Embed Size (px)
Citation preview
Benefit Analysis for National Oceanic and Atmospheric Administration High-Performance Computing System for Research Applications Final Report
Prepared for: Joan M. Brundage Chief Information Officer National Oceanic and Atmospheric Administration (NOAA)/Office of Oceanic and Atmospheric Research (OAR), Aeronomy Laboratory Prepared by: Jeffrey K. Lazo Marca L. Hagenstad Kevin P. Cooney James L. Henderson Stratus Consulting Inc. PO Box 4059 Boulder, CO 80306-4059 (303) 381-8000 and Jennie S. Rice Consulting Economist December 4, 2003 SC10367
Stratus Consulting
Benefit Analysis for National
Oceanic and Atmospheric Administration High-Performance
Computing System for Research Applications
Final Report
Prepared for:
Joan M. Brundage Chief Information Officer
NOAA/OAR Aeronomy Laboratory
Prepared by:
Stratus Consulting Inc.
PO Box 4059 Boulder, CO 80306-4059
(303) 381-8000
Contact:
Jeffrey K. Lazo Marca L. Hagenstad
Kevin P. Cooney James L. Henderson
and
Jennie S. Rice, Consulting Economist
December 4, 2003 SC10367
Contents
List of Exhibits .............................................................................................................................v Acronyms ................................................................................................................................... vii Acknowledgements .................................................................................................................... ix Executive Summary ................................................................................................................. S-1
Chapter 1 Introduction
1.1 Background........................................................................................................ 1-2 1.2 Objectives .......................................................................................................... 1-4 1.3 Outline ............................................................................................................... 1-4
Chapter 2 NOAA Supercomputing and Weather Forecasting Research
2.1 Supercomputing at NOAA................................................................................. 2-1 2.1.1 National Centers for Environmental Prediction..................................... 2-2 2.1.2 Geophysical Fluid Dynamics Laboratory .............................................. 2-3 2.1.3 Forecast Systems Laboratory................................................................. 2-3
2.2 Forecast Systems Laboratory............................................................................. 2-3 2.3 NOAA Proposal to Expand Supercomputing Capabilities ................................ 2-6
Chapter 3 The Value of Weather Forecasts and R&D to Improve Weather Forecasts
3.1 Value of Weather Forecasts ............................................................................... 3-1 3.2 Value of Information and R&D ......................................................................... 3-2
Chapter 4 Assessment of Benefits of Improved Weather Forecasts
4.1 Households......................................................................................................... 4-4 4.1.1 Household perceptions and uses of weather information ...................... 4-5 4.1.2 Household values for weather information............................................ 4-6 4.1.3 Stratus Consulting (2002) ...................................................................... 4-7
4.2 Aviation ............................................................................................................. 4-9 4.3 Agriculture ....................................................................................................... 4-11
4.3.1 Introduction.......................................................................................... 4-11 4.3.2 Value of weather forecasts to agriculture ............................................ 4-12
SC10367
Stratus Consulting Contents
Page iv SC10367
4.3.3 Literature on the value of seasonal climate forecasts to agriculture.... 4-13 4.3.4 Estimation of value to three crop sectors of improvements in
weather forecasts.................................................................................. 4-14 4.4 Energy .............................................................................................................. 4-15 4.5 Weather-Related Fatalities............................................................................... 4-16
Chapter 5 Economic Analysis
5.1 Household Sector Benefits for Improved Weather Forecasts............................ 5-3 5.2 Agricultural Benefits from Improved Weather Forecasts.................................. 5-6 5.3 Avoided Weather-Related Fatalities Resulting from Improved
Weather Forecasts.............................................................................................. 5-6 5.4 Summary ............................................................................................................ 5-7
Chapter 6 Conclusions ....................................................................................................... 6-1
References .................................................................................................................................R-1
Appendices A Literature Review by Sector B Omissions, Biases, and Uncertainties

Exhibits 1.1 How weather information is collected, analyzed, and delivered ................................... 1-3 3.1 Decision tree for orange grower .................................................................................... 3-4 3.2 Orange grower’s decision tree with expected values..................................................... 3-5 3.3 Decision tree with perfect information about frost ........................................................ 3-6 3.4 Probability tree of forecast accuracy ............................................................................. 3-7 3.5 Result of applying Bayes’ Rule ..................................................................................... 3-8 3.6 Expected value with 80% accurate forecast .................................................................. 3-9 3.7 Expected value with 90% accurate forecast ................................................................ 3-10 4.1 Benefits of improved weather modeling........................................................................ 4-2 4.2 Taxonomy of potential beneficiaries of weather information ....................................... 4-3 4.3 Flow chart of household benefits from short-term weather forecasts ........................... 4-5 4.4 Attribute levels for storm survey ................................................................................... 4-7 4.5 Best estimate of annual values for improved and current weather forecast services .... 4-8 4.6 Influence diagram of weather impacts on aviation...................................................... 4-10 4.7 Flow chart of the agricultural benefits of short-term weather forecasts ...................... 4-12 4.8 Annual value of improvement to perfect information ................................................. 4-14 4.9 Influence diagram of weather impacts on energy industry.......................................... 4-17 4.10 Weather-related fatalities and VSL estimates.............................................................. 4-18 5.1 Contributions to improving weather forecasts............................................................... 5-2 5.2 Financial assumptions for base case present value calculations.................................... 5-4 5.3 Household benefits sensitivity analysis results.............................................................. 5-5 5.4 Summary of present value of benefits in 2003 .............................................................. 5-7 6.1 Summary of present value of benefits in 2003 .............................................................. 6-1
SC10367
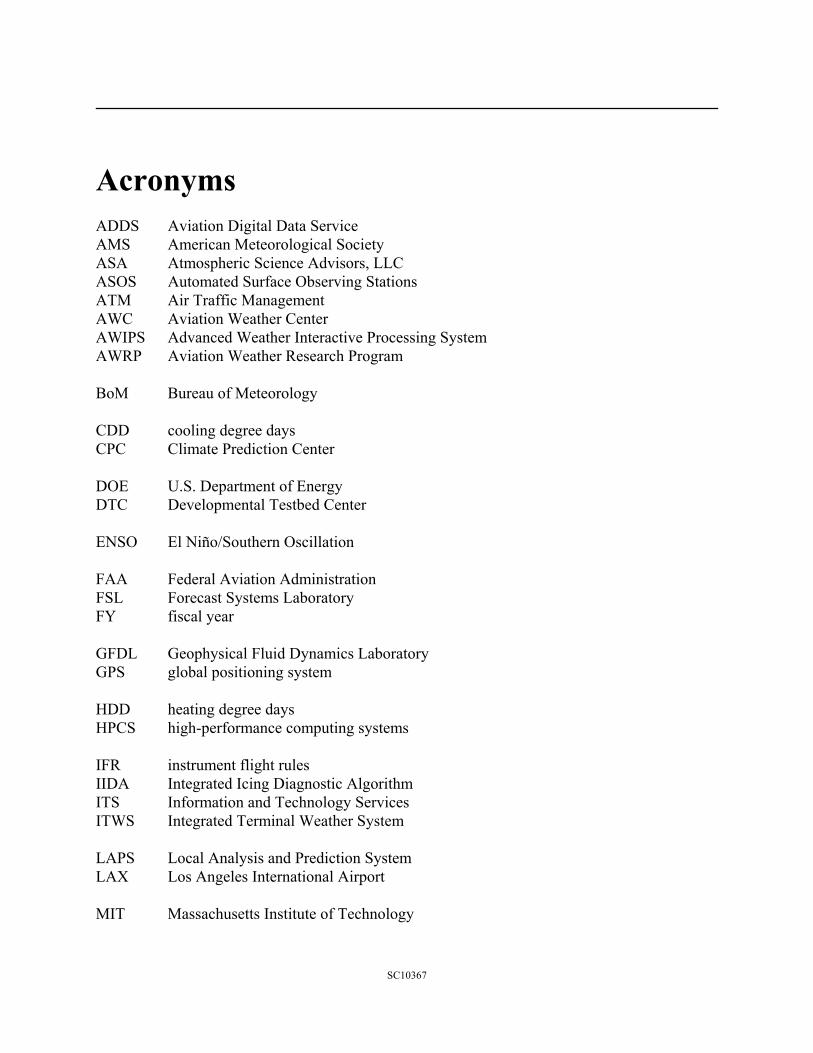
Acronyms ADDS Aviation Digital Data Service AMS American Meteorological Society ASA Atmospheric Science Advisors, LLC ASOS Automated Surface Observing Stations ATM Air Traffic Management AWC Aviation Weather Center AWIPS Advanced Weather Interactive Processing System AWRP Aviation Weather Research Program BoM Bureau of Meteorology CDD cooling degree days CPC Climate Prediction Center DOE U.S. Department of Energy DTC Developmental Testbed Center ENSO El Niño/Southern Oscillation FAA Federal Aviation Administration FSL Forecast Systems Laboratory FY fiscal year GFDL Geophysical Fluid Dynamics Laboratory GPS global positioning system HDD heating degree days HPCS high-performance computing systems IFR instrument flight rules IIDA Integrated Icing Diagnostic Algorithm ITS Information and Technology Services ITWS Integrated Terminal Weather System LAPS Local Analysis and Prediction System LAX Los Angeles International Airport MIT Massachusetts Institute of Technology
SC10367
Stratus Consulting Acronyms
Page viii SC10367
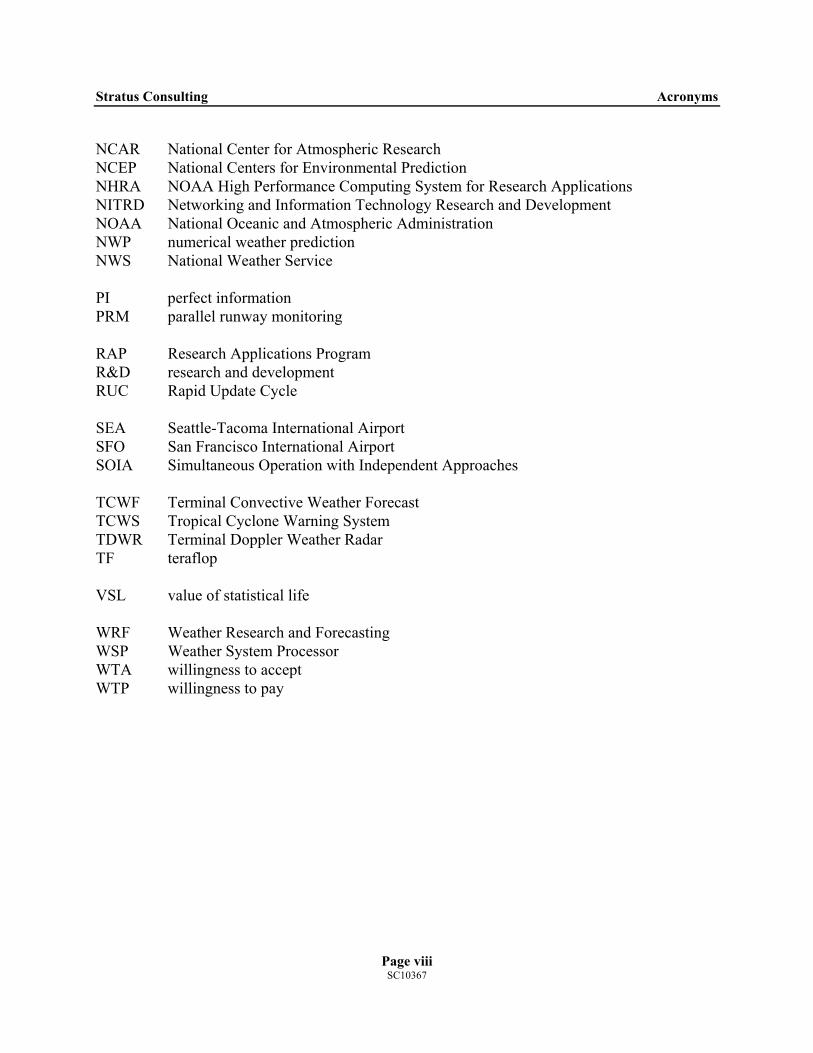
NCAR National Center for Atmospheric Research NCEP National Centers for Environmental Prediction NHRA NOAA High Performance Computing System for Research Applications NITRD Networking and Information Technology Research and Development NOAA National Oceanic and Atmospheric Administration NWP numerical weather prediction NWS National Weather Service PI perfect information PRM parallel runway monitoring RAP Research Applications Program R&D research and development RUC Rapid Update Cycle SEA Seattle-Tacoma International Airport SFO San Francisco International Airport SOIA Simultaneous Operation with Independent Approaches TCWF Terminal Convective Weather Forecast TCWS Tropical Cyclone Warning System TDWR Terminal Doppler Weather Radar TF teraflop VSL value of statistical life WRF Weather Research and Forecasting WSP Weather System Processor WTA willingness to accept WTP willingness to pay
Acknowledgments We would like to thank the staff at NOAA (especially those at the Forecasts Systems Laboratory in Boulder, Colorado), including Joan Brundage, Leslie Hart, Scott Nahman, Michael Kraus, Brent Shaw, and Stan Benjamin, for supplying information and offering insights on this effort and for reviewing and commenting on our work. We would also like to thank Barbara Brown and Richard Katz from the National Center for Atmospheric Research in Boulder, Colorado, for their prompt responses to our request for information and data. In addition, we would like to thank Howard Eichenbaum and Jim Sunderlin at MCR Federal, Inc., Bedford, Massachusetts, for furnishing us with copies of two of their benefits assessments for weather-forecasting-related products developed for the Aviation Weather Research Program. We would also like to acknowledge all the people at Stratus Consulting who supported this effort, including Dave Pilot, Dot Newton, Chuck Herrick, Sue Visser, Diane Blagusz, Erin Miles, and Tim Pittz, along with René Howard of WordProse, Inc., for her editing of the final report.
SC10367

Executive Summary Purpose
This benefit analysis assesses the potential economic benefits of purchasing new supercomputing equipment for the NOAA High Performance Computing System for Research Applications (NHRA) in Boulder, Colorado, to serve the computing needs of NOAA and associated entities.
Approach
In this analysis, we identify economic sectors that currently benefit from weather forecasts and that would realize increased benefits from the acquisition of a new NHRA supercomputer and the associated improvements in weather forecasts. Personnel at NOAA’s Forecasting Systems Laboratory (FSL), which will operate the NHRA, supplied input on the technical aspects of potential weather forecasting improvements. For this study, we reviewed the literature that places value on short-term weather forecasts from the perspectives of various sectors of the economy, including households, agriculture, aviation, and the energy industry. Exhibit S.1 shows the conceptual relationship between the purchase of a new supercomputer and the benefits to various sectors as a result of this investment
Using conservative assumptions about the contribution of a new NHRA supercomputer to the potential overall improvement in weather forecasting, we conducted an economic analysis that focused on household values. Households are most likely the largest end user of NOAA’s weather forecasting services, and a recent economic analysis (Stratus Consulting, 2002) resulted in the most direct estimates of improved weather forecasting benefits. We also separately quantified potential benefits to a limited number of agricultural crops, estimated the potential value of reduced weather-related fatalities, and examined the literature on values to portions of the energy industry and the commercial aviation industry.
Results
The economic analysis conducted here indicates that the potential societal benefits from the purchase of a new NHRA supercomputer are great. The estimated present value of benefits to the household sector for improvements in ordinary day-to-day (i.e., not including severe weather) weather forecasts alone are estimated at $69 million. A sensitivity analysis of the assumptions underlying this derivation indicates a range of values to the household sector of between $34 million and $232 million.
SC10367

Stratus Consulting Executive Summary
Ex(NW
Calcwheapoten
Exhiamousmal
New supercomputer
Improved environmental
modeling
Air ForceBenefits
DOE benefits (wind)
Marine resourcemgt. benefits
Private sectorbenefits (e.g.,highways)
Internationalbenefits
Improvedoperationalforecasts(NWS Benefits)
Armybenefits
Aviationbenefits
Retailbenefits
Energy benefits(temps, wind)
Marinetransportationbenefits
Agriculturebenefits
Total benefits Household
benefits
hibit S.1. Benefits of improved weather modeling. S = National Weather Service; DOE = U.S. Department of Energy)
ulated benefits to certain segments of the agricultural economy (some orchards, winter t, and alfalfa) are estimated at a present value of about $26 million. The present value of tially avoided weather-related fatalities is estimated at $21 million.
bit S.2 summarizes the base case present values for these three areas. Although a significant nt of additional research would be needed to refine these estimates, the benefits from this
l subset of the economy appear significant.
Exhibit S.2. Summary of present value of benefits in 2003 (million $, 2002) Household sector 69 Orchards, winter wheat alfalfa 26 Avoided weather-related fatalities 21
Page S-2 SC10367
Stratus Consulting Executive Summary
Page S-3 SC10367
We should note that, in general, we made very conservative assumptions in deriving these benefit estimates. These assumptions include the evaluation of the time period over which benefits may accrue to different sectors and how many of those benefits may be attributable to the research and development that a new supercomputer would allow. In addition, the analysis includes values to parts of two sectors only (households and agriculture) and thus does not include value estimates from numerous other sectors. Our brief literature review indicated that at least the aviation and energy industries could realize potentially significant economic benefits.
Conclusions
This work presents a lower bound estimate of the value of improved weather forecasting made possible by NOAA’s acquisition of a new NHRA supercomputer (i.e., the potential benefits to society are likely to be significantly larger than just those included in this analysis). This information can be used in NOAA’s benefit-cost analysis of a new supercomputer, and may be useful to policy makers as well.
Future work could better identify all end users of the supercomputer outputs and determine more completely how NOAA’s supercomputers have contributed to the progress of forecast accuracy (and how further upgrades will continue to do so). Because of the potentially significant societal benefits from improved weather forecast research, and the lack of reliable economic information quantifying these benefits, future work could also explore the values to other sectors of the economy not evaluated in this report, and offer additional insight into individual uses, perceptions, and values of weather forecasts.
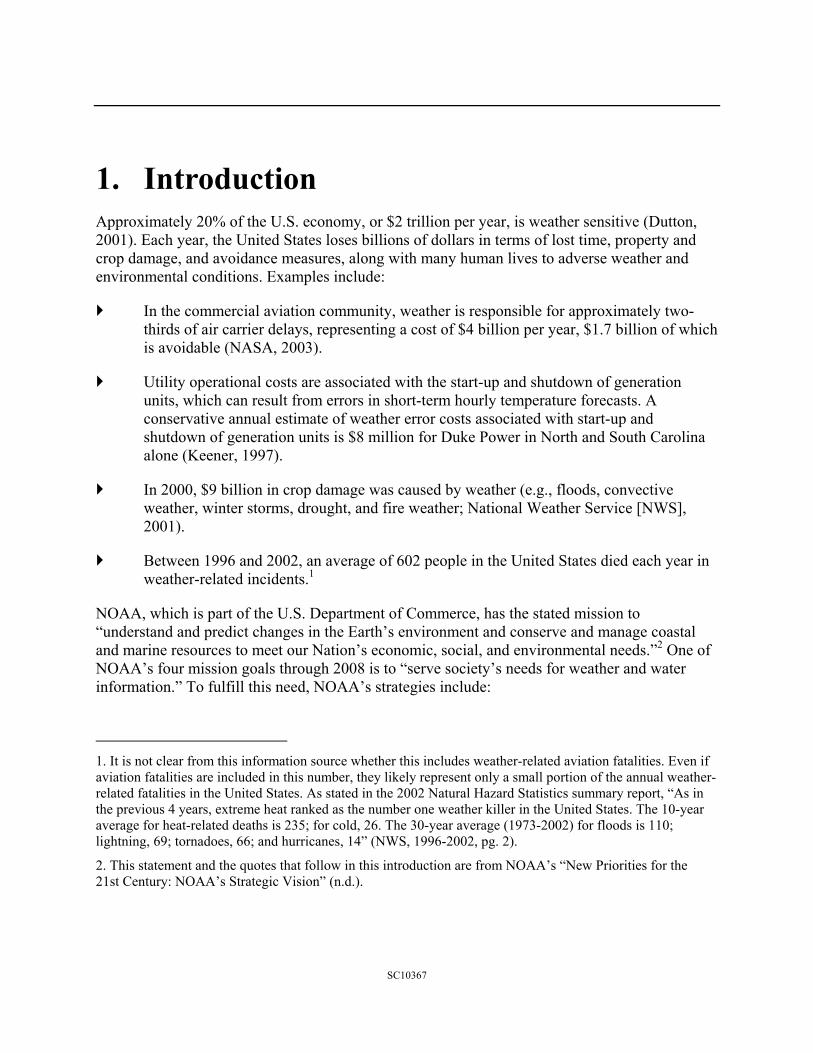
1. Introduction Approximately 20% of the U.S. economy, or $2 trillion per year, is weather sensitive (Dutton, 2001). Each year, the United States loses billions of dollars in terms of lost time, property and crop damage, and avoidance measures, along with many human lives to adverse weather and environmental conditions. Examples include:
In the commercial aviation community, weather is responsible for approximately two-thirds of air carrier delays, representing a cost of $4 billion per year, $1.7 billion of which is avoidable (NASA, 2003).
Utility operational costs are associated with the start-up and shutdown of generation units, which can result from errors in short-term hourly temperature forecasts. A conservative annual estimate of weather error costs associated with start-up and shutdown of generation units is $8 million for Duke Power in North and South Carolina alone (Keener, 1997).
In 2000, $9 billion in crop damage was caused by weather (e.g., floods, convective weather, winter storms, drought, and fire weather; National Weather Service [NWS], 2001).
Between 1996 and 2002, an average of 602 people in the United States died each year in weather-related incidents.1
NOAA, which is part of the U.S. Department of Commerce, has the stated mission to “understand and predict changes in the Earth’s environment and conserve and manage coastal and marine resources to meet our Nation’s economic, social, and environmental needs.”2 One of NOAA’s four mission goals through 2008 is to “serve society’s needs for weather and water information.” To fulfill this need, NOAA’s strategies include:
1. It is not clear from this information source whether this includes weather-related aviation fatalities. Even if aviation fatalities are included in this number, they likely represent only a small portion of the annual weather-related fatalities in the United States. As stated in the 2002 Natural Hazard Statistics summary report, “As in the previous 4 years, extreme heat ranked as the number one weather killer in the United States. The 10-year average for heat-related deaths is 235; for cold, 26. The 30-year average (1973-2002) for floods is 110; lightning, 69; tornadoes, 66; and hurricanes, 14” (NWS, 1996-2002, pg. 2).
2. This statement and the quotes that follow in this introduction are from NOAA’s “New Priorities for the 21st Century: NOAA’s Strategic Vision” (n.d.).
SC10367

Stratus Consulting Introduction
investment “in new technologies, techniques, and weather and water forecast modeling to improve the accuracy and timeliness of our prediction capabilities and services”
“improve the performance of our suite of weather and water, air quality, and space weather prediction capabilities.”
This includes a commitment to “maintain and improve our technology infrastructure to enhance our scientific productivity through seamless sets of observational and forecast products, advanced high-bandwidth networks, supercomputing capabilities, and actions to improve our customers’ use of e-government to receive 24 H 7 service — 24 hours a day, 7 days a week.” As NOAA’s strategy statements indicate, improved supercomputing capabilities are essential to the agency’s mission.
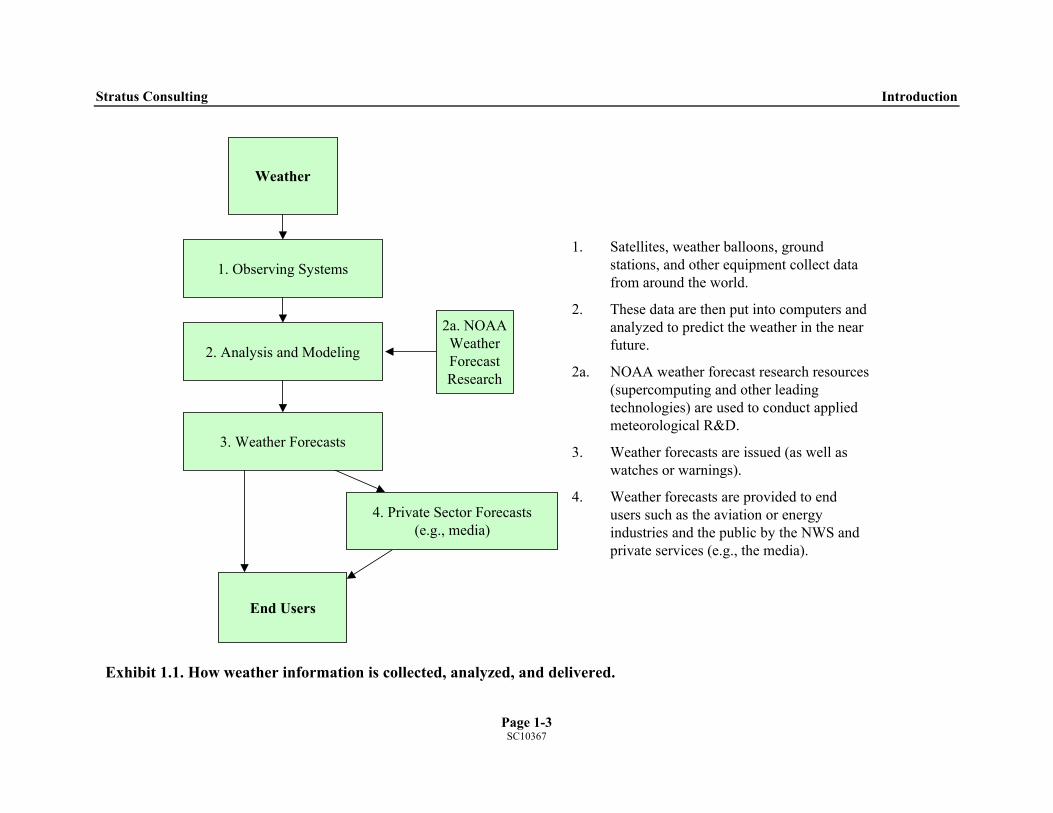
1.1 Background The flow chart in Exhibit 1.1 shows how weather information is collected, analyzed, and delivered to users. The flow chart also illustrates how the NOAA weather forecast research and its computing capabilities contribute to the process. NOAA weather forecast research, of which the Forecast Systems Laboratory (FSL) is a critical element, improves the analysis and modeling methods that are used to generate weather forecasts. This information is then transmitted directly or indirectly (e.g., through the media or private sector forecasters) to end users. Because weather forecasts are a quasi-public good,3 there is no developed market for intermediate weather forecast products and thus no market data on the value of these products. There are numerous steps between the point at which weather forecast research work enters the forecasting system and the point at which the end users receive forecasts and make decisions. Exhibit 1.1, then, also suggests that even if the specific contribution of research and development (R&D) work in weather forecast research is identified, it may be difficult to translate into changes in forecast products that benefit end users.
3. See Section 3.1 of this report and Stratus Consulting (2002) for further discussion of the public good nature of weather forecasts.
Page 1-2 SC10367
Stratus Consulting Introduction
1. Observing Systems
2. Analysis and Modeling
3. Weather Forecasts
4. Private Sector Forecasts (e.g., media)
1. Satellites, weather balloons, ground stations, and other equipment collect data from around the world.
2. These data are then put into computers and analyzed to predict the weather in the near future.
2a. NOAA weather forecast research resources (supercomputing and other leading technologies) are used to conduct applied meteorological R&D.
3. Weather forecasts are issued (as well as watches or warnings).
4. Weather forecasts are provided to end users such as the aviation or energy industries and the public by the NWS and private services (e.g., the media).
2a. NOAA Weather Forecast Research
Weather
End Users
Exhibit 1.1. How weather information is collected, analyzed, and delivered.
Page 1-3
SC10367

Stratus Consulting Introduction
1.2 Objectives The objective of this report and analysis is to assess the potential economic benefits of the purchase of new supercomputing equipment for the NOAA High Performance Computing System for Research Applications (NHRA) in Boulder, Colorado, to serve the computing needs of NOAA and other associated entities.
1.3 Outline In Chapter 2, we discuss the background of supercomputing at NOAA and the functions and capabilities of NOAA’s three centers that operate supercomputers. Chapter 3 covers the concepts involved in valuing weather information and presents an overview of the value of R&D. In Chapter 4, we identify the sectors that would likely benefit from NOAA’s acquisition of a new supercomputer and review the available literature on weather forecast values for four sectors (households, aviation, agriculture, and energy). The economic analysis, presented in Chapter 5, focuses primarily on the economic benefits stemming from the household sector. This discussion outlines the estimated household economic values for improvements in weather forecasts, and quantifies how much a new supercomputer would contribute to improvements. In Chapter 6, we offer concluding remarks. The appendices include more extensive information on the literature reviewed for this benefits assessment and a discussion of the omissions, biases, and uncertainties involved in the analysis.
Page 1-4 SC10367

2. NOAA Supercomputing and Weather Forecasting Research
2.1 Supercomputing at NOAA NOAA is dedicated to enhancing economic security and national safety by predicting and conducting research on weather- and climate-related events, along with providing environmental stewardship of the nation’s coastal and marine resources. NOAA participates in the Information Technology Research and Development Program1 both as a user of high-end computing, with its global change and weather forecasting modeling applications, and as a proponent of expanded information dissemination through the Internet. NOAA’s primary role in the national program is as an early adopter of advanced technology.2
NOAA conducts real-world testing of advanced concepts such as scalable parallel computing, high-bandwidth networking, and advanced information and dissemination technologies. NOAA’s research in climate prediction and weather forecasting is critical to its mission of describing and predicting changes in the earth’s environment, managing the nation’s ocean and coastal resources, and promoting global stewardship of the world’s oceans and atmosphere. This research depends on advances in high-end computing; on the collection and dissemination of environmental data; on the ability to visualize and analyze vast quantities of data; and on the ability of NOAA researchers to collaborate effectively, efficiently, and easily with colleagues throughout the agency, the nation, and the world.
Each day, the supercomputers use more than 2 million atmospheric and oceanic observations collected from the ground, the air, the sea, and space. From these observations, the models predict changes that could occur in the atmosphere and the resulting weather. Crucial guidance, given under strict timetables, enables forecasters to predict events such as hurricanes, floods, and winter storms days in advance.
Increased computing power enables higher resolution in models of the earth’s atmosphere-ocean system. Increased resolution permits key features such as weather fronts and ocean eddies to be more accurately represented, and reduces distortions that result from clouds. More accurate
1. The Interagency Working Group on Information Technology Research and Development, which coordinates the Federal information technology R&D programs, is part of the multiagency Federal Networking and Information Technology Research and Development (NITRD) Program.
2. See: http://www.cio.noaa.gov/hpcc/relation.html.
SC10367

Stratus Consulting Supercomputing and Weather Forecasting Research
NOAA models improve the understanding of the behavior of climate and weather systems, allowing government and industry representatives to make better decisions on issues that affect both the environment and the economy.
The three organizations within NOAA that maintain supercomputing facilities and of which at least a portion is devoted to R&D of weather forecasting capabilities follow:
the National Centers for Environmental Prediction (NCEP) the Geophysical Fluid Dynamics Laboratory (GFDL) the Forecast Systems Laboratory (FSL).
2.1.1 National Centers for Environmental Prediction
NCEP delivers national and global weather; water, climate, and space weather guidance; forecasts; warnings; and analyses. NCEP, an arm of NOAA’s NWS, makes a wide variety of national and international weather guidance products available to NWS field offices, government agencies, emergency managers, private sector meteorologists, and meteorological organizations and societies throughout the world.3
NCEP Central Operations sustains and executes the operational suite of the numerical analysis and forecast models and prepares NCEP products for dissemination. The Networking and Communications Branch of Central Operations maintains system administration and other user support services on a 24-hour basis for NCEP computing and communications systems including high-performance computing systems (HPCS). This branch is responsible for the overall planning, design, development, implementation, and assessment of NCEP computing and communications capabilities, as well as for the facilities and infrastructure that support the relevant technology. This responsibility includes coordinating network and communications issues between NCEP and other parts of NOAA as well as between NCEP and other agencies.
In addition, NCEP’s Environmental Modeling Center develops and improves numerical weather, climate, hydrological, and oceanic predictions through programs of applied research in data analysis, modeling, and product development in partnership with the broader research community.
3. For more on NCEP, see http://www.ncep.noaa.gov.
Page 2-2 SC10367

Stratus Consulting Supercomputing and Weather Forecasting Research
2.1.2 Geophysical Fluid Dynamics Laboratory
The GFDL is engaged in comprehensive, long-lead-time research that is fundamental to NOAA’s mission.4 The goal of this research is to expand the scientific understanding of the physical processes that govern the behavior of the atmosphere and the oceans as complex fluid systems. These systems can then be modeled mathematically and computer simulation methods can be used to study their phenomenology. The Technical Services Branch of GFDL maintains a computational facility to support research conducted at GFDL with emphasis on supercomputing and networked desktop systems for developing, running, and analyzing results from numerical models.
2.1.3 Forecast Systems Laboratory
Established in 1988, FSL conducts applied meteorological R&D to improve and create short-term warning and weather forecast systems, models, and observing technology. Supercomputing and other leading-edge technologies are used in these applications. FSL then transfers the new scientific and technological advances to its clients, which include NOAA’s NWS, the commercial and general aviation communities, the U.S. Air Force, many foreign weather forecasting offices, various private interests, and others. Section 2.2 gives more detail on FSL and the laboratory’s supercomputing capabilities.5
2.2 Forecast Systems Laboratory FSL’s mission is to transfer technology and research findings in the atmospheric, oceanic, and hydrologic sciences to NOAA operations, other federal organizations, industry, and virtually any users of environmental information. Major research interests center on short-range numerical weather prediction and its applications to daily commerce. The laboratory’s researchers work to anticipate the science and technology that the nation’s operational weather services will need in the next 5 to 15 years. More than ever, the rapid pace of technological change and the need for sound science to support more advanced services dictate the importance of FSL’s endeavors.
FSL has six divisions that carry out research and systems development activities. Under the Office of the Director, Information and Technology Services (ITS) supports these six divisions. ITS is responsible for managing the computers, communications, data networks, and associated peripherals that the FSL staff uses. The central facility houses a wide variety of meteorological
4. For more information on GFDL, see: http://www.gfdl.gov.
5. For more information on FSL, see: http://www.fsl.noaa.gov/.
Page 2-3 SC10367

Stratus Consulting Supercomputing and Weather Forecasting Research
data-ingest interfaces, storage devices, local- and wide-area networks, communications links to external networks, and display devices. It comprises dozens of computers, ranging from workstations and servers to a supercomputer manufactured by High Performance Technologies, Inc. (Reston, Virginia).6
The research and technology activities at FSL cover four major themes: 1) bringing new atmospheric observing systems to maturity, 2) assimilating and modeling to improve short-range weather predictions, 3) investigating computer architectures as a vehicle for handling the computational demands of environmental models, and 4) developing environmental information systems for customers both inside and outside of NOAA. FSL’s research efforts have brought about numerous advances in weather forecasting technologies and methods, including:
The laboratory spearheaded efforts to make wind profiling and ground-based global positioning system (GPS) moisture observations a staple in regional prediction. The NOAA Profiler Network provides reliable hourly observations of winds from the surface to the lower stratosphere, revealing details not available from other observing systems.
FSL’s 20-km Rapid Update Cycle (RUC) model, one of NOAA’s operational Numerical Weather Prediction (NWP) models, was a multiyear development project that has set the stage for assimilation of new satellite and radar data sets in the future.
The laboratory is collaborating on a multiagency Developmental Test Center in Boulder, Colorado, which will focus on developing the Weather Research and Forecasting Model.7 This model will serve as both an operational model and a research vehicle for the larger modeling community.
FSL’s Local Analysis and Prediction System (LAPS) has been deployed to supply higher resolution analyses and forecasts of all weather variables to support space-vehicle launches and routine space operations at Cape Canaveral and at Vandenberg Air Force Base.
FSL supports the U.S. Forest Service with high-resolution graphic and point-specific products specially configured to give fire officials a variety of information, including fire indices and ventilation potential.
In collaboration with the NOAA Ocean Service and the NOAA NWS, the laboratory’s researchers set up a demonstration system to bring on-site analysis and modeling to the
6. For more on FSL supercomputing, see http://www.supercomputingonline.com/print.php?sid = 4883.
7. See http://www.wrf-model.org/PRESENTATIONS/2000_06_23_klemp/sld002.htm for information on the collaborators in this multiagency project.
Page 2-4 SC10367
Stratus Consulting Supercomputing and Weather Forecasting Research
Jacksonville, Florida, Warning and Forecast Office. This system includes real-time analysis of local data using LAPS and forecasts generated by the new Weather Research and Forecasting (WRF) model.
More timely and accurate warnings and forecasts require continued improvements to the Advanced Weather Interactive Processing System (AWIPS), the backbone of the modernized NOAA NWS. AWIPS was built on technology that FSL developed.
In collaboration with the Federal Highway Administration and other organizations, FSL generates meteorological fields from an ensemble of mesoscale models. The complex weather information that goes into the resulting maintenance decision support system allows clear decisions to be made about a number of transportation issues, including snowplow deployment, chemical application, and weather-threatened locations.
The laboratory has partnered in the development of the Aviation Digital Data Service (ADDS), now implemented at the NOAA Aviation Weather Center, to furnish pilots with current preflight planning information on the status of the national airspace. ADDS is a joint effort of NCAR Research Applications Program (RAP), NOAA Forecast Systems Laboratory (FSL), and the National Centers for Environmental Prediction (NCEP) Aviation Weather Center (AWC).
Prototypes of two other aviation products are being implemented: the Tactical Convective Hazard Product and an initial version of the Volcanic Ash Coordination Tool.
As a leader in high-performance computing, FSL houses the essential infrastructure for weather and other environmental research, and allows future observing systems to be tested through repeated model simulations that require extraordinary processing power. The laboratory’s HPCS comprises 768 nodes with dual Intel Pentium processors rated at 2.2 GHz. An upgrade in November 2002 merited a ranking of number 8 (at that time) on the Top 500 List of the World’s Fastest Computers (http://www.top500.org/dlist/2002/11/). As of November 2003, this system was ranked 17th in the world (http://www.top500.org/dlist/2003/11/).
FSL supplies the computational capability for numerous environmental modeling efforts that are carried out by FSL and non-FSL researchers, NCEP, several NOAA laboratories, and numerous joint institutes. FSL’s Advanced Computing Branch enables advancements in atmospheric and oceanic sciences by making HPCS easier to use (i.e., through development of the Scalable Modeling System) and by exploiting the advanced capacities of high-speed networks and technologies.
Page 2-5 SC10367
Stratus Consulting Supercomputing and Weather Forecasting Research
To perform computer-intensive tasks, FSL acquired an Intel Paragon XP/S-15-208-processor massively parallel computer 9 years ago.8 When the Paragon reached the end of its life about 6 years ago, the laboratory leased an interim 32-processor SGI Origin 2000 machine. Because FSL and NOAA needed to increase the spatial and temporal resolution of the models it runs, an HPCS was procured. Improved computing power permits more detailed models covering larger geographic areas to be developed and tested. FSL has acquired a commodity-based cluster with an initial peak speed of approximately 0.34 teraflop (TF) and a 10%-20% sustainable performance for running finite-difference models of the atmosphere and ocean. In fiscal year (FY) 2001, the peak speed was increased to 0.8 TF. In FY 2003, the peak speed was increased to 14.2 TF.
The FSL HPCS’s LINPACK performance of 3.3 TF/s was sufficient to place 11th in the May 2003 ranking of the world’s fastest supercomputers (http://www.top500.org/list/2003/06/?page). Although it is only one-tenth as powerful as the Japanese Earth Simulator (which comprises NEC SX-6 vector platforms), LINPACK’s price/performance is $1.5 million/TF compared to $11 million/TF for the Earth Simulator. FSL’s environmental models scale to use the available computing power. The system is currently in the midst of a new procurement cycle. Experts anticipate that cost per teraflop will continue to fall, providing the government with a more powerful system. As more computing power becomes available, the resolution of the model and the complexity of the physics within the model are increased to use the computing resources.
2.3 NOAA Proposal to Expand Supercomputing Capabilities NOAA seeks to acquire an HPCS to meet its research and development needs in 2004. The desired new system will replace several GNU/Linux-based clusters within FSL’s computing facilities. The system known as the NOAA HPCS for Research Applications (NHRA) will be used to sustain geophysical research programs such as the Developmental Testbed Center (DTC), development and testing of National- and Global-scale observing systems, air quality modeling, ocean modeling, and climate modeling as well as parallel processing research as applied to real-time numerical weather prediction (NWP).
8. See http://www-fd.fsl.noaa.gov/papers/pm_ams94.htm for an early history of FSL supercomputing (accessed December 1, 2003).
Page 2-6 SC10367
Stratus Consulting Supercomputing and Weather Forecasting Research
Page 2-7 SC10367
The NHRA is one of the technology components in the current NOAA Strategic Plan and is critical to achieve NOAA’s four strategic goals. Many specific environmental modeling and forecast goals for the years 2004 through 2009 as identified in the current NOAA Strategic Plan are dependent upon the timely acquisition of the NHRA.9
NOAA’s purchase of a new HPCS for installation in Boulder, Colorado, would double current computing capabilities. It would also enable doubling of the spatial and temporal resolutions of environmental models currently run by NOAA, including finite-difference models of the atmosphere and ocean.
This analysis is designed to quantify the potential benefit of the proposed procurement.
9. See http://nhra.fsl.noaa.gov/nhraPA_team1.html (accessed December 1, 2003).
3. The Value of Weather Forecasts and R&D to Improve Weather Forecasts
3.1 Value of Weather Forecasts
Many authors discuss weather forecasts as public goods (e.g., Anaman and Lellyett, 1996; Johnson and Holt, 1997; Freebairn and Zillman, n.d. [a], n.d. [b]). Public goods are goods or services that are “nonrival” and “nonexcludable.” Nonrival means that one person’s consumption of the good does not diminish the ability of others to consume the good (e.g., one person knowing the weather forecast does not diminish anyone else’s ability to benefit from knowing the forecast).1 Nonexcludable means that once the good is provided, no one can be excluded from using the good. The excludable characteristic of weather forecasts forms the basis for private weather forecasting services. Consequently, weather forecasts are better defined as “quasi-public” goods because of the potential for exclusion. Because the NWS has not excluded the public from the services it offers, weather forecasts have been furnished as a free good.
Given the quasi-public good nature of weather forecasts, the economic value of most weather forecasting services is not directly observed in the market. For this reason, it is difficult to determine the economic value of the changes in these services that are provided as a result of NOAA programs to improve weather forecasting. However, this is exactly what benefit-cost analyses require.
In categorizing valuation approaches, Murphy (1994) distinguishes between prescriptive approaches (behavior in accordance with normative principles such as utility maximization or loss minimization) and descriptive studies (focusing on actual behavior, as in decision making or information processing; see also Freebairn and Zillman, n.d. [a]). Most prescriptive studies posit a loss function or its inverse, a payoff function (e.g., Davis and Nnaji, 1982; Ehrendorfer and Murphy, 1992).
Hundreds of studies have been done on the value of weather, but fewer studies have examined the value of weather information. Using Murphy’s terminology, most studies of the value of weather information are prescriptive in terms of examining idealized behavior given a change in the information available to the decision maker. Johnson and Holt (1997) and Wilks (1997) review several such studies, mainly in the agriculture sector. Murphy (1994) includes an
1. “Nonrivalry also often characterizes the benefits from . . . weather monitoring stations . . .” (Cornes and Sandler, 1996, p. 8).
SC10367

Stratus Consulting The Value of and Improving Weather Forecasts
annotated bibliography of studies of the value of forecasts indicating approach/method, type/range of forecasts, and sector of application.
3.2 Value of Information and R&D
In economic terms, improved weather forecasts can be thought of as improved information. R&D undertaken to improve weather forecasts, including the use of higher performance computing systems, can be conceptualized in terms of economic approaches to understanding the value of information and R&D.
Most organizations, governmental as well as private, make significant investments in R&D in the hopes of developing successful new products. These products may be tangible, such as bioengineered pharmaceuticals, or intangible, such as improved scientific information. Assessing the value of R&D is a challenging endeavor because of the uncertainty, complexity, and long time horizons typically associated with R&D programs. Moreover, the immediate results of R&D are rarely useful on their own; instead, transforming promising R&D results into end-user value requires additional development, commercialization, and marketing activities, all of which involve further uncertainty, complexity, and time. Matheson (1983) offers an excellent overview of the challenges of managing R&D activities.
In contrast to corporate R&D, where each company receives the benefits of its own successful efforts, government-sponsored R&D creates public research results on which various user groups may or may not capitalize. In this context, calculating the value of R&D requires an economic evaluation of all potential public benefits. Ideally, areas of greatest potential public benefit would be used to guide the selection of R&D activities. In other words, even though the flow of benefits from R&D starts with the sponsoring organization and moves outward to users, the optimal management of R&D should quantify benefits in the opposite direction: first, where are the greatest potential benefits from R&D, and then, what R&D activities are most likely to produce those benefits? Menke (1981) outlines a detailed methodology and gives an example of quantifying the value of basic research.
As noted above, basic information — as opposed to new technology — is often the result of R&D. Intuitively, it would seem that additional information would always have value. Is this true, and if not, under what conditions does it hold? When does better information have value, and how is it quantified?
Quantifying the economic value of information is a relatively new concept, dating back to the 1960s when the field of decision analysis was created (Raiffa and Schlaifer, 1961; Howard, 1966). Decision analysis merges statistical decision theory with systems analysis to form a methodology for analyzing large, complex, and uncertain decisions. The process involves
Page 3-2 SC10367
Stratus Consulting The Value of and Improving Weather Forecasts
structuring a decision problem to clarify its alternatives, information, and values. A mathematical model is built to quantify the value of each alternative according to the information and value objectives of the decision maker. Important uncertainties in the information are represented stochastically, and a final probability distribution over the potential outcomes for each alternative is determined.
In the prescriptive framework of decision analysis, new information has value if it has the potential to change the decision maker’s preferred alternative.2 A key assumption of many prescriptive models is that decision makers are acting to maximize profit and minimize losses. An extensive literature exists on the psychology of decision making (see Tverksy and Kahneman, 1974, 1981). These works point out flaws in prescriptive decision-making models, primarily in the areas of preference modeling and judgments about uncertain information. Decision analysis incorporates the use of utility functions to address risk attitudes (Howard, 1970) and enhanced methods for subjective probability assessment to address subconscious informational biases (Spetzler and von Holstein, 1972).
Decision analysis offers a means to determine the value of both perfect and imperfect information to the decision maker. “Perfect” information is always correct, hardly a realistic concept, but one that is very useful when trying to determine an upper bound on the value of additional information. Because it is a relatively straightforward calculation, the value of perfect information is helpful for ranking R&D activities.
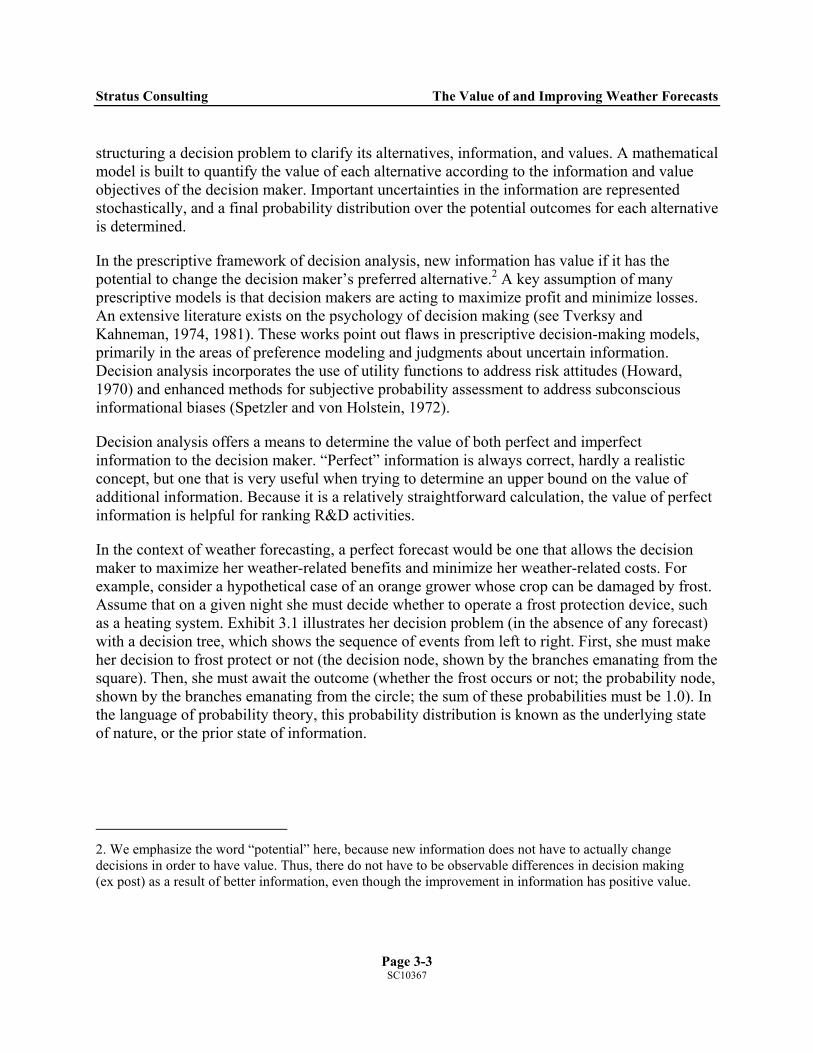
In the context of weather forecasting, a perfect forecast would be one that allows the decision maker to maximize her weather-related benefits and minimize her weather-related costs. For example, consider a hypothetical case of an orange grower whose crop can be damaged by frost. Assume that on a given night she must decide whether to operate a frost protection device, such as a heating system. Exhibit 3.1 illustrates her decision problem (in the absence of any forecast) with a decision tree, which shows the sequence of events from left to right. First, she must make her decision to frost protect or not (the decision node, shown by the branches emanating from the square). Then, she must await the outcome (whether the frost occurs or not; the probability node, shown by the branches emanating from the circle; the sum of these probabilities must be 1.0). In the language of probability theory, this probability distribution is known as the underlying state of nature, or the prior state of information.
2. We emphasize the word “potential” here, because new information does not have to actually change decisions in order to have value. Thus, there do not have to be observable differences in decision making (ex post) as a result of better information, even though the improvement in information has positive value.
Page 3-3 SC10367
Stratus Consulting The Value of and Improving Weather Forecasts
Ex
Applying hypothetical valdecision for the grower. Awith no frost damage is 10If frost occurs but she has her net loss is 50. If there ivalue of 100 is reduced bydiscrete probability distribno frost), we can calculatefollows:
Expected v
Expected v
In the absence of additionaexpected value of 65. Exhiand results. The arrow hig
Frost
No frost
Frost
No frost
Protection
No frost
Frost
Protection
hibit 3.1. Decision tree for orange grower.
ues to the situation shown in Exhibit 3.1, we can calculate the optimal ssume that the cost of frost protection is 25, and the value of the crop 0. If frost occurs and she has no frost protection, she has a total loss, 0. frost protection, she still has crop damage but it is limited to 25, and s no frost, but she has installed frost protection anyway, her potential the cost of frost protection to 75. Finally, by applying a hypothetical ution for the likelihood of frost (40% chance of frost; 60% chance of the expected (i.e., probability-weighted) value of each alternative as
alue with frost protection = (0.4) × 50 + (0.6) × 75 = 65
alue with no frost protection = (0.4) × 0 + (0.6) × 100 = 60
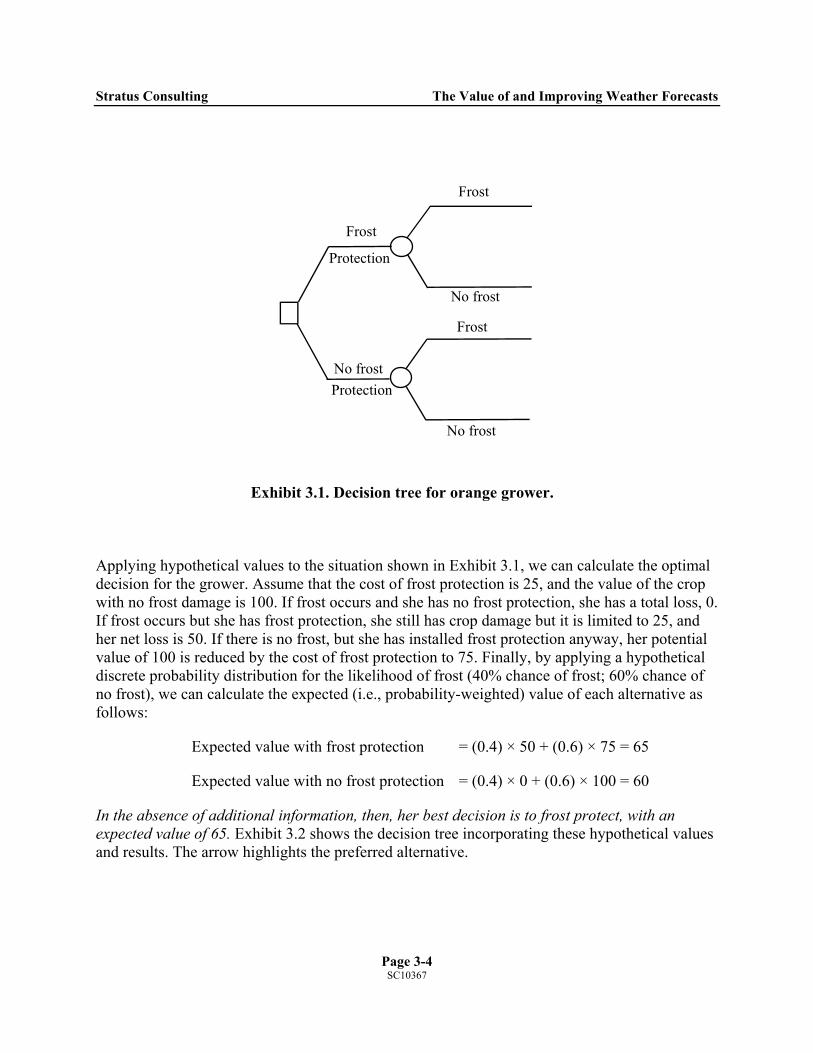
l information, then, her best decision is to frost protect, with an bit 3.2 shows the decision tree incorporating these hypothetical values hlights the preferred alternative.
Page 3-4 SC10367
Stratus Consulting The Value of and Improving Weather Forecasts
Frost
No frost
Frost
Endpointvalue
50
0
75
100No frost
Protection
No frost
Frost
Expectedvalue = 60
Expectedvalue = 65
Protection
p = 0.40
p = 0.40
p = 0.60
p = 0.60
Exhibit 3.2. Orange grower’s decision tree with expected values. (p = probability)
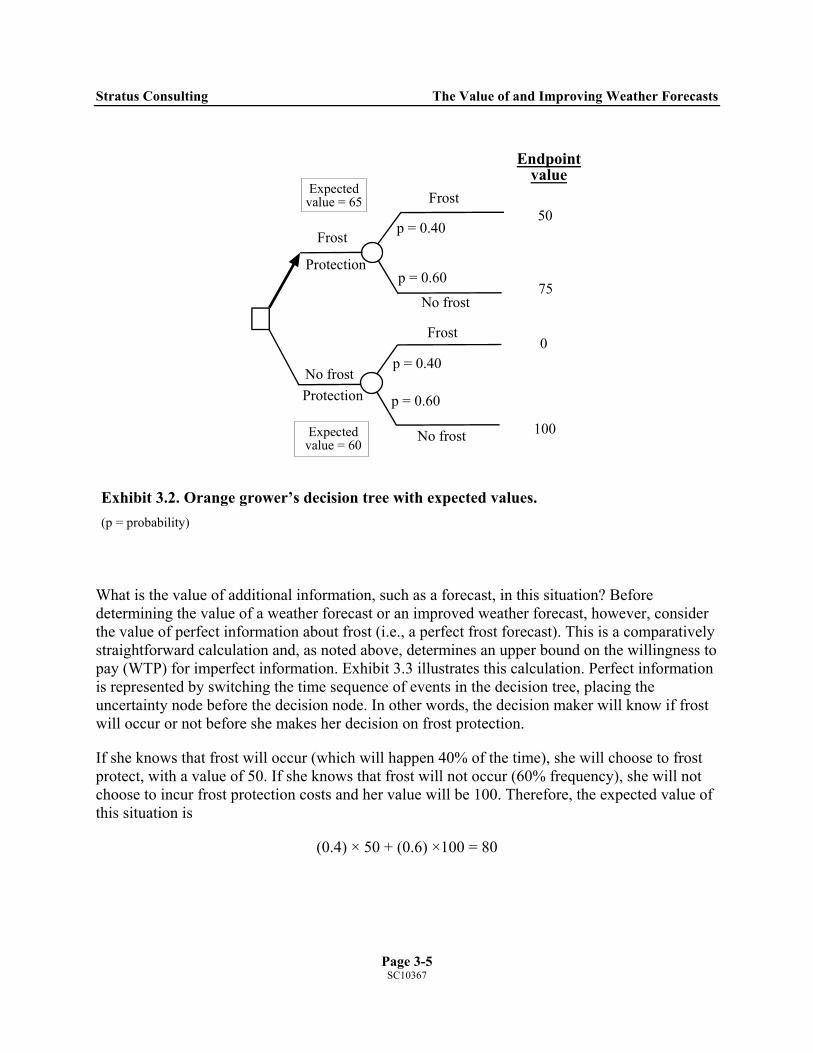
What is the value of additional information, such as a forecast, in this situation? Before determining the value of a weather forecast or an improved weather forecast, however, consider the value of perfect information about frost (i.e., a perfect frost forecast). This is a comparatively straightforward calculation and, as noted above, determines an upper bound on the willingness to pay (WTP) for imperfect information. Exhibit 3.3 illustrates this calculation. Perfect information is represented by switching the time sequence of events in the decision tree, placing the uncertainty node before the decision node. In other words, the decision maker will know if frost will occur or not before she makes her decision on frost protection.
If she knows that frost will occur (which will happen 40% of the time), she will choose to frost protect, with a value of 50. If she knows that frost will not occur (60% frequency), she will not choose to incur frost protection costs and her value will be 100. Therefore, the expected value of this situation is
(0.4) × 50 + (0.6) ×100 = 80
Page 3-5 SC10367
Stratus Consulting The Value of and Improving Weather Forecasts
Exhibit 3.3
The value osituations, wis 65. With 15. Thus, athe reason t60% of the value from
Imperfect inexample, a how should1761) devenew inform
If thP(Boccu
Frost
No frost
Frost
p = 0.40
Prior LikelihoodEndpoint
value
50
0
p = 0.60 75
100No frost
Protection
Protection
Protection
Protection
No frost
Frost
Overall expectedvalue with
perfect information= (0.4)x 50 + (0.6) x 100
= 80
Expectedvalue = 100
Expectedvalue = 50
. Decision tree with perfect information about frost.
f perfect information is the difference between the expected values of the two ith and without perfect information. Without perfect information, her expected value
perfect information, her expected value is 80, and the value of perfect information is ny weather forecast (i.e., imperfect information) will have a value less than 15. Note hat perfect information has value: without it, her best alternative is to protect; with it, time she would change her decision to no frost protection and would increase her 75 to 100 (60% of 25 is 15).
formation is the real-world norm, and is often thought of in terms of a forecast. For frost forecast has a certain degree of accuracy associated with it. Given this forecast, we update our probability distribution on frost? The Reverend Thomas Bayes (1702-loped a theorem, called Bayes’ Rule, to update a prior probability distribution given ation:
e events E1, E2,…,Ek partition a sample space, and if B is any other event for which ) > 0, the conditional probability of any partitioning event Ei given that B has rred is
( ) ( ) ( )( ) ( )
k ..., 2, 1, i ,|
||1
==∑ =
k
j ij
iii
EBPEPEBPEPBEP
Page 3-6 SC10367
Stratus Consulting The Value of and Improving Weather Forecasts
The term on the left is known as the “posterior” distribution; that is, the updated probability on the state of information (i.e., the prior) given the new information. The two probability expressions in the numerator of the right-hand term are the “prior “and the “likelihood” distributions, respectively. The denominator is known as the “preposterior” distribution.
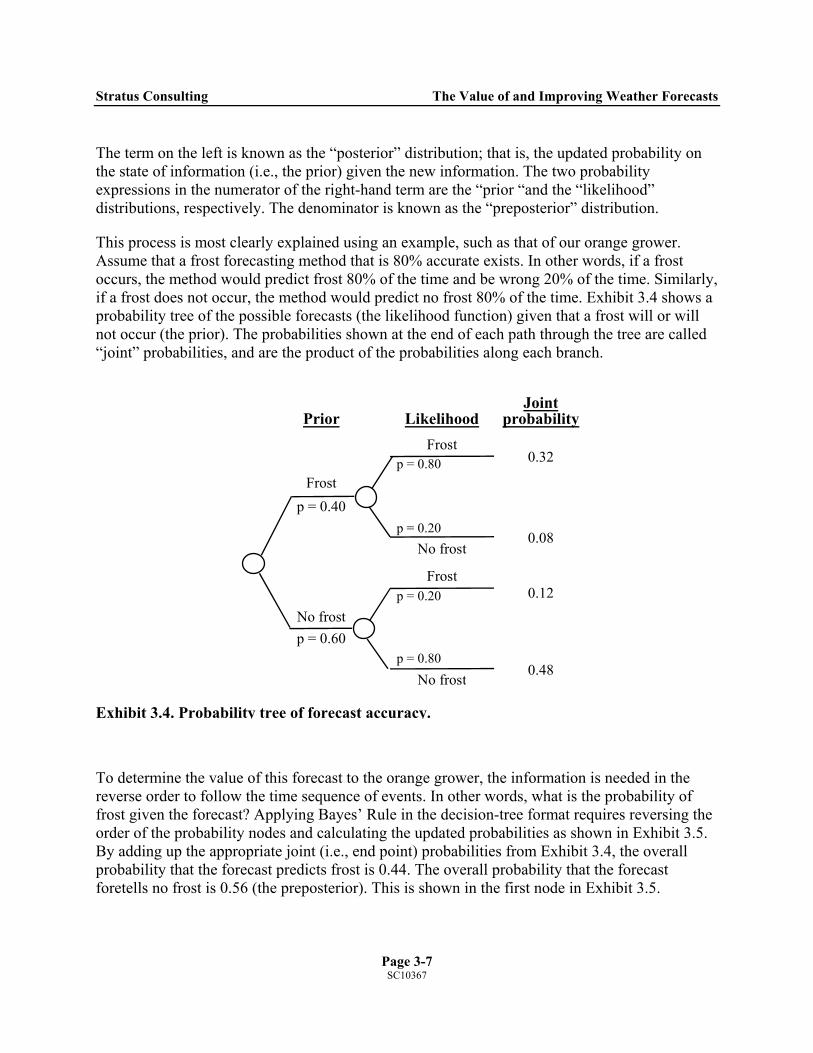
This process is most clearly explained using an example, such as that of our orange grower. Assume that a frost forecasting method that is 80% accurate exists. In other words, if a frost occurs, the method would predict frost 80% of the time and be wrong 20% of the time. Similarly, if a frost does not occur, the method would predict no frost 80% of the time. Exhibit 3.4 shows a probability tree of the possible forecasts (the likelihood function) given that a frost will or will not occur (the prior). The probabilities shown at the end of each path through the tree are called “joint” probabilities, and are the product of the probabilities along each branch.
Exhibit 3.4. Probabil
To determine the valureverse order to followfrost given the forecasorder of the probabilitBy adding up the apprprobability that the foforetells no frost is 0.5
Frost
No frost
Frost
p = 0.40
Prior LikelihoodJoint
probability
p = 0.80
p = 0.20
0.32
0.08No frost
p = 0.60
0.12
0.48No frost
Frost
p = 0.80
p = 0.20
ity tree of forecast accuracy.
e of this forecast to the orange grower, the information is needed in the the time sequence of events. In other words, what is the probability of t? Applying Bayes’ Rule in the decision-tree format requires reversing the y nodes and calculating the updated probabilities as shown in Exhibit 3.5. opriate joint (i.e., end point) probabilities from Exhibit 3.4, the overall recast predicts frost is 0.44. The overall probability that the forecast 6 (the preposterior). This is shown in the first node in Exhibit 3.5.
Page 3-7 SC10367
Stratus Consulting The Value of and Improving Weather Forecasts
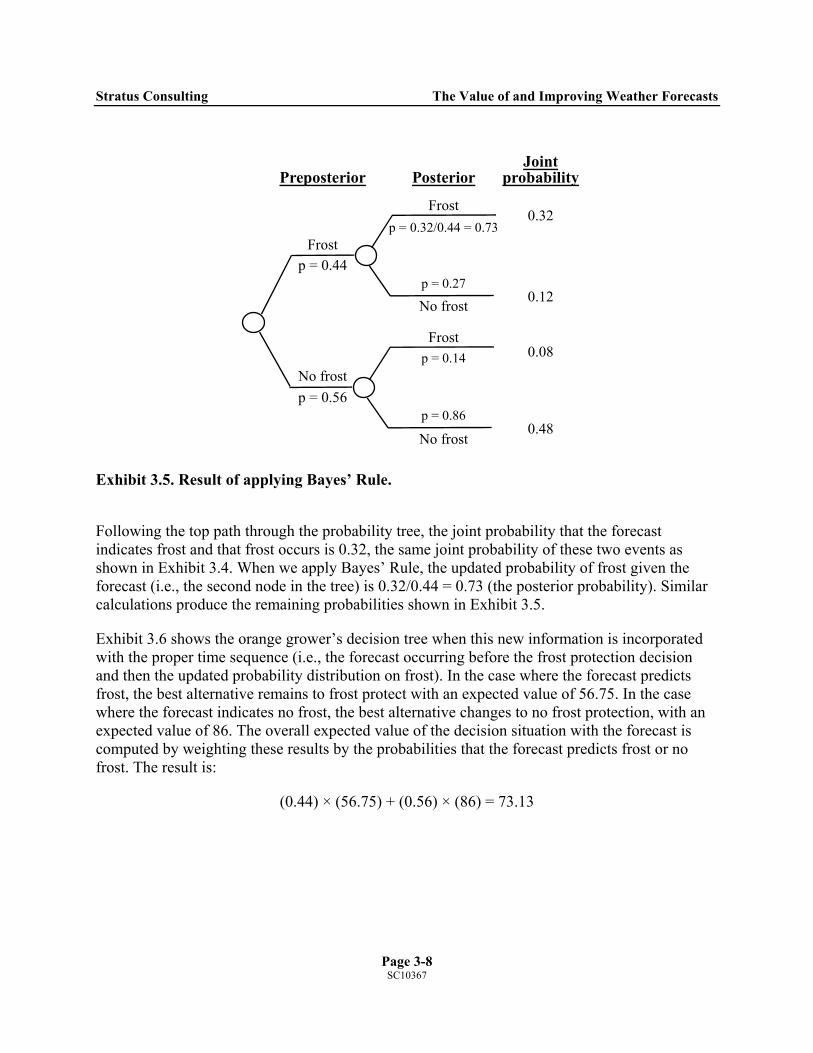
Exhibit 3.5. Result of
Following the top pathindicates frost and thashown in Exhibit 3.4. forecast (i.e., the secocalculations produce t
Exhibit 3.6 shows thewith the proper time sand then the updated pfrost, the best alternatwhere the forecast indexpected value of 86. computed by weightinfrost. The result is:
Frost
No frost
Frostp = 0.44
Preposterior PosteriorJoint
probability
p = 0.32/0.44 = 0.73
p = 0.27
0.32
0.12
Frost
No frost
No frostp = 0.56
p = 0.14
p = 0.86
0.08
0.48
applying Bayes’ Rule.
through the probability tree, the joint probability that the forecast t frost occurs is 0.32, the same joint probability of these two events as When we apply Bayes’ Rule, the updated probability of frost given the nd node in the tree) is 0.32/0.44 = 0.73 (the posterior probability). Similar he remaining probabilities shown in Exhibit 3.5.
orange grower’s decision tree when this new information is incorporated equence (i.e., the forecast occurring before the frost protection decision robability distribution on frost). In the case where the forecast predicts
ive remains to frost protect with an expected value of 56.75. In the case icates no frost, the best alternative changes to no frost protection, with an The overall expected value of the decision situation with the forecast is g these results by the probabilities that the forecast predicts frost or no
(0.44) × (56.75) + (0.56) × (86) = 73.13
Page 3-8 SC10367

Stratus Consulting The Value of and Improving Weather Forecasts
Exhib
Finalbetw
As w
Frost
No frost
p = 0.73050
75p = 0.270
Frost
No frost
p = 0.7300
100p = 0.270
Frost
No frost
protection
Frostp = 0.44
Frost
No frost
p = 0.14050
75p = 0.860
Frost
No frost
p = 0.1400
100p = 0.860
Frost
No frostp = 0.56
EV = 73.13
Forecast Decision OutcomeEndpoint
value
protection
protection
protectionNo frost
EV = 71.500
EV =86.000
EV = 56.750
EV = 27.000
it 3.6. Expected value with 80% accurate forecast.
ly, the value of the forecast itself (i.e., the value of imperfect information) is the difference een the decision maker’s expected value with and without the information:
Value of the 80% accurate forecast = 73.13 – 65 = 8.13
e would expect, this value is less than the value of perfect information, which was 15.
Page 3-9 SC10367

Stratus Consulting The Value of and Improving Weather Forecasts
In this situation, what would be the value of an improved forecast such as might result from a new R&D effort? Suppose the improved forecast has an accuracy of 90%. Following the same process as shown in Exhibits 3.4, 3.5, and 3.6 and applying Bayes’ Rule, we arrive at the new decision tree for the orange grower, shown in Exhibit 3.7. The overall expected value rises to 76.5 as a result of the improved accuracy. The value of the 90% accurate forecast, then, is 11.5 compared to no new information and 3.37 compared to the 80% accurate forecast.
Exhibit
In summimperfecbenefits
Frost
No frost
p = 0.85750
75p = 0.143
Frost
No frost
p = 0.8570
100p = 0.143
Frost
No frost
protection
Frostp = 0.42
Frost
No frost
p = 0.06950
75p = 0.931
Frost
No frost
p = 0.0690
100p = 0.931
Frost
No frostp = 0.58
EV = 76.5
Forecast Decision OutcomeEndpoint
value
protection
protection
protection
No frost
EV = 53.575
EV = 14.300
EV = 73.275
EV = 93.100
3.7. Expected value with 90% accurate forecast.
Page 3-10 SC10367
ary, methods exist to determine the value of information to decision makers even if it is t, as in the case of weather forecasting. This value can in turn be used to assess the of R&D efforts that will yield better information.
4. Assessment of Benefits of Improved Weather Forecasts
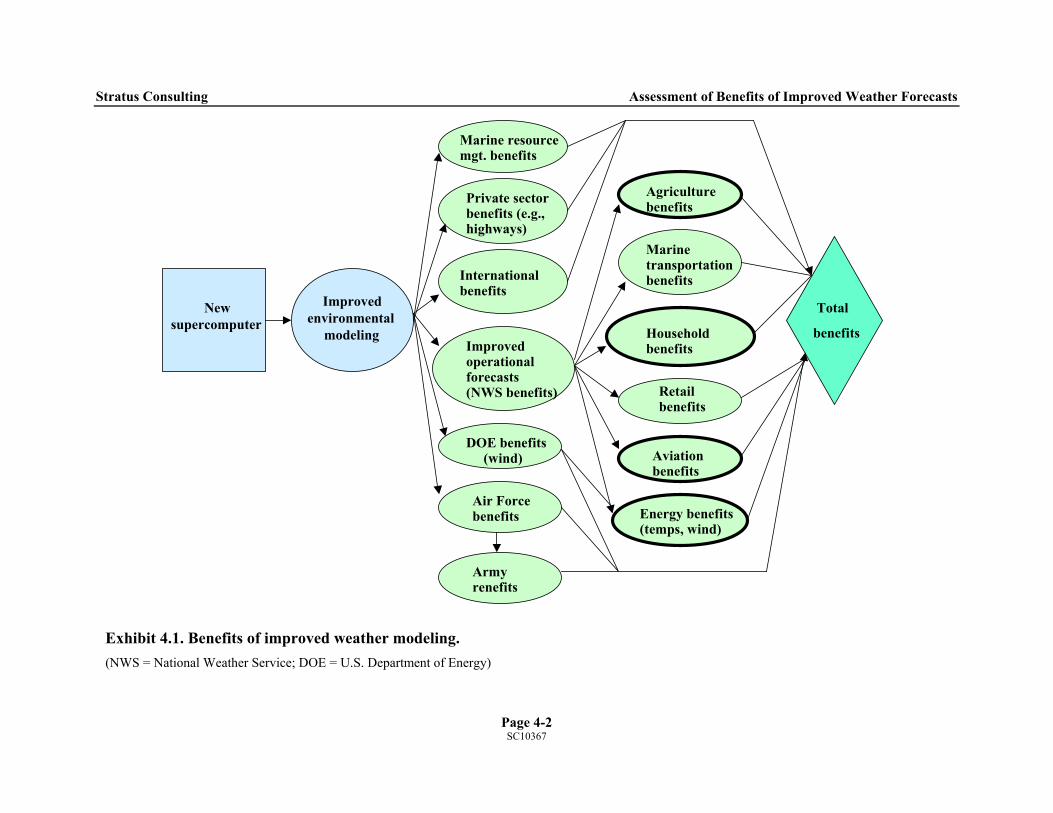
The improvements in computing and modeling capabilities derived from the acquisition of a new supercomputer may lead to various economic benefits as illustrated in the influence diagram in Exhibit 4.1. In an influence diagram, square icons represent decisions; circles represent uncertain data or events, or both; and diamonds represent the decision criteria. The direction of the arrows indicates the influences. Exhibit 4.1 shows the decision to purchase a new supercomputer (a square) leading to improved environmental (including weather) modeling (a circle). Improved weather modeling, in turn, has the potential to lead directly to an array of benefits in the following sectors (also in circles):
NWS operational forecasts marine resource management private sector (e.g., highways) international benefits wind-related sectors of the U.S. Department of Energy (DOE) U.S. Air Force, which also provides forecasts to the U.S. Army.
Exhibit 4.1 also illustrates that additional economic benefits are possible from the sectors utilizing NWS forecasts, either directly or as inputs to sector-specific weather forecast models:
agriculture marine transportation households
ordinary weather forecasts weather-related fatalities
retail businesses aviation energy.
Combining all the direct and indirect benefits of improved weather modeling will lead to the total benefits of acquiring a new supercomputer, as shown by the arrows leading into the diamond icon. Note that Exhibit 4.1 is intended to represent the majority of the possible benefits of a new NOAA supercomputer; it is not meant to be exhaustive.
SC10367
Stratus Consulting Assessment of Benefits of Improved Weather Forecasts
New supercomputer
Improved environmental
modeling
Air Forcebenefits
DOE benefits (wind)
Marine resource mgt. benefits
Private sector benefits (e.g., highways)
Internationalbenefits
Improvedoperational forecasts (NWS benefits)
Armyrenefits
Aviationbenefits
Retailbenefits
Energy benefits (temps, wind)
Marinetransportation benefits
Agriculturebenefits
Total
benefits Householdbenefits
Exhibit 4.1. Benefits of improved weather modeling. (NWS = National Weather Service; DOE = U.S. Department of Energy)
Page 4-2 SC10367
Stratus Consulting Assessment of Benefits of Improved Weather Forecasts
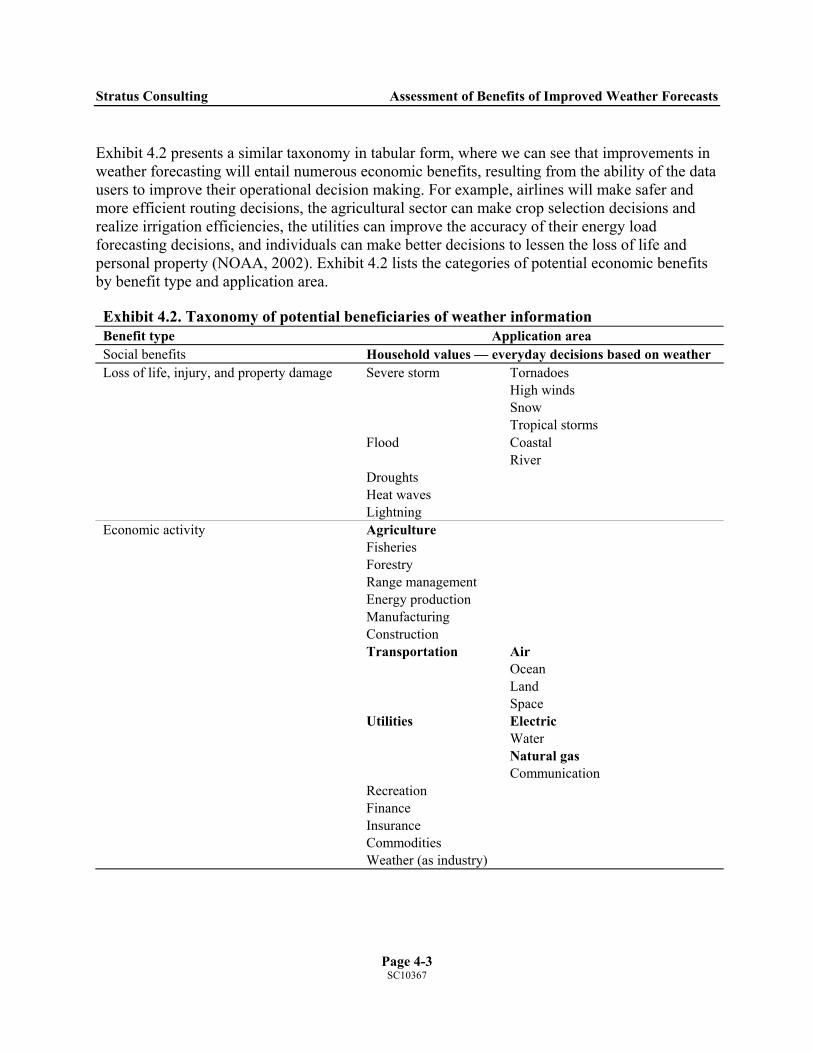
Exhibit 4.2 presents a similar taxonomy in tabular form, where we can see that improvements in weather forecasting will entail numerous economic benefits, resulting from the ability of the data users to improve their operational decision making. For example, airlines will make safer and more efficient routing decisions, the agricultural sector can make crop selection decisions and realize irrigation efficiencies, the utilities can improve the accuracy of their energy load forecasting decisions, and individuals can make better decisions to lessen the loss of life and personal property (NOAA, 2002). Exhibit 4.2 lists the categories of potential economic benefits by benefit type and application area.
Exhibit 4.2. Taxonomy of potential beneficiaries of weather information Benefit type Application area Social benefits Household values — everyday decisions based on weather
Tornadoes High winds Snow
Severe storm
Tropical storms Coastal Flood River
Droughts Heat waves
Loss of life, injury, and property damage
Lightning Agriculture Fisheries Forestry Range management Energy production Manufacturing Construction
Air Ocean Land
Transportation
Space Electric Water Natural gas
Utilities
Communication Recreation Finance Insurance Commodities
Economic activity
Weather (as industry)
Page 4-3 SC10367

Stratus Consulting Assessment of Benefits of Improved Weather Forecasts
Exhibit 4.2. Taxonomy of potential beneficiaries of weather information (cont.) Benefit type Application area
Earth processes Model evaluation
Public policy; understanding Earth
Global change Source: NOAA, 2002.
For the purposes of this study, we selected for analysis the sectors likely to show the greatest potential economic benefits or those for which making quantitative assessments of the relationship between improved forecast quality and improved weather modeling appears most feasible. The benefits of the four application areas listed in Exhibit 4.2 (in bold type) are discussed in further detail in this analysis: 1) households, 2) agriculture, 3) aviation, and 4) utilities (electric and natural gas).The benefits to these sectors are examined both qualitatively and quantitatively. We obtained information on economic benefits (primarily costs avoided by the increased forecast accuracy) via interviews with NOAA personnel and from published and unpublished literature.
This analysis attempts to quantify some of the expected benefits to just a few of the 33 application areas identified in Exhibit 4.2. Thus, notwithstanding the limitations of the estimation techniques used, these estimates represent a lower bound to the true dollar value for potential benefits.
The remaining sections in this chapter briefly summarizes the literature on the value of weather forecasts and improved weather forecasts in each of these four sectors. Appendix A includes more detailed summaries of the literature we reviewed.
4.1 Households
Future weather inherently involves risk and uncertainty, concepts that have been addressed in many forms in economic theory and modeling. Weather forecasts are made up of information about future events, which may or may not be of use to individuals or groups in dealing with the risk and uncertainty of future weather conditions. Although weather outcomes have real impacts on behavior and economic consequences, information about potential weather outcomes may also have value. We focus here on the value of information in dealing with risk and uncertainty of future weather outcomes. The value of information then relates to how individuals, or “economic agents,” can or will react to changes in the information available when they face a “weather risk.” Exhibit 4.3 shows that improvements in many weather forecast products have potential decision-making values to households.
Page 4-4 SC10367

Stratus Consulting Assessment of Benefits of Improved Weather Forecasts
4
Iehfain
MtesIfvteinpdinp
Short TermWeather
Modeling
Severe WeatherForecasts
TemperatureForecasts
PrecipitationForecasts
WindForecasts
Home ImprovementDecisions
Preparation forSevere Weather
ShoppingDecisions
Commuting /Travel Decisions
Total
Benefits
RecreationDecisions
Cloud CoverForecasts
Exhibit 4.3. Flow chart of household benefits from short-term weather forecasts.
.1.1 Household perceptions and uses of weather information
n general, the importance of communication in the valuation process has not been thoroughly xamined. Studies have generally addressed specific aspects of weather forecasts. Understanding ousehold perception of weather information involves the receiving part of communication, and ew studies have examined how individuals perceive and use weather information. We are not ware of any consistent or determined effort to examine the communication of weather formation to households.
urphy et al. (1980) report on an examination of how laypeople understand probabilities in rms of precipitation forecasts. Results indicate that individuals misunderstand the event more
o than the probabilities and that they prefer information presented as percentages. MSI Services ncorporated (1981) reports on a national telephone survey of 1,300 households’ use of and need or weather forecast information, but this work did not elicit reliable economic estimates of the alue for current or improved forecasts. Murphy and Brown (1983) discuss the use of rminology in verbal public weather forecasts and what can be done to improve the transfer of formation. They conclude that studies have found that, in general, temperature and
recipitation are the most important part of the forecast message. Curtis and Murphy (1985) iscuss a survey implemented through a newspaper in Seattle examining individual terpretations of various terms used in weather forecasts. Similar to previous findings,
recipitation and temperature information was more important than cloud cover or wind. Pope
Page 4-5 SC10367
Stratus Consulting Assessment of Benefits of Improved Weather Forecasts
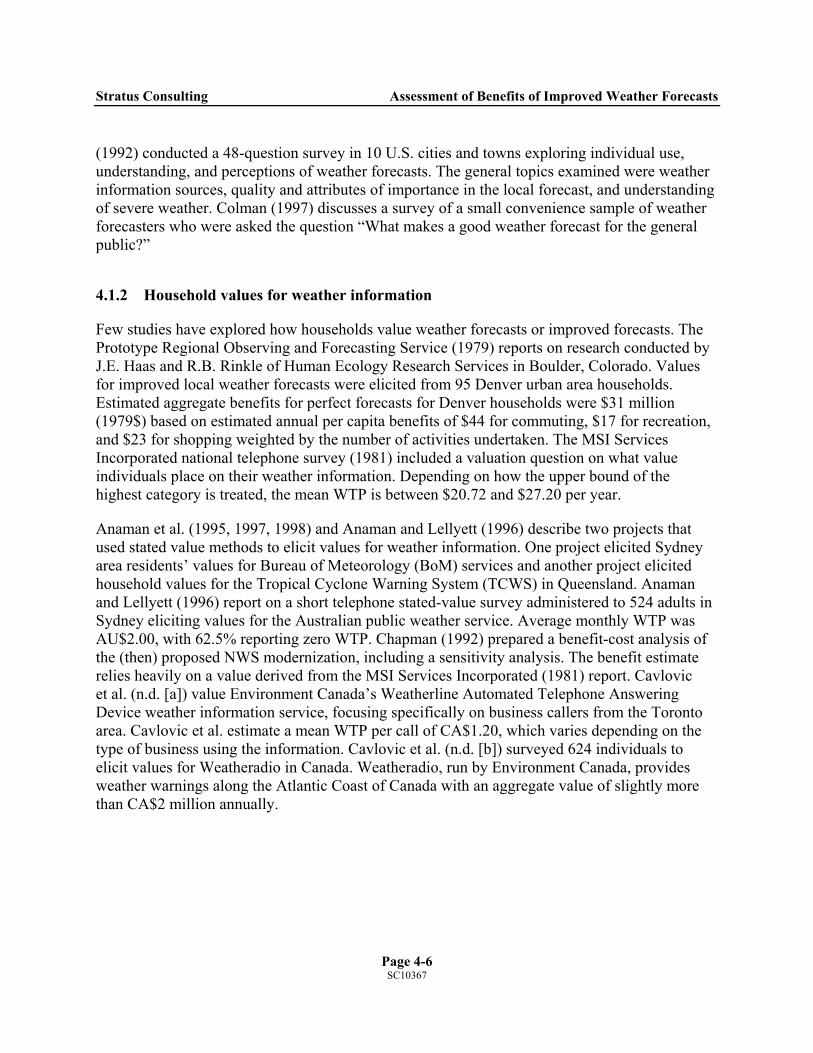
(1992) conducted a 48-question survey in 10 U.S. cities and towns exploring individual use, understanding, and perceptions of weather forecasts. The general topics examined were weather information sources, quality and attributes of importance in the local forecast, and understanding of severe weather. Colman (1997) discusses a survey of a small convenience sample of weather forecasters who were asked the question “What makes a good weather forecast for the general public?”
4.1.2 Household values for weather information
Few studies have explored how households value weather forecasts or improved forecasts. The Prototype Regional Observing and Forecasting Service (1979) reports on research conducted by J.E. Haas and R.B. Rinkle of Human Ecology Research Services in Boulder, Colorado. Values for improved local weather forecasts were elicited from 95 Denver urban area households. Estimated aggregate benefits for perfect forecasts for Denver households were $31 million (1979$) based on estimated annual per capita benefits of $44 for commuting, $17 for recreation, and $23 for shopping weighted by the number of activities undertaken. The MSI Services Incorporated national telephone survey (1981) included a valuation question on what value individuals place on their weather information. Depending on how the upper bound of the highest category is treated, the mean WTP is between $20.72 and $27.20 per year.
Anaman et al. (1995, 1997, 1998) and Anaman and Lellyett (1996) describe two projects that used stated value methods to elicit values for weather information. One project elicited Sydney area residents’ values for Bureau of Meteorology (BoM) services and another project elicited household values for the Tropical Cyclone Warning System (TCWS) in Queensland. Anaman and Lellyett (1996) report on a short telephone stated-value survey administered to 524 adults in Sydney eliciting values for the Australian public weather service. Average monthly WTP was AU$2.00, with 62.5% reporting zero WTP. Chapman (1992) prepared a benefit-cost analysis of the (then) proposed NWS modernization, including a sensitivity analysis. The benefit estimate relies heavily on a value derived from the MSI Services Incorporated (1981) report. Cavlovic et al. (n.d. [a]) value Environment Canada’s Weatherline Automated Telephone Answering Device weather information service, focusing specifically on business callers from the Toronto area. Cavlovic et al. estimate a mean WTP per call of CA$1.20, which varies depending on the type of business using the information. Cavlovic et al. (n.d. [b]) surveyed 624 individuals to elicit values for Weatheradio in Canada. Weatheradio, run by Environment Canada, provides weather warnings along the Atlantic Coast of Canada with an aggregate value of slightly more than CA$2 million annually.
Page 4-6 SC10367
Stratus Consulting Assessment of Benefits of Improved Weather Forecasts
Stratus Consulting (2002) represents the only recent study designed to elicit household values for current and improved weather forecasts using accepted economic approaches. Because this work is the basis for the benefit analysis in this report, we discuss this study in more detail in the following section.
4.1.3 Stratus Consulting (2002)
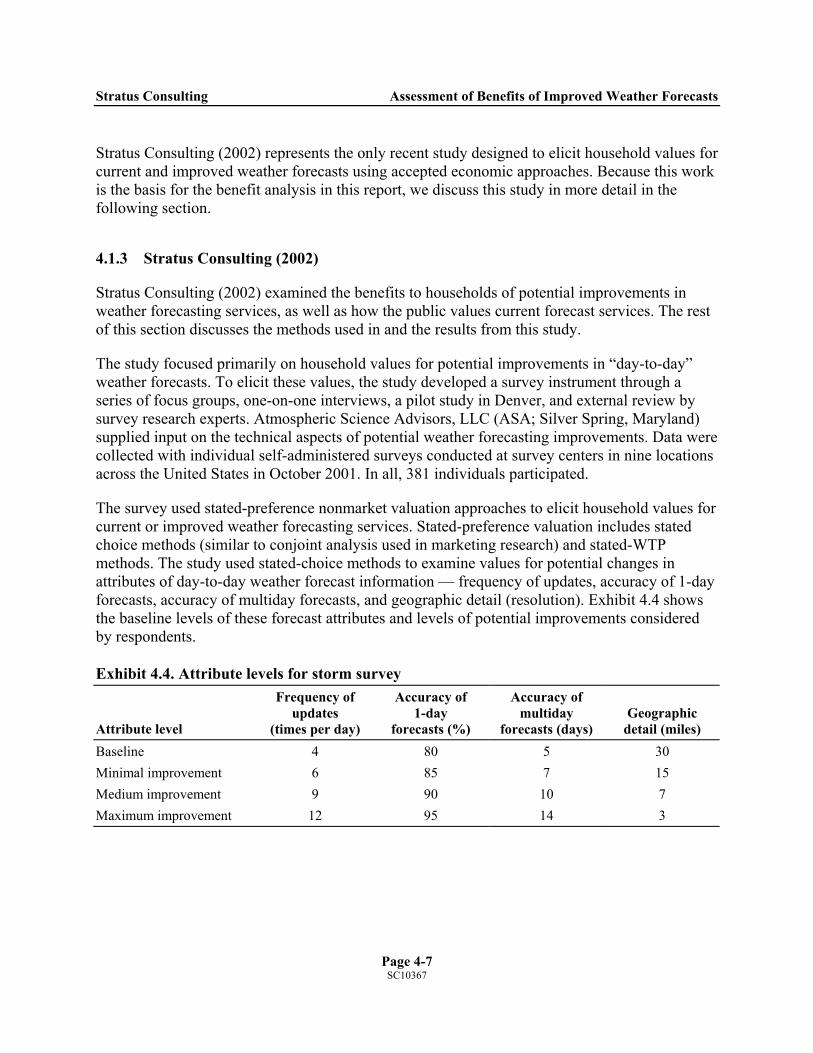
Stratus Consulting (2002) examined the benefits to households of potential improvements in weather forecasting services, as well as how the public values current forecast services. The rest of this section discusses the methods used in and the results from this study.
The study focused primarily on household values for potential improvements in “day-to-day” weather forecasts. To elicit these values, the study developed a survey instrument through a series of focus groups, one-on-one interviews, a pilot study in Denver, and external review by survey research experts. Atmospheric Science Advisors, LLC (ASA; Silver Spring, Maryland) supplied input on the technical aspects of potential weather forecasting improvements. Data were collected with individual self-administered surveys conducted at survey centers in nine locations across the United States in October 2001. In all, 381 individuals participated.
The survey used stated-preference nonmarket valuation approaches to elicit household values for current or improved weather forecasting services. Stated-preference valuation includes stated choice methods (similar to conjoint analysis used in marketing research) and stated-WTP methods. The study used stated-choice methods to examine values for potential changes in attributes of day-to-day weather forecast information — frequency of updates, accuracy of 1-day forecasts, accuracy of multiday forecasts, and geographic detail (resolution). Exhibit 4.4 shows the baseline levels of these forecast attributes and levels of potential improvements considered by respondents.
Exhibit 4.4. Attribute levels for storm survey
Attribute level
Frequency of updates
(times per day)
Accuracy of 1-day
forecasts (%)
Accuracy of multiday
forecasts (days) Geographic
detail (miles)
Baseline 4 80 5 30 Minimal improvement 6 85 7 15 Medium improvement 9 90 10 7 Maximum improvement 12 95 14 3
Page 4-7 SC10367
Stratus Consulting Assessment of Benefits of Improved Weather Forecasts
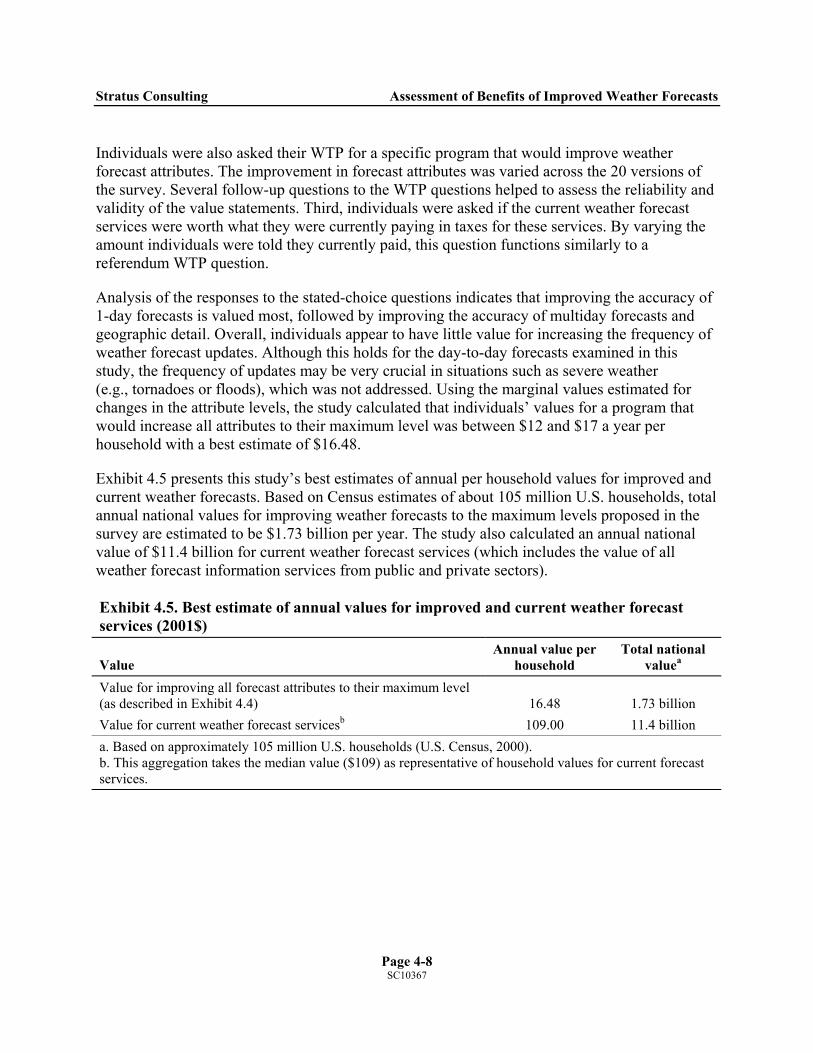
Individuals were also asked their WTP for a specific program that would improve weather forecast attributes. The improvement in forecast attributes was varied across the 20 versions of the survey. Several follow-up questions to the WTP questions helped to assess the reliability and validity of the value statements. Third, individuals were asked if the current weather forecast services were worth what they were currently paying in taxes for these services. By varying the amount individuals were told they currently paid, this question functions similarly to a referendum WTP question.
Analysis of the responses to the stated-choice questions indicates that improving the accuracy of 1-day forecasts is valued most, followed by improving the accuracy of multiday forecasts and geographic detail. Overall, individuals appear to have little value for increasing the frequency of weather forecast updates. Although this holds for the day-to-day forecasts examined in this study, the frequency of updates may be very crucial in situations such as severe weather (e.g., tornadoes or floods), which was not addressed. Using the marginal values estimated for changes in the attribute levels, the study calculated that individuals’ values for a program that would increase all attributes to their maximum level was between $12 and $17 a year per household with a best estimate of $16.48.
Exhibit 4.5 presents this study’s best estimates of annual per household values for improved and current weather forecasts. Based on Census estimates of about 105 million U.S. households, total annual national values for improving weather forecasts to the maximum levels proposed in the survey are estimated to be $1.73 billion per year. The study also calculated an annual national value of $11.4 billion for current weather forecast services (which includes the value of all weather forecast information services from public and private sectors).
Exhibit 4.5. Best estimate of annual values for improved and current weather forecast services (2001$)
Value Annual value per
household Total national
valuea Value for improving all forecast attributes to their maximum level (as described in Exhibit 4.4) 16.48 1.73 billion Value for current weather forecast servicesb 109.00 11.4 billion a. Based on approximately 105 million U.S. households (U.S. Census, 2000). b. This aggregation takes the median value ($109) as representative of household values for current forecast services.
Page 4-8 SC10367
Stratus Consulting Assessment of Benefits of Improved Weather Forecasts
4.2 Aviation
Between 70% and 75% of recorded commercial flight delays were caused by weather over the last decade, and approximately 35% of commercial aviation fatalities occur in weather-related accidents. Delays and accidents can be caused by turbulence, icing, low-level wind shear, fog, low visibility, lightning strikes, and other factors. Accidents also can be caused by volcanic ash damaging airframes, engines, or instruments. For example, one Boeing 747 lost power in all four engines while flying through a cloud of volcanic ash over Alaska. The pilot was able to restart the engines and land safely, but all four engines had to be replaced and damages totaled $30 million. Weather is the cause of 80% of accidents in general aviation, and 83.3% of fatal accidents among private fliers (American Meteorological Society [AMS] Newsletter, 2000).
When weather events occur, flights may be delayed substantially, the capacity of the system may be greatly reduced, and aircraft and crews may not be available when needed. Improvements in forecasting weather en route and at the airport can lower costs for fuel, lower crew labor costs as more flights operate closer to the scheduled times, reduce passenger reaccommodation costs because fewer connections are missed, and lower costs from repositioning aircraft to serve later flights. For some airlines that do not have an automatic policy of carrying extra fuel to allow for all contingencies, accurate forecasts can allow aircraft to avoid carrying extra fuel that might be needed for safety, reducing weight and saving on fuel costs. Reduced delays or cancellations can also produce higher revenue because more passengers complete their trips as planned (and are not rebooked on other carriers when flights are cancelled or connections are missed), and generate less “ill will” toward the carrier or the carrier’s hub airport because passengers will have better flight experiences (Sinnott et al., 2002).
Exhibit 4.6 summarizes some of the potential weather impacts on aviation and shows where improved weather forecasts may generate benefits.
Aviation weather information and products serve the Air Traffic Management (ATM) system operated by the Federal Aviation Administration (FAA). This system has taken decades to develop to its current capabilities. The NWS works closely with the FAA and the U.S. Department of Defense to provide aviation weather products. Much of the effort to increase scientific understanding of atmospheric conditions that cause dangerous weather is being coordinated through the FAA’s Aviation Weather Research Program (AWRP). The research is aimed at producing more accurate and accessible weather observations, warnings, and forecasts. Partner agencies including NOAA, the National Center for Atmospheric Research (NCAR), the Massachusetts Institute of Technology’s (MIT) Lincoln Laboratory, and the Naval Research Laboratory have worked with the AWRP to conduct the research.
Page 4-9 SC10367

Stratus Consulting Assessment of Benefits of Improved Weather Forecasts
Exh
Estimtechnthe sweatannu2027(WSPare eWSPbene$521airpoand L
Net costs
Accidents
Flightdelays
Equipmentcosts
Injuries andloss of life
Fuelcosts
Crew labor costs
Rebookingcosts
Volcanic ash
Turbulence
Icing
Wind shear
Fog
Low visibility
Lightning
Etc.
ibit 4.6. Influence diagram of weather impacts on aviation.
ates from the literature of the benefits of improvements in weather forecasts and the ology that produces them vary greatly according to the areas of forecasting examined and
ystem evaluated. The value of improvements in satellite technology that is used to produce her forecasts and volcanic ash plume notifications is estimated to be $55 million in marginal al benefits, and $205 million in discounted present value benefits from the time frame 2012- (NOAA, 2002). A study from the national deployment of the Weather System Processor ) assessed delay-reduction benefits in terms of aircraft delay-hour reductions. The benefits
xpected to be $21 million per year based on expected year 2000 traffic counts at the planned airports (Rhoda and Weber, 1996). Based on the latest estimates, national delay-reduction fits from implementing the Integrated Terminal Weather System (ITWS) totals .6 million per year. Benefits from additional deployment of ITWS at three West Coast rts (San Francisco International Airport [SFO], Seattle-Tacoma International Airport [SEA], os Angeles International Airport [LAX]) are estimated to total $56.8 million from reduced
Page 4-10 SC10367
Stratus Consulting Assessment of Benefits of Improved Weather Forecasts
delays resulting from improved merging and sequencing of aircraft. In addition, benefits from Simultaneous Operation with Independent Approaches (SOIA) at SFO are estimated to be $84.3 million per year (Evans et al., 1999). Estimates of the benefits of ITWS application at New York area airports also show substantial benefits from avoided delays in specific convective weather events (Allan et al., 2001). A study of the benefits of Terminal Convective Weather Forecast (TCWF) implementation for the ITWS estimates the benefits of national implementation of TCWF to be $545.2 million annually because of avoided delays from convective weather events (Sunderlin and Paull, 2001). A study of potential benefits from implementation of the Integrated Icing Diagnostic Algorithm (IIDA) estimates an average annual benefit of $31.7 million accruing from avoided in-flight accidents caused by icing (Paull, 2001). Another study showed the value of improved forecasts to an Australian airline in fuel savings to be approximately $11 million per year. The value of a hypothetical 1% increase in forecast accuracy was valued at $0.85 million (Leigh, 1995).
4.3 Agriculture
4.3.1 Introduction
Agricultural activities are very sensitive to climate and weather conditions. Both short-term and long-term forecasts are essential in planning agricultural production. Short-term and daily forecasts relate to daily weather up to 10 days ahead; seasonal forecasts relate to climate over 3- to 6-month periods with lead times of 1-12 or more months. Short-term weather forecasts, such as daily temperature and precipitation predictions, help producers to make better decisions on irrigation and crop-weather relationships such as frost protection and timing of optimal harvests. Long-term climate forecasts are useful to producers for managing land use, selecting plants and breeds of animals, and implementing crop production practices such as irrigation and pest and disease control. Farmers also benefit from severe weather forecasts. Severe weather causes crop damage averaging $2.5 million each year, and this figure would be even higher if the forecasts did not give farmers time to prepare and protect their property.
In this section, the discussion focuses on the benefits from short-term weather forecasts, because most of NOAA FSL’s supercomputing capabilities benefit those forecasts. However, we include a brief discussion of seasonal climate forecasts because these types of forecasts are also generated using the current capabilities, but to a lesser extent.
Short-term forecasts include forecasts for less than 1 day, showing location, movement, and intensity of regional and local rainfall, and displaying current weather conditions as well as derived variables. Daily weather forecasts include forecasts up to 10 days in advance, and outputs are produced for 12 hourly or daily intervals. Variable forecasts, which are important to agriculture, include rainfall, temperature, winds, frost, and all types of severe weather forecasts.
Page 4-11 SC10367

Stratus Consulting Assessment of Benefits of Improved Weather Forecasts
The flow chart in Exhibit 4.7 displays these weather forecasts and shows which agricultural decisions are based on these forecast variables. Planting, irrigation, fertilization, pesticide application, harvesting, and drying decisions are all affected by weather, and harvest yield can be greatly influenced by the decisions made by producers and by the weather that follows.
4
TfdF
Short-term weather forecasts
Severeweather
Temperature
Precipitation
Wind
Frost protection(e.g., orchards)
Dryingdecisions (e.g.,wheat, raisins)
Protection fromsevere weather
Fertilizationdecisions
Plantingdecisions
Pesticidedecisions
Total
benefits
Irrigiationdecisions
Frost
Harvestingdecisions (e.g.,wheat)
Exhibit 4.7. Flow chart of the agricultural benefits of short-term weather forecasts.
.3.2 Value of weather forecasts to agriculture
he value of short-term weather forecasts to agriculture materializes when producers have the lexibility to adjust production responses to the new information as it comes in and make ecisions that improve harvest levels (increase profits) or reduce damage (decrease costs). orecasts also are used to help producers decide whether or not to buy crop insurance.
Page 4-12 SC10367

Stratus Consulting Assessment of Benefits of Improved Weather Forecasts
Several studies have estimated the economic benefits of weather forecasts. Some have done so by determining the benefit per unit of farmland (most commonly per hectare), and some have examined a lump sum improvement across a region or a nation per year. We discuss a few studies applicable to the purposes of this research here, and the appendices contain a more complete listing of studies and the values that have been estimated for various short-term weather forecasts.
Katz et al. (1982) examined the relationships between temperature, bud loss, and yield loss, and used optimal decision models to estimate the value of the meteorological information to apple, pear, and peach growers in central Washington. The per acre values estimates (1977$) were $808 for apples, $492 for pears, and $270 for peaches. These amounts account for 66%, 63%, and 47%, respectively, of the economic value that an orchardist whose decisions were based on perfect information would realize. Wilks et al. (1993) examined how alfalfa producers used daily precipitation, temperature, and evaporation forecasts in making their day-to-day harvest decisions. Wilks and colleagues modeled the daily cutting decisions over a growing season, allowing the model to prescribe both the number and timing of cuttings. Temperature forecasts were included in the model to control plant yield and maturity, and as input to the derived evaporation forecasts. The study concluded that perfect weather forecasts are worth $140 per hectare per year to alfalfa growers (1991$). For wheat, precipitation forecast information, as with alfalfa, is most valuable at harvest time because grain quality deteriorates when rain delays the wheat harvest. Fox et al. (1999a) found that the value of perfect weather information averaged $100 per hectare per year (1994 CA$). Fox and coworkers also found that the level of the farmers’ risk aversion was an important determinant of the value of weather forecast information.
4.3.3 Literature on the value of seasonal climate forecasts to agriculture
Substantial advances in climate forecasting in recent years have given farmers access to a growing number of seasonal outlooks. These longer term forecasts may be useful for decisions on land use and management, selection of plants and breeds of animals, and crop production practices such as irrigation, fertilizer application, and pest and disease control.
One study of the Corn Belt region found that perfect long-term forecasts for precipitation, temperature, and radiation were worth from $1.3 billion to $2.9 billion over a 10-year horizon to farmers making decisions about fertilizer application, planting date and density, hybrid selection, and harvest date (Mjelde and Penson, 2000). Adams et al. (1995) assessed the economic returns from improved El Niño/Southern Oscillation (ENSO) forecasts (precipitation and temperature) to various crop yields in the southeastern United States. The results indicated that, under a free-market setting (i.e., in the absence of farm programs), the value of perfect forecasts is $200 million per year. The value of imperfect but improved forecasts is $132 million. Solow
Page 4-13 SC10367

Stratus Consulting Assessment of Benefits of Improved Weather Forecasts
et al. (1998) found perfect ENSO information to be worth more than $320 million per year to U.S. agriculture as a whole. This forecast value was based on expected economic surplus (the sum of consumer and producer welfare). It used teleconnection between ENSO events and minimum and maximum temperature and precipitation in the United States. Appendix A reviews several more studies on the benefits of seasonal forecasts to agriculture.
4.3.4 Estimation of value to three crop sectors of improvements in weather forecasts
Applying a few of the estimates explained in Section 4.3.2 to the nation can yield some insight as to what national agricultural values of perfect weather information might be. Exhibit 4.8 displays the forecast values for three different crops: orchards (apples, peaches, and pears); alfalfa; and winter wheat. The values are listed per acre and are then multiplied by various amounts of land.1 For illustrative purposes, the per-acre values are first applied to the total amount of land planted for that crop. We then show varying percentages of these because it is believed that the studies were likely focused on lands where the value of the weather information is high. We calculated these values over a range of 5% to 20% of the total cropland.
Exhibit 4.8. Annual value of improvement to perfect information
Orchards (apples,
peaches, and pears) Alfalfa Winter wheat
Total for these crops
Value of improvement to perfect information (PI) per acre of farmlanda $1,403 $75 $35 $65.19b Acres of farmlandc 828,460 23,541,000 44,349,000 68,718,460
Value of PI for 100% of land $1.16 billion $1.77 billion $1.55 billion $4.48 billion
Value of PI for 20% of land $232 million $354 million $310 million $896 million
Value of PI for 10% of land $116 million $177 million $155 million $448 million
Value of PI for 5% of land $58 million $89 million $77 million $224 million
a. Midpoint was used when a range of values was given. b. Average per acre. c. Source: Census of Agriculture (1997). Sources: orchards: Katz et al. (1982); alfalfa: Wilks et al. (1993); winter wheat: Fox et al. (1999b).
1. We converted value per hectare to value per acre as appropriate in order to aggregate using information about the number of acres harvested.
Page 4-14 SC10367
Stratus Consulting Assessment of Benefits of Improved Weather Forecasts
Applying the per-acre value of weather information to orchards to just 10% of all orchard land (for apples, peaches, and pears) indicates an annual benefits of $116 million. Alfalfa and winter wheat values for weather information on just 10% of total acres planted indicates benefits of $177 million and $155 million, respectively. The final column of Exhibit 4.8 shows the total benefits of perfect information for these crops for the percent of land included. For instance, perfect short-term weather forecasts on just 10% of the cropland of only five crops generates a total benefit of $448 million each year.
4.4 Energy
Reliability is arguably the highest priority of electric companies. Roughly two-thirds of power outages are weather-related, and some of these could be avoided if more accurate weather data were available. Although the analysis of the recent (August 14, 2003) blackout in the Northeast is still being completed, and early indications are that this particular widespread outage was caused more by a breakdown in human-computer communications than weather, the cost of this outage alone has been estimated between $4 and $6 billion (Dukart, 2003).
Hot weather causes air-conditioning equipment to operate at higher capacity, increasing the need for power suppliers to produce electricity, and thus requiring less economically efficient generating units to run. This, in turn, increases peak loads on the nation’s electric transmission grid, and as power demands surge, equipment becomes overloaded and can fail and cause outages. The primary equipment failures typically involve transformers, which themselves are heat producers that fail when they become overheated. Transmission lines sag when they heat, and if they sag so far that they touch trees, they will short to the ground and automated controls will switch them off from the transmission grid. A number of high-profile outages in recent years have been caused by one of these two mechanisms, although it is unclear exactly how many outages could be prevented by increasing the accuracy of weather data. The increased power demands also increase the level of air pollution emitted by generating facilities. Outages and other heat-related system problems affect power generators, electricity and gas traders, regional transmission operators, and local populations.
Short-term load forecasts of power needs depend on a number of weather variables, including temperature, humidity, wind speed, cloud cover, and extreme events. Temperature is the leading factor in most situations, and more accurate hourly temperature predictions would increase the accuracy of load forecasts, reducing the impacts on the nation’s power system (Fan and McDonald, 1994).
In addition to these weather-related impacts, both short-term forecasts and seasonal weather information drive business decisions within the energy sector. Utility companies typically cite weather as a major determinant of earnings performance in their annual reports, and most state
Page 4-15 SC10367

Stratus Consulting Assessment of Benefits of Improved Weather Forecasts
utility commissions permit utilities to adjust rates based on a weather-normalization clause. Seasonal forecasts of heating degree days (HDD) and cooling degree days (CDD) are now used by third-party companies, who sell “hedge” products to utilities that insure them against the risk to profits associated with above- or below-normal weather conditions. In 2000, nearly 1,400 weather-risk contracts were in place in the United States, with an estimated value of weather risk transferred of $1.8 billion (Nathan, 2001). Temperatures from the Automated Surface Observing Stations (ASOS) are the most widely used data for the weather-risk industry.
Other uses of weather data in the energy sector include:
DOE accumulates ASOS data to derive renewable power resource assessments of solar and wind potential across the country. These assessments, in turn, are a key determinant in investment decisions by developers of renewable energy.
Natural gas suppliers and industrial consumers use longer term forecasts to optimize investments in gas storage, primarily for winter use. Store too much gas for the weather conditions and capital is diverted from other profitable investments. Store too little gas and be forced to purchase on the spot market at prohibitive prices (although in the past few years, gas prices have also heavily influenced electricity prices because gas-fired combustion turbines used to produce power at peak times have become significant users of natural gas, and they rely on short-term forecasts).
In the case of severe weather, utilities can minimize downtime, and thus revenue loss, by predicting when and where crews will be needed to repair downed lines or blown transformers.
Although summing the various end uses for weather data and accurately predicting the value of marginal increases in accuracy of the weather data would be difficult, the value of the marginal benefits of improved short-term forecasts to electric and gas suppliers has been estimated at $500 million per year (Williamson et al., 2002).
Exhibit 4.9 summarizes the relationship between forecasts and costs in the energy industry.
4.5 Weather-Related Fatalities
Significant numbers of people are killed or injured each year in weather-related incidents. Although not all of these are likely to be preventable with improved weather forecasts, some portion of the total could likely be reduced with improved forecasts, warning systems, and changes in behavior on the part of the people receiving this information.
Page 4-16 SC10367

Stratus Consulting Assessment of Benefits of Improved Weather Forecasts
Exhi
One apnumber(VSL) apolicy dthe VSL
An exteusing eor willibeing ubenefitset al. (1
2. See K
Net costs
Loadforecasts
Maint. crew costs
Outagecosts
Operatingcosts
Air pollutioncosts
Weather-risk contracts
Forecasts of:
Temperature
Humidity
Cloud cover
Severe weather: - Wind - Lightning
Etc.
bit 4.9. Influence diagram of weather impacts on energy industry.
proach to valuing the benefits of better weather forecasts would be to determine the of reduced deaths and injuries and put a value on these. The “value of statistical life” pproach is commonly used in determining the value of mortality reductions in public ecision making.2 Deriving individual WTP to reduce the risk of death is used to calculate .
nsive body of literature exists on individual WTP to reduce mortality risks. Many studies, ither revealed-preference or stated-preference approaches, have estimated average WTP ngness to accept (WTA) for small changes in risks of accidental death. These studies are sed as the basis for monetary valuation of mortality risk in assessments of the potential of policy decisions. The works that discuss these types of applications include Fisher 989), Miller (1989), Cropper and Freeman (1991), and Viscusi (1992, 1993).
Page 4-17 SC10367
enkel (2001) for a discussion of the use of VSL statistics in policy decision making.
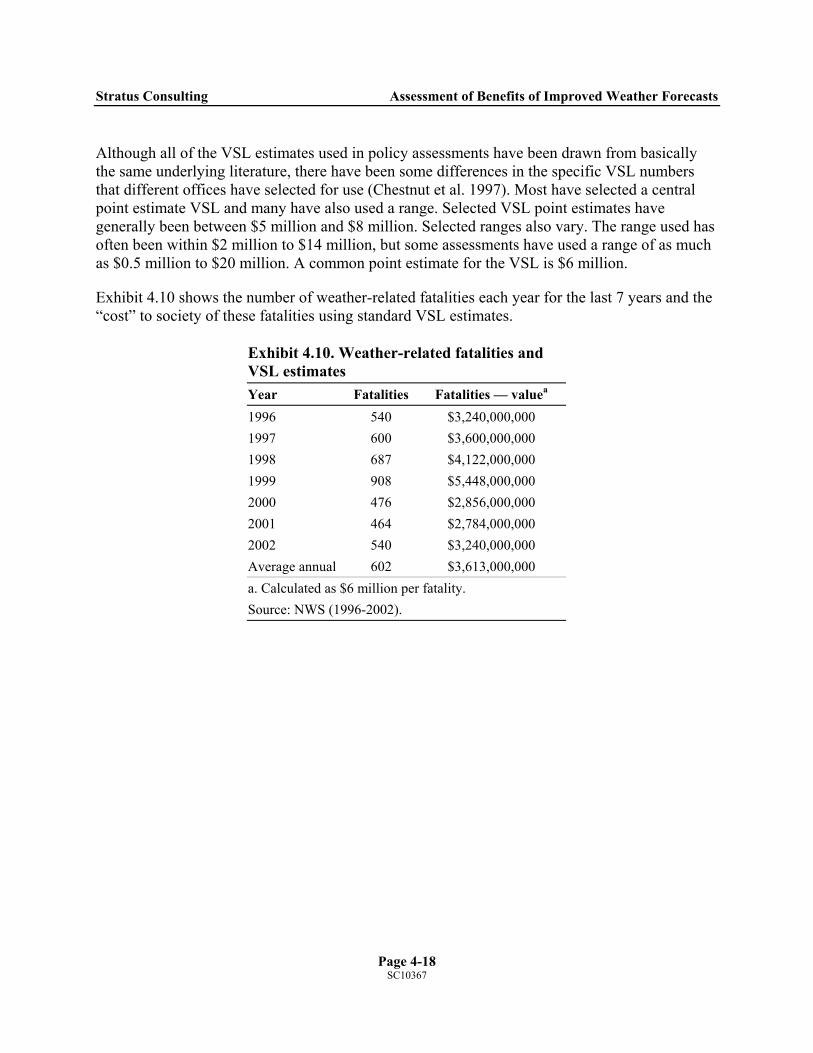
Stratus Consulting Assessment of Benefits of Improved Weather Forecasts
Page 4-18 SC10367
Although all of the VSL estimates used in policy assessments have been drawn from basically the same underlying literature, there have been some differences in the specific VSL numbers that different offices have selected for use (Chestnut et al. 1997). Most have selected a central point estimate VSL and many have also used a range. Selected VSL point estimates have generally been between $5 million and $8 million. Selected ranges also vary. The range used has often been within $2 million to $14 million, but some assessments have used a range of as much as $0.5 million to $20 million. A common point estimate for the VSL is $6 million.
Exhibit 4.10 shows the number of weather-related fatalities each year for the last 7 years and the “cost” to society of these fatalities using standard VSL estimates.
Exhibit 4.10. Weather-related fatalities and VSL estimates Year Fatalities Fatalities — valuea 1996 540 $3,240,000,000 1997 600 $3,600,000,000 1998 687 $4,122,000,000 1999 908 $5,448,000,000 2000 476 $2,856,000,000 2001 464 $2,784,000,000 2002 540 $3,240,000,000 Average annual 602 $3,613,000,000 a. Calculated as $6 million per fatality. Source: NWS (1996-2002).

5. Economic Analysis The economic benefits of improved weather forecasting are potentially huge. As shown in Exhibit 4.1 in the previous chapter, the investment in a new NOAA supercomputer will affect many sectors of society, including other government agencies, private industry, and individual households. In this chapter, we report on an economic analysis of the societal benefits of a new NOAA supercomputer in three areas:
the household sector a limited number of agricultural crops weather-related fatalities.
At this time we have not included a calculation of the present benefits in the aviation or energy sectors. Noting the magnitude of the benefits suggested in these other industries, however, we feel the analysis described here represents a lower bound to total benefits. Even though these areas represent only a fraction of all the potential benefits of the new supercomputer, the present value of the benefits from each of these areas individually is in the tens of millions of dollars, even using conservative assumptions.1
Determining these benefits requires linking the use of the new supercomputer to overall improvements in weather forecasting and then linking these forecasting improvements to economic benefits. Because these linkages have never been formally quantified, Stratus Consulting facilitated an assessment with NOAA staff. According to NOAA, improvements in forecasting are a function of three factors: observation, understanding, and computing, as shown in Exhibit 5.1. NOAA estimates that each of these factors make roughly equal contributions.
NCEP, GFDL, and NHRA make these contributions to computing, which NOAA estimates at 60%, 20%, and 20%, respectively.2
The final step is to estimate the new supercomputer’s contribution to improvements in weather forecasting generated by NOAA researchers over the expected likely 5-year life of the new computer. NOAA estimates this contribution at 75%. In other words, without the proposed
1. Throughout this work we attempted to make “conservative” assumptions at any point where a subjective judgement was necessary. By conservative we mean erring on the side of understating the final benefit estimates instead of potentially overstating the benefits.
2. As discussed in chapter 2, the proposed new supercomputer will replace several GNU/Linux-based clusters within FSL’s computing facilities and will be known as the NOAA HPCS for Research Applications (NHRA). We thus refer to this as NHRA here rather than as FSL.
SC10367

Stratus Consulting Economic Analysis
Observation
Understanding
Computing
Improvements inWeather Forecasts
NCEPSupercomputing
NHRA
GFDLSupercomputing
Exhibit 5.1. Contributions to improving weather forecasts.
NHRA supercomputing capabilities, advances in weather forecasting research and development at FSL and other NOAA laboratories to which this computer contribute are expected to be only about one-fourth of what they would be with the increased computing capabilities.
Combining these contributions results in an overall contribution from the new NOAA supercomputer of:
33% × 20% × 75% = 5%
Page 5-2 SC10367

Stratus Consulting Economic Analysis
Page 5-3 SC10367
This 5% contribution will be applied to the economic benefits in the household, agriculture, and weather-related fatalities segments that are expected to result from improved environmental modeling. The details of the analysis for each area follow.
5.1 Household Sector Benefits for Improved Weather Forecasts
In contrast to the often anecdotal research available in other sectors, Stratus Consulting recently completed an extensive economic analysis for NOAA that links specific improvements in weather forecast accuracy to social benefits: Economic Value of Current and Improved Weather Forecasts in the U.S. Household Sector (Stratus Consulting, 2002).
As described in Section 4.1.3, the Stratus Consulting household study determined that the average household would be willing to pay about $16 (2001$) per year to have forecast quality improved to the maximum technically feasible level. The aggregate national benefit is $1.73 billion per year. The forecast improvements were in the categories of 1-day forecasts, multiday forecasts, geographic details, and update frequency, and they focused on temperature and precipitation. Study participants assumed that current forecasts were 80% accurate and that the maximum technically feasible level is 95%. Since the study was completed, forecasts have continued to improve and are currently estimated to be 85% accurate.3 The total potential household benefit of improving forecasts to 95% accuracy is therefore reduced by one-third to $1.15 billion (2001$) for the purposes of this analysis.
The percent improvement in overall weather forecasting over the analysis period is highly uncertain because of the complexity of the problem and the multiple parties involved in R&D and technology transfer. For the purposes of this study, we used a conservative range of percent improvements in overall weather forecasting over current accuracy so as not to overestimate the benefits of the new NOAA supercomputer. The range chosen is from 2.5% to 10.0%, with a base case value of 4.25%. This range represents the total (not annual) improvement in weather forecast accuracy that accrues over a 5-year period from all sources of R&D (i.e., improvements in observation, understanding, and computing). Once this total benefit accrues, we assume that it remains an annual benefit to society in perpetuity.
We used the financial assumptions shown in Exhibit 5.2 to compute the present value of benefits to the household sector.
3. This conservative assumption is made to ensure that we account for improvements in weather forecasting that may have occurred since the study was conducted in 2001.
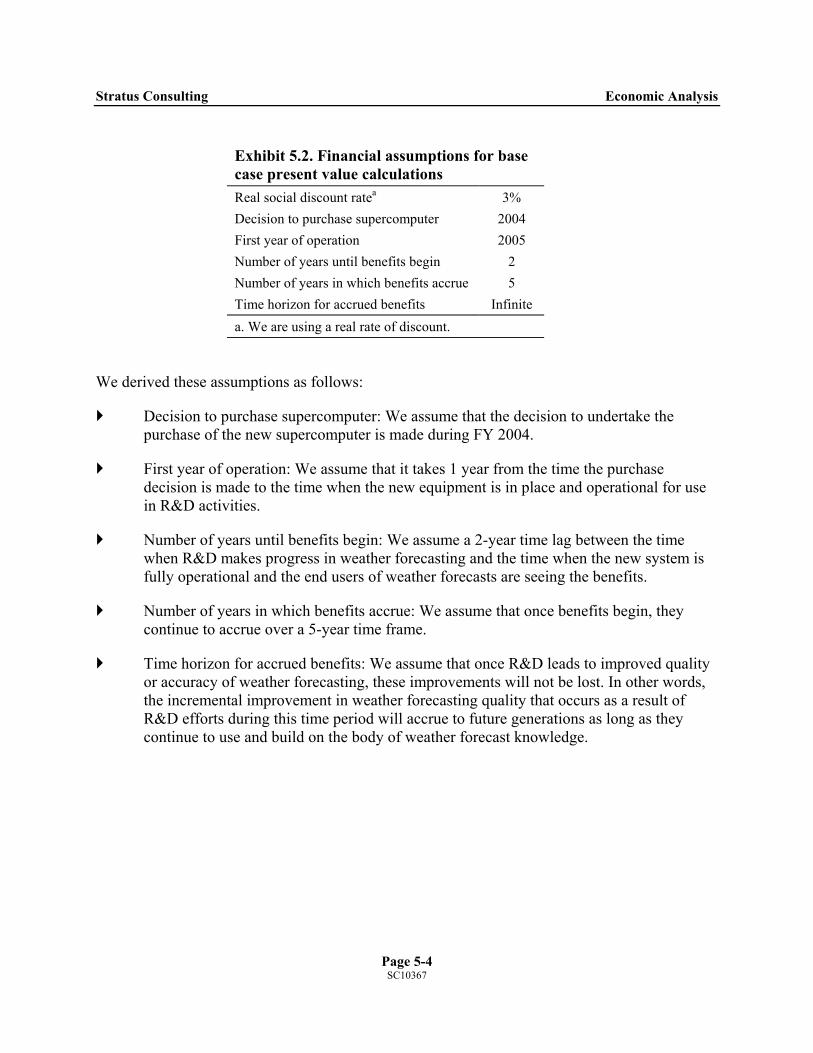
Stratus Consulting Economic Analysis
Exhibit 5.2. Financial assumptions for base case present value calculations Real social discount ratea 3% Decision to purchase supercomputer 2004 First year of operation 2005 Number of years until benefits begin 2 Number of years in which benefits accrue 5 Time horizon for accrued benefits Infinite a. We are using a real rate of discount.
We derived these assumptions as follows:
Decision to purchase supercomputer: We assume that the decision to undertake the purchase of the new supercomputer is made during FY 2004.
First year of operation: We assume that it takes 1 year from the time the purchase decision is made to the time when the new equipment is in place and operational for use in R&D activities.
Number of years until benefits begin: We assume a 2-year time lag between the time when R&D makes progress in weather forecasting and the time when the new system is fully operational and the end users of weather forecasts are seeing the benefits.
Number of years in which benefits accrue: We assume that once benefits begin, they continue to accrue over a 5-year time frame.
Time horizon for accrued benefits: We assume that once R&D leads to improved quality or accuracy of weather forecasting, these improvements will not be lost. In other words, the incremental improvement in weather forecasting quality that occurs as a result of R&D efforts during this time period will accrue to future generations as long as they continue to use and build on the body of weather forecast knowledge.
Page 5-4 SC10367
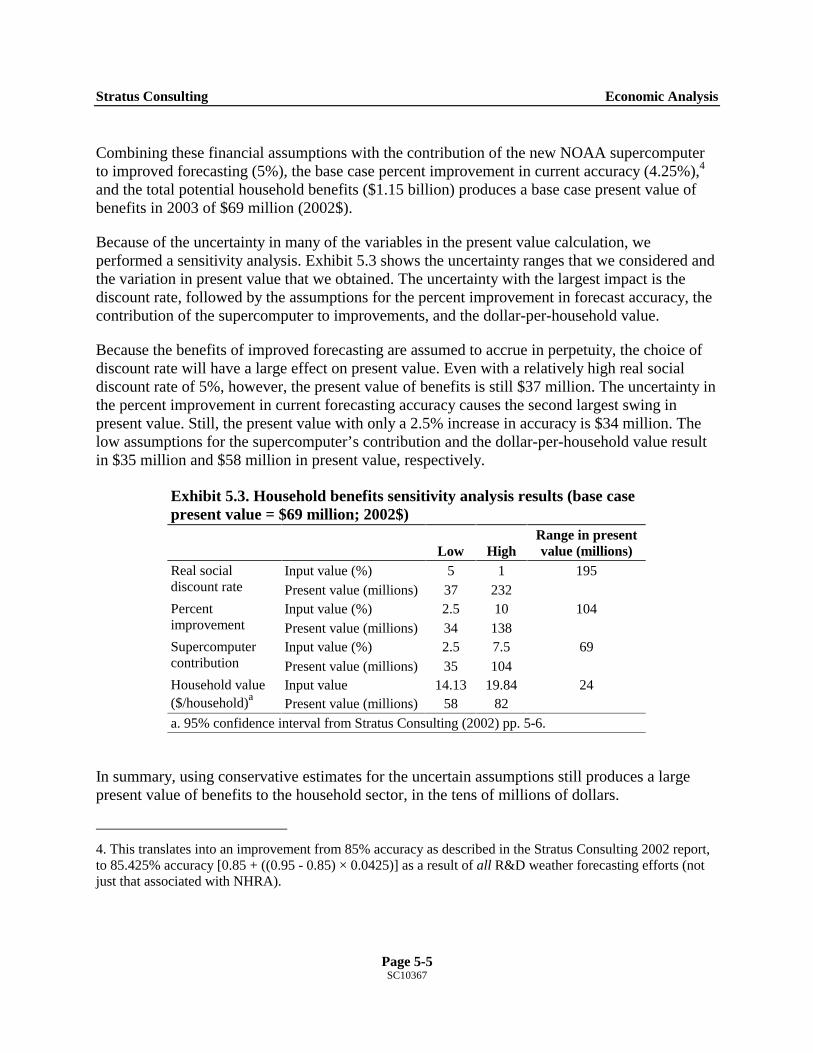
Stratus Consulting Economic Analysis
Page 5-5 SC10367
Combining these financial assumptions with the contribution of the new NOAA supercomputer to improved forecasting (5%), the base case percent improvement in current accuracy (4.25%),4 and the total potential household benefits ($1.15 billion) produces a base case present value of benefits in 2003 of $69 million (2002$).
Because of the uncertainty in many of the variables in the present value calculation, we performed a sensitivity analysis. Exhibit 5.3 shows the uncertainty ranges that we considered and the variation in present value that we obtained. The uncertainty with the largest impact is the discount rate, followed by the assumptions for the percent improvement in forecast accuracy, the contribution of the supercomputer to improvements, and the dollar-per-household value.
Because the benefits of improved forecasting are assumed to accrue in perpetuity, the choice of discount rate will have a large effect on present value. Even with a relatively high real social discount rate of 5%, however, the present value of benefits is still $37 million. The uncertainty in the percent improvement in current forecasting accuracy causes the second largest swing in present value. Still, the present value with only a 2.5% increase in accuracy is $34 million. The low assumptions for the supercomputer’s contribution and the dollar-per-household value result in $35 million and $58 million in present value, respectively.
Exhibit 5.3. Household benefits sensitivity analysis results (base case present value = $69 million; 2002$)
Low High Range in present value (millions)
Input value (%) 5 1 Real social discount rate Present value (millions) 37 232
195
Input value (%) 2.5 10 Percent improvement Present value (millions) 34 138
104
Input value (%) 2.5 7.5 Supercomputer contribution Present value (millions) 35 104
69
Input value 14.13 19.84 Household value ($/household)a Present value (millions) 58 82
24
a. 95% confidence interval from Stratus Consulting (2002) pp. 5-6.
In summary, using conservative estimates for the uncertain assumptions still produces a large present value of benefits to the household sector, in the tens of millions of dollars.
4. This translates into an improvement from 85% accuracy as described in the Stratus Consulting 2002 report, to 85.425% accuracy [0.85 + ((0.95 - 0.85) × 0.0425)] as a result of all R&D weather forecasting efforts (not just that associated with NHRA).
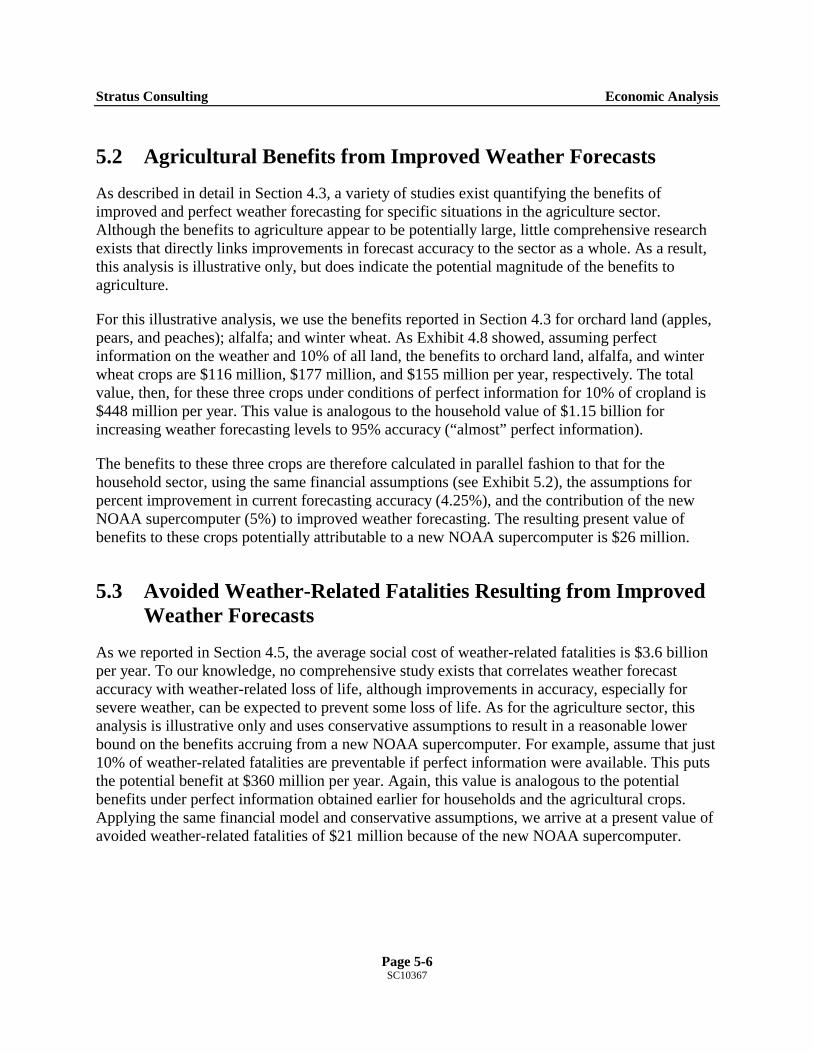
Stratus Consulting Economic Analysis
Page 5-6 SC10367
5.2 Agricultural Benefits from Improved Weather Forecasts
As described in detail in Section 4.3, a variety of studies exist quantifying the benefits of improved and perfect weather forecasting for specific situations in the agriculture sector. Although the benefits to agriculture appear to be potentially large, little comprehensive research exists that directly links improvements in forecast accuracy to the sector as a whole. As a result, this analysis is illustrative only, but does indicate the potential magnitude of the benefits to agriculture.
For this illustrative analysis, we use the benefits reported in Section 4.3 for orchard land (apples, pears, and peaches); alfalfa; and winter wheat. As Exhibit 4.8 showed, assuming perfect information on the weather and 10% of all land, the benefits to orchard land, alfalfa, and winter wheat crops are $116 million, $177 million, and $155 million per year, respectively. The total value, then, for these three crops under conditions of perfect information for 10% of cropland is $448 million per year. This value is analogous to the household value of $1.15 billion for increasing weather forecasting levels to 95% accuracy (“almost” perfect information).
The benefits to these three crops are therefore calculated in parallel fashion to that for the household sector, using the same financial assumptions (see Exhibit 5.2), the assumptions for percent improvement in current forecasting accuracy (4.25%), and the contribution of the new NOAA supercomputer (5%) to improved weather forecasting. The resulting present value of benefits to these crops potentially attributable to a new NOAA supercomputer is $26 million.
5.3 Avoided Weather-Related Fatalities Resulting from Improved Weather Forecasts
As we reported in Section 4.5, the average social cost of weather-related fatalities is $3.6 billion per year. To our knowledge, no comprehensive study exists that correlates weather forecast accuracy with weather-related loss of life, although improvements in accuracy, especially for severe weather, can be expected to prevent some loss of life. As for the agriculture sector, this analysis is illustrative only and uses conservative assumptions to result in a reasonable lower bound on the benefits accruing from a new NOAA supercomputer. For example, assume that just 10% of weather-related fatalities are preventable if perfect information were available. This puts the potential benefit at $360 million per year. Again, this value is analogous to the potential benefits under perfect information obtained earlier for households and the agricultural crops. Applying the same financial model and conservative assumptions, we arrive at a present value of avoided weather-related fatalities of $21 million because of the new NOAA supercomputer.
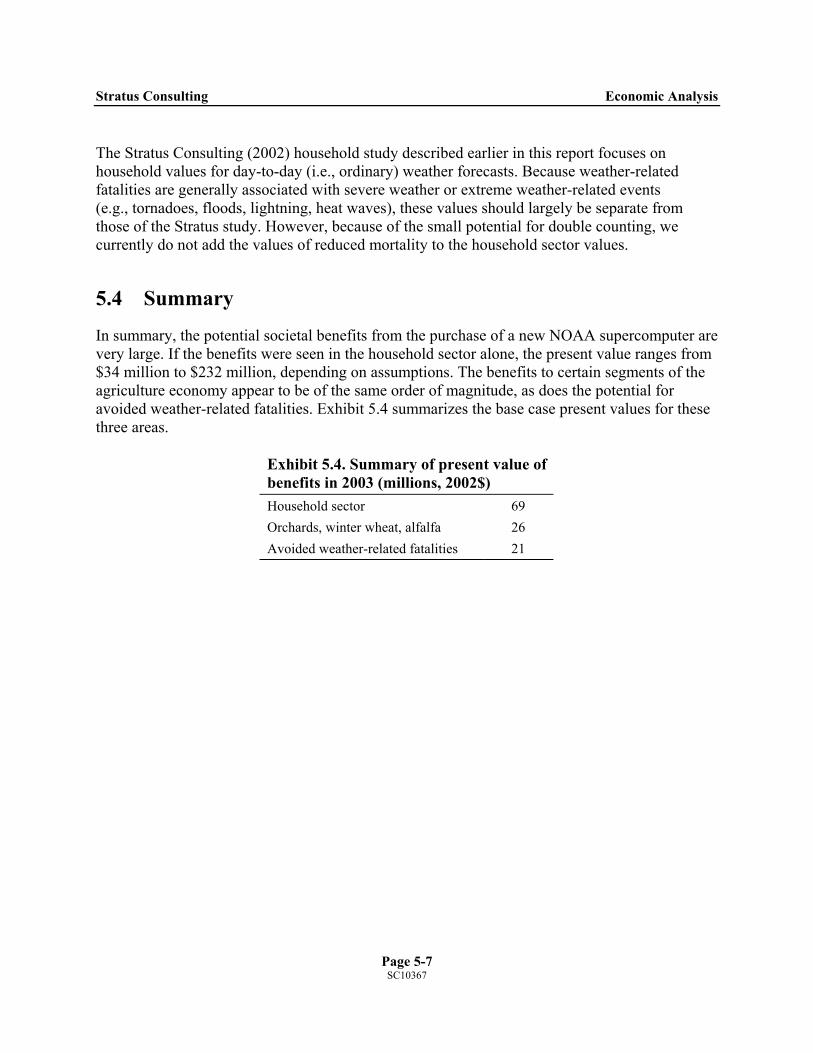
Stratus Consulting Economic Analysis
Page 5-7 SC10367
The Stratus Consulting (2002) household study described earlier in this report focuses on household values for day-to-day (i.e., ordinary) weather forecasts. Because weather-related fatalities are generally associated with severe weather or extreme weather-related events (e.g., tornadoes, floods, lightning, heat waves), these values should largely be separate from those of the Stratus study. However, because of the small potential for double counting, we currently do not add the values of reduced mortality to the household sector values.
5.4 Summary In summary, the potential societal benefits from the purchase of a new NOAA supercomputer are very large. If the benefits were seen in the household sector alone, the present value ranges from $34 million to $232 million, depending on assumptions. The benefits to certain segments of the agriculture economy appear to be of the same order of magnitude, as does the potential for avoided weather-related fatalities. Exhibit 5.4 summarizes the base case present values for these three areas.
Exhibit 5.4. Summary of present value of benefits in 2003 (millions, 2002$) Household sector 69 Orchards, winter wheat, alfalfa 26 Avoided weather-related fatalities 21
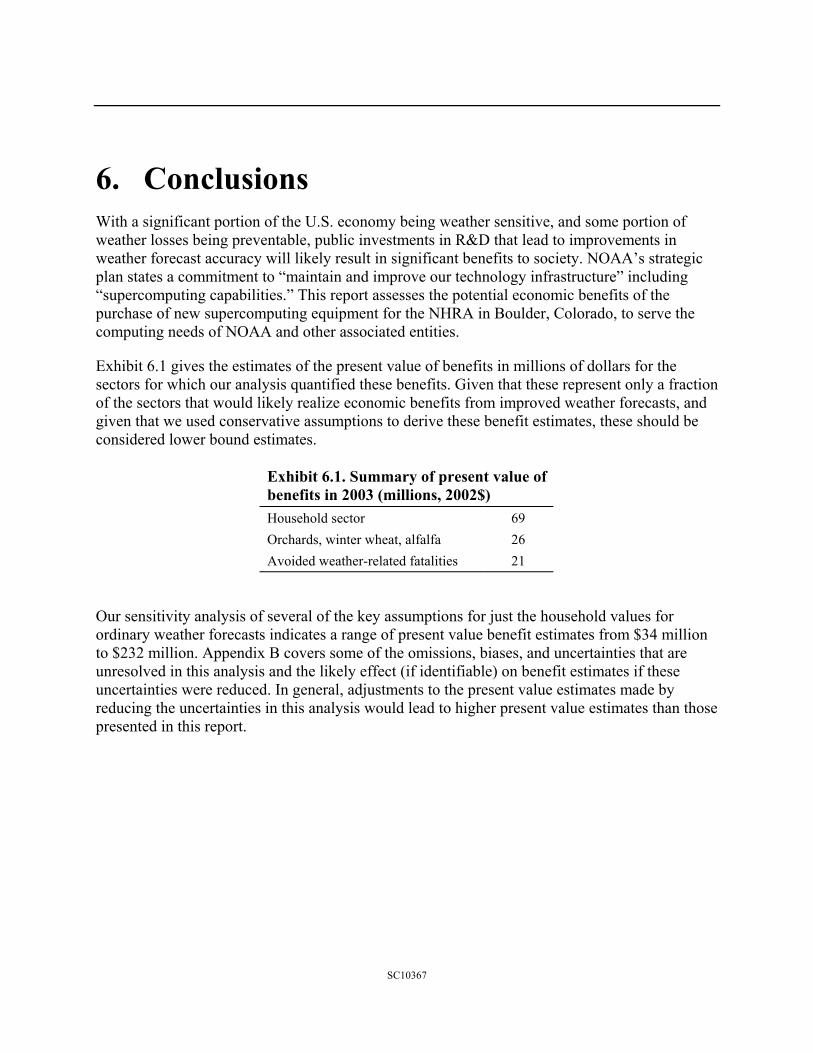
6. Conclusions With a significant portion of the U.S. economy being weather sensitive, and some portion of weather losses being preventable, public investments in R&D that lead to improvements in weather forecast accuracy will likely result in significant benefits to society. NOAA’s strategic plan states a commitment to “maintain and improve our technology infrastructure” including “supercomputing capabilities.” This report assesses the potential economic benefits of the purchase of new supercomputing equipment for the NHRA in Boulder, Colorado, to serve the computing needs of NOAA and other associated entities.
Exhibit 6.1 gives the estimates of the present value of benefits in millions of dollars for the sectors for which our analysis quantified these benefits. Given that these represent only a fraction of the sectors that would likely realize economic benefits from improved weather forecasts, and given that we used conservative assumptions to derive these benefit estimates, these should be considered lower bound estimates.
Exhibit 6.1. Summary of present value of benefits in 2003 (millions, 2002$) Household sector 69 Orchards, winter wheat, alfalfa 26 Avoided weather-related fatalities 21
Our sensitivity analysis of several of the key assumptions for just the household values for ordinary weather forecasts indicates a range of present value benefit estimates from $34 million to $232 million. Appendix B covers some of the omissions, biases, and uncertainties that are unresolved in this analysis and the likely effect (if identifiable) on benefit estimates if these uncertainties were reduced. In general, adjustments to the present value estimates made by reducing the uncertainties in this analysis would lead to higher present value estimates than those presented in this report.
SC10367
References Abawi, G.Y., R.J. Smith, and D.K. Brady. 1995. “Assessment of the Value of Long Range
Weather Forecasts in Wheat Harvest Management.” Journal of Agricultural Engineering Resources 62:39-48.
Adams, R.M., K.J. Bryant, B.A. McCarl, D.M. Legler, J.J. O’Brien, A.R. Solow, and R. Weiher. 1995. “Value of Improved Long-Range Weather Information.” Contemporary Economic Policy, Western Economic Association International XIII:10-19.
Allan, S.S., S.G. Gaddy, and J.E. Evans. 2001. Delay Causality and Reduction at the New York City Airports Using Terminal Weather Information Systems. Lexington, MA: MIT Lincoln Laboratory.
AMS Newsletter. 2000. “Experts Underscore Weather in Aircraft Accidents at Capitol Hill Briefing.” American Meteorological Society Newsletter 21(3):April.
Anaman, K.A. and S.C. Lellyett. 1996. “Contingent Valuation Study of the Public Weather Service in the Sydney Metropolitan Area.” Economic Papers 15(3):64-77.
Anaman, K.A., D.J. Thampapillai, A. Henderson-Sellers, P.F. Noar, and P.J. Sullivan. 1995. “Methods for Assessing the Benefits of Meteorological Services in Australia.” Meteorological Applications 2:17-19.
Anaman, K.A., S.C. Lellyett, L. Drake, R.J. Leigh, A. Henderson-Sellers, P.F. Noar, P.J. Sullivan, and D.J. Thampapillai. 1997. Economics and Social Benefits of Meteorological Services Provided by the Australian Bureau of Meteorology: Final Project Report. Sydney: MacQuarie University, Bureau of Meteorology.
Anaman, K.A., S.C. Lellyett, L. Drake, R.J. Leigh, A. Henderson-Sellers, P.F. Noar, P.J. Sullivan, and D.J. Thampapillai. 1998. “Benefits of Meteorological Services: Evidence from Recent Research in Australia.” Meteorological Applications 5(2):103-115.
Baquet, A.E., A.N. Halter, and F.S. Conklin. 1976. “The Value of Frost Forecasting: A Bayesian Appraisal.” American Journal of Agricultural Economics 58:511-520.
Bowman, P.J., G.M. McKeon, and D.H. White. 1995. “An Evaluation of the Impact of Long-Range Climate Forecasting on the Physical and Financial Performance of Wool-Producing Enterprises in Victoria.” Australian Journal of Agricultural Research 46:687-702.
SC10367

Stratus Consulting References
Cavlovic, A., J. Forkes, and K. Rollins. N.d. (a). Economic Value of Environment Canada’s ATAD Service for Business Users in the Greater Toronto Area. Unpublished report submitted to The Policy Program and International Affairs Directorate, Atmospheric Environment Service, Environment Canada.
Cavlovic, A., J. Forkes, and K. Rollins. N.d. (b). Economic Value of Environment Canada’s Weatheradio Service for Users in Maritime Communities of Atlantic Canada. Unpublished report submitted to The Policy Program and International Affairs Directorate, Atmospheric Environment Service, Environment Canada.
Census of Agriculture. 1997. Available at http://govinfo.kerr.orst.edu/php/agri/area_to_county.php. Accessed November 25, 2003.
Changnon, S.A., J.M. Changnon, and D. Changnon. 1995. “Uses and Applications of Climate Forecasts for Power Utilities.” Bulletin of the American Meteorological Society 76(5):711-720.
Chapman, R.E. 1992. “Benefit-Cost Analysis for the Modernization and Associated Restructuring of the National Weather Service.” NISTIR 4867. Report to the U.S. Department of Commerce, National Institute of Standards and Technology. Washington, D.C.
Chen, C.-C., B. McCarl, and H. Hill. 2002. “Agricultural Value of ENSO Information under Alternative Phase Definition.” Climatic Change 54:305-325.
Chestnut, L.G., D. Mills, and A. Alberini. 1997. “Monetary Valuation of Human Mortality Risks in Cost-Benefit Analyses of Environmental Programs: Background Paper and Bibliography.” Prepared for Office of Policy Planning and Evaluation. U.S. Environmental Protection Agency. Washington, D.C.
Cogan, J. 1998. “What is Weather Risk?” Originally published by PMA Online Magazine, May, 1998. Downloaded October 28, 2003, from http://www.retailenergy.com/articles/weather.htm.
Colman, B. 1997. “What is a Good Weather Forecast? in the Eyes of a Forecaster.” Presented at the Workshop on the Social and Economic Impacts of Weather, April 2-4, Boulder, CO.
Cornes, R. and T. Sandler. 1996. The Theory of Externalities, Public Goods and Club Goods. 2nd edition. New York: Cambridge University Press.
Page R-2 SC10367
Stratus Consulting References
Cropper, M.L. and A.M. Freeman III. 1991. “Environmental Health Effects.” Measuring the Demand for Environmental Quality. J.B. Braden and C.D. Kolstad (eds.). New York: North-Holland.
Curtis, J.C. and A.H. Murphy. 1985. “Public Interpretation and Understanding of Forecast Terminology: Some Results of a Newspaper Survey in Seattle, Washington.” Bulletin of the American Meteorological Society 66:810-819.
Davis, D.R. and S. Nnaji. 1982. “The Information Needed to Evaluate the Worth of Uncertain Information, Predictions and Forecasts.” Journal of Applied Meteorology 21:461-470.
Dempsey, C.L., K.W. Howard, R.A. Maddox, and D.H. Phillips. 1998. “Developing Advanced Weather Technologies for the Power Industry.” Bulletin of the American Meteorological Society 79(6):1019-1035.
Dischel, B. 2001. “Seasonal Weather Forecasts and Derivative Valuation.” Available at http://www.financewise.com/public/edit/energy/weather00/wthr00-forecast.htm. Accessed December 1, 2003.
Dukart, J.R. 2003. “Powerless.” Transmission and Distribution World Q4, 2003.
Dutton, J.P. 2001. Professor of Meteorology and Former Dean of the College of Earth and Mineral Sciences, Pennsylvania State University, 2001, Weather and Climate Sensitive GDP Components 1999. Working paper.
Ehrendorfer, M. and A.H. Murphy. 1992. “On the Relationship between the Quality and Value of Weather and Climate Forecasting Systems.” Idöjárás 96:187-206.
Evans, J.E. 1995. “Measuring the Economic Value of Aviation Meteorological Products.” Paper presented at the 14th Conference on Weather Analysis and Forecasting. January 15-20, 1995, Dallas, TX.
Evans, J.E., T.J. Dacey, D.A. Rhoda, R.E. Cole, F.W. Wilson, and E.R. Williams. 1999. “Weather Sensing and Data Fusion to Improve Safety and Reduce Delays at Major West Coast Airports.” Lexington, MA: MIT Lincoln Laboratory.
Fan, J.Y. and J.D. McDonald. 1994. “A Real-Time Implementation of Short-Term Load Forecasting for Distribution Power Systems.” IEEE Transactions on Power Systems 9(2):988-994.
Fisher, A., L.G. Chestnut, and D.M. Violette. 1989. “The Value of Reducing Risks of Death: A Note on New Evidence.” Journal of Policy Analysis and Management 8(1):88-100.
Page R-3 SC10367

Stratus Consulting References
Fox, G., J. Turner, and T. Gillespie. 1999a. “The Value of Precipitation Forecast Information in Winter Wheat Production.” Agricultural and Forest Meteorology 95:99-111.
Fox, G., J. Turner, and T. Gillespie. 1999b. “Estimating the Value of Precipitation Forecast Information in Alfalfa Dry Hay Production in Ontario.” Journal of Production Agriculture 12:551-558.
Freebairn, J.W. and J.W. Zillman. N.d. (a). Economic Benefits of Meteorological Services. Unpublished paper. Parkville, VIC, Australia: The University of Melbourne Department of Economics.
Freebairn, J.W. and J.W. Zillman. N.d. (b). Funding Meteorological Services. Unpublished paper. Parkville, VIC, Australia: The University of Melbourne Department of Economics.
Hackney, J. 2002. “Increasing the Value of Weather Information in the Operation of the Electric Power System – Workshop Report.” November 6-7, Boulder, CO. Sponsored by the United States Weather Research Program (USWRP) Availble online at http://www.esig.ucar.edu/electricity/workshop/. Accessed December 1, 2003.
Hammer, G.L., D.P. Holzworth, and R. Stone. 1996. “The Value of Skill in Seasonal Climate Forecasting to Wheat Crop Management in a Region with High Climatic Variability.” Australian Journal of Agricultural Research 47:717-737.
Hill, H.S.J., J.W. Mjelde, W. Rosenthal, and P.J. Lamb. 1999. “The Potential Impacts of the Use of Southern Oscillation Information on the Texas Aggregate Sorghum Production.” Journal of Climate 12:519-530.
Hill, H.S.J., J. Park, J.W. Mjelde, W. Rosenthal, H.A. Love, and S.W. Fuller. 2000. “Comparing the Value of Southern Oscillation Index-Based Climate Forecast Methods for Canadian and US Wheat Producers.” Agricultural and Forest Meteorology 100:261-272.
Howard, R.A. 1966. “Decision Analysis: Applied Decision Theory.” In Proceedings of the Fourth International Conference on Operational Research: Publications in Operational Research, No. 15. Hertz, D.B. and J. Melese (eds.). Boston, MA: Operations Research Society of America.
Howard, R.A. 1970. “Risk Preference.” The Principles and Applications of Decision Analysis. R.A. Howard and J.E. Matheson (eds.). Menlo Park, CA: Decision Analysis Group, Stanford Research Institute. pp. 629-663.
Page R-4 SC10367
Stratus Consulting References
Jochec, K.G., J.W. Mjelde, A.C. Lee, and J.R. Conner. 2001. “Use of Seasonal Climate Forecasts in Rangeland-Based Livestock Operations in West Texas.” Journal of Applied Meteorology 40:1629-1639.
Johnson, S.R. and M.T. Holt. 1997. “The Value of Weather Information.” Chapter 3 in Economic Value of Weather and Climate Forecasts. R.W. Katz and A.H. Murphy (eds.). Cambridge, UK: Cambridge University Press.
Katz, R.W., A.H. Murphy, and R.L. Winkler. 1982. “Assessing the Value of Frost Forecasts to Orchardists: A Dynamic Decision-Analytic Problem.” Journal of Applied Meteorology 21:518-531.
Keener, Jr. R.N. 1997. “The Estimated Impact of Weather on Daily Electric Utility Operations.” Paper presented at the Workshop on the Social and Economic Impacts of Weather, April 2-4, Boulder, CO. Available at http://sciencepolicy.colorado.edu/socasp/weather1/keener.html. Accessed November 16, 2003.
Kenkel, D. 2001. “Using Estimates of the Value of a Statistical Life in Evaluating Regulatory Effects.” In Valuing the Health Benefits of Food Safety: A Proceedings. F. Kuchler (ed.). ERS MP No. MP1570. Electronic Report from the Economic Research Service. United States Department of Agriculture. Available online at http://www.ers.usda.gov/publications/mp1570/ Accessed December 2, 2003.
Leigh, R.J. 1995. “Economic Benefits of Terminal Aerodrome Forecasts (TAFs) for Sydney Airport, Australia.” Meteorological Applications 2:239-247.
Luo, H., J.R. Skees, and M.A. Marchant. 1994. “Weather Information and the Potential for Inter-Temporal Adverse Selection in Crop Insurance.” Review of Agricultural Economics 16:441-451.
Matheson, J.E. 1970. “Overview of R&D Decision Analysis.” The Principles and Applications of Decision Analysis. R.A. Howard and J.E. Matheson (eds.). Menlo Park, CA: Decision Analysis Group, Stanford Research Institute.
Menke, M.M. 1981. “Evaluating Basic Research Strategies.” Long Range Planning 14(3):44-57. Cambridge, MA: Pergamon Press, Ltd.
Messina, C.D., J.W. Hansen, and A.J. Hall. 1999. “Land Allocation Conditioned on ENSO Phases in the Pampas of Argentina.” Agricultural Systems 60:197-212.
Miller, T.R. 1989. “Willingness to Pay Comes of Age: Will the System Survive?” Northwestern University Law Review 83:876-907.
Page R-5 SC10367
Stratus Consulting References
Mjelde, J.W. and J.B. Penson. 2000. “Dynamic Aspects of the Impact of the Use of Perfect Climate Forecasts in the Corn Belt Region.” Journal of Applied Meteorology 39:67-79.
Mjelde, J.W., T.N. Thompson, and C.J. Nixon. 1996. “Government Institutional Effects on the Value of Seasonal Climate Forecasts.” American Journal of Agricultural Economics 78:175-188.
Mjelde, J.W., T.N. Thompson, F.M. Hons, J.T. Cothren, and C.G. Coffman. 1997. “Using Southern Oscillation Information for Determining Corn and Sorghum Profit-Maximizing Input Levels in East-Central Texas.” Journal of Production Agriculture 10:168-175.
MSI Services Incorporated. 1981. “Public Requirements for Weather Information and Attitudes Concerning Weather Service.” Prepared for the NWS.
Murnane, R.J., M. Crowe, A. Eustis, S. Howard, J. Koepsell, R. Leffler, and R. Livezey. 2002. “The Weather Risk Management Industry’s Climate Forecast and Data Needs: A Workshop Report.” Bulletin of the American Meteorological Society 83(8):1193-1198.
Murphy, A.H. 1994. Socio-Economic Value of Climate Forecasts. Report to Economics Group, Office of the Chief Scientist, NOAA. Washington, DC.
Murphy, A.H. and B.G. Brown. 1983. “Forecast Terminology: Composition and Interpretation of Public Weather Forecasts.” Bulletin of the American Meteorological Society 64:13-22.
Murphy, A.H., S. Lichtenstein, B. Fischhoff, and R.L. Winkler. 1980. “Misinterpretations of Precipitation Probability Forecasts.” Bulletin of the American Meteorological Society 61:695-701.
Nathan, R.V. 2001. “Risk Management — Walking the Talk on Climate Change.” Platts Global Energy Business Nov/Dec.
NASA. 2003. “Aviation Weather Information.” Available at http://awin.larc.nasa.gov/overview.htm. Accessed October 31, 2003.
NOAA. N.d. “New Priorities for the 21st Century: NOAA’s Strategic Vision.” Available at http://www.ppi.noaa.gov/pdfs/NOAAStrategicHIRES.pdf. Accessed November 16, 2003.
NOAA. 2002. Geostationary Operational Environmental Satellite System (GOES) GOES-R Sounder and Imager Cost/Benefit Analysis (CBA). Prepared for the Department of Commerce by NOAA, National Environmental Satellite, Data, and Information Service (NESDIS), Office of Systems Development. November 15. Silver Spring, MD: NOAA/NESDIS.
Page R-6 SC10367

Stratus Consulting References
NWS. 1996-2002. “Summary of Natural Hazard Statistics for 1996 through 2002 in the United States.” Compiled by the NWS Office of Climate, Water and Weather Services and the National Climatic Data Center. Available at http://www.nws.noaa.gov/om/severe_weather. Accessed November 25, 2003.
Paull, G. 2001. “Integrated Icing Diagnostic Algorithm (IIDA) Safety Benefits Analysis Accident Case Studies.” Prepared for the FAA by MCR Federal, Inc., Bedford, MA.
Pope, C.A. 1992. Viewer Perceptions of Severe Weather and Broadcast Meteorologists, Vol. II. Masters thesis. Starkville, MS: Mississippi State University.
Prototype Regional Observing and Forecasting Service. 1979. “Report of a Study to Estimate Economic and Convenience Benefits of Improved Local Weather Forecasts.” NOAA Technical Memorandum ERL PROFS-1. Boulder, CO: NOAA Environmental Research Laboratory.
Raiffa, H. and R. Schlaifer. 1961. Applied Statistical Decision Theory. Cambridge, MA: Harvard University Press.
Rhoda, D.A. and M.E. Weber. 1996. “Assessment of Delay Aversion Benefits of the Airport Surveillance Radar (ASR) Weather Systems Processor (WSP) — Project Report.” Lexington, MA: MIT Lincoln Laboratory.
Sinnott, J.H., W.K. MacReynolds, F.R. Morser, and T.P. Berry. 2002. “Understanding the Impact of the ATM System on Airline Economics.” In Handbook of Airline Economics. 2nd edition. New York: McGraw Hill. pp. 377-400.
Solow, A.R., R.F. Adams, K.J. Bryant, D.M. Legler, J.J. O’Brien, B.A. McCarl, W. Ayda, and R. Weiher. 1998. “The Value of Improved ENSO Prediction to U.S. Agriculture.” Climatic Change 39:47-60.
Spetzler, C.S. and C.S. von Holstein. 1972. “Probability Encoding in Decision Analysis.” In Proceedings of the ORSA-TIMS-AIEE National Meeting, Atlantic City, NJ. November. Reprinted in The Principles and Applications of Decision Analysis. 1984. R.A. Howard and J.E. Matheson (eds.). Menlo Park, CA: Strategic Decisions Group, Stanford Research Institute. 1984, pp. 603-625.
Stratus Consulting, Inc. 2002. “Economic Value of Current and Improved Weather Forecasts in the U.S. Household Sector.” Prepared for the NOAA Office of Policy and Strategic Planning, with the financial support of the NOAA National Environmental Satellite Data and Information Service.
Page R-7 SC10367
Stratus Consulting References
Page R-8 SC10367
Sunderlin, J. and G. Paull. 2001. “FAA Terminal Convective Weather Forecast Benefits Analysis.” Prepared for the FAA by MCR Federal, Inc. Bedford, MA.
Tversky, A. and D. Kahneman. 1974. “Judgments Under Uncertainty: Heuristics and Biases.” Science 185:1124-1131.
Tversky, A. and D. Kahneman. 1981. “The Framing of Decisions and the Psychology of Choice.” Science 211:453-458.
U.S. Census. 2000. Current Population Survey, Table 1. “Households by Type and Selected Characteristics: March 2000” Available at http://www.census.gov/prod/2001pubs/p20-537.pdf. Accessed March 27, 2002.
Viscusi, W.K. 1992. Fatal Tradeoffs: Public and Private Responsibilities for Risk. New York: Oxford University Press.
Viscusi, W.K. 1993. “The Value of Risks to Life and Health.” Journal of Economic Literature 31:1912-1946.
Wilks, D.S. 1997. “Forecast Value: Prescriptive Decision Studies.” Chapter 4 in Economic Value of Weather and Climate Forecasts. R.W. Katz and A.H. Murphy (eds.). Cambridge, UK: Cambridge University Press.
Wilks, D.S. and D.W. Wolfe. 1998. “Optimal Use and Economic Value of Weather Forecasts for Lettuce Irrigation in a Humid Climate.” Agricultural and Forest Meteorology 89:115-130.
Wilks, D.S., R.E. Pitt, and G.W. Fick. 1993. “Modeling Optimal Alfalfa Harvest Scheduling Using Short-Range Weather Forecasts.” Agricultural Systems 42:277-305.
Williamson, R.A., H.R. Hertzfeld, and J. Cordes. 2002. “The Socio-Economic Value of Improved Weather and Climate Information.” Washington, DC: Space Policy Institute, George Washington University.
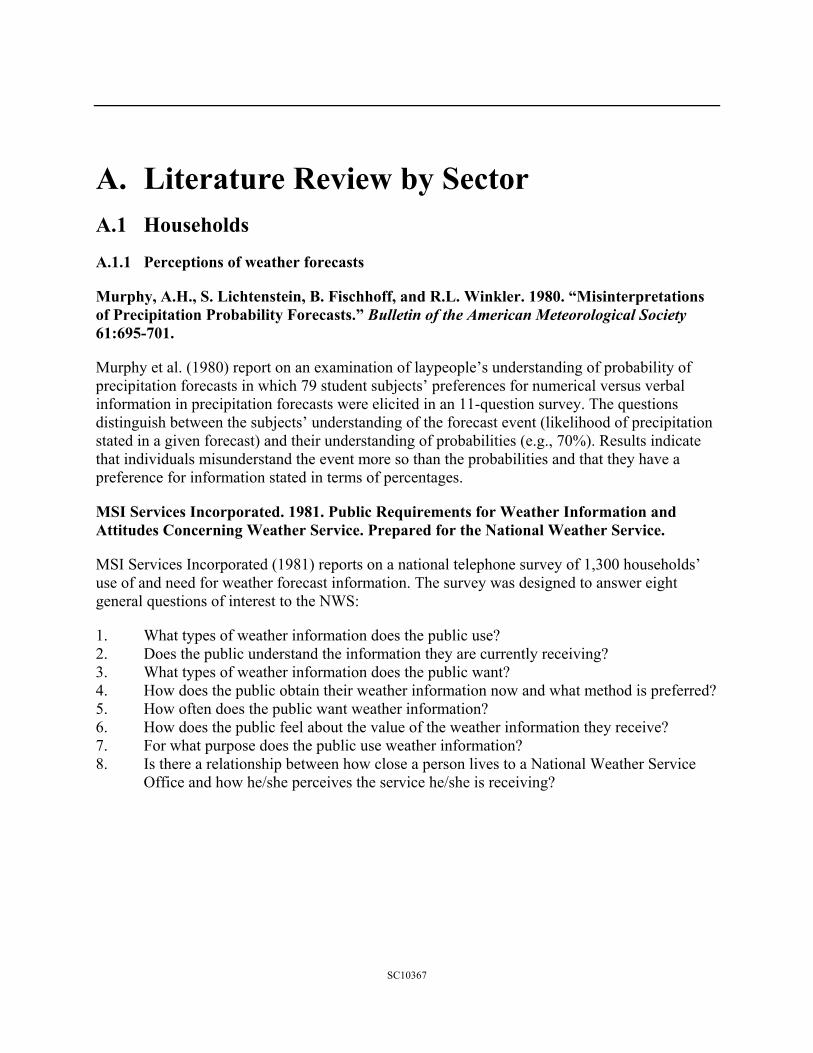
A. Literature Review by Sector A.1 Households
A.1.1 Perceptions of weather forecasts
Murphy, A.H., S. Lichtenstein, B. Fischhoff, and R.L. Winkler. 1980. “Misinterpretations of Precipitation Probability Forecasts.” Bulletin of the American Meteorological Society 61:695-701.
Murphy et al. (1980) report on an examination of laypeople’s understanding of probability of precipitation forecasts in which 79 student subjects’ preferences for numerical versus verbal information in precipitation forecasts were elicited in an 11-question survey. The questions distinguish between the subjects’ understanding of the forecast event (likelihood of precipitation stated in a given forecast) and their understanding of probabilities (e.g., 70%). Results indicate that individuals misunderstand the event more so than the probabilities and that they have a preference for information stated in terms of percentages.
MSI Services Incorporated. 1981. Public Requirements for Weather Information and Attitudes Concerning Weather Service. Prepared for the National Weather Service.
MSI Services Incorporated (1981) reports on a national telephone survey of 1,300 households’ use of and need for weather forecast information. The survey was designed to answer eight general questions of interest to the NWS:
1. What types of weather information does the public use? 2. Does the public understand the information they are currently receiving? 3. What types of weather information does the public want? 4. How does the public obtain their weather information now and what method is preferred? 5. How often does the public want weather information? 6. How does the public feel about the value of the weather information they receive? 7. For what purpose does the public use weather information? 8. Is there a relationship between how close a person lives to a National Weather Service
Office and how he/she perceives the service he/she is receiving?
SC10367
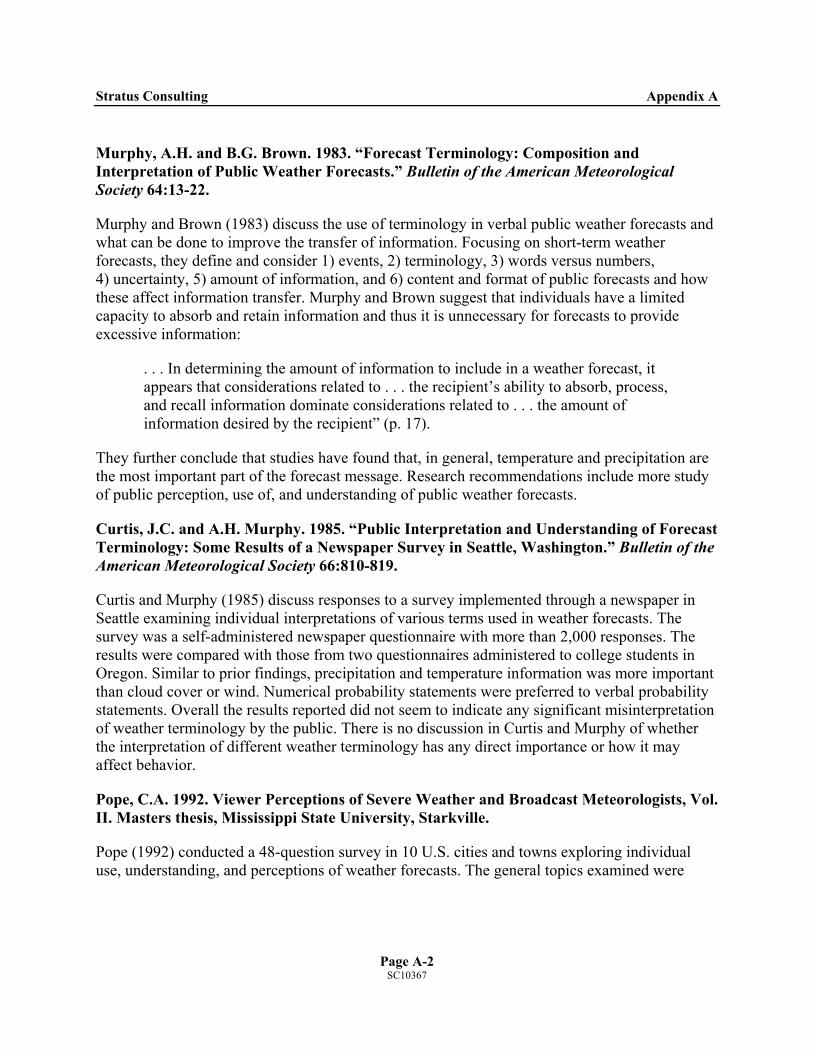
Stratus Consulting Appendix A
Murphy, A.H. and B.G. Brown. 1983. “Forecast Terminology: Composition and Interpretation of Public Weather Forecasts.” Bulletin of the American Meteorological Society 64:13-22.
Murphy and Brown (1983) discuss the use of terminology in verbal public weather forecasts and what can be done to improve the transfer of information. Focusing on short-term weather forecasts, they define and consider 1) events, 2) terminology, 3) words versus numbers, 4) uncertainty, 5) amount of information, and 6) content and format of public forecasts and how these affect information transfer. Murphy and Brown suggest that individuals have a limited capacity to absorb and retain information and thus it is unnecessary for forecasts to provide excessive information:
. . . In determining the amount of information to include in a weather forecast, it appears that considerations related to . . . the recipient’s ability to absorb, process, and recall information dominate considerations related to . . . the amount of information desired by the recipient” (p. 17).
They further conclude that studies have found that, in general, temperature and precipitation are the most important part of the forecast message. Research recommendations include more study of public perception, use of, and understanding of public weather forecasts.
Curtis, J.C. and A.H. Murphy. 1985. “Public Interpretation and Understanding of Forecast Terminology: Some Results of a Newspaper Survey in Seattle, Washington.” Bulletin of the American Meteorological Society 66:810-819.
Curtis and Murphy (1985) discuss responses to a survey implemented through a newspaper in Seattle examining individual interpretations of various terms used in weather forecasts. The survey was a self-administered newspaper questionnaire with more than 2,000 responses. The results were compared with those from two questionnaires administered to college students in Oregon. Similar to prior findings, precipitation and temperature information was more important than cloud cover or wind. Numerical probability statements were preferred to verbal probability statements. Overall the results reported did not seem to indicate any significant misinterpretation of weather terminology by the public. There is no discussion in Curtis and Murphy of whether the interpretation of different weather terminology has any direct importance or how it may affect behavior.
Pope, C.A. 1992. Viewer Perceptions of Severe Weather and Broadcast Meteorologists, Vol. II. Masters thesis, Mississippi State University, Starkville.
Pope (1992) conducted a 48-question survey in 10 U.S. cities and towns exploring individual use, understanding, and perceptions of weather forecasts. The general topics examined were
Page A-2 SC10367

Stratus Consulting Appendix A
weather information sources, quality and attributes of importance in the local forecaster, and understanding of severe weather. Location-specific differences were found that generally seemed to correlate with the locations’ weather. Respondents used TV as the primary weather forecast source (70.5%). Pope found that current, today’s, and the next day’s forecasts were the most important meteorological data displayed by local weather forecasters, over other data such as local radar, national weather, extended forecasts, satellite images, and jet stream maps. Individuals were generally indifferent between temperature being presented as a range versus a point description, but were generally in favor of percentage terminology rather than a descriptive term to indicate probability of precipitation. Similar to Murphy et al. (1980), Pope found general misinterpretation of “the event.” In this case a “50% chance of rain” was interpreted as meaning any one place in the forecasting area will have a 50% chance of rain (as opposed to the “correct” interpretation of only one specific place in the forecasting area will have a 50% chance of rain).
Colman, B. 1997. “What Is a Good Weather Forecast? in the Eyes of a Forecaster.” Presented at the Workshop on the Social and Economic Impacts of Weather, April 2-4, Boulder, CO.
Colman (1997) discusses briefly what makes a good weather forecast for the public. A small convenience sample of weather forecasters was asked the question, and a majority answered that a good forecast was determined by the public’s response and perception of the forecast rather than by skill measures of accuracy: “. . . forecasters are concerned about public perception and the action the forecast instills” (p. 2). Colman provides two examples of similar forecasts of high wind warnings for the Seattle area, one that did not receive much public reaction and one that did, but the author does not offer any reasons for this difference. Similar to the issues raised by Hooke and Pielke, Colman discusses that modernization has developed the technology for highly detailed weather forecasts but that the “technology” to best communicate forecasts to the public has not been developed. Several of the issues raised about communication and public perception are closely related to the risk perception literature (e.g., trust and credibility issues), but this literature is not specifically mentioned.
A.1.2 Studies on household values for weather forecasts
Prototype Regional Observing and Forecasting Service. 1979. Report of a Study to Estimate Economic and Convenience Benefits of Improved Local Weather Forecasts. NOAA Technical Memorandum ERL PROFS-1. NOAA Environmental Research Laboratory, Boulder, CO.
Prototype Regional Observing and Forecasting Service (1979) reports on research conducted by J.E. Haas and R.B. Rinkle of Human Ecology Research Services in Boulder, Colorado. Values for improved local weather forecasts were elicited from 95 Denver urban area households.
Page A-3 SC10367
Stratus Consulting Appendix A
Residents were interviewed to examine their use of forecasts for various work and recreation activities. After discussing forecasts for different weather conditions with different lead times, individuals were asked to estimate benefits from improved or perfect weather forecasts. Values were elicited in terms of their savings in undertaking different activities such as recreation, commuting, or shopping. The majority of subjects were unable or unwilling to make a value statement. Treating nonresponses as zero value, values were estimated on a per forecast basis for type of forecast (e.g., hail, snow, rain). Estimated aggregate benefits for perfect forecasts for Denver households were $31 million (1979$) based on estimated annual per capita benefits of $44 for commuting, $17 for recreation, and $23 for shopping weighted by the number of activities undertaken.
MSI Services Incorporated. 1981. Public Requirements for Weather Information and Attitudes Concerning Weather Service. Prepared for the National Weather Service.
MSI Services Incorporated (1981) reports on a national telephone survey of 1,300 households’ use of and needs for weather forecast information. The survey included a valuation question on what individuals think the value of their weather information is: “If you had to put a dollar value per year on weather information you receive, what would it be?” Depending on how the upper bound of the highest category is treated, the mean WTP is between $20.72 a year and $27.20 a year. Given reasonable practices in stated value studies, the value estimate derived from this report is of questionable use — the question was the 51st question in a 59-question telephone survey; the commodity being valued, “weather information you receive,” is extremely vague even given the preceding questions; and the valuation scenario did not identify a payment mechanism, discuss complements or substitutes, or check for validity or reliability of responses.
Anaman, K.A. and S.C. Lellyett. 1996. “Contingent Valuation Study of the Public Weather Service in the Sydney Metropolitan Area.” Economic Papers 15(3):64-77.
Anaman, K.A., D.J. Thampapillai, A. Henderson-Sellers, P.F. Noar, and P.J. Sullivan. 1995. “Methods for Assessing the Benefits of Meteorological Services in Australia.” Meteorological Applications 2:17-19.
Anaman, K.A., S.C. Lellyett, L. Drake, R.J. Leigh, A. Henderson-Sellers, P.F. Noar, P.J. Sullivan, and D.J. Thampapillai. 1997. Economics and Social Benefits of Meteorological Services Provided by the Australian Bureau of Meteorology: Final Project Report. MacQuarie University, Bureau of Meteorology, Sydney.
Anaman, K.A., S.C. Lellyett, L. Drake, R.J. Leigh, A. Henderson-Sellers, P.F. Noar, P.J. Sullivan, and D.J. Thampapillai. 1998. “Benefits of Meteorological Services: Evidence from Recent Research in Australia.” Meteorological Applications 5(2):103-115.
Page A-4 SC10367

Stratus Consulting Appendix A
Anaman et al. (1995, 1997, 1998) and Anaman and Lellyett (1996) describe a seven-project, multiyear study of various aspects of the value of weather information services provided by the Bureau of Meteorology (BoM) of Australia. Two of the seven projects used stated-value methods to elicit values for weather information; Project 1 elicited Sydney area residents’ values for BoM services and Project 7 elicited household values for the Tropical Cyclone Warning System (TCWS) in Queensland. Anaman and Lellyett (1996) report on a short telephone stated-value survey administered to 524 adults in Sydney eliciting values for the Australian public weather service. Average monthly WTP was AU$2.00, with 62.5% reporting zero WTP. A logistic regression indicated lower WTP from older people, higher WTP from more frequent users and from those judging the information to be of higher quality, and no significant relationship for the additional use of weather information in business as well as personal use. The logistic regression modeled WTP as 0 for zero WTP and 1 for positive WTP.
Chapman, R.E. 1992. Benefit-Cost Analysis for the Modernization and Associated Restructuring of the National Weather Service. NISTIR 4867. Report to the U.S. Department of Commerce, National Institute of Standards and Technology. Washington, D.C.
Chapman (1992) prepared a benefit-cost analysis of the (then) proposed NWS modernization, including a sensitivity analysis. In general, Chapman found strong support for the modernization using any criteria (benefit-cost ratio or net present value). The benefit estimate relies heavily on a value derived from the 1981 MSI Services report “Public Requirements for Weather Information and Attitudes Concerning Weather Service.” The per capita value from the MSI Services study was translated to $35.50 per year (1992$). Even given adjustments made to the MSI Services study values for use in the benefit-cost analysis of the weather service modernization, there is nothing in the MSI Services study that would indicate a specific relationship between values for current services (as elicited in the MSI Services study) and values for changes in services (as required for benefit-cost analysis of the modernization).
Cavlovic, A., J. Forkes, and K. Rollins. No date (a). Economic Value of Environment Canada’s ATAD Service for Business Users in the Greater Toronto Area. Unpublished report submitted to The Policy Program and International Affairs Directorate, Atmospheric Environment Service, Environment Canada.
Cavlovic et al. (n.d. [a]) value Environment Canada’s Weatherline Automated Telephone Answering Device (ATAD) weather information service, focusing specifically on business callers from the Toronto area. Cavlovic et al. estimate a mean WTP per call of CA$1.20, which varies depending on the type of business using the information.
Page A-5 SC10367

Stratus Consulting Appendix A
Cavlovic, A., J. Forkes, and K. Rollins. No date (b). Economic Value of Environment Canada’s Weatheradio Service for Users in Maritime Communities of Atlantic Canada. Unpublished report submitted to The Policy Program and International Affairs Directorate, Atmospheric Environment Service, Environment Canada.
Cavlovic et al. (n.d. [b]) surveyed 624 individuals to elicit values for Weatheradio in Canada. Weatheradio, run by Environment Canada, provides weather warnings along the Atlantic coast of Canada and thus is primarily a weather warning system. A telephone-administered, double-bounded dichotomous choice contingent valuation survey was used. The survey also elicited information on other sources and uses of weather information and preferences for improvements to Weatheradio. Average annual WTP for Weatheradio was derived for residents of New Brunswick (CA $96.27 per user, business or personal), Nova Scotia (CA$76.47), and Prince Edward Island (CA$93.12) for an aggregate value of slightly more than CA $2 million annually.
A.2 Aviation
Sunderlin, J. and G. Paull. 2001. FAA Terminal Convective Weather Forecast Benefits Analysis. Prepared for the FAA by MCR Federal, Inc. Bedford, MA.
The study estimated the benefits of the Terminal Convective Weather Forecast (TCWF) product. The product is being developed as part of the Federal Aviation Administration (FAA) Aviation Weather Research Program (AWRP). TCWF is an implementation product for the Integrated Terminal Weather System (ITWS). ITWS forecasts are sometimes erroneous because they do not account for storm evolution, and the current prediction window is limited to 10 to 20 minutes. TCWF addresses these shortcomings. TWCF was demonstrated at Dallas-Fort Worth, Orlando, Jacksonville, and New York airports. Benefits were estimated for these locations and extrapolated to the national level. Current ITWS benefits were estimated to be $573.5 million. Benefits were estimated for the TCWF based on interviews with traffic management personnel. Delay reduction benefits were extrapolated to yearly savings using linear extrapolation and a queuing model. The percentage of respondents expressing that they saw benefits from using the product were used to develop confidence intervals around the estimate. Total national benefits were estimated to be $545.2 million annually at a confidence level of 55%-60%. This estimate ranges from $461.2 million at the 80% confidence level to $687.2 million at the 20% confidence level. Estimated TCWF savings are approximately 3% of the delay baseline. Also, TCWF savings is approximately 6% of weather delay at the TCWF sites, assuming that weather delay is approximately 40% of all delays.
Page A-6 SC10367
Stratus Consulting Appendix A
Paull, G. 2001. Integrated Icing Diagnostic Algorithm (IIDA) Safety Benefits Analysis Accident Case Studies. Prepared for the FAA by MCR Federal, Inc. Bedford, MA.
This study estimated the benefits of the Integrated Icing Diagnostic Algorithm (IIDA), and the related product the Integrated Icing Forecast Algorithm (IIFA). The majority of estimated benefits apply to general aviation operations, with the remainder from commuter and air taxi operations. Air carrier benefits were excluded because of the limited number of historical in-flight icing accidents. Six recent in-flight accidents were selected for review as to the likelihood the IIDA product would have prevented the event. Excluding air carriers, the average annual cost of in-flight icing accidents is $100 million. The effectiveness of IIDA in reducing accident risk was estimated to range from 26% to 62%. Accidents occurring within the CONUS were 90% of total accidents, and 80% of all noncarrier accidents involved known icing conditions where the pilot received a weather briefing. Thus the historical baseline was limited to 72% (90% * 80%) of the historical baseline. Therefore, the accident pool that IIDA may affect totals $72 in annual costs. The potential safety benefit from IIDA was estimated to range from $18.7 million to $44.7 million, with an average benefit of $31.7 million. Benefits for Alaska were excluded because IIDA is not projected to cover Alaska until 2002. This result assumes that the proportion of pilots who currently receive weather briefings will utilize IIDA, have established confidence in the product, and do not benefit in situations where icing conditions were not forecast. The ability to disseminate information to pilots in a timely manner is still of concern. Until IIDA is easily accessible to pilots and pilots build confidence in the product, the benefits potential estimated will not be fully realized.
Leigh, R.J. 1995. “Economic Benefits of Terminal Aerodrome Forecasts (TAFs) for Sydney Airport, Australia.” Meteorological Applications 2:239-247.
This study analyzed the economic value to Quantas Airlines of improvements in Terminal Aerodrome Forecast (TAF) information. The value to the airline derives from avoidance of carrying extra fuel on board that might have been required in bad weather conditions to divert to an alternate airport or account for other contingencies. A hypothetical increase in TAF accuracy of 1% is valued at $0.85 million. The average value to Quantas of TAF service at the Sydney airport is $4.9 million. This is more than the value that Quantas pays indirectly to Australian Bureau of Meteorology for all aviation weather services ($4.2 million). When extrapolated to all international Quantas flights this is about $11 million per year. These values do not consider the social value of reduced air pollution (carbon dioxide, nitrogen oxides, etc.). Quantas policy allows for making the decision on how much fuel to carry after factoring in weather forecasts. Many other airlines require carrying extra fuel regardless of the weather forecast, so this value to Quantas is not widely applicable to other airlines.
Page A-7 SC10367

Stratus Consulting Appendix A
Evans, J.E. 1995. “Measuring the Economic Value of Aviation Meteorological Products.” Paper presented at the 14th Conference on Weather Analysis and Forecasting. January 15-20. Dallas, TX.
This study reviews safety and delay reduction in regard to aviation weather forecasting — specifically the benefit of wind shear detection systems and delay reduction resulting from improved weather information. Assessing the benefits of wind shear impact reduction systems is difficult because of the small number of wind shear incidents in history to study, and the limited amount of wind shear data at some airports depending on the variability of thunderstorm events between years. It is also difficult to determine the effect of warning systems that alert only when a plane is already encountering a microburst. Pilot reaction to these rare warnings is a key factor. Regarding delays, in another study delay results were extrapolated from Chicago O’Hare to other major airports based on differences in traffic into the airport. Thunderstorms, heavy fog, and low visibility were considered. Thunderstorms accounted for approximately 50% of the delay. Downstream effects of a delay are generally considered to be 4 times the initial weather delay, although one study showed the downstream affected passengers to be 27 times the initial delay. A queuing model study suggests a modest reduction in weather event effective duration (e.g., from 3.0 hours to 2.5 hours) by predicting the event end time can produce substantial changes in delay (e.g., 20%-35%), and that relatively small changes in system capacity (e.g., 10%) can produce much larger proportional reductions in accumulated delay (e.g., 20% to 50%).
NOAA. 2002. Geostationary Operational Environmental Satellite System (GOES) GOES-R Sounder and Imager Cost/Benefit Analysis (CBA). Prepared for the Department of Commerce by NOAA, National Environmental Satellite, Data, and Information Service (NESDIS), Office of Systems Development. November 15. Silver Spring, MD: NOAA/NESDIS.
Two main products from the GEOS-R satellite system are an advanced imager and sounder. These will provide greater Earth coverage and weather and environmental information and predictive capability. There are two main sources of value to aviation from improvements in the satellite — avoided delays from better weather information, and detection of volcanic ash plumes to avoid catastrophic aircraft failure or damage to engines, instruments, and airframes. With advanced sounder data, forecasters looking 1 to 2 hours in advance will likely be able to reduce the watch area by approximately 90%. This will result in more efficient use of air space by reducing weather related flight delays. It will also provide more information about the intensity and rate of development of convective weather. Estimated benefits are $55 million marginal annual benefits, and $205 million in discounted present value benefits from the time frame from 2012 to 2027. Of this amount, $38 million annually and $103.3 million in present value terms will come from avoided delays from better weather information; the rest comes from avoiding volcanic ash plumes.
Page A-8 SC10367

Stratus Consulting Appendix A
Allan, S.S., S.G. Gaddy, and J.E. Evans. 2001. Delay Causality and Reduction at the New York City Airports Using Terminal Weather Information Systems. Lexington, MA: MIT Lincoln Laboratory.
This study examines initial benefits from a pilot project to provide Integrated Terminal Weather System services to New York. In the late summer of 1999, the initial ITWS capability was extended to include 30- to 60-minute predictions of convective storms generated by the Terminal Convective Weather Forecast (TCWF) algorithm. One key benefit is improved traffic management decision making during convective weather. Traffic managers were able to reduce airport gridlock by releasing several additional departures each hour by properly timing the arrival and impact of lines of convective weather. In the second example, terminal wind information is used to correctly set arrival rates and merge/sequence aircraft during a time of strong vertical wind shear. Because New York winters are especially vulnerable to vertical wind shear, accurate knowledge of terminal winds is critical for traffic managers. Study of these two types of benefit using an MIT-developed queuing model shows that nearly $2,080,000 was saved at Newark International Airport through the use of ITWS during the convective weather event. It also reveals that use of the terminal wind product led to savings of at least $156,000 on the strong vertical wind shear day. Improved decision making by New York FAA users of ITWS results in more than $156 million in benefits per year. A case study showed additional possible benefits from providing storm decay predictions (more than $1,560,000 for one day), and substantial benefits ($499,200 per event) from providing correct timing of the onset and ending of capacity-limiting events such as low ceilings or high surface winds.
Evans, J.E., T.J. Dacey, D.A. Rhoda, R.E. Cole, F.W. Wilson, E.R. Williams. 1999. “Weather Sensing and Data Fusion to Improve Safety and Reduce Delays at Major West Coast Airports.” Lexington, MA: MIT Lincoln Laboratory.
This study analyzes the weather sensing and forecasting required to improve safety and reduce delays at West Coast airports currently not scheduled to receive an Integrated Terminal Weather System (ITWS). This report considers the Los Angeles (LAX), San Francisco (SFO), Seattle (SEA), and Portland (PDX) international airports. There are three basic approaches for reducing delays: 1) use a parallel runway monitoring (PRM) system with a wake vortex encounter avoidance system to permit use of closely spaced runways in instrument flight rules (IFR) conditions; 2) increase the number of aircraft landed per hour per runway; and 3) match the traffic flow to the time-varying airport capacity (i.e., traffic flow management optimization). Delay reduction benefit for the West Coast airports would come from use of terminal winds information. National delay-reduction benefits from ITWS implementation based on latest estimates totals $521.6 million per year. Reduced SFO delays resulting from improved merging and sequencing of aircraft is estimated to be $21.1 million. In addition, benefits from Simultaneous Operation with Independent Approaches (SOIA) at SFO are estimated to be $84.3
Page A-9 SC10367

Stratus Consulting Appendix A
million per year. Merging and sequencing improvements at LAX are projected to be worth $22.7 million. Benefits at SEA are projected to be $14.8 million.
Rhoda, D.A. and M.E. Weber. 1996. “Assessment of Delay Aversion Benefits of the Airport Surveillance Radar (ASR) Weather Systems Processor (WSP) — Project Report.” Lexington, MA: MIT Lincoln Laboratory.
Testing of the Weather Systems Processor (WSP) modification to existing Airport Surveillance Radars (ASR-9) and related terminal areas hazardous weather detection systems (Terminal Doppler Weather Radar (TDWR) and the Integrated Terminal Weather System (ITWS) have been shown to reduce the risk of wind shear induced aircraft accidents during landing or takeoff and significantly aid terminal air traffic management during adverse weather. Delay benefits from national deployment of the WSP are assessed in terms of aircraft delay-hour reductions. Benefits are expected to be $21 million per year based on expected year 2000 traffic counts at the planned WSP airports.
A.3 Agriculture
Katz, R.W., A.H. Murphy, and R.L. Winkler. 1982. “Assessing the Value of Frost Forecasts to Orchardists: A Dynamic Decision-Analytic Problem.” Journal of Applied Meteorology 21: 518-531.
Katz et al.(1982) found that daily minimum temperature forecasts were valuable to apple, pear, and peach orchardists in central Washington. Deciduous fruit trees become particularly susceptible to damage from freezing temperatures, or frost, in the spring when the buds begin to develop into blossoms. Frost can damage or kills buds, and extremely low temperatures can damage trees. To minimize damage caused by low temperatures, many fruit growers employ devices such as heaters, wind machines, and overhead sprinklers to protect their orchards. Because the use of protective devices involves considerable expense, the producer must decide if it makes economic sense to use these devices if just a slight chance of frost exists. To aid in these decisions, the area’s NWS office disseminates minimum temperature forecasts to the orchardists each evening. The value of these forecasts to a fruit grower is measured by the ability of the forecasts to reduce the uncertainty under which the decision is made, resulting in turn in a reduction in the orchardist’s expected expenses. The study examined the relationships between temperature, bud loss, and yield loss, and used a class of models to determine the optimal actions and to estimate the value of the meteorological information. Over the entire frost-protection season, these values estimates (1977$) were $808 per acre for apples, $492 per acre for pears, and $270 per acre for peaches. These amounts account for 66%, 63%, and 47%, respectively, of the economic value that would be realized by an orchardist whose decisions were based on perfect information.
Page A-10 SC10367
Stratus Consulting Appendix A
Wilks, D.S., R.E. Pitt, and G.W. Fick 1993. “Modeling Optimal Alfalfa Harvest Scheduling Using Short-Range Weather Forecasts.” Agricultural Systems 42:277-305.
Wilks et al. (1993) examined how alfalfa producers used daily precipitation, temperature, and evaporation forecasts in making their day-to-day harvest decisions. Forage preservation is another agricultural process where weather forecasts are important inputs. Alfalfa is usually preserved for livestock feed at a later date. Good weather is needed for drying the harvest several days in the field, as rain can damage the harvest and extend the drying period, exposing the forage to the potential for further damage. The problem is complicated by the fact that the quality, and thus value, of the undamaged product decreases as harvests are delayed, so that the farmer cannot wait indefinitely for a very high probability of good drying weather. The Wilks et al. (1993) study modeled the daily cutting decisions over a growing season, allowing the model to prescribe both the number and timing of cuttings. Temperature forecasts were included in the model to control plant yield and maturity, and as input to the derived evaporation forecasts. The study concluded that the perfect weather forecasts are worth $140 per hectare per year to alfalfa growers (in 1991 dollars).
Fox, G., J. Turner, and T. Gillespie. 1999a. “The Value of Precipitation Forecast Information in Winter Wheat Production.” Agricultural and Forest Meteorology 95:99-111.
Fox et al. (1999a) explored that fact that weather forecast information is also an important for timing winter wheat planting, spraying, fertilizing, and harvesting. Precipitation forecast information, as with alfalfa, is most valuable at harvest time as grain quality deteriorates when rain delays wheat harvest. Fox et al. (1999a) found that the value of perfect weather information averaged $100 per hectare per year (CA 1994$). The study also found that the level of risk aversion was an important determinant of the value of weather forecast information.
Additional literature
There is a large set of literature that examines the value of weather forecasts to various agricultural commodities. Exhibit A.1 lists some of this literature and the estimated values for short-term forecasts to various crops. Exhibit A.2 lists some of the values estimated for longer term forecasts such as seasonal forecasts
Page A-11 SC10367

Stratus Consulting Appendix A
Exhibit A.1. Value of short-term weather forecasts to agriculture Study Value source Estimate Anaman and Lellyett (1996)
Value of temperature, wind, and precipitation forecasts to cotton producers in Australia
VOIa imperfect: $397,150/yr (AU 1995$)
Baquet et al. (1976)
Value of frost forecast to pear orchard managers
VOI, imperfect: $798/ha-yr; VOI perfect: $1,270/ha-yr (1976$)
Fox et al. (1999a)
Value of precipitation forecast information in winter wheat production in Canada
VOI, imperfect: -$153 – +$364/ha-yr; VOI, perfect: $0 – $364/ha-yr (CA 1999$)
Fox et al. (1999b)
Value of precipitation forecast information in alfalfa dry hay production in Ontario
VOI, imperfect: -$6 – +$36/acre-year; VOI, perfect: $4 – $73/acre-year (CA 1999$)
Hammer et al. (1996)
Value of precipitation and frost timing forecasts for wheat crop management in Australia
VOI, imperfect: up to 20% increase in profit; VOI, perfect: 15% of value of perfect forecasts is achieved by present forecasts (1996$)
Luo et al. (1994)
Value of temperature forecasts to U.S. corn producers deciding whether to buy crop insurance
VOI, imperfect: $0.30-$0.86/dollar of insurance premium (1994$)
Wilks and Wolfe (1998)
Value of temperature and precipitation forecasts for lettuce irrigation timing in a humid climate in the United States
VOI, imperfect: $900-$1000/ha-yr (1998$)
a. Value of information.
Exhibit A.2. Value of long term climate forecasts to agriculture Abawi et al. (1995)
Value of precipitation forecasts in implementing wheat harvest strategies such as early harvesting, drying, and contract harvesting
VOI, imperfect: $12/ha-yr; VOI, perfect: $20/ha-yr (AU 1995$)
Adams et al. (1995)
Value of improved El Nino-Southern Oscillation forecasts (precipitation and temperature) to various crop yields in the southeastern United States
VOI, perfect: $200 million/yr; VOI, imperfect: $132 million/yr (1994$)
Bowman et al. (1995)
Value of precipitation and temperature forecasts to wool-producers in Victoria, Australia
VOI, imperfect: $890-$2,390; VOI, perfect: $1,380-$2,940 (AU 1995$)
Chen et al. (2002)
Agricultural value of ENSO information VOI, imperfect: $399-$754 million; VOI, perfect: $1390 million (1996$)
Hill et al. (1999)
Value of precipitation, temperature, and radiation forecasts for Texan aggregate sorghum production
VOI, imperfect: $0-$90/ha (1999$)
Page A-12 SC10367

Stratus Consulting Appendix A
Exhibit A.2. Value of long term climate forecasts to agriculture (cont.) Hill et al. (2000)
Value of precipitation, temperature, and radiation forecasts for planning fertilizer applications on U.S. and Canadian wheat fields
VOI, imperfect: $0-$10/ha-yr; VOI, perfect: $9-$52/ha-yr (2000$)
Jochec et al. (2001)
Value of temperature and precipitation forecasts to livestock ranchers in Texas
VOI, imperfect: -$149-$5/section-yr; VOI, perfect: -$46 to $121/section-yr (2001$)
Messina et al. (1999)
Value of maximum and minimum temperature, precipitation, and radiation forecasts to corn, soybean, sunflower, and wheat producers in Argentina
VOI, imperfect: $5-$15/ha-yr (1999$)
Mjelde and Penson (2000)
Value of precipitation, temperature, and radiation forecasts in making fertilizer application decisions in the Corn Belt region
VOI, perfect: $1.3-$2.9 billion over 10 years (2000$)
Mjelde et al. (1996)
Value of precipitation forecasts on the following decisions: type of crop, amount of nitrogen applied, the farmer’s participation in the Federal Farm Program, and whether to buy crop insurance
VOI, imperfect: $974-$12,085/farm; VOI, perfect: $16,567/farm (1996$)
Mjelde et al. (1997)
Value of precipitation forecasts on the following decisions: fertilizer application level, planting date, and seeding rate
VOI, imperfect: $1-$2/acre (1997$)
Solow et al. (1998)
Value of improved ENSO prediction to U.S. agriculture (various crops)
VOI, imperfect: $240-$266 million/yr; VOI, perfect: $323 million/yr (1995$)
A.4 Energy
Changnon, S.A., J.M. Changnon, and D. Changnon. 1995. “Uses and Applications of Climate Forecasts for Power Utilities.” Bulletin of the American Meteorological Society 76(5):711-720.
This paper looks specifically at climate forecasting use by power utilities, and focuses on the type and quality of information most useful to this business type. Changnon et al. (1995) surveyed 56 decision makers at six utilities in the Midwest. A key finding was that only 3 out of the 56 decision makers surveyed used 30- and 90-day NWS outlooks for seasonal load planning (a usage level much lower than agribusiness). One of the reasons given for low usage of these forecasts was the format of the information received, which was not area-specific, and was also text-based only at that time. Given changes in utility market structure in the last 8 years, one would expect the use of the data for load forecasting purposes to be much higher today — and the majority of respondents did use climate forecasts in other forms. When queried about the
Page A-13 SC10367

Stratus Consulting Appendix A
type of data he/she was interested in receiving in the future, interest centered on temperature and extreme temperature data. There was also a significant interest in the accuracy of weather data, including the accuracy trends of recent forecasts — and a comfort level with the use of probabilities as a means of expressing uncertainty of forecasts. As most of the utilities are summer-peaking, the utility representatives were most interested in summer climate forecasts.
The paper discusses the value of climate forecasts. A majority (25 of 44 respondents) set the value of using climate forecasts as >$100,000 for their individual task area. The energy traders and fuel acquisition specialists in the sample all valued the information higher than this threshold. If we extrapolate these findings using the simple assumption that each electricity utility in the country would achieve similar value from climate forecasts, given the more than 3000 investor-owned and public utilities in the United States, the resulting value would be in the range of $300 million.
Murnane, R. J., M. Crowe, A. Eustis, S. Howard, J. Koepsell, R. Leffler, and R. Livezey. 2002. “The Weather Risk Management Industry’s Climate Forecast and Data Needs: A Workshop Report.” Bulletin of the American Meteorological Society 83(8):1193-1198.
This paper reports on a workshop held in 2001 — cosponsored by NOAA, the Weather Risk Management Association, and the Risk Prediction Index. The workshop was not focused entirely on energy, but did include energy participants, including Enron. The group determined that NOAA’s forecasts and climate data were “key elements of the weather risk market.” The key factor in growing this market was that forecasts evolve and become easier to understand and use. The most widely used data sources are the Automated Surface Observing System (ASOS) and the Cooperative Observer Program (COOP). This paper does not provide dollar values associated with data accuracy, and participants stated they do not really use long-range forecasts — but acknowledged that contract prices change after forecasts are issued.
Dempsey, C. L., K. W. Howard, R. A. Maddox, and D. H. Phillips. 1998. “Developing Advanced Weather Technologies for the Power Industry.” Bulletin of the American Meteorological Society 79(6):1019-1035.
This paper reports on a tailored collaboration between the Electric Power Research Institute (EPRI) and the Salt River Project (SRP) that explored the use of NWS nonweather data into operational decision making. It focused on the impacts of extreme weather events (thunderstorms, lightning, high winds, sudden temperature changes, and winter precipitation) on daily operations. A number of outage situations were investigated, but they were not assigned an economic value. A key finding of this study was the benefits of the use of NowCasts, short-term detailed forecasts typically valid for 30-120 minutes — produced by the NWS WSR-88D observing system. The paper summarizes postanalysis conducted on weather events during the summer of 1994 (the study period), and the expected megawatt-hour savings that could have
Page A-14 SC10367

Stratus Consulting Appendix A
been realized through the use of NowCasts. Even though the summer monsoon was less active than normal that year, the findings point to potential savings of well over 1000 MWh. At an average market price of $30/MW, this would have resulted in $30,000 savings. Savings were based primarily on the cost of purchased energy that could have been avoided, had advance knowledge of storm effects (lower temperatures, and thus lower air conditioning loads) been utilized.
Additional Notes: Two recent articles in Transmission and Distribution World (Q4, 2003) contain the following additional information on costs and causes of power outages in the United States — 67% of power outages are weather-related (this comes from an Edison Electric Institute (EEI) 1999 reliability report that surveyed 62 investor-owned utilities). The articles do not define “weather-related,” but extreme heat is often cited as the cause of system overload, a primary outage factor. A second article in the same Q4 2003 issue cites the costs of the August 14, 2003, outage in the upper Midwest and along the East Coast at between $4 and $6 billion. It is unclear how much more accurate the weather data would have needed to be to reduce the likelihood of this outage.
Cogan, J. 1998. “What is Weather Risk?” Originally published by PMA Online Magazine, May, 1998. Downloaded October 28, 2003, from http://www.retailenergy.com/articles/weather.htm.
This article reports on a survey of 200 top utility company annual reports, 80% of which cite weather as a major determinant of earnings performance. About half the companies claimed that weather was responsible for poorer than expected financial performance. The article is written by the president of Natsource, Inc., a weather hedging service. Weather hedging is based on a risk mitigation strategy for energy companies that basically buy insurance against abnormal levels of heating or cooling degree days, or precipitation. This is a relatively new business that has grown in deregulated energy markets. The article cites some examples of various weather risk products, but does not provide dollar estimates of savings to the industry.
Dischel, B. 2001. “Seasonal Weather Forecasts and Derivative Valuation.” Available at http://www.financewise.com/public/edit/energy/weather00/wthr00-forecast.htm. Accessed December 1, 2003.
This article looks at the value of short- and long-term forecasts in weather-derivative products. The article states that there is limited value in short-term forecasts, as they provide only a few days of information, with the uncertainty of the data declining rapidly after the first few days. Long-range forecasts, however, make use of factors including atmospheric and oceanic conditions and are based on average weather — not specific events. The article advocates for future forecasts that “quantify the probability of each possible weather outcome throughout the full range of possibilities.” The article reviews several tools available from the Climate
Page A-15 SC10367
Stratus Consulting Appendix A
Page A-16 SC10367
Prediction Center (CPC), including the seasonal forecasts for distribution of temperature, precipitation, and the error envelopes of each.
The article goes on to provide an example of weather-contingent revenue estimation at a gas supply company. As with the Cogan article, weather risk products are advocated to reduce the value at risk associated with uncertainty of the weather. The example provided indicates a significant upside (up to 100% revenue increase at certain degree day levels) for an energy provider that hedges against the possibility of warmer or cooler than average weather. No concrete dollar values are included.
Fan, J.Y. and J. D. McDonald. 1994. “A Real-Time Implementation of Short-Term Load Forecasting for Distribution Power Systems.” IEEE Transactions on Power Systems 9(2):988-994.
This paper presents a model for short-term forecasting of electrical loads by correlating weather data and other factors to system loads. The key weather factors used in the algorithm developed are temperature, dry bulb temperature, relative humidity, and wind speed. The study demonstrates that weather impacts electrical loads in a nonlinear manner (usually taking a “bathtub-like” relationship, which dips from cooler temperatures until about 60°F is reached, and then rises a bit steeper until it flattens out somewhere above 100°F). Temperature is clearly the primary determinant.
Hackney, J. 2002. “Increasing the Value of Weather Information in the Operation of the Electric Power System – Workshop Report.” November 6-7, Boulder, CO. Sponsored by the United States Weather Research Program (USWRP). Available online at http://www.esig.ucar.edu/electricity/workshop/. Accessed December 1, 2003.
This workshop report provides highlights from a meeting held at NCAR, which included 35 experts from the electric power industry and the meteorological sciences community. It focuses on the information needs of the electricity sector. Although the workshop report does not contain dollar values associated with improved information, one presenter (Frank Monforte) highlighted a regression study indicating that daily electrical load prediction errors could be reduced from roughly 3.00% to about 1.33% through the use of average dry bulb temperatures.

B. Omissions, Biases, and Uncertainties Exhibit B.1 lists some potential omissions, biases, and uncertainties in the present value estimates for the benefits of a new supercomputer. These might affect the final benefit estimates if better information were available. “Positive” impact suggests that including better information on this aspect of the analysis would increase the present value estimates above those given in Exhibit 5.4. “Negative” impact suggests that including better information on this aspect of the analysis would lower the present value estimates below those given in Exhibit 5.4.
Exhibit B.1. Omissions, biases, and uncertainties in the present value estimates for the benefits of a new supercomputer
Issue Impact on present
value estimates Comments Omitted benefits from other agricultural sectors benefiting from improved weather forecasts
Positive (actual present value may be higher than estimated)
Estimated benefit estimates do not include benefits to agriculture other than those derived for orchards, winter wheat, and alfalfa.
Omitted benefits from all sectors where existing literature indicates significant benefits from improved weather forecasts
Positive (actual present value may be higher than estimated)
Estimated benefits estimates do not include benefits to: aviation energy.
The literature reviewed in this report indicates significant potential positive benefits in these two sectors that are not included in this economic analysis.
Omitted benefits from all other sectors benefiting from improved weather forecasts
Positive (actual present value may be higher than estimated)
Estimated benefits estimates do not include benefits to: marine transportation retail businesses marine resources private sector (e.g., highways) international weather bureaus military others not identified in this report.
SC10367

Stratus Consulting Appendix B
Page B-2 SC10367
Exhibit B.1. Omissions, biases, and uncertainties in the present value estimates for the benefits of a new supercomputer (cont.)
Issue Impact on present
value estimates Comments Timing of benefits Uncertain Timing of benefits is assumed to begin 2 years
after the new supercomputer is installed. Benefits would be experienced in full in 5 years, some occur sooner or later.
Appropriate discount rate Uncertain Some might argue that a 0% discount rate is applicable for activities that span across generations; others might argue that rates greater than 3% should apply to reflect real opportunity costs of capital in the near term.
Portion of weather forecast improvements attributable to the supercomputer
Uncertain It is uncertain that the applied percent of improvement resulting from the supercomputer is the true percent. The true percent could be higher or lower (see sensitivity analysis in Section 5.1 for more information).
Percent improvement in weather forecast
Uncertain It is uncertain that the applied percent of improvement expected in weather forecasts is the true percent. The true percent could be higher or lower (see sensitivity analysis in Section 5.1 for more information).
Omitted benefits to other applications besides weather forecasting
Positive (actual present value may be higher than estimated)
Estimated benefits do not include benefits to other laboratories and entities that will use the supercomputer (e.g., for climate and flood forecasting). We approximate that 80% of the supercomputer use will be for the weather forecasts discussed in this report.
Population growth and wealth growth
Positive (actual present value may be higher than estimated)
The benefit estimates derived in this report implicitly assume a constant population at current levels of real wealth. As population increases and real wealth increases, the aggregate value of improved weather forecasts to future generations will be higher.
Link between improved forecast and specific type of use benefit
Uncertain, but likely negative
The model used in the study is simplified and omits critical factors such as: 1) effective dissemination of the forecast; 2) articulation of the forecast in a way that is both comprehensible and realistically actionable to the target user; and 3) absence of other confounding factors that might limit or constrain use of the improved information.