Embed Size (px)
Citation preview
Online Nonparametric Anomaly Detection in High-Dimensional Datasets
Online Nonparametric Anomaly Detection inHigh-Dimensional Datasets
Yasin YılmazElectrical Engineering
University of South Florida
2/13/2018
Online Nonparametric Anomaly Detection in High-Dimensional Datasets
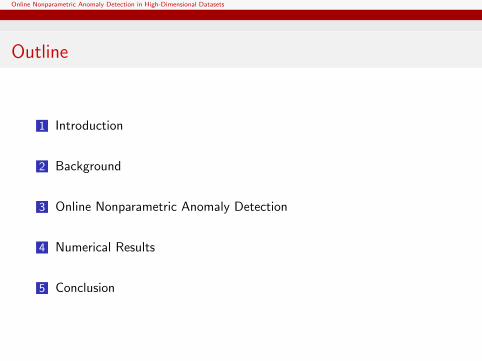
Outline
1 Introduction
2 Background
3 Online Nonparametric Anomaly Detection
4 Numerical Results
5 Conclusion

Online Nonparametric Anomaly Detection in High-Dimensional Datasets
Introduction
Introduction
Online Nonparametric Anomaly Detection in High-Dimensional Datasets
Introduction
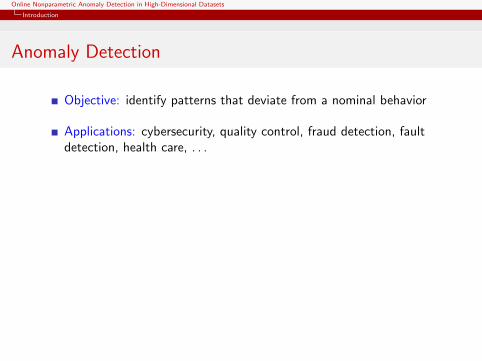
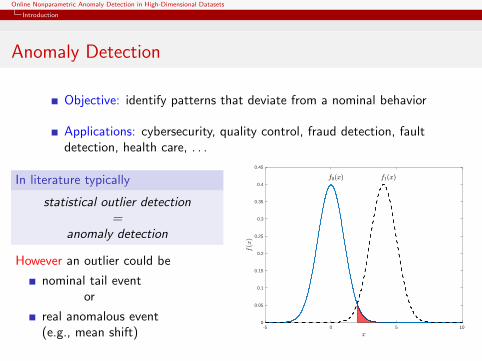
Anomaly Detection
Objective: identify patterns that deviate from a nominal behavior
Applications: cybersecurity, quality control, fraud detection, faultdetection, health care, . . .
In literature typically
statistical outlier detection=
anomaly detection
However an outlier could be
nominal tail eventor
real anomalous event(e.g., mean shift)
-5 0 5 10
x
0
0.05
0.1
0.15
0.2
0.25
0.3
0.35
0.4
0.45
f(x
)
f0(x) f1(x)
Online Nonparametric Anomaly Detection in High-Dimensional Datasets
Introduction
Anomaly Detection
Objective: identify patterns that deviate from a nominal behavior
Applications: cybersecurity, quality control, fraud detection, faultdetection, health care, . . .
In literature typically
statistical outlier detection=
anomaly detection
However an outlier could be
nominal tail eventor
real anomalous event(e.g., mean shift)
-5 0 5 10
x
0
0.05
0.1
0.15
0.2
0.25
0.3
0.35
0.4
0.45
f(x
)
f0(x) f1(x)
Online Nonparametric Anomaly Detection in High-Dimensional Datasets
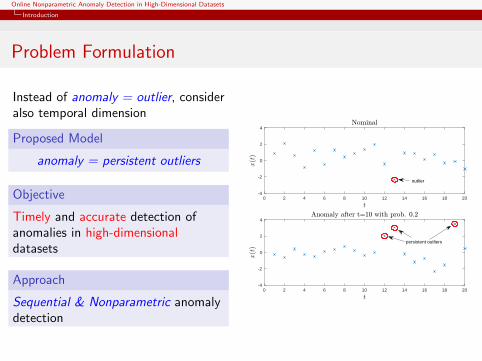
Introduction
Problem Formulation
Instead of anomaly = outlier, consideralso temporal dimension
Proposed Model
anomaly = persistent outliers
Objective
Timely and accurate detection ofanomalies in high-dimensionaldatasets
Approach
Sequential & Nonparametric anomalydetection
0 2 4 6 8 10 12 14 16 18 20
t
-4
-2
0
2
4
x(t
)
Nominal
0 2 4 6 8 10 12 14 16 18 20
t
-4
-2
0
2
4
x(t
)
Anomaly after t=10 with prob. 0.2
persistent outliers
outlier

Online Nonparametric Anomaly Detection in High-Dimensional Datasets
Introduction
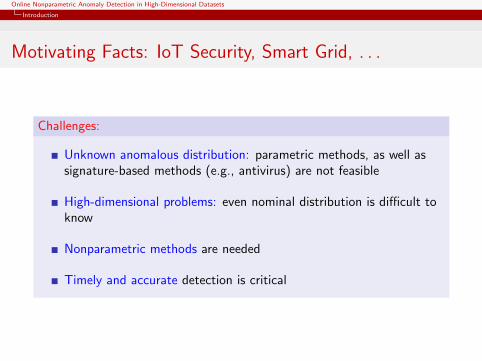
Motivating Facts: IoT Security, Smart Grid, . . .
IoT devices: 8.4B in 2017 and expected to hit 20B by 2020 1
IoT systems: highly vulnerable – needs scalable security solutions 2
Mirai IoT botnet: largest recorded DDoS attack with at least 1.1Tbps bandwidth (Oct. 2016) 2
Persirai IoT botnet targets at least 120,000 IP cams (May 2017) 3
A plausible cyberattack against the US grid: 100M people may beleft without power with up to $1 trillion of monetary loss 4
1R. Minerva, A. Biru, and D. Rotondi, “Towards a definition of the Internet ofThings (IoT),” IEEE Internet Initiative, no. 1, 2015.
2E. Bertino and N. Islam, “Botnets and Internet of Things Security,” Computer,vol. 50, no. 2, pp. 76-79, Feb. 2017.
3Trend Micro, “Persirai: New Internet of Things (IoT) Botnet Targets IPCameras”, May 9 , 2017, available online
4Trevor Maynard and Nick Beecroft, “Business Blackout,” Lloyd’s Emerging RiskReport, p. 60, May 2015.
Online Nonparametric Anomaly Detection in High-Dimensional Datasets
Introduction
Motivating Facts: IoT Security, Smart Grid, . . .
Challenges:
Unknown anomalous distribution: parametric methods, as well assignature-based methods (e.g., antivirus) are not feasible
High-dimensional problems: even nominal distribution is difficult toknow
Nonparametric methods are needed
Timely and accurate detection is critical
Online Nonparametric Anomaly Detection in High-Dimensional Datasets
Introduction
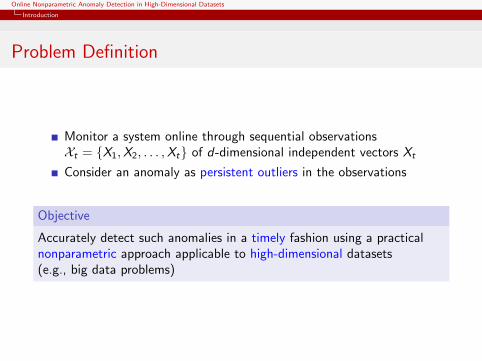
Problem Definition
Monitor a system online through sequential observationsXt = X1,X2, . . . ,Xt of d-dimensional independent vectors Xt
Consider an anomaly as persistent outliers in the observations
Objective
Accurately detect such anomalies in a timely fashion using a practicalnonparametric approach applicable to high-dimensional datasets(e.g., big data problems)

Online Nonparametric Anomaly Detection in High-Dimensional Datasets
Background
Background
Online Nonparametric Anomaly Detection in High-Dimensional Datasets
Background
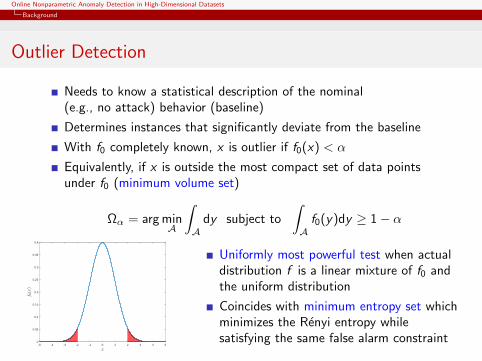
Outlier Detection
Needs to know a statistical description of the nominal(e.g., no attack) behavior (baseline)
Determines instances that significantly deviate from the baseline
With f0 completely known, x is outlier if f0(x) < α
Equivalently, if x is outside the most compact set of data pointsunder f0 (minimum volume set)
Ωα = arg minA
∫A
dy subject to
∫Af0(y)dy ≥ 1− α
-5 -4 -3 -2 -1 0 1 2 3 4 5
x
0
0.05
0.1
0.15
0.2
0.25
0.3
0.35
0.4
f 0(x
)
Uniformly most powerful test when actualdistribution f is a linear mixture of f0 andthe uniform distribution
Coincides with minimum entropy set whichminimizes the Renyi entropy whilesatisfying the same false alarm constraint
Online Nonparametric Anomaly Detection in High-Dimensional Datasets
Background
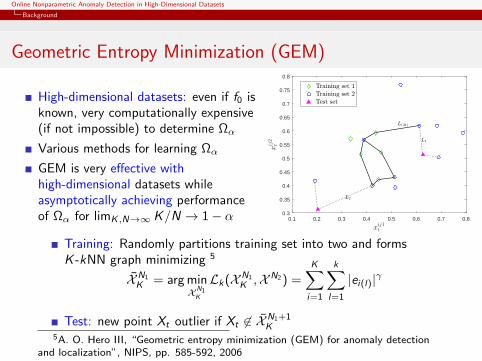
Geometric Entropy Minimization (GEM)
High-dimensional datasets: even if f0 isknown, very computationally expensive(if not impossible) to determine Ωα
Various methods for learning Ωα
GEM is very effective withhigh-dimensional datasets whileasymptotically achieving performanceof Ωα for limK ,N→∞ K/N → 1− α 0.1 0.2 0.3 0.4 0.5 0.6 0.7 0.8
xij1t
0.3
0.35
0.4
0.45
0.5
0.55
0.6
0.65
0.7
0.75
0.8
xij
2t
L(M )
L1
L2
Training set 1Training set 2Test set
Training: Randomly partitions training set into two and formsK -kNN graph minimizing 5
XN1
K = arg minXN1
K
Lk(XN1
K ,XN2 ) =K∑i=1
k∑l=1
|ei(l)|γ
Test: new point Xt outlier if Xt 6∈ XN1+1K
5A. O. Hero III, “Geometric entropy minimization (GEM) for anomaly detectionand localization”, NIPS, pp. 585-592, 2006
Online Nonparametric Anomaly Detection in High-Dimensional Datasets
Background
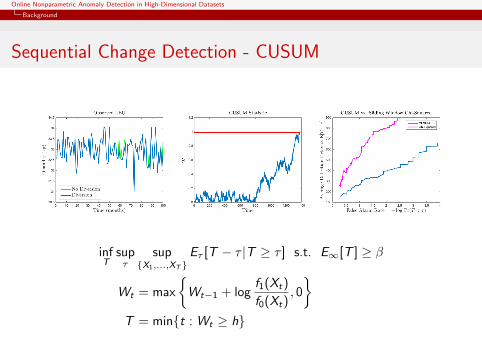
Sequential Change Detection - CUSUM
infT
supτ
supX1,...,XT
Eτ [T − τ |T ≥ τ ] s.t. E∞[T ] ≥ β
Wt = max
Wt−1 + log
f1(Xt)
f0(Xt), 0
T = mint : Wt ≥ h
Online Nonparametric Anomaly Detection in High-Dimensional Datasets
Online Nonparametric Anomaly Detection
Online Nonparametric Anomaly Detection
Online Nonparametric Anomaly Detection in High-Dimensional Datasets
Online Nonparametric Anomaly Detection
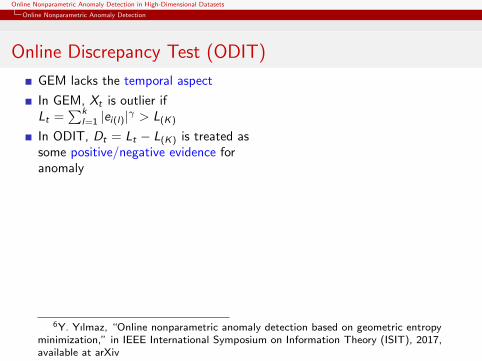
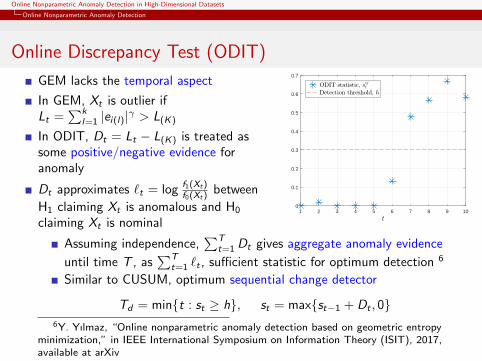
Online Discrepancy Test (ODIT)
GEM lacks the temporal aspect
In GEM, Xt is outlier ifLt =
∑kl=1 |ei(l)|γ > L(K)
In ODIT, Dt = Lt − L(K) is treated assome positive/negative evidence foranomaly
Dt approximates `t = log f1(Xt)f0(Xt)
between
H1 claiming Xt is anomalous and H0
claiming Xt is nominal1 2 3 4 5 6 7 8 9 10
t
0
0.1
0.2
0.3
0.4
0.5
0.6
0.7
ODIT statistic, sijt
Detection threshold, h
Assuming independence,∑T
t=1 Dt gives aggregate anomaly evidence
until time T , as∑T
t=1 `t , sufficient statistic for optimum detection 6
Similar to CUSUM, optimum sequential change detector
Td = mint : st ≥ h, st = maxst−1 + Dt , 0
6Y. Yılmaz, “Online nonparametric anomaly detection based on geometric entropyminimization,” in IEEE International Symposium on Information Theory (ISIT), 2017,available at arXiv
Online Nonparametric Anomaly Detection in High-Dimensional Datasets
Online Nonparametric Anomaly Detection
Online Discrepancy Test (ODIT)
GEM lacks the temporal aspect
In GEM, Xt is outlier ifLt =
∑kl=1 |ei(l)|γ > L(K)
In ODIT, Dt = Lt − L(K) is treated assome positive/negative evidence foranomaly
Dt approximates `t = log f1(Xt)f0(Xt)
between
H1 claiming Xt is anomalous and H0
claiming Xt is nominal1 2 3 4 5 6 7 8 9 10
t
0
0.1
0.2
0.3
0.4
0.5
0.6
0.7
ODIT statistic, sijt
Detection threshold, h
Assuming independence,∑T
t=1 Dt gives aggregate anomaly evidence
until time T , as∑T
t=1 `t , sufficient statistic for optimum detection 6
Similar to CUSUM, optimum sequential change detector
Td = mint : st ≥ h, st = maxst−1 + Dt , 06Y. Yılmaz, “Online nonparametric anomaly detection based on geometric entropy
minimization,” in IEEE International Symposium on Information Theory (ISIT), 2017,available at arXiv
Online Nonparametric Anomaly Detection in High-Dimensional Datasets
Online Nonparametric Anomaly Detection
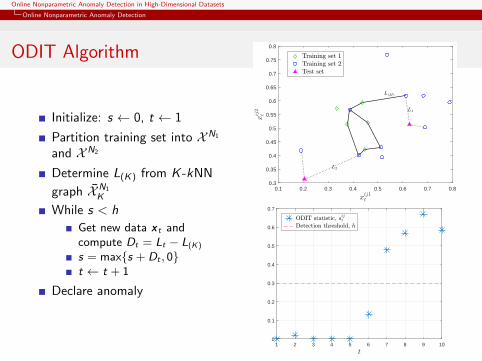
ODIT Algorithm
Initialize: s ← 0, t ← 1
Partition training set into XN1
and XN2
Determine L(K) from K -kNN
graph XN1
K
While s < h
Get new data x t andcompute Dt = Lt − L(K)
s = maxs + Dt , 0t ← t + 1
Declare anomaly
0.1 0.2 0.3 0.4 0.5 0.6 0.7 0.8
xij1t
0.3
0.35
0.4
0.45
0.5
0.55
0.6
0.65
0.7
0.75
0.8
xij
2t
L(M )
L1
L2
Training set 1Training set 2Test set
1 2 3 4 5 6 7 8 9 10
t
0
0.1
0.2
0.3
0.4
0.5
0.6
0.7
ODIT statistic, sijt
Detection threshold, h
Online Nonparametric Anomaly Detection in High-Dimensional Datasets
Online Nonparametric Anomaly Detection
Theoretical Justification - Asymptotic
Asymptotic Optimality
Anomaly distribution f1(Xt) is the uniform distribution over thesupport of Xt :
H0 : Xt ∼ f0,∀tH1 : Xt ∼ f0, t < τ, and Xt ∼ funi , t ≥ τ
as the training set grows and N2 →∞, Dt → log f1(Xt)f0(Xt)
,
and thus ODIT converges to CUSUM, which is minimax optimum.

Online Nonparametric Anomaly Detection in High-Dimensional Datasets
Online Nonparametric Anomaly Detection
Sketch of the Proof
Build an d-dimensional dynamic histogram by putting each k points in thetraining set in a bin.
As the number of points increases, bin sizes decrease. Hence, theprobability mass in each bin is k/N2, where N2 is the number of all points.
Assuming uniform distribution over bins (which is granted by the Poissonpoint process, however being Poisson is not required by the proof)
probability distribution in each bin is (k/N2)/(vd rk(Xt)d) where vd rk(Xt)
d
is the volume of the hypersphere centered at the point Xt and radiusrk(Xt)
As N2 →∞, the histogram converges to f0, thus(k/N2)/(vd rk(Xt)
d)→ f0(Xt).
Similarly, (k/N2)/(vd rk(X(K))d) approximates a uniform distribution and
as N2 →∞ converges to the uniform distribution over the support of Xt ,where X(K) is the point that corresponds to the baseline statistic L(K) inthe training set.
Online Nonparametric Anomaly Detection in High-Dimensional Datasets
Online Nonparametric Anomaly Detection
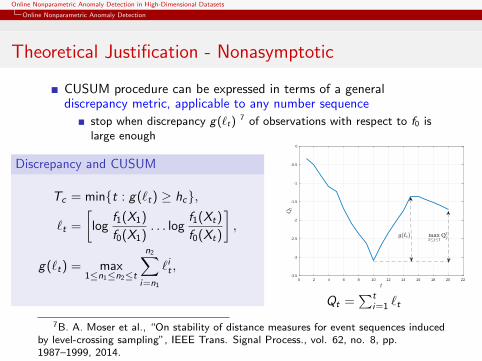
Theoretical Justification - Nonasymptotic
CUSUM procedure can be expressed in terms of a generaldiscrepancy metric, applicable to any number sequence
stop when discrepancy g(`t)7 of observations with respect to f0 is
large enough
Discrepancy and CUSUM
Tc = mint : g(`t) ≥ hc,
`t =
[log
f1(X1)
f0(X1). . . log
f1(Xt)
f0(Xt)
],
g(`t) = max1≤n1≤n2≤t
n2∑i=n1
`it ,0 2 4 6 8 10 12 14 16 18 20 22
t
-3.5
-3
-2.5
-2
-1.5
-1
-0.5
0
Qt
g(`t) max15j5t
Qjt
Qt =∑t
i=1 `t
7B. A. Moser et al., “On stability of distance measures for event sequences inducedby level-crossing sampling”, IEEE Trans. Signal Process., vol. 62, no. 8, pp.1987–1999, 2014.

Online Nonparametric Anomaly Detection in High-Dimensional Datasets
Numerical Results
Numerical Results

Online Nonparametric Anomaly Detection in High-Dimensional Datasets
Numerical Results
Simulations
f0 is a 2D independent Gaussian with zero mean and σ = 0.1f1 = 0.8f0 + 0.2U[0, 1]Training set 10, 000 points (N1 = 1000, N2 = 9000)α = 0.05, k = 1, K = αN1
Parametric clairvoyant CUSUM knows both f0 and f1 exactlyGeneralized CUSUM exactly knows f0, but estimates the uniformdistribution upper bound as 0.9
0 0.5 1 1.5 2 2.5 3 3.5 4
! log10 P (? = H1jH0)
4
4.5
5
5.5
6
6.5
Aver
age
Det
ection
Delay
ODITCUSUMG-CUSUM
Online Nonparametric Anomaly Detection in High-Dimensional Datasets
Numerical Results
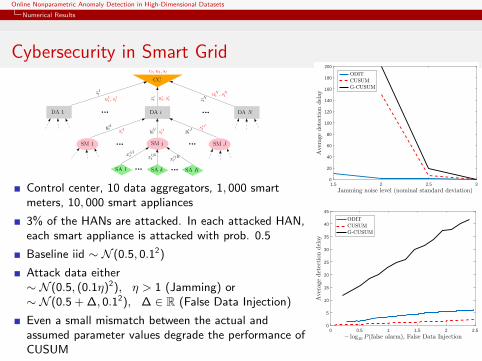
Cybersecurity in Smart GridCC
DA i
SM jSM 1 SM J
DA 1 DA N
xij1t xijkt xijKt
yijtyi1t yiJtsijt
siJtsi1t
uit, situ1t , s
1t
uNt , sNtzit
z1tzNt
vt, ut, st
SA kSA 1 SA K
Control center, 10 data aggregators, 1, 000 smartmeters, 10, 000 smart appliances
3% of the HANs are attacked. In each attacked HAN,each smart appliance is attacked with prob. 0.5
Baseline iid ∼ N (0.5, 0.12)
Attack data either∼ N (0.5, (0.1η)2), η > 1 (Jamming) or∼ N (0.5 + ∆, 0.12), ∆ ∈ R (False Data Injection)
Even a small mismatch between the actual andassumed parameter values degrade the performance ofCUSUM
1.5 2 2.5 3
Jamming noise level (nominal standard deviation)
0
20
40
60
80
100
120
140
160
180
200
Ave
rage
det
ection
delay
ODITCUSUMG-CUSUM
0 0.5 1 1.5 2 2.5
! log10 P (false alarm), False Data Injection
0
5
10
15
20
25
30
35
40
45
Averagedetectiondelay
ODITCUSUMG-CUSUM
Online Nonparametric Anomaly Detection in High-Dimensional Datasets
Numerical Results
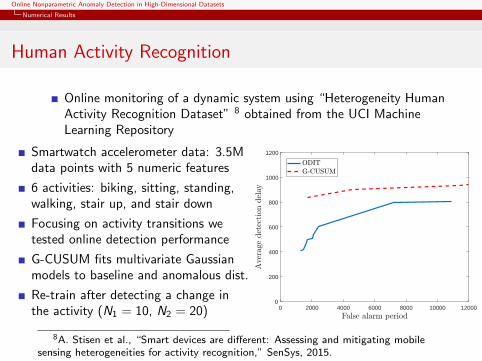
Human Activity Recognition
Online monitoring of a dynamic system using “Heterogeneity HumanActivity Recognition Dataset” 8 obtained from the UCI MachineLearning Repository
Smartwatch accelerometer data: 3.5Mdata points with 5 numeric features
6 activities: biking, sitting, standing,walking, stair up, and stair down
Focusing on activity transitions wetested online detection performance
G-CUSUM fits multivariate Gaussianmodels to baseline and anomalous dist.
Re-train after detecting a change inthe activity (N1 = 10, N2 = 20) 0 2000 4000 6000 8000 10000 12000
False alarm period
0
200
400
600
800
1000
1200
Ave
rage
det
ection
delay
ODITG-CUSUM
8A. Stisen et al., “Smart devices are different: Assessing and mitigating mobilesensing heterogeneities for activity recognition,” SenSys, 2015.

Online Nonparametric Anomaly Detection in High-Dimensional Datasets
Conclusion
Conclusion
Online Nonparametric Anomaly Detection in High-Dimensional Datasets
Conclusion
Conclusions
With the proliferation of IoT devices, and the ease of triggering DoSattacks even from unsophisticated malicious parties, there is anincreasing need for developing scalable and effective solutions.
A novel anomaly detection framework
Scalable: applicable to high-dimensional datasets (big data problems)Nonparametric: agnostic to data-type and protocolOnline system monitoringAsymptotically optimum for testing against uniformly distributedanomalies
Outperforms sequential change detector CUSUM that estimatesparameters from data
Outperforms even clairvoyant CUSUM in case of a small tomoderate variance increase (e.g., Jamming attack)

Online Nonparametric Anomaly Detection in High-Dimensional Datasets
Conclusion
Questions?
Thank you!


![Comparison of Unsupervised Anomaly Detection Techniques · a RapidMiner [10] Extension Anomaly Detection was developed that contains several unsupervised anomaly detection techniques](https://img.pdfslide.net/doc/110x75/5b014b8c7f8b9a952f8e25e8/comparison-of-unsupervised-anomaly-detection-rapidminer-10-extension-anomaly-detection.jpg)


![Anomaly Detection: Principles, Benchmarking, Explanation ...web.engr.oregonstate.edu/~tgd/...anomaly-detection... · Towards a Theory of Anomaly Detection [Siddiqui, et al.; UAI 2016]](https://img.pdfslide.net/doc/110x75/5fd8992320a65f059c333c6d/anomaly-detection-principles-benchmarking-explanation-webengr-tgdanomaly-detection.jpg)