Embed Size (px)
Citation preview

Anomaly Detection
Poul Petersen
BigML
2
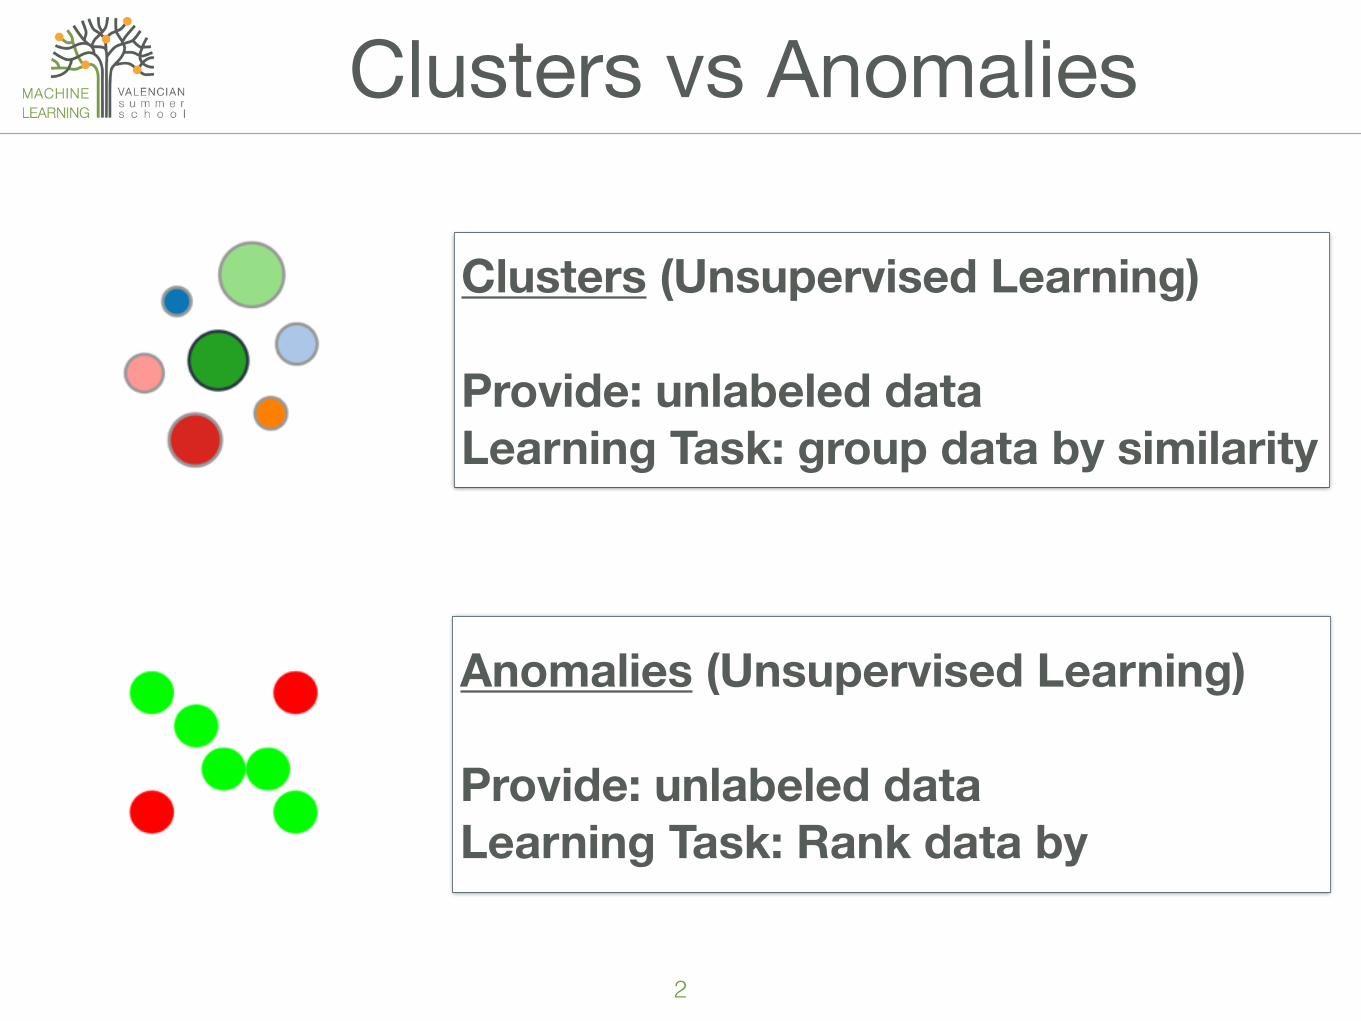
Clusters vs Anomalies
Clusters (Unsupervised Learning)
Provide: unlabeled data Learning Task: group data by similarity
Anomalies (Unsupervised Learning)
Provide: unlabeled data Learning Task: Rank data by

3
Clusters vs Anomalies
sepal length
sepal width
petal length
petal width
5.1 3.5 1.4 0.25.7 2.6 3.5 1.06.7 2.5 5.8 1.8… … … …
Learning Task: Find “k” clusters such that the data in each cluster is self similar
sepal length
sepal width
petal length
petal width
5.1 3.5 1.4 0.25.7 2.6 3.5 1.06.7 2.5 5.8 1.8… … … …
Learning Task: Assign value from 0 (similar) to 1 (dissimilar) to each instance.
4
• Unusual instance discovery
• Intrusion Detection
• Fraud
• Identify Incorrect Data
• Remove Outliers
• Model Competence / Input Data Drift
Use Cases
5
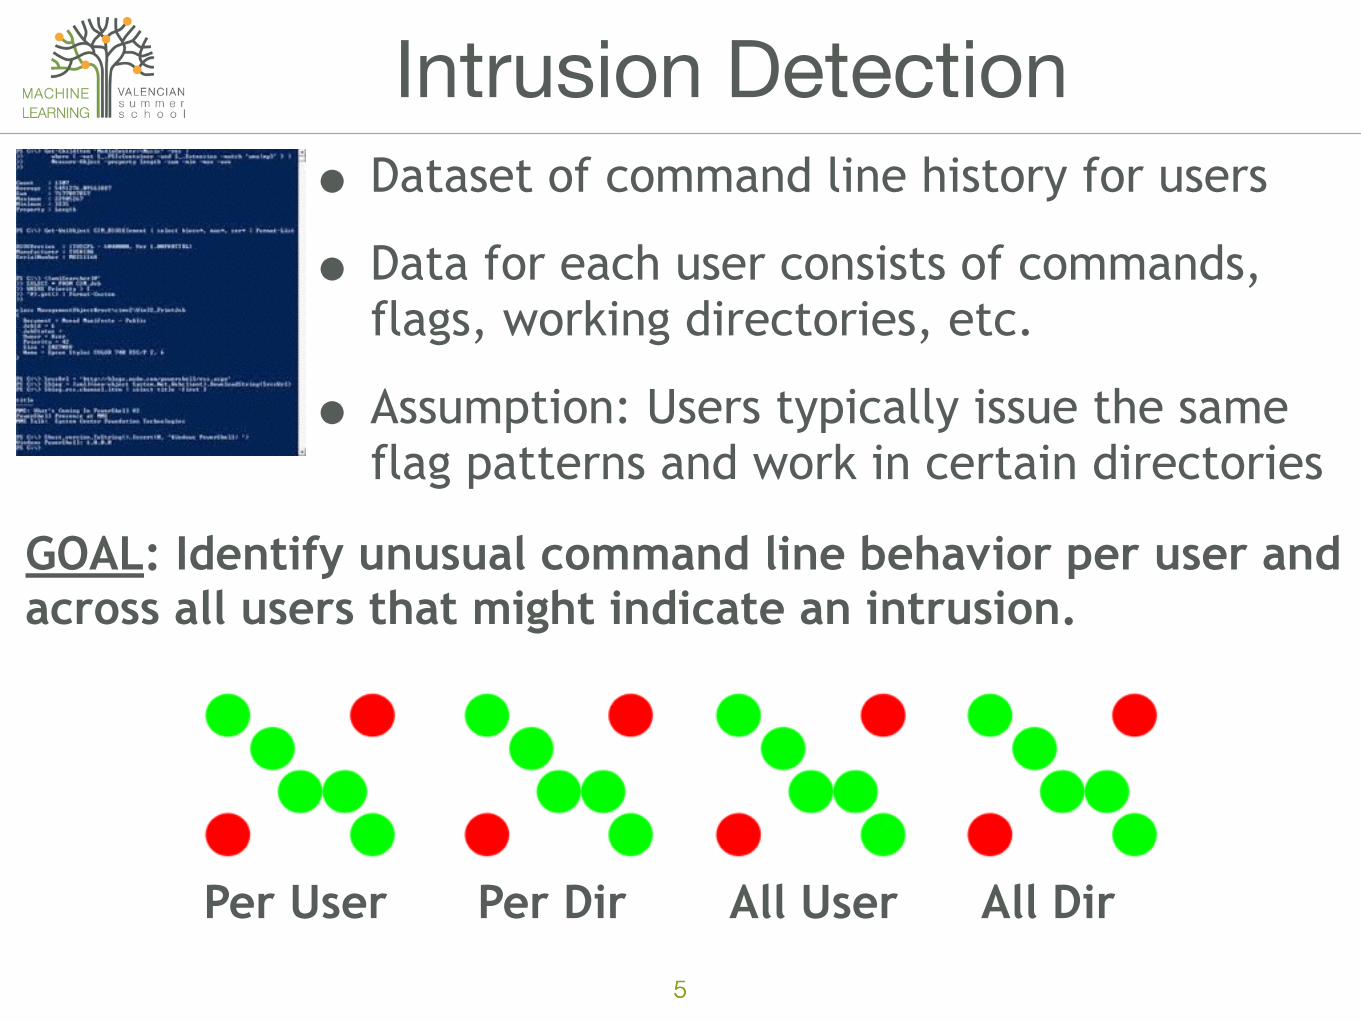
Intrusion Detection
GOAL: Identify unusual command line behavior per user and across all users that might indicate an intrusion.
• Dataset of command line history for users
• Data for each user consists of commands, flags, working directories, etc.
• Assumption: Users typically issue the same flag patterns and work in certain directories
5
Per User Per Dir All User All Dir
6
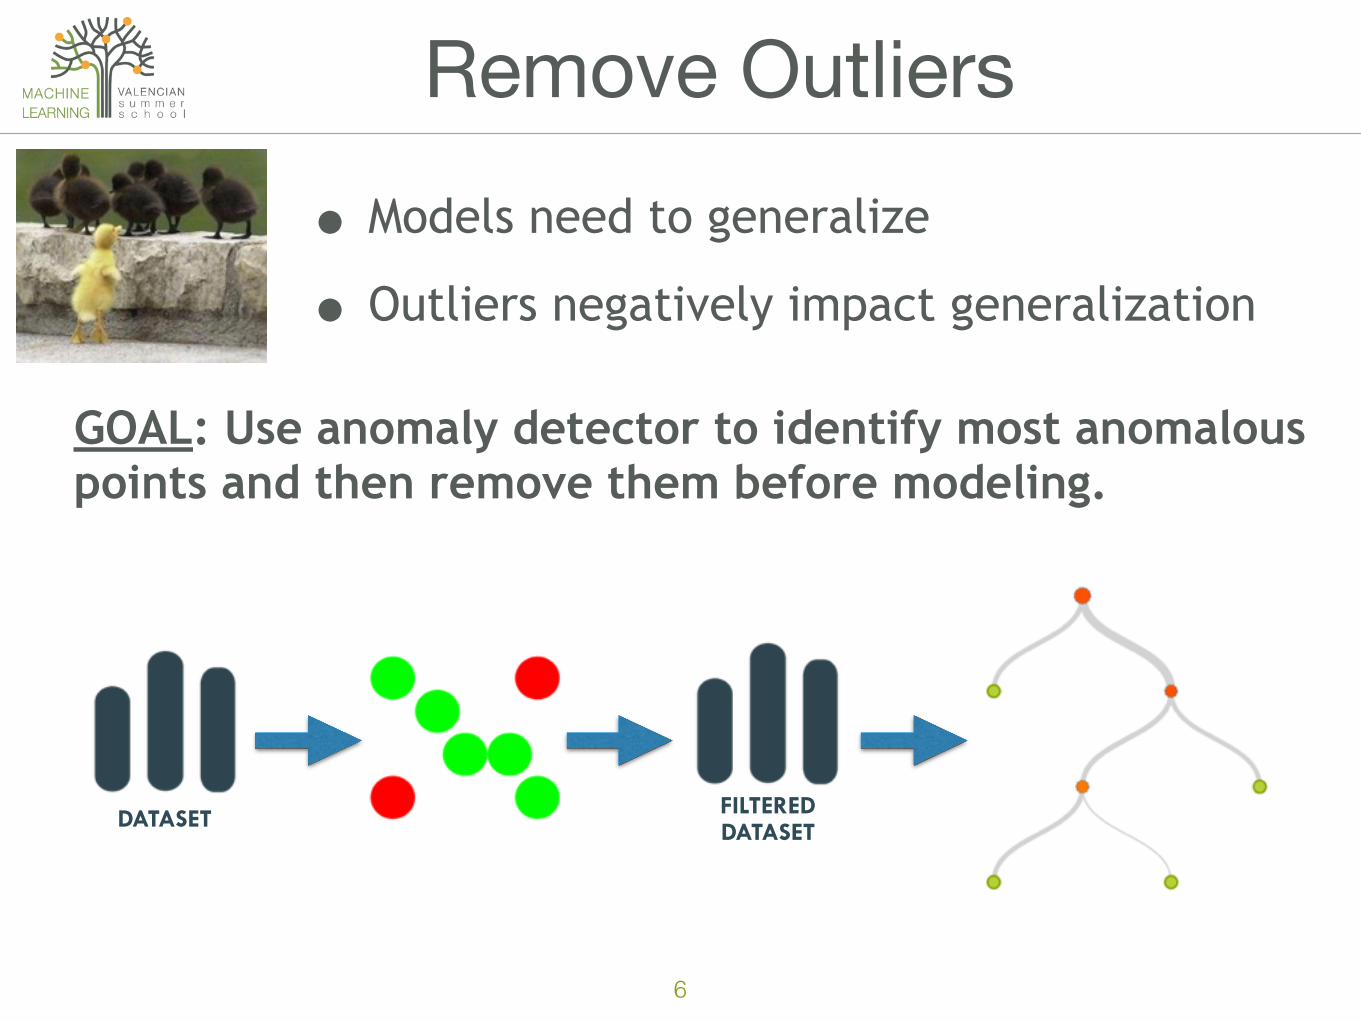
Remove Outliers
• Models need to generalize
• Outliers negatively impact generalization
GOAL: Use anomaly detector to identify most anomalous points and then remove them before modeling.
DATASET FILTERED DATASET

7
Fraud• Dataset of credit card transactions
• Additional user profile information
GOAL: Cluster users by profile and use multiple anomaly scores to detect transactions that are anomalous on multiple levels.
Card Level User Level Similar User Level
8
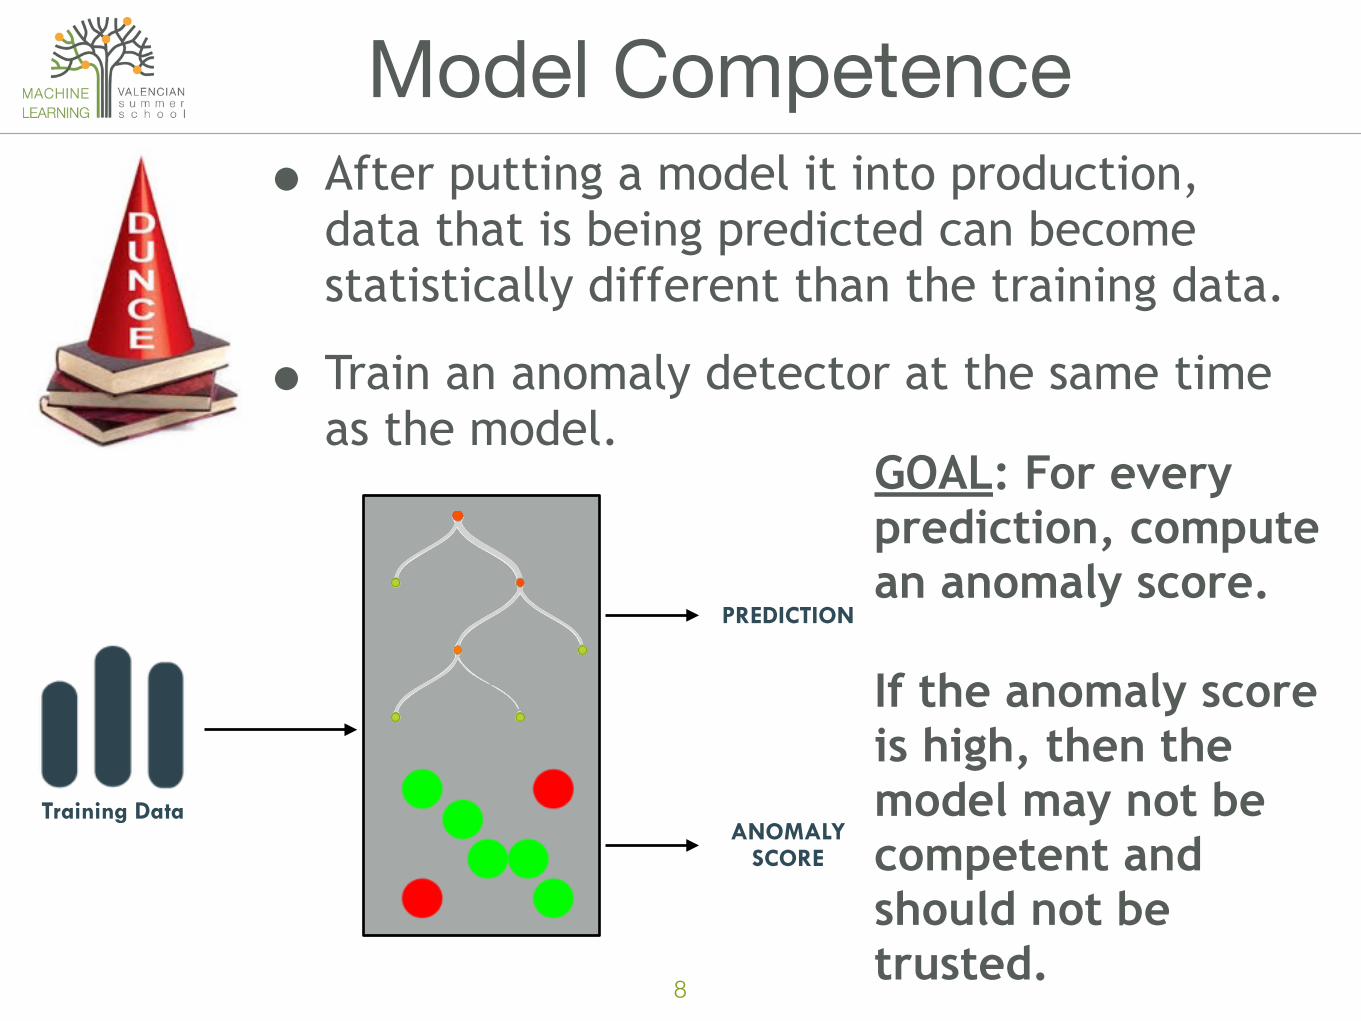
Model Competence
GOAL: For every prediction, compute an anomaly score.
If the anomaly score is high, then the model may not be competent and should not be trusted.
• After putting a model it into production, data that is being predicted can become statistically different than the training data.
• Train an anomaly detector at the same time as the model.
Training Data
PREDICTION
ANOMALY SCORE
9
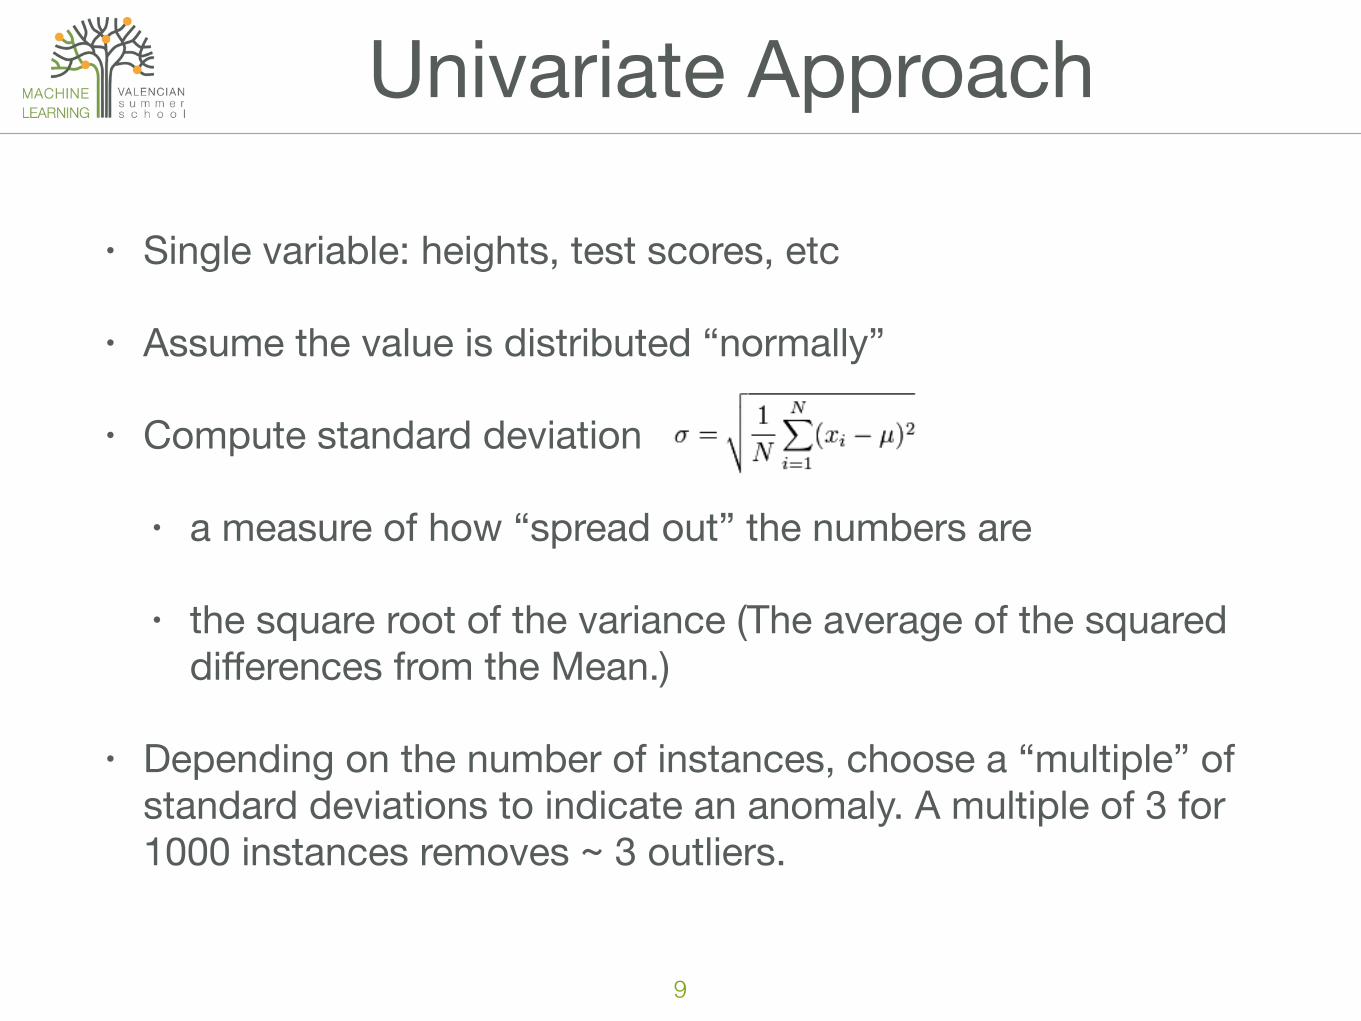
Univariate Approach
• Single variable: heights, test scores, etc
• Assume the value is distributed “normally”
• Compute standard deviation
• a measure of how “spread out” the numbers are
• the square root of the variance (The average of the squared differences from the Mean.)
• Depending on the number of instances, choose a “multiple” of standard deviations to indicate an anomaly. A multiple of 3 for 1000 instances removes ~ 3 outliers.
10
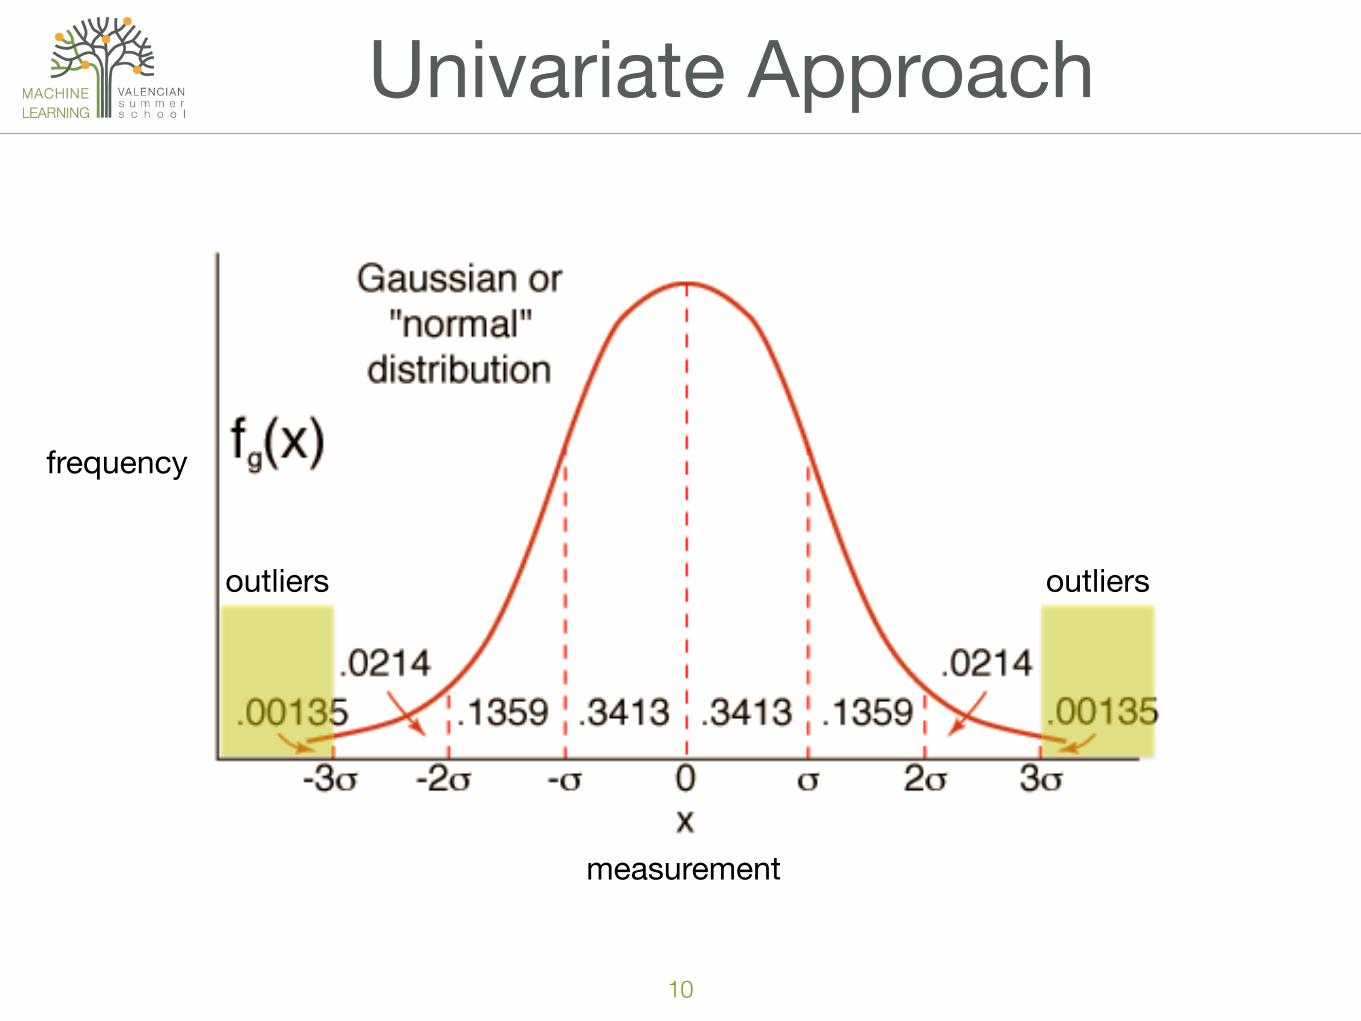
Univariate Approach
measurement
frequency
outliersoutliers
11
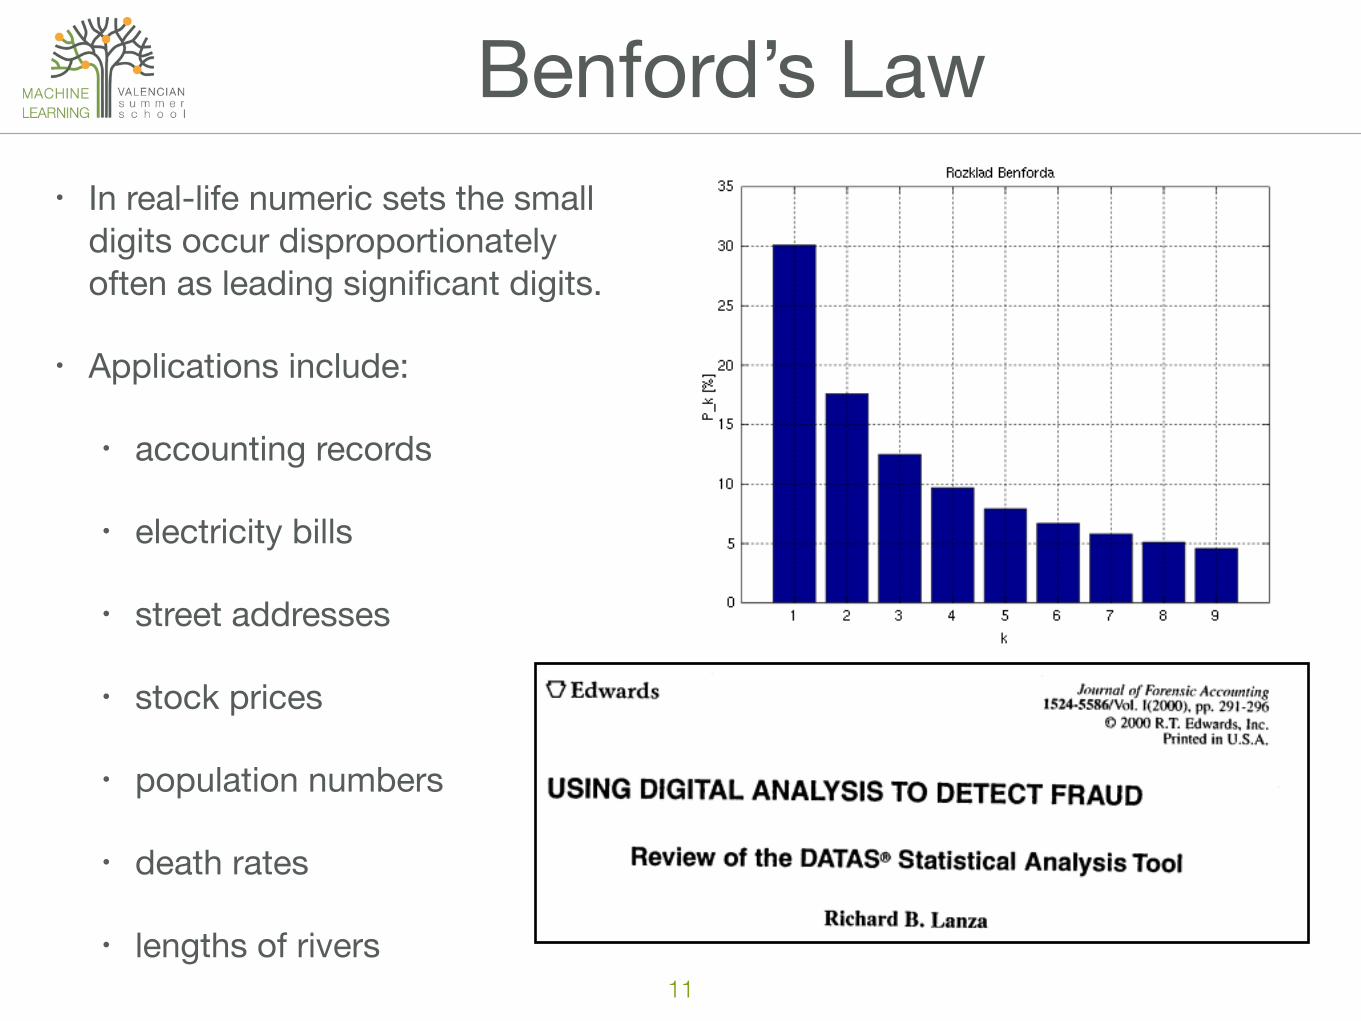
Benford’s Law• In real-life numeric sets the small
digits occur disproportionately often as leading significant digits.
• Applications include:
• accounting records
• electricity bills
• street addresses
• stock prices
• population numbers
• death rates
• lengths of rivers

12
Human Example
Most Unusual?

13
Human Example“Round”“Skinny” “Corners”
“Skinny” but not “smooth”
No “Corners”
Not “Round”
Key InsightThe “most unusual” object
is different in some way fromevery partition of the features.Most unusual
14
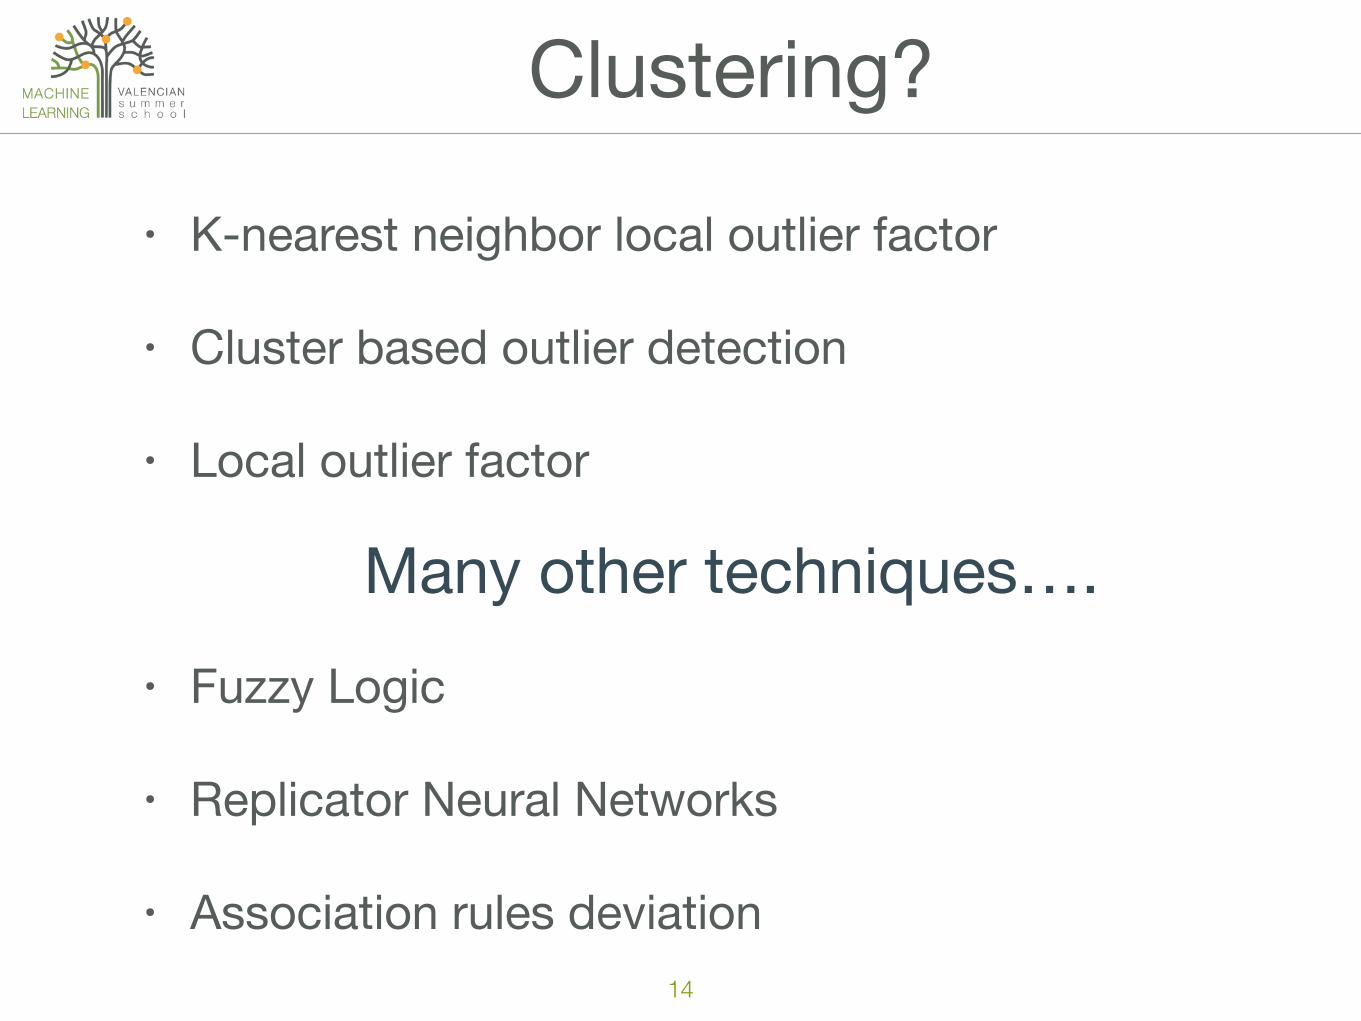
Clustering?
• K-nearest neighbor local outlier factor
• Cluster based outlier detection
• Local outlier factor
Many other techniques….• Fuzzy Logic
• Replicator Neural Networks
• Association rules deviation
15
Human Example
• Human used prior knowledge to select possible features that separated the objects.
• “round”, “skinny”, “smooth”, “corners”
• Items were then separated based on the chosen features
• Each cluster was then examined to see
• which object fit the least well in its cluster
• and did not fit any other cluster
16
Learning from Humans
• Length/Width
• greater than 1 => “skinny”
• equal to 1 => “round”
• less than 1 => invert
• Number of Surfaces
• distinct surfaces require “edges” which have corners
• easier to count
• Smooth - true or false
Create features that capture these object differences
17
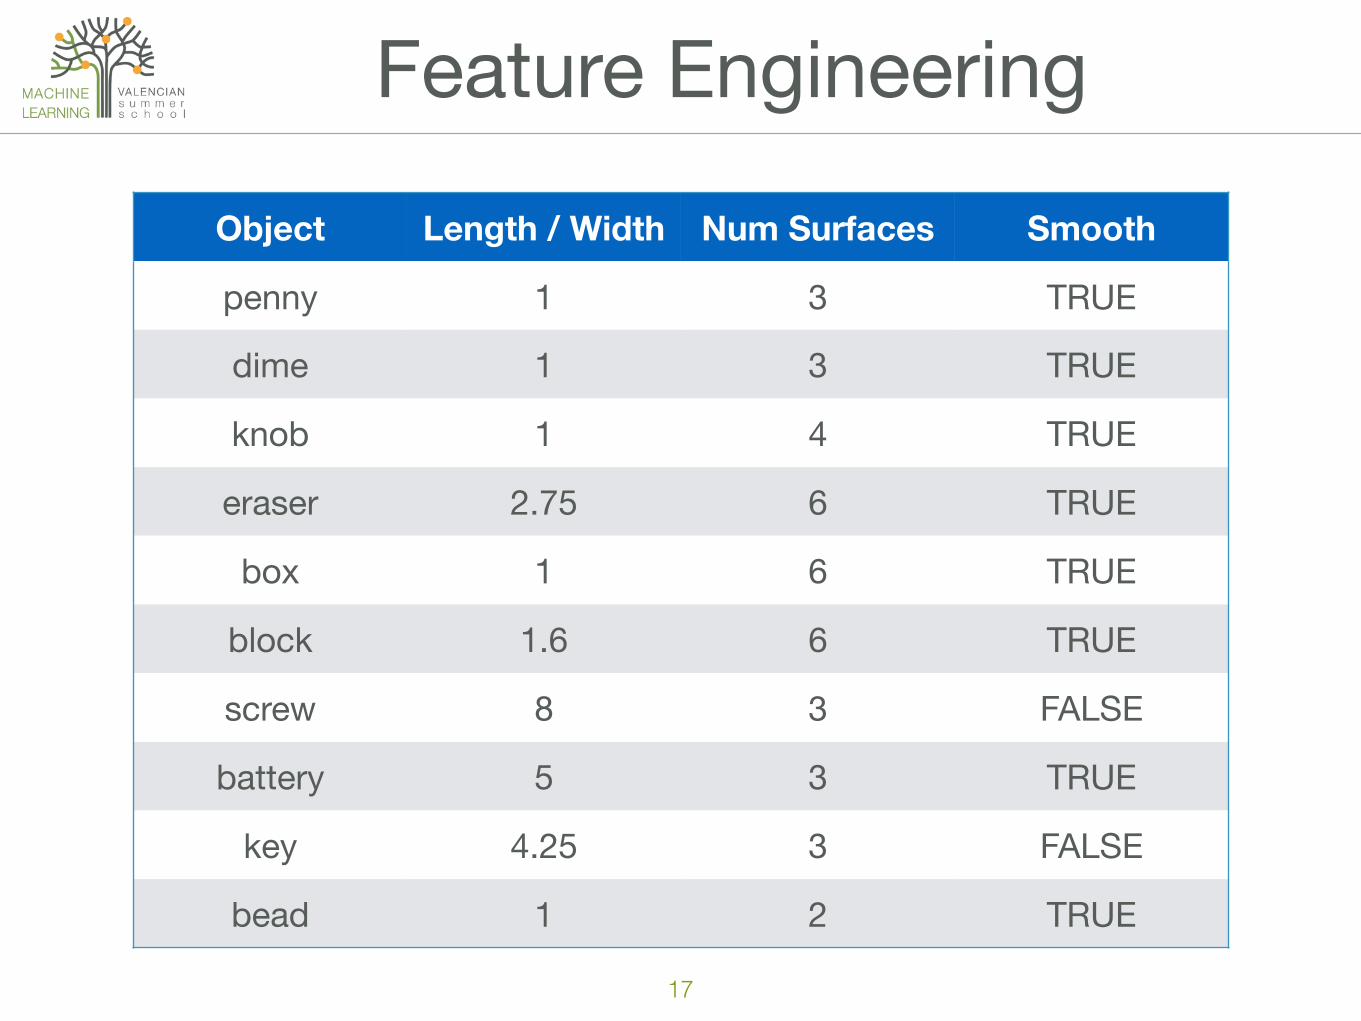
Feature EngineeringObject Length / Width Num Surfaces Smooth
penny 1 3 TRUE
dime 1 3 TRUE
knob 1 4 TRUE
eraser 2.75 6 TRUE
box 1 6 TRUE
block 1.6 6 TRUE
screw 8 3 FALSE
battery 5 3 TRUE
key 4.25 3 FALSE
bead 1 2 TRUE
18
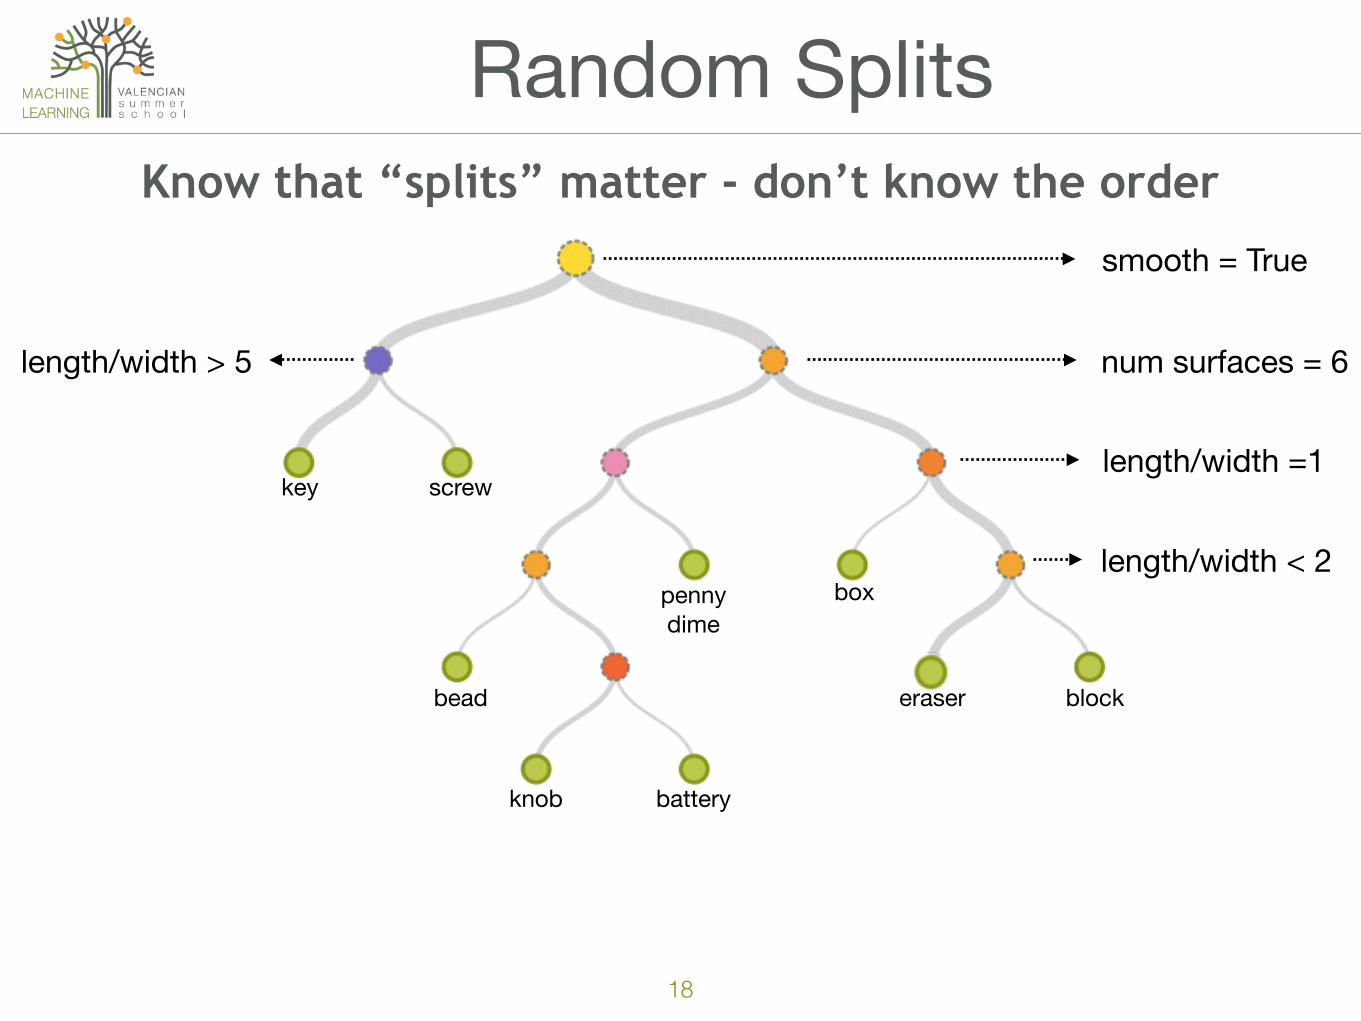
Random Splits
smooth = True
length/width > 5
box
blockeraser
knob
pennydime
bead
key
battery
screw
num surfaces = 6
length/width =1
length/width < 2
Know that “splits” matter - don’t know the order

19
Isolation Forest
Grow a random decision tree until each instance is in its own leaf
“easy” to isolate
“hard” to isolate
Depth
Now repeat the process several times and use average Depth to compute anomaly score: 0 (similar) -> 1 (dissimilar)

20
Isolation Forest Scoring
f_1 f_2 f_3i_1 red cat balli_2 red cat balli_3 red cat boxi_4 blue dog pen
D = 3
D = 6
D = 2
Score

![Anomaly Detection: Principles, Benchmarking, Explanation ...web.engr.oregonstate.edu/~tgd/...anomaly-detection... · Towards a Theory of Anomaly Detection [Siddiqui, et al.; UAI 2016]](https://img.pdfslide.net/doc/110x75/5fd8992320a65f059c333c6d/anomaly-detection-principles-benchmarking-explanation-webengr-tgdanomaly-detection.jpg)
![Comparison of Unsupervised Anomaly Detection Techniques · a RapidMiner [10] Extension Anomaly Detection was developed that contains several unsupervised anomaly detection techniques](https://img.pdfslide.net/doc/110x75/5b014b8c7f8b9a952f8e25e8/comparison-of-unsupervised-anomaly-detection-rapidminer-10-extension-anomaly-detection.jpg)