Embed Size (px)
Citation preview
ZOOLOGICAL RESEARCH
Assessment of habitat suitability of the snow leopard(Panthera uncia) in Qomolangma National NatureReserve based on MaxEnt modeling
De-Feng Bai1,2, Peng-Ju Chen1, Luciano Atzeni1, Lhaba Cering3, Qian Li2, Kun Shi1,4,*
1 Wildlife Institute, School of Nature Conservation, Beijing Forestry University, Beijing 100083, China2 Everest Snow Leopard Conservation Center, Rikaze Xizang 857000, China3 Qomolangma National Nature Reserve Administration, Rikaze Xizang 857000, China4 Eco-Bridge Continental, Beijing 100085, China
ABSTRACT
Habitat evaluation constitutes an important andfundamental step in the management of wildlifepopulations and conservation policy planning.Geographic information system (GIS) and speciespresence data provide the means by which suchevaluation can be done. Maximum Entropy (MaxEnt)is widely used in habitat suitability modeling due to itspower of accuracy and additional descriptive properties.To survey snow leopard populations in Qomolangma(Mt. Everest) National Nature Reserve (QNNR), Xizang(Tibet), China, we pooled 127 pugmarks, 415 scrapemarks, and 127 non-invasive identifications of the animalalong line transects and recorded 87 occurrencesthrough camera traps from 2014–2017. We adopted theMaxEnt model to generate a map highlighting the extentof suitable snow leopard habitat in QNNR. Resultsshowed that the accuracy of the MaxEnt model wasexcellent (mean AUC=0.921). Precipitation in the driestquarter, ruggedness, elevation, maximum temperatureof the warmest month, and annual mean temperaturewere the main environmental factors influencing habitatsuitability for snow leopards, with contribution rates of20.0%, 14.4%, 13.3%, 8.7%, and 8.2% respectively.The suitable habitat area extended for 7 001.93 km2,representing 22.72% of the whole reserve. The regionsbordering Nepal were the main suitable snow leopardhabitats and consisted of three separate habitat patches.Our findings revealed that precipitation, temperatureconditions, ruggedness, and elevations of around 4
000 m a.s.l. influenced snow leopard preferences atthe landscape level in QNNR. We advocate furtherresearch and cooperation with Nepal to evaluatehabitat connectivity and to explore possible proxies ofpopulation isolation among these patches. Furthermore,evaluation of subdivisions within the protection zones ofQNNR is necessary to improve conservation strategiesand enhance protection.
Keywords: Qomolangma National Nature Reserve;Snow leopard; MaxEnt; Habitat suitability assessment;Tibet
INTRODUCTION
Wildlife habitat is defined as the surrounding environment wherewild animals can accomplish their life cycle (Cody, 1987; Jiang etal., 2012). Habitats supply resources for population persistence,representing a determining factor for survival and successfulreproduction (Wang & Chen, 2004; Yang et al., 2000). Thehabitat suitability index (HSI) is a measure of the ability for ahabitat to sustain a species and is an important indicator for thequality of a given habitat (Jin et al., 2008; Lu et al., 2012; Songet al., 2014). Such evaluation constitutes one of the first steps inwildlife protection and management, offering a scientific rationalefor the improvement of conservation policies (Liu et al., 2013).
Received: 01 December 2017; Accepted: 29 March 2018; Online: 24
May 2018
Foundation items: This project was funded primarily by the Everest
Snow Leopard Conservation Center, a partnership initiative of Vanke
Foundation and Qomolangma National Nature Reserve Administration*Corresponding author, E-mail: [email protected]
DOI: 10.24272/j.issn.2095-8137.2018.057
Science Press Zoological Research 39(6): 373–386, 2018 373
The snow leopard (Panthera uncia) is a feline speciesdistributed over 12 countries in Central Asia. It is estimatedthat China contains approximately 60% of the potential habitatavailable to snow leopards, who are reported to reside inthe western provinces of Xinjiang, Xizang (Tibet), Qinghai,Gansu, Sichuan, and Inner Mongolia (McCarthy & Chapron,2003; Riordan & Shi, 2010, 2016). The species is currentlyclassified as Vulnerable by the IUCN (International Union forConservation of Nature and Natural Resources, 2017) andlisted as a Class I protected animal by the China Key List(Riordan & Shi, 2010; Wang, 1998). Snow leopard-orientedresearch spans a diverse range of areas, including abundanceand density (Alexander et al., 2015; Jackson et al., 2006),home range (Johansson et al., 2016), diet (Wang et al., 2014),behavior (Li et al., 2013), genetic diversity (Janecka et al.,2017), climate change impact (Aryal et al., 2014d, 2016),human-snow leopard conflict (Aryal et al., 2014b; Chen et al.,2016), and translocation of prey species (Aryal et al., 2013).
Previous studies on snow leopard habitat use indicate twobroad components determining such selection. First, snowleopard occurrence is predicted by several abiotic factors suchas terrain (slope and aspect) (Sharma et al., 2015; Wolf & Ale,2009), elevation (Alexander et al., 2016a; Aryal et al., 2014c),snow cover (Aryal et al., 2014c), distance from rivers (Aryal etal., 2014c), and annual mean temperature (Li et al., 2013). Thesecond component is represented by biotic factors such as preyavailability (Alexander et al., 2016b; Aryal et al., 2014a; Xu &Luo, 2010) and human activity (Wolf & Ale, 2009). During the1990s, slightly more than 100 snow leopards were estimated toinhabit Qomolangma National Nature Reserve (QNNR). Basedon three brief surveys, Jackson et al. (1994) estimated that“good” habitat totaled approximately 8 000 km2, or about 25%of QNNR’s area. Furthermore, in May–June 2014 and May2015, a preliminary snow leopard presence survey (Chen etal., 2017) and a human-carnivore conflict survey (Chen etal., 2016) were conducted in QNNR, respectively. A morecomprehensive and interdisciplinary study was also conductedto provide an evidential basis for the formulation of effectiveconservation policies and programs (Chen et al., 2017). Basedon the above studies, habitat suitability assessment wasdeemed necessary for a systematic survey of the snow leopardpopulation in QNNR. Several studies have been conductedto estimate the extent of suitable habitat covering the wholesnow leopard range (McCarthy et al., 2016; Hunter & Jackson,1997; Fox, 1994). However, habitat suitability assessment atthe regional level has not yet been reported, resulting in a gapbetween research and local conservation actions.
Recently, with the development of 3S (GIS, RS, GPS)techniques, multiple models have been used to assess suitablehabitat distribution, including mechanism models (Ouyang etal., 2001; Xu et al., 2006), regression models (Schadt etal., 2002), and ecological niche models (Su et al., 2015;Xu & Luo, 2010; Wang et al., 2008; Phillips et al., 2006).The maximum entropy (MaxEnt) model is an ecological nichemodel, which has been increasingly used to assess wildlifehabitat distribution (Clements et al., 2012; Wilting et al., 2010).
MaxEnt models were originally formulated to estimate thepresence density of a target species across a landscape(Phillips et al., 2006), but have since been applied to modelspecies distribution and environmental niches, relying on“presence-only” data and environmental predictors, therebyavoiding bias and leading to accurate results (Merow et al.,2013; Pearson et al., 2007; Phillips et al., 2006). MaxEntmodels are reliable, straightforward, and allow data to be easilyobtained (Merow & Silander, 2014; Phillips & Dudík, 2008;Radosavljevic & Anderson, 2014). These models are suitablefor the prediction of species habitat distribution at the wholereserve level, and an appropriate model for habitat suitabilityanalysis (Haegeman & Etienne, 2010; Stachura-Skierczynskaet al., 2009; Xing & Hao, 2011).
Understanding the distribution of snow leopard habitat inQNNR is important for the improvement of research outcomesand conservation plans. Thus, our study aimed to: (1) assessthe potential habitat distribution for snow leopard in QNNR,along with biotic and abiotic factors of influence using theMaxEnt model; and (2) identify critical areas for snow leopardconservation under the existing functional zones of QNNR.
MATERIALS AND METHODS
Study areaLocated in the southwest Xizang (Tibet) Autonomous Region,China, QNNR (N27◦48′–N29◦19′, E84◦27′–E88◦23′) wasestablished in 1989 to protect wildlife and ecosystems alongthe border of China and Nepal. The reserve covers an areaof 33 814 km2, centering on the world’s highest peak, Mt.Everest. Altitude ranges from 1 440 m to 8 844 m a.s.l.. Theaverage annual temperature is 2.1 ◦C and total annual rainfallis 270.5 mm. Some 81 species of mammals, 342 birds, 29amphibians and reptiles, and 8 fish inhabit the reserve (QNNRAdministration, unpublished). Large mammals include thesnow leopard (Panthera uncia), wolf (Canis lupus), lynx (Lynxlynx), brown bear (Ursus arctos), leopard (Panthera pardus),blue sheep (Pseudois nayaur ), wild ass (Equus kiang),Tibetan gazelle (Procapra piticaudata), and Himalayan tahr(Hemitragus jemlahicus) (Chen et al., 2017). QNNR consistsmainly of two broad ecosystems: that is, semi-humid mountainforest and semi-arid shrub along the southern and northernparts, respectively. Within these, vegetation varies acrossdifferent sub-ecosystems. As altitude increases, 10 distinctsub-ecosystems can be observed progressively, includingsubtropical evergreen broad-leaved forest, subtropicalsemi-green broad-leaved forest, subtropical evergreenconiferous forest, warm temperature green coniferous forest,warm temperature sclerophyllous evergreen broad-leavedforest, subalpine temperature zone evergreen coniferousforest, subalpine temperature zone broad-leaved deciduousforest, alpine sub-frigid zone shrubland and grassland, alpinesub-frigid zone periglacial and alpine snow zone (QNNRAdministration, unpublished). The perpendicular width of eachvertical ecological system ranges from hundreds to thousandsof meters, and each is very sensitive to external environmentchange (QNNR Administration, unpublished). For the different
374 www.zoores.ac.cn

functional zones in QNNR, any disturbance is restricted in thecore zone, scientific research can be conducted in the bufferarea, and some human activity can occur in the experimentalzone.
Model selectionInformation science is the basis of MaxEnt models, which arewidely used in many academic disciplines, as proposed byJaynes (1957a, 1957b) and more recent studies (Jaynes &Bretthorst, 2003; Xing & Hao, 2011). The MaxEnt model isbased upon ecological niche theory, relying on information fromspecies “presence” data to explore the possible distribution ofa target species within a study area. In 2004, MaxEnt softwarewas developed to assess and evaluate suitable habitat fortarget species with good predictive power (Phillips et al., 2006).Occupancy models and generalized linear models (GLM) arealso used to explore the relationship between species habitatselection and environmental factors (Alexander et al., 2015;MacKenzie et al., 2006; Wang et al., 2018). However, GLMand occupancy models exhibit similar limitations, such as theneed for presence/absence or detection/non-detection data,which can introduce difficulties when an expansive study areais needed to detect rare species like snow leopards (Alexanderet al., 2016a; MacKenzie et al., 2006). The MaxEnt modelprovides a self-checking function with automatically generatedreceiver operating characteristic (ROC) curves. Furthermore,to understand the regional level habitat distribution of snowleopards in QNNR, presence records are more likely to beaccessible, and thus the MaxEnt model has an advantageover other types of models (Su et al., 2015; Liu et al., 2013).Therefore, the MaxEnt model was selected in this study toexplore the potential suitable habitat of snow leopards inQNNR.
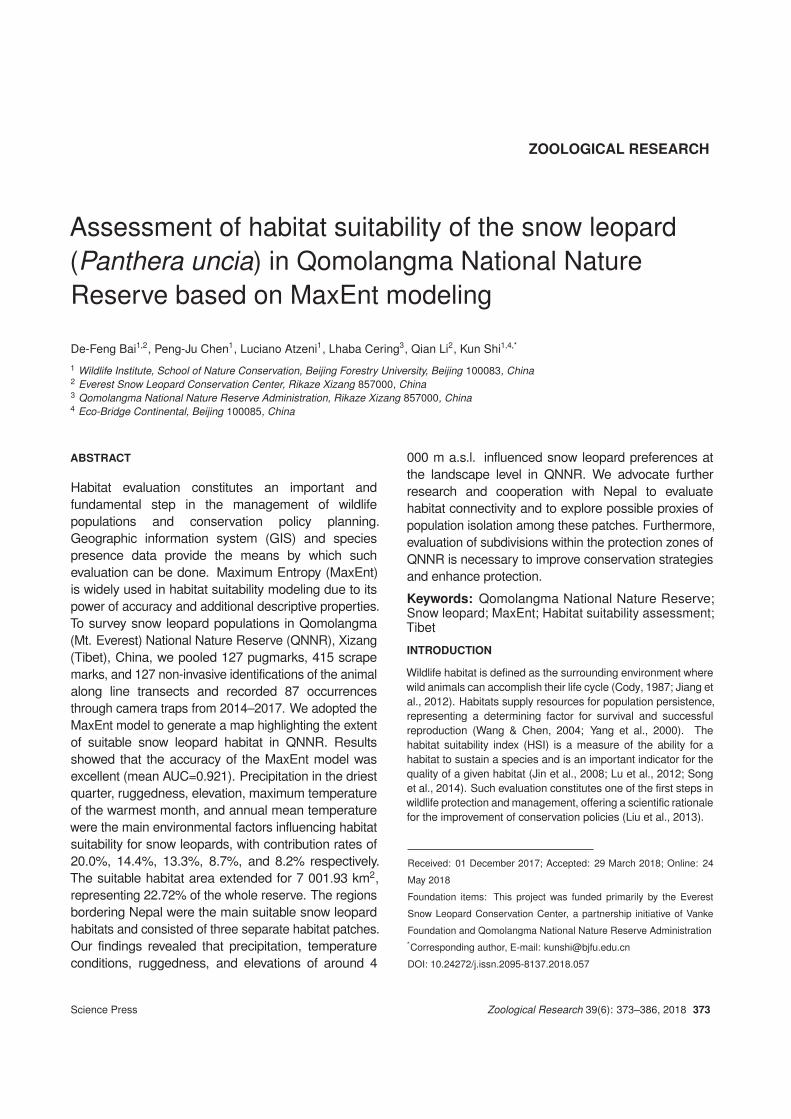
Snow leopard “presence” dataIn 2014, a preliminary survey was conducted in four areas with33 camera traps around the villages of Zhalong (Jilong County),Dacang (Dingjie County), Riwu and Qudang (Dingri County)(Chen et al., 2017). Other study areas were later selectedto estimate snow leopard abundance and density with highintensity. Our study area was divided into several 4 km×4 kmgrids. We selected sampling transects and camera locationsaccording to our knowledge of the ecological requirementsof snow leopards and the experience of our local guide tomaximize the detectability of animals in each grid. In 2015,following the preliminary survey, we selected Zhalong (JilongCounty) and Qudang (Dingri County) as study areas. In total,83 and 23 camera traps (Ltl Acorn) were systematically setup over 400 km2 in the Zhalong study area and 208 km2 inthe Qudang study area between October and November 2015,respectively. In summer 2016 (April to May), 112 camera traps(Ltl Acorn) were set up over 480 km2 in the Zhalong study area.In winter 2016, an additional 68 camera trap sites were set upover 790 km2 in another part of the Jilong study area. In winter2017, a snow leopard survey was conducted over 750 km2 inthe Zhaxizong study area (Dingri County). We recorded snowleopard signs (scats, tracks, scent marks, scrapes, bedding,
and hair) along the most likely routes (ridgelines, hillsides,prey resource-rich places, and higher rugged places). Camerastations were placed with a minimum spacing of 1 km tomaximize the number of individuals caught and adequatelyrecapture individuals at different camera traps (Alexander etal., 2015). We placed two cameras in each site to capture bothsides of the animal (Jackson et al., 2006). Within each grid, twoor more camera stations were established. The Zhalong studyarea (Jilong County) was expanded from 400 km2 in 2015 to790 km2 in 2016. The transects used in 2015 were fixed forlater surveys, but camera trap sites were not (Figure 1).
For non-invasive genetics, we collected samples thatbelonged to snow leopards along transects to set up cameratraps. The selection of feces was based upon shape, haircontent, and terrain type or was found in association withother marking signs particular to this species. We collectedscat samples using silica gel drying agent (Boitani & Powell,2012; Wasser et al., 1997). In the field, tubes containingsilica desiccant were stored away from light in a dry and coolenvironment and were immediately stored at −20 ◦C afterarrival at the laboratory. DNA from scat samples was extractedusing a QIAamp DNA Stool Mini Kit (Qiagen, USA) followinga modified extraction protocol under a dedicated UV-lightlaminar flow cabinet, physically separated by the pre-PCRarea. Each batch of extracted samples was processed alongwith a negative control to account for possible contamination,with results screened on 1% agarose gel. Speciesidentification was initially conducted through amplification ofa 110 base pairs-portion of the cyt b (cyt b) gene usingcarnivore-specific primers, as described in Farrell et al. (2000)(forward: 5′-TATTCTTTATCTGCCTATACATACACG-3′; reverse:5′-AAACTGCAGCCCCTCAGAATGATATTTGTCCTCA-3′). PCRanalysis was conducted under a dedicated UV-sterilizedlaminar flow hood using Premix Taq (Ex Taq Version 2.0; TakaraBiotechnology) to a final volume of 20 μL containing 0.2 mmol/Lof each dNTP, 2 mmol/L of Mg2+, 0.4 μmol/L of each primer, 7.4μL of DNAase/RNAase-free ultrapure water (Tiangen Biotech,Beijing), and 1 μL of extracted DNA. PCR conditions consistedof an initial denaturation step of 10 min at 94 ◦C, 35 cycles at 94◦C for 30 s, 57 ◦C for 45 s, and 72 ◦C for 45 s, followed by a finalelongation step at 72 ◦C for 10 min. All amplifications includedone positive snow leopard reference sample and a blankcontrol to account for contamination. Results were screenedby 1% agarose gel electrophoresis. Successful PCR productswere sequenced through an Applied Biosystems ABI 3730XLsystem by SinoGenoMax Limited Company (Beijing, China).Readings were assembled in Geneious 10.1 (Biomatters Ltd.)and matched against the NCBI database using BLAST toobtain the percentage of similarity. Only completely assembledsequences were considered for the dataset. Samples yieldingincomplete assemblies, along with unsuccessful PCRs for cytb and non-carnivore species identifications, were re-screenedtargeting a 126 base pairs-portion of the ATP6 gene using thecarnivore-specific primers described in Chaves et al. (2012)(DF3: 5′-AACGAAAATCTATTCGCCTCT-3′; DR1: 5′-CCAGTATTTGTTTTGATGTTAGTTG-3′). The primers described in
Zoological Research 39(6): 373–386, 2018 375

Farrell et al. (2000) were used to target prey species DNA(Chaves et al., 2012). PCR volumes were identical to the
protocol used for cyt b, as were the PCR conditions, exceptfor the annealing temperature (51 ◦C for 45 s).
400 m Contour
16 km2 grid cell
-306 - 1800 m
1800 - 2800 m
2800 - 4200 m
4200 - 5000 m
5000 - 8648 m
400 m Contour
16 km2 grid cell
-306 - 1800 m
1800 - 2800 m
2800 - 4200 m
4200 - 5000 m
5000 - 8648 m
400 m Contour
16 km2 grid cell
-306 - 1800 m
1800 - 2800 m
2800 - 4200 m
4200 - 5000 m
5000 - 8613 m
400 m Contour
16 km2 grid cell
-306 - 1800 m
1800 - 2800 m
2800 - 4200 m
4200 - 5000 m
5000 - 8613 m
Camera trap positions
Elevation<VALUE>
Camera trap positions
Elevation<VALUE>
Camera trap positions
Elevation
<VALUE>
Camera trap positions
Elevation
<VALUE>
Figure 1 Location of camera traps for snow leopard surveys in Qomolangma National Nature Reserve, Xizang (Tibet)
A: Qudang Study Area, Dingri County, winter 2015. B: Zhalong Study Area, Jilong County, winter 2015. C: Zhalong Study Area, Jilong County, summer 2016. D:
Zhalong Study Area, Jilong County, winter 2016.
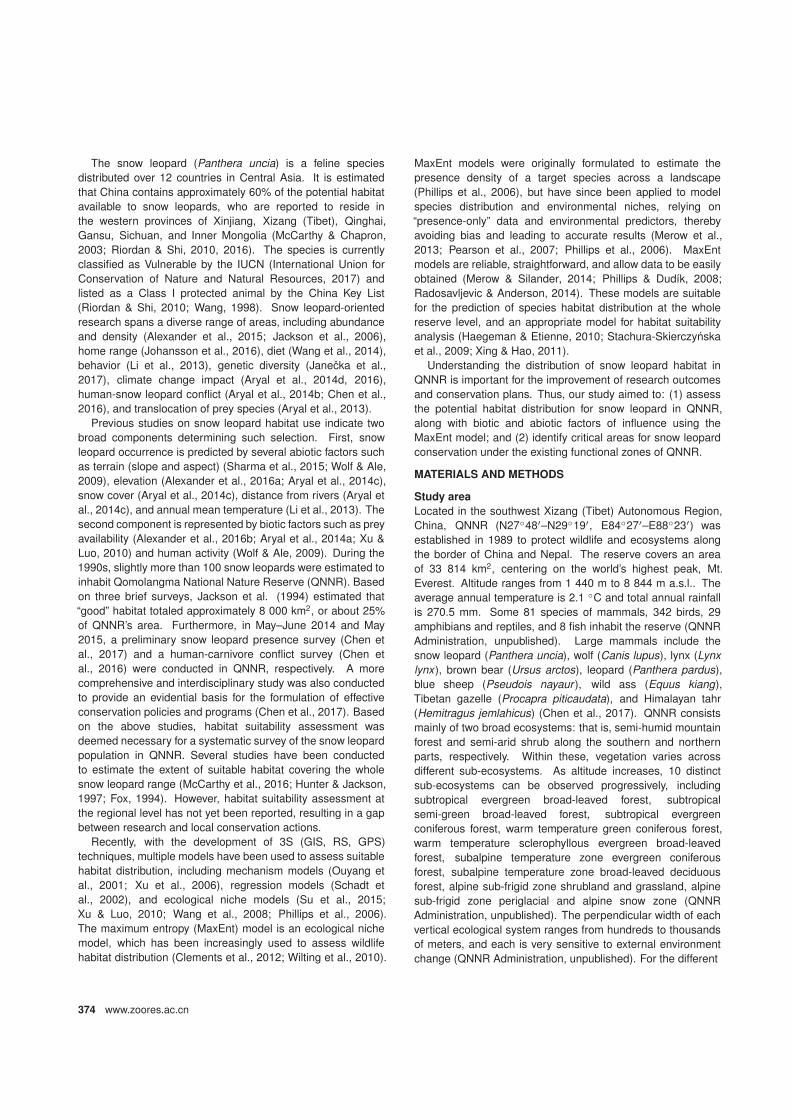
Feces, scent marks, and killings could be attributed tocarnivores other than snow leopards; however, pugmarks andscrapes are easily recognized. Therefore, pugmarks, scrapes,and feces identified as belonging to snow leopards wereselected to create a suitable habitat distribution simulation inQNNR (Jackson & Hunter, 1996; Janecka et al., 2008). Weused 1-km2 grid cells for the MaxEnt niche-based modeling(Phillips et al., 2006). One snow leopard presence per cellwas used and repeated location data were removed. A totalof 222 GPS snow leopard presence points were included forfurther analysis. However, due to the higher number of fieldstudies in the Jilong area, records were heavily geographicallyunbalanced, with the Jilong area containing more than 50% ofall records. We thus further reduced the number of recordsin the Jilong area by randomly selecting records to produce
the same survey effort as outside the Jilong area. As only 59records were included for analysis outside the Jilong area (eastQNNR), we only included 59 records from the Jilong area (westQNNR).
Environment variablesWe tested the relationship of snow leopard presence datawith possible influencing factors. We identified two maincategories related to suitable habitat distribution, namelyabiotic factors (elevation, slope, aspect, ruggedness, landuse type, and distance factors) and bioclimatic and bioticfactors (prey species, human related factors) (Alexander et al.,2016a, 2016b; Sharma et al., 2015). We selected elevation,slope, aspect, ruggedness, land use type, and bioclimaticfactors for landscape level analysis. We used snow leopardpresence points and extracted 19 bioclimatic variables of our
376 www.zoores.ac.cn
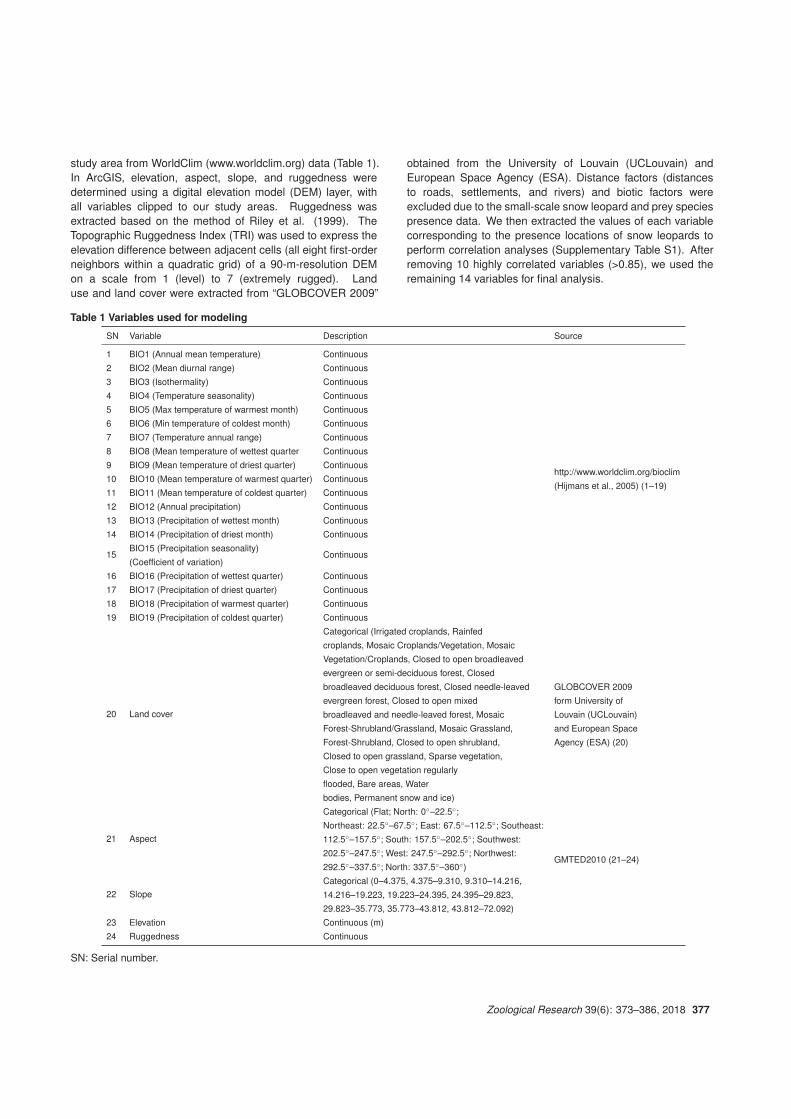
study area from WorldClim (www.worldclim.org) data (Table 1).In ArcGIS, elevation, aspect, slope, and ruggedness weredetermined using a digital elevation model (DEM) layer, withall variables clipped to our study areas. Ruggedness wasextracted based on the method of Riley et al. (1999). TheTopographic Ruggedness Index (TRI) was used to express theelevation difference between adjacent cells (all eight first-orderneighbors within a quadratic grid) of a 90-m-resolution DEMon a scale from 1 (level) to 7 (extremely rugged). Landuse and land cover were extracted from “GLOBCOVER 2009”
obtained from the University of Louvain (UCLouvain) andEuropean Space Agency (ESA). Distance factors (distancesto roads, settlements, and rivers) and biotic factors wereexcluded due to the small-scale snow leopard and prey speciespresence data. We then extracted the values of each variablecorresponding to the presence locations of snow leopards toperform correlation analyses (Supplementary Table S1). Afterremoving 10 highly correlated variables (>0.85), we used theremaining 14 variables for final analysis.
Table 1 Variables used for modeling
SN Variable Description Source
1 BIO1 (Annual mean temperature) Continuous
http://www.worldclim.org/bioclim
(Hijmans et al., 2005) (1–19)
2 BIO2 (Mean diurnal range) Continuous
3 BIO3 (Isothermality) Continuous
4 BIO4 (Temperature seasonality) Continuous
5 BIO5 (Max temperature of warmest month) Continuous
6 BIO6 (Min temperature of coldest month) Continuous
7 BIO7 (Temperature annual range) Continuous
8 BIO8 (Mean temperature of wettest quarter Continuous
9 BIO9 (Mean temperature of driest quarter) Continuous
10 BIO10 (Mean temperature of warmest quarter) Continuous
11 BIO11 (Mean temperature of coldest quarter) Continuous
12 BIO12 (Annual precipitation) Continuous
13 BIO13 (Precipitation of wettest month) Continuous
14 BIO14 (Precipitation of driest month) Continuous
15BIO15 (Precipitation seasonality)
(Coefficient of variation)Continuous
16 BIO16 (Precipitation of wettest quarter) Continuous
17 BIO17 (Precipitation of driest quarter) Continuous
18 BIO18 (Precipitation of warmest quarter) Continuous
19 BIO19 (Precipitation of coldest quarter) Continuous
20 Land cover
Categorical (Irrigated croplands, Rainfed
croplands, Mosaic Croplands/Vegetation, Mosaic
Vegetation/Croplands, Closed to open broadleaved
evergreen or semi-deciduous forest, Closed
broadleaved deciduous forest, Closed needle-leaved
evergreen forest, Closed to open mixed
broadleaved and needle-leaved forest, Mosaic
Forest-Shrubland/Grassland, Mosaic Grassland,
Forest-Shrubland, Closed to open shrubland,
Closed to open grassland, Sparse vegetation,
Close to open vegetation regularly
flooded, Bare areas, Water
bodies, Permanent snow and ice)
GLOBCOVER 2009
form University of
Louvain (UCLouvain)
and European Space
Agency (ESA) (20)
21 Aspect
Categorical (Flat; North: 0◦–22.5◦;
Northeast: 22.5◦–67.5◦; East: 67.5◦–112.5◦; Southeast:
112.5◦–157.5◦; South: 157.5◦–202.5◦; Southwest:
202.5◦–247.5◦; West: 247.5◦–292.5◦; Northwest:
292.5◦–337.5◦; North: 337.5◦–360◦)GMTED2010 (21–24)
22 SlopeCategorical (0–4.375, 4.375–9.310, 9.310–14.216,
14.216–19.223, 19.223–24.395, 24.395–29.823,
29.823–35.773, 35.773–43.812, 43.812–72.092)
23 Elevation Continuous (m)
24 Ruggedness Continuous
SN: Serial number.
Zoological Research 39(6): 373–386, 2018 377

Simulation procedureSnow leopard presence data and selected variables wereadapted to the format required for MaxEnt software (v 3.3.3k)(Phillips et al., 2006). We selected 75% of snow leopardpresence data to build the model, with the remaining 25% usedfor model verification. We included 10 replicates in our analysis.We used a jackknife estimator to detect the importance of eachvariable. Sensitivity analysis was done for each variable withlogistic output format. Results of the MaxEnt model wereverified by ROC values: that is, rejected with a ROC value0.5–0.6; poor with 0.6–0.7; normal with 0.7–0.8; good with0.8–0.9; and excellent with 0.9–1.0. According to the expertexperience method (Swets, 1988), the output results were usedin ArcGIS 10.2 to reclassify the suitable snow leopard habitatdistribution map. Using the MaxEnt model to evaluate habitatsuitability in QNNR, the ASCII format file was imported intoArcGIS 10.2 for transformation into floating raster data. Thefloating raster was reclassified into low grade habitat (0–0.14),moderately suitable habitat (0.14–0.42), and highly suitablehabitat (0.42–1). Focal statistics in ArcGIS were used tosmooth the raster map to obtain the suitable snow leopardhabitat distribution map in QNNR.
RESULTS
Snow leopard presence data recordsIn 2014, we recorded five snow leopard pugmark sites and 65scrape sites, and 17 camera trap sites captured snow leopardphotographs. In winter 2015, we recorded 38 pugmark sites,111 scrape sites, and 27 camera trap sites with photographs. Insummer 2016, we recorded 35 pugmark sites, 131 scrape sites,and 44 camera trap sites with photographs. In winter 2016, werecorded 39 pugmark sites, 73 scrape sites, and 32 cameratrap sites with photographs. In winter 2017, we recorded 10pugmark sites and 35 scrape sites.
We collected a total of 52, 84, 135, and 72 fecal samples insummer 2014, winter 2015, summer 2016, and winter 2016,respectively. In 2014, we positively identified 29 samplesthrough cyt b, 21 of which belonged to snow leopards. The 23unsuccessful samples, including two incomplete assemblies,produced 15 snow leopard identifications through the ATP6gene. In total, we identified 84% of samples (44), withsnow leopard identifications accounting for 69% of the total(36). Of the 86 samples collected in winter 2015, 43 werepositively identified as a carnivore species using cyt b, ofwhich 14 samples belonged to snow leopard. The remaining43 were screened using the ATP6 gene; however, out ofthe positive PCRs, identification was only possible for onesample, which belonged to a snow leopard. In total, forsamples collected in 2015, we identified 44 samples (51%),15 of which were snow leopards (17% of total). Speciesidentification of the 135 samples collected in spring 2016yielded 71 assembled predator species identifications, 23of which were snow leopards. Out of the 64 samplesselected for a second amplification, 55 failed to amplify, fivebelonged to blue sheep (Pseudois nayaur ), one to yak (Bosgrunniens), and three were partial assemblies belonging to
a carnivore species (either forward or reverse strand). Wethen amplified 64 samples for the ATP6 gene, yielding 31positive carnivore identifications, with 26 belonging to snowleopards. In summary, 102 samples (75.5%) were successfullyidentified, with snow leopards representing 36.2% of the total(49 identifications). For winter 2016, we identified 24 carnivoresout of 72 samples through cyt b, 11 of which were identified assnow leopard. The remaining 48, amplified through the ATP6gene, yielded 19 carnivores, with snow leopards identified 16times. In total, we identified 43 carnivores in 43 occasions(60% of total), and snow leopards represented 37.5% of totalfecal samples. Pooling all samples together over the four fieldseasons, we collected 345 fecal samples and identified 233(66%) as belonging to a predator species. Snow leopards wereidentified 127 times, representing 36.8% of the total collectedscats and 54.5% of the successful identifications. Results aresummarized in Table 2.
Table 2 Identification results from molecular scatology
Field Season Scats Cyt b+ ATP6+ SLs Failed
Summer 2014 52 29 15 36 8
Winter 2015 84 43 1 15 42
Summer 2016 135 71 31 49 33
Winter 2016 72 24 19 27 29
Total 343 167 66 127 112
Cyt b+ and ATP6+ indicate success of identification using the two
markers. SLs: Snow leopards.
In total, 127 pugmark sites, 415 scrape sites, and 127 molecularidentifications of snow leopard were recorded. In addition, 120camera trap sites captured snow leopard images (Figure 2).
MaxEnt prediction evaluationThe ROC results (Figure 3) showed a mean AUC value of0.921, indicating that the predictions obtained from the MaxEntmodel were excellent.
Suitable snow leopard habitat distribution withenvironment factorsAccording to the suitable habitat distribution map, wedetermined that suitable habitat was located mainly alongmountain areas near the Nepalese border. We identified threedistinct separated patches: (1) Zhalong and Gongdan areasin Jilong county; (2) Chabuling area in Nielamu county andRongxia area in Dingri county; and, (3) Qudang area andperimeter zone in Dingri county.
The jackknife estimator results (Figure 4; Table 3) showedthat precipitation in the driest quarter (BIO17; 20.0%),ruggedness (14.4%), elevation (13.3%), maximum temperatureof the warmest month (BIO5; 8.7%), and annual meantemperature (BIO1; 8.2%) were the main factors contributingto snow leopard habitat selection. The importance rates in theMaxEnt model prediction indicated that ruggedness (34.4%),mean diurnal range (BIO2; 16.9%), maximum temperatureof the warmest month (BIO5; 11.3%), annual precipitation(BIO12; 8.8%), and precipitation in the driest quarter (BIO17;
378 www.zoores.ac.cn

7.9%) were the five main factors affecting snow leopard habitatpreferences (Table 3; Table 4).
Sensitivity analysis determined the influence of each factoron snow leopard habitat distribution (Figure 5). The altitude inareas suitable for snow leopard habitat was between 3 900 m
and 5 000 m a.s.l.. The ruggedness range most suitablefor snow leopards was between 1 000 m and 1 300 m a.s.l.where the terrain was extremely rugged. Consequently, snowleopards preferred to use more rugged terrain at elevations ofaround 4 000 m a.s.l..
Figure 2 Snow leopard presence data collected in QNNR
Average sensitivity vs.1 - specificity for snow leopard
1.0
0.9
0.8
0.7
0.6
0.5
0.4
0.3
0.2
0.1
0.0
Sen
sitiv
ity (1
- om
issi
on ra
te)
1 - Specificity (fractionsl predicated area)0.0 0.1 0.2 0.3 0.4 0.5 0.6 0.7 0.8 0.9 1.0
Mean (AUC = 0.921)Mean ± SD
Random prediction
Figure 3 ROC verification of distribution of suitable snow leopard habitat in QNNR
Zoological Research 39(6): 373–386, 2018 379

Jackknife of regularized training gain for snow leopardWithout variable
With only variableWith all variables
Aspect
Bio_1
Bio_12
Bio_13
Bio_14
Bio_17
Bio_2
Bio_3
Bio_5
Bio_6
Elevation
Landcover
Ruggedness
Slope
0.0 0.2 0.4 0.6 0.8 1.0 1.2 1.4Regularized training gain
Env
ironm
enta
l var
iabl
e
Figure 4 Jackknife test of environmental variables in training data by MaxEnt
Distribution of suitable snow leopard habitat in QNNR
From the reclassified map, the area of each habitat class(low grade habitat, moderately suitable habitat, and highlysuitable habitat) was calculated. The area of highly suitablehabitat in QNNR was 1 756.55 km2, moderately suitable habitatwas 5 245.38 km2, and low-grade habitat was 23 814.05km2. Thus, the area of relatively good snow leopard habitattotaled 7 001.93 km2 in QNNR, accounting for 22.72% of theoverall area of QNNR (Figure 6). According to the existingfunctional zones (core, experimental, and buffer zones) ofQNNR (Figure 7), only 23.24% (1 627.52 km2/7 001.93 km2)of good habitat lies in the core zone, 36.06% (2 525.22km2/7 001.93 km2) lies in the buffer zone, and 40.52%(2 837.40 km2/7 001.93 km2) lies in the experimental zone.
Table 3 Contribution and permutation importance values of
environmental variables
Environmental variables Contribution (%) Permutation importance (%)
Aspect 1.3141 1.38
BIO1 8.1786 0.4244
BIO12 6.8994 8.8319
BIO13 4.214 2.6905
BIO14 0.7669 2.2132
BIO17 19.9978 7.8506
BIO2 6.3171 16.8578
BIO3 4.4267 3.8942
BIO5 8.7044 11.2613
BIO6 4.1076 0.508
Elevation 13.3151 1.6187
Land cover 2.3265 3.9645
Ruggedness 14.3777 34.3892
Slope 5.154 4.1157
DISCUSSION
Environmental factors influencing snow leopard habitatselectionOur results showed that precipitation in the driest quarter (BIO17),ruggedness, elevation, maximum temperature of the warmestmonth (BIO5), and annual mean temperature (BIO1) were the fivemain factors influencing snow leopard habitat suitability in QNNR.Wolf & Ale (2009) conducted research in the Sagarmatha NationalPark (area of 1 148 km2) of Nepal and reported that terrain andhuman activity were the main factors determining snow leopardspatial distribution, whilst prey species had a moderate effect.In Nepal’s Annapurna Conservation Area, Aryal et al. (2014c)indicated that cliffs, grassland, and shrubland at high elevations (3000–5 000 m a.s.l.) were preferred habitats of snow leopards inthe study area (about 2 025 km2). A study conducted in Mongoliareported that distribution of prey resources and rugged terrainlargely explained changes in snow leopard habitat use (McCarthy etal., 2005). In India, investigation in intensively grazed areas showedthat snow leopard habitat-use mainly relied on wild prey speciesdensity (Sharma et al., 2015). In China, very little research has beenconducted on snow leopard habitat use. A winter habitat-use surveyof snow leopards in Tomur National Nature Reserve highlightedthat prey resources and principal geographic features (ruggedness,bases of cliffs, and stream beds) were the main factors influencingsnow leopard habitat use within the 3 000 km2 study area (Xu et al.,2012). In Sanjiangyuan National Nature Reserve, a landscape levelanalysis of snow leopard habitat using the MaxEnt model indictedthat annual average temperature and ruggedness were the twomain factors influencing habitat selection (Li et al., 2013). Fromthe above studies, we can conclude that the determining factors ofsnow leopard habitat selection may differ in different areas. Thus,local surveys on snow leopard habitat selection are critical to adaptconservation needs according to the local context.
380 www.zoores.ac.cn

Table 4 Cumulative and logistic thresholds and corresponding omission rates used for modeling
Cumulative threshold Logistic threshold DescriptionFractional
predicted area
Training
omission rate
1.000 0.015 Fixed cumulative value 1 0.641 0.000
5.000 0.056 Fixed cumulative value 5 0.382 0.014
10.000 0.113 Fixed cumulative value 10 0.262 0.047
3.590 0.042 Minimum training presence 0.464 0.000
18.200 0.203 10 percentile training presence 0.173 0.099
24.048 0.261 Equal training sensitivity and specificity 0.128 0.128
30.946 0.330 Maximum training sensitivity plus specificity 0.096 0.133
5.371 0.060Balance training omission predicted area
and threshold value0.376 0.006
13.893 0.159Equate entropy of thresholded and
original distributions0.210 0.086
Figure 5 Response curve of selected variables for snow leopard habitat suitability in QNNR
Zoological Research 39(6): 373–386, 2018 381

Figure 6 Distribution of suitable snow leopard habitat in QNNR
Figure 7 Distribution of suitable snow leopard habitat in different functional zones in QNNR
382 www.zoores.ac.cn

Little has been done to understand regional level snowleopard habitat suitability. Our results found that precipitationand temperature conditions at the regional level had a stronginfluence on suitable snow leopard habitat. Thus, it is likely thatclimate change will influence snow leopard habitat selection (Liet al., 2016). Among abiotic factors, elevation and ruggednesshad a greater influence on habitat suitability. Our study areahad the highest average elevation among the whole globalrange of snow leopards, ranging from 3 500 m to 5 500 m a.s.l..Our results indicated that snow leopards preferred elevations ofaround 4 000 m a.s.l. near Mt. Everest. Like previous research,our findings confirmed that snow leopards favored highly toextremely rugged areas, as based on the highest permutationimportance values (Li, 2013). Highly rugged areas usuallycontain large-sized rugged rocks, which may provide shelterfor snow leopards, and thus represent an important feature fortheir survival. The response curves of land cover and slopeshowed that snow leopards preferred bare and relatively highslope areas. Aspect had little influence on snow leopard habitatsuitability in QNNR.
We selected the MaxEnt model as the most appropriatemethod to accomplish our research aims. However, werecognize that bias may still exist due to the relatively smallstudy area and the inclusion of a limited number of habitattypes, mainly due to resource availability and accessibility. Thishighlights the common practice of research groups to focuseconomic efforts toward survey areas where the probabilitiesof encountering a target species are higher. One fundamentalassumption of the MaxEnt model is that the entire area ofinterest has been systematically or randomly sampled (Phillipset al., 2009; Royle et al., 2012). Our survey showed a strongsampling bias toward some regions or environmental features.To account for this factor, we selected 222 presence sitesaccording to the pixel cells of environmental variables. Manyoccurrence records were available for this study, therefore weadopted spatial filtering and balancing of occurrence data tominimize omission errors (false negatives) and commissionerrors (false positives) (Kramer-Schadt et al., 2013). Spatialclumping of records was reduced in datasets for MaxEnt modelcalibration. Environmental variables were tested regarding theirautocorrelation relationship. The manipulation of backgrounddatasets was considered inaccurate, as it might increase therisk of omission errors for species like snow leopards with ageneralist response in many predictors.
Based on the collected data, we primarily selected non-bioticfactors for further analysis. However, the limited number ofexamined factors may be inappropriate (at least to some extent)for our landscape level analysis in QNNR. An increase inthe number of evaluated factors is preferable for landscapelevel investigation, as advocated by Robinson & Weckworth(2016). More meaningful variables (e.g., human-related factors)influencing snow leopard habitat distribution should be includedin future research. Understanding snow leopard habitat inQNNR is important, thus this study provides a basis for morein-depth analysis on population densities and represents astarting point to implement wider conservation-oriented studies.
Suitable habitat distributionThe MaxEnt model was used to assess habitat suitabilityin QNNR and, according to the AUC values, results wereexcellent. We showed that suitable snow leopard habitatin QNNR was mainly located along the border with Nepal,with three distinct habitat patches detected within the naturereserve (Figure 6). This habitat separation might be due to thepresence of very high mountains, including Mt. Everest and theXixiabangma area (Figure 6). According to the geographicalfeatures and local knowledge (personal communication), snowleopards are reported to exist along the southern border of theXixiabangma area and in the northern area of Mt. Everest (nearbase camp). Using the HIS method, Jackson et al. (1994)described preliminary results for suitable snow leopard habitat,showing such habitat to be mainly located in the westernarea of QNNR. Our results indicated that “good” snow leopardhabitat area was about 1 000 km2 smaller than the results givenby Jackson et al. (1994). This might be a consequence of theincrease in human population and activities like tourism (Chenet al., 2017), or because of the variables and methods used forhabitat suitability estimation.
Further study should focus on the three unconnected habitatpatches to assess whether individual snow leopards are subjectto isolation. Cross-boundary cooperative research with Nepalis also necessary. In QNNR, low-grade snow leopard habitataccounted for about 84% of all potential snow leopard habitatand included very flat areas with little shelter or usable rockcover. However, it is necessary to survey these areas toconfirm the “absence” of snow leopards and understand naturalprey population statuses. Low-grade snow leopard habitat isimportant for their survival because it constitutes a part of theecosystem where snow leopards could exist.
Good snow leopard habitat in QNNR mainly lies inthe experimental zone, which is not optimal for protection.Therefore, assessing the efficiency of the functional zones inQNNR is needed in order to implement better conservationstrategies and promote new protection policies.
QNNR is located in the core area of the Himalayas andis an important area for global snow leopard conservation(McCarthy & Chapron, 2003). Since its establishment 30 yearsago, no-grazing and controlled-grazing policies have beenimplemented in QNNR; however, the contradiction betweenprotection and development is still prominent (Chen et al.,2016). To improve protection of rare species and ecosystems inQNNR, it is imperative to strengthen management of the wholenature reserve, accounting for target species occurrence andhuman conflict.
COMPETING INTERESTS
The authors declare that they have no competing interests.
AUTHORS’ CONTRIBUTIONS
K.S., D.F.B., P.J.C., L.C., and Q.L. designed the study. D.F.B. supervised the
analyses and drafted the manuscript. D.F.B., P.J.C., L.C., and Q.L. collected
field data. L.A. and K.S. supervised the molecular lab work. L.A. and D.F.B.
carried out the molecular lab work. L.A. carried out genomic DNA data
Zoological Research 39(6): 373–386, 2018 383
analysis and wrote the methods and results sections about genomic DNA
from feces. D.F.B., K.S., L.A., and P.J.C. revised the manuscript. All authors
read and approved the final manuscript.
ACKNOWLEDGEMENTS
We are grateful for the support received from the Second National Survey
of Terrestrial Wildlife, State Forestry Administration of China, and Forestry
Bureau of Tibet Autonomous Region. The field work was supported by
Zi-Cheng Yang and Xin-Jin Che from the Wildlife Institute of Beijing Forestry
University. We thank the staff of Qomolangma National Nature Reserve,
particularly Ciou, Ciwang, Daqiong, Yajun, Gesangzhuoma, and Suolun, for
their assistance in fieldwork coordination. We also thank the local residents
and officials for sharing their insights.
REFERENCES
Alexander JS, Gopalaswamy AM, Shi K, Riordan P. 2015. Face value:
towards robust estimates of snow leopard densities. PLoS One, 10(8):
e0134815.
Alexander JS, Gopalaswamy AM, Shi K, Hughes J, Riordan P. 2016b.
Patterns of snow leopard site use in an increasingly human-dominated
landscape. PLoS One, 11(5): e0155309.
Alexander JS, Shi K, Tallents LA, Riordan P. 2016a. On the high trail:
examining determinants of site use by the endangered snow leopard
Panthera uncia in Qilianshan, China. Oryx, 50(2): 231–238.
Aryal A, Brunton D, Raubenheimer D. 2013. Habitat assessment for the
translocation of blue sheep to maintain a viable snow leopard population
in the Mt Everest Region, Nepal. Zoology and Ecology, 23(1): 66–82.
Aryal A, Brunton D, Ji WH, Raubenheimer D. 2014a. Blue sheep in the
Annapurna Conservation Area, Nepal: habitat use, population biomass
and their contribution to the carrying capacity of snow leopards. Integrative
Zoology, 9(1): 34–45.
Aryal A, Brunton D, Ji WH, Barraclough RK, Raubenheimer D. 2014b.
Human-Carnivore conflict: ecological and economical sustainability of
predation on livestock by snow leopard and other carnivores in the Himalaya.
Sustainability Sciences, 9(3): 321–329.
Aryal A, Brunton D, Ji WH, Karmacharya D, McCarthy T, Bencini R,
Raubenheimer D. 2014c. Multipronged strategy including genetic analysis for
assessing conservation options for the snow leopard in the Central Himalaya.
Journal of Mammalogy, 95(4): 871–881.
Aryal A, Brunton D, Raubenheimer D. 2014d. Impact of climate change on
human-wildlife-ecosystem interactions in the Trans-Himalaya region of Nepal.
Theoretical and Applied Climatology, 115(3–4): 517–529.
Aryal A, Shrestha UB, Ji WH, Ale SB, Shrestha S, Ingty T, Maraseni T,
Cockfield G, Raubenheimer D. 2016. Predicting the distributions of predator
(snow leopard) and prey (blue sheep) under climate change in the Himalaya.
Ecology and Evolution, 6(12): 4065–4075.
Boitani L, Powell RA. 2012. Carnivore Ecology and Conservation: A
Handbook of Techniques. London: Oxford University Press.
Chaves PB, Graeff VG, Lion MB, Oliveira LR, Eizirik E. 2012. DNA barcoding
meets molecular scatology: short mtDNA sequences for standardized
species assignment of carnivore noninvasive samples. Molecular Ecology
Resources, 12(1): 18–35.
Chen PJ, Gao YF, Lee ATL, Cering L, Shi K, Clark SG. 2016.
Human-carnivore coexistence in Qomolangma (Mt. Everest) Nature Reserve,
China: patterns and compensation. Biological Conservation, 197: 18–26.
Chen PJ, Gao YF, Wang J, Pu Q, Lhaba C, Hu HJ, Xu J, Shi K. 2017.
Status and conservation of the endangered snow leopard Panthera uncia
in Qomolangma National Nature Reserve, Tibet. Oryx, 51(4): 590–593.
Clements GR, Rayan DM, Aziz SA, Kawanishi K, Traeholt C, Magintan D,
Yazi MFA, Tingley R. 2012. Predicting the distribution of the Asian tapir in
Peninsular Malaysia using maximum entropy modeling. Integrative Zoology,
7(4): 400–406.
Cody ML. 1987. Habitat Selection in Birds. New York: Academic Press,
1–559.
Farrell LE, Roman J, Sunquist ME. 2000. Dietary separation of sympatric
carnivores identified by molecular analysis of scats. Molecular Ecology, 9(10):
1583–1590.
Fox JL. 1994. Snow leopard conservation in the wild–a comprehensive
perspective on a low density and highly fragmented population. In: Fox
JL, Du JZ. Proceedings of the Seventh International Snow Leopard
Symposium (Xining, Qinghai, China, 25–30 July, 1992). Seattle, Washington:
International Snow Leopard Trust, 3–15.
GMTED2010. 2011. The Global Multi-resolution Terrain Elevation Data 2010.
Retrieved from https://topotools.cr.usgs.gov.
Haegeman B, Etienne RS. 2010. Entropy maximization and the spatial
distribution of species. The American Naturalist, 175(4): E74–E69.
Hijmans RJ, Cameron SE, Parra JL, Jones PG, Jarvis A. 2005. Very high
resolution interpolated climate surfaces for global land areas. International
Journal of Climatology, 25(15): 1965–1978.
Hunter DO, Jackson R. 1997. A range-wide model of potential snow leopard
habitat. In: Jackson R, Ahmad A. Proceedings of the Eighth International
Snow Leopard Symposium. Seattle, USA, Islamabad, Pakistan: International
Snow Leopard Trust and World Wildlife Fund-Pakistan, 51–56.
International Union for Conservation of Nature and Natural Resources.
2017. The IUCN red list of threatened species. http://www.iucnredlist.org.
(Accessed 05 March 2018)
Jackson R, Wang ZY, Lu XD, Chen Y. 1994. Snow leopards in the
Qomolangma nature preserve of the Tibet autonomous region. In: Fox JL,
Du J. Proceeding of the Seventh International Snow Leopard Symposium.
Seattle, USA: International Snow Leopard Trust, 85–95.
Jackson R, Hunter DO. 1996. Snow Leopard Survey and Conservation
Handbook. 2nd ed. Seattle, Colorado: International Snow Leopard Trust,
Seattle, Washington and U.S. Geological Survey, Fort Collins Science
Center, Colorado, 154.
Jackson RM, Roe JD, Wangchuk R, Hunter DO. 2006. Estimating snow
leopard population abundance using photography and capture-recapture
techniques. Wildlife Society Bulletin, 34(3): 772–781.
Janecka JE, Jackson R, Zhang YG, Li DQ, Munkhtsog B, Buckley-Beason V,
Murphy WJ. 2008. Population monitoring of snow leopards using noninvasive
collection of scat samples: a pilot study. Animal Conservation, 11(5):
401–411.
Janecka JE, Zhang YG, Li DQ, Munkhtsog B, Bayaraa M, Galsandorj N,
Wangchuk TR, Karmacharya D, Li J, Lu Z, Uulu KZ, Gaur A, Kumar S,
Kumar K, Hussain S, Muhammad G, Jevitl M, Hacker C, Burger P, Wultsch C,
384 www.zoores.ac.cn
Janecka MJ, Helgen K, Murphy WJ, Jackson R. 2017. Range-wide snow
leopard phylogeography supports three subspecies. Journal of Heredity,
108(6): 597–607.
Jaynes ET. 1957a. Information theory and statistical mechanics. Physical
Review, 106(4): 620–630.
Jaynes ET. 1957b. Information theory and statistical mechanics. II. Physical
Review, 108(2): 171–190.
Jaynes ET, Bretthorst GL. 2003. Probability Theory: the Logic Science.
Cambridge, Unites Kingdom: Cambridge University Press.
Jiang AW, Zhou F, Qin Y, Liu NF. 2012. 10-years of bird habitat selection
studies in mainland China: a review. Acta Ecologica Sinica, 32(18):
5918–5923. (in Chinese)
Jin LR, Sun KP, He HS, Zhou YF. 2008. Research advances in habitat
suitability index model. Chinese Journal of Ecology, 27(5): 841–846. (in
Chinese)
Johansson Ö, Rauset GR, Samelius G, McCarthy T, Andrén H, Tumursukh
L, Mishra C. 2016. Land sharing is essential for snow leopard conservation.
Biological Conservation, 203: 1–7.
Kramer-Schadt S, Niedballa J, Pilgrim JD, Schröder B, Lindenborn J,
Reinfelder V, Stillfried M, Heckmann I, Scharf AK, Augeri DM, Cheyne
SM, Hearn AJ, Ross J, Macdonald DW, Mathai J, Eaton J, Marshall AJ,
Semiadi G, Rustam R, Bernard H, Alfred R, Samejima H, Duckworth
JW, Breitenmoser-Wuersten C, Belant JL, Hofer H, Wilting A. 2013. The
importance of correcting for sampling bias in MaxEnt species distribution
models. Diversity and Distributions, 19(11): 1366–1379.
Li J. 2013. Ecology and Conservation Strategy of Snow Leopard (Panthera
uncia) in Sangjiangyuan Area on the Tibetan Plateau. Ph. D. dissertation,
Peking University, Beijing. (in Chinese)
Li J, Schaller GB, McCarthy TM, Wang DJ, Jiagong ZL, Cai P, Basang LM, Lu
Z. 2013. A communal sign post of snow leopards (Panthera uncia) and other
species on the Tibetan Plateau, China. International Journal of Biodiversity,
2013: 370905.
Li J, McCarthy TM, Wang H, Weckworth BV, Schaller GB, Mishra C, Lu
Z, Beissinger SR. 2016. Climate refugia of snow leopards in High Asia.
Biological Conservation, 203: 188–196.
Liu ZS, Gao H, Teng LW, Su Y, Wang XQ, Kong FY. 2013. Habitat suitability
assessment of blue sheep in Helan Mountain based on MAXENT modeling.
Acta Ecologica Sinica, 33(22): 7243–7249. (in Chinese)
Lu CY, Gu W, Dai AH, Wei HY. 2012. Assessing habitat suitability based on
geographic information system (GIS) and fuzzy: a case study of Schisandra
sphenanthera Rehd. et Wils. in Qinling Mountains, China. Ecological
Modelling, 242: 105–115.
MacKenzie DI, Nichols JD, Royal JA, Pollock KH, Bailey LL, Hines JE. 2006.
Occupancy Estimation and Modeling: Inferring Patterns and Dynamics of
Species Occurrence. Amsterdam: Academic Press.
McCarthy T, Mallon D, Philip JN. 2016. Snow Leopard. Biodiversity of the
World: Conservation from Genes to Landscapes. San Diego: Elsevier Inc.,
23–42.
McCarthy TM, Chapron G. 2003. Snow Leopard Survival Strategy. Seattle,
WA: ISLT and SLN.
McCarthy TM, Fuller TK, Munkhtsog B. 2005. Movements and activities of
snow leopards in Southwestern Mongolia. Biological Conservation, 124(4):
527–537.
Merow C, Smith MJ, Silander JA Jr. 2013. A practical guide to MaxEnt for
modeling species’ distributions: what it does, and why inputs and settings
matter. Ecography, 36(10): 1058–1069.
Merow C, Silander JA Jr. 2014. A comparison of Maxlike and Maxent for
modelling species distributions. Methods in Ecology and Evolution, 5(3):
215–225.
Ouyang ZY, Liu JG, Han X, Tan YC, Zhang HM. 2001. An assessment
of giant panda habitat in Wolong Nature Reserve. Acta Ecologica Sinica,
21(11): 1869–1874. (in Chinese)
Pearson RG, Raxworthy CJ, Nakamura M, Peterson AT. 2007. Predicting
species distributions from small numbers of occurrence records: a test
case using cryptic geckos in Madagascar. Journal of Biogeography, 34(1):
102–117.
Phillips SJ, Anderson RP, Schapire RE. 2006. Maximum entropy modeling of
species geographic distributions. Ecological Modelling, 190(3–4): 231–259.
Phillips SJ, Dudík M. 2008. Modeling of species distributions with Maxent:
new extensions and a comprehensive evaluation. Ecography, 31(2):
161–175.
Phillips SJ, Dudik M, Elith J, Graham CH, Lehmann A, Leathwick J,
Ferrier S. 2009. Sample selection bias and presence-only distribution
models: implications for background and pseudo-absence data. Ecological
Applications, 19(1): 181–197.
Radosavljevic A, Anderson RP. 2014. Making better MAXENT models of
species distributions: complexity, overfitting and evaluation. Journal of
Biogeography, 41(4): 629–643.
Riley SJ, DeGloria SD, Elliot R. 1999. A terrain ruggedness index that
quantifies topographic heterogeneity. Intermountain Journal of Sciences,
5(1–4): 23–27.
Riordan P, Shi K. 2010. The snow leopard in China: Panthera uncia.
CATnews, (5): 14–17.
Riordan P, Shi K. 2016. Current state of snow leopard conservation in
China. In: McCarthy T, Mallon D, Nyhus PJ. Snow Leopards. Biodiversity
of the World: Conservation from Genes to Landscape. Amsterdam: Elsevier,
523–531.
Robinson HS, Weckworth B. 2016. Landscape ecology: linking landscape
metrics to ecological process. In: McCarthy T, Mallon D, Nyhus PJ. Snow
Leopards. Biodiversity of the World: Conservation from Genes to Landscape.
Amsterdam: Elsevier, 395–405.
Royle JA, Chandler RB, Yackulic C, Nichols JD. 2012. Likelihood analysis
of species occurrence probability from presence-only data for modelling
species distributions. Methods in Ecology and Evolution, 3(3): 545–554.
Schadt S, Revilla E, Wiegand T, Knauer F, Kaczensky P, Breitenmoser U,
Bufka L, Cervený J, Koubek P, Huber T, Staniša C, Trepl L. 2002. Assessing
the suitability of central European landscapes for the reintroduction of
Eurasian lynx. Journal of Applied Ecology, 39(2): 189–203.
Sharma RK, Bhatnagar YV, Mishra C. 2015. Does livestock benefit or harm
snow leopards? Biological Conservation, 190: 8–13.
Song JW, Wang XY, Liao Y, Zhen J, Ishwaran N, Guo HD, Yang RX, Liu CS,
Chang C, Zong X. 2014. An improved neural network for regional giant panda
habitat suitability mapping: a case study in Ya’an prefecture. Sustainability,
6(7): 4059–4076.
Zoological Research 39(6): 373–386, 2018 385
Stachura-Skierczynska K, Tumiel T, Skierczynski M. 2009. Habitat prediction
model for three-toed woodpecker and its implications for the conservation
of biologically valuable forests. Forest Ecology and Management, 258(5):
679–703.
Su JH, Aryal A, Nan ZB, Ji WH. 2015. Climate change-induced range
expansion of a subterranean rodent: implications for rangeland management
in Qinghai-Tibetan Plateau. PLoS One, 10(9): e0138969.
Swets JA. 1988. Measuring the accuracy of diagnostic systems. Science,
240: 1285–1293.
Wang F, McShea WJ, Li S, Wang DJ. 2018. Does one size fit all? A
multispecies approach to regional landscape corridor planning. Diversity and
Distribution, 24(3): 415–425.
Wang J, Laguardia A, Damerell PJ, Riordan P, Shi K. 2014. Dietary overlap
of snow leopard and other carnivores in the Pamirs of Northwestern China.
Chinese Science Bulletin, 59(25): 3162–3168.
Wang JL, Chen Y. 2004. Applications of 3S technology in wildlife habitat
researches. Geography and Geo-Information Science, 20(6): 44–77. (in
Chinese)
Wang S. 1998. China Red Data Book of Endangered Animals: Mammalia.
Beijing: Science Press, 132–135.
Wang XZ, Xu WH, Ouyang ZY, Liu JG, Xiao Y, Chen YP, Zhao LJ, Huang
JZ. 2008. The application of Ecological-Niche factor analysis in giant pandas
(Ailuropoda melanoleuca) habitat assessment. Acta Ecologica Sinica, 28(2):
821–828. (in Chinese)
Wasser SK, Houston CS, Koehler GM, Cadd GG, Fain SR. 1997. Techniques
for application of faecal DNA methods to field studies of Ursids. Molecular
Ecology, 6(11): 1091–1097.
Wilting A, Cord A, Hearn AJ, Hesse D, Mohamed A, Traeholdt C, Cheyne
SM, Sunarto S, Jayasilan MA, Ross J, Shapiro AC, Sebastian A, Dech S,
Breitenmoser C, Sanderson J, Duckworth JW, Hofer H. 2010. Modelling
the species distribution of flat-headed cats (Prionailurus planiceps), an
endangered South-East Asian small felid. PLoS One, 5(3): e9612.
Wolf M, Ale S. 2009. Signs at the top: habitat features influencing snow
leopard Uncia uncia activity in Sagarmatha National Park, Nepal. Journal of
Mammalogy, 90(3): 604–611.
Xing DL, Hao ZQ. 2011. The principle of maximum entropy and its
applications in ecology. Biodiversity Science, 19(3): 295–302. (in Chinese)
Xu F, Ma M, Yang WK, Blank D, Wu YQ, McCarthy T, Munkhtsog B. 2012.
Winter habitat use of snow leopards in Tomur national nature reserve of
Xinjiang, Northwest China. Journal of Arid Land, 4(2): 191–195.
Xu WH, Ouyang ZY, Jiang ZY, Zheng H, Liu JG. 2006. Assessment of
giant panda habitat in the Daxiangling Mountain Range, Sichuan, China.
Biodiversity Science, 14(3): 223–231. (in Chinese)
Xu WH, Luo C. 2010. Application of MAXENT model in Rhinopithecus
roxllanae habitat assessment in Qinling Mountain. Forest Engineering, 26(2):
1–3, 26. (in Chinese)
Yang WK, Zhong WQ, Gao XY. 2000. A review of studies on avian habitat
selection. Arid Zone Research, 17(3): 71–78.
386 www.zoores.ac.cn