Embed Size (px)
DESCRIPTION
Paul Ebeling on E. I. DuPont de Nemours & Co. (DD), Harley-Davidson, Inc. (HOG), Nike, Inc. (NKE), and Las Vegas Sands Corp. (LVS)
Citation preview
The Red Roadmaster’s US Market Monthly Re-cap + Stock Talk ™
6 April 2010 Date Line: Hong Kong (SAR) China
You can now follow us on Twitter please go to http://twitter.com/EbelingHefferna and join in.
Red’s Bull Alert Light volume sends the DJIA towards 11,000, The DJIA and S&P 500 both closed at new 18 month highs + the leading NAS ended at a 19 month closing high.
Re-cap of the US Stock Market Action for the session ending 5 April 2010 The S&P 500 is now up 75.5% from its bottom on March 9, 2009.
Last week, the US stock indexes closed their 5th straight week of gains and 4 positive Q running.
US stocks rose Monday, and the DJIA tapped at the 11,000 level, on signs of a turnaround in the US labor market the fueled hopes the economy is strengthening, and the profit outlook is brightening. Shares of natural resources companies led the charge on expectations that an improving economy would drive up demand.
The DJIA rose 46.48 pts, or 0.43%, to close at 10,973.55, the S&P 500 gained 9.34 pts, or 0.79%, to close at 1,187.44, and the NAS tallied up a + 26.95 pts, or 1.12%, to end the session at 2,429.53.
Volume was extremely light, making Monday's session the second-slowest volume day of 2010.
On the first trading day after government data showed the economy added the largest number of jobs in three years, investors got separate reports showing that services, the US economy's largest segment, grew above expectations in March and pending home sales rose more than expected in February.
On the New York Merc, May US Crude Oil rose US$1.75, or 2.06%, to settle at US$86.62 bbl the highest close since the October 8, 2008, settlement of US$88.95.
The yield on the benchmark US 10 yr T-Note rose to touch 4% earlier, a level not seen since June 2009, when it hit 4.01%.
Semiconductor shares also stood out, with the semiconductor index .SOXX up 3%.
The February home sales data lifted home builders' stocks, with the PHLX housing index was up 1.8%.
The Institute for Supply Management said its services index jumped to 55.4 in March, its strongest reading since May 2006, and above February's reading of 53.0.
Nonfarm payrolls gained 162,000 jobs in March, below consensus, and many of the jobs were temporary, but more private-sector hiring was seen as further evidence the economy is improving.
1
Advancing Sectors: Energy (+1.6%), Materials (+1.2%), Consumer Discretionary (+1.2%), Tech (+1.1%), Financial (+1.0%), Industrials (+0.8%), Telecom (+0.7%), Utilities (+0.6%)
Declining Sectors: Health Care (-0.3%), Consumer Staples (-0.1%)
Volume and Breadth: About 7.04B/shrs traded on the NYSE, the AMEX, and the NAS, below last year's estimated daily average of 9.65B/shrs. Advancers beat decliners by 3 to 1 on both the NYSE and NAS
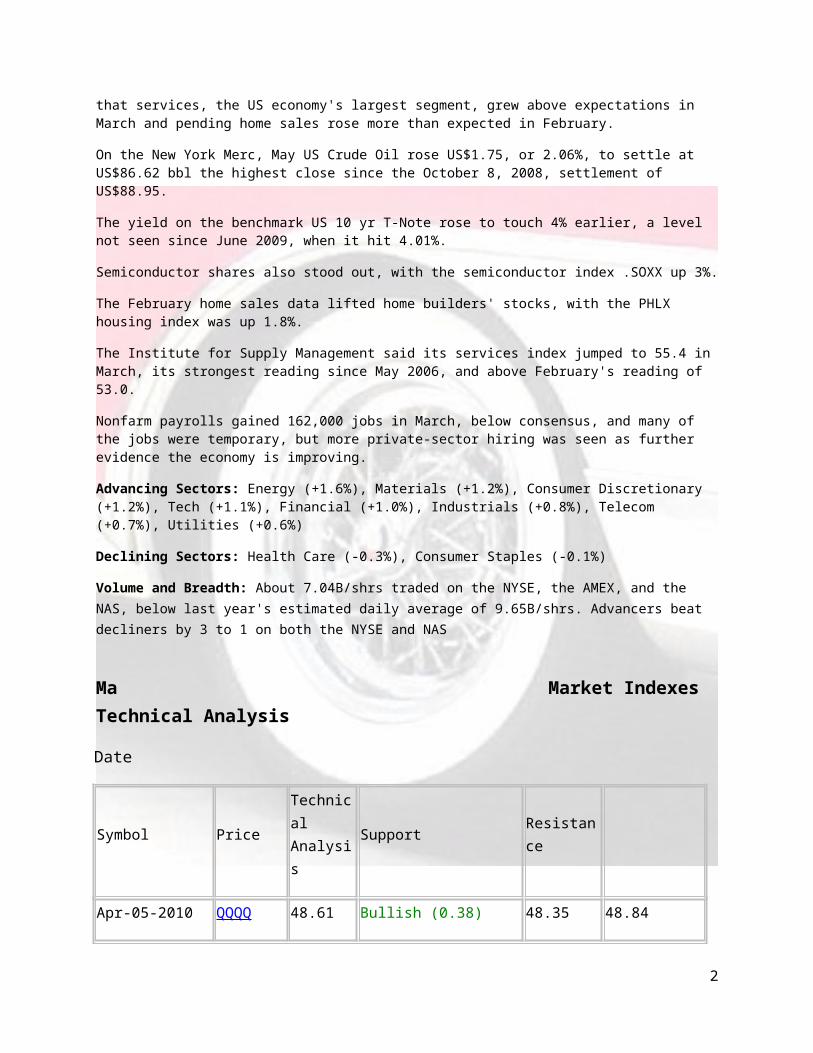
Ma Market Indexes Technical Analysis
Date
Symbol PriceTechnical Analysis
Support Resistance
Apr-05-2010 QQQQ 48.61 Bullish (0.38) 48.35 48.84
Apr-05-2010 DIA 109.73 Neutral (0.17) 109.03 110.28
Apr-05-2010 SPY 118.76 Neutral (0.16) 117.38 119.20
Stocks to Watch Today
E. I. DuPont de Nemours & Co. (DD), Harley-Davidson, Inc. (HOG), Nike, Inc. (NKE), and Las Vegas Sands Corp. (LVS)
2

E. I. DuPont de Nemours & Co. (DD) Up-date 5 Last Look: March 19, 2010
April 6, 2010
Paul A. Ebeling, Jnr. Analyst
Today let’s look at E. I. DuPont de Nemours & Co. (DD), the Giant US Chemical and Agriculture company, from a Technical POV. The overall indications, after Monday’s (April 5) market action, are Bullish: in the near term Bullish, mid-term Very Bullish, and long term Very Bullish. The recent Candle Stick analysis is: Neutral
3
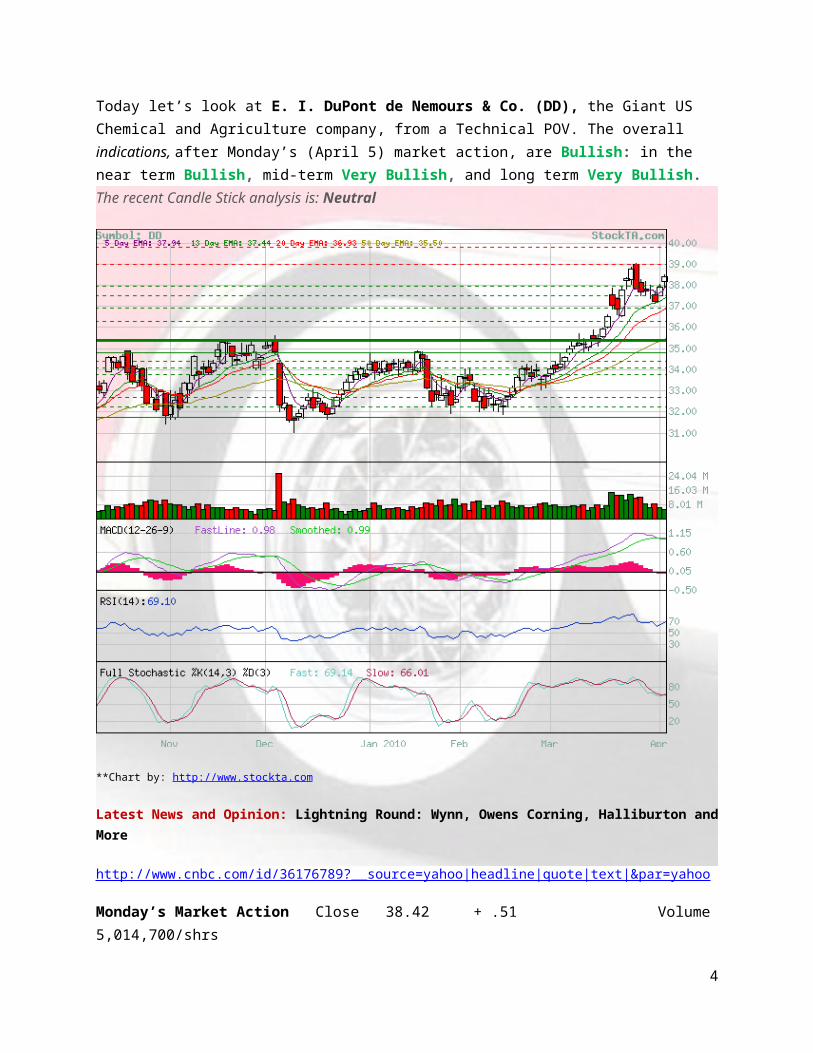
**Chart by: http://www.stockta.com
Latest News and Opinion: Lightning Round: Wynn, Owens Corning, Halliburton and More
http://www.cnbc.com/id/36176789?__source=yahoo|headline|quote|text|&par=yahoo
Monday’s Market Action Close 38.42 + .51 Volume 5,014,700/shrs
There is a Bullish Harami on March 30, and one Gap open up on March 5 at 34.63/34.71, the near term resistance is 39.00, support at 37.97, and the 50 day (EMA) exponential moving average is 35.50.
This is EI DuPont de Nemours & Co. (DD): (DuPont) operates as a science and technology company in various disciplines, including agriculture, industrial biotechnology, chemistry, biology, materials science, and manufacturing. It operates in five segments: Agriculture & Nutrition, Coatings & Color Technologies, Electronic & Communication Technologies, Performance Materials, and Safety & Protection. The Agriculture & Nutrition segment offers benzene and carbamic acid related intermediates, copper, insect control products, natural gas, soybeans, soy flake, and soy lecithin, sulfonamides, corn, and soybean seeds. The Coatings & Color Technologies segment provides automotive finishes, industrial coatings, and titanium dioxide white pigments. The Electronic & Communication Technologies segment offers a range of materials for the electronics industry, flexographic printing and color communication systems, and various fluoropolymer and fluorochemical products. The Performance Materials segment provides thermoplastic, and thermoset engineering polymers and elastomers to fabricate components for mechanical and electrical systems, as well as specialized resins and films used in packaging and industrial applications, sealants and adhesives, sporting goods, and interlayers for laminated safety glass. The Safety & Protection segment offers specialty and industrial chemicals, nonwovens, aramids, and solid surfaces. The company also has interest in two antihypertensive drugs, the Cozaar and Hyzaar. It serves construction, transportation, communications, industrial chemicals, oil and gas, electric utilities, automotive, manufacturing, defense, homeland security and safety consulting, refrigeration, insulation, aerosol propellants, aerospace, automotive, electronics, chemical processing, and house ware industries. The company operates in the United States, Europe, the Asia Pacific, Canada, and Latin America. DuPont was founded in 1802 and is headquartered in Wilmington, Delaware.
Competitive Landscape
Demand for agricultural chemicals depends mainly on demand for various crops, which in turn depends on crop prices. The profitability of individual companies is linked to efficient operations and marketing. Big producers have large economies of scale in production. Smaller companies can compete effectively by making specialty chemicals or fertilizer mixtures for local markets. Operations are capital intensive and highly automated: annual revenue per employee at a large plant is close to US$700,000.
Chemical Manufacturing - Agricultural Industry Forecast
The output of US agricultural fertilizers and chemicals is forecast to grow at an annual compounded rate of 2% between 2008 and 2013. Data Sourced: December 2008
E. I. DuPont de Nemours & Co. (HQ) Chief Exec. Officer & Pres: Ellen J. Kullman
1007 Market StreetWilmington, DE 19898United States Phone: 302-774-1000Fax: 302-773-2631
http://www.dupont.com
4
DuPont Subsidiaries
Du Pont China Holding Company Ltd.Du Pont (Thailand) LimitedDuPont Agriculture & Nutrition
HARLEY-DAVIDSON, Inc. (HOG) Up-date 1 Last Look: April 17, 2009
April 6, 2010
Paul A. Ebeling, Jnr. Analyst
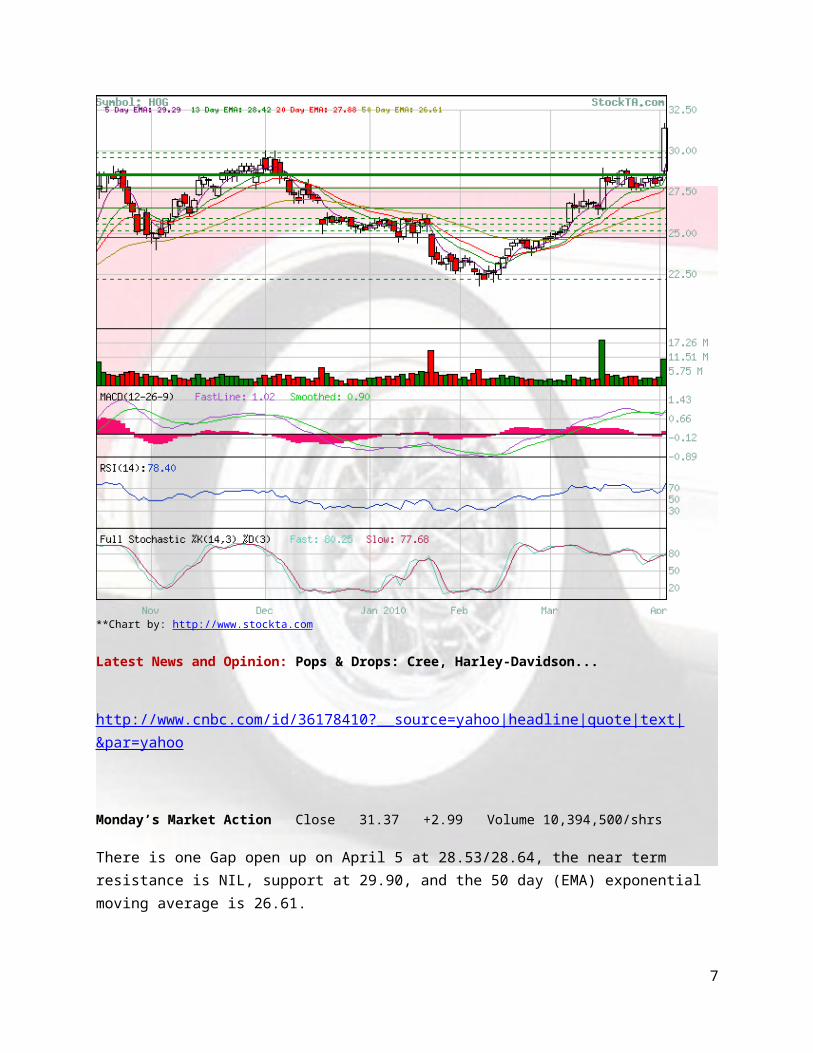
Today let’s look at Harley-Davidson, Inc. (HOG), The USAs quintessential motor cycle maker, from a Technical POV. The overall analysis after Monday’s (April 5) market action is Bullish; in the near term Bullish, mid-term Bullish, and long term Bullish. The recent Candle Stick analysis is: Neutral
**Chart by: http://www.stockta.com
5
Latest News and Opinion: Pops & Drops: Cree, Harley-Davidson...
http://www.cnbc.com/id/36178410?__source=yahoo|headline|quote|text|&par=yahoo
Monday’s Market Action Close 31.37 +2.99 Volume 10,394,500/shrs
There is one Gap open up on April 5 at 28.53/28.64, the near term resistance is NIL, support at 29.90, and the 50 day (EMA) exponential moving average is 26.61.
This is Harley-Davidson (HOG): H-D is the only major US maker of motorcycles and the nation's #1 seller of heavyweight motorcycles. The company offers 35 models of touring and custom Harleys through a worldwide network of more than 1,500 dealers. Harley models include the Electra Glide, the Sportster, and the Fat Boy. The company also makes motorcycles under the Buell, MV Agusta, and Cagiva nameplates. Harley-Davidson sells attitude with its brand name products which include a line of clothing and accessories (MotorClothes). Harley-Davidson Financial Services offers financing to dealers and consumers in the US and Canada.
Competitive Landscape
Demand for many specialty retail goods is driven by gains in consumer income. Large competitors can offer lower prices because they buy in quantity. Small retailers can compete with large ones by offering different merchandise or providing a higher level of service. Despite the presence of some large chains, specialty retail markets are highly fragmented.
Specialty Retail Industry Forecast
US personal consumption expenditures for specialty retail items, like toys, dolls, games, cameras, film, film processing, guns, ammunition, sporting equipment, boats, and aircraft, are forecast to grow at an annual compounded rate of 5.1% between 2008 and 2013.
Harley-Davidson, Inc.
Jim Ziemer Chief Executive Officer/President
3700 West Juneau AvenueMilwaukee, WI 53208United StatesPhone: 414-342-4680Fax: 414-343-4621
http://www.harley-davidson.com
6
Las Vegas Sands Corp. (LVS) Up-date 8 Last Look: March 17, 2010
April 6, 2010
Paul A. Ebeling, Jnr. Analyst
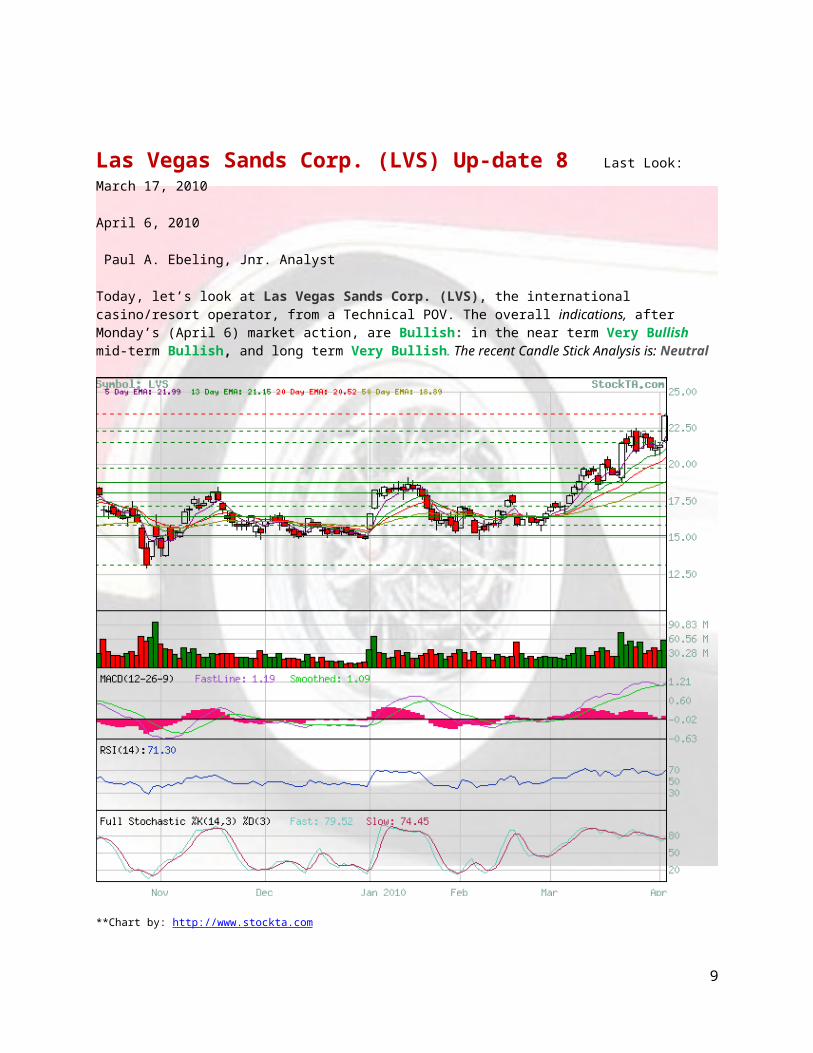
Today, let’s look at Las Vegas Sands Corp. (LVS), the international casino/resort operator, from a Technical POV. The overall indications, after Monday’s (April 6) market action, are Bullish: in the near term Very Bullish mid-term Bullish, and long term Very Bullish. The recent Candle Stick Analysis is: Neutral
**Chart by: http://www.stockta.com
7
Latest News and Opinion: Macau Still A Boon For U.S.-Listed Casino Shares
http://finance.yahoo.com/news/Macau-Still-A-Boon-For-indie-3143177383.html?x=0&.v=1
Monday’s Market Action Close 23.36 + 2.06 Volume 58,148,800/shrs
There are two Gaps open up on March 5 and April 5 at 17.25/21.56, the near term resistance is 23.46, support at 22.29, and the 50 day (EMA) exponential moving average is 18.89.
This is Las Vegas Sands Corp. (LVS): The Venetian Casino Resort (owned by Las Vegas Sands) brings a touch of Venice to the Las Vegas Strip. Replete with gondoliers and a replica of the Rialto Bridge, the Venetian offers a 120,000-sq.-ft. casino and a 4,000-suite hotel, as well as a shopping, dining, and entertainment complex. Las Vegas Sands also operates the Congress Center conference facility that links the casino to the nearby Sands Expo Center trade show and convention center. In addition, the firm operates The Sands Macao casino in China, and The Palazzo Casino next door to the Venetian in Las Vegas. Chairman and CEO Sheldon Adelson and trusts for his family own nearly 70% of the firm.
The Competitive Landscape
Growth in consumer income and state spending has driven expansion of the US gambling industry. The profitability of individual companies depends on efficient operations and effective marketing. Large operators have the financial resources to make large investments in facilities and efficient computer operations, and have cross-marketing opportunities. Small gambling facilities can thrive by catering to a local clientèle. The industry is fairly labor-intensive: annual revenue per employee is US$90,000.
Gambling Operations Industry Forecast
USA personal consumption expenditures for participant amusements and pari-mutuel net receipts, which include gambling operations, are forecast to grow at an annual compounded rate of 5 % between 2008 and 2013.
Las Vegas Sands Corp. (HQ)
Chairman, CEO, and Treasurer Sheldon G. Adelson3355 Las Vegas Blvd. SouthLas Vegas, NV 89109United States Phone: 702-414-1000Fax: 702-414-4884http://www.lasvegassands.com
8
Nike, Inc. (NKE) Up-date 3 Last Look: March 19, 2010
April 6, 2010
Paul A. Ebeling, Jnr. Analyst
Today, let’s look at Nike, Inc. (NKE), the world's #1 shoemaker, from a Technical POV. The overall indications, after Monday (April 5) market action is Neutral: in the near term Neutral, mid-term Bullish, and long term Bullish . The recent Candle Stick analysis is: Very Bearish
**Chart by: http://www.stockta.com
Latest News and Opinion: Is the Tiger Woods Scandal Played Out?
9
http://www.thestreet.com/_yahoo/story/10716704/1/is-the-tiger-woods-scandal-played-out.html?cm_ven=YAHOO&cm_cat=FREE&cm_ite=NA
Monday’s Market Action Close 74.11 + .10 Volume 1,770,400/shrs
There is a DOJI on April 5 and one Gap open up on March 18 at 71.33/73.70,the near term resistance is 74.66, support at 73.83, and the 50 day (EMA) exponential moving average is 69.13
This is Nike, Inc. (NKE): NIKE designs, develops, and markets footwear, apparel, equipment, and accessory products worldwide. The company offers various categories of shoes, including running, training, basketball, soccer, sport-inspired urban shoes, and children’s shoes. It also provides shoes for aquatic activities, baseball, bicycling, cheerleading, golf, lacrosse, outdoor activities, skateboarding, tennis, volleyball, walking, wrestling, and various athletic and recreational uses. In addition, the company offers sports-inspired lifestyle apparel, athletic bags, and accessory items. Further, it provides a line of performance equipment, including socks, sport balls, eyewear, timepieces, electronic devices, bats, gloves, protective equipment, golf clubs, and various equipments designed for sports activities under the NIKE brand name, as well as markets apparel with licensed college and professional team and league logos. Additionally, it offers licenses to produce and sell NIKE brand swimwear, team sports apparel, training equipment, children’s clothing, electronic devices, eyewear, golf accessories, and belts. Nike, Inc. also markets its products under the brand names of Converse, Chuck Taylor, All Star, One Star, John Varvatos, Jack Purcell, Cole Haan, Bragano, and Hurley. The company sells its products to retail accounts, through stores, independent distributors, and licensees, as well as through its Website, nikestore.com. As of May 31, 2008, it operated 296 retail stores in the United States and 260 retail stores internationally. NIKE, Inc. was founded in 1964 and is headquartered in Beaverton, Oregon.
Competitive Landscape
Demand is driven by fashion and demographics. The profitability of individual companies depends on their ability to design and market attractive shoe models. Big companies have economies of scale in distribution and marketing. Small companies can compete successfully through superior design or marketing.
Footwear Manufacture, Wholesale, and Retail Industry Forecast
The output of US shoe and other leather product manufacturing is forecast to grow at an annual compounded rate of 4% between 2008 and 2013. Data Sourced: December 2009
Nike Inc. (HQ)
Chief Executive Officer, Exec. Director: Mark G. Parker
One Bowerman DriveBeaverton, OR 97005United States Phone: 503-671-2500Fax: 503-671-6300
Web Site: http://www.nike.com
Disclaimer
10
DO NOT BASE ANY INVESTMENT DECISION UPON ANY MATERIALS FOUND ON THIS WEBSITE OR IN OUR NEWSLETTERS. Red Roadmaster is not registered as a securities broker-dealer or an investment advisor either within the US Securities and Exchange Commission (the “SEC”) or with any state securities regulatory authority. We are neither licensed nor qualified to provide investment advice. The information contained on our website or in any of our newsletters should be viewed as commercial advertisement and is not intended to be investment advice. Any information found on our website, or in any of our newsletters is not provided to any particular individual with a view toward their individual circumstances. The information contained on our website, and in any newsletter we distribute, is not an offer to buy or sell securities. We distribute opinions, comments, and information free of charge exclusively to individuals who wish to receive them.
Our newsletter and website have been prepared for informational purposes only and are not intended to be used as a complete source of information on any particular company. An individual should never invest in the securities of any of the companies’ profiled based solely on information contained in our report. Individuals should assume that all information contained on our website or in one of our newsletters about profiled companies is not trustworthy unless verified by their own independent research.
Any individual who chooses to invest in any securities should do so with caution. Investing in securities is speculative and carries a high degree of risk; you may lose some or all of the money that is invested. Always research your own investments and consult with a registered investment adviser or licensed stock broker before investing.
Information contained in the Redroadmaster Stock Talk report will contain “forward looking statements” as defined under section 27A of the Securities Act of 1933 and Section 21B of the Securities Exchange Act of 1934. Subscribers are cautioned not to place undue reliance upon these forward looking statements. These forward looking statements are subject to a number of known and unknown risks and uncertainties outside of our control that could cause actual operations or results to differ materially from those anticipated. Factors that could affect performance include, but are not limited to, those factors that are discussed in each profiled company’s most recent reports or registration statements filed with the SEC. You should consider these factors in evaluating the forward looking statements included in the report and not place undue reliance upon such statements.
Red Roadmaster is committed to providing factual information on the companies that are profiled. However, we do not provide any assurance as to the accuracy or completeness of the information provided, including information regarding a profiled company’s plans or ability to effect any planned or proposed actions. We have no first-hand knowledge of any profiled company’s operations and therefore cannot comment on their capabilities, intent, resources, nor experience and we make no attempt to do so. Statistical information, dollar amounts, and market size data was provided by the subject company and related sources which we believe to be reliable.
To the fullest extent of the law, we will not be liable to any person or entity for the quality, accuracy, completeness, reliability, or timeliness of the information provided in this report, or for any direct, indirect, consequential, incidental, special or punitive damages that may arise out of the use of information we provide to any person or entity (including, but not limited to, lost profits, loss opportunities, trading losses, and damages that may result from any inaccuracy or incompleteness of this information). We encourage you to invest carefully and read investment information available at the websites of the SEC at http://www.sec.gov and FINRA at http://www.finra.org
11