Embed Size (px)
Citation preview
Plug-In Electric Vehicle Infrastructure
Cost-Effectiveness Report
July 20, 2016
Prepared for:
Shayna Hirshfield-Gold
Energy Policy Analyst
City of Oakland
250 Frank Ogawa Plaza, Suite 5301
Oakland, CA 94612
Prepared by:
Ed Pike, PE
Jeffrey Steuben
Energy Solutions
449 15th Street
Oakland, CA 94612
CONTENTS 1. EXECUT I VE SUM M ARY .................................................................................................................... 1
2. PURPOSE ............................................................................................................................................. 1
3. SCENA RIOS ......................................................................................................................................... 4
4. RESULTS .............................................................................................................................................. 5
5. METHOD OL OG Y ................................................................................................................................ 8
6. COM PARISO N TO CALIFO RNI A PEVC CA SE STUDI ES ....................................................... 9
APPEND I X A: PEV PARK ING SPA CE COST DETAILS ............................................................ 11
APPEND I X B: PERM ITTING AND INSPE CTI O N COSTS ............................................................ 13
APPEND I X C: CA LCU LATI ON METH OD OL O GY ........................................................................ 15
Acknowledgements
The California Energy Commission provided grant funding for this report under PON-14-603.
The PEV Infrastructure cost-effectiveness model used for this report leverages prior experience from
research funded by Pacific Gas & Electric.
The authors wish to express appreciation to the following reviewers. Any errors are the responsibility of
the authors:
Rachel DiFranco, City of Fremont
Shayna Hirschfield-Gold, City of Oakland
Barry Hooper, City of San Francisco
L I S T O F TA B L E S
Table 1. Summary of CALGreen Mandatory and Voluntary PEV-Readiness Standards ............................................ 2
Table 2. Scenario Summary ......................................................................................................................................... 4
Table 3. Cost Results per Parking Space (Oakland, California) .................................................................................. 6
Table 4. Regional Factors Compared to National Average ......................................................................................... 8
Table 5. Regionally Adjusted Results per Parking Space for Two Enclosed Parking Scenarios ................................. 8
Table 6. Scenario One Surface Parking ..................................................................................................................... 11
Table 7. Scenario Two Surface Parking ..................................................................................................................... 11
Table 8. Scenario Three Surface Parking ................................................................................................................... 12
Table 9. Scenario Four Surface Parking .................................................................................................................... 12
Table 10. Electrical Permit and Inspection Cost Data ............................................................................................... 13
Table 11. Building Permit and Inspection Cost Data ................................................................................................. 13
Table 12. Total Permit and Inspection Cost Summary .............................................................................................. 14
Table 13. Task Descriptions and Quantities for Scenario One and Scenario Two .................................................... 17
Table 14. Task Descriptions and Quantities for Scenario Three and Scenario Four .................................................. 22
L I S T O F F I G U R E S
Figure 1. Annual Electric Vehicle Sales Under CARB Most Likely Compliance Pathway ........................................ 3
Figure 2: Number of California PEV Rebates per ZIP Code ....................................................................................... 3
Figure 3: Costs by Work Type for Retrofit and New Construction ............................................................................. 7
Figure 4: Relative Cost of New Construction vs. Retrofit ........................................................................................... 7
Plug-in Electric Vehicle Infrastructure Cost-Effectiveness Report
1
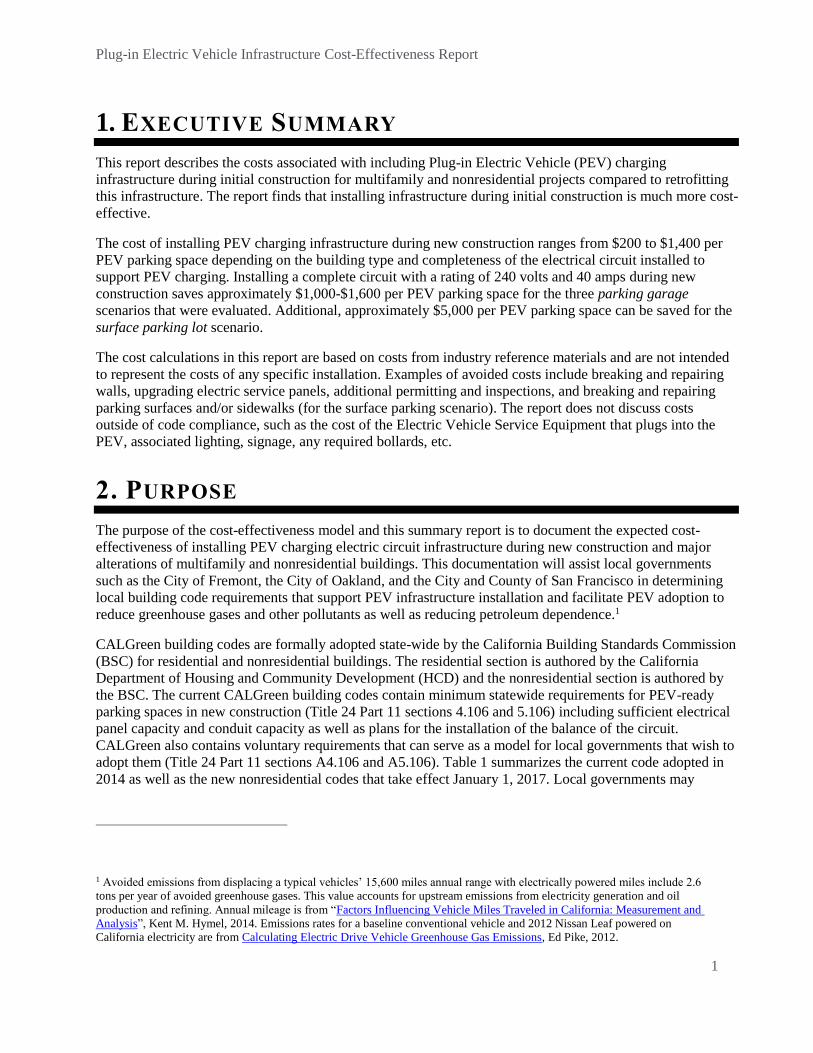
1. EXECUTIVE SUMMARY
This report describes the costs associated with including Plug-in Electric Vehicle (PEV) charging
infrastructure during initial construction for multifamily and nonresidential projects compared to retrofitting
this infrastructure. The report finds that installing infrastructure during initial construction is much more cost-
effective.
The cost of installing PEV charging infrastructure during new construction ranges from $200 to $1,400 per
PEV parking space depending on the building type and completeness of the electrical circuit installed to
support PEV charging. Installing a complete circuit with a rating of 240 volts and 40 amps during new
construction saves approximately $1,000-$1,600 per PEV parking space for the three parking garage
scenarios that were evaluated. Additional, approximately $5,000 per PEV parking space can be saved for the
surface parking lot scenario.
The cost calculations in this report are based on costs from industry reference materials and are not intended
to represent the costs of any specific installation. Examples of avoided costs include breaking and repairing
walls, upgrading electric service panels, additional permitting and inspections, and breaking and repairing
parking surfaces and/or sidewalks (for the surface parking scenario). The report does not discuss costs
outside of code compliance, such as the cost of the Electric Vehicle Service Equipment that plugs into the
PEV, associated lighting, signage, any required bollards, etc.
2. PURPOSE
The purpose of the cost-effectiveness model and this summary report is to document the expected cost-
effectiveness of installing PEV charging electric circuit infrastructure during new construction and major
alterations of multifamily and nonresidential buildings. This documentation will assist local governments
such as the City of Fremont, the City of Oakland, and the City and County of San Francisco in determining
local building code requirements that support PEV infrastructure installation and facilitate PEV adoption to
reduce greenhouse gases and other pollutants as well as reducing petroleum dependence.1
CALGreen building codes are formally adopted state-wide by the California Building Standards Commission
(BSC) for residential and nonresidential buildings. The residential section is authored by the California
Department of Housing and Community Development (HCD) and the nonresidential section is authored by
the BSC. The current CALGreen building codes contain minimum statewide requirements for PEV-ready
parking spaces in new construction (Title 24 Part 11 sections 4.106 and 5.106) including sufficient electrical
panel capacity and conduit capacity as well as plans for the installation of the balance of the circuit.
CALGreen also contains voluntary requirements that can serve as a model for local governments that wish to
adopt them (Title 24 Part 11 sections A4.106 and A5.106). Table 1 summarizes the current code adopted in
2014 as well as the new nonresidential codes that take effect January 1, 2017. Local governments may
1 Avoided emissions from displacing a typical vehicles’ 15,600 miles annual range with electrically powered miles include 2.6
tons per year of avoided greenhouse gases. This value accounts for upstream emissions from electricity generation and oil
production and refining. Annual mileage is from “Factors Influencing Vehicle Miles Traveled in California: Measurement and
Analysis”, Kent M. Hymel, 2014. Emissions rates for a baseline conventional vehicle and 2012 Nissan Leaf powered on
California electricity are from Calculating Electric Drive Vehicle Greenhouse Gas Emissions, Ed Pike, 2012.
Plug-in Electric Vehicle Infrastructure Cost-Effectiveness Report
2
choose to adopt voluntary codes, which then become mandatory in their jurisdiction, or tailored local codes.
A lack of PEV charging infrastructure is a key challenge for meeting California PEV adoption goals as noted
in the draft 2015 ZEV Action Plan.2 Local governments can exceed state-wide CALGreen minimums by
adopting CALGreen voluntary targets or adopting more aggressive local codes tailored to local
circumstances to help achieve PEV adoption goals.
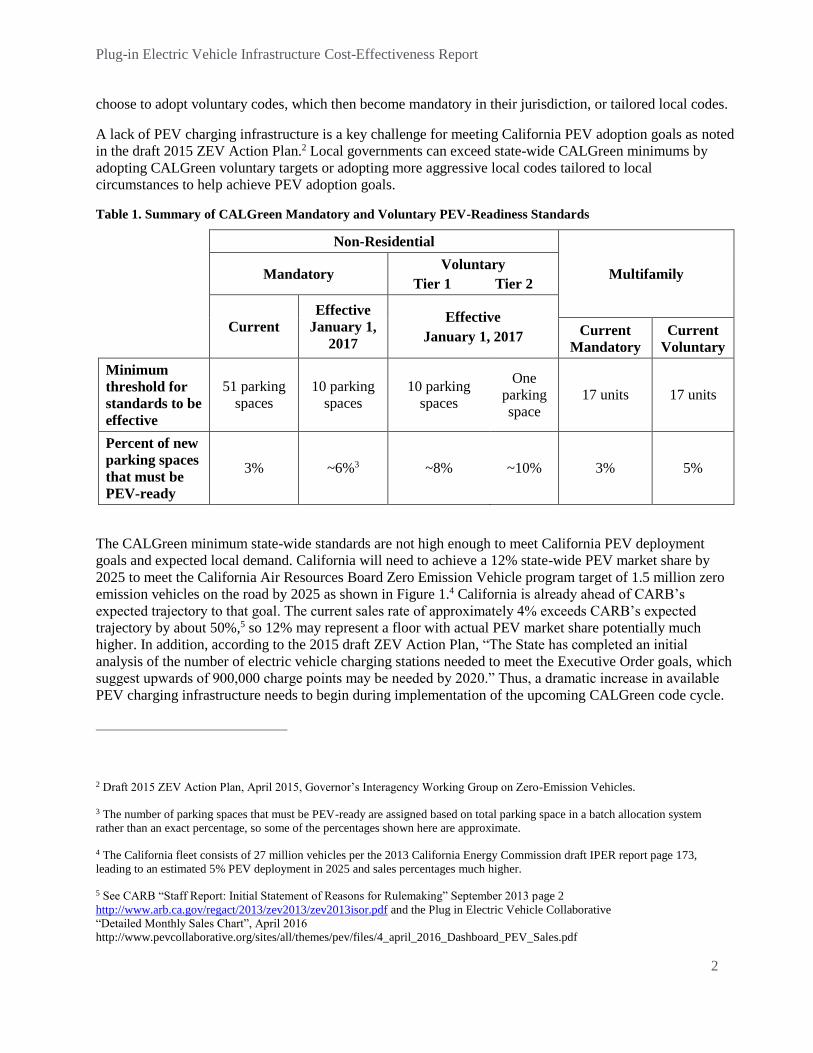
Table 1. Summary of CALGreen Mandatory and Voluntary PEV-Readiness Standards
Non-Residential
Multifamily Mandatory Voluntary
Tier 1 Tier 2
Current
Effective
January 1,
2017
Effective
January 1, 2017 Current
Mandatory
Current
Voluntary
Minimum
threshold for
standards to be
effective
51 parking
spaces
10 parking
spaces
10 parking
spaces
One
parking
space
17 units 17 units
Percent of new
parking spaces
that must be
PEV-ready
3% ~6%3 ~8% ~10% 3% 5%
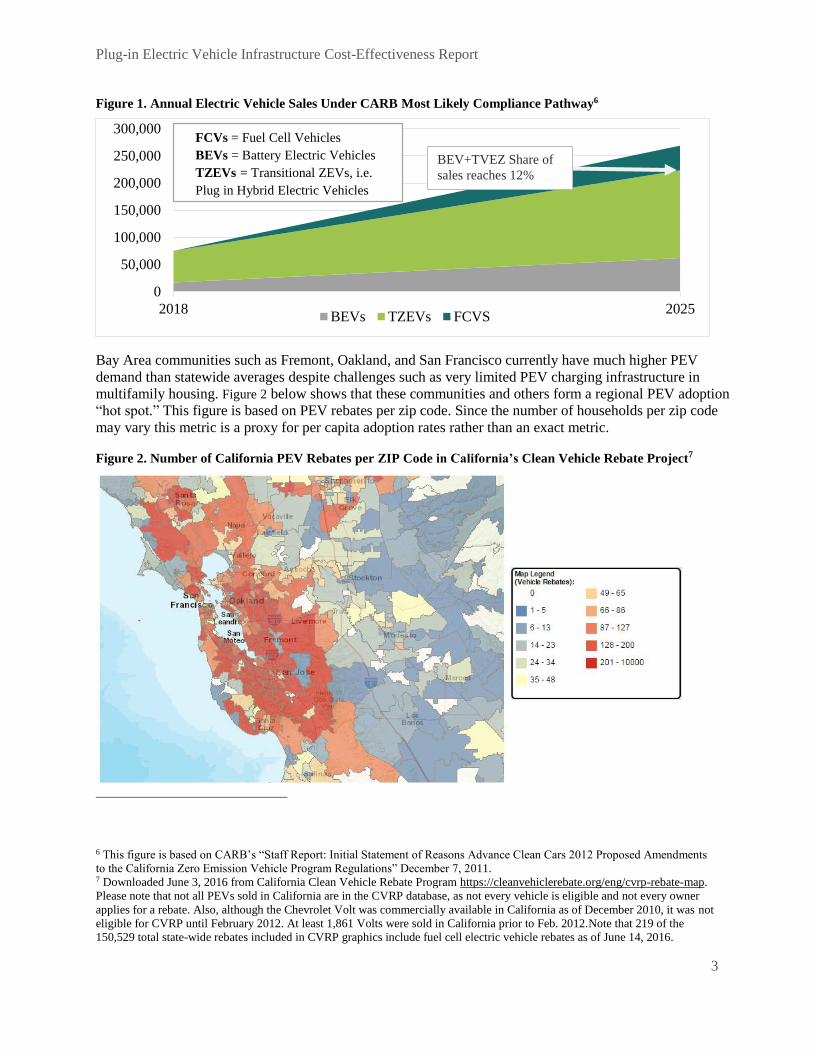
The CALGreen minimum state-wide standards are not high enough to meet California PEV deployment
goals and expected local demand. California will need to achieve a 12% state-wide PEV market share by
2025 to meet the California Air Resources Board Zero Emission Vehicle program target of 1.5 million zero
emission vehicles on the road by 2025 as shown in Figure 1.4 California is already ahead of CARB’s
expected trajectory to that goal. The current sales rate of approximately 4% exceeds CARB’s expected
trajectory by about 50%,5 so 12% may represent a floor with actual PEV market share potentially much
higher. In addition, according to the 2015 draft ZEV Action Plan, “The State has completed an initial
analysis of the number of electric vehicle charging stations needed to meet the Executive Order goals, which
suggest upwards of 900,000 charge points may be needed by 2020.” Thus, a dramatic increase in available
PEV charging infrastructure needs to begin during implementation of the upcoming CALGreen code cycle.
2 Draft 2015 ZEV Action Plan, April 2015, Governor’s Interagency Working Group on Zero-Emission Vehicles.
3 The number of parking spaces that must be PEV-ready are assigned based on total parking space in a batch allocation system
rather than an exact percentage, so some of the percentages shown here are approximate.
4 The California fleet consists of 27 million vehicles per the 2013 California Energy Commission draft IPER report page 173,
leading to an estimated 5% PEV deployment in 2025 and sales percentages much higher.
5 See CARB “Staff Report: Initial Statement of Reasons for Rulemaking” September 2013 page 2
http://www.arb.ca.gov/regact/2013/zev2013/zev2013isor.pdf and the Plug in Electric Vehicle Collaborative
“Detailed Monthly Sales Chart”, April 2016
http://www.pevcollaborative.org/sites/all/themes/pev/files/4_april_2016_Dashboard_PEV_Sales.pdf
Plug-in Electric Vehicle Infrastructure Cost-Effectiveness Report
3
Figure 1. Annual Electric Vehicle Sales Under CARB Most Likely Compliance Pathway6
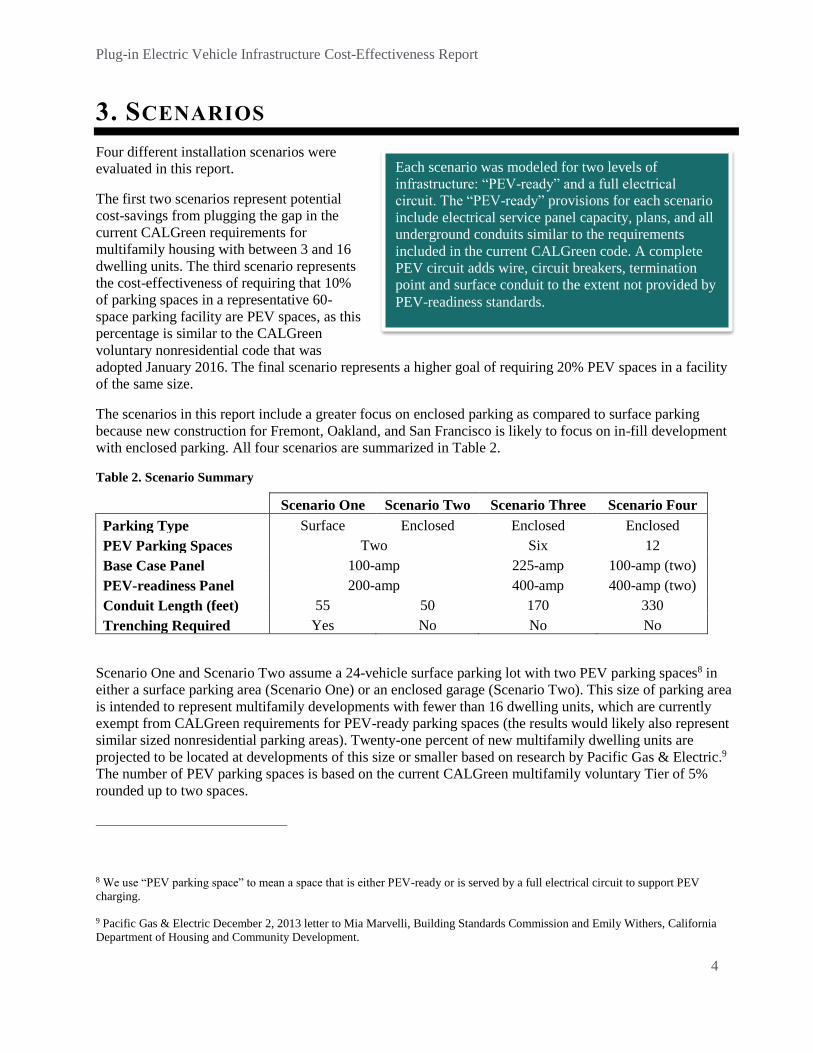
Bay Area communities such as Fremont, Oakland, and San Francisco currently have much higher PEV
demand than statewide averages despite challenges such as very limited PEV charging infrastructure in
multifamily housing. Figure 2 below shows that these communities and others form a regional PEV adoption
“hot spot.” This figure is based on PEV rebates per zip code. Since the number of households per zip code
may vary this metric is a proxy for per capita adoption rates rather than an exact metric.
Figure 2. Number of California PEV Rebates per ZIP Code in California’s Clean Vehicle Rebate Project7
6 This figure is based on CARB’s “Staff Report: Initial Statement of Reasons Advance Clean Cars 2012 Proposed Amendments
to the California Zero Emission Vehicle Program Regulations” December 7, 2011. 7 Downloaded June 3, 2016 from California Clean Vehicle Rebate Program https://cleanvehiclerebate.org/eng/cvrp-rebate-map.
Please note that not all PEVs sold in California are in the CVRP database, as not every vehicle is eligible and not every owner
applies for a rebate. Also, although the Chevrolet Volt was commercially available in California as of December 2010, it was not
eligible for CVRP until February 2012. At least 1,861 Volts were sold in California prior to Feb. 2012.Note that 219 of the
150,529 total state-wide rebates included in CVRP graphics include fuel cell electric vehicle rebates as of June 14, 2016.
0
50,000
100,000
150,000
200,000
250,000
300,000
2018 2025BEVs TZEVs FCVS
FCVs = Fuel Cell Vehicles
BEVs = Battery Electric Vehicles
TZEVs = Transitional ZEVs, i.e.
Plug in Hybrid Electric Vehicles
BEV+TVEZ Share of
sales reaches 12%
Plug-in Electric Vehicle Infrastructure Cost-Effectiveness Report
4
3. SCENARIOS
Four different installation scenarios were
evaluated in this report.
The first two scenarios represent potential
cost-savings from plugging the gap in the
current CALGreen requirements for
multifamily housing with between 3 and 16
dwelling units. The third scenario represents
the cost-effectiveness of requiring that 10%
of parking spaces in a representative 60-
space parking facility are PEV spaces, as this
percentage is similar to the CALGreen
voluntary nonresidential code that was
adopted January 2016. The final scenario represents a higher goal of requiring 20% PEV spaces in a facility
of the same size.
The scenarios in this report include a greater focus on enclosed parking as compared to surface parking
because new construction for Fremont, Oakland, and San Francisco is likely to focus on in-fill development
with enclosed parking. All four scenarios are summarized in Table 2.
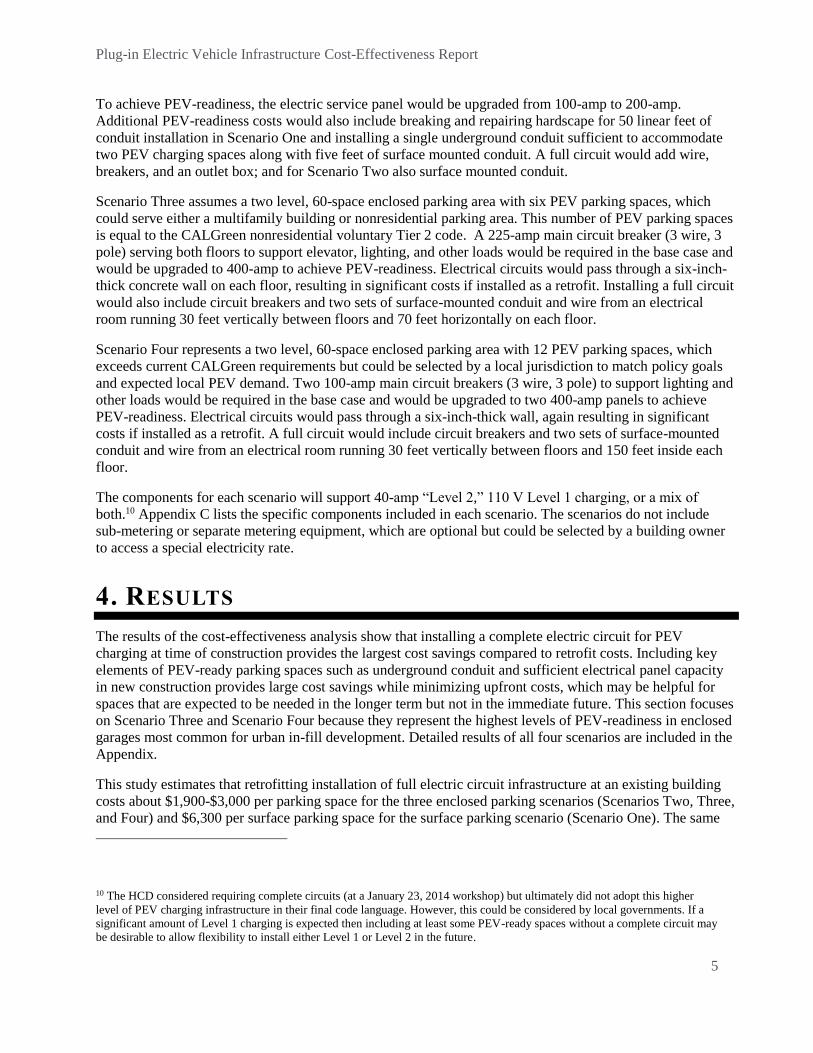
Table 2. Scenario Summary
Scenario One Scenario Two Scenario Three Scenario Four
Parking Type Surface Enclosed Enclosed Enclosed
PEV Parking Spaces Two Six 12
Base Case Panel 100-amp 225-amp 100-amp (two)
PEV-readiness Panel 200-amp 400-amp 400-amp (two)
Conduit Length (feet) 55 50 170 330
Trenching Required Yes No No No
Scenario One and Scenario Two assume a 24-vehicle surface parking lot with two PEV parking spaces8 in
either a surface parking area (Scenario One) or an enclosed garage (Scenario Two). This size of parking area
is intended to represent multifamily developments with fewer than 16 dwelling units, which are currently
exempt from CALGreen requirements for PEV-ready parking spaces (the results would likely also represent
similar sized nonresidential parking areas). Twenty-one percent of new multifamily dwelling units are
projected to be located at developments of this size or smaller based on research by Pacific Gas & Electric.9
The number of PEV parking spaces is based on the current CALGreen multifamily voluntary Tier of 5%
rounded up to two spaces.
8 We use “PEV parking space” to mean a space that is either PEV-ready or is served by a full electrical circuit to support PEV
charging.
9 Pacific Gas & Electric December 2, 2013 letter to Mia Marvelli, Building Standards Commission and Emily Withers, California
Department of Housing and Community Development.
Each scenario was modeled for two levels of
infrastructure: “PEV-ready” and a full electrical
circuit. The “PEV-ready” provisions for each scenario
include electrical service panel capacity, plans, and all
underground conduits similar to the requirements
included in the current CALGreen code. A complete
PEV circuit adds wire, circuit breakers, termination
point and surface conduit to the extent not provided by
PEV-readiness standards.
Plug-in Electric Vehicle Infrastructure Cost-Effectiveness Report
5
To achieve PEV-readiness, the electric service panel would be upgraded from 100-amp to 200-amp.
Additional PEV-readiness costs would also include breaking and repairing hardscape for 50 linear feet of
conduit installation in Scenario One and installing a single underground conduit sufficient to accommodate
two PEV charging spaces along with five feet of surface mounted conduit. A full circuit would add wire,
breakers, and an outlet box; and for Scenario Two also surface mounted conduit.
Scenario Three assumes a two level, 60-space enclosed parking area with six PEV parking spaces, which
could serve either a multifamily building or nonresidential parking area. This number of PEV parking spaces
is equal to the CALGreen nonresidential voluntary Tier 2 code. A 225-amp main circuit breaker (3 wire, 3
pole) serving both floors to support elevator, lighting, and other loads would be required in the base case and
would be upgraded to 400-amp to achieve PEV-readiness. Electrical circuits would pass through a six-inch-
thick concrete wall on each floor, resulting in significant costs if installed as a retrofit. Installing a full circuit
would also include circuit breakers and two sets of surface-mounted conduit and wire from an electrical
room running 30 feet vertically between floors and 70 feet horizontally on each floor.
Scenario Four represents a two level, 60-space enclosed parking area with 12 PEV parking spaces, which
exceeds current CALGreen requirements but could be selected by a local jurisdiction to match policy goals
and expected local PEV demand. Two 100-amp main circuit breakers (3 wire, 3 pole) to support lighting and
other loads would be required in the base case and would be upgraded to two 400-amp panels to achieve
PEV-readiness. Electrical circuits would pass through a six-inch-thick wall, again resulting in significant
costs if installed as a retrofit. A full circuit would include circuit breakers and two sets of surface-mounted
conduit and wire from an electrical room running 30 feet vertically between floors and 150 feet inside each
floor.
The components for each scenario will support 40-amp “Level 2,” 110 V Level 1 charging, or a mix of
both.10 Appendix C lists the specific components included in each scenario. The scenarios do not include
sub-metering or separate metering equipment, which are optional but could be selected by a building owner
to access a special electricity rate.
4. RESULTS
The results of the cost-effectiveness analysis show that installing a complete electric circuit for PEV
charging at time of construction provides the largest cost savings compared to retrofit costs. Including key
elements of PEV-ready parking spaces such as underground conduit and sufficient electrical panel capacity
in new construction provides large cost savings while minimizing upfront costs, which may be helpful for
spaces that are expected to be needed in the longer term but not in the immediate future. This section focuses
on Scenario Three and Scenario Four because they represent the highest levels of PEV-readiness in enclosed
garages most common for urban in-fill development. Detailed results of all four scenarios are included in the
Appendix.
This study estimates that retrofitting installation of full electric circuit infrastructure at an existing building
costs about $1,900-$3,000 per parking space for the three enclosed parking scenarios (Scenarios Two, Three,
and Four) and $6,300 per surface parking space for the surface parking scenario (Scenario One). The same
10 The HCD considered requiring complete circuits (at a January 23, 2014 workshop) but ultimately did not adopt this higher
level of PEV charging infrastructure in their final code language. However, this could be considered by local governments. If a
significant amount of Level 1 charging is expected then including at least some PEV-ready spaces without a complete circuit may
be desirable to allow flexibility to install either Level 1 or Level 2 in the future.
Plug-in Electric Vehicle Infrastructure Cost-Effectiveness Report
6
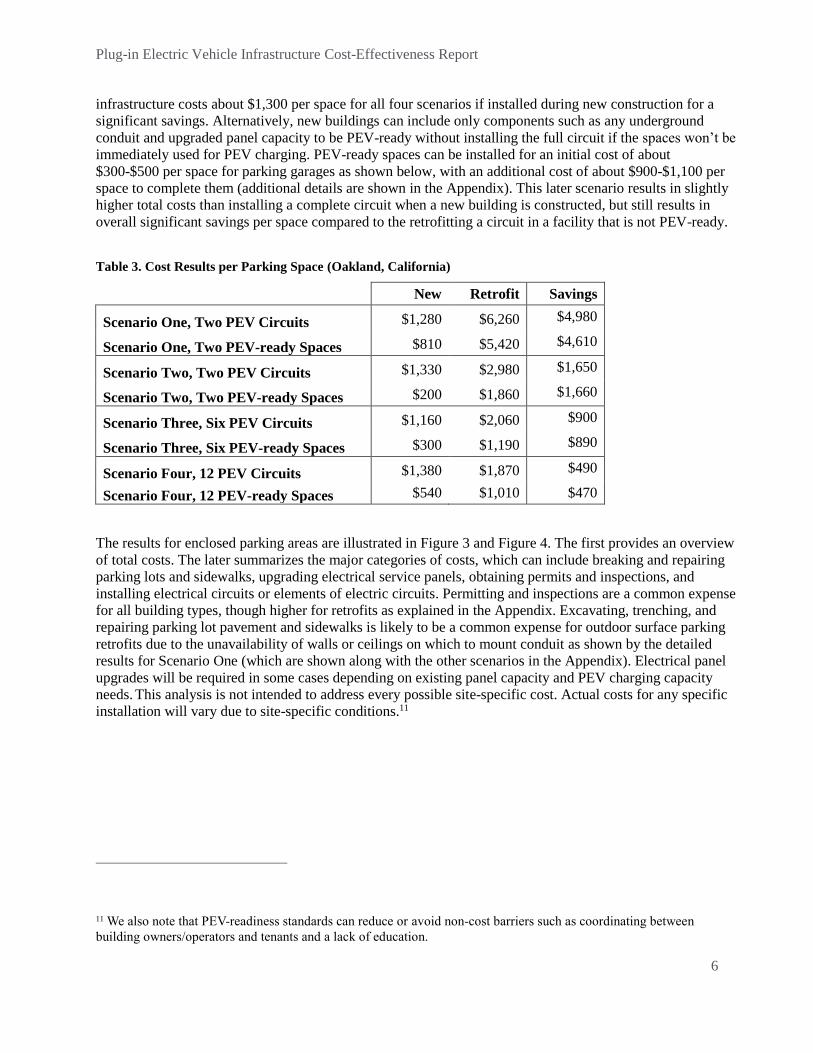
infrastructure costs about $1,300 per space for all four scenarios if installed during new construction for a
significant savings. Alternatively, new buildings can include only components such as any underground
conduit and upgraded panel capacity to be PEV-ready without installing the full circuit if the spaces won’t be
immediately used for PEV charging. PEV-ready spaces can be installed for an initial cost of about
$300-$500 per space for parking garages as shown below, with an additional cost of about $900-$1,100 per
space to complete them (additional details are shown in the Appendix). This later scenario results in slightly
higher total costs than installing a complete circuit when a new building is constructed, but still results in
overall significant savings per space compared to the retrofitting a circuit in a facility that is not PEV-ready.
Table 3. Cost Results per Parking Space (Oakland, California)
New Retrofit Savings
Scenario One, Two PEV Circuits $1,280 $6,260 $4,980
Scenario One, Two PEV-ready Spaces $810 $5,420 $4,610
Scenario Two, Two PEV Circuits $1,330 $2,980 $1,650
Scenario Two, Two PEV-ready Spaces $200 $1,860 $1,660
Scenario Three, Six PEV Circuits $1,160 $2,060 $900
Scenario Three, Six PEV-ready Spaces $300 $1,190 $890
Scenario Four, 12 PEV Circuits $1,380 $1,870 $490
Scenario Four, 12 PEV-ready Spaces $540 $1,010 $470
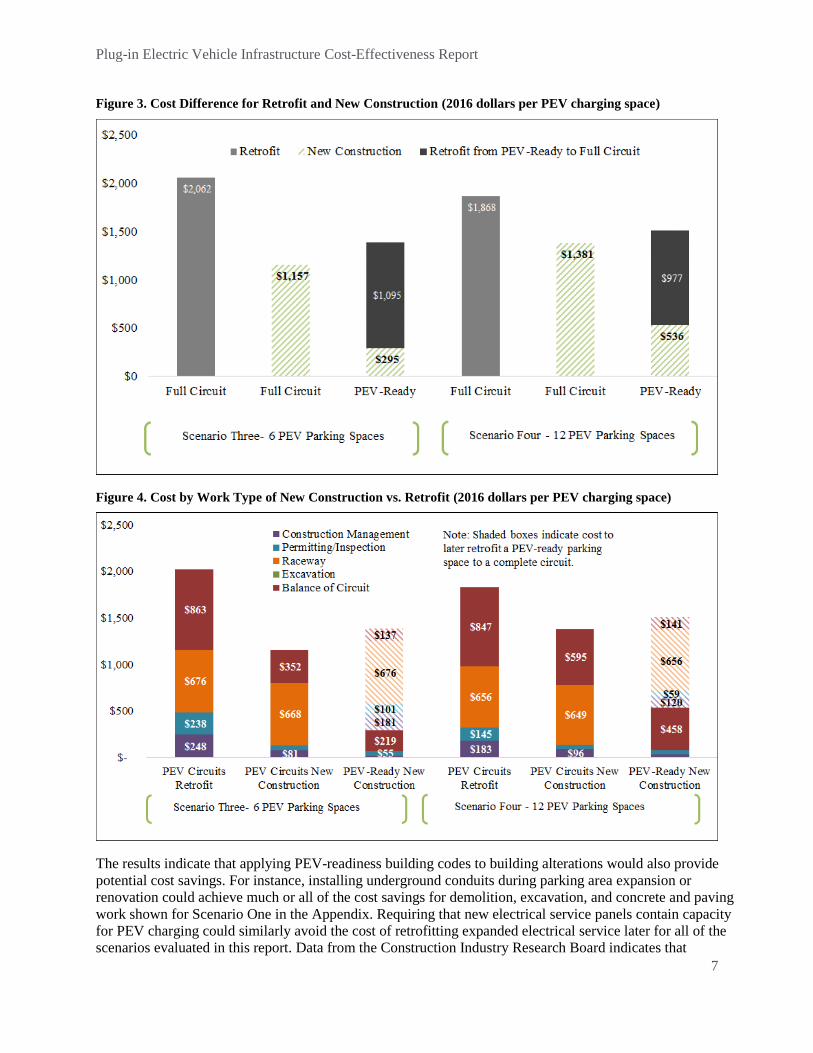
The results for enclosed parking areas are illustrated in Figure 3 and Figure 4. The first provides an overview
of total costs. The later summarizes the major categories of costs, which can include breaking and repairing
parking lots and sidewalks, upgrading electrical service panels, obtaining permits and inspections, and
installing electrical circuits or elements of electric circuits. Permitting and inspections are a common expense
for all building types, though higher for retrofits as explained in the Appendix. Excavating, trenching, and
repairing parking lot pavement and sidewalks is likely to be a common expense for outdoor surface parking
retrofits due to the unavailability of walls or ceilings on which to mount conduit as shown by the detailed
results for Scenario One (which are shown along with the other scenarios in the Appendix). Electrical panel
upgrades will be required in some cases depending on existing panel capacity and PEV charging capacity
needs. This analysis is not intended to address every possible site-specific cost. Actual costs for any specific
installation will vary due to site-specific conditions.11
11 We also note that PEV-readiness standards can reduce or avoid non-cost barriers such as coordinating between
building owners/operators and tenants and a lack of education.
Plug-in Electric Vehicle Infrastructure Cost-Effectiveness Report
7
Figure 3. Cost Difference for Retrofit and New Construction (2016 dollars per PEV charging space)
Figure 4. Cost by Work Type of New Construction vs. Retrofit (2016 dollars per PEV charging space)
The results indicate that applying PEV-readiness building codes to building alterations would also provide
potential cost savings. For instance, installing underground conduits during parking area expansion or
renovation could achieve much or all of the cost savings for demolition, excavation, and concrete and paving
work shown for Scenario One in the Appendix. Requiring that new electrical service panels contain capacity
for PEV charging could similarly avoid the cost of retrofitting expanded electrical service later for all of the
scenarios evaluated in this report. Data from the Construction Industry Research Board indicates that
Plug-in Electric Vehicle Infrastructure Cost-Effectiveness Report
8
alterations and additions represent about 21% of the value of permitted construction for both residential and
nonresidential new construction.12
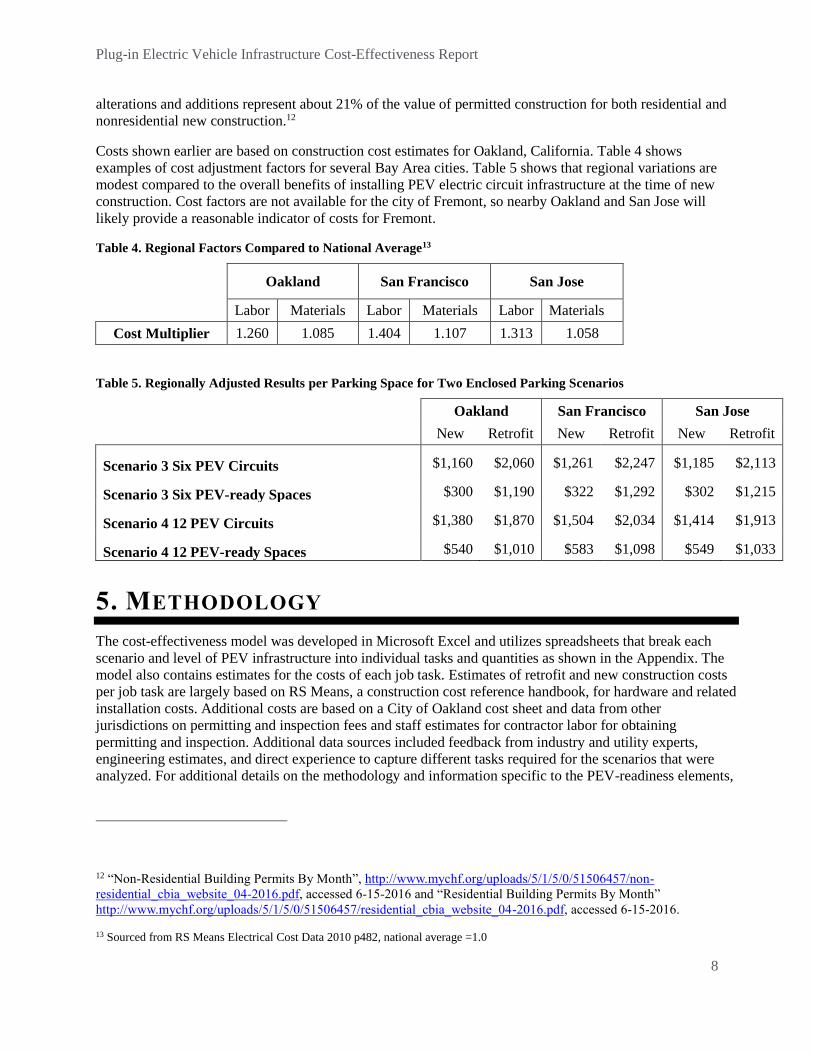
Costs shown earlier are based on construction cost estimates for Oakland, California. Table 4 shows
examples of cost adjustment factors for several Bay Area cities. Table 5 shows that regional variations are
modest compared to the overall benefits of installing PEV electric circuit infrastructure at the time of new
construction. Cost factors are not available for the city of Fremont, so nearby Oakland and San Jose will
likely provide a reasonable indicator of costs for Fremont.
Table 4. Regional Factors Compared to National Average13
Oakland San Francisco San Jose
Labor Materials Labor Materials Labor Materials
Cost Multiplier 1.260 1.085 1.404 1.107 1.313 1.058
Table 5. Regionally Adjusted Results per Parking Space for Two Enclosed Parking Scenarios
Oakland San Francisco San Jose
New Retrofit New Retrofit New Retrofit
Scenario 3 Six PEV Circuits $1,160 $2,060 $1,261 $2,247 $1,185 $2,113
Scenario 3 Six PEV-ready Spaces $300 $1,190 $322 $1,292 $302 $1,215
Scenario 4 12 PEV Circuits $1,380 $1,870 $1,504 $2,034 $1,414 $1,913
Scenario 4 12 PEV-ready Spaces $540 $1,010 $583 $1,098 $549 $1,033
5. METHODOLOGY
The cost-effectiveness model was developed in Microsoft Excel and utilizes spreadsheets that break each
scenario and level of PEV infrastructure into individual tasks and quantities as shown in the Appendix. The
model also contains estimates for the costs of each job task. Estimates of retrofit and new construction costs
per job task are largely based on RS Means, a construction cost reference handbook, for hardware and related
installation costs. Additional costs are based on a City of Oakland cost sheet and data from other
jurisdictions on permitting and inspection fees and staff estimates for contractor labor for obtaining
permitting and inspection. Additional data sources included feedback from industry and utility experts,
engineering estimates, and direct experience to capture different tasks required for the scenarios that were
analyzed. For additional details on the methodology and information specific to the PEV-readiness elements,
12 “Non-Residential Building Permits By Month”, http://www.mychf.org/uploads/5/1/5/0/51506457/non-
residential_cbia_website_04-2016.pdf, accessed 6-15-2016 and “Residential Building Permits By Month”
http://www.mychf.org/uploads/5/1/5/0/51506457/residential_cbia_website_04-2016.pdf, accessed 6-15-2016.
13 Sourced from RS Means Electrical Cost Data 2010 p482, national average =1.0
Plug-in Electric Vehicle Infrastructure Cost-Effectiveness Report
9
please see Appendix C.
The cost-effectiveness model includes four hypothetical installation scenarios to allow easy comparison of
costs between different levels of PEV-readiness for both new construction and retrofit projects. Actual
project costs and configurations will likely vary from these cases, which are intended to provide
representative examples for comparison purposes rather than estimate site-specific costs. The modeled costs
exclude design work and other project-specific costs outside the scope of CALGreen building codes such as
signage, lighting, pedestal mounting, bollards, wheel stops, longer conduit runs, and contingencies.14 The
model also does not include utility-side infrastructure such as sizing transformer pads and connections to
accommodate potential swap-out for a larger capacity transformer.15 The scenarios also do not include a
separate utility sub-meter.16
6. COMPARISON TO CALIFORNIA PEVC CASE
STUDIES
The Plug-in Electric Vehicle Collaborative (PEVC) workplace charging study, “Amping up California
Workplaces” (2013) reports a range of retrofit installation costs per charger for workplace charging,
including both private and public parking. The costs for the enclosed parking PEV circuit retrofit case in the
Plug-In Electric Vehicle Infrastructure Cost-Effectiveness Report tend to be closest to the low end of
examples listed by the PEVC project ($2,300). This is likely because this report is intended to address
common costs for certain scenarios and not a complete set of potential site-specific costs as noted earlier.17
Thus, it may be conservative and the cost savings that would be achieved by PEV-readiness CALGreen
standards may be greater than the figures presented in this report. The types of cost savings shown in this
summary due to building codes are consistent with a PEVC document noting categories of significant
expense for retrofitting PEV infrastructure in multi-unit housing.18
The surface parking costs in this Plug-in Electric Vehicle Infrastructure Cost-Effectiveness Report fall
roughly in the middle of the cost estimates reported by the PEVC project. The PEVC report finds that “… if
the installation entails trenching or asphalt and cement excavation, costs will increase. The cost of such work
14 RS Means specifies a range of potential design costs, while noting that design costs will likely be 50% higher for alterations.
15 We note that sizing a transformer pad and connections for a transformer with the capacity to accommodate expected future
PEV charging load is a significant source of cost savings, even if a larger transformer is not actually installed until later when
required to accommodate PEV load. We note that a report prepared by HCD – “Report on Electric Vehicle Readiness” dated
November 2013 provides some data on transformer costs.
16 A sub-meter may be a desirable add-on for some building owners or PEV drivers to allocate electricity costs and/or provide
access to utility PEV charging electricity tariffs, though some special electricity rates for PEV owners are available through
whole-house rates and utilities are also conducting pilots of metering via electric vehicle service equipment. We believe that
builders wishing to install a socket for a sub-meter at the time of new construction may achieve cost savings compared to retrofits
but we have not quantified this potential.
17 California Plug-In Electric Vehicle Collaborative. 2013. “Amping up California Workplaces: 20 case studies on plug-in
electric vehicle charging at work”. November. http://www.evcollaborative.org/sites/all/themes/pev/files/WPC_Report4web.pdf.
18 California Plug-In Electric Vehicle Collaborative. 2013. “Plug-in Electric Vehicle Charging Infrastructure Guidelines for
Multi-unit Dwellings”. November. http://www.evcollaborative.org/sites/all/themes/pev/files/MUD_Guidelines4web.pdf . This
report notes that drilling through walls and parking decks at multifamily parking garages can be expensive.

Plug-in Electric Vehicle Infrastructure Cost-Effectiveness Report
10
can easily exceed the cost of the EVSE unit itself.” This finding is consistent with the results of the PEV-
Readiness Cost-Effectiveness Report finding that asphalt and concrete removal and repair for the surface
parking examples are a major expense.
Plug-in Electric Vehicle Infrastructure Cost-Effectiveness Report
11
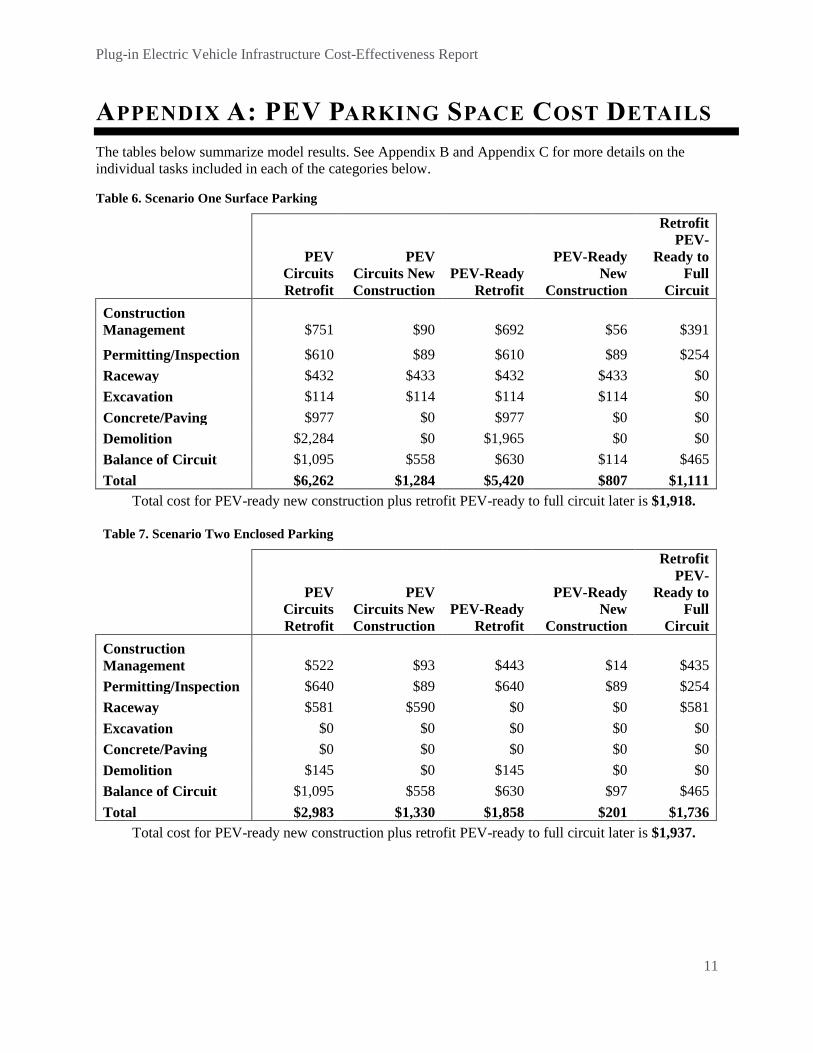
APPENDIX A: PEV PARKING SPACE COST DETAILS
The tables below summarize model results. See Appendix B and Appendix C for more details on the
individual tasks included in each of the categories below.
Table 6. Scenario One Surface Parking
PEV
Circuits
Retrofit
PEV
Circuits New
Construction
PEV-Ready
Retrofit
PEV-Ready
New
Construction
Retrofit
PEV-
Ready to
Full
Circuit
Construction
Management $751 $90 $692 $56 $391
Permitting/Inspection $610 $89 $610 $89 $254
Raceway $432 $433 $432 $433 $0
Excavation $114 $114 $114 $114 $0
Concrete/Paving $977 $0 $977 $0 $0
Demolition $2,284 $0 $1,965 $0 $0
Balance of Circuit $1,095 $558 $630 $114 $465
Total $6,262 $1,284 $5,420 $807 $1,111
Total cost for PEV-ready new construction plus retrofit PEV-ready to full circuit later is $1,918.
Table 7. Scenario Two Enclosed Parking
PEV
Circuits
Retrofit
PEV
Circuits New
Construction
PEV-Ready
Retrofit
PEV-Ready
New
Construction
Retrofit
PEV-
Ready to
Full
Circuit
Construction
Management $522 $93 $443 $14 $435
Permitting/Inspection $640 $89 $640 $89 $254
Raceway $581 $590 $0 $0 $581
Excavation $0 $0 $0 $0 $0
Concrete/Paving $0 $0 $0 $0 $0
Demolition $145 $0 $145 $0 $0
Balance of Circuit $1,095 $558 $630 $97 $465
Total $2,983 $1,330 $1,858 $201 $1,736
Total cost for PEV-ready new construction plus retrofit PEV-ready to full circuit later is $1,937.
Plug-in Electric Vehicle Infrastructure Cost-Effectiveness Report
12
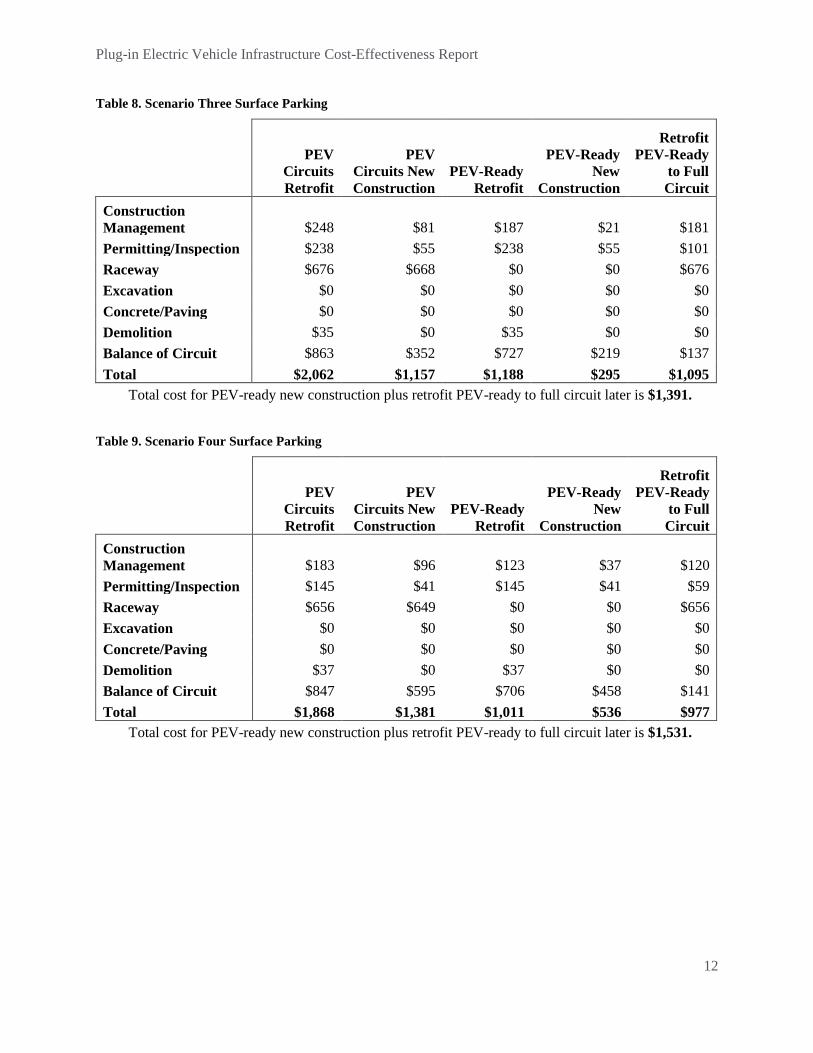
Table 8. Scenario Three Surface Parking
PEV
Circuits
Retrofit
PEV
Circuits New
Construction
PEV-Ready
Retrofit
PEV-Ready
New
Construction
Retrofit
PEV-Ready
to Full
Circuit
Construction
Management $248 $81 $187 $21 $181
Permitting/Inspection $238 $55 $238 $55 $101
Raceway $676 $668 $0 $0 $676
Excavation $0 $0 $0 $0 $0
Concrete/Paving $0 $0 $0 $0 $0
Demolition $35 $0 $35 $0 $0
Balance of Circuit $863 $352 $727 $219 $137
Total $2,062 $1,157 $1,188 $295 $1,095
Total cost for PEV-ready new construction plus retrofit PEV-ready to full circuit later is $1,391.
Table 9. Scenario Four Surface Parking
PEV
Circuits
Retrofit
PEV
Circuits New
Construction
PEV-Ready
Retrofit
PEV-Ready
New
Construction
Retrofit
PEV-Ready
to Full
Circuit
Construction
Management $183 $96 $123 $37 $120
Permitting/Inspection $145 $41 $145 $41 $59
Raceway $656 $649 $0 $0 $656
Excavation $0 $0 $0 $0 $0
Concrete/Paving $0 $0 $0 $0 $0
Demolition $37 $0 $37 $0 $0
Balance of Circuit $847 $595 $706 $458 $141
Total $1,868 $1,381 $1,011 $536 $977
Total cost for PEV-ready new construction plus retrofit PEV-ready to full circuit later is $1,531.
Plug-in Electric Vehicle Infrastructure Cost-Effectiveness Report
13
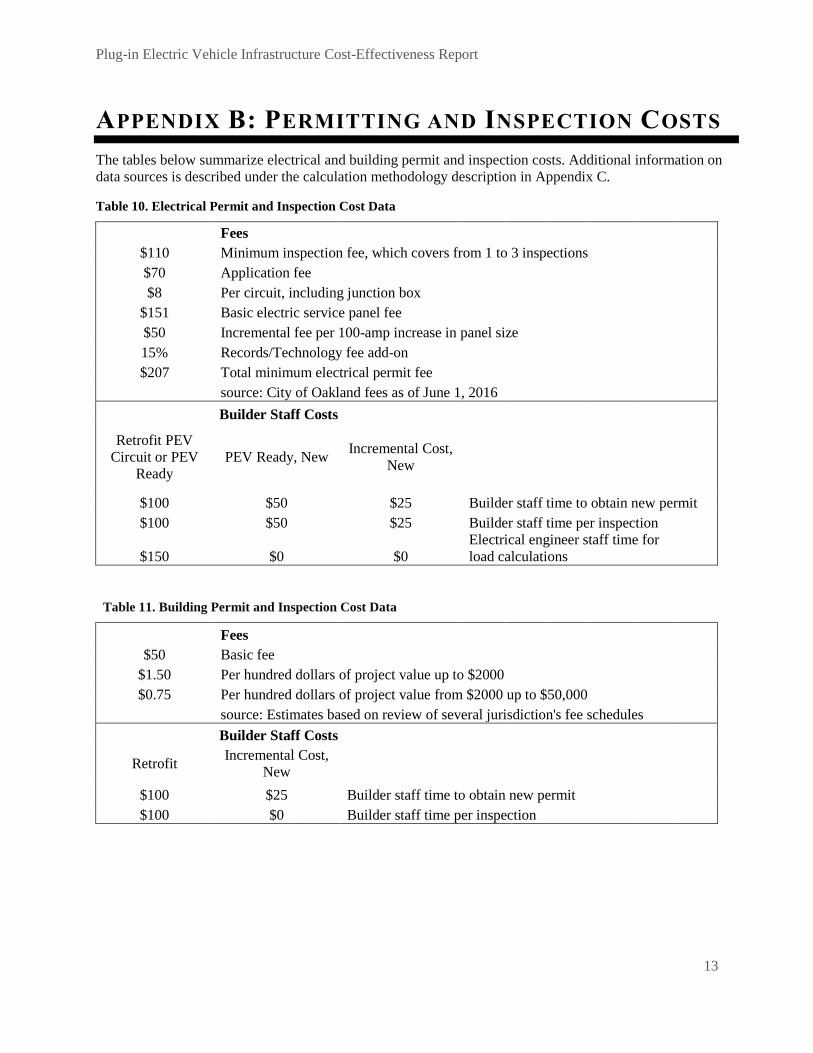
APPENDIX B: PERMITTING AND INSPECTION COSTS
The tables below summarize electrical and building permit and inspection costs. Additional information on
data sources is described under the calculation methodology description in Appendix C.
Table 10. Electrical Permit and Inspection Cost Data
Fees
$110 Minimum inspection fee, which covers from 1 to 3 inspections
$70 Application fee
$8 Per circuit, including junction box
$151 Basic electric service panel fee
$50 Incremental fee per 100-amp increase in panel size
15% Records/Technology fee add-on
$207 Total minimum electrical permit fee
source: City of Oakland fees as of June 1, 2016
Builder Staff Costs
Retrofit PEV
Circuit or PEV
Ready
PEV Ready, New Incremental Cost,
New
$100 $50 $25 Builder staff time to obtain new permit
$100 $50 $25 Builder staff time per inspection
$150 $0 $0
Electrical engineer staff time for
load calculations
Table 11. Building Permit and Inspection Cost Data
Fees
$50 Basic fee
$1.50 Per hundred dollars of project value up to $2000
$0.75 Per hundred dollars of project value from $2000 up to $50,000
source: Estimates based on review of several jurisdiction's fee schedules
Builder Staff Costs
Retrofit Incremental Cost,
New
$100 $25 Builder staff time to obtain new permit
$100 $0 Builder staff time per inspection
Plug-in Electric Vehicle Infrastructure Cost-Effectiveness Report
14
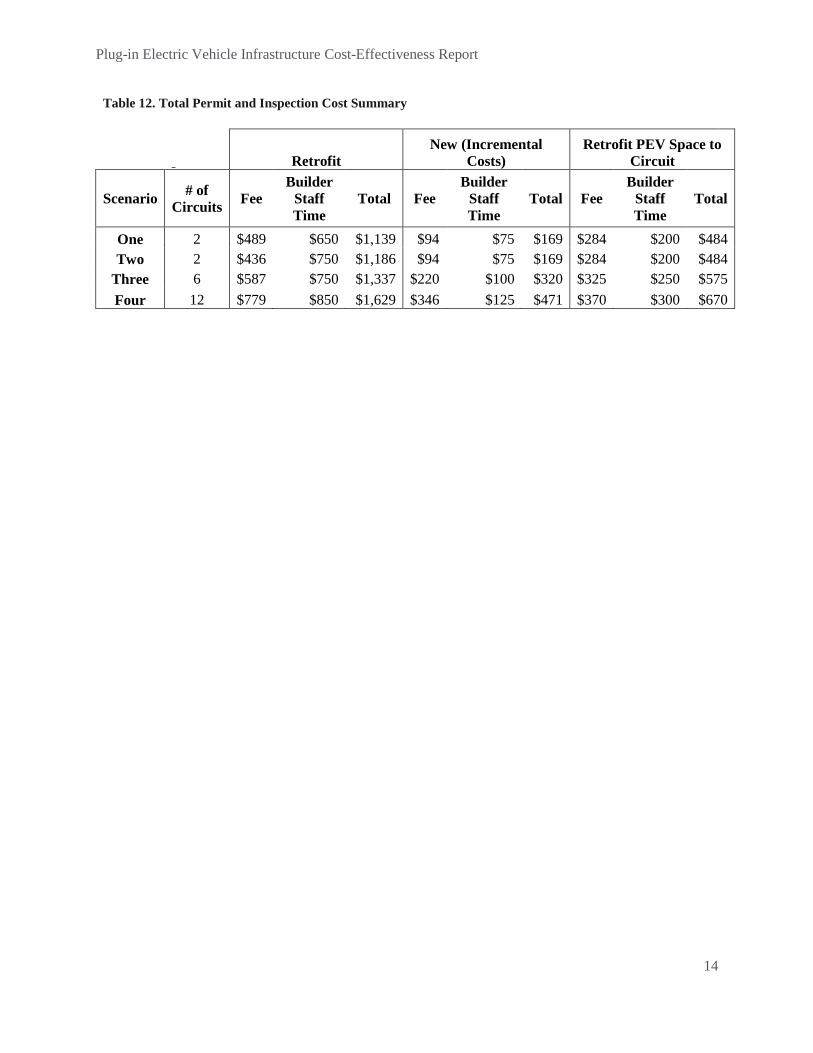
Table 12. Total Permit and Inspection Cost Summary
Retrofit
New (Incremental
Costs)
Retrofit PEV Space to
Circuit
Scenario # of
Circuits Fee
Builder
Staff
Time
Total Fee
Builder
Staff
Time
Total Fee
Builder
Staff
Time
Total
One 2 $489 $650 $1,139 $94 $75 $169 $284 $200 $484
Two 2 $436 $750 $1,186 $94 $75 $169 $284 $200 $484
Three 6 $587 $750 $1,337 $220 $100 $320 $325 $250 $575
Four 12 $779 $850 $1,629 $346 $125 $471 $370 $300 $670
Plug-in Electric Vehicle Infrastructure Cost-Effectiveness Report
15
APPENDIX C: CALCULATION METHODOLOGY
Data Sources
Estimates of retrofit and new construction costs were based on data from RS Means Quarter 3 2013, a
construction cost reference handbook, for hardware and related installation costs; City of Oakland cost sheet
for permitting fees; and staff estimates for contractor labor for obtaining permitting and inspection. Costs
were escalated to 2016 using US Bureau of Labor Statistics Producer Price Index statistics for materials19
and California Director of Industrial Relations labor costs for Oakland from 2013 to 2016.20 Additional data
sources included feedback from industry experts, engineering estimates and direct experience to capture
different tasks required for the scenarios that were analyzed. Table 13 and Table 14 contain a list of all tasks
included in the analysis.
General Assumptions We made the following general assumptions:
Cost estimates include a fixed general overhead and profit factor.21 Overhead cost for smaller retrofit
projects will likely be higher than PEV-readiness tasks bundled with new development. We added an
estimated cost for project initiation and cost-estimation, assuming that most of this cost would be
passed on to the customer and a portion would be absorbed by the contractor.
Labor costs are based on union labor. The use of union labor can vary from project to project.
Geographic adjustments are based on 2010 RS Means Electrical Cost Data page 465.
In a number of cases RS Means contains minimum retrofit task costs.22 In these cases the lesser of
the minimum task cost or the sum of the actual task costs was applied. Where related tasks had
separate minimum task costs but the labor crew could likely also perform a related task, we applied
only one minimum labor charge.23
Permit and Inspection Fees Permitting costs for breaking concrete and/or pavement in addition to electrical work are based on City of
Oakland fees of $70 per application and a minimum of $110 per inspection plus a technology and records
19 Material cost adjustment 2013 to 2016 are based on Producer Price Index category 1175 "Switchgrear, switchboard and
industrial controls" relative index from Nov 2013 to March 2016 which shows virtually no change.
http://www.bls.gov/ppi/ppidr201311.pdf 20 See http://www.dir.ca.gov/OPRL/main.htm prevailing wage and superseded prevailing wage determinations for electrical job
categories.
21 Individual RS Means line items related to overhead (under General Requirements) are assumed to be addressed by overhead
and profit.
22 Minimum task costs are typically not relevant for new construction due to the overall project scale.
23 For instance, we assume that a concrete sawing and demolition crew deployed for a day for a retrofit project could also drill
concrete walls if concrete sawing required less than 8 hours (some additional equipment would be required).
Plug-in Electric Vehicle Infrastructure Cost-Effectiveness Report
16
fee.24 Electrical inspection fees can exceed the minimum depending on the capacity and quantity of electric
panels and number of circuits. The total estimated costs include rough and final building and electrical
permit fees where applicable. Building permits are generally not required for converting PEV-ready spaces
to full circuits, and the cost for adding work in new construction is assumed to be relatively low. Builder
staff time for permit filing and inspections are included at $100/hour. Permit and inspection costs may vary
between regions.
We assume a small additional amount of labor to accommodate an inspection of PEV-specific elements in
new construction. Please see Appendix B for more details.
Paving and Conduit Sidewalks are assumed to be four-inch-thick and made of concrete, and asphalt pavement is assumed to be a
six-inch aggregate base and three-inch pavement.25 Trenching is included for both new construction and
retrofit surface parking. Conduits are assumed to serve two circuits each, whether below grade or surface
mounted. No additional curbs or bollards are assumed.
Termination Point The termination point is assumed to consist of an outlet box with a face plate and no electric vehicle service
equipment (i.e. the unit that connects to the vehicle) installed at the time of construction. No termination
point is included for the PEV-ready spaces.
Equipment Rentals We assume one day of equipment rental for a backhoe, concrete mixer and asphalt spreader for surface
parking retrofits. We assume a half-day of operating cost (labor and fuel) based on the expectation that this
equipment may not be continuously utilized, and that workers could perform other tasks when that
equipment was not in use.26 A 40-horsepower backhoe was assumed to be sufficient for loading of
excavated asphalt and concrete in the retrofit case.27
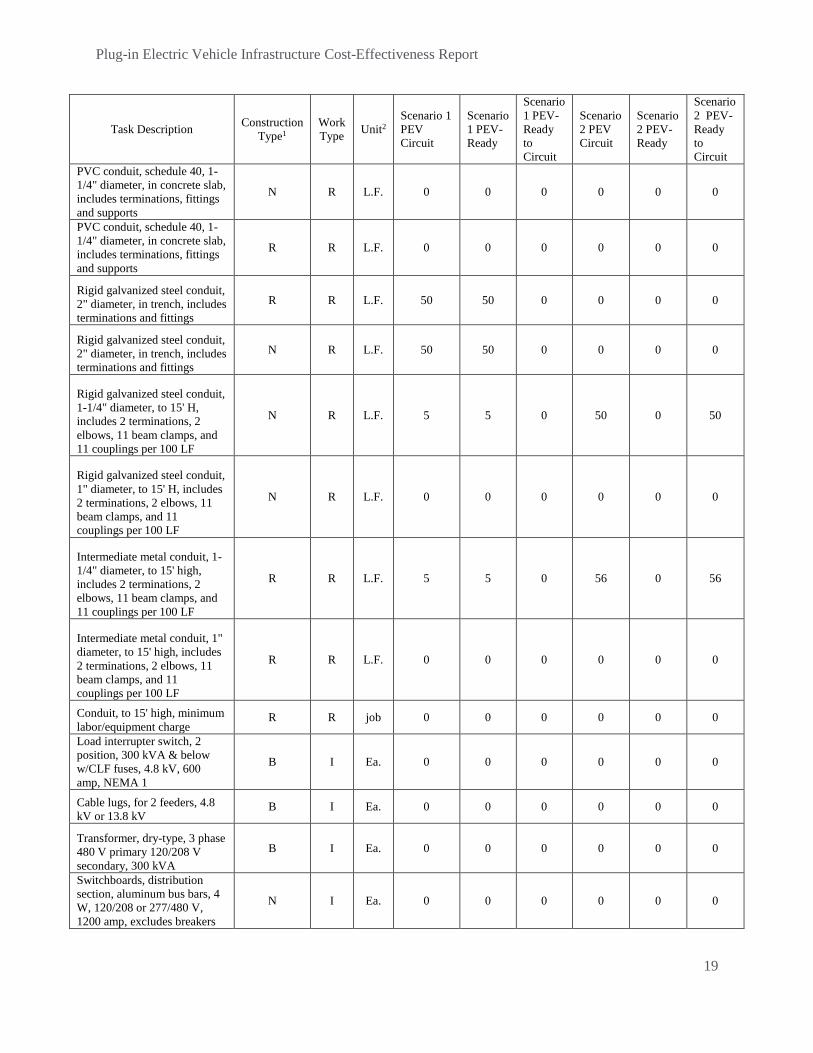
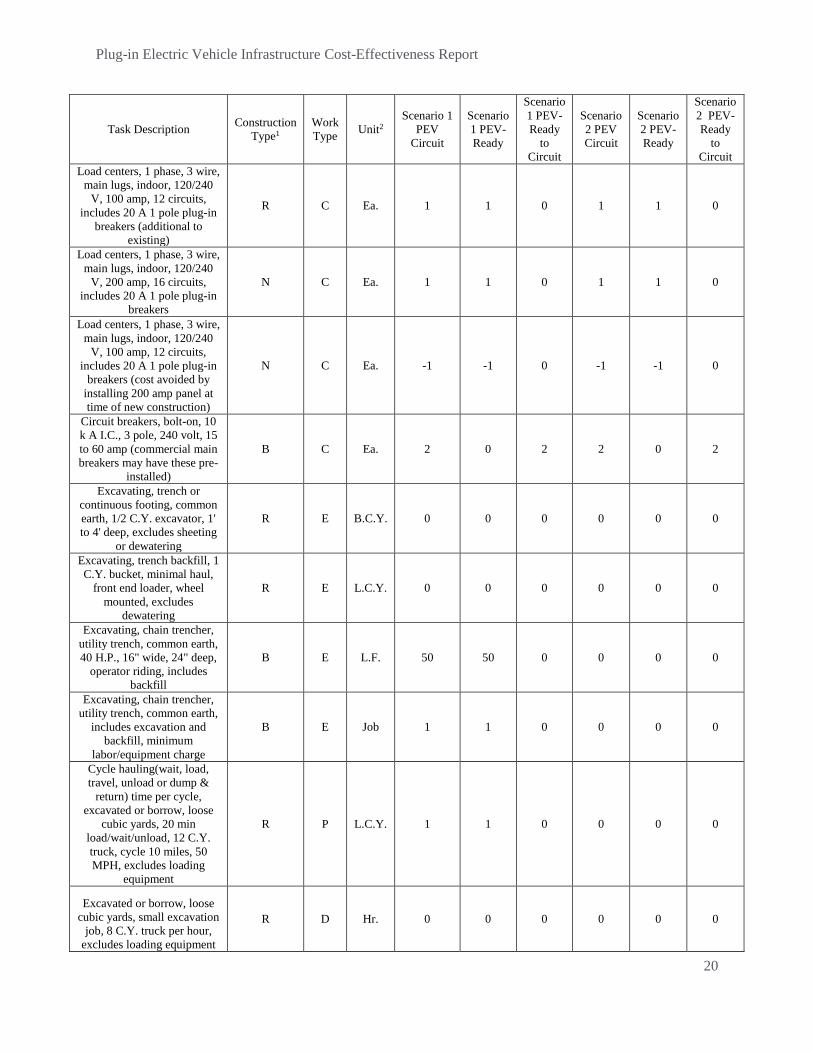
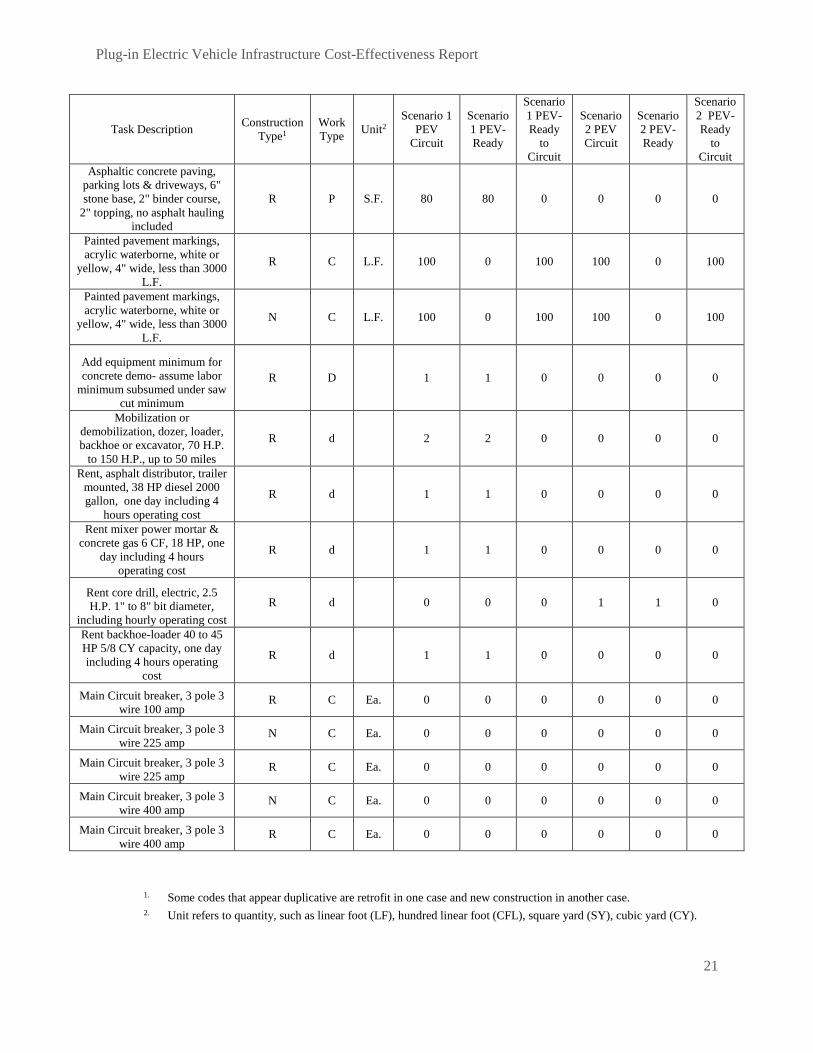
Task Descriptions Task descriptions for each scenario are listed below in Table 13 and Table 14. The tables list tasks with a
note to designate where the task applies to retrofits, new construction or both. Tasks are listed with a “0”
quantity where they do not apply or are subsumed in cases where minimum job costs are assumed. A
negative number indicates the avoidance of smaller electrical panel due to installation of a larger panel.
24 http://www2.oaklandnet.com/Government/o/PBN/OurOrganization/BuildingServices/s/Permits/index.htm
25 “Sidewalk Repair Manual”. 2013. City of Portland Bureau of Transportation April.
http://www.portlandoregon.gov/transportation/article/443054; Asphalt Paving Association of Idaho design guide:
http://www.apai.net/cmdocs/apai/designguide/Chapter_5B.pdf.
26 We assume that even if this equipment was needed for less than 8 hrs, it could not be demobilized and transportation to another
job site in time for use on that alternate job site on the same day thus a full days cost would be incurred.
27 A 40 hp backhoe with 3,300 lb lift capacity was assumed sufficient (Coyote C14 LB from www.specguideonline.com) which
falls into the smallest bin listed in RS Means. Total mass of asphalt to be excavated was calculated at 14.5 tons at the National
Asphalt Pavement Association: http://www.asphaltpavement.org/ and 40 hp backhoe lift capacity was assumed sufficient to
economically excavate and lift both asphalt as well as additional concrete material to be removed in the retrofit case.
Plug-in Electric Vehicle Infrastructure Cost-Effectiveness Report
17
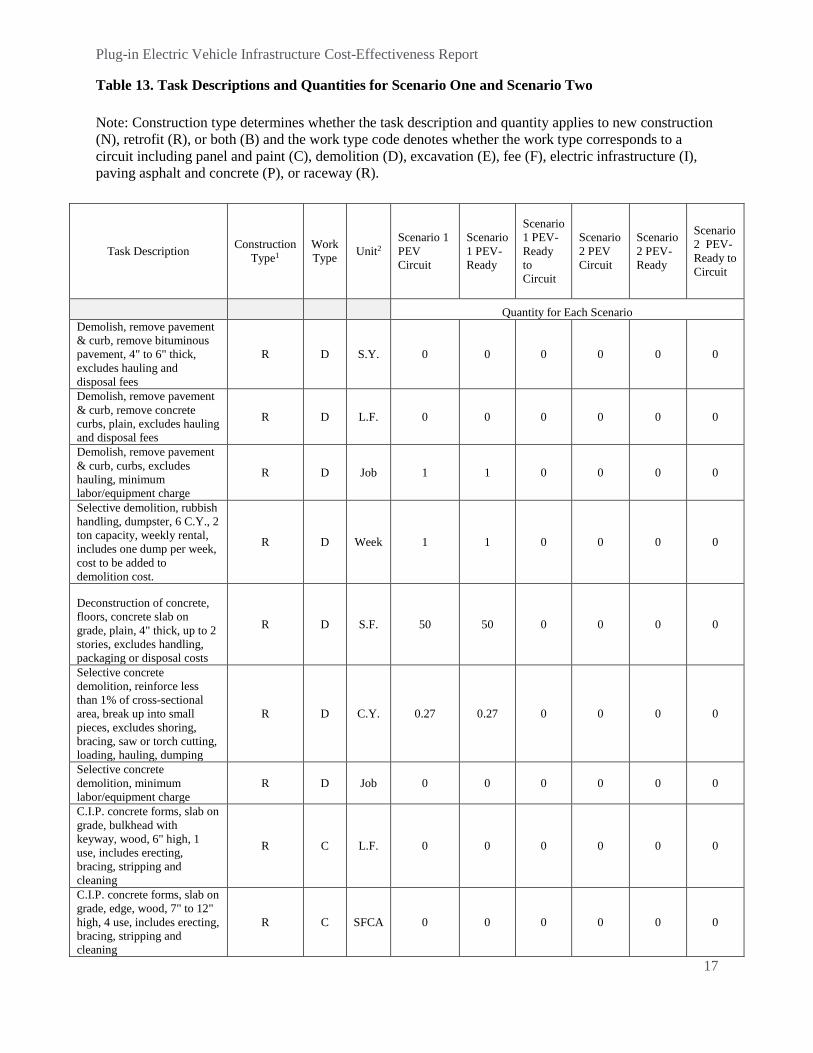
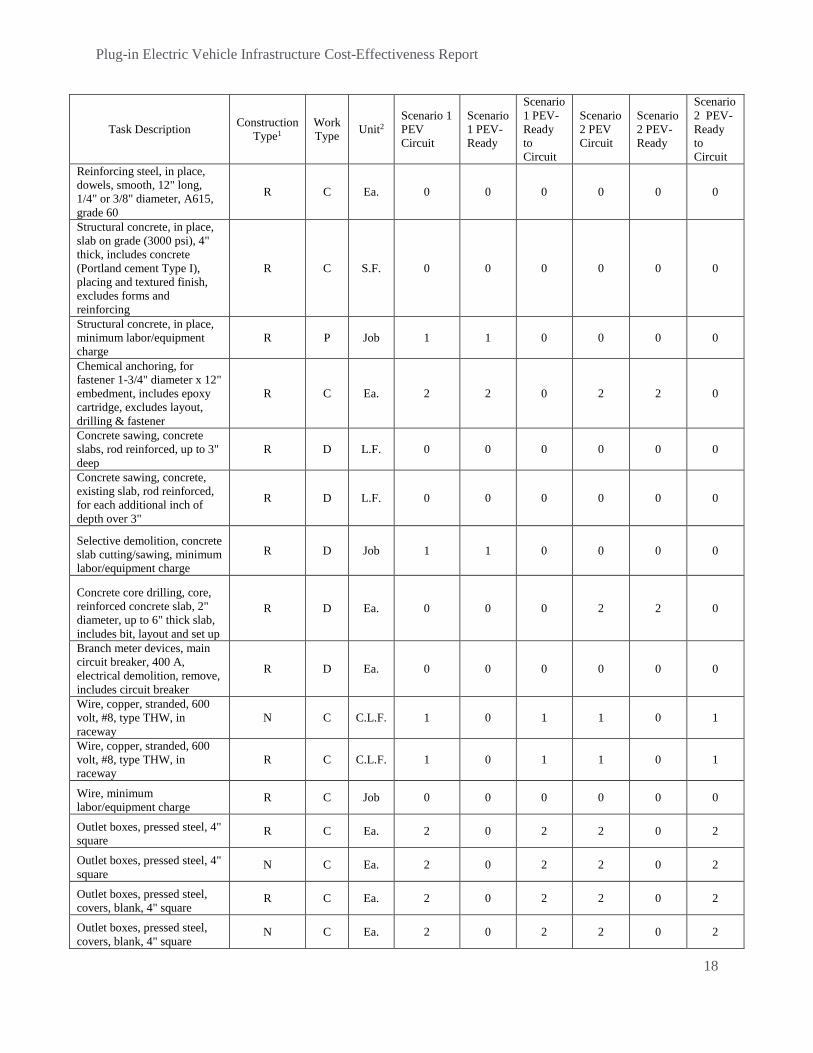
Table 13. Task Descriptions and Quantities for Scenario One and Scenario Two
Note: Construction type determines whether the task description and quantity applies to new construction
(N), retrofit (R), or both (B) and the work type code denotes whether the work type corresponds to a
circuit including panel and paint (C), demolition (D), excavation (E), fee (F), electric infrastructure (I),
paving asphalt and concrete (P), or raceway (R).
Task Description Construction
Type1
Work
Type Unit2
Scenario 1
PEV
Circuit
Scenario
1 PEV-
Ready
Scenario
1 PEV-
Ready
to
Circuit
Scenario
2 PEV
Circuit
Scenario
2 PEV-
Ready
Scenario
2 PEV-
Ready to
Circuit
Quantity for Each Scenario
Demolish, remove pavement
& curb, remove bituminous
pavement, 4" to 6" thick,
excludes hauling and
disposal fees
R D S.Y. 0 0 0 0 0 0
Demolish, remove pavement
& curb, remove concrete
curbs, plain, excludes hauling
and disposal fees
R D L.F. 0 0 0 0 0 0
Demolish, remove pavement
& curb, curbs, excludes
hauling, minimum
labor/equipment charge
R D Job 1 1 0 0 0 0
Selective demolition, rubbish
handling, dumpster, 6 C.Y., 2
ton capacity, weekly rental,
includes one dump per week,
cost to be added to
demolition cost.
R D Week 1 1 0 0 0 0
Deconstruction of concrete,
floors, concrete slab on
grade, plain, 4" thick, up to 2
stories, excludes handling,
packaging or disposal costs
R D S.F. 50 50 0 0 0 0
Selective concrete
demolition, reinforce less
than 1% of cross-sectional
area, break up into small
pieces, excludes shoring,
bracing, saw or torch cutting,
loading, hauling, dumping
R D C.Y. 0.27 0.27 0 0 0 0
Selective concrete
demolition, minimum
labor/equipment charge
R D Job 0 0 0 0 0 0
C.I.P. concrete forms, slab on
grade, bulkhead with
keyway, wood, 6" high, 1
use, includes erecting,
bracing, stripping and
cleaning
R C L.F. 0 0 0 0 0 0
C.I.P. concrete forms, slab on
grade, edge, wood, 7" to 12"
high, 4 use, includes erecting,
bracing, stripping and
cleaning
R C SFCA 0 0 0 0 0 0
Plug-in Electric Vehicle Infrastructure Cost-Effectiveness Report
18
Task Description Construction
Type1
Work
Type Unit2
Scenario 1
PEV
Circuit
Scenario
1 PEV-
Ready
Scenario
1 PEV-
Ready
to
Circuit
Scenario
2 PEV
Circuit
Scenario
2 PEV-
Ready
Scenario
2 PEV-
Ready
to
Circuit
Reinforcing steel, in place,
dowels, smooth, 12" long,
1/4" or 3/8" diameter, A615,
grade 60
R C Ea. 0 0 0 0 0 0
Structural concrete, in place,
slab on grade (3000 psi), 4"
thick, includes concrete
(Portland cement Type I),
placing and textured finish,
excludes forms and
reinforcing
R C S.F. 0 0 0 0 0 0
Structural concrete, in place,
minimum labor/equipment
charge
R P Job 1 1 0 0 0 0
Chemical anchoring, for
fastener 1-3/4" diameter x 12"
embedment, includes epoxy
cartridge, excludes layout,
drilling & fastener
R C Ea. 2 2 0 2 2 0
Concrete sawing, concrete
slabs, rod reinforced, up to 3"
deep
R D L.F. 0 0 0 0 0 0
Concrete sawing, concrete,
existing slab, rod reinforced,
for each additional inch of
depth over 3"
R D L.F. 0 0 0 0 0 0
Selective demolition, concrete
slab cutting/sawing, minimum
labor/equipment charge
R D Job 1 1 0 0 0 0
Concrete core drilling, core,
reinforced concrete slab, 2"
diameter, up to 6" thick slab,
includes bit, layout and set up
R D Ea. 0 0 0 2 2 0
Branch meter devices, main
circuit breaker, 400 A,
electrical demolition, remove,
includes circuit breaker
R D Ea. 0 0 0 0 0 0
Wire, copper, stranded, 600
volt, #8, type THW, in
raceway
N C C.L.F. 1 0 1 1 0 1
Wire, copper, stranded, 600
volt, #8, type THW, in
raceway
R C C.L.F. 1 0 1 1 0 1
Wire, minimum
labor/equipment charge R C Job 0 0 0 0 0 0
Outlet boxes, pressed steel, 4"
square R C Ea. 2 0 2 2 0 2
Outlet boxes, pressed steel, 4"
square N C Ea. 2 0 2 2 0 2
Outlet boxes, pressed steel,
covers, blank, 4" square R C Ea. 2 0 2 2 0 2
Outlet boxes, pressed steel,
covers, blank, 4" square N C Ea. 2 0 2 2 0 2
Plug-in Electric Vehicle Infrastructure Cost-Effectiveness Report
19
Task Description Construction
Type1
Work
Type Unit2
Scenario 1
PEV
Circuit
Scenario
1 PEV-
Ready
Scenario
1 PEV-
Ready
to
Circuit
Scenario
2 PEV
Circuit
Scenario
2 PEV-
Ready
Scenario
2 PEV-
Ready
to
Circuit
PVC conduit, schedule 40, 1-
1/4" diameter, in concrete slab,
includes terminations, fittings
and supports
N R L.F. 0 0 0 0 0 0
PVC conduit, schedule 40, 1-
1/4" diameter, in concrete slab,
includes terminations, fittings
and supports
R R L.F. 0 0 0 0 0 0
Rigid galvanized steel conduit,
2" diameter, in trench, includes
terminations and fittings
R R L.F. 50 50 0 0 0 0
Rigid galvanized steel conduit,
2" diameter, in trench, includes
terminations and fittings
N R L.F. 50 50 0 0 0 0
Rigid galvanized steel conduit,
1-1/4" diameter, to 15' H,
includes 2 terminations, 2
elbows, 11 beam clamps, and
11 couplings per 100 LF
N R L.F. 5 5 0 50 0 50
Rigid galvanized steel conduit,
1" diameter, to 15' H, includes
2 terminations, 2 elbows, 11
beam clamps, and 11
couplings per 100 LF
N R L.F. 0 0 0 0 0 0
Intermediate metal conduit, 1-
1/4" diameter, to 15' high,
includes 2 terminations, 2
elbows, 11 beam clamps, and
11 couplings per 100 LF
R R L.F. 5 5 0 56 0 56
Intermediate metal conduit, 1"
diameter, to 15' high, includes
2 terminations, 2 elbows, 11
beam clamps, and 11
couplings per 100 LF
R R L.F. 0 0 0 0 0 0
Conduit, to 15' high, minimum
labor/equipment charge R R job 0 0 0 0 0 0
Load interrupter switch, 2
position, 300 kVA & below
w/CLF fuses, 4.8 kV, 600
amp, NEMA 1
B I Ea. 0 0 0 0 0 0
Cable lugs, for 2 feeders, 4.8
kV or 13.8 kV B I Ea. 0 0 0 0 0 0
Transformer, dry-type, 3 phase
480 V primary 120/208 V
secondary, 300 kVA
B I Ea. 0 0 0 0 0 0
Switchboards, distribution
section, aluminum bus bars, 4
W, 120/208 or 277/480 V,
1200 amp, excludes breakers
N I Ea. 0 0 0 0 0 0
Plug-in Electric Vehicle Infrastructure Cost-Effectiveness Report
20
Task Description Construction
Type1
Work
Type Unit2
Scenario 1
PEV
Circuit
Scenario
1 PEV-
Ready
Scenario
1 PEV-
Ready
to
Circuit
Scenario
2 PEV
Circuit
Scenario
2 PEV-
Ready
Scenario
2 PEV-
Ready
to
Circuit
Load centers, 1 phase, 3 wire,
main lugs, indoor, 120/240
V, 100 amp, 12 circuits,
includes 20 A 1 pole plug-in
breakers (additional to
existing)
R C Ea. 1 1 0 1 1 0
Load centers, 1 phase, 3 wire,
main lugs, indoor, 120/240
V, 200 amp, 16 circuits,
includes 20 A 1 pole plug-in
breakers
N C Ea. 1 1 0 1 1 0
Load centers, 1 phase, 3 wire,
main lugs, indoor, 120/240
V, 100 amp, 12 circuits,
includes 20 A 1 pole plug-in
breakers (cost avoided by
installing 200 amp panel at
time of new construction)
N C Ea. -1 -1 0 -1 -1 0
Circuit breakers, bolt-on, 10
k A I.C., 3 pole, 240 volt, 15
to 60 amp (commercial main
breakers may have these pre-
installed)
B C Ea. 2 0 2 2 0 2
Excavating, trench or
continuous footing, common
earth, 1/2 C.Y. excavator, 1'
to 4' deep, excludes sheeting
or dewatering
R E B.C.Y. 0 0 0 0 0 0
Excavating, trench backfill, 1
C.Y. bucket, minimal haul,
front end loader, wheel
mounted, excludes
dewatering
R E L.C.Y. 0 0 0 0 0 0
Excavating, chain trencher,
utility trench, common earth,
40 H.P., 16" wide, 24" deep,
operator riding, includes
backfill
B E L.F. 50 50 0 0 0 0
Excavating, chain trencher,
utility trench, common earth,
includes excavation and
backfill, minimum
labor/equipment charge
B E Job 1 1 0 0 0 0
Cycle hauling(wait, load,
travel, unload or dump &
return) time per cycle,
excavated or borrow, loose
cubic yards, 20 min
load/wait/unload, 12 C.Y.
truck, cycle 10 miles, 50
MPH, excludes loading
equipment
R P L.C.Y. 1 1 0 0 0 0
Excavated or borrow, loose
cubic yards, small excavation
job, 8 C.Y. truck per hour,
excludes loading equipment
R D Hr. 0 0 0 0 0 0
Plug-in Electric Vehicle Infrastructure Cost-Effectiveness Report
21
Task Description Construction
Type1
Work
Type Unit2
Scenario 1
PEV
Circuit
Scenario
1 PEV-
Ready
Scenario
1 PEV-
Ready
to
Circuit
Scenario
2 PEV
Circuit
Scenario
2 PEV-
Ready
Scenario
2 PEV-
Ready
to
Circuit
Asphaltic concrete paving,
parking lots & driveways, 6"
stone base, 2" binder course,
2" topping, no asphalt hauling
included
R P S.F. 80 80 0 0 0 0
Painted pavement markings,
acrylic waterborne, white or
yellow, 4" wide, less than 3000
L.F.
R C L.F. 100 0 100 100 0 100
Painted pavement markings,
acrylic waterborne, white or
yellow, 4" wide, less than 3000
L.F.
N C L.F. 100 0 100 100 0 100
Add equipment minimum for
concrete demo- assume labor
minimum subsumed under saw
cut minimum
R D 1 1 0 0 0 0
Mobilization or
demobilization, dozer, loader,
backhoe or excavator, 70 H.P.
to 150 H.P., up to 50 miles
R d 2 2 0 0 0 0
Rent, asphalt distributor, trailer
mounted, 38 HP diesel 2000
gallon, one day including 4
hours operating cost
R d 1 1 0 0 0 0
Rent mixer power mortar &
concrete gas 6 CF, 18 HP, one
day including 4 hours
operating cost
R d 1 1 0 0 0 0
Rent core drill, electric, 2.5
H.P. 1" to 8" bit diameter,
including hourly operating cost
R d 0 0 0 1 1 0
Rent backhoe-loader 40 to 45
HP 5/8 CY capacity, one day
including 4 hours operating
cost
R d 1 1 0 0 0 0
Main Circuit breaker, 3 pole 3
wire 100 amp R C Ea. 0 0 0 0 0 0
Main Circuit breaker, 3 pole 3
wire 225 amp N C Ea. 0 0 0 0 0 0
Main Circuit breaker, 3 pole 3
wire 225 amp R C Ea. 0 0 0 0 0 0
Main Circuit breaker, 3 pole 3
wire 400 amp N C Ea. 0 0 0 0 0 0
Main Circuit breaker, 3 pole 3
wire 400 amp R C Ea. 0 0 0 0 0 0
1. Some codes that appear duplicative are retrofit in one case and new construction in another case.
2. Unit refers to quantity, such as linear foot (LF), hundred linear foot (CFL), square yard (SY), cubic yard (CY).
Plug-in Electric Vehicle Infrastructure Cost-Effectiveness Report
22
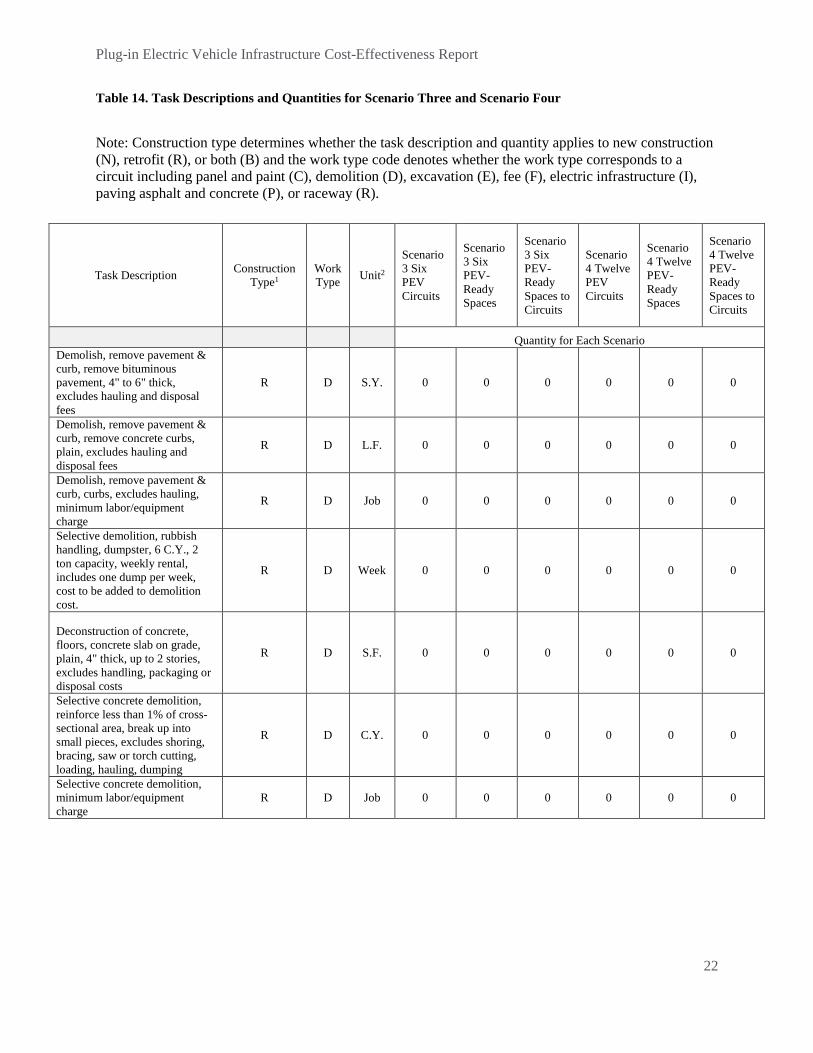
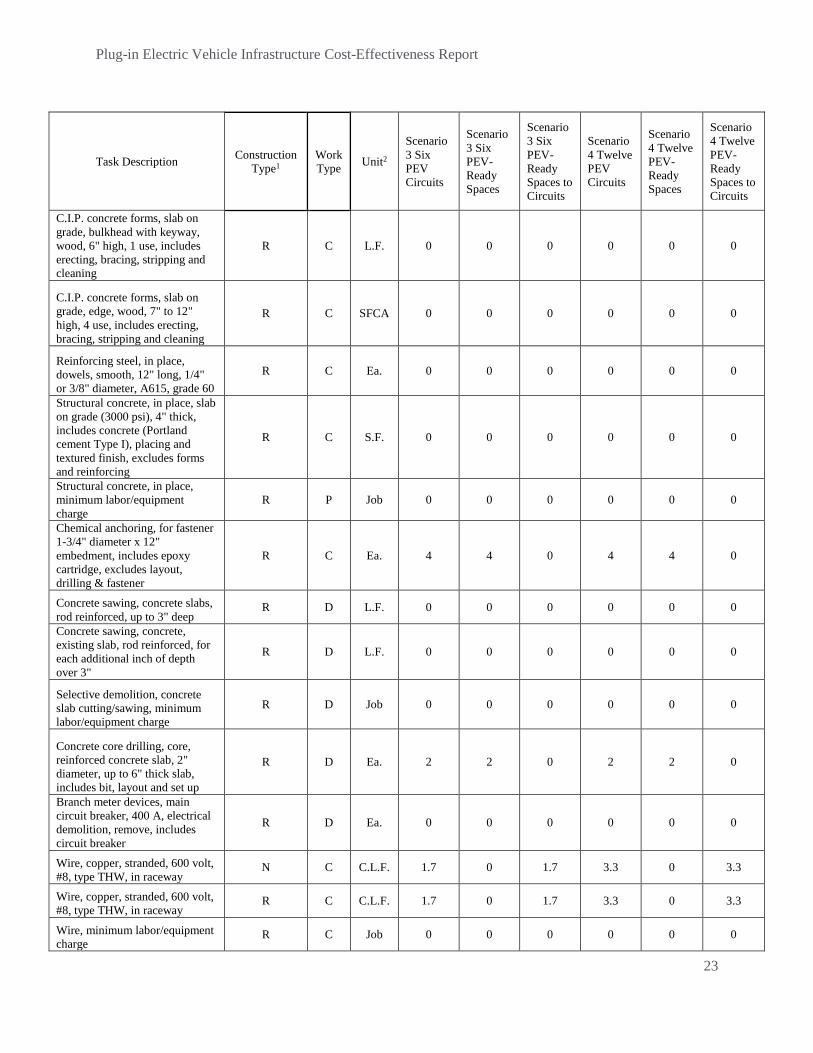
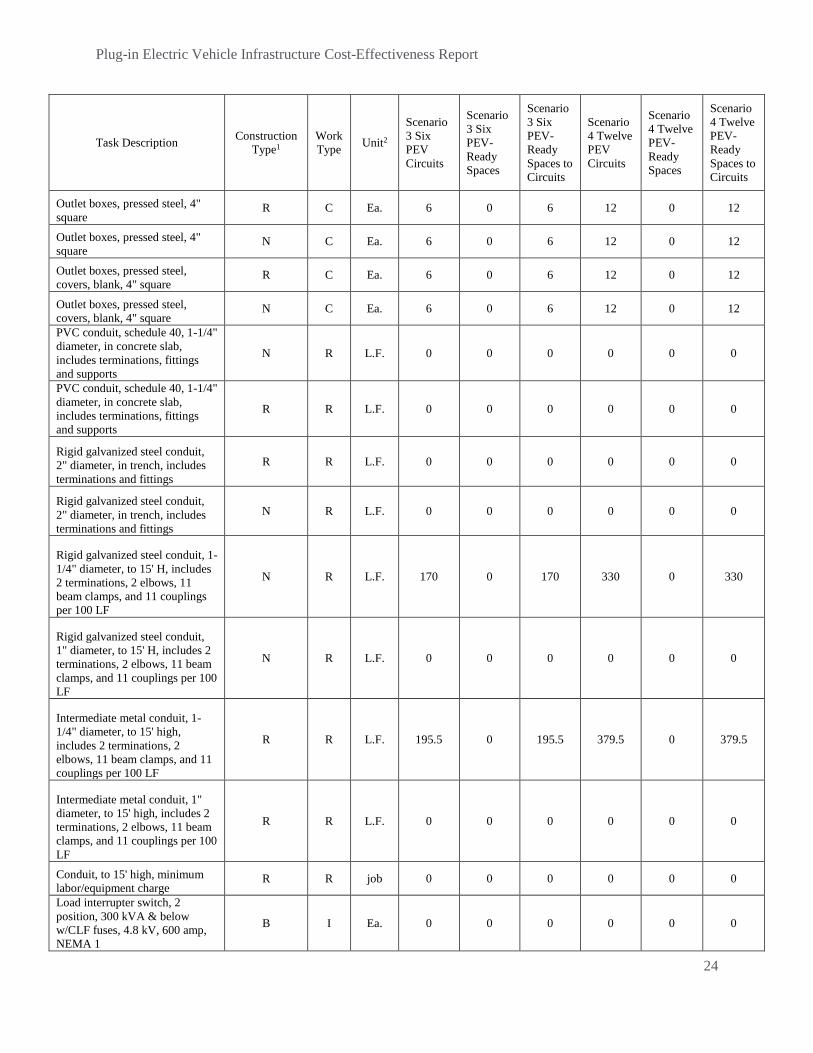
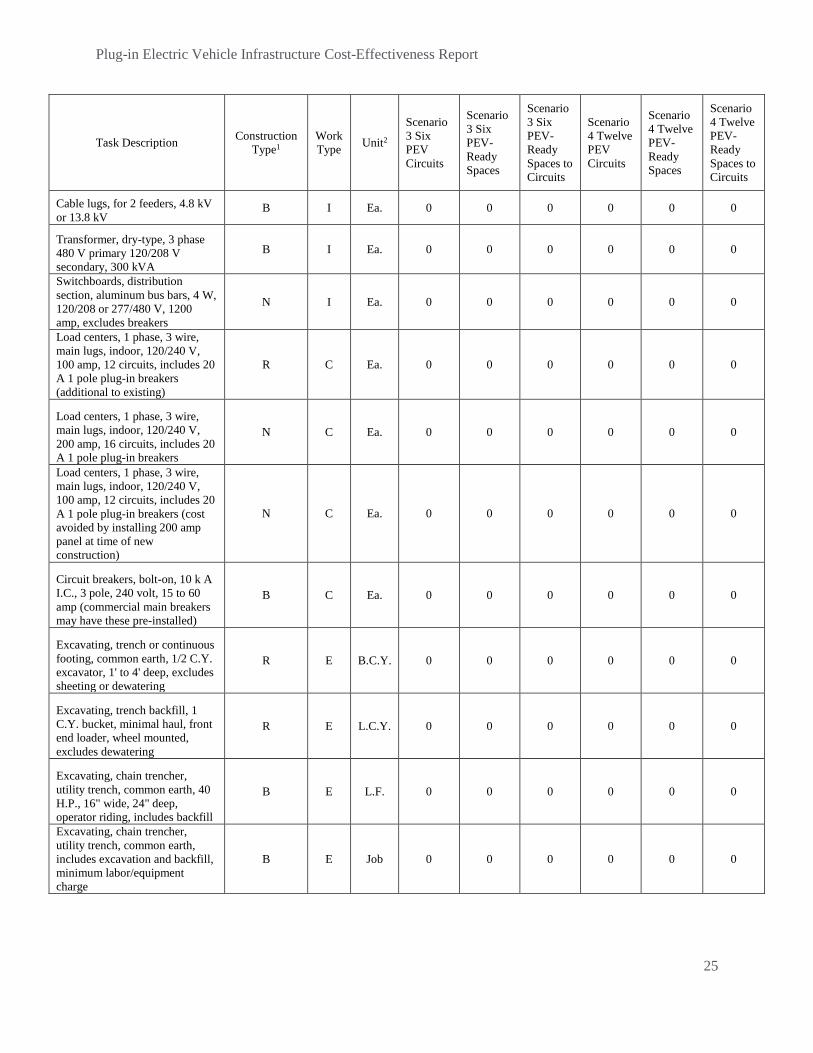
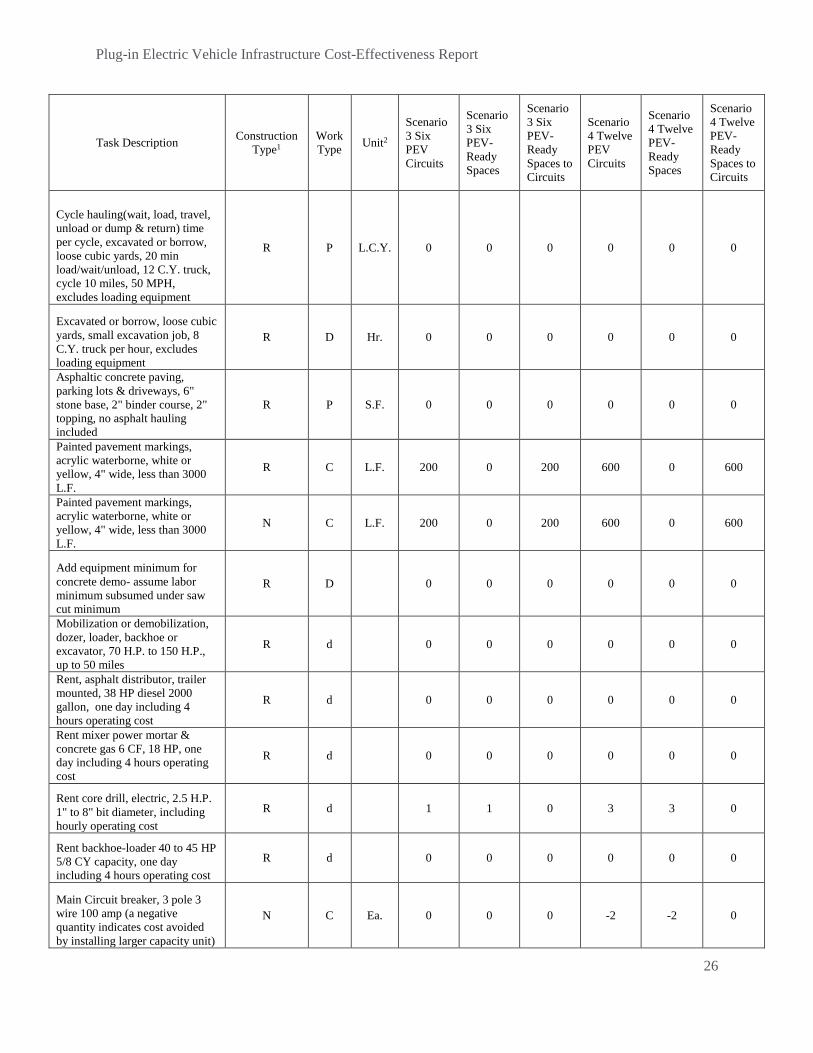
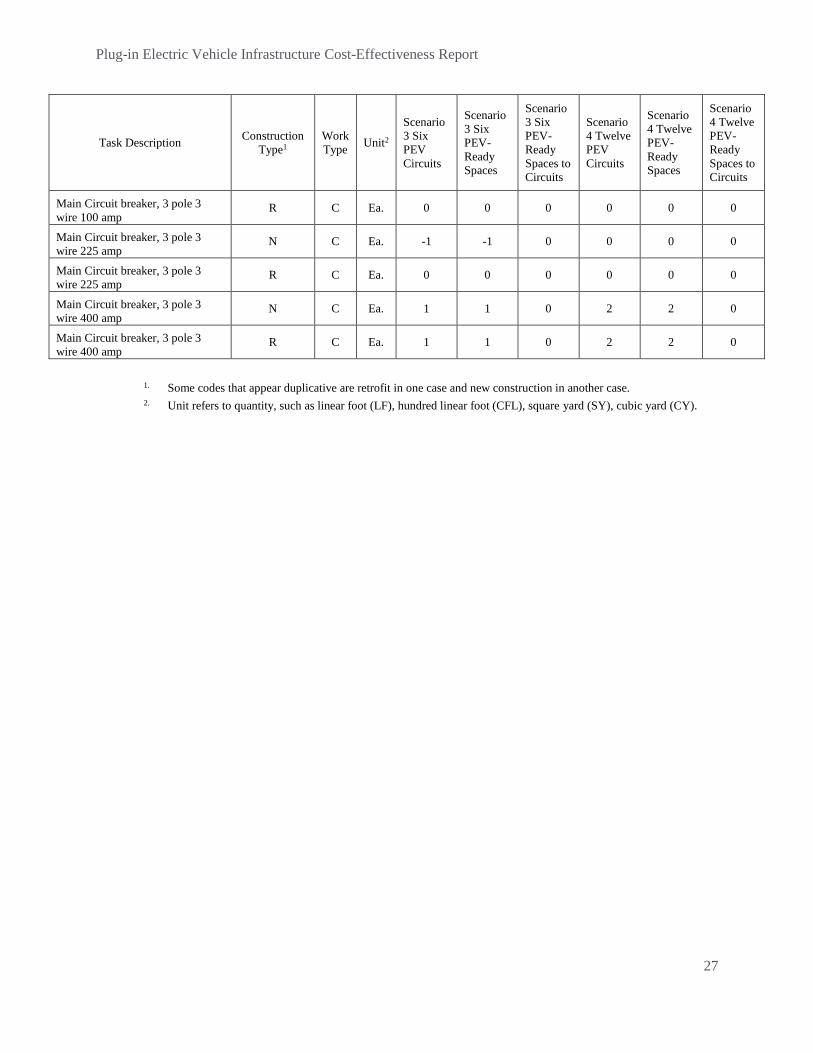
Table 14. Task Descriptions and Quantities for Scenario Three and Scenario Four
Note: Construction type determines whether the task description and quantity applies to new construction
(N), retrofit (R), or both (B) and the work type code denotes whether the work type corresponds to a
circuit including panel and paint (C), demolition (D), excavation (E), fee (F), electric infrastructure (I),
paving asphalt and concrete (P), or raceway (R).
Task Description Construction
Type1
Work
Type Unit2
Scenario
3 Six
PEV
Circuits
Scenario
3 Six
PEV-
Ready
Spaces
Scenario
3 Six
PEV-
Ready
Spaces to
Circuits
Scenario
4 Twelve
PEV
Circuits
Scenario
4 Twelve
PEV-
Ready
Spaces
Scenario
4 Twelve
PEV-
Ready
Spaces to
Circuits
Quantity for Each Scenario
Demolish, remove pavement &
curb, remove bituminous
pavement, 4" to 6" thick,
excludes hauling and disposal
fees
R D S.Y. 0 0 0 0 0 0
Demolish, remove pavement &
curb, remove concrete curbs,
plain, excludes hauling and
disposal fees
R D L.F. 0 0 0 0 0 0
Demolish, remove pavement &
curb, curbs, excludes hauling,
minimum labor/equipment
charge
R D Job 0 0 0 0 0 0
Selective demolition, rubbish
handling, dumpster, 6 C.Y., 2
ton capacity, weekly rental,
includes one dump per week,
cost to be added to demolition
cost.
R D Week 0 0 0 0 0 0
Deconstruction of concrete,
floors, concrete slab on grade,
plain, 4" thick, up to 2 stories,
excludes handling, packaging or
disposal costs
R D S.F. 0 0 0 0 0 0
Selective concrete demolition,
reinforce less than 1% of cross-
sectional area, break up into
small pieces, excludes shoring,
bracing, saw or torch cutting,
loading, hauling, dumping
R D C.Y. 0 0 0 0 0 0
Selective concrete demolition,
minimum labor/equipment
charge
R D Job 0 0 0 0 0 0
Plug-in Electric Vehicle Infrastructure Cost-Effectiveness Report
23
Task Description Construction
Type1
Work
Type Unit2
Scenario
3 Six
PEV
Circuits
Scenario
3 Six
PEV-
Ready
Spaces
Scenario
3 Six
PEV-
Ready
Spaces to
Circuits
Scenario
4 Twelve
PEV
Circuits
Scenario
4 Twelve
PEV-
Ready
Spaces
Scenario
4 Twelve
PEV-
Ready
Spaces to
Circuits
C.I.P. concrete forms, slab on
grade, bulkhead with keyway,
wood, 6" high, 1 use, includes
erecting, bracing, stripping and
cleaning
R C L.F. 0 0 0 0 0 0
C.I.P. concrete forms, slab on
grade, edge, wood, 7" to 12"
high, 4 use, includes erecting,
bracing, stripping and cleaning
R C SFCA 0 0 0 0 0 0
Reinforcing steel, in place,
dowels, smooth, 12" long, 1/4"
or 3/8" diameter, A615, grade 60
R C Ea. 0 0 0 0 0 0
Structural concrete, in place, slab
on grade (3000 psi), 4" thick,
includes concrete (Portland
cement Type I), placing and
textured finish, excludes forms
and reinforcing
R C S.F. 0 0 0 0 0 0
Structural concrete, in place,
minimum labor/equipment
charge
R P Job 0 0 0 0 0 0
Chemical anchoring, for fastener
1-3/4" diameter x 12"
embedment, includes epoxy
cartridge, excludes layout,
drilling & fastener
R C Ea. 4 4 0 4 4 0
Concrete sawing, concrete slabs,
rod reinforced, up to 3" deep R D L.F. 0 0 0 0 0 0
Concrete sawing, concrete,
existing slab, rod reinforced, for
each additional inch of depth
over 3"
R D L.F. 0 0 0 0 0 0
Selective demolition, concrete
slab cutting/sawing, minimum
labor/equipment charge
R D Job 0 0 0 0 0 0
Concrete core drilling, core,
reinforced concrete slab, 2"
diameter, up to 6" thick slab,
includes bit, layout and set up
R D Ea. 2 2 0 2 2 0
Branch meter devices, main
circuit breaker, 400 A, electrical
demolition, remove, includes
circuit breaker
R D Ea. 0 0 0 0 0 0
Wire, copper, stranded, 600 volt,
#8, type THW, in raceway N C C.L.F. 1.7 0 1.7 3.3 0 3.3
Wire, copper, stranded, 600 volt,
#8, type THW, in raceway R C C.L.F. 1.7 0 1.7 3.3 0 3.3
Wire, minimum labor/equipment
charge R C Job 0 0 0 0 0 0
Plug-in Electric Vehicle Infrastructure Cost-Effectiveness Report
24
Task Description Construction
Type1
Work
Type Unit2
Scenario
3 Six
PEV
Circuits
Scenario
3 Six
PEV-
Ready
Spaces
Scenario
3 Six
PEV-
Ready
Spaces to
Circuits
Scenario
4 Twelve
PEV
Circuits
Scenario
4 Twelve
PEV-
Ready
Spaces
Scenario
4 Twelve
PEV-
Ready
Spaces to
Circuits
Outlet boxes, pressed steel, 4"
square R C Ea. 6 0 6 12 0 12
Outlet boxes, pressed steel, 4"
square N C Ea. 6 0 6 12 0 12
Outlet boxes, pressed steel,
covers, blank, 4" square R C Ea. 6 0 6 12 0 12
Outlet boxes, pressed steel,
covers, blank, 4" square N C Ea. 6 0 6 12 0 12
PVC conduit, schedule 40, 1-1/4"
diameter, in concrete slab,
includes terminations, fittings
and supports
N R L.F. 0 0 0 0 0 0
PVC conduit, schedule 40, 1-1/4"
diameter, in concrete slab,
includes terminations, fittings
and supports
R R L.F. 0 0 0 0 0 0
Rigid galvanized steel conduit,
2" diameter, in trench, includes
terminations and fittings
R R L.F. 0 0 0 0 0 0
Rigid galvanized steel conduit,
2" diameter, in trench, includes
terminations and fittings
N R L.F. 0 0 0 0 0 0
Rigid galvanized steel conduit, 1-
1/4" diameter, to 15' H, includes
2 terminations, 2 elbows, 11
beam clamps, and 11 couplings
per 100 LF
N R L.F. 170 0 170 330 0 330
Rigid galvanized steel conduit,
1" diameter, to 15' H, includes 2
terminations, 2 elbows, 11 beam
clamps, and 11 couplings per 100
LF
N R L.F. 0 0 0 0 0 0
Intermediate metal conduit, 1-
1/4" diameter, to 15' high,
includes 2 terminations, 2
elbows, 11 beam clamps, and 11
couplings per 100 LF
R R L.F. 195.5 0 195.5 379.5 0 379.5
Intermediate metal conduit, 1"
diameter, to 15' high, includes 2
terminations, 2 elbows, 11 beam
clamps, and 11 couplings per 100
LF
R R L.F. 0 0 0 0 0 0
Conduit, to 15' high, minimum
labor/equipment charge R R job 0 0 0 0 0 0
Load interrupter switch, 2
position, 300 kVA & below
w/CLF fuses, 4.8 kV, 600 amp,
NEMA 1
B I Ea. 0 0 0 0 0 0
Plug-in Electric Vehicle Infrastructure Cost-Effectiveness Report
25
Task Description Construction
Type1
Work
Type Unit2
Scenario
3 Six
PEV
Circuits
Scenario
3 Six
PEV-
Ready
Spaces
Scenario
3 Six
PEV-
Ready
Spaces to
Circuits
Scenario
4 Twelve
PEV
Circuits
Scenario
4 Twelve
PEV-
Ready
Spaces
Scenario
4 Twelve
PEV-
Ready
Spaces to
Circuits
Cable lugs, for 2 feeders, 4.8 kV
or 13.8 kV B I Ea. 0 0 0 0 0 0
Transformer, dry-type, 3 phase
480 V primary 120/208 V
secondary, 300 kVA
B I Ea. 0 0 0 0 0 0
Switchboards, distribution
section, aluminum bus bars, 4 W,
120/208 or 277/480 V, 1200
amp, excludes breakers
N I Ea. 0 0 0 0 0 0
Load centers, 1 phase, 3 wire,
main lugs, indoor, 120/240 V,
100 amp, 12 circuits, includes 20
A 1 pole plug-in breakers
(additional to existing)
R C Ea. 0 0 0 0 0 0
Load centers, 1 phase, 3 wire,
main lugs, indoor, 120/240 V,
200 amp, 16 circuits, includes 20
A 1 pole plug-in breakers
N C Ea. 0 0 0 0 0 0
Load centers, 1 phase, 3 wire,
main lugs, indoor, 120/240 V,
100 amp, 12 circuits, includes 20
A 1 pole plug-in breakers (cost
avoided by installing 200 amp
panel at time of new
construction)
N C Ea. 0 0 0 0 0 0
Circuit breakers, bolt-on, 10 k A
I.C., 3 pole, 240 volt, 15 to 60
amp (commercial main breakers
may have these pre-installed)
B C Ea. 0 0 0 0 0 0
Excavating, trench or continuous
footing, common earth, 1/2 C.Y.
excavator, 1' to 4' deep, excludes
sheeting or dewatering
R E B.C.Y. 0 0 0 0 0 0
Excavating, trench backfill, 1
C.Y. bucket, minimal haul, front
end loader, wheel mounted,
excludes dewatering
R E L.C.Y. 0 0 0 0 0 0
Excavating, chain trencher,
utility trench, common earth, 40
H.P., 16" wide, 24" deep,
operator riding, includes backfill
B E L.F. 0 0 0 0 0 0
Excavating, chain trencher,
utility trench, common earth,
includes excavation and backfill,
minimum labor/equipment
charge
B E Job 0 0 0 0 0 0
Plug-in Electric Vehicle Infrastructure Cost-Effectiveness Report
26
Task Description Construction
Type1
Work
Type Unit2
Scenario
3 Six
PEV
Circuits
Scenario
3 Six
PEV-
Ready
Spaces
Scenario
3 Six
PEV-
Ready
Spaces to
Circuits
Scenario
4 Twelve
PEV
Circuits
Scenario
4 Twelve
PEV-
Ready
Spaces
Scenario
4 Twelve
PEV-
Ready
Spaces to
Circuits
Cycle hauling(wait, load, travel,
unload or dump & return) time
per cycle, excavated or borrow,
loose cubic yards, 20 min
load/wait/unload, 12 C.Y. truck,
cycle 10 miles, 50 MPH,
excludes loading equipment
R P L.C.Y. 0 0 0 0 0 0
Excavated or borrow, loose cubic
yards, small excavation job, 8
C.Y. truck per hour, excludes
loading equipment
R D Hr. 0 0 0 0 0 0
Asphaltic concrete paving,
parking lots & driveways, 6"
stone base, 2" binder course, 2"
topping, no asphalt hauling
included
R P S.F. 0 0 0 0 0 0
Painted pavement markings,
acrylic waterborne, white or
yellow, 4" wide, less than 3000
L.F.
R C L.F. 200 0 200 600 0 600
Painted pavement markings,
acrylic waterborne, white or
yellow, 4" wide, less than 3000
L.F.
N C L.F. 200 0 200 600 0 600
Add equipment minimum for
concrete demo- assume labor
minimum subsumed under saw
cut minimum
R D 0 0 0 0 0 0
Mobilization or demobilization,
dozer, loader, backhoe or
excavator, 70 H.P. to 150 H.P.,
up to 50 miles
R d 0 0 0 0 0 0
Rent, asphalt distributor, trailer
mounted, 38 HP diesel 2000
gallon, one day including 4
hours operating cost
R d 0 0 0 0 0 0
Rent mixer power mortar &
concrete gas 6 CF, 18 HP, one
day including 4 hours operating
cost
R d 0 0 0 0 0 0
Rent core drill, electric, 2.5 H.P.
1" to 8" bit diameter, including
hourly operating cost
R d 1 1 0 3 3 0
Rent backhoe-loader 40 to 45 HP
5/8 CY capacity, one day
including 4 hours operating cost
R d 0 0 0 0 0 0
Main Circuit breaker, 3 pole 3
wire 100 amp (a negative
quantity indicates cost avoided
by installing larger capacity unit)
N C Ea. 0 0 0 -2 -2 0
Plug-in Electric Vehicle Infrastructure Cost-Effectiveness Report
27
Task Description Construction
Type1
Work
Type Unit2
Scenario
3 Six
PEV
Circuits
Scenario
3 Six
PEV-
Ready
Spaces
Scenario
3 Six
PEV-
Ready
Spaces to
Circuits
Scenario
4 Twelve
PEV
Circuits
Scenario
4 Twelve
PEV-
Ready
Spaces
Scenario
4 Twelve
PEV-
Ready
Spaces to
Circuits
Main Circuit breaker, 3 pole 3
wire 100 amp R C Ea. 0 0 0 0 0 0
Main Circuit breaker, 3 pole 3
wire 225 amp N C Ea. -1 -1 0 0 0 0
Main Circuit breaker, 3 pole 3
wire 225 amp R C Ea. 0 0 0 0 0 0
Main Circuit breaker, 3 pole 3
wire 400 amp N C Ea. 1 1 0 2 2 0
Main Circuit breaker, 3 pole 3
wire 400 amp R C Ea. 1 1 0 2 2 0
1. Some codes that appear duplicative are retrofit in one case and new construction in another case.
2. Unit refers to quantity, such as linear foot (LF), hundred linear foot (CFL), square yard (SY), cubic yard (CY).