Embed Size (px)
Citation preview
Health Insurance Exchange – Research and Evaluation
Lynn A. Blewett, Ph.D.
Professor, Division of Health Policy and Management, University of Minnesota School of Public Health
Division of Health Policy and Management
Research In Progress Seminar, February 20, 2013
University of Minnesota, School of Public Health
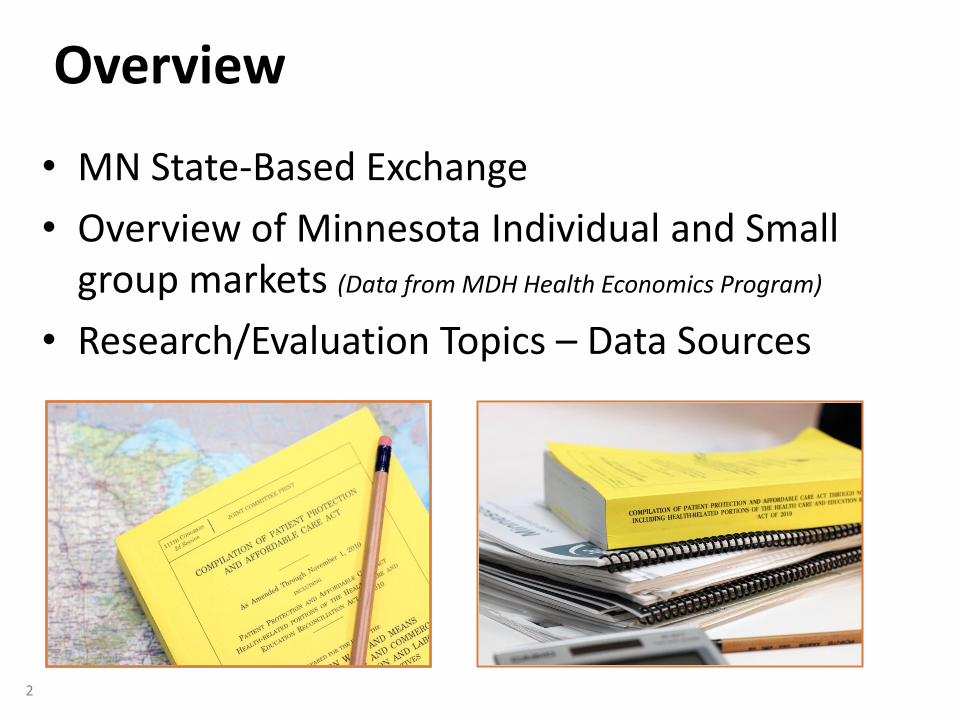
Overview
• MN State-Based Exchange
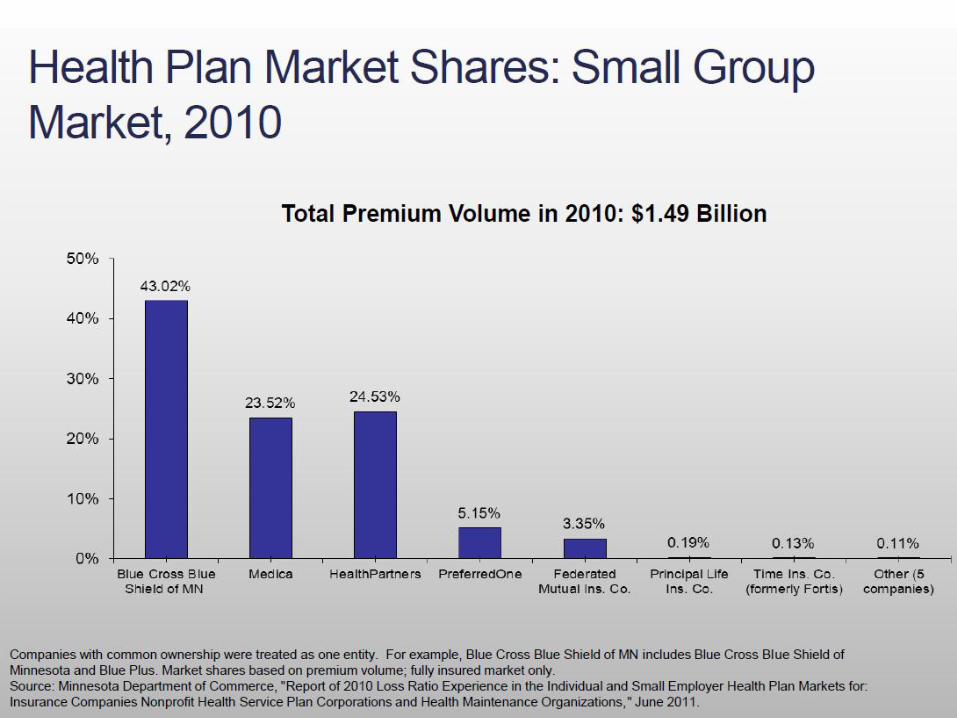
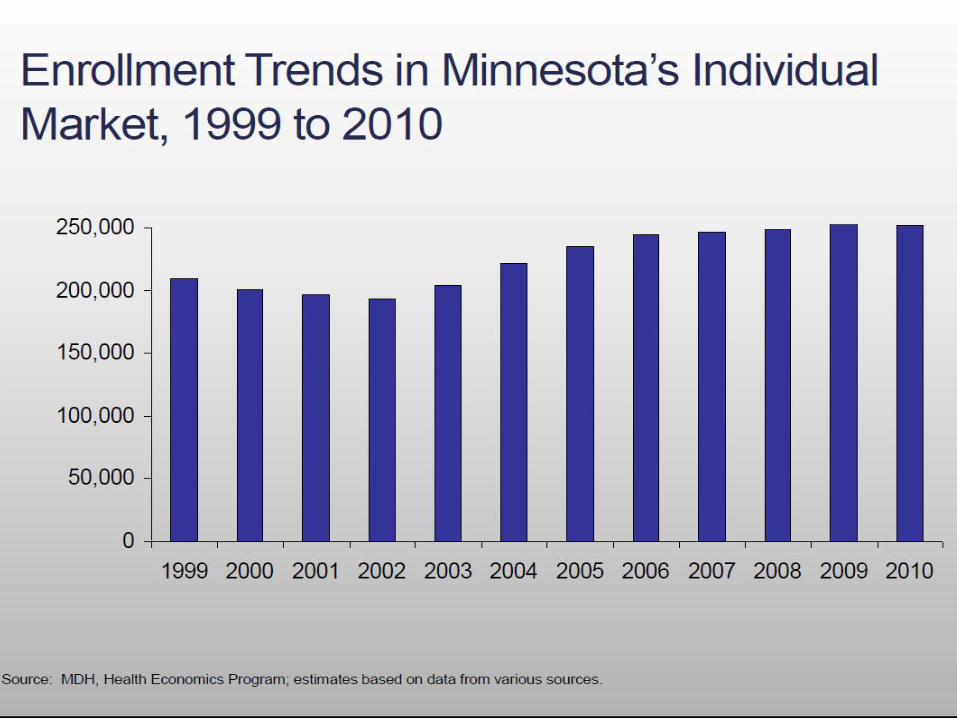
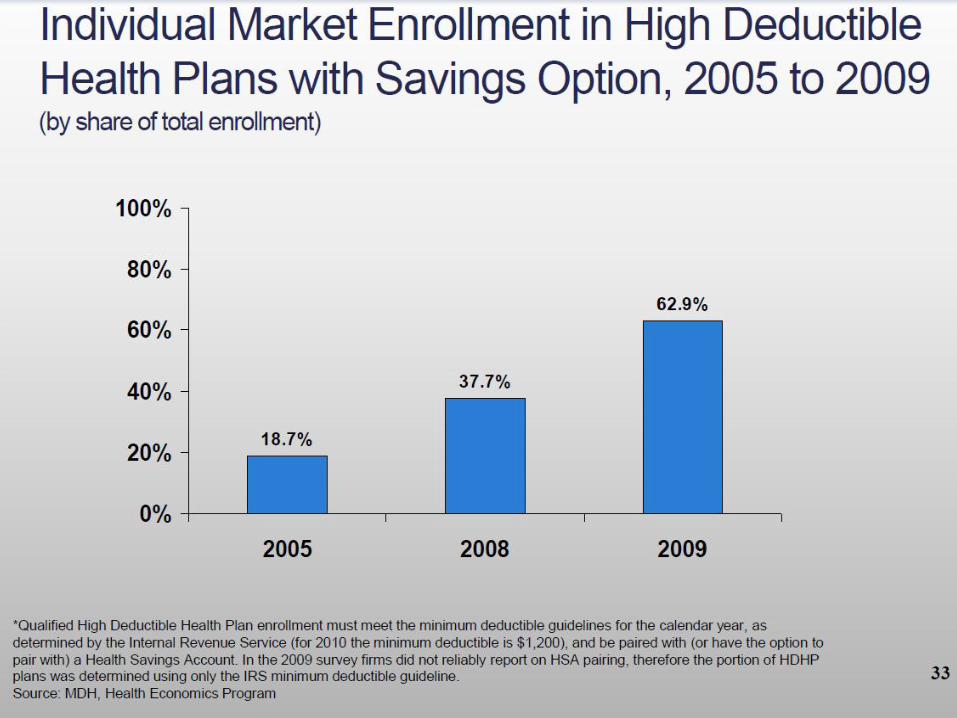
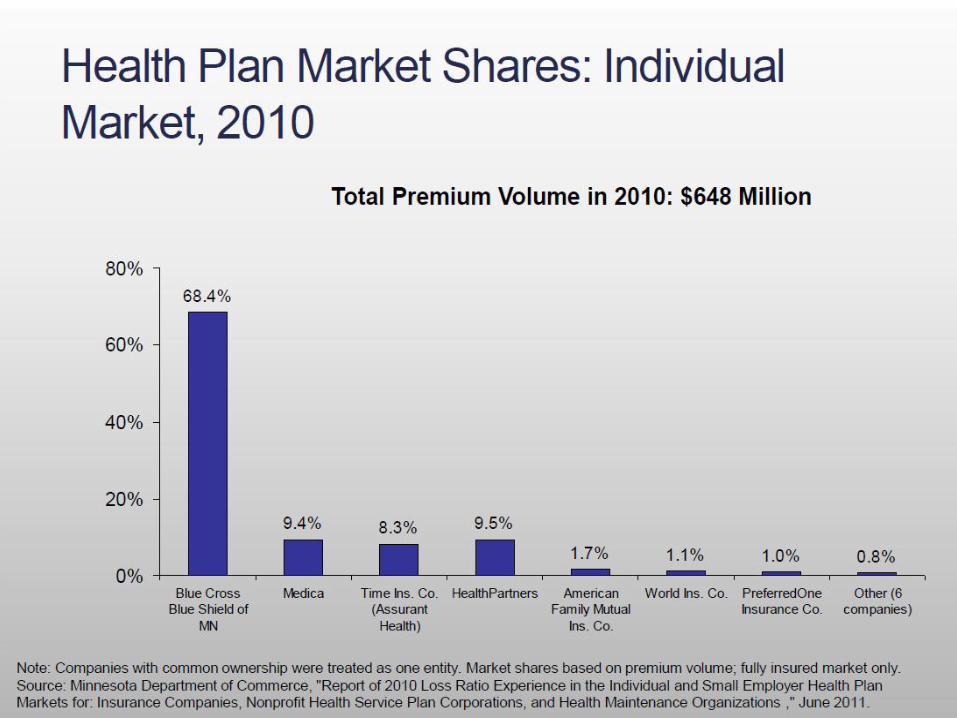
• Overview of Minnesota Individual and Small group markets (Data from MDH Health Economics Program)
• Research/Evaluation Topics – Data Sources
2
3
0 100 200 300 400 500
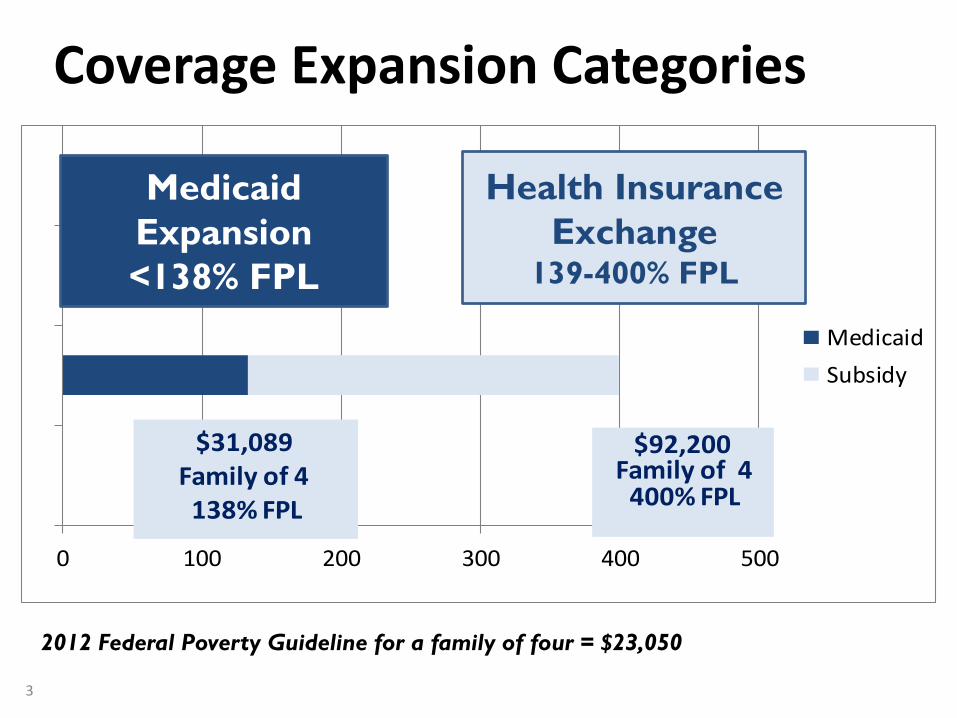
Medicaid
Subsidy
$92,200 Family of 4
400% FPL
$31,089 Family of 4 138% FPL
Medicaid
Expansion
<138% FPL
Health Insurance
Exchange 139-400% FPL
2012 Federal Poverty Guideline for a family of four = $23,050
Coverage Expansion Categories
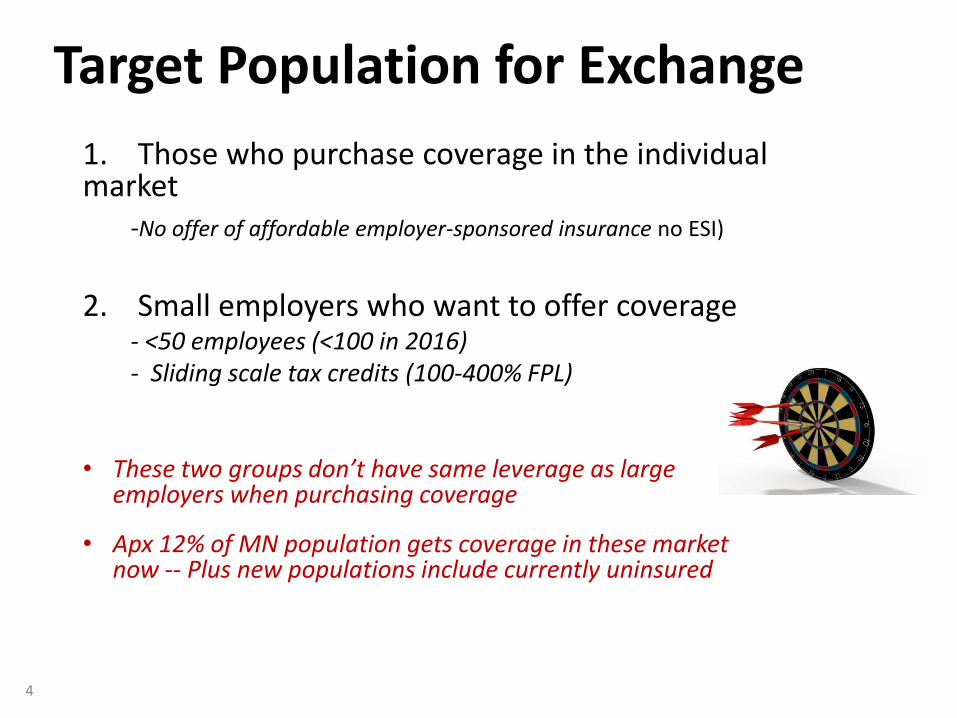
1. Those who purchase coverage in the individual market -No offer of affordable employer-sponsored insurance no ESI)
2. Small employers who want to offer coverage
- <50 employees (<100 in 2016) - Sliding scale tax credits (100-400% FPL)
• These two groups don’t have same leverage as large
employers when purchasing coverage
• Apx 12% of MN population gets coverage in these market now -- Plus new populations include currently uninsured
Target Population for Exchange
4
5
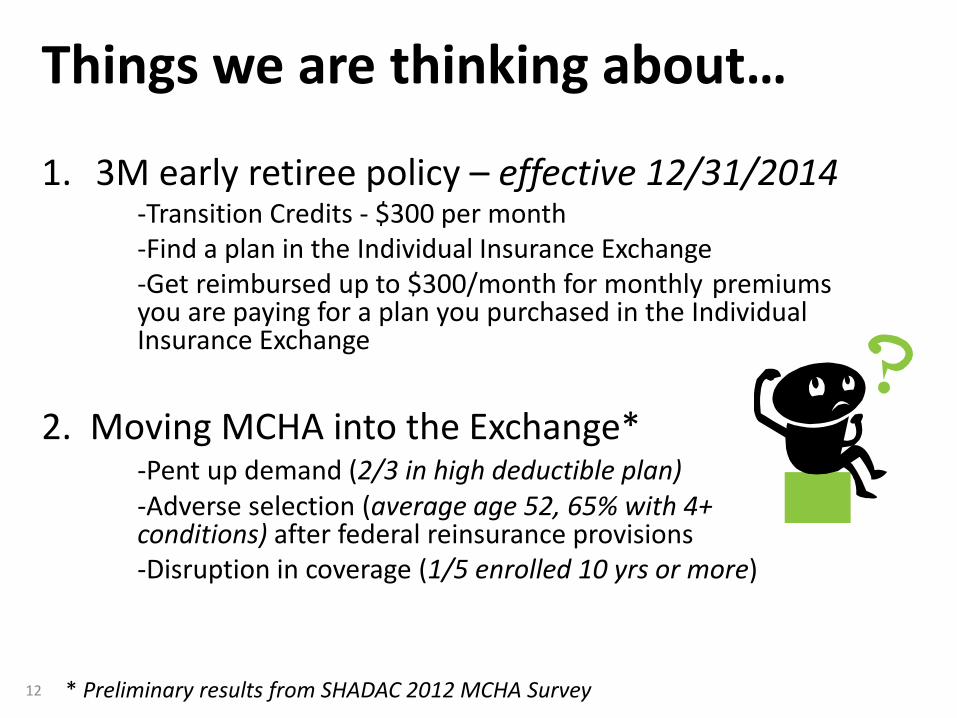
Things we are thinking about…
1. 3M early retiree policy – effective 12/31/2014 -Transition Credits - $300 per month -Find a plan in the Individual Insurance Exchange -Get reimbursed up to $300/month for monthly premiums you are paying for a plan you purchased in the Individual Insurance Exchange
2. Moving MCHA into the Exchange* -Pent up demand (2/3 in high deductible plan) -Adverse selection (average age 52, 65% with 4+ conditions) after federal reinsurance provisions -Disruption in coverage (1/5 enrolled 10 yrs or more)
* Preliminary results from SHADAC 2012 MCHA Survey 12
3. Making sure there is enough primary care capacity for expansion coverage and by urban/rural
– MN at 142/100,000 (nat’l average 120/100,000)*
4. Remaining uninsured and stability of safety-net – Estimated 210,000 people uninsured
5. What the premiums will be in the exchange and will be they low enough for young, healthy people to sign up? – How many willing to pay the penalty; 2014 - $95 (for each adult) 2015 - $325; 2016 - $695
* http://www.americashealthrankings.org/ALL/PCP/2012
More…
13
• No more health status rating for premiums – sick and healthy must be rated the same
• Age rating is limited 3:1 • The High Deductible Plans ($5,000 and $10,000) will not
meet out-of-pocket limitations – these are the cheapest plans on the market
• Plans may offer catastrophic coverage but only to enrollees under the age of 30 or those who would otherwise be exempt from the requirement to purchase coverage because the premium exceeds 8% of their income. – coverage level would be set at the HSA current law levels except
that prevention benefits and coverage for three – primary care visits would be exempt from the deductible.
Why will premiums go up for young and healthy?
14
SOME PRELIMINARY RESEARCH/EVALUATION QUESTIONS AND
POTENTIAL DATA SOURCES
Based on SHADAC work of Julie Sonier, Elizabeth Lukanen, and Lacey Hartman for the CA HealthCare Foundation
http://www.shadac.org/publications/framework-tracking-impacts-aca-in-ca
15
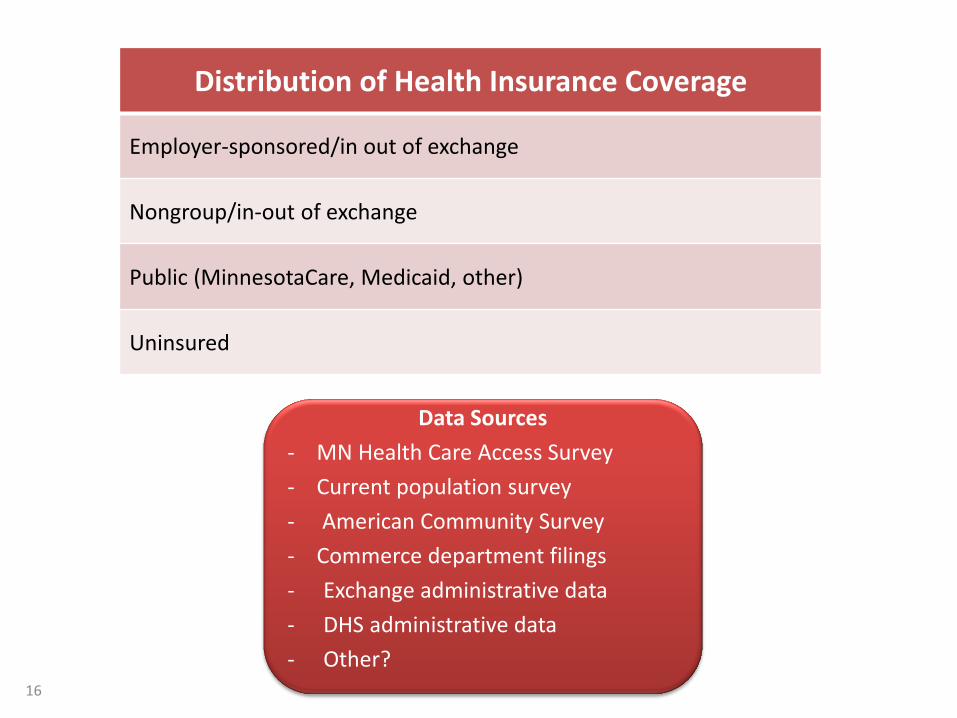
Distribution of Health Insurance Coverage
Employer-sponsored/in out of exchange
Nongroup/in-out of exchange
Public (MinnesotaCare, Medicaid, other)
Uninsured
Data Sources
- MN Health Care Access Survey
- Current population survey
- American Community Survey
- Commerce department filings
- Exchange administrative data
- DHS administrative data
- Other?
16
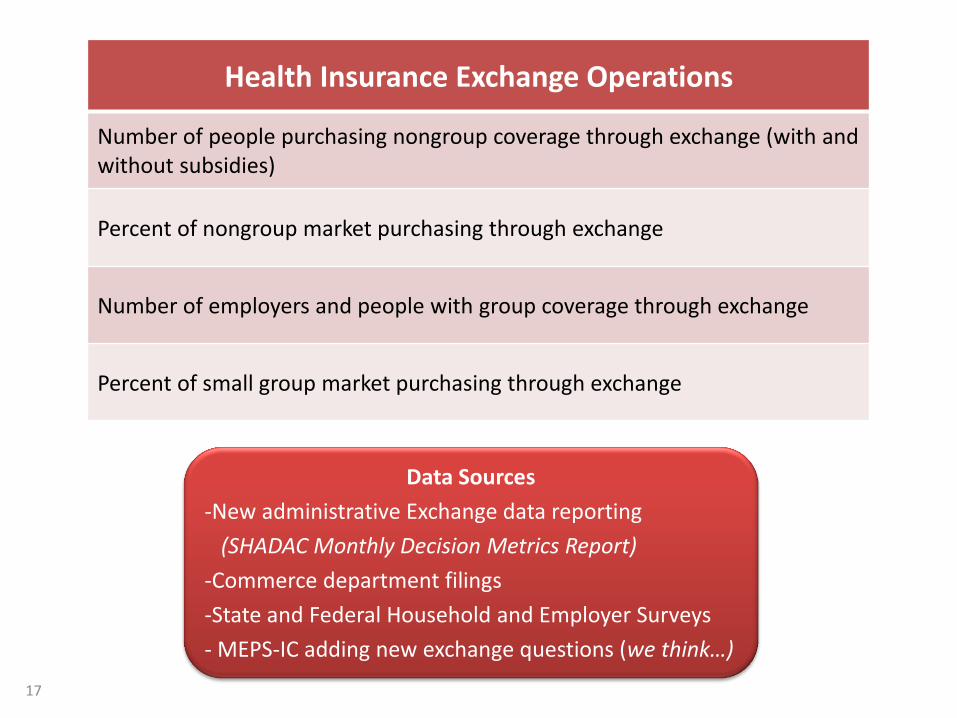
Health Insurance Exchange Operations
Number of people purchasing nongroup coverage through exchange (with and without subsidies)
Percent of nongroup market purchasing through exchange
Number of employers and people with group coverage through exchange
Percent of small group market purchasing through exchange
Data Sources
-New administrative Exchange data reporting
(SHADAC Monthly Decision Metrics Report)
-Commerce department filings
-State and Federal Household and Employer Surveys
- MEPS-IC adding new exchange questions (we think…)
17
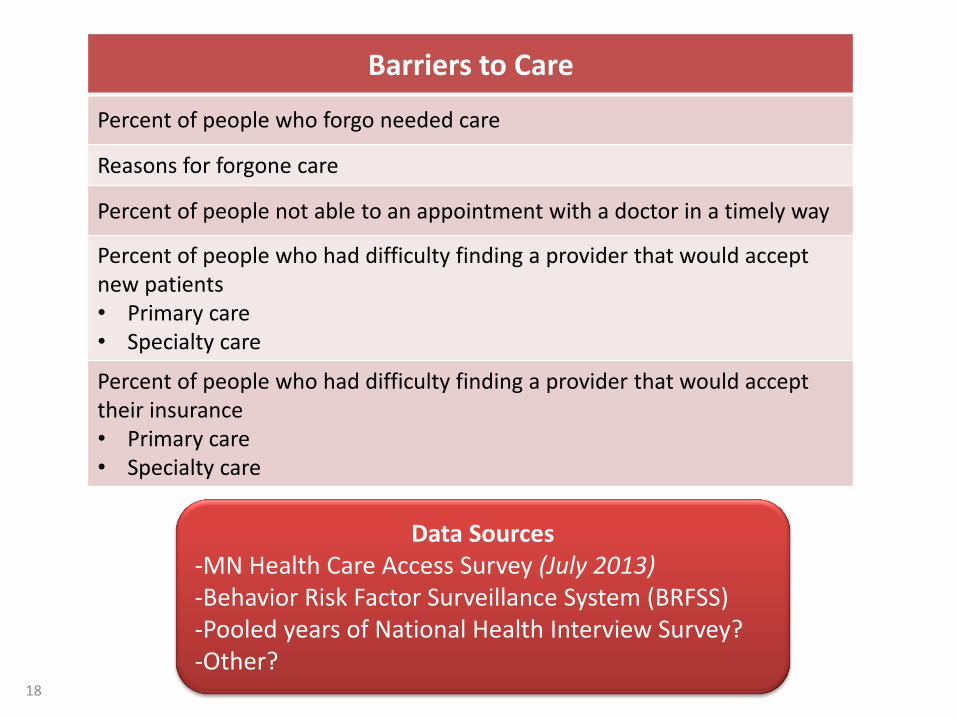
Barriers to Care
Percent of people who forgo needed care
Reasons for forgone care
Percent of people not able to an appointment with a doctor in a timely way
Percent of people who had difficulty finding a provider that would accept new patients • Primary care • Specialty care
Percent of people who had difficulty finding a provider that would accept their insurance • Primary care • Specialty care
Data Sources -MN Health Care Access Survey (July 2013) -Behavior Risk Factor Surveillance System (BRFSS) -Pooled years of National Health Interview Survey? -Other?
18
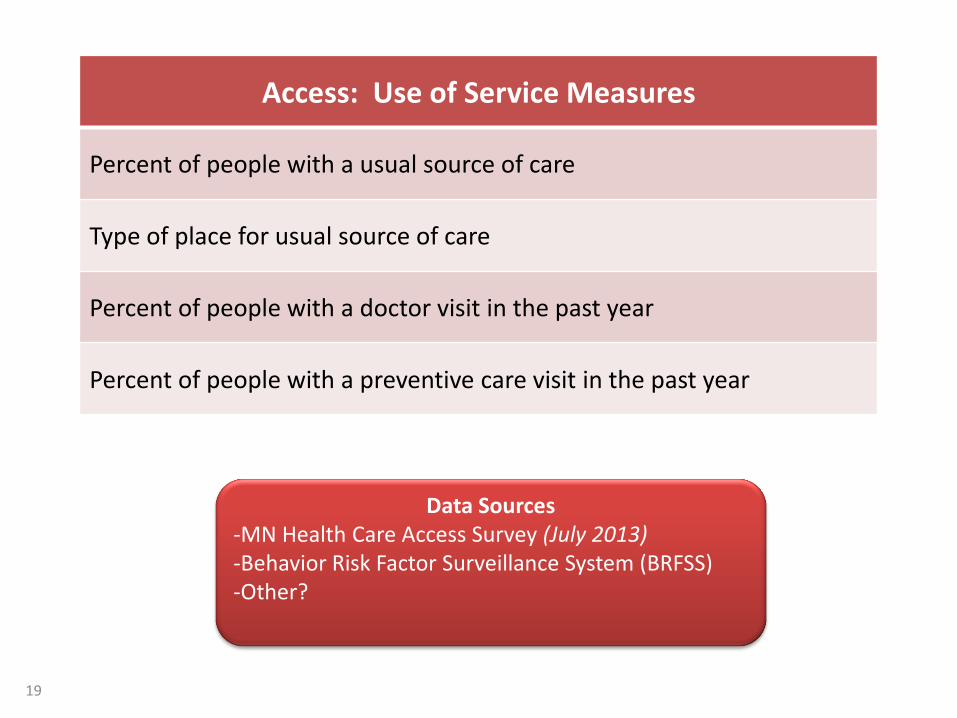
Access: Use of Service Measures
Percent of people with a usual source of care
Type of place for usual source of care
Percent of people with a doctor visit in the past year
Percent of people with a preventive care visit in the past year
Data Sources -MN Health Care Access Survey (July 2013) -Behavior Risk Factor Surveillance System (BRFSS) -Other?
19
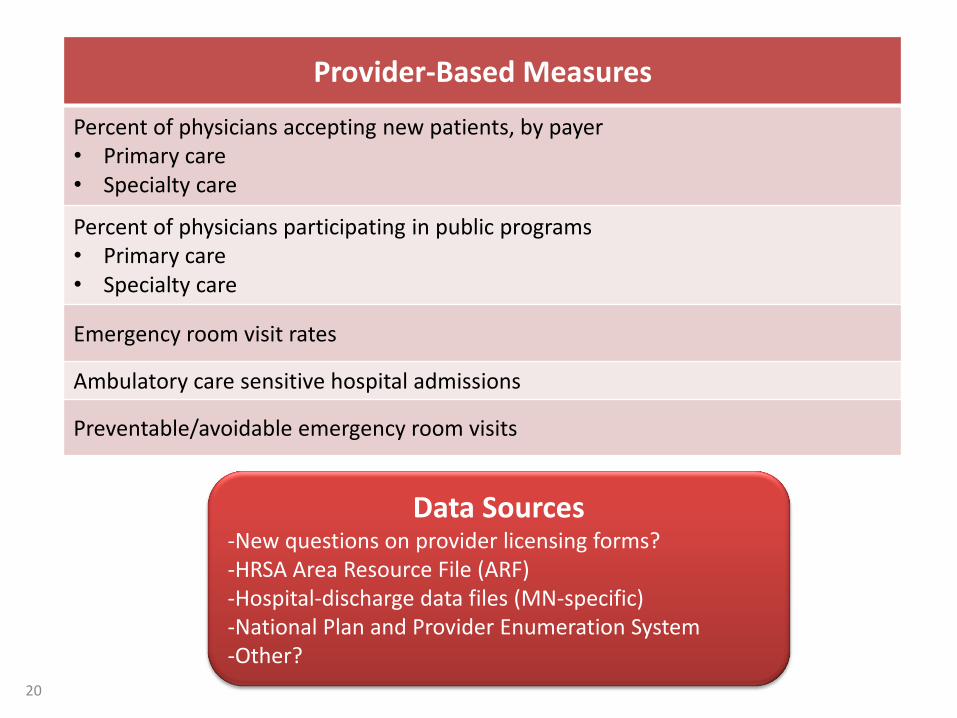
Provider-Based Measures
Percent of physicians accepting new patients, by payer • Primary care • Specialty care
Percent of physicians participating in public programs • Primary care • Specialty care
Emergency room visit rates
Ambulatory care sensitive hospital admissions
Preventable/avoidable emergency room visits
Data Sources -New questions on provider licensing forms? -HRSA Area Resource File (ARF) -Hospital-discharge data files (MN-specific) -National Plan and Provider Enumeration System -Other?
20
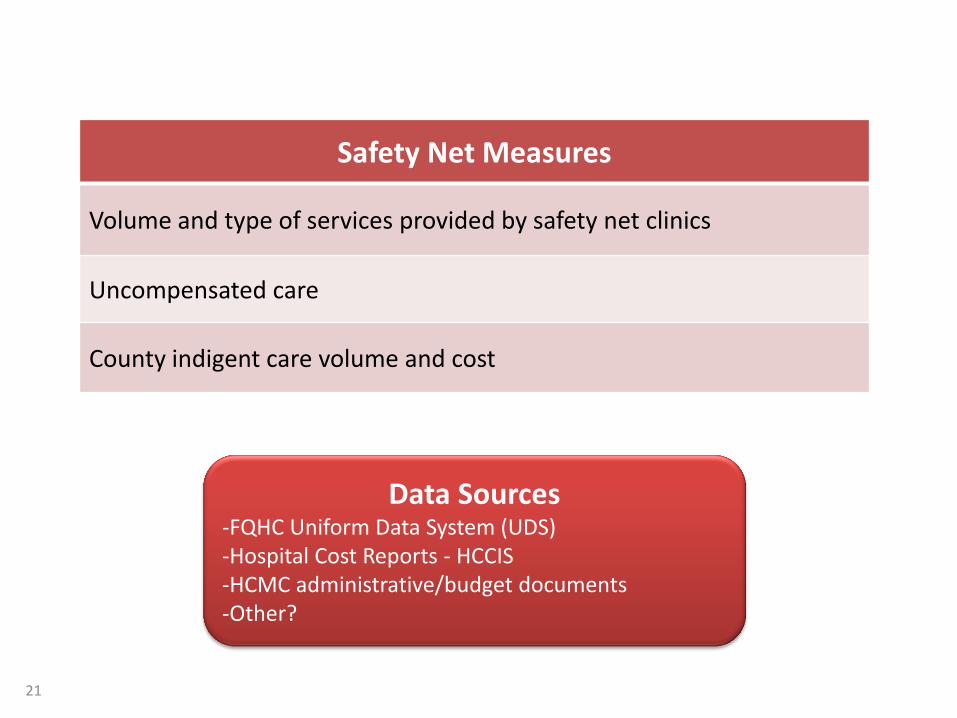
Safety Net Measures
Volume and type of services provided by safety net clinics
Uncompensated care
County indigent care volume and cost
Data Sources -FQHC Uniform Data System (UDS) -Hospital Cost Reports - HCCIS -HCMC administrative/budget documents -Other?
21
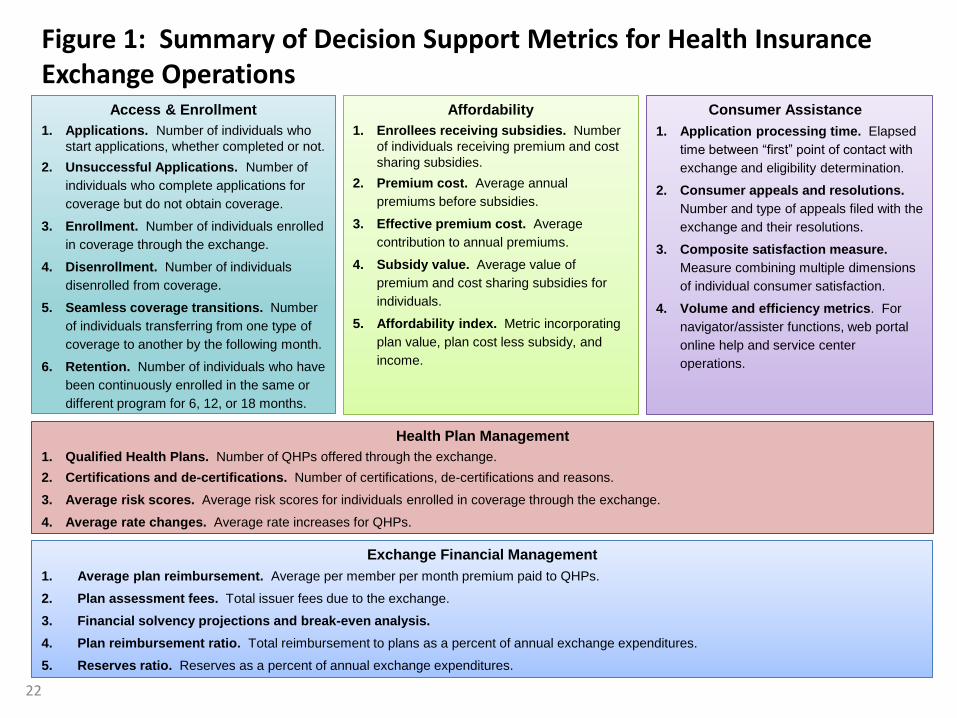
Exchange Financial Management
1. Average plan reimbursement. Average per member per month premium paid to QHPs.
2. Plan assessment fees. Total issuer fees due to the exchange.
3. Financial solvency projections and break-even analysis.
4. Plan reimbursement ratio. Total reimbursement to plans as a percent of annual exchange expenditures.
5. Reserves ratio. Reserves as a percent of annual exchange expenditures.
Figure 1: Summary of Decision Support Metrics for Health Insurance Exchange Operations
Access & Enrollment
1. Applications. Number of individuals who
start applications, whether completed or not.
2. Unsuccessful Applications. Number of
individuals who complete applications for
coverage but do not obtain coverage.
3. Enrollment. Number of individuals enrolled
in coverage through the exchange.
4. Disenrollment. Number of individuals
disenrolled from coverage.
5. Seamless coverage transitions. Number
of individuals transferring from one type of
coverage to another by the following month.
6. Retention. Number of individuals who have
been continuously enrolled in the same or
different program for 6, 12, or 18 months.
Affordability
1. Enrollees receiving subsidies. Number
of individuals receiving premium and cost
sharing subsidies.
2. Premium cost. Average annual
premiums before subsidies.
3. Effective premium cost. Average
contribution to annual premiums.
4. Subsidy value. Average value of
premium and cost sharing subsidies for
individuals.
5. Affordability index. Metric incorporating
plan value, plan cost less subsidy, and
income.
Consumer Assistance
1. Application processing time. Elapsed
time between “first” point of contact with
exchange and eligibility determination.
2. Consumer appeals and resolutions.
Number and type of appeals filed with the
exchange and their resolutions.
3. Composite satisfaction measure.
Measure combining multiple dimensions
of individual consumer satisfaction.
4. Volume and efficiency metrics. For
navigator/assister functions, web portal
online help and service center
operations.
Health Plan Management
1. Qualified Health Plans. Number of QHPs offered through the exchange.
2. Certifications and de-certifications. Number of certifications, de-certifications and reasons.
3. Average risk scores. Average risk scores for individuals enrolled in coverage through the exchange.
4. Average rate changes. Average rate increases for QHPs.
22