Embed Size (px)
Citation preview

8/14/2019 Price Monetizer
http://slidepdf.com/reader/full/price-monetizer 1/15
Page 1/15
Author: Steven Vannelli
June 2, 2008
How Do You Say ‘Platform Company’ in Japanese?
For the past two decades, investors in Japan have had to endure limited or negativegrowth, deflation, deteriorating demographics, and a business environment that sup-ports inefficient “walking dead” companies. Unsurprisingly, it has thus been a toughplace to make money. Thus, we are not surprised to see that our past few months’bullishness on Japan has been met by howls of skepticism and derision from clients.In an ad-hoc comment published last week (see Japan’s Return to Normalcy ), Louistried to make the macro-case for Japan. In the following ad hoc comment, we will try to show concrete examples of how the macro-trends we have highlighted in our re-search are impacting Japanese companies today, and how Japanese companies some-times still fall short of Western investors’ expectation.
1– Piggy-Backing on China’s Growth Amongst the many complaints investors have about Japan is that the country’sgrowth typically relies on exports—with the unspoken criticism being that Japan isonly piggy-backing on other people’s growth. In other words, Japan is little morethan a leverage play on global growth, at a time when global growth is slowing.
To be fair, there is a lot of validity to this criticism as Japan’s exports have grownfrom representing 10% of GDP a decade ago to 17% today. However, over thecourse of the past decade, Japan’s export picture has changed dramatically. Just fiveyears ago, Japan was in essence a levered play on US consumption. But today, agrowing amount of the country’s exports are moving to other Asian nations. Japan’sexporters have thrived in the Asian boom of the past five years (see chart below) andit can now be said that the sales of Japanese exporters are far more diversified (andthus better), then they have ever been.
In Japan’s latest export expansion, the American consumer has simply not been aleading force. Instead, it is China whose thirst for Japanese goods has allowed ex-ports to grow as a percentage of GDP. Chinese imports from Japan have increasedmore than four-fold in the last decade to the point where China is now very close inabsolute terms to the United States as the largest importer of Japanese goods. At thecurrent pace, we should expect that China will overtake the US and become Japan’sbiggest client in the next few years.
Volume 2, Issue 17
June 2, 2008
GaveKal Equity Strategy
GaveKal AsiaSuite 801, 8th Floor
Chinachem Hollywood Cen-tre,
1-13 Hollywood Road,
Central, Hong Kong
852-2869 8363 (tel)
852-2869 8131 (fax)
www.gavekal.com
GaveKal EuropeNorrlandsgatan 15
11143 Stockholm
46 8 723-8080 (tel)
46 8 723-0712 (fax)
GaveKal USA1600 Glenarm Place
Suite 2611
Denver, CO 80202
303-534 8100 (tel)
303-534 8108 (fax)
GaveKal Middle-EastMakateb Business CenterOffice No. 601/604
Al Salmien TowerElectra StreetAbu Dhabi - UAE
971 (0)50 6170287 (tel)971 (0) 2 672 4344 (fax)
'98 '99 '00 '01 '02 '03 '04 '05 '06 '0700
2,0002,000
4,0004,000
6,0006,000
8,0008,000
10,00010,000
12,00012,000
14,00014,000
16,00016,000
18,00018,000
20,00020,000
1024.85
1989.18
2677.42
13093.89
16600.52
Gavekal Research - www.GaveKal.com
Japan
Japanese Exports by Major Country
(MSUM 1Y) Exports United States of America, JPY - Japan(MSUM 1Y) Exports China, JPY - Japan(MSUM 1Y) Exports Germany, JPY - Japan
(MSUM 1Y) Exports France, JPY - Japan(MSUM 1Y) Exports United Kingdom, JPY - Japan

8/14/2019 Price Monetizer
http://slidepdf.com/reader/full/price-monetizer 2/15
GaveKal Equity Strategy
Japan’s prospects forcontinued exportgrowth are veryfavourable.
From a close proximityto, and improving rela-tions with, China...
...to relatively inexpen-sive products...
...Japan has advan-tages when it comes tothe Asian export
market...
June 2, 2008 Page 2/15
Japan’s export growth has benefited from a variety of sustainable factors, namely:
1– Proximity to a booming China & Asia : Japan is obviously very close to theindustrialized areas of eastern China. This helps keep shipping costs low.
2– Stable Exchange Rates: Stable exchange rates between two countries aretypically conducive to growing trade flows. And interestingly, over the past dec-ade, the RMB-JPY exchange rate has been amazingly stable. When one considersthe upheavals that China (1997 Asian Crisis, SARS, boom linked to bank recapi-talization…) and Japan (banking crisis, TMT bust…) had to endure over thatdecade, one might wonder whether Japanese and Chinese monetary authoritiesare in fact not targeting their FX rates against the US$ but against one another?
3– A Massively Undervalued Yen: Japanese products, relative to similar prod-ucts coming from major export-competing countries such as Germany, are today
very inexpensive thanks to a very cheap Yen (or an expensive Euro).
4– Strong Labor Productivity Gains: Finally, and most importantly, Japan’srecent export growth is buoyed by the country’s strong labor productivity. Simply put, Japanese productivity per hour is rising, which is translating into lower unitlabor costs. In the last 10 years, Japan has experienced a substantial decline in its
unit labor costs on both an absolute as well as a relative basis compared to Ja-pan’s main export competitors, the United States and Germany. The UnitedStates and Germany have both had declining unit labor costs as well, but, as thecharts on the following page emphasizes, Japan’s decline in unit labor costs hassimply been more drastic.
'98 '99 '00 '01 '02 '03 '04 '05 '06 '070.050.05
0.0550.055
0.060.06
0.0650.065
0.070.07
0.0750.075
0.080.08
0.0850.085
0.07
0.07
0.07
0.08
Gavekal Research - www.GaveKal.com
JapanRMB/JPY Exchange Rate
RMB/JPYTrendline: Average with 1st standard deviation
'78 '79 '80 '81 '82 '83 '84 '85 '86 '87 '88 '89 '90 '91 '92 '93 '94 '95 '96 '97 '98 '99 '00 '01 '02 '03 '04 '05 '06 '07-40
-30
-20
-10
0
10
20
30
40
50
50
100
150
200
250
300
350
400
-26.75
-14.36
163.77
14.36
GaveKal Research - www.GaveKal.com
JapanJPY/EUR: PPP Value
Over/Under Value - % (Left)Spot Rates JPY/EUR, Close Daily - Japan (Right)
Trendline: Average (hidden) with 1st standard deviation

8/14/2019 Price Monetizer
http://slidepdf.com/reader/full/price-monetizer 3/15
GaveKal Equity Strategy
Rising labor productiv-
ity, and a resulting de-cline in unit labor costs,is another strength.
What, exactly, does Ja-pan export to China?
June 2, 2008 Page 3/15
So what exactly has Japan been exporting to China? The answer, linked toChina’s infrastructure spending boom (see The Bullish Growth in China’s Road Infra- structure Spending ) has been machinery. In recent years, Japan’s industrial sector hashad a positive macro wind at its back. But is this enough to make Japanese indus-trials an attractive investment proposition?
'98 '99 '00 '01 '02 '03 '04 '05 '06 '07 '0870
80
90
100
110
120
130
140
-15
-10
-5
0
5
10
15
79.27
-1.60
136.11
Gavekal Resear ch - www.GaveKal.com
JapanLabor Productivity
(INDEX) Labour Cost Manufacturing industry, 2000=100, SA - Japan (Left)(INDEX) Mfg Output Per Hour Index Civilia n Labor Force Basis NSA - Japan (Left)Unit Labor costs, Manufacturing (NSA, annual percent change) - Japan (Right)
'98 '99 '00 '01 '02 '03 '04 '05 '06 7070
7575
8080
8585
9090
9595
100100
105105
73.11
90.87
97.92
GaveKal Research - www.GaveKal.com
JapanUnit Labor Costs Relative to Major Competitors
(INDEX) Mfg Unit Labor Cost Index, Natl Currency Basis Civilian La bor Force Basis NSA - Germany(INDEX) Mfg Unit Labor Cost Index, Natl Currency Basis Civilian La bor Force Basis NSA - Japan(INDEX) Mfg Unit Labor Cost Index, Natl Currency Basis Civilian La bor Force Basis NSA - United States
'98 '99 '00 '01 '02 '03 '04 '05 '06 '070
500
1,000
1,500
2,000
2,500
3,000
3,500
4,000
2,000
4,000
6,000
8,000
10,000
12,000
14,000
283.60
390.88
437.37
478.51
779.97
792.85
929.89
1087.41
1660.49
1805.16
2052.20
2475.89
3450.97
13093.89
GaveKal Research- www.GaveKal.com
JapanExports to China
Exports China, JPY - Japan (Right)Exports China, chemicals, JPY- Japan (Left)Exports China, electrical machinery, JPY - Japan (Left)Exports China, general machinery, JPY - Japan (Left)Exports China, integrated circuits, JPY- Japan (Left)Exports China, iron and steel products, JPY - Japan (Left)Exports China, manufactured goods, JPY - Japan (Left)
Exports China, mineral fuels, JPY - Japan (Left)Exports China, motor vehicles, JPY - Japan (Left)Exports China, nonferrous metals, JPY- Japan (Left)Exports China, raw materials, JPY - Japan (Left)Exports China, semiconductors etc, JPY - Japan (Left)Exports China, transport equipment, JPY - Japan (Left)Exports China, other, JPY - Japan (Left)

8/14/2019 Price Monetizer
http://slidepdf.com/reader/full/price-monetizer 4/15

8/14/2019 Price Monetizer
http://slidepdf.com/reader/full/price-monetizer 5/15
GaveKal Equity Strategy
Relative to other sec-tors of Japanesebusiness, the Industri-
als do not seem to in-vest too heavily in R&D.
The exception is themachinery sector.
June 2, 2008 Page 5/15
Japan R&D by Sector R&D Expense Net Sales Market Cap R&D Intensity
(US$) Sector Average
Consumer Discretionary
Sum 40,580.8 1,319,631.4 700,433.7 2.5
Consumer Staples
Sum 2,137.8 330,808.5 203,252.7 1.2
Energy
Sum 399.7 261,851.8 58,432.0 0.1
Financials Sum 0.0 453,866.4 569,129.5 0.0
Health Care
Sum 8,576.2 130,266.4 167,430.9 11.0
Industrials
Sum 8,800.8 1,124,320.9 596,645.1 1.3
Information Technology
Sum 26,242.3 588,637.1 466,471.1 4.4
Materials
Sum 7,281.7 459,037.8 269,073.2 1.9
Telecom Services
Sum 3,263.5 218,087.0 174,090.5 1.1
Utilities
Sum 1,118.5 200,121.0 154,651.8 0.6
Total 98,401.1 5,086,628.4 3,359,610.5 2.6
R&D Spending by Industrial Sub-Sector R&D Expense Sales Market Cap R&D Intensity
(US$) Sub-Sector Ave
Air Freight & Logistics
Sum #N/A 12,284.3 6,690.1 N/A
Airlines
Sum #N/A 37,256.8 15,668.5 N/A
Building Products
Sum 965.9 57,896.4 38,591.3 1.7
Commercial Printing
Sum 504.2 32,929.8 19,233.2 1.5
Construction & Engineering
Sum 367.9 101,677.4 24,944.8 0.3
Construction & Farm Machinery & Heavy Trucks
Sum 1,207.3 63,787.1 47,035.6 1.7
Diversified Commercial & Professional Services
Sum 50.8 7,662.5 12,386.3 0.7
Electrical Components & Equipment
Sum 1,796.2 77,459.7 28,642.9 2.2
Heavy Electrical Equipment
Sum 1,053.4 40,579.2 18,545.9 2.6
Human Resource & Employment Services
Sum 0.0 4,128.0 325.6 0.0
Industrial Conglomerates
Sum #N/A 7,538.0 5,490.7 N/A
Industrial Machinery
Sum 2,263.3 130,870.6 101,114.7 2.0
Marine
Sum 11.4 58,730.9 32,303.3 0.0
Marine Ports & Services
Sum #N/A 3,886.6 4,418.9 N/A
Office Services & Supplies
Sum 11.8 2,260.2 1,013.5 0.5
Railroads
Sum 350.3 101,000.4 96,544.7 0.4
Trading Companies & Distributors
Sum 218.4 360,791.7 136,247.7 0.4
Trucking
Sum #N/A 23,581.2 7,447.6 N/A
Total 8,800.8 1,124,320.9 596,645.1 1.3

8/14/2019 Price Monetizer
http://slidepdf.com/reader/full/price-monetizer 6/15
GaveKal Equity Strategy
In short, we are watch-ing Japanese industrial
machinery companiestransform themselvesinto platform compa-nies.
Sumitomo Electric is anexample of a Japanesefirm that is moving to aplatform-companymodel.
June 2, 2008 Page 6/15
3– The Importance of R&D
Contrary to popular belief, most R&D expense concerns development . In the US, we can see from (rather dated) statistics produced by the National Science Foun-dation that development costs are far and away the largest component of R&D.
Following on that example, in the global auto industry, 85% of R&D is dedicatedto the development of tooling for the new year’s model—and given the similari-ties previously noted in R&D intensity, we would guess that this figure is proba-bly similar for the machinery industry.
And the goal of R&D should of course always be to boost productivity—whereproductivity is simply the change in the difference between input and output(which is why volume growth sends such an important signal). Typically, we look for productivity in two basic ways:
♦ A reduced level of capital intensity, indicative of a company moving to anasset-light strategy.
♦ An improved level of profitability, indicative of successfully moving up the value chain.
And of course, either of these trends can be seen as a sign that a company may betransforming itself into a platform company.
4– Becoming Platform Companies?
Sumitomo Electric, the largest Japanese electrical equipment manufacturer, pro- vides an example of just such a transformation. Over the last decade, capital ex-
penditures as a percentage of sales have been in a shallow downtrend (interruptedin the last recession by briefly falling sales).
'98 '99 '00 '01 '02 '03 '04 '05 '06 '07
55
66
77
88
99
1010
4.743
GaveKal Research - www.GaveKal.com
Capital Expenditures as a % of SalesSumitomo Electric Industries Ltd. (5802)
Capital Exp (Total) % Total Sales
'98 '99 '00 '01 '02 '03 00
1010
2020
3030
4040
5050
6060
7070
8080
9090
4.21
18.66
77.13
GaveKal Research- www.GaveKal.com
United StatesRe search & Development Spending Breakdown
Appplied Research as a % of T otalBasic Research as a % of Total
Development as a % of Total

8/14/2019 Price Monetizer
http://slidepdf.com/reader/full/price-monetizer 7/15
GaveKal Equity Strategy
Mitsubishi Electric isalso seeing a decline inthe capex-to-salesratio, while R&D spend-ing is on the rise.
P,P,&E turnover is on therise for a number ofJapanese firms—asign of improvingcapital productivity.
June 2, 2008 Page 7/15
And we find the same trend in Mitsubishi Electric Corp, Japan’s largest heavy electrical equipment company:
Of course, it is one thing to employ less physical capital—anyone can do that— but is quite another to more efficiently use a stock of fixed capital. This is why R&D spending is so important: because it leads to a deepening of the humanand organizational capital stock, that then provides the foundation upon
which to leverage one’s physical capital stock .
Identifying companies generating improved capital productivity is actually not sochallenging. A first sign is a rising trend in sales over net property plant andequipment. Looking again at Mitsubishi Electric Corp and also at Fanuc Inc., Ja-pan’s largest industrial machinery company, we find a marked improvement inthat ratio:
'98 '99 '00 '01 '02 '03 '04 '05 '06 '07
44
4.54.5
55
5.55.5
66
6.56.5
6.727
GaveKal Research - www.GaveKal.com
Net Property, Plant and Equipment Turnover
Mitsubishi Electric Corp. (6503)
Property, Plant & Equip - Net
'98 '99 '00 '01 '02 '03 '04 '05 '06 '07
33
44
55
66
77
88
3.57 1
GaveKal Research - www.GaveKal.com
Capital Expenditures as a % o f SalesMitsubishi Electric Corp. (6503)
Capital Exp (Total) % Total Sales
'98 '99 '00 '01 '02 '03 '04 '05 '06 '07
1.21.2
1.41.4
1.61.6
1.81.8
22
2.22.2 2 . 2 0 9
GaveKal Research -www.GaveKal .com
Net Proper ty , P lant and Eq uipm ent Turnover Fanuc Ltd. (69 54)
Property, Plant & Equip - Net

8/14/2019 Price Monetizer
http://slidepdf.com/reader/full/price-monetizer 8/15
GaveKal Equity Strategy
Better working capitaltrends are seen invariables such as im-proved inventory turn-over.
June 2, 2008 Page 8/15
The impact of improved capital productivity can be seen in working capitaltrends as well. An improved flow of goods out of the fixed capital base allowscompanies to leverage their inventories.
In any traded-good industry—especially one where unit labor costs are low andthe currency is undervalued—we look for a company to be grabbing marketshare. This is a two-fer for businesses selling products with positive demand elas-ticity because it means their slice of the pie is growing and the whole pie is grow-ing too.
'98 '99 '00 '01 '02 '03 '04 '05 '06 '07
55
5.55.5
66
6.56.5
77
7.57.5
6.844
GaveKal Research - www.GaveKal.com
Inventory Turnover Sumitomo Electric Industries Ltd. (580 2)
Inventory Turnover
'98 '99 '00 '01 '02 '03 '04 '05 '06 '07
44
4.54.5
55
5.55.5
5.396
GaveKal Research - www.GaveKal.com
Inventory Turnover Mitsubishi Electric Corp. (6503)
Inventory Turnover
'98 '99 '00 '01 '02 '03 '04 '05 '06 '07
1515
2020
2525
3030
353535.434
GaveKal Research - www.GaveKal.com
Foreign S ales as a % Total SalesSumitomo Electric Industries Ltd. (5802)
Foreign Sales % Total Sales

8/14/2019 Price Monetizer
http://slidepdf.com/reader/full/price-monetizer 9/15
GaveKal Equity Strategy
For machinery makers,foreign sales as a per-
cent of the total havegrown dramaticallyover the last decade.
June 2, 2008 Page 9/15
Just as we have done on the macro level, we can also deconstruct a company’srevenues and see the extent to which the company is generating volume gains. Inthe next chart, we take the Japanese producer price index for machinery andequipment and use it to deflate revenues. What we see, is Sumitomo doubled
revenues despite a –15% drop in prices. This was achieved through a 140% in-crease in volumes.
All of the above should culminate in a structurally rising trend in return on in- vested capital.
'98 '99 '00 '01 '02 '03 '04 '05 '06 '07
3434
3636
3838
4040
4242
4444
4646
4848
505049.461
GaveKal Research - www.GaveKal.com
Foreign Sales as a % Total SalesFanuc Ltd. (6954)
Foreign Sales % Total Sales
'93 '94 '95 '96 '97 '98 '99 '00 '01 '02 '03 '04 '05 '06 '07 '0880
100
120
140
160
180
200
220
240
260
8,000
10,000
12,000
14,000
16,000
18,000
20,000
22,000
85.41
20291.20
240.03
Gavekal Research - www.GaveKal.com
Japanese Machinery & EquipmentProducer Prices, Volume Index & Revenues
Sumitomo Electric Industries Ltd.
(INDEX) JPN PPI MACH & EQUIP, Index, Publication Base Year (2000), 2000Y - JAPAN (Left)Sumitomo Electric Industries Ltd. - Sales - Net (US $) (Right)(INDEX) Sumitomo Electric Industr ies Ltd. - Volume Index ( Left)
'98 '99 '00 '01 '02 '03 '04 '05 '06 '07
-1-1
00
11
22
33
44
55
666.169
©FactSet Research System s
Return on Inve sted Capital
Sumitomo Electric Industries Ltd. (580 2)
Return on Invested Capital

8/14/2019 Price Monetizer
http://slidepdf.com/reader/full/price-monetizer 10/15
GaveKal Equity Strategy
Focusing more on thebalance sheet of theseJapanese machinerymakers, we like to seecompanies reducingtheir levels of debt.
June 2, 2008 Page 10/15
5– Stumbling At An Important Hurdle
When we try to identify companies adopting the “platform-company” businessmodel (as explained in Our Brave New World ), we like to see signs that companiesare throwing off excess capital. While Japanese companies are shrinking the sizeof their balance sheets (mostly by reducing leverage), they are not doing so ac-tively enough. Most of the time, we find that companies are not necessarily pay-ing down debt but instead avoiding new debt:
'98 '99 '00 '01 '02 '03 '04 '05 '06 '07-4-4
-2-2
00
22
44
66
88
10109.653
©FactSet Research Systems
Return on Invested CapitalMitsubishi Electric Corp. (6503)
Return on Invested Capital
'98 '99 '00 '01 '02 '03 '04 '05 '06 '07
1515
2020
2525
3030
14.718
GaveKal Research - www.GaveKal.com
Long Term Debt as a % Total CapitalSumitomo Electric Industries Ltd. (580 2)
Long Term Debt % Total Capital
'98 '99 '00 '01 '02 '03 '04 '05 '06 '07
2525
3030
3535
4040
4545
5050
5555
6060
24.585
GaveKal Research - www.GaveKal.com
Long Term Debt as a % Total CapitalMitsubishi Electric Corp. (6503)
Long Term Debt % Total Capital

8/14/2019 Price Monetizer
http://slidepdf.com/reader/full/price-monetizer 11/15
GaveKal Equity Strategy
What are companiesdoing with the excess
capital that they aregenerating?
They don’t seem to behoarding the cash...
...but nor are they pay-ing huge dividends orrepurchasing largeamounts of shares.
June 2, 2008 Page 11/15
Of course, this begs the question of what Japanese companies are doing with theexcess capital that they are generating? Are they hoarding it? It doesn’t seem so:
Are they giving it back to shareholders (like American companies), via huge stock buybacks and massively increased dividends? A little bit of the latter but notenough of the former:
'98 '99 '00 '01 '02 '03 '04 '05 '06 '07
66
77
88
99
1010
1111
1212
6.335
GaveKal Research - www.GaveKal.com
Cash as a % Total AssetsSumitomo Electric Industries L td. (5802)
Cash as a % Total Assets
'98 '99 '00 '01 '02 '03 '04 '05 '06 '07
1010
1111
1212
1313
1414
1515
1616
9.865
GaveKal Research - www.GaveKal.com
Cash as a % Total AssetsMitsubishi Electric Corp. (6503)
Cash as a % Total Assets
'98 '99 '00 '01 '02 '03 '04 '05 '06 '07
-10,000-10,000
00
10,00010,000
20,00020,000
30,00030,000
-15477.000
-1.000
GaveKal Research - www.GaveKal.com
Dividends & Share BuybacksSumitomo Electric Industries Ltd. (5802)
Common & Pfd Stk - Change (CF) Dividends Paid - Total (CF)

8/14/2019 Price Monetizer
http://slidepdf.com/reader/full/price-monetizer 12/15
GaveKal Equity Strategy
Unfortunately, excesscash is often investedin other companies — and not for the rightreasons.
Associate income and
minority interests re-duces the quality ofboth earnings and thebalance sheet.
June 2, 2008 Page 12/15
Then where is the money going? This is the part that makes us cringe. All too
often, instead of returning excess capital to shareholders, Japanese companiesinstead invest in other companies. Needless to say, this usually proves to be amisallocation of capital if only because, all too often, it has less to do with seeking out the highest rate of return for shareholders’ money than with establishing de-fenses against takeovers. In the charts below, we take acquisitions/investmentfrom the financing section of the cash flow statement and compare it to invest-ments in unconsolidated subsidiaries from the balance sheet:
These investments in other companies make financial statements much less trans-parent than we would like to see. Equity in earnings, which results when onecompany treats an investment in an unconsolidated subsidiary under the equity method, is the proportional share of the subsidiaries’ income. For example, if company A owns 10% of company B, and company B reports $100 of income,company A books $10 as equity in earnings. However because we do not see thefull accounts of company B, we do not know how secure that income will be in
the future.Conversely, when a company has sold a stake in itself (think private equity), thatinvestment is recorded on the balance sheet as a minority interest. Minority inter-est holders are first in line to claim income, followed by preferred and commonshareholders. However when a company has a large minority interest as a share
'98 '99 '00 '01 '02 '03 '04 '05 '06 '07
-25,000-25,000
-20,000-20,000
-15,000-15,000
-10,000-10,000
-5,000-5,000
00
-25758.000
30.000
GaveKal Research - www.GaveKal.com
Dividends & Share BuybacksMitsubishi Electric Corp. (6503)
Common & Pfd Stk - Change (CF) Dividends Paid - Total (CF)
'98 '99 '00 '01 '02 '03 '04 '05 '06 '07
800
900
1,000
1,100
1,200
1,300
1,400
1,500
1,600
100
150
200
250
300
350
400
159.307
1554.556
GaveKal Research - www.GaveKal.com
Cash Flow Spent on Investments & Level of In vestments in Subsidiaries
Sumitomo Electric Industries Ltd. (5802)
Acquisitions & Investments - (CF) Investments - in Unconsolidated Subsidiaries
8/14/2019 Price Monetizer
http://slidepdf.com/reader/full/price-monetizer 13/15
GaveKal Equity Strategy
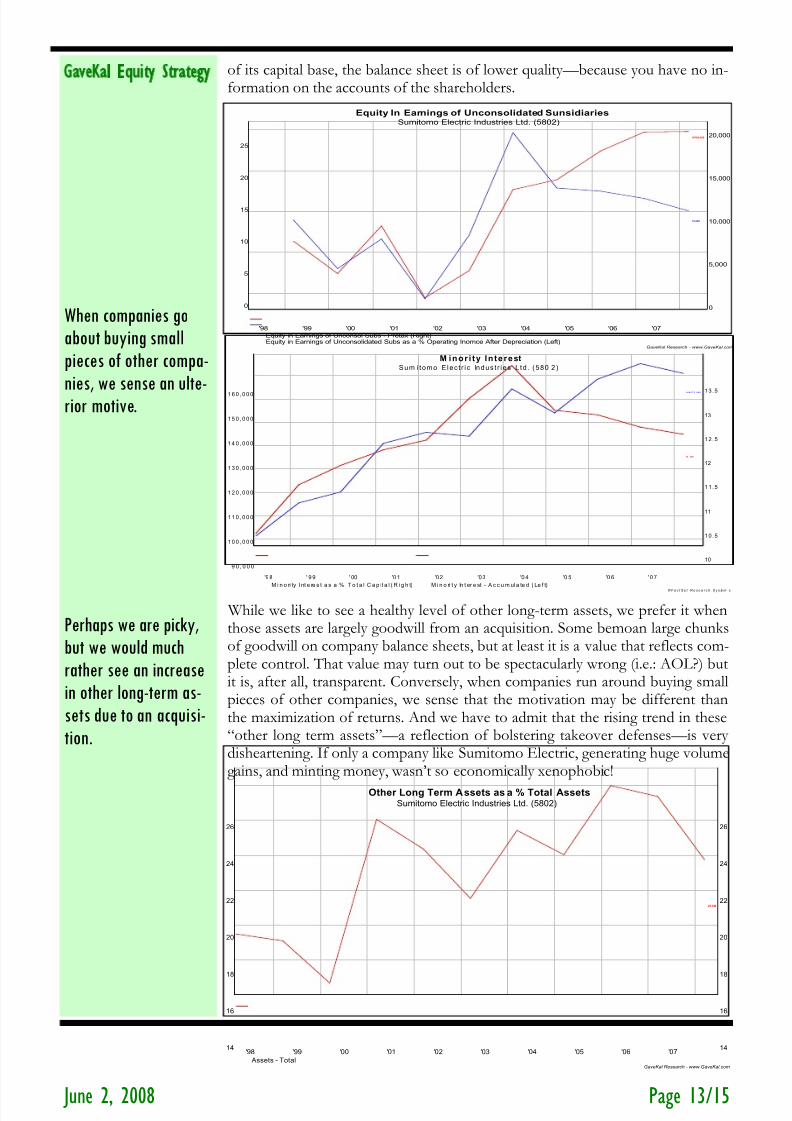
When companies goabout buying smallpieces of other compa-
nies, we sense an ulte-rior motive.
Perhaps we are picky,but we would muchrather see an increasein other long-term as-sets due to an acquisi-tion.
June 2, 2008 Page 13/15
of its capital base, the balance sheet is of lower quality—because you have no in-formation on the accounts of the shareholders.
While we like to see a healthy level of other long-term assets, we prefer it whenthose assets are largely goodwill from an acquisition. Some bemoan large chunksof goodwill on company balance sheets, but at least it is a value that reflects com-plete control. That value may turn out to be spectacularly wrong (i.e.: AOL?) butit is, after all, transparent. Conversely, when companies run around buying smallpieces of other companies, we sense that the motivation may be different thanthe maximization of returns. And we have to admit that the rising trend in these“other long term assets”—a reflection of bolstering takeover defenses—is very disheartening. If only a company like Sumitomo Electric, generating huge volumegains, and minting money, wasn’t so economically xenophobic!
'98 '99 '00 '01 '02 '03 '04 '05 '06 '07
0
5,000
10,000
15,000
20,000
0
5
10
15
20
25
13.265
19765.000
GaveKal Research - www.GaveKal.com
Equity In Earnings of Unconsolidated SunsidiariesSumitomo Electric Industries Ltd. (5802)
Equity in Earnings of Unconsol Subs - Pretax (Right)Equity in Earnings of Unconsolidated Subs as a % Operating Inomce After Depreciation (Left)
'98 ' 9 9 ' 00 '0 1 '02 '03 '0 4 '0 5 '0 6 ' 0 7
10
10 .5
11
11 .5
12
12 .5
13
13 .5
9 0 , 0 0 0
1 0 0 , 0 0 0
1 1 0 , 0 0 0
1 2 0 , 0 0 0
1 3 0 , 0 0 0
1 4 0 , 0 0 0
1 5 0 , 0 0 0
1 6 0 , 0 0 0
12 .145
1 6 0 6 7 5 . 0 0 0
© F a c t S e t R e s e a r c h S y s te m s
M inor i ty Inte restSum i tomo E lec t r i c Indus t r i es L td . (580 2 )
M i n o ri ty I nt e re s t a s a % T o t a l C a p it a l ( R i g h t) M i n o ri t y In t er e st - A c c u m ul a te d ( Le f t)
'98 '99 '00 '01 '02 '03 '04 '05 '06 '071414
1616
1818
2020
2222
2424
2626
21.740
GaveKal Research - www.GaveKal.com
Other Long Term Assets as a % Total AssetsSumitomo Electric Industries Ltd. (5802)
Assets - Total

8/14/2019 Price Monetizer
http://slidepdf.com/reader/full/price-monetizer 14/15
GaveKal Equity Strategy
Is the paranoid
behavior of Japanesemanagement largelydiscounted?
June 2, 2008 Page 14/15
6– Conclusion
So, as investors, we have two opposing forces to weigh. On the one hand, Japa-nese industrial companies are experiencing tremendous growth on the back of smart investments and an explosion in demand from China. Even more encour-agingly, Japanese machinery companies are starting to demonstrate many of theattributes of platform companies. This force is so powerful that, despite the eco-nomic slowdown unfolding around the world, Japanese industrial companies aredemonstrating tremendous earnings momentum. In fact, they are the only sector
with rising earnings estimates in Japan. On the other hand, balance sheets andincome statements are murky and companies are throwing too much of theirmoney down the nezumi hole.
Our colleague Chris Russell, who just spent a week in Japan meeting with compa-nies and investors, had this to say in response to Louis’ recently published Japan’s Return to Normalcy : “It is interesting to hear 1) how many long/short managershave folded, especially those who started relatively recently, and 2) that Japan isno longer an independent asset class… Regarding macro or long-only institu-tional investors, Merrill Lynch estimates, from their Global Fund Manager Sur-
vey, that global investors are now as underweight Japan as at anytime since 2003but when asked what their one-year view would be, there are now 10% moremanagers who would be overweight Japan, mirroring a change in their view of Europe from over to under. This is a good time to make the case for relative per-formance arising from a structural more than a cyclical change in Japanese eq-uity.”
Which basically brings us back to the question at hand, namely if the big hurdleto an equity market rally is the paranoid behavior of Japanese management, thento what extent is that value-destructive attitude reflected in current valuations?
Today, we find a number of companies selling near book value and at historically low multiples of whatever one cares to compare: earnings, cash flow, or sales.
Thus, we cannot help but feel that, after two decades of valuation compression, Japanese machinery companies (at the very least) are worth a look. By and large,they have wisely pursued and executed on a platform company strategy, whichhas allowed them to become more resilient to external shocks. And we believethat this new strategy, and resilience, is not yet reflected in share prices.
So how do you say ‘Platform Company’ in Japanese? We put that question to a Japanese-speaking friend and her response was, “It doesn’t translate”. In theyears to come, and especially for the sake of our overweighting of Japan, let’shope that it does. Japan is now so close.
May Jun Jul Aug Sep Oct Nov Dec Jan Feb Mar Apr 4040
5050
6060
7070
8080
9090
100100
110110
120120
130130
44.96
85.71
86.91
93.57
96.76
99.17
102.21
103.43
103.94
117.45
GaveKal Research - www.GaveKal.com
JapanIndex of IBES Earings Estimates 12 Months Forward
(INDEX) MSCI Japan / Consumer Discretionary -SEC - IBES Aggregates - Mean EPS Est - 12 Months(INDEX) MSCI Japan / Consumer Staples -SEC - IBES Aggregates - Mean EPS Est - 12 Months(INDEX) MSCI Japan / Energy -SEC - IBES Aggregates - Mean EPS Est - 12 Months(INDEX) MSCI Japan / Financials -SEC - IBES Aggregates - Mean EPS Est - 12 Months(INDEX) MSCI Japan / Health Care -SEC - IBES Aggregates - Mean EPS Est - 12 Months(INDEX) MSCI Japan / Industrials -SEC - IBES Aggregates - Mean EPS Est - 12 Months(INDEX) MSCI Japan / Informat ion Technology -SEC - IBES Aggregates - MeanEPS Est - 12 Months(INDEX) MSCI Japan / Materials -SEC - IBES Aggregates - Mean EPS Est - 12 Months(INDEX) MSCI Japan / Telecommunications Services -SEC - IBES Aggregates - Mean EPS Est - 12 Months(INDEX) MSCI Japan / Utiliti es -SEC - IBES Aggregates - Mean EPS Est - 12 Months

8/14/2019 Price Monetizer
http://slidepdf.com/reader/full/price-monetizer 15/15
GaveKal Equity Strategy
These various valuation
measures provide fur-ther fuel for ouroptimistic fire.
'88 '89 '90 '91 '92 '93 '94 '95 '96 '97 '98 '99 '00 '01 '02 '03 '04 '05 '06 '07
0.50.5
11
1.51.5
22
2.52.5
33
3.53.5
44
4.54.5
1.061
GaveKal Research - www.GaveKal.com
Price to Book Value RatioSumitomo Electric Industries Ltd. (5802)
Japan - Industrials - Electrical Components & Equipment
'88 '89 '90 '91 '92 '93 '94 '95 '96 '97 '98 '99 '00 '01 '02 '03 '04 '05 '06 '070.20.2
0.40.4
0.60.6
0.80.8
11
1.21.2
1.41.4
.398
GaveKal Research - www.GaveKal.com
Price to Sales RatioSumitomo Electric Industries Ltd. (5802)
Japan - Industrials - Electrical Components & Equipment
'88 '89 '90 '91 '92 '93 '94 '95 '96 '97 '98 '99 '00 '01 '02 '03 '04 '05 '06 '07
44
66
88
1010
1212
1414
1616
1818
2020
2222
4.790
GaveKal Research - www.gavekal.com
Price to Cash Flow RatioSumitomo Electric Industries Ltd. (5802)
Japan - Industrials - Electrical Components & Equipment
'88 '89 '90 '91 '92 '93 '94 '95 '96 '97 '98 '99 '00 '01 '02 '03 '04 '05 '06 '07
0.40.4
0.60.6
0.80.8
11
1.21.2
1.41.4
1.61.6
1.81.8
1.538
Dividend YieldSumitomo Electric Industries Ltd. (5802)
Japan - Industrials - Electrical Components & Equipment