Embed Size (px)
Citation preview

N0057600
GJO−2003−410−TAC GJO−PIN 25.5.1
Pinellas Environmental Restoration Project Quarterly Progress Report
for the Young - Rainey STAR Center’s 4.5 Acre Site
October through December 2002
January 2003
Prepared by U.S. Department of Energy
Grand Junction Office Grand Junction, Colorado
Work Performed Under DOE Contract Number DE−AC13−02GJ79491 Task Order Number ST03-107

Document Number N0057600 Contents
DOE/Grand Junction Office 4.5 Acre Site Quarterly Progress Report January 2003 Page iii
Contents Acronyms and Abbreviations ..........................................................................................................v 1.0 Introduction ............................................................................................................................1
1.1 Site Update....................................................................................................................2 1.2 Quarterly Site Activities ...............................................................................................3
2.0 Monitoring Data .....................................................................................................................3 2.1 Ground Water Elevations and Flow .............................................................................3 2.2 Ground Water Sampling ...............................................................................................4 2.3 Ground Water Analytical Results.................................................................................4 2.4 Geochemical Parameters ..............................................................................................5 2.5 Quality Assurance/Quality Control ..............................................................................6
3.0 Biosparge System Operation..................................................................................................6 3.1 Biosparge System Performance....................................................................................6 3.2 Biosparge System Sampling and Monitoring ...............................................................7
4.0 Tasks to be Performed Next Quarter......................................................................................7 5.0 References ..............................................................................................................................7
Figures Figure 1. Young - Rainey STAR Center Location ......................................................................... 9 Figure 2. 4.5 Acre Site Location................................................................................................... 10 Figure 3. Monitoring Well Locations and DPT Locations with Total COPC Concentrations
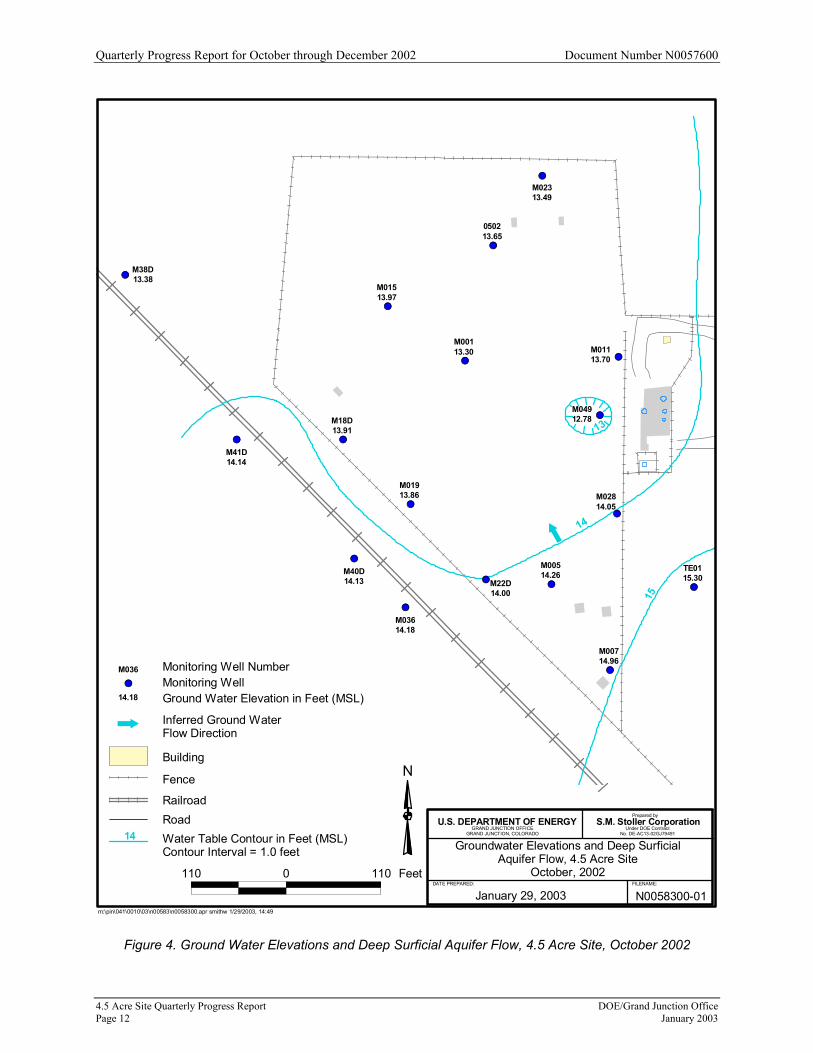
and Sample Depths ........................................................................................................ 11 Figure 4. Ground Water Elevations and Deep Surficial Aquifer Flow, 4.5 Acre Site,
October 2002.................................................................................................................. 12
Tables Table 1. Field Measurements and VOCs Concentrations from Additional DPT Locations at the
4.5 Acre Site................................................................................................................... 13 Table 2. Water-Level Data at the 4.5 Acre Site............................................................................ 14 Table 3. Field Measurements of Samples Collected at the 4.5 Acre Site..................................... 15 Table 4. COPC Concentrations from wells and DPT Locations at the 4.5 Acre Site................... 18 Table A–1. Relative Percent Difference (RPD) for Duplicate Samples.....................................A–3
Complete Appendices will be provided upon request. Click appendices to request Appendix A. Laboratory Reports—October 2002 Quarterly Results (Table A-1 Only)

Document Number N0057600 Acronyms and Abbreviations
DOE/Grand Junction Office 4.5 Acre Site Quarterly Progress Report January 2003 Page v
Acronyms and Abbreviations bls below land surface BTEX benzene, toluene, ethylbenzene, and xylene °C degrees Celsius ComQAP Comprehensive Quality Assurance Plan COPC contaminants of potential concern DCE dichloroethene DOE U.S. Department of Energy DPE dual-phase extraction DPT direct push technology EPA U.S. Environmental Protection Agency FDEP Florida Department of Environmental Protection ft feet HPC Heterotrophic Plate Count HSWA Hazardous and Solid Waste Amendment IRA Interim Remedial Action µg/L micrograms per liter µmhos/cm micromhos per centimeter mg/L milligrams per liter mV millivolts NGVD national geodetic vertical datum NTU Nephelometric Turbidity Units PCIC Pinellas County Industrial Council RAP Remedial Action Plan RCRA Resource Conservation and Recovery Act RPD relative percent difference STAR Center Young – Rainey Science, Technology, and Research Center STL Severn Trent Laboratories TCE trichloroethene TCOPC total contaminants of potential concern TVOCs total volatile organic compounds VOCs volatile organic compounds
Document Number N0057600 Quarterly Progress Report for October through December 2002
DOE/Grand Junction Office 4.5 Acre Site Quarterly Progress Report January 2003 Page 1
1.0 Introduction
The Young - Rainey Science, Technology, and Research Center (STAR Center) is a former U.S. Department of Energy (DOE) facility constructed in the mid-1950s in Pinellas County, Florida. The STAR Center, while owned by DOE, primarily manufactured neutron generators for nuclear weapons. Other products manufactured at the STAR Center have included radioisotopically-powered thermoelectric generators, thermal batteries, specialty capacitors, crystal resonators, neutron detectors, lightning arrestor connectors, and vacuum switch tubes. In 1987, the U.S. Environmental Protection Agency (EPA) performed a Resource Conservation and Recovery Act (RCRA) Facility Assessment at the site to gather information on potential releases of hazardous materials. In February of 1990, EPA issued a Hazardous and Solid Waste Amendments (HSWA) Permit to DOE, enabling DOE to investigate and perform remediation activities in those areas contaminated by hazardous materials resulting from DOE operations. In November 2000, the State of Florida received HSWA authorization from the EPA. On March 17, 1995, DOE sold the facility to the Pinellas County Industrial Council (PCIC). The sales contract includes clauses to ensure continued compliance with Federal, State, and local regulations while DOE remediates the site. On July 1, 1999, the PCIC was disestablished and ownership of the STAR Center changed to the Pinellas County government. Administration of DOE activities at the facility is the responsibility of the DOE Idaho Operations Office. Responsibility for environmental restoration activities, conducted under the EPA RCRA Corrective Action Program of 1984, was transferred from DOE’s Pinellas Area Office to DOE’s Grand Junction Office in October 1997. S.M. Stoller Corporation (Stoller), a prime contractor to DOE’s Grand Junction Office, provides technical support to DOE for remediation and closure of all active solid-waste management units on site and for the 4.5 Acre Site. The STAR Center is a 99-acre facility located in Largo, Florida, and lies in the northeast quarter of Section 13, Township 30 South, Range 15 East (Figure 1). The 4.5 Acre Site is located to the northwest of the STAR Center (Figure 2). This parcel was owned by DOE from 1957 to 1972, at which time it was sold to a private landowner. During the period of DOE ownership, the property was used for disposal of drums of waste resins and solvents. As a result of this practice, the surficial aquifer was impacted by volatile organic compounds (VOCs), primarily vinyl chloride, toluene, trichloroethene (TCE), and 1,2-dichloroethene (DCE). DOE completed a source removal in 1985. An Interim Remedial Action (IRA) consisting of ground water extraction and treatment via air stripping, and a routine ground water monitoring program were initiated in May 1990. In July 1997, a modification of the IRA involving installation of dual-phase extraction (DPE) wells provided a more aggressive system to remove ground water contamination. In November 1999, the DPE/air-stripping system was replaced with an in-situ biosparge treatment system. All activities associated with this site are conducted consistent with the Florida Department of Environmental Protection (FDEP) Corrective Actions for Contamination Site Cases (FDEP not dated) and the Remediation Agreement for the Four and One-Half Acre Site in Largo, Pinellas County, Florida, Between: State of Florida Department of Environmental Protection and U.S. Department of Energy (FDEP 2001). The 4.5 Acre Site Biosparge System Integration Plan (DOE 2000a) was approved by FDEP on January 17, 2001. This plan states that performance monitoring would be undertaken on a quarterly basis. Therefore, in April 2001, performance monitoring of the remedial system through the use of direct push technology (DPT) was undertaken. With this report, seven quarters of data have been collected. Samples of ground water were collected from 40 locations to depths
Quarterly Progress Report for October through December 2002 Document Number N0057600
4.5 Acre Site Quarterly Progress Report DOE/Grand Junction Office Page 2 January 2003
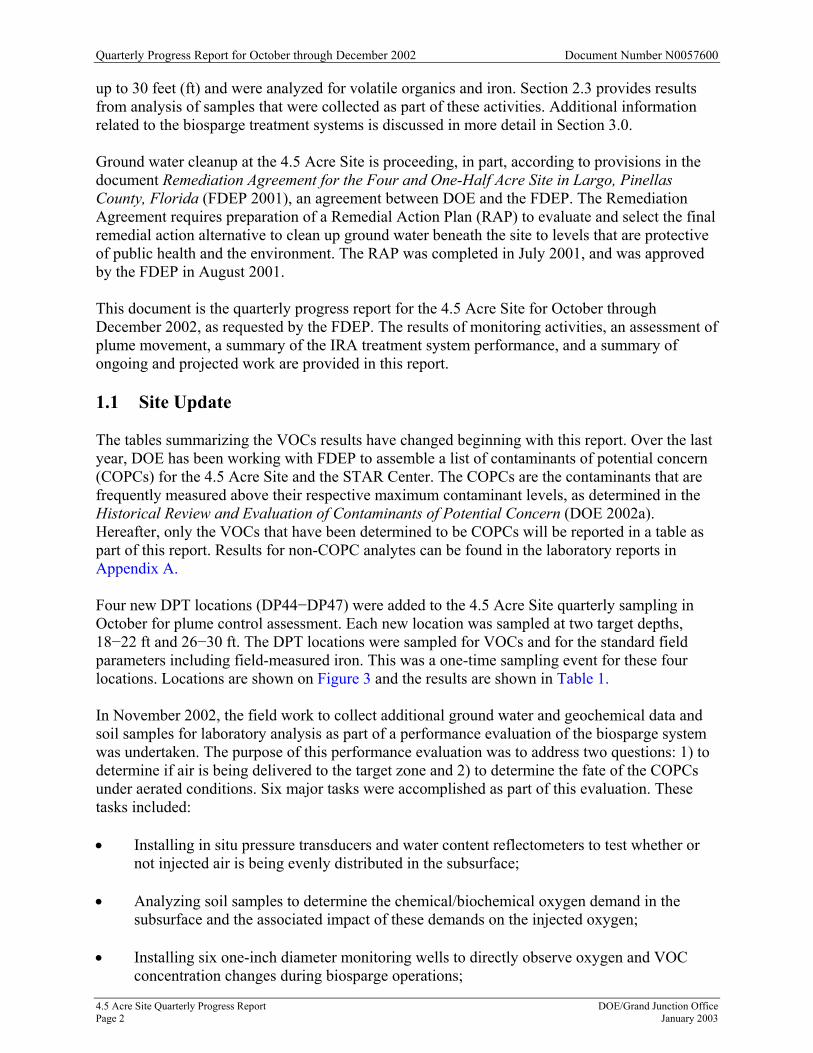
up to 30 feet (ft) and were analyzed for volatile organics and iron. Section 2.3 provides results from analysis of samples that were collected as part of these activities. Additional information related to the biosparge treatment systems is discussed in more detail in Section 3.0. Ground water cleanup at the 4.5 Acre Site is proceeding, in part, according to provisions in the document Remediation Agreement for the Four and One-Half Acre Site in Largo, Pinellas County, Florida (FDEP 2001), an agreement between DOE and the FDEP. The Remediation Agreement requires preparation of a Remedial Action Plan (RAP) to evaluate and select the final remedial action alternative to clean up ground water beneath the site to levels that are protective of public health and the environment. The RAP was completed in July 2001, and was approved by the FDEP in August 2001. This document is the quarterly progress report for the 4.5 Acre Site for October through December 2002, as requested by the FDEP. The results of monitoring activities, an assessment of plume movement, a summary of the IRA treatment system performance, and a summary of ongoing and projected work are provided in this report. 1.1 Site Update The tables summarizing the VOCs results have changed beginning with this report. Over the last year, DOE has been working with FDEP to assemble a list of contaminants of potential concern (COPCs) for the 4.5 Acre Site and the STAR Center. The COPCs are the contaminants that are frequently measured above their respective maximum contaminant levels, as determined in the Historical Review and Evaluation of Contaminants of Potential Concern (DOE 2002a). Hereafter, only the VOCs that have been determined to be COPCs will be reported in a table as part of this report. Results for non-COPC analytes can be found in the laboratory reports in Appendix A. Four new DPT locations (DP44−DP47) were added to the 4.5 Acre Site quarterly sampling in October for plume control assessment. Each new location was sampled at two target depths, 18−22 ft and 26−30 ft. The DPT locations were sampled for VOCs and for the standard field parameters including field-measured iron. This was a one-time sampling event for these four locations. Locations are shown on Figure 3 and the results are shown in Table 1. In November 2002, the field work to collect additional ground water and geochemical data and soil samples for laboratory analysis as part of a performance evaluation of the biosparge system was undertaken. The purpose of this performance evaluation was to address two questions: 1) to determine if air is being delivered to the target zone and 2) to determine the fate of the COPCs under aerated conditions. Six major tasks were accomplished as part of this evaluation. These tasks included: • Installing in situ pressure transducers and water content reflectometers to test whether or
not injected air is being evenly distributed in the subsurface; • Analyzing soil samples to determine the chemical/biochemical oxygen demand in the
subsurface and the associated impact of these demands on the injected oxygen; • Installing six one-inch diameter monitoring wells to directly observe oxygen and VOC
concentration changes during biosparge operations;

Document Number N0057600 Quarterly Progress Report for October through December 2002
DOE/Grand Junction Office 4.5 Acre Site Quarterly Progress Report January 2003 Page 3
• Determining biodegradation rates and oxygen consumption rates utilizing microcosm
experiments with site soils and ground water; • Performing biological characterization by determining the phospholipid fatty acid
concentrations of subsurface sediments; and • Determining VOC concentrations in soil gas at selected areas of the site. The results of these tasks will be summarized in a report that will be prepared during the first quarter of 2003. 1.2 Quarterly Site Activities • Obtained water-level measurements from all monitoring wells on October 7−8, 2002.
• Conducted the quarterly sampling event (i.e., collected ground water samples from 20 monitoring wells and 60 ground water samples from 35 DPT sample locations) in October 2002 for analysis of VOCs.
• Collected 10 samples from four additional DPT locations that were placed to gather information for plume delineation.
• Collected field parameter and iron data from all DPT locations to evaluate geochemical conditions during active biosparging
• Reported the results of quarterly sampling events (this document). • Performed preventive maintenance on the biosparge systems throughout the quarter.
2.0 Monitoring Data
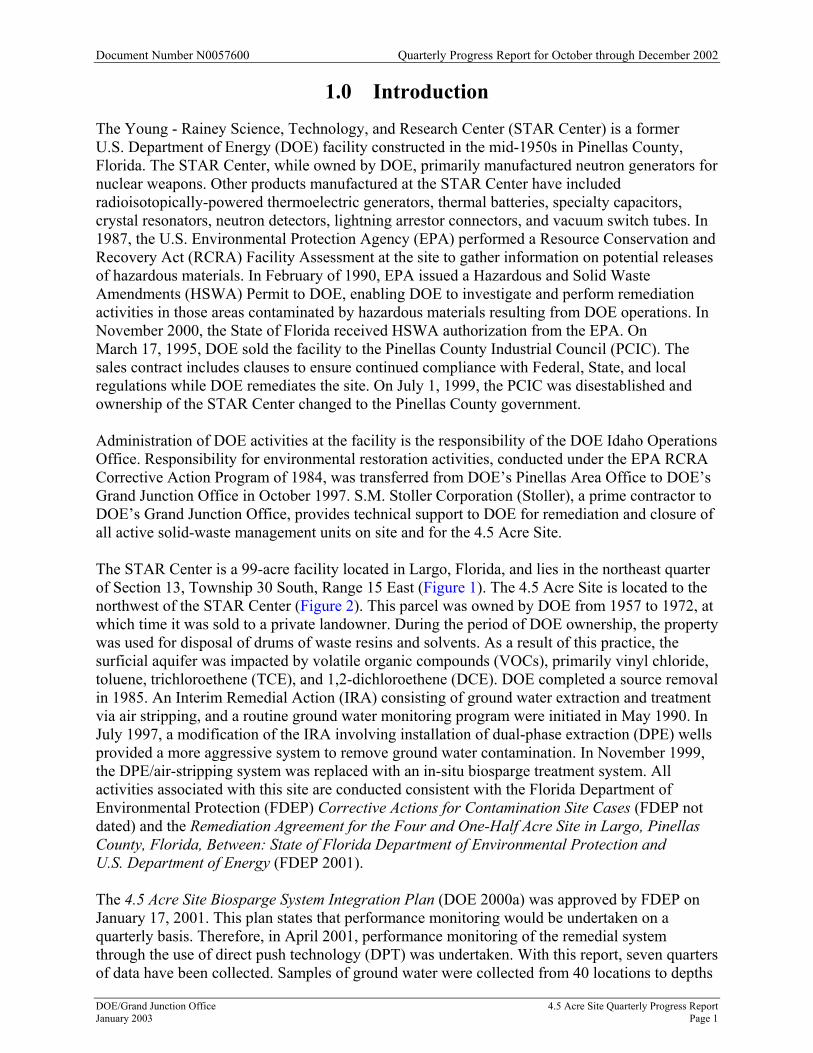
2.1 Ground Water Elevations and Flow Within a 3-hour period on October 7, 2002, depth-to-water measurements were taken in all monitoring wells at the 4.5 Acre Site (except those along the railroad tracks) as part of the sitewide quarterly sampling event. Measurements in the wells along the tracks were made in the morning on October 8. The depth to water in each well was measured with an electronic water-level indicator. The October 2002 ground water elevation data for the 4.5 Acre Site are listed in Table 2. The data and information from deep wells were used to construct contours of water levels in the deep surficial aquifer in Figure 4. The water levels were measured 3 and 4 days following shutdown of the biosparging system on October 4, 2002. The interpretative flow patterns shown on Figure 4 indicate a slight ground water low in the center of the site (around monitoring well PIN20–M049), with ground water flowing towards this low from all directions. These flow patterns suggest that ground water in the center of the site was displaced by air from the biosparging system, and 3 days following
Quarterly Progress Report for October through December 2002 Document Number N0057600
4.5 Acre Site Quarterly Progress Report DOE/Grand Junction Office Page 4 January 2003
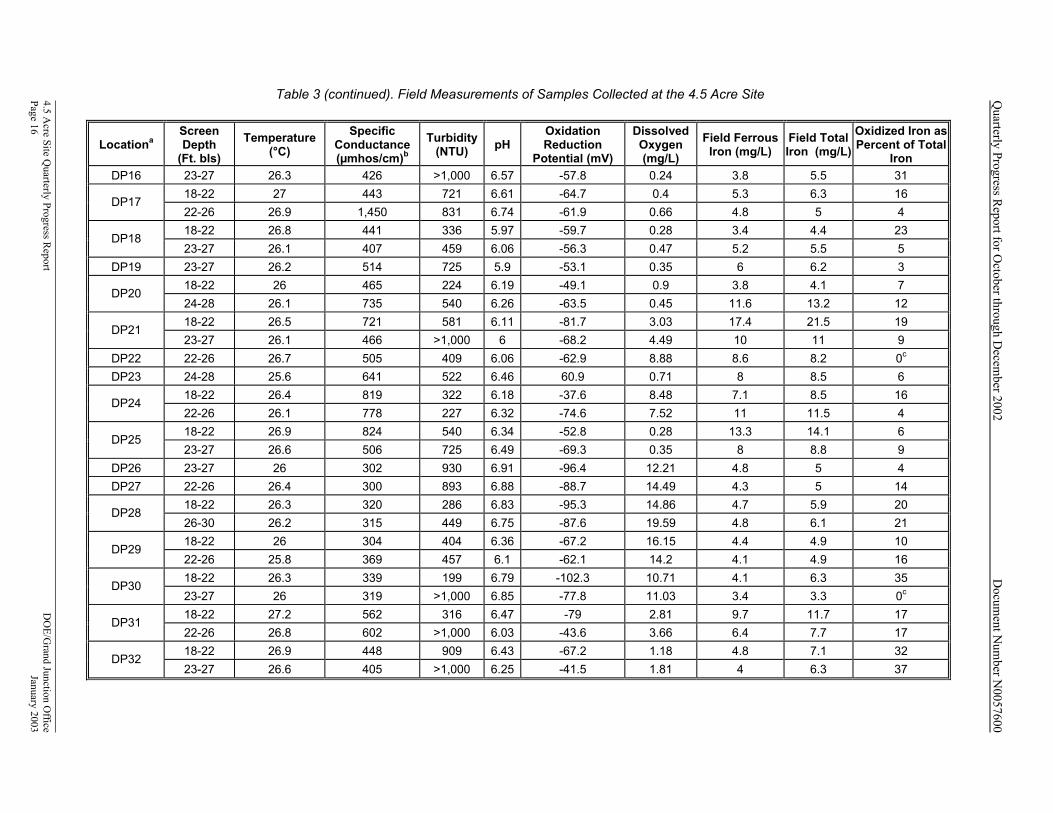
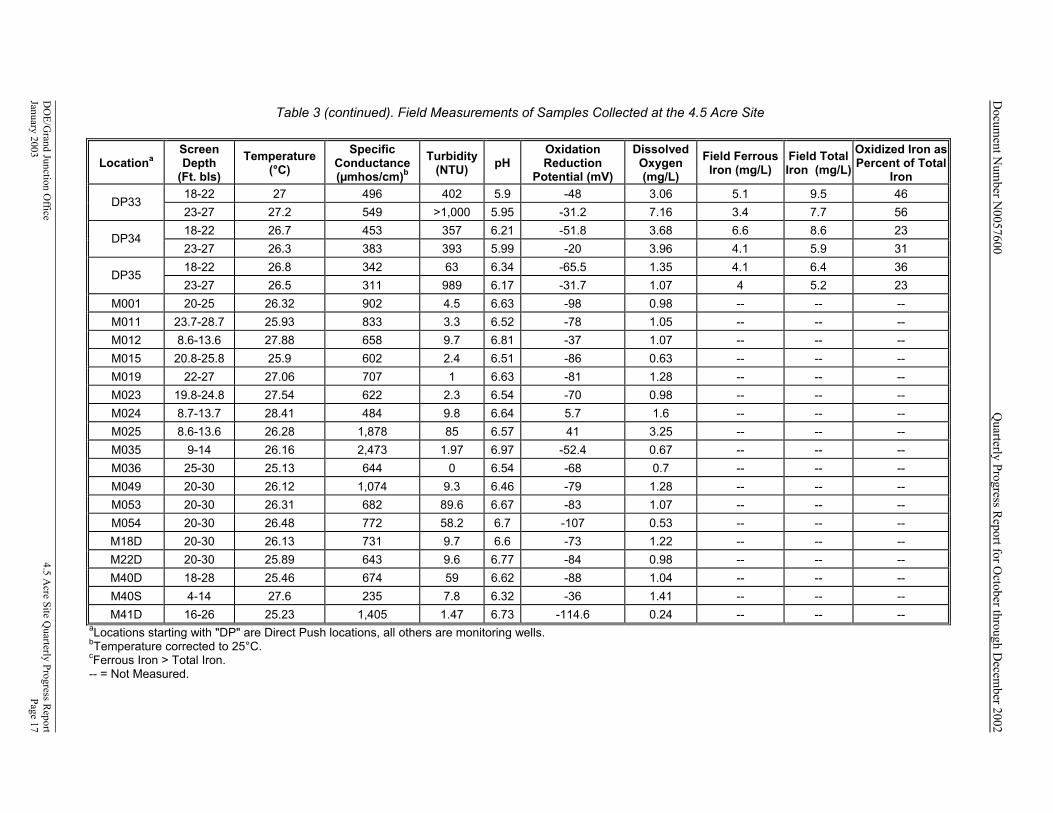
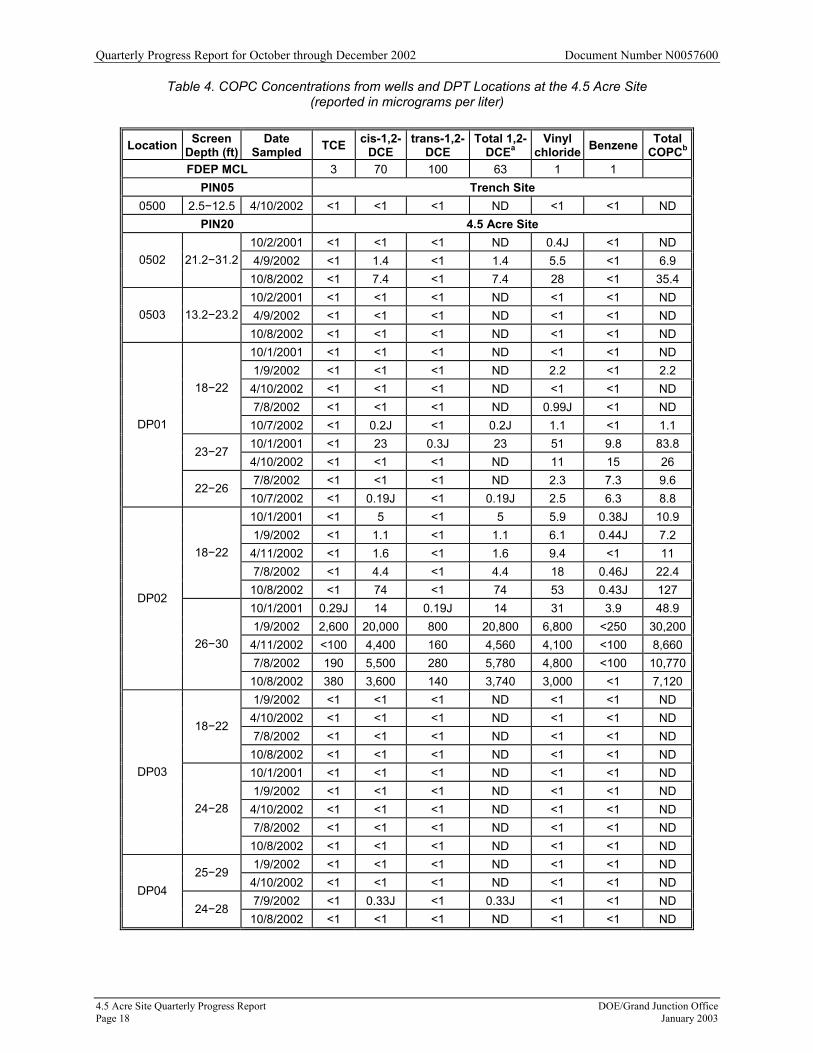
system shutdown, water was still flowing towards this hydraulic low. This flow pattern is consistent with the patterns observed the previous five quarters. Under static, non-pumping conditions, ground water at the site has historically been observed to flow to the north-northwest with no hydraulic low in the center of the site. The water table ranged from about 3 to 7 ft below land surface (bls), with ground water elevations that ranged from a high of 15.30 ft at PIN20–TE01 to a low of 9.12 ft at PIN20−M025. The hydraulic gradients in the south and north areas of the site were approximately 0.008 and 0.002 feet per foot, respectively. These gradients are similar to those observed in October 2001, but slightly less than those observed in July 2002. Using Darcy’s Law, along with approximations of 1 ft/day for hydraulic conductivity and 0.3 for effective porosity, ground water in the south part of the site is estimated to move about 10 ft/year, which is consistent with previously observed velocities of 6 to 10 ft/year. 2.2 Ground Water Sampling Twenty monitoring wells and 40 DPT locations were sampled by Stoller personnel in October 2002. Four of the DPT locations were one-time locations sampled to aid in plume delineation. All DPT locations were sampled at approximately 26 to 30 ft bls and a selected subset of 30 DPT locations were also sampled at approximately 18 to 22 ft bls (total of 70 DPT ground water samples). All DPT locations were filled with bentonite chips after sampling. The sampling screen depths bls are used as part of the identifier for the DPT locations for the tables in this report. All samples were collected in accordance with the Stoller Sampling and Analysis Plan for the Young - Rainey STAR Center (DOE 2002b), using FDEP procedures. All samples collected were submitted to Severn Trent Laboratories (STL) for analysis of VOCs using EPA Method 8021. STL is accredited by the Florida Department of Health in accordance with the National Environmental Laboratory Accreditation Conference, certification number E84282. The monitoring wells were purged with dedicated bladder pumps. The wells were micropurged, and the samples were collected when the field measurements stabilized. DPT locations were purged using a peristaltic pump and sampled when the field measurements stabilized. Table 3 lists measurements of pH, specific conductance, dissolved oxygen, oxidation/reduction potential, turbidity, and temperature recorded at the time each sample was collected. These measurements were collected using a flow cell and multiparameter meter. Values for total iron and ferrous iron were measured at the DPT locations using a colorimeter and are discussed in Section 2.4. 2.3 Ground Water Analytical Results Individual COPC and total COPCs (TCOPCs) concentrations in samples collected from wells and direct-push locations at the 4.5 Acre Site are included in Table 4. The previous four quarters of results are included in Table 4 for comparison. Figure 3 shows the TCOPCs concentrations.

Document Number N0057600 Quarterly Progress Report for October through December 2002
DOE/Grand Junction Office 4.5 Acre Site Quarterly Progress Report January 2003 Page 5
No COPCs were detected in samples from the 37 sample locations listed below. PIN20−0503 PIN20−DP28 18 ft PIN20−DP35 18 ft PIN20−M035 PIN29−DP03 18 ft PIN20−DP28 26 ft PIN20−DP46 18 ft PIN20−M036 PIN20−DP03 24 ft PIN20−DP29 18 ft PIN20−DP47 18 ft PIN20−M054 PIN20−DP04 24 ft PIN20−DP30 18 ft PIN20−DP47 23 ft PIN20−M22D PIN20−DP10 24 ft PIN20−DP30 23 ft PIN20−M011 PIN20−M40D PIN20−DP13 18 ft PIN20−DP31 18 ft PIN20−M012 PIN20−M40S PIN20−DP13 24 ft PIN20−DP32 18 ft PIN20−M019 PIN20−M41D PIN20−DP16 23 ft PIN20−DP33 18 ft PIN20−M023 PIN20−DP19 23 ft PIN20−DP34 18 ft PIN20−M024 PIN20−DP23 24 ft PIN20−DP34 23 ft PIN20−M025 Samples from 53 sample locations listed below contained COPCs at detectable levels. PIN20−0502 PIN20−DP11 24 ft PIN20−DP21 23 ft PIN20−DP41 23 ft PIN20−DP01 18 ft PIN20−DP12 18 ft PIN20−DP22 22 ft PIN20−DP44 18 ft PIN20−DP01 22 ft PIN20−DP12 25 ft PIN20−DP24 18 ft PIN20−DP44 23 ft PIN20−DP02 18 ft PIN20−DP14 18 ft PIN20−DP24 22 ft PIN20−DP45 18 ft PIN20−DP02 26 ft PIN20−DP14 22 ft PIN20−DP25 18 ft PIN20−DP45 23 ft PIN20−DP05 23 ft PIN20−DP15 18 ft PIN20−DP25 23 ft PIN20−DP46 23 ft PIN20−DP06 18 ft PIN20−DP15 23 ft PIN20−DP26 23 ft PIN20−M001 PIN20−DP06 24 ft PIN20−DP17 18 ft PIN20−DP27 22 ft PIN20−M015 PIN20−DP07 18 ft PIN20−DP17 22 ft PIN20−DP29 22 ft PIN20−M049 PIN20−DP07 26 ft PIN20−DP18 18 ft PIN20−DP31 22 ft PIN20−M053 PIN20−DP08 18 ft PIN20−DP18 23 ft PIN20−DP32 23 ft PIN20−M18D PIN20−DP08 24 ft PIN20−DP20 18 ft PIN20−DP33 23 ft PIN20−DP09 24 ft PIN20−DP20 24 ft PIN20−DP35 23 ft PIN20−DP11 18 ft PIN20−DP21 18 ft PIN20−DP41 18 ft The maximum TCOPCs value detected was 24,000 micrograms per liter (µg/L) at PIN20−DP12 25 ft. The compound detected at the highest concentration in PIN20–DP12 25 ft was cis-1,2-DCE at a concentration of 19,000 µg/L. Laboratory reports for quarterly samples collected in October 2002 are provided in Appendix A. 2.4 Geochemical Parameters As discussed in the July to September 2002 quarterly report, Heterotrophic Plate Count (HPC) analysis was discontinued following the July 2002 sampling event. As part of the performance evaluation, samples were collected during November 2002 for analysis of phospholipid fatty acids. The usefulness of this analysis will be evaluated under the performance evaluation plan. If this analysis proves applicable for monitoring the biosparging system, it should be implemented to replace the HPC analysis at the same locations and at the same frequency. Also as part of the regular annual monitoring, samples for field analysis of dissolved total and ferrous iron were collected during the DPT sampling. Collection of these data is intended to monitor conversion from reducing to oxidizing conditions during biosparging. As the biosparging system continues operation, the reduced iron should be converted to oxidized iron. The measured iron values and the calculated percent of oxidized iron are shown with the rest of the field measurements in Table 1 and Table 3.
Quarterly Progress Report for October through December 2002 Document Number N0057600
4.5 Acre Site Quarterly Progress Report DOE/Grand Junction Office Page 6 January 2003
Laboratory reports for annual samples collected in October 2002 are provided in Appendix A. 2.5 Quality Assurance/Quality Control Five duplicate VOCs samples were compared and the relative percent differences (RPDs) between the results were calculated. Results of VOCs analysis for each duplicate sample are listed in Table A–1 in Appendix A. From the five duplicate samples, 180 individual compounds were analyzed. None of the compounds failed the suggested control limit of an RPD of less than 30 percent when the concentration was greater than 5 times the detection limit. All data are considered Class A level, indicating that the data may be appropriately used for quantitative and qualitative purposes. According to the Stoller Sampling Plan, duplicate samples should be collected at a frequency of one duplicate for every 20 or less samples. There were 20 PIN20 ground water VOCs samples collected from standard monitoring wells and one duplicate sample. For the DPT locations, there were 70 VOCs samples collected and four duplicate samples, therefore, the duplicate criteria were met. Five trip blanks and four equipment blanks were submitted for analysis. Estimated quantities of methylene chloride were observed in seven of the samples. These results were above the analytical method detection limit but below the reporting limit. The level of contamination is slightly higher than seen in the prior sampling event in July 2002. The highest estimated methylene chloride value seen in the blanks was 3.8 µg/L. One equipment blank collected on October 8, 2002, contained toluene at 6.4 µg/L and TCE at 20 µg/L, and “J” values were also found for benzene, methylene chloride, and tetrachloroethene. The equipment blank was taken from an unused section of the middle of a large roll of tubing used in the DPT sampling. A very similar pattern of hits was also found in the well sampled just prior to this, PIN20−DP31 18 ft. Historical results from this well have been nondetects. Based on the similar contamination pattern in the equipment blank and the sample, it is likely that both were contaminated by the same source. The positive results for toluene, TCE, and total volatile aromatics from the PIN20−DP31 18 ft were given an “R” qualifier to indicate that the data is considered invalid. Because these data are considered invalid they will not be shown on Table 4. None of the other blanks from this sampling event showed this contamination. The source of contamination has not been ascertained.
3.0 Biosparge System Operation
3.1 Biosparge System Performance The biosparge systems at the 4.5 Acre Site were continuously operational throughout the quarter, with three exceptions. The biosparge systems were shut down for quarterly sampling activities from October 4 through 11, 2002. Upon completion of sampling on October 11, the biosparge operations were restarted. In November, biosparge operations were shutdown from November 8 through 18 for performance evaluation activities discussed in detail in Section 1.1. In December, a site-wide power outage suspended biosparge operations from the night of December 22

Document Number N0057600 Quarterly Progress Report for October through December 2002
DOE/Grand Junction Office 4.5 Acre Site Quarterly Progress Report January 2003 Page 7
through the morning of December 23. Biosparge operations resumed on December 23 with the use of compressed air. Additionally, the failed blower at Biosparge System 2 from the previous quarter was installed in October. This blower was successfully restarted after quarterly sampling efforts were completed on October 11. 3.2 Biosparge System Sampling and Monitoring As described in the previous quarterly report, the Interim Remedial Action Plan Addendum for the 4.5 Acre Site outlined sampling and monitoring activities to monitor biosparging activities. The 4.5 Acre Site Biosparge Monitoring Report (DOE 2000b), presents the data collection activities associated with the biosparging system start-up, analyzes the monitoring results, and makes recommendations for continued operations. This report was issued in July 2000. Subsequently, biosparging activities will be monitored on a quarterly basis during regular quarterly sampling events.
4.0 Tasks to be Performed Next Quarter
The following tasks are scheduled during the next quarterly period (January through March 2003).
• Sampling and analysis of ground water and water level measurements in early January.
• DPT sampling of ground water.
• Continue collecting field data and running laboratory column testing as part of the performance evaluation of the biosparging system and download data from the Performance Evaluation data logger.
• Routine preventive maintenance activities.
5.0 References
FDEP, not dated. Corrective Actions for Contamination Site Cases, http://www.dep.state.fl.us ———, 2001. Remediation Agreement for the Four and One-Half Acre Site in Largo, Pinellas County, Florida, U.S. Department of Energy, Grand Junction Office, Grand Junction, Colorado, January. U.S. Department of Energy, 2000a. 4.5 Acre Site Biosparge System Integration Plan, GJO–2000–182–TAR, MAC–PIN 25.5.1.1, prepared by U.S. Department of Energy, Grand Junction Office, Grand Junction, Colorado, December.

Quarterly Progress Report for October through December 2002 Document Number N0057600
4.5 Acre Site Quarterly Progress Report DOE/Grand Junction Office Page 8 January 2003
U.S. Department of Energy, 2000b. 4.5 Acre Site Biosparge Monitoring Report, MAC–PIN 25.5.1, prepared by U.S. Department of Energy, Grand Junction Office, Grand Junction, Colorado, July. ———, 2002a. Historical Review and Evaluation of Contaminants of Potential Concern, GJO−2002−359−TAC, GJO−PIN 2.4-2, prepared by U.S. Department of Energy Grand Junction Office, Grand Junction, Colorado, September. ———, 2002b. Sampling Procedures for the Young – Rainey STAR Center, GJO−2001−206−TAR, MAC–PIN 2.4-1, prepared by U.S. Department of Energy, Grand Junction Office, Grand Junction, Colorado, July.

Document Number N0057600 Quarterly Progress Report for October through December 2002
DOE/Grand Junction Office 4.5 Acre Site Quarterly Progress Report January 2003 Page 9
STA
RKE
Y R
D
BRYAN DAIRY RD
102ND AVE
114TH AVE
BELCH
ER
RD
92ND
ST
BARDMOOR PL
121ST AVE
BARDMOOR BLVD
70T
H S
T
LA ND
ST
75T
H S
T
2ND ST
WIL D
A CR
E S RD
122ND AVE
72N
D S
T
SOMERSET DR
VD
6TH ST
120TH AVE
5TH ST
LAK
E D
R 130TH AVE
CU
MBER
L AND
DR
8TH ST
121ST TER
BAS IN
S T
ANNWOOD RD
LARGO LAKES DR
EASY S T
93RD
ST
TR
EE S
T
TA
LL P
INE S
DR
88T
H S
T
124TH AVE
ESPLANADE AVE BAYOU DR
84TH W
AY
CA
NAL ST
124TH TER N 8
6TH
ST
85TH ST
84 T H ST
93RD
WAY
69TH ST N
68T
H S
T N
88T H
WA
Y
109TH TER
PERTH DR
95TH AVE
107TH AVE
0TH
ST
85T
H W
AY
86T
H W
AY
67T
H L
N N
93R
D S
T N
WALSINGHAM RD 87T H S T
COTTONWOODE DR
69TH W
AY N
119TH AVE
76T
H C
T N
EN
DEA
VOR
WAY
101ST CT 7
1ST
WAY
IND
I AN H
ILLS CT
SHAD
Y OA
K LN
RAN
CH
ERO
BLV
D W
131ST PL
ENTERPRISE BLVD 9T H
ST
W
94TH ST N
83RD
LN
VD
118TH DR
67 T
H S
T N
MAIDSTONE CT
GO
RD
A C
IR E
67TH S T
TULANE AVE W
92ND
W
89TH W
AY
69T
H S
T
LEI
SUR
E LN
E
126TH AVE
93RD AVE
102ND AVE
92 N
D S
T
84T
H W
AY
96TH AVE
102ND AVE
100TH AVE
85 T
H S
T
AVE
130TH AVE
ULMERTON RD
92 N
D S
TSTATE HWY 686
STATE HW
Y 6 93
BE LCHE R
R D
BRYAN DAIRY RD
Young-RaineySTAR
Center
3000 0 3000 Feet
N
N0044400-07
Gulf ofMexico
Tampa
TampaBay
CreekCanal
RailroadStreetHighway
MapArea
Florida
m:\pin\041\0010\02\n00444\n0044400.apr d50849 1/10/2002, 8:29
Figure 1. Young - Rainey STAR Center Location

Quarterly Progress R
eport for October through D
ecember 2002
Docum
ent Num
ber N0057600
4.5 Acre Site Q
uarterly Progress Report
DO
E/Grand Junction O
fficePage 10
January 2003
Figure 2. 4.5 Acre Site Location
%%%%%%%%%%%%%
%%
%%%%%%%%
CSX, Inc. Railroad
Bryan Dairy Road
Belcher Road
WestPond
EastPond
SouthPond
SouthPond
4.5 AcreSite
Site BoundaryConcrete Surface% Railroad
RoadPavedDirt
BuildingFenceTanksPondSlurry Wall
N
400 0 400 Feet
N0032800-01m:\pin\041\0010\01\n00328\n0032800.apr r50329 7/14/2000, 9:17

Document Number N0057600 Quarterly Progress Report for October through December 2002
DOE/Grand Junction Office 4.5 Acre Site Quarterly Progress Report January 2003 Page 11
Ú
Ú
Ú Ú
Ú
Ú
%U
%U
%U
%U
%U
%U
%U
%U
%U%U
%U
%U
%U
%U
%U
%U
%U
%U
%U
%U
%U%U
%U
%U
%U
%U
%U%U
%U
%U
%U
%U
%U
%U
%U
%U
%U
%U
%U
%U
%U%U
%U%U
%U
%U
%U
%U
%U
%U
%U
%U
%U
%U
%U
%U
%U
%U
%U
%U%U
%U%U
%U
%U
%U
%U%U
%U
%U
#S
#S
#S
#S
#S
#S
#S
#S
#S
#S
#S
#S
#S#S
#S
#S
#S
#S
#S
#S
0502
M011
M036
M41D
M001
M015
M019
M18D
M053
M049
M023
M40D
M054
0503
M035
M024
M012
M40SM22D
35.4
ND
ND
ND
2.2
1.4
ND
2.8
1.7
124.2
ND
ND
ND
ND
ND
ND
ND
NDND
M025ND
DP25
DP32
DP02
DP471823
NDND
DP03
DP10
DP28
DP05
DP451823
2.12.6
DP23
DP13
DP41DP44
DP19
DP17
DP34
DP29
DP30
DP08DP04
DP15
DP27
DP31
DP16
DP35
DP24
DP14
DP12
DP21
DP22
DP20
DP461823
ND3.2
DP18
DP26
DP11
DP06
DP09
DP01
DP33
DP071826
34201300
1823
56.784.3
1823
ND78
1826
1277120
1824
NDND
24 ND
1826
NDND
23 14
24 ND
1824
NDND
1823
319
1823
8.913
23 ND
1822
2.42
1823
NDND
1822
ND1.3
1823
NDND
1824
17.8173.2
24 ND
1823
3216.9
22 1.9
1822
ND8264
23 ND
1823
ND17.5
1822
1.43
1822
9.18.6
1825
3.324000
1823
16.827
22 115.4
1824
3.480.7
1823
19.78.9
23 347
1824
9.12.6
1824
23.455.5
24 4.3
1822
1.18.8
1823
ND82
90 0 90 Feet
N
DATE PREPARED:
*
FILENAME:
*
N0058400-01
Horizontal Well Screened Interval
#S µMonitoring Well Locationwith Total COPC Result ( g/L)
DPT Location%U
TotalCOPC( g/L)µDepth(ft)18
2423.455.5
DP06 Location Code
Horizontal WellU.S. DEPARTMENT OF ENERGY
GRAND JUNCTION OFFICEGRAND JUNCTION, COLORADO
Under DOE ContractNo. DE-AC13-02GJ79491
Prepared by
S.M. Stoller Corporation
4.5 Acre Site Monitoring Wells and DPT Locationswith Total COPC Concentrations and Sample Depths
October 2002 Sampling Event
m:\pin\041\0010\03\n00584\n0058400.apr smithw 1/17/2003, 12:59
January 17, 2003
Figure 3. Monitoring Well Locations and DPT Locations with Total COPC Concentrations and
Sample Depths
Quarterly Progress Report for October through December 2002 Document Number N0057600
4.5 Acre Site Quarterly Progress Report DOE/Grand Junction Office Page 12 January 2003
#S
#S
#S
#S
#S
#S
#S
#S
#S
#S
#S
#S
#S
#S
#S
#S
#S
−
0502
M005
M007
M011
M036
M41D
TE01
M001
M015
M019
M18DM049
M023
M40D
M38D
M028
M22D
13.65
14.26
14.96
13.70
14.18
14.14
15.30
13.30
13.97
13.86
13.9112.78
13.49
14.13
13.38
14.05
14.00 15
14
13
−M036
14.18
Monitoring Well NumberMonitoring WellGround Water Elevation in Feet (MSL)
Groundwater Elevations and Deep SurficialAquifer Flow, 4.5 Acre Site
October, 2002DATE PREPARED:
*
FILENAME:
14 Water Table Contour in Feet (MSL)Contour Interval = 1.0 feet
RoadRailroad
Fence
Building
#S
Inferred Ground WaterFlow Direction
110 0 110 Feet
N
U.S. DEPARTMENT OF ENERGYGRAND JUNCTION OFFICE
GRAND JUNCTION, COLORADOUnder DOE Contract
No. DE-AC13-02GJ79491
Prepared byS.M. Stoller Corporation
N0058300-01m:\pin\041\0010\03\n00583\n0058300.apr smithw 1/29/2003, 14:49
January 29, 2003
Figure 4. Ground Water Elevations and Deep Surficial Aquifer Flow, 4.5 Acre Site, October 2002

Docum
ent Num
ber N0057600
Quarterly Progress R
eport for October through D
ecember 2002
DO
E/Grand Junction O
ffice 4.5 A
cre Site Quarterly Progress R
eportJanuary 2003
Page 13
Table 1. Field Measurements and VOCs Concentrations from Additional DPT Locations at the 4.5 Acre Site
(only detected volatiles shown)
Loca
tion
Scre
en D
epth
(F
t. bl
s)
Tem
pera
ture
(°
C)
Spec
ific
Con
duct
ance
(µ
mho
s/cm
)a
Turb
idity
(N
TU)
pH
Oxi
datio
n R
educ
tion
Pote
ntia
l (m
V)
Dis
solv
ed
Oxy
gen
(mg/
L)
Fiel
d Fe
rrou
s Iro
n (m
g/L)
Fiel
d To
tal
Iron
(mg/
L)
Oxi
dize
d Iro
n as
Per
cent
of
Tota
l Iro
n
TCE
(µg/
L)
cis-
1,2-
DC
E (µ
g/L)
tran
s-1,
2-D
CE
(µg/
L)
Tota
l 1,2
-DC
Eb (µ
g/L)
Viny
l chl
orid
e (µ
g/L)
Ben
zene
(µ
g/L)
Tota
l CO
PCc
(µg/
L)
PIN20 4.5 Acre Site DP41 18−22 26 362 913 6.55 -59.8 0.36 2.8 5.3 47 <1 <1 <1 ND 3 0.12J 3
DP41 23−27 25.9 603 910 6.69 -44.3 0.39 3.5 4.8 27 <1 0.28J <1 0.28J 19 <1 19
DP44 18−22 26.2 297 >1,000 6.5 -35.4 0.61 4.1 5.3 23 <1 0.27J <1 0.27J 8.9 <1 8.9
DP44 23−27 25.8 349 915 6.72 -83.6 0.36 3.8 5 24 <1 <1 <1 ND 13 <1 13
DP45 18−22 26.1 272 592 6.86 -86.9 0.27 1.8 2.1 14 <1 2.1 <1 2.1 0.48J <1 2.1
DP45 23−27 25.9 333 >1,000 6.77 -52.6 1.16 1.1 1.7 35 <1 0.46J <1 0.46J 2.6 <1 2.6
DP46 18−22 25.8 307 507 6.34 -29.8 0.9 0.8 0.9 11 <1 0.38J <1 0.38J <1 0.12J ND
DP46 23−27 25.8 321 >1,000 6 -6.5 2.3 0.7 1.4 50 <1 0.29J <1 0.29J 3.2 0.16J 3.2
DP47 18−22 26.8 322 >1,000 6.29 -72.6 0.81 2.5 3.1 19 <1 <1 <1 ND <1 <1 ND
DP47 23−27 26.6 250 988 6.32 -44.6 0.6 0.9 2.4 63 <1 <1 <1 ND <1 <1 ND atemperature corrected to 25°C bTotal 1,2-DCE is the sum of cis-1,2-DCE and trans-1,2-DCE cTotal COPC is the sum of the individual COPC concentrations. The cis-1,2-DCE and trans-1,2-DCE values are not part of the Total COPC value because these values are included in the Total 1,2-DCE value. "J" values are not included in the Total COPC value. ND = Not detected. J = Estimated value, result is between the reporting limit and the method detection limit.

Quarterly Progress Report for October through December 2002 Document Number N0057600
4.5 Acre Site Quarterly Progress Report DOE/Grand Junction Office Page 14 January 2003
Table 2. Water-Level Data at the 4.5 Acre Site
Measurement Location Date Time
Water Depth From Land Surface (ft)
Ground Water Elevation (ft NGVD)
PIN02 West Pond 502D 10/7/2002 12:43 2.71 15.79 W002 10/7/2002 17:00 -- 16.1 PIN05 Trench Site 0500 10/7/2002 12:35 2.94 15.56 PIN20 4.5 Acre Site 0502 10/7/2002 10:50 3.75 13.65 0503 10/7/2002 10:29 3.76 13.64 M001 10/7/2002 10:45 4.3 13.3 M003 10/7/2002 10:14 3.61 14.59 M005 10/7/2002 10:15 4.04 14.26 M007 10/7/2002 10:12 4.49 14.96 M011 10/7/2002 10:37 4.4 13.7 M012 10/7/2002 10:39 3.6 14.4 M015 10/7/2002 10:21 3.83 13.97 M019 10/7/2002 10:16 4.14 13.86 M023 10/7/2002 10:24 5.98 13.49 M024 10/7/2002 10:25 4.02 13.78 M025 10/7/2002 10:23 7.18 9.12 M028 10/7/2002 10:10 4.15 14.05 M035 10/8/2002 07:58 6.13 12.67 M036 10/8/2002 07:55 5.12 14.18 M049 10/7/2002 10:35 5.02 12.78 M053 10/7/2002 10:22 3.21 13.99 M054 10/7/2002 10:27 3.63 14.07 M18D 10/7/2002 10:19 3.79 13.91 M22D 10/7/2002 10:11 3.8 14 M38D 10/8/2002 07:48 5.12 13.38 M40D 10/8/2002 07:57 5.27 14.13 M40S 10/8/2002 07:57 5.07 14.13 M41D 10/8/2002 08:00 4.96 14.14 TE01 10/7/2002 12:30 2.8 15.3

Docum
ent Num
ber N0057600
Quarterly Progress R
eport for October through D
ecember 2002
DO
E/Grand Junction O
ffice 4.5 A
cre Site Quarterly Progress R
eport January 2003
Page 15
Table 3. Field Measurements of Samples Collected at the 4.5 Acre Site
Locationa Screen Depth
(Ft. bls) Temperature
(°C) Specific
Conductance (µmhos/cm)b
Turbidity (NTU) pH
Oxidation Reduction
Potential (mV)
Dissolved Oxygen (mg/L)
Field Ferrous Iron (mg/L)
Field Total Iron (mg/L)
Oxidized Iron as Percent of Total
Iron PIN20 4.5 Acre Site
0502 21.2-31.2 27.3 682 36.9 6.63 -67 0.65 -- -- -- 0503 13.2-23.2 27.14 795 64.2 6.57 -77 0.65 -- -- --
18-22 27.1 861 499 6.57 -118.9 3.85 17 9.6 0c DP01
22-26 27 622 435 6.19 -90.8 14.98 5.7 7.4 23 18-22 27 2,156 279 6.21 -94.8 2.67 35.4 35.6 1
DP02 26-30 26.5 940 540 5.97 -25.5 5.12 6 6.8 12 18-22 26.7 459 690 6.19 -67.8 2.29 6.8 9.3 27
DP03 24-28 26.7 393 576 6.11 -44.2 2.43 2.9 3.5 17
DP04 24-28 26.3 414 538 6.17 -51.6 3.51 4.4 5.2 15 DP05 23-27 26.8 683 496 6.63 -112.7 3.99 6.2 8.1 23
18-22 27.3 869 445 6.46 -84.7 14.6 13.6 14.7 7 DP06
24-28 26.7 761 243 6.46 -77.1 4.64 5.3 7.3 27 18-22 26.3 1,141 282 6.55 -68 7.6 9.1 11.4 20
DP07 26-30 25.8 809 415 6.59 -53.1 3.96 4.4 4.4 0 18-22 26.1 1,433 549 6.53 -92 5.91 24.9 27.2 8
DP08 24-28 26 810 301 6.52 -65.2 4.88 5.2 5.7 9
DP09 24-28 28.8 1,014 >1,000 6.45 -76.3 25.8 2.7 3.8 29 DP10 24-28 25.7 717 319 6.55 -68.4 2.35 5 6.6 24
18-22 26.9 1,058 355 6.58 -89.5 17.27 8.9 10.6 16 DP11
24-28 26.5 883 578 6.55 -66.3 11.2 4.6 5.3 13 18-22 26.1 1,603 364 6.55 -74.9 20.8 13 14.2 8
DP12 25-29 26.2 784 499 6.56 -55.8 5.47 3.4 4.5 24 18-22 25.5 1,285 247 6.58 -84.2 7.77 19.1 19.1 0
DP13 24-28 25.5 833 346 6.7 -67.5 6.97 4.4 4.5 2 18-22 26.9 505 648 6.68 -78.5 0.35 7 9.1 23
DP14 22-26 26.7 388 944 6.47 -55.6 0.3 5 6.5 23 18-22 26.8 457 490 6.65 -77.7 0.48 4.7 7 33
DP15 23-27 26.3 449 932 6.61 -63.6 0.35 3.5 5.3 34
Quarterly Progress R
eport for October through D
ecember 2002
Docum
ent Num
ber N0057600
4.5 Acre Site Q
uarterly Progress Report
DO
E/Grand Junction O
fficePage 16
January 2003
Table 3 (continued). Field Measurements of Samples Collected at the 4.5 Acre Site
Locationa Screen Depth
(Ft. bls) Temperature
(°C) Specific
Conductance (µmhos/cm)b
Turbidity (NTU) pH
Oxidation Reduction
Potential (mV)
Dissolved Oxygen (mg/L)
Field Ferrous Iron (mg/L)
Field Total Iron (mg/L)
Oxidized Iron as Percent of Total
Iron DP16 23-27 26.3 426 >1,000 6.57 -57.8 0.24 3.8 5.5 31
18-22 27 443 721 6.61 -64.7 0.4 5.3 6.3 16 DP17
22-26 26.9 1,450 831 6.74 -61.9 0.66 4.8 5 4 18-22 26.8 441 336 5.97 -59.7 0.28 3.4 4.4 23
DP18 23-27 26.1 407 459 6.06 -56.3 0.47 5.2 5.5 5
DP19 23-27 26.2 514 725 5.9 -53.1 0.35 6 6.2 3 18-22 26 465 224 6.19 -49.1 0.9 3.8 4.1 7
DP20 24-28 26.1 735 540 6.26 -63.5 0.45 11.6 13.2 12 18-22 26.5 721 581 6.11 -81.7 3.03 17.4 21.5 19
DP21 23-27 26.1 466 >1,000 6 -68.2 4.49 10 11 9
DP22 22-26 26.7 505 409 6.06 -62.9 8.88 8.6 8.2 0c DP23 24-28 25.6 641 522 6.46 60.9 0.71 8 8.5 6
18-22 26.4 819 322 6.18 -37.6 8.48 7.1 8.5 16 DP24
22-26 26.1 778 227 6.32 -74.6 7.52 11 11.5 4 18-22 26.9 824 540 6.34 -52.8 0.28 13.3 14.1 6
DP25 23-27 26.6 506 725 6.49 -69.3 0.35 8 8.8 9
DP26 23-27 26 302 930 6.91 -96.4 12.21 4.8 5 4 DP27 22-26 26.4 300 893 6.88 -88.7 14.49 4.3 5 14
18-22 26.3 320 286 6.83 -95.3 14.86 4.7 5.9 20 DP28
26-30 26.2 315 449 6.75 -87.6 19.59 4.8 6.1 21 18-22 26 304 404 6.36 -67.2 16.15 4.4 4.9 10
DP29 22-26 25.8 369 457 6.1 -62.1 14.2 4.1 4.9 16 18-22 26.3 339 199 6.79 -102.3 10.71 4.1 6.3 35
DP30 23-27 26 319 >1,000 6.85 -77.8 11.03 3.4 3.3 0c 18-22 27.2 562 316 6.47 -79 2.81 9.7 11.7 17
DP31 22-26 26.8 602 >1,000 6.03 -43.6 3.66 6.4 7.7 17 18-22 26.9 448 909 6.43 -67.2 1.18 4.8 7.1 32
DP32 23-27 26.6 405 >1,000 6.25 -41.5 1.81 4 6.3 37
Docum
ent Num
ber N0057600
Quarterly Progress R
eport for October through D
ecember 2002
DO
E/Grand Junction O
ffice 4.5 A
cre Site Quarterly Progress R
eportJanuary 2003
Page 17
Table 3 (continued). Field Measurements of Samples Collected at the 4.5 Acre Site
Locationa Screen Depth
(Ft. bls) Temperature
(°C) Specific
Conductance (µmhos/cm)b
Turbidity (NTU) pH
Oxidation Reduction
Potential (mV)
Dissolved Oxygen (mg/L)
Field Ferrous Iron (mg/L)
Field Total Iron (mg/L)
Oxidized Iron as Percent of Total
Iron 18-22 27 496 402 5.9 -48 3.06 5.1 9.5 46
DP33 23-27 27.2 549 >1,000 5.95 -31.2 7.16 3.4 7.7 56 18-22 26.7 453 357 6.21 -51.8 3.68 6.6 8.6 23
DP34 23-27 26.3 383 393 5.99 -20 3.96 4.1 5.9 31 18-22 26.8 342 63 6.34 -65.5 1.35 4.1 6.4 36
DP35 23-27 26.5 311 989 6.17 -31.7 1.07 4 5.2 23
M001 20-25 26.32 902 4.5 6.63 -98 0.98 -- -- -- M011 23.7-28.7 25.93 833 3.3 6.52 -78 1.05 -- -- -- M012 8.6-13.6 27.88 658 9.7 6.81 -37 1.07 -- -- -- M015 20.8-25.8 25.9 602 2.4 6.51 -86 0.63 -- -- -- M019 22-27 27.06 707 1 6.63 -81 1.28 -- -- -- M023 19.8-24.8 27.54 622 2.3 6.54 -70 0.98 -- -- -- M024 8.7-13.7 28.41 484 9.8 6.64 5.7 1.6 -- -- -- M025 8.6-13.6 26.28 1,878 85 6.57 41 3.25 -- -- -- M035 9-14 26.16 2,473 1.97 6.97 -52.4 0.67 -- -- -- M036 25-30 25.13 644 0 6.54 -68 0.7 -- -- -- M049 20-30 26.12 1,074 9.3 6.46 -79 1.28 -- -- -- M053 20-30 26.31 682 89.6 6.67 -83 1.07 -- -- -- M054 20-30 26.48 772 58.2 6.7 -107 0.53 -- -- -- M18D 20-30 26.13 731 9.7 6.6 -73 1.22 -- -- -- M22D 20-30 25.89 643 9.6 6.77 -84 0.98 -- -- -- M40D 18-28 25.46 674 59 6.62 -88 1.04 -- -- -- M40S 4-14 27.6 235 7.8 6.32 -36 1.41 -- -- -- M41D 16-26 25.23 1,405 1.47 6.73 -114.6 0.24 -- -- --
aLocations starting with "DP" are Direct Push locations, all others are monitoring wells. bTemperature corrected to 25°C. cFerrous Iron > Total Iron. -- = Not Measured.
Quarterly Progress Report for October through December 2002 Document Number N0057600
4.5 Acre Site Quarterly Progress Report DOE/Grand Junction Office Page 18 January 2003
Table 4. COPC Concentrations from wells and DPT Locations at the 4.5 Acre Site (reported in micrograms per liter)
Location Screen
Depth (ft) Date
Sampled TCE cis-1,2-DCE
trans-1,2-DCE
Total 1,2-DCEa
Vinyl chloride Benzene Total
COPCb
FDEP MCL 3 70 100 63 1 1 PIN05 Trench Site
0500 2.5−12.5 4/10/2002 <1 <1 <1 ND <1 <1 ND PIN20 4.5 Acre Site
10/2/2001 <1 <1 <1 ND 0.4J <1 ND 4/9/2002 <1 1.4 <1 1.4 5.5 <1 6.9 0502 21.2−31.2 10/8/2002 <1 7.4 <1 7.4 28 <1 35.4 10/2/2001 <1 <1 <1 ND <1 <1 ND 4/9/2002 <1 <1 <1 ND <1 <1 ND 0503 13.2−23.2 10/8/2002 <1 <1 <1 ND <1 <1 ND 10/1/2001 <1 <1 <1 ND <1 <1 ND 1/9/2002 <1 <1 <1 ND 2.2 <1 2.2 4/10/2002 <1 <1 <1 ND <1 <1 ND 7/8/2002 <1 <1 <1 ND 0.99J <1 ND
18−22
10/7/2002 <1 0.2J <1 0.2J 1.1 <1 1.1 10/1/2001 <1 23 0.3J 23 51 9.8 83.8
23−27 4/10/2002 <1 <1 <1 ND 11 15 26 7/8/2002 <1 <1 <1 ND 2.3 7.3 9.6
DP01
22−26 10/7/2002 <1 0.19J <1 0.19J 2.5 6.3 8.8 10/1/2001 <1 5 <1 5 5.9 0.38J 10.9 1/9/2002 <1 1.1 <1 1.1 6.1 0.44J 7.2 4/11/2002 <1 1.6 <1 1.6 9.4 <1 11 7/8/2002 <1 4.4 <1 4.4 18 0.46J 22.4
18−22
10/8/2002 <1 74 <1 74 53 0.43J 127 10/1/2001 0.29J 14 0.19J 14 31 3.9 48.9 1/9/2002 2,600 20,000 800 20,800 6,800 <250 30,2004/11/2002 <100 4,400 160 4,560 4,100 <100 8,660 7/8/2002 190 5,500 280 5,780 4,800 <100 10,770
DP02
26−30
10/8/2002 380 3,600 140 3,740 3,000 <1 7,120 1/9/2002 <1 <1 <1 ND <1 <1 ND 4/10/2002 <1 <1 <1 ND <1 <1 ND 7/8/2002 <1 <1 <1 ND <1 <1 ND
18−22
10/8/2002 <1 <1 <1 ND <1 <1 ND 10/1/2001 <1 <1 <1 ND <1 <1 ND 1/9/2002 <1 <1 <1 ND <1 <1 ND 4/10/2002 <1 <1 <1 ND <1 <1 ND 7/8/2002 <1 <1 <1 ND <1 <1 ND
DP03
24−28
10/8/2002 <1 <1 <1 ND <1 <1 ND 1/9/2002 <1 <1 <1 ND <1 <1 ND
25−29 4/10/2002 <1 <1 <1 ND <1 <1 ND 7/9/2002 <1 0.33J <1 0.33J <1 <1 ND
DP04 24−28
10/8/2002 <1 <1 <1 ND <1 <1 ND

Document Number N0057600 Quarterly Progress Report for October through December 2002
Table 4 (continued). COPC Concentrations from wells and DPT Locations at the 4.5 Acre Site (reported in micrograms per liter)
DOE/Grand Junction Office 4.5 Acre Site Quarterly Progress Report January 2003 Page 19
Location Screen Depth (ft)
Date Sampled TCE cis-1,2-
DCE trans-1,2-
DCE Total 1,2-
DCEa Vinyl
chloride Benzene Total COPCb
FDEP MCL 3 70 100 63 1 1 10/1/2001 <1 <1 <1 ND <1 19 19 4/10/2002 <1 <1 <1 ND <1 16 16 7/9/2002 <1 <1 <1 ND <1 11 11
DP05 23−27
10/7/2002 <1 <1 <1 ND 0.58J 14 14 10/2/2001 <1 <1 <1 ND 12 8.6 20.6 1/10/2002 <1 <1 <1 ND 11 12 23 4/11/2002 <1 <1 <1 ND 5.4 14 19.4 7/10/2002 <1 <1 <1 ND 10 11 21
18−22
10/7/2002 <1 <1 <1 ND 6.4 17 23.4 23−27 10/2/2001 <1 0.81J <1 0.81J 24 6.9 30.9 24−28 1/10/2002 <1 0.23J <1 0.23J 12 8.7 20.7 23−27 4/11/2002 <1 <1 <1 ND 4 13 17
7/10/2002 <1 4.6 <1 4.6 46 5.3 55.9
DP06
24−28 10/7/2002 <1 1.5 <1 1.5 40 14 55.5 10/2/2001 <250 16,000 120J 16,000 3,300 <250 19,3001/10/2002 210 4,000 110 4,110 2,800 <100 7,120 4/11/2002 83 2,800 74 2,874 2,400 <50 5,357 7/8/2002 91 2,100 54 2,154 1,700 <50 3,945
18−22
10/8/2002 <50 1,600 120 1,720 1,700 <50 3,420 10/2/2001 <50 21J <50 21J 4,000 <50 4,000 1/10/2002 <50 14J <50 14J 2,400 <50 2,400 4/11/2002 <100 210 <100 210 4,500 <100 4,710
DP07
26−30
10/8/2002 <25 19J <25 19J 1,300 <25 1,300 10/2/2001 2.3J 77 0.52J 77 9.5 0.34J 86.5 1/10/2002 2.6 37 0.9J 37 16 0.17J 55.6 4/11/2002 1.5 25 0.5J 25 5.5 0.18J 32 7/8/2002 0.73J 4.8 <1 4.8 6.1 <1 10.9
18−22
10/8/2002 <1 10 <1 10 7.8 <1 17.8 25−29 10/2/2001 31 35 0.21J 35 6.9 0.14J 72.9 24−28 1/10/2002 2 1.4 <1 1.4 11 <1 14.4
4/11/2002 42 46 1.9 47.9 13 <1 102.9 25−29
7/8/2002 0.59J 1.4 <1 1.4 <1 <1 1.4
DP08
24−28 10/8/2002 <2.5 130 9.2 139.2 34 <2.5 173.2 10/1/2001 <1 <1 <1 ND <1 0.33J ND 1/8/2002 <1 <1 <1 ND 0.42J <1 ND 26−30 4/10/2002 <1 <1 <1 ND <1 0.34J ND 7/9/2002 <1 <1 <1 ND <1 1.2 1.2
DP09
24−28 10/7/2002 <1 1.6 <1 1.6 2.7 <1 4.3 10/1/2001 <1 <1 <1 ND <1 <1 ND 1/9/2002 <1 <1 <1 ND <1 <1 ND 26−30 4/10/2002 <1 <1 <1 ND <1 <1 ND
DP10
24−28 10/8/2002 <1 <1 <1 ND <1 <1 ND

Quarterly Progress Report for October through December 2002 Document Number N0057600
Table 4 (continued). COPC Concentrations from wells and DPT Locations at the 4.5 Acre Site (reported in micrograms per liter)
4.5 Acre Site Quarterly Progress Report DOE/Grand Junction Office Page 20 January 2003
Location Screen Depth (ft)
Date Sampled TCE cis-1,2-
DCE trans-1,2-
DCE Total 1,2-
DCEa Vinyl
chloride Benzene Total COPCb
FDEP MCL 3 70 100 63 1 1 10/2/2001 <1 0.64J <1 0.64J 1.4 8 9.4 1/8/2002 <1 0.55J <1 0.55J 1.4 9.7 11.1 4/9/2002 <1 <1 <1 ND <1 11 11 7/9/2002 <1 <1 <1 ND 1.8 7.7 9.5
18−22
10/7/2002 <1 0.36J <1 0.36J 2 7.1 9.1 10/2/2001 <1 <1 <1 ND 2.4 0.26J 2.4 1/8/2002 <1 <1 <1 ND 3.1 0.54J 3.1 26−30 4/9/2002 <1 5.7 <1 5.7 9.6 0.52J 15.3 7/9/2002 <1 <1 <1 ND <1 2.2 2.2
DP11
24−28 10/7/2002 <1 0.23J <1 0.23J 0.76J 2.6 2.6 10/2/2001 0.46J 1.6 <1 1.6 4.2 <1 5.8 1/9/2002 <1 <1 <1 ND 4.6 0.16J 4.6 4/11/2002 <1 <1 <1 ND <1 <1 ND 7/9/2002 <1 <1 <1 ND 8.7 <1 8.7
18−22
10/7/2002 0.2J 0.14J <1 0.14J 3.3 <1 3.3 10/2/2001 <5 3.4J <5 3.4J 390 <5 390 1/9/2002 <5 <5 <5 ND 100 <5 100 4/11/2002 <250 16,000 81J 16,000 27,000 <250 43,000
26−30
7/9/2002 67,000 250,000 770J 250,000 23,000 <2,500 340,000
DP12
25−29 10/7/2002 <250 19,000 <250 19,000 5,000 <250 24,00010/2/2001 <1 <1 <1 ND <1 <1 ND 1/9/2002 <1 <1 <1 ND <1 <1 ND 4/10/2002 <1 <1 <1 ND <1 <1 ND 7/9/2002 <1 <1 <1 ND <1 <1 ND
18−22
10/8/2002 <1 <1 <1 ND <1 <1 ND 26−30 4/10/2002 <1 <1 <1 ND 0.37J <1 ND
DP13
24−28 10/8/2002 <1 <1 <1 ND <1 <1 ND 10/3/2001 <1 2 <1 2 8.5 0.56J 10.5 1/8/2002 <1 2 <1 2 14 0.75J 16 4/8/2002 <1 0.78J <1 0.78J 9.9 0.82J 9.9 7/11/2002 <1 0.36J <1 0.36J 12 0.6J 12
18−22
10/10/2002 <1 0.64J <1 0.64J 9.1 0.71J 9.1 24−28 4/8/2002 <1 <1 <1 ND 1.5 0.17J 1.5
DP14
22−26 10/10/2002 <1 <1 <1 ND 8.6 0.24J 8.6 10/3/2001 <1 21 1 22 8.8 0.13J 30.8 1/8/2002 <1 31 1 32 16 0.28J 48 4/8/2002 <1 24 0.58J 24 12 0.3J 36 7/11/2002 <1 25 0.76J 25 11 0.3J 36
18−22
10/10/2002 <1 21 1 22 10 0.2J 32 1/8/2002 <1 2.1 <1 2.1 8.2 <1 10.3 4/8/2002 <1 3.5 <1 3.5 7.4 <1 10.9 22−26 7/11/2002 <1 4.7 <1 4.7 5.6 <1 10.3
DP15
23−27 10/10/2002 <1 7.6 <1 7.6 9.3 <1 16.9

Document Number N0057600 Quarterly Progress Report for October through December 2002
Table 4 (continued). COPC Concentrations from wells and DPT Locations at the 4.5 Acre Site (reported in micrograms per liter)
DOE/Grand Junction Office 4.5 Acre Site Quarterly Progress Report January 2003 Page 21
Location Screen Depth (ft)
Date Sampled TCE cis-1,2-
DCE trans-1,2-
DCE Total 1,2-
DCEa Vinyl
chloride Benzene Total COPCb
FDEP MCL 3 70 100 63 1 1 22−26 4/8/2002 <1 0.37J <1 0.37J <1 <1 ND
7/11/2002 <1 <1 <1 ND <1 <1 ND DP16 23−27
10/10/2002 <1 0.96J <1 0.96J <1 <1 ND 10/3/2001 <1 0.12J <1 0.12J 1.8 0.21J 1.8 1/8/2002 <1 0.24J <1 0.24J 2.8 0.5J 2.8 4/8/2002 <1 0.35J <1 0.35J 3.1 0.42J 3.1 7/11/2002 <1 0.21J <1 0.21J 2.6 0.7J 2.6
18−22
10/10/2002 <1 0.5J <1 0.5J 2.4 0.34J 2.4 4/8/2002 <1 <1 <1 ND 3.4 0.32J 3.4 7/11/2002 <1 <1 <1 ND 4 0.57J 4
DP17
22−26 10/10/2002 <1 0.15J <1 0.15J 2 0.22J 2 10/3/2001 0.15J 21 0.94J 21 2.8 <1 23.8 1/8/2002 <1 20 0.94J 20 4.2 <1 24.2 4/8/2002 <1 26 0.27J 26 3 <1 29 7/11/2002 <1 16 0.24J 16 0.55J 0.13J 16
18−22
10/10/2002 <1 17 0.37J 17 2.7 <1 19.7 10/3/2001 <1 4.3 0.14J 4.3 4.1 <1 8.4 1/8/2002 <1 1.1 <1 1.1 4.8 <1 5.9 4/8/2002 <1 7.4 <1 7.4 4.3 <1 11.7
24−28
7/11/2002 <1 3.4 <1 3.4 4.1 <1 7.5
DP18
23−27 10/10/2002 <1 5.2 <1 5.2 3.7 <1 8.9 25−29 4/8/2002 <1 <1 <1 ND <1 <1 ND
DP19 23−27 10/10/2002 <1 <1 <1 ND 0.36J <1 ND
10/3/2001 <1 0.35J 0.41J 0.76J 0.98J <1 ND 1/8/2002 <1 <1 0.32J 0.32J <1 <1 ND 4/8/2002 <1 <1 0.24J 0.24J <1 <1 ND 7/11/2002 <1 <1 <1 ND 2.4 <1 2.4
18−22
10/10/2002 <1 <1 0.37J 0.37J 3.4 <1 3.4 1/8/2002 <1 <1 0.27J 0.27J 39 <1 39
25−29 4/8/2002 <1 <1 1.8 1.8 90 <1 91.8
DP20
24−28 10/10/2002 0.2J 0.16J 4.7 4.7 76 <1 80.7 10/3/2001 <1 <1 9.6 9.6 7.9 <1 17.5 1/8/2002 0.42J 0.89J 9.4 9.4 13 <1 22.4 4/9/2002 <1 0.34J 13 13 6.2 <1 19.2 7/11/2002 <1 0.37J 7.2 7.2 14 0.19J 21.2
18−22
10/10/2002 0.32J 0.78J 7.4 7.4 9.4 <1 16.8 23−27 1/8/2002 0.3J 0.41J 0.27J 0.68J 34 0.57J 34 24−28 4/9/2002 <1 0.38J 0.44J 0.82J 31 0.49J 31
DP21
23−27 10/10/2002 0.27J 0.65J 0.98J 1.63J 27 0.27J 27 1/7/2002 0.71J 0.95J 1.2 1.2 85 1.4 87.6 4/9/2002 0.23J 0.81J 1.2J 2.01J 87 1.3J 87 24−28 7/10/2002 <2.5 <2.5 2.4J 2.4J 270 1.7J 270
DP22
22−26 10/10/2002 2.5 2.9 1.6J 2.9 110 1.2J 115.4

Quarterly Progress Report for October through December 2002 Document Number N0057600
Table 4 (continued). COPC Concentrations from wells and DPT Locations at the 4.5 Acre Site (reported in micrograms per liter)
4.5 Acre Site Quarterly Progress Report DOE/Grand Junction Office Page 22 January 2003
Location Screen Depth (ft)
Date Sampled TCE cis-1,2-
DCE trans-1,2-
DCE Total 1,2-
DCEa Vinyl
chloride Benzene Total COPCb
FDEP MCL 3 70 100 63 1 1 1/7/2002 <1 <1 <1 ND <1 0.27J ND
25−29 4/9/2002 <1 <1 <1 ND <1 0.22J ND 7/10/2002 <1 <1 <1 ND <1 0.22J ND
DP23 24−28
10/10/2002 <1 0.15J <1 0.15J 0.84J <1 ND 10/4/2001 <1 <1 <1 ND <1 <1 ND 1/8/2002 <1 0.24J <1 0.24J <1 <1 ND 4/9/2002 <1 0.23J <1 0.23J <1 <1 ND 7/10/2002 <1 0.41J <1 0.41J 2.3 <1 2.3
18−22
10/10/2002 <1 0.3J <1 0.3J 1.4 0.25J 1.4 24−28 4/9/2002 <1 <1 <1 ND <1 0.35J ND
7/10/2002 <1 <1 <1 ND <1 0.48J ND
DP24
22−26 10/10/2002 <1 <1 <1 ND 3 0.58J 3 10/4/2001 <1 <1 1 1 11 <1 12 1/8/2002 0.49J 1 2.9 3.9 31 <1 34.9 4/9/2002 <1 0.88J 1.6 1.6 20 <1 21.6 7/10/2002 0.87J 0.86J 1.3 1.3 75 <1 76.3
18−22
10/10/2002 <1 0.88J 1.7 1.7 55 <1 56.7 10/4/2001 0.86J <2.5 1.7J 1.7J 74 <2.5 74 1/8/2002 90 34 42 76 160 <2.5 326 4/9/2002 16 11 21 32 270 <2.5 318
24−28
7/10/2002 3.6 5.8 24 29.8 76 <1 109.4
DP25
23−27 10/10/2002 4.1 4.5 7.7 12.2 68 <1 84.3 10/4/2001 5,900 3,000 1,300 4,300 310 <100 10,510
26−30 4/9/2002 12,000 4,000 1,200 5,200 <100 <100 17,200DP26
23−27 10/10/2002 80 48 29 77 190 <2.5 347 25−29 4/9/2002 0.11J 0.13J <1 0.13J <1 5.5 5.5
DP27 22−26 10/10/2002 0.19J 0.21J <1 0.21J 1.9 <1 1.9
10/4/2001 <1 <1 <1 ND <1 <1 ND 1/7/2002 0.11J <1 <1 ND <1 <1 ND 4/9/2002 <1 <1 <1 ND <1 <1 ND 7/10/2002 <1 <1 <1 ND <1 <1 ND
18−22
10/10/2002 <1 <1 <1 ND <1 <1 ND 24.5−28.5 4/9/2002 <1 <1 <1 ND <1 <1 ND
DP28
26−30 10/10/2002 0.14J 0.16J <1 0.16J 0.82J <1 ND 10/4/2001 <1 <1 <1 ND <1 <1 ND 1/7/2002 <1 <1 <1 ND <1 <1 ND 4/9/2002 <1 <1 <1 ND <1 0.28J ND 7/10/2002 <1 <1 <1 ND <1 <1 ND
18−22
10/10/2002 <1 <1 <1 ND 0.42J 0.36J ND 24−28 10/4/2001 <1 <1 <1 ND <1 <1 ND 22−26 1/7/2002 <1 <1 <1 ND <1 <1 ND 24−28 4/9/2002 <1 <1 <1 ND <1 <1 ND
DP29
22−26 10/10/2002 <1 0.22J <1 0.22J 1.3 0.27J 1.3

Document Number N0057600 Quarterly Progress Report for October through December 2002
Table 4 (continued). COPC Concentrations from wells and DPT Locations at the 4.5 Acre Site (reported in micrograms per liter)
DOE/Grand Junction Office 4.5 Acre Site Quarterly Progress Report January 2003 Page 23
Location Screen Depth (ft)
Date Sampled TCE cis-1,2-
DCE trans-1,2-
DCE Total 1,2-
DCEa Vinyl
chloride Benzene Total COPCb
FDEP MCL 3 70 100 63 1 1 1/7/2002 <1 <1 <1 ND <1 <1 ND 4/9/2002 <1 <1 <1 ND <1 <1 ND 7/10/2002 <1 <1 <1 ND <1 <1 ND
18−22
10/10/2002 <1 <1 <1 ND <1 <1 ND 10/4/2001 <1 <1 <1 ND <1 <1 ND
26−30 4/9/2002 <1 <1 <1 ND <1 <1 ND
DP30
23−27 10/10/2002 <1 <1 <1 ND <1 <1 ND 10/2/2001 <1 0.78J <1 0.78J 3.3 0.12J 3.3 1/9/2002 <1 <1 <1 ND <1 0.22J ND 4/10/2002 <1 <1 <1 ND 0.61J <1 ND 7/8/2002 <1 <1 <1 ND 0.86J 0.43J ND
18−22
10/8/2002 -- <1 <1 ND 0.72J 0.17J NDc 22−26 1/9/2002 <2.5 96 3.3 99.3 140 <2.5 239.3 24−28 4/10/2002 2J 440 34 474 600 <10 1,074
7/8/2002 <50 2,700 84 2,784 1,900 <50 4,684
DP31
22−26 10/8/2002 <50 4,000 64 4,064 4,200 <50 8,264 10/2/2001 <1 <1 <1 ND <1 <1 ND 1/10/2002 <1 <1 <1 ND <1 <1 ND 4/10/2002 <1 <1 <1 ND <1 <1 ND 7/9/2002 <1 <1 <1 ND 3.1 <1 3.1
18−22
10/11/2002 <1 <1 <1 ND <1 <1 ND 4/10/2002 <5 80 <5 80 160 <5 240
DP32
23−27 10/11/2002 <1 13 0.27J 13 65 0.16J 78 10/3/2001 <1 <1 <1 ND <1 <1 ND 1/10/2002 <1 <1 <1 ND <1 <1 ND 4/10/2002 <1 <1 <1 ND <1 <1 ND 7/9/2002 <1 <1 <1 ND <1 <1 ND
18−22
10/11/2002 <1 <1 <1 ND <1 <1 ND 1/10/2002 <1 2.2 <1 2.2 4.4 <1 6.6 4/10/2002 <1 1.7 <1 1.7 <1 <1 1.7 7/9/2002 <1 35 <1 35 44 <1 79
DP33
23−27
10/11/2002 <1 31 0.28J 31 51 <1 82 10/3/2001 <1 <1 <1 ND <1 <1 ND 1/10/2002 <1 <1 <1 ND <1 <1 ND 4/10/2002 <1 <1 <1 ND <1 <1 ND 7/9/2002 <1 <1 <1 ND <1 <1 ND
18−22
10/11/2002 <1 <1 <1 ND <1 <1 ND 24−28 10/3/2001 <1 <1 <1 ND <1 <1 ND 23−27 1/10/2002 <1 <1 <1 ND <1 <1 ND 24−28 4/10/2002 <1 <1 <1 ND <1 <1 ND
DP34
23−27 10/11/2002 <1 <1 <1 ND <1 <1 ND

Quarterly Progress Report for October through December 2002 Document Number N0057600
Table 4 (continued). COPC Concentrations from wells and DPT Locations at the 4.5 Acre Site (reported in micrograms per liter)
4.5 Acre Site Quarterly Progress Report DOE/Grand Junction Office Page 24 January 2003
Location Screen Depth (ft)
Date Sampled TCE cis-1,2-
DCE trans-1,2-
DCE Total 1,2-
DCEa Vinyl
chloride Benzene Total COPCb
FDEP MCL 3 70 100 63 1 1 10/2/2001 <1 <1 <1 ND <1 <1 ND 1/10/2002 <1 <1 <1 ND <1 <1 ND 4/10/2002 <1 <1 <1 ND <1 <1 ND 7/9/2002 <1 <1 <1 ND 5.6 0.41J 5.6
18−22
10/11/2002 <1 <1 <1 ND 0.85J <1 ND 4/10/2002 <1 1.6 <1 1.6 13 0.72J 14.6
DP35
23−27 10/11/2002 <1 2.5 <1 2.5 15 0.3J 17.5 10/2/2001 <1 <1 <1 ND 8.8 0.16J 8.8 1/9/2002 <1 2.4 0.17J 2.4 23 0.34J 25.4 4/10/2002 <1 <1 <1 ND 2.1 <1 2.1 7/10/2002 <1 <1 <1 ND 0.9J <1 ND
M001 20−25
10/9/2002 <1 0.13J <1 0.13J 2.2 <1 2.2 M003 9−14 4/10/2002 <1 <1 <1 ND <1 <1 ND M005 25.8−30.7 4/10/2002 <1 <1 <1 ND <1 <1 ND M007 25.3−30.3 4/10/2002 <1 <1 <1 ND <1 <1 ND
10/3/2001 <1 <1 <1 ND <1 <1 ND 1/8/2002 <1 <1 <1 ND <1 <1 ND 4/10/2002 <1 <1 <1 ND <1 <1 ND 7/10/2002 <1 <1 <1 ND <1 <1 ND
M011 23.7−28.7
10/9/2002 <1 <1 <1 ND <1 <1 ND 10/3/2001 <1 <1 <1 ND <1 <1 ND 4/10/2002 <1 <1 <1 ND <1 <1 ND M012 8.6−13.6 10/9/2002 <1 <1 <1 ND <1 <1 ND 4/11/2002 <1 <1 <1 ND 0.41J <1 ND
M015 20.8−25.8 10/9/2002 <1 <1 <1 ND 1.4 <1 1.4 10/2/2001 <1 <1 <1 ND <1 <1 ND 1/9/2002 <1 <1 <1 ND 0.66J <1 ND 4/10/2002 <1 <1 <1 ND 0.25J <1 ND 7/11/2002 <1 <1 <1 ND <1 <1 ND
M019 22−27
10/9/2002 <1 <1 <1 ND <1 <1 ND 10/3/2001 <1 <1 <1 ND <1 <1 ND 1/8/2002 <1 <1 <1 ND <1 <1 ND 4/9/2002 <1 <1 <1 ND <1 <1 ND 7/10/2002 <1 <1 <1 ND <1 <1 ND
M023 19.8−24.8
10/8/2002 <1 <1 <1 ND <1 <1 ND 10/3/2001 <1 <1 <1 ND <1 <1 ND 1/8/2002 <1 <1 <1 ND <1 <1 ND 4/9/2002 <1 <1 <1 ND <1 <1 ND 7/10/2002 <1 <1 <1 ND <1 <1 ND
M024 8.7−13.7
10/8/2002 <1 <1 <1 ND <1 <1 ND 4/11/2002 <1 <1 <1 ND <1 <1 ND
M025 8.6−13.6 10/8/2002 <1 <1 <1 ND <1 <1 ND

Document Number N0057600 Quarterly Progress Report for October through December 2002
Table 4 (continued). COPC Concentrations from wells and DPT Locations at the 4.5 Acre Site (reported in micrograms per liter)
DOE/Grand Junction Office 4.5 Acre Site Quarterly Progress Report January 2003 Page 25
Location Screen Depth (ft)
Date Sampled TCE cis-1,2-
DCE trans-1,2-
DCE Total 1,2-
DCEa Vinyl
chloride Benzene Total COPCb
FDEP MCL 3 70 100 63 1 1 M028 22−27 4/10/2002 <1 <1 <1 ND <1 <1 ND
10/4/2001 <1 <1 <1 ND <1 <1 ND 1/9/2002 <1 0.29J <1 0.29J <1 <1 ND 7/12/2002 <1 0.46J <1 0.46J <1 <1 ND
M035 9−14
10/9/2002 <1 <1 <1 ND <1 <1 ND 10/3/2001 <1 <1 <1 ND <1 <1 ND 1/9/2002 <1 <1 <1 ND <1 <1 ND 4/11/2002 <1 <1 <1 ND <1 <1 ND 7/11/2002 <1 <1 <1 ND <1 <1 ND
M036 25−30
10/9/2002 <1 <1 <1 ND <1 <1 ND 10/3/2001 14 58 2.6 60.6 4.4 <1 79 1/9/2002 15 57 2.6 59.6 8.6 <1 83.2 4/9/2002 11 70 3.5 73.5 6.7 <1 91.2 7/10/2002 5.9 90 5.4 95.4 9.8 <1 111.1
M049 20−30
10/9/2002 7 100 5.2 105.2 12 <2.5 124.2 10/2/2001 <1 <1 <1 ND <1 <1 ND 1/8/2002 0.15J 0.49J <1 0.49J 0.5J <1 ND 4/9/2002 <1 <1 <1 ND <1 <1 ND 7/11/2002 <1 <1 <1 ND <1 <1 ND
M053 20−30
10/9/2002 1.7 <1 <1 ND <1 <1 1.7 10/3/2001 <1 <1 <1 ND <1 <1 ND 1/8/2002 <1 0.15J <1 0.15J <1 <1 ND 4/9/2002 <1 <1 <1 ND <1 <1 ND 7/10/2002 <1 <1 <1 ND <1 <1 ND
M054 20−30
10/8/2002 <1 <1 <1 ND <1 <1 ND 10/2/2001 <1 <1 <1 ND <1 <1 ND 1/8/2002 <1 0.36J <1 0.36J 1.4 <1 1.4 4/9/2002 <1 <1 <1 ND <1 <1 ND 7/11/2002 <1 0.21J <1 0.21J <1 <1 ND
M18D 20−30
10/9/2002 <1 1.1 <1 1.1 1.7 <1 2.8 10/2/2001 <1 <1 <1 ND <1 <1 ND 1/9/2002 <1 <1 <1 ND 0.9J <1 ND 4/10/2002 <1 <1 <1 ND <1 <1 ND 7/11/2002 <1 <1 <1 ND <1 <1 ND
M22D 20−30
10/9/2002 <1 <1 <1 ND 0.41J <1 ND M38D 20−30 4/11/2002 <1 <1 <1 ND <1 <1 ND
10/4/2001 <1 <1 <1 ND <1 <1 ND 4/12/2002 <1 <1 <1 ND <1 <1 ND M40D 18−28 10/9/2002 <1 <1 <1 ND <1 <1 ND

Quarterly Progress Report for October through December 2002 Document Number N0057600
Table 4 (continued). COPC Concentrations from wells and DPT Locations at the 4.5 Acre Site (reported in micrograms per liter)
4.5 Acre Site Quarterly Progress Report DOE/Grand Junction Office Page 26 January 2003
Location Screen Depth (ft)
Date Sampled TCE cis-1,2-
DCE trans-1,2-
DCE Total 1,2-
DCEa Vinyl
chloride Benzene Total COPCb
FDEP MCL 3 70 100 63 1 1 10/3/2001 <1 <1 <1 ND <1 <1 ND 4/11/2002 <1 <1 <1 ND <1 <1 ND M40S 4−14 10/9/2002 0.6J <1 <1 ND <1 <1 ND 10/3/2001 <1 <1 <1 ND <1 <1 ND 4/11/2002 <1 <1 <1 ND <1 <1 ND M41D 16−26 10/9/2002 <1 <1 <1 ND <1 <1 ND
aTotal 1,2-DCE is the sum of cis-1,2-DCE and trans-1,2-DCE. bTotal COPC is the sum of the individual COPC concentrations. The cis-1,2-DCE and trans-1,2-DCE values are not part of the Total COPC value because these values are included in the Total 1,2-DCE value. "J" values are not included in the Total COPC value. cThere were laboratory quality control issues with this sample, see Section 2.5. ND = Not detected. J = Estimated value, result is between the reporting limit and the method detection limit. B = Analyte also found in method blank. -- = No Data.

Appendix A
Laboratory Reports—October 2002 Quarterly Results

Document Number N0057600 Appendix A
DOE/Grand Junction Office 4.5 Acre Site Quarterly Progress Report January 2003 Page A–3
Table A–1. Relative Percent Difference (RPD) for Duplicate Samples 4.5 Acre Site
Sample ID Duplicate ID Case
Number Constituent Sa Db RPD Value
5 times DLc Faild
cis-1,2-Dichloroethene 0.2 0.26 26.1 5 Methylene chloride 1.4 0.37 116.4 25 Toluene 0.19 0.27 34.8 5
PIN20−DP01-18 PIN20−0553 B213924
Vinyl chloride 1.1 1.7 42.9 5 cis-1,2-Dichloroethene 7.6 6.4 17.1 5 Methylene chloride 1.8 1.6 11.8 25 PIN20−DP15-23 PIN20−0554 B214001 Vinyl chloride 9.3 9.7 4.2 5 1,1-Dichloroethene 1.8 1.4 25.0 12.5 cis-1,2-Dichloroethene 48 36 28.6 12.5 Propane, 2-methoxy-2-methyl- 48 56 15.4 125
trans-1,2-Dichloroethene 29 26 10.9 12.5 Trichloroethene 80 66 19.2 12.5
PIN20−DP26-23 PIN20−0555 B213965
Vinyl chloride 190 150 23.5 12.5 Benzene 0.12 0.25 70.3 5 Methylene chloride 0.47 0.76 47.2 25 PIN20−DP41-18 PIN20−0556 B214001 Vinyl chloride 3 2.6 14.3 5 Benzene 0.5 0.16 103.0 5 Ethylbenzene 0.5 0.17 98.5 5 m,p-Xylene 0.5 0.37 29.9 5 Methylene chloride 0.9 2.5 94.1 25 o-Xylene 0.5 0.21 81.7 5
PIN20−M019 PIN20−0550 B213939A/B213940
Toluene 0.5 0.18 94.1 5 aS = Original sample (N001), VOC concentration in µg/L. bD = Duplicate sample (N002), VOC concentration in µg/L. cDL = Detection limit. dFail is an RPD greater than "30% and an original or duplicate sample more than 5 times the detection limit.

Appendix A Document Number N0057600
4.5 Acre Site Quarterly Progress Report DOE/Grand Junction Office Page A–4 January 2003
End of current text