Embed Size (px)
Citation preview
R&D Quarterly Status Report: Multi-Level Learning in Hybrid Deliberative/Reactive Mobile
Robot Architectural Software Systems
May 2000
Sponsored by
Defense Advanced Research Projects Agency (DOD)
ARPA Order H908/00
Issued by U. S. Army Space and Missile Defense Command
Contract No. DASG60-99-C-0081
Project Director: Ronald C. Arkin
College of Computing
Georgia Institute of Technology
Atlanta, GA 30332-0280
(404) 894-8209
Effective Date of Contract: 1 September 1999
Contract Expiration Date: 31 August 2003
Reporting Period: 1 March 2000 – 31 May 2000
DISCLAIMER
The views and conclusions contained in this document are those of the authors and should not be interpreted as representing the official policies, either express or implied, of the Defense Advanced
Research Projects Agency or the U. S. Government.
Distribution limited to DOD components only; Critical Technology; (February 2000). Other requests for this document must be referred to Deputy Commander, US Army Space and Missile Defense Command;
ATTN: SMDC-TC-YD, Huntsville, AL 35807-3801.

SPONSORING / MONITORING AGENCY REPORT NUMBER
10.
7. PERFORMING ORGANIZATION NAME(S) AND ADDRESS(ES)
Public reporting burden for this collection of information is estimated to average 1 hour per response, including the time for reviewing instructions, searching existing data sources,gathering and maintaining the data needed, and completing and reviewing the collection of information. Send comments regarding this burden estimate or any other aspect of this collection of information, including suggestions for reducing this burden, to Washington Headquarters Services, Directorate for Information Operations and Reports, 1215 JeffersonDavis Highway, Suite 1204, Arlington, VA 22202-4302, and to the Office of Management and Budget, Paperwork Reduction Project (0704-0188), Washington, DC 20503.
PERFORMING ORGANIZATION REPORT NUMBER
REPORT DOCUMENTATION PAGE Form ApprovedOMB No. 0704-0188
SECURITY CLASSIFICATION OF REPORT
SECURITY CLASSIFICATION OF THIS PAGE
SECURITY CLASSIFICATION OF ABSTRACT
8.
1. AGENCY USE ONLY (Leave blank)
4. TITLE AND SUBTITLE
6. AUTHOR(S)
9. SPONSORING / MONITORING AGENCY NAME(S) AND ADDRESS(ES)
11. SUPPLEMENTARY NOTES
12a. DISTRIBUTION / AVAILABILITY STATEMENT
14. SUBJECT TERMS
13. ABSTRACT (Maximum 200 words)
5. FUNDING NUMBERS
20. LIMITATION OF ABSTRACT
15. NUMBER OF PAGES
16. PRICE CODE
2. REPORT DATE 3. REPORT TYPE AND DATES COVERED
12b. DISTRIBUTION CODE
17. 18. 19.
NSN 7540-01-280-5500 Standard Form 298 (Rev. 2-89)Prescribed by ANSI Std. Z39-18 298-102
USAPPC V1.00

3
1 INTRODUCTION
We are developing revolutionary learning methods in the context of proven DARPA-developed software to accomplish complex adaptive autonomous mobile robot operations in dynamic, hostile environments. Prior quarterly reports have covered the following major areas:
• the general theory and approach to this research,
• early results in each learning task,
• the plan for integration of each learning method into the into the existing MissionLab software system,
• progress that has been made in the integration process, and
• concepts for test mission scenarios.
The previous reports are still a valuable reference for background material, including a full bibliography.
This report focuses primarily on detailed simulation results of each learning method and some early results on actual robots. Additionally, the usability studies which have recently begun are described in some detail, since these feed important design data into one of the learning tasks.
2 RESEARCH APPROACH
There are five basic learning methods being investigated:
1. Learning Momentum: Slowly adjust parameters of one behavioral assemblage.
2. Case-Based Reasoning for Assemblage Selection: Switch (parameters of) behavioral assemblages for one behavior.
3. Reinforcement Learning: Switch from one behavior to another based on trial and error.
4. Probabilistic Learning and Planning: Construct FSA of behaviors from probabilistic world model.
5. Case-Based Reasoning “Wizardry:” Help the user to construct FSA of behaviors.
The first three methods can be characterized as occurring at a “sub-user” level within the robot’s real-time execution. The latter two methods assist the user in constructing missions at the level of the user interface. While initially we have been investigating these methods separately, over time we will be studying their interaction within a multi-level architecture.
The mission scenarios to be used for the studies continue to be refined. These are based on other experiences with defense robotics and include:
• airport surveillance,
4
• building approach,
• room search and clearance,
• mine and biohazard disposal, and
• rolling ambush.
No major changes have been made to the research approach that was described previously, particularly in the first quarterly report (November 1999). For the actual implementation issues, we have continued to follow the integration plan described in Appendix A of the previous quarterly report (February 2000). An second working visit was arranged by the subcontractor, Mobile Intelligence, in March 2000, and satisfactory progress has been maintained in the general implementation and integration process.
3 RESULTS AND DISCUSSION
Here, we primarily describe some of the simulations and robot trials for each of the methods, along with initial results and observations.
3.1 CBR for Behavioral Selection Progress
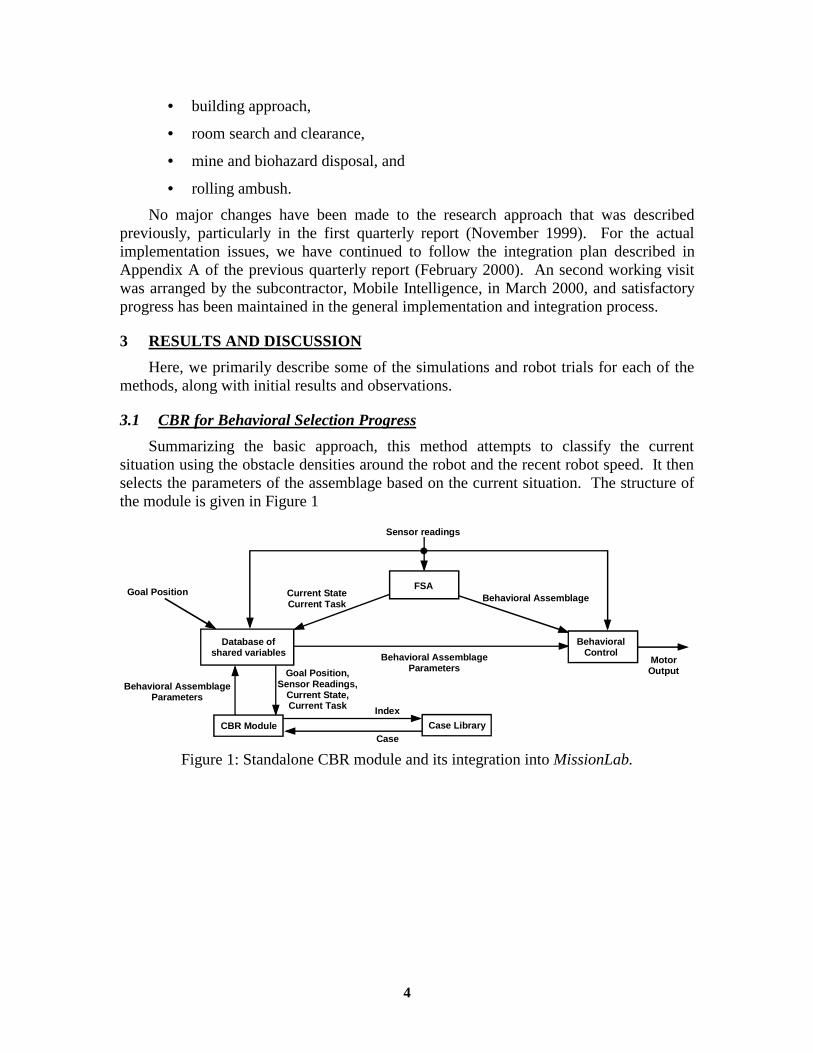
Summarizing the basic approach, this method attempts to classify the current situation using the obstacle densities around the robot and the recent robot speed. It then selects the parameters of the assemblage based on the current situation. The structure of the module is given in Figure 1
Sensor readings
Goal Position
Goal Position,Sensor Readings,
Current State,Current Task
Behavioral AssemblageParameters
MotorOutput
Database of shared variables
FSA
BehavioralControl
CBR Module
Behavioral AssemblageParameters
Current StateCurrent Task
Behavioral Assemblage
Case Library
Index
Case
Figure 1: Standalone CBR module and its integration into MissionLab.
5
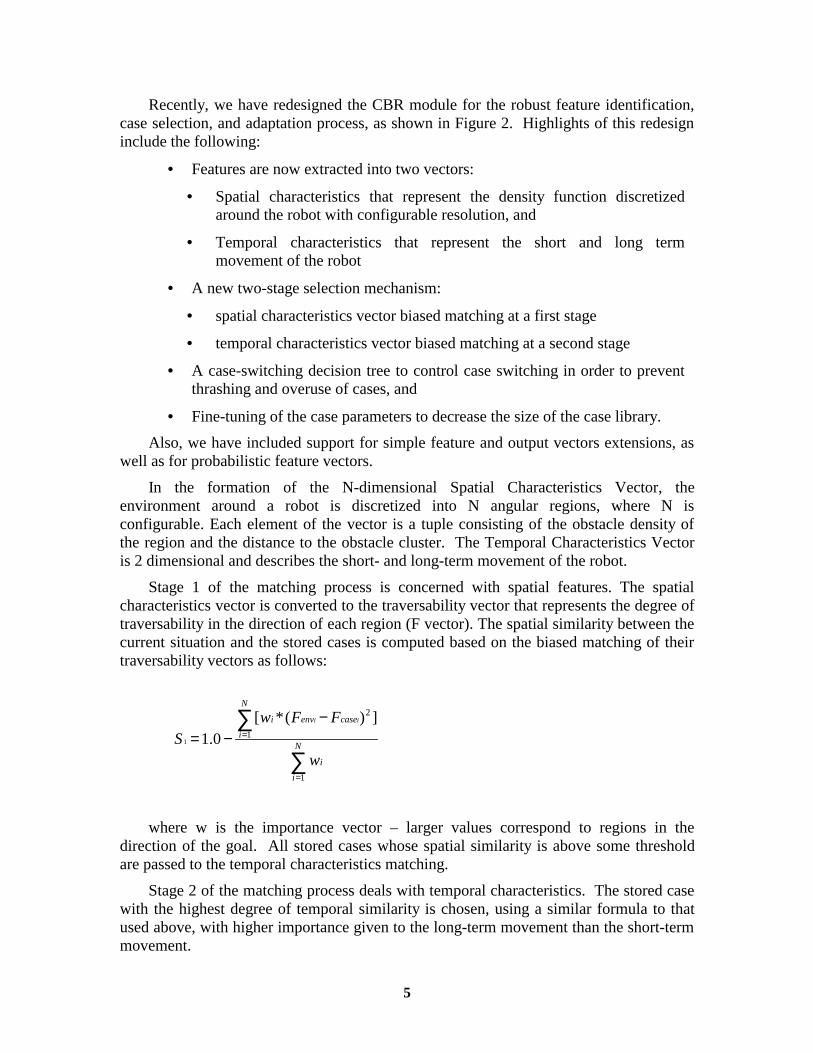
Recently, we have redesigned the CBR module for the robust feature identification, case selection, and adaptation process, as shown in Figure 2. Highlights of this redesign include the following:
• Features are now extracted into two vectors:
• Spatial characteristics that represent the density function discretized around the robot with configurable resolution, and
• Temporal characteristics that represent the short and long term movement of the robot
• A new two-stage selection mechanism:
• spatial characteristics vector biased matching at a first stage
• temporal characteristics vector biased matching at a second stage
• A case-switching decision tree to control case switching in order to prevent thrashing and overuse of cases, and
• Fine-tuning of the case parameters to decrease the size of the case library.
Also, we have included support for simple feature and output vectors extensions, as well as for probabilistic feature vectors.
In the formation of the N-dimensional Spatial Characteristics Vector, the environment around a robot is discretized into N angular regions, where N is configurable. Each element of the vector is a tuple consisting of the obstacle density of the region and the distance to the obstacle cluster. The Temporal Characteristics Vector is 2 dimensional and describes the short- and long-term movement of the robot.
Stage 1 of the matching process is concerned with spatial features. The spatial characteristics vector is converted to the traversability vector that represents the degree of traversability in the direction of each region (F vector). The spatial similarity between the current situation and the stored cases is computed based on the biased matching of their traversability vectors as follows:
∑
∑
=
=
−−= N
i
i
N
i
caseenvi
w
FFwS
ii
1
1
2 ])(*[0.11
where w is the importance vector – larger values correspond to regions in the direction of the goal. All stored cases whose spatial similarity is above some threshold are passed to the temporal characteristics matching.
Stage 2 of the matching process deals with temporal characteristics. The stored case with the highest degree of temporal similarity is chosen, using a similar formula to that used above, with higher importance given to the long-term movement than the short-term movement.
6
Stage 3 is the case-switching decision tree. The decision whether to change the current case to the new one is based on
• the period of time the current case has been applied,
• the degree of spatial similarity of the current case with the current situation,
• the degree of spatial similarity of the current case with the new case, and
• the temporal similarity.
Finally, we reach Stage 4, the Case Adaptation Process. Here, the parameters of the new case, if selected, are modified according to the following rules:
• If both the long-term and short-term movement are below some small threshold, then the noise gain is increased inversely proportionally to the long and short-term movement values and the suggested case application time is increased as well.
• If only the long-term movement is below some small threshold, then the noise gain and the suggested case application time are increased, but to a lesser extent.
• If only the short-term movement is below some small threshold, then the noise gain and the suggested case application time are increased, but to an even lesser extent.
CurrentEnvironment
FeatureIdentification
Spatial Features &Temporal Features
Vectors
Spatial Features Vector Matching
(1st stage of Case Selection)
Spatial Features Vector Matching
(2nd stage of Case Selection)
Set ofMatching
Cases
BestMatching
Case
Case switchingDecision tree
(whether to use new or old case)
CaseAdaptation
Short-Term Memory
(Domain Specific Cases)
Long-Term Memory
(The whole library)
Domain specificsubset of the case library
All the casesin the short-term
memory
BestMatching
Caseor
CurrentlyusedCase
CaseApplication
Case ready to be appliedCase Output Parameters(Behavioral Assemblage
Parameters)
CBR Module
Figure 2: Processing stages of the redesigned CBR module.
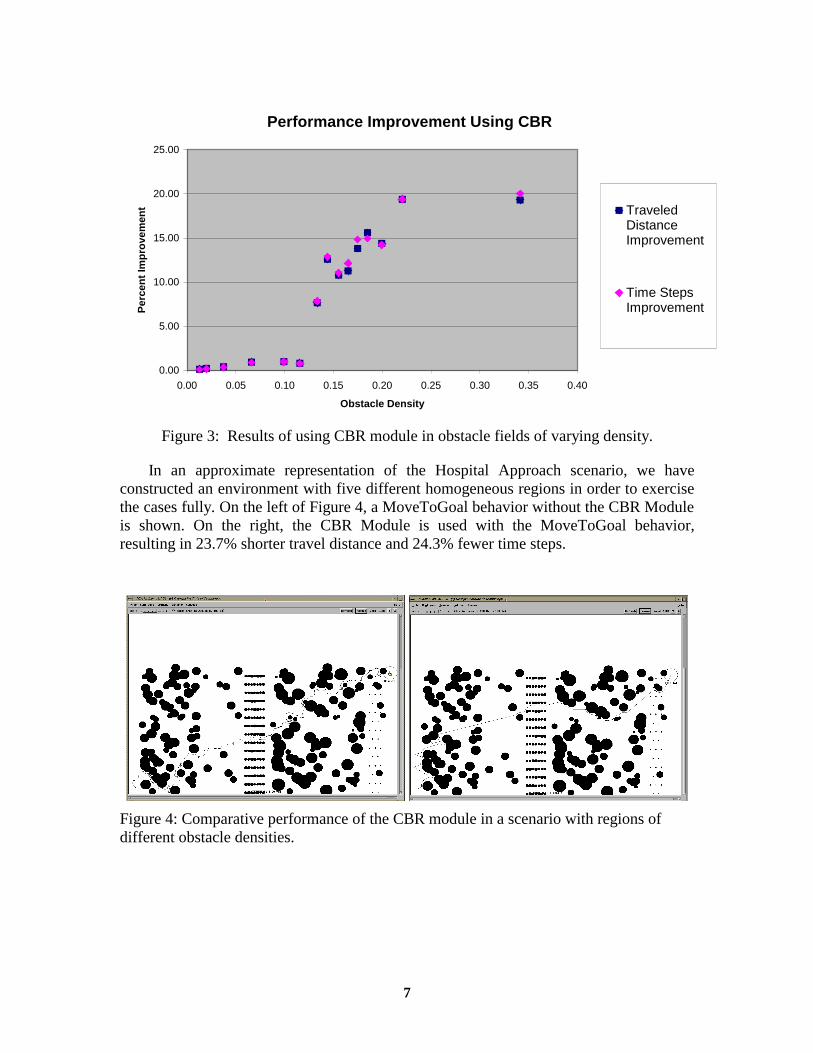
The results thus far, graphed in Figure 3 indicate about a 17% decrease on average in the traveling distance and required time steps for a MovetoGoal behavior with the CBR module, as compared to a MovetoGoal behavior without the CBR module. These results are from measurements of over 40 runs in environments of different types and varying in densities, with the best set of parameters chosen manually for non-CBR behavior. Not apparent in the graph is the significant increase in the number of solved environments.
7
Performance Improvement Using CBR
0.00
5.00
10.00
15.00
20.00
25.00
0.00 0.05 0.10 0.15 0.20 0.25 0.30 0.35 0.40
Obstacle Density
Per
cen
t Im
pro
vem
ent Traveled
DistanceImprovement
Time StepsImprovement
Figure 3: Results of using CBR module in obstacle fields of varying density.
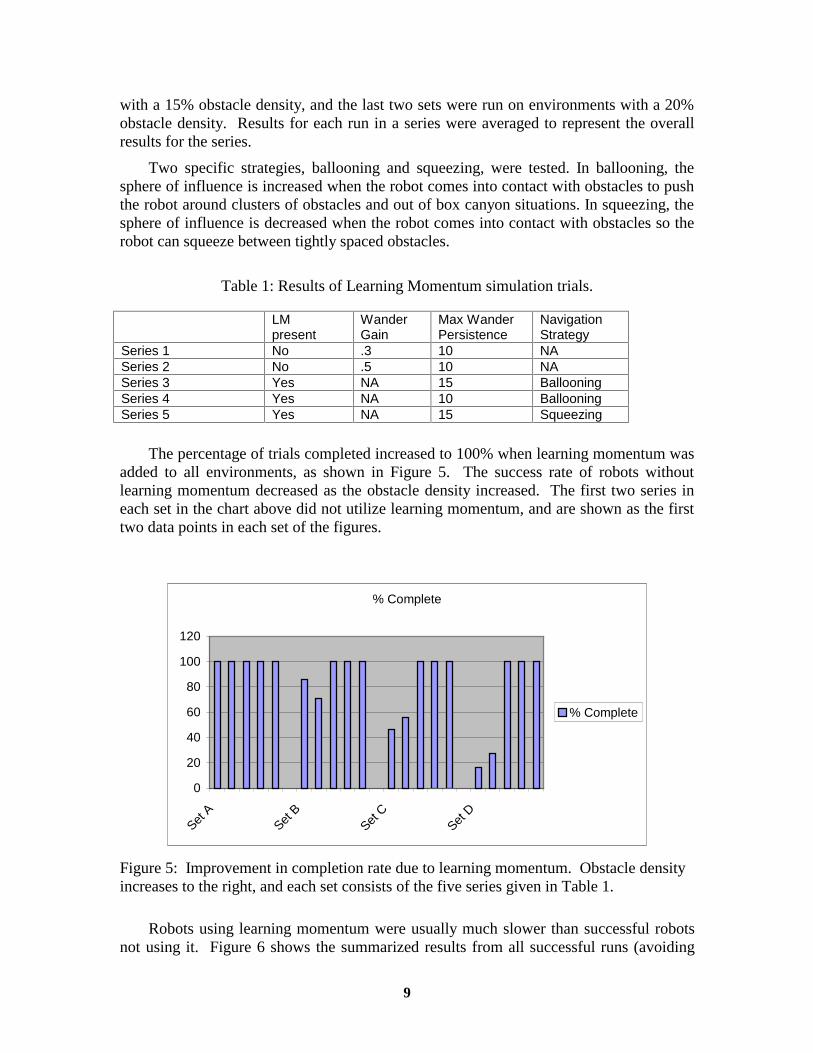
In an approximate representation of the Hospital Approach scenario, we have constructed an environment with five different homogeneous regions in order to exercise the cases fully. On the left of Figure 4, a MoveToGoal behavior without the CBR Module is shown. On the right, the CBR Module is used with the MoveToGoal behavior, resulting in 23.7% shorter travel distance and 24.3% fewer time steps.
Figure 4: Comparative performance of the CBR module in a scenario with regions of different obstacle densities.

8
In the future, we will be addressing
• the addition of a second level of operation – selection and adaptation of the whole new behavioral assemblage,
• automatic learning and adjustment of cases through experience,
• implementation of probabilistic feature identification,
• integration with Q-learning and momentum learning, and
• significant statistical results on real robots.
3.2 Learning Momentum Progress
Learning momentum (LM) is a process by which a robot, at runtime, changes values that dictate how it reacts to the environment. Values include weights given to vectors pointing towards the goal, away from obstacles, and in random directions. Also included are the robot’s wander persistence and sphere of influence (the maximum distance an obstacle must be from a robot before the obstacle is ignored). A short running history is kept to see if the robot is making progress or is stuck. If the robot determines that it is stuck (i.e., the distance it’s moving is below a certain threshold), it will take action. For example, it will increase the weight of its random vector and decrease the weight of its goal vector.
Previously, we demonstrated a vast improvement in navigation around obstacles by using LM algorithms that allow the robot to change its noise persistence. When the robot got stuck and chose a random direction to try and find a way around the object, it could move in that direction a larger distance if needs be. This greater persistence gives the robot the ability to cover a larger area to move around large obstacles. Algorithms allowing the robot to change its sphere of influence had been implemented previously, too.
Currently, we alter the following behavioral parameters:
• Move to Goal Vector weight,
• Avoid Obstacle Vector weight,
• Wander Vector weight,
• Wander persistence, and
• Obstacle Sphere of Influence.
We are now considering simulation results to quantify performance improvements due to LM. The relevant metrics are
• Improved Completion Rate, and
• Improved Completion Time.
Four sets of tests were run. Each set consisted of five series of just over one hundred runs each. The robot differences for each series are summarized in Table 1. Each set of tests were run on a different environment. The first two sets were run on environments
9
with a 15% obstacle density, and the last two sets were run on environments with a 20% obstacle density. Results for each run in a series were averaged to represent the overall results for the series.
Two specific strategies, ballooning and squeezing, were tested. In ballooning, the sphere of influence is increased when the robot comes into contact with obstacles to push the robot around clusters of obstacles and out of box canyon situations. In squeezing, the sphere of influence is decreased when the robot comes into contact with obstacles so the robot can squeeze between tightly spaced obstacles.
Table 1: Results of Learning Momentum simulation trials.
LM present
Wander Gain
Max Wander Persistence
Navigation Strategy
Series 1 No .3 10 NA Series 2 No .5 10 NA Series 3 Yes NA 15 Ballooning Series 4 Yes NA 10 Ballooning Series 5 Yes NA 15 Squeezing
The percentage of trials completed increased to 100% when learning momentum was added to all environments, as shown in Figure 5. The success rate of robots without learning momentum decreased as the obstacle density increased. The first two series in each set in the chart above did not utilize learning momentum, and are shown as the first two data points in each set of the figures.
% Complete
0
20
40
60
80
100
120
Set A
Set B
Set C
Set D
% Complete
Figure 5: Improvement in completion rate due to learning momentum. Obstacle density increases to the right, and each set consists of the five series given in Table 1.
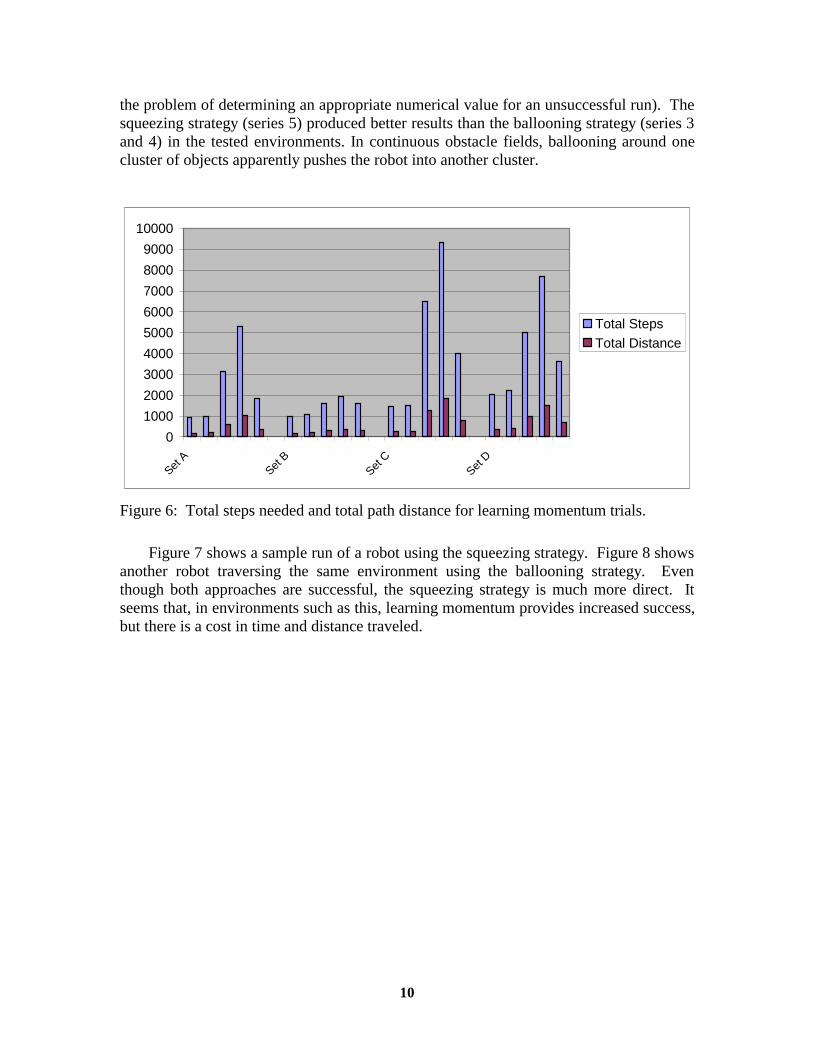
Robots using learning momentum were usually much slower than successful robots not using it. Figure 6 shows the summarized results from all successful runs (avoiding
10
the problem of determining an appropriate numerical value for an unsuccessful run). The squeezing strategy (series 5) produced better results than the ballooning strategy (series 3 and 4) in the tested environments. In continuous obstacle fields, ballooning around one cluster of objects apparently pushes the robot into another cluster.
0
1000
2000
3000
4000
5000
6000
7000
8000
9000
10000
Set A
Set B
Set C
Set D
Total StepsTotal Distance
Figure 6: Total steps needed and total path distance for learning momentum trials.
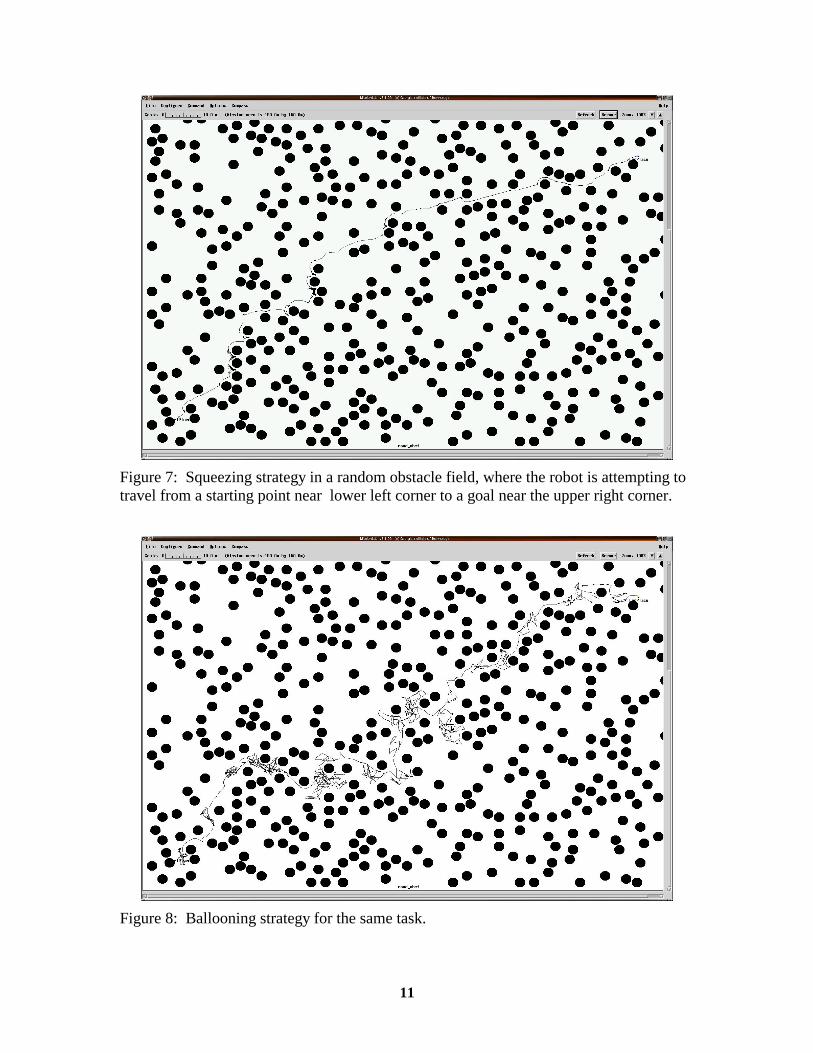
Figure 7 shows a sample run of a robot using the squeezing strategy. Figure 8 shows another robot traversing the same environment using the ballooning strategy. Even though both approaches are successful, the squeezing strategy is much more direct. It seems that, in environments such as this, learning momentum provides increased success, but there is a cost in time and distance traveled.
11
Figure 7: Squeezing strategy in a random obstacle field, where the robot is attempting to travel from a starting point near lower left corner to a goal near the upper right corner.
Figure 8: Ballooning strategy for the same task.
12
3.3 Reinforcement learning Progress
This learning method essentially involves trial and error to determine when to switch from one behavior to another. It operates at coarse granularity, implementing behavioral assemblage selection as opposed to parameterization, as is done in the previous two methods. We recently have added the ability to dynamically choose which behavioral assemblage to execute, as well as the ability to learn which assemblage to choose using wide variety of reinforcement learning methods, including Q-learning, value iteration, and policy iteration.
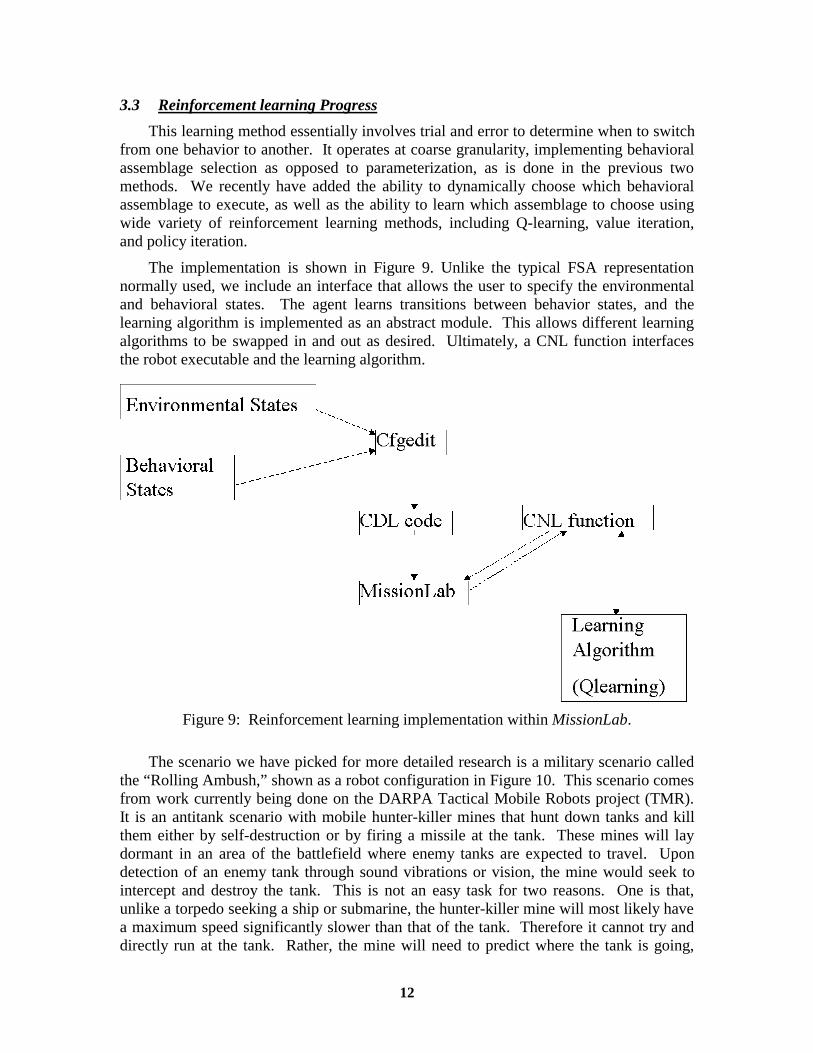
The implementation is shown in Figure 9. Unlike the typical FSA representation normally used, we include an interface that allows the user to specify the environmental and behavioral states. The agent learns transitions between behavior states, and the learning algorithm is implemented as an abstract module. This allows different learning algorithms to be swapped in and out as desired. Ultimately, a CNL function interfaces the robot executable and the learning algorithm.
Figure 9: Reinforcement learning implementation within MissionLab.
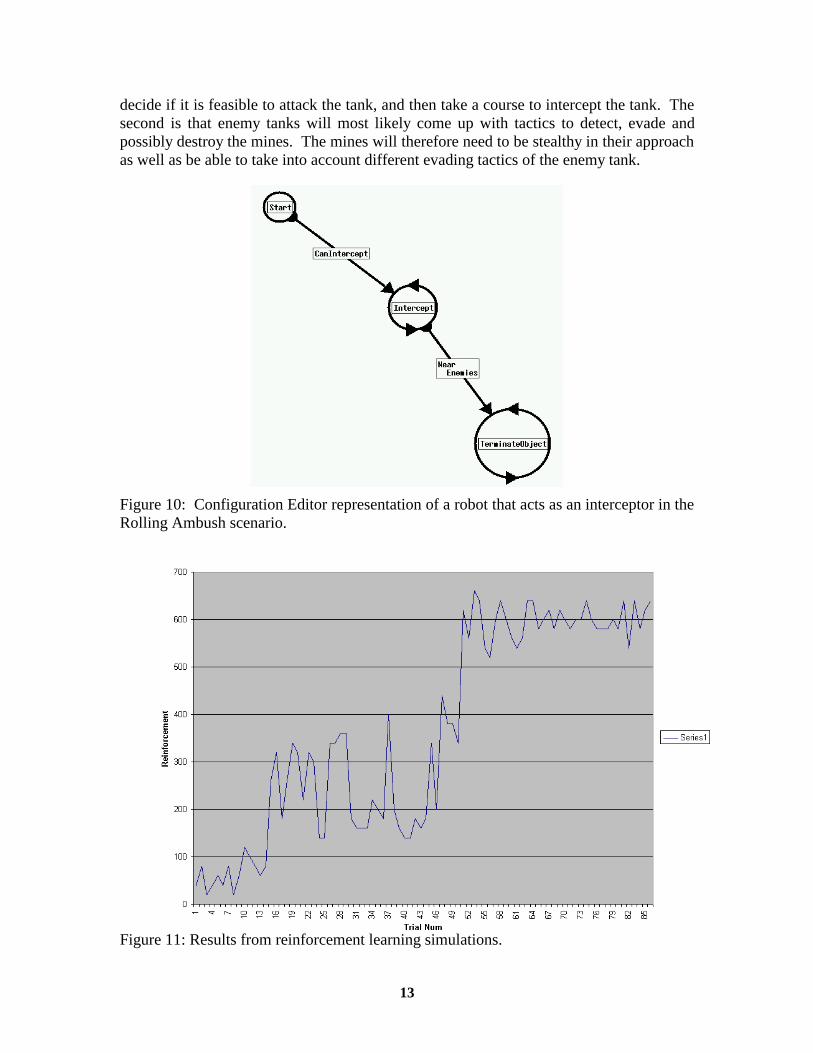
The scenario we have picked for more detailed research is a military scenario called the “Rolling Ambush,” shown as a robot configuration in Figure 10. This scenario comes from work currently being done on the DARPA Tactical Mobile Robots project (TMR). It is an antitank scenario with mobile hunter-killer mines that hunt down tanks and kill them either by self-destruction or by firing a missile at the tank. These mines will lay dormant in an area of the battlefield where enemy tanks are expected to travel. Upon detection of an enemy tank through sound vibrations or vision, the mine would seek to intercept and destroy the tank. This is not an easy task for two reasons. One is that, unlike a torpedo seeking a ship or submarine, the hunter-killer mine will most likely have a maximum speed significantly slower than that of the tank. Therefore it cannot try and directly run at the tank. Rather, the mine will need to predict where the tank is going,
13
decide if it is feasible to attack the tank, and then take a course to intercept the tank. The second is that enemy tanks will most likely come up with tactics to detect, evade and possibly destroy the mines. The mines will therefore need to be stealthy in their approach as well as be able to take into account different evading tactics of the enemy tank.
Figure 10: Configuration Editor representation of a robot that acts as an interceptor in the Rolling Ambush scenario.
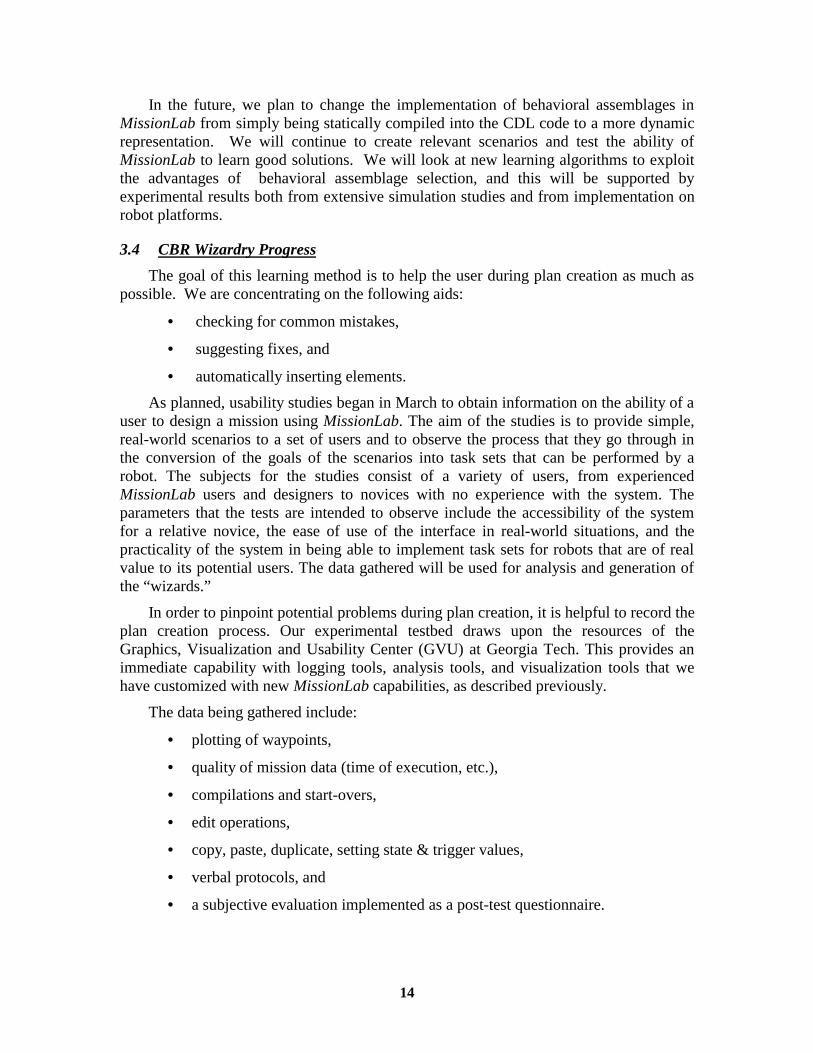
Figure 11: Results from reinforcement learning simulations.
14
In the future, we plan to change the implementation of behavioral assemblages in MissionLab from simply being statically compiled into the CDL code to a more dynamic representation. We will continue to create relevant scenarios and test the ability of MissionLab to learn good solutions. We will look at new learning algorithms to exploit the advantages of behavioral assemblage selection, and this will be supported by experimental results both from extensive simulation studies and from implementation on robot platforms.
3.4 CBR Wizardry Progress
The goal of this learning method is to help the user during plan creation as much as possible. We are concentrating on the following aids:
• checking for common mistakes,
• suggesting fixes, and
• automatically inserting elements.
As planned, usability studies began in March to obtain information on the ability of a user to design a mission using MissionLab. The aim of the studies is to provide simple, real-world scenarios to a set of users and to observe the process that they go through in the conversion of the goals of the scenarios into task sets that can be performed by a robot. The subjects for the studies consist of a variety of users, from experienced MissionLab users and designers to novices with no experience with the system. The parameters that the tests are intended to observe include the accessibility of the system for a relative novice, the ease of use of the interface in real-world situations, and the practicality of the system in being able to implement task sets for robots that are of real value to its potential users. The data gathered will be used for analysis and generation of the “wizards.”
In order to pinpoint potential problems during plan creation, it is helpful to record the plan creation process. Our experimental testbed draws upon the resources of the Graphics, Visualization and Usability Center (GVU) at Georgia Tech. This provides an immediate capability with logging tools, analysis tools, and visualization tools that we have customized with new MissionLab capabilities, as described previously.
The data being gathered include:
• plotting of waypoints,
• quality of mission data (time of execution, etc.),
• compilations and start-overs,
• edit operations,
• copy, paste, duplicate, setting state & trigger values,
• verbal protocols, and
• a subjective evaluation implemented as a post-test questionnaire.
15
The experiments are administered by a third party. All participants are given a uniform introduction to MissionLab before being assigned one task at a time. They are left alone in the usability lab to complete the task, but are observed via one-way glass and recorded with a video camera.
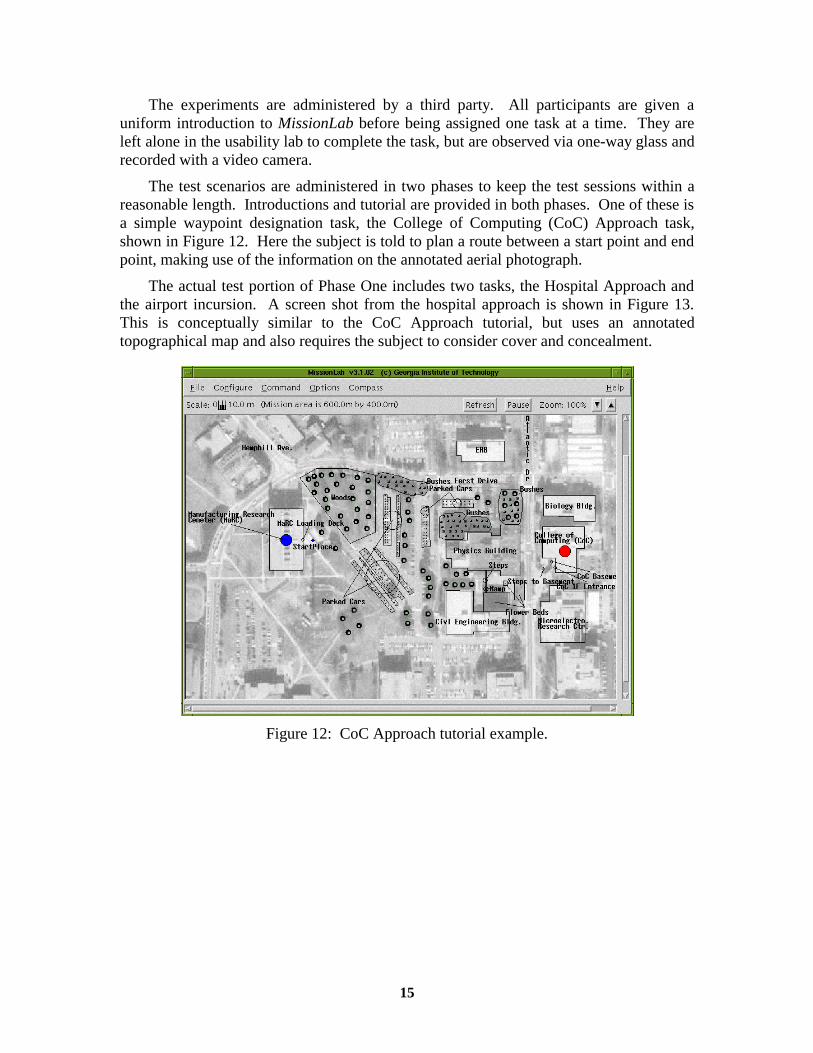
The test scenarios are administered in two phases to keep the test sessions within a reasonable length. Introductions and tutorial are provided in both phases. One of these is a simple waypoint designation task, the College of Computing (CoC) Approach task, shown in Figure 12. Here the subject is told to plan a route between a start point and end point, making use of the information on the annotated aerial photograph.
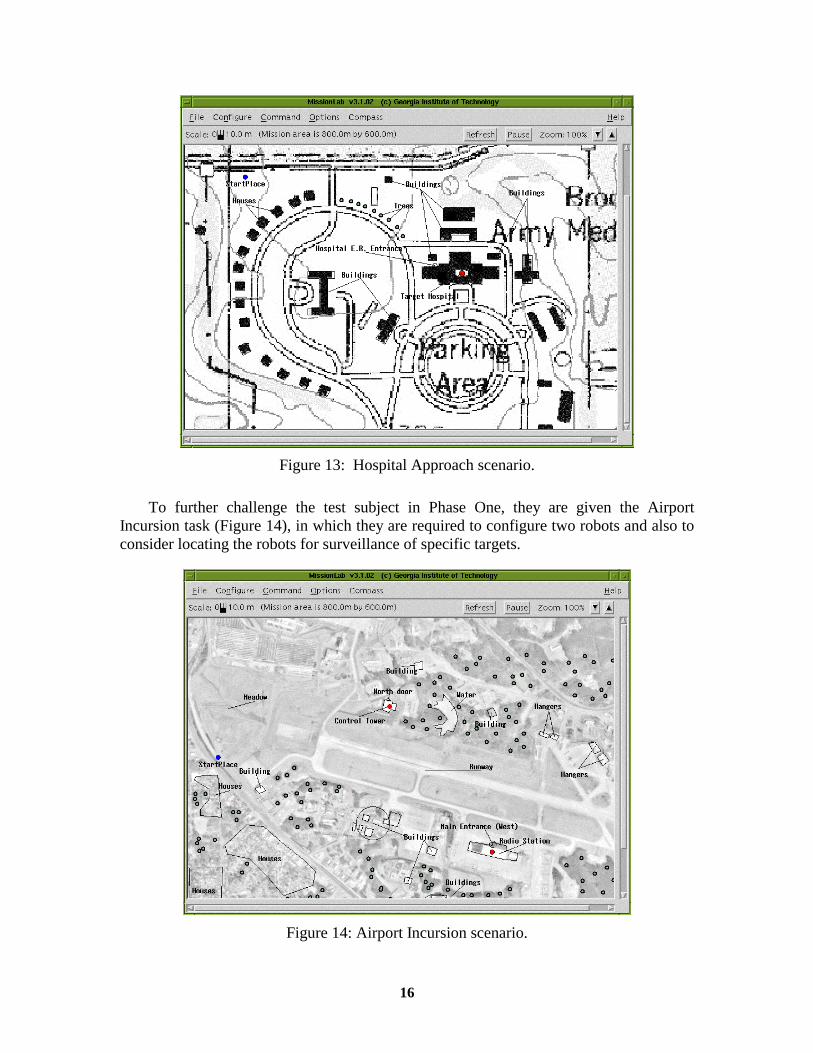
The actual test portion of Phase One includes two tasks, the Hospital Approach and the airport incursion. A screen shot from the hospital approach is shown in Figure 13. This is conceptually similar to the CoC Approach tutorial, but uses an annotated topographical map and also requires the subject to consider cover and concealment.
Figure 12: CoC Approach tutorial example.
16
Figure 13: Hospital Approach scenario.
To further challenge the test subject in Phase One, they are given the Airport Incursion task (Figure 14), in which they are required to configure two robots and also to consider locating the robots for surveillance of specific targets.
Figure 14: Airport Incursion scenario.
17
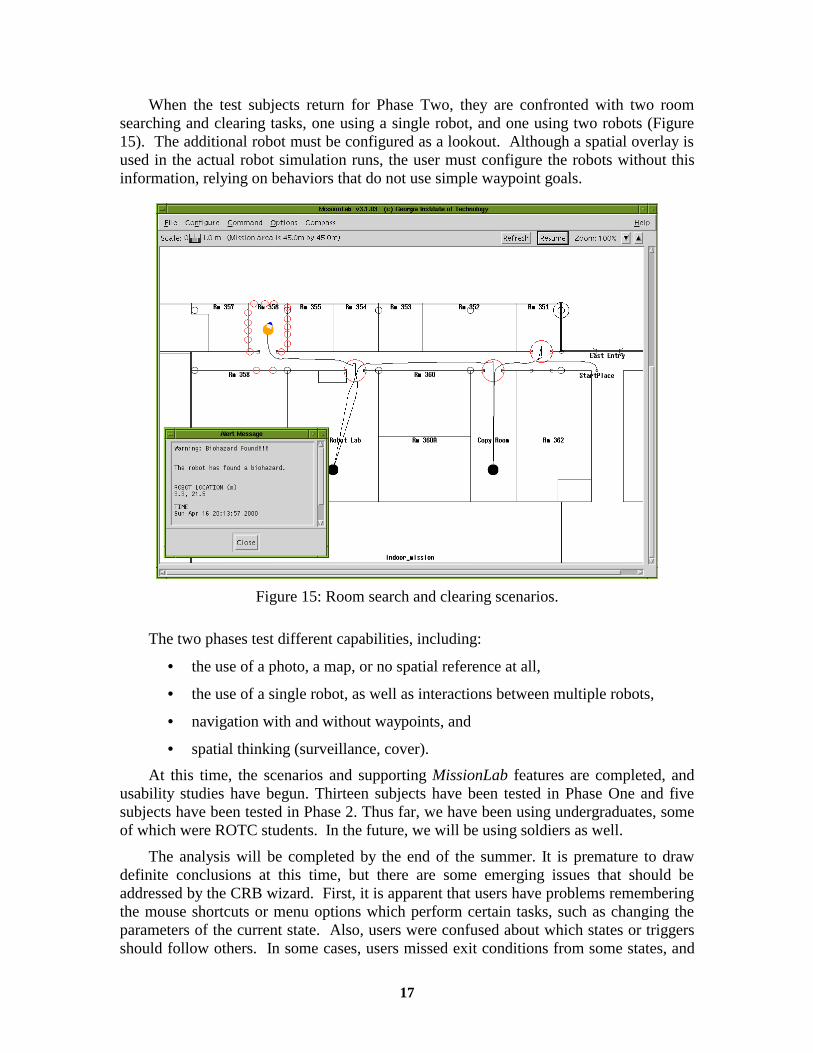
When the test subjects return for Phase Two, they are confronted with two room searching and clearing tasks, one using a single robot, and one using two robots (Figure 15). The additional robot must be configured as a lookout. Although a spatial overlay is used in the actual robot simulation runs, the user must configure the robots without this information, relying on behaviors that do not use simple waypoint goals.
Figure 15: Room search and clearing scenarios.
The two phases test different capabilities, including:
• the use of a photo, a map, or no spatial reference at all,
• the use of a single robot, as well as interactions between multiple robots,
• navigation with and without waypoints, and
• spatial thinking (surveillance, cover).
At this time, the scenarios and supporting MissionLab features are completed, and usability studies have begun. Thirteen subjects have been tested in Phase One and five subjects have been tested in Phase 2. Thus far, we have been using undergraduates, some of which were ROTC students. In the future, we will be using soldiers as well.
The analysis will be completed by the end of the summer. It is premature to draw definite conclusions at this time, but there are some emerging issues that should be addressed by the CRB wizard. First, it is apparent that users have problems remembering the mouse shortcuts or menu options which perform certain tasks, such as changing the parameters of the current state. Also, users were confused about which states or triggers should follow others. In some cases, users missed exit conditions from some states, and
18
in others created state/trigger sequences that could never be reached during mission execution. All of these problems can be minimized with the wizard.
Some summary numerical results are shown in Table 2. The completion rates indicate that the task difficulties are appropriate for our studies, since we hope to increasingly challenge the user up to a point where they reach a task that few, if any, complete. It is through the failures that we can potentially learn the most about aiding the users. As expected, the average number of compiles and the required time to complete the task also increase steadily as the tasks become more difficult.
Table 2: Preliminary Usability Study Results
Phase 1 Phase 2 Approach
CoC Airport
Incursion Search and
Clear Two-robot
version Completion rate 90% 80% 60% 0% Average no. of compiles 1.4 2.4 2.8 3.6 Average time 9 min 14 min 26 min --
3.5 Probabilistic Planning and Execution Progress
This learning method constructs an FSA of behaviors from a probabilistic world model using Partially Observable Markov Decision Process (POMDP) models, taking into account actuator uncertainty, sensor uncertainty, and environmental uncertainty. Different costs and probabilities result in different FSAs. Our working hypothesis is that humans are bad in determining optimal FSAs, which is why planning should be automated.
Expectations are generated based on situational probabilities regarding behavioral performance (e.g., obstacle densities and traversability). These expectations are used at planning stages for behavioral selection.
POMDPs (Partially Observable Markov Decision Processes) can be used to plan based on models of the environment. These models consist of states, actions, costs, transition probabilities, and observation probabilities. By mapping the policy graph to a finite state automaton, the resulting plan can be used in behavior-based systems.
Figure 16: Relationship of MissionLab components to the POMDP solver.

19
The general process is illustrated in Figure 16. There are essentially four steps:
1. The POMDP is specified. 2. The POMDP is solved resulting in an FSA (finite state automaton). 3. The FSA is converted into a .cdl file and loaded into MissionLab. 4. The FSA is compiled and executed in simulation or on a physical robot.
A representative example, the Room Clearing scenario, is shown as a POMDP in Figure 17. This is solved, producing the FSA of Figure 18. Currently, the compiler generates “modules” which the user integrates into complete plans.
Figure 17: POMDP describing the room clearing model.
Figure 18: A MissionLab FSA generated from the previous POMDP.
20
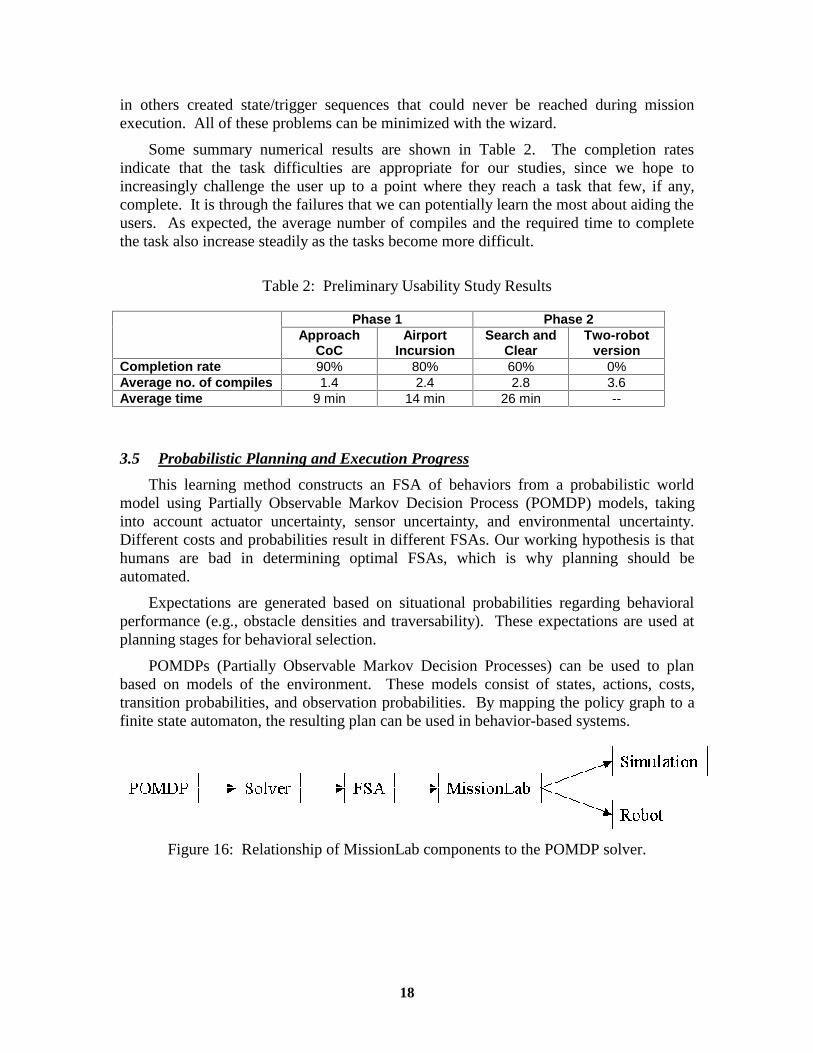
The performance of a static baseline plan, similar to one a user may input, decays quickly as the cost of failure increases. In this case, the baseline plan is identical to a plan generated by a POMDP solver if the cost of failure is 100. The POMDP solver is able to adapt the plan to account for higher costs of failure. As the costs increase, the POMDP solver generates different plans to optimize the performance. A comparison of a baseline plan vs. a solved-POMDP plan is shown for different costs of failure in Figure 19.
Expected Payoff of Plan vs Cost of Failure
-1500
-1000
-500
0
500
1000
0 2000 4000 6000 8000 10000 12000
Cost of Failure
Exp
ecte
d P
ayo
ff o
f P
lan POMDP Plan
Baseline Plan
Figure 19: Plans based on POMDPs perform better than a baseline plan when the cost of failure increases.
The mapping of states and transitions of the policy graph to triggers and behaviors of the finite state automaton may give rise to semantic problems. This mapping must be taken into account during modeling based on the scenario, the details of the simulation used, and the capabilities of the robot.
In the near future, we will gather more numerical data based on simulation runs. We will also begin tests on real robots. Sensor models must be developed (based on sampling) for the sensors being used. A microphone, for example, maybe used for the room searching scenario. We will also develop a simpler interface for modeling the POMDP.
21
3.6 Interaction and dissemination of results
With sponsor approval, we continue to maintain a web site at http://www.cc.gatech.edu/ai/robot-lab/MARS. Project documents and software downloads are available, and eventually we expect to provide online simulations and multimedia content.
We attended the workshop in Houston and presented much of the same research progress described here.