Embed Size (px)
Citation preview

Regulated Price Plan
Price Report
November 1, 2019 to
October 31, 2020
Ontario Energy Board
October 22, 2019

Ontar io Energy Board 1
Executive Summary This report contains the electricity commodity prices under the Regulated Price Plan (RPP) for the period November 1, 2019 through October 31, 2020.
Effective November 1, 2019, the provisions of the Ontario Fair Hydro Plan Act, 2017 (OFHP Act) under which the Ontario Energy Board (OEB) has been setting RPP prices since July 2017, are repealed, and the same is true of the related regulation (O. Reg. 195/17) made under the OFHP Act. The OEB is therefore once again setting RPP prices under section 79.16 of the Ontario Energy Board Act, 1998, which more closely reflect the cost of supply. Also effective November 1, 2019, an expanded government rebate under the Ontario Rebate for Electricity Consumers Act, 2016 will largely offset the increase in RPP prices relative to the RPP prices that were set by the OEB for May 1, 2019.
The RPP prices set by the OEB effective November 1, 2019 were developed using the methodology described in the Regulated Price Plan Manual (RPP Manual).
In accordance with O. Reg. 95/05, the OEB must forecast the cost of supplying RPP consumers and ensure that RPP prices reflect this cost. RPP prices are reviewed by the OEB every six months to determine if they need to be adjusted.
In broad terms, the methodology used to develop RPP prices has two essential steps:
1. Forecasting the total RPP supply cost for 12 months, and
2. Establishing prices to recover the forecast RPP supply cost from RPP consumers over the 12-month period.
The calculation of the total RPP electricity supply cost involves several separate forecasts, including:
o the hourly market price of electricity;
o the electricity consumption pattern of RPP consumers;
o the electricity supplied by those assets of Ontario Power Generation (OPG) whose price is regulated;
o the costs related to the contracts signed by non-utility generators (NUGs) with the former Ontario Hydro; and
o the costs of the supply contracts, and conservation and demand management (CDM) initiatives of the Independent Electricity System Operator (IESO).
The market-based price for electricity used by RPP consumers reflects both the hourly market price of electricity and the electricity consumption pattern of RPP consumers. Residential consumers, who represent most RPP consumption, use relatively more of their electricity during times when total Ontario demand and prices are higher (than the overall Ontario average) and relatively less when total Ontario demand and prices are lower (than the overall Ontario average). This consumption pattern makes the average market price for RPP consumers higher than the average market price for the entire Ontario electricity market.

Ontar io Energy Board 2
Average RPP Supply Cost
The hourly market price forecast was developed by Power Advisory LLC (Power Advisory). The forecast of the simple average market price for 12 months from November 1, 2019 is $18.50/MWh (1.85 cents per kWh). After accounting for the consumption pattern of RPP consumers, the average market price for electricity used by RPP consumers is forecast to be $20.09/MWh (2.01 cents per kWh).
The combined effect of the other components of the RPP supply cost is expected to increase this per kilowatt-hour price. The collective impact of the other components is summarized by the Global Adjustment. The Global Adjustment reflects the impact of the NUG contract costs, which are above market prices at most times, the regulated prices for OPG’s prescribed nuclear and hydroelectric generating facilities (the prescribed assets), which may be above or below market prices, and any remaining cost of supply contracts held by the IESO which generators have not recovered through their market revenues. The cost associated with CDM initiatives implemented by the IESO is also included. The forecast net impact of the Global Adjustment is to increase the average RPP supply cost by $106.94/MWh (10.69 cents per kWh).
The forecast supply cost also considers the uncertainty associated with actual market prices and actual market demand as both are subject to random effects. Consequently, a minor adjustment is made to the RPP supply cost to account for the fact that these random effects are more likely to increase than to decrease supply costs during the forecast period. This adjustment was determined to be $1.00/MWh (or 0.100 cents per kWh). Without this adjustment, the RPP would be expected to end the year with a small debit variance. Prior to the OFHP Act, an additional adjustment factor was included in the RPP to “clear” the difference between the actual and forecast cost of supplying electricity to all RPP consumers recorded in the IESO’s RPP-related variance account. The IESO has not tracked this variance since RPP prices started to be set under the OFHP Act, and the OEB has again adopted a value of $0.00 as the current balance in the IESO’s RPP-related variance account. Adjustments related to the IESO’s RPP-related variance account will be considered when the OEB next sets RPP prices.
As set out in Table ES-1, the resulting average RPP supply cost (for the period starting November 1, 2019) is $128.03/MWh. This average supply cost corresponds to an average RPP price, referred to as RPA, of 12.80 cents per kWh.
Table ES-1: Average RPP Supply Cost Summary (for the period from November 1, 2019 through October 31, 2020)
Source: Power Advisory LLC
RPP Supply Cost Summaryfor the period from November 1, 2019 through October 31, 2020 $/MWh
Forecast Wholesale Electricity Price - Simple Average $18.50Load-Weighted Costs for RPP Consumers
Wholesale Electricity Cost - RPP-Weighted $20.09Global Adjustment + $106.94Adjustment to Address Bias Towards Unfavourable Variance + $1.00
Average Supply Cost for RPP Consumers = $128.03

Ontar io Energy Board 3
Regulated Price Plan Prices
RPP consumers are not charged the average RPP supply cost. Rather, they pay prices under price structures that are designed to make their consumption weighted average price equal to the average supply cost. There are two RPP price structures, one for consumers with eligible time-of-use (or “smart”) meters who pay time-of-use (TOU) prices, who make up the majority of RPP consumers, and one for consumers with conventional meters (tiered pricing).
Regulated Price Plan – TOU Pricing
Consumers with eligible time-of-use (or “smart”) meters that can determine when electricity is consumed during the day will pay under a TOU price structure. The prices for this plan are based on three TOU periods per weekday1. These periods are referred to as Off-Peak (with a price of RPEMOFF), Mid-Peak (RPEMMID) and On-Peak (RPEMON). The lowest (Off-Peak) price is below the RPA, while the other two are above it.
The resulting TOU prices for consumers with eligible TOU meters are:
o RPEMOFF = 10.1 cents per kWh;
o RPEMMID = 14.4 cents per kWh; and,
o RPEMON = 20.8 cents per kWh.
These prices reflect the seasonal change in the TOU pricing periods which will take effect on November 1, 2019 and May 1, 2020. TOU pricing periods are:
o Off-peak period (priced at RPEMOFF):
Winter and summer weekdays: 7 p.m. to midnight and midnight to 7 a.m.
Winter and summer weekends and holidays:2 24 hours (all day)
o Mid-peak period (priced at RPEMMID)
Winter weekdays (November 1 to April 30): 11 a.m. to 5 p.m.
Summer weekdays (May 1 to October 31): 7 a.m. to 11 a.m. and 5 p.m. to 7 p.m.
o On-peak period (priced at RPEMON)
Winter weekdays: 7 a.m. to 11 a.m. and 5 p.m. to 7p.m.
Summer weekdays: 11 a.m. to 5 p.m.
1 Weekends and statutory holidays have one TOU period: Off-peak. 2 For the purpose of RPP TOU pricing, a “holiday” means the following days: New Year’s Day, Family Day, Good Friday, Christmas Day, Boxing Day, Victoria Day, Canada Day, Labour Day, Thanksgiving Day, and the Civic Holiday. When any holiday falls on a weekend (Saturday or Sunday), the next weekday following (that is not also a holiday) is to be treated as the holiday for RPP TOU pricing purposes.
Ontar io Energy Board 4
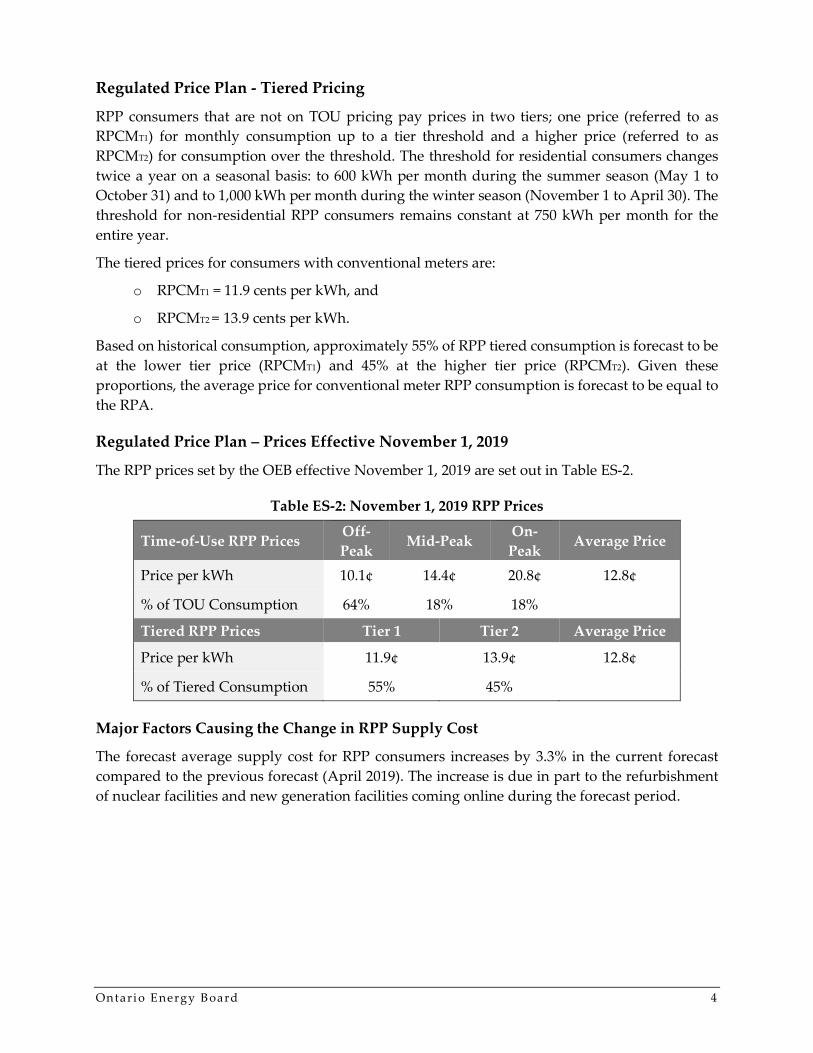
Regulated Price Plan - Tiered Pricing
RPP consumers that are not on TOU pricing pay prices in two tiers; one price (referred to as RPCMT1) for monthly consumption up to a tier threshold and a higher price (referred to as RPCMT2) for consumption over the threshold. The threshold for residential consumers changes twice a year on a seasonal basis: to 600 kWh per month during the summer season (May 1 to October 31) and to 1,000 kWh per month during the winter season (November 1 to April 30). The threshold for non-residential RPP consumers remains constant at 750 kWh per month for the entire year.
The tiered prices for consumers with conventional meters are:
o RPCMT1 = 11.9 cents per kWh, and
o RPCMT2 = 13.9 cents per kWh.
Based on historical consumption, approximately 55% of RPP tiered consumption is forecast to be at the lower tier price (RPCMT1) and 45% at the higher tier price (RPCMT2). Given these proportions, the average price for conventional meter RPP consumption is forecast to be equal to the RPA.
Regulated Price Plan – Prices Effective November 1, 2019
The RPP prices set by the OEB effective November 1, 2019 are set out in Table ES-2.
Table ES-2: November 1, 2019 RPP Prices
Time-of-Use RPP Prices Off-Peak Mid-Peak On-
Peak Average Price
Price per kWh 10.1¢ 14.4¢ 20.8¢ 12.8¢
% of TOU Consumption 64% 18% 18%
Tiered RPP Prices Tier 1 Tier 2 Average Price
Price per kWh 11.9¢ 13.9¢ 12.8¢
% of Tiered Consumption 55% 45%
Major Factors Causing the Change in RPP Supply Cost
The forecast average supply cost for RPP consumers increases by 3.3% in the current forecast compared to the previous forecast (April 2019). The increase is due in part to the refurbishment of nuclear facilities and new generation facilities coming online during the forecast period.

Ontar io Energy Board 5
Table of Contents EXECUTIVE SUMMARY ............................................................................................................................................................ 1
AVERAGE RPP SUPPLY COST ....................................................................................................................................................... 2 REGULATED PRICE PLAN – TOU PRICING ................................................................................................................................... 3 REGULATED PRICE PLAN - TIERED PRICING ................................................................................................................................ 4 REGULATED PRICE PLAN – PRICES EFFECTIVE NOVEMBER 1, 2019 ............................................................................................. 4
LIST OF FIGURES & TABLES ................................................................................................................................................... 5 1. INTRODUCTION ............................................................................................................................................................... 6
1.1 ASSOCIATED DOCUMENTS ............................................................................................................................................. 6 1.2 PROCESS FOR RPP PRICE DETERMINATIONS ................................................................................................................. 6
2. CALCULATING THE RPP SUPPLY COST ................................................................................................................... 8 2.1 DEFINING THE RPP SUPPLY COST ................................................................................................................................. 8 2.2 COMPUTATION OF THE RPP SUPPLY COST .................................................................................................................... 9
2.2.1 Forecast Cost of Supply Under Market Rules ........................................................................................................ 10 2.2.2 RPP Share of the Global Adjustment ..................................................................................................................... 10 2.2.3 Cost Adjustment Term for Prescribed Generators.................................................................................................. 11 2.2.4 Cost Adjustment Term for Non-Utility Generators and Other Generation under Contract with the OEFC ........ 12 2.2.5 Cost Adjustment Term for Certain Renewable Generation Under Contract with the IESO ................................. 12 2.2.6 Cost Adjustment Term for Other Contracts with the IESO ................................................................................... 13 2.2.7 Estimate of the Global Adjustment ......................................................................................................................... 15 2.2.8 Cost Adjustment Term for IESO Variance Account .............................................................................................. 16
2.3 CORRECTING FOR THE BIAS TOWARDS UNFAVOURABLE VARIANCES ......................................................................... 16 2.4 TOTAL RPP SUPPLY COST ........................................................................................................................................... 16
3. CALCULATING THE RPP PRICE ................................................................................................................................. 18 3.1 TOU PRICES ................................................................................................................................................................ 18 3.2 TIERED PRICES ............................................................................................................................................................. 19
List of Figures & Tables List of Figures
Figure 1: Process Flow for Determining the RPP Price ............................................................................................................. 7 Figure 2: Components of the RPP Supply Cost ....................................................................................................................... 15
List of Tables
Table 1: Ontario Electricity Market Price Forecast ($ per MWh) ........................................................................................... 10 Table 2: Total Electricity Supply Cost ....................................................................................................................................... 17 Table 3: Average RPP Supply Cost Summary .......................................................................................................................... 17 Table 4: November 1, 2019 RPP Prices ...................................................................................................................................... 20

Introduction 6
1. Introduction Under amendments to the Ontario Energy Board Act, 1998 (Act) contained in the Electricity Restructuring Act, 2004, the Ontario Energy Board (OEB) was mandated to develop a regulated price plan (RPP) for electricity prices to be charged to consumers that have been designated by legislation and that have not opted to switch to a retailer or to be charged the hourly spot market price. The first prices were implemented under the RPP effective on April 1, 2005, as set out by the Ontario Government in regulation O. Reg. 95/05 (Classes of Consumers and Determination of Rates) made under the Act. This report covers the period from November 1, 2019 to October 31, 2020 (forecast period). RPP prices are reviewed by the OEB every six months to determine if they need to be adjusted.
The OEB has issued a Regulated Price Plan Manual (RPP Manual3) that explains how RPP prices are set. The OEB relies on a forecast of wholesale electricity market prices, prepared by Power Advisory LLC (Power Advisory), as a basic input into the forecast of RPP supply costs as per the RPP Manual methodology.
This report describes how the OEB has used the RPP Manual’s processes and methodologies to arrive at the RPP prices effective November 1, 2019.
This report consists of three chapters as follows:
o Chapter 1. Introduction
o Chapter 2. Calculating the RPP Supply Cost
o Chapter 3. Calculating RPP Prices
1.1 Associated Documents
Two documents are closely associated with this report:
o The RPP Manual describes the methodology for setting RPP prices; and,
o The Ontario Wholesale Electricity Market Price Forecast For the Period November 1, 2019 through April 30, 2021 (Market Price Forecast Report),4 prepared by Power Advisory, contains the Ontario wholesale electricity market price forecast and explains the material assumptions which lie behind the hourly price forecast. Those assumptions are not repeated in this Report.
1.2 Process for RPP Price Determinations
Figure 1 below illustrates the processes followed to calculate RPP prices for both consumers with conventional meters and those with eligible time-of-use (TOU) meters. This report is organized according to this basic process.
3 https://www.oeb.ca/OEB/_Documents/EB-2004-0205/RPP_Manual.pdf 4 https://www.oeb.ca/sites/default/files/rpp-wholesale-electricity-market-price-forecast-20191022.pdf

Introduction 7
Figure 1: Process Flow for Determining the RPP Price
Analysis for Time-of-Use
Prices
RPP Price for Eligible Time-of-Use Meters • Market Price Generation
• OPG Regulated Assets • NUGs • Contracted Renewables • Other Contracted Generation • CDM Costs
RPP Supply
Cost
RPP Basic Price
Determination
Analysis for Tiers
RPP Price for Conventional
Meters
Source: RPP Manual

Calculat ing the RPP Supply Cost 8
2. Calculating the RPP Supply Cost The RPP supply cost calculation formula is set out in Equation 1 below. To calculate the RPP supply cost for the forecast period requires forecast data for the variables in Equation 1. Most of the terms depend on more than one underlying data source or assumption. This chapter describes the data or assumption source for each of the terms and explains how the data were used to calculate the RPP supply cost. More detail on this methodology is provided in the RPP Manual.
It is important to remember that the elements of Equation 1 are forecasts. In some cases, the calculation uses actual historical values, but in these cases the historical values constitute the best available forecast.
2.1 Defining the RPP Supply Cost
Equation 1 below defines the RPP supply cost. This equation is further explained in the RPP Manual.
Equation 1
CRPP = M + α [(A – B) + (C – D) + (E – F) + G] + H, where
o CRPP is the total RPP supply cost;
o M is the amount that the RPP supply would have cost under the Market Rules;
o α is the RPP proportion of the total Global Adjustment costs;5
o A is the amount paid to prescribed generators in respect of the output of their prescribed generation facilities;6
o B is the amount those generators would have received under the Market Rules;
o C is the amount paid to the Ontario Electricity Finance Corporation (OEFC) with respect to its payments under contracts with non-utility generators (NUGs);
o D is the amount that would have been received under the Market Rules for electricity and ancillary services supplied by those NUGs;
5 The elements in square brackets collectively represent the Global Adjustment. For RPP price setting purposes the elements of the Global Adjustment are described differently in this Report than they are in O. Reg. 429/04 (Adjustments under Section 25.33 of the Act) made under the Electricity Act, 1998. “E” and “F” in the expression in square brackets include certain generation contracts that are associated with “G” in O. Reg. 429/04. This is necessary to ensure that there is no double-counting and thus over-recovery of generation costs because all RPP supply is included in “M”. The Global Adjustment formula in O. Reg. 429/04 also has a component (“H”) for amounts approved by the OEB under section 78.5 of the Act that are payable to distributors. These were amounts related to OEB-approved conservation and demand management programs under Ministerial directive. The last such program ended in 2014. As discussed below, the Global Adjustment is recovered through the RPP according to the allocation of the Global Adjustment between Class A and Class B consumers, and the RPP consumers’ share of Class B consumption. 6 As set out in regulation O. Reg. 53/05 (Payments under Section 78.1 of the Act) made under the Act, the OEB sets payment amounts for energy produced from Ontario Power Generation’s nuclear and certain hydro-electric generating stations (the prescribed assets). The OEB’s most recent Order setting hydroelectric payment amounts (EB-2018-0243) was issued on February 21, 2019. Nuclear payment amounts were approved as part of EB-2016-0152 effective January 1, 2017 and for each following year through to December 31, 2021. The Decision and Order on EB-2016-0152 was issued December 28, 2017 and the Payments Amount Order was issued March 29, 2018.

Calculat ing the RPP Supply Cost 9
o E is the amount paid to the Independent Electricity System Operator (IESO) with respect to its payments under certain contracts with renewable generators;
o F is the amount that would have been received under the Market Rules for electricity and ancillary services supplied by those renewable generators;
o G is the amount paid by the IESO for its other procurement contracts for generation or for demand response or Conservation and Demand Management (CDM); and
o H is the amount associated with the variance account held by the IESO, currently zero.
The forecast per unit RPP supply cost will be the total RPP supply cost (CRPP) divided by the total forecast RPP demand. RPP prices will be calculated based on that forecast per unit cost.
2.2 Computation of the RPP Supply Cost
Broadly speaking, the steps involved in forecasting the RPP supply cost are:
1. Forecast wholesale market prices;
2. Forecast the load shape for RPP consumers;
3. Forecast the quantities in Equation 1; and
4. Forecast RPP Supply Cost = Total of Equation 1.
In addition to the four steps listed above, the calculation of the total RPP supply cost requires a forecast of the stochastic adjustment, which is not included in Equation 1. The stochastic adjustment is included in the RPP Manual as an additional cost factor calculated outside of Equation 1.
Effective January 1, 2019, gas-fired generation in Ontario (among others) is subject to Part II of the federal Greenhouse Gas Pollution Pricing Act (Greenhouse Gas Act), which introduces an output-based pricing system (OBPS). Accordingly, this RPP forecast accounts for the impact of the OBPS over the forecast period. Participants in the OBPS are required to report and manage their own carbon-related compliance obligations, and have the following options to satisfy annual emissions that exceed their sector-based emission intensity benchmark: (i) pay the excess emissions charge; (ii) submit surplus credits issued by the federal government; or (iii) submit eligible offset credits. The Market Price Forecast Report assumes that gas-fired generators will satisfy their OBPS obligations by paying the excess emissions charge.
As more fully detailed in the Market Price Forecast Report, the forecast of wholesale market prices reflects the forecast of natural gas prices plus the excess emissions charges under the Greenhouse Gas Act ($20.00/tonne of CO2e in 2019 and $30.00/tonne of CO2e in 2020)7.
The following sections will describe each term or group of terms in Equation 1, the data used for forecasting them, and the computational methodology to produce each component of the RPP supply cost.
7 https://laws-lois.justice.gc.ca/eng/acts/G-11.55/page-43.html - h-76/
Calculat ing the RPP Supply Cost 10
2.2.1 Forecast Cost of Supply Under Market Rules
This section covers the first term of Equation 1:
CRPP = M + α [(A – B) + (C – D) + (E – F) + G] + H
The forecast cost of supply to RPP consumers under the Market Rules depends on two forecasts:
o The forecast of the simple average hourly Ontario electricity price (HOEP) in the IESO-administered market over all hours in each month of the year; and
o The forecast of the ratio of the load-weighted average market price paid by RPP consumers in each month to the simple average HOEP in that month.
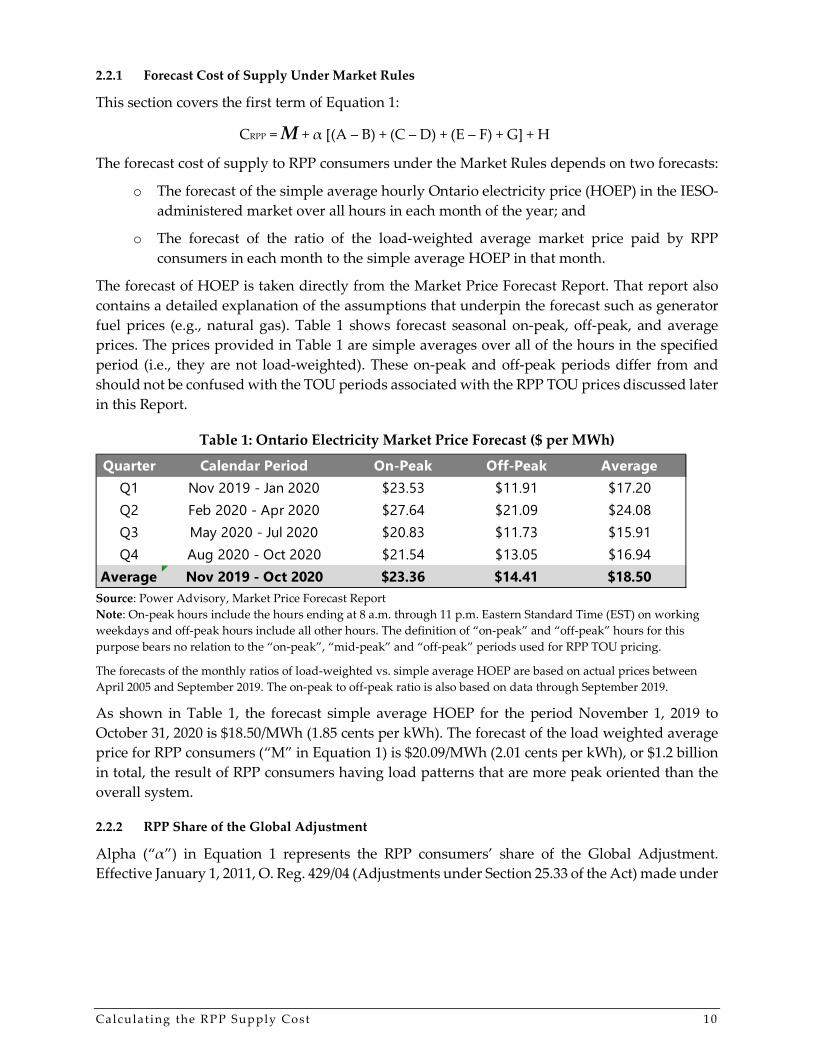
The forecast of HOEP is taken directly from the Market Price Forecast Report. That report also contains a detailed explanation of the assumptions that underpin the forecast such as generator fuel prices (e.g., natural gas). Table 1 shows forecast seasonal on-peak, off-peak, and average prices. The prices provided in Table 1 are simple averages over all of the hours in the specified period (i.e., they are not load-weighted). These on-peak and off-peak periods differ from and should not be confused with the TOU periods associated with the RPP TOU prices discussed later in this Report.
Table 1: Ontario Electricity Market Price Forecast ($ per MWh)
Source: Power Advisory, Market Price Forecast Report Note: On-peak hours include the hours ending at 8 a.m. through 11 p.m. Eastern Standard Time (EST) on working weekdays and off-peak hours include all other hours. The definition of “on-peak” and “off-peak” hours for this purpose bears no relation to the “on-peak”, “mid-peak” and “off-peak” periods used for RPP TOU pricing.
The forecasts of the monthly ratios of load-weighted vs. simple average HOEP are based on actual prices between April 2005 and September 2019. The on-peak to off-peak ratio is also based on data through September 2019.
As shown in Table 1, the forecast simple average HOEP for the period November 1, 2019 to October 31, 2020 is $18.50/MWh (1.85 cents per kWh). The forecast of the load weighted average price for RPP consumers (“M” in Equation 1) is $20.09/MWh (2.01 cents per kWh), or $1.2 billion in total, the result of RPP consumers having load patterns that are more peak oriented than the overall system.
2.2.2 RPP Share of the Global Adjustment
Alpha (“α”) in Equation 1 represents the RPP consumers’ share of the Global Adjustment. Effective January 1, 2011, O. Reg. 429/04 (Adjustments under Section 25.33 of the Act) made under
Quarter Calendar Period On-Peak Off-Peak Average
Q1 Nov 2019 - Jan 2020 $23.53 $11.91 $17.20
Q2 Feb 2020 - Apr 2020 $27.64 $21.09 $24.08
Q3 May 2020 - Jul 2020 $20.83 $11.73 $15.91
Q4 Aug 2020 - Oct 2020 $21.54 $13.05 $16.94
Average Nov 2019 - Oct 2020 $23.36 $14.41 $18.50

Calculat ing the RPP Supply Cost 11
the Electricity Act, 1998 was amended to revise how the Global Adjustment is allocated to two sets of consumers, Class A and Class B (which includes RPP consumers).8
The first step to determine alpha is to estimate Class A’s share of the Global Adjustment. Based on the formula and periods defined in O. Reg. 429/04, the Class A share decreased from 19.3% for the July 2018 to June 2019 period, to 17.7% for the July 2019 to June 2020 period9. This decrease was due to a decrease in the average load factor (the ratio of coincident peak demand to annual energy consumption) across all Class A customers. The decrease in load factor is likely primarily due to the fact that none of the Top 5 Peaks in the May 2018 to April 2019 Base Period occurred in the winter, whereas one of the Top 5 Peaks in the previous Base Period occurred in the winter. The Class A share of Global Adjustment charges is forecast to increase to 17.8% for the July 2020 to June 2021 period, taking into account the possibility that one or more of the Top 5 Peaks in the May 2019 to April 2020 Base Period could occur during the winter. On average, Class B’s share of the Global Adjustment is forecast to be 82.3% over the forecast period.
On June 14, 2019, the government of Ontario concluded its online consultation on the design and effectiveness of current industrial electricity pricing and programs.10 Changes resulting from this and other consultation activities on industrial electricity pricing could impact RPP supply costs in the future, and they will be reflected as appropriate in future RPP supply cost forecasts when such changes, if any, are known.
The next step is to estimate RPP consumers’ share of Class B consumption. Based on historical data on RPP consumption as a share of total Ontario consumption, it is forecast that RPP consumption will amount to approximately 60 TWh, or 61% of total Class B consumption. The RPP share varies with the seasons, ranging between 56% and 64% of Class B consumption. RPP consumers’ share of total monthly Global Adjustment charges is therefore forecast to range between 46% and 52%. Over the entire forecast period, the RPP consumers’ share of the Global Adjustment is forecast to be 50.4%. The value of α therefore 0.504.
2.2.3 Cost Adjustment Term for Prescribed Generators
This section covers the second term of Equation 1:
CRPP = M + α [(A – B) + (C – D) + (E – F) + G] + H
The prescribed generators are comprised of the rate-regulated nuclear and hydroelectric facilities of Ontario Power Generation (OPG) for which the OEB sets payment amounts. The payment amounts for OPG’s prescribed generation are $89.70/MWh in 2019 and $94.96/MWh in 2020 for
8 O. Reg. 429/04 defines two classes of consumers; Class A, comprised of consumers whose maximum hourly demand for electricity exceeds a specified threshold; and Class B consumers, comprised of all other consumers, including RPP consumers. The demand threshold for Class A eligibility has been reduced over time, most recently by amendments to O. Reg. 429/04 made in 2016 (O. Reg. 366/16) and 2017 (O. Reg. 107/17). 9 “Class A customers are assessed their portion of GA costs based on the percentage that their consumption contributes to the top five system coincident peaks during a predetermined base period (May 1-April 30) and will be charged their percentage of total GA costs through the next adjustment, or billing period (July 1-June 30).” (http://www.ieso.ca/en/Sector-Participants/Settlements/Global-Adjustment-and-Peak-Demand-Factor) 10 https://www.ontario.ca/page/consultation-industrial-electricity-prices

Calculat ing the RPP Supply Cost 12
nuclear generation, and $45.46/MWh in 2019 and $45.48/MWh11 in 2020 for hydroelectric generation. These payment amounts, which reflect both base payment amounts and rate riders, were set out in the following two OEB decisions: EB-2016-0152 and EB-2018-0243.
Quantity A was therefore forecast by multiplying payment amounts per MWh by the prescribed assets’ total forecast output per month in MWh.
Quantity B was forecast by estimating the market values of each MWh of nuclear and prescribed hydraulic generation, and multiplying those market values by the volume of nuclear and prescribed hydraulic generation. The value of A is $5.17 billion, and the value of B is $1.38 billion.
2.2.4 Cost Adjustment Term for Non-Utility Generators and Other Generation under Contract with the OEFC
This section describes the calculation of the third term of Equation 1:
CRPP = M + α [(A – B) + (C – D) + (E – F) + G] + H
Although the details of these payments (amounts by recipient, volumes, etc.) are not public, published information from the IESO about aggregate monthly payments to NUGs has been used as the basis for forecasting payments in future months. This forecast was used to compute an estimate of the total payments to the NUGs under their contracts, or amount C in Equation 1.
The amount that the NUGs would receive under the Market Rules, quantity D in Equation 1, is their hourly production times the hourly Ontario energy price. These quantities were forecast on a monthly basis, as an aggregate for the NUGs as a whole.
The value of “C” in Equation 1 (i.e., the contract cost of the NUGs) is estimated to be $0.17 billion, and the value of “D” (i.e., the market value of the NUG output) is estimated to be $0.03 billion.
2.2.5 Cost Adjustment Term for Certain Renewable Generation Under Contract with the IESO
This section describes the calculation of the fourth term of Equation 1:
CRPP = M + α [(A – B) + (C – D) + (E – F) + G] + H
Quantities E and F in the above formula refer to certain renewable generators paid by the IESO under contracts related to output. Generators in this category are renewable generators under the following contracts:
o Renewable Energy Supply (RES) Request for Proposals (RFP) Phases I, II and III;
o the Renewable Energy Standard Offer Program (RESOP);
o the Feed-In Tariff (FIT) Program;
o the Hydroelectric Standard Offer Program (HESOP);
o the Hydroelectric Energy Supply Agreements (HESA) directive, covering new and redeveloped hydro facilities;
11 The 2020 hydroelectric payment amount is comprised of riders approved in EB-2016-0152 and EB-2018-0243, and an estimated base payment amount. The 2020 hydroelectric base payment amount was estimated by escalating the approved 2019 base payment amount by 1.1%, the escalation approved for 2019 hydroelectric payment amounts in EB-2018-0243.

Calculat ing the RPP Supply Cost 13
o the Hydro Contract Initiative (HCI), covering existing hydro plants;
o the Energy from Waste program; and
o NUGs who are under contract with the IESO rather than OEFC.
Quantity E in Equation 1 is the forecast quantity of electricity supplied by these renewable generators times the fixed price they are paid under their contract with the IESO. The statistical model includes estimates of the fixed prices. In some cases, this is simply the announced contract price (e.g., $420/MWh for solar generation under RESOP). In others, the contract price needs to be adjusted in each year either partially or fully in proportion to inflation. In still others, detailed information on contract prices is not available, and they have been estimated based on publicly-available information (for example, the Ontario Government announced that the weighted average price for Renewable RFP I projects was $79.97/MWh, but did not announce prices for individual contracts).12
The size and generation type of the successful renewable energy projects to-date have been announced by the government of Ontario and the IESO. The forecast includes additional renewable capacity coming into service during the forecast period, and the monthly output of both existing and new plants, using either historical values of actual outputs (where available), or estimates based on the plants’ capacities and estimated capacity factors. The forecast also considers average market revenues for each plant or type of plant. Quantity F in Equation 1 is therefore the forecast output of the renewable generation multiplied by the forecast average market revenue (based on market prices in the Market Price Forecast Report) at the time that output is generated.
The value of “E” in Equation 1 (i.e., the contract cost of renewable generation) is estimated to be $4.97 billion, and the value of “F” (i.e., the market value of renewable generation) is estimated to be $0.45 billion.
2.2.6 Cost Adjustment Term for Other Contracts with the IESO
This section describes the calculation of the fifth term of Equation 1:
CRPP = M + α [(A – B) + (C – D) + (E – F) + G] + H
The costs for three types of resources under contract with the IESO are included in G:
1. Conventional generation (e.g., natural gas) whose payment relates to the generator’s capacity costs;
2. Conservation and demand management costs, and storage contracts; and
3. Bruce Power, which has an output-based contract for generation from its Bruce A and B nuclear facilities.
The contribution of conventional generation under contract to the IESO to quantity G relates to several contracts:
o Clean Energy Supply (CES) and other contracts, which include conventional gas generation contracts as well as one demand response contract;
12 For information related to the FIT Price Schedule, see the IESO’s dedicated web page at: http://www.ieso.ca/sector-participants/feed-in-tariff-program/overview

Calculat ing the RPP Supply Cost 14
o The “early mover”, “Accelerated CES” and “Northern York Region” contracts; and
o Contracts awarded for gas-fired projects classified as Combined Heat and Power (CHP) projects.
The costs of these generation contracts, for the purpose of calculating the RPP supply cost, are based on an estimate of the contingent support payments to be paid under the contract guidelines. The contingent support payment is the difference between the net revenue requirement (NRR) stipulated in the contracts and the “deemed” energy market revenues. The deemed energy market revenues were estimated based on the deemed dispatch logic as stipulated in the contract and the Market Price Forecast Report that underpins this report. The NRRs and other contract parameters for each contract have been estimated based on publicly available information. Examples include the average NRR for the CES contracts which was announced by the government of Ontario to be $7,900 per megawatt-month,13 as well as an NRR of $17,000 per megawatt-month for the cancelled Oakville Generating Station which has been used as a guideline for some of the more recent gas plant additions.
The cost of CDM initiatives delivered under contract with the IESO is also captured in term G of Equation 1. On March 21, 2019, the Conservation First Framework was discontinued by Ministerial directive, and replaced with a new Interim Framework effective April 1, 2019.14 Under the Interim Framework, which runs from April 1, 2019 to December 31, 2020, the IESO will centrally deliver a reduced portfolio of CDM programs. All local programs will be discontinued, although there will be an opportunity for electricity distributors to apply to the IESO for limited funding for cost-effective local programs. The forecast of CDM initiative costs for the forecast period reflects an estimate of the cost reduction implications of these changes.
In December 2015, the IESO negotiated an amended agreement with Bruce Power in relation to the refurbishment and continued operation of the Bruce Power nuclear units15. The amended contract stipulates that an initial price of $65.73/MWh would be paid for the output of Bruce A and B. The amended contract also stipulates that the initial price will be indexed to inflation every April 1, as well as adjusted periodically for asset management, waste fees, and refurbishments. For this forecast period, these revised contract terms have been applied for the output of Bruce A and B.
The IESO has a contract with OPG for the on-going operation of OPG’s Lennox Generating Station, a 2,140-MW gas-fired peaking plant. The cost of this contract is included in the “G” variable.
The value of “G” in Equation 1 (i.e., net cost of Bruce nuclear, gas, CDM costs and storage contracts) is estimated to be $4.37 billion.
13 The NRR for the “early movers” was assumed to be the same. 14 For information on the IESO’s CDM activities, see the IESO’s dedicated web page at: http://www.ieso.ca/Sector-Participants/Conservation-Delivery-and-Tools/Interim-Framework 15 In 2005, Bruce Power entered into an initial Bruce Power Refurbishment Implementation Agreement in relation to the operation of Bruce Units 1 and 2. In December 2015, the IESO and Bruce Power entered into an Amended and Restated Bruce Power Refurbishment Implementation Agreement.

Calculat ing the RPP Supply Cost 15
2.2.7 Estimate of the Global Adjustment
The total Global Adjustment is estimated to be $12.8 billion. The RPP share of this (i.e., α times the total cost) is estimated to be $6.5 billion, or $106.94/MWh (10.694 cents per kWh). This is the forecast of the average Global Adjustment cost per unit for RPP consumers over the period from November 1, 2019 to October 31, 2020.
The Global Adjustment represents the difference between the total contract cost of the various contracts it covers (for Bruce nuclear, gas plants, renewable generation, CDM, etc.) and the market value of contracted generation, as well as the difference between the payment amounts set for OPG’s prescribed generating assets and the market value of that generation. The Global Adjustment therefore changes for three reasons:
o changes (mostly increases) in the number and aggregate capacity of contracts or rate-regulated assets it covers;
o changes in regulated rates or inflation-based adjustments in contract rates; or
o fluctuations in the market revenues earned by contracted and prescribed generation.
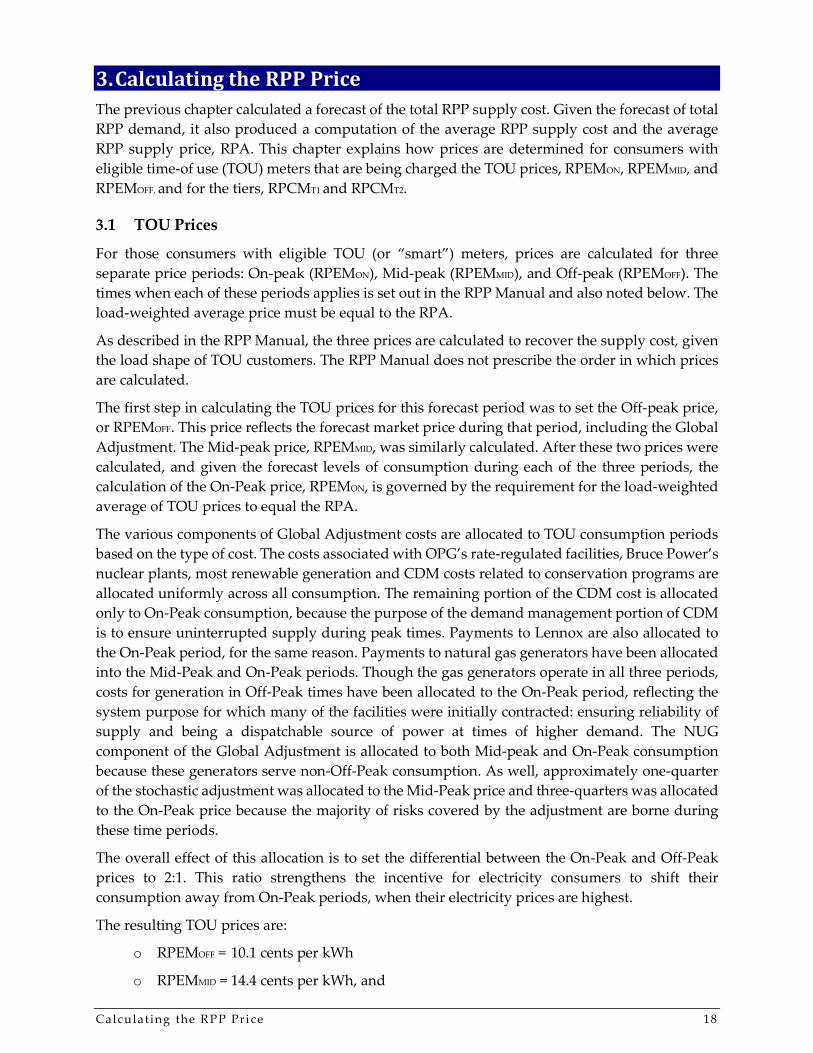
This is illustrated in Figure 2, which shows how the Global Adjustment is expected to change over the next 12 months.
Figure 2: Components of the RPP Supply Cost
Source: Power Advisory
Overall, per-MWh RPP supply costs have increased by 3.3% between this forecast period and the supply costs which were forecast for the May 2019 to April 2020 period, as set out in the OEB’s April 17, 2019 Regulated Price Plan Supply Cost Report: May 1, 2019 to April 30, 2020. A number of factors have contributed to this change including:
o Payment amounts for rate-regulated nuclear facilities and payments for contracted nuclear facilities have increased, primarily to cover the cost of refurbishment.
$0
$25
$50
$75
$100
$125
$150
Cost
to C
lass
B C
onsu
mer
s ($
/MW
h)
Global Adjustment
Market Cost
Supply Cost

Calculat ing the RPP Supply Cost 16
o New wind generation facilities are coming into service. Details on capacity additions during the forecast period are provided in the Market Price Forecast Report.
o Class B consumers’ share of Global Adjustment charges has increased slightly, as discussed above.
2.2.8 Cost Adjustment Term for IESO Variance Account
This section describes the calculation of the sixth term of Equation 1:
CRPP = M + α [(A – B) + (C – D) + (E – F) + G] + H
Previously, the calculation of RPP supply cost included variable H which represented the variance between RPP revenue and actual costs of RPP supply as reported by the IESO. The IESO has not tracked this variance since RPP prices started to be set under the Ontario Fair Hydro Plan Act, 2017. Consequently, the OEB has again adopted a value of $0.00 for H. Adjustments related to the IESO’s RPP-related variance account will be considered when the OEB next sets RPP prices.
2.3 Correcting for the Bias Towards Unfavourable Variances
The supply costs discussed in section 2.2 are based on “most likely” forecasts of demand, HOEP, gas prices, generator operations, and other factors. However, none of these factors can be predicted with absolute certainty. Calculating the total RPP supply cost therefore needs to take into account the fact that volatility exists amongst the forecast parameters, and that there is a slightly greater likelihood of negative or unfavourable variances than favourable variances. For example, because nuclear generation plants tend to operate at capacity factors between 80% and 90%, these facilities are more likely to supply less energy than forecast (due to unscheduled outages) than to supply more than forecast (i.e., there is 10-20% upside versus 80-90% downside on the generator output). Similarly, during unexpectedly cold or hot weather, prices tend to be higher than expected as does RPP consumers’ demand for electricity. The net result is that it is more likely that RPP supply costs will exceed the forecast than fall below it, unless there is a minor adjustment to reflect the greater likelihood of unfavourable variances.
The Adjustment to Address Bias Towards Unfavourable Variance is set at $1.00/MWh (0.100 cents per kWh). This amount is included in the RPP supply cost.
2.4 Total RPP Supply Cost
Table 2 shows the percentage of Ontario’s total electricity supply attributable to various generation sources, the percentage of forecasted Global Adjustment costs for each type of generation and the total unit costs. Total unit costs are based on contracted costs or regulated payment amounts for each generation type, including Global Adjustment payments and market price payments, where applicable.

Calculat ing the RPP Supply Cost 17
Table 2: Total Electricity Supply Cost
% of Total % of Total Total Unit Cost Supply GA (cents/kWh) Nuclear 53% 45% 8.7¢ Hydro 25% 13% 6.3¢ Gas 10% 12% 11.8¢ Wind 9% 15% 14.7¢ Solar 2% 13% 47.9¢ Bioenergy 1% 2% 26.8¢
Source: Power Advisory NB: Percentage (%) of Total Global Adjustment excludes CDM costs.
The total RPP supply cost is estimated to be $7.7 billion.
The following table itemizes the various steps discussed above to arrive at an average RPP supply cost of $128.03/MWh. This average supply cost corresponds to an average RPP price, which is referred to as RPA, of 12.80 cents per kWh.
Table 3: Average RPP Supply Cost Summary
Source: Power Advisory
RPP Supply Cost Summaryfor the period from November 1, 2019 through October 31, 2020 $/MWh
Forecast Wholesale Electricity Price - Simple Average $18.50Load-Weighted Costs for RPP Consumers
Wholesale Electricity Cost - RPP-Weighted $20.09Global Adjustment + $106.94Adjustment to Address Bias Towards Unfavourable Variance + $1.00
Average Supply Cost for RPP Consumers = $128.03
Calculat ing the RPP Pr i ce 18
3. Calculating the RPP Price The previous chapter calculated a forecast of the total RPP supply cost. Given the forecast of total RPP demand, it also produced a computation of the average RPP supply cost and the average RPP supply price, RPA. This chapter explains how prices are determined for consumers with eligible time-of use (TOU) meters that are being charged the TOU prices, RPEMON, RPEMMID, and RPEMOFF, and for the tiers, RPCMT1 and RPCMT2.
3.1 TOU Prices
For those consumers with eligible TOU (or “smart”) meters, prices are calculated for three separate price periods: On-peak (RPEMON), Mid-peak (RPEMMID), and Off-peak (RPEMOFF). The times when each of these periods applies is set out in the RPP Manual and also noted below. The load-weighted average price must be equal to the RPA.
As described in the RPP Manual, the three prices are calculated to recover the supply cost, given the load shape of TOU customers. The RPP Manual does not prescribe the order in which prices are calculated.
The first step in calculating the TOU prices for this forecast period was to set the Off-peak price, or RPEMOFF. This price reflects the forecast market price during that period, including the Global Adjustment. The Mid-peak price, RPEMMID, was similarly calculated. After these two prices were calculated, and given the forecast levels of consumption during each of the three periods, the calculation of the On-Peak price, RPEMON, is governed by the requirement for the load-weighted average of TOU prices to equal the RPA.
The various components of Global Adjustment costs are allocated to TOU consumption periods based on the type of cost. The costs associated with OPG’s rate-regulated facilities, Bruce Power’s nuclear plants, most renewable generation and CDM costs related to conservation programs are allocated uniformly across all consumption. The remaining portion of the CDM cost is allocated only to On-Peak consumption, because the purpose of the demand management portion of CDM is to ensure uninterrupted supply during peak times. Payments to Lennox are also allocated to the On-Peak period, for the same reason. Payments to natural gas generators have been allocated into the Mid-Peak and On-Peak periods. Though the gas generators operate in all three periods, costs for generation in Off-Peak times have been allocated to the On-Peak period, reflecting the system purpose for which many of the facilities were initially contracted: ensuring reliability of supply and being a dispatchable source of power at times of higher demand. The NUG component of the Global Adjustment is allocated to both Mid-peak and On-Peak consumption because these generators serve non-Off-Peak consumption. As well, approximately one-quarter of the stochastic adjustment was allocated to the Mid-Peak price and three-quarters was allocated to the On-Peak price because the majority of risks covered by the adjustment are borne during these time periods.
The overall effect of this allocation is to set the differential between the On-Peak and Off-Peak prices to 2:1. This ratio strengthens the incentive for electricity consumers to shift their consumption away from On-Peak periods, when their electricity prices are highest.
The resulting TOU prices are:
o RPEMOFF = 10.1 cents per kWh
o RPEMMID = 14.4 cents per kWh, and

Calculat ing the RPP Pr i ce 19
RPEMON = 20.8 cents per kWh.
These prices reflect the seasonal change in the TOU pricing periods which will take effect on November 1, 2019 and May 1, 2020. As defined in the RPP Manual, the time periods for TOU price application are as follows:
o Off-Peak period (priced at RPEMOFF):
Winter and summer weekdays: 7 p.m. to midnight and midnight to 7 a.m.
Winter and summer weekends and holidays16: 24 hours (all day)
o Mid-Peak period (priced at RPEMMID)
Winter weekdays (November 1 to April 30): 11 a.m. to 5 p.m.
Summer weekdays (May 1 to October 31): 7 a.m. to 11 a.m. and 5 p.m. to 7 p.m.
o On-Peak period (priced at RPEMON)
Winter weekdays: 7 a.m. to 11 a.m. and 5 p.m. to 7p.m.
Summer weekdays: 11 a.m. to 5 p.m.
The above times are given in local time (i.e., the times given reflect daylight savings time in the summer).
The load profile assumed for TOU consumers is different from the load profile for non-TOU RPP consumers. RPP prices are calculated so that a TOU consumer with an average TOU load profile would pay the same average price as an RPP consumer that pays the tiered prices with a typical (non-TOU) load profile. This average price is equal to the RPA.
3.2 Tiered Prices
The final step is to calculate tiered prices. There is a two-tiered pricing structure: RPCMT1 (the price for consumption at or below the tier threshold) and RPCMT2 (the price for consumption above the tier threshold). The tier threshold is an amount of consumption per month.
The tiered prices are calculated so that the average per unit revenue would be equal to the RPA. This is achieved by maintaining the ratio between the original upper and lower tier prices (i.e., the ratio between 4.7 and 5.5 cents per kWh) and forecasting consumption above and below the threshold in each month of the forecast period.
RPP tiered prices are calculated such that the weighted average price will come as close as possible to the RPA, based on the forecast ratio of Tier 1 to Tier 2 consumption, and maintaining a 15-17% difference between Tier 1 and Tier 2 prices.
The resulting tiered prices are:
o RPCMT1 = 11.9 cents per kWh; and,
o RPCMT2 = 13.9 cents per kWh.
16 For the purpose of RPP TOU pricing, a “holiday” means the following days: New Year’s Day, Family Day, Good Friday, Christmas Day, Boxing Day, Victoria Day, Canada Day, Labour Day, Thanksgiving Day, and the Civic Holiday. When any holiday falls on a weekend (Saturday or Sunday), the next weekday following (that is not also a holiday) is to be treated as the holiday for RPP TOU pricing purposes.
Calculat ing the RPP Pr i ce 20
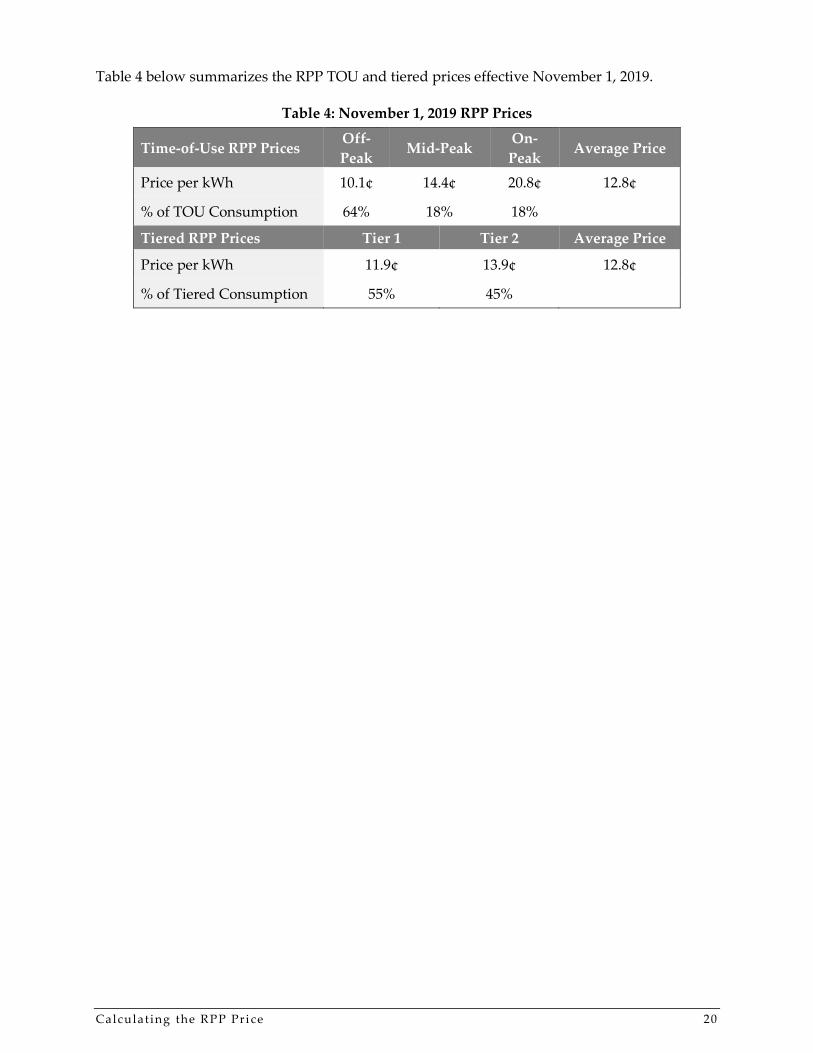
Table 4 below summarizes the RPP TOU and tiered prices effective November 1, 2019.
Table 4: November 1, 2019 RPP Prices
Time-of-Use RPP Prices Off-Peak Mid-Peak On-
Peak Average Price
Price per kWh 10.1¢ 14.4¢ 20.8¢ 12.8¢
% of TOU Consumption 64% 18% 18%
Tiered RPP Prices Tier 1 Tier 2 Average Price
Price per kWh 11.9¢ 13.9¢ 12.8¢
% of Tiered Consumption 55% 45%