Embed Size (px)
Citation preview

RTO Information
This report presents summary information about the Registered Training Organisation
Name Jetset Training College
Street AddressLevel 6,461 Bourke St
City/town/suburb Melbourne
State VIC
Post code 3000
NTIS number 20864

Summary ReportThe Summary Report provides information about the RTO and a snapshot of results for the scales measured by theLearner Questionnaire (LQ) and Employer Questionnaire (EQ).
For each scale, the Summary Report presents information about the:
count of responses used to calculate the scale score;average scale score; andvariation in scale scores.
Scores are reported on the response scale of 0 to 100, where 0 means 'strongly disagree' and 100 means 'stronglyagree'.
Results are provided for learners and/or employers depending on the data entered into SMART.
This Summary Report can be used to analyse the number, average and variation of the survey responses.Comparisons can be made across scales, to previous reports, or between learners and employers.
Summary statistics
Learners Employers
Scale Responsecount
Averagescore
Averagevariation
Responsecount
Averagescore
Averagevariation
Trainer Quality 61 92.2 11.0
Effective Assessment 61 90.2 12.8
Clear Expectations 61 90.0 13.4
Learning Stimulation 61 90.5 14.0
Training Relevance 61 91.8 11.1
Competency Development 61 90.9 11.7
Training Resources 61 90.7 12.5
Effective Support 61 91.6 12.8
Active Learning 61 84.4 14.2
Overall Satisfaction 61 95.1 10.4

Respondent ReportThe Respondent Report provides summary information about learner demographics and training characteristics.
For each characteristic, the Respondent Report presents the:
number of learners/employers in the population;number of survey respondents; andpercentage of respondents.
Results are provided for learners and/or employers depending on the data entered into SMART.
This Respondent Report can be used to analyse the distribution of survey respondents across the RTO learnerand/or employer population. It provides information on the representativeness and hence generalisability of thesurvey responses.

Characteristic
Learners Employers
Populationcount
Respondentcount
Responseper cent
Populationcount
Respondentcount
Responseper cent
Field ofeducation
Natural and physicalsciences
0 0 0.0
Informationtechnology
0 0 0.0
Engineering andrelated technologies
0 0 0.0
Architecture andbuilding
0 0 0.0
Agriculture,environmental andrelated studies
0 0 0.0
Health 0 0 0.0
Education 0 0 0.0
Management andcommerce
0 0 0.0
Society and culture 0 0 0.0
Creative arts 0 0 0.0
Food, hospitalityand personalservices
0 0 0.0
Other 195 58 29.7
TOTAL 195 58 29.7 0 0 0.0
Qualificationlevel
Certificate I 0 0 0.0
Certificate II 0 0 0.0
Certificate III 0 0 0.0
Certificate IV 195 58 29.7
Certificate levelunknown
0 0 0.0
Diploma 0 0 0.0
Advanced diploma 0 0 0.0
Associate degree 0 0 0.0
Degree 0 0 0.0
Short course orstatement ofattainment
0 0 0.0
VET GraduateCertificate orDiploma
0 0 0.0
Other qualificationor training
0 0 0.0
Do not know 0 0 0.0
Total 195 58 29.7

Item ReportThe Item Report presents information about learner and employer responses to individual items on the LearnerQuestionnaire (LQ) and/or Employer Questionnaire (EQ).
For each item, the Item Report presents information on the:
number of valid responses to each response category 'strongly disagree' (SD), 'disagree' (D), 'agree' (A),'strongly agree' (SA), the number of 'agreement' (AG) responses, and the number of missing (MI)responses;percentage of valid responses to each response category 'strongly disagree' (SD), 'disagree' (D), 'agree' (A),'strongly agree' (SA), the number of 'agreement' (AG) responses, and the number of missing (MI)responses;average score; andvariation in scores.
Scores are reported on the response scale of 0 to 100, where 0 means 'strongly disagree' and 100 means 'stronglyagree'.
Results are provided for learners and/or employers depending on the data entered into SMART.
This Item Report can be used to analyse feedback on phenomenon measured by each LQ and/or EQ item. Itprovides detailed information that can be used to address specific aaspects of education and training.

LQ response category numbers
Item SD D A SA AG MI
LQ1 Trainers encouraged learners to ask questions. 0 0 13 48 61 0
LQ2 Trainers made the subject as interesting as possible. 0 0 13 48 61 0
LQ3 Trainers had an excellent knowledge of the subject content. 0 0 13 48 61 0
LQ4 Trainers explained things clearly. 0 0 18 43 61 0
LQ5 Overall, I am satisfied with the training. 0 0 8 53 61 0
LQ6 I would recommend the training to others. 0 0 12 49 61 0
LQ7 I would recommend the training organisation to others. 0 0 7 54 61 0
LQ8 I received useful feedback on my assessments. 0 5 16 40 56 0
LQ9 Assessments were based on realistic activities. 0 2 15 44 59 0
LQ10 The way I was assessed was a fair test of my skills and knowledge. 0 0 15 46 61 0
LQ11 The training organisation gave appropriate recognition of existingknowledge and skills.
0 0 12 49 61 0
LQ12 It was always easy to know the standards expected. 0 1 18 42 60 0
LQ13 I usually had a clear idea of what was expected of me. 0 0 18 43 61 0
LQ14 Trainers made it clear right from the start what they expected from me. 0 0 17 43 60 1
LQ15 I was given enough material to keep up my interest. 0 1 12 48 60 0
LQ16 The amount of work I had to do was reasonable. 0 0 19 42 61 0
LQ17 The training was at the right level of difficulty for me. 0 3 13 45 58 0
LQ18 The training focused on relevant skills. 0 0 12 49 61 0
LQ19 The training prepared me well for work. 0 0 16 45 61 0
LQ20 The training had a good mix of theory and practice. 0 0 17 44 61 0
LQ21 I developed the skills expected from this training. 0 0 13 48 61 0
LQ22 I learned to work with people. 0 1 16 44 60 0
LQ23 I identified ways to build on my current knowledge and skills. 0 0 15 46 61 0
LQ24 I developed the knowledge expected from this training. 0 0 14 47 61 0
LQ25 I learned to plan and manage my work. 0 1 21 39 60 0
LQ26 Training resources were available when I needed them. 0 0 16 45 61 0
LQ27 The training used up-to-date equipment, facilities and materials. 0 0 20 41 61 0
LQ28 Training facilities and materials were in good condition. 0 0 15 46 61 0
LQ29 Training organisation staff respected my background and needs. 0 0 14 47 61 0
LQ30 The training was flexible enough to meet my needs. 0 0 12 49 61 0
LQ31 The training organisation had a range of services to support learners. 0 2 16 43 59 0
LQ32 I set high standards for myself in this training. 0 1 27 33 60 0
LQ33 I pushed myself to understand things I found confusing. 0 1 19 41 60 0
LQ34 I looked for my own resources to help me learn. 0 10 26 25 51 0
LQ35 I approached trainers if I needed help. 0 1 16 44 60 0

LQ response category percentages
Item SD D A SA AG MI
LQ1 Trainers encouraged learners to ask questions. 0.0 0.0 21.3 78.7 100.0 0.0
LQ2 Trainers made the subject as interesting as possible. 0.0 0.0 21.3 78.7 100.0 0.0
LQ3 Trainers had an excellent knowledge of the subject content. 0.0 0.0 21.3 78.7 100.0 0.0
LQ4 Trainers explained things clearly. 0.0 0.0 29.5 70.5 100.0 0.0
LQ5 Overall, I am satisfied with the training. 0.0 0.0 13.1 86.9 100.0 0.0
LQ6 I would recommend the training to others. 0.0 0.0 19.7 80.3 100.0 0.0
LQ7 I would recommend the training organisation to others. 0.0 0.0 11.5 88.5 100.0 0.0
LQ8 I received useful feedback on my assessments. 0.0 8.2 26.2 65.6 91.8 0.0
LQ9 Assessments were based on realistic activities. 0.0 3.3 24.6 72.1 96.7 0.0
LQ10 The way I was assessed was a fair test of my skills and knowledge. 0.0 0.0 24.6 75.4 100.0 0.0
LQ11 The training organisation gave appropriate recognition of existingknowledge and skills.
0.0 0.0 19.7 80.3 100.0 0.0
LQ12 It was always easy to know the standards expected. 0.0 1.6 29.5 68.9 98.4 0.0
LQ13 I usually had a clear idea of what was expected of me. 0.0 0.0 29.5 70.5 100.0 0.0
LQ14 Trainers made it clear right from the start what they expected from me. 0.0 0.0 28.3 71.7 100.0 1.6
LQ15 I was given enough material to keep up my interest. 0.0 1.6 19.7 78.7 98.4 0.0
LQ16 The amount of work I had to do was reasonable. 0.0 0.0 31.2 68.9 100.0 0.0
LQ17 The training was at the right level of difficulty for me. 0.0 4.9 21.3 73.8 95.1 0.0
LQ18 The training focused on relevant skills. 0.0 0.0 19.7 80.3 100.0 0.0
LQ19 The training prepared me well for work. 0.0 0.0 26.2 73.8 100.0 0.0
LQ20 The training had a good mix of theory and practice. 0.0 0.0 27.9 72.1 100.0 0.0
LQ21 I developed the skills expected from this training. 0.0 0.0 21.3 78.7 100.0 0.0
LQ22 I learned to work with people. 0.0 1.6 26.2 72.1 98.4 0.0
LQ23 I identified ways to build on my current knowledge and skills. 0.0 0.0 24.6 75.4 100.0 0.0
LQ24 I developed the knowledge expected from this training. 0.0 0.0 23.0 77.1 100.0 0.0
LQ25 I learned to plan and manage my work. 0.0 1.6 34.4 63.9 98.4 0.0
LQ26 Training resources were available when I needed them. 0.0 0.0 26.2 73.8 100.0 0.0
LQ27 The training used up-to-date equipment, facilities and materials. 0.0 0.0 32.8 67.2 100.0 0.0
LQ28 Training facilities and materials were in good condition. 0.0 0.0 24.6 75.4 100.0 0.0
LQ29 Training organisation staff respected my background and needs. 0.0 0.0 23.0 77.1 100.0 0.0
LQ30 The training was flexible enough to meet my needs. 0.0 0.0 19.7 80.3 100.0 0.0
LQ31 The training organisation had a range of services to support learners. 0.0 3.3 26.2 70.5 96.7 0.0
LQ32 I set high standards for myself in this training. 0.0 1.6 44.3 54.1 98.4 0.0
LQ33 I pushed myself to understand things I found confusing. 0.0 1.6 31.2 67.2 98.4 0.0
LQ34 I looked for my own resources to help me learn. 0.0 16.4 42.6 41.0 83.6 0.0
LQ35 I approached trainers if I needed help. 0.0 1.6 26.2 72.1 98.4 0.0

LQ item averages and variations
Item Averagescore
Averagevariation
LQ1 Trainers encouraged learners to ask questions. 92.9 13.8
LQ2 Trainers made the subject as interesting as possible. 92.9 13.8
LQ3 Trainers had an excellent knowledge of the subject content. 92.9 13.8
LQ4 Trainers explained things clearly. 90.2 15.3
LQ5 Overall, I am satisfied with the training. 95.6 11.3
LQ6 I would recommend the training to others. 93.4 13.4
LQ7 I would recommend the training organisation to others. 96.2 10.7
LQ8 I received useful feedback on my assessments. 85.8 21.5
LQ9 Assessments were based on realistic activities. 89.6 17.8
LQ10 The way I was assessed was a fair test of my skills and knowledge. 91.8 14.5
LQ11 The training organisation gave appropriate recognition of existing knowledge and skills. 93.4 13.4
LQ12 It was always easy to know the standards expected. 89.1 16.9
LQ13 I usually had a clear idea of what was expected of me. 90.2 15.3
LQ14 Trainers made it clear right from the start what they expected from me. 90.6 15.1
LQ15 I was given enough material to keep up my interest. 92.3 15.4
LQ16 The amount of work I had to do was reasonable. 89.6 15.6
LQ17 The training was at the right level of difficulty for me. 89.6 18.8
LQ18 The training focused on relevant skills. 93.4 13.4
LQ19 The training prepared me well for work. 91.3 14.8
LQ20 The training had a good mix of theory and practice. 90.7 15.1
LQ21 I developed the skills expected from this training. 92.9 13.8
LQ22 I learned to work with people. 90.2 16.5
LQ23 I identified ways to build on my current knowledge and skills. 91.8 14.5
LQ24 I developed the knowledge expected from this training. 92.3 14.1
LQ25 I learned to plan and manage my work. 87.4 17.4
LQ26 Training resources were available when I needed them. 91.3 14.8
LQ27 The training used up-to-date equipment, facilities and materials. 89.1 15.8
LQ28 Training facilities and materials were in good condition. 91.8 14.5
LQ29 Training organisation staff respected my background and needs. 92.3 14.1
LQ30 The training was flexible enough to meet my needs. 93.4 13.4
LQ31 The training organisation had a range of services to support learners. 89.1 18.0
LQ32 I set high standards for myself in this training. 84.2 17.9
LQ33 I pushed myself to understand things I found confusing. 88.5 17.1
LQ34 I looked for my own resources to help me learn. 74.9 24.1
LQ35 I approached trainers if I needed help. 90.2 16.5

EQ response category numbers
Item SD D A SA AG MI
EQ1 The training used up-to-date equipment, facilities and materials. 0 0 0 0 0 0
EQ2 The training organisation dealt satisfactorily with any issues or complaints. 0 0 0 0 0 0
EQ3 The training organisation was flexible enough to meet our needs. 0 0 0 0 0 0
EQ4 Assessment was at an appropriate standard. 0 0 0 0 0 0
EQ5 The training resources were appropriate for learner needs. 0 0 0 0 0 0
EQ6 The training reflected current practice. 0 0 0 0 0 0
EQ7 The training organisation developed customised programs. 0 0 0 0 0 0
EQ8 The training organisation provided good support for workplace trainingand assessment.
0 0 0 0 0 0
EQ9 The training focused on relevant skills. 0 0 0 0 0 0
EQ10 Our employees gained the skills they needed from this training. 0 0 0 0 0 0
EQ11 The training was effectively integrated into our organisation. 0 0 0 0 0 0
EQ12 Overall, we are satisfied with the training. 0 0 0 0 0 0
EQ13 We would recommend the training organisation to others. 0 0 0 0 0 0
EQ14 We would recommend the training to others. 0 0 0 0 0 0
EQ15 The training organisation gave appropriate recognition of existingknowledge and skills.
0 0 0 0 0 0
EQ16 The way employees were assessed was a fair test of their skills andknowledge.
0 0 0 0 0 0
EQ17 Trainers had good knowledge and experience of the industry. 0 0 0 0 0 0
EQ18 Assessments were based on realistic activities. 0 0 0 0 0 0
EQ19 Trainers were effective in their teaching. 0 0 0 0 0 0
EQ20 The training was an effective investment. 0 0 0 0 0 0
EQ21 Trainers were able to relate material to the workplace. 0 0 0 0 0 0
EQ22 The training had a good mix of theory and practice. 0 0 0 0 0 0
EQ23 The training organisation acted on feedback from employers. 0 0 0 0 0 0
EQ24 The training has helped our employees work with people. 0 0 0 0 0 0
EQ25 Training resources and equipment were in good condition. 0 0 0 0 0 0
EQ26 The training helped employees identify how to build on their currentknowledge and skills.
0 0 0 0 0 0
EQ27 The training prepared employees well for work. 0 0 0 0 0 0
EQ28 Our employees gained the knowledge they needed from this training. 0 0 0 0 0 0
EQ29 The training prepared our employees for the demands of work. 0 0 0 0 0 0
EQ30 The training organisation clearly explained what was expected fromemployers.
0 0 0 0 0 0

EQ response category percentages
Item SD D A SA AG MI
EQ1 The training used up-to-date equipment, facilities and materials. 0 0 0 0 0 0
EQ2 The training organisation dealt satisfactorily with any issues or complaints. 0 0 0 0 0 0
EQ3 The training organisation was flexible enough to meet our needs. 0 0 0 0 0 0
EQ4 Assessment was at an appropriate standard. 0 0 0 0 0 0
EQ5 The training resources were appropriate for learner needs. 0 0 0 0 0 0
EQ6 The training reflected current practice. 0 0 0 0 0 0
EQ7 The training organisation developed customised programs. 0 0 0 0 0 0
EQ8 The training organisation provided good support for workplace trainingand assessment.
0 0 0 0 0 0
EQ9 The training focused on relevant skills. 0 0 0 0 0 0
EQ10 Our employees gained the skills they needed from this training. 0 0 0 0 0 0
EQ11 The training was effectively integrated into our organisation. 0 0 0 0 0 0
EQ12 Overall, we are satisfied with the training. 0 0 0 0 0 0
EQ13 We would recommend the training organisation to others. 0 0 0 0 0 0
EQ14 We would recommend the training to others. 0 0 0 0 0 0
EQ15 The training organisation gave appropriate recognition of existingknowledge and skills.
0 0 0 0 0 0
EQ16 The way employees were assessed was a fair test of their skills andknowledge.
0 0 0 0 0 0
EQ17 Trainers had good knowledge and experience of the industry. 0 0 0 0 0 0
EQ18 Assessments were based on realistic activities. 0 0 0 0 0 0
EQ19 Trainers were effective in their teaching. 0 0 0 0 0 0
EQ20 The training was an effective investment. 0 0 0 0 0 0
EQ21 Trainers were able to relate material to the workplace. 0 0 0 0 0 0
EQ22 The training had a good mix of theory and practice. 0 0 0 0 0 0
EQ23 The training organisation acted on feedback from employers. 0 0 0 0 0 0
EQ24 The training has helped our employees work with people. 0 0 0 0 0 0
EQ25 Training resources and equipment were in good condition. 0 0 0 0 0 0
EQ26 The training helped employees identify how to build on their currentknowledge and skills.
0 0 0 0 0 0
EQ27 The training prepared employees well for work. 0 0 0 0 0 0
EQ28 Our employees gained the knowledge they needed from this training. 0 0 0 0 0 0
EQ29 The training prepared our employees for the demands of work. 0 0 0 0 0 0
EQ30 The training organisation clearly explained what was expected fromemployers.
0 0 0 0 0 0

EQ item averages and variations
Item Averagescore
Averagevariation
EQ1 The training used up-to-date equipment, facilities and materials.
EQ2 The training organisation dealt satisfactorily with any issues or complaints.
EQ3 The training organisation was flexible enough to meet our needs.
EQ4 Assessment was at an appropriate standard.
EQ5 The training resources were appropriate for learner needs.
EQ6 The training reflected current practice.
EQ7 The training organisation developed customised programs.
EQ8 The training organisation provided good support for workplace training and assessment.
EQ9 The training focused on relevant skills.
EQ10 Our employees gained the skills they needed from this training.
EQ11 The training was effectively integrated into our organisation.
EQ12 Overall, we are satisfied with the training.
EQ13 We would recommend the training organisation to others.
EQ14 We would recommend the training to others.
EQ15 The training organisation gave appropriate recognition of existing knowledge and skills.
EQ16 The way employees were assessed was a fair test of their skills and knowledge.
EQ17 Trainers had good knowledge and experience of the industry.
EQ18 Assessments were based on realistic activities.
EQ19 Trainers were effective in their teaching.
EQ20 The training was an effective investment.
EQ21 Trainers were able to relate material to the workplace.
EQ22 The training had a good mix of theory and practice.
EQ23 The training organisation acted on feedback from employers.
EQ24 The training has helped our employees work with people.
EQ25 Training resources and equipment were in good condition.
EQ26 The training helped employees identify how to build on their current knowledge andskills.
EQ27 The training prepared employees well for work.
EQ28 Our employees gained the knowledge they needed from this training.
EQ29 The training prepared our employees for the demands of work.
EQ30 The training organisation clearly explained what was expected from employers.
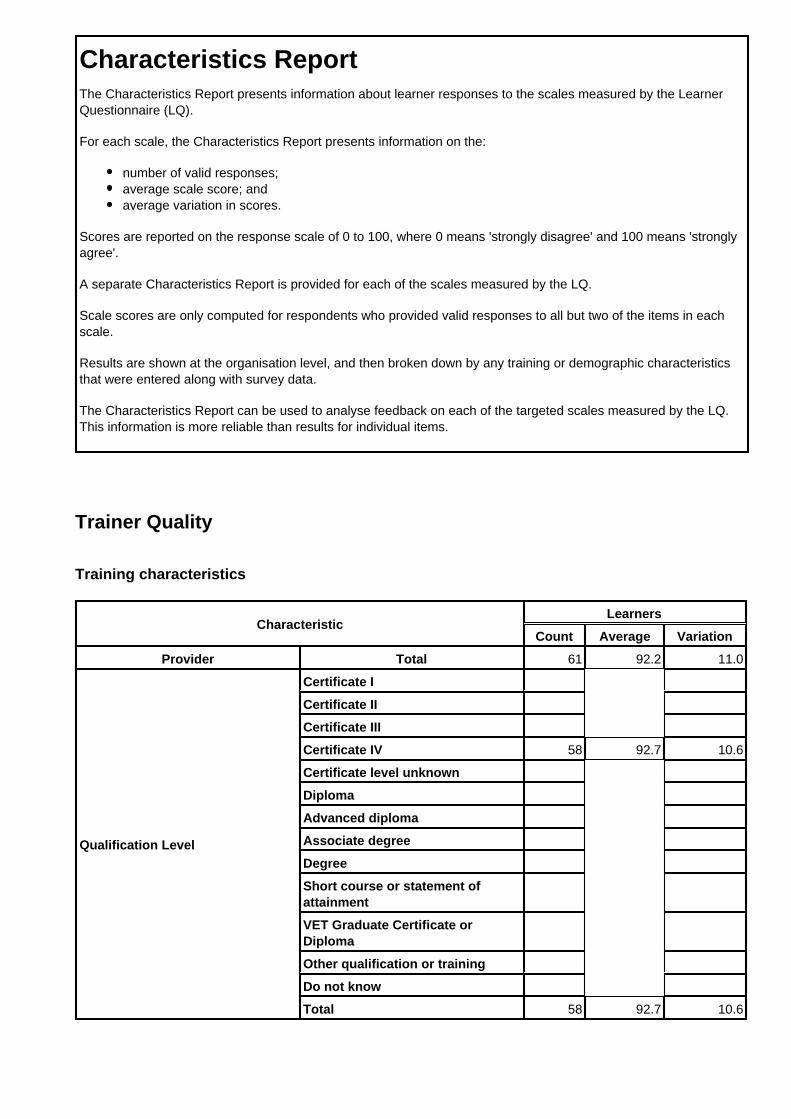
Characteristics ReportThe Characteristics Report presents information about learner responses to the scales measured by the LearnerQuestionnaire (LQ).
For each scale, the Characteristics Report presents information on the:
number of valid responses;average scale score; andaverage variation in scores.
Scores are reported on the response scale of 0 to 100, where 0 means 'strongly disagree' and 100 means 'stronglyagree'.
A separate Characteristics Report is provided for each of the scales measured by the LQ.
Scale scores are only computed for respondents who provided valid responses to all but two of the items in eachscale.
Results are shown at the organisation level, and then broken down by any training or demographic characteristicsthat were entered along with survey data.
The Characteristics Report can be used to analyse feedback on each of the targeted scales measured by the LQ.This information is more reliable than results for individual items.
Trainer Quality
Training characteristics
CharacteristicLearners
Count Average Variation
Provider Total 61 92.2 11.0
Qualification Level
Certificate I
Certificate II
Certificate III
Certificate IV 58 92.7 10.6
Certificate level unknown
Diploma
Advanced diploma
Associate degree
Degree
Short course or statement ofattainment
VET Graduate Certificate orDiploma
Other qualification or training
Do not know
Total 58 92.7 10.6

CharacteristicLearners
Count Average Variation
Provider Total 61 92.2 11.0
Field of education
Natural and physical sciences
Information technology
Engineering and relatedtechnologies
Architecture and building
Agriculture, environmental andrelated studies
Health
Education
Management and commerce
Society and culture
Creative arts
Food, hospitality and personalservices
Other 58 92.7 10.6
Total 58 92.7 10.6

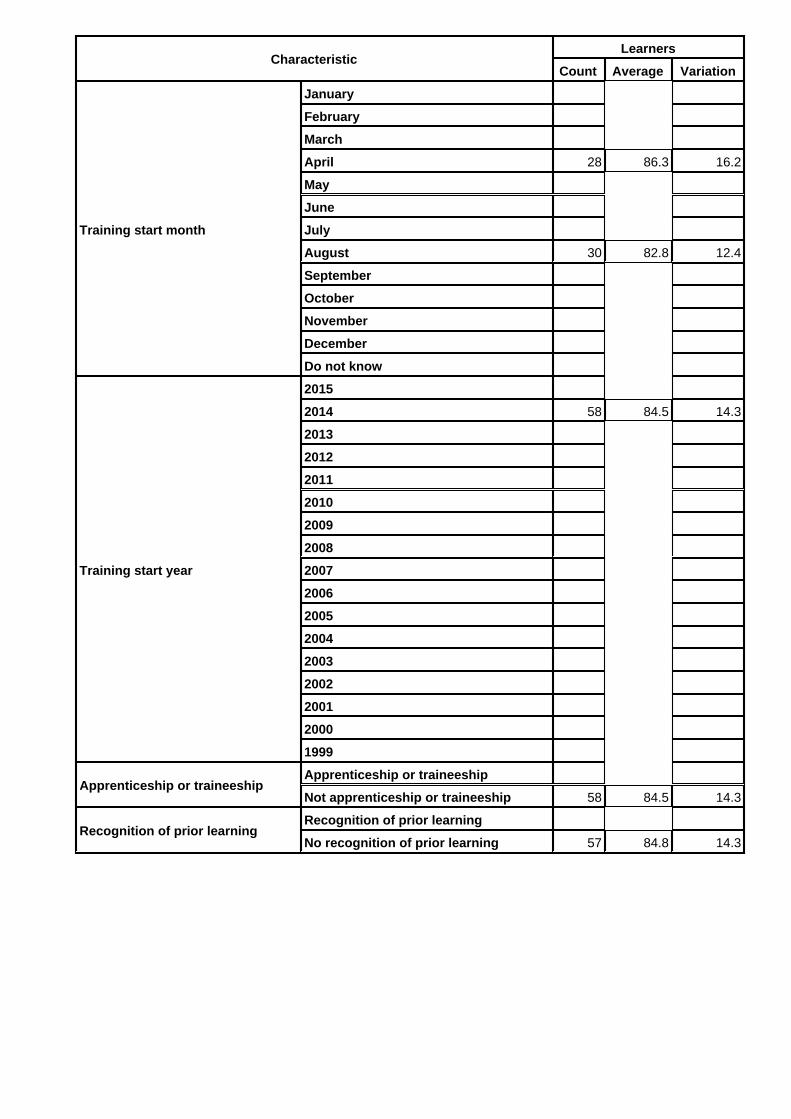
CharacteristicLearners
Count Average Variation
Training start month
January
February
March
April 28 92.9 10.8
May
June
July
August 30 92.5 10.6
September
October
November
December
Do not know
Training start year
2015
2014 58 92.7 10.6
2013
2012
2011
2010
2009
2008
2007
2006
2005
2004
2003
2002
2001
2000
1999
Apprenticeship or traineeshipApprenticeship or traineeship
Not apprenticeship or traineeship 58 92.7 10.6
Recognition of prior learningRecognition of prior learning
No recognition of prior learning 57 93.0 10.4

Learner characteristics
CharacteristicLearners
Count Average Variation
Learner sex
Female 45 91.7 10.8
Male 16 93.7 11.6
Total 61 92.2 11.0
Learner age
Under 15
15 to 19 11 90.2 14.3
20 to 24 34 93.1 9.5
25 to 34 10 88.3 13.7
35 to 44 5 96.7 4.6
45 to 54
55 to 64 1 100.0 0.0
65 or over
Total 61 92.2 11.0
Aboriginal or Torres Strait Islanderorigin
No 61 92.2 11.0
Yes, Aboriginal
Yes, Torres Strait Islander
Yes, both Aboriginal and TorresStrait Islander
Total 61 92.2 11.0
Home language
English 43 90.9 11.2
Language other than English 18 95.4 10.0
Total 61 92.2 11.0
Permanent residency orcitizenship
Australian 60 92.1 11.0
Not Australian 1 100.0 0.0
Total 61 92.2 11.0
Disability status
Disability identified 3 100.0 0.0
No disability identified 58 91.8 11.1
Total 61 92.2 11.0
Groups1 61 92.2 11.0
Total 61 92.2 11.0

Effective Assessment
Training characteristics
CharacteristicLearners
Count Average Variation
Provider Total 61 90.2 12.8
Qualification Level
Certificate I
Certificate II
Certificate III
Certificate IV 58 90.2 12.6
Certificate level unknown
Diploma
Advanced diploma
Associate degree
Degree
Short course or statement ofattainment
VET Graduate Certificate orDiploma
Other qualification or training
Do not know
Total 58 90.2 12.6

CharacteristicLearners
Count Average Variation
Provider Total 61 90.2 12.8
Field of education
Natural and physical sciences
Information technology
Engineering and relatedtechnologies
Architecture and building
Agriculture, environmental andrelated studies
Health
Education
Management and commerce
Society and culture
Creative arts
Food, hospitality and personalservices
Other 58 90.2 12.6
Total 58 90.2 12.6

CharacteristicLearners
Count Average Variation
Training start month
January
February
March
April 28 90.5 12.6
May
June
July
August 30 90.0 12.8
September
October
November
December
Do not know
Training start year
2015
2014 58 90.2 12.6
2013
2012
2011
2010
2009
2008
2007
2006
2005
2004
2003
2002
2001
2000
1999
Apprenticeship or traineeshipApprenticeship or traineeship
Not apprenticeship or traineeship 58 90.2 12.6
Recognition of prior learningRecognition of prior learning
No recognition of prior learning 57 90.8 12.0

Learner characteristics
CharacteristicLearners
Count Average Variation
Learner sex
Female 45 89.6 13.2
Male 16 91.7 11.8
Total 61 90.2 12.8
Learner age
Under 15
15 to 19 11 89.4 16.3
20 to 24 34 90.4 11.3
25 to 34 10 86.7 15.3
35 to 44 5 95.0 11.2
45 to 54
55 to 64 1 100.0 0.0
65 or over
Total 61 90.2 12.8
Aboriginal or Torres Strait Islanderorigin
No 61 90.2 12.8
Yes, Aboriginal
Yes, Torres Strait Islander
Yes, both Aboriginal and TorresStrait Islander
Total 61 90.2 12.8
Home language
English 43 89.0 13.8
Language other than English 18 93.1 9.6
Total 61 90.2 12.8
Permanent residency orcitizenship
Australian 60 90.0 12.8
Not Australian 1 100.0 0.0
Total 61 90.2 12.8
Disability status
Disability identified 3 94.4 9.6
No disability identified 58 89.9 12.9
Total 61 90.2 12.8
Groups1 61 90.2 12.8
Total 61 90.2 12.8

Clear Expectations
Training characteristics
CharacteristicLearners
Count Average Variation
Provider Total 61 90.0 13.4
Qualification Level
Certificate I
Certificate II
Certificate III
Certificate IV 58 90.0 13.3
Certificate level unknown
Diploma
Advanced diploma
Associate degree
Degree
Short course or statement ofattainment
VET Graduate Certificate orDiploma
Other qualification or training
Do not know
Total 58 90.0 13.3

CharacteristicLearners
Count Average Variation
Provider Total 61 90.0 13.4
Field of education
Natural and physical sciences
Information technology
Engineering and relatedtechnologies
Architecture and building
Agriculture, environmental andrelated studies
Health
Education
Management and commerce
Society and culture
Creative arts
Food, hospitality and personalservices
Other 58 90.0 13.3
Total 58 90.0 13.3

CharacteristicLearners
Count Average Variation
Training start month
January
February
March
April 28 91.7 12.3
May
June
July
August 30 88.5 14.1
September
October
November
December
Do not know
Training start year
2015
2014 58 90.0 13.3
2013
2012
2011
2010
2009
2008
2007
2006
2005
2004
2003
2002
2001
2000
1999
Apprenticeship or traineeshipApprenticeship or traineeship
Not apprenticeship or traineeship 58 90.0 13.3
Recognition of prior learningRecognition of prior learning
No recognition of prior learning 57 90.4 13.0

Learner characteristics
CharacteristicLearners
Count Average Variation
Learner sex
Female 45 89.4 14.0
Male 16 91.7 11.8
Total 61 90.0 13.4
Learner age
Under 15
15 to 19 11 89.9 13.6
20 to 24 34 90.2 13.3
25 to 34 10 84.4 15.9
35 to 44 5 97.8 5.0
45 to 54
55 to 64 1 100.0 0.0
65 or over
Total 61 90.0 13.4
Aboriginal or Torres Strait Islanderorigin
No 61 90.0 13.4
Yes, Aboriginal
Yes, Torres Strait Islander
Yes, both Aboriginal and TorresStrait Islander
Total 61 90.0 13.4
Home language
English 43 90.2 12.9
Language other than English 18 89.5 15.0
Total 61 90.0 13.4
Permanent residency orcitizenship
Australian 60 89.8 13.5
Not Australian 1 100.0 0.0
Total 61 90.0 13.4
Disability status
Disability identified 3 96.3 6.4
No disability identified 58 89.7 13.6
Total 61 90.0 13.4
Groups1 61 90.0 13.4
Total 61 90.0 13.4

Learning Stimulation
Training characteristics
CharacteristicLearners
Count Average Variation
Provider Total 61 90.5 14.0
Qualification Level
Certificate I
Certificate II
Certificate III
Certificate IV 58 90.8 14.0
Certificate level unknown
Diploma
Advanced diploma
Associate degree
Degree
Short course or statement ofattainment
VET Graduate Certificate orDiploma
Other qualification or training
Do not know
Total 58 90.8 14.0

CharacteristicLearners
Count Average Variation
Provider Total 61 90.5 14.0
Field of education
Natural and physical sciences
Information technology
Engineering and relatedtechnologies
Architecture and building
Agriculture, environmental andrelated studies
Health
Education
Management and commerce
Society and culture
Creative arts
Food, hospitality and personalservices
Other 58 90.8 14.0
Total 58 90.8 14.0

CharacteristicLearners
Count Average Variation
Training start month
January
February
March
April 28 90.5 16.5
May
June
July
August 30 91.1 11.5
September
October
November
December
Do not know
Training start year
2015
2014 58 90.8 14.0
2013
2012
2011
2010
2009
2008
2007
2006
2005
2004
2003
2002
2001
2000
1999
Apprenticeship or traineeshipApprenticeship or traineeship
Not apprenticeship or traineeship 58 90.8 14.0
Recognition of prior learningRecognition of prior learning
No recognition of prior learning 57 91.2 13.7

Learner characteristics
CharacteristicLearners
Count Average Variation
Learner sex
Female 45 91.4 14.2
Male 16 88.2 13.7
Total 61 90.5 14.0
Learner age
Under 15
15 to 19 11 86.9 21.0
20 to 24 34 91.8 11.7
25 to 34 10 86.7 15.5
35 to 44 5 97.8 5.0
45 to 54
55 to 64 1 88.9 0.0
65 or over
Total 61 90.5 14.0
Aboriginal or Torres Strait Islanderorigin
No 61 90.5 14.0
Yes, Aboriginal
Yes, Torres Strait Islander
Yes, both Aboriginal and TorresStrait Islander
Total 61 90.5 14.0
Home language
English 43 90.4 14.5
Language other than English 18 90.7 13.3
Total 61 90.5 14.0
Permanent residency orcitizenship
Australian 60 90.6 14.1
Not Australian 1 88.9 0.0
Total 61 90.5 14.0
Disability status
Disability identified 3 88.9 11.1
No disability identified 58 90.6 14.2
Total 61 90.5 14.0
Groups1 61 90.5 14.0
Total 61 90.5 14.0

Training Relevance
Training characteristics
CharacteristicLearners
Count Average Variation
Provider Total 61 91.8 11.1
Qualification Level
Certificate I
Certificate II
Certificate III
Certificate IV 58 91.8 11.1
Certificate level unknown
Diploma
Advanced diploma
Associate degree
Degree
Short course or statement ofattainment
VET Graduate Certificate orDiploma
Other qualification or training
Do not know
Total 58 91.8 11.1

CharacteristicLearners
Count Average Variation
Provider Total 61 91.8 11.1
Field of education
Natural and physical sciences
Information technology
Engineering and relatedtechnologies
Architecture and building
Agriculture, environmental andrelated studies
Health
Education
Management and commerce
Society and culture
Creative arts
Food, hospitality and personalservices
Other 58 91.8 11.1
Total 58 91.8 11.1

CharacteristicLearners
Count Average Variation
Training start month
January
February
March
April 28 90.1 12.2
May
June
July
August 30 93.3 9.9
September
October
November
December
Do not know
Training start year
2015
2014 58 91.8 11.1
2013
2012
2011
2010
2009
2008
2007
2006
2005
2004
2003
2002
2001
2000
1999
Apprenticeship or traineeshipApprenticeship or traineeship
Not apprenticeship or traineeship 58 91.8 11.1
Recognition of prior learningRecognition of prior learning
No recognition of prior learning 57 92.2 10.7

Learner characteristics
CharacteristicLearners
Count Average Variation
Learner sex
Female 45 91.4 11.3
Male 16 93.1 10.6
Total 61 91.8 11.1
Learner age
Under 15
15 to 19 11 90.9 15.6
20 to 24 34 91.2 10.5
25 to 34 10 91.1 10.2
35 to 44 5 97.8 5.0
45 to 54
55 to 64 1 100.0 0.0
65 or over
Total 61 91.8 11.1
Aboriginal or Torres Strait Islanderorigin
No 61 91.8 11.1
Yes, Aboriginal
Yes, Torres Strait Islander
Yes, both Aboriginal and TorresStrait Islander
Total 61 91.8 11.1
Home language
English 43 91.5 10.8
Language other than English 18 92.6 12.1
Total 61 91.8 11.1
Permanent residency orcitizenship
Australian 60 91.9 11.2
Not Australian 1 88.9 0.0
Total 61 91.8 11.1
Disability status
Disability identified 3 85.2 17.0
No disability identified 58 92.1 10.8
Total 61 91.8 11.1
Groups1 61 91.8 11.1
Total 61 91.8 11.1

Competency Development
Training characteristics
CharacteristicLearners
Count Average Variation
Provider Total 61 90.9 11.7
Qualification Level
Certificate I
Certificate II
Certificate III
Certificate IV 58 91.0 11.5
Certificate level unknown
Diploma
Advanced diploma
Associate degree
Degree
Short course or statement ofattainment
VET Graduate Certificate orDiploma
Other qualification or training
Do not know
Total 58 91.0 11.5

CharacteristicLearners
Count Average Variation
Provider Total 61 90.9 11.7
Field of education
Natural and physical sciences
Information technology
Engineering and relatedtechnologies
Architecture and building
Agriculture, environmental andrelated studies
Health
Education
Management and commerce
Society and culture
Creative arts
Food, hospitality and personalservices
Other 58 91.0 11.5
Total 58 91.0 11.5

CharacteristicLearners
Count Average Variation
Training start month
January
February
March
April 28 91.4 11.5
May
June
July
August 30 90.7 11.7
September
October
November
December
Do not know
Training start year
2015
2014 58 91.0 11.5
2013
2012
2011
2010
2009
2008
2007
2006
2005
2004
2003
2002
2001
2000
1999
Apprenticeship or traineeshipApprenticeship or traineeship
Not apprenticeship or traineeship 58 91.0 11.5
Recognition of prior learningRecognition of prior learning
No recognition of prior learning 57 91.3 11.3

Learner characteristics
CharacteristicLearners
Count Average Variation
Learner sex
Female 45 90.7 12.1
Male 16 91.7 11.0
Total 61 90.9 11.7
Learner age
Under 15
15 to 19 11 92.1 13.6
20 to 24 34 91.4 10.7
25 to 34 10 84.7 13.7
35 to 44 5 96.0 8.9
45 to 54
55 to 64 1 100.0 0.0
65 or over
Total 61 90.9 11.7
Aboriginal or Torres Strait Islanderorigin
No 61 90.9 11.7
Yes, Aboriginal
Yes, Torres Strait Islander
Yes, both Aboriginal and TorresStrait Islander
Total 61 90.9 11.7
Home language
English 43 90.9 12.2
Language other than English 18 91.1 11.0
Total 61 90.9 11.7
Permanent residency orcitizenship
Australian 60 90.8 11.8
Not Australian 1 100.0 0.0
Total 61 90.9 11.7
Disability status
Disability identified 3 91.1 15.4
No disability identified 58 90.9 11.7
Total 61 90.9 11.7
Groups1 61 90.9 11.7
Total 61 90.9 11.7

Training Resources
Training characteristics
CharacteristicLearners
Count Average Variation
Provider Total 61 90.7 12.5
Qualification Level
Certificate I
Certificate II
Certificate III
Certificate IV 58 90.8 12.7
Certificate level unknown
Diploma
Advanced diploma
Associate degree
Degree
Short course or statement ofattainment
VET Graduate Certificate orDiploma
Other qualification or training
Do not know
Total 58 90.8 12.7

CharacteristicLearners
Count Average Variation
Provider Total 61 90.7 12.5
Field of education
Natural and physical sciences
Information technology
Engineering and relatedtechnologies
Architecture and building
Agriculture, environmental andrelated studies
Health
Education
Management and commerce
Society and culture
Creative arts
Food, hospitality and personalservices
Other 58 90.8 12.7
Total 58 90.8 12.7

CharacteristicLearners
Count Average Variation
Training start month
January
February
March
April 28 92.1 12.4
May
June
July
August 30 89.6 13.0
September
October
November
December
Do not know
Training start year
2015
2014 58 90.8 12.7
2013
2012
2011
2010
2009
2008
2007
2006
2005
2004
2003
2002
2001
2000
1999
Apprenticeship or traineeshipApprenticeship or traineeship
Not apprenticeship or traineeship 58 90.8 12.7
Recognition of prior learningRecognition of prior learning
No recognition of prior learning 57 91.2 12.4

Learner characteristics
CharacteristicLearners
Count Average Variation
Learner sex
Female 45 89.6 12.6
Male 16 93.7 12.2
Total 61 90.7 12.5
Learner age
Under 15
15 to 19 11 87.9 14.4
20 to 24 34 91.8 11.7
25 to 34 10 86.7 14.6
35 to 44 5 95.6 9.9
45 to 54
55 to 64 1 100.0 0.0
65 or over
Total 61 90.7 12.5
Aboriginal or Torres Strait Islanderorigin
No 61 90.7 12.5
Yes, Aboriginal
Yes, Torres Strait Islander
Yes, both Aboriginal and TorresStrait Islander
Total 61 90.7 12.5
Home language
English 43 90.2 13.1
Language other than English 18 92.0 11.3
Total 61 90.7 12.5
Permanent residency orcitizenship
Australian 60 90.6 12.6
Not Australian 1 100.0 0.0
Total 61 90.7 12.5
Disability status
Disability identified 3 92.6 12.8
No disability identified 58 90.6 12.6
Total 61 90.7 12.5
Groups1 61 90.7 12.5
Total 61 90.7 12.5

Effective Support
Training characteristics
CharacteristicLearners
Count Average Variation
Provider Total 61 91.6 12.8
Qualification Level
Certificate I
Certificate II
Certificate III
Certificate IV 58 91.8 12.6
Certificate level unknown
Diploma
Advanced diploma
Associate degree
Degree
Short course or statement ofattainment
VET Graduate Certificate orDiploma
Other qualification or training
Do not know
Total 58 91.8 12.6

CharacteristicLearners
Count Average Variation
Provider Total 61 91.6 12.8
Field of education
Natural and physical sciences
Information technology
Engineering and relatedtechnologies
Architecture and building
Agriculture, environmental andrelated studies
Health
Education
Management and commerce
Society and culture
Creative arts
Food, hospitality and personalservices
Other 58 91.8 12.6
Total 58 91.8 12.6

CharacteristicLearners
Count Average Variation
Training start month
January
February
March
April 28 92.1 13.5
May
June
July
August 30 91.5 11.9
September
October
November
December
Do not know
Training start year
2015
2014 58 91.8 12.6
2013
2012
2011
2010
2009
2008
2007
2006
2005
2004
2003
2002
2001
2000
1999
Apprenticeship or traineeshipApprenticeship or traineeship
Not apprenticeship or traineeship 58 91.8 12.6
Recognition of prior learningRecognition of prior learning
No recognition of prior learning 57 92.2 12.2

Learner characteristics
CharacteristicLearners
Count Average Variation
Learner sex
Female 45 90.9 13.5
Male 16 93.7 10.7
Total 61 91.6 12.8
Learner age
Under 15
15 to 19 11 88.9 17.2
20 to 24 34 92.2 12.1
25 to 34 10 90.0 12.2
35 to 44 5 95.6 9.9
45 to 54
55 to 64 1 100.0 0.0
65 or over
Total 61 91.6 12.8
Aboriginal or Torres Strait Islanderorigin
No 61 91.6 12.8
Yes, Aboriginal
Yes, Torres Strait Islander
Yes, both Aboriginal and TorresStrait Islander
Total 61 91.6 12.8
Home language
English 43 89.9 13.7
Language other than English 18 95.7 9.4
Total 61 91.6 12.8
Permanent residency orcitizenship
Australian 60 91.5 12.8
Not Australian 1 100.0 0.0
Total 61 91.6 12.8
Disability status
Disability identified 3 96.3 6.4
No disability identified 58 91.4 13.0
Total 61 91.6 12.8
Groups1 61 91.6 12.8
Total 61 91.6 12.8

Active Learning
Training characteristics
CharacteristicLearners
Count Average Variation
Provider Total 61 84.4 14.2
Qualification Level
Certificate I
Certificate II
Certificate III
Certificate IV 58 84.5 14.3
Certificate level unknown
Diploma
Advanced diploma
Associate degree
Degree
Short course or statement ofattainment
VET Graduate Certificate orDiploma
Other qualification or training
Do not know
Total 58 84.5 14.3

CharacteristicLearners
Count Average Variation
Provider Total 61 84.4 14.2
Field of education
Natural and physical sciences
Information technology
Engineering and relatedtechnologies
Architecture and building
Agriculture, environmental andrelated studies
Health
Education
Management and commerce
Society and culture
Creative arts
Food, hospitality and personalservices
Other 58 84.5 14.3
Total 58 84.5 14.3
CharacteristicLearners
Count Average Variation
Training start month
January
February
March
April 28 86.3 16.2
May
June
July
August 30 82.8 12.4
September
October
November
December
Do not know
Training start year
2015
2014 58 84.5 14.3
2013
2012
2011
2010
2009
2008
2007
2006
2005
2004
2003
2002
2001
2000
1999
Apprenticeship or traineeshipApprenticeship or traineeship
Not apprenticeship or traineeship 58 84.5 14.3
Recognition of prior learningRecognition of prior learning
No recognition of prior learning 57 84.8 14.3

Learner characteristics
CharacteristicLearners
Count Average Variation
Learner sex
Female 45 84.8 14.5
Male 16 83.3 13.9
Total 61 84.4 14.2
Learner age
Under 15
15 to 19 11 80.3 20.8
20 to 24 34 84.6 12.0
25 to 34 10 83.3 15.7
35 to 44 5 93.3 7.0
45 to 54
55 to 64 1 91.7 0.0
65 or over
Total 61 84.4 14.2
Aboriginal or Torres Strait Islanderorigin
No 61 84.4 14.2
Yes, Aboriginal
Yes, Torres Strait Islander
Yes, both Aboriginal and TorresStrait Islander
Total 61 84.4 14.2
Home language
English 43 84.5 14.8
Language other than English 18 84.3 13.1
Total 61 84.4 14.2
Permanent residency orcitizenship
Australian 60 84.3 14.3
Not Australian 1 91.7 0.0
Total 61 84.4 14.2
Disability status
Disability identified 3 86.1 17.3
No disability identified 58 84.3 14.2
Total 61 84.4 14.2
Groups1 61 84.4 14.2
Total 61 84.4 14.2

Overall Satisfaction
Training characteristics
CharacteristicLearners
Count Average Variation
Provider Total 61 95.1 10.4
Qualification Level
Certificate I
Certificate II
Certificate III
Certificate IV 58 95.4 10.0
Certificate level unknown
Diploma
Advanced diploma
Associate degree
Degree
Short course or statement ofattainment
VET Graduate Certificate orDiploma
Other qualification or training
Do not know
Total 58 95.4 10.0

CharacteristicLearners
Count Average Variation
Provider Total 61 95.1 10.4
Field of education
Natural and physical sciences
Information technology
Engineering and relatedtechnologies
Architecture and building
Agriculture, environmental andrelated studies
Health
Education
Management and commerce
Society and culture
Creative arts
Food, hospitality and personalservices
Other 58 95.4 10.0
Total 58 95.4 10.0

CharacteristicLearners
Count Average Variation
Training start month
January
February
March
April 28 96.0 9.2
May
June
July
August 30 94.8 10.8
September
October
November
December
Do not know
Training start year
2015
2014 58 95.4 10.0
2013
2012
2011
2010
2009
2008
2007
2006
2005
2004
2003
2002
2001
2000
1999
Apprenticeship or traineeshipApprenticeship or traineeship
Not apprenticeship or traineeship 58 95.4 10.0
Recognition of prior learningRecognition of prior learning
No recognition of prior learning 57 95.9 9.3

Learner characteristics
CharacteristicLearners
Count Average Variation
Learner sex
Female 45 94.1 11.7
Male 16 97.9 4.5
Total 61 95.1 10.4
Learner age
Under 15
15 to 19 11 92.9 13.4
20 to 24 34 94.8 11.0
25 to 34 10 96.7 7.5
35 to 44 5 97.8 5.0
45 to 54
55 to 64 1 100.0 0.0
65 or over
Total 61 95.1 10.4
Aboriginal or Torres Strait Islanderorigin
No 61 95.1 10.4
Yes, Aboriginal
Yes, Torres Strait Islander
Yes, both Aboriginal and TorresStrait Islander
Total 61 95.1 10.4
Home language
English 43 94.6 10.9
Language other than English 18 96.3 9.3
Total 61 95.1 10.4
Permanent residency orcitizenship
Australian 60 95.0 10.5
Not Australian 1 100.0 0.0
Total 61 95.1 10.4
Disability status
Disability identified 3 96.3 6.4
No disability identified 58 95.0 10.6
Total 61 95.1 10.4
Groups1 61 95.1 10.4
Total 61 95.1 10.4

Group ReportThe Group Report provides information about each nominated group and a snapshot of results for the scalesmeasured by the Learner Questionnaire (LQ) and Employer Questionnaire (EQ).
For each scale, the Group Report presents information about the:
count of responses used to calculate the scale score;average scale score; andvariation in scale scores.
Scores are reported on the response scale of 0 to 100, where 0 means 'strongly disagree' and 100 means 'stronglyagree'.
Results are provided for learners and/or employers depending on the data entered into SMART.
This Group Report can be used to analyse the number, average and variation of the survey responses.Comparisons can be made across scales, to previous reports, or between learners and employers.
Group 1
Learners Employers
Scale Average score Average variation Average score Average variation
Trainer Quality 92.2 11.0
Effective Assessment 90.2 12.8
Clear Expectations 90.0 13.4
Learning Stimulation 90.5 14.0
Training Relevance 91.8 11.1
Competency Development 90.9 11.7
Training Resources 90.7 12.5
Effective Support 91.6 12.8
Active Learning 84.4 14.2
Overall Satisfaction 95.1 10.4
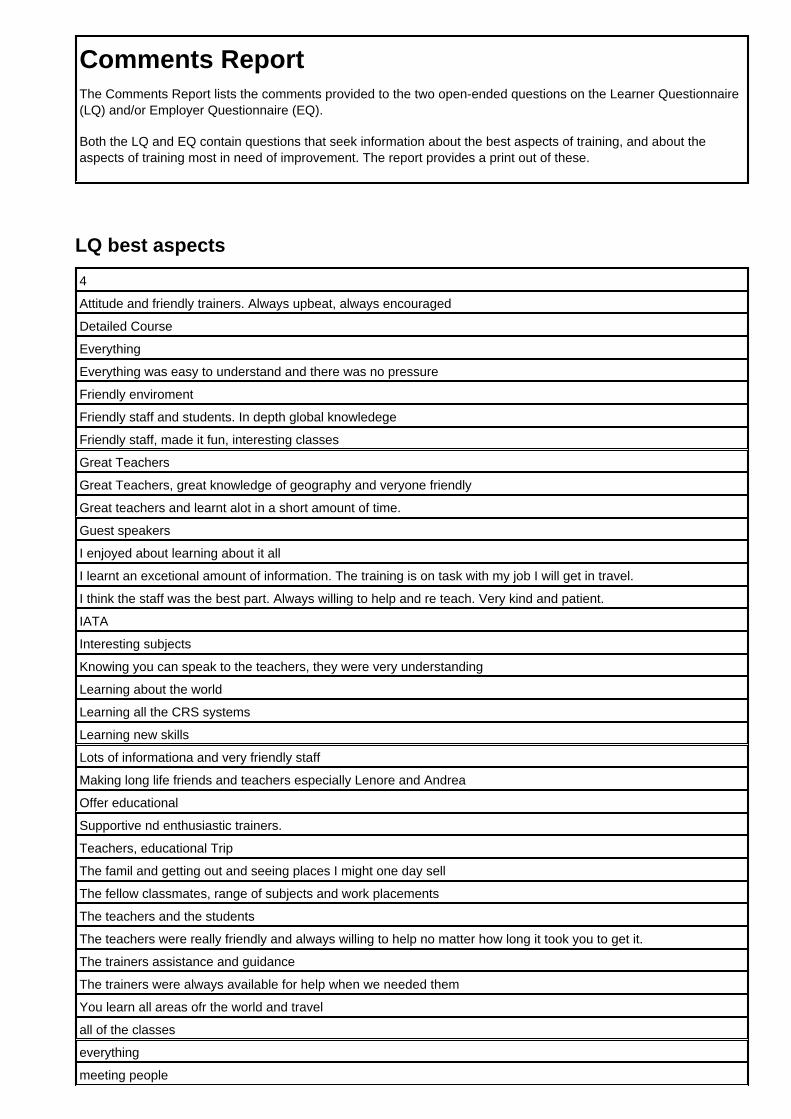
Comments ReportThe Comments Report lists the comments provided to the two open-ended questions on the Learner Questionnaire(LQ) and/or Employer Questionnaire (EQ).
Both the LQ and EQ contain questions that seek information about the best aspects of training, and about theaspects of training most in need of improvement. The report provides a print out of these.
LQ best aspects
4
Attitude and friendly trainers. Always upbeat, always encouraged
Detailed Course
Everything
Everything was easy to understand and there was no pressure
Friendly enviroment
Friendly staff and students. In depth global knowledege
Friendly staff, made it fun, interesting classes
Great Teachers
Great Teachers, great knowledge of geography and veryone friendly
Great teachers and learnt alot in a short amount of time.
Guest speakers
I enjoyed about learning about it all
I learnt an excetional amount of information. The training is on task with my job I will get in travel.
I think the staff was the best part. Always willing to help and re teach. Very kind and patient.
IATA
Interesting subjects
Knowing you can speak to the teachers, they were very understanding
Learning about the world
Learning all the CRS systems
Learning new skills
Lots of informationa and very friendly staff
Making long life friends and teachers especially Lenore and Andrea
Offer educational
Supportive nd enthusiastic trainers.
Teachers, educational Trip
The famil and getting out and seeing places I might one day sell
The fellow classmates, range of subjects and work placements
The teachers and the students
The teachers were really friendly and always willing to help no matter how long it took you to get it.
The trainers assistance and guidance
The trainers were always available for help when we needed them
You learn all areas ofr the world and travel
all of the classes
everything
meeting people

the whole course

LQ needs improvement
Computer connections did not let us down to much but on occasions it did
Course coulde be longer and edcational
Cover letter
Felt a little rushed at the end
Felt a little rushed at the end
Geography
Printers Ha Ha
Some classes went on too long
Spent too much time on IATA Australia module
The time frame of the course could have been extended a week or so more
Time frame towards the end of course
more up to date shortcuts on reservation systems
none
nothing
nothing
the course is perfect

EQ best aspects

EQ needs improvement

Administration ReportThe Administration Report provides information provided by the training organisation on survey management. Itprovides a print out of responses entered into the SMART system.
Learner survey feedback
Staff days spent managing learner survey
Cost of direct expenses of learner survey
Problems encountered during learner survey
Employer survey feedback
Staff days spent managing employer survey
Cost of direct expenses of employer survey
Problems encountered during employersurvey

Registering body report29 Jun 2015
RTO Information
NTIS number 20864
Name Jetset Training College
Street AddressLevel 6,461 Bourke St
City/town/suburb Melbourne
State VIC
Post code 3000
Learner and employer response
Learners Employers
Response count (number) 61 0
Population count (number) 195
Response rate (per cent) 31.3
Learner and employer feedback
Learners Employers
Scale Averagescore
Averagevariation
Averagescore
Averagevariation
All scales 90.6 16.0
Trainer Quality 92.2 11.0
Effective Assessment 90.2 12.8
Clear Expectations 90.0 13.4
Learning Stimulation 90.5 14.0
Training Relevance 91.8 11.1
Competency Development 90.9 11.7
Training Resources 90.7 12.5
Effective Support 91.6 12.8
Active Learning 84.4 14.2
Overall Satisfaction 95.1 10.4
Survey contexts and use
Completion of this section is optional and may be used by the RTO to provide information and an explanation of thedata provided.
Information Explanatory notes
Specific contexts to consider wheninterpreting survey results
Main ways data has been used forcontinuous improvement