Embed Size (px)
Citation preview

WEDNESDAY MAY 23, 2012, 1201AM ET
Russians Back Protests, Political Freedoms And Putin, Too
Andrew Kohut,
President, Pew Research Center
Pew Global Attitudes Project: Pew Research Center:
Richard Wike, Associate Director James Bell,
Juliana Menasce Horowitz, Director of International Survey Research, Pew Research Center Senior Researcher
Katie Simmons, Research Associate Bruce Stokes,
Jacob Poushter, Research Analyst Director of Pew Global Economic Attitudes, Pew Research Center
Cathy Barker, Research Assistant Elizabeth Mueller Gross,
Vice President, Pew Research Center
For Media Inquiries Contact: Richard Wike Vidya Krishnamurthy 202.419.4372 http://pewglobal.org

2
May 23, 2012
TABLE OF CONTENTS
Copyright © 2012 Pew Research Center www.pewresearch.org
PAGE
Overview: Russians Back Protests, Political Freedoms 1
About the Project 8
Chapter 1: National Conditions 9
Chapter 2: Reaction to Presidential Election, Protests 12
Chapter 3: Attitudes Toward Democracy 16
Chapter 4: Views of Leaders 22
Chapter 5: Nationalism and Russia’s Global Image 25
Survey Methods 27
Survey Topline 28
Appendix 37

1
Russians Back Protests, Political Freedoms And Putin, Too Following a winter of discontent Russians
express an increased appetite for political
freedom, and at the same time strongly
endorse Vladimir Putin.
Compared with just a few years ago, more
Russians believe that voting gives people like
themselves an opportunity to express their
opinion about the country’s governance, more
feel that it is important to be able to openly
criticize the government, and greater numbers
see freedom of the press and honest elections
as very important.
Consistent with the value placed on core
democratic principles, a solid majority (64%)
see attending protests as an opportunity to
speak out about how the government is run,
and more than half (56%) specifically approve
of the mass demonstrations that followed the
December 2011 parliamentary vote, which was
marred by fraud allegations. In that regard,
while a modest 56%-majority says they are
satisfied with the outcome of the March 4,
2012 presidential election, just 47% believe
that election was fair.
Nonetheless, the poll finds a number of
indicators of support for the status quo. Most
notably, 72% of Russians voice a favorable
Conflicting Views of Political Change
Support for Protests 2012
% Attending protests gives people an opportunity to express their opinion
Agree 64 Disagree 27 Don’t know 8
Opinion of protests for fair elections Support 56 Oppose 33 Don’t know 10 Mixed Views of Presidential Election Satisfaction with results Satisfied 56 Dissatisfied 33 Don’t know 10 Were the elections fair? Yes, fair 47 No, not fair 35 Don’t know 18 Opinion of Putin, Medvedev Putin favorability Favorable 72 Unfavorable 24 Don’t know 4 Medvedev favorability Favorable 67 Unfavorable 28 Don’t know 5
PEW RESEARCH CENTER QRUS1, QRUS2, Q52a-b, Q68c, & Q82.
Pew Research Center’s Global Attitudes Project – www.pewglobal.org
2
opinion of Vladimir Putin, while almost as many hold a positive opinion of Dmitri Medvedev
(67%). Putin’s popularity is being fueled more by views of the economy and perceptions of
social mobility than it is being hurt by democratic aspirations. Relatively few Russians express
favorable views of other prominent political figures. Roughly four-in-ten or fewer have
positive opinions of presidential contenders Gennady Zyuganov (39%), Mikhail Prokhorov
(36%), Sergei Mironov (36%) and Vladimir Zhirinovsky (28%). Meanwhile, 54% of Russians
are unfamiliar with government critic and protest organizer Alexei Navalny.
Further, as they have for most of the post-
Soviet era, a majority of Russians continue to
feel that relying on a leader with a strong hand
in order to solve problems is more important
than relying on a democratic form of
government (57% vs. 32%). In addition, strong
majorities say it is very important to live in a
country where there is law and order (75%)
and economic prosperity (71%). In fact, three-
quarters say they would choose a strong
economy over a good democracy.
These are among the principal findings from a
nationwide survey of Russia by the Pew Research Center’s Global Attitudes Project. Face-to-
face interviews were conducted with 1,000 adults in Russia between March 19 and April 4,
2012. The poll finds that Russians are generally divided about their country’s direction as
Putin begins his third term as president: 46% are satisfied with the way things are going in
their country, while 45% are not. At home, the economy is a concern for many Russians, with
only 32% describing the current economic situation as good. Meanwhile, in the international
arena, a solid majority (73%) believe Russia deserves greater respect from other countries. The
survey also finds persistent strains of ethnic nationalism among Russians, with about half
(53%) saying Russia should be for Russians only, and 44% saying it is natural for Russia to
have an empire.
Which Is More Important?
2009 2011 2012
% % % Democracy 29 32 32 Strong leader 60 57 57 Don’t know 11 11 11
2009 2011 2012
% % % Good democracy 14 21 19 Strong economy 78 73 75 Don’t know 7 6 7
PEW RESEARCH CENTER Q71 & Q72.

Pew Research Center’s Global Attitudes Project – www.pewglobal.org
3
Democratic Freedoms More Valued
Against the backdrop of protests over the conduct of elections and the state of democracy in
Russia, increasing numbers of Russians endorse the importance of key civic freedoms and
institutions. Looking back a full ten years, five of the six measures of democratic freedom
tested by the Global Attitudes Project have witnessed double-digit increases in terms of the
percentage of Russians describing them as “very important.”
As they have in the past, today Russians place
the greatest value on a judiciary that treats all
citizens equally (71%), but compared with
2009, more now also value a civilian-
controlled military (up 14 percentage points),
an uncensored media (up 12 points) and
honest elections (up 11 points). The
importance of free speech and religious
freedom has grown more modestly over the
past three years (up 7 and 5 percentage points,
respectively).
Although growing numbers of Russians value
civic freedoms and institutions, relatively few
see these as a reality in their country. Roughly
one-in-five or fewer say a fair judiciary (17%),
honest elections (16%), uncensored media
(15%) and a civilian-controlled military (14%)
describe Russia very well. Slightly more (28%)
say that freedom of speech is characteristic of
their country, while almost half (46%) agree
that citizens are generally free to practice their
religion.
Comparing the percentage of Russians who place a high value on core political freedoms with
the percentage who believe the same freedoms are a fact of life in Russia, it is possible to
discern a growing gap between democracy’s promise and practice.
In light of this gap, it is not surprising to find only 31% of Russians are satisfied with the way
democracy is working in their country. This sentiment is pervasive across demographic
Democracy’s Promise and Practice % Very important
2002
2009 2012 09-12
Change % % % Fair judiciary 68 69 71 +2 Honest elections 37 41 52 +11 Religious freedom 35 47 52 +5 Uncensored media 31 37 49 +12 Free speech 30 37 44 +7 Civilian-controlled military 20 27 41 +14
MEDIAN 33 39 51 +12
% Describes country very well
2002 2009 2012 09-12
Change % % % Fair judiciary 20 19 17 -2 Honest elections 15 16 16 0 Religious freedom 35 43 46 +3 Uncensored media 14 15 15 0 Free speech 20 22 28 +6 Civilian-controlled military 12 12 14 +2
MEDIAN 18 18 17 -1
PEW RESEARCH CENTER Q69a-f, Q70a-f.
Pew Research Center’s Global Attitudes Project – www.pewglobal.org
4
4744
56
43
54
37
1991 2009 2012
Agree Disagree
groups. And although those with a favorable view of Putin are somewhat more upbeat about
the state of democracy in Russia (36% satisfied), even within this group a majority (57%) see
room for improvement.
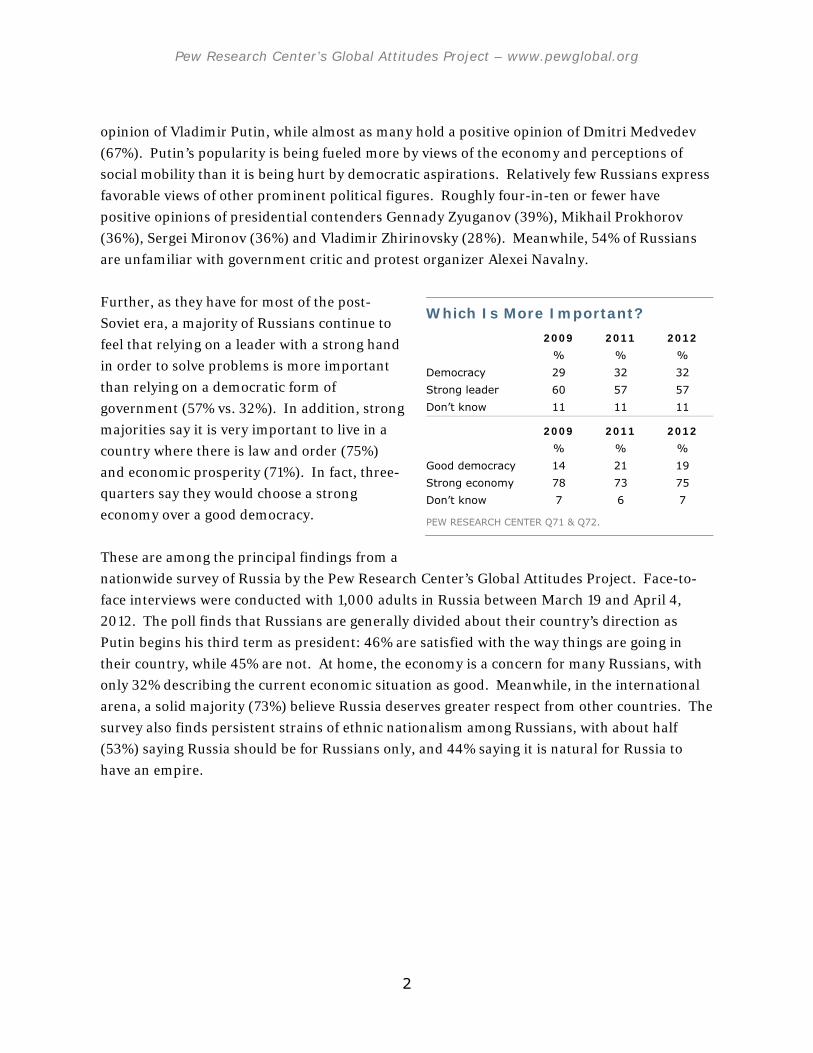
Voting, Protests Seen as Important
Despite the public’s disappointment with
democratization in Russia, the number of
people who say voting matters has actually
risen. In 1991, when the Times Mirror Center,
precursor to the Pew Research Center, first
asked if voting gave people an opportunity to
express their opinion about how government
runs things, just 47% agreed. In 2009, the
balance of opinion showed more doubting the
power of voting. But this spring there seems to
be a renewed conviction that casting one’s vote
matters – a 56%-majority now believes this to
be true.
Positive shifts in the value placed on voting are
evident across education and income groups.
Meanwhile, attitudes among older Russians
appear to have “caught up” with those of
younger Russians. In 2009, just over half
(54%) of those ages 18-29 said that voting gave
them a say about governance, but fewer among
30-49 year olds (42%) or those over 50 (38%) felt the same. Today, about the same number of
18-29 year olds think voting matters (51%), but more among the 30-49 and 50-plus cohorts
now share this view, (55% and 61%, respectively).
Along with generally endorsing the importance of voting, a strong majority of Russians (64%)
believe that attending protests or demonstrations is an effective way for average citizens to
comment on the government’s actions. And more than half (56%) say they support the
protests for fair elections that arose in the wake of the controversial parliamentary vote in
December of last year.
More Agree That Voting Gives People an Opportunity to Express Their Opinion About Government
As asked in 2012, 2009, and 1991 the question has reflected the Russian translation: “Voting gives people like me an opportunity to express their opinion about how the government runs things.” In 2009 and 1991, the translation was reported as, “Voting gives people like me some say about how the government runs things”.
PEW RESEARCH CENTER Q68b.
Pew Research Center’s Global Attitudes Project – www.pewglobal.org
5
Satisfied56% Dissatisfied
33%
DK10%
Yes47%
No35%
DK18%
While some in Russia have suggested that the protests for fair elections are the result of
Western meddling, most Russians (58%) disagree, attributing the demonstrations instead to
genuine dissatisfaction among the public.
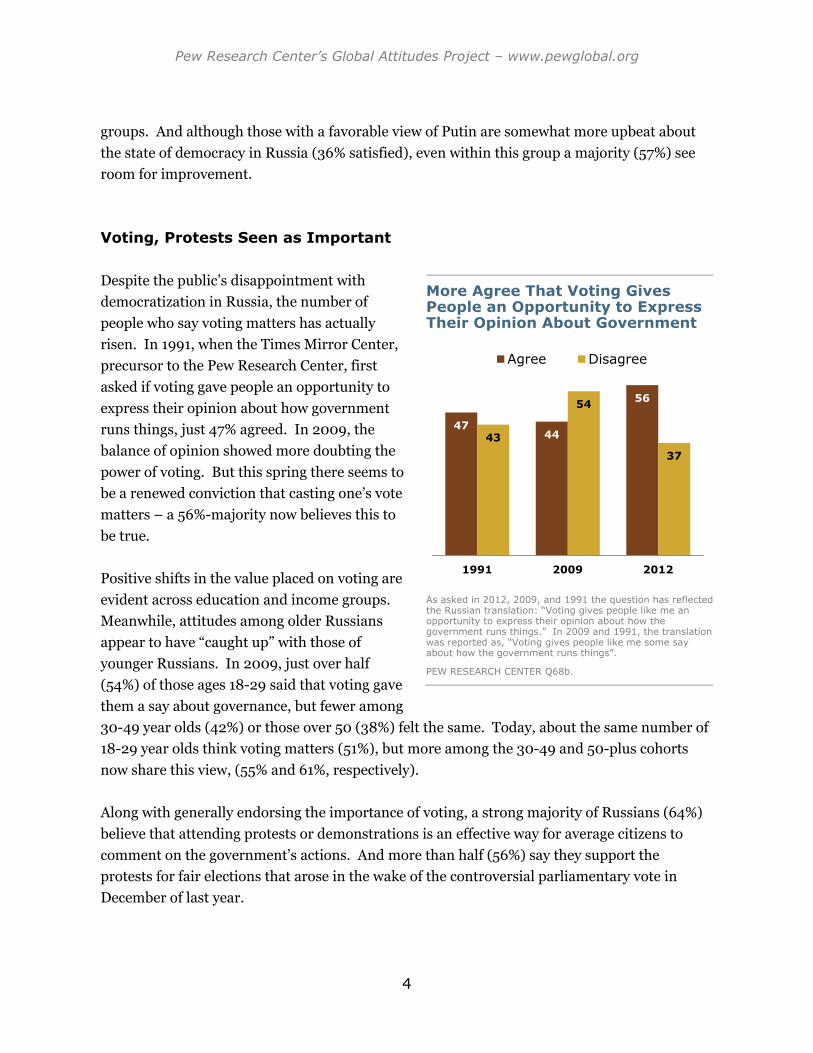
Mixed Reaction to Presidential Vote
Protests in the wake of the December 2011 parliamentary
elections brought to the fore questions about the fairness of the
March 4, 2012 presidential vote. Following Putin’s first-round
victory, the public offers a mixed assessment of the balloting:
47% believe the election was free from manipulation, while
roughly a third (35%) disagree and 18% are uncertain.
Overall, a majority (56%) say they are satisfied with the results
of the election, compared with a third (33%) who are
dissatisfied. One-in-ten do not have an opinion either way.
The perceived fairness of the March 4th vote is a key factor
influencing satisfaction with the outcome. Nearly nine-in-ten
(87%) who think the election was “clean” say they are satisfied
with the outcome. By contrast, only one-in-five who believe the
vote was unfair say the same. Russians who are unsure
whether the election was fair, meanwhile, tend to be satisfied
(46%) with Putin’s victory.
Not surprisingly, reaction to the election results is especially
positive among Russians who hold a favorable opinion of Putin
(71% satisfied) and those who feel they are better off financially
than they were five years ago (71% satisfied).
Putin’s Continued Appeal
While some Russians may have their doubts about the fairness
of the March 4th presidential vote, Putin clearly remains
popular. Roughly seven-in-ten (72%) say they have a favorable opinion of the returning
president. Only about a quarter (24%) of respondents voice the opposite view.
Were the Presidential Elections Fair?
PEW RESEARCH CENTER QRUS2.
Most Satisfied with Presidential Election
PEW RESEARCH CENTER QRUS1.
Pew Research Center’s Global Attitudes Project – www.pewglobal.org
6
24
28
52
48
51
66
31
72
67
39
36
36
28
16
Putin
Medvedev
Zyuganov
Prokhorov
Mironov
Zhirinovsky
Navalny
FavorableUnfavorable
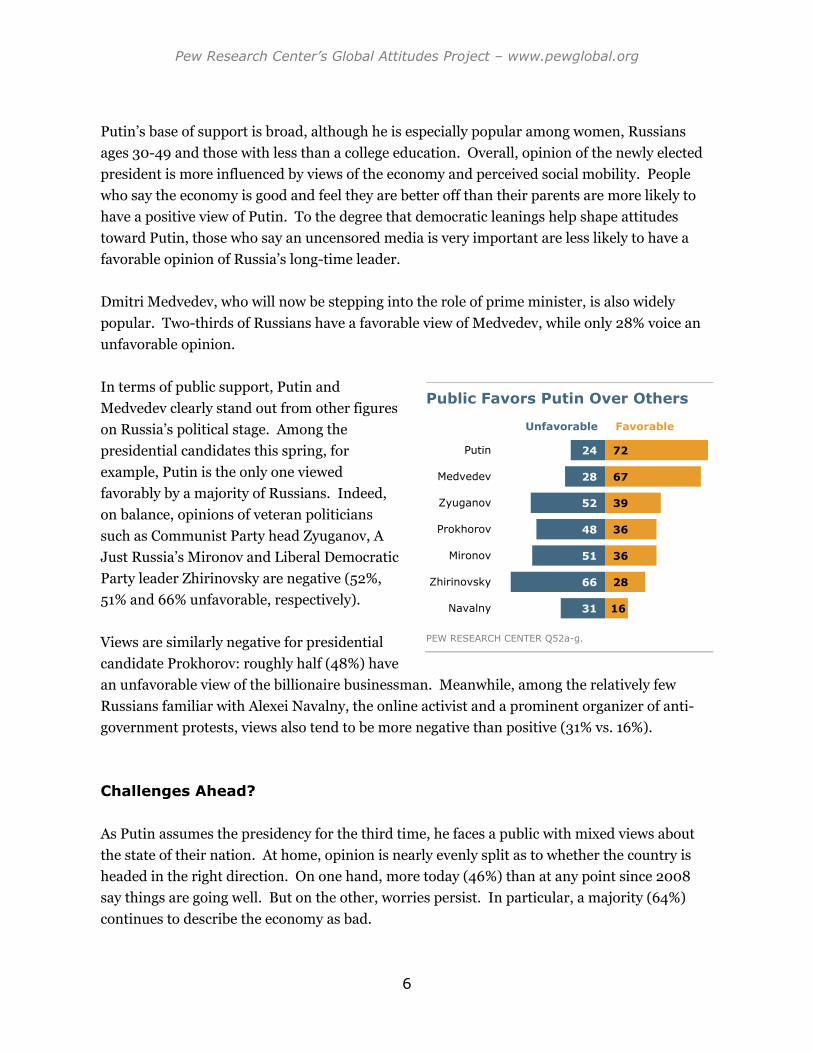
Putin’s base of support is broad, although he is especially popular among women, Russians
ages 30-49 and those with less than a college education. Overall, opinion of the newly elected
president is more influenced by views of the economy and perceived social mobility. People
who say the economy is good and feel they are better off than their parents are more likely to
have a positive view of Putin. To the degree that democratic leanings help shape attitudes
toward Putin, those who say an uncensored media is very important are less likely to have a
favorable opinion of Russia’s long-time leader.
Dmitri Medvedev, who will now be stepping into the role of prime minister, is also widely
popular. Two-thirds of Russians have a favorable view of Medvedev, while only 28% voice an
unfavorable opinion.
In terms of public support, Putin and
Medvedev clearly stand out from other figures
on Russia’s political stage. Among the
presidential candidates this spring, for
example, Putin is the only one viewed
favorably by a majority of Russians. Indeed,
on balance, opinions of veteran politicians
such as Communist Party head Zyuganov, A
Just Russia’s Mironov and Liberal Democratic
Party leader Zhirinovsky are negative (52%,
51% and 66% unfavorable, respectively).
Views are similarly negative for presidential
candidate Prokhorov: roughly half (48%) have
an unfavorable view of the billionaire businessman. Meanwhile, among the relatively few
Russians familiar with Alexei Navalny, the online activist and a prominent organizer of anti-
government protests, views also tend to be more negative than positive (31% vs. 16%).
Challenges Ahead?
As Putin assumes the presidency for the third time, he faces a public with mixed views about
the state of their nation. At home, opinion is nearly evenly split as to whether the country is
headed in the right direction. On one hand, more today (46%) than at any point since 2008
say things are going well. But on the other, worries persist. In particular, a majority (64%)
continues to describe the economy as bad.
Public Favors Putin Over Others
PEW RESEARCH CENTER Q52a-g.
Pew Research Center’s Global Attitudes Project – www.pewglobal.org
7
53
4440
31
Russia should be for Russians
It's natural for Russia to have an empire
Agree Disagree
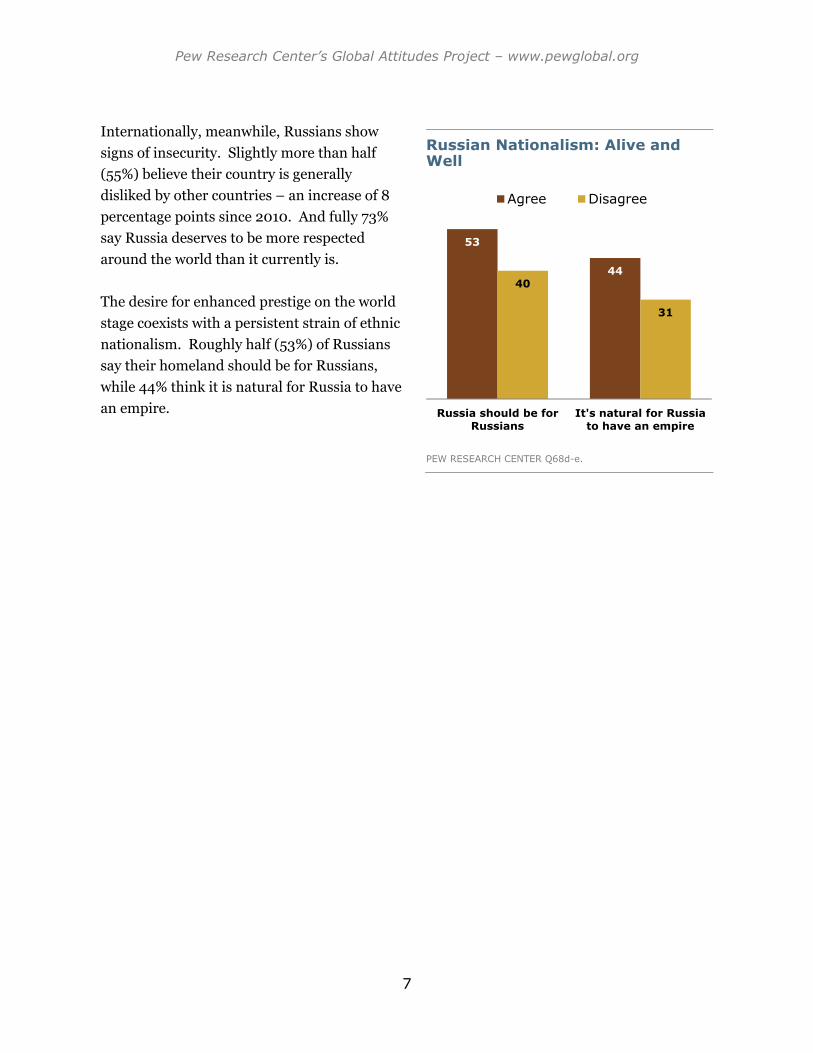
Internationally, meanwhile, Russians show
signs of insecurity. Slightly more than half
(55%) believe their country is generally
disliked by other countries – an increase of 8
percentage points since 2010. And fully 73%
say Russia deserves to be more respected
around the world than it currently is.
The desire for enhanced prestige on the world
stage coexists with a persistent strain of ethnic
nationalism. Roughly half (53%) of Russians
say their homeland should be for Russians,
while 44% think it is natural for Russia to have
an empire.
Russian Nationalism: Alive and Well
PEW RESEARCH CENTER Q68d-e.

8
About the Pew Global Attitudes Project The Pew Research Center’s Global Attitudes Project conducts public opinion surveys around the world on a broad array of subjects ranging from people’s assessments of their own lives to their views about the current state of the world and important issues of the day. The project is directed by Andrew Kohut, president of the Pew Research Center, a nonpartisan “fact tank” in Washington, DC, that provides information on the issues, attitudes, and trends shaping America and the world. The Pew Global Attitudes Project is principally funded by The Pew Charitable Trusts. Since its inception in 2001, the Pew Global Attitudes Project has released numerous major reports, analyses, and other releases, on topics including attitudes toward the U.S. and American foreign policy, globalization, terrorism, and democracy. Pew Global Attitudes Project team members include Richard Wike (Associate Director), Juliana Menasce Horowitz, Katie Simmons, Jacob Poushter, and Cathy Barker. Other contributors to the project include Pew Research Center staff members James Bell (Director, International Survey Research), Bruce Stokes (Director, Pew Global Economic Attitudes), and Elizabeth Mueller Gross (Vice President), as well as Bruce Drake, Neha Sahgal, Carroll Doherty, and Michael Dimock. Additional members of the team include Mary McIntosh, president of Princeton Survey Research Associates International, and Mike Mokrzycki. The Pew Global Attitudes Project team regularly consults with survey and policy experts, regional and academic experts, journalists, and policymakers whose expertise provides tremendous guidance in shaping the surveys. The Pew Global Attitudes Project’s co-chairs are on leave through 2012. The project is co-chaired by former U.S. Secretary of State Madeleine K. Albright, currently principal, the Albright Stonebridge Group, and by former Senator John C. Danforth, currently partner, Bryan Cave LLP. All of the project’s reports and commentaries are available at www.pewglobal.org. The data are also made available on our website within two years of publication. Findings from the project are also analyzed in America Against the World: How We Are Different and Why We Are Disliked by Andrew Kohut and Bruce Stokes, published by Times Books. A paperback edition of the book was released in May 2007. For further information, please contact: Richard Wike Associate Director, Pew Global Attitudes Project 202.419.4400 / [email protected]
Pew Global Attitudes Project Public Opinion Surveys
Survey Sample Interviews
Summer 2002 44 Nations 38,263
November 2002 6 Nations 6,056
March 2003 9 Nations 5,520
May 2003 21 Publics* 15,948
Spring 2004 9 Nations 7,765
Spring 2005 17 Nations 17,766
Spring 2006 15 Nations 16,710
Spring 2007 47 Publics* 45,239
Spring 2008 24 Nations 24,717
Spring 2009 25 Publics* 26,397
Fall 2009 14 Nations 14,760
Spring 2010 22 Nations 24,790
Spring 2011 23 Publics* 29,100
Spring 2012 21 Nations 26,210
* Includes the Palestinian territories.

9
2027 26 23
3236
54
2734 32
46
7164
69 71
6256
43
6559 60
45
0
20
40
60
80
100
2002 2004 2006 2008 2010 2012
Satisfied Dissatisfied
1. National Conditions Russians are divided about the direction of their country. Slightly less than half are satisfied
with the way things are going, while about the same number are dissatisfied.
Russians also offer a mixed assessment of their own economic progress. Roughly as many say
they are better off compared with five years ago, as say they are worse off. Views on the
current economy are much clearer though, with a majority describing it as bad, and relatively
few expecting to see improvements over the next 12 months.
Public Divided on Country Direction
Russians are nearly evenly
split on the question of their
country’s direction: 46% say
they are satisfied with the
way things are going in their
country, while 45% say they
are dissatisfied. Another 9%
do not have a definite
opinion.
Although divided, the mood
of the Russian public is much
improved from a year ago,
when only 32% were satisfied
with the country’s direction,
compared with six-in-ten
who were not. In fact,
satisfaction with Russia’s direction is at its highest level since 2008.
Politics seem to be a factor in whether people feel the country is headed in a positive direction.
For instance, among Russians who view Putin favorably, 55% say they are satisfied with the
way things are going in their country, while only 37% are dissatisfied. In contrast, those who
have an unfavorable opinion of Putin are roughly four times as likely to say they are unhappy
as happy with the country’s direction (71% dissatisfied vs. 18% satisfied).
Satisfaction With Country Direction
PEW RESEARCH CENTER Q2.

Pew Research Center’s Global Attitudes Project – www.pewglobal.org
10
13
38
52
20
3329
32
83
56
43
7665 65 64
0
20
40
60
80
100
2002 2007 2008 2009 2010 2011 2012
Good Bad
Better off32%
Worse off29%
About the same
36%
DK3%
Asked how their financial situation compares with five years
ago, about a third of Russians (32%) say they and their families
are better off today, while 36% say their situation has not
changed. Roughly three-in-ten (29%), meanwhile, report being
worse off than they were five years ago.
Notably, Russians who say they and their families are better off
tend to be the more upbeat about the country’s direction.
Roughly six-in-ten (63%) in this group are satisfied with the
way things are going in Russia, whereas only 42% of those who
say their situation is unchanged share this view. Among those
who report being worse off today, even fewer (31%) are
satisfied with the country’s direction.
Views of the National Economy
The Russian public’s
assessment of the current
economy is decidedly
negative. Only about a third
(32%) describe the current
economic situation as good,
little changed from the last
few years.
Negative views of the
economy are especially
common among those who
are financially worse off
compared with five years ago
(72% bad) and those who say
their financial situation is
about the same as five years
ago (70%). Meanwhile, Russians who feel they are better off today are divided on the
economy: 48% good vs. 47% bad.
Compared to Five Years Ago, Are You Financially…
PEW RESEARCH CENTER Q20.
Most Say Current Economic Conditions Are Bad
PEW RESEARCH CENTER Q14.

Pew Research Center’s Global Attitudes Project – www.pewglobal.org
11
Improve31%
Remain the same44%
Worsen15%
DK9%
Overall, just 31% of Russians believe the economic situation
will improve over the next 12 months, while 44% think it will
remain the same. About one-in-six (15%) predict the economy
will worsen in the coming year.
Among Russians who say they are better off than they were five
years ago, predictions for the future are a bit brighter. Roughly
half (51%) in this group believe the economy will improve over
the next year, while roughly a third (35%) expect the situation
to remain the same and just 9% foresee worse times ahead.
By contrast, among those who say their circumstances have
grown worse, only about a quarter (23%) expect the economy
to improve.
Over Next 12 Months, Economy Will…
PEW RESEARCH CENTER Q15.

12
Satisfied56% Dissatisfied
33%
DK10%
Fair47%
Not fair35%
DK18%
2. Reaction to Presidential Election, Protests
On balance, Vladimir Putin’s first-round victory in the March
4th presidential vote appears to sit well with most Russians,
with a majority saying they are satisfied with the results of the
election.
Views on the fairness of the election, however, are more mixed.
Only a plurality believe the presidential election was “clean,”
while a substantial minority question the integrity of the
balloting, and almost one-in-five are unsure.
Overall, a clear majority of Russians endorse the notion that
protests and demonstrations provide people an opportunity to
express their opinion about how government runs things. And
most – including many Putin-backers – say they support the
fair-elections protests that began in the wake of the December
2011 parliamentary vote.
Interestingly, compared with a few years ago, more Russians
today see their vote as a way to communicate their opinion
about governance, even as many continue to doubt elected
officials actually pay heed to what average citizens think.
Views on the Presidential Vote
A modest majority of Russians (56%) say they are satisfied with
the results of the March 4th election, while a third say they are
not. One-in-ten do not offer an opinion.
Views on the fairness of the election are more mixed. Just 47% believe balloting was free from
manipulation, while roughly a third (35%) disagree and 18% are uncertain.
The perceived fairness of the March 4th vote is a key factor influencing satisfaction with the
outcome. Nearly nine-in-ten (87%) who think the election was fair say they are satisfied with
the outcome. By contrast, only one-in-five who believe the vote was unfair say the same.
Most Satisfied With Presidential Election
But Fewer Sure Vote Was Fair
PEW RESEARCH CENTER QRUS1 & QRUS2.
Pew Research Center’s Global Attitudes Project – www.pewglobal.org
13
Russians who are unsure whether the election was fair, meanwhile, tend to be somewhat
content with Putin’s victory (46% satisfied vs. 23% dissatisfied).
As one might expect, Russians who hold a favorable opinion of Putin generally express
satisfaction with the March 4th election results: 71% in this group are pleased with the former
president’s victory, while just 20% are not. The inverse is true among those who have a
negative view of Putin – only 17% express satisfaction with the election outcome, compared
with 72% who are dissatisfied.
Reaction to the election is also split along party lines. Nearly eight-in-ten Russians (78%) who
identify with United Russia, Putin’s governing party, say they are satisfied with the March vote,
while only 16% are displeased. By contrast, only 31% among those aligned with the
Communist Party are satisfied with the election results, compared with nearly six-in-ten (58%)
who are not. Reaction to Putin’s victory is more divided among Russians aligned with other
parties (41% satisfied, 50% dissatisfied) or no party (46% satisfied, 37% dissatisfied).
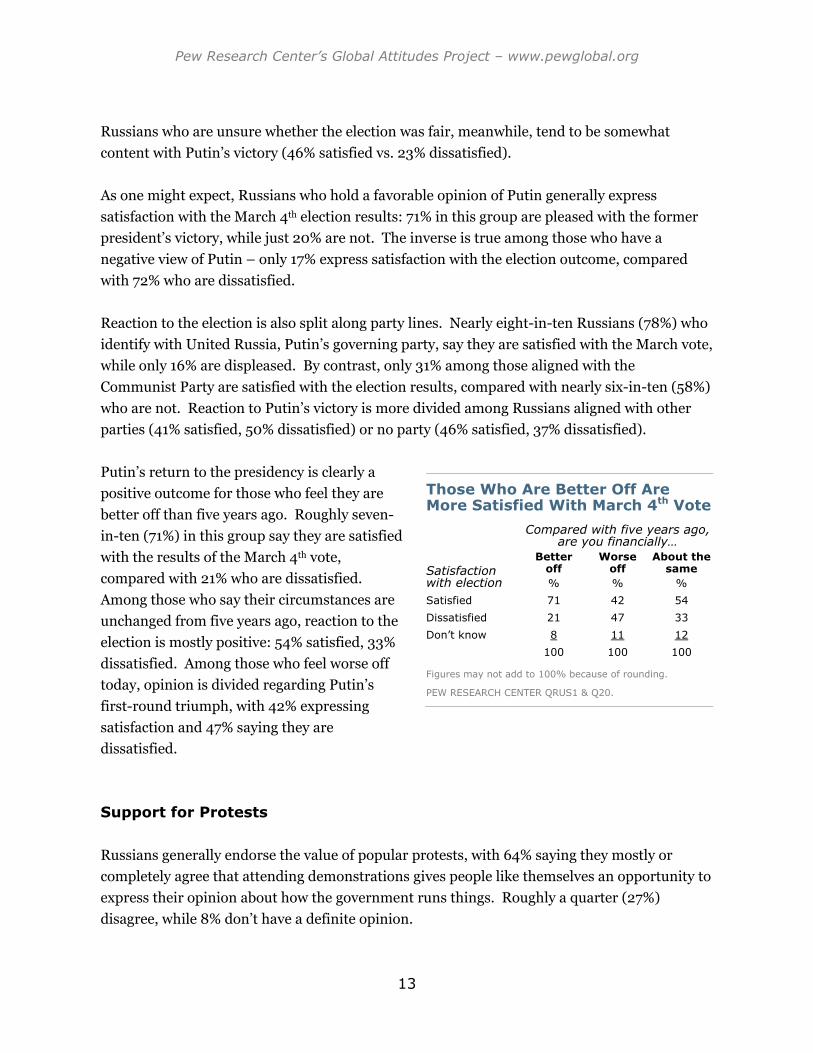
Putin’s return to the presidency is clearly a
positive outcome for those who feel they are
better off than five years ago. Roughly seven-
in-ten (71%) in this group say they are satisfied
with the results of the March 4th vote,
compared with 21% who are dissatisfied.
Among those who say their circumstances are
unchanged from five years ago, reaction to the
election is mostly positive: 54% satisfied, 33%
dissatisfied. Among those who feel worse off
today, opinion is divided regarding Putin’s
first-round triumph, with 42% expressing
satisfaction and 47% saying they are
dissatisfied.
Support for Protests
Russians generally endorse the value of popular protests, with 64% saying they mostly or
completely agree that attending demonstrations gives people like themselves an opportunity to
express their opinion about how the government runs things. Roughly a quarter (27%)
disagree, while 8% don’t have a definite opinion.
Those Who Are Better Off Are More Satisfied With March 4th Vote
Compared with five years ago,
are you financially…
Satisfaction with election
Better off
Worse off
About the same
% % % Satisfied 71 42 54 Dissatisfied 21 47 33 Don’t know 8 11 12 100 100 100
Figures may not add to 100% because of rounding.
PEW RESEARCH CENTER QRUS1 & Q20.

Pew Research Center’s Global Attitudes Project – www.pewglobal.org
14
Asked specifically about the protests that arose
in the wake of the December parliamentary
vote, a 56%-majority say they support the
protests, compared with a third who oppose
the demonstrations and one-in-ten who do not
offer an opinion.
Only a quarter of the Russian public subscribes
to the view that the protests of the last several
months are the result of Western powers
attempting to destabilize Russia. Rather,
nearly six-in-ten (58%) believe the
demonstrations emanate from genuine
Russian dissatisfaction with the conduct of
elections.
Support for the recent protests is somewhat higher among men than women (61% vs. 52%).
People with at least a college education are more supportive than those with secondary
education or less (63% vs. 49%).
Notably, Russians who have a favorable opinion of Putin are divided over the issue of the fair-
election protests (48% support vs. 42% oppose), while those who view Putin unfavorably
clearly back the protesters (79% support vs. 12% oppose). Similarly, those who question the
integrity of the March 4th presidential vote clearly come out in favor of the demonstrators by a
74% to 17% margin. Meanwhile, those who believe the election was fair tend to object to the
protests (41% support vs. 51% oppose).
Voting Matters
Against the backdrop of protests demanding “clean” elections, a majority of (56%) of Russians
say that voting gives people like themselves an opportunity to express their opinion about how
government runs things. Just over a third (37%) disagree.
Compared with previous years, belief in the importance of voting has strengthened. In 1991,
for example, when Russians were first asked if voting gave people a voice, opinion
Public Backs Protests
Attending protests gives people an opportunity to express their opinion
2012 %
Agree 64 Disagree 27 Don’t know 8 Support for protests for fair elections Support 56 Oppose 33 Don’t know 10
Protests result of Western efforts or genuine dissatisfaction?
Western efforts 25 Genuine dissatisfaction 58 Don’t know 17
PEW RESEARCH CENTER Q68c, Q82, & Q82b.

Pew Research Center’s Global Attitudes Project – www.pewglobal.org
15
4744
56
43
54
37
1991 2009 2012
Agree Disagree
was divided: 47% said yes, while 43% said no.
By 2009, the public had actually soured
somewhat toward the ballot box, with 44%
saying their vote mattered, but more than half
(54%) saying it did not.
Today, attitudes toward voting are fairly
consistent across demographic groups. In
terms of change over time, however, one of the
most dramatic increases has occurred among
Russians age 30 and older. In 2009, just 42%
of those 30-49 and 38% of those over 50 felt
their vote mattered. Today, 55% and 61%,
respectively, feel this is true. Among young
people, meanwhile, attitudes toward voting
have remained about the same: in 2009, 54%
of 18-29 year olds said voting gave them a
voice; today, roughly the same number (51%)
still hold this view.
Despite the increased importance placed on
voting, Russians are not convinced that their
voices matter to those in power. Six-in-ten, for
instance, doubt that elected officials care what
people like themselves think, while just a third
believe elected office-holders care about public
opinion.
Though a minority, the number of Russians
who believe elected officials care about
citizens’ views is actually higher than in years
past. In 2009, only about a quarter (26%) held
this view, while in 1991 just 18% thought this
was the case.
More Agree That Voting Gives People an Opportunity to Express Their Opinion About Government
As asked in 2012, 2009, and 1991 the question has reflected the Russian translation: “Voting gives people like me an opportunity to express their opinion about how the government runs things.” In 2009 and 1991, the translation was reported as, “Voting gives people like me some say about how the government runs things”.
PEW RESEARCH CENTER Q68b.
More Older Russians Value Voting % Agree voting is chance to express
own opinion 2009 2012 Change Age % % % 18-29 54 51 -3 30-49 42 55 +13 50+ 38 61 +23
As asked in 2012, 2009, and 1991 the question has reflected the Russian translation: “Voting gives people like me an opportunity to express their opinion about how the government runs things.” In 2009 and 1991, the translation was reported as, “Voting gives people like me some say about how the government runs things”.
PEW RESEARCH CENTER Q68b.

16
75
71
71
52
52
49
44
43
41
Law and order
Fair judiciary
Economic prosperity
Uncensored media
Honest elections
Religious freedom
Free speech
Uncensored access to internetCivilian-controlled
military
% Very important
3. Attitudes Toward Democracy
Most Russians continue to express discontent about the way democracy is working in their
country. And there is a continued clear lack of confidence in the capacity of democracy to solve
the country’s problems – nearly six-in-ten say a strong leader is better suited for dealing with
the nation’s challenges than a democratic government.
Moreover, economics tends to trump
democracy as a top priority for most Russians.
When asked to choose between a good
democracy and a strong economy, three-in-
four pick the latter. Economic prosperity –
along with law and order – is considered a
more important priority than nearly all of the
democratic rights and institutions tested on
the survey.
Still, Russians value many features of
democracy, such as a fair judicial system,
competitive elections, an uncensored media,
and free expression. Indeed, today they place a
higher premium on these democratic freedoms
than was the case three years ago.
Few Russians, however, believe their country has the institutions and liberties they desire. As
previous Pew Global Attitudes surveys have highlighted, there is a significant “democracy gap”
in Russia between citizens’ democratic
aspirations and the reality of their current
political system.
Most Dissatisfied With Democracy
Roughly six-in-ten Russians (63%) are
dissatisfied with the way democracy is working
in their country, unchanged from one year ago.
About three-in-ten (31%) say they are satisfied
and 6% offer no opinion.
Top Priorities
PEW RESEARCH CENTER Q69a-i.
Those Who Are Better Off Are More Satisfied With Democracy
Compared with five years ago,
are you financially…
Satisfaction with democracy
Better off
Worse off
About the same
% % % Satisfied 46 22 24 Dissatisfied 50 71 67 Don’t know 3 6 9 100 100 100
Figures may not add to 100% because of rounding.
PEW RESEARCH CENTER Q20 & Q73.

Pew Research Center’s Global Attitudes Project – www.pewglobal.org
17
51
31
2128 29 27
3329
32 3239
51
7066
61 6357 60 57 57
0
20
40
60
80
100
1991 1992 2002 2005 2006 2007 2008 2009 2011 2012
Democracy Strong leader
Views on this question are linked to whether Russians believe they made financial progress
over the last five years. Nearly half (46%) of those who say they are better off financially today
than they were five years ago are satisfied with the way democracy is working, compared with
just 22% of those who are worse off and 24% of Russians who say their financial situation is
about the same as it was five years ago.
Democracy vs. Strong Leader
Amid widespread disillusionment about how democracy is working, 57% say "a leader with a
strong hand" is better equipped to solve the country's problems than a democratic form of
government. Just 32% think a democratic government is better suited for dealing with these
challenges.
This is unchanged from 2011,
though the percentage
expressing confidence in a
strong leader is down
significantly from a decade
ago, when 70% held this
view.
Russians have not always
expressed so little faith in
democracy. Two decades
ago, as the Soviet Union was
dissolving, a spring
1991 survey by the Times
Mirror Center (the
predecessor of the Pew
Research Center) found 51%
of Russians preferring a
democratic form of
government and 39% favoring a strong hand. But by the fall of 1992, that had flipped to 51%
favoring a strong leader and 31% preferring democratic government.
Most Say Strong Leader Can Solve Russia’s Problems
PEW RESEARCH CENTER Q71.

Pew Research Center’s Global Attitudes Project – www.pewglobal.org
18
11 14 15 1421 19
80 8174
7873 75
0
20
40
60
80
100
2002 2005 2007 2009 2011 2012
Good democracyStrong economy
Education is strongly correlated with views on
this issue. Among Russians with a college
education, opinions are closely divided: 43%
favor a democratic government, while 47%
endorse a strong leader. Among those with
less education, only 28% choose democracy
and roughly six-in-ten say the country should
rely on a strong leader.
Democracy vs. Strong Economy
If forced to choose, three-in-four Russians say
a strong economy is more important than a
good democracy. Only 19% place a higher
priority on democracy, while 7% do not have
an opinion. This is basically unchanged from
one year ago, when 73% said a strong economy
was more important.
In fact, views on this question have been fairly
stable over the past decade, although the
percentage who prioritize democracy has crept
up slightly from the 11% registered in 2002.
College Educated Divided Over Democracy v. Strong Leader
Education
Russia should rely on…
Secondary or less
Vocational/Some
college College or more
% % % Democracy 28 28 43 Strong leader 62 60 47 Don’t know 10 11 10 100 100 100
Figures may not add to 100% because of rounding.
PEW RESEARCH CENTER Q71.
Russians Consistently Say Economy More Important Than Democracy
PEW RESEARCH CENTER Q72.
Pew Research Center’s Global Attitudes Project – www.pewglobal.org
19
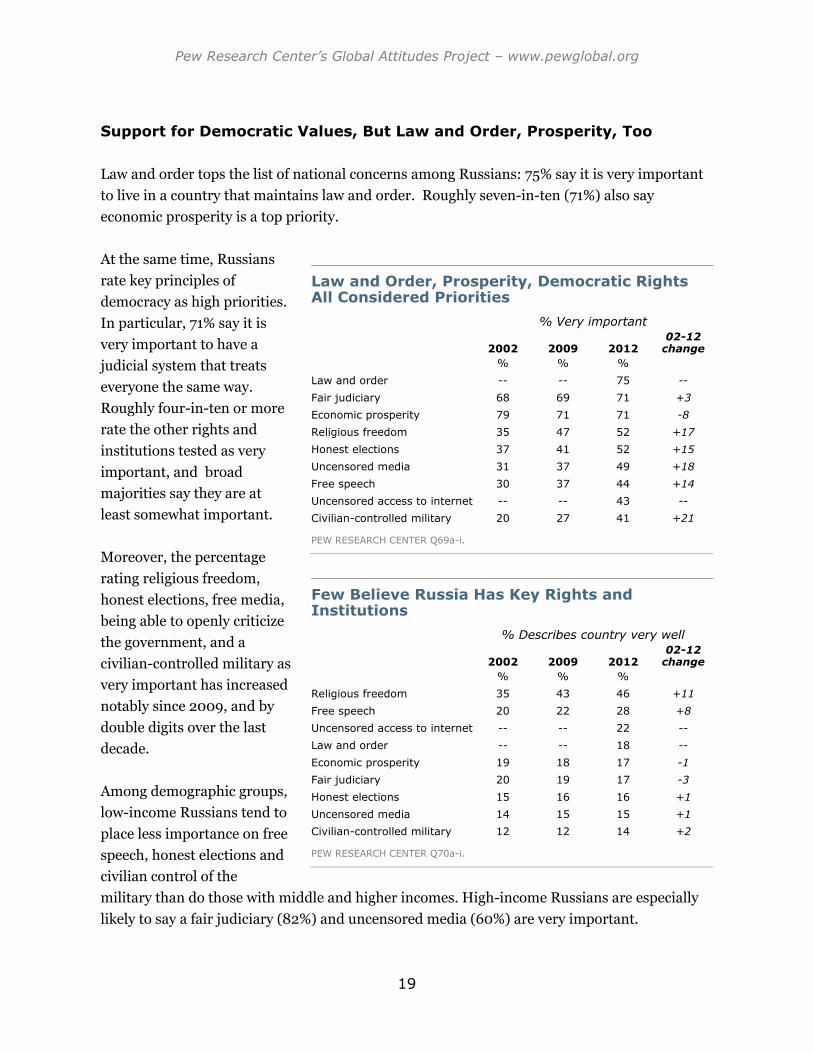
Support for Democratic Values, But Law and Order, Prosperity, Too
Law and order tops the list of national concerns among Russians: 75% say it is very important
to live in a country that maintains law and order. Roughly seven-in-ten (71%) also say
economic prosperity is a top priority.
At the same time, Russians
rate key principles of
democracy as high priorities.
In particular, 71% say it is
very important to have a
judicial system that treats
everyone the same way.
Roughly four-in-ten or more
rate the other rights and
institutions tested as very
important, and broad
majorities say they are at
least somewhat important.
Moreover, the percentage
rating religious freedom,
honest elections, free media,
being able to openly criticize
the government, and a
civilian-controlled military as
very important has increased
notably since 2009, and by
double digits over the last
decade.
Among demographic groups,
low-income Russians tend to
place less importance on free
speech, honest elections and
civilian control of the
military than do those with middle and higher incomes. High-income Russians are especially
likely to say a fair judiciary (82%) and uncensored media (60%) are very important.
Law and Order, Prosperity, Democratic Rights All Considered Priorities
% Very important
2002 2009 2012 02-12
change % % % Law and order -- -- 75 -- Fair judiciary 68 69 71 +3 Economic prosperity 79 71 71 -8 Religious freedom 35 47 52 +17 Honest elections 37 41 52 +15 Uncensored media 31 37 49 +18 Free speech 30 37 44 +14 Uncensored access to internet -- -- 43 -- Civilian-controlled military 20 27 41 +21
PEW RESEARCH CENTER Q69a-i.
Few Believe Russia Has Key Rights and Institutions
% Describes country very well
2002 2009 2012 02-12
change % % % Religious freedom 35 43 46 +11 Free speech 20 22 28 +8 Uncensored access to internet -- -- 22 -- Law and order -- -- 18 -- Economic prosperity 19 18 17 -1 Fair judiciary 20 19 17 -3 Honest elections 15 16 16 +1 Uncensored media 14 15 15 +1 Civilian-controlled military 12 12 14 +2
PEW RESEARCH CENTER Q70a-i.
Pew Research Center’s Global Attitudes Project – www.pewglobal.org
20
While Russians tend to value key elements of democracy, relatively few think their country
currently has these features. Only 28% say having freedom of speech describes Russia very
well, and roughly one-in-five or fewer say this about uncensored internet access, a fair judicial
system, competitive elections, free media, and civilian control of the military. The exception is
religious freedom – nearly half says this describes Russia very well. And unlike most of the
other aspects of democracy included on the survey, more Russians now believe their country
has religious freedom than was the case a decade ago.
In addition to lacking important democratic characteristics, Russians also tend to believe their
country lacks law and order (only 18% say this describes Russia very well) and economic
prosperity (17%).
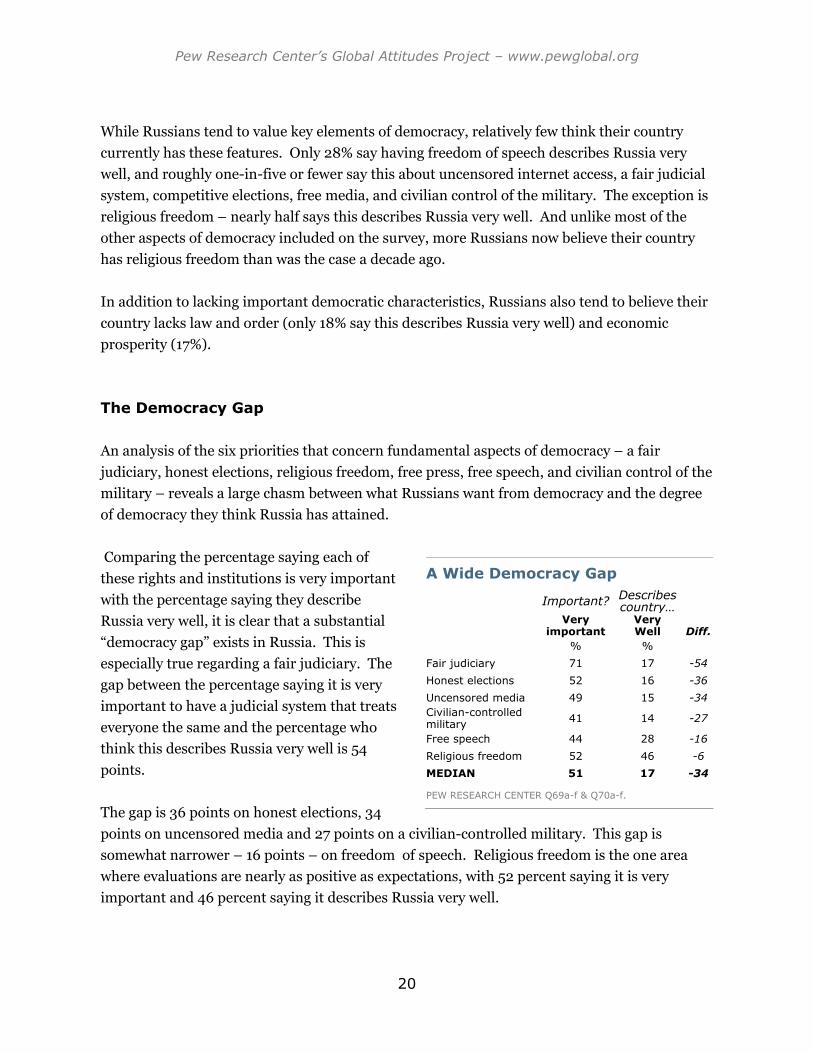
The Democracy Gap
An analysis of the six priorities that concern fundamental aspects of democracy – a fair
judiciary, honest elections, religious freedom, free press, free speech, and civilian control of the
military – reveals a large chasm between what Russians want from democracy and the degree
of democracy they think Russia has attained.
Comparing the percentage saying each of
these rights and institutions is very important
with the percentage saying they describe
Russia very well, it is clear that a substantial
“democracy gap” exists in Russia. This is
especially true regarding a fair judiciary. The
gap between the percentage saying it is very
important to have a judicial system that treats
everyone the same and the percentage who
think this describes Russia very well is 54
points.
The gap is 36 points on honest elections, 34
points on uncensored media and 27 points on a civilian-controlled military. This gap is
somewhat narrower – 16 points – on freedom of speech. Religious freedom is the one area
where evaluations are nearly as positive as expectations, with 52 percent saying it is very
important and 46 percent saying it describes Russia very well.
A Wide Democracy Gap
Important? Describes country…
Very
important Very Well Diff.
% % Fair judiciary 71 17 -54 Honest elections 52 16 -36 Uncensored media 49 15 -34 Civilian-controlled military 41 14 -27
Free speech 44 28 -16 Religious freedom 52 46 -6 MEDIAN 51 17 -34
PEW RESEARCH CENTER Q69a-f & Q70a-f.

Pew Research Center’s Global Attitudes Project – www.pewglobal.org
21
33
41 39
51
1823
18 17
0
20
40
60
2002 2007 2009 2012
Very importantDescribes Russia very well
Looking at the median percentage each year
who say these rights and institutions are very
important and comparing it with the median
percentage who believe these rights and
institutions describe Russia very well, it is
possible to discern a democracy gap that has
widened over time as Russians consistently
report the absence of democracy on the
ground, even as more place a value on political
freedom.
Democracy Gap Has Grown Since 2009
Medians of six democracy principles: free speech, honest elections, fair judiciary, civilian-controlled military, uncensored media and religious freedom.
PEW RESEARCH CENTER Q69a-f, Q70a-f.

22
72
67
39
36
36
28
16
Putin
Medvedev
Zyuganov
Prokhorov
Mironov
Zhirinovsky
Navalny
DK4%
Favorable72%
Unfavorable24%
4. Views of Leaders
Just months after controversial parliamentary
and presidential elections in Russia, the
country’s two top leaders, President Vladimir
Putin and Prime Minister Dmitri Medvedev,
enjoy solidly favorable ratings among the
Russian public.
Democratic stirrings among the public
notwithstanding, the survey finds that
favorable views of Putin are influenced first
and foremost by economic factors: people who
say the economy is good or feel they are better
off than their parents are more likely to have a
positive opinion of Putin. To the degree that
democratic values factor into attitudes toward Putin, those who say an uncensored media is
important are less likely to have a positive view of the third-term president.
Other figures on Russia’s political stage barely hold a candle to Putin. Russians generally have
negative views of Putin’s challengers from the March 2012 presidential election, especially the
outspoken nationalist politician Vladimir Zhirinovsky. Alexei Navalny, a critic of Putin and
one of the lead organizers of demonstrations protesting recent elections, is unknown to more
than half of the Russian public.
Putin and Medvedev Widely Popular Vladimir Putin is well liked by most Russians, with roughly
seven-in-ten (72%) offering a favorable opinion of the recently
re-elected president. Only about a quarter (24%) of
respondents have an unfavorable view of the Russian leader.
Putin is broadly popular, but especially so among women, those
ages 30-49 and those with less than secondary education (75%,
75% and 77% favorable, respectively).
Overall, assessments of the national economy and social
Ratings of Russian Leaders % Favorable
PEW RESEARCH CENTER Q52a-g.
Views of Putin
PEW RESEARCH CENTER Q52b.

Pew Research Center’s Global Attitudes Project – www.pewglobal.org
23
0.21
0.14
Economic situation
Standard of living compared to parents
Presence of law and order
Importance of democratic rights
mobility play the greatest role in shaping
attitudes toward Putin. Those who say the
economy is in good shape and those who feel
that they are better off than their parents are
more likely to have a favorable opinion of the
third-term president. To the extent that
popular views of Putin are shaped by
democratic aspirations, people who place
importance on a media free from censorship
are less likely to have a positive opinion of
Putin.
Medvedev, the second half of what some have
referred to as Russia’s leadership tandem, is
also widely popular.
Two-thirds of Russians have a favorable view
of Medvedev, while only 28% voice an
unfavorable opinion. Like Putin, Medvedev is
broadly popular across demographic groups,
while his ratings jump to 88% among Russians
who either have a favorable view of Vladimir
Putin or support Putin’s political party, United
Russia. By contrast, among those with an
unfavorable view of Putin only 12% support
Medvedev.
When it comes to how much confidence the
Russian people have in Medvedev’s handling of
world affairs, 59% say they have a lot or some
confidence in his ability to do the right thing,
while a third express not too much or no
confidence. This is a decline from 2011 when
70% of Russians said they had confidence in Medvedev to handle world affairs and an even
larger drop from 2009, when 76% of Russians expressed confidence in him.
The public’s confidence in Medvedev is slightly less than that for Putin: 69% have confidence
in Putin’s handling of world affairs, while about a quarter (24%) do not.
Women, Older, and Less Educated More Favorable Toward Putin Favorable Unfavorable % % Total 72 24 Gender Men 69 27 Women 75 21 Age 18-29 66 30 30-49 75 21 50+ 74 23 Education Secondary or less 77 20 Vocational/Some college 73 23 College or more 68 29
PEW RESEARCH CENTER Q52b.
Opinions that Matter the Most to Putin’s Popularity
Relative influence of each factor
The number shown is the difference in the probability of favoring Putin between selected groups within each variable. For example, the probability of favoring Putin is 0.90 for those who say the economic situation is good, compared with 0.69 for those who say it is bad, a difference of 0.21. See appendix for more details on this analysis.
PEW RESEARCH CENTER Q14, Q64b, Q70h, Q69a-f.
Pew Research Center’s Global Attitudes Project – www.pewglobal.org
24
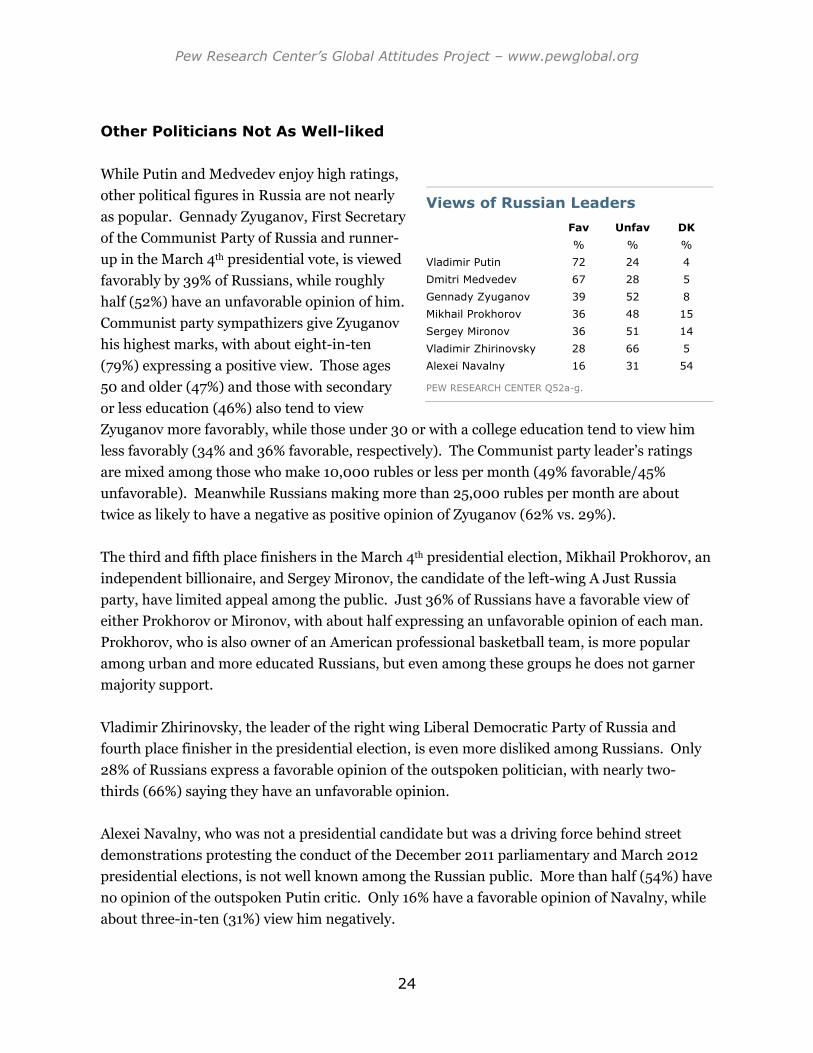
Other Politicians Not As Well-liked While Putin and Medvedev enjoy high ratings,
other political figures in Russia are not nearly
as popular. Gennady Zyuganov, First Secretary
of the Communist Party of Russia and runner-
up in the March 4th presidential vote, is viewed
favorably by 39% of Russians, while roughly
half (52%) have an unfavorable opinion of him.
Communist party sympathizers give Zyuganov
his highest marks, with about eight-in-ten
(79%) expressing a positive view. Those ages
50 and older (47%) and those with secondary
or less education (46%) also tend to view
Zyuganov more favorably, while those under 30 or with a college education tend to view him
less favorably (34% and 36% favorable, respectively). The Communist party leader’s ratings
are mixed among those who make 10,000 rubles or less per month (49% favorable/45%
unfavorable). Meanwhile Russians making more than 25,000 rubles per month are about
twice as likely to have a negative as positive opinion of Zyuganov (62% vs. 29%).
The third and fifth place finishers in the March 4th presidential election, Mikhail Prokhorov, an
independent billionaire, and Sergey Mironov, the candidate of the left-wing A Just Russia
party, have limited appeal among the public. Just 36% of Russians have a favorable view of
either Prokhorov or Mironov, with about half expressing an unfavorable opinion of each man.
Prokhorov, who is also owner of an American professional basketball team, is more popular
among urban and more educated Russians, but even among these groups he does not garner
majority support.
Vladimir Zhirinovsky, the leader of the right wing Liberal Democratic Party of Russia and
fourth place finisher in the presidential election, is even more disliked among Russians. Only
28% of Russians express a favorable opinion of the outspoken politician, with nearly two-
thirds (66%) saying they have an unfavorable opinion.
Alexei Navalny, who was not a presidential candidate but was a driving force behind street
demonstrations protesting the conduct of the December 2011 parliamentary and March 2012
presidential elections, is not well known among the Russian public. More than half (54%) have
no opinion of the outspoken Putin critic. Only 16% have a favorable opinion of Navalny, while
about three-in-ten (31%) view him negatively.
Views of Russian Leaders Fav Unfav DK % % % Vladimir Putin 72 24 4 Dmitri Medvedev 67 28 5 Gennady Zyuganov 39 52 8 Mikhail Prokhorov 36 48 15 Sergey Mironov 36 51 14 Vladimir Zhirinovsky 28 66 5 Alexei Navalny 16 31 54
PEW RESEARCH CENTER Q52a-g.

25
53
4440
31
Russia should be for Russians
It's natural for Russia to have an empire
Agree Disagree
5. Nationalism and Russia’s Global Image
Nationalism remains a potent sentiment among Russians today, and a plurality believe it’s
natural for the country to have an empire. At the same time, the prevailing view is that Russia
is more disliked than liked around the world, while nearly three-in-four say their country
deserves greater respect internationally.
Russian Nationalism
Roughly half of Russians (53%) agree that their
homeland should be for Russians only; four-in-
ten disagree. The public voiced a similar
degree of ethnic chauvinism in 2009, when
54% said “Russia should be for Russians.” In
contrast, when the Soviet Union was in its last
throes in 1991, 69% disagreed and only 26%
agreed with that notion that Russia should be
exclusively for Russians.
Along with strains of ethnic nationalism, the
image of Russia as an imperial power persists
among a substantial number of Russians
today. A 44%-plurality say it’s natural for their
country to have an empire, compared with 31%
who disagree and a quarter who do not have a
definite opinion. In 2009, roughly the same number (47%) felt it was natural for Russia to
have its own empire. Two decades ago, with the Soviet Union on the verge of collapse, only
37% shared this view.
Notably, Russians who admire Vladimir Putin are not especially adamant about their country’s
imperial claims. Among those with a favorable opinion of Putin, 45% think it’s natural for
their country to have an empire, compared with 43% among those who have a negative opinion
of the Russian president.
Russian Nationalism Still Alive
PEW RESEARCH CENTER Q68d-e.

Pew Research Center’s Global Attitudes Project – www.pewglobal.org
26
Russia is as respected as it should be
16%
Russia should be more respected
73%
Both/Neither (Vol)9%
DK2%
Russia’s International Image
A little more than half of Russians (55%) think
people in other countries generally dislike
Russia. This is up from 47% in 2010, but
comparable to the 57% who expressed the
same view in 2005. Today, 31% say Russia
generally is liked around the world, while 14%
give no opinion.
Nearly three-in-four Russians (73%) say their
country should be more respected around the
world; only 16% believe that internationally
Russia is as respected as it should be.
The sense that Russia deserves greater respect
from other countries is fairly constant across
age, education and income groups.
More Say Russia Disliked Around World
2005 2010 2012 10-12
Change % % % Generally liked 32 36 31 -5 Generally disliked 57 47 55 +8 Don’t know 11 17 14 -3
PEW RESEARCH CENTER QRUS3.
Russians Feel Lack of Respect Around the world…
PEW RESEARCH CENTER QRUS4.
27
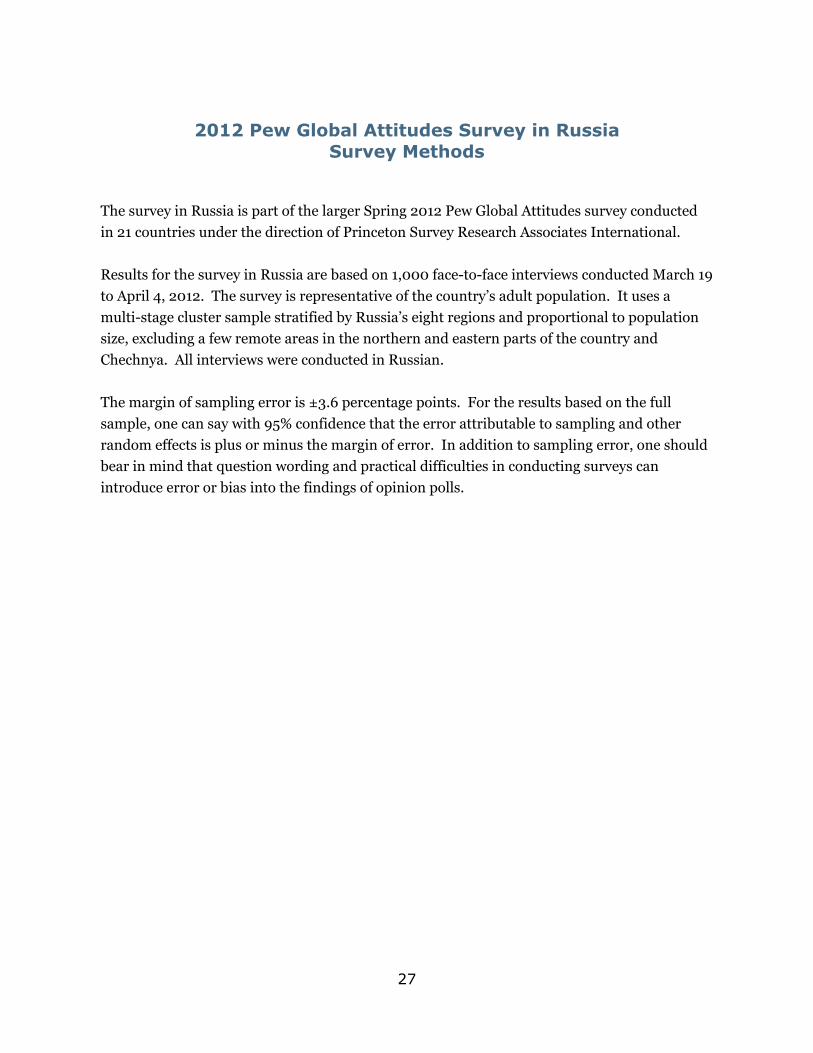
2012 Pew Global Attitudes Survey in Russia Survey Methods
The survey in Russia is part of the larger Spring 2012 Pew Global Attitudes survey conducted
in 21 countries under the direction of Princeton Survey Research Associates International.
Results for the survey in Russia are based on 1,000 face-to-face interviews conducted March 19
to April 4, 2012. The survey is representative of the country’s adult population. It uses a
multi-stage cluster sample stratified by Russia’s eight regions and proportional to population
size, excluding a few remote areas in the northern and eastern parts of the country and
Chechnya. All interviews were conducted in Russian.
The margin of sampling error is ±3.6 percentage points. For the results based on the full
sample, one can say with 95% confidence that the error attributable to sampling and other
random effects is plus or minus the margin of error. In addition to sampling error, one should
bear in mind that question wording and practical difficulties in conducting surveys can
introduce error or bias into the findings of opinion polls.
28
Pew Global Attitudes Project 2012 Spring Survey Topline Results
May 23, 2012 Release
Methodological notes:
Survey results are based on a national sample. For further details on sample designs,
see Survey Methods section.
Due to rounding, percentages may not total 100%. The topline “total” columns show
100%, because they are based on unrounded numbers.
Since 2007, the Global Attitudes Project has used an automated process to generate
toplines. As a result, numbers may differ slightly from those published prior to 2007.
Not all questions included in the Spring 2012 survey are presented in this topline.
Omitted questions have either been previously released or will be released in future
reports.

TotalDK/RefusedDissatisfiedSatisfied
Q2 Overall, are you satisfied or dissatisfied with the way things are going in our country today?
Spring, 2012
Spring, 2011
Spring, 2010
Fall, 2009
Spring, 2009
Spring, 2008
Spring, 2007
Spring, 2006
Spring, 2005
Spring, 2004
May, 2003
March, 2003
Summer, 2002
Russia
10097120
10065835
10096427
10056926
10067123
10076232
10095636
10044354
10096527
10066034
10075934
10086032
10094546
TotalDK/RefusedDissatisfiedSatisfied
QRUS1 Overall, were you satisfied or dissatisfied with the results of the March 4th presidential elections?
Spring, 2012Russia 100103356
TotalDK/RefusedNo, not fairYes, fair
QRUS2 Do you think the March 4th presidential elections were fair, or don’t you think so?
Spring, 2012Russia 100183547
TotalDK/RefusedGenerally disliked
Generally liked
QRUS3 How do you think people in other countries of the world feel about Russia? Is Russia generally liked or
disliked?
Spring, 2012
Spring, 2010
Spring, 2005
Russia
100115732
100174736
100145531
TotalDK/RefusedVery badSomewhat
badSomewhat
goodVery good
Q14 Now thinking about our economic situation, how would you describe the current economic situation in Russia – is it very good, somewhat good, somewhat bad or very bad?
Spring, 2012
Spring, 2011
Spring, 2010
Fall, 2009
Spring, 2009
Spring, 2008
Spring, 2007
Summer, 2002
Russia
10042657130
10061145353
1004637475
10052155182
10041850253
10041649303
10061946245
10051549284
29

TotalDK/RefusedWorsen a lotWorsen a little
Remain the same
Improve a little
Improve a lot
Q15 And over the next 12 months do you expect the economic situation in our country to improve a lot, improve a little, remain the same, worsen a little or worsen a lot?
Spring, 2012
Spring, 2011
Spring, 2010
Spring, 2009
Spring, 2008
Summer, 2002
Russia
100751353211
100631039348
100971536275
10073842363
100961246226
100941144265
TotalDK/RefusedAbout the sameWorse offBetter off
Q20 And thinking about how you and your family were doing financially five years ago: Would you say you are better off today than you were five years ago, worse off today, or are you doing about the same today as you were
five years ago?
Spring, 2012Russia 1003362932
TotalDK/Refused
No confidence
at all
Not too much
confidenceSome
confidenceA lot of
confidence
Q40b For each, tell me how much confidence you have in each leader to do the right thing regarding world affairs – a lot of confidence, some confidence, not too much confidence, or
no confidence at all: b. Dmitri Medvedev
Spring, 2012
Spring, 2011
Spring, 2010
Spring, 2009
Russia
10064144927
10074153836
10066184030
10089243425
Previously, question asked about "Russian President Dmitri Medvedev"
TotalDK/Refused
No confidence
at all
Not too much
confidenceSome
confidenceA lot of
confidence
Q40c For each, tell me how much confidence you have in each leader to do the right thing regarding world affairs – a lot of confidence, some confidence, not too much confidence, or
no confidence at all: c. Russian President Vladimir Putin
Spring, 2012
Spring, 2011
Spring, 2010
Spring, 2009
Spring, 2008
Spring, 2007
Spring, 2006
May, 2003
Russia
10013194828
10084134827
1006283846
10043103053
10043114239
10074123245
10065143936
10078163237
From 2009 to 2011, question asked about "Russian Prime Minister Vladimir Putin"
TotalDK/RefusedVery
unfavorableSomewhat unfavorable
Somewhat favorable
Very favorable
Q52a Now I’d like to ask your views about some political leaders in our country. Please tell me if you have a very favorable, somewhat favorable, somewhat unfavorable, or very
unfavorable opinion of: a. Dmitri Medvedev
Spring, 2012Russia 10058204423
TotalDK/RefusedVery
unfavorableSomewhat unfavorable
Somewhat favorable
Very favorable
Q52b Now I’d like to ask your views about some political leaders in our country. Please tell me if you have a very favorable, somewhat favorable, somewhat unfavorable, or very
unfavorable opinion of: b. Vladimir Putin
Spring, 2012Russia 10048164131
30

TotalDK/RefusedVery
unfavorableSomewhat unfavorable
Somewhat favorable
Very favorable
Q52c Now I’d like to ask your views about some political leaders in our country. Please tell me if you have a very favorable, somewhat favorable, somewhat unfavorable, or very
unfavorable opinion of: c. Gennady Zyuganov
Spring, 2012Russia 10081636309
TotalDK/RefusedVery
unfavorableSomewhat unfavorable
Somewhat favorable
Very favorable
Q52d Now I’d like to ask your views about some political leaders in our country. Please tell me if you have a very favorable, somewhat favorable, somewhat unfavorable, or very
unfavorable opinion of: d. Sergey Mironov
Spring, 2012Russia 100141536315
TotalDK/RefusedVery
unfavorableSomewhat unfavorable
Somewhat favorable
Very favorable
Q52e Now I’d like to ask your views about some political leaders in our country. Please tell me if you have a very favorable, somewhat favorable, somewhat unfavorable, or very
unfavorable opinion of: e. Vladimir Zhirinovsky
Spring, 2012Russia 10053036217
TotalDK/RefusedVery
unfavorableSomewhat unfavorable
Somewhat favorable
Very favorable
Q52f Now I’d like to ask your views about some political leaders in our country. Please tell me if you have a very favorable, somewhat favorable, somewhat unfavorable, or very
unfavorable opinion of: f. Mikhail Prokhorov
Spring, 2012Russia 100152325306
TotalDK/RefusedVery
unfavorableSomewhat unfavorable
Somewhat favorable
Very favorable
Q52g Now I’d like to ask your views about some political leaders in our country. Please tell me if you have a very favorable, somewhat favorable, somewhat unfavorable, or very
unfavorable opinion of: g. Alexei Navalny
Spring, 2012Russia 100541318133
TotalDK/Refused
Parents did not live to the age of
respondent (Volunteered)
Much worse
Somewhat worseAbout the same
Somewhat betterMuch better
Q64b Compared to your parents when they were the same age as you are now, do you think your own standard of living now is much better, somewhat better, about the same, somewhat worse, or much worse than theirs was?
Spring, 2012Russia 10031712213719
TotalDK/RefusedBoth/Neither (Volunteered)
Russia should be more respected
around the world than it is
Russia is as respected around the world as it should be
QRUS4 Which statement comes closer to your own views, even if neither is exactly right? Russia is as respected around the world as it should be OR Russia should be more respected
around the world than it is?
Spring, 2012Russia 100297316
TotalDK/RefusedCompletely disagree
Mostly disagreeMostly agree
Completely agree
Q68a Please tell me whether you completely agree, mostly agree, mostly disagree or completely disagree with the following: a. Most elected officials care what people like me
think
Spring, 2012
Fall, 2009
Spring, 1991
Russia
100102646144
10043536206
10072832294
31

TotalDK/RefusedCompletely disagree
Mostly disagreeMostly agree
Completely agree
Q68b Please tell me whether you completely agree, mostly agree, mostly disagree or completely disagree with the following: b. Voting gives people like me an opportunity to
express their opinion about how the government runs things
Spring, 2012
Fall, 2009
Spring, 1991
Russia
100922213413
100326283410
100614234412
As asked in 2012, 2009, and 1991 the question has reflected the Russian translation: “Voting gives people like me an opportunity to express their opinion about how the government runs things.” In 2009 and 1991, the translation was reported as, “Voting gives people like me some say about how the government runs things.”
TotalDK/RefusedCompletely disagree
Mostly disagreeMostly agree
Completely agree
Q68c Please tell me whether you completely agree, mostly agree, mostly disagree or completely disagree with the following: c. Attending protests or demonstrations gives people like me an opportunity to express their opinion about how the government runs
things
Spring, 2012Russia 10088194816
TotalDK/RefusedCompletely disagree
Mostly disagreeMostly agree
Completely agree
Q68d Please tell me whether you completely agree, mostly agree, mostly disagree or completely disagree with the following: d. Russia should be for Russians
Spring, 2012
Fall, 2009
Spring, 1991
Russia
100643261313
100316273123
100615253023
TotalDK/RefusedCompletely disagree
Mostly disagreeMostly agree
Completely agree
Q68e Please tell me whether you completely agree, mostly agree, mostly disagree or completely disagree with the following: e. It's natural for Russia to have an empire
Spring, 2012
Spring, 2011
Fall, 2009
Spring, 1991
Russia
1001918251918
1001812233116
1002013203315
1002514172915
TotalDK/Refused
Not important at
allNot too important
Somewhat important
Very important
Q69a How important is it to you to live in a country where a. you can openly say what you think and can criticize the state? Is it very important, somewhat important, not too
important or not important at all?
Spring, 2012
Fall, 2009
Spring, 2007
Summer, 2002
Russia
10026164630
10023154634
10025124437
1002384244
TotalDK/Refused
Not important at
allNot too important
Somewhat important
Very important
Q69b How important is it to you to live in a country where b. honest elections are held regularly with a choice of at least two political parties? Is it very important, somewhat
important, not too important or not important at all?
Spring, 2012
Fall, 2009
Spring, 2007
Summer, 2002
Russia
10035164037
10033124141
10034104241
1003363652
32

TotalDK/Refused
Not important at
allNot too important
Somewhat important
Very important
Q69c How important is it to you to live in a country where c. there is a judicial system that treats everyone in the same way? Is it very important, somewhat important, not too
important or not important at all?
Spring, 2012
Fall, 2009
Spring, 2007
Summer, 2002
Russia
1001022968
1002042470
1001152469
1002142271
TotalDK/Refused
Not important at
allNot too important
Somewhat important
Very important
Q69d How important is it to you to live in a country where d. the military is under the control of civilian leaders? Is it very important, somewhat important, not too important or
not important at all?
Spring, 2012
Fall, 2009
Spring, 2007
Summer, 2002
Russia
1001313213320
10078163534
100139193227
100128112841
TotalDK/Refused
Not important at
allNot too important
Somewhat important
Very important
Q69e How important is it to you to live in a country where e. the media can report the news without state censorship? Is it very important, somewhat important, not too important or
not important at all?
Spring, 2012
Fall, 2009
Spring, 2007
Summer, 2002
Russia
10056144431
10033134140
10044144137
1004373749
TotalDK/Refused
Not important at
allNot too important
Somewhat important
Very important
Q69f How important is it to you to live in a country where f. you can practice your religion freely? Is it very important, somewhat important, not too important or not important at all?
Spring, 2012
Fall, 2009
Spring, 2007
Summer, 2002
Russia
10037134235
10035113745
1003493747
1005493052
TotalDK/Refused
Not important at
allNot too important
Somewhat important
Very important
Q69g How important is it to you to live in a country where g. there is economic prosperity? Is it very important, somewhat important, not too important or not important at all?
Spring, 2012
Fall, 2009
Spring, 2007
Summer, 2002
Russia
1002011979
1002142668
1001242271
1003232171
TotalDK/Refused
Not important at
allNot too important
Somewhat important
Very important
Q69h How important is it to you to live in a country where h. law and order is maintained? Is it very important, somewhat important, not too important or not important at all?
Spring, 2012Russia 1002131975
33

TotalDK/Refused
Not important at
allNot too
importantSomewhat important
Very important
Q69i How important is it to you to live in a country where i. people have access to the internet without government censorship or interference? Is it very important, somewhat
important, not too important or not important at all?
Spring, 2012Russia 100117122743
TotalDK/RefusedNot well at
allNot too wellSomewhat
wellVery well
Q70a I am going to read you the same list. Does a. you can openly say what you think and can criticize the state describe our country very well, somewhat well, not too well or not
well at all?
Spring, 2012
Fall, 2009
Spring, 2007
Summer, 2002
Russia
10075155320
10034194825
10045234522
10046164628
TotalDK/RefusedNot well at
allNot too wellSomewhat
wellVery well
Q70b I am going to read you the same list. Does b. honest elections are held regularly with a choice of at least two political parties describe our country very well, somewhat well, not
too well or not well at all?
Spring, 2012
Fall, 2009
Spring, 2007
Summer, 2002
Russia
100912224215
100512264017
100515273816
100614273616
TotalDK/RefusedNot well at
allNot too wellSomewhat
wellVery well
Q70c I am going to read you the same list. Does c. there is a judicial system that treats everyone in the same way describe our country very well, somewhat well, not too well or
not well at all?
Spring, 2012
Fall, 2009
Spring, 2007
Summer, 2002
Russia
100828251920
100322232625
100426282219
100626302117
TotalDK/RefusedNot well at
allNot too wellSomewhat
wellVery well
Q70d I am going to read you the same list. Does d. the military is under the control of civilian leaders describe our country very well, somewhat well, not too well or not well at
all?
Spring, 2012
Fall, 2009
Spring, 2007
Summer, 2002
Russia
1001911283012
1001113273514
1001812263212
1001815242914
TotalDK/RefusedNot well at
allNot too wellSomewhat
wellVery well
Q70e I am going to read you the same list. Does e. the media can report the news without state censorship describe our country very well, somewhat well, not too well or not well at
all?
Spring, 2012
Fall, 2009
Spring, 2007
Summer, 2002
Russia
100138224414
100610214320
100710284015
100912234115
34

TotalDK/RefusedNot well at
allNot too wellSomewhat
wellVery well
Q70f I am going to read you the same list. Does f. you can practice your religion freely describe our country very well, somewhat well, not too well or not well at all?
Spring, 2012
Fall, 2009
Spring, 2007
Summer, 2002
Russia
1006155335
1004584340
1005494043
1005264146
TotalDK/RefusedNot well at
allNot too wellSomewhat
wellVery well
Q70g I am going to read you the same list. Does g. there is economic prosperity describe our country very well, somewhat well, not too well or not well at all?
Spring, 2012
Fall, 2009
Spring, 2007
Summer, 2002
Russia
100626292019
100516223423
100423282618
100520352317
TotalDK/RefusedNot well at
allNot too wellSomewhat
wellVery well
Q70h I am going to read you the same list. Does h. law and order is maintained describe our country very well, somewhat well, not too well or not well at all?
Spring, 2012Russia 100523322218
TotalDK/RefusedNot well at
allNot too wellSomewhat
wellVery well
Q70i I am going to read you the same list. Does i. people have access to the internet without government censorship or interference describe our country very well, somewhat
well, not too well or not well at all?
Spring, 2012Russia 100215153722
TotalDK/RefusedStrong leader
Democratic form of
government
Q71 Some feel that we should rely on a democratic form of government to solve our country's problems. Others feel that we should rely on a leader with a strong hand to solve
our country's problems. Which comes closer to your opinion?
Spring, 2012
Spring, 2011
Fall, 2009
Spring, 2008
Spring, 2007
Spring, 2006
Spring, 2005
Summer, 2002
Fall, 1992
Spring, 1991
Russia
100103951
100185131
10097021
10066628
100106129
100116327
100105733
100116029
100115732
100115732
TotalDK/RefusedA strong economy
A good democracy
Q72 If you had to choose between a good democracy or a strong economy, which would you say is more important?
Spring, 2012
Spring, 2011
Fall, 2009
Spring, 2007
Spring, 2005
Summer, 2002
Russia
10088011
10058114
100117415
10077814
10067321
10077519
35

TotalDK/RefusedNot at all satisfied
Not too satisfied
Somewhat satisfied
Very satisfied
Q73 How satisfied are you with the way democracy is working in our country – very satisfied, somewhat satisfied, not too satisfied or not at all satisfied?
Spring, 2012
Spring, 2011
Fall, 2009
Russia
10072338293
10092637234
10061845265
TotalDK/RefusedStrongly oppose
Somewhat oppose
Somewhat support
Strongly support
Q82 In general, do you strongly support, somewhat support, somewhat oppose, or strongly oppose the protests for fair elections that have occurred since the parliamentary elections
in December?
Spring, 2012Russia 1001011223323
TotalDK/Refused
Result of Russian
dissatisfaction
Result of efforts by Western powers
Q82b Some people say the protests for fair elections are the result of efforts by Western powers to destabilize Russia. Others say the protests are the result of genuine Russian dissatisfaction with the
conduct of the elections. Which comes closer to your view?
Spring, 2012Russia 100175825
36
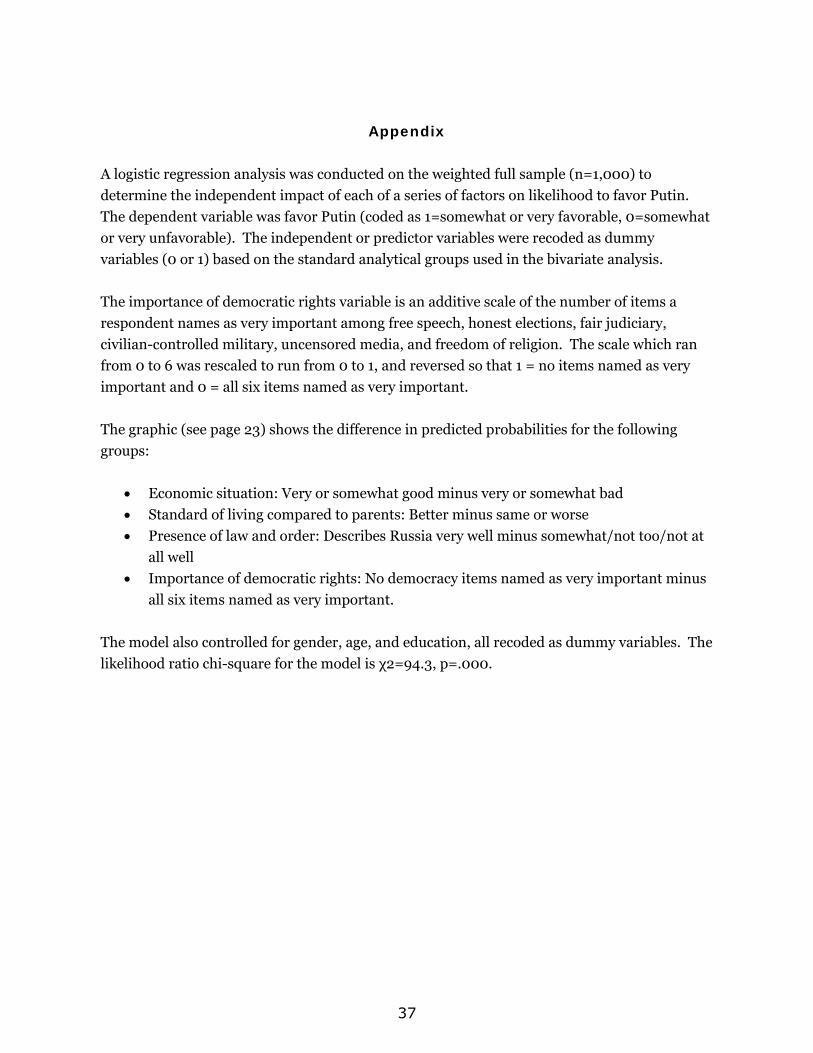
Appendix
A logistic regression analysis was conducted on the weighted full sample (n=1,000) to
determine the independent impact of each of a series of factors on likelihood to favor Putin.
The dependent variable was favor Putin (coded as 1=somewhat or very favorable, 0=somewhat
or very unfavorable). The independent or predictor variables were recoded as dummy
variables (0 or 1) based on the standard analytical groups used in the bivariate analysis.
The importance of democratic rights variable is an additive scale of the number of items a
respondent names as very important among free speech, honest elections, fair judiciary,
civilian-controlled military, uncensored media, and freedom of religion. The scale which ran
from 0 to 6 was rescaled to run from 0 to 1, and reversed so that 1 = no items named as very
important and 0 = all six items named as very important.
The graphic (see page 23) shows the difference in predicted probabilities for the following
groups:
Economic situation: Very or somewhat good minus very or somewhat bad
Standard of living compared to parents: Better minus same or worse
Presence of law and order: Describes Russia very well minus somewhat/not too/not at
all well
Importance of democratic rights: No democracy items named as very important minus
all six items named as very important.
The model also controlled for gender, age, and education, all recoded as dummy variables. The
likelihood ratio chi-square for the model is χ2=94.3, p=.000.
37