Embed Size (px)
Citation preview

Session 1 “Multicultural Society” 1
Yogyakarta : Management of Multiculturalism Herry Zudianto
Mayor of Yogyakarta City
Yogyakarta, or Jogja which some people are more familiarized with, located on the southern part of Java Island, nevertheless, is portraying the country itself as well, Indonesia. The city, which constitutes the capital of Yogyakarta Special Region province is commonly conceived as the “miniature of Indonesia”, for the diversity of its citizens’ origins and cultures.
By means of almost similar configuration, the presence of islands far distinct from each other (Java, Sumatra, Bali, Borneo, Celebes, New Guinea, and so forth), acculturation and assimilation as a result of international trade with foreign merchants - furthermore followed by foreign clerics and troops for centuries, perpetual preservation of the local wisdoms, have been major factors on building the Indonesian society as multilinguistic, multiethnic, multireligious and multiculture. There are over 300 tribes or ethnic groups and more than 700 local languages or dialects spoken throughout the country from the largest ethnic, Javanese, to smaller clans in Papua (West New Guinea). Therefore, multiculturalism by means of favorable interrelations among different ethnics, different beliefs and different interests within the Indonesian society is undoubtly a very important feature needed to be well-managed not only by the government, but it also needs the involvement of all citizens and all communities by promoting and extending the value of tolerance.
Before the early establishment days of Yogyakarta in the year 1756, interaction among nations throughout the Southeast Asian region has signified the appearance of Hinduism, Buddhism, Islamic and Christianity influence within the society. Major cultures as well as Javanese, Austronesian, Indian sub-continent, Chinese, Arabic and eventually European civilizations came from various directions giving colorful coherence and contribution to the flourished multiculturalism evolution.
The native Javanese culture inherited from Kraton Ngayogyakarta Hadiningrat (Kingdom of Ngayogyakarta) existed before the arrival of other major cultures in Java Island. Javanese civilization – which tend to be open, inclusive and tolerance – assumed the presence of other cultures, indicated by the developed communities and settlements in some areas of the city during 1800s. Far eastern settlements – mostly Chinese and Arabic traders and merchants - evolved adjacent to the Royal Palace, native villages and Dutch houses at that time. By 1920, there were 94,254 (90.08%) Javanese inhabitants compared to 5,643 (5.44%) Chinese and 3,730 (3.59%) Europeans according to local Dutch-administered statistics. The feature revealed that multiculturalism was deep-rooted within the city, particularly among different nations, different cultures and different communities – peacefully.
Yogyakarta is well-known as a “City of tolerance” in Indonesia. The local wisdom concept of teposeliro (or literally “tolerance” in Javanese) which means the spirit of mutual respect reciprocally in harmony has important role in acculturating other cultures introduced by settlers from outer islands or overseas. Tolerance encourages people to be open-minded understanding the differences and not resist against different ideas. That is, tolerant views which extend beyond individual interests, understanding that other peoples’ interests do exist and has to be equally considered. Nevertheless, there is presence of mutual interest which bounds to be mutually respected as well.
At present, Yogyakarta is also well-known as a City of education and prominent tourism destination – nearest city to Borobudur and the city of patriotism. The presence of high-ranking universities in
- 53 -
Session 1 “Multicultural Society” 1
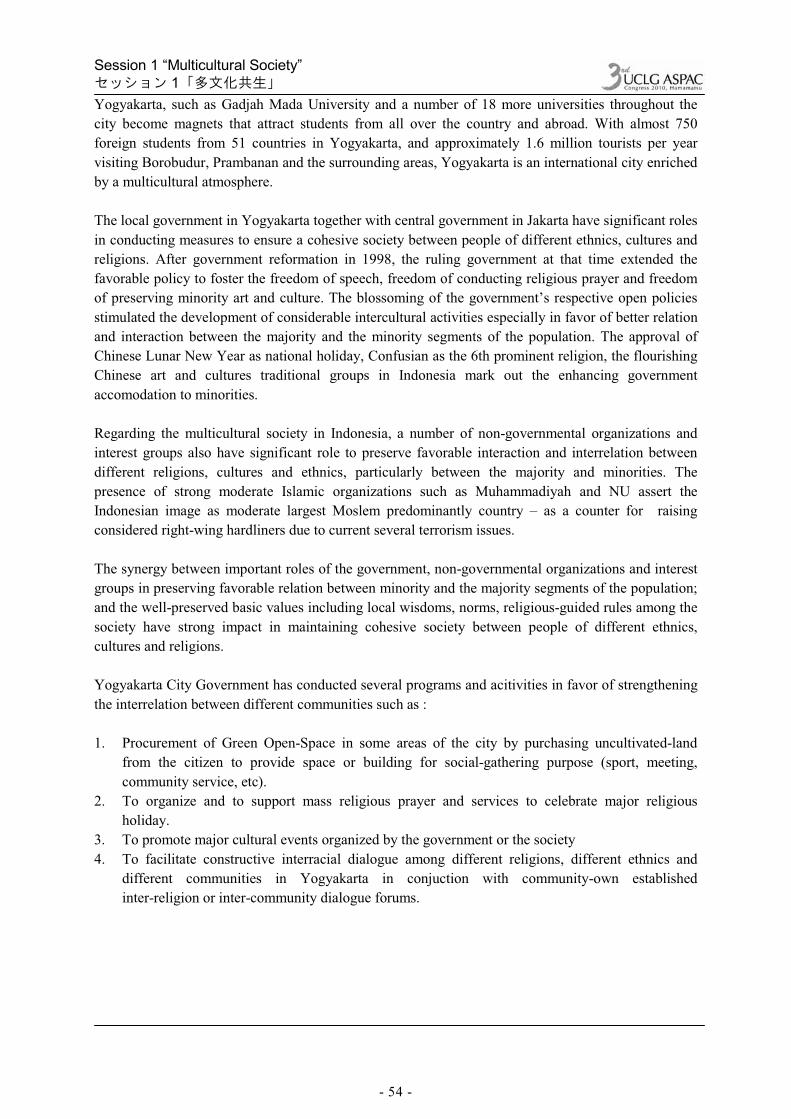
Yogyakarta, such as Gadjah Mada University and a number of 18 more universities throughout the city become magnets that attract students from all over the country and abroad. With almost 750 foreign students from 51 countries in Yogyakarta, and approximately 1.6 million tourists per year visiting Borobudur, Prambanan and the surrounding areas, Yogyakarta is an international city enriched by a multicultural atmosphere.
The local government in Yogyakarta together with central government in Jakarta have significant roles in conducting measures to ensure a cohesive society between people of different ethnics, cultures and religions. After government reformation in 1998, the ruling government at that time extended the favorable policy to foster the freedom of speech, freedom of conducting religious prayer and freedom of preserving minority art and culture. The blossoming of the government’s respective open policies stimulated the development of considerable intercultural activities especially in favor of better relation and interaction between the majority and the minority segments of the population. The approval of Chinese Lunar New Year as national holiday, Confusian as the 6th prominent religion, the flourishing Chinese art and cultures traditional groups in Indonesia mark out the enhancing government accomodation to minorities.
Regarding the multicultural society in Indonesia, a number of non-governmental organizations and interest groups also have significant role to preserve favorable interaction and interrelation between different religions, cultures and ethnics, particularly between the majority and minorities. The presence of strong moderate Islamic organizations such as Muhammadiyah and NU assert the Indonesian image as moderate largest Moslem predominantly country – as a counter for raising considered right-wing hardliners due to current several terrorism issues.
The synergy between important roles of the government, non-governmental organizations and interest groups in preserving favorable relation between minority and the majority segments of the population; and the well-preserved basic values including local wisdoms, norms, religious-guided rules among the society have strong impact in maintaining cohesive society between people of different ethnics, cultures and religions.
Yogyakarta City Government has conducted several programs and acitivities in favor of strengthening the interrelation between different communities such as :
1. Procurement of Green Open-Space in some areas of the city by purchasing uncultivated-land from the citizen to provide space or building for social-gathering purpose (sport, meeting, community service, etc).
2. To organize and to support mass religious prayer and services to celebrate major religious holiday.
3. To promote major cultural events organized by the government or the society 4. To facilitate constructive interracial dialogue among different religions, different ethnics and
different communities in Yogyakarta in conjuction with community-own established inter-religion or inter-community dialogue forums.
- 54 -
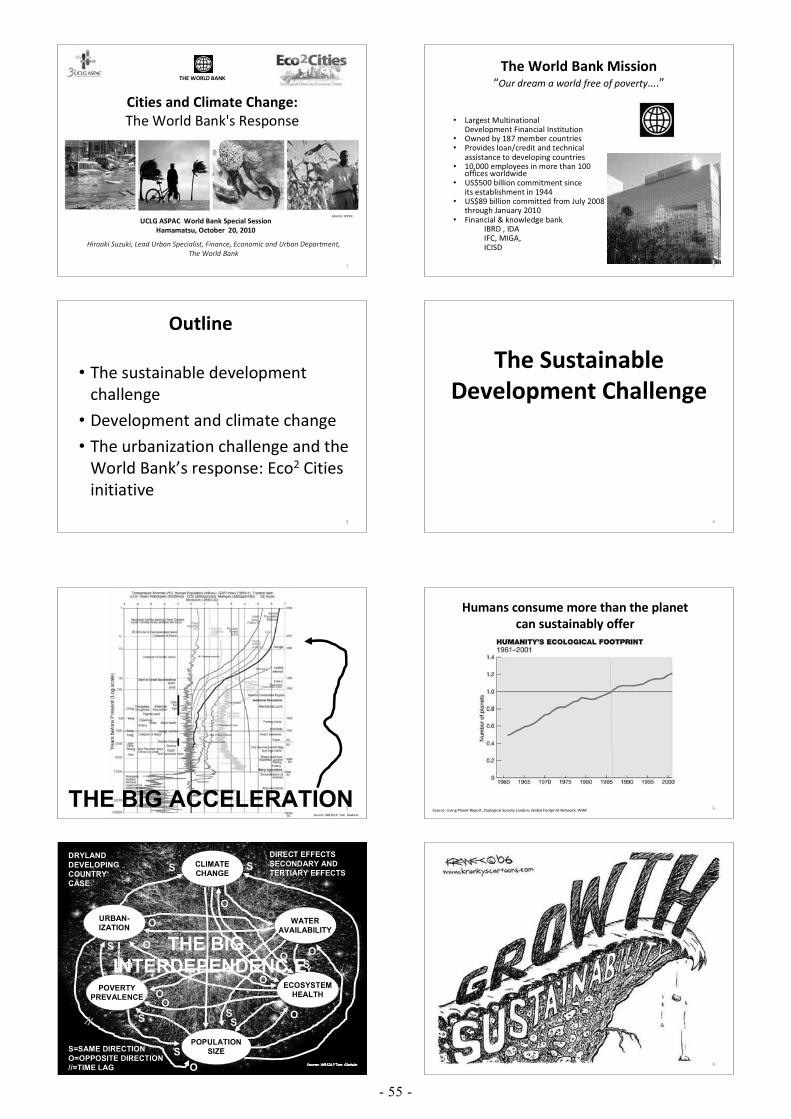
Hiroaki Suzuki, Lead Urban Specialist, Finance, Economic and Urban Department,The World Bank
THEWORLD BANK
Cities and Climate Change:The World Bank's Response
UCLG ASPAC World Bank Special SessionHamamatsu, October 20, 2010
Source: IPPUC
1
The World Bank Mission“Our dream a world free of poverty….”
• Largest MultinationalDevelopment Financial Institution
• Owned by 187 member countries• Provides loan/credit and technical
assistance to developing countries• 10,000 employees in more than 100
offices worldwide• US$500 billion commitment since
its establishment in 1944• US$89 billion committed from July 2008
through January 2010• Financial & knowledge bank
IBRD , IDAIFC, MIGA,ICISD
2
Outline
• The sustainable developmentchallenge
• Development and climate change
• The urbanization challenge and theWorld Bank’s response: Eco2 Citiesinitiative
3
The SustainableDevelopment Challenge
4
Source: WB SDLP Tom Gladwin
THE BIG ACCELERATION5 Source: Living Planet Report, Zoological Society London, Global Footprint Network, WWF
Humans consume more than the planetcan sustainably offer
6
CLIMATECHANGE
WATERAVAILABILITY
URBAN-IZATION
POVERTYPREVALENCE
ECOSYSTEMHEALTH
POPULATIONSIZE
DRYLANDDEVELOPINGCOUNTRYCASE
O
O
O
DIRECT EFFECTSSECONDARY ANDTERTIARY EFFECTS
O
O
O
S
S
S
OO
S
SS=SAME DIRECTIONO=OPPOSITE DIRECTION//=TIME LAG
O
SS
O
S
O
OO
//
//
O
//
//
//
//
THE BIGINTERDEPENDENC EY
7 8
- 55 -

1980 ??
Sustainability Seize OpportunitiesSeize OpportunitiesAvoid RisksAvoid Risks
Inno
vatio
n
1980 ??
Sustainability Seize OpportunitiesSeize OpportunitiesAvoid RisksAvoid Risks
Inno
vatio
n
??
Sustainability Seize OpportunitiesSeize OpportunitiesAvoid RisksAvoid Risks
Inno
vatio
n
??
Sustainability Seize OpportunitiesSeize OpportunitiesAvoid RisksAvoid Risks
Inno
vatio
n
Increases in Population and Consumption
Sustainability Seize OpportunitiesSeize OpportunitiesAvoid RisksAvoid Risks
Inno
vatio
nDecline in Living Systems
2000 ??
SustainabilitySeize OpportunitiesSeize Opportunities
Avoid RisksAvoid Risks
Inno
vatio
n
THE BIG SQUEEZE
Source: WB SDLP Tom Gladwin 9
Development andClimate Change
10
CO2 is off the charts
Source: Lüthi and others 2008 11
Temperature Anomalies (relative to 1960 1990)
Mediterranean Regions (10W 40E, 30N 50N)
Observations
2003
Source: WB SDLP Will Day
12
13
What is Happening?Projected impacts of climate change
Source: Stern Review
15 Slide 16
- 56 -

Slide 17 Source: UN Office for the Coordination of Humanitarian Affairs & CARE, “Humanitarian Implications of Climate Change:Mapping Emerging Trends and Risk Hotspots” (August 2008).
18
More than a billion people depend on water fromdiminishing Himalayan glaciers
19Source: World Development Report 2010.
Rich countries are also affected by anomalous climate:The 2003 heat wave killed more than 70,000 people in Europe
Source: World Development Report 2010. 20
Japan recorded its hottestsummer ever
21 22
Where is energy being consumed?
Unequal footprints: Emissions per capita in low , middle , andhigh income countries, 2005
23Source: World Development Report 2010.
Individuals’ emissions in high income countries overwhelm those indeveloping countries
24Source: World Development Report 2010.
- 57 -

Where the world needs to go: Energy related CO2emissions per capita
25Source: World Development Report 2010.
What should we do?The emissions gap between where the world is headed and where it needs to go is huge, but a
portfolio of clean energy technologies can help the world stay at 450 ppm CO2e (2 C)
26Source: World Development Report 2010.
5 10 15 20 25 30 35150
100
50
50
100
Technology options: Abatement beyond business as usual(GTCO2e per year in 2030)
Cost
ofab
atem
ent€
pertCO
2e
18 3326
550ppm
450ppm
400ppm
~€25 ~€50~€40
Building insulationFuel efficiency in commercial vehicles
Lighting/Air conditioning
Water heating
Fuel efficiency in vehicles
Sugar cane biofuel
Standby lossesIndustrial non CO2
Marginal cost € per ton CO2e
NuclearCCS & enhanced oil recovery
Wind: low penetration
Co firing biomassCCS on new coal
Avoided deforestationCCS retrofit Biodiesel
Industrial CCS
AfterMcKinsey
Source: McKinsey 2007
27
The goal is to push low carbon technologies from unprovenconcept to widespread deployment and to higher emission
reductions
28Source: World Development Report 2010.
It’s not just about energy: At high carbon prices the combined mitigationpotential of agriculture and forestry is greater than that of other individual
sectors of the economy
29Source: World Development Report 2010.
Global green stimulus spending is increasing
30Source: World Development Report 2010.
Green Growth
31
The gap is large: Estimated annual climate funding required fora 2 C trajectory compared with current resources
32Source: World Development Report 2010.
- 58 -

Annual spending for energy and climate changeR&D pales against subsidies
33Source: World Development Report 2010.
Government budgets for energy RD&D are at their lowest,and nuclear dominates
34Source: World Development Report 2010.
a
35
Climate impacts are long lived:Rising temperatures and sealevels associated with higher
concentrations of CO2
ACT NOW
36Source: World Development Report 2010.
Despite low energy consumption and emissions per capita,developing countries will dominate much of the future growth in
total energy consumption and CO2 emissions
ACT TOGETHER
37Source: World Development Report 2010.
Rebalancing act: Switching from SUVs to fuel efficient passenger cars in theU.S. alone would nearly offset the emissions generated in providing
electricity to 1.6 billion more people
38Source: World Development Report 2010.
Africa has enormous untapped hydropower potential, compared to lower potentialbut more exploitation of hydro resources in the United States
ACTDIFFERENTLY
39Source: World Development Report 2010.
Turning back the desert with indigenousknowledge, farmer action, and social learning
40Source: World Development Report 2010.
- 59 -

Did I convince you that globalwarming is happening?
Otherwise…….
41 Slide 42
The World Bank’s response tothe urbanization challenge: Eco2
Cities Initiative
43
The world urbanizes
44
1950 2000 2050World Population (bil.) 2.54 6.12 9.19World Urban Population (bil.) 0.74 2.85 6.4Share of Asia (%) 32.1 48.1 54.5
Density why it pays to be close to Tokyo
Tokyo•Quarter ofJapan’sPopulation (35Million)•4% of Its Land•18 % of ItsGDP
45Source: World Development Report 2010. 46
Urbanization is a good proxyfor income level
Source: Acemoglu, D., Presentation at the World Bank on Jan.19, 2006GDP for China is taken from the same presentation, and urbanization in China is taken from UN data
China
Urbanization Generate Both Economic Growth & Environmental Challenges
Increasing Solid Waste
Shopping MallNew Urban Landscape
Source: International Energy Agency, 2005; World Bank Staff Estimates
Air Pollution & GHG
47
Natural Disaster
Investment
48
Unsustainable Growth– Projected new urban built up area in developing countriesalone is 400,000 km² (2000 – 2030)
– This equals the total urban built up area of the ‘entireworld’ as of the year 2001 –we are building a ‘whole newworld!’
– 4 Earths (Ecological Footprint) required if developingcountry cities urbanize following the models of developedcountry cities
- 60 -

• Helping cities achieve ecological andeconomic sustainability in synergy.
• Integrated cross sector approach energyefficient and low carbon development.
• Optimal urban plan & land use compactcities.
• Combining multiple financial instruments(IBRD,IDA, GEF, CF,CTF, IFC,PPP etc.)
www.worldbank/org/eco2
49
Example of Simultaneous Economic andEnvironmental Improvement
Since 1990 Swedish CO2 emissions have reduced by 9% while itseconomy has grown at a stable speed.
50Source: Symbiocity
By looking at global good practice cities:– Stockholm, Sweden
– Curitiba, Brazil
– Yokohama, Japan
– Singapore
– Vancouver, Canada
– Auckland, New Zealand
– Brisbane, Australia
51
How did we arrive at our Eco2 solutions? 1. Stockholm, Sweden
Integrated utility management & resource management was used in
the redevelopment of the southern district in Stockholm, Sweden
Energy
Water and sewage
Waste
Source: Stockholm City Planning Administration52
Integrated land use and transport• Innovative land use management
– Linear urban growth along five strategic axes with highlydense commercial/ residential development to absorbrapid population growth
– Institute for Research and Urban Planning of Curitiba(IPPUC) for integrated planning
• Affordable and integrated bus system– Bus Rapid Transit lane along the five strategic axes
– Investment cost – about US$ 3 mil/km(about 3 6% of underground metro)
– 45% Bus ridership
– Less traffic congestion
2. Curitiba, Brazil
53
SOUTH STRUCTURAL AXIS
Nova Curitiba
Av. Paraná
Represa Do Passaúna
DOWNTOWNMal. Floriano
Parque IguaçúGreen Line
Porto Alegre
Ponta Grossa
INDUSTRIAL DISTRICT
Parque Barigui
São Paulo
Curitiba’s Transit Oriented Development
54
55
• Flood control with enhanced green space– Eco system preserved in the city
– Expenditure for drainage construction saved
– Green and amenity space enhanced
– Flood prone slum areas turn into valued land of tax revenue source
• Social considerations– Inclusive neighborhoods
– Waste management programs
– Citizen ownership and eco consciousness
2. Curitiba, Brazil
• Solid Waste Reduction– Implementation of 3R (Reduce,
Reuse, Recycle) with citizencollaboration
– Achieved 38.7% reduction in sixyears (2001 2007)
Source: City of Yokohama
3. City of Yokohama, Japan
Waste Reduction in Yokohama
56
- 61 -

Integrated water resource
management
• Closed water loop• Entire water cycle managed by
one organization• Water security
• Water catchment
• Wastewater reclamation• Desalination
• Demand management– Tariff: Financial incentive to
reduce water consumption
Demand Control and Water ConsumptionYear 2000 2004
Population (‘000) 4,028 4,167
GDP (US$ mil.) 92,720 109,157
National Water Consumption (mil. m3) 454 440
Average Monthly Household Water Consumption (m3) 20.5 19.3
Average Monthly Household Water Bill (Singapore$) 31.0 29.4
Source: PUB website, Singapore
4. SingaporeClosed Water Loop
57
Congestion pricing for urban transport management– London– Singapore– Stockholm– Milan (linked with GHG emission)
London:– £137m was raised in the financial year 2007/08 to invest back into improving
public transport in London.– Traffic was 21% lower than pre charge levels within the charging zone
70,000 fewer cars/day– Increased usage of buses and bicycles
Source: Transport for London website
5. London, Stockholm, Milan, Singapore
5858
Urban form impacts on cities’ transport efficiencyDecisions today are limited by decisions in the past
Source: Bertaud, A., and T. Pode, Jr., Density in Atlanta: Implications for Traffic and Transit (Los Angeles: Reason Foundation, 2007).
59 60
Cars – a waste of space!
Four Principles of Eco2
61
A City Based ApproachEnables local governments to proactively lead and inspireAdapted to the specific circumstances and local ecology
An Expanded Platform for Collaborative Design and Decision MakingSustained synergy through coordination and alignment of stakeholderactions and incentives
A One System ApproachRealize benefits of integrationOptimize the city system as a whole
An Investment Framework that Values Sustainability and ResiliencyLifecycle analysisAsses value and benchmark all capital assets (manufactured, natural, socialand human)Broader risk assessments and adaptive strategies for resilience
RegionalSystems
MunicipalServices
LandUse
RoadsSewerage
Waste
Housing
Office Buildings
Environmental Mgt.
Fleet Mgt.
Procurement
ParksLighting
TransitWater
City HallOperationslow highLevel of control
BuildingStocks
BuildingStocks
ElectricityElectricity
EcosystemsEcosystems
TransportationTransportation
NaturalGas
NaturalGas
SocialServicesSocialServices
InformationCommunicationsInformation
CommunicationsIndustryIndustry
AgricultureAgricultureRural
CommunitiesRural
Communities
Eco2: Stakeholder Involvement
1. Expanded beyondadministrativeboundaries toeconomic andecological boundaries.
2. Collaboration with allstakeholders
3. A shared planningframework
4. Integrated designprocess
5. Policy/investmentcoordination
Private Sector Citizens
National Policy & FrameworkNational Policy & Framework
62
high Level of control low
Eco2: An Integrated One System Approach
63
PromoteSocialEquity
Water Mgt
Land Management Transport Planning
Regulation, IncentivesTechnology, AwarenessRegulation, IncentivesTechnology, Awareness
WasteManagement
WasteManagement
WaterManagement
WaterManagement
Adapt tonaturalrisks
Adapt tonaturalrisks
64
Layering
Cascading(Use same resources)
Examples of the One System Approach
Looping(Reuse resources)
Integrating
Use the same facility for differentpurposes: day (school)/night(vocational center)/weekend
(culture center)
- 62 -

An Investment Framework that Values Sustainabilityand Resiliency
65
Lifecycle cost benefit analysis: investment decisions
Capital O & M Costs Disposal Costs
Financial Accounting
Environmental Load ProfileConstructionMaterials (Steel.Concrete.etc
Energy, Water Waste/Recycle
Sankey diagrams toAnalyze Material Flows
How do we Prepare an Eco2 City Program?
Design Charrettes toforecast and plan
GIS to analyze urbanform
Lifecycle cost benefitanalysis to comparealternatives for investmentdecisions
Phase 1: Various financial instruments
Alignment of World Bank financing instruments:
67
Climate Investment Funds
Global Environment Facility
Sector Investment Loan/Credit
Carbon Finance
Development Policy Loan
IFC (private sector)IFC (private sector)
Infrastructure InvestmentInfrastructure Investment
Adoption of Policy/Regulation
MIGA (insurance)MIGA (insurance)
Phase 2: Possible scaling up of support inpartnership with national governments
68
Book available
at WB Infoshop, Amazon …..
For order information, please visit
www.worldbank.org/eco2
Eco2 Book
Contact Person:Hiroaki Suzuki: [email protected]
Eco2 Pilot Operations
70
See You at Eco2 2010 Yokohama!Pacifico Oct 21 and 22, 2010
•First international conference on Eco2 cities•Global good practice cities•East Asia pilot Eco2 cities•Japanese cities and private businesses•Eco2 Operation Guide
http://go.worldbank.org/KRP47JLUZ0 71
Registration is Open to the Public and Free
- 63 -