Embed Size (px)
Citation preview
SOUTH CAROLINA AGRICULTURAL
STATISTICS
AE 501 2010 REVISED 2011 PRELIMINARY PUBLISHED: OCTOBER 2012
SOUTH CAROLINA AGRICULTURAL STATISTICS
Crops, Livestock, and Poultry 2009 - 2011
(varies by commodity)
prepared by
U S D A - N A S S
SOUTH CAROLINA FIELD OFFICE
1835 Assembly Street Columbia, South Carolina 29201-2449
Phone (803) 765-5333
Fax (803) 765-5310 Web Page: http://www.nass.usda.gov/sc/
E-Mail: [email protected]
EDWARD WELLS, Director HOWARD HILL, JR., Deputy Director
issued cooperatively
UNITED STATES DEPARTMENT OF AGRICULTURE NATIONAL AGRICULTURAL STATISTICS SERVICE
CYNTHIA CLARK, Administrator
Washington, D.C. 20250
and
CLEMSON UNIVERSITY PUBLIC SERVICE AND AGRICULTURE
DR. JOHN W. KELLY, Vice President
DEPARTMENT OF APPLIED ECONOMICS AND STATISTICS
DR. HOKE HILL, Chair
List Frame
Estimates
Surveys
Wendy E. Adams
John S. Cheek
Kelcey M. Guseman
Elizabeth N. Duncan
Linda S. Pridgen

TABLE OF CONTENTS ALL CROPS: Page
Crop Summary ........................................................... 6 Acreage, Yield, and Production 2010-2011 ................ 8 Crops - Record Highs and Lows ................................ 9
COUNTY ESTIMATES: FIELD CROPS: Five Year County Average Yields, Selected Crops 2007-2011 .................................... 10 Corn ......................................................................... 11 Cotton ...................................................................... 12 Hay, All ..................................................................... 13 Peanuts ..................................................................... 14 Soybeans ................................................................. 15 Tobacco ................................................................... 16 Wheat ....................................................................... 17
FRUITS: Peaches (State Estimates only) 2007- 2011 ............ 18 Pecans (State Estimates only) 2007- 2011 .............. 18
DISTRICT ESTIMATES: FIELD CROPS: Map of Districts and Corn ......................................... 19 Cotton and Hay, all ................................................... 20 Peanuts and Soybeans ............................................ 21 Tobacco and Wheat.................................................. 22 VEGETABLES, MAJOR, Fresh Market and Processing, 2009-2011 ................................................... 23 GRAIN STORAGE CAPACITY, OFF AND ON FARM .......... 24 GRAIN STOCKS, BY QUARTERS, 2010-2011 ................ 24 HAY, ALL, ON FARM STOCKS ..................................... 24
ALL CROPS: PAGE
CONTINUED NURSERY, FLORICULTURE, HORTICULTURE AND TURFGRASS ............................................................... 25 COMMERCIAL FERTILIZER: .......................................... 26
FARM NUMBERS:
Farm Numbers, Land in Farms, Economic Sales Class, 2009-2011 ........................ 27 Farm Numbers, Land in Farms and Average Size .... 27 Census Farm Numbers, by Counties, 2002 and 2007 .................................. 28
ALL LIVESTOCK AND POULTRY:
Livestock & Poultry, Record Highs and Lows .......... 30 Livestock Operations, 2005-2011 ............................. 30 All Cattle and Calves Jan. 1, 2010-2012 ................... 31 Goats, Meat and Other, 2010 -2012.......................... 31 Goats, Milk ................................................................. 31 Hogs and Poultry Numbers, Dec. 1, 2009-2011 ...... 31
CATTLE, MILK PRODUCTION AND GOATS: All Cattle and Calves, by Counties and by Districts, Jan. 1, 2011 and 2012 ......................... 32 All Beef Cows that have calved, by Counties and by Districts, Jan. 1, 2011-2012 ......................... 33 Cattle and Calves, Calf Crop, Disposition, Production, and Income, 2006-2011 ....................... 34 All Milk Cows that have calved, by Counties and by Districts, Jan. 1, 2011-2012 ........................ 35 All Milk Cows that have calved, Jan. 1, 1993-2012 ................................................... 35 Average Number of Cows Milked, Production and Marketings, 2009-2011 .................. 36 Manufactured Dairy Products ................................... 36 Goats, Meat and Other, and Milk Goats, Number by Class, 2011 and 2012 ........................... 36 Bees and Honey ....................................................... 36

TABLE OF CONTENTS
ALL LIVESTOCK AND POULTRY: Page
CONTINUED
CASH RECEIPTS: Page
HOGS AND PIGS: Total Hogs and Pigs, by Counties and by Districts, December 1, 2010 – 2011 .…………………………..37 All Hogs and Pigs, Pig Crop, Disposition, Production, and Income, 2010-2011 ...................... 38 Hogs and Pigs for Breeding and Market Hogs by Weight Class, Dec. 1, 2010-2011 ..................... 38
POULTRY AND EGG PRODUCTION: Number of Layers, Eggs per 100 Layers, and Egg Production, by Months, 2005-2011 ................ 39
BROILERS RAISED: Broilers Raised ........................................................ 40 Broilers Raised, Production, by Counties, 2010-2011 ........................................ 40 Broilers Raised, Disposition, Production and Value, 2007-2011 .......................... 40
TURKEYS RAISED: Turkeys Raised ......................................................... 41 Turkeys Raised, Production by Counties and Districts, 2010-2011..................... 41 Turkeys Raised, Disposition, and Value, 2007-2011 ............................................ 41
COMMERCIAL SLAUGHTER: Commercial Red Meat Production, by Months, 2010-2011 ............................................ 42 Young Chickens, by Months, 2010-2011 ................. 42
Cash Receipts Review and Major Commodities with Ranking ....................................................... 44 Crops, Livestock and Government Payments, 2009-2011 .................... 45 Cash Receipts by Counties, 2010 Revised ........... 46 Cash Receipts by Counties, 2011 Preliminary ...... 47 Cash Receipts from Timber Harvest, 2009 ........... 48
FARM INCOME AND PRODUCTION EXPENSES: Farm Income and Expenses, 2007-2011 .............. 49 United States and Southeast Farm Labor and Wage Rates, 2011-2012 ............................. 50 Farm Real Estate Values, and Cash Rents, 2002 - 2012 ............................. 50 Cash Rent received by Counties, 2010-2011 ....... 51
PRICES RECEIVED: Crops, Fruits and Vegetables Marketing Year Prices, 2009-2011 ..................... 52 Livestock and Products, Marketing Year Prices, 2006-2011 ..................... 53
COUNTY SUMMARY TABLES: Crops, Livestock, and Cash Receipts for South Carolina and by Counties, 2011 ........ 54-69
OTHER:
Clemson County Extension Offices...................... 70 Commodity Boards ............................................... 71 Associations and Councils .................................... 72 Agricultural Related Web Sites ........................... 73

80
30
10
5040
20
Horry
Aiken
York
Berkeley
Colleton
Lee
Jasper
Charleston
Sumter
Orangeburg
Laurens
Fairfield
Richland
Union
Beaufort
Oconee
Kershaw
Anderson
Lexington
Chester
Williamsburg
Dillon
Marion
Newberry
Chesterfield
Clarendon
Saluda
Pickens
Barnwell
Abbeville
Florence
Greenville
Georgetown
Spartanburg
Hampton
Lancaster
Darlington
Marlboro
Edgefield
Dorchester
Calhoun
Allendale
Bamberg
Cherokee
Greenwood
McCormick
CROPS SECTION

2011 SOUTH CAROLINA CROP SUMMARY
JANUARY: 2011 rolled in with areas of dense fog for much of the State. Mild air exited and was replaced by a cold front that arrived from the northwest. On January 10, snow began to fall from the upstate mountains into the southern midlands. Chesnee measured 13 inches of snow by January 11. High temperatures reached into the forties mid-month with rain and fog present in many areas of the State. A smaller cold weather system on January 24 produced light snow in the upstate and frost for the inland portions of the state. Milder weather arrived at the end of the month with the Columbia area measuring a high of 75 degrees on January 30. The State average temperature for the month was five degrees below normal with an average rainfall of 1.5 inches. FEBRUARY: The first week of February began with cool, cloudy weather over much of the State. Freezing rain was reported in some counties and a wintry mix continued to fall through the end of the first week. Rainfall for the week was the heaviest weekly amount recorded since December 2009. Light snow continued to fall in the upstate and northern coastal areas through mid-month. Dry, mild air arrived along with warmer temperatures later in the month. On February 17, the State observed the first day without a freeze since October 6, 2010. A much drier and warmer end to February saw early flowering of bulbs and ornamental trees for much of the State. The State average temperature for the month was four degrees above normal with an average of 3.2 inches of rain. MARCH: Cold weather returned the first week of March. Frost was observed in many counties and daytime temperatures did not exceed the sixties. Rain showers and high winds were observed during the first weekend in March, leading to more frost on March 7 and 8. A hard freeze of 25 degrees was reported on the morning of March 12 in Saluda and Pelion. A warming trend began in the afternoon and would continue for the remainder of the month. Rains were plentiful due to thunderstorms with some bringing severe weather and large hailstones. Temperatures in the high seventies were accompanied by high winds which led to some reports of wildfires in coastal counties. The State average temperature for the period was four degrees above normal with an average rainfall of 3.2 inches. APRIL: The month began with turbulent weather during the first week of April. Near 90-degree heat helped fuel another round of storms on April 9. Mid- April brought average temperatures and very little rainfall. Some localities experienced damage to early field crops and orchards throughout the path of the hailstorm. Eighty-five percent of corn had been planted and forty five percent of tobacco was transplanted. Warm temperatures and scattered thunderstorms characterized the week ending April 24, 2011. Highs were in the 80's for much of the State all week. The state average temperature for the final week was six degrees above normal. The State average rainfall for the period was .4 inches. MAY: The month began with warm temperatures across most of the State. Typical May weather began the week ending May 15th, 2011. The week ending May 22nd, began with cloudy, cooler weather and pockets of rainfall for most of the State. By late May, cotton planting was eighty six percent complete while peanut planting advanced to seventy five percent complete. Soybean planting reached fifty seven percent complete. Hot, dry weather dominated the final week of May. Sunny skies brought temperatures back into the 90's on Sunday. Winter wheat completely turned color, finishing well ahead of the five year average due to warmer temperatures. The State average rainfall for the period was 0.7 inches. JUNE: The first week brought higher than normal temperatures and very little rainfall to the State. By mid-June, hot, dry weather contributed to lower yield potential for major crops. High temperatures and scattered thunderstorms characterized the week ending June 26th. The week began with temperatures in the triple digits for much of the State. The State average temperature for the period was four degrees above normal. Eighty six percent of corn had silked. Cotton planting was completed for the season, finishing on schedule with the five year average. Eighteen percent of peanuts had pegged, while soybean planting reached 94 percent complete, one point ahead of the five year average. Seventy eight percent of the crop had emerged. By the end of June, winter wheat harvest was 100 percent complete.
- 6 -
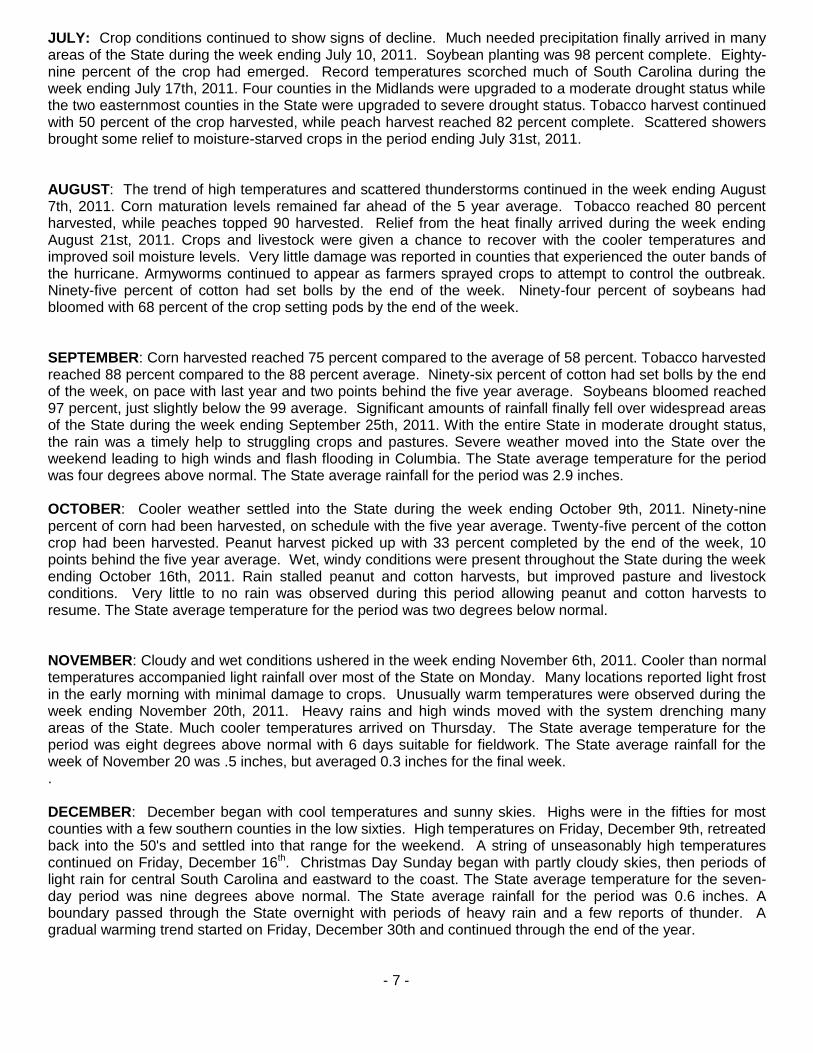
JULY: Crop conditions continued to show signs of decline. Much needed precipitation finally arrived in many areas of the State during the week ending July 10, 2011. Soybean planting was 98 percent complete. Eighty- nine percent of the crop had emerged. Record temperatures scorched much of South Carolina during the week ending July 17th, 2011. Four counties in the Midlands were upgraded to a moderate drought status while the two easternmost counties in the State were upgraded to severe drought status. Tobacco harvest continued with 50 percent of the crop harvested, while peach harvest reached 82 percent complete. Scattered showers brought some relief to moisture-starved crops in the period ending July 31st, 2011. AUGUST: The trend of high temperatures and scattered thunderstorms continued in the week ending August 7th, 2011. Corn maturation levels remained far ahead of the 5 year average. Tobacco reached 80 percent harvested, while peaches topped 90 harvested. Relief from the heat finally arrived during the week ending August 21st, 2011. Crops and livestock were given a chance to recover with the cooler temperatures and improved soil moisture levels. Very little damage was reported in counties that experienced the outer bands of the hurricane. Armyworms continued to appear as farmers sprayed crops to attempt to control the outbreak. Ninety-five percent of cotton had set bolls by the end of the week. Ninety-four percent of soybeans had bloomed with 68 percent of the crop setting pods by the end of the week. SEPTEMBER: Corn harvested reached 75 percent compared to the average of 58 percent. Tobacco harvested reached 88 percent compared to the 88 percent average. Ninety-six percent of cotton had set bolls by the end of the week, on pace with last year and two points behind the five year average. Soybeans bloomed reached 97 percent, just slightly below the 99 average. Significant amounts of rainfall finally fell over widespread areas of the State during the week ending September 25th, 2011. With the entire State in moderate drought status, the rain was a timely help to struggling crops and pastures. Severe weather moved into the State over the weekend leading to high winds and flash flooding in Columbia. The State average temperature for the period was four degrees above normal. The State average rainfall for the period was 2.9 inches. OCTOBER: Cooler weather settled into the State during the week ending October 9th, 2011. Ninety-nine percent of corn had been harvested, on schedule with the five year average. Twenty-five percent of the cotton crop had been harvested. Peanut harvest picked up with 33 percent completed by the end of the week, 10 points behind the five year average. Wet, windy conditions were present throughout the State during the week ending October 16th, 2011. Rain stalled peanut and cotton harvests, but improved pasture and livestock conditions. Very little to no rain was observed during this period allowing peanut and cotton harvests to resume. The State average temperature for the period was two degrees below normal. NOVEMBER: Cloudy and wet conditions ushered in the week ending November 6th, 2011. Cooler than normal temperatures accompanied light rainfall over most of the State on Monday. Many locations reported light frost in the early morning with minimal damage to crops. Unusually warm temperatures were observed during the week ending November 20th, 2011. Heavy rains and high winds moved with the system drenching many areas of the State. Much cooler temperatures arrived on Thursday. The State average temperature for the period was eight degrees above normal with 6 days suitable for fieldwork. The State average rainfall for the week of November 20 was .5 inches, but averaged 0.3 inches for the final week. . DECEMBER: December began with cool temperatures and sunny skies. Highs were in the fifties for most counties with a few southern counties in the low sixties. High temperatures on Friday, December 9th, retreated back into the 50's and settled into that range for the weekend. A string of unseasonably high temperatures continued on Friday, December 16th. Christmas Day Sunday began with partly cloudy skies, then periods of light rain for central South Carolina and eastward to the coast. The State average temperature for the seven-day period was nine degrees above normal. The State average rainfall for the period was 0.6 inches. A boundary passed through the State overnight with periods of heavy rain and a few reports of thunder. A gradual warming trend started on Friday, December 30th and continued through the end of the year.
- 7 -

CROPS, FRUITS AND VEGETABLES
Acreage, Yield, and Production, SOUTH CAROLINA, 2010 and 2011
Crop and Unit
Planted
Acres
Harvested
Acres
Yield Per
Harvested Acre
Total Production
2010
2011
2010
2011
2010
2011
2010
2011
------------ Thou. Acres ------------
------ Thou. ------
Corn, Grain ............................. Bu. 350 360 335 330 91 65 30,485 21,450
Corn, Silage .......................... Ton -- -- 10 14 16.0 12.0 160 168
Cotton ......................... Lb. & Bale 202 303 201 301 898 828 376 519
Cottonseed............................. Ton -- -- -- -- -- -- 123 159
Hay, All................................... Ton -- -- 360 300 2.0 2.1 720 630
Oats ....................................... Bu. 26 22 13 13 47 60 611 780
Peanuts, Nuts ......................... Lb. 67.0 77.0 64.0 73.0 3,500 3,300 224,000 240,900
Sorghum, Grain 2/ ................. Bu. -- -- -- -- -- -- -- --
Sorghum, Silage 2/ ............... Ton -- -- -- -- -- -- -- --
Soybeans, Beans .................... Bu. 465 370 455 360 23 25.5 10,465 9,180
Sweet potatoes 2/ ............... Cwt. -- -- -- -- -- -- -- --
Tobacco ................................. Lb. -- -- 16.0 15.5 2,250 1,700 36,000 26,350
Wheat, Winter ........................ Bu. 145 190 130 180 36 60 4,680 10,800
Apples 2/ ............................... Lb. -- -- -- -- -- -- -- --
Peaches 1/ ............................. Ton -- -- 15.5 15.5 7.10 6.13 102,800 77,600
Pecans, All 1/ ....................... Lb. -- -- -- -- -- -- 1,500 3,000
Cucumbers, Pickles .............. Ton 2.0 2.0 2.0 2.0 3.00 3.00 6,000 6,000
FRESH MARKET
Cantaloupes ......................... Cwt. 1.6 1.6 1.2 1.4 195 325 234 455
Cucumbers ............................ Cwt. 1.5 1.8 1.4 1.7 180 200 252 340
Snap beans ........................... Cwt. 0.5 0.3 0.4 0.2 45 33 18 7
Squash ................................. Cwt. 0.6 1.6 0.5 1.5 130 130 66 195
Tomatoes ............................. Cwt. 2.5 2.7 2.4 2.5 170 195 408 488 Watermelons ........................ Cwt. 8.5 7.8 8.0 7.0 330 380 2,640 2,660
1/ Utilized production. 2/ Estimates discontinued in 2009.
- 8 -
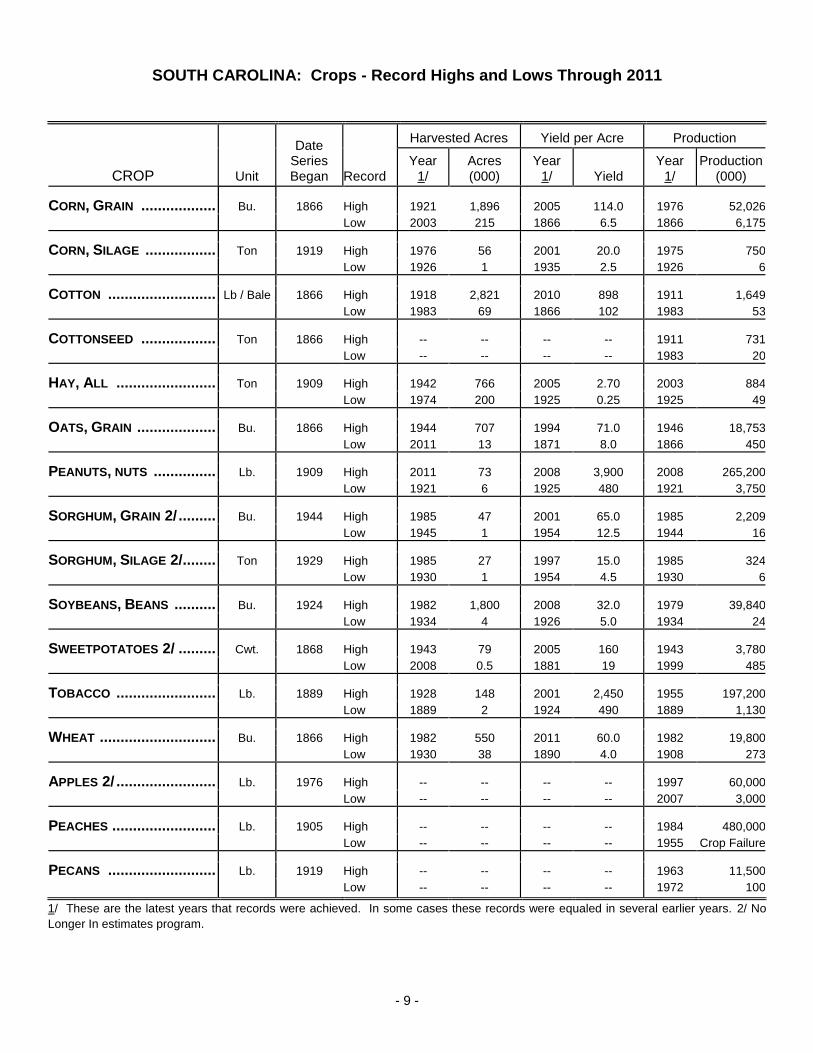
SOUTH CAROLINA: Crops - Record Highs and Lows Through 2011
CROP
Unit
Date
Series Began
Record
Harvested Acres
Yield per Acre
Production
Year
1/
Acres (000)
Year
1/
Yield
Year
1/
Production
(000)
CORN, GRAIN .................. Bu. 1866 High 1921 1,896 2005 114.0 1976 52,026
Low 2003 215 1866 6.5 1866 6,175
CORN, SILAGE ................. Ton 1919 High 1976 56 2001 20.0 1975 750
Low 1926 1 1935 2.5 1926 6
COTTON .......................... Lb / Bale 1866 High 1918 2,821 2010 898 1911 1,649
Low 1983 69 1866 102 1983 53
COTTONSEED .................. Ton 1866 High -- -- -- -- 1911 731
Low -- -- -- -- 1983 20
HAY, ALL ........................ Ton 1909 High 1942 766 2005 2.70 2003 884
Low 1974 200 1925 0.25 1925 49
OATS, GRAIN ................... Bu. 1866 High 1944 707 1994 71.0 1946 18,753
Low 2011 13 1871 8.0 1866 450
PEANUTS, NUTS ............... Lb. 1909 High 2011 73 2008 3,900 2008 265,200
Low 1921 6 1925 480 1921 3,750
SORGHUM, GRAIN 2/ ......... Bu. 1944 High 1985 47 2001 65.0 1985 2,209
Low 1945 1 1954 12.5 1944 16
SORGHUM, SILAGE 2/........ Ton 1929 High 1985 27 1997 15.0 1985 324
Low 1930 1 1954 4.5 1930 6
SOYBEANS, BEANS .......... Bu. 1924 High 1982 1,800 2008 32.0 1979 39,840
Low 1934 4 1926 5.0 1934 24
SWEETPOTATOES 2/ ......... Cwt. 1868 High 1943 79 2005 160 1943 3,780
Low 2008 0.5 1881 19 1999 485
TOBACCO ........................ Lb. 1889 High 1928 148 2001 2,450 1955 197,200
Low 1889 2 1924 490 1889 1,130
WHEAT ............................ Bu. 1866 High 1982 550 2011 60.0 1982 19,800
Low 1930 38 1890 4.0 1908 273
APPLES 2/ ........................ Lb. 1976 High -- -- -- -- 1997 60,000
Low -- -- -- -- 2007 3,000
PEACHES ......................... Lb. 1905 High -- -- -- -- 1984 480,000
Low -- -- -- -- 1955 Crop Failure
PECANS .......................... Lb. 1919 High -- -- -- -- 1963 11,500
Low -- -- -- -- 1972 100
1/ These are the latest years that records were achieved. In some cases these records were equaled in several earlier years. 2/ No
Longer In estimates program.
- 9 -
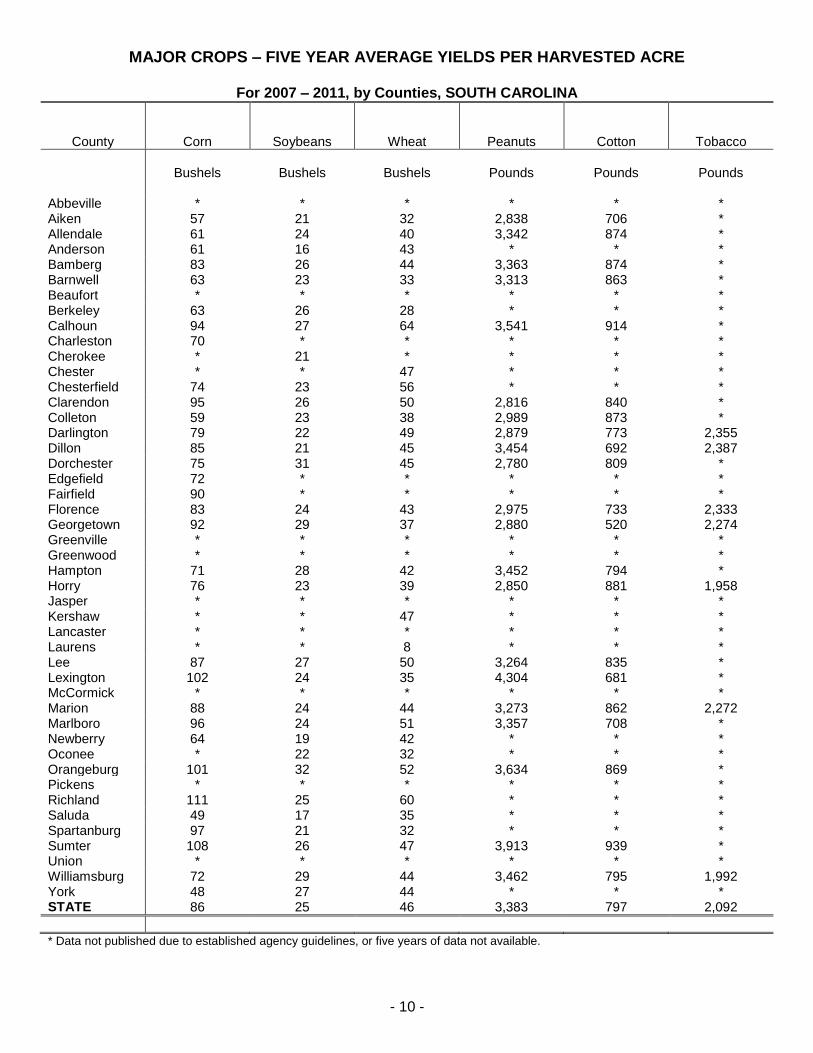
MAJOR CROPS – FIVE YEAR AVERAGE YIELDS PER HARVESTED ACRE
For 2007 – 2011, by Counties, SOUTH CAROLINA
County Corn Soybeans Wheat Peanuts Cotton
Tobacco
Bushels Bushels Bushels Pounds Pounds Pounds
Abbeville * * * * * * Aiken 57 21 32 2,838 706 * Allendale 61 24 40 3,342 874 * Anderson 61 16 43 * * * Bamberg 83 26 44 3,363 874 * Barnwell 63 23 33 3,313 863 * Beaufort * * * * * * Berkeley 63 26 28 * * * Calhoun 94 27 64 3,541 914 * Charleston 70 * * * * * Cherokee * 21 * * * * Chester * * 47 * * * Chesterfield 74 23 56 * * * Clarendon 95 26 50 2,816 840 * Colleton 59 23 38 2,989 873 * Darlington 79 22 49 2,879 773 2,355 Dillon 85 21 45 3,454 692 2,387 Dorchester 75 31 45 2,780 809 * Edgefield 72 * * * * * Fairfield 90 * * * * * Florence 83 24 43 2,975 733 2,333 Georgetown 92 29 37 2,880 520 2,274 Greenville * * * * * * Greenwood * * * * * * Hampton 71 28 42 3,452 794 * Horry 76 23 39 2,850 881 1,958 Jasper * * * * * * Kershaw * * 47 * * * Lancaster * * * * * * Laurens * * 8 * * * Lee 87 27 50 3,264 835 * Lexington 102 24 35 4,304 681 * McCormick * * * * * * Marion 88 24 44 3,273 862 2,272 Marlboro 96 24 51 3,357 708 * Newberry 64 19 42 * * * Oconee * 22 32 * * * Orangeburg 101 32 52 3,634 869 * Pickens * * * * * * Richland 111 25 60 * * * Saluda 49 17 35 * * * Spartanburg 97 21 32 * * * Sumter 108 26 47 3,913 939 * Union * * * * * * Williamsburg 72 29 44 3,462 795 1,992 York 48 27 44 * * * STATE 86 25 46 3,383 797 2,092
* Data not published due to established agency guidelines, or five years of data not available.
- 10 -

CORN Acreage, Yield, and Production, by Counties, SOUTH CAROLINA, 2010 and 2011
County
Acres Planted
for all Purposes
Acres Harvested
for Grain
Yield Per
Harvested Acre
Production for Grain
2010
2011
2010
2011
2010
2011
2010
2011
-------------------- Acres --------------------
-------------------- Bushels --------------------
Abbeville 1/ Aiken 4,000 4,000 3,400 3,300 55.1 65.2 187,400 215,000 Allendale 11,200 11,000 11,100 10,100 82.4 20.8 915,000 210,000 Anderson 1,800 1,100 1,000 400 63 59.3 63,000 23,700 Bamberg 6,800 6,300 6,200 5,100 84.7 68.6 525,000 350,000 Barnwell 4,400 4,500 4,100 4,200 69 71.4 283,000 300,000 Beaufort 1/ Berkeley 2,500 3,400 2,200 2,600 71.8 38.5 158,000 100,000 Calhoun 8,000 6,400 7,600 6,300 90.8 123.8 690,000 780,000 Charleston 1/ Cherokee 1/ Chester 1/ Chesterfield 6,400 6,000 6,300 5,700 67.5 69.3 425,000 395,000 Clarendon 33,500 34,100 33,300 34,000 101.8 76.3 3,390,000 2,595,000 Colleton 6,300 6,600 6,000 4,100 73.3 25.6 440,000 105,000 Darlington 22,000 22,700 21,300 22,300 76.3 63.5 1,625,000 1,415,000 Dillon 17,000 21,200 16,900 21,100 105.3 63 1,780,000 1,330,000 Dorchester 6,900 7,200 6,700 6,800 73 40.4 489,000 275,000 Edgefield 1/ Fairfield 1/ Florence 21,400 24,900 21,200 23,800 101.2 42.9 2,145,000 1,020,000 Georgetown 1,900 1,900 1,700 1,600 79.4 34.4 135,000 55,000 Greenville 1/ Greenwood 1/ Hampton 6,300 7,600 6,100 6,700 83.6 57.5 510,000 385,000 Horry 25,800 28,400 25,500 26,600 83.9 34.6 2,140,000 920,000 Jasper 1,100 1/ 900 1/ 59.9 1/ 53,900 1/ Kershaw 1/ 2,900 1/ 2,800 1/ 77.5 1/ 217,000 Lancaster 1/ Laurens 1/ Lee 25,200 28,100 25,000 27,600 84 79.9 2,100,000 2,205,000 Lexington 6,000 6,000 5,800 5,800 90.5 57.8 525,000 335,000 McCormick 1/ Marion 8,000 11,100 7,900 10,500 110.8 51 875,000 535,000 Marlboro 7,900 9,400 7,800 9,300 91 84.4 710,000 785,000 Newberry 4,200 1/ 3,100 1/ 60 1/ 186,000 1/ Oconee 1/ Orangeburg 40,200 34,100 37,700 30,000 101.9 85.8 3,840,000 2,575,000 Pickens 1/ Richland 7,000 5,400 6,700 5,100 98.5 121.6 660,000 620,000 Saluda 1/ 1,500 1/ 600 1/ 58.2 1/ 34,900 Spartanburg 1,000 1,100 800 400 87.5 123.8 70,000 49,500 Sumter 30,600 32,400 30,100 31,200 106.5 90.9 3,205,000 2,835,000 Union 1/ Williamsburg 21,600 21,400 20,900 17,600 87.1 30.1 1,820,000 530,000 York 500 1/ 350 1/ 27.1 1/ 9,500 1/ Other Counties 10,500 9,300 7,350 4,400 72 58 530,200 254,900 STATE 350,000 360,000 335,000 330,000 91 65 30,485,000 21,450,000
1/ Included in other counties; not published separately due to established agency guidelines.
- 11 -
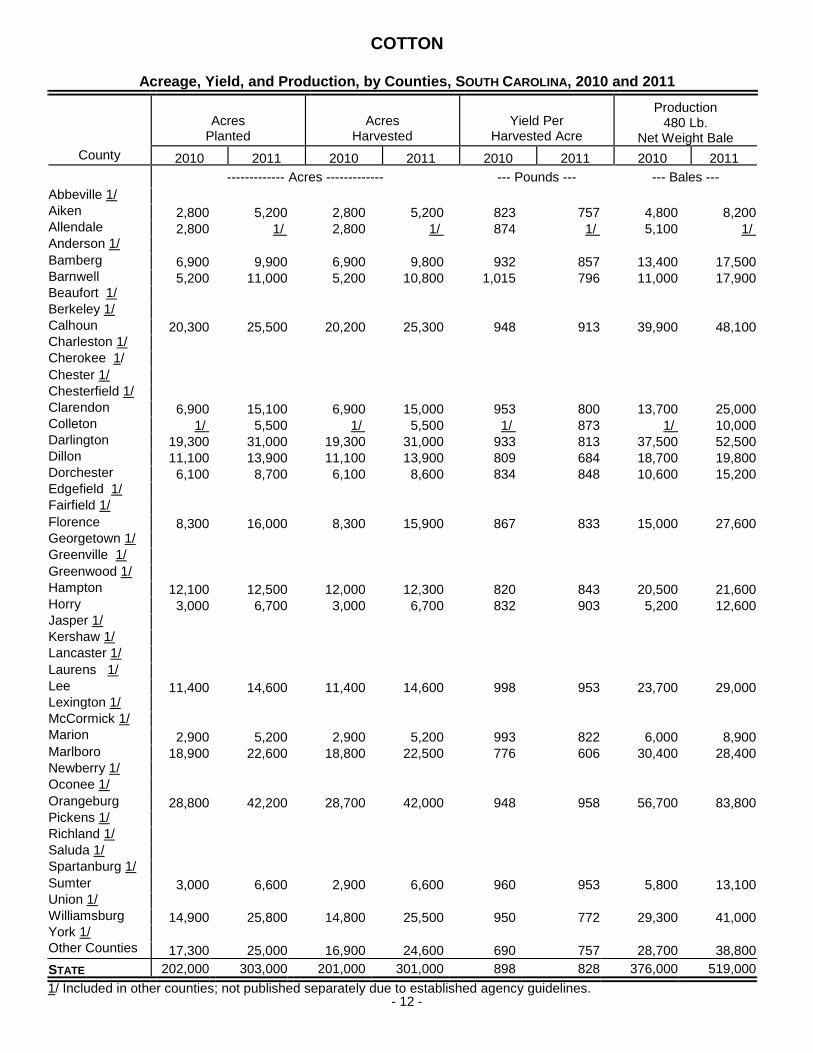
COTTON Acreage, Yield, and Production, by Counties, SOUTH CAROLINA, 2010 and 2011
County
Acres
Planted
Acres
Harvested
Yield Per
Harvested Acre
Production
480 Lb. Net Weight Bale
2010
2011
2010
2011
2010
2011
2010
2011
------------- Acres -------------
--- Pounds ---
--- Bales --- Abbeville 1/ Aiken 2,800 5,200 2,800 5,200 823 757 4,800 8,200 Allendale 2,800 1/ 2,800 1/ 874 1/ 5,100 1/ Anderson 1/ Bamberg 6,900 9,900 6,900 9,800 932 857 13,400 17,500 Barnwell 5,200 11,000 5,200 10,800 1,015 796 11,000 17,900 Beaufort 1/ Berkeley 1/ Calhoun 20,300 25,500 20,200 25,300 948 913 39,900 48,100 Charleston 1/ Cherokee 1/ Chester 1/ Chesterfield 1/ Clarendon 6,900 15,100 6,900 15,000 953 800 13,700 25,000 Colleton 1/ 5,500 1/ 5,500 1/ 873 1/ 10,000 Darlington 19,300 31,000 19,300 31,000 933 813 37,500 52,500 Dillon 11,100 13,900 11,100 13,900 809 684 18,700 19,800 Dorchester 6,100 8,700 6,100 8,600 834 848 10,600 15,200 Edgefield 1/ Fairfield 1/ Florence 8,300 16,000 8,300 15,900 867 833 15,000 27,600 Georgetown 1/ Greenville 1/ Greenwood 1/ Hampton 12,100 12,500 12,000 12,300 820 843 20,500 21,600 Horry 3,000 6,700 3,000 6,700 832 903 5,200 12,600 Jasper 1/ Kershaw 1/ Lancaster 1/ Laurens 1/ Lee 11,400 14,600 11,400 14,600 998 953 23,700 29,000 Lexington 1/ McCormick 1/ Marion 2,900 5,200 2,900 5,200 993 822 6,000 8,900 Marlboro 18,900 22,600 18,800 22,500 776 606 30,400 28,400 Newberry 1/ Oconee 1/ Orangeburg 28,800 42,200 28,700 42,000 948 958 56,700 83,800 Pickens 1/ Richland 1/ Saluda 1/ Spartanburg 1/ Sumter 3,000 6,600 2,900 6,600 960 953 5,800 13,100 Union 1/ Williamsburg 14,900 25,800 14,800 25,500 950 772 29,300 41,000 York 1/ Other Counties 17,300 25,000 16,900 24,600 690 757 28,700 38,800
STATE 202,000 303,000 201,000 301,000 898 828 376,000 519,000
1/ Included in other counties; not published separately due to established agency guidelines. - 12 -

ALL HAY Acreage, Yield, and Production, by Counties, SOUTH CAROLINA, 2010 and 2011
County
Acres
Harvested
Yield Per
Harvested Acre
Production
2010
2011
2010
2011
2010
2011
----- Acres -----
------------------------------ Tons ------------------------------
Abbeville 1/ 12,000 1/ 1.5 1/ 18,000 1/ Aiken 18,000 13,800 2.8 1.95 50,300 26,600 Allendale 1/ 1/ 4,500 1/ 4.45 1/ 20,000 Anderson 36,100 21,900 1.5 1.8 55,000 39,100 Bamberg 3,900 3,600 3.7 3.45 14,400 12,500 Barnwell 1/ 4,000 1/ 3.1 1/ 12,400 1/ Beaufort 1/ 500 1/ 2.4 1/ 1,200 1/ Berkeley 3,000 2,400 2.0 2.8 6,000 6,700 Calhoun 1/ 2,500 1/ 3.65 1/ 9,100 1/ Charleston 1/ 2,100 1/ 2.2 1/ 4,600 1/ Cherokee 1/ 1/ 1/ 1/ 1/ 1/ Chester 10,300 7,500 1.95 1.8 20,100 13,400 Chesterfield 1/ 8,850 1/ 2.5 1/ 22,200 1/ Clarendon 1/ 2,900 1/ 2.35 1/ 6,800 1/ Colleton 5,600 5,100 2.4 1.95 13,400 10,000 Darlington 3,450 1,900 2.25 1.9 7,700 3,600 Dillon 2,800 2,400 2.05 1.9 5,800 4,600 Dorchester 2,800 1,900 2.1 2.25 5,900 4,300 Edgefield 6,500 4,900 1.95 1.4 12,800 6,900 Fairfield 1/ 4,300 1/ 1.55 1/ 6,600 1/ Florence 1/ 2,400 1/ 2.3 1/ 5,500 1/ Georgetown 1/ 1/ 1/ 1/ 1/ 1/ Greenville 1/ 9,400 1/ 1.35 1/ 12,500 1/ Greenwood 1/ 9,700 1/ 1.65 1/ 16,000 1/ Hampton 1/ 1,700 1/ 2.6 1/ 4,400 1/ Horry 1/ 6,000 1/ 2.45 1/ 14,800 1/ Jasper 1/ 1/ 1/ 1/ 1/ 1/ Kershaw 6,300 2,900 2.4 2.1 15,200 6,100 Lancaster 1/ 11,000 1/ 2.65 1/ 29,300 1/ Laurens 1/ 24,200 1/ 1.5 1/ 36,200 1/ Lee 1/ 2,900 1/ 2.25 1/ 6,500 1/ Lexington 10,400 7,800 2.25 2.7 23,500 20,900 McCormick 1/ 2,200 1/ 1.35 1/ 3,000 1/ Marion 3,100 2,500 3.0 3.1 9,300 7,800 Marlboro 1/ 1/ 1/ 1/ 1/ 1/ Newberry 16,500 10,200 2.05 2.2 33,900 22,300 Oconee 1/ 18,700 1/ 1.95 1/ 36,000 1/ Orangeburg 7,700 5,600 2.85 4 22,000 22,400 Pickens 1/ 10,600 1/ 1.7 1/ 17,900 1/ Richland 1/ 2,300 1/ 1.75 1/ 4,000 1/ Saluda 16,500 18,900 2 2.95 33,000 56,000 Spartanburg 1/ 22,000 1/ 1.55 1/ 34,000 1/ Sumter 1/ 4,900 1/ 2.85 1/ 14,000 1/ Union 1/ 1/ 1/ 1/ 1/ 1/ Williamsburg 1/ 2,800 1/ 2.25 1/ 6,300 1/ York 1/ 17,900 1/ 1.75 1/ 31,600 1/ Other Counties 21,200 182,200 1.75 1.9 38,800 346,800 STATE 360,000 300,000 2.0 2.1 720,000 630,000
1/ Included in other counties; not published separately due to established agency guidelines
- 13 -
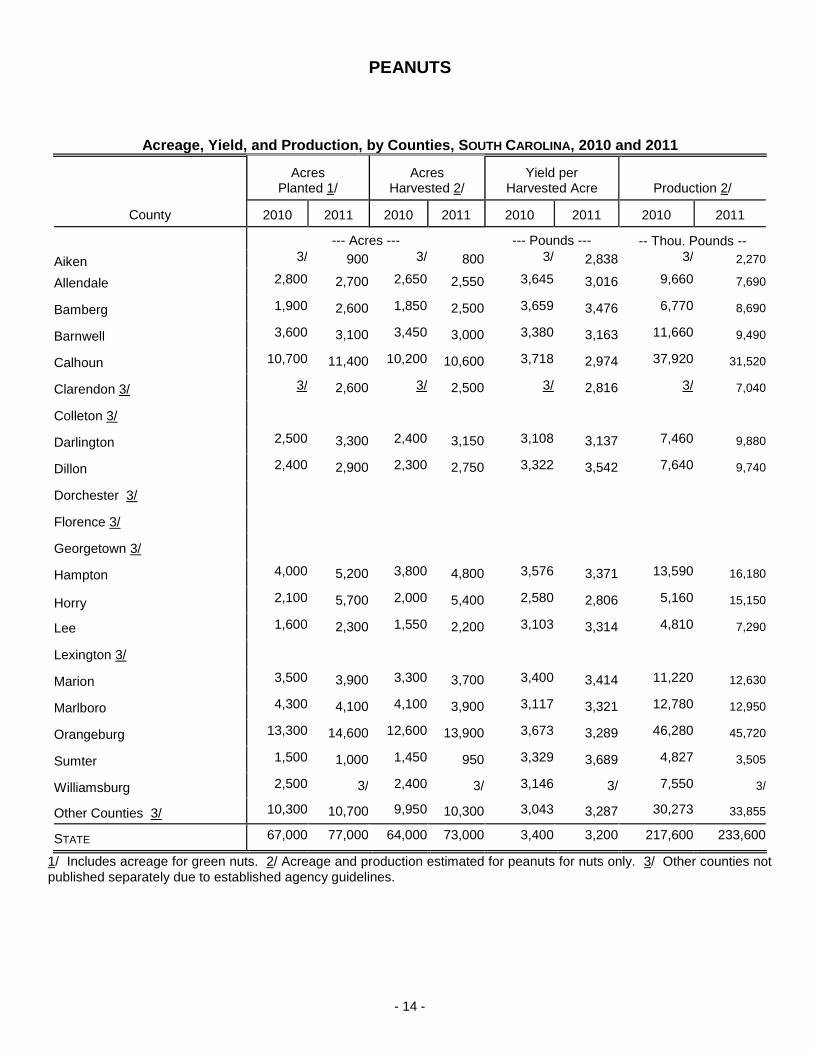
PEANUTS Acreage, Yield, and Production, by Counties, SOUTH CAROLINA, 2010 and 2011
County
Acres
Planted 1/
Acres
Harvested 2/
Yield per
Harvested Acre
Production 2/
2010
2011 2010
2011 2010
2011 2010
2011
--- Acres ---
--- Pounds ---
-- Thou. Pounds --
Aiken 3/ 900 3/ 800 3/ 2,838 3/ 2,270 Allendale 2,800 2,700 2,650 2,550 3,645 3,016 9,660 7,690
Bamberg 1,900 2,600 1,850 2,500 3,659 3,476 6,770 8,690
Barnwell 3,600 3,100 3,450 3,000 3,380 3,163 11,660 9,490
Calhoun 10,700 11,400 10,200 10,600 3,718 2,974 37,920 31,520
Clarendon 3/ 3/ 2,600 3/ 2,500 3/ 2,816 3/ 7,040
Colleton 3/
Darlington 2,500 3,300 2,400 3,150 3,108 3,137 7,460 9,880
Dillon 2,400 2,900 2,300 2,750 3,322 3,542 7,640 9,740
Dorchester 3/
Florence 3/
Georgetown 3/
Hampton 4,000 5,200 3,800 4,800 3,576 3,371 13,590 16,180
Horry 2,100 5,700 2,000 5,400 2,580 2,806 5,160 15,150
Lee 1,600 2,300 1,550 2,200 3,103 3,314 4,810 7,290
Lexington 3/
Marion 3,500 3,900 3,300 3,700 3,400 3,414 11,220 12,630
Marlboro 4,300 4,100 4,100 3,900 3,117 3,321 12,780 12,950
Orangeburg 13,300 14,600 12,600 13,900 3,673 3,289 46,280 45,720
Sumter 1,500 1,000 1,450 950 3,329 3,689 4,827 3,505
Williamsburg 2,500 3/ 2,400 3/ 3,146 3/ 7,550 3/
Other Counties 3/ 10,300 10,700 9,950 10,300 3,043 3,287 30,273 33,855
STATE 67,000 77,000 64,000 73,000 3,400 3,200 217,600 233,600
1/ Includes acreage for green nuts. 2/ Acreage and production estimated for peanuts for nuts only. 3/ Other counties not
published separately due to established agency guidelines.
- 14 -
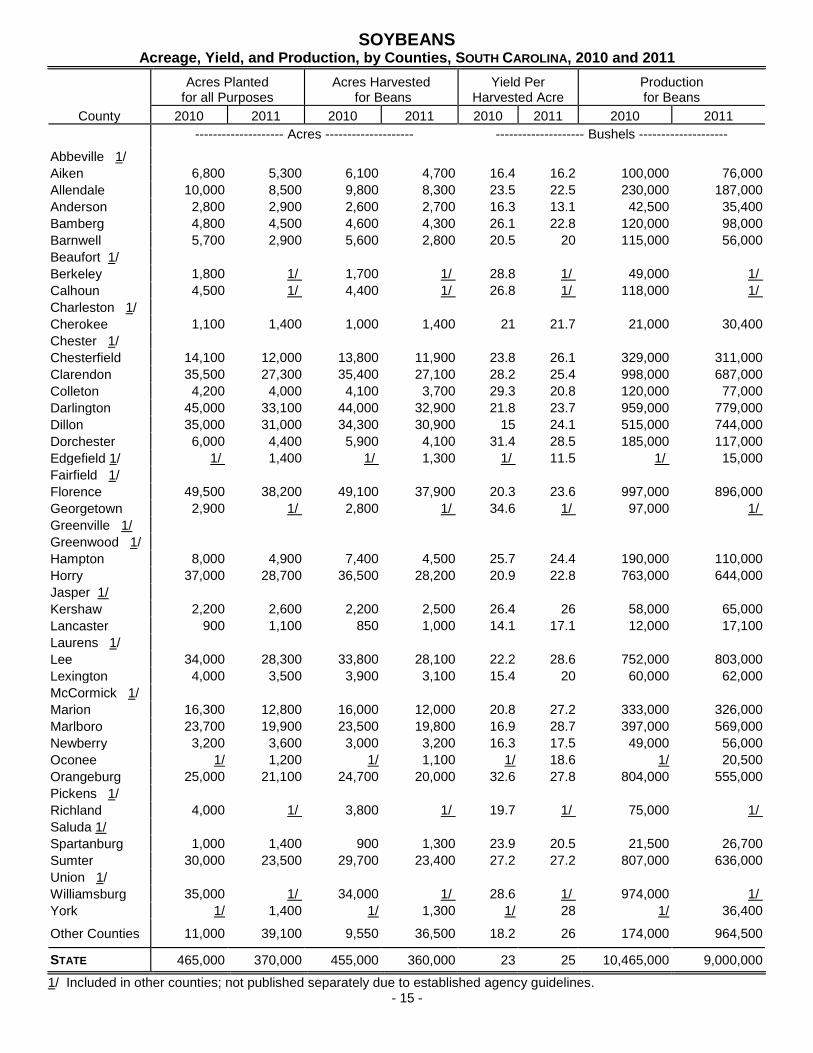
SOYBEANS
Acreage, Yield, and Production, by Counties, SOUTH CAROLINA, 2010 and 2011
County
Acres Planted
for all Purposes
Acres Harvested
for Beans
Yield Per
Harvested Acre
Production for Beans
2010
2011
2010
2011
2010
2011
2010
2011
-------------------- Acres --------------------
-------------------- Bushels --------------------
Abbeville 1/ Aiken 6,800 5,300 6,100 4,700 16.4 16.2 100,000 76,000 Allendale 10,000 8,500 9,800 8,300 23.5 22.5 230,000 187,000 Anderson 2,800 2,900 2,600 2,700 16.3 13.1 42,500 35,400 Bamberg 4,800 4,500 4,600 4,300 26.1 22.8 120,000 98,000 Barnwell 5,700 2,900 5,600 2,800 20.5 20 115,000 56,000 Beaufort 1/ Berkeley 1,800 1/ 1,700 1/ 28.8 1/ 49,000 1/ Calhoun 4,500 1/ 4,400 1/ 26.8 1/ 118,000 1/ Charleston 1/ Cherokee 1,100 1,400 1,000 1,400 21 21.7 21,000 30,400 Chester 1/ Chesterfield 14,100 12,000 13,800 11,900 23.8 26.1 329,000 311,000 Clarendon 35,500 27,300 35,400 27,100 28.2 25.4 998,000 687,000 Colleton 4,200 4,000 4,100 3,700 29.3 20.8 120,000 77,000 Darlington 45,000 33,100 44,000 32,900 21.8 23.7 959,000 779,000 Dillon 35,000 31,000 34,300 30,900 15 24.1 515,000 744,000 Dorchester 6,000 4,400 5,900 4,100 31.4 28.5 185,000 117,000 Edgefield 1/ 1/ 1,400 1/ 1,300 1/ 11.5 1/ 15,000 Fairfield 1/ Florence 49,500 38,200 49,100 37,900 20.3 23.6 997,000 896,000 Georgetown 2,900 1/ 2,800 1/ 34.6 1/ 97,000 1/ Greenville 1/ Greenwood 1/ Hampton 8,000 4,900 7,400 4,500 25.7 24.4 190,000 110,000 Horry 37,000 28,700 36,500 28,200 20.9 22.8 763,000 644,000 Jasper 1/ Kershaw 2,200 2,600 2,200 2,500 26.4 26 58,000 65,000 Lancaster 900 1,100 850 1,000 14.1 17.1 12,000 17,100 Laurens 1/ Lee 34,000 28,300 33,800 28,100 22.2 28.6 752,000 803,000 Lexington 4,000 3,500 3,900 3,100 15.4 20 60,000 62,000 McCormick 1/ Marion 16,300 12,800 16,000 12,000 20.8 27.2 333,000 326,000 Marlboro 23,700 19,900 23,500 19,800 16.9 28.7 397,000 569,000 Newberry 3,200 3,600 3,000 3,200 16.3 17.5 49,000 56,000 Oconee 1/ 1,200 1/ 1,100 1/ 18.6 1/ 20,500 Orangeburg 25,000 21,100 24,700 20,000 32.6 27.8 804,000 555,000 Pickens 1/ Richland 4,000 1/ 3,800 1/ 19.7 1/ 75,000 1/ Saluda 1/ Spartanburg 1,000 1,400 900 1,300 23.9 20.5 21,500 26,700 Sumter 30,000 23,500 29,700 23,400 27.2 27.2 807,000 636,000 Union 1/ Williamsburg 35,000 1/ 34,000 1/ 28.6 1/ 974,000 1/ York 1/ 1,400 1/ 1,300 1/ 28 1/ 36,400 Other Counties 11,000 39,100 9,550 36,500 18.2 26 174,000 964,500 STATE 465,000 370,000 455,000 360,000 23 25 10,465,000 9,000,000
1/ Included in other counties; not published separately due to established agency guidelines. - 15 -
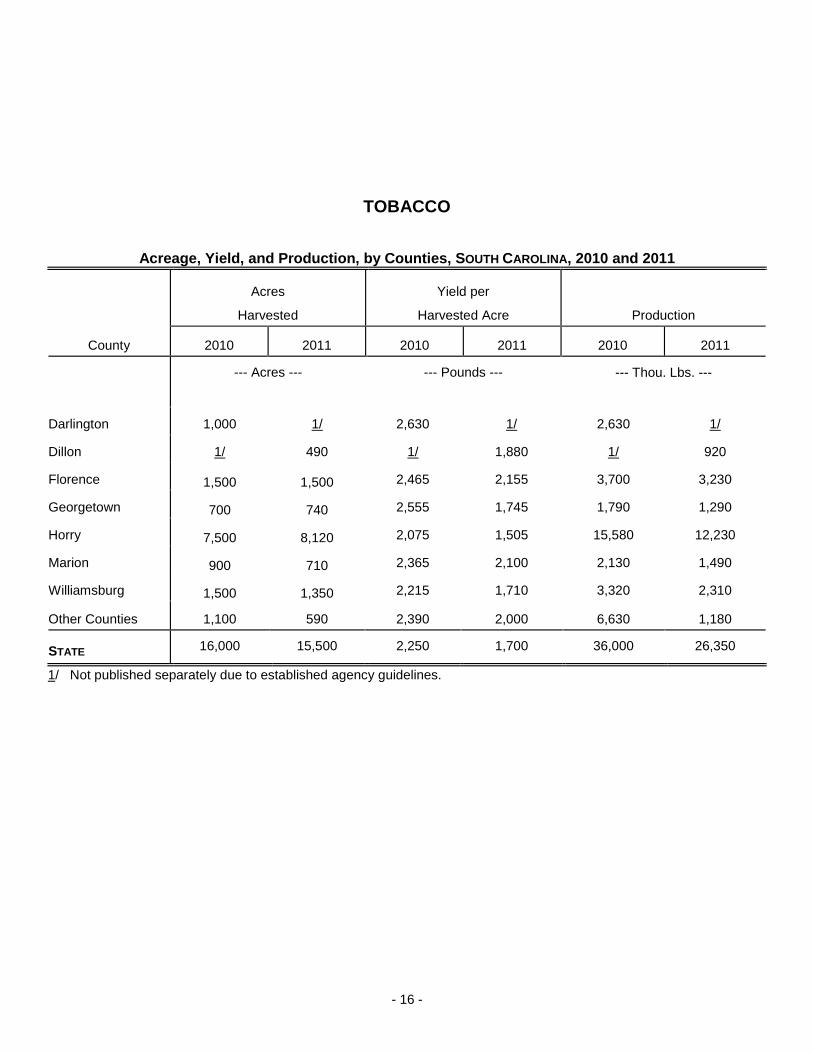
TOBACCO
Acreage, Yield, and Production, by Counties, SOUTH CAROLINA, 2010 and 2011
County
Acres
Harvested
Yield per
Harvested Acre
Production
2010
2011
2010
2011
2010
2011
--- Acres ---
--- Pounds ---
--- Thou. Lbs. ---
Darlington 1,000 1/ 2,630 1/ 2,630 1/
Dillon 1/ 490 1/ 1,880 1/ 920
Florence 1,500 1,500 2,465 2,155 3,700 3,230
Georgetown 700 740 2,555 1,745 1,790 1,290
Horry 7,500 8,120 2,075 1,505 15,580 12,230
Marion 900 710 2,365 2,100 2,130 1,490
Williamsburg 1,500 1,350 2,215 1,710 3,320 2,310
Other Counties 1,100 590 2,390 2,000 6,630 1,180
STATE 16,000 15,500 2,250 1,700 36,000 26,350
1/ Not published separately due to established agency guidelines.
- 16 -
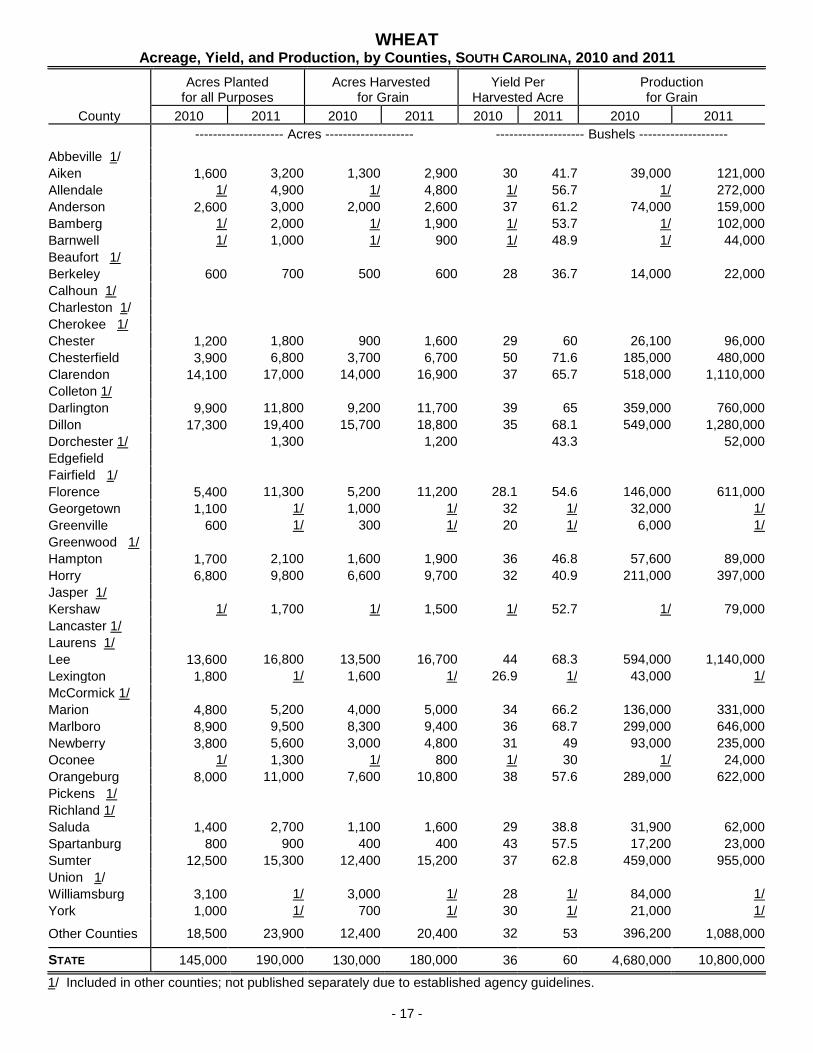
WHEAT
Acreage, Yield, and Production, by Counties, SOUTH CAROLINA, 2010 and 2011
County
Acres Planted
for all Purposes
Acres Harvested
for Grain
Yield Per
Harvested Acre
Production for Grain
2010
2011
2010
2011
2010
2011
2010
2011
-------------------- Acres --------------------
-------------------- Bushels --------------------
Abbeville 1/
Aiken 1,600 3,200 1,300 2,900 30 41.7 39,000 121,000 Allendale 1/ 4,900 1/ 4,800 1/ 56.7 1/ 272,000 Anderson 2,600 3,000 2,000 2,600 37 61.2 74,000 159,000 Bamberg 1/ 2,000 1/ 1,900 1/ 53.7 1/ 102,000 Barnwell 1/ 1,000 1/ 900 1/ 48.9 1/ 44,000 Beaufort 1/ Berkeley 600 700 500 600 28 36.7 14,000 22,000 Calhoun 1/ Charleston 1/ Cherokee 1/ Chester 1,200 1,800 900 1,600 29 60 26,100 96,000 Chesterfield 3,900 6,800 3,700 6,700 50 71.6 185,000 480,000 Clarendon 14,100 17,000 14,000 16,900 37 65.7 518,000 1,110,000 Colleton 1/ Darlington 9,900 11,800 9,200 11,700 39 65 359,000 760,000 Dillon 17,300 19,400 15,700 18,800 35 68.1 549,000 1,280,000 Dorchester 1/ 1,300 1,200 43.3 52,000 Edgefield Fairfield 1/ Florence 5,400 11,300 5,200 11,200 28.1 54.6 146,000 611,000 Georgetown 1,100 1/ 1,000 1/ 32 1/ 32,000 1/ Greenville 600 1/ 300 1/ 20 1/ 6,000 1/ Greenwood 1/ Hampton 1,700 2,100 1,600 1,900 36 46.8 57,600 89,000 Horry 6,800 9,800 6,600 9,700 32 40.9 211,000 397,000 Jasper 1/ Kershaw 1/ 1,700 1/ 1,500 1/ 52.7 1/ 79,000 Lancaster 1/ Laurens 1/ Lee 13,600 16,800 13,500 16,700 44 68.3 594,000 1,140,000 Lexington 1,800 1/ 1,600 1/ 26.9 1/ 43,000 1/ McCormick 1/ Marion 4,800 5,200 4,000 5,000 34 66.2 136,000 331,000 Marlboro 8,900 9,500 8,300 9,400 36 68.7 299,000 646,000 Newberry 3,800 5,600 3,000 4,800 31 49 93,000 235,000 Oconee 1/ 1,300 1/ 800 1/ 30 1/ 24,000 Orangeburg 8,000 11,000 7,600 10,800 38 57.6 289,000 622,000 Pickens 1/ Richland 1/ Saluda 1,400 2,700 1,100 1,600 29 38.8 31,900 62,000 Spartanburg 800 900 400 400 43 57.5 17,200 23,000 Sumter 12,500 15,300 12,400 15,200 37 62.8 459,000 955,000 Union 1/ Williamsburg 3,100 1/ 3,000 1/ 28 1/ 84,000 1/ York 1,000 1/ 700 1/ 30 1/ 21,000 1/ Other Counties 18,500 23,900 12,400 20,400 32 53 396,200 1,088,000 STATE 145,000 190,000 130,000 180,000 36 60 4,680,000 10,800,000
1/ Included in other counties; not published separately due to established agency guidelines.
- 17 -

PEACHES
Acreage, Yield and Production SOUTH CAROLINA, 2007 – 2011
Year Bearing Acreage Yield per acre Total Production Utilized Production
---- Acres ---- ---------- Tons ---------- 2007 14,000 0.89 12,500 12,000 2008 14,000 4.29 60,000 57,000 2009 14,000 5.36 75,000 66,000 2010 15,500 7.10 110,000 102,800
2011 15,500 6.13 95,000 77,600
1/ Yield is calculated by dividing total production by total bearing acres with the published estimate rounded according to agency
rounding rules.
PECANS
Utilized Production and Price by Variety, by Years, SOUTH CAROLINA, 2007- 2011
- 18 -
Utilized Production Price per Pound Value of Production
Year Improved
Native/ Seedling
All Improved Native/
Seedling All Improved
Native/ Seedling
All
----- Thou. Lbs ----- ----- Dollars ----- ----- Thou. Dollars -----
2007 1,500 500 2,000 1.160 0.900 1.100 1,740 450 2,190
2008 3,000 400 3,400 1.210 0.650 1.140 3,630 260 3,890
2009 1,200 800 2,000 1.300 0.880 1.130 1,560 704 2,264
2010 1,300 200 1,500 1.800 1.450 1.750 2,340 290 2,630
2011 2,040 960 3,000 2.000 1.350 1.790 4,080 1,296 5,376

SOUTH CAROLINA DISTRICT REFERENCE MAP
- 19 -
CORN
Acreage, Yield, and Production, by Districts, SOUTH CAROLINA, 2010 and 2011
District
Acres Planted
For All Purposes
Acres Harvested
For Grain
Yield Per
Harvested Acre
Production For Grain
2010
---------------- Acres --------------
------------- Bushels -------------
North West 4,300 2,600 73.1 190,000 North Central 5,800 4,500 77.8 350,000 Eastern 132,000 129,500 90 11,655,000 West Central 11,000 8,200 56.1 460,000 Central 150,500 146,200 98.6 14,410,000 Southern 46,400 44,000 77.7 3,420,000 STATE 350,000 335,000 91 30,485,000
2011
North West 4,100 1,900 71.1 135,000 North Central 5,100 4,300 73.3 315,000 Eastern 147,000 138,500 50.4 6,985,000 West Central 9,000 4,800 63.5 305,000 Central 146,500 140,000 85.3 11,945,000 Southern 48,300 40,500 43.6 1,765,000 STATE 360,000 330,000 65 21,450,000

COTTON
Acreage, Yield, and Production, by Districts, SOUTH CAROLINA, 2010 and 2011
District
Acres Planted
Acres Harvested
Yield Per Harvested Acre
Production 480 Lb.
Net Wt. Bale
----------------Acres--------------- Pounds Bales 2010
Northwest 1/
North Central 1/ Eastern 80,700 80,500 872 146,300 West Central 4,600 4,600 710 6,800 Central 74,400 74,100 959 148,000 Southern 37,200 37,000 882 68,000 Other Districts 5,100 4,800 690 6,900
STATE 202,000 201,000 898 376,000
2011
Northwest 1/
North Central 1/ Eastern 125,000 124,400 756 196,000 West Central 7,100 6,900 737 10,600 Central 110,000 109,500 920 209,900 Southern 54,500 53,900 828 93,000 Other Districts 6,400 6,300 724 9,500
STATE 303,000 301,000 828 519,000
1/ Included in other districts; not published due separately due to agency guidelines.
ALL HAY
Acreage, Yield, and Production, by Districts, SOUTH CAROLINA, 2010 and 2011
District
Acres
Harvested
Yield Per
Harvested Acre
Production
2010
-------------- Acres -------------
------------- Tons ------------
North West 136,500 1.55 213,400 North Central 49,800 2.05 102,800 Eastern 32,200 2.45 79,100 West Central 81,400 2.05 167,000 Central 33,600 2.55 85,900 Southern 26,500 2.70 71,800 STATE 360,000 2.00 720,000
2011
North West 112,400 1.50 166,400 North Central 37,300 2.55 95,600 Eastern 31,800 2.10 67,100 West Central 65,400 2.20 144,200 Central 26,100 2.45 63,700 Southern 27,000 3.45 93,000 STATE 300,000 2.10 630,000
- 20 -

PEANUTS
Acreage, Yield, and Production, by Districts, SOUTH CAROLINA, 2010 and 2011
District
Acres
Planted 1/
Acres
Harvested 2/
Yield Per
Harvested Acre
Production 2/
2010
---------------- Acres ----------------
---------------- Pounds ----------------
Eastern 19,700 18,800 3,116 58,580,000 West Central 3/ Central 29,700 28,300 3,595 101,750,000 Southern 16,700 16,000 3,422 54,750,000 Other Districts 3/ 900 900 2,800 2,520,000
STATE 67,000 64,000 3,400 217,600,000
2011
Eastern 24,200 23,000 3,179 73,110,000 West Central 900 800 2,838 2,270,000 Central 34,100 32,300 3,207 103,570,000 Southern 17,800 16,900 3,234 54,650,000 Other Districts 3/ 10,700 10,300 3,287 33,855,000
STATE 77,000 73,000 3,200 233,6003,287
1/ Includes acreage for green nuts. 2/ Acreage and production estimated for peanuts for nuts only. 3/ Not published separately due to established agency guidelines.
SOYBEANS
Acreage, Yield, and Production, by Districts, SOUTH CAROLINA, 2010 and 2011
District
Acres Planted
For All Purposes
Acres Harvested
For Beans
Yield Per
Harvested Acre
Production For Beans
2010
---------------- Acres --------------
------------- Bushels -------------
North West 7,100 6,400 18.4 118,000 North Central 6,700 6,500 21.5 140,000 Eastern 258,500 254,000 21.1 5,364,000 West Central 13,700 12,600 16.6 209,000 Central 137,000 135,700 26.6 3,614,000 Southern 42,000 39,800 25.6 1,020,000 STATE 465,000 455,000 23 10,465,000
2011
North West 7,900 7,400 17 122,000 North Central 6,000 5,700 24 138,000 Eastern 203,000 199,700 25 5,025,000 West Central 11,800 10,300 17 170,000 Central 109,500 107,300 27 2,855,000 Southern 31,800 29,600 23 690,000 STATE 370,000 360,000 25 9,000,000
- 21 -

TOBACCO
Acreage, Yield, and Production, by Districts, SOUTH CAROLINA, 2010 and 2011
District
Acres
Harvested
Yield Per
Harvested Acre
Production
2010
--- Acres ---
--- Pounds ---
--- Thou. Lbs. ---
Eastern 14,200 2,240 31,780 Central 1/
Other Districts 1/ 1,800 2,345 4,220 STATE 16,000 2,250 36,000
2011
Eastern 13,500 1,680 22,650 Central 1/
Other Districts 1/ 2,000 1,850 3,700 STATE 15,500 1,700 26,350
1/ Not published separately due to established agency guidelines.
WHEAT
Acreage, Yield, and Production, by Districts, SOUTH CAROLINA, 2010 and 2011
District
Acres Planted
For All Purposes
Acres Harvested
For Grain
Yield Per
Harvested Acre
Production For Grain
2010
---------------- Acres --------------
------------- Bushels -------------
North West 6,800 4,300 34.2 147,000 North Central 4,800 3,400 32.6 111,000 Eastern 61,200 56,700 35.3 2,001,000 West Central 9,100 7,000 28.1 197,000 Central 54,000 52,400 38.8 2,035,000 Southern 9,100 6,200 30.5 189,000 STATE 145,000 130,000 36 4,680,000
2011
North West 7,100 5,200 54 281,000 North Central 6,300 4,800 59 283,000 Eastern 81,200 79,300 61.3 4,859,000 West Central 13,600 11,000 46 506,000 Central 67,200 66,300 63.7 4,220,000 Southern 14,600 13,400 48.6 651,000 STATE 190,000 180,000 60 10,800,000
- 22 -

VEGETABLES
Acreage, Yield, Production, Unit Price and Value of Production, SOUTH CAROLINA, 2009- 2011 1/
Years
Acres
Planted
Acres
Harvested
Yield
Per Acre
Production
Price
Per Unit
Value of
Production
----- Acres -----
- Cwt. -
- 000 Cwt. -
- Dols./ Cwt. -
- 000 Dols. -
C A N T A L O U P S - F R E S H M A R K E T
2009 1,300 1,200 250 300 20.00 6,000
2010 1,600 1,200 195 234 15.30 3,580
2011 1,600 1,400 325 455 20.00 9,100
C U C U M B E R S F O R P I C K L E S 2/
2009 2,200 2,000 6.00 12,000 330.00 3,960
2010 2,000 2,000 3.00 6,000 220.00 1,320
2011 2,000 2,000 3.00 6,000 220.00 1,320
C U C U M B E R S - F R E S H M A R K E T
2009 1,800 1,700 230 391 18.00 7,038
2010 1,500 1,400 180 252 24.00 6,048
2011 1,800 1,700 200 340 26.00 8,840
S N A P B E A N S - F R E S H M A R K E T
2009 1,000 900 55 50 43.00 2,150
2010 500 400 45 18 52.00 936
2011 300 200 33 7 90.00 630
S Q U A S H - F R E S H M A R K E T / P R O C E S S I N G
2009 1,100 1,000 140 141 32.50 4,578
2010 600 500 130 66 31.60 2,083
2011 1,600 1,500 130 195 33.00 6,435
T O M A T O E S - F R E S H M A R K E T
2009 2,000 1,900 175 333 48.00 15,984
2010 2,500 2,400 170 408 46.00 18,768
2011 2,700 2,500 195 488 46.00 22,448
W A T E R M E L 0 N S
2009 7,500 6,500 230 1,495 9.00 13,455
2010 8,500 8,000 330 2,640 13.50 35,640
2011 7,800 7,000 380 2,660 14.50 38,570
1/ South Carolina makes estimates for vegetable commodities, fresh market and processing, through the Federal Estimates Program. 2/ Yield and production in tons; price in dollars per ton.
MUSHROOMS: South Carolina participates in the Annual Mushroom Survey, however due to established agency guidelines, data are included in other states. - 23 -

GRAIN STORAGE CAPACITY Off-Farm and On-Farm
Capacity of Off-Farm commercial grain storage
totaled 19.5 million bushels in SOUTH CAROLINA on December 1, 2011, eleven percent above December 1, 2010. With this capacity, South Carolina ranks 35
th in
the United States.
Off-farm grain storage facilities in South Carolina totaled 53 on December 1, 2011, unchanged from December 1, 20109.
On-Farm storage capacity is not published for South Carolina.
Off-Farm and On-Farm Grain Storage Capacity, Selected States, December 1, 2010 and 2011
Selected
State
Number of
Off-Farm Facilities
Rated Off-Farm
Storage Capacity 1/
On-Farm
Storage Capacity 2/
Dec. 1 2010 3/
Dec. 1 2011
Dec. 1 2010 3/
Dec. 1 2011
Dec. 1 2010 3/
Dec. 1 2011
-------------------- Thou. Bushels --------------------
Florida 19 19 6,170 5,280 4/ 4/ Georgia 119 115 48,000 52,000 60,000 60,000 North Carolina 175 174 83,000 85,000 95,000 100,000 SOUTH CAROLINA 53 53 17,500 19,500 4/ 4/ Virginia 79 78 31,800 33,200 50,000 55,000 UNITED STATES 8,991 8,899 9,740,655 10,113,087 12,535,000 12,775,000
1/ Off-farm grain storage capacity data includes all elevators, warehouses, terminals, merchant mills, other storage, and oilseed
crushers which store grains, soybeans, sunflowers, or flaxseed. 2/ On-farm grain storage capacity includes all bins, cribs, sheds, and
other structures normally used to store whole grains or oilseeds located on farms. 3/ Revised. 4/ Not published.
GRAIN AND HAY STOCKS On Farm, Off Farm, and in All Positions, SOUTH CAROLINA, Quarterly, 2010- 2011
Year
ON FARM STOCKS
OFF FARM STOCKS
TOTAL STOCKS ALL POSITIONS
MAR. 1
JUN. 1
SEPT. 1
DEC. 1
MAR. 1
JUN. 1
SEPT. 1
DEC. 1
MAR. 1
JUN. 1
SEPT. 1
DEC. 1
--------------- Thousand Bushels ---------------
C O R N
2010
1/
1/
1/
1/ 2,956 2,465 * 3,762
1/
1/
1/
1/
2011
1/
1/
1/
1/ 3,715 2,065 * 3,935
1/
1/
1/
1/
W H E A T
2010
1/
1/
1/
1/ 1,156 * 1,132 939
1/
1/
1/
1/
2011
1/
1/
1/
1/ * 377 1,770 1,674
1/
1/
1/
1/
O A T S
2010
1/
1/
1/
1/ * * * *
1/
1/
1/
1/
2011
1/
1/
1/
1/ * * * *
1/
1/
1/
1/
S O Y B E A N S
2010
1/
1/
1/
1/ 4,176 2,827 989 4,350
1/
1/
1/
1/
2011
1/
1/
1/
1/ 3,056 * * 2,267
1/
1/
1/
1/
ALL HAY – ON FARM
M A Y 1 D E C E M B E R 1
--------------- Thousand Tons --------------- 2010 130 490
2011 110 400
1/ No estimates available. * Not published to avoid disclosing individual operations.
- 24 -
NURSERY, FLORICULTURE, HORTICULTURE AND TURFGRASS
FLORICULTURE
Total crop value of all floriculture crops for all South Carolina growers with $10,000 or more in sales in
2011 was estimated at $88.0 million, down 6 percent compared to $93.4 million in 2010. There were
78 growers in 2011, down from 87 in 2010. Total covered area for floriculture crop production was
recorded at 3.97 million square feet, down from 5.51 million square feet in 2010. Total greenhouse
space covered area at 3.42 million square feet was down from 2010's 4.84 million square feet.
Growers with $100,000 plus in total sales posted a wholesale value of plant production during 2011 of
$85.5 million, down from $90.3 million in 2010. The wholesale value of bedding and garden plants, the
largest part of production, totaled $75.6 million, down from $77.7 million in 2010.
The website address for a detailed report concerning this survey is:
http://usda.mannlib.cornell.edu/MannUsda/viewDocumentInfo.do?documentID=1072
OTHER WEBSITES WITH HORTICULTURAL DATA
2007 Census of Agriculture
South Carolina County Summary Table 35 - Nursery and Greenhouse Crops, Cut Christmas Trees
Harvested, and Sod Grown for Sale: 2007 and 2002
http://www.nass.usda.gov/Census_of_Agriculture/index.asp
Under the Census By State drop-down, select a state, then under State and County Reports click on
State, then arrow down to table 37 and click on PDF.
- 25 -
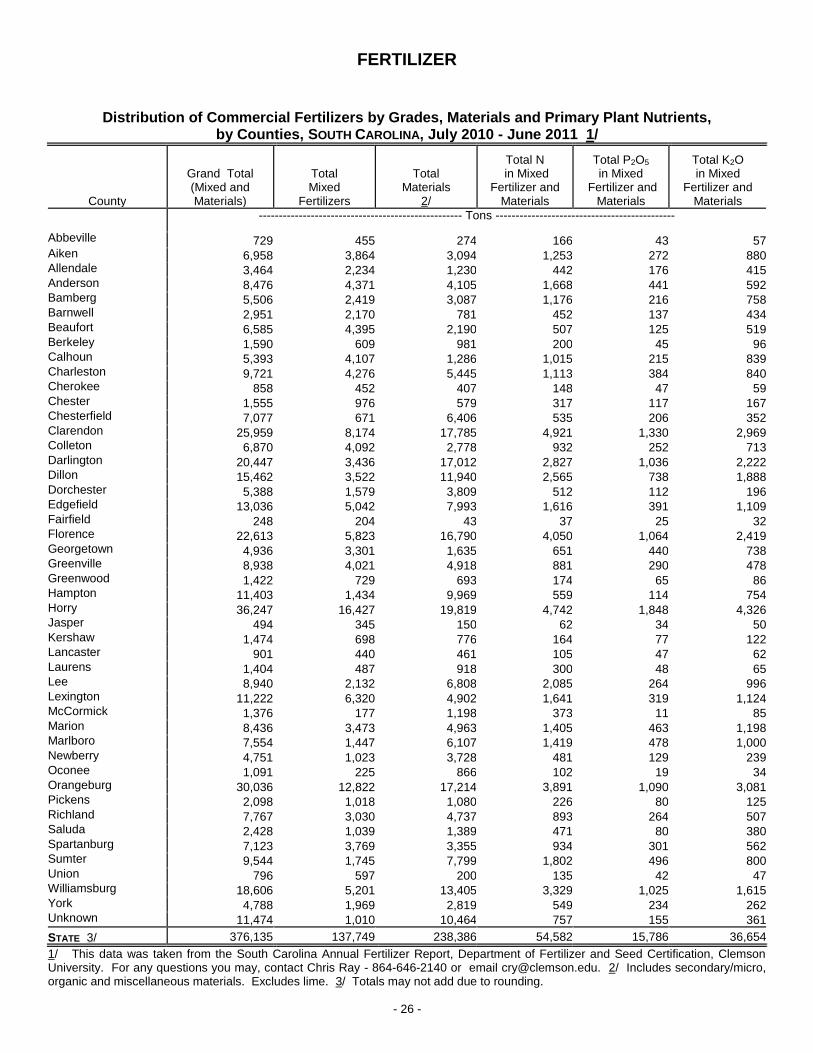
FERTILIZER Distribution of Commercial Fertilizers by Grades, Materials and Primary Plant Nutrients,
by Counties, SOUTH CAROLINA, July 2010 - June 2011 1/
County
Grand Total (Mixed and Materials)
Total Mixed
Fertilizers
Total
Materials 2/
Total N
in Mixed Fertilizer and
Materials
Total P2O5 in Mixed
Fertilizer and Materials
Total K2O in Mixed
Fertilizer and Materials
--------------------------------------------------- Tons ---------------------------------------------
Abbeville 729 455 274 166 43 57 Aiken 6,958 3,864 3,094 1,253 272 880 Allendale 3,464 2,234 1,230 442 176 415 Anderson 8,476 4,371 4,105 1,668 441 592 Bamberg 5,506 2,419 3,087 1,176 216 758 Barnwell 2,951 2,170 781 452 137 434 Beaufort 6,585 4,395 2,190 507 125 519 Berkeley 1,590 609 981 200 45 96 Calhoun 5,393 4,107 1,286 1,015 215 839 Charleston 9,721 4,276 5,445 1,113 384 840 Cherokee 858 452 407 148 47 59 Chester 1,555 976 579 317 117 167 Chesterfield 7,077 671 6,406 535 206 352 Clarendon 25,959 8,174 17,785 4,921 1,330 2,969 Colleton 6,870 4,092 2,778 932 252 713 Darlington 20,447 3,436 17,012 2,827 1,036 2,222 Dillon 15,462 3,522 11,940 2,565 738 1,888 Dorchester 5,388 1,579 3,809 512 112 196 Edgefield 13,036 5,042 7,993 1,616 391 1,109 Fairfield 248 204 43 37 25 32 Florence 22,613 5,823 16,790 4,050 1,064 2,419 Georgetown 4,936 3,301 1,635 651 440 738 Greenville 8,938 4,021 4,918 881 290 478 Greenwood 1,422 729 693 174 65 86 Hampton 11,403 1,434 9,969 559 114 754 Horry 36,247 16,427 19,819 4,742 1,848 4,326 Jasper 494 345 150 62 34 50 Kershaw 1,474 698 776 164 77 122 Lancaster 901 440 461 105 47 62 Laurens 1,404 487 918 300 48 65 Lee 8,940 2,132 6,808 2,085 264 996 Lexington 11,222 6,320 4,902 1,641 319 1,124 McCormick 1,376 177 1,198 373 11 85 Marion 8,436 3,473 4,963 1,405 463 1,198 Marlboro 7,554 1,447 6,107 1,419 478 1,000 Newberry 4,751 1,023 3,728 481 129 239 Oconee 1,091 225 866 102 19 34 Orangeburg 30,036 12,822 17,214 3,891 1,090 3,081 Pickens 2,098 1,018 1,080 226 80 125 Richland 7,767 3,030 4,737 893 264 507 Saluda 2,428 1,039 1,389 471 80 380 Spartanburg 7,123 3,769 3,355 934 301 562 Sumter 9,544 1,745 7,799 1,802 496 800 Union 796 597 200 135 42 47 Williamsburg 18,606 5,201 13,405 3,329 1,025 1,615 York 4,788 1,969 2,819 549 234 262 Unknown 11,474 1,010 10,464 757 155 361 STATE 3/ 376,135 137,749 238,386 54,582 15,786 36,654
1/ This data was taken from the South Carolina Annual Fertilizer Report, Department of Fertilizer and Seed Certification, Clemson University. For any questions you may, contact Chris Ray - 864-646-2140 or email [email protected]. 2/ Includes secondary/micro, organic and miscellaneous materials. Excludes lime. 3/ Totals may not add due to rounding. - 26 -
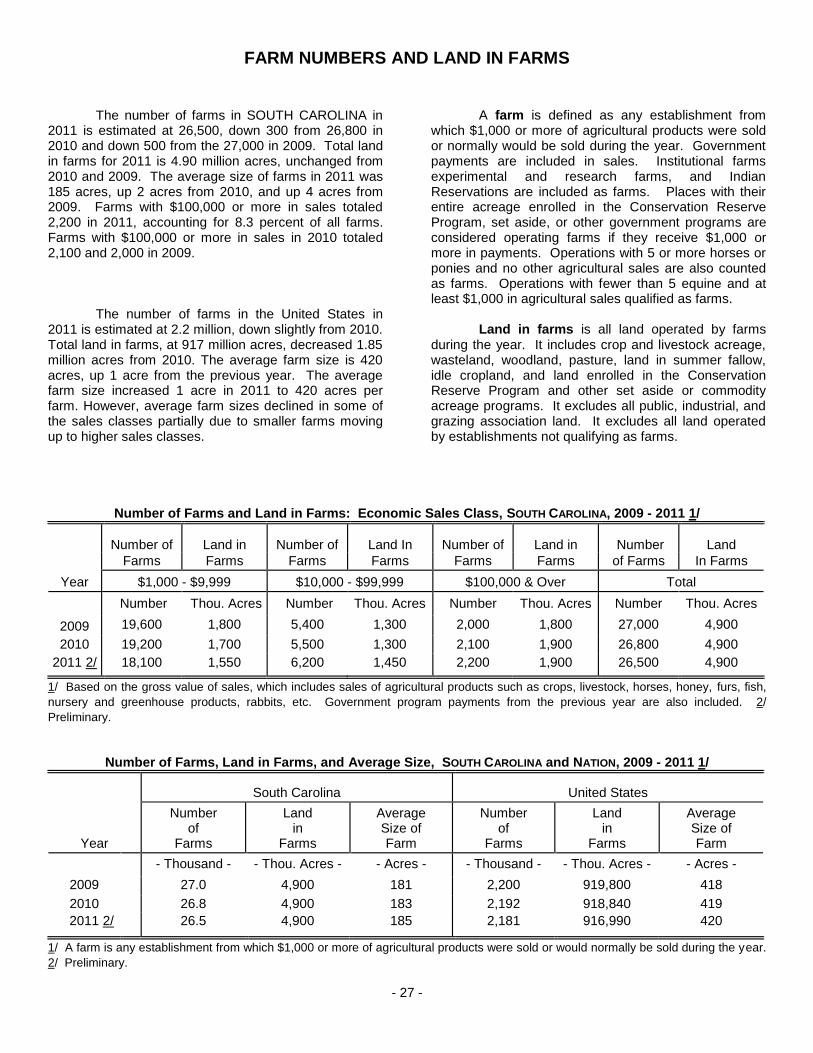
FARM NUMBERS AND LAND IN FARMS
The number of farms in SOUTH CAROLINA in 2011 is estimated at 26,500, down 300 from 26,800 in 2010 and down 500 from the 27,000 in 2009. Total land in farms for 2011 is 4.90 million acres, unchanged from 2010 and 2009. The average size of farms in 2011 was 185 acres, up 2 acres from 2010, and up 4 acres from 2009. Farms with $100,000 or more in sales totaled 2,200 in 2011, accounting for 8.3 percent of all farms. Farms with $100,000 or more in sales in 2010 totaled 2,100 and 2,000 in 2009.
The number of farms in the United States in 2011 is estimated at 2.2 million, down slightly from 2010. Total land in farms, at 917 million acres, decreased 1.85 million acres from 2010. The average farm size is 420 acres, up 1 acre from the previous year. The average farm size increased 1 acre in 2011 to 420 acres per farm. However, average farm sizes declined in some of the sales classes partially due to smaller farms moving up to higher sales classes.
A farm is defined as any establishment from which $1,000 or more of agricultural products were sold or normally would be sold during the year. Government payments are included in sales. Institutional farms experimental and research farms, and Indian Reservations are included as farms. Places with their entire acreage enrolled in the Conservation Reserve Program, set aside, or other government programs are considered operating farms if they receive $1,000 or more in payments. Operations with 5 or more horses or ponies and no other agricultural sales are also counted as farms. Operations with fewer than 5 equine and at least $1,000 in agricultural sales qualified as farms.
Land in farms is all land operated by farms during the year. It includes crop and livestock acreage, wasteland, woodland, pasture, land in summer fallow, idle cropland, and land enrolled in the Conservation Reserve Program and other set aside or commodity acreage programs. It excludes all public, industrial, and grazing association land. It excludes all land operated by establishments not qualifying as farms.
Number of Farms and Land in Farms: Economic Sales Class, SOUTH CAROLINA, 2009 - 2011 1/
Year
Number of
Farms
Land in
Farms
Number of
Farms
Land In
Farms
Number of
Farms
Land in
Farms
Number
of Farms
Land
In Farms
$1,000 - $9,999
$10,000 - $99,999
$100,000 & Over
Total
Number Thou. Acres
Number
Thou. Acres
Number
Thou. Acres
Number
Thou. Acres
2009 19,600 1,800 5,400 1,300 2,000 1,800 27,000 4,900
2010 19,200 1,700 5,500 1,300 2,100 1,900 26,800 4,900
2011 2/ 18,100 1,550 6,200 1,450 2,200 1,900 26,500 4,900
1/ Based on the gross value of sales, which includes sales of agricultural products such as crops, livestock, horses, honey, furs, fish,
nursery and greenhouse products, rabbits, etc. Government program payments from the previous year are also included. 2/
Preliminary.
Number of Farms, Land in Farms, and Average Size, SOUTH CAROLINA and NATION, 2009 - 2011 1/
Year
South Carolina
United States
Number
of Farms
Land
in Farms
Average Size of Farm
Number
of Farms
Land
in Farms
Average Size of Farm
- Thousand -
- Thou. Acres -
- Acres -
- Thousand -
- Thou. Acres -
- Acres -
2009 27.0 4,900 181 2,200 919,800 418
2010 26.8 4,900 183 2,192 918,840 419
2011 2/ 26.5
4,900 185 2,181 916,990 420
1/ A farm is any establishment from which $1,000 or more of agricultural products were sold or would normally be sold during the year.
2/ Preliminary.
- 27 -
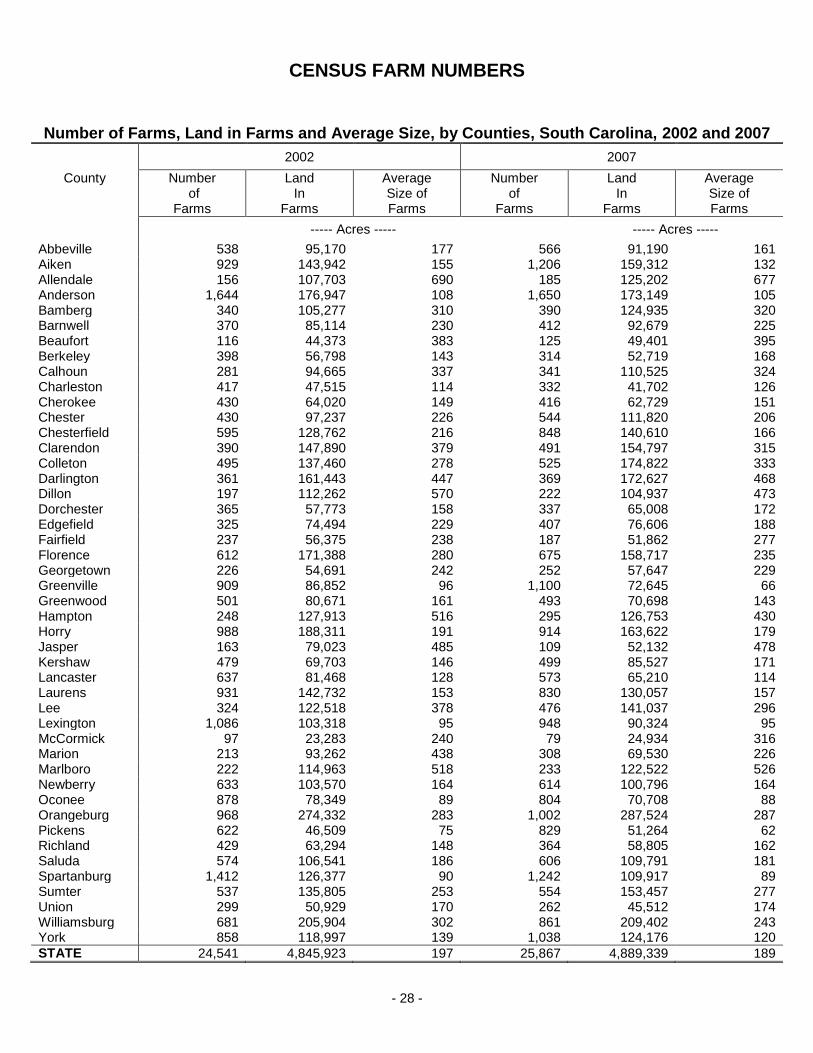
CENSUS FARM NUMBERS
Number of Farms, Land in Farms and Average Size, by Counties, South Carolina, 2002 and 2007 2002 2007
County Number of
Farms
Land In
Farms
Average Size of Farms
Number of
Farms
Land In
Farms
Average Size of Farms
----- Acres ----- ----- Acres -----
Abbeville 538 95,170 177 566 91,190 161 Aiken 929 143,942 155 1,206 159,312 132 Allendale 156 107,703 690 185 125,202 677 Anderson 1,644 176,947 108 1,650 173,149 105 Bamberg 340 105,277 310 390 124,935 320 Barnwell 370 85,114 230 412 92,679 225 Beaufort 116 44,373 383 125 49,401 395 Berkeley 398 56,798 143 314 52,719 168 Calhoun 281 94,665 337 341 110,525 324 Charleston 417 47,515 114 332 41,702 126 Cherokee 430 64,020 149 416 62,729 151 Chester 430 97,237 226 544 111,820 206 Chesterfield 595 128,762 216 848 140,610 166 Clarendon 390 147,890 379 491 154,797 315 Colleton 495 137,460 278 525 174,822 333 Darlington 361 161,443 447 369 172,627 468 Dillon 197 112,262 570 222 104,937 473 Dorchester 365 57,773 158 337 65,008 172 Edgefield 325 74,494 229 407 76,606 188 Fairfield 237 56,375 238 187 51,862 277 Florence 612 171,388 280 675 158,717 235 Georgetown 226 54,691 242 252 57,647 229 Greenville 909 86,852 96 1,100 72,645 66 Greenwood 501 80,671 161 493 70,698 143 Hampton 248 127,913 516 295 126,753 430 Horry 988 188,311 191 914 163,622 179 Jasper 163 79,023 485 109 52,132 478 Kershaw 479 69,703 146 499 85,527 171 Lancaster 637 81,468 128 573 65,210 114 Laurens 931 142,732 153 830 130,057 157 Lee 324 122,518 378 476 141,037 296 Lexington 1,086 103,318 95 948 90,324 95 McCormick 97 23,283 240 79 24,934 316 Marion 213 93,262 438 308 69,530 226 Marlboro 222 114,963 518 233 122,522 526 Newberry 633 103,570 164 614 100,796 164 Oconee 878 78,349 89 804 70,708 88 Orangeburg 968 274,332 283 1,002 287,524 287 Pickens 622 46,509 75 829 51,264 62 Richland 429 63,294 148 364 58,805 162 Saluda 574 106,541 186 606 109,791 181 Spartanburg 1,412 126,377 90 1,242 109,917 89 Sumter 537 135,805 253 554 153,457 277 Union 299 50,929 170 262 45,512 174 Williamsburg 681 205,904 302 861 209,402 243 York 858 118,997 139 1,038 124,176 120
STATE 24,541 4,845,923 197 25,867 4,889,339 189
- 28 -
80
30
10
5040
20
Horry
Aiken
York
Berkeley
Colleton
Lee
Jasper
Charleston
Sumter
Orangeburg
Laurens
Fairfield
Richland
Union
Beaufort
Oconee
Kershaw
Anderson
Lexington
Chester
Williamsburg
Dillon
Marion
Newberry
Chesterfield
Clarendon
Saluda
Pickens
Barnwell
Abbeville
Florence
Greenville
Georgetown
Spartanburg
Hampton
Lancaster
Darlington
Marlboro
Edgefield
Dorchester
Calhoun
Allendale
Bamberg
Cherokee
Greenwood
McCormick
LIVESTOCK SECTION

LIVESTOCK AND POULTRY Record Highs and Lows Based on Inventory Numbers SOUTH CAROLINA
Species
Date
Series
Began
Record
Inventory
Date
All Cattle and Calves, January 1
1867
High
Low
750,000
265,000
1977
1896
Milk Cows That Have Calved, January 1 1/
1867
High
Low
195,000
16,000
1920
2011
Beef Cows That Have Calved, January 1 1/
1920
High
Low
336,000
15,000
1977
1939
All Hogs and Pigs, December 1
1866
High
Low
920,000
210,000
1922
2010
Meat and Other Goats, January 1
2005
High
Low
45,500
39,000
2007
2010
Milk Goats, January 1
2005
High
Low
3,500
2,800
2008
2011
Broilers Raised 2/
1934
High
Low
241,000,000
300,000
2010
1934
Layers-All Flock Types 3/
1934
High
Low
6,785,000
2,235,000
1980
1938
Turkeys Raised 2/
1929
High
Low
12,500,000
86,000
2008
1929 1/ Prior to January 1, 1970, definition was milk cows and beef cows 2 years old and over. 2/ Annual number raised
rather than inventory. 3/ Annual average number of layers, (December previous year through November current year)
rather than inventory. NOTE: In some cases the inventory is identical for more than one year. In such cases, the year
shown is the latest year of occurrence.
LIVESTOCK OPERATIONS FARM NUMBERS: South Carolina 2005 - 2011
Year
Total Farms
in
South Carolina
Number of Farms
with
Cattle and Calves
Number of Farms
with
Milk Cows
Number of Farms
with
Beef Cows
Number of Farms
with
Hogs and Pigs
2005 24,500 10,000 200 9,000 1,000
2006 24,600 10,200 200 9,200 1,100
2007 25,900 8,800 110 8,200 810
2008 1/ 26,900 - - - -
2009 1/ 27,000 - - - -
2010 1/ 26,800 - - - -
2011 1/ 26,500 - - - -
1/ The number of operations by State will no longer be published on an annual basis. State level numbers will only be published in
conjunction with the Census of Agriculture every five years.
- 30 -

LIVESTOCK INVENTORY Number of All Cattle and Calves, by Class, and Inventory Value, SOUTH CAROLINA, January 1, 2010-2012
Specie
and Class
Number on Farms
January 1
Inventory Value, January 1
Per Head
Total Value
2010
2011
2012
2010
2011
2012
2010
2011
2012
---- Thou. Head ----
------------ Dollars ------------
----------- Thou. Dollars -----------
All Cattle & Calves ................. 380 385 370 730.00 740.00 830.00 277,400 284,900 307,100 All Cows that have Calved ..... 200 200 200
--
--
--
--
--
--
Beef Cows ......................... 183 184 184
--
--
--
--
--
--
Milk Cows .......................... 17 16 16
--
--
--
--
--
--
Steers 500 lbs. and over ........ 17 17 11
--
--
--
--
--
--
Bulls 500 lbs. and over ........... 16 16 16
--
--
--
--
--
--
Calves under 500 lbs . ........... 90 95 86
--
--
--
--
--
--
Heifers 500 lbs. and over ....... 57 57 57
--
--
--
--
--
--
For Beef Cow Replacement ....................
36
36
36
--
--
--
--
--
--
For Milk Cow Replacement ....................
8
7
6
--
--
--
--
--
--
Other Heifers ..................... 13 14 15
--
--
--
--
--
--
Goats, Meat and Other. . . . . 39.1 42.5 43.5
--
--
--
--
--
--
Goats, Milk ............................ 2.9 2.8 3.0
--
--
--
--
--
--
HOGS AND POULTRY INVENTORY Number of All Hogs, All Chickens, and Inventory Value, SOUTH CAROLINA, December 1, 2009-2011
Specie
and Class
Number on Farms
December 1
Inventory Value, December 1
Per Head
Total Value
2009
2010
2011
2009
2010
2011
2009
2010
2011
--------- Thou. Head ---------
------------- Dollars -------------
----------- Thou. Dollars -----------
All Hogs and Pigs 225 230 210 98.00 92.00 150.00 22,035 29,016 31,544
Total Layers 4,470 4,251 4,349 3.40 3.20 3.60 21,678 18,608 21,002 Total Pullets 1,754 1,402 1,324 -- -- -- -- -- --
Other Chickens 152 162 161 -- -- -- -- -- --
- 31 -

LIVESTOCK INVENTORY
ALL CATTLE AND CALVES
The South Carolina cattle industry had a total of
370,000 cattle and calves as of January 1, 2012. There
were a total of 184,000 beef cows and 16,000 milk cows in
the inventory.
The 2011 calf crop totaled 160,000 head, down
5,000 head from 2010 and 2009.
Inventory Number, by Counties, SOUTH CAROLINA, January 1, 2011 and 2012
All Cattle and Calves All Cattle and Calves
County 2011 /1 2012 County 2011 /1 2012
----- Head ----- ----- Head -----
Abbeville 15,200 14,500 Hampton 2,400 2,300 Aiken 12,200 11,800 Horry 10,000 9,600 Allendale 5,500 5,200 Jasper 800 800 Anderson 33,000 32,000 Kershaw 4,700 4,500 Bamberg 7,200 6,900 Lancaster 11,200 10,800 Barnwell 4,400 4,200 Laurens 21,000 20,000 Beaufort 1,200 1,100 Lee 2,800 2,700 Berkeley 1,400 1,400 Lexington 9,000 8,600 Calhoun 2,300 2,300 McCormick 6,400 6,100 Charleston 2,400 2,300 Marion 3,100 3,000 Cherokee 7,100 6,900 Marlboro 1,800 1,700 Chester 17,800 17,000 Newberry 24,000 23,000 Chesterfield 10,500 10,100 Oconee 15,000 14,400 Clarendon 4,600 4,500 Orangeburg 13,000 12,500 Colleton 4,400 4,200 Pickens 8,600 8,200 Darlington 3,300 3,200 Richland 2,200 2,200 Dillon 2,800 2,700 Saluda 26,000 25,000 Dorchester 3,100 3,000 Spartanburg 16,000 15,400 Edgefield 8,200 7,800 Sumter 5,400 5,200 Fairfield 5,900 5,700 Union 5,900 5,700 Florence 3,400 3,300 Williamsburg 4,500 4,300 Georgetown 1,100 1,100 York 16,600 15,900 Greenville 7,800 7,500 Other Counties -- --
Greenwood 9,800 9,400 STATE 385,000 370,000
/1 Revised. * Included in other counties; not published separately due to established agency guidelines.
Inventory Number, by Districts, SOUTH CAROLINA, January 1, 2011 and 2012
Year
District
North- west
North
Central
Eastern
West
Central
Central
Southern
STATE
------------------------------------------ Head ------------------------------------------
January 1, 2011 /1 114,400 56,200 45,100 97,200 39,300 32,800 385,000
January 1, 2012 110,100 53,900 43,400 93,200 38,000 31,400 370,000
/1 Revised
- 32 -
South Carolina ranked 39th in the Nation for all
cattle and calves, with Texas ranked 1st, Nebraska
ranked 2nd
, Kansas ranked 3rd
, and California ranked
4th. The leading county in South Carolina was
Anderson, followed by Saluda, Newberry, Laurens and
Chester.

LIVESTOCK INVENTORY
ALL BEEF COWS THAT HAVE CALVED Number Calved, by Counties, SOUTH CAROLINA, January 1, 2011 and 2012
All Cattle and Calves All Cattle and Calves
County 2011 /1 2012 County 2011 /1 2012
----- Head ----- ----- Head -----
Abbeville * * Hampton 1,200 1,200
Aiken 6,000 6,000 Horry * *
Allendale * * Jasper * *
Anderson 15,700 15,700 Kershaw 2,500 2,500
Bamberg 2,600 2,600 Lancaster 5,800 5,800
Barnwell * * Laurens 9,500 9,500
Beaufort 600 600 Lee 1,300 1,300
Berkeley * * Lexington * *
Calhoun 1,200 1,200 McCormick 1,000 1,000
Charleston * * Marion 3,400 3,400
Cherokee 3,900 3,900 Marlboro 1,100 1,100
Chester * * Newberry 8,500 8,500
Chesterfield 5,600 5,600 Oconee 7,800 7,800
Clarendon 2,400 2,400 Orangeburg 3,600 3,600
Colleton * * Pickens 4,500 4,500
Darlington * * Richland * *
Dillon 1,400 1,400 Saluda 12,300 12,300
Dorchester 1,600 1,600 Spartanburg 7,800 7,800
Edgefield 3,500 3,500 Sumter * *
Fairfield 3,000 3,000 Union * *
Florence 2,000 2,000 Williamsburg * *
Georgetown 500 500 York 7,800 7,800
Greenville * * Other Counties 50,600 50,600
Greenwood 5,300 5,300 STATE 184,000 184,000
/1 Revised. * Included in other counties; not published separately due to established agency guidelines.
Number Calved, by Districts, SOUTH CAROLINA, January 1, 2011 and 2012
Year
District
North- west
North
Central
Eastern
West
Central
Central
Southern
STATE
------------------------------------------ Head ------------------------------------------
January 1, 2011 /1 49,200 19,100 14,000 36,600 8,500 6,000 184,000
January 1, 2012 49,200 19,100 14,000 36,600 8,500 6,000 184,000
/1 Revised - 33 -
LIVESTOCK INVENTORY
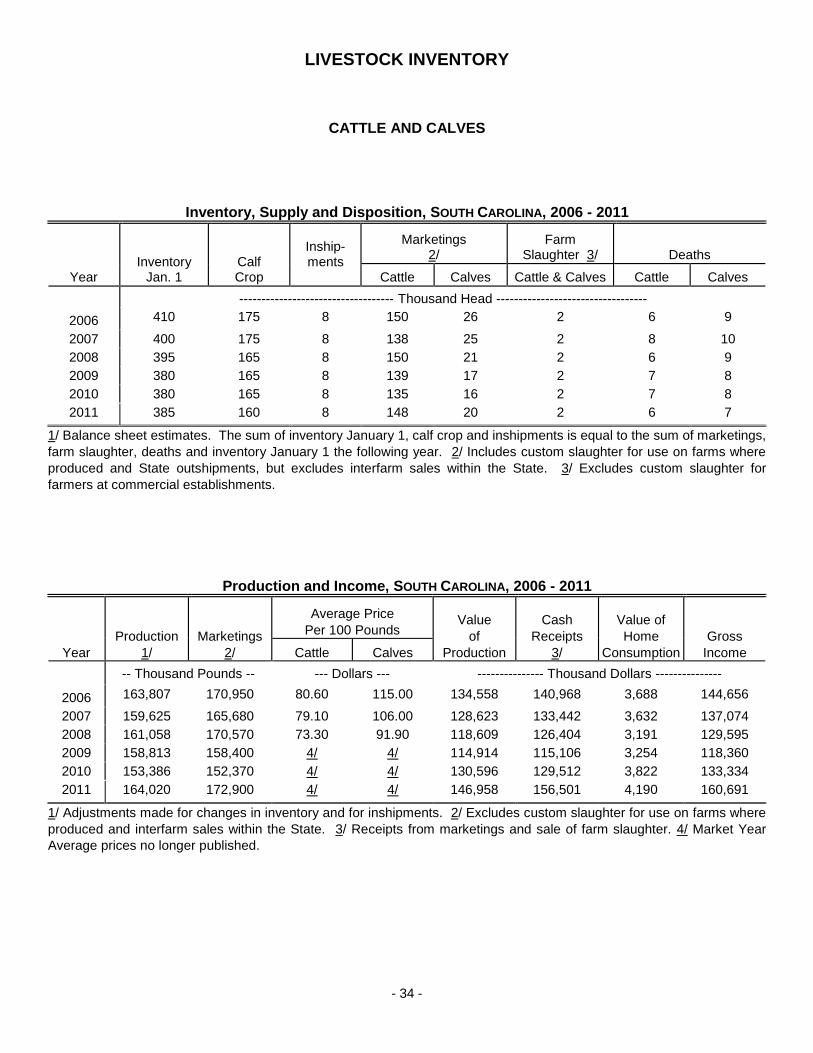
CATTLE AND CALVES Inventory, Supply and Disposition, SOUTH CAROLINA, 2006 - 2011
Year
Inventory
Jan. 1
Calf Crop
Inship- ments
Marketings
2/
Farm
Slaughter 3/
Deaths
Cattle
Calves Cattle & Calves
Cattle
Calves
----------------------------------- Thousand Head ----------------------------------
2006 410 175 8 150 26 2 6 9
2007 400 175 8 138 25 2 8 10
2008 395 165 8 150 21 2 6 9
2009 380 165 8 139 17 2 7 8
2010 380 165 8 135 16 2 7 8
2011 385 160 8 148 20 2 6 7
1/ Balance sheet estimates. The sum of inventory January 1, calf crop and inshipments is equal to the sum of marketings,
farm slaughter, deaths and inventory January 1 the following year. 2/ Includes custom slaughter for use on farms where
produced and State outshipments, but excludes interfarm sales within the State. 3/ Excludes custom slaughter for
farmers at commercial establishments. Production and Income, SOUTH CAROLINA, 2006 - 2011
Year
Production
1/
Marketings
2/
Average Price
Per 100 Pounds
Value
of
Production
Cash
Receipts
3/
Value of
Home
Consumption
Gross
Income
Cattle
Calves
-- Thousand Pounds --
--- Dollars ---
--------------- Thousand Dollars ---------------
2006 163,807 170,950 80.60 115.00 134,558 140,968 3,688 144,656
2007 159,625 165,680 79.10 106.00 128,623 133,442 3,632 137,074
2008 161,058 170,570 73.30 91.90 118,609 126,404 3,191 129,595
2009 158,813 158,400 4/ 4/ 114,914 115,106 3,254 118,360
2010 153,386 152,370 4/ 4/ 130,596 129,512 3,822 133,334
2011 164,020 172,900 4/ 4/ 146,958 156,501 4,190 160,691
1/ Adjustments made for changes in inventory and for inshipments. 2/ Excludes custom slaughter for use on farms where
produced and interfarm sales within the State. 3/ Receipts from marketings and sale of farm slaughter. 4/ Market Year
Average prices no longer published.
- 34 -
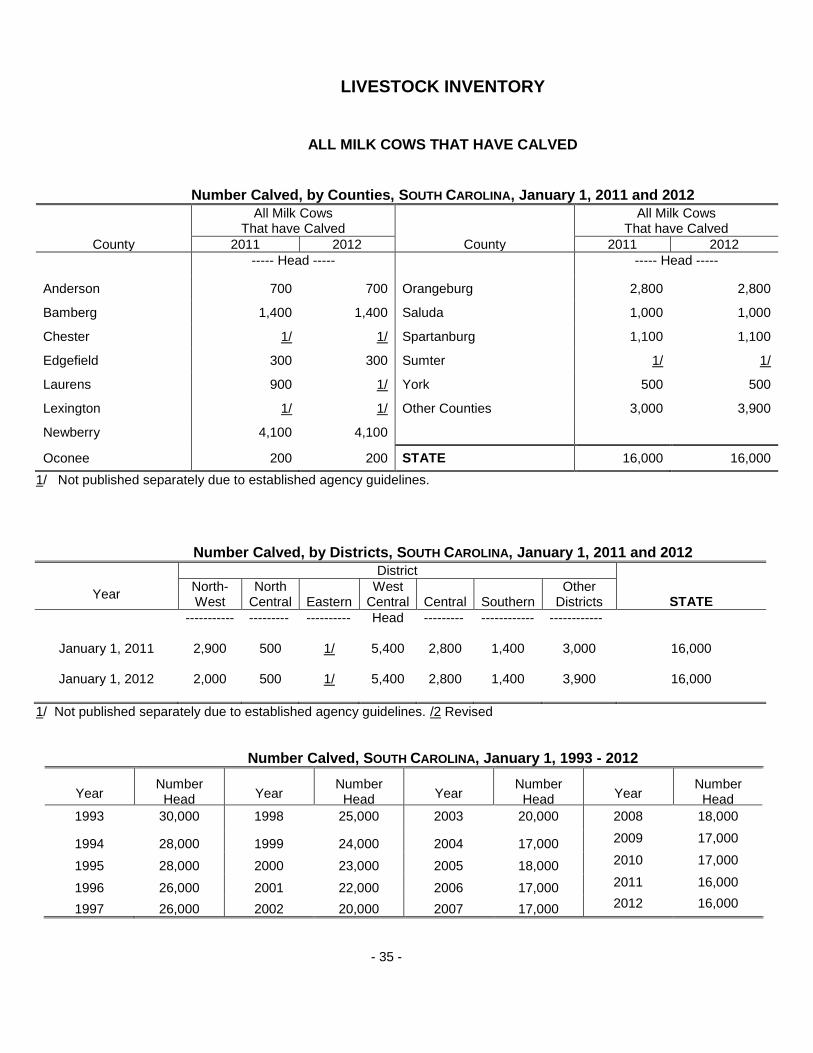
LIVESTOCK INVENTORY
ALL MILK COWS THAT HAVE CALVED
Number Calved, by Counties, SOUTH CAROLINA, January 1, 2011 and 2012
All Milk Cows That have Calved
All Milk Cows That have Calved
County 2011 2012 County 2011 2012
----- Head ----- ----- Head -----
Anderson 700 700 Orangeburg 2,800 2,800
Bamberg 1,400 1,400 Saluda 1,000 1,000
Chester 1/ 1/ Spartanburg 1,100 1,100
Edgefield 300 300 Sumter 1/ 1/
Laurens 900 1/ York 500 500
Lexington 1/ 1/ Other Counties 3,000 3,900
Newberry 4,100 4,100
Oconee 200 200 STATE 16,000 16,000
1/ Not published separately due to established agency guidelines.
Number Calved, by Districts, SOUTH CAROLINA, January 1, 2011 and 2012
District
Year North- West
North Central
Eastern
West Central
Central
Southern
Other Districts
STATE
----------- --------- ---------- Head --------- ------------ ------------
January 1, 2011 2,900 500 1/ 5,400 2,800 1,400 3,000 16,000
January 1, 2012 2,000 500 1/ 5,400 2,800 1,400 3,900 16,000
1/ Not published separately due to established agency guidelines. /2 Revised
Number Calved, SOUTH CAROLINA, January 1, 1993 - 2012
Year
Number
Head
Year
Number
Head
Year
Number
Head
Year
Number
Head 1993 30,000
1998
25,000
2003
20,000 2008 18,000
1994 28,000 1999 24,000 2004 17,000 2009 17,000
1995 28,000
2000
23,000
2005
18,000 2010 17,000
1996
26,000
2001 22,000
2006
17,000 2011 16,000
1997
26,000 2002
20,000
2007
17,000 2012 16,000
- 35 -
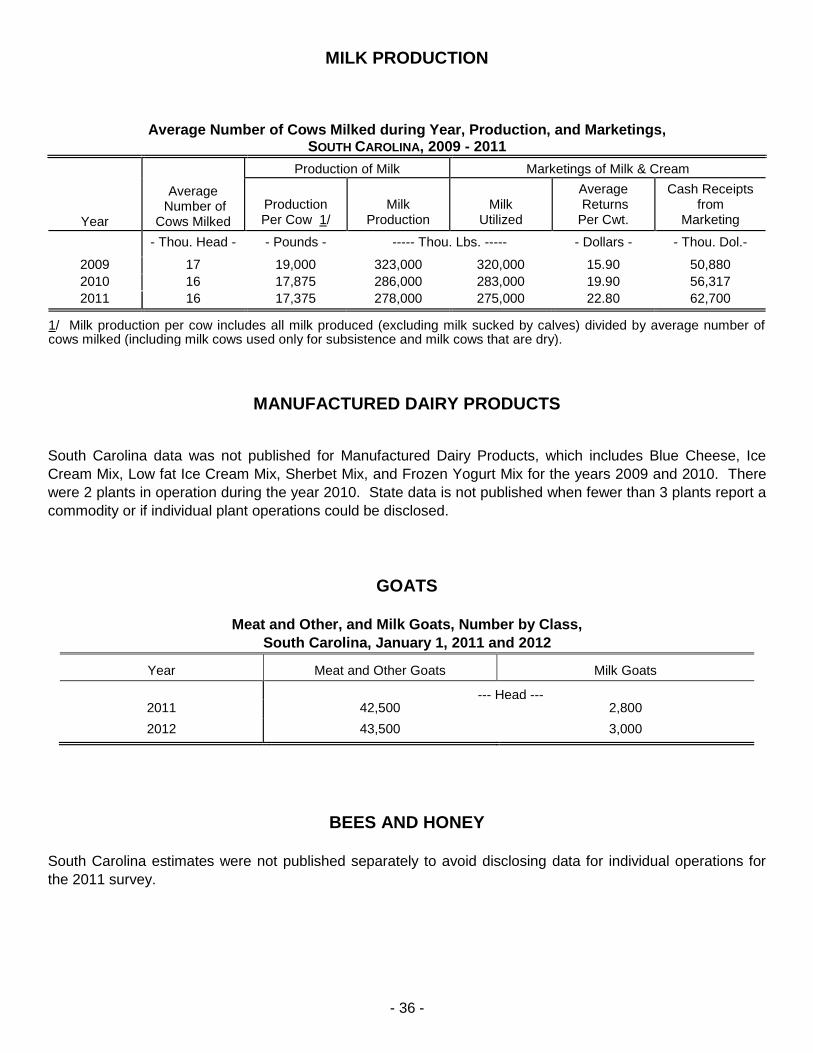
MILK PRODUCTION
Average Number of Cows Milked during Year, Production, and Marketings, SOUTH CAROLINA, 2009 - 2011
Year
Average
Number of Cows Milked
Production of Milk
Marketings of Milk & Cream
Production Per Cow 1/
Milk
Production
Milk
Utilized
Average Returns Per Cwt.
Cash Receipts
from Marketing
- Thou. Head -
- Pounds -
----- Thou. Lbs. -----
- Dollars -
- Thou. Dol.-
2009 17 19,000 323,000 320,000 15.90 50,880
2010 16 17,875 286,000 283,000 19.90 56,317
2011 16 17,375 278,000 275,000 22.80 62,700 1/ Milk production per cow includes all milk produced (excluding milk sucked by calves) divided by average number of cows milked (including milk cows used only for subsistence and milk cows that are dry).
MANUFACTURED DAIRY PRODUCTS
South Carolina data was not published for Manufactured Dairy Products, which includes Blue Cheese, Ice
Cream Mix, Low fat Ice Cream Mix, Sherbet Mix, and Frozen Yogurt Mix for the years 2009 and 2010. There
were 2 plants in operation during the year 2010. State data is not published when fewer than 3 plants report a
commodity or if individual plant operations could be disclosed.
GOATS
Meat and Other, and Milk Goats, Number by Class,
South Carolina, January 1, 2011 and 2012
Year
Meat and Other Goats
Milk Goats
--- Head --- 2011 42,500 2,800
2012 43,500 3,000
BEES AND HONEY
South Carolina estimates were not published separately to avoid disclosing data for individual operations for
the 2011 survey.
- 36 -
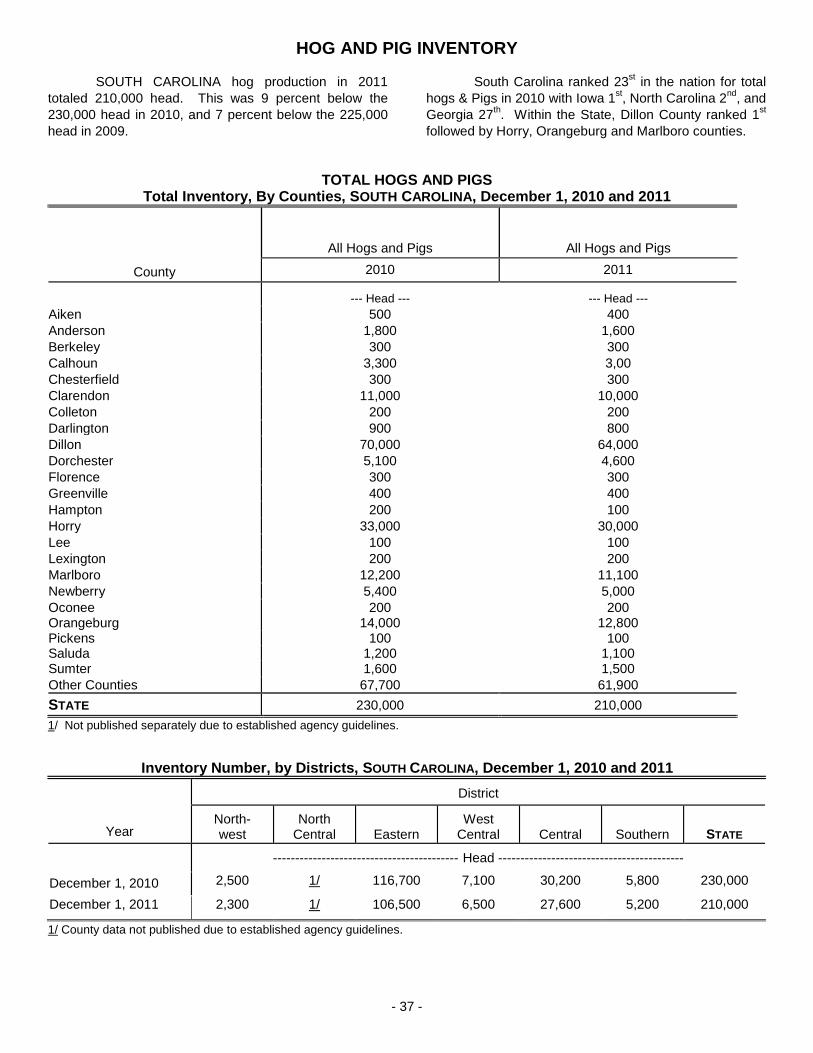
HOG AND PIG INVENTORY
SOUTH CAROLINA hog production in 2011
totaled 210,000 head. This was 9 percent below the
230,000 head in 2010, and 7 percent below the 225,000
head in 2009.
South Carolina ranked 23st in the nation for total
hogs & Pigs in 2010 with Iowa 1st, North Carolina 2
nd, and
Georgia 27th. Within the State, Dillon County ranked 1
st
followed by Horry, Orangeburg and Marlboro counties.
TOTAL HOGS AND PIGS Total Inventory, By Counties, SOUTH CAROLINA, December 1, 2010 and 2011
County
All Hogs and Pigs
All Hogs and Pigs
2010 2010
2011 2010
--- Head ---
--- Head ---
Aiken 500 400
Anderson 1,800 1,600
Berkeley 300 300
Calhoun 3,300 3,00
Chesterfield 300 300
Clarendon 11,000 10,000
Colleton 200 200
Darlington 900 800
Dillon 70,000 64,000
Dorchester 5,100 4,600
Florence 300 300
Greenville 400 400
Hampton 200 100
Horry 33,000 30,000
Lee 100 100
Lexington 200 200
Marlboro 12,200 11,100
Newberry 5,400 5,000
Oconee 200 200 Orangeburg 14,000 12,800 Pickens 100 100 Saluda 1,200 1,100 Sumter 1,600 1,500
Other Counties 67,700 61,900 STATE 230,000 210,000
1/ Not published separately due to established agency guidelines.
Inventory Number, by Districts, SOUTH CAROLINA, December 1, 2010 and 2011
Year
District
North- west
North
Central
Eastern
West
Central
Central
Southern
STATE
------------------------------------------ Head ------------------------------------------
December 1, 2010 2,500 1/ 116,700 7,100 30,200 5,800 230,000
December 1, 2011 2,300 1/ 106,500 6,500 27,600 5,200 210,000
1/ County data not published due to established agency guidelines.
- 37 -

LIVESTOCK INVENTORY
HOGS AND PIGS
Inventory, Supply, and Disposition, SOUTH CAROLINA, 2010 - 2011 1/
Year
Number
Hogs & Pigs
on Farms Dec. 1
December - November 2/
Inship- ments
4/
Market-
ings 5/
Farm
Slaughter 6/
Deaths
Sows
Farrowed
Pigs per Litter 3/
Pig Crop
----------------------------------------- Thousand Head ----------------------------------------
2010 225 26 8.77 228 98 290.5 1.5 29
2011 210 23.5 9.02 212 91 290.5 1.5 31
1/ Balance sheet estimates. The sum of De0cember 1 inventory (previous year) plus pig crop (Dec.-Nov.) and inshipments for the current year is equal
to the sum of marketings, farm slaughter, deaths, and inventory December 1, the following year. 2/ December previous year. 3/ Pigs per litter equal
pigs saved divided by sows farrowed. 4/ Excludes inshipments direct to Federal Inspected slaughter plants. 5/ Includes custom slaughter for use on
farms where produced and State outshipments, but excludes interfarm sales within the State. 6/ Excludes custom slaughter for farmers at commercial
establishments.
Production and Income, by Years, SOUTH CAROLINA, 2010 - 2011
Year
Production
1/
Marketings
2/
Value of
Production 3/
Cash
Receipts 3/ 4/
Value of Home Consumption
Gross
Income
------- Thou. Pounds -------
------------------------- Thousand Dollars -------------------------
2010 53,178 54,395 29,016 31,481 1,150 32,631
2011 48,966 56,840 31,544 38,329 1,429 39,758
1/ Adjustments made for changes in inventory and for inshipments. 2/ Excludes custom slaughter for use on farms where produced
and interfarm sales within the State. 3/ Includes allowance for higher average price of state inshipments and outshipments of feeder
pigs. 4/ Receipts for marketings and sale of farm slaughter.
Number of Hogs and Pigs for Breeding and Market Hogs and Pigs by Weight Class, SOUTH CAROLINA, December 1, 2010 - 2011
Year
Hogs and Pigs on Farms Market Hogs and Pigs by Weight Class
For Breeding
For
Market
All
Hogs
Under
50 Lbs.
50-119
Lbs.
120-179
Lbs.
180 Lbs. & Over
----------------------------------- Thousand Head -----------------------------------
2010 14 216 230 26 64 63 63
2011 10 200 210 47 52 51 50
- 38 -

LAYERS AND EGG PRODUCTION
Number of Layers, Eggs per 100 Layers, and Egg Production, by Months,
SOUTH CAROLINA, 2005 – 2011
Item & Month 2005 2006 2007 2008 2009 2010 2011
-----------Thousand Head ----------- ALL LAYERS 1/ December 2/ 5,332 5,110 4,994 4,554 4,420 4,483 4,270 January 5,288 5,123 4,873 4,606 4,486 4,477 4,312 February 5,138 5,186 4,918 4,696 4,389 4,394 4,423 March 4,995 5,207 5,031 4,711 4,276 4,417 4,429 April 4,955 5,214 4,962 4,604 4,388 4,356 4,363 May 4,973 5,290 4,904 4,598 4,537 4,160 4,446 June 5,129 5,234 4,864 4,583 4,422 4,087 4,529 July 5,037 5,129 4,755 4,338 4,333 4,180 4,502 August 4,825 5,069 4,729 4,298 4,516 4,390 4,420 September 4,881 4,976 4,807 4,343 4,643 4,404 4,196 October 5,037 4,940 4,808 4,367 4,686 4,352 4,053 November 5,076 4,976 4,677 4,415 4,583 4,312 4,221
Annual Average 3/ 5,056 5,121 4,860 4,509 4,473 4,334 4,347
----------- Eggs----------- EGGS PER 100 LAYERS December 2/ 2,307 2,270 2,243 2,196 2,195 2,164 2,272 January 2,307 2,303 2,155 2,106 2,140 2,100 2,226 February 2,044 1,986 1,911 1,895 1,982 1,912 1,990 March 2,182 2,132 2,087 2,080 2,198 2,196 2,213 April 2,018 2,052 1,955 2,107 2,028 2,089 2,177 May 2,031 2,079 2,039 2,131 2,006 2,139 2,249 June 1,969 2,025 2,035 2,051 2,035 2,080 2,142 July 2,040 2,106 2,145 2,282 2,146 2,105 2,221 August 2,147 2,131 2,093 2,257 2,126 2,096 2,308 September 2,163 2,090 2,039 2,049 2,089 2,112 2,264 October 2,214 2,247 2,184 2,107 2,155 2,229 2,295 November 2,140 2,211 2,117 2,106 2,117 2,203 2,180
Eggs per Layer 4/ 256 256 250 254 253 254 265
----------- Million Eggs ----------- EGGS PRODUCED December 2/ 123 116 112 100 97 97 97 January 122 118 105 97 96 94 96 February 105 103 94 89 87 84 88 March 109 111 105 98 94 97 98 April 100 107 97 97 89 91 95 May 100 110 100 98 91 89 100 June 101 106 99 94 90 85 97 July 105 108 102 99 93 88 100 August 106 108 99 97 96 92 102 September 108 104 98 89 97 93 95 October 114 111 105 92 101 97 93 November 111 110 99 93 97 95 92
Annual Total 1,304 1,312 1,215 1,143 1,128 1,102 1,153 1/ Average number on hand during month. 2/ December of the previous year. 3/ Average number during year. 4/ Annual rate of lay per layer on hand (eggs produced during year divided by average number of layers during year).
- 39 -

BROILERS RAISED
SOUTH CAROLINA broiler producers raised
223,400,000 broilers in 2011. This was 7 percent below
the 2010 total of 241,000,000 and 6 percent below the
237,800,000 in 2009. Pounds produced totaled
1,496,800,000 in 2011, down 4 percent from 2010 and 2
percent below 2009. The average price received for
broilers in 2011 was 47.0 cents per pound liveweight
equivalent, down 1.0 cent from 2010, but up 1.0 cent from
2009. Value of production, which includes home
consumption, was $697,509,000, down 7 percent from
2010’s $750,476,000 and less than 1 percent above
2009’s value of $695,508,000. On a county wide basis
during 2011, Oconee, Lexington, Aiken, Orangeburg, and
Saluda, were the leading broiler-producing counties in the
State. South Carolina ranks 11th in the Nation with
Georgia holding the top spot and Arkansas placing 2nd
,
Alabama 3rd
, North Carolina 4th, and Mississippi 5
th.
Number Raised and Pounds Produced, by Counties, SOUTH CAROLINA, 2010 and 2011
County
Number Raised
Pounds Produced
2010 2011 2010 2011
--- Thousand Head ---
--- Thousand Pounds ---
Aiken 27,600 25,600 179,400 171,520
Anderson 10,600 9,800 68,900 65,660
Barnwell 1/
Calhoun 5,200 4,800 33,800 32,160
Chesterfield 7,550 7,000 49,075 46,900
Clarendon 13,700 12,700 89,050 85,090
Darlington 4,700 4,350 30,550 29,145
Dillon 9,600 8,900 62,400 59,630
Dorchester 3,400 3,150 22,100 21,105
Edgefield 1,150 1,050 7,475 7,035
Florence 1/
Horry 3,900 3,600 25,350 24,120
Kershaw 1/
Laurens 4,950 4,550 32,175 30,485
Lee 4,750 4,400 30,875 29,480
Lexington 35,200 32,700 228,800 219,090
Marion 1/
Marlboro 6,450 6,000 41,925 40,200
Newberry 8,750 8,100 56,875 54,270
Oconee 41,600 38,600 270,400 258,620
Orangeburg 19,500 18,100 126,750 121,270
Richland 1/
Saluda 16,300 15,100 105,950 101,170
Sumter 5,600 5,200 36,400 34,840
Williamsburg 2,350 2,200 15,275 14,740
Other Counties 8,150 7,500 52,975 50,250 STATE 241,000 223,400
1,556,900 1,496,800
Number Raised, Disposition and Value of Production, SOUTH CAROLINA, 2007 - 2011 1/
Year
Number Raised
Avg. Liveweight
per Broiler
Pounds
Produced
Price per Pound 2/
Value of
Production 3/
-- Thou. Head --
-- Pounds --
-- Thou. Lbs. --
-- Cents --
-- Thou. Dollars --
2007 234,900 6.3 1,479,900 45.0 665,955
2008 236,900 6.4 1,516,200 46.0 697,452
2009 237,800 6.4 1,521,900 46.0 695,508
2010 241,000 6.5 1,556,900 48.0 750,426
2011 223,400 6.7 1,496,800 47.0 697,509 1/ Twelve month period beginning with December of previous year. 2/ Liveweight equivalent price. 3/ Gross income received for the production of broilers. Includes home consumption which is less than 1 percent of total production.
- 40 -

TURKEYS RAISED
Turkeys raised in SOUTH CAROLINA during
2011 totaled 11,500,000 birds, down 3 percent from 2010 and 2009. Value of production was $305,877,000 during 2011, 117 percent above the 2010 value of
$261,324,000, and 138 percent above the 2009 value of $220,912,000. During 2011, the average price received was 68.0 cents per pound, up 7 cents from 2010, and up 17 cents from 2009.
Number Raised and Pounds Produced, by Counties, SOUTH CAROLINA, 2010 and 2011
County
Number Raised
Pounds Produced
2010 2011
2010 2011
---- Thousand Head ----
---- Thousand Pounds ----
Cherokee 1,000 970 36,000 37,830 Chester 525 500 18,900 19,500 Chesterfield 1,100 1,050 39,600 40,950 Darlington 505 480 18,180 18,720 Fairfield 715 690 25,740 26,910 Kershaw 2,800 2,700 100,800 105,300 Lancaster 1,800 1,750 64,800 68,250 Lee 875 840 31,500 32,760 Newberry 725 700 26,100 27,300 Spartanburg 1/ Sumter 350 335 12,600 13,065 York 1,150 1,150 41,400 44,850
Other Counties 355 335 12,780 13,065
STATE 11,900 11,500 428,400 448,500
1/ Not published separately due to established agency guidelines.
Number Raised by Districts, SOUTH CAROLINA, 2010 and 2011
Year
District
North- west
North Central Eastern
West Central Central Southern STATE
-------------------------------------------- Thousand Head --------------------------------------------
2010 1,000 6,990 1,605 725 1,225 -- 11,900
2011 970 6,790 1,530 700 1,175 -- 11,500
Number Raised, Disposition, and Value of Production, SOUTH CAROLINA, 2007- 2011
Year
Number Raised
Average
Liveweight
Pounds
Produced
Price per Pound
Value of
Production
-- Thou. Head --
-- Pounds --
-- Thou. Lbs. --
-- Cents -- -- Thou. Dollars --
2007 10,400 36.7 381,680 52.0 198,474
2008 12,500 38.2 477,500 56.0 267,400
2009 11,900 36.4 433,160 51.0 220,912
2010 11,900 36.0 428,400 61.0 261,324
2011 11,500 39.0 448,500 68.0 305,877
- 41 -
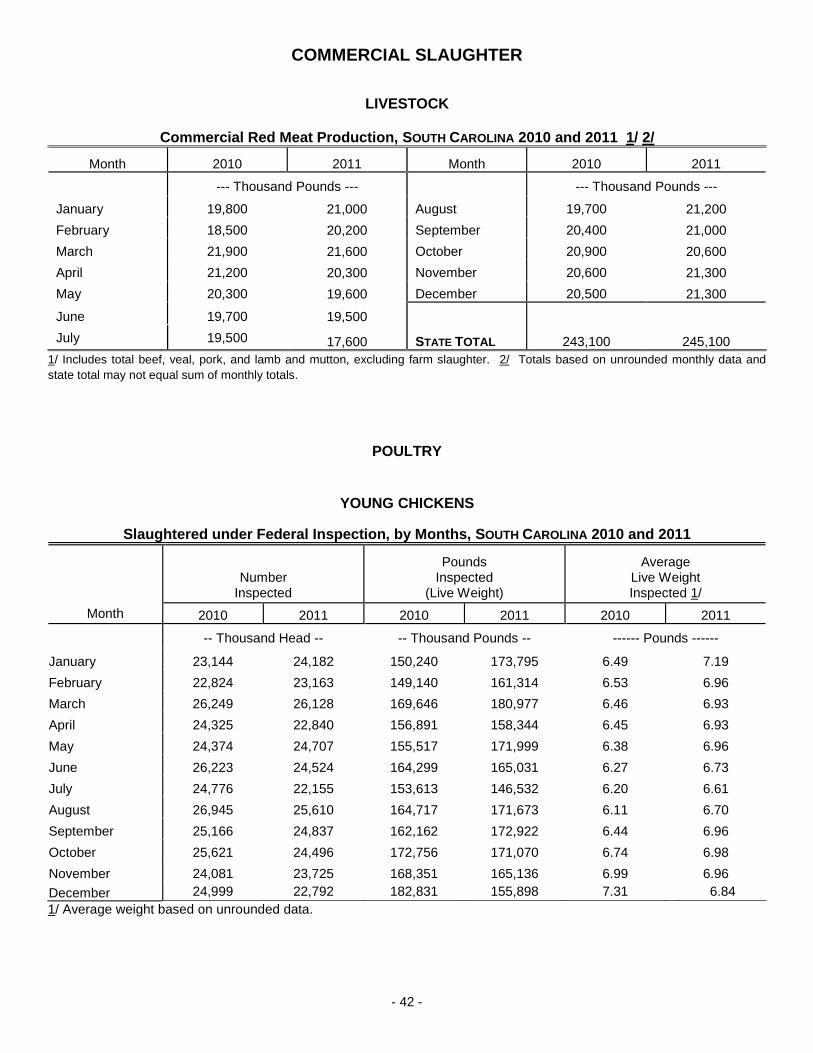
COMMERCIAL SLAUGHTER
LIVESTOCK Commercial Red Meat Production, SOUTH CAROLINA 2010 and 2011 1/ 2/
Month
2010
2011
Month
2010
2011
--- Thousand Pounds ---
--- Thousand Pounds ---
January 19,800 21,000
August 19,700 21,200
February 18,500 20,200
September 20,400 21,000
March 21,900 21,600
October 20,900 20,600
April 21,200 20,300
November 20,600 21,300
May 20,300 19,600
December 20,500 21,300
June 19,700 19,500
STATE TOTAL 243,100 245,100
July 19,500 17,600
1/ Includes total beef, veal, pork, and lamb and mutton, excluding farm slaughter. 2/ Totals based on unrounded monthly data and
state total may not equal sum of monthly totals.
POULTRY
YOUNG CHICKENS
Slaughtered under Federal Inspection, by Months, SOUTH CAROLINA 2010 and 2011
Month
Number
Inspected
Pounds
Inspected (Live Weight)
Average
Live Weight Inspected 1/
2010
2011
2010
2011
2010
2011
-- Thousand Head --
-- Thousand Pounds --
------ Pounds ------
January 23,144 24,182 150,240 173,795 6.49 7.19 February 22,824 23,163 149,140 161,314 6.53 6.96 March 26,249 26,128 169,646 180,977 6.46 6.93 April 24,325 22,840 156,891 158,344 6.45 6.93 May 24,374 24,707 155,517 171,999 6.38 6.96 June 26,223 24,524 164,299 165,031 6.27 6.73 July 24,776 22,155 153,613 146,532 6.20 6.61 August 26,945 25,610 164,717 171,673 6.11 6.70 September 25,166 24,837 162,162 172,922 6.44 6.96 October 25,621 24,496 172,756 171,070 6.74 6.98 November 24,081 23,725 168,351 165,136 6.99 6.96 December 24,999 22,792 182,831 155,898 7.31 6.84
1/ Average weight based on unrounded data.
- 42 -
80
30
10
5040
20
Horry
Aiken
York
Berkeley
Colleton
Lee
Jasper
Charleston
Sumter
Orangeburg
Laurens
Fairfield
Richland
Union
Beaufort
Oconee
Kershaw
Anderson
Lexington
Chester
Williamsburg
Dillon
Marion
Newberry
Chesterfield
Clarendon
Saluda
Pickens
Barnwell
Abbeville
Florence
Greenville
Georgetown
Spartanburg
Hampton
Lancaster
Darlington
Marlboro
Edgefield
Dorchester
Calhoun
Allendale
Bamberg
Cherokee
Greenwood
McCormick
ECONOMIC SECTION
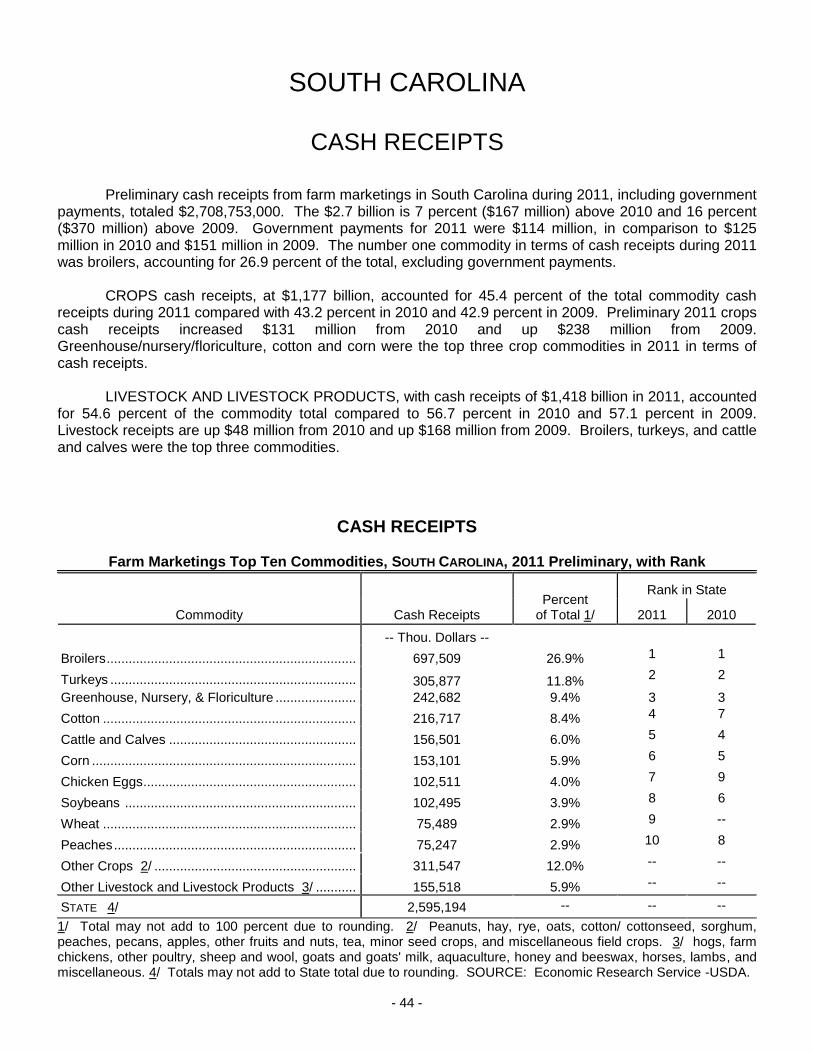
SOUTH CAROLINA CASH RECEIPTS
Preliminary cash receipts from farm marketings in South Carolina during 2011, including government payments, totaled $2,708,753,000. The $2.7 billion is 7 percent ($167 million) above 2010 and 16 percent ($370 million) above 2009. Government payments for 2011 were $114 million, in comparison to $125 million in 2010 and $151 million in 2009. The number one commodity in terms of cash receipts during 2011 was broilers, accounting for 26.9 percent of the total, excluding government payments.
CROPS cash receipts, at $1,177 billion, accounted for 45.4 percent of the total commodity cash receipts during 2011 compared with 43.2 percent in 2010 and 42.9 percent in 2009. Preliminary 2011 crops cash receipts increased $131 million from 2010 and up $238 million from 2009. Greenhouse/nursery/floriculture, cotton and corn were the top three crop commodities in 2011 in terms of cash receipts.
LIVESTOCK AND LIVESTOCK PRODUCTS, with cash receipts of $1,418 billion in 2011, accounted for 54.6 percent of the commodity total compared to 56.7 percent in 2010 and 57.1 percent in 2009. Livestock receipts are up $48 million from 2010 and up $168 million from 2009. Broilers, turkeys, and cattle and calves were the top three commodities.
CASH RECEIPTS
Farm Marketings Top Ten Commodities, SOUTH CAROLINA, 2011 Preliminary, with Rank
Commodity
Cash Receipts
Percent
of Total 1/
Rank in State
2011
2010
-- Thou. Dollars --
Broilers .................................................................... 697,509 26.9% 1 1 Turkeys ................................................................... 305,877 11.8%
2 2
Greenhouse, Nursery, & Floriculture ...................... 242,682 9.4% 3 3 Cotton ..................................................................... 216,717 8.4% 4 7 Cattle and Calves ................................................... 156,501 6.0% 5 4 Corn ........................................................................ 153,101 5.9% 6 5 Chicken Eggs .......................................................... 102,511 4.0% 7 9 Soybeans ............................................................... 102,495 3.9% 8 6 Wheat ..................................................................... 75,489 2.9% 9 -- Peaches .................................................................. 75,247 2.9% 10 8 Other Crops 2/ ....................................................... 311,547 12.0% -- -- Other Livestock and Livestock Products 3/ ........... 155,518 5.9% -- -- STATE 4/ 2,595,194 -- -- --
1/ Total may not add to 100 percent due to rounding. 2/ Peanuts, hay, rye, oats, cotton/ cottonseed, sorghum, peaches, pecans, apples, other fruits and nuts, tea, minor seed crops, and miscellaneous field crops. 3/ hogs, farm chickens, other poultry, sheep and wool, goats and goats' milk, aquaculture, honey and beeswax, horses, lambs, and miscellaneous. 4/ Totals may not add to State total due to rounding. SOURCE: Economic Research Service -USDA.
- 44 -

CASH RECEIPTS
Farm Marketings by Commodity and Government Payments South Carolina, 2009 – 2011
Commodity 2009 1/ 2010 1/ 2011 2/
---------- Thousand Dollars ---------- FIELD CROPS: Corn . . . . . . . . . . . . . . . . . . . . . . . . . . . . . . . . . . . . . 103,342 128,287 153,101
Cotton Lint . . . . . . . . . . . . . . . . . . . . . . . . . . . . . . . . . 62,789 130,259 196,843
Cottonseed . . . . . . . . . . . . . . . . . . . . . . . . . . . . . . . . . 6,901 11,029 19,874
Hay . . . . . . . . . . . . . . . . . . . . . . . . . . . . . . . . . . . . . . . 17,860 14,555 11,412
Oats . . . . . . . . . . . . . . . . . . . . . . . . . . . . . . . . . . . . . . 1,357 920 1,597
Peanuts . . . . . . . . . . . . . . . . . . . . . . . . . . . . . . . . . . . 31,554 54,208 71,014
Soybeans . . . . . . . . . . . . . . . . . . . . . . . . . . . . . . . . . . 145,549 121,678 102,495
Tobacco . . . . . . . . . . . . . . . . . . . . . . . . . . . . . . . . . . . 68,376 63,360 43,741
Wheat . . . . . . . . . . . . . . . . . . . . . . . . . . . . . . . . . . . . . 44,534 23,746 75,489
VEGETABLES:
Cantaloups . . . . . . . . . . . . . . . . . . . . . . . . . . . . . . . . . 6,000 3,580 9,100
Cucumbers, Fresh . . . . . . . . . . . . . . . . . . . . . . . . . . . 7,038 6,048 8,840
Cucumbers, Processing . . . . . . . . . . . . . . . . . . . . . . . 3,960 1,320 1,320
Snap Beans, Fresh . . . . . . . . . . . . . . . . . . . . . . . . . . 2,150 936 630
Squash . . . . . . . . . . . . . . . . . . . . . . . . . . . . . . . . . . . . 4,578 2,083 6,435
Sweetpotatoes . . . . . . . . . . . . . . . . . . . . . . . . . . . . . . #N/A #N/A #N/A
Tomatoes, Fresh . . . . . . . . . . . . . . . . . . . . . . . . . . . . 15,984 18,768 22,448
Watermelons . . . . . . . . . . . . . . . . . . . . . . . . . . . . . . . 13,455 35,640 38,570
Other Vegetables 3/ . . . . . . . . . . . . . . . . . . . . . . . . . . 59,700 62,100 71,200
FRUITS AND NUTS:
Apples . . . . . . . . . . . . . . . . . . . . . . . . . . . . . . . . . . . . #N/A #N/A #N/A
Peaches . . . . . . . . . . . . . . . . . . . . . . . . . . . . . . . . . . . 64,488 98,130 75,247
Pecans . . . . . . . . . . . . . . . . . . . . . . . . . . . . . . . . . . . . 2,264 2,630 5,376
Other Fruits and Nuts 4/ . . . . . . . . . . . . . . . . . . . . . . 5,045 6,025 5,625
MISCELLANEOUS CROPS: Greenhouse, Nursery and Floriculture . . . . . . . . . . . . 257,995 248,315 242,682
Other Crops 5/ . . . . . . . . . . . . . . . . . . . . . . . . . . . . . . 5,975 4,805 5,180
TOTAL CROPS 6/ 938,892 1,045,983 1,177,278
LIVESTOCK AND LIVESTOCK PRODUCTS:
Broilers . . . . . . . . . . . . . . . . . . . . . . . . . . . . . . . . . . . . 695,508 750,426 697,509
Cattle and Calves . . . . . . . . . . . . . . . . . . . . . . . . . . . . 115,106 129,512 156,501
Eggs . . . . . . . . . . . . . . . . . . . . . . . . . . . . . . . . . . . . . . 85,739 86,243 102,511
Farm Chickens . . . . . . . . . . . . . . . . . . . . . . . . . . . . . . 1,481 1,996 2,522
Hogs 7/ . . . . . . . . . . . . . . . . . . . . . . . . . . . . . . . . . . . . 24,706 31,481 38,329
Milk . . . . . . . . . . . . . . . . . . . . . . . . . . . . . . . . . . . . . . 50,880 56,317 62,700
Turkeys . . . . . . . . . . . . . . . . . . . . . . . . . . . . . . . . . . . 220,912 261,324 305,877
Other Poultry 8/ . . . . . . . . . . . . . . . . . . . . . . . . . . . . . 13,330 11,720 11,100
Other Livestock 9/ . . . . . . . . . . . . . . . . . . . . . . . . . . . 695,508 750,426 697,509
TOTAL LIVESTOCK AND LIVESTOCK PRODUCTS 6/ 1,249,575 1,369,817 1,417,916
TOTAL COMMODITIES 6/ 2,188,467 2,415,800 2,595,194
GOVERNMENT PAYMENTS 150,526 125,492 113,559
STATE 6/ 2,338,993 2,541,292 2,708,753
1/ Revised. 2/ Preliminary. 3/ Includes gingko, herbs, mushrooms and other miscellaneous vegetables. 4/ Berries and other fruit. 5/ Tea, minor seed crops, Christmas trees, other miscellaneous field crops, and other forest products. 6/ Totals may not add due to rounding. 7/ Data differs from Meat Animals, PDI due to the reference date. 8/ Squab, pigeons, quail and other poultry. 9/ Sheep, goats, minor seafood, horses, miscellaneous. SOURCE: Economic Research Service – USDA. #N/A / Not Available
- 45 -
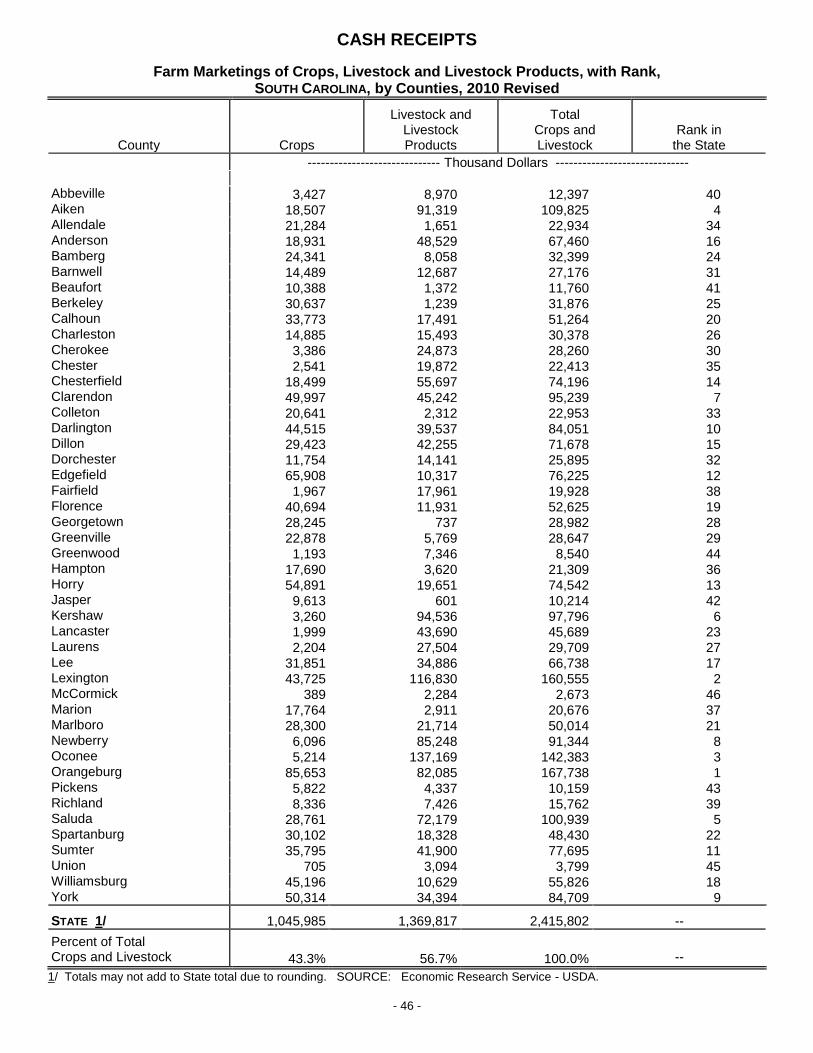
CASH RECEIPTS
Farm Marketings of Crops, Livestock and Livestock Products, with Rank, SOUTH CAROLINA, by Counties, 2010 Revised
County
Crops
Livestock and
Livestock Products
Total
Crops and Livestock
Rank in
the State
------------------------------ Thousand Dollars ------------------------------
Abbeville 3,427 8,970 12,397 40 Aiken 18,507 91,319 109,825 4 Allendale 21,284 1,651 22,934 34 Anderson 18,931 48,529 67,460 16 Bamberg 24,341 8,058 32,399 24 Barnwell 14,489 12,687 27,176 31 Beaufort 10,388 1,372 11,760 41 Berkeley 30,637 1,239 31,876 25 Calhoun 33,773 17,491 51,264 20 Charleston 14,885 15,493 30,378 26 Cherokee 3,386 24,873 28,260 30 Chester 2,541 19,872 22,413 35 Chesterfield 18,499 55,697 74,196 14 Clarendon 49,997 45,242 95,239 7 Colleton 20,641 2,312 22,953 33 Darlington 44,515 39,537 84,051 10 Dillon 29,423 42,255 71,678 15 Dorchester 11,754 14,141 25,895 32 Edgefield 65,908 10,317 76,225 12 Fairfield 1,967 17,961 19,928 38 Florence 40,694 11,931 52,625 19 Georgetown 28,245 737 28,982 28 Greenville 22,878 5,769 28,647 29 Greenwood 1,193 7,346 8,540 44 Hampton 17,690 3,620 21,309 36 Horry 54,891 19,651 74,542 13 Jasper 9,613 601 10,214 42 Kershaw 3,260 94,536 97,796 6 Lancaster 1,999 43,690 45,689 23 Laurens 2,204 27,504 29,709 27 Lee 31,851 34,886 66,738 17 Lexington 43,725 116,830 160,555 2 McCormick 389 2,284 2,673 46 Marion 17,764 2,911 20,676 37 Marlboro 28,300 21,714 50,014 21 Newberry 6,096 85,248 91,344 8 Oconee 5,214 137,169 142,383 3 Orangeburg 85,653 82,085 167,738 1 Pickens 5,822 4,337 10,159 43 Richland 8,336 7,426 15,762 39 Saluda 28,761 72,179 100,939 5 Spartanburg 30,102 18,328 48,430 22 Sumter 35,795 41,900 77,695 11 Union 705 3,094 3,799 45 Williamsburg 45,196 10,629 55,826 18 York 50,314 34,394 84,709 9 STATE 1/ 1,045,985 1,369,817 2,415,802
--
Percent of Total Crops and Livestock 43.3% 56.7% 100.0%
--
1/ Totals may not add to State total due to rounding. SOURCE: Economic Research Service - USDA.
- 46 -

CASH RECEIPTS
Farm Marketings of Crops, Livestock and Livestock Products, with Rank, SOUTH CAROLINA, by Counties, 2011 Preliminary
County
Crops
Livestock and
Livestock Products
Total
Crops and Livestock
Rank in
the State
------------------------------ Thousand Dollars ------------------------------
Abbeville 3,437 10,330 13,767 41 Aiken 20,644 86,107 106,751 6 Allendale 18,045 3,144 21,188 38 Anderson 19,135 49,988 69,123 17 Bamberg 30,346 9,377 39,724 24 Barnwell 19,005 13,001 32,006 26 Beaufort 12,749 1,450 14,199 40 Berkeley 30,131 1,368 31,499 28 Calhoun 40,389 16,726 57,115 20 Charleston 15,955 15,679 31,634 27 Cherokee 3,429 29,119 32,548 25 Chester 3,877 23,888 27,765 33 Chesterfield 21,797 59,671 81,468 14 Clarendon 63,990 43,787 107,777 5 Colleton 23,371 2,641 26,011 34 Darlington 55,148 42,521 97,669 8 Dillon 41,634 42,416 84,050 13 Dorchester 13,832 14,256 28,088 32 Edgefield 59,308 10,497 69,805 16 Fairfield 1,067 20,841 21,908 37 Florence 47,476 11,478 58,954 18 Georgetown 27,237 1,455 28,691 30 Greenville 22,165 6,059 28,225 31 Greenwood 1,269 8,315 9,584 44 Hampton 20,626 3,593 24,219 36 Horry 55,085 20,448 75,533 15 Jasper 9,662 693 10,355 43 Kershaw 4,295 106,471 110,766 4 Lancaster 2,381 51,659 54,040 22 Laurens 2,107 28,395 30,501 29 Lee 49,286 37,239 86,525 12 Lexington 51,116 109,971 161,087 2 McCormick 624 2,561 3,185 46 Marion 21,141 4,136 25,278 35 Marlboro 36,663 21,489 58,152 19 Newberry 7,007 94,483 101,490 7 Oconee 5,467 128,873 134,340 3 Orangeburg 103,926 79,164 183,090 1 Pickens 5,950 4,988 10,938 42 Richland 12,078 7,507 19,586 39 Saluda 23,443 71,494 94,937 9 Spartanburg 26,732 21,022 47,754 23 Sumter 48,487 43,224 91,710 10 Union 731 3,703 4,435 45 Williamsburg 44,751 11,922 56,673 21 York 50,286 40,765 91,050 11 STATE 1/ 1,177,278 1,417,916 2,595,194
--
Percent of Total Crops and Livestock 45.4% 54.6% 100.0%
--
1/ Totals may not add to State total due to rounding. SOURCE: Economic Research Service - USDA. - 47 -
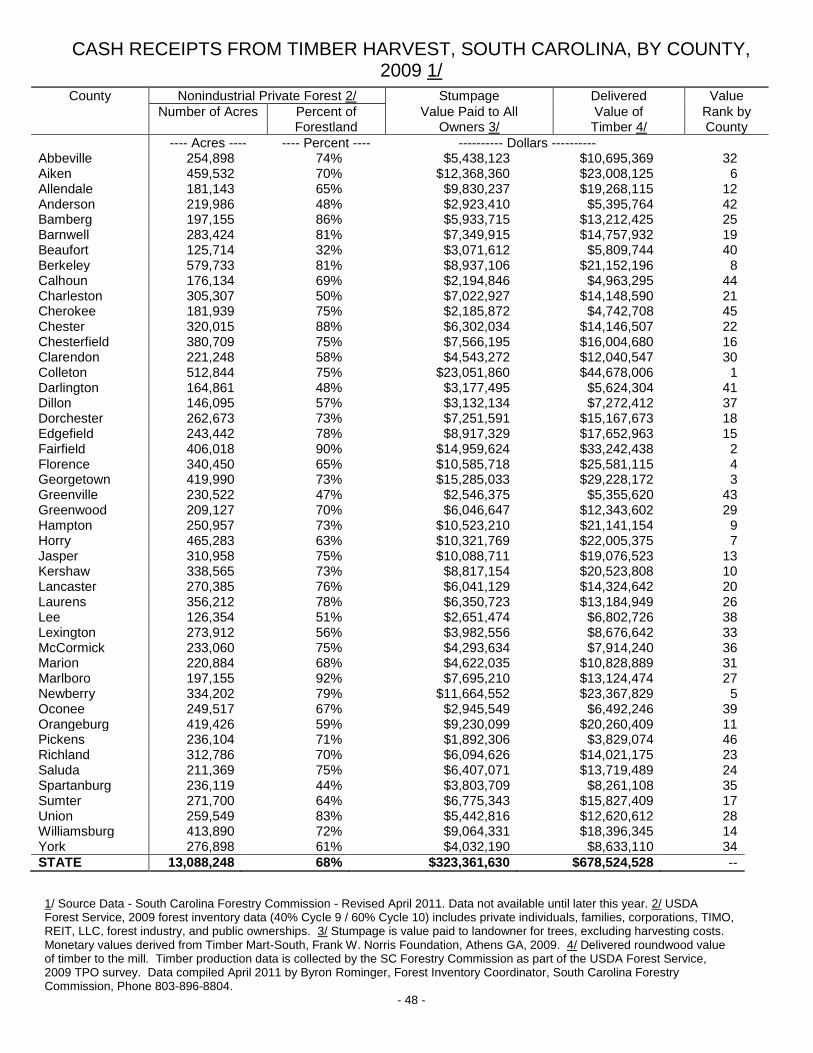
CASH RECEIPTS FROM TIMBER HARVEST, SOUTH CAROLINA, BY COUNTY, 2009 1/
1/ Source Data - South Carolina Forestry Commission - Revised April 2011. Data not available until later this year. 2/ USDA Forest Service, 2009 forest inventory data (40% Cycle 9 / 60% Cycle 10) includes private individuals, families, corporations, TIMO, REIT, LLC, forest industry, and public ownerships. 3/ Stumpage is value paid to landowner for trees, excluding harvesting costs. Monetary values derived from Timber Mart-South, Frank W. Norris Foundation, Athens GA, 2009. 4/ Delivered roundwood value of timber to the mill. Timber production data is collected by the SC Forestry Commission as part of the USDA Forest Service, 2009 TPO survey. Data compiled April 2011 by Byron Rominger, Forest Inventory Coordinator, South Carolina Forestry Commission, Phone 803-896-8804.
- 48 -
County Nonindustrial Private Forest 2/ Stumpage Delivered Value
Number of Acres Percent of Forestland
Value Paid to All Owners 3/
Value of Timber 4/
Rank by County
---- Acres ---- ---- Percent ---- ---------- Dollars ---------- Abbeville 254,898 74% $5,438,123 $10,695,369 32 Aiken 459,532 70% $12,368,360 $23,008,125 6 Allendale 181,143 65% $9,830,237 $19,268,115 12 Anderson 219,986 48% $2,923,410 $5,395,764 42 Bamberg 197,155 86% $5,933,715 $13,212,425 25 Barnwell 283,424 81% $7,349,915 $14,757,932 19 Beaufort 125,714 32% $3,071,612 $5,809,744 40 Berkeley 579,733 81% $8,937,106 $21,152,196 8 Calhoun 176,134 69% $2,194,846 $4,963,295 44 Charleston 305,307 50% $7,022,927 $14,148,590 21 Cherokee 181,939 75% $2,185,872 $4,742,708 45 Chester 320,015 88% $6,302,034 $14,146,507 22 Chesterfield 380,709 75% $7,566,195 $16,004,680 16 Clarendon 221,248 58% $4,543,272 $12,040,547 30 Colleton 512,844 75% $23,051,860 $44,678,006 1 Darlington 164,861 48% $3,177,495 $5,624,304 41 Dillon 146,095 57% $3,132,134 $7,272,412 37 Dorchester 262,673 73% $7,251,591 $15,167,673 18 Edgefield 243,442 78% $8,917,329 $17,652,963 15 Fairfield 406,018 90% $14,959,624 $33,242,438 2 Florence 340,450 65% $10,585,718 $25,581,115 4 Georgetown 419,990 73% $15,285,033 $29,228,172 3 Greenville 230,522 47% $2,546,375 $5,355,620 43 Greenwood 209,127 70% $6,046,647 $12,343,602 29 Hampton 250,957 73% $10,523,210 $21,141,154 9 Horry 465,283 63% $10,321,769 $22,005,375 7 Jasper 310,958 75% $10,088,711 $19,076,523 13 Kershaw 338,565 73% $8,817,154 $20,523,808 10 Lancaster 270,385 76% $6,041,129 $14,324,642 20 Laurens 356,212 78% $6,350,723 $13,184,949 26 Lee 126,354 51% $2,651,474 $6,802,726 38 Lexington 273,912 56% $3,982,556 $8,676,642 33 McCormick 233,060 75% $4,293,634 $7,914,240 36 Marion 220,884 68% $4,622,035 $10,828,889 31 Marlboro 197,155 92% $7,695,210 $13,124,474 27 Newberry 334,202 79% $11,664,552 $23,367,829 5 Oconee 249,517 67% $2,945,549 $6,492,246 39 Orangeburg 419,426 59% $9,230,099 $20,260,409 11 Pickens 236,104 71% $1,892,306 $3,829,074 46 Richland 312,786 70% $6,094,626 $14,021,175 23 Saluda 211,369 75% $6,407,071 $13,719,489 24 Spartanburg 236,119 44% $3,803,709 $8,261,108 35 Sumter 271,700 64% $6,775,343 $15,827,409 17 Union 259,549 83% $5,442,816 $12,620,612 28 Williamsburg 413,890 72% $9,064,331 $18,396,345 14 York 276,898 61% $4,032,190 $8,633,110 34
STATE 13,088,248 68% $323,361,630 $678,524,528 --

FARM INCOME AND EXPENSES, SOUTH CAROLINA, 2007 – 2011 1/ COMMODITY 2007 2008 2009 2010 2011
------------ Thou. Dol. ------------ VALUE OF PRODUCTION 697,035 1,020,301 935,146 1,025,366 1,182,609 Food Grains 24,345 76,967 45,203 24,223 76,443 Feed Crops 123,770 146,658 122,978 143,761 166,110 Cotton 85,212 67,555 69,690 141,289 216,717 Oil Crops 120,957 170,743 177,103 175,886 173,509 Tobacco 69,188 69,426 68,376 63,360 43,741 Fruits and Tree Nuts 19,491 62,670 78,317 113,770 94,238 Vegetables 49,648 105,859 113,202 130,475 158,543 All Other Crops 276,649 275,041 264,024 253,219 247,977 Home Consumption 281 338 246 188 430 Value of Inventory Adjustment 2/ -72,506 45,044 -3,993 -20,805 4,901 VALUE OF LIVESTOCK PRODUCTION 1,260,841 1,368,907 1,249,772 1,373,316 1,405,480 Meat Animals 177,193 175,194 139,812 160,993 194,830 Dairy Products 67,309 67,940 50,880 56,317 62,700 Poultry and Eggs 974,262 1,098,265 1,016,970 1,111,709 1,119,519 Miscellaneous Livestock 46,020 43,189 41,913 40,798 40,867 Home Consumption 833 1,002 1,131 1,267 1,177 Value of Inventory Adjustment 2/ -4,776 -16,683 -934 2,232 -13,613 REVENUES FROM SERVICES AND FORESTRY 399,904 417,038 395,958 404,371 460,969 Machine Hire and Customwork 15,785 7,420 14,680 5,513 5,209 Forest Products Sold 26,000 26,000 26,100 26,900 27,400 Other Farm Income 159,520 169,869 155,076 164,218 210,702 Gross Imputed Rental Value of Farm Dwellings 198,599 213,749 200,102 207,740 217,658 VALUE OF AGRICULTURAL SECTOR OUTPUT 2,357,780 2,806,246 2,580,876 2,803,053 3,049,058 LESS PURCHASED INPUTS 1,607,158 1,751,777 1,562,931 1,820,171 2,128,195 FARM ORIGIN 720,696 824,287 756,782 922,607 1,172,251 Feed Purchased 553,331 653,966 587,030 730,817 967,995 Livestock and Poultry Purchased 70,221 68,065 74,313 81,012 79,844 Seed Purchased 97,144 102,256 95,439 110,778 124,412 MANUFACTURED INPUTS 406,506 426,975 383,276 400,739 448,389 Fertilizers and Lime 140,880 169,027 131,840 151,049 168,010 Pesticides 80,893 84,871 98,132 92,828 107,415 Petroleum Fuel and Oils 119,179 125,036 100,168 106,214 122,313 Electricity 65,554 48,041 53,136 50,648 50,651 OTHER PURCHASED INPUTS 479,956 500,515 422,873 496,825 507,555 Repair and Maintenance of Capital Items 118,186 109,646 99,968 141,758 123,030 Machine Hire and Customwork 14,780 17,235 13,434 18,985 24,589 Marketing, Storage, and Transportation Expenses 101,224 86,116 88,643 122,296 116,752 Contract Labor 32,871 18,830 12,446 12,699 9,470 Miscellaneous Expenses 212,895 268,688 208,382 201,087 233,714 PLUS NET GOVERNMENT TRANSACTIONS 116,301 103,558 104,467 78,881 62,073 + Direct Government Payments 164,508 152,979 150,526 125,492 113,559 - Motor Vehicle Registration and Licensing Fees 4,415 4,771 3,831 4,383 4,566 - Property Taxes 43,792 44,650 42,228 42,228 46,920 GROSS VALUE ADDED 866,923 1,158,027 1,122,413 1,061,763 982,936 LESS CAPITAL CONSUMPTION 237,521 250,097 269,294 274,948 287,210 NET VALUE ADDED 629,402 907,930 853,119 786,815 695,726 LESS PAYMENTS TO STAKEHOLDERS 289,722 288,190 266,359 271,682 250,014 Employee Compensation (Total Hired Labor) 179,432 182,847 159,256 159,533 138,658 Net Rent Received by Non-operator Landlords 9,758 9,121 8,882 17,028 23,549 Real Estate and Non-Real Estate Interest 100,532 96,222 98,221 95,121 87,807 NET FARM INCOME 339,680 619,740 586,760 515,133 445,712
1/ Value of agricultural sector production is the gross value of the commodities and services produced within a year. Net value-added is the sector’s contribution to the National economy and is the sum of the income from production earned by all factors-of-production, regardless of ownership. Net farm income is the farm operators’ share of income from the sector’s production activities. The concept presented is consistent with that employed by the Organization for Economic Cooperation and Development. 2/ A positive value of inventory change represents current-year production not sold by December 31. A negative value is an offset to production from prior years included in current-year sales. SOURCE: Economic Research Service – USDA
- 49 -
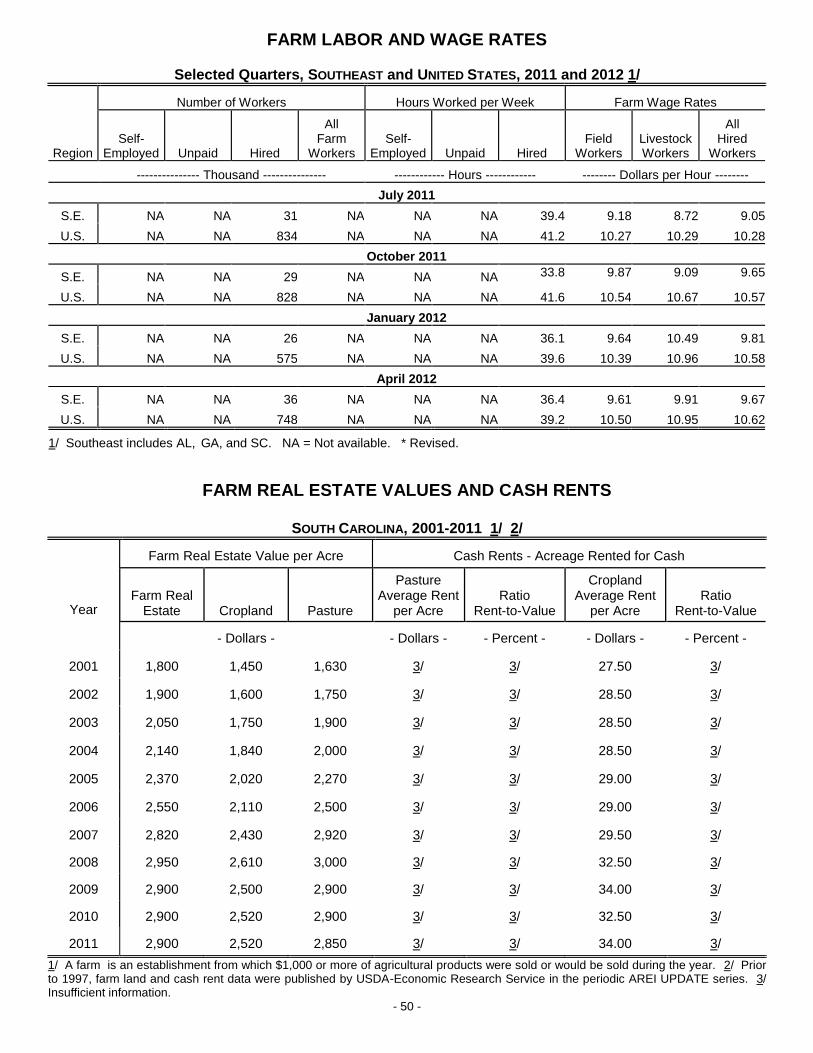
FARM LABOR AND WAGE RATES
Selected Quarters, SOUTHEAST and UNITED STATES, 2011 and 2012 1/
Region
Number of Workers
Hours Worked per Week
Farm Wage Rates
Self-
Employed
Unpaid
Hired
All
Farm Workers
Self-
Employed
Unpaid
Hired
Field
Workers
Livestock Workers
All
Hired Workers
--------------- Thousand ---------------
------------ Hours ------------
-------- Dollars per Hour --------
July 2011
S.E.
NA
NA 31
NA
NA
NA 39.4 9.18 8.72 9.05
U.S.
NA
NA 834
NA
NA
NA 41.2 10.27 10.29 10.28
October 2011
S.E.
NA
NA
29
NA
NA
NA 33.8 9.87 9.09 9.65
U.S.
NA
NA 828
NA
NA
NA 41.6 10.54 10.67 10.57
January 2012
S.E.
NA
NA 26
NA
NA
NA 36.1 9.64 10.49 9.81
U.S.
NA
NA 575
NA
NA
NA 39.6 10.39 10.96 10.58
April 2012
S.E.
NA
NA 36
NA
NA
NA 36.4 9.61 9.91 9.67
U.S.
NA
NA 748
NA
NA
NA 39.2 10.50 10.95 10.62
1/ Southeast includes AL, GA, and SC. NA = Not available. * Revised.
FARM REAL ESTATE VALUES AND CASH RENTS SOUTH CAROLINA, 2001-2011 1/ 2/
Year
Farm Real Estate Value per Acre
Cash Rents - Acreage Rented for Cash
Farm Real
Estate
Cropland
Pasture
Pasture
Average Rent per Acre
Ratio
Rent-to-Value
Cropland
Average Rent per Acre
Ratio
Rent-to-Value
- Dollars -
- Dollars -
- Percent -
- Dollars -
- Percent -
2001
1,800
1,450
1,630
3/
3/
27.50
3/
2002
1,900
1,600
1,750
3/
3/
28.50
3/
2003
2,050
1,750
1,900
3/
3/
28.50
3/
2004
2,140
1,840
2,000
3/
3/
28.50
3/
2005
2,370
2,020
2,270
3/
3/
29.00
3/
2006
2,550
2,110
2,500
3/
3/
29.00
3/
2007 2,820 2,430 2,920
3/
3/ 29.50 3/
2008 2,950 2,610 3,000
3/
3/ 32.50 3/
2009 2,900 2,500 2,900
3/
3/ 34.00
3/
2010 2,900 2,520 2,900
3/
3/ 32.50
3/
2011 2,900 2,520 2,850
3/
3/ 34.00
3/
1/ A farm is an establishment from which $1,000 or more of agricultural products were sold or would be sold during the year. 2/ Prior to 1997, farm land and cash rent data were published by USDA-Economic Research Service in the periodic AREI UPDATE series. 3/ Insufficient information.
- 50 -
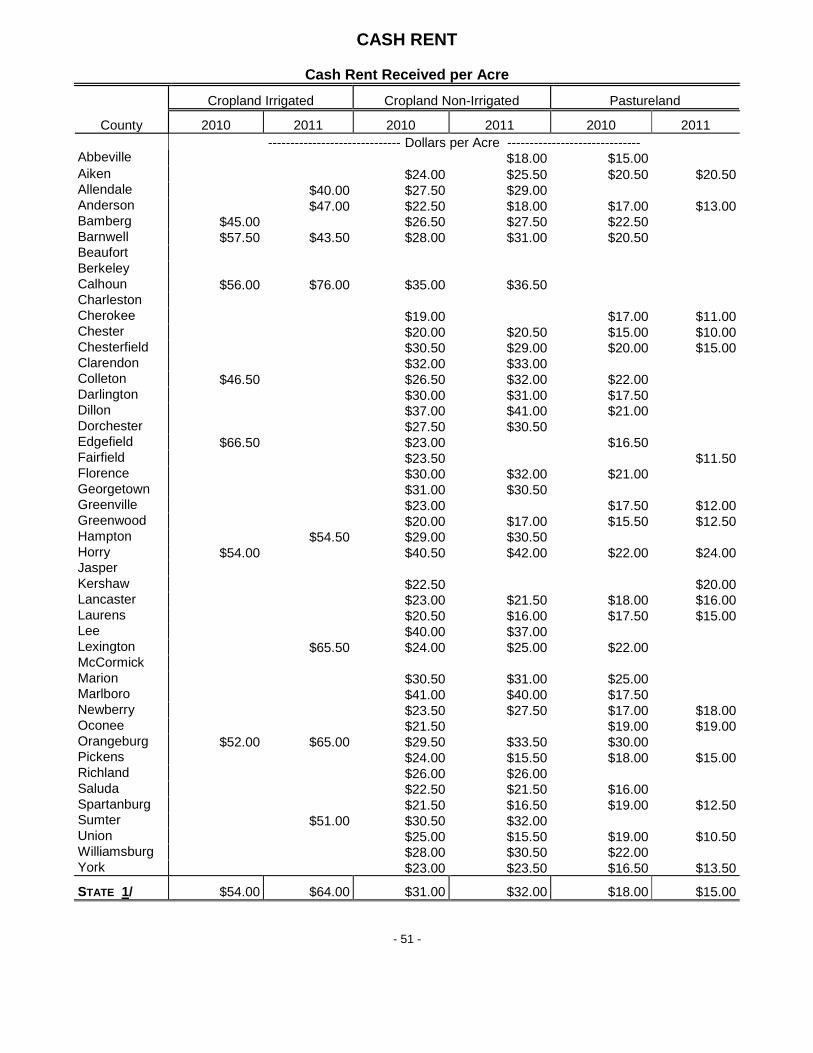
CASH RENT
Cash Rent Received per Acre
County
Cropland Irrigated
Cropland Non-Irrigated
Pastureland
2010 2011 2010 2011 2010 2011
------------------------------ Dollars per Acre ------------------------------
Abbeville $18.00 $15.00 Aiken $24.00 $25.50 $20.50 $20.50 Allendale $40.00 $27.50 $29.00 Anderson $47.00 $22.50 $18.00 $17.00 $13.00 Bamberg $45.00 $26.50 $27.50 $22.50 Barnwell $57.50 $43.50 $28.00 $31.00 $20.50 Beaufort Berkeley Calhoun $56.00 $76.00 $35.00 $36.50 Charleston Cherokee $19.00 $17.00 $11.00 Chester $20.00 $20.50 $15.00 $10.00 Chesterfield $30.50 $29.00 $20.00 $15.00 Clarendon $32.00 $33.00 Colleton $46.50 $26.50 $32.00 $22.00 Darlington $30.00 $31.00 $17.50 Dillon $37.00 $41.00 $21.00 Dorchester $27.50 $30.50 Edgefield $66.50 $23.00 $16.50 Fairfield $23.50 $11.50 Florence $30.00 $32.00 $21.00 Georgetown $31.00 $30.50 Greenville $23.00 $17.50 $12.00 Greenwood $20.00 $17.00 $15.50 $12.50 Hampton $54.50 $29.00 $30.50 Horry $54.00 $40.50 $42.00 $22.00 $24.00 Jasper Kershaw $22.50 $20.00 Lancaster $23.00 $21.50 $18.00 $16.00 Laurens $20.50 $16.00 $17.50 $15.00 Lee $40.00 $37.00 Lexington $65.50 $24.00 $25.00 $22.00 McCormick Marion $30.50 $31.00 $25.00 Marlboro $41.00 $40.00 $17.50 Newberry $23.50 $27.50 $17.00 $18.00 Oconee $21.50 $19.00 $19.00 Orangeburg $52.00 $65.00 $29.50 $33.50 $30.00 Pickens $24.00 $15.50 $18.00 $15.00 Richland $26.00 $26.00 Saluda $22.50 $21.50 $16.00 Spartanburg $21.50 $16.50 $19.00 $12.50 Sumter $51.00 $30.50 $32.00 Union $25.00 $15.50 $19.00 $10.50 Williamsburg $28.00 $30.50 $22.00 York $23.00 $23.50 $16.50 $13.50 STATE 1/ $54.00 $64.00 $31.00 $32.00 $18.00 $15.00
- 51 -

PRICES RECEIVED
CROPS
Marketing Year Average Prices Received, by SOUTH CAROLINA Farmers, 2009-2011
Year Crop
Harvested
Tobacco
Peanuts
Cotton
Lint
Cotton Seed
All Hay Baled
Sweet-
potatoes
-------------------- Dollars per Lb.-----------------
----------- Dol./Ton. -----------
-- Dol./Cwt. --
2009 1.760 0.231 0.650 158.00 105.00 1/
2010 1.760 0.242 0.780 140.00 100.00 1/
2011 1.660 0.304 0.910 202.00 100.00 1/
Year Crop
Harvested
Soybeans
Corn
Sorghum
Grain
Wheat
Oats
------------------------------------------ Dollars per Bushel ------------------------------------------
2009 9.50 3.86 1/ 4.25 2.30
2010 11.80 5.59 1/ 5.00 2.40
2011 11.30 6.80 1/ 7.05 2.90
1/ Estimates discontinued in 2009.
FRUITS AND VEGETABLES
Marketing Year Average Prices Received, by SOUTH CAROLINA Farmers, 2009-2011
Year Crop
Harvested
Pecans - All
All
Apples
All
Peaches
Cucumbers Processed
------- Dollars per Lb. --------
------- Dollars per Ton -------
2009 1.130 1/ 977.00 330.00
2010 1.750 1/ 955.00 220.00
2011 1.790 1/ 970.00 220.00
1/ Estimates discontinued in 2009.
Year Crop
Harvested
F R E S H M A R K E T
Cucumbers
Tomatoes
Snap Beans
Watermelons
Cantaloups
Squash
--------------------------------- Dollars per Hundredweight -----------------------------
2009 18.00 48.00 43.00 9.00 20.00 32.50
2010 24.00 46.00 52.00 13.50 15.30 31.60
2011 26.00 46.00 90.00 14.50 20.00 33.00
- 52 -
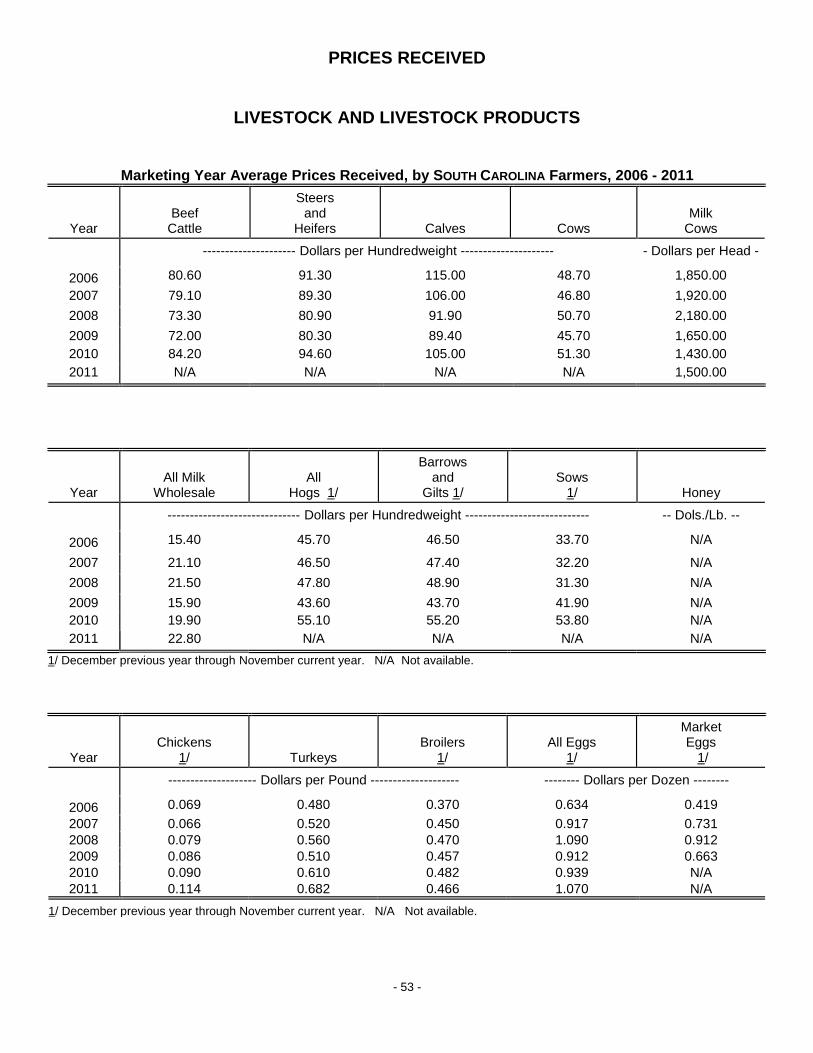
PRICES RECEIVED LIVESTOCK AND LIVESTOCK PRODUCTS Marketing Year Average Prices Received, by SOUTH CAROLINA Farmers, 2006 - 2011
Year
Beef
Cattle
Steers
and Heifers
Calves
Cows
Milk
Cows
--------------------- Dollars per Hundredweight --------------------- - Dollars per Head -
2006 80.60 91.30 115.00 48.70 1,850.00
2007 79.10 89.30 106.00 46.80 1,920.00
2008 73.30 80.90 91.90 50.70 2,180.00
2009 72.00 80.30 89.40 45.70 1,650.00
2010 84.20 94.60 105.00 51.30 1,430.00
2011 N/A N/A N/A N/A 1,500.00
Year
All Milk
Wholesale
All
Hogs 1/
Barrows
and Gilts 1/
Sows
1/
Honey
------------------------------ Dollars per Hundredweight ----------------------------
-- Dols./Lb. --
2006 15.40 45.70 46.50 33.70 N/A
2007 21.10 46.50 47.40 32.20 N/A
2008 21.50 47.80 48.90 31.30 N/A
2009 15.90 43.60 43.70 41.90 N/A
2010 19.90 55.10 55.20 53.80 N/A
2011 22.80 N/A N/A N/A N/A
1/ December previous year through November current year. N/A Not available.
Year
Chickens
1/
Turkeys
Broilers
1/
All Eggs
1/
Market Eggs
1/
-------------------- Dollars per Pound --------------------
-------- Dollars per Dozen --------
2006 0.069 0.480 0.370 0.634 0.419
2007 0.066 0.520 0.450 0.917 0.731
2008 0.079 0.560 0.470 1.090 0.912
2009 0.086 0.510 0.457 0.912 0.663
2010 0.090 0.610 0.482 0.939 N/A
2011 0.114 0.682 0.466 1.070 N/A 1/ December previous year through November current year. N/A Not available.
- 53 -
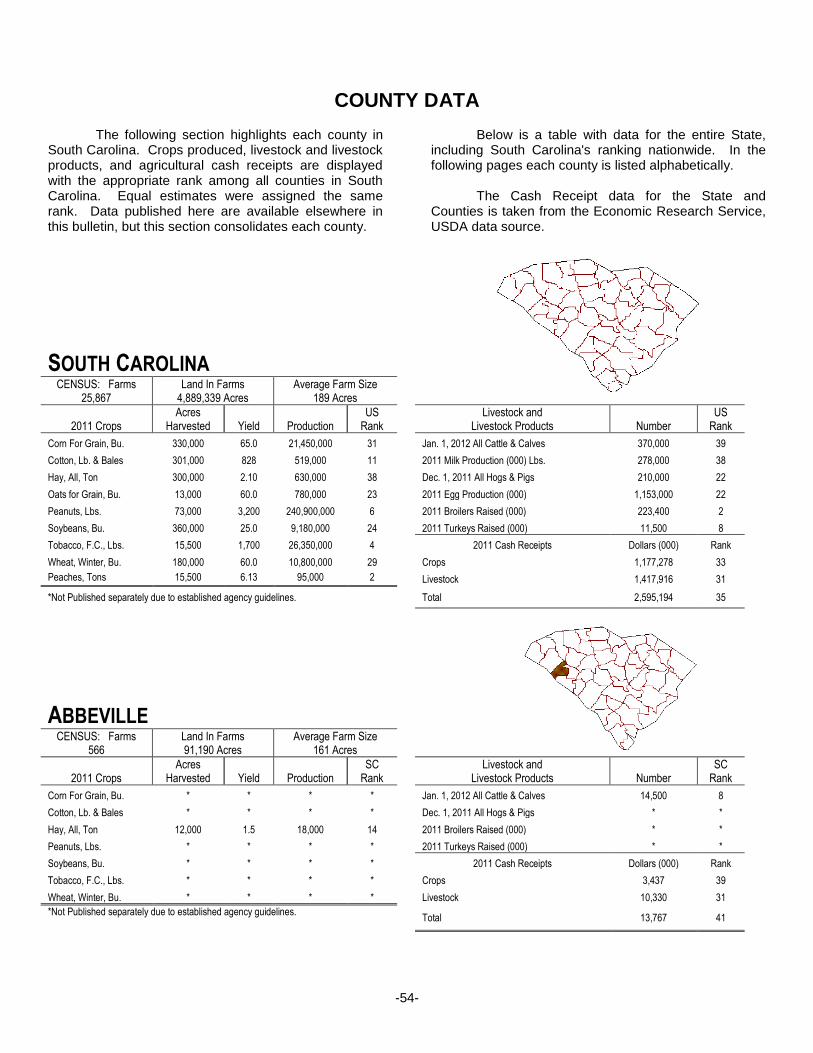
-54-
COUNTY DATA
The following section highlights each county in
South Carolina. Crops produced, livestock and livestock products, and agricultural cash receipts are displayed with the appropriate rank among all counties in South Carolina. Equal estimates were assigned the same rank. Data published here are available elsewhere in this bulletin, but this section consolidates each county.
Below is a table with data for the entire State, including South Carolina's ranking nationwide. In the following pages each county is listed alphabetically.
The Cash Receipt data for the State and Counties is taken from the Economic Research Service, USDA data source.
SOUTH CAROLINA CENSUS: Farms
25,867 Land In Farms
4,889,339 Acres Average Farm Size
189 Acres
2011 Crops Acres
Harvested Yield Production US
Rank
Livestock and Livestock Products Number
US Rank
Corn For Grain, Bu. 330,000 65.0 21,450,000 31 Jan. 1, 2012 All Cattle & Calves 370,000 39
Cotton, Lb. & Bales 301,000 828 519,000 11 2011 Milk Production (000) Lbs. 278,000 38
Hay, All, Ton 300,000 2.10 630,000 38 Dec. 1, 2011 All Hogs & Pigs 210,000 22
Oats for Grain, Bu. 13,000 60.0 780,000 23 2011 Egg Production (000) 1,153,000 22
Peanuts, Lbs. 73,000 3,200 240,900,000 6 2011 Broilers Raised (000) 223,400 2
Soybeans, Bu. 360,000 25.0 9,180,000 24 2011 Turkeys Raised (000) 11,500 8
Tobacco, F.C., Lbs. 15,500 1,700 26,350,000 4 2011 Cash Receipts Dollars (000) Rank
Wheat, Winter, Bu. 180,000 60.0 10,800,000 29 Crops 1,177,278 33
Peaches, Tons 15,500 6.13 95,000 2 Livestock 1,417,916 31
*Not Published separately due to established agency guidelines. Total 2,595,194 35
ABBEVILLE
CENSUS: Farms 566
Land In Farms 91,190 Acres
Average Farm Size 161 Acres
2011 Crops Acres
Harvested Yield Production SC
Rank
Livestock and Livestock Products Number
SC Rank
Corn For Grain, Bu. * * * * Jan. 1, 2012 All Cattle & Calves 14,500 8
Cotton, Lb. & Bales * * * * Dec. 1, 2011 All Hogs & Pigs * *
Hay, All, Ton 12,000 1.5 18,000 14 2011 Broilers Raised (000) * *
Peanuts, Lbs. * * * * 2011 Turkeys Raised (000) * *
Soybeans, Bu. * * * * 2011 Cash Receipts Dollars (000) Rank
Tobacco, F.C., Lbs. * * * * Crops 3,437 39
Wheat, Winter, Bu. * * * * Livestock 10,330 31
*Not Published separately due to established agency guidelines.
Total 13,767 41

-55-
AIKEN
CENSUS: Farms 1,206
Land In Farms 159,312 Acres
Average Farm Size 132 Acres
2011 Crops Acres
Harvested Yield Production SC
Rank
Livestock and Livestock Products Number
SC Rank
Corn For Grain, Bu. 3,300 65.2 215,000 21 Jan. 1, 2012 All Cattle & Calves 11,800 11
Cotton, Lb. & Bales 5,200 757 8,200 18 Dec. 1, 2011 All Hogs & Pigs 400 13T
Hay, All, Ton 13,800 1.95 26,600 3 2011 Broilers Raised (000) 25,600 3
Peanuts, Lbs. 800 2,838 2,270,000 15 2011 Turkeys Raised (000) * *
Soybeans, Bu. 4,700 16.2 76,000 17 2011 Cash Receipts Dollars (000) Rank
Tobacco, F.C., Lbs. * * * * Crops 20,644 24
Wheat, Winter, Bu. 2,900 41.7 121,000 15 Livestock 86,107 5
*Not Published separately due to established agency guidelines. Total 106,751 6
ALLENDALE
CENSUS: Farms 185
Land In Farms 125,202 Acres
Average Farm Size 677 Acres
2011 Crops Acres
Harvested Yield Production SC
Rank
Livestock and Livestock Products Number
SC Rank
Corn For Grain, Bu. 10,100 20.8 210,000 22 Jan. 1, 2012 All Cattle & Calves 5,200 23T
Cotton, Lb. & Bales * * * * Dec. 1, 2011 All Hogs & Pigs * *
Hay, All, Ton 4,500 4.45 20,000 7 2011 Broilers Raised (000) * *
Peanuts, Lbs. 2,550 3,016 7,690,000 11 2011 Turkeys Raised (000) * *
Soybeans, Bu. 8,300 22.5 187,000 12 2011 Cash Receipts Dollars (000) Rank
Tobacco, F.C., Lbs. * * * * Crops 18,045 28
Wheat, Winter, Bu. 4,800 56.7 272,000 12 Livestock 3,144 40
*Not Published separately due to established agency guidelines. Total 21,188 38
ANDERSON
CENSUS: Farms 1,650
Land In Farms 173,149 Acres
Average Farm Size 105 Acres
2011 Crops Acres
Harvested Yield Production SC
Rank
Livestock and Livestock Products Number
SC Rank
Corn For Grain, Bu. 400 59.3 23,700 28 Jan. 1, 2012 All Cattle & Calves 32,000 1
Cotton, Lb. & Bales * * * * Dec. 1, 2011 All Hogs & Pigs 1,600 9
Hay, All, Ton 21,900 1.8 39,100 2 2011 Broilers Raised (000) 9,800 7
Peanuts, Lbs. * * * * 2011 Turkeys Raised (000) * *
Soybeans, Bu. 2,700 13.1 35,400 23 2011 Cash Receipts Dollars (000) Rank
Tobacco, F.C., Lbs. * * * * Crops 19,135 26
Wheat, Winter, Bu. 2,600 61.2 159,000 14 Livestock 49,988 10
*Not Published separately due to established agency guidelines. Total 69,123 17

-56-
BAMBERG
CENSUS: Farms 390
Land In Farms 124,935 Acres
Average Farm Size 320 Acres
2011 Crops Acres
Harvested Yield Production SC
Rank
Livestock and Livestock Products Number
SC Rank
Corn For Grain, Bu. 5,100 68.6 350,000 16 Jan. 1, 2012 All Cattle & Calves 6,900 20
Cotton, Lb. & Bales 9,800 857 17,500 12 Dec. 1, 2011 All Hogs & Pigs * *
Hay, All, Ton 3,600 3.45 12,500 9 2011 Broilers Raised (000) * *
Peanuts, Lbs. 2,500 3,476 8,690,000 10 2011 Turkeys Raised (000) * *
Soybeans, Bu. 4,300 22.8 98,000 15 2011 Cash Receipts Dollars (000) Rank
Tobacco, F.C., Lbs. * * * * Crops 30,346 15
Wheat, Winter, Bu. 1,900 53.7 102,000 16 Livestock 9,377 32
*Not Published separately due to established agency guidelines. Total 39,724 24
BARNWELL
CENSUS: Farms 412
Land In Farms 92,679 Acres
Average Farm Size 225 Acres
2011 Crops Acres
Harvested Yield Production SC
Rank
Livestock and Livestock Products Number
SC Rank
Corn For Grain, Bu. 4,200 71.4 300,000 18 Jan. 1, 2012 All Cattle & Calves 4,200 26T
Cotton, Lb. & Bales 10,800 796 17,900 11 Dec. 1, 2011 All Hogs & Pigs * *
Hay, All, Ton * * * * 2011 Broilers Raised (000) * *
Peanuts, Lbs. 3,000 3,163 9,490,000 9 2011 Turkeys Raised (000) * *
Soybeans, Bu. 2,800 20 56,000 21 2011 Cash Receipts Dollars (000) Rank
Tobacco, F.C., Lbs. * * * * Crops 19,005 27
Wheat, Winter, Bu. 900 48.9 44,000 22 Livestock 13,001 27
*Not Published separately due to established agency guidelines. Total 32,006 26
BEAUFORT
CENSUS: Farms 125
Land In Farms 49,401 Acres
Average Farm Size 395 Acres
2011 Crops Acres
Harvested Yield Production SC
Rank
Livestock and Livestock Products Number
SC Rank
Corn For Grain, Bu. * * * * Jan. 1, 2012 All Cattle & Calves 1,100 35T
Cotton, Lb. & Bales * * * * Dec. 1, 2011 All Hogs & Pigs * *
Hay, All, Ton * * * * 2011 Broilers Raised (000) * *
Peanuts, Lbs. * * * * 2011 Turkeys Raised (000) * *
Soybeans, Bu. * * * * 2011 Cash Receipts Dollars (000) Rank
Tobacco, F.C., Lbs. * * * * Crops 12,749 31
Wheat, Winter, Bu. * * * * Livestock 1,450 44
*Not Published separately due to established agency guidelines. Total 14,199 40
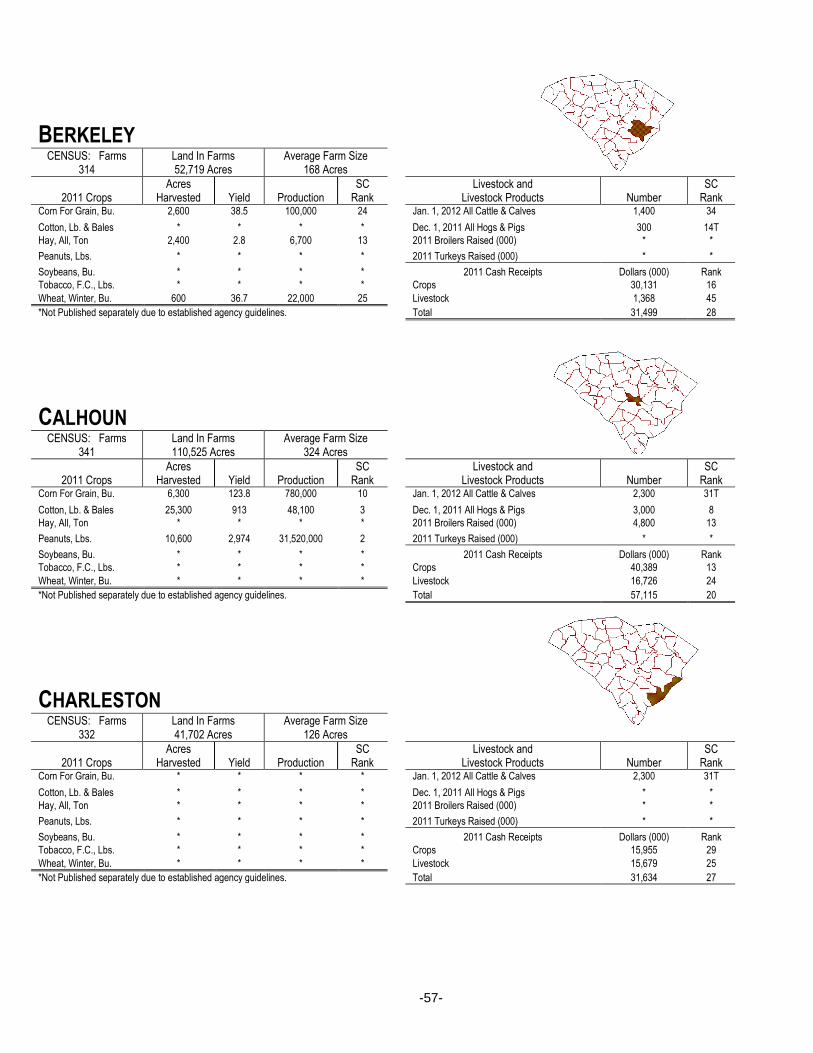
-57-
BERKELEY
CENSUS: Farms 314
Land In Farms 52,719 Acres
Average Farm Size 168 Acres
2011 Crops Acres
Harvested Yield Production SC
Rank
Livestock and Livestock Products Number
SC Rank
Corn For Grain, Bu. 2,600 38.5 100,000 24 Jan. 1, 2012 All Cattle & Calves 1,400 34
Cotton, Lb. & Bales * * * * Dec. 1, 2011 All Hogs & Pigs 300 14T
Hay, All, Ton 2,400 2.8 6,700 13 2011 Broilers Raised (000) * *
Peanuts, Lbs. * * * * 2011 Turkeys Raised (000) * *
Soybeans, Bu. * * * * 2011 Cash Receipts Dollars (000) Rank
Tobacco, F.C., Lbs. * * * * Crops 30,131 16
Wheat, Winter, Bu. 600 36.7 22,000 25 Livestock 1,368 45
*Not Published separately due to established agency guidelines. Total 31,499 28
CALHOUN
CENSUS: Farms 341
Land In Farms 110,525 Acres
Average Farm Size 324 Acres
2011 Crops Acres
Harvested Yield Production SC
Rank
Livestock and Livestock Products Number
SC Rank
Corn For Grain, Bu. 6,300 123.8 780,000 10 Jan. 1, 2012 All Cattle & Calves 2,300 31T
Cotton, Lb. & Bales 25,300 913 48,100 3 Dec. 1, 2011 All Hogs & Pigs 3,000 8
Hay, All, Ton * * * * 2011 Broilers Raised (000) 4,800 13
Peanuts, Lbs. 10,600 2,974 31,520,000 2 2011 Turkeys Raised (000) * *
Soybeans, Bu. * * * * 2011 Cash Receipts Dollars (000) Rank
Tobacco, F.C., Lbs. * * * * Crops 40,389 13
Wheat, Winter, Bu. * * * * Livestock 16,726 24
*Not Published separately due to established agency guidelines. Total 57,115 20
CHARLESTON
CENSUS: Farms 332
Land In Farms 41,702 Acres
Average Farm Size 126 Acres
2011 Crops Acres
Harvested Yield Production SC
Rank
Livestock and Livestock Products Number
SC Rank
Corn For Grain, Bu. * * * * Jan. 1, 2012 All Cattle & Calves 2,300 31T
Cotton, Lb. & Bales * * * * Dec. 1, 2011 All Hogs & Pigs * *
Hay, All, Ton * * * * 2011 Broilers Raised (000) * *
Peanuts, Lbs. * * * * 2011 Turkeys Raised (000) * *
Soybeans, Bu. * * * * 2011 Cash Receipts Dollars (000) Rank
Tobacco, F.C., Lbs. * * * * Crops 15,955 29
Wheat, Winter, Bu. * * * * Livestock 15,679 25
*Not Published separately due to established agency guidelines. Total 31,634 27

-58-
CHEROKEE
CENSUS: Farms 416
Land In Farms 62,729 Acres
Average Farm Size 151 Acres
2011 Crops Acres
Harvested Yield Production SC
Rank
Livestock and Livestock Products Number
SC Rank
Corn For Grain, Bu. * * * * Jan. 1, 2012 All Cattle & Calves 6,900 20
Cotton, Lb. & Bales * * * * Dec. 1, 2011 All Hogs & Pigs * *
Hay, All, Ton * * * * 2011 Broilers Raised (000) * *
Peanuts, Lbs. * * * * 2011 Turkeys Raised (000) 970 5
Soybeans, Bu. 1,400 21.7 30,400 24 2011 Cash Receipts Dollars (000) Rank
Tobacco, F.C., Lbs. * * * * Crops 3,429 40
Wheat, Winter, Bu. * * * * Livestock 29,119 17
*Not Published separately due to established agency guidelines. Total 32,548 25
CHESTER
CENSUS: Farms 544
Land In Farms 111,820 Acres
Average Farm Size 206 Acres
2011 Crops Acres
Harvested Yield Production SC
Rank
Livestock and Livestock Products Number
SC Rank
Corn For Grain, Bu. * * * * Jan. 1, 2012 All Cattle & Calves 17,000 5
Cotton, Lb. & Bales * * * * Dec. 1, 2011 All Hogs & Pigs * *
Hay, All, Ton 7,500 1.8 13,400 8 2011 Broilers Raised (000) * *
Peanuts, Lbs. * * * * 2011 Turkeys Raised (000) 500 9
Soybeans, Bu. * * * * 2011 Cash Receipts Dollars (000) Rank
Tobacco, F.C., Lbs. * * * * Crops 3,877 38
Wheat, Winter, Bu. 1,600 60 96,000 17 Livestock 23,888 19
*Not Published separately due to established agency guidelines. Total 27,765 33
CHESTERFIELD
CENSUS: Farms 848
Land In Farms 140,610 Acres
Average Farm Size 166 Acres
2011 Crops Acres
Harvested Yield Production SC
Rank
Livestock and Livestock Products Number
SC Rank
Corn For Grain, Bu. 5,700 69.3 395,000 14 Jan. 1, 2012 All Cattle & Calves 10,100 13
Cotton, Lb. & Bales * * * * Dec. 1, 2011 All Hogs & Pigs 300 14T
Hay, All, Ton * * * * 2011 Broilers Raised (000) 7,000 10
Peanuts, Lbs. * * * * 2011 Turkeys Raised (000) 1,050 4
Soybeans, Bu. 11,900 26.1 311,000 11 2011 Cash Receipts Dollars (000) Rank
Tobacco, F.C., Lbs. * * * * Crops 21,797 22
Wheat, Winter, Bu. 6,700 71.6 480,000 9 Livestock 59,671 8
*Not Published separately due to established agency guidelines. Total 81,468 14

-59-
CLARENDON
CENSUS: Farms 491
Land In Farms 154,797 Acres
Average Farm Size 315 Acres
2011 Crops Acres
Harvested Yield Production SC
Rank
Livestock and Livestock Products Number
SC Rank
Corn For Grain, Bu. 34,000 76.3 2,595,000 2 Jan. 1, 2012 All Cattle & Calves 4,500 24T
Cotton, Lb. & Bales 15,000 800 25,000 8 Dec. 1, 2011 All Hogs & Pigs 10,000 5
Hay, All, Ton * * * * 2011 Broilers Raised (000) 12,700 6
Peanuts, Lbs. 2,500 2,816 7,040,000 13 2011 Turkeys Raised (000) * *
Soybeans, Bu. 27,100 25.4 687,000 5 2011 Cash Receipts Dollars (000) Rank
Tobacco, F.C., Lbs. * * * * Crops 63,990 2
Wheat, Winter, Bu. 16,900 65.7 1,110,000 3 Livestock 43,787 11
*Not Published separately due to established agency guidelines. Total 107,777 5
COLLETON
CENSUS: Farms 525
Land In Farms 174,822 Acres
Average Farm Size 333 Acres
2011 Crops Acres
Harvested Yield Production SC
Rank
Livestock and Livestock Products Number
SC Rank
Corn For Grain, Bu. 4,100 25.6 105,000 23 Jan. 1, 2012 All Cattle & Calves 4,200 26T
Cotton, Lb. & Bales 5,500 873 10,000 16 Dec. 1, 2011 All Hogs & Pigs 200 15T
Hay, All, Ton 5,100 1.95 10,000 10 2011 Broilers Raised (000) * *
Peanuts, Lbs. * * * * 2011 Turkeys Raised (000) * *
Soybeans, Bu. 3,700 20.8 77,000 16 2011 Cash Receipts Dollars (000) Rank
Tobacco, F.C., Lbs. * * * * Crops 23,371 20
Wheat, Winter, Bu. * * * * Livestock 2,641 41
*Not Published separately due to established agency guidelines. Total 26,011 34
DARLINGTON
CENSUS: Farms 369
Land In Farms 172,627 Acres
Average Farm Size 468 Acres
2011 Crops Acres
Harvested Yield Production SC
Rank
Livestock and Livestock Products Number
SC Rank
Corn For Grain, Bu. 22,300 63.5 1,415,000 5 Jan. 1, 2012 All Cattle & Calves 3,200 28
Cotton, Lb. & Bales 31,000 813 52,500 2 Dec. 1, 2011 All Hogs & Pigs 800 12
Hay, All, Ton 1,900 1.9 3,600 17 2011 Broilers Raised (000) 4,350 16
Peanuts, Lbs. 3,150 3,137 9,880,000 7 2011 Turkeys Raised (000) 480 10
Soybeans, Bu. 32,900 23.7 779,000 3 2011 Cash Receipts Dollars (000) Rank
Tobacco, F.C., Lbs. * * * * Crops 55,148 4
Wheat, Winter, Bu. 11,700 65 760,000 5 Livestock 42,521 13
*Not Published separately due to established agency guidelines. Total 97,669 8

-60-
DILLON
CENSUS: Farms 222
Land In Farms 104,937 Acres
Average Farm Size 473 Acres
2011 Crops Acres
Harvested Yield Production SC
Rank
Livestock and Livestock Products Number
SC Rank
Corn For Grain, Bu. 21,100 63 1,330,000 6 Jan. 1, 2012 All Cattle & Calves 2,700 30T
Cotton, Lb. & Bales 13,900 684 19,800 10 Dec. 1, 2011 All Hogs & Pigs 64,000 1
Hay, All, Ton 2,400 1.9 4,600 15 2011 Broilers Raised (000) 8,900 8
Peanuts, Lbs. 2,750 3,542 9,740,000 8 2011 Turkeys Raised (000) * *
Soybeans, Bu. 30,900 24.1 744,000 4 2011 Cash Receipts Dollars (000) Rank
Tobacco, F.C., Lbs. 490 1,880 920,000 6 Crops 41,634 12
Wheat, Winter, Bu. 18,800 68.1 1,280,000 1 Livestock 42,416 14
*Not Published separately due to established agency guidelines. Total 84,050 13
DORCHESTER
CENSUS: Farms 377
Land In Farms 65,008 Acres
Average Farm Size 172 Acres
2011 Crops Acres
Harvested Yield Production SC
Rank
Livestock and Livestock Products Number
SC Rank
Corn For Grain, Bu. 6,800 40.4 275,000 19 Jan. 1, 2012 All Cattle & Calves 3,000 29T
Cotton, Lb. & Bales 8,600 848 15,200 13 Dec. 1, 2011 All Hogs & Pigs 4,600 7
Hay, All, Ton 1,900 2.25 4,300 16 2011 Broilers Raised (000) 3,150 18
Peanuts, Lbs. * * * * 2011 Turkeys Raised (000) * *
Soybeans, Bu. 4,100 28.5 117,000 13 2011 Cash Receipts Dollars (000) Rank
Tobacco, F.C., Lbs. * * * * Crops 13,832 30
Wheat, Winter, Bu. 1,200 43.3 52,000 21 Livestock 14,256 26
*Not Published separately due to established agency guidelines. Total 28,088 32
EDGEFIELD
CENSUS: Farms 407
Land In Farms 76,606 Acres
Average Farm Size 188 Acres
2011 Crops Acres
Harvested Yield Production SC
Rank
Livestock and Livestock Products Number
SC Rank
Corn For Grain, Bu. * * * * Jan. 1, 2012 All Cattle & Calves 7,800 18
Cotton, Lb. & Bales * * * * Dec. 1, 2011 All Hogs & Pigs * * Hay, All, Ton 4,900 1.4 6,900 12 2011 Broilers Raised (000) 1,050 20
Peanuts, Lbs. * * * * 2011 Turkeys Raised (000) * *
Soybeans, Bu. 1,300 11.5 15,000 28 2011 Cash Receipts Dollars (000) Rank Tobacco, F.C., Lbs. * * * * Crops 59,308 3
Wheat, Winter, Bu. * * * * Livestock 10,497 30
*Not Published separately due to established agency guidelines. Total 69,805 16

-61-
FAIRFIELD
CENSUS: Farms 187
Land In Farms 51,862 Acres
Average Farm Size 277 Acres
2011 Crops Acres
Harvested Yield Production SC
Rank
Livestock and Livestock Products Number
SC Rank
Corn For Grain, Bu. * * * * Jan. 1, 2012 All Cattle & Calves 5,700 22T
Cotton, Lb. & Bales * * * * Dec. 1, 2011 All Hogs & Pigs * *
Hay, All, Ton * * * * 2011 Broilers Raised (000) * *
Peanuts, Lbs. * * * * 2011 Turkeys Raised (000) 690 8
Soybeans, Bu. * * * * 2011 Cash Receipts Dollars (000) Rank
Tobacco, F.C., Lbs. * * * * Crops 1,067 44
Wheat, Winter, Bu. * * * * Livestock 20,841 22
*Not Published separately due to established agency guidelines. Total 21,908 37
FLORENCE
CENSUS: Farms 675
Land In Farms 158,717 Acres
Average Farm Size 235 Acres
2011 Crops Acres
Harvested Yield Production SC
Rank
Livestock and Livestock Products Number
SC Rank
Corn For Grain, Bu. 23,800 42.9 1,020,000 7 Jan. 1, 2012 All Cattle & Calves 3,400 27
Cotton, Lb. & Bales 15,900 833 27,600 7 Dec. 1, 2011 All Hogs & Pigs 300 14T
Hay, All, Ton * * * * 2011 Broilers Raised (000) * *
Peanuts, Lbs. * * * * 2011 Turkeys Raised (000) * *
Soybeans, Bu. 37,900 23.6 896,000 1 2011 Cash Receipts Dollars (000) Rank
Tobacco, F.C., Lbs. 1,500 2,155 3,230,000 2 Crops 47,476 10
Wheat, Winter, Bu. 11,200 54.6 611,000 8 Livestock 11,478 29
*Not Published separately due to established agency guidelines. Total 58,954 18
GEORGETOWN
CENSUS: Farms 252
Land In Farms 57,647 Acres
Average Farm Size 229 Acres
2011 Crops Acres
Harvested Yield Production SC
Rank
Livestock and Livestock Products Number
SC Rank
Corn For Grain, Bu. 1,600 34.4 55,000 25 Jan. 1, 2012 All Cattle & Calves 1,100 35T
Cotton, Lb. & Bales * * * * Dec. 1, 2011 All Hogs & Pigs * *
Hay, All, Ton * * * * 2011 Broilers Raised (000) * *
Peanuts, Lbs. * * * * 2011 Turkeys Raised (000) * *
Soybeans, Bu. * * * * 2011 Cash Receipts Dollars (000) Rank
Tobacco, F.C., Lbs. 740 1,745 1,290,000 5 Crops 27,237 17
Wheat, Winter, Bu. * * * * Livestock 1,455 43
*Not Published separately due to established agency guidelines. Total 28,691 30

-62-
GREENVILLE CENSUS: Farms
1,100 Land In Farms 72,645 Acres
Average Farm Size 66 Acres
2011 Crops Acres
Harvested Yield Production SC
Rank
Livestock and Livestock Products Number
SC Rank
Corn For Grain, Bu. * * * * Jan. 1, 2012 All Cattle & Calves 7,500 19
Cotton, Lb. & Bales * * * * Dec. 1, 2011 All Hogs & Pigs 400 13T
Hay, All, Ton * * * * 2011 Broilers Raised (000) * *
Peanuts, Lbs. * * * * 2011 Turkeys Raised (000) * *
Soybeans, Bu. * * * * 2011 Cash Receipts Dollars (000) Rank
Tobacco, F.C., Lbs. * * * * Crops 22,165 21
Wheat, Winter, Bu. * * * * Livestock 6,059 35
*Not Published separately due to established agency guidelines. Total 28,225 31
GREENWOOD
CENSUS: Farms 493
Land In Farms 70,698 Acres
Average Farm Size 143 Acres
2011 Crops Acres
Harvested Yield Production SC
Rank
Livestock and Livestock Products Number
SC Rank
Corn For Grain, Bu. * * * * Jan. 1, 2012 All Cattle & Calves 9,400 15
Cotton, Lb. & Bales * * * * Dec. 1, 2011 All Hogs & Pigs * *
Hay, All, Ton * * * * 2011 Broilers Raised (000) * *
Peanuts, Lbs. * * * * 2011 Turkeys Raised (000) * *
Soybeans, Bu. * * * * 2011 Cash Receipts Dollars (000) Rank
Tobacco, F.C., Lbs. * * * * Crops 1,269 43
Wheat, Winter, Bu. * * * * Livestock 8,315 33
*Not Published separately due to established agency guidelines. Total 9,584 44
HAMPTON
CENSUS: Farms 295
Land In Farms 126,753 Acres
Average Farm Size 430 Acres
2011 Crops Acres
Harvested Yield Production SC
Rank
Livestock and Livestock Products Number
SC Rank
Corn For Grain, Bu. 6,700 57.5 385,000 15 Jan. 1, 2012 All Cattle & Calves 2,300 31T
Cotton, Lb. & Bales 12,300 843 21,600 9 Dec. 1, 2011 All Hogs & Pigs 100 16T
Hay, All, Ton * * * * 2011 Broilers Raised (000) * *
Peanuts, Lbs. 4,800 3,371 16,180,000 3 2011 Turkeys Raised (000) * *
Soybeans, Bu. 4,500 24.4 100,000 14 2011 Cash Receipts Dollars (000) Rank
Tobacco, F.C., Lbs. * * * * Crops 20,626 25
Wheat, Winter, Bu. 1,900 46.8 89,000 18 Livestock 3,593 39
*Not Published separately due to established agency guidelines. Total 24,219 36

-63-
HORRY
CENSUS: Farms 914
Land In Farms 163,622 Acres
Average Farm Size 179 Acres
2011 Crops Acres
Harvested Yield Production SC
Rank
Livestock and Livestock Products Number
SC Rank
Corn For Grain, Bu. 26,600 34.6 920,000 8 Jan. 1, 2012 All Cattle & Calves 9,600 14
Cotton, Lb. & Bales 6,700 903 12,600 15 Dec. 1, 2011 All Hogs & Pigs 30,000 2
Hay, All, Ton * * * * 2011 Broilers Raised (000) 3,600 17
Peanuts, Lbs. 5,400 2,806 15,150,000 4 2011 Turkeys Raised (000) * *
Soybeans, Bu. 28,200 22.8 644,000 6 2011 Cash Receipts Dollars (000) Rank
Tobacco, F.C., Lbs. 8,120 1,505 12,230,000 1 Crops 55,085 5
Wheat, Winter, Bu. 9,700 40.9 397,000 10 Livestock 20,448 23
*Not Published separately due to established agency guidelines. Total 75,533 15
JASPER
CENSUS: Farms 109
Land In Farms 52,132 Acres
Average Farm Size 478 Acres
2011 Crops Acres
Harvested Yield Production SC
Rank
Livestock and Livestock Products Number
SC Rank
Corn For Grain, Bu. * * * * Jan. 1, 2012 All Cattle & Calves 800 36
Cotton, Lb. & Bales * * * * Dec. 1, 2011 All Hogs & Pigs * *
Hay, All, Ton * * * * 2011 Broilers Raised (000) * *
Peanuts, Lbs. * * * * 2011 Turkeys Raised (000) * *
Soybeans, Bu. * * * * 2011 Cash Receipts Dollars (000) Rank
Tobacco, F.C., Lbs. * * * * Crops 9,662 33
Wheat, Winter, Bu. * * * * Livestock 693 46
*Not Published separately due to established agency guidelines. Total 10,355 43
KERSHAW
CENSUS: Farms 499
Land In Farms 85,527 Acres
Average Farm Size 171 Acres
2011 Crops Acres
Harvested Yield Production SC
Rank
Livestock and Livestock Products Number
SC Rank
Corn For Grain, Bu. 2,800 77.5 217,000 20 Jan. 1, 2012 All Cattle & Calves 4,500 24T
Cotton, Lb. & Bales * * * * Dec. 1, 2011 All Hogs & Pigs * *
Hay, All, Ton 2,900 2.1 6,100 14 2011 Broilers Raised (000) * *
Peanuts, Lbs. * * * * 2011 Turkeys Raised (000) 2,700 1
Soybeans, Bu. 2,500 26 65,000 18 2011 Cash Receipts Dollars (000) Rank
Tobacco, F.C., Lbs. * * * * Crops 4,295 37
Wheat, Winter, Bu. 1,500 52.7 79,000 19 Livestock 106,471 3
*Not Published separately due to established agency guidelines. Total 110,766 4
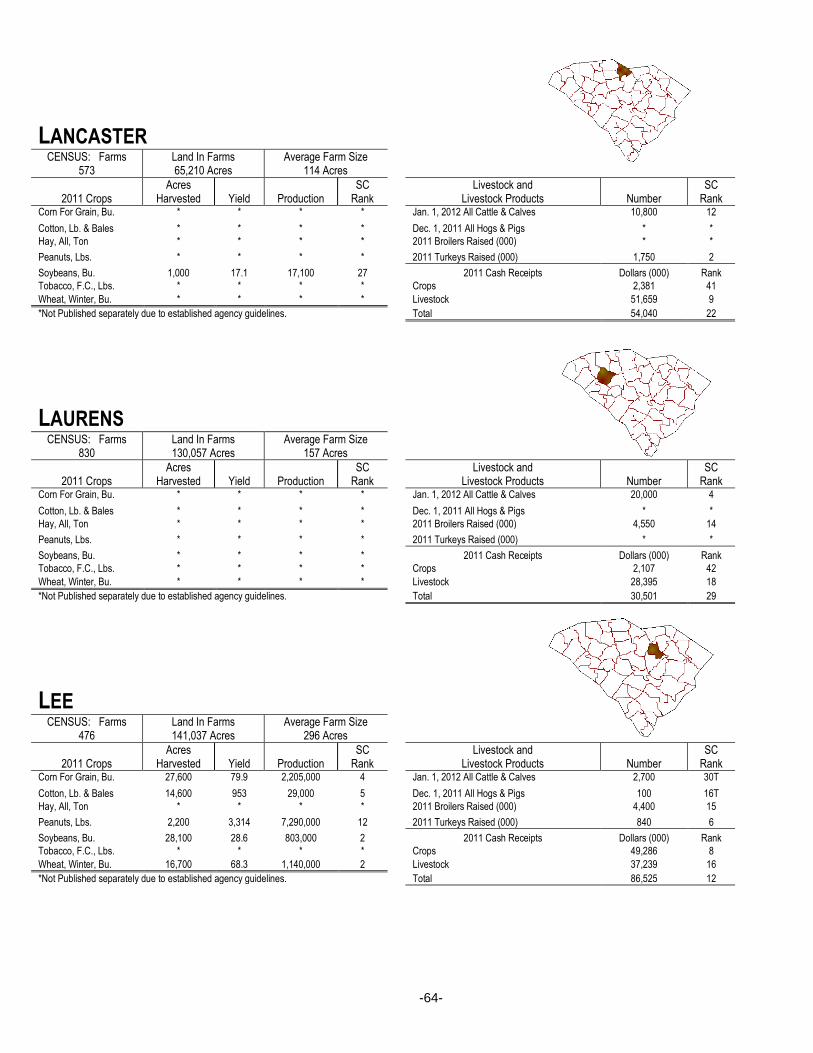
-64-
LANCASTER
CENSUS: Farms 573
Land In Farms 65,210 Acres
Average Farm Size 114 Acres
2011 Crops Acres
Harvested Yield Production SC
Rank
Livestock and Livestock Products Number
SC Rank
Corn For Grain, Bu. * * * * Jan. 1, 2012 All Cattle & Calves 10,800 12
Cotton, Lb. & Bales * * * * Dec. 1, 2011 All Hogs & Pigs * *
Hay, All, Ton * * * * 2011 Broilers Raised (000) * *
Peanuts, Lbs. * * * * 2011 Turkeys Raised (000) 1,750 2
Soybeans, Bu. 1,000 17.1 17,100 27 2011 Cash Receipts Dollars (000) Rank
Tobacco, F.C., Lbs. * * * * Crops 2,381 41
Wheat, Winter, Bu. * * * * Livestock 51,659 9
*Not Published separately due to established agency guidelines. Total 54,040 22
LAURENS
CENSUS: Farms 830
Land In Farms 130,057 Acres
Average Farm Size 157 Acres
2011 Crops Acres
Harvested Yield Production SC
Rank
Livestock and Livestock Products Number
SC Rank
Corn For Grain, Bu. * * * * Jan. 1, 2012 All Cattle & Calves 20,000 4
Cotton, Lb. & Bales * * * * Dec. 1, 2011 All Hogs & Pigs * *
Hay, All, Ton * * * * 2011 Broilers Raised (000) 4,550 14
Peanuts, Lbs. * * * * 2011 Turkeys Raised (000) * *
Soybeans, Bu. * * * * 2011 Cash Receipts Dollars (000) Rank
Tobacco, F.C., Lbs. * * * * Crops 2,107 42
Wheat, Winter, Bu. * * * * Livestock 28,395 18
*Not Published separately due to established agency guidelines. Total 30,501 29
LEE
CENSUS: Farms 476
Land In Farms 141,037 Acres
Average Farm Size 296 Acres
2011 Crops Acres
Harvested Yield Production SC
Rank
Livestock and Livestock Products Number
SC Rank
Corn For Grain, Bu. 27,600 79.9 2,205,000 4 Jan. 1, 2012 All Cattle & Calves 2,700 30T
Cotton, Lb. & Bales 14,600 953 29,000 5 Dec. 1, 2011 All Hogs & Pigs 100 16T
Hay, All, Ton * * * * 2011 Broilers Raised (000) 4,400 15
Peanuts, Lbs. 2,200 3,314 7,290,000 12 2011 Turkeys Raised (000) 840 6
Soybeans, Bu. 28,100 28.6 803,000 2 2011 Cash Receipts Dollars (000) Rank
Tobacco, F.C., Lbs. * * * * Crops 49,286 8
Wheat, Winter, Bu. 16,700 68.3 1,140,000 2 Livestock 37,239 16
*Not Published separately due to established agency guidelines. Total 86,525 12

-65-
LEXINGTON
CENSUS: Farms 948
Land In Farms 90,324 Acres
Average Farm Size 95 Acres
2011 Crops Acres
Harvested Yield Production SC
Rank
Livestock and Livestock Products Number
SC Rank
Corn For Grain, Bu. 5,800 57.8 335,000 17 Jan. 1, 2012 All Cattle & Calves 8,600 16
Cotton, Lb. & Bales * * * * Dec. 1, 2011 All Hogs & Pigs 200 15T
Hay, All, Ton 7,800 2.7 20,900 6 2011 Broilers Raised (000) 32,700 2
Peanuts, Lbs. * * * * 2011 Turkeys Raised (000) * *
Soybeans, Bu. 3,100 20 62,000 19 2011 Cash Receipts Dollars (000) Rank
Tobacco, F.C., Lbs. * * * * Crops 51,116 6
Wheat, Winter, Bu. * * * * Livestock 109,971 2
*Not Published separately due to established agency guidelines. Total 161,087 2
MCCORMICK
CENSUS: Farms 79
Land In Farms 24,934 Acres
Average Farm Size 316 Acres
2011 Crops Acres
Harvested Yield Production SC
Rank
Livestock and Livestock Products Number
SC Rank
Corn For Grain, Bu. * * * * Jan. 1, 2012 All Cattle & Calves 1,700 33
Cotton, Lb. & Bales * * * * Dec. 1, 2011 All Hogs & Pigs * *
Hay, All, Ton * * * * 2011 Broilers Raised (000) * *
Peanuts, Lbs. * * * * 2011 Turkeys Raised (000) * *
Soybeans, Bu. * * * * 2011 Cash Receipts Dollars (000) Rank
Tobacco, F.C., Lbs. * * * * Crops 624 46
Wheat, Winter, Bu. * * * * Livestock 2,561 42
*Not Published separately due to established agency guidelines. Total 3,185 46
MARION
CENSUS: Farms 308
Land In Farms 69,530 Acres
Average Farm Size 226 Acres
2011 Crops Acres
Harvested Yield Production SC
Rank
Livestock and Livestock Products Number
SC Rank
Corn For Grain, Bu. 10,500 51 535,000 12 Jan. 1, 2012 All Cattle & Calves 6,100 21
Cotton, Lb. & Bales 5,200 822 8,900 17 Dec. 1, 2011 All Hogs & Pigs *
Hay, All, Ton 2,500 3.1 7,800 2011 Broilers Raised (000) * *
Peanuts, Lbs. 3,700 3,414 12,630,000 6 2011 Turkeys Raised (000) * *
Soybeans, Bu. 12,000 27.2 326,000 10 2011 Cash Receipts Dollars (000) Rank
Tobacco, F.C., Lbs. 710 2,100 1,490,000 4 Crops 21,141 23
Wheat, Winter, Bu. 5,000 66.2 331,000 11 Livestock 4,136 37
*Not Published separately due to established agency guidelines. Total 25,278 35

-66-
MARLBORO
CENSUS: Farms 233
Land In Farms 122,522 Acres
Average Farm Size 526 Acres
2011 Crops Acres
Harvested Yield Production SC
Rank
Livestock and Livestock Products Number
SC Rank
Corn For Grain, Bu. 9,300 84.4 785,000 9 Jan. 1, 2012 All Cattle & Calves 3,000 29T
Cotton, Lb. & Bales 22,500 606 28,400 6 Dec. 1, 2011 All Hogs & Pigs 11,100 4
Hay, All, Ton * * * * 2011 Broilers Raised (000) 6,000 11
Peanuts, Lbs. 3,900 3,321 12,950,000 5 2011 Turkeys Raised (000) * *
Soybeans, Bu. 19,800 28.7 569,000 8 2011 Cash Receipts Dollars (000) Rank
Tobacco, F.C., Lbs. * * * * Crops 36,663 14
Wheat, Winter, Bu. 9,400 68.7 646,000 6 Livestock 21,489 20
*Not Published separately due to established agency guidelines. Total 59,152 19
NEWBERRY
CENSUS: Farms 614
Land In Farms 100,796 Acres
Average Farm Size 164 Acres
2011 Crops Acres
Harvested Yield Production SC
Rank
Livestock and Livestock Products Number
SC Rank
Corn For Grain, Bu. * * * * Jan. 1, 2012 All Cattle & Calves 23,000 3
Cotton, Lb. & Bales * * * * Dec. 1, 2011 All Hogs & Pigs 5,000 6
Hay, All, Ton 10,200 2.2 22,300 5 2011 Broilers Raised (000) 8,100 9
Peanuts, Lbs. * * * * 2011 Turkeys Raised (000) 700 7
Soybeans, Bu. 3,200 17.5 56,000 20 2011 Cash Receipts Dollars (000) Rank
Tobacco, F.C., Lbs. * * * * Crops 7,007 34
Wheat, Winter, Bu. 4,800 49 235,000 13 Livestock 94,483 4
*Not Published separately due to established agency guidelines. Total 101,490 7
OCONEE
CENSUS: Farms 804
Land In Farms 70,708 Acres
Average Farm Size 88 Acres
2011 Crops Acres
Harvested Yield Production SC
Rank
Livestock and Livestock Products Number
SC Rank
Corn For Grain, Bu. * * * * Jan. 1, 2012 All Cattle & Calves 14,400 9
Cotton, Lb. & Bales * * * * Dec. 1, 2011 All Hogs & Pigs 200 15T
Hay, All, Ton * * * * 2011 Broilers Raised (000) 38,600 1
Peanuts, Lbs. * * * * 2011 Turkeys Raised (000) * *
Soybeans, Bu. 1,100 18.6 20,500 26 2011 Cash Receipts Dollars (000) Rank
Tobacco, F.C., Lbs. * * * * Crops 5,467 36
Wheat, Winter, Bu. 800 30 24,000 23 Livestock 128,873 1
*Not Published separately due to established agency guidelines. Total 134,340 3

-67-
ORANGEBURG
CENSUS: Farms 1,002
Land In Farms 287,524 Acres
Average Farm Size 287 Acres
2011 Crops Acres
Harvested Yield Production SC
Rank
Livestock and Livestock Products Number
SC Rank
Corn For Grain, Bu. 30,000 85.8 2,575,000 3 Jan. 1, 2012 All Cattle & Calves 12,500 10
Cotton, Lb. & Bales 42,000 958 83,800 1 Dec. 1, 2011 All Hogs & Pigs 12,800 3
Hay, All, Ton 5,600 4 22,400 4 2011 Broilers Raised (000) 18,100 4
Peanuts, Lbs. 13,900 3,289 45,720,000 1 2011 Turkeys Raised (000) * *
Soybeans, Bu. 20,000 27.8 555,000 9 2011 Cash Receipts Dollars (000) Rank
Tobacco, F.C., Lbs. * * * * Crops 103,926 1
Wheat, Winter, Bu. 10,800 57.6 622,000 7 Livestock 79,164 6
*Not Published separately due to established agency guidelines. Total 183,090 1
PICKENS
CENSUS: Farms 829
Land In Farms 51,264 Acres
Average Farm Size 62 Acres
2011 Crops Acres
Harvested Yield Production SC
Rank
Livestock and Livestock Products Number
SC Rank
Corn For Grain, Bu. * * * * Jan. 1, 2012 All Cattle & Calves 8,200 17
Cotton, Lb. & Bales * * * * Dec. 1, 2011 All Hogs & Pigs 100 16T
Hay, All, Ton * * * * 2011 Broilers Raised (000) * *
Peanuts, Lbs. * * * * 2011 Turkeys Raised (000) * *
Soybeans, Bu. * * * * 2011 Cash Receipts Dollars (000) Rank
Tobacco, F.C., Lbs. * * * * Crops 5,950 35
Wheat, Winter, Bu. * * * * Livestock 4,988 36
*Not Published separately due to established agency guidelines. Total 10,938 42
RICHLAND
CENSUS: Farms 364
Land In Farms 58,805 Acres
Average Farm Size 162 Acres
2011 Crops Acres
Harvested Yield Production SC
Rank
Livestock and Livestock Products Number
SC Rank
Corn For Grain, Bu. 5,100 121.6 620,000 11 Jan. 1, 2012 All Cattle & Calves 2,200 32
Cotton, Lb. & Bales * * * * Dec. 1, 2011 All Hogs & Pigs * *
Hay, All, Ton * * * * 2011 Broilers Raised (000) * *
Peanuts, Lbs. * * * * 2011 Turkeys Raised (000) * *
Soybeans, Bu. * * * * 2011 Cash Receipts Dollars (000) Rank
Tobacco, F.C., Lbs. * * * * Crops 12,078 32
Wheat, Winter, Bu. * * * * Livestock 7,507 34
*Not Published separately due to established agency guidelines. Total 19,586 39

-68-
SALUDA
CENSUS: Farms 606
Land In Farms 109,791 Acres
Average Farm Size 181 Acres
2011 Crops Acres
Harvested Yield Production SC
Rank
Livestock and Livestock Products Number
SC Rank
Corn For Grain, Bu. 600 58.2 34,900 27 Jan. 1, 2012 All Cattle & Calves 25,000 2
Cotton, Lb. & Bales * * * * Dec. 1, 2011 All Hogs & Pigs 1,100 11
Hay, All, Ton 18,900 2.95 56,000 1 2011 Broilers Raised (000) 15,100 5
Peanuts, Lbs. * * * * 2011 Turkeys Raised (000) * *
Soybeans, Bu. * * * * 2011 Cash Receipts Dollars (000) Rank
Tobacco, F.C., Lbs. * * * * Crops 23,443 19
Wheat, Winter, Bu. 1,600 38.8 62,000 20 Livestock 71,494 7
*Not Published separately due to established agency guidelines. Total 94,937 9
SPARTANBURG
CENSUS: Farms 1,242
Land In Farms 109,917 Acres
Average Farm Size 89 Acres
2011 Crops Acres
Harvested Yield Production SC
Rank
Livestock and Livestock Products Number
SC Rank
Corn For Grain, Bu. 400 123.8 49,500 26 Jan. 1, 2012 All Cattle & Calves 15,400 7
Cotton, Lb. & Bales * * * * Dec. 1, 2011 All Hogs & Pigs * *
Hay, All, Ton * * * * 2011 Broilers Raised (000) * *
Peanuts, Lbs. * * * * 2011 Turkeys Raised (000) * *
Soybeans, Bu. 1,300 20.5 26,700 25 2011 Cash Receipts Dollars (000) Rank
Tobacco, F.C., Lbs. * * * * Crops 26,732 18
Wheat, Winter, Bu. 400 57.5 23,000 24 Livestock 21,022 21
*Not Published separately due to established agency guidelines. Total 47,754 23
SUMTER
CENSUS: Farms 554
Land In Farms 153,457 Acres
Average Farm Size 277 Acres
2011 Crops Acres
Harvested Yield Production SC
Rank
Livestock and Livestock Products Number
SC Rank
Corn For Grain, Bu. 31,200 90.9 2,835,000 1 Jan. 1, 2012 All Cattle & Calves 5,200 23T
Cotton, Lb. & Bales 6,600 953 13,100 14 Dec. 1, 2011 All Hogs & Pigs 1,500 10
Hay, All, Ton * * * * 2011 Broilers Raised (000) 5,200 12
Peanuts, Lbs. 950 3,689 3,505,000 14 2011 Turkeys Raised (000) 335 11
Soybeans, Bu. 23,400 27.2 636,000 7 2011 Cash Receipts Dollars (000) Rank
Tobacco, F.C., Lbs. * * * * Crops 48,487 9
Wheat, Winter, Bu. 15,200 62.8 955,000 4 Livestock 43,224 12
*Not Published separately due to established agency guidelines. Total 91,710 10
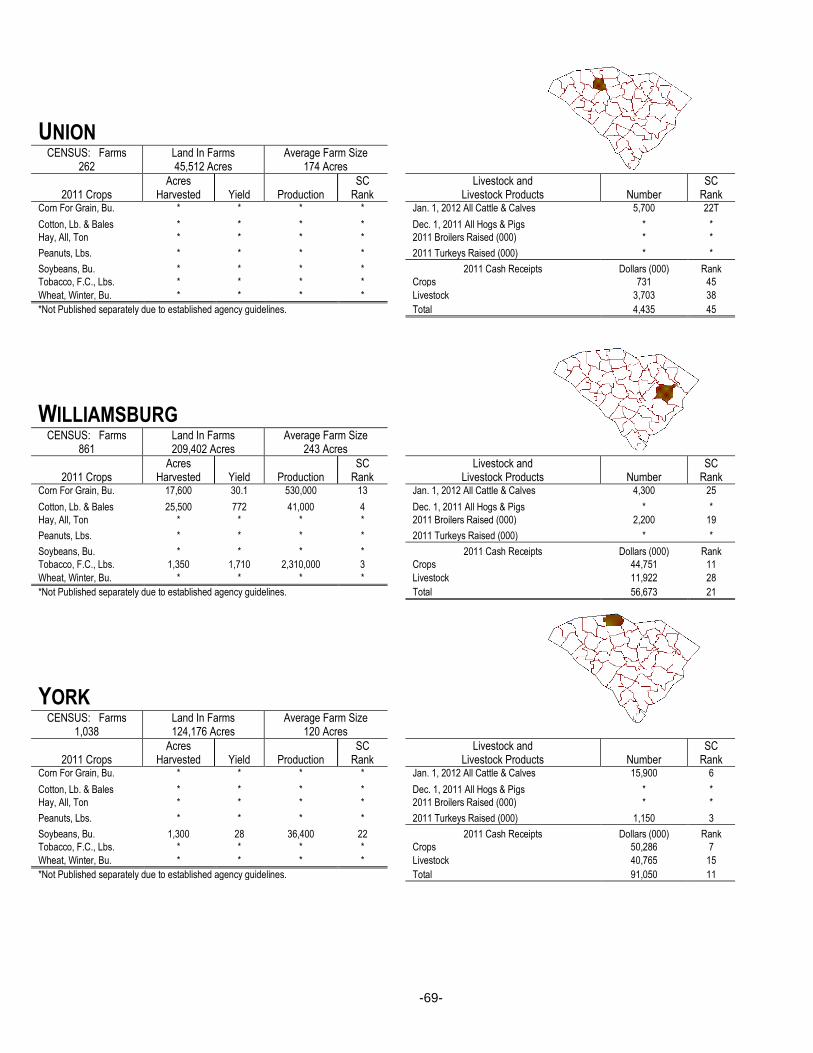
-69-
UNION
CENSUS: Farms 262
Land In Farms 45,512 Acres
Average Farm Size 174 Acres
2011 Crops Acres
Harvested Yield Production SC
Rank
Livestock and Livestock Products Number
SC Rank
Corn For Grain, Bu. * * * * Jan. 1, 2012 All Cattle & Calves 5,700 22T
Cotton, Lb. & Bales * * * * Dec. 1, 2011 All Hogs & Pigs * *
Hay, All, Ton * * * * 2011 Broilers Raised (000) * *
Peanuts, Lbs. * * * * 2011 Turkeys Raised (000) * *
Soybeans, Bu. * * * * 2011 Cash Receipts Dollars (000) Rank
Tobacco, F.C., Lbs. * * * * Crops 731 45
Wheat, Winter, Bu. * * * * Livestock 3,703 38
*Not Published separately due to established agency guidelines. Total 4,435 45
WILLIAMSBURG
CENSUS: Farms 861
Land In Farms 209,402 Acres
Average Farm Size 243 Acres
2011 Crops Acres
Harvested Yield Production SC
Rank
Livestock and Livestock Products Number
SC Rank
Corn For Grain, Bu. 17,600 30.1 530,000 13 Jan. 1, 2012 All Cattle & Calves 4,300 25
Cotton, Lb. & Bales 25,500 772 41,000 4 Dec. 1, 2011 All Hogs & Pigs * *
Hay, All, Ton * * * * 2011 Broilers Raised (000) 2,200 19
Peanuts, Lbs. * * * * 2011 Turkeys Raised (000) * *
Soybeans, Bu. * * * * 2011 Cash Receipts Dollars (000) Rank
Tobacco, F.C., Lbs. 1,350 1,710 2,310,000 3 Crops 44,751 11
Wheat, Winter, Bu. * * * * Livestock 11,922 28
*Not Published separately due to established agency guidelines. Total 56,673 21
YORK
CENSUS: Farms 1,038
Land In Farms 124,176 Acres
Average Farm Size 120 Acres
2011 Crops Acres
Harvested Yield Production SC
Rank
Livestock and Livestock Products Number
SC Rank
Corn For Grain, Bu. * * * * Jan. 1, 2012 All Cattle & Calves 15,900 6
Cotton, Lb. & Bales * * * * Dec. 1, 2011 All Hogs & Pigs * *
Hay, All, Ton * * * * 2011 Broilers Raised (000) * *
Peanuts, Lbs. * * * * 2011 Turkeys Raised (000) 1,150 3
Soybeans, Bu. 1,300 28 36,400 22 2011 Cash Receipts Dollars (000) Rank
Tobacco, F.C., Lbs. * * * * Crops 50,286 7
Wheat, Winter, Bu. * * * * Livestock 40,765 15
*Not Published separately due to established agency guidelines. Total 91,050 11
CLEMSON COOPERATIVE EXTENSION SERVICE OFFICES
The Extension Service provides informal education to residents of South Carolina as a function of the land-grant University. An office is located in each county. Its mission is to provide sound, scientifically-based information to South Carolinians and help them use that information to improve the quality of their lives. Major programming areas include agriculture and natural resources, home economics and family life, youth development and 4-H, and community development.
County Street Address Mailing Address Area Code
Telephone Number
Abbeville 265 Industrial Park Rd, Abbeville, SC 29620 PO Box 640 864 446-2276
Aiken 1555 Richland Ave, East, Ste 500, Aiken, SC 29801 803 649-6297
Allendale 398 Barnwell Hwy, Room 115, Allendale, SC 29810 PO Box 577 803 584-4207
Anderson 313 S. Towers St, Anderson, SC 29624 864 226-1581
Bamberg 847 Calhoun St, Bamberg, SC 29003 PO Box 299 803 245-2661
Barnwell 34 Pechmann St, Barnwell, SC 29812 PO Box 468 803 259-7141
Beaufort 102 Industrial Village Rd, Ste 101, Beaufort, SC 29906 843 255-6060
Berkeley 3014 Cypress Garden Rd, Moncks Corner, SC 29461 843 719-4140
Calhoun 904 FR Huff Dr, Ste 101, St. Matthews, SC 29135 PO Box 161 803 874-2354
Charleston 259 Meeting Street, Charleston, SC 29401 843 722-5940
Cherokee 1100 W. Floyd Baker Blvd, Gaffney, SC 29342 864 489-3141
Chester 109 Ella St, Chester, SC 29706 PO Box 548 803 385-6181
Chesterfield 101 Main St, Chesterfield County Courthouse Annex, Chesterfield, SC 29709
PO Box 149 843 623-2134
Clarendon 103 Sunset Dr, Manning, SC 29102 803 435-8429
Colleton 611 Black St, Walterboro, SC 29488 PO Box 1086 843 549-2595
Darlington 300 Russell St, Room 222, Darlington, SC 29532 843 393-0484
Dillon 200 S 5th
Ave, Dillon, SC 29536 PO Box 631 843 774-8218
Dorchester 201 Johnston St, St. George, SC 29477 843 832-0135
Edgefield 304 Gray St, Edgefield, SC 29824 803 637-3161
Fairfield JB Floyd Office Building, 96 US Hwy 321 South Winnsboro, SC 29180
803 635-4722
Florence 2685 S Irby St., Ste K, Florence, SC 29505 843 661-4800
Georgetown 731 Prince St, Georgetown, SC 29442 PO Box 1100 843 546-4481
Greenville Greenville County Square, 301 University Ridge Ste 4300, Greenville, SC 29601
864 232-4431
Greenwood 105 North University St, Greenwood, SC 29648 PO Box 246 864 223-3264
Hampton 200 East Jackson St, West, Hampton, SC 29924 PO Box 646 803 943-3427
Horry 1949 Industrial Park, Conway, SC 29526 843 365-6715
Jasper 1506 Grays Hwy, Suite E, Ridgeland, SC 29936 PO Box 1089 843 726-3461
Kershaw 632 W. DeKalb St, Camden, SC 29020 PO Box 248 803 432-9071
Lancaster 107 South French St, Lancaster, SC 29721 PO Box 1255 803 283-3302
Laurens 219 West Laurens St, Laurens, SC 29360 864 984-2514
Lee W L Bryant Ag Building, 5 Courthouse Square Bishopville, SC 29010
803 484-5416
Lexington 605 W. Main St, Ste 109, Lexington, SC 29072 803 359-8515
McCormick 610 South Mine St., McCormick, SC 29835 PO Box 1150 864 852-2112
Marion Beeson Bldg, 206 Airport Ct, Ste C, Mullins, SC 29574 843 423-8285
Marlboro 709 S. Parsonage St Ext, Marlboro CountyAg Building, Bennettsville, SC 29512
PO Box 80 843 479-6851
Newberry 1860 Wilson Rd, Newberry, SC 29108 PO Box 160 803 276-1091
Oconee 301C WS Broad St, Walhalla, SC 29691 864 638-5889
Orangeburg 1550 Henley St, Ste 200, Orangeburg, SC 29115 803 534-6280
Pickens 222 W Main St, Pickens, SC 29671 PO Box 995 864 878-1394
Richland 900 Clemson Rd, Columbia, SC 29224 PO Box 102406 803 865-1216
Saluda 201 E Church St, Saluda, SC 29138 864 445-8117
Spartanburg 612 Chesnee Hwy, Spartanburg, SC 29303 864 596-2993
Sumter 115 N Harvin St, 5th Floor, Sumter, SC 29150 803 773-5561
Union 120 Kirby St, Union, SC 29379 864 427-6259
Williamsburg 9 Court House Square, Kingstree, SC 29556 PO Box 700 843 355-6106
York 120 North Congress St, York, SC 29745 PO Box 669 803 684-9919
- 70 -

SOUTH CAROLINA ASSOCIATIONS AND COUNCILS
SOUTH CAROLINA APPLE GROWERS ASSOCIATION
SOUTH CAROLINA AQUACULTURE ASSOCIATION
SOUTH CAROLINA CATTLEMENS ASSOCIATION
SOUTH CAROLINA CHRISTMAS TREE GROWERS ASSOCIATION
SOUTH CAROLINA CORN AND SOYBEAN ASSOCIATION
SOUTH CAROLINA DAIRY ASSOCIATION
SOUTH CAROLINA FERTILIZER AND AGRICHEMICAL ASSOCIATION
SOUTH CAROLINA FRUIT/VEGETABLE SPECIALTY CROP ASSOCIATION
SOUTH CAROLINA HORSEMENS COUNCIL
SOUTH CAROLINA LANDSCAPE AND TURFGRASS ASSOCIATION
SOUTH CAROLINA LIVESTOCK MARKETS ASSOCIATION
SOUTH CAROLINA MEAT GOAT ASSOCIATION
SOUTH CAROLINA NURSERY AND LANDSCAPE ASSOCIATION
SOUTH CAROLINA PEACH COUNCIL
SOUTH CAROLINA POULTRY FEDERATION
SOUTH CAROLINA SEEDSMENS ASSOCIATION
SOUTH CAROLINA SHEEP INDUSTRIES ASSOCIATION
SOUTH CAROLINA SPECIALTY FOOD ASSOCIATION
SOUTH CAROLINA TOBACCO GROWERS ASSOCIATION
SOUTH CAROLINA TOMATO ASSOCIATION
SOUTH CAROLINA WATERMELON ASSOCIATION
- 71 -
SOUTH CAROLINA COMMODITY BOARDS
SOUTH CAROLINA BEEF BOARD
SOUTH CAROLINA COTTON BOARD
SOUTH CAROLINA PEANUT BOARD
SOUTH CAROLINA PORK BOARD
SOUTH CAROLINA SOYBEAN BOARD
SOUTH CAROLINA TOBACCO BOARD
SOUTH CAROLINA WATERMELON BOARD
The above commodity boards and the following associations and councils were listed by the South Carolina
Department of Agriculture prior to printing this publication. For the latest list of contacts, please refer to their
website:
www.scda.state.sc.us
If you do not have access to the internet, contact the following:
Wayne Mack
Director of Marketing and Promotion
803-734-2205
Martin Eubanks
Agriculture Commodities Representative
803-734-2221
- 72 -

AGRICULTURAL RELATED WEB SITES SOUTH CAROLINA
S. C. Department of Agriculture http://www.scda.state.sc.us
S. C. Farm Bureau http://www.scfb.org
Clemson Univ. Cooperative Ext. Service http://www.clemson.edu/extension
Coastal Research & Education Center http://www.clemson.edu/coastalrec
Edisto Research & Education Center http://www.clemson.edu/edisto
Pee Dee Research & Education Center http://www.clemson.edu/peedeerec
Sandhill Research & Education Center http://www.clemson.edu/sandhill/page.htm?pageId=1
S. C. Natural Resources Conservation Service http://www.sc.nrcs.usda.gov
S. C. Agricultural Statistics Service http://www.nass.usda.gov/sc
S. C. State University Extension http://www.scsu.edu
S. C. State Climatology Office http://www.dnr.sc.gov/climate/sco/index.php
S. C. Forest Service http://www.state.sc.us/forest
Ag. First Farm Credit Bank http://www.agfirst.com
S. C. Dept of Health & Environmental Control http://www.scdhec.net
S. C. Rural Development Council http://www.state.sc.us./scrdc
S. C. Horsemen=s Council http://www.schorsecouncil.org
NATIONAL / OTHER
United States Department of Agriculture http://www.usda.gov
National Agricultural Statistics Service http://www.usda.gov/nass
Farm Service Agency http://www.fsa.usda.gov
Risk Management Agency http://www.rma.usda.gov
National Resources Conservation Service http://www.nrcs.usda.gov
Economic Research Service http://www.ers.usda.gov
National Agricultural Library http://www.nalusda.gov
Joint Agricultural Weather Facility http://www.usda.gov/oce/weather/index.htm
National FFA Online http://www.ffa.org
Canadian Ag. Statistics http://www.statcan.ca
South Carolina Agricultural and Forestry Research System is a cooperative program funded from federal and state funds. Programs of the SCAFRS in cooperation with South Carolina State University and the U. S. Department of Agriculture are offered to
people of all ages, regardless of race, color, sex, religion, national origin, disability, political beliefs, sexual orientation, or marital or
family status. The SCAFRS is an equal opportunity employer.
- 73 -