Embed Size (px)
Citation preview
Summary
In recent years, there have been repeated recommendations- mainly in German technical publications - to control the beltspeed of conveyor systems. The level of filling ϕ of the belttrough with 100 % should serve as a basis for the control pro-cedure. This means that high utilization of the average trans-port capacity should always be aimed for, at an adapted,reduced belt speed. This type of operation is said to reduceenergy consumption and hence operating cost. This essaylooks critically at this recommendation. On the basis thatDIN 22101 applies to the design of belt conveyors and not toestablishing the fictitious resistance coefficient at differentbelt speeds or filling levels, the limiting quantities on themotion resistance of belt conveyors are described. Based onthe dependencies of individual resistances researched in rel-evant literature, simulation calculations for a fictitious beltconveyor are used to demonstrate that the fictitious resis-tance coefficient of belt conveyors largely depends on the fill-ing level ϕ and only to a small degree on the belt speed. Bymeans of the characteristic quantity “specific energy require-ment” it is demonstrated that speed control for the purpose ofenergy savings is inappropriate at traditional filling levels inthe range between 60 % and 100 %.
1 Introduction
Belt conveyors have proven themselves to be an excellentsolution for the transport of raw mineral materials and soil.Today, they are in most cases the most cost-effective solutionfor handling bulk material mass flows over short and mediumconveying distances. Despite the already advantageouscosts for belt conveyor operation, there is still a desire toreduce these costs even further.
Publication sources state that, in order to balance the fillinglevel, the belt speed should be controlled in accordance withthe load. As a result, energy consumption should decrease.Publications give the impression that a reduction of the
energy consumption by up to 30 % is possible, if, by control-ling the conveying speed with the nominal volume flow as aleading quantity, that is a filling level of 100 %, the belt con-veyor can also be operated if the volume flow is subject tofluctuations. In this context, publication sources mention cen-ter distances of more than 1400 m. In its summary, publica-tion sources also suggest that more a economical operationis achieved if variable-speed drives are used for belt convey-ors. In some publication sources, DIN 22101 is used as abasis for these statements.
Against this background, the author of this paper has beenasked by Voith Turbo to provide an expert’s opinion whether- universally applicable - the energy consumption of belt con-veyors is reduced and hence allows more economical opera-tion, if the filling level ϕ of the belt trough is utilized to 100 %.
2 Principle Calculation Methods toDetermine the Motion Resistance ofBelt Conveyors
The energy consumption of long, horizontal belt conveyorsystems in stationary operating conditions is determined bythe motion resistance in the loaded section of the belt and thereturn belt. This resistance consists of the running resistanceof the rolls supporting the belt, as well as the flexure resis-tance of the bulk material and the belt when running acrossthe supporting rolls. The energy required to overcome theseresistances is determined by a number of operative and con-structive characteristic properties. Compared to the otherresistances, overcoming differences in height requires a highamount of energy. Lifting masses to a different level here pri-marily determines the amount of energy required, and cantherefore not be influenced. Motion resistances are all forcesacting on the belt along the direction of transport, which haveto be overcome during the operation of the belt conveyor.
2.1 Calculation Methodper DIN 22101 - Overview
Following DIN 22101 motion resistances FW are divided into:
• Primary resistances FH
• Secondary resistances FN
• Gradient resistances FSt
368
H. Lauhoff, Germany
Speed Control on Belt Conveyors -Does it Really Save Energy?
Vol. 25 (2005) No. 6 • bulk solids handling
Dipl.-Ing HANS LAUHOFF, Ingenieurbüro Hans Lauhoff,Wessingweg 11, 59269 Beckum, Germany.Tel.: +49 (0) 2521 299 844 • Fax: +49 (0) 2521 299 843E-Mail: [email protected]
This paper as first presented at Beltcon 13, organized by the IMHCand held on 3rd - 4th August 2005 in Randburg, Rep. of South Africa.
Details about the author on page 412.
• Special resistances FS
It is thus:
FW = FH + FN + FSt + FS
Primary resistances FH
Primary resistances are all friction-related resistances alongthe belt conveyor, with the exception of special resistances.The primary resistances FHi on the individual section are, as amatter of simplification and under assumption of a linear rela-tion between resistances and the conveyed load for eachindividual section i, determined separately.
The sum of all individual sections forms the entire primaryresistance.
Secondary resistances FN
Secondary resistances are friction and inertia resistanceswhich occur only at certain parts of the belt conveyor. Theseinclude:
• Feeder resistance to goods Fauf [see Fig. 1, VIII, 5)]to be transported
• Friction resistance between FSchb [see Fig. 1, VII, 5)]transport goods and chute
• Friction resistance of FGr [see Fig. 1, V, 7)]belt cleaners
• Deflection resistance of [see Fig. 1, V and VI, (6)]belt at drums
The secondary resistances are independent of the length ofthe belt conveyor and are constant. With long center dis-tances, their significance declines compared to motion resis-tances distributed across the conveying track - the primary
resistances. If the proportion of secondary resistances withinthe total number of resistances is low, a general assumptionis permissible. The total sum of the secondary resistances istaken into consideration by the coefficient C.
For conveyors with a length of more than 1 000 m it is C ≤ 1.09.
Special resistances FS
Special resistances are resistances which do not occur at allbelt conveyors. These are especially the vertical resistance ofidlers, friction resistances outside feeder stations and resis-tances of the equipment used for feeding the bulk materialoutside if this happens along the conveying track.
Application area of DIN 22101
The norm DIN 22101 covers the fundamentals for the cal-culation and the design of belt conveyors for bulk materi-als. For the determination of the primary resistances, amathematical basis in accordance with COULOMB’s law offriction is used.
The force of the added weights of the moved masses of bulkmaterial, belt and idlers, multiplied by the fictitious resistancecoefficient f results in the primary resistance FH. The selectionof the fictitious resistance coefficient fi is of overriding impor-tance for the quantity of the primary resistances, especially ifthe gradient resistances tend to be low. According to thenorm, a range of values for the fictitious resistance coefficientis stated for different operating and plant parameters. Forthis, usually several marginal conditions are mentioned, fromwhich these values derive.
Parameters, such as fictitious resistance coefficient and loaddistribution of bulk materials, are assumed to be constant val-ues for the calculation of the primary resistances.
However, Alles already describes that, above all, the fictitiousresistance coefficient is not constant. Therefore, DIN 22101should not and cannot be used as an immediate calculationbasis for fluctuating operating conditions (Fig. 2).
369bulk solids handling • Vol. 25 (2005) No. 6
Speed Control on Belt Conveyors
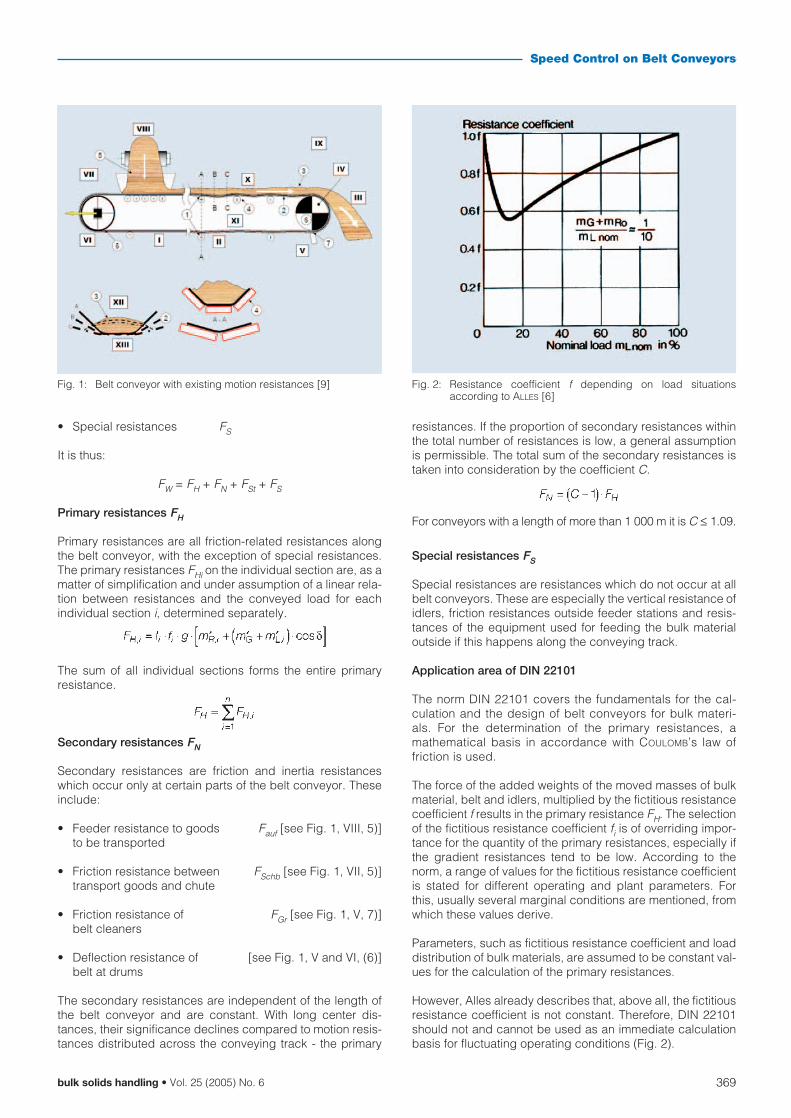
Fig. 1: Belt conveyor with existing motion resistances [9] Fig. 2: Resistance coefficient f depending on load situationsaccording to ALLES [6]
2.2 Single Resistance Method - Overview
A method for calculating the primary resistances, in which theindividual share of resistances, based on physical laws withpossibly all limiting quantities, are incorporated, was there-fore desirable for the establishment of this expert’s opinion.LACHMANN and VIERLING were the first to set up this method.
Primary resistance in single resistance method -overview from literature
The primary resistances FH are divided into two groups:
• Running resistance of idlers U' [see Fig. 1, (4)]
• Flexure resistances U" [see Fig. 1, XII, XIII (2), (3)]
And the latter again into:
• Indentation resistance of belt UE" [see Fig. 1, (1)]
• Belt flexure resistance UG" [see Fig. 1, XII (2)]
• Transport load flexure resistance UL" [see Fig. 1, XIII (3)]
The motion resistances FW are therefore established as men-tioned in the paper.
During the last decades, numerous scientific works dealt withthis differentiation when calculating single resistances. Dueto the complicated influence of constructive, technologicaland operating characteristics affecting the flexure resistance,the single resistance method for establishing the primary
resistance did not gain acceptance in the past. There wasalso a lack of individual characteristic quantities which wouldallow an accurate prognosis of the actual quantity of the sin-gle resistances prior to realizing the plant.
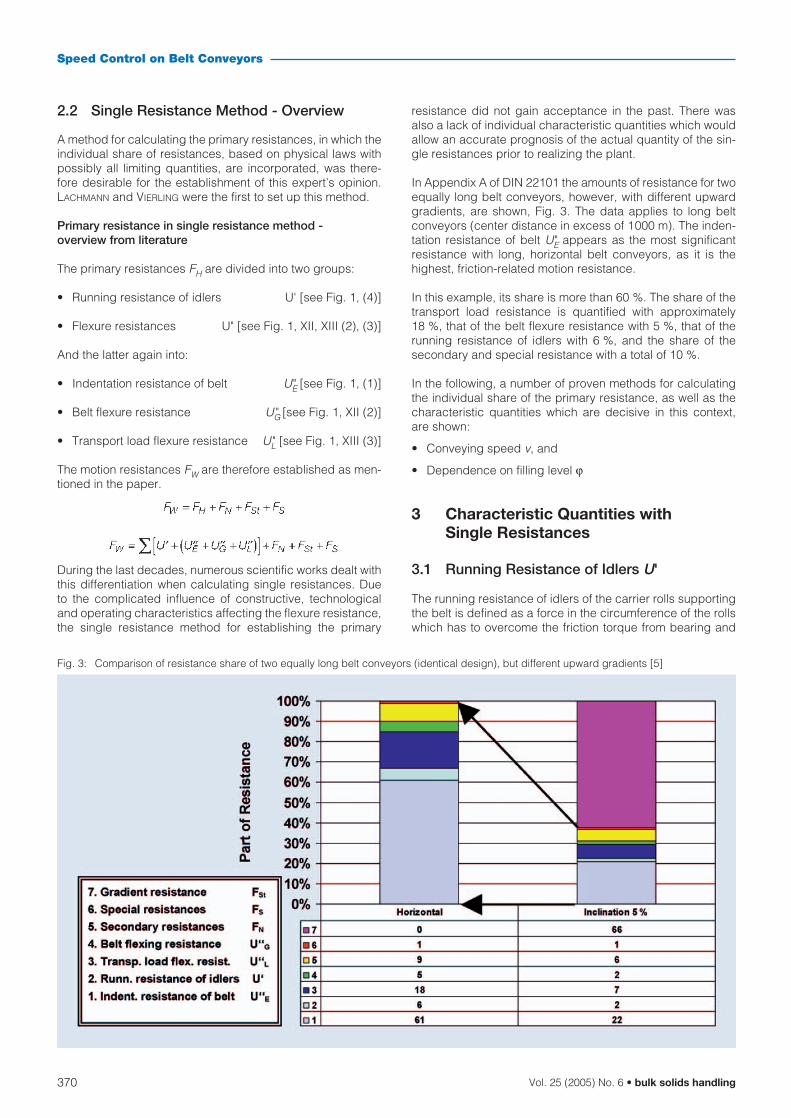
In Appendix A of DIN 22101 the amounts of resistance for twoequally long belt conveyors, however, with different upwardgradients, are shown, Fig. 3. The data applies to long beltconveyors (center distance in excess of 1000 m). The inden-tation resistance of belt UE" appears as the most significantresistance with long, horizontal belt conveyors, as it is thehighest, friction-related motion resistance.
In this example, its share is more than 60 %. The share of thetransport load resistance is quantified with approximately18 %, that of the belt flexure resistance with 5 %, that of therunning resistance of idlers with 6 %, and the share of thesecondary and special resistance with a total of 10 %.
In the following, a number of proven methods for calculatingthe individual share of the primary resistance, as well as thecharacteristic quantities which are decisive in this context,are shown:
• Conveying speed v, and
• Dependence on filling level ϕ
3 Characteristic Quantities withSingle Resistances
3.1 Running Resistance of Idlers U'
The running resistance of idlers of the carrier rolls supportingthe belt is defined as a force in the circumference of the rollswhich has to overcome the friction torque from bearing and
370 Vol. 25 (2005) No. 6 • bulk solids handling
Speed Control on Belt Conveyors
Fig. 3: Comparison of resistance share of two equally long belt conveyors (identical design), but different upward gradients [5]
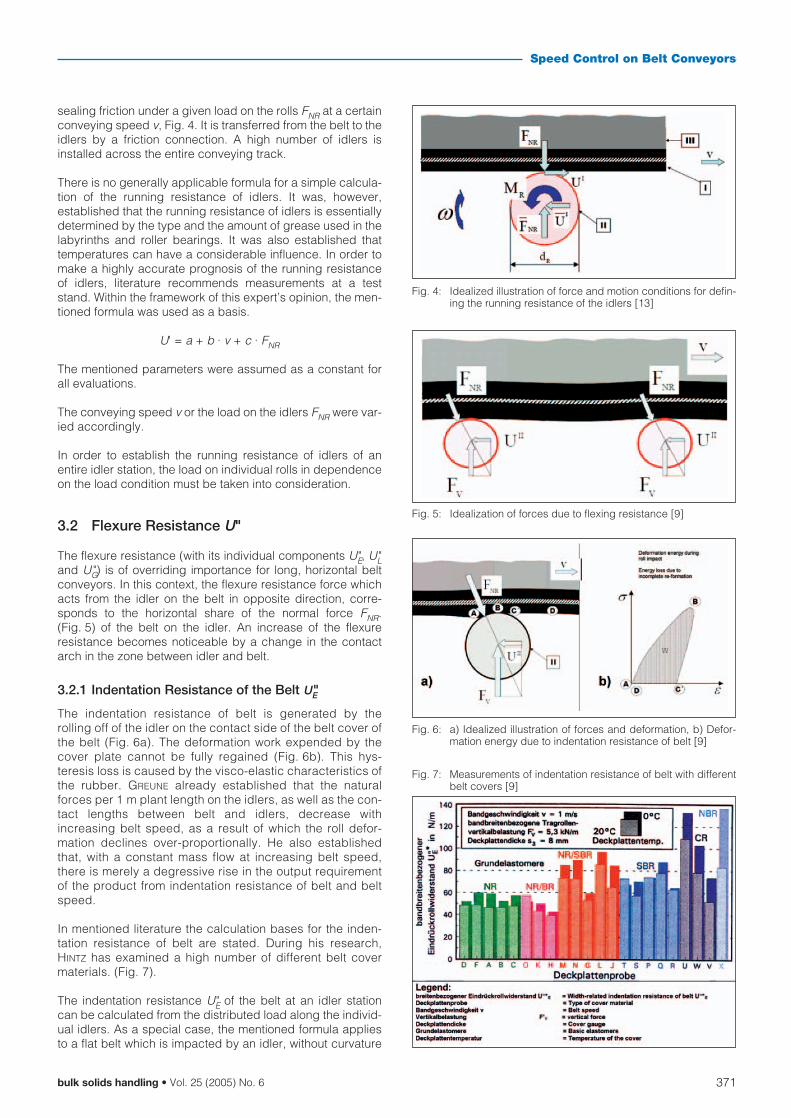
sealing friction under a given load on the rolls FNR at a certainconveying speed v, Fig. 4. It is transferred from the belt to theidlers by a friction connection. A high number of idlers isinstalled across the entire conveying track.
There is no generally applicable formula for a simple calcula-tion of the running resistance of idlers. It was, however,established that the running resistance of idlers is essentiallydetermined by the type and the amount of grease used in thelabyrinths and roller bearings. It was also established thattemperatures can have a considerable influence. In order tomake a highly accurate prognosis of the running resistanceof idlers, literature recommends measurements at a teststand. Within the framework of this expert’s opinion, the men-tioned formula was used as a basis.
U' = a + b · v + c · FNR
The mentioned parameters were assumed as a constant forall evaluations.
The conveying speed v or the load on the idlers FNR were var-ied accordingly.
In order to establish the running resistance of idlers of anentire idler station, the load on individual rolls in dependenceon the load condition must be taken into consideration.
3.2 Flexure Resistance U"
The flexure resistance (with its individual components UE", UL"and UG") is of overriding importance for long, horizontal beltconveyors. In this context, the flexure resistance force whichacts from the idler on the belt in opposite direction, corre-sponds to the horizontal share of the normal force FNR.(Fig. 5) of the belt on the idler. An increase of the flexureresistance becomes noticeable by a change in the contactarch in the zone between idler and belt.
3.2.1 Indentation Resistance of the Belt UE"
The indentation resistance of belt is generated by therolling off of the idler on the contact side of the belt cover ofthe belt (Fig. 6a). The deformation work expended by thecover plate cannot be fully regained (Fig. 6b). This hys-teresis loss is caused by the visco-elastic characteristics ofthe rubber. GREUNE already established that the naturalforces per 1 m plant length on the idlers, as well as the con-tact lengths between belt and idlers, decrease withincreasing belt speed, as a result of which the roll defor-mation declines over-proportionally. He also establishedthat, with a constant mass flow at increasing belt speed,there is merely a degressive rise in the output requirementof the product from indentation resistance of belt and beltspeed.
In mentioned literature the calculation bases for the inden-tation resistance of belt are stated. During his research,HINTZ has examined a high number of different belt covermaterials. (Fig. 7).
The indentation resistance UE" of the belt at an idler stationcan be calculated from the distributed load along the individ-ual idlers. As a special case, the mentioned formula appliesto a flat belt which is impacted by an idler, without curvature
371bulk solids handling • Vol. 25 (2005) No. 6
Speed Control on Belt Conveyors
Fig. 4: Idealized illustration of force and motion conditions for defin-ing the running resistance of the idlers [13]
Fig. 5: Idealization of forces due to flexing resistance [9]
Fig. 6: a) Idealized illustration of forces and deformation, b) Defor-mation energy due to indentation resistance of belt [9]
Fig. 7: Measurements of indentation resistance of belt with differentbelt covers [9]
and a constant load for the indentation resistance of beltacross the belt width.
where:
cE cover plate-specific constant
d idler diameter
FV vertical load on idlers
bR contact length between idler and belt
Analog to the fictitious friction coefficient according to DIN22101, the indentation resistance of belt divided by verticalload of idlers is equal to the fictitious friction coefficient fE ofthe indentation resistance of belt.
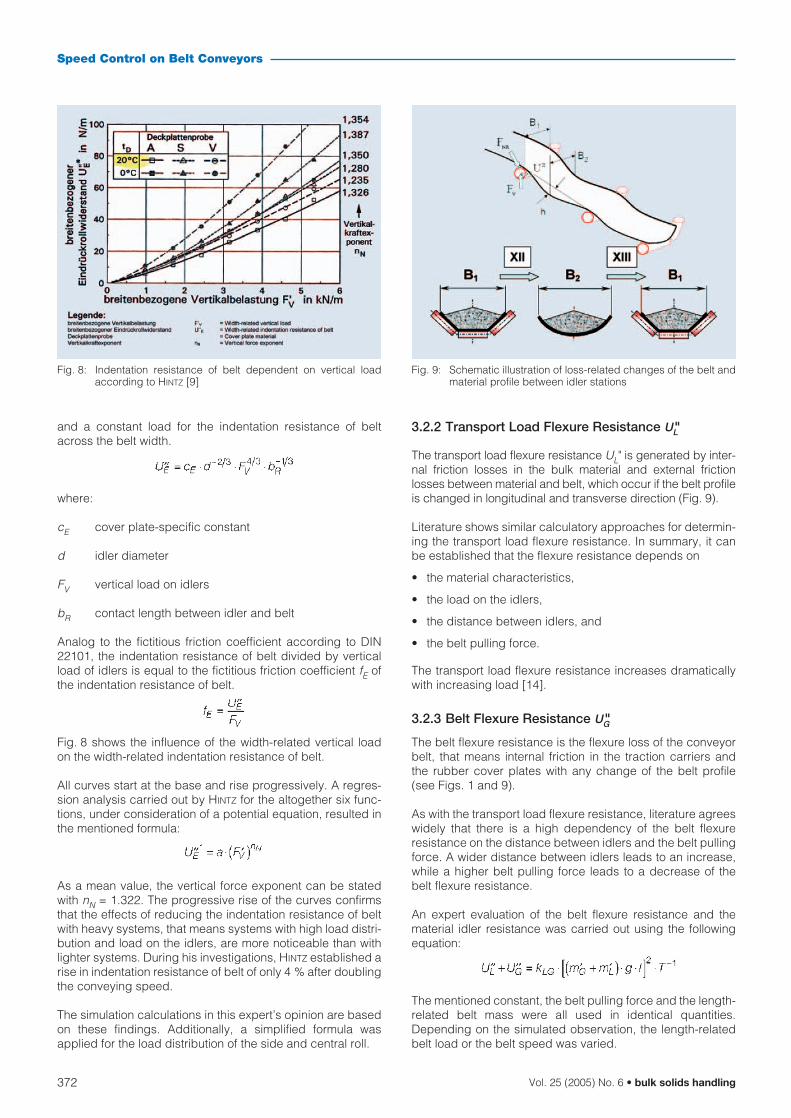
Fig. 8 shows the influence of the width-related vertical loadon the width-related indentation resistance of belt.
All curves start at the base and rise progressively. A regres-sion analysis carried out by HINTZ for the altogether six func-tions, under consideration of a potential equation, resulted inthe mentioned formula:
As a mean value, the vertical force exponent can be statedwith nN = 1.322. The progressive rise of the curves confirmsthat the effects of reducing the indentation resistance of beltwith heavy systems, that means systems with high load distri-bution and load on the idlers, are more noticeable than withlighter systems. During his investigations, HINTZ established arise in indentation resistance of belt of only 4 % after doublingthe conveying speed.
The simulation calculations in this expert’s opinion are basedon these findings. Additionally, a simplified formula wasapplied for the load distribution of the side and central roll.
3.2.2 Transport Load Flexure Resistance UL"
The transport load flexure resistance UL" is generated by inter-nal friction losses in the bulk material and external frictionlosses between material and belt, which occur if the belt profileis changed in longitudinal and transverse direction (Fig. 9).
Literature shows similar calculatory approaches for determin-ing the transport load flexure resistance. In summary, it canbe established that the flexure resistance depends on
• the material characteristics,
• the load on the idlers,
• the distance between idlers, and
• the belt pulling force.
The transport load flexure resistance increases dramaticallywith increasing load [14].
3.2.3 Belt Flexure Resistance UG"
The belt flexure resistance is the flexure loss of the conveyorbelt, that means internal friction in the traction carriers andthe rubber cover plates with any change of the belt profile(see Figs. 1 and 9).
As with the transport load flexure resistance, literature agreeswidely that there is a high dependency of the belt flexureresistance on the distance between idlers and the belt pullingforce. A wider distance between idlers leads to an increase,while a higher belt pulling force leads to a decrease of thebelt flexure resistance.
An expert evaluation of the belt flexure resistance and thematerial idler resistance was carried out using the followingequation:
The mentioned constant, the belt pulling force and the length-related belt mass were all used in identical quantities.Depending on the simulated observation, the length-relatedbelt load or the belt speed was varied.
372 Vol. 25 (2005) No. 6 • bulk solids handling
Speed Control on Belt Conveyors
Fig. 8: Indentation resistance of belt dependent on vertical loadaccording to HINTZ [9]
Fig. 9: Schematic illustration of loss-related changes of the belt andmaterial profile between idler stations
4 Evaluation of Literature -Assessment Using a CalculationExample by Means of the SpecificEnergy Consumption
In order to provide a satisfactory answers to the issues dis-cussed in this expert’s opinion, it was not primarily a matter ofmaking exact statements on the actual primary resistance.
Instead, it was perfectly sufficient, deriving from a fictitiousnominal mass flow of a fictitious belt conveyor with a fillinglevel of 100 % and a belt speed of vnenn to
• (fictitiously) reduce the mass flow in such a way, and
• assume it of being the same size,
that on the one hand:
Case A: the filling level ϕ reduces and the conveying speedvnenn remains constant,
and on the other hand,
Case B: the filling level ϕ remains constant at 100 % and theconveying speed v reduces.
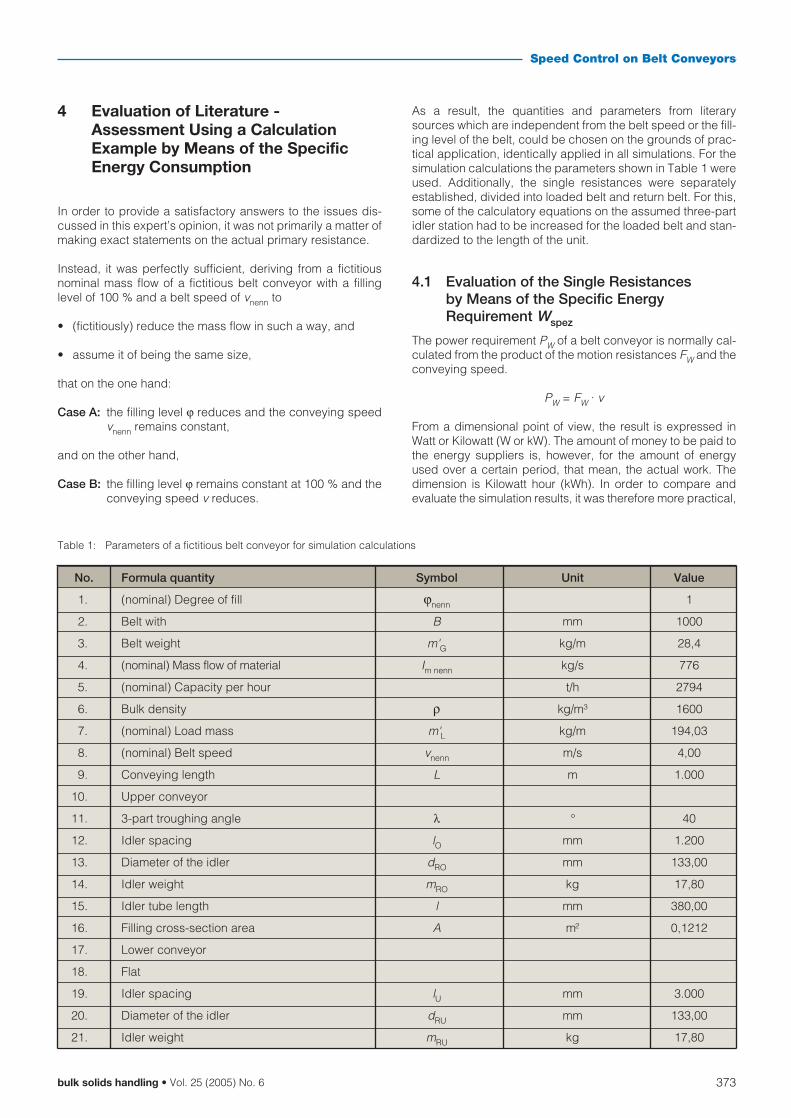
As a result, the quantities and parameters from literarysources which are independent from the belt speed or the fill-ing level of the belt, could be chosen on the grounds of prac-tical application, identically applied in all simulations. For thesimulation calculations the parameters shown in Table 1 wereused. Additionally, the single resistances were separatelyestablished, divided into loaded belt and return belt. For this,some of the calculatory equations on the assumed three-partidler station had to be increased for the loaded belt and stan-dardized to the length of the unit.
4.1 Evaluation of the Single Resistancesby Means of the Specific EnergyRequirement Wspez
The power requirement PW of a belt conveyor is normally cal-culated from the product of the motion resistances FW and theconveying speed.
PW = FW · v
From a dimensional point of view, the result is expressed inWatt or Kilowatt (W or kW). The amount of money to be paid tothe energy suppliers is, however, for the amount of energyused over a certain period, that mean, the actual work. Thedimension is Kilowatt hour (kWh). In order to compare andevaluate the simulation results, it was therefore more practical,
373bulk solids handling • Vol. 25 (2005) No. 6
Speed Control on Belt Conveyors
No. Formula quantity Symbol Unit Value
1. (nominal) Degree of fill ϕnenn 1
2. Belt with B mm 1000
3. Belt weight m'G kg/m 28,4
4. (nominal) Mass flow of material Im nenn kg/s 776
5. (nominal) Capacity per hour t/h 2794
6. Bulk density ρ kg/m³ 1600
7. (nominal) Load mass m'L kg/m 194,03
8. (nominal) Belt speed vnenn m/s 4,00
9. Conveying length L m 1.000
10. Upper conveyor
11. 3-part troughing angle λ ° 40
12. Idler spacing lO mm 1.200
13. Diameter of the idler dRO mm 133,00
14. Idler weight mRO kg 17,80
15. Idler tube length l mm 380,00
16. Filling cross-section area A m² 0,1212
17. Lower conveyor
18. Flat
19. Idler spacing lU mm 3.000
20. Diameter of the idler dRU mm 133,00
21. Idler weight mRU kg 17,80
Table 1: Parameters of a fictitious belt conveyor for simulation calculations
374 Vol. 25 (2005) No. 6 • bulk solids handling
Speed Control on Belt Conveyors
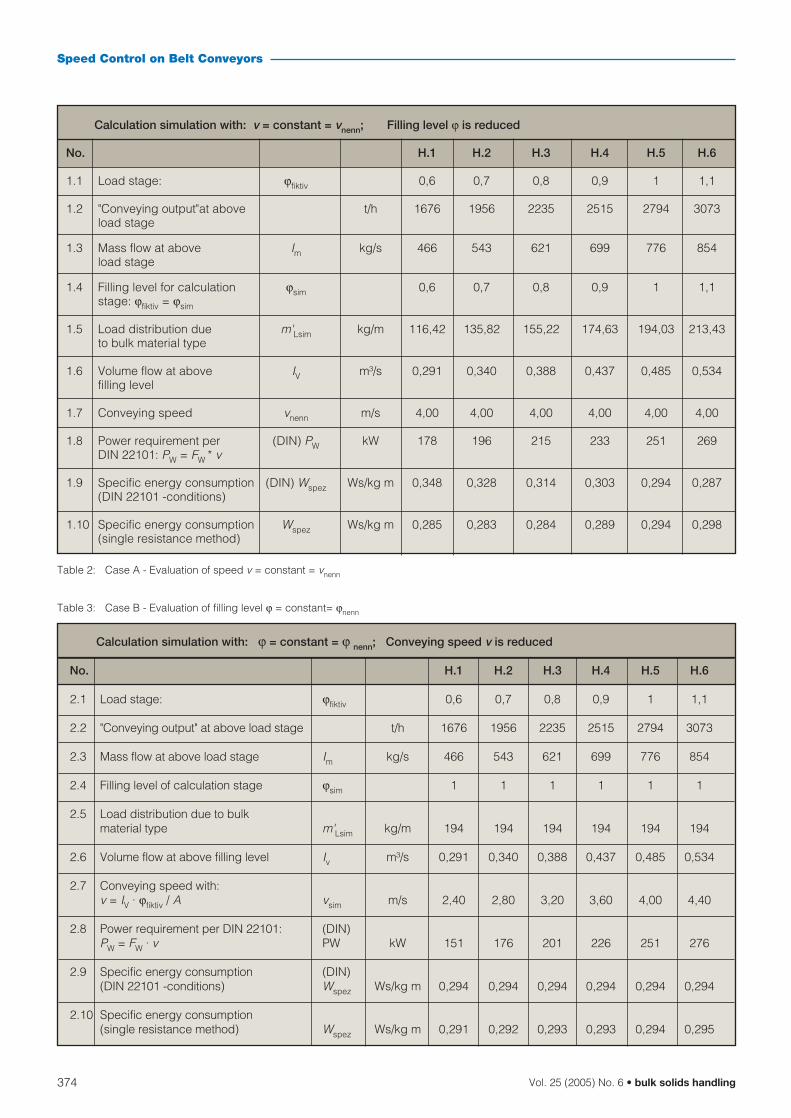
Calculation simulation with: v = constant = vnenn; Filling level ϕ is reduced
No. H.1 H.2 H.3 H.4 H.5 H.6
1.1 Load stage: ϕfiktiv 0,6 0,7 0,8 0,9 1 1,1
1.2 "Conveying output"at above t/h 1676 1956 2235 2515 2794 3073load stage
1.3 Mass flow at above Im kg/s 466 543 621 699 776 854load stage
1.4 Filling level for calculation ϕsim 0,6 0,7 0,8 0,9 1 1,1stage: ϕfiktiv = ϕsim
1.5 Load distribution due m'Lsim kg/m 116,42 135,82 155,22 174,63 194,03 213,43to bulk material type
1.6 Volume flow at above IV m³/s 0,291 0,340 0,388 0,437 0,485 0,534filling level
1.7 Conveying speed vnenn m/s 4,00 4,00 4,00 4,00 4,00 4,00
1.8 Power requirement per (DIN) PW kW 178 196 215 233 251 269DIN 22101: PW = FW * v
1.9 Specific energy consumption (DIN) Wspez Ws/kg m 0,348 0,328 0,314 0,303 0,294 0,287(DIN 22101 -conditions)
1.10 Specific energy consumption Wspez Ws/kg m 0,285 0,283 0,284 0,289 0,294 0,298(single resistance method)
Table 2: Case A - Evaluation of speed v = constant = vnenn
Calculation simulation with: ϕ = constant = ϕ nenn; Conveying speed v is reduced
No. H.1 H.2 H.3 H.4 H.5 H.6
2.1 Load stage: ϕfiktiv 0,6 0,7 0,8 0,9 1 1,1
2.2 "Conveying output" at above load stage t/h 1676 1956 2235 2515 2794 3073
2.3 Mass flow at above load stage Im kg/s 466 543 621 699 776 854
2.4 Filling level of calculation stage ϕsim 1 1 1 1 1 1
2.5 Load distribution due to bulk material type m'Lsim kg/m 194 194 194 194 194 194
2.6 Volume flow at above filling level Iv m³/s 0,291 0,340 0,388 0,437 0,485 0,534
2.7 Conveying speed with:v = IV · ϕfiktiv / A vsim m/s 2,40 2,80 3,20 3,60 4,00 4,40
2.8 Power requirement per DIN 22101: (DIN) PW = FW · v PW kW 151 176 201 226 251 276
2.9 Specific energy consumption (DIN) (DIN 22101 -conditions) Wspez Ws/kg m 0,294 0,294 0,294 0,294 0,294 0,294
2.10 Specific energy consumption(single resistance method) Wspez Ws/kg m 0,291 0,292 0,293 0,293 0,294 0,295
Table 3: Case B - Evaluation of filling level ϕ = constant= ϕnenn
to relate the expended drive power PW for the belt conveyorwith its differing loads to the time-related mass flow and theconveyor system length L. The result is defined as the specificenergy requirement Wspez.
Case A: Conveying speed v = constant = vnenn
During the evaluation of v = constant = vnenn the conveyingspeed v was kept constant. In order to vary the operatingconditions, the filling level ϕ, that means the load on theidlers, was changed at stages from 0.6 to 1.1 and hencereduced. For further details refer to Table 2.
Case B: Filling level ϕ = constant = ϕnenn
For the evaluation ϕ = constant, the filling level ϕ, that meansthe load on the idlers, has been maintained. In order to varythe operating conditions, the conveying speed was adaptedat stages from 2.4 m/s to 4.4 m/s. Depending on the simula-tion (columns H1 to H6 of Tables 2 and 3) the same mass flowwas used as a basis (lines 1.3 and 2.3 of Tables 2 and 3).
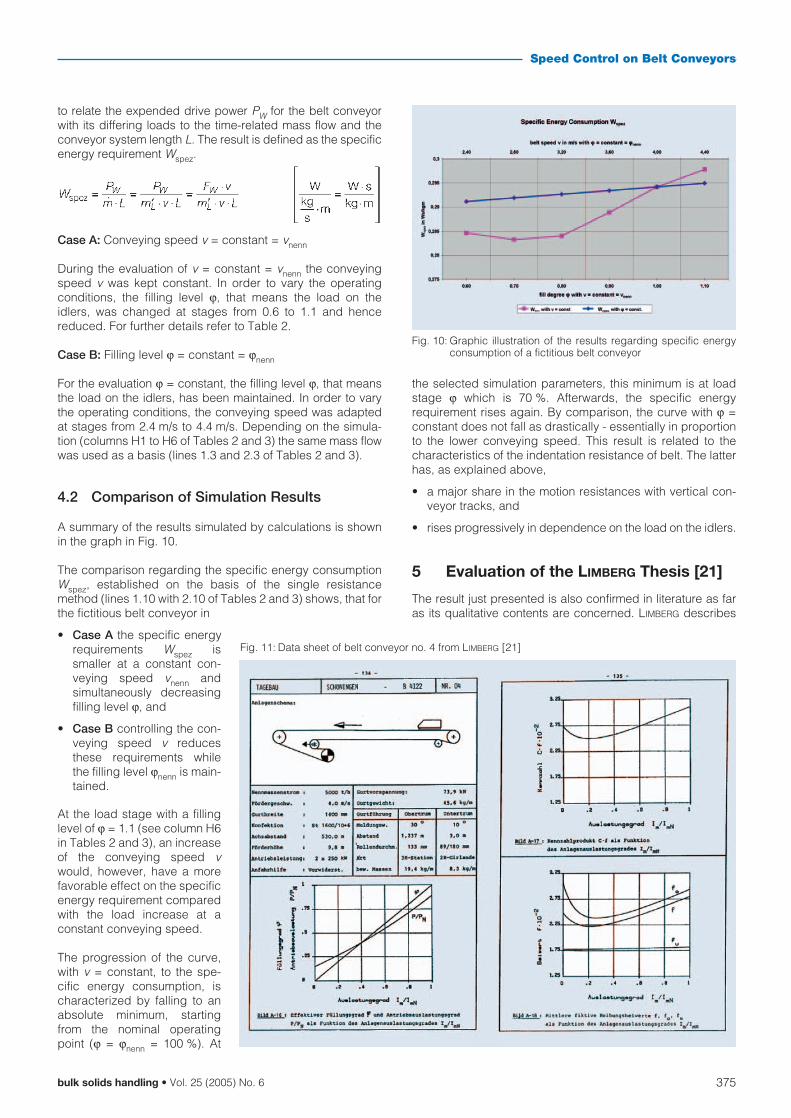
4.2 Comparison of Simulation Results
A summary of the results simulated by calculations is shownin the graph in Fig. 10.
The comparison regarding the specific energy consumptionWspez, established on the basis of the single resistancemethod (lines 1.10 with 2.10 of Tables 2 and 3) shows, that forthe fictitious belt conveyor in
• Case A the specific energyrequirements Wspez issmaller at a constant con-veying speed vnenn andsimultaneously decreasingfilling level ϕ, and
• Case B controlling the con-veying speed v reducesthese requirements whilethe filling level ϕnenn is main-tained.
At the load stage with a fillinglevel of ϕ = 1.1 (see column H6in Tables 2 and 3), an increaseof the conveying speed vwould, however, have a morefavorable effect on the specificenergy requirement comparedwith the load increase at aconstant conveying speed.
The progression of the curve,with v = constant, to the spe-cific energy consumption, ischaracterized by falling to anabsolute minimum, startingfrom the nominal operatingpoint (ϕ = ϕnenn = 100 %). At
the selected simulation parameters, this minimum is at loadstage ϕ which is 70 %. Afterwards, the specific energyrequirement rises again. By comparison, the curve with ϕ =constant does not fall as drastically - essentially in proportionto the lower conveying speed. This result is related to thecharacteristics of the indentation resistance of belt. The latterhas, as explained above,
• a major share in the motion resistances with vertical con-veyor tracks, and
• rises progressively in dependence on the load on the idlers.
5 Evaluation of the LIMBERG Thesis [21]
The result just presented is also confirmed in literature as faras its qualitative contents are concerned. LIMBERG describes
375bulk solids handling • Vol. 25 (2005) No. 6
Speed Control on Belt Conveyors
Fig. 10: Graphic illustration of the results regarding specific energyconsumption of a fictitious belt conveyor
Fig. 11: Data sheet of belt conveyor no. 4 from LIMBERG [21]
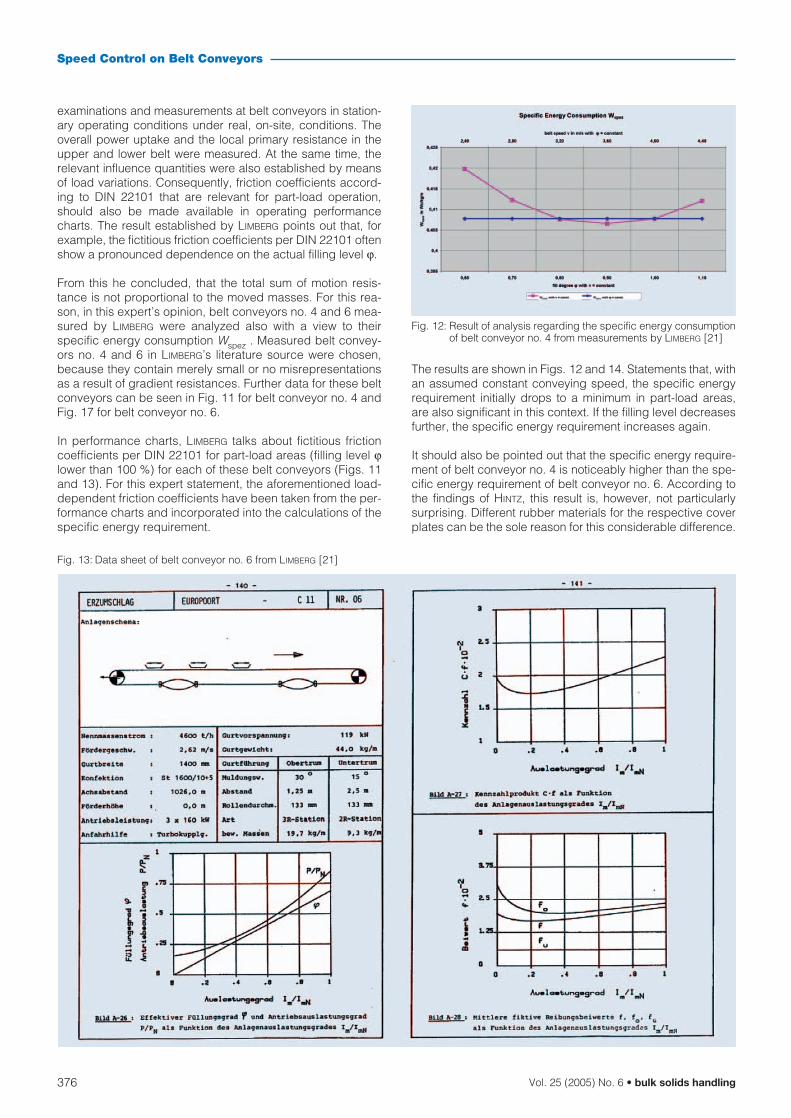
examinations and measurements at belt conveyors in station-ary operating conditions under real, on-site, conditions. Theoverall power uptake and the local primary resistance in theupper and lower belt were measured. At the same time, therelevant influence quantities were also established by meansof load variations. Consequently, friction coefficients accord-ing to DIN 22101 that are relevant for part-load operation,should also be made available in operating performancecharts. The result established by LIMBERG points out that, forexample, the fictitious friction coefficients per DIN 22101 oftenshow a pronounced dependence on the actual filling level ϕ.
From this he concluded, that the total sum of motion resis-tance is not proportional to the moved masses. For this rea-son, in this expert’s opinion, belt conveyors no. 4 and 6 mea-sured by LIMBERG were analyzed also with a view to theirspecific energy consumption Wspez . Measured belt convey-ors no. 4 and 6 in LIMBERG’s literature source were chosen,because they contain merely small or no misrepresentationsas a result of gradient resistances. Further data for these beltconveyors can be seen in Fig. 11 for belt conveyor no. 4 andFig. 17 for belt conveyor no. 6.
In performance charts, LIMBERG talks about fictitious frictioncoefficients per DIN 22101 for part-load areas (filling level ϕlower than 100 %) for each of these belt conveyors (Figs. 11and 13). For this expert statement, the aforementioned load-dependent friction coefficients have been taken from the per-formance charts and incorporated into the calculations of thespecific energy requirement.
The results are shown in Figs. 12 and 14. Statements that, withan assumed constant conveying speed, the specific energyrequirement initially drops to a minimum in part-load areas,are also significant in this context. If the filling level decreasesfurther, the specific energy requirement increases again.
It should also be pointed out that the specific energy require-ment of belt conveyor no. 4 is noticeably higher than the spe-cific energy requirement of belt conveyor no. 6. According tothe findings of HINTZ, this result is, however, not particularlysurprising. Different rubber materials for the respective coverplates can be the sole reason for this considerable difference.
376 Vol. 25 (2005) No. 6 • bulk solids handling
Speed Control on Belt Conveyors
Fig. 12: Result of analysis regarding the specific energy consumptionof belt conveyor no. 4 from measurements by LIMBERG [21]
Fig. 13: Data sheet of belt conveyor no. 6 from LIMBERG [21]
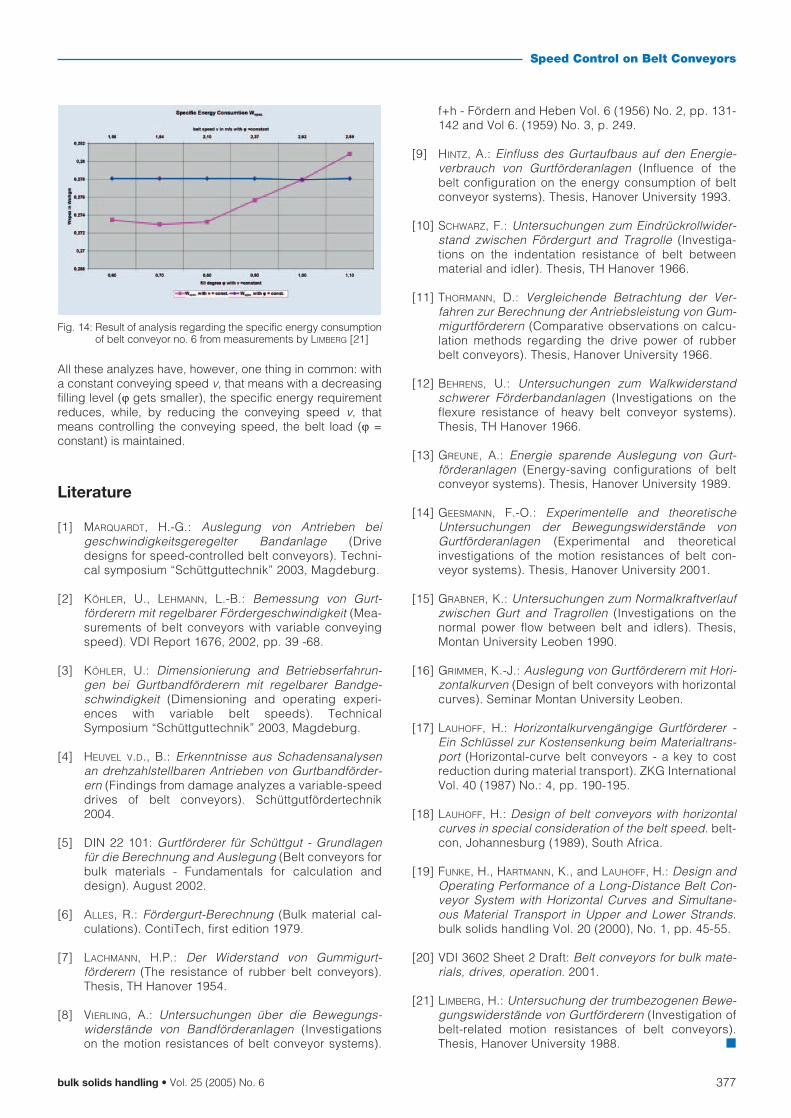
All these analyzes have, however, one thing in common: witha constant conveying speed v, that means with a decreasingfilling level (ϕ gets smaller), the specific energy requirementreduces, while, by reducing the conveying speed v, thatmeans controlling the conveying speed, the belt load (ϕ =constant) is maintained.
Literature
[1] MARQUARDT, H.-G.: Auslegung von Antrieben beigeschwindigkeitsgeregelter Bandanlage (Drivedesigns for speed-controlled belt conveyors). Techni-cal symposium “Schüttguttechnik” 2003, Magdeburg.
[2] KÖHLER, U., LEHMANN, L.-B.: Bemessung von Gurt-förderern mit regelbarer Fördergeschwindigkeit (Mea-surements of belt conveyors with variable conveyingspeed). VDI Report 1676, 2002, pp. 39 -68.
[3] KÖHLER, U.: Dimensionierung and Betriebserfahrun-gen bei Gurtbandförderern mit regelbarer Bandge-schwindigkeit (Dimensioning and operating experi-ences with variable belt speeds). TechnicalSymposium “Schüttguttechnik” 2003, Magdeburg.
[4] HEUVEL V.D., B.: Erkenntnisse aus Schadensanalysenan drehzahlstellbaren Antrieben von Gurtbandförder-ern (Findings from damage analyzes a variable-speeddrives of belt conveyors). Schüttgutfördertechnik2004.
[5] DIN 22 101: Gurtförderer für Schüttgut - Grundlagenfür die Berechnung and Auslegung (Belt conveyors forbulk materials - Fundamentals for calculation anddesign). August 2002.
[6] ALLES, R.: Fördergurt-Berechnung (Bulk material cal-culations). ContiTech, first edition 1979.
[7] LACHMANN, H.P.: Der Widerstand von Gummigurt-förderern (The resistance of rubber belt conveyors).Thesis, TH Hanover 1954.
[8] VIERLING, A.: Untersuchungen über die Bewegungs-widerstände von Bandförderanlagen (Investigationson the motion resistances of belt conveyor systems).
f+h - Fördern and Heben Vol. 6 (1956) No. 2, pp. 131-142 and Vol 6. (1959) No. 3, p. 249.
[9] HINTZ, A.: Einfluss des Gurtaufbaus auf den Energie-verbrauch von Gurtförderanlagen (Influence of thebelt configuration on the energy consumption of beltconveyor systems). Thesis, Hanover University 1993.
[10] SCHWARZ, F.: Untersuchungen zum Eindrückrollwider-stand zwischen Fördergurt and Tragrolle (Investiga-tions on the indentation resistance of belt betweenmaterial and idler). Thesis, TH Hanover 1966.
[11] THORMANN, D.: Vergleichende Betrachtung der Ver-fahren zur Berechnung der Antriebsleistung von Gum-migurtförderern (Comparative observations on calcu-lation methods regarding the drive power of rubberbelt conveyors). Thesis, Hanover University 1966.
[12] BEHRENS, U.: Untersuchungen zum Walkwiderstandschwerer Förderbandanlagen (Investigations on theflexure resistance of heavy belt conveyor systems).Thesis, TH Hanover 1966.
[13] GREUNE, A.: Energie sparende Auslegung von Gurt-förderanlagen (Energy-saving configurations of beltconveyor systems). Thesis, Hanover University 1989.
[14] GEESMANN, F.-O.: Experimentelle and theoretischeUntersuchungen der Bewegungswiderstände vonGurtförderanlagen (Experimental and theoreticalinvestigations of the motion resistances of belt con-veyor systems). Thesis, Hanover University 2001.
[15] GRABNER, K.: Untersuchungen zum Normalkraftverlaufzwischen Gurt and Tragrollen (Investigations on thenormal power flow between belt and idlers). Thesis,Montan University Leoben 1990.
[16] GRIMMER, K.-J.: Auslegung von Gurtförderern mit Hori-zontalkurven (Design of belt conveyors with horizontalcurves). Seminar Montan University Leoben.
[17] LAUHOFF, H.: Horizontalkurvengängige Gurtförderer -Ein Schlüssel zur Kostensenkung beim Materialtrans-port (Horizontal-curve belt conveyors - a key to costreduction during material transport). ZKG InternationalVol. 40 (1987) No.: 4, pp. 190-195.
[18] LAUHOFF, H.: Design of belt conveyors with horizontalcurves in special consideration of the belt speed. belt-con, Johannesburg (1989), South Africa.
[19] FUNKE, H., HARTMANN, K., and LAUHOFF, H.: Design andOperating Performance of a Long-Distance Belt Con-veyor System with Horizontal Curves and Simultane-ous Material Transport in Upper and Lower Strands.bulk solids handling Vol. 20 (2000), No. 1, pp. 45-55.
[20] VDI 3602 Sheet 2 Draft: Belt conveyors for bulk mate-rials, drives, operation. 2001.
[21] LIMBERG, H.: Untersuchung der trumbezogenen Bewe-gungswiderstände von Gurtförderern (Investigation ofbelt-related motion resistances of belt conveyors).Thesis, Hanover University 1988. ■
377bulk solids handling • Vol. 25 (2005) No. 6
Speed Control on Belt Conveyors
Fig. 14: Result of analysis regarding the specific energy consumptionof belt conveyor no. 6 from measurements by LIMBERG [21]