Embed Size (px)
Citation preview

Transportation Research Record 818
Transport: Initial Concepts and Model. In Traffic F.quilibrium Methods (M.A. Florian, ed.), Proc., International Symposium on Traffic F.quilibrium Methods, Montreal, 1974, Springer Verlag, Berlin, 1976, pp. 322-367.
5. H. Mohring. Optimization and Scale Economies in Urban Bus Transportation. American Economic Review, Sept. 1972.
6. C.R. Guinn. Transit Optimization--Test 1 Analysis; Transit Optimization--Test 2 Analysis. New York State Department of Transportation, Albany, Preliminary Res. Repts. 2 and 12, 1967.
7. s. Scheele. A Mathematical Programming Algorithm for Optimal Frequencies. Institute of Technology, Linkoping Univ., Linkoping, Sweden, Linkoping Studies in Science and Technology, Dissertation 12, 1977.
8. M. Lampkin and P.D. Saalmans. The Design of Routes, Service Frequencies, and Schedules for a Municipal Bus Undertaking: A Case Study. Operations Research Quarterly, Vol. 18, No. 4, Dec. 1967, pp. 375-397.
9. L.A. Silman, z. Barzily, and U. Passy.
7
Planning the Route System for Urban Buses. Computers and Operations Research, Vol. 1, 1974, pp. 201-211.
10. A. Last and S.E. Leak. TRANSEPT: A Bus Model. Traffic Engineering and Control, Vol. 17, No. 1, Jan. 1976.
11. o. Hasselstrom. A Method for Optimization of Urban Bus Route Systems. Volvo Bus Corporation, GOteborg, Sweden, working paper, 1979.
12. C.A. Nash. Management Objectives, Fares, and Service Levels in Bus Transport. Journal of Transport Economics and Policy, Jan. 1978.
13. A.F. Han and N.H.M. Wilson. The Allocation of Buses in Heavily Utilized Networks with Overlapping Routes. Transportation Research (in preparation) •
14. Ecosometrics, Inc. Patronage Impacts of Change in Transit Fares and Services. Office of Service and Methods Demonstrations, UMTA, U.S. Department of Transportation, Rept. 135-1, 1980.
Publication of this paper sponsored by Committee on Traveler Behavior and Values.
Strategies for Improving Reliability of
Bus Transit Service
MARK A. TURNQUIST
Four major classes of strategies for improving reliability of bus transit service are analyzed: vehicle-holding strategies, reduction of the number of stops made by each bus, signal preemption, and provision of exclusive right-of-way. The principal findings are that (a) strategies to improve service reliability can have very substantial impacts on overall service quality, including improvements in average wait and in-vehicle time as well, and (b) the best strategy to use in a particular situation depends on several factors, but service frequency is the most important. For low-frequency services (less than 10 buses per hour), schedule-based holding strategies or zone scheduling is likely to work best. For midfrequency services (10-30 buses per hour) zone scheduling or signal preemption is likely to be most effective, although headway-based holding can also work well if an appropriate control point can be found. In high-frequency situations (more than 30 buses per hour), an exclusive lane combined with signal preemption should be considered.
The concept of service reliability has come into increasing prominence in recent years as an important characteristic of the quality of service provided by transportation systems. A basic definition of reliability, as the term is used here, is the var iabili ty of a system performance measure over time. The focus is on stochastic variation in performance rather than on more-traditional engineering concepts of probability of component or system failure. The level-of-service measure most clearly subject to variation is travel time, and this variability is often described in terms of nonadherence to schedule.
Service reliability is important to both the transit user and the transit operator. To the user, nonadherence to schedule results in increased wait time, makes transferring more difficult, and causes uncertain arrival time at the destination. The importance of some measure of reliability to tripmaking behavior has been emphasized in several attitudinal studies. For example, Paine and others !1)
found that potential users ranked "arriving when planned" as the single most important service characteristic of a transit system. This finding has been substantiated in further studies by Golob and others (~) and by Wallin and Wright (l).
In addition to its importance to transit users, unreliability in operations is a source of reduced productivity and increased costs for transit operators. This is due to the need to build substantial slack time into timetables in order to absorb deviations from the schedule. This leads to reduced use of both equipment and personnel. The recent report by Abkowitz and others (!) provides an excellent summary of the major issues in transit-service reliability from the perspectives of both the user and the operator.
In light of the current need for more costeffective public transportation in urban areas, it is important to understand the sources of unreliability and to investigate the potential of several alternative control strategies to improve both the quality of service provided and the productivity of the equipment and the personnel in the system.
The research on which this paper is based has had four major objectives:
1. Investigation of the sources of servicereliability problems in bus transit networks,
2. Identification of potential strategies for improving reliability of service,
3. Development of models to allow these strategies to be analyzed and evaluated, and
4. General evaluation of the relative effectiveness of these strategies.
8
Experiments with a network-simulation model to investigate sources of reliability problems are summarized in the next section. The following sections provide analyses of four major classes of strategies for improving service reliability: vehicle holding; methods for reducing the number of stops made by each vehicle, which include increasing stop spacing and zone scheduling; signal-preemption; and exclusive rights-of-way for buses. The paper concludes with practical implications of the results.
This paper is a summary of findings from a twoyear project and is intended to highlight the major research results. Readers interested in additional details on model development and test results should refer to the two larger reports from this project, that by Turnquist and Bowman (~) and that by Turnquist (~).
SOURCES OF UNRELIABILITY AND IMPLICATIONS FOR CONTROL STRATEGIES
One of the objectives of this research has been to focus on the ways in which network characteristics affect schedule reliability and hence the level of service experienced by the users. A set of experiments has been conducted to examine two relationships that seem to be of primary importance--the effects (a) of factors that contribute to the tendency of vehicles to bunch together as they travel and (b) of network configuration as exemplified by grid versus radial networks.
The first relationship to be considered has previously been addressed by Vuchic (7) by using a deterministic model to explore the -propagation of schedule disturbances along a transit line. 'l'his model attempts to explain the pairing of successive vehicles, or bunching, in terms of the arrival and boarding rates of passengers at stops. The conclusion reached is that the most effective means of controlling these schedule disturbances is to reduce boarding times. This work extends that research by including the effect of "batch" passenger arrivals from connecting routes and, more important, the variability in link travel times.
Grid and radial networks represent fundamentally different patterns of service. They will result in different trip routings, different lengths of trips on the network, and different transfer characteristics. Thus, it is vital to contrast the levels of service reliability offered by the two types of network structure.
In order to reach conclusions about the two major relationships indicated above, a set of experiments was designed that involve five factors: (a) frequency of service (buses per hour), (b) coefficient of variation of link travel time, (c) demand/capacity ratio (total passenger miles per hour divided by available "space" miles per hour--both seated and standing--on all vehicles) , (d) route density (miles of two-way route per square mile), and (e) network orientation (grid or radial). Frequency of service was assumed to be the same for all routes, and the coefficient of variation in link travel time was the same for all links in the network.
The experimental design and details of the experimental results have been discussed at length by Turnquist and Bowman (~) and will not be repeated here. However, a summary of the major findings of the experiments is as follows. The experiments have indicated how vehicle bunching is related to frequency of service, level of demand, and the variability of link travel times. In particular, these results illustrate the importance of reducing variability in link travel time in an effort to prevent bunches from forming. This represents an extension to the results of Vuchic (l) , which placed primary
Transportation Research Record 818
emphasis on the demand/capacity ratio and boarding times.
It is clear from the experimental results that service reliability is much more sensitive to frequency of service than to route density. This implies that there are substantial reliability impacts of the trade-off between operating fewer routes at higher frequency or more routes at lower frequency, given a limited amount of vehicle resources. Traditionally, this trade-off has been evaluated by using simplistic models of expected passenger wait time and the accessibility of transit service to users. However, this work has shown that service reliability is also an important factor in this trade-off and should be included in the evaluation.
This research has several practical implications for transit operators who are attempting to improve the level of service provided to passengers. Firs~, the presence of large variability in link travel times can substantially reduce the benefits that result from increasing frequency of service, due to the tendency of vehicles to bunch together along the route. In such cases, it is well worthwhile to investigate techniques for reducing this travel-time variability.
The influence of transfers on level of service points out the need to pay special attention to the on-time arrival of vehicles at major transfer stations. This is especially true for radially oriented network structures. As a rule, providing excess slack time in the route schedule is to be avoided, since it tends to increase travel time and reduce vehicle productivity. However, when a large number of passenger transfers can be aided by creating enough slack time to assure successful connections, allowing a short delay may be highly beneficial.
In summary, the major sources of reliability problems in transit service are bunching of vehicles and poor connections at transfer points. In a broad sense, then, the major objectives of control strategies are to keep bunches from forming (or to break them up after they have formed) and to ensure that scheduled arrival times at transfer points are met. At a more detailed level, deviations from schedule, which lead to bunching and poor transfer connections, can be traced to excessive variability in either link travel times between stops or dwell ti mes at stops. Therefore, potential control strategies should be focused on reducing one or both of these sources of variability.
This investigation has concentrated on four general classes of strategies: (a) vehicle holding, (b) reductions in the number of stops served by each vehicle, (c) modifications to traffic signal settings and operation, and (d) provision.of exclusive rights-of-way for transit vehicles. Such a classification provides a useful framework for discussion of many individual strategies and a comparison of their relative effectiveness in particular situations. The following sections provide discussions of each of these classes of control strategies.
VEHICLE HOLDING
Vehicle-holding strategies attempt to prevent bunches from forming and serve to break up bunches that may already have formed. When enacted at major transfer points, such strategies can also be useful in ensuring that schedule connections are made.
Two important subclasses of strategies can be distinguished. One type is oriented toward holding vehicles to a particular schedule, and the second is focused on maintaining constant headways between successive vehicles.

Transportation Research Record 818
Schedule- Based Holding
A schedule-based holding strategy is nothing more than creating checkpoints or time points along a bus route and insisting that no vehicle leave a time point before its scheduled departure time. This is probably the simplest form of schedule control possible and is practiced (at least in theory) by many transit operators. Theory and practice often differ, however, because of lack of enforcement.
The keys to successful implementation of a schedule-based checkpoint strategy are (a) to have a schedule to which vehicles have a reasonable chance to adhere and (b) to enforce the rule of no early departures from the checkpoint. It is important that the mean arrival time of buses at the checkpoint be approximately the scheduled time. If the schedule is unrealistic, so that vehicles are consistently late, this strategy will have little or no effect, since the control actions directly affect only those vehicles that are ahead of schedule. On the other hand, it is inadvisable to have a schedule so slack that almost all vehicles are early, since delaying all these vehicles to meet the schedule of the slowest vehicles imposes penalties on a large number of passengers and reduces overall vehicle speed and productivity.
A schedule-based holding strategy can be particularly useful on suburban routes or in other instances in which headways are quite large. When service is relatively infrequent, passengers tend to learn the schedule and coordinate their arrival at the bus stop with the scheduled arrival time of the bus so as to minimize wait time. In such cases, adherence to schedule by the buses is very important in provision of quality service to the passengers.
Headway-Ba sed Holding
When service is quite frequent, we might expect headway-based holding strategies to be effective. If service is frequent enough so that passengers may be assumed to arrive randomly in time at a given bus stop without regard to the schedule of service, the average waiting time E(W) has been derived by Welding (_~):
E(W) = [E(H)/2] + [V(H)/2E(H)] (1)
where E (H) is the expected headway between successive vehicles and V(H) is the variance of headways.
It is clear from Equation 1 that making the headways more regular (i.e., reducing the variance) will tend to reduce average waiting time. This is the motivation for headway-based control strategies. In general, the objective of control is to minimize a weighted sum of wait-time savings due to reduced headway variability and expected delay due to the holding strategy. Three basic categories of strategies may be distinguished.
One type has been referred to by Jackson (10) and by Turnquist and Bowman (5) as the "prefol "policy because it splits the diff;rence between the preceding and following headways for each vehicle . This policy requires a prediction of the arrival time of the following vehicle. Automatic train-control systems could provide train location in rapid transit applications. For bus s y stems, location may be determined by automatic vehicle-monitoring (AVM) technologies. A projection of its speed to the control point would also be required.
A less-reliable but much less-expensive predict ion of the following headway would be its statistical expectation. This suggests an alternative control policy, which will be referred to as the single-headway policy. It is dependent only on the
9
known current headway and previous hold. Detailed mathematical development of both prefol and singleheadway strategies may be found in a report by Turnquist (&_) •
Both the prefol and the single-headway policies are likely to be more effective than the third category, the so-called threshold-based holding strategies. The strategy "hold until the headway reaches a minimum threshold" has often been suggested and modeled in the literature (~, 11-13). Simulation work has indicated that this strategy tends to delay too many vehicles too long, which increases the average headway and sometimes actually lengthens passenger wait time.
Note that a prefol implementation would not increase the average headway, since no vehicle is held past the arrival of its follower. (Technically, the average headway is increased by a small amount if the last bus is held past the e nd of the period.)
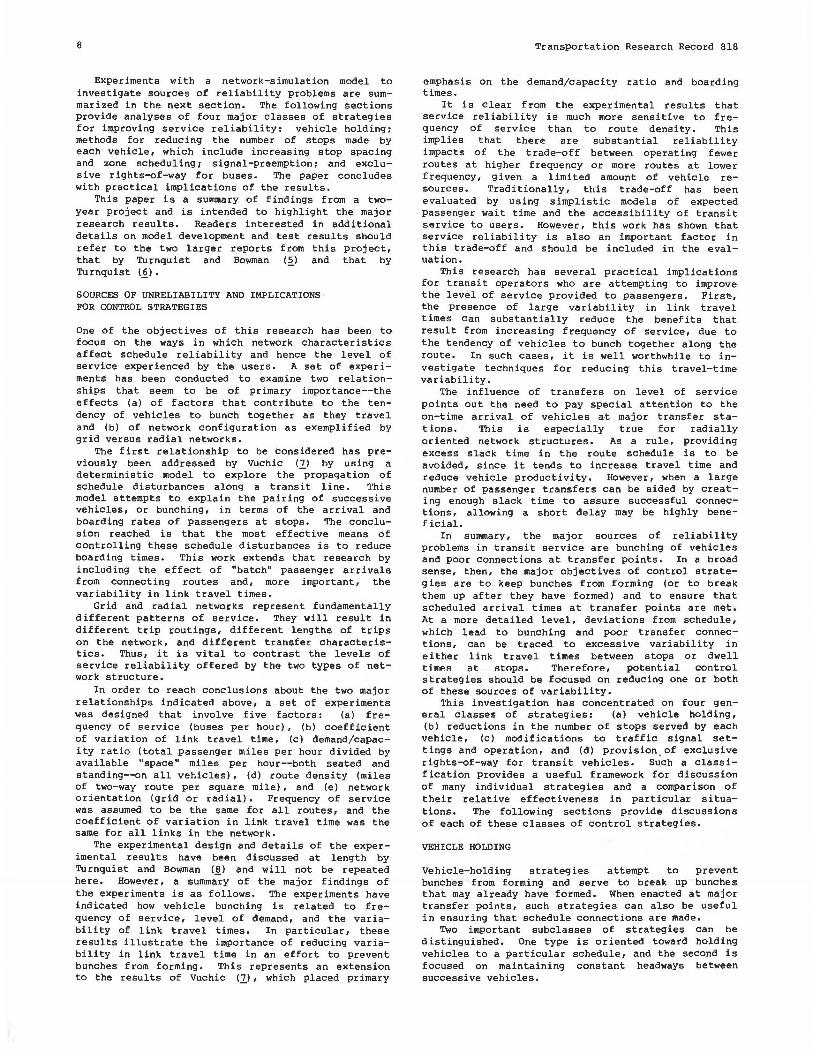
One of the most important aspects of the analysis of any headway-based holding strategy is to identify those situations for which it is likely to be effective and those situations for which it is not . The relative benefits of holding depend on three factors: (a) the coefficient of variation of headways, (b) the correlation coefficient between successive headways, and (c) the proportion of total passengers who must ride through the control point.
Control of headways will make the greatest reduct ion in total delay when headways alternate (i.e., short, long, short, long, etc.). This happens on routes on which vehicles are i nfluenced substantially by the operation of the vehicle in front of them (successive headways are highly correlated) . For example, this would tend to be the case when loading delays are relatively more important than traffic congestion in determining overall vehicle operating speed. Routes on which pairing or bunching is prevalent would be of this type. In such a situation, holding a vehicle to lengthen a short headway also serves to reduce the long one that follows. Thus, the variance of headways is reduced by a greater amount for a given delay to the held vehicle than if a short headway might be followed by another short headway.
Figure 1 illustrates sets of values of the headway coefficient of variation, headway correlation, and proportion of passengers delayed for which headway-based holding could reduce average passenger delay by at least 10 percent. By exami ning the two extreme cases of independent headways and perfectly correlated headways, we can bound the regions of effectiveness for a class of headway control strategies.
Note that the region for which the single-headway strategy produces definite benefits is much smaller than that for the prefol strategy. In general, the single-headway strategy is less effective than the prefol strategy because it uses no direct information about the following headway. However, the difference between the strategies diminishes as the correlation between successive headways becomes stronger because the pred i ctability of the following headway is increasing.
It should also be emphasized that the effectiveness of headway-based controls is dependent on identification of an appropriate control point along the route. It is wise to control a route at a point at which there are relatively few people on the vehicle and relatively many waiting to board at subsequent stops. Generally, this means that the control point should be located as early along the vehicle's route as possible. However, it is also generally recognized that reliability problems worsen as one proceeds along a route. If dispatching at the route

10
Figure 1. Comparison of regions of effectiveness for prefol and single-headway strategies.
Ei t her control def inite l y effecti ve
I .O r-+--.--------~-------~
Q)
0
" ,.., 0 l<
"O
.8
4
g .2 :r
Prelo l control defini te! elf ec tive-single head -
way control may be, i f headways corre l ated Effect iveness of either
control policy depends upon headway correlation
Neither control effective
Proportion of passengers delayed
origin is effective, the headways will be reasonably regular at the early stops along the route, which implies that the coefficient of variation will be s mall. At stops further along the route, however, the coefficient of variation in headways will tend to be 1 arger. Thus, the decision of whether to implement a control strategy is tied to identificatiqp of a logical control point along the route.
STOP REDUCTION AND ZONE SCHEDULING
Since a substantial portion of bus travel time is spent decelerating for stops, standing to allow boarding and alighting of passengers, waiting to reenter the traffic stream, and accelerating, reduction of the number of stops made by each vehicle is one way to improve travel time. In addition, since the variability of stop dwell time is a major source of deviation from schedule, reducing the number of stops should improve reliability. This research has examined two different ways in which to accomplish a reduction in the number of stops that each bus makes. The first is increasing stop spacing by eliminating some stops along a route, and the second is zone scheduling.
I nc r easing S top Spacing
Increasing the spacing between stops is clearly one way to reduce the number of stops that must be made by each vehicle. The major disadvantage of increased stop spacing is that accessibility to the route is diminished. Passengers must walk further, on average, to get to a bus stop. This cost must be weighed against the improved travel time and reliability in order to arrive at optimal stop-spacing decisions.
Very little work has been done in this regard for bus operations. Vuchic (14) and Vuchic and Newell (]2) have considered such problems for rapid transit lines, but reliability improvements were not among their measures of performance. Mohring (16) discusses optimal stop spacing for urban bus-routes, but in the context of a very simple model and with no attention to reliability of service.
In order to test the effects of stop spacing more carefully, a series of simulation experiments have
Transportation Research Record 818
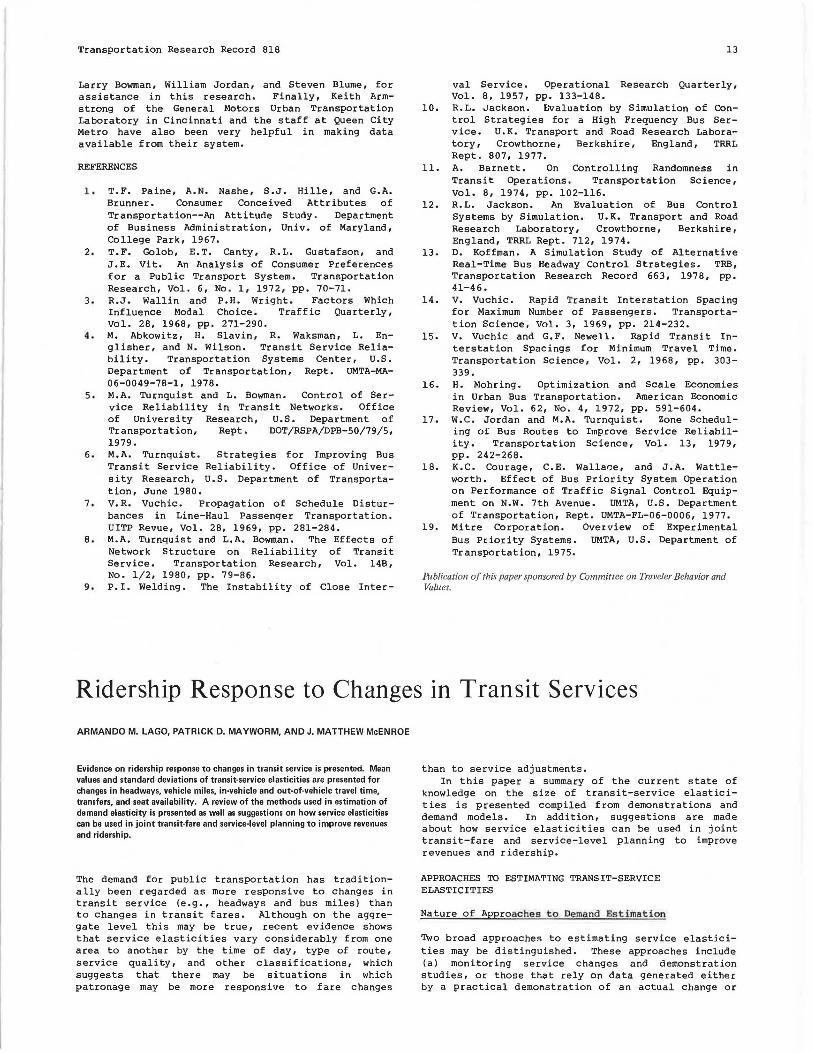
been run that use as a test network the Reading Road corridor in Cincinnati. This network is shown in Figure 2. The simulation tests reflect a morning peak period, and changes in stop density were made along a 7.1-km (4.4-mile) section from Clinton Springs Avenue to Government Square (downtown).
In the base case (which reflects existing operations), there are 36 stops in this section; the average stop spacing is O. 20 km (0.12 mile). For the tests, 17 of these stops were eliminated, which resulted in an average stop spacing of 0.37 km (0.23 mile). Five replications of each configuration were run and the averages over these replications compared.
The results show that average passenger speed over the system increased from 14.1 km/h (B.B mph) to 14.5 km/h (9.0 mph). This change, although in the right direction, is not statistically significant at any reasonable level, however. The SD passenger speed was unchanged at 5.3 km/h (3.3 mph).
Reducing stop density also appears to have made small reductions in both the mean and SD (or variance) of waiting time. Mean waiting time was reduced from 7.5 min to 7.2 min and SD from 7.7 min to 7.0 min. However, as in the case of average passenger speed, these changes are not statistically significant.
Thus, the simulation results with respect to reduced stop density are not particularly encouraging. However, closer i nspection of the simulation output showed that a major reason why eliminating stops had such small effects was that buses were still being slowed by traffic signals. Because of the signal settings, they could not take advantage of the potential reductions in travel time along the route; they simply spent more time in queues at traffic lights. In an attempt to rectify this, changes in both stop density and signal operation were made simultaneously. These results were more encouraging and are discussed in greater detail later.
Zone Scheduling
An alternative way of r educing lhe numl.Jer of stops each vehicle must make without increasing overall stop spacing is to divide a route into zones. Each zone is a set of consecutive stops that has a subset of all the buses on the route allocated to it. An inbound bus dispatched from the outermost stop in its zone makes stops to pick up or let off passengers within its zone only; it runs nonstop to the route terminus after passing the inner zonal boundary. On its outward journey, the bus may provide local service all along the route; may travel express to the innermost stop of its zone, at which point it would again beg in to offer local service ; or may travel express all the way to the outer terminus of its zone and then begin another inbound run. Zones must overlap so that passengers bound from a stop in one zone to a stop in a different zone other than the route terminus can transfer.
Zone scheduling can improve both average bus speeds and reliability in two ways:
1. Average in-motion time and variability can be reduced by the nonstop service offered for a portion of each bus's run under a zone-scheduling scheme, and
2. The number of stops each bus makes can ue reduced, which will lessen both average bus dwell time and variability in this time.
A dynamic-progranuning model has been developed to study the impact of zone scheduling on both service reliability and average wait and in-vehicle time. Service reliability is measured by the variance in

Transportation Research Record 818
Figure 2. Reading Road corridor in Cincinnati.
.,. c .; - --- Lincoln Ave 0 .. a::
passenger trip time summed over all passengers that use the route. The elements of the model are described in detail by Jordan and Turnquist <.!1>·
The general conclusions from test applications of the model are as follows:
1. Substantial improvements in average trip time and reliability are attained through zone scheduling relative to all-local service;
2. While maintaining the improvements in average trip time and reliability, substantial decreases in a route's bus-fleet size can be made as a result of the improved productivity of all vehicles;
3. Average trip time is improved simultaneously with reliability under a zone-scheduling scheme; and
4. The major portion of reliability improvements can be attained by a very simple zone structure.
These results appear to be relatively insensitive to changes in important model parameters, at least in cases examined to date. This tends to increase the level of confidence in these results.
Our analysis has demonstrated that zone scheduling can be a very effective way in which to improve the quality and productivity of urban transit service. It should be emphasized that the attractiveness of zone scheduling in a given situation will depend greatly on the relative express and local speeds attainable, the relative variability in travel times on express and local links, and the proportion of total route ridership that is destined for (or originates at) the route terminus.
CHANGES IN TRAFFIC-SIGNAL OPERATION
Several authors, including Welding (~) and Jackson (10), have emphasized the importance of variability in travel times between stops as a source of bus reliability problems. A major portion of this variability arises from delays at controlled intersections. This section examines signal preemption as a method of reducing the impact of signalized intersections on average delay and the variability of delays.
11
Several studies have reported experience with preemption strategies at isolated intersections or on intersections along major streets that have light cross traffic. Such applications have shown substantial savings in mean transit time at insignificant costs to automobile users (.!.!!., ,!2.). It must be noted that most previous researchers have focused on preemption as a means of reducing average delay at intersections and hence improving average speed of the buses. For the most part, service reliability benefits from reducing the variability of delays have not been considered explicitly. In order to include this measure of effectiveness, simulation experiments that use signal preemption have been performed in this project, again by using the Reading Road corridor in Cincinnati (Figure 2) as a test case.
As in previous tests, five replications of the preemption strategy were made with the simulation model. The pooled average of these five runs is then compared with a similar average from the base case.
One of the major effects of the preemption strategy is that bu!? travel times over the section that uses signal preemption are reduced by approximately 3. 5 min (out of a scheduled 24 min) , which implies an average speed increase from 17.7 km/h (11.0 mph) to 20.7 km/h (12.9 mph), or about 17 percent. The SD of travel time was reduced by approximately o.s min out of a total of 2.7, a reduction of 18 percent.
A second major effect is on passenger wait time. Average wait time is reduced by 0.6 min, from 7.5 min to 6.9 min, a reduction of B percent. The SD of wait time is also reduced, from 7.7 min to 7.0 min, or 9 percent. All the changes to both travel times (or speeds) and waiting time are significant at the 90 percent confidence level.
Signal preemption thus appears to offer sign if icant potential for improving both average speed and reliability, with concomitant effects on both mean and variance of waiting time. As a further test of this strategy, a second experiment was conducted that combined signal preemption with reduced stop density, as discussed earlier.
The results of this experiment were a small (but insignificant) further increase in average speed and a small decrease in average wait (also insignificant) compared with the use of preemption alone. However, the SD of wait time decreased to 6. 5 min compared with 7.0 min for preemption alone and 7.7 min for the base case. This further reduction in the variability of wait time is statistically significant and constitutes the major observed impact of combining signal preemption and reduced stop density.
RESERVED BUS LANES
In congested areas, traffic-stream delays account for a substantial portion of total transit travel time. Measures that remove the bus from these delays will reduce travel time and improve reliability. There is considerable empirical evidence from the United States, Europe, and Australia that reserved lanes can improve both average transit speeds and reliability. Additional simulation experiments conducted in this project have been designed to examine the effectiveness of reserved lanes together with signal preemption.
As a test case, the Reading Road corridor was again used as a basis but with substantial modifications. Bus operations are not heavy enough now to justify a reserved lane; there are only about 12 buses per hour. This would not be a very effective test of reserved-lane strategies intended for areas

12
of much higher activity. To obtain a test case, the bus frequencies and passenger-arrival rates were multiplied by a factor of 5, which resulted in average headways of about 1 min and loadings comparable with those of the present case. Other elements of the corridor were left unchanged. Thus, our test is over a corridor 7.1 km (4.4 miles) in length that has a total of 36 stops and 32 signalized intersections. The reserved lane was specified to be a curb lane (the one that went with the traffic flow).
Table 1 summarizes the major results from testing the reserved lane alone and those from the reserved lane in combination with signal preemption. The addition of the lane itself results in a small reduction in average travel time, but this is not statistically significant. The reduction in the SD of travel time, from 5.1 min to 4.4 min (14 percent), is statistically significant at the 95 percent level. Reductions in mean and SD of waiting time are also statistically insignificant. Thus, the major impact of adding the reserved lane in this case appears to be a reduction in the variability of travel time, a direct improvement to service reliability.
Combining the reserved lane with signal preemption is noticeably more effective. The changes in passenger wait time are still insignificant, but the changes in both mean and SD of travel time along the corridor are highly significant. The estimated reduction in average travel time is 17 percent, and the reduction in the SD of travel time is 18 percent.
'l'Wo additional aspects of these experiments should be noted in order to aid interpretation of the results. First, the effects of the signal preemption on cross traffic have not been analyzed in detail. The expected value of delay to cross traffic has been included in the settings of the signals used in the preemption study. However, morethorough analysis would require a more-detailed traffic-simulation model. The second point is that the vehicle traffic levels (both in the main direction and in the cross direction) assumed for these experiments are relatively light. Main-direction volumes are the heaviest and are in the range of j~0-400 vehicles per lane per hour. Most situations in which reserved lanes would be considered are likely to have heavier traffic volumes as well as heavy bus volumes. Thus, the benefits of removing the J buses from the mixed traffic scheme are likely to be greater than those measured in these exper iments. In this sense, these results are likely to be conservative.
Thus, the combination of a reserved lane for buses and signal-preemption capability appears to be a potentially effective method for improving both average travel time and reliability in situations that involve very heavy bus movements.
CONCLUSIONS AND IMPLICATIONS
The most important determinant of the appropriate strategy for reliability improvement in a given sit-
Table 1. Summary of test results for reserved-lane strategies.
Measure
Average bus travel time SD of bus travel time Average wait time SD of wait time
Travel Time (min)
Base Case (no reserved lane)
25.2 5.1 0.9 1.3
Reserved Lane Only
23.8 4.4 0.8 1.2
Reserved Lane and Preemption
20.8 4.2 0.7 I.I
Transportation Research Record 818
uation seems to be frequency of service on the route or routes in question. For low-frequency situations (less than 10 buses per hour) , checkpoint control (schedule-based holding) is likely to be the most effective strategy, provided that an appropriate schedule is constructed and adherence to schedule at checkpoints is enforced. In some low-frequency situations, zone scheduling may also be effective if most passengers are destined for (or originate at) one terminus of the route. The presence of an expressway roughly parallel to the route also makes this strategy more effective.
In medium-frequency situations (10-30 buses per hour), the most effective strategies are likely to be zone scheduling and signal preemption. If the origin-destination pattern of passengers is suitable and an express facility is available, zone scheduling is likely to be the best choice. If these co~ditions are not met, signal preemption on the local facility used by the buses should be considered. Headway-based holding can also be useful if an appropriate control point can be found along the route.
For high-frequency situations (more than 30 buses per hour) an exclusive lane together with signal preemption if the road is an arterial should be considered. Experience from several demonstrations of bus lanes and modeling results from this study and others indicate the effectiveness of such a strategy in improving both average travel time and reliability for buses.
Whereas these recommendations provide general guidelines for transit operators and planners in selecting service-improvement strategies, the most valuable product of this research is the battery of models developed for analyzing a number of strategies in any particular situation. These models include the analytic formulations for developing holding strategies, the dynamic-programming model for designing zone-scheduled systems, and the computersimulation model for detailed analysis of many possible strategies. By using these tools, the transit operator or planner can design and test a serviceimprovement strategy appropriate for his or her particular situation.
It should be noted that effective implementation of service-improvement strategies need not imply the installation of expensive AVM equipment. Although such equipment is clearly beneficial in implementing headway-based holding strategies, for example, there are many other potential stratP.giP.R that arP. 1 ikely to be just as effective (or perhaps more so) and that require substantially less investment in hardware.
Finally, it is important to emphasize the need for cooperation between transit-operating authorities and municipal departments responsible for streets and traffic signals. Many of the strategies for service improvement described in this paper would require agreement and joint action on the part of both agencies for effective implementation. In order to reach the point of acting together, it is important that they begin to plan together. Communication and agreement on overall goals at an early stage are vital to the success of many of the strategies that seem to be most effective in improving service reliability in transit systems.
ACKNOWLEDGMENT
This research was supported by the Office of University Research, U.S. Department of Transportation. This support is gratefully acknowledged, but the research findings and opinions are solely mine and do not necessarily represent the position of the U.S. Department of Transportation. I would like to thank several individuals, including Mark Abkowitz,
Transportation Research Record 818
Larry Bowman, William Jordan, and Steven Blume, for assistance in this research. Finally, Keith Armstrong of the General Motors Urban Transportation Laboratory in Cincinnati and the staff at Queen City Metro have also been very helpful in making data available from their system.
REFERENCES
1. T.F. Paine, A.N. Nashe, S.J. Hille, and G.A. Brunner. Consumer Conceived Attributes of Transportation--An Attitude Study. Department of Business Administration, Univ. of Maryland, College Park, 1967.
2. T.F. Golob, E.T. Canty, R.L. Gustafson, and J.E. Vi t. An Analysis of Consumer Preferences for a Public Transport System. Transportation Research, Vol. 6, No. 1, 1972, pp. 70-71.
3. R.J. Wallin and P.H. Wright. Factors Which Influence Modal Choice. Traffic Quarterly, Vol. 28, 1968, pp. 271-290.
4. M. Abkowitz, H. Slavin, R. Waksman, L. Englisher, and N. Wilson. Transit Service Reliability. Transportation Systems Center, U.S. Department of Transportation, Rept. UMTA-MA-06-0049-78-1, 1978.
5. M.A. Turnquist and L. Bowman. Control of Service Reliability in Transit Networks. Office of University Research, U.S. Department of Transportation, Rept. DOT/RSPA/DPB-50/79/5, 1979.
6. M.A. Turnquist. Strategies for Improving Bus Transit Service Reliability. Office of University Research, U.S. Department of Transportation, June 1980.
7. V.R. Vuchic. Propagation of Schedule Disturbances in Line-Haul Passenger Transportation. UITP Revue, Vol. 28, 1969, pp. 281-284.
8. M.A. Turnquist and L.A. Bowman. The Effects of Network Structure on Reliability of Transit Service. Transportation Research, Vol. 14B, No. 1/2, 1980, pp. 79-86.
9. P.I. Welding. The Instability of Close Inter-
13
val Service. Operational Research Quarterly, Vol. 8, 1957, pp. 133-148.
10. R.L. Jackson. Evaluation by Simulation of Control Strategies for a High Frequency Bus Service. U.K. Transport and Road Research Laboratory, Crowthorne, Berkshire, England, TRRL Rept. 807, 1977.
11. A. Barnett. On Controlling Randomness in Transit Operations. Transportation Science, Vol. 8, 1974, pp. 102-116.
12. R.L. Jackson. An Evaluation of Bus Control Systems by Simulation. U.K. Transport and Road Research Laboratory, Crowthorne, Berkshire, England, TRRL Rept. 712, 1974.
13. D. Koffman. A Simulation Study of Alternative Real-Time Bus Headway Control Strategies. TRB, Transportation Research Record 663, 1978, pp. 41-46.
14. v. Vuchic. Rapid Transit Interstation Spacing for Maximum Number of Passengers. Transportation Science, Vol. 3, 1969, pp. 214-232.
15. v. Vuchic and G.F. Newell. Rapid Transit Interstation Spacings for Minimum Travel Time. Transportation Science, Vol. 2, 1968, pp. 303-339.
16. H. Mohring. Optimization and Scale Economies in Urban Bus Transportation. American Economic Review, Vol. 62, No. 4, 1972, pp. 591-604.
17. w.c. Jordan and M.A. Turnquist. Zone Scheduling of Bus Routes to Improve Service Reliability. Transportation Science, Vol. 13, 1979, pp. 242-268.
18. K.C. Courage, C.E. Wallar::e, and J.A. Wattleworth. Effect of Bus Priority System Operation on Performance of Traffic Signal Control Equipment on N.W. 7th Avenue. UMTA, U.S. Department of Transportation, Rept. UMTA-FL-06-0006, 1977.
19. Mitre Corporation. Overview of Experimental Bus Priority Systems. UMTA, U.S. Department of Transportation, 1975.
Publication of this paper sponsored by Committee on Traveler Behavior and Values.
Ridership Response to Changes in Transit Services
ARMANDO M. LAGO, PATRICK D. MAYWORM, AND J. MATTHEW McENROE
Evidence on ridership response to changes in transit service is presented. Mean values and standard deviations of transit-service elasticities are presented for changes in headways, vehicle miles, in·vehicle and out-of-vehicle travel time, transfers, and seat availability. A review of the methods used in estimation of demand elasticity is presented as well as suggestions on how service elasticities can be used in joint transit-fare and service-level planning to improve revenues and ridership.
The demand for public transportation has traditionally been regarded as more responsive to changes in transit service (e.g., headways and bus miles) than to changes in transit fares. Although on the aggregate level this may be true, recent evidence shows that service elasticities vary considerably from one area to another by the time of day, type of route, service quality, and other classifications, which suggests that there may be situations in which patronage may be more responsive to fare changes
than to service adjustments. In this paper a summary of the current state of
knowledge on the size of transit-service elasticities is presented compiled f rem demonstrations and demand models. In addition, suggestions are made about how service elasticities can be used in joint transit-fare and service-level planning to improve revenues and ridership.
APPROACHES TO ESTIMATING TRANSIT-SERVICE ELASTICITIES
Nature of Approac hes to Demand Estimation
Two broad approaches to estimating service elasticities may be distinguished. These approaches include (a) monitoring service changes and demonstration studies, or those that rely on data generated either by a practical demonstration of an actual change or