Embed Size (px)
Citation preview
DR B R AMBEDKAR NATIONAL INSTITUTE OF TECHNOLOGY JALANDHAR-144011, INDIA DEPARTMENT OF INDUSTRIAL AND PRODUCTION ENGINEERING
IVTH INTERNATIONAL CONFERENCE ON PRODUCTION AND INDUSTRIAL ENGINEERING, CPIE-2016
1
SUSTAINABLE MACHINING OF SS 410 ALLOY
Navneet Khanna1, Vivek Joshi2, Alokesh Pramanik3 1-2 Department of Mechanical Engineering
IITRAM, Ahmedabad-380002, INDIA 3 Department of Mechanical Engineering
Curtin University, Perth, AUSTRALIA
ABSTRACT
Clean and sustainable manufacturing are one of the cynosures for the recent manufacturing
industries due to the environmental degradation. The huge amount of energy is consumed
during the machining of metal alloys in manufacturing industries, which affects the
environment very badly. Low power consumption along with the high quality products is in
great demand for the industries. This industry oriented scientific study outlines the application
of technology and statistical techniques to make the machining of AISI SS 410 alloy sustainable
by reducing power consumption and surface roughness. The results will be transferred to the
practitioners working in the local small and medium sized enterprises (SMEs).
1. INTRODUCTION
AISI SS 410 alloy is widely used in aerospace industries for bearings, water valves, pumps,
turbines, compressor components, shafting, surgical tools and nuclear applications etc. which
demand high strength and high resistance to wear and corrosion. The AISI SS 410 alloy has
high resistance to corrosion due to the presence of chromium and the alloy is of low cost hence
it is used widely. The increase in the demand of products of this alloy during the last few
decades has led to opt for sustainable machining not only for higher material removal rate but
also for the reduction of wear of cutting tool, the reduction of power consumption, reduction
in surface roughness and complete elimination of finishing operations in most cases thus
reducing the machining cost and making it environmentally sustainable [1]. Since past few
decades, the sustainable machining was not practiced and it was polluting the environment to
a very large extent as the harmful chemicals like used cutting fluids from the machining
industries were thrown into either rivers or in the surrounding areas that ultimately degrade the
quality of the water available for domestic use as well as the vegetation and also the
surrounding environment. Also, the industry uses a large amount of power, mostly in form of
electricity. Generation of electricity leads to the environmental pollution as a large amount of
smoke is released into the atmosphere. Hence, more the energy usage in machining phase
means more CO2 equivalent emissions in environment [2]. The recent manufacturing
industries are constantly striving to decrease its cutting costs and increase the quality of the
machined parts, as the demand for high tolerance manufactured goods is rapidly increasing.
Minimizing the power consumption in the machining phase of a product can save cost and
reduce the global warming potential associated with machining [3].
It is found that there is a lack of scientific approach on monitoring and verification of
performance assessment of installed equipment and utilities among industries in various small
and medium sized enterprises (SME) clusters of India. Several SME units are not aware of the
latest technologies or measures which improve energy efficiency while maintaining the product
quality. It is observed that that power consumption in the industry can be reduced with the
widespread adoption of proven and commercially available technologies and techniques, which
DR B R AMBEDKAR NATIONAL INSTITUTE OF TECHNOLOGY JALANDHAR-144011, INDIA DEPARTMENT OF INDUSTRIAL AND PRODUCTION ENGINEERING
IVTH INTERNATIONAL CONFERENCE ON PRODUCTION AND INDUSTRIAL ENGINEERING, CPIE-2016
2
will improve energy efficiency and produce global benefits from reduced Green House Gasses
(GHGs) emissions.
This paper presents a real industry supported study. The study illustrated is well-thought-out
experiments and not simply a few experimental tests to discover the effects of changing one or
more parameters at a time. The study will deliver a good base for practitioners working in SME
clusters on how to go about executing an experiment in real industrial settings. The study will
cover the literature review, experimental details, experimental design, analysis using Minitab
software (Trial version), and analysis of results and conclusion of the study. This study will
increase the awareness of the application of technology (power and energy quality analyzer
and surface roughness tester) and statistical techniques (DOE), among local SME clusters and
there potential in tackling process optimization difficulties related to power consumption and
surface roughness during machining processes.
2. LITERATURE REVIEW
Recently, looking to the trends in advancement of machining, dry machining is often
considered desirable to avoid the extra costs and environmental problems associated with
cutting fluids [4, 5].
Cebelli et al. [6] studied the machining characteristics of stainless steel in turning processes.
They found that the surface roughness increased when the depth of cut and feed rate were
increased; while increasing the cutting speed the surface roughness was found to be decreased.
Nikolaos et al. [7] developed surface roughness model for turning of AISI 316 with
TiN/Al2O3/TiC coated carbide tool and was found to be close to the actual results.
Xavier and Adithan [8] worked on determining the influence of cutting fluids on tool wear and
the surface roughness during tuning of AISI 304 with a carbide cutting tool. The coconut oil
was used as compared to other cutting fluids. It was found that the coconut oil had a significant
effect in reducing the tool wear and the surface finish was found better. This was explained by
the reason being the good thermal and oxidative stability.
Ozel et al. [9] worked on Determination of optimum cutting parameters during machining of
AISI 304 austenitic stainless steel. The turning operation was done using cemented carbide
cutting tools. Finally, as a result, it was observed that there was a decrease in tool wear with
increasing the cutting speed up to 180 m/min. Surface roughness (Ra) was also decreased with
increasing the cutting speed. The relation between surface roughness/ tool wear and the chips
was also obtained.
Noordin et al. [10] found out the tool wear during the turning of AISI 1018. The wear land was
measured and the tool life was checked. It was found out that cutting speed and feed have a
significant effect on the tool wear.
Agarwal et al. [11] compared the RSM and Taguchi’s Technique by studying the effects of
cutting speed, feed rate, depth of cut, nose radius and cutting environment in CNC turning of
AISI P-20 tool steel. They applied RSM and Taguchi’s technique to carry out the
experimentation. It was found that the feed rate and the nose radius were significantly affecting
factors. Also, the RSM technique was found to be little more effective as compared to the
Taguchi’s method while verifying the mathematical relation thus obtained.
Bhattacharya et al. [12] estimated the effect of cutting parameters in high speed machining of
AISI 1045 using Taguchi design and ANOVA. The output responses were taken as Surface
roughness and power consumption.
Khanna and Davim [13] applied Design of Experiments (DOE) on machining of different
grades of titanium (Ti6Al4V, Ti54M and Ti10.2.3) to investigate the effect of cutting speed
and feed rate on the cutting forces and the temperature rise. It was finally concluded that feed

DR B R AMBEDKAR NATIONAL INSTITUTE OF TECHNOLOGY JALANDHAR-144011, INDIA DEPARTMENT OF INDUSTRIAL AND PRODUCTION ENGINEERING
IVTH INTERNATIONAL CONFERENCE ON PRODUCTION AND INDUSTRIAL ENGINEERING, CPIE-2016
3
rate was the most influential factor which affects the cutting and feed forces, while the cutting
speed had most significant effect on the cutting tool temperature.
Jawahir et al. [14] presented an overview of major cryogenic manufacturing processes. The
analysis of the product was done on the basis of quality and finally proceeded to the analysis
of process mechanics and material performance covering different interactions like thermo-
mechanical and tribological.
Arrazola et al. [15] investigated the recent advances in the modelling of machining and their
predictive performance. He prepared a report on combined work done by Industries and the
academic institutes in the modelling of machining.
Kant and Sangwan [16] provided a multi-objective predictive model for the minimization of
power consumption and surface roughness using grey relational analysis with principal
component analysis and RSM. It was concluded that the feed had the most significant effect on
the response, followed by depth of cut and cutting speed.
It is found in the available literature that so far no efforts have been made toward optimization
of machining parameters for minimizing both power consumption and surface roughness
during machining of AISI 410 martensitic stainless steel. This paper is an attempt to fill this
gap in the research.
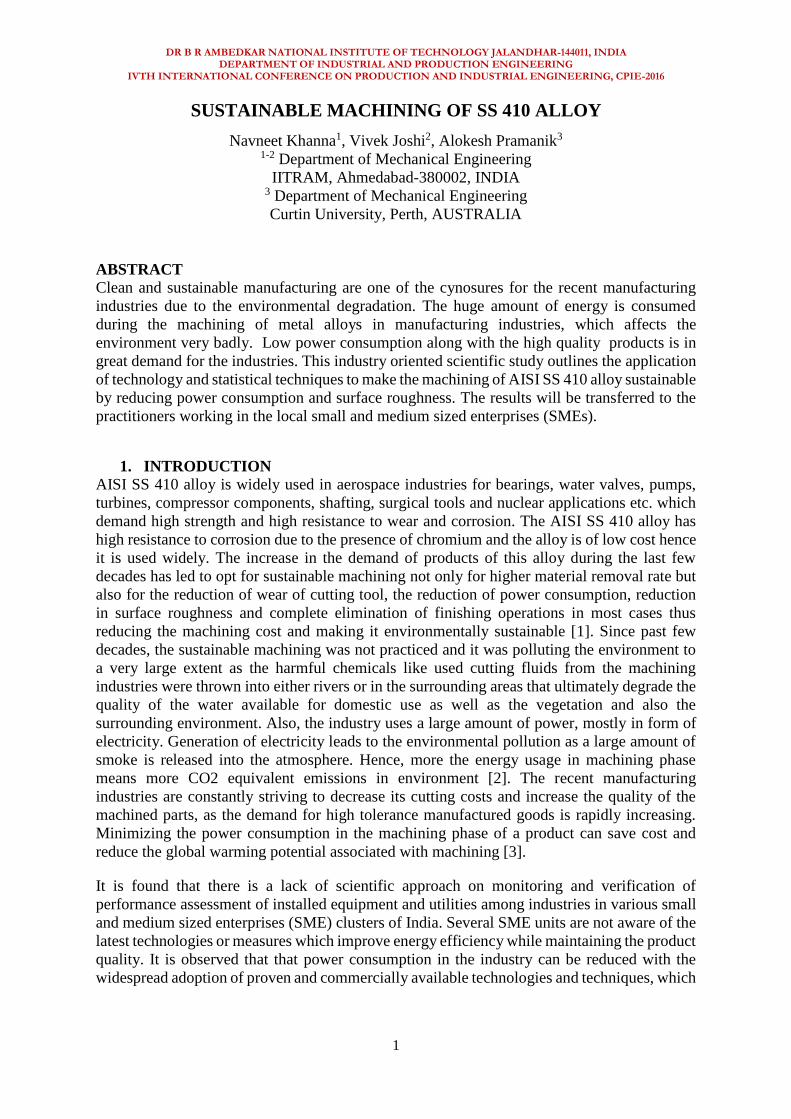
3. EXPERIMENTAL SETUP
Machining tests were carried out on a conventional lathe machine as well on a CNC turning
Center. The basic objective behind the use of both conventional lathe and CNC turning center
is their existing usage in the local SME clusters. Stainless Steel AISI SS 410 was selected as a
work piece material. The chemical composition of the work piece material is given in Table 1.
Taylor Hobson Surtonic S-100 series roughness tester was used for the measurement of surface
roughness. To minimize the experimental error each measurement of surface roughness was
repeated three times and only the average values were reported. Fluke 435 Series II Power
Quality and Energy Analyzer has been used to capture the power utilized during each cutting
test. Fig. 1 shows representation of the experimental setup.
DR B R AMBEDKAR NATIONAL INSTITUTE OF TECHNOLOGY JALANDHAR-144011, INDIA DEPARTMENT OF INDUSTRIAL AND PRODUCTION ENGINEERING
IVTH INTERNATIONAL CONFERENCE ON PRODUCTION AND INDUSTRIAL ENGINEERING, CPIE-2016
4
Fig.1. Experimental setup
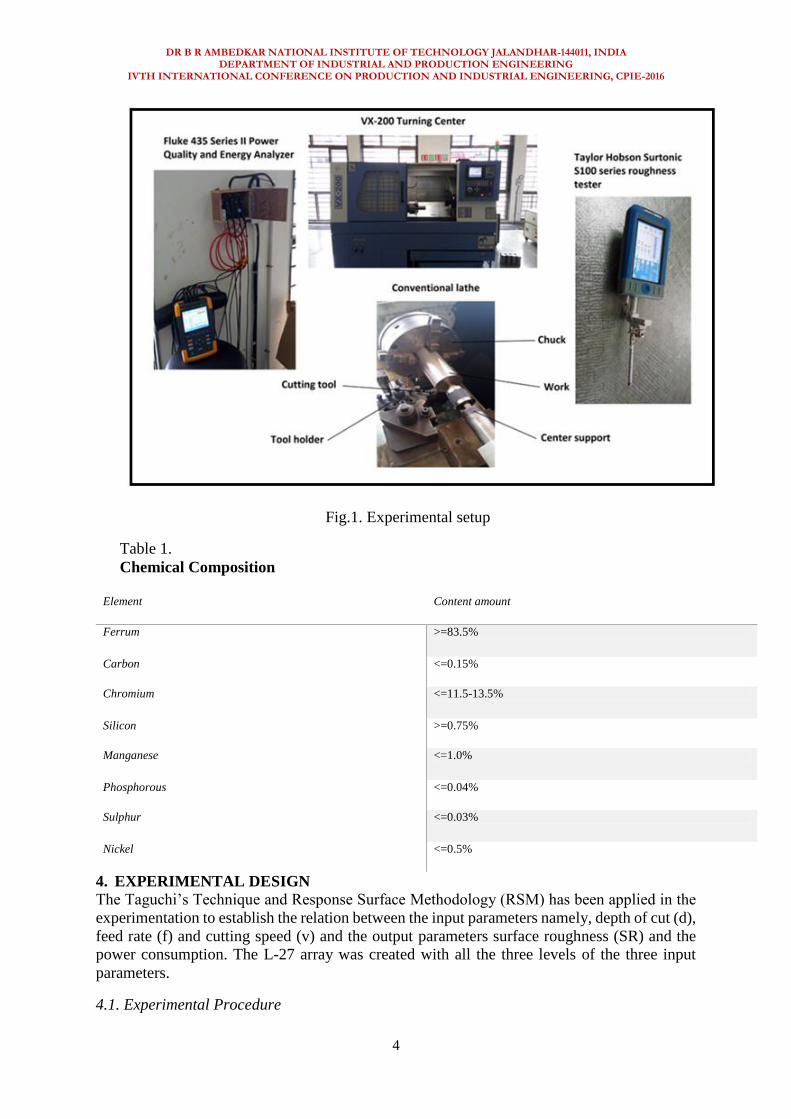
Table 1.
Chemical Composition
Element Content amount
Ferrum >=83.5%
Carbon <=0.15%
Chromium <=11.5-13.5%
Silicon >=0.75%
Manganese <=1.0%
Phosphorous <=0.04%
Sulphur <=0.03%
Nickel <=0.5%
4. EXPERIMENTAL DESIGN
The Taguchi’s Technique and Response Surface Methodology (RSM) has been applied in the
experimentation to establish the relation between the input parameters namely, depth of cut (d),
feed rate (f) and cutting speed (v) and the output parameters surface roughness (SR) and the
power consumption. The L-27 array was created with all the three levels of the three input
parameters.
4.1. Experimental Procedure
DR B R AMBEDKAR NATIONAL INSTITUTE OF TECHNOLOGY JALANDHAR-144011, INDIA DEPARTMENT OF INDUSTRIAL AND PRODUCTION ENGINEERING
IVTH INTERNATIONAL CONFERENCE ON PRODUCTION AND INDUSTRIAL ENGINEERING, CPIE-2016
5
The sponsored material was procured in the form of long bar of 1500mm of diameter 82 mm.
It was then cut into 9 equal pieces and the material was turned on a lathe machine so as to free
the surface from the rust and dust and were made to 81mm diameter. Then the pieces were
loaded on a lathe machine and were turned by 27 different combinations of the levels of the
input parameters. The experimentation was carried out using 3 levels in each of the input
parameters. They are shown in the table 2. The material, characteristics of tool and detailed
experimental setup is described in Table 3. The full factorial methodology, Taguchi technique
and Response Surface Methodology (RSM) are used to conduct the experimentation. The L-
27 orthogonal array has been formed with all the possible combinations of the input parameters.
The output/ response parameters are mentioned in the Table.4
Table 2. Cutting parameters
Coded values -1 0 1
Cutting speed (m/min) 94 142 212
Feed (mm/rev) 0.11 0.13 0.167
Depth of cut (mm) 0.5 1 1.5
Table 3.
Setup equipment and machining condition
Conventional Lathe Banka’s Lathe, 2.2 kW power rating
CNC Turning Center Mac Power CNC VX 200
Work piece AISI SS 410
Cutting Condition Dry
Cutting insert on Lathe CNMG
Cutting insert on CNC DNMG
Tool material Tungsten Carbide
Tool holder on Lathe MCLNR Lathe Turning Tool-Holder, 20x20mm
Shank Right Hand
Tool holder on CNC MCLNR CNC Turning Tool-Holder, 25x25mm
Shank left handed
DR B R AMBEDKAR NATIONAL INSTITUTE OF TECHNOLOGY JALANDHAR-144011, INDIA DEPARTMENT OF INDUSTRIAL AND PRODUCTION ENGINEERING
IVTH INTERNATIONAL CONFERENCE ON PRODUCTION AND INDUSTRIAL ENGINEERING, CPIE-2016
6
Table 4. Response Parameters
Entity Short form Unit
Power Consumption Pow Watt (W)
Surface Roughness SR µm (micro-meter)
Surface roughness on CNC SRcnc µm (micro-meter)
Then the results were recorded and graphs of power consumption and surface roughness versus
time were obtained for each reading.
5. EXPERIMENTAL RESULTS
The results of the experiment are shown in Table. 5
Table.5. The Experimental Results
Control variables Average of Responses
Control Variables Response Variables
Ex. No v f d SR Pow SRCNC
1 212 0.11 0.5 0.97 1890 0.7
2 212 0.11 1 0.3 1920 0.8
3 212 0.11 1.5 0.83 2028 0.7
4 212 0.13 0.5 0.87 1800 1.05
5 212 0.13 1 0.9 1965 1.65
6 212 0.13 1.5 1.34 2040 1.35
7 212 0.17 0.5 0.77 1815 1.4
8 212 0.17 1 1.37 1980 0.35
9 212 0.17 1.5 1.7 2160 1.2
10 142 0.11 0.5 1.37 1740 1.15
11 142 0.11 1 1.2 1860 1.3
12 142 0.11 1.5 1.37 1920 1.3
13 142 0.13 0.5 1.37 1800 1.25
14 142 0.13 1 1.1 1860 1.3
15 142 0.13 1.5 0.59 1920 1.75
16 142 0.17 0.5 1.67 1800 1.25
17 142 0.17 1 2.0 1860 1.35
18 142 0.17 1.5 2.03 1980 1.3
19 94 0.11 0.5 0.7 1740 1.2
20 94 0.11 1 1.2 1740 0.8
21 94 0.11 1.5 1.1 1800 0.9
22 94 0.13 0.5 1.3 1800 1.2
23 94 0.13 1 1.3 1860 1.8
DR B R AMBEDKAR NATIONAL INSTITUTE OF TECHNOLOGY JALANDHAR-144011, INDIA DEPARTMENT OF INDUSTRIAL AND PRODUCTION ENGINEERING
IVTH INTERNATIONAL CONFERENCE ON PRODUCTION AND INDUSTRIAL ENGINEERING, CPIE-2016
7
24 94 0.13 1.5 1.44 1800 0.8
25 94 0.17 0.5 1.84 1740 1.15
26 94 0.17 1 1.5 1740 1.25
27 94 0.17 1.5 0.7 1813 1.2
1.1. Surface roughness in Lathe using RSM
After taking the readings, response surface methodology was applied using Minitab 17 (Trial
version) on the response data and the following relation between the cutting parameters and
the surface roughness was obtained.
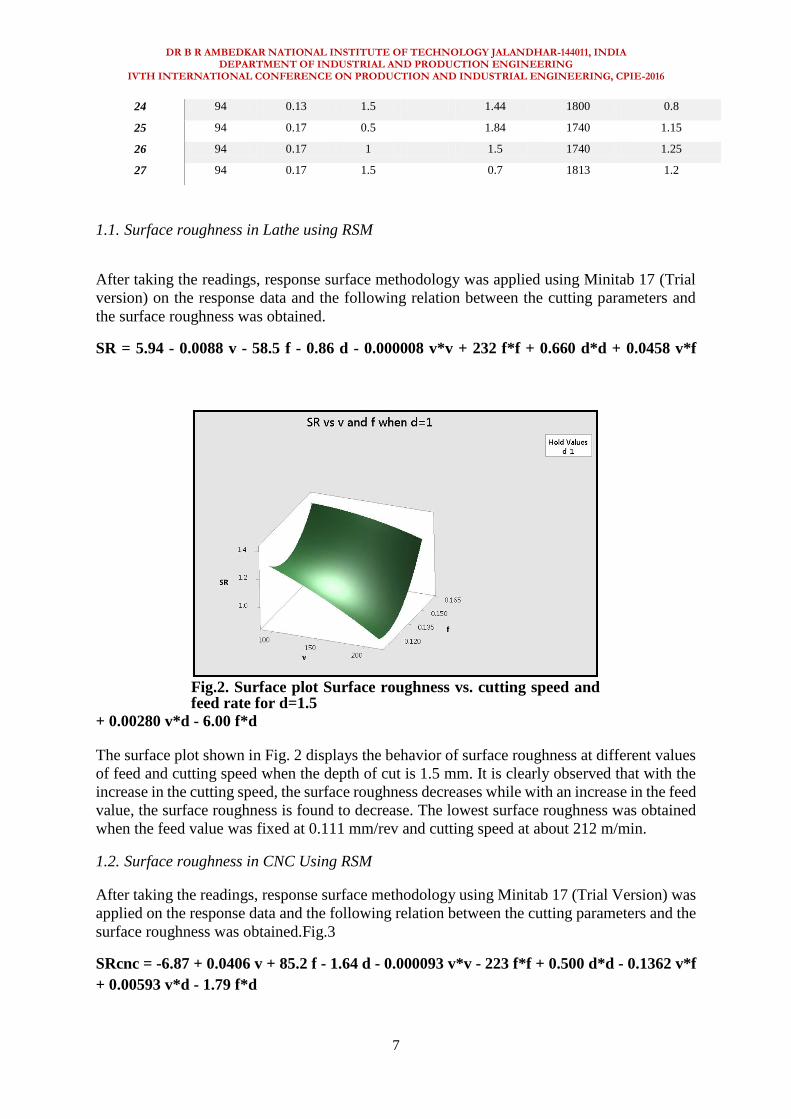
SR = 5.94 - 0.0088 v - 58.5 f - 0.86 d - 0.000008 v*v + 232 f*f + 0.660 d*d + 0.0458 v*f
+ 0.00280 v*d - 6.00 f*d
The surface plot shown in Fig. 2 displays the behavior of surface roughness at different values
of feed and cutting speed when the depth of cut is 1.5 mm. It is clearly observed that with the
increase in the cutting speed, the surface roughness decreases while with an increase in the feed
value, the surface roughness is found to decrease. The lowest surface roughness was obtained
when the feed value was fixed at 0.111 mm/rev and cutting speed at about 212 m/min.
1.2. Surface roughness in CNC Using RSM
After taking the readings, response surface methodology using Minitab 17 (Trial Version) was
applied on the response data and the following relation between the cutting parameters and the
surface roughness was obtained.Fig.3
SRcnc = -6.87 + 0.0406 v + 85.2 f - 1.64 d - 0.000093 v*v - 223 f*f + 0.500 d*d - 0.1362 v*f
+ 0.00593 v*d - 1.79 f*d
Fig.2. Surface plot Surface roughness vs. cutting speed and feed rate for d=1.5
DR B R AMBEDKAR NATIONAL INSTITUTE OF TECHNOLOGY JALANDHAR-144011, INDIA DEPARTMENT OF INDUSTRIAL AND PRODUCTION ENGINEERING
IVTH INTERNATIONAL CONFERENCE ON PRODUCTION AND INDUSTRIAL ENGINEERING, CPIE-2016
8
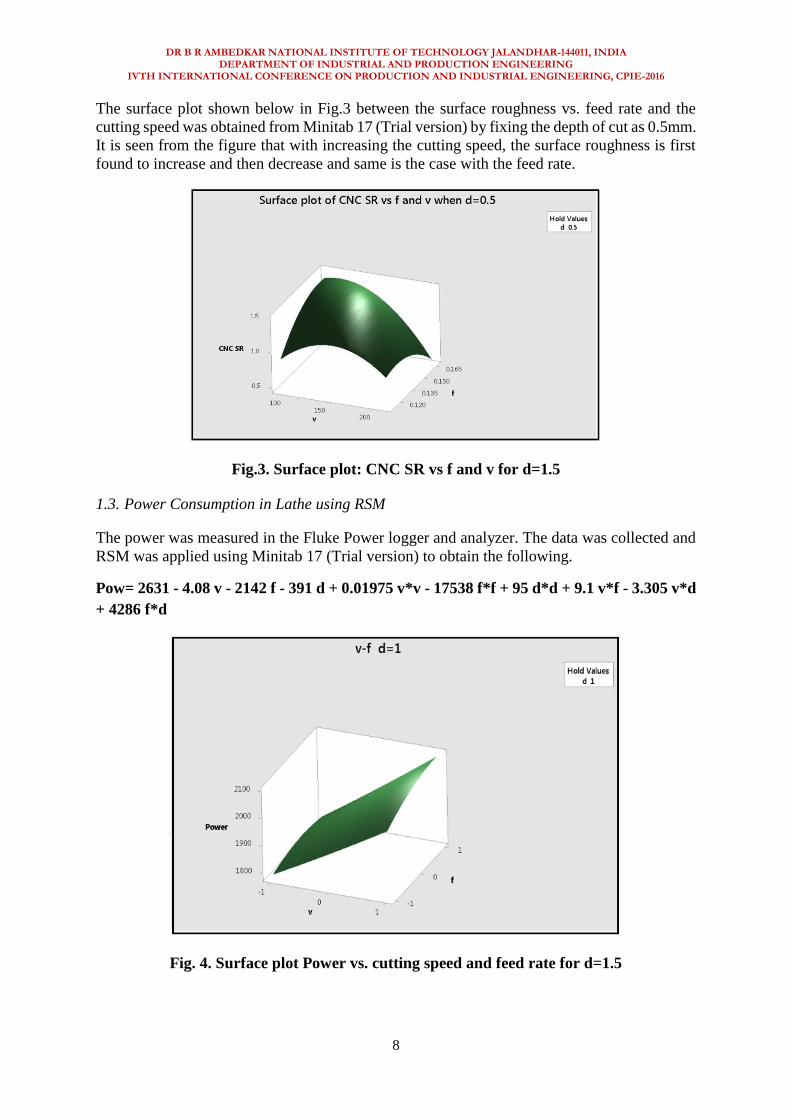
The surface plot shown below in Fig.3 between the surface roughness vs. feed rate and the
cutting speed was obtained from Minitab 17 (Trial version) by fixing the depth of cut as 0.5mm.
It is seen from the figure that with increasing the cutting speed, the surface roughness is first
found to increase and then decrease and same is the case with the feed rate.
Fig.3. Surface plot: CNC SR vs f and v for d=1.5
1.3. Power Consumption in Lathe using RSM
The power was measured in the Fluke Power logger and analyzer. The data was collected and
RSM was applied using Minitab 17 (Trial version) to obtain the following.
Pow= 2631 - 4.08 v - 2142 f - 391 d + 0.01975 v*v - 17538 f*f + 95 d*d + 9.1 v*f - 3.305 v*d
+ 4286 f*d
Fig. 4. Surface plot Power vs. cutting speed and feed rate for d=1.5
DR B R AMBEDKAR NATIONAL INSTITUTE OF TECHNOLOGY JALANDHAR-144011, INDIA DEPARTMENT OF INDUSTRIAL AND PRODUCTION ENGINEERING
IVTH INTERNATIONAL CONFERENCE ON PRODUCTION AND INDUSTRIAL ENGINEERING, CPIE-2016
9
It is clearly visible from the above Fig.4 that as the cutting speed increases, the power consumed
also increases. Also with the increase in the feed value, the power consumption in seen to
increase. The minimum power consumption is found the least at the minimum cutting speed
and the feed values of 94 m/min and 0.11 mm/rev respectively.
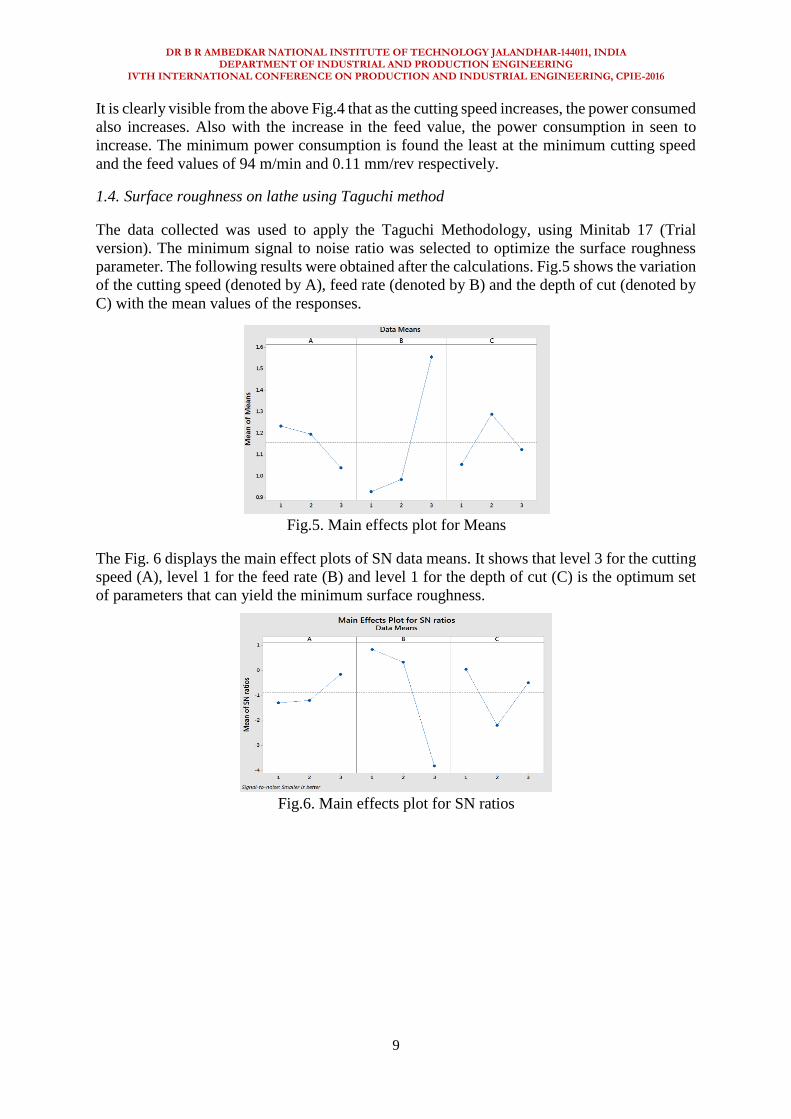
1.4. Surface roughness on lathe using Taguchi method
The data collected was used to apply the Taguchi Methodology, using Minitab 17 (Trial
version). The minimum signal to noise ratio was selected to optimize the surface roughness
parameter. The following results were obtained after the calculations. Fig.5 shows the variation
of the cutting speed (denoted by A), feed rate (denoted by B) and the depth of cut (denoted by
C) with the mean values of the responses.
Fig.5. Main effects plot for Means
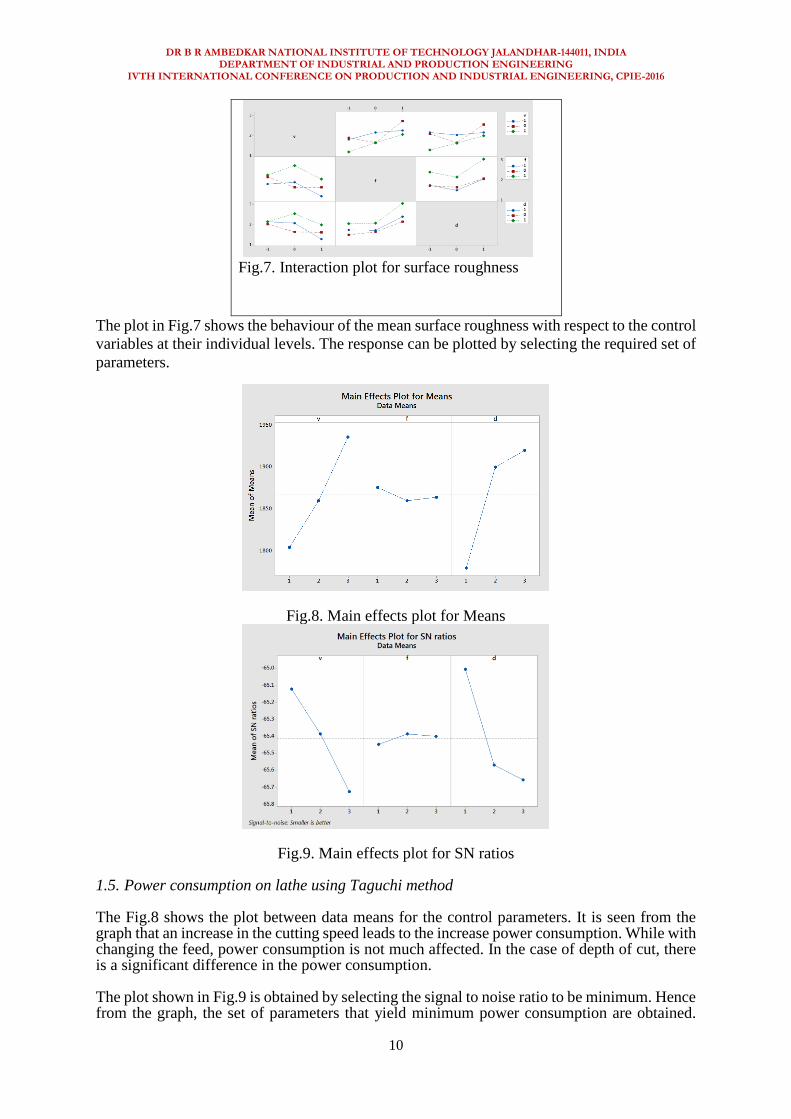
The Fig. 6 displays the main effect plots of SN data means. It shows that level 3 for the cutting
speed (A), level 1 for the feed rate (B) and level 1 for the depth of cut (C) is the optimum set
of parameters that can yield the minimum surface roughness.
Fig.6. Main effects plot for SN ratios
DR B R AMBEDKAR NATIONAL INSTITUTE OF TECHNOLOGY JALANDHAR-144011, INDIA DEPARTMENT OF INDUSTRIAL AND PRODUCTION ENGINEERING
IVTH INTERNATIONAL CONFERENCE ON PRODUCTION AND INDUSTRIAL ENGINEERING, CPIE-2016
10
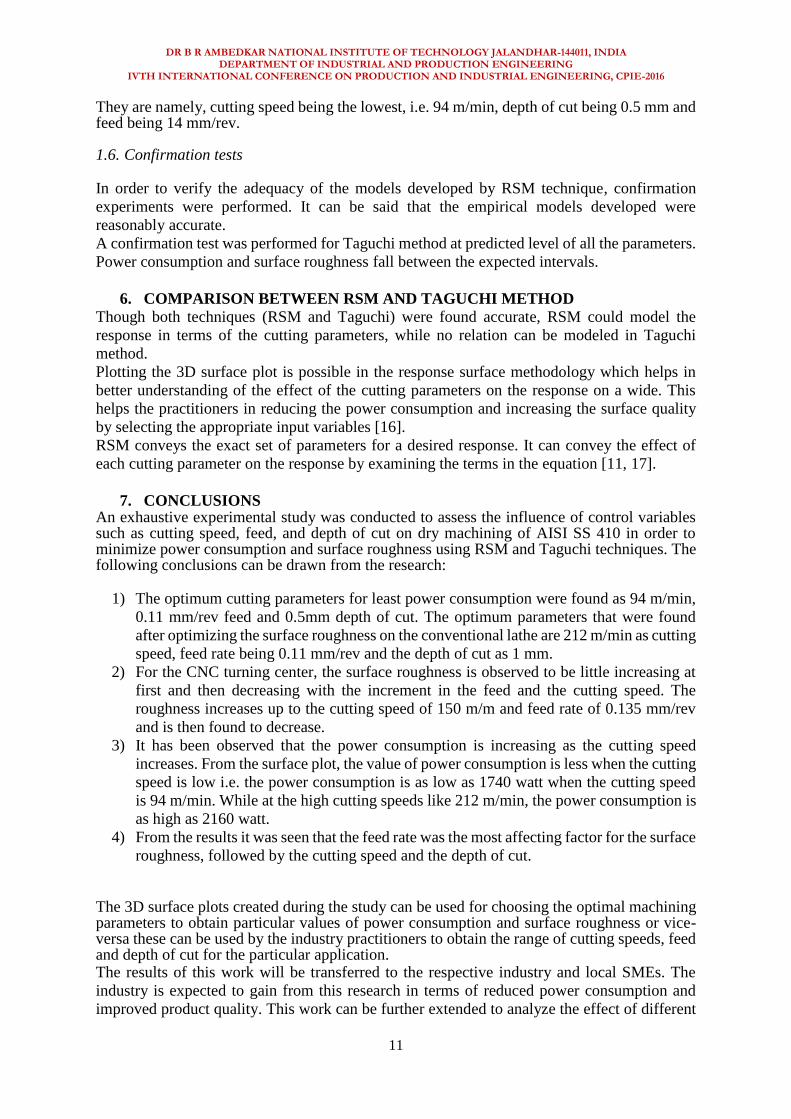
Fig.7. Interaction plot for surface roughness
The plot in Fig.7 shows the behaviour of the mean surface roughness with respect to the control
variables at their individual levels. The response can be plotted by selecting the required set of
parameters.
Fig.8. Main effects plot for Means
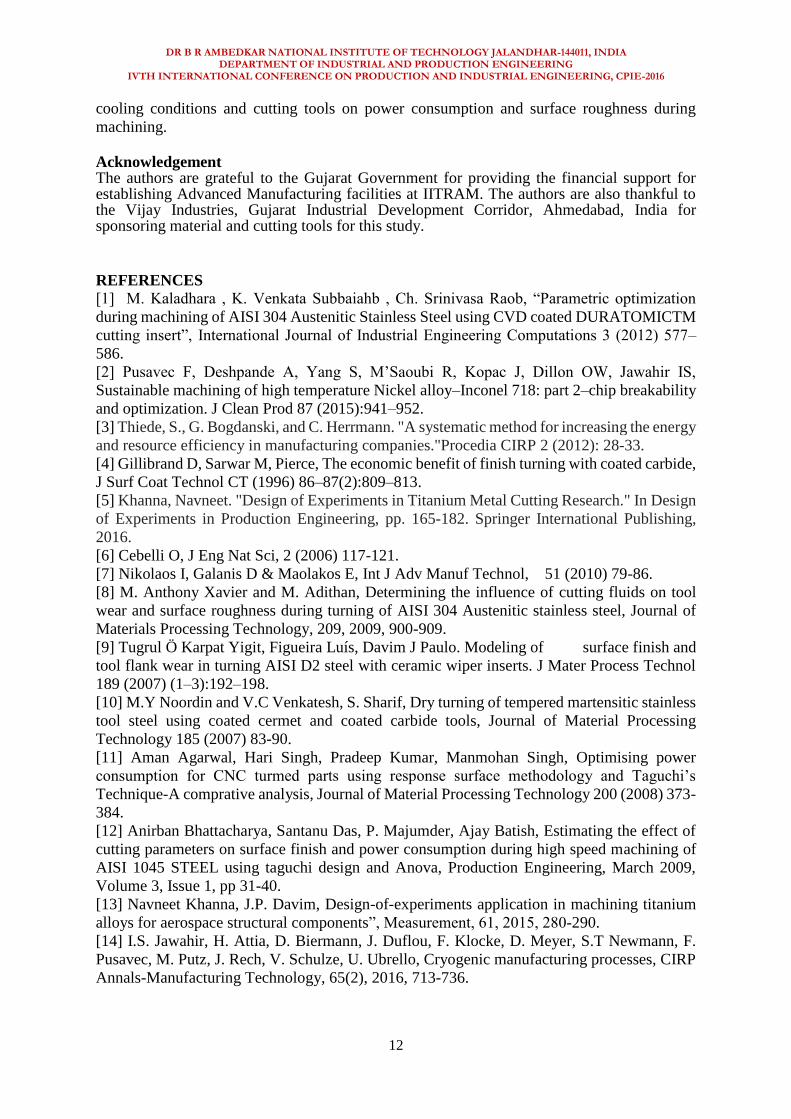
Fig.9. Main effects plot for SN ratios
1.5. Power consumption on lathe using Taguchi method
The Fig.8 shows the plot between data means for the control parameters. It is seen from the graph that an increase in the cutting speed leads to the increase power consumption. While with changing the feed, power consumption is not much affected. In the case of depth of cut, there is a significant difference in the power consumption.
The plot shown in Fig.9 is obtained by selecting the signal to noise ratio to be minimum. Hence from the graph, the set of parameters that yield minimum power consumption are obtained.
DR B R AMBEDKAR NATIONAL INSTITUTE OF TECHNOLOGY JALANDHAR-144011, INDIA DEPARTMENT OF INDUSTRIAL AND PRODUCTION ENGINEERING
IVTH INTERNATIONAL CONFERENCE ON PRODUCTION AND INDUSTRIAL ENGINEERING, CPIE-2016
11
They are namely, cutting speed being the lowest, i.e. 94 m/min, depth of cut being 0.5 mm and feed being 14 mm/rev.
1.6. Confirmation tests
In order to verify the adequacy of the models developed by RSM technique, confirmation
experiments were performed. It can be said that the empirical models developed were
reasonably accurate.
A confirmation test was performed for Taguchi method at predicted level of all the parameters.
Power consumption and surface roughness fall between the expected intervals.
6. COMPARISON BETWEEN RSM AND TAGUCHI METHOD
Though both techniques (RSM and Taguchi) were found accurate, RSM could model the
response in terms of the cutting parameters, while no relation can be modeled in Taguchi
method.
Plotting the 3D surface plot is possible in the response surface methodology which helps in
better understanding of the effect of the cutting parameters on the response on a wide. This
helps the practitioners in reducing the power consumption and increasing the surface quality
by selecting the appropriate input variables [16].
RSM conveys the exact set of parameters for a desired response. It can convey the effect of
each cutting parameter on the response by examining the terms in the equation [11, 17].
7. CONCLUSIONS An exhaustive experimental study was conducted to assess the influence of control variables such as cutting speed, feed, and depth of cut on dry machining of AISI SS 410 in order to minimize power consumption and surface roughness using RSM and Taguchi techniques. The following conclusions can be drawn from the research:
1) The optimum cutting parameters for least power consumption were found as 94 m/min,
0.11 mm/rev feed and 0.5mm depth of cut. The optimum parameters that were found
after optimizing the surface roughness on the conventional lathe are 212 m/min as cutting
speed, feed rate being 0.11 mm/rev and the depth of cut as 1 mm.
2) For the CNC turning center, the surface roughness is observed to be little increasing at
first and then decreasing with the increment in the feed and the cutting speed. The
roughness increases up to the cutting speed of 150 m/m and feed rate of 0.135 mm/rev
and is then found to decrease.
3) It has been observed that the power consumption is increasing as the cutting speed
increases. From the surface plot, the value of power consumption is less when the cutting
speed is low i.e. the power consumption is as low as 1740 watt when the cutting speed
is 94 m/min. While at the high cutting speeds like 212 m/min, the power consumption is
as high as 2160 watt.
4) From the results it was seen that the feed rate was the most affecting factor for the surface
roughness, followed by the cutting speed and the depth of cut.
The 3D surface plots created during the study can be used for choosing the optimal machining parameters to obtain particular values of power consumption and surface roughness or vice-versa these can be used by the industry practitioners to obtain the range of cutting speeds, feed and depth of cut for the particular application. The results of this work will be transferred to the respective industry and local SMEs. The
industry is expected to gain from this research in terms of reduced power consumption and
improved product quality. This work can be further extended to analyze the effect of different
DR B R AMBEDKAR NATIONAL INSTITUTE OF TECHNOLOGY JALANDHAR-144011, INDIA DEPARTMENT OF INDUSTRIAL AND PRODUCTION ENGINEERING
IVTH INTERNATIONAL CONFERENCE ON PRODUCTION AND INDUSTRIAL ENGINEERING, CPIE-2016
12
cooling conditions and cutting tools on power consumption and surface roughness during
machining.
Acknowledgement The authors are grateful to the Gujarat Government for providing the financial support for establishing Advanced Manufacturing facilities at IITRAM. The authors are also thankful to the Vijay Industries, Gujarat Industrial Development Corridor, Ahmedabad, India for sponsoring material and cutting tools for this study.
REFERENCES [1] M. Kaladhara , K. Venkata Subbaiahb , Ch. Srinivasa Raob, “Parametric optimization
during machining of AISI 304 Austenitic Stainless Steel using CVD coated DURATOMICTM
cutting insert”, International Journal of Industrial Engineering Computations 3 (2012) 577–
586.
[2] Pusavec F, Deshpande A, Yang S, M’Saoubi R, Kopac J, Dillon OW, Jawahir IS,
Sustainable machining of high temperature Nickel alloy–Inconel 718: part 2–chip breakability
and optimization. J Clean Prod 87 (2015):941–952.
[3] Thiede, S., G. Bogdanski, and C. Herrmann. "A systematic method for increasing the energy
and resource efficiency in manufacturing companies."Procedia CIRP 2 (2012): 28-33.
[4] Gillibrand D, Sarwar M, Pierce, The economic benefit of finish turning with coated carbide,
J Surf Coat Technol CT (1996) 86–87(2):809–813.
[5] Khanna, Navneet. "Design of Experiments in Titanium Metal Cutting Research." In Design
of Experiments in Production Engineering, pp. 165-182. Springer International Publishing,
2016.
[6] Cebelli O, J Eng Nat Sci, 2 (2006) 117-121.
[7] Nikolaos I, Galanis D & Maolakos E, Int J Adv Manuf Technol, 51 (2010) 79-86.
[8] M. Anthony Xavier and M. Adithan, Determining the influence of cutting fluids on tool
wear and surface roughness during turning of AISI 304 Austenitic stainless steel, Journal of
Materials Processing Technology, 209, 2009, 900-909.
[9] Tugrul Ö Karpat Yigit, Figueira Luís, Davim J Paulo. Modeling of surface finish and
tool flank wear in turning AISI D2 steel with ceramic wiper inserts. J Mater Process Technol
189 (2007) (1–3):192–198.
[10] M.Y Noordin and V.C Venkatesh, S. Sharif, Dry turning of tempered martensitic stainless
tool steel using coated cermet and coated carbide tools, Journal of Material Processing
Technology 185 (2007) 83-90.
[11] Aman Agarwal, Hari Singh, Pradeep Kumar, Manmohan Singh, Optimising power
consumption for CNC turmed parts using response surface methodology and Taguchi’s
Technique-A comprative analysis, Journal of Material Processing Technology 200 (2008) 373-
384.
[12] Anirban Bhattacharya, Santanu Das, P. Majumder, Ajay Batish, Estimating the effect of
cutting parameters on surface finish and power consumption during high speed machining of
AISI 1045 STEEL using taguchi design and Anova, Production Engineering, March 2009,
Volume 3, Issue 1, pp 31-40.
[13] Navneet Khanna, J.P. Davim, Design-of-experiments application in machining titanium
alloys for aerospace structural components”, Measurement, 61, 2015, 280-290.
[14] I.S. Jawahir, H. Attia, D. Biermann, J. Duflou, F. Klocke, D. Meyer, S.T Newmann, F.
Pusavec, M. Putz, J. Rech, V. Schulze, U. Ubrello, Cryogenic manufacturing processes, CIRP
Annals-Manufacturing Technology, 65(2), 2016, 713-736.

DR B R AMBEDKAR NATIONAL INSTITUTE OF TECHNOLOGY JALANDHAR-144011, INDIA DEPARTMENT OF INDUSTRIAL AND PRODUCTION ENGINEERING
IVTH INTERNATIONAL CONFERENCE ON PRODUCTION AND INDUSTRIAL ENGINEERING, CPIE-2016
13
[15] P.J. Arrazola, T. Özel, D. Umbrello, M. Davies, I.S. Jawahir, Recent advances in
modelling of metal machining processes, CIRP Annals - Manufacturing Technology, Volume
62, Issue 2, 2013, Pages 695–718.
[16] Girish Kant, Kuldip Singh Sangwan, Prediction and optimization of machining parameters
for minimizing power consumption and surface roughness in machining, Journal of Cleaner
Production, Volume 83, 15 November 2014, Pages 151–164.
[17] Ilhan Asilturk and Suleyman Neseli, Multi response optimization of CNC turning
parameters via Taguchi based response surface analysis, Measurement, 45 (2012) 785-794.