Embed Size (px)
Citation preview
56
Syarat Mutu Roti Tawar
No Kriteria uji Satuan Persyaratan 1 1.1 1.2 1.3 2. 3. 4. 5. 6. 7. 8. 9. 9.1. 9.2. 9.3. 9.4. 10. 10.1 10.2 10.3 10.4 11. 12. 12.1. 12.2. 12.3.
Keadaan Kenampakan Bau Rasa Air Abu (tidak termasuk garam dihitung atas dasar bahan kering) Abu yang tidak larut dalam asam. NaCl Gula jumlah Lemak Serangga / belatung Bahan tambahan makanan Pengawet Pewarna Pemanis buatan Sakarin siklamat Cemaran logam Raksa (Hg) Timbal (Pb) Tembaga (Cu) Seng (Zn) Cemaran arsen (As) Cemaran mikroba Angka lempeng total E.Coli Kapang
- - -
% b/b % b/b
% b/b % b/b % b/b % b/b
-
Sesuai SNI 0222-1987
mg/kg mg/kg mg/kg mg/kg mg/kg
koloni/g APM/g
Koloni/g
Normal,tdk berjamur Normal Normal Maks 40 Maks 1 Maks 3,0 Maks 2,5 - - Tidak boleh ada Negatif Maks 0,05 Maks 1,0 Maks 10,0 Maks 40,0 Maks 0,5 Maks 106 <3 Maks 104
Sumber : SNI 01-3840-1995
57
KUESIONER
UJI RANKING HEDONIK Nama : Tanggal Uji : Produk : Bread Atribut : overall rasa Instruksi Di hadapan anda tersedia 4 sampel bread. Cicipilah sampel secara berurutan dari kiri ke kanan. Anda boleh mengulang sesering yang Anda perlukan.Setiap akan mencicipi sampel yang berbeda berkumurlah dengan air tawar selama kurang lebih 30 detik. Berilah penilaian dengan kisaran nilai 1-4 Antar sampel tidak boleh memiliki nilai yang sama. 1 = paling tidak suka 2 = tidak suka 3 = suka 4 = paling suka
Kode sampel Ranking
UJI RANKING HEDONIK Nama : Tanggal Uji : Produk : Bread Atribut : overall tekstur Instruksi Di hadapan anda tersedia 4 sampel bread. Cicipilah sampel secara berurutan dari kiri ke kanan. Anda boleh mengulang sesering yang Anda perlukan. Setiap akan mencicipi sampel yang berbeda berkumurlah dengan air tawar selama kurang lebih 30 detik. Berilah penilaian dengan kisaran nilai 1-4. Antar sampel tidak boleh memiliki nilai yang sama. 1 = paling tidak suka 2 = tidak suka 3 = suka 4 = paling suka
Kode sampel Ranking
58
UJI RANKING HEDONIK Nama : Tanggal Uji : Produk : Bread Atribut : overall aroma Instruksi Di hadapan anda tersedia 4 sampel bread. Ciumlah sampel secara berurutan dari kiri ke kanan. Anda boleh mengulang sesering yang Anda perlukan. Berilah penilaian dengan kisaran nilai 1-4. Antar sampel tidak boleh memiliki nilai yang sama. 1 = paling tidak suka 2 = tidak suka 3 = suka 4 = paling suka
Kode sampel Ranking
UJI RANKING HEDONIK Nama : Tanggal Uji : Produk : Bread Atribut : overall warna Instruksi Di hadapan anda tersedia 4 sampel bread. Amatilah sampel secara berurutan dari kiri ke kanan. Anda boleh mengulang sesering yang Anda perlukan. Berilah penilaian dengan kisaran nilai 1-4. Antar sampel boleh memiliki nilai yang sama. 1 = paling tidak suka 2 = tidak suka 3 = suka 4 = paling suka
Kode sampel Ranking
59
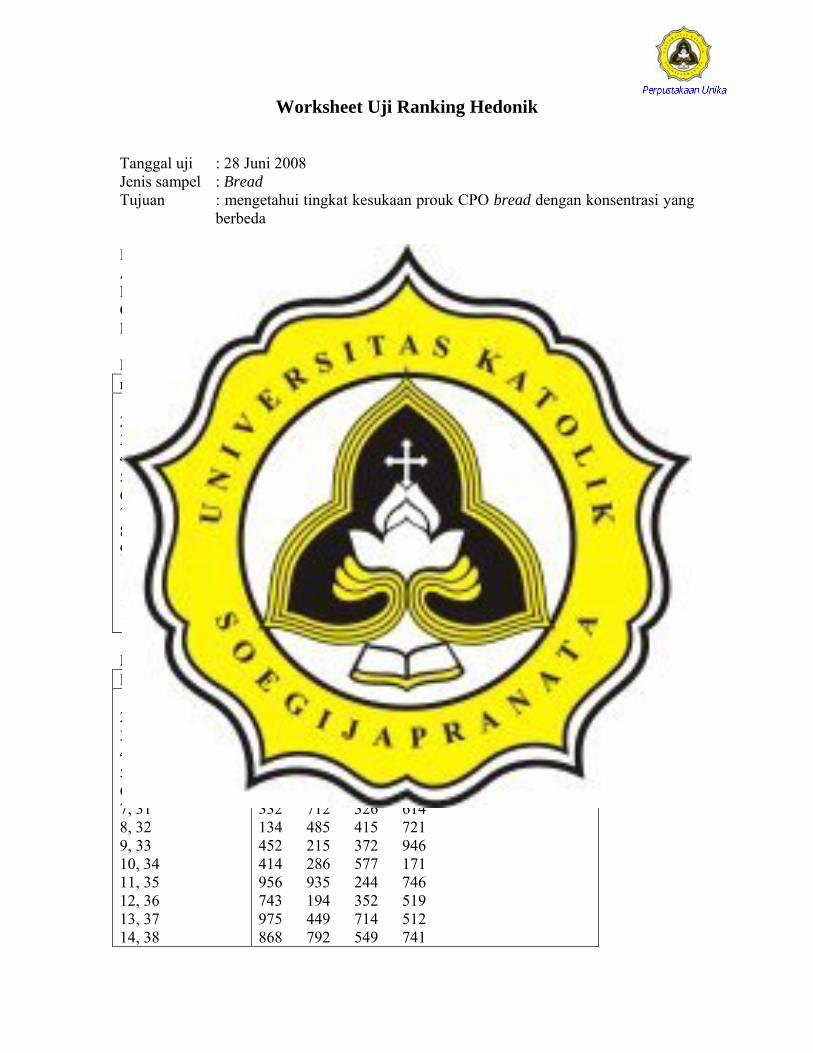
Worksheet Uji Ranking Hedonik
Tanggal uji : 28 Juni 2008 Jenis sampel : Bread Tujuan : mengetahui tingkat kesukaan prouk CPO bread dengan konsentrasi yang
berbeda Identifikasi Sampel A : Roti tawar kontrol B : Roti tawar 50% CPO C : Roti tawar 60% CPO D : Roti tawar 70% CPO Kode Kombinasi Penyajian no Kode no Kode 1, 25, 49 2, 26 3, 27, 50 4, 28 5, 29 6, 30 7, 31 8, 32 9, 33 10, 34 11, 35 12, 36 13, 37
DBAC ABCD DCBA BDAC CBDA DABC ADCB BDCA CBAD ACBD BCDA CABD DACB
14, 38 15, 39 16, 40 17, 41 18, 42 19, 43 20, 44 21, 45 22, 46 23, 47 24, 48
ADBC CDBA DCAB ABDC DBCA BCAD CDAB BADC CADB ACDB BACD
Penyajian Panelis Kode sampel 1, 25, 49 2, 26 3, 27, 50 4, 28 5, 29 6, 30 7, 31 8, 32 9, 33 10, 34 11, 35 12, 36 13, 37 14, 38
847 314 557 811 245 461 313 179 448 598 172 861 951 513 451 949 694 128 773 154 487 114 968 881 332 712 326 614 134 485 415 721 452 215 372 946 414 286 577 171 956 935 244 746 743 194 352 519 975 449 714 512 868 792 549 741

60
15, 39 16, 40 17, 41 18, 42 19, 43 20, 44 21, 45 22, 46 23, 47 24, 48
441 446 349 941 122 193 786 756 637 777 195 158 755 287 1635 164 127 617 792 165 721 191 152 299 674 813 133 222 145 581 317 397 951 966 911 544 117 332 553 313
Rekap Kode Sampel Kode Rekap A 557 245 861 451 154 114 332 721 372
414 746 194 449 868 941 786 637 164 792 152 813 581 951 232
B 314 461 172 951 128 968 614 134 215 577 956 352 512 549 349 756 777 287 127 299 674 397 544
C 811 313 598 949 694 881 326 415 452 286 935 743 714 741 441 193 158 635 617 721 222 145 966 553
D 847 179 448 513 513 773 487 712 485 946 171 244 519 975 792 446 122 195 755 165 191 133 317 911 313

61
HARGA POKOK PENJUALAN (HPP)
Bahan Harga per satuan (Rp)
kontrol CPO 50% 60% 70%
Terigu (500g) Yeast (5 g) Gula (25 g) Garam (10 g) Susu (10 g) Improver(1,5g) Mentega putih CPO
8000/kg 2000/sachet 6000/kg 1000/kg 6000/ons 3000/ons 12500/kg 10000/kg
4000 1000 500 100 600 100 500 -
4000 1000 500 100 600 100 250 200
4000 1000 500 100 600 100 200 240
4000 1000 500 100 600 100 150 280
Total 6800 6750 6740 6730
62
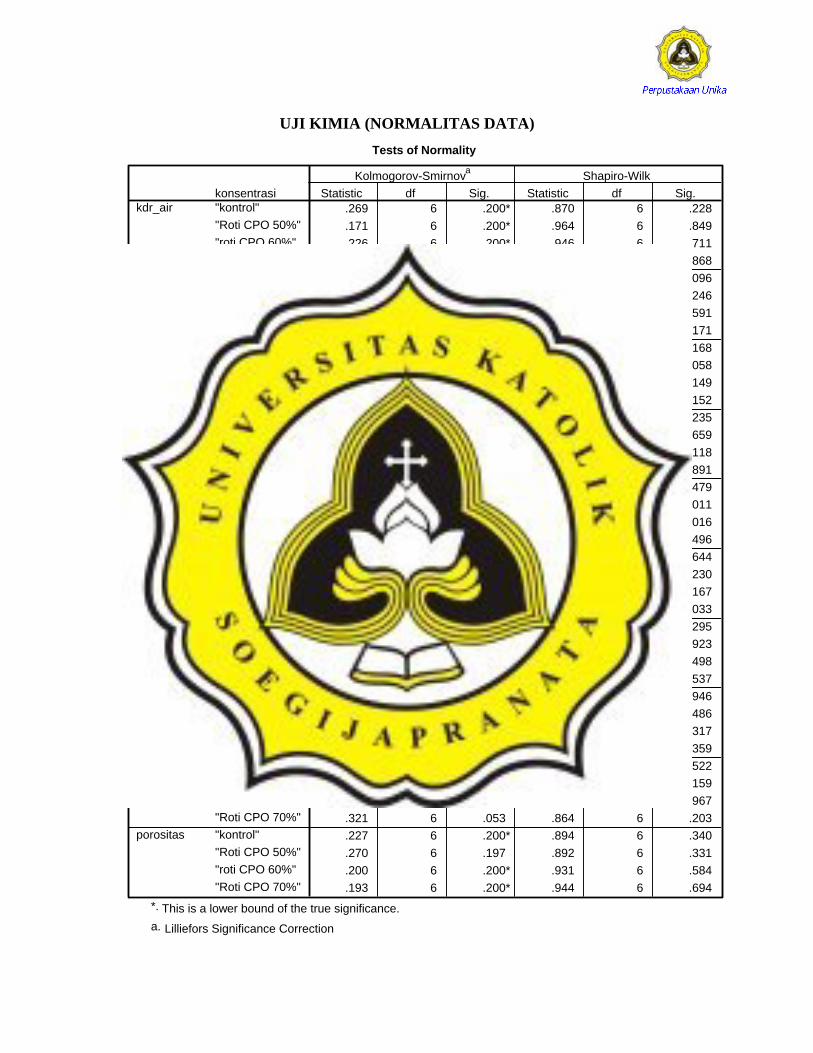
UJI KIMIA (NORMALITAS DATA)
Tests of Normality
.269 6 .200* .870 6 .228
.171 6 .200* .964 6 .849
.226 6 .200* .946 6 .711
.195 6 .200* .967 6 .868
.288 6 .130 .824 6 .096
.247 6 .200* .875 6 .246
.215 6 .200* .931 6 .591
.256 6 .200* .855 6 .171
.265 6 .200* .854 6 .168
.265 6 .200* .799 6 .058
.342 6 .027 .847 6 .149
.217 6 .200* .848 6 .152
.260 6 .200* .872 6 .235
.189 6 .200* .940 6 .659
.267 6 .200* .835 6 .118
.144 6 .200* .970 6 .891
.188 6 .200* .916 6 .479
.388 6 .005 .725 6 .011
.363 6 .013 .739 6 .016
.189 6 .200* .919 6 .496
.224 6 .200* .938 6 .644
.248 6 .200* .871 6 .230
.202 6 .200* .853 6 .167
.277 6 .168 .773 6 .033
.225 6 .200* .885 6 .295
.165 6 .200* .975 6 .923
.194 6 .200* .919 6 .498
.211 6 .200* .924 6 .537
.149 6 .200* .979 6 .946
.273 6 .185 .917 6 .486
.255 6 .200* .890 6 .317
.239 6 .200* .897 6 .359
.217 6 .200* .922 6 .522
.267 6 .200* .851 6 .159
.167 6 .200* .983 6 .967
.321 6 .053 .864 6 .203
.227 6 .200* .894 6 .340
.270 6 .197 .892 6 .331
.200 6 .200* .931 6 .584
.193 6 .200* .944 6 .694
konsentrasi"kontrol""Roti CPO 50%""roti CPO 60%""Roti CPO 70%""kontrol""Roti CPO 50%""roti CPO 60%""Roti CPO 70%""kontrol""Roti CPO 50%""roti CPO 60%""Roti CPO 70%""kontrol""Roti CPO 50%""roti CPO 60%""Roti CPO 70%""kontrol""Roti CPO 50%""roti CPO 60%""Roti CPO 70%""kontrol""Roti CPO 50%""roti CPO 60%""Roti CPO 70%""kontrol""Roti CPO 50%""roti CPO 60%""Roti CPO 70%""kontrol""Roti CPO 50%""roti CPO 60%""Roti CPO 70%""kontrol""Roti CPO 50%""roti CPO 60%""Roti CPO 70%""kontrol""Roti CPO 50%""roti CPO 60%""Roti CPO 70%"
kdr_air
kdr_abu
kdr_lemak
antioksidan
vit_A
kdr_prot
TBA_0
TBA_3
karbohidrat
porositas
Statistic df Sig. Statistic df Sig.Kolmogorov-Smirnova Shapiro-Wilk
This is a lower bound of the true significance.*.
Lilliefors Significance Correctiona.
63
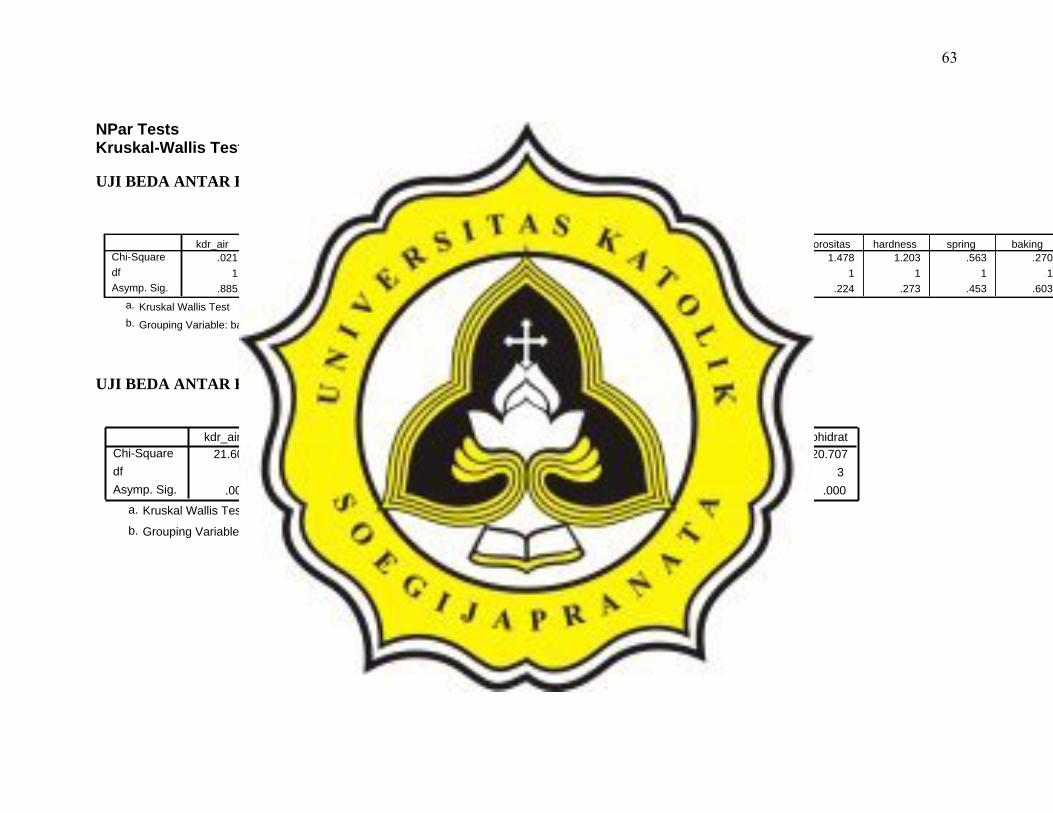
NPar Tests Kruskal-Wallis Test UJI BEDA ANTAR BATCH
Test Statisticsa,b
.021 6.327 .303 .013 .053 .630 2.347 .404 .030 1.478 1.203 .563 .2701 1 1 1 1 1 1 1 1 1 1 1 1
.885 .012 .582 .908 .817 .427 .126 .525 .862 .224 .273 .453 .603
Chi-SquaredfAsymp. Sig.
kdr_air kdr_abu kdr_lemak antioksidan vit_A kdr_prot TBA_0 TBA_3 karbohidrat porositas hardness spring baking
Kruskal Wallis Testa.
Grouping Variable: batchb.
UJI BEDA ANTAR KONSENTRASI
Test Statisticsa,b
21.609 5.465 20.227 21.600 21.600 10.148 3.822 21.609 20.7073 3 3 3 3 3 3 3 3
.000 .141 .000 .000 .000 .017 .281 .000 .000
Chi-Squaredf Asymp. Sig.
kdr_air kdr_abu kdr_lemak antioksidan vit_A kdr_prot TBA_0 TBA_3 karbohidrat
Kruskal Wallis Test a.
Grouping Variable: konsentrasi b.
64
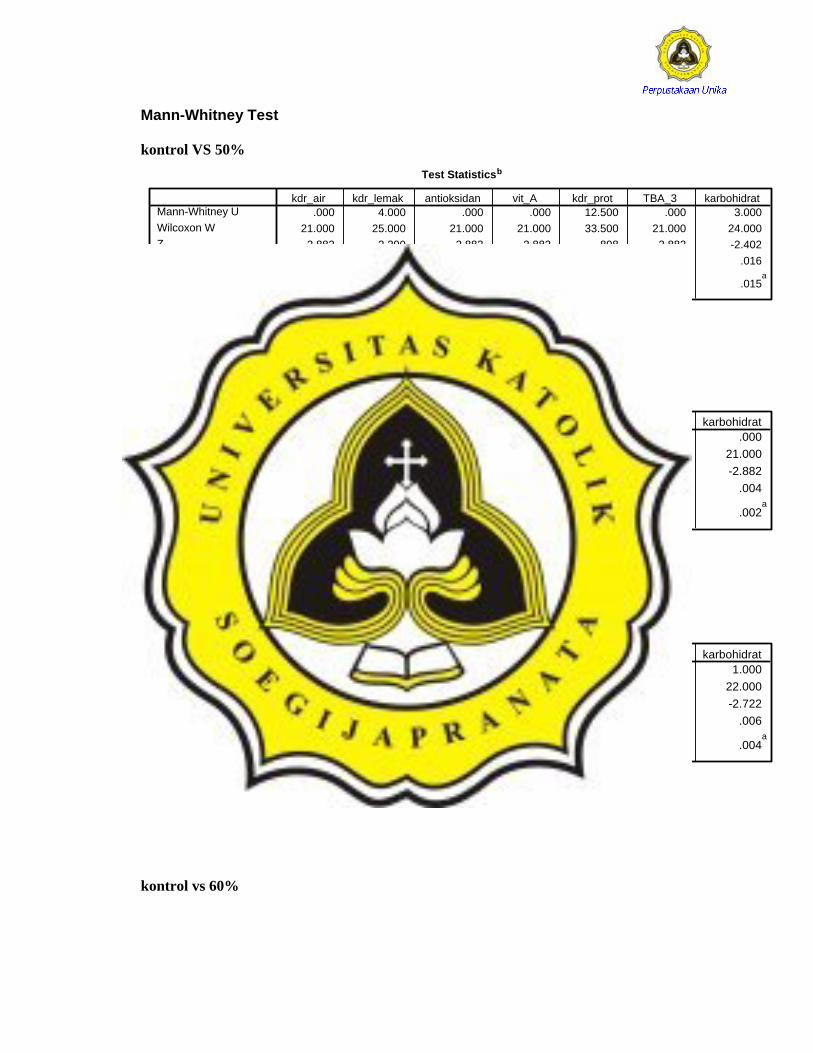
Mann-Whitney Test kontrol VS 50%
Test Statisticsb
.000 4.000 .000 .000 12.500 .000 3.00021.000 25.000 21.000 21.000 33.500 21.000 24.000-2.882 -2.290 -2.882 -2.882 -.898 -2.882 -2.402
.004 .022 .004 .004 .369 .004 .016
.002a
.026a
.002a
.002a
.394a
.002a
.015a
Mann-Whitney UWilcoxon WZAsymp. Sig. (2-tailed)Exact Sig. [2*(1-tailedSig.)]
kdr_air kdr_lemak antioksidan vit_A kdr_prot TBA_3 karbohidrat
Not corrected for ties.a.
Grouping Variable: konsentrasib.
50% VS 60%
Test Statisticsb
.000 .000 .000 .000 8.000 .000 .00021.000 21.000 21.000 21.000 29.000 21.000 21.000-2.882 -2.913 -2.882 -2.882 -1.630 -2.887 -2.882
.004 .004 .004 .004 .103 .004 .004
.002a
.002a
.002a
.002a
.132a
.002a
.002a
Mann-Whitney UWilcoxon WZAsymp. Sig. (2-tailed)Exact Sig. [2*(1-tailedSig.)]
kdr_air kdr_lemak antioksidan vit_A kdr_prot TBA_3 karbohidrat
Not corrected for ties.a.
Grouping Variable: konsentrasib.
60% VS 70%
Test Statisticsb
.000 3.000 .000 .000 15.000 .000 1.00021.000 24.000 21.000 21.000 36.000 21.000 22.000-2.887 -2.419 -2.882 -2.882 -.509 -2.887 -2.722
.004 .016 .004 .004 .611 .004 .006
.002a
.015a
.002a
.002a
.699a
.002a
.004a
Mann-Whitney UWilcoxon WZAsymp. Sig. (2-tailed)Exact Sig. [2*(1-tailedSig.)]
kdr_air kdr_lemak antioksidan vit_A kdr_prot TBA_3 karbohidrat
Not corrected for ties.a.
Grouping Variable: konsentrasib.
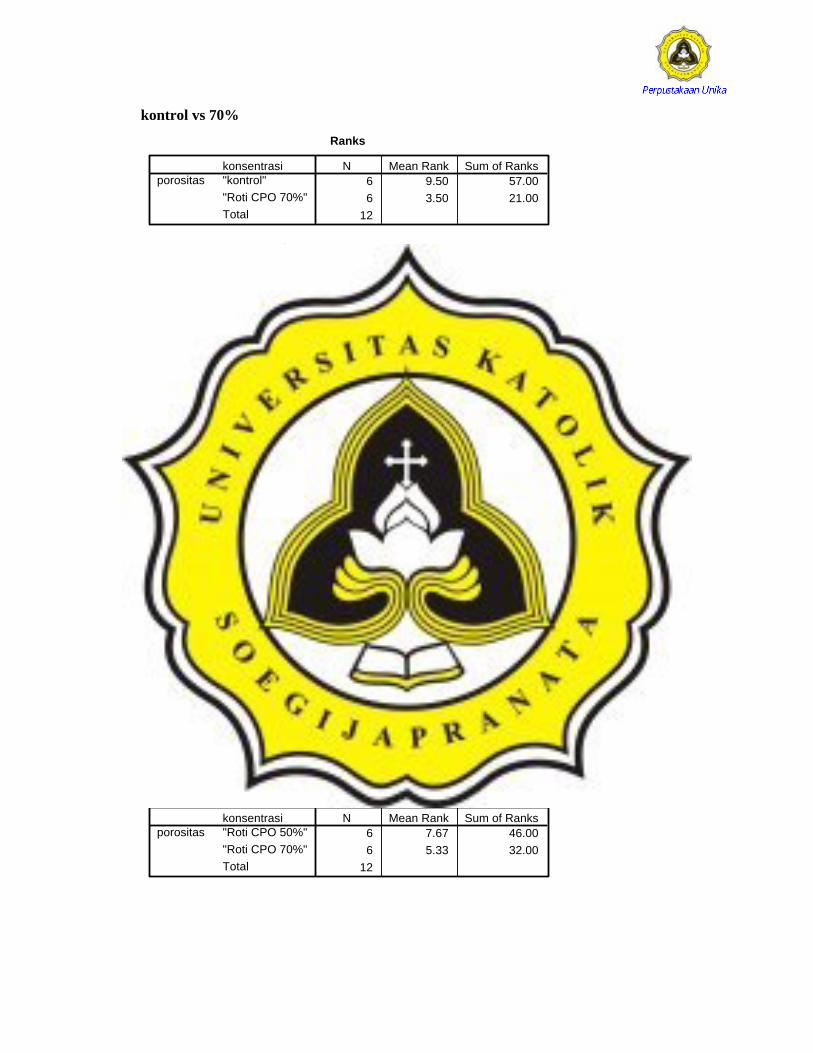
kontrol vs 60%
65
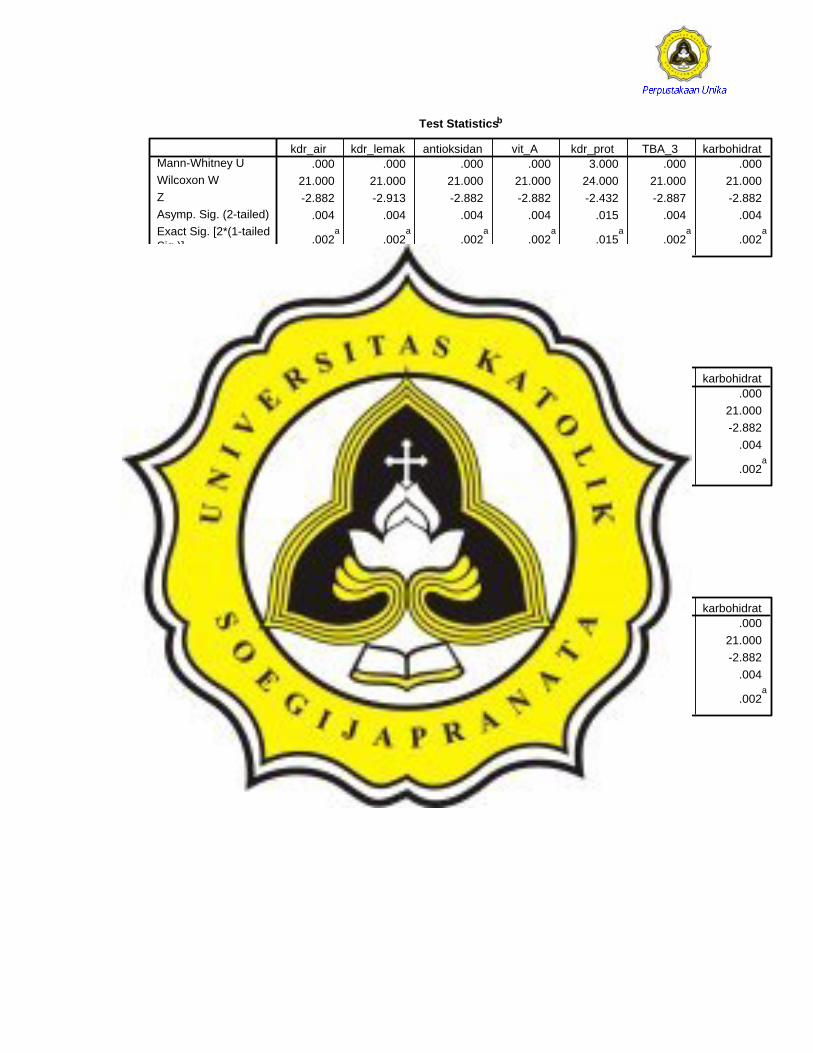
Test Statisticsb
.000 .000 .000 .000 3.000 .000 .00021.000 21.000 21.000 21.000 24.000 21.000 21.000-2.882 -2.913 -2.882 -2.882 -2.432 -2.887 -2.882
.004 .004 .004 .004 .015 .004 .004
.002a
.002a
.002a
.002a
.015a
.002a
.002a
Mann-Whitney UWilcoxon WZAsymp. Sig. (2-tailed)Exact Sig. [2*(1-tailedSig.)]
kdr_air kdr_lemak antioksidan vit_A kdr_prot TBA_3 karbohidrat
Not corrected for ties.a.
Grouping Variable: konsentrasib.
kontrol vs 70%
Test Statisticsb
.000 .000 .000 .000 2.500 .000 .00021.000 21.000 21.000 21.000 23.500 21.000 21.000-2.887 -2.892 -2.882 -2.882 -2.527 -2.882 -2.882
.004 .004 .004 .004 .012 .004 .004
.002a
.002a
.002a
.002a
.009a
.002a
.002a
Mann-Whitney UWilcoxon WZAsymp. Sig. (2-tailed)Exact Sig. [2*(1-tailedSig.)]
kdr_air kdr_lemak antioksidan vit_A kdr_prot TBA_3 karbohidrat
Not corrected for ties.a.
Grouping Variable: konsentrasib.
60% vs 70%
Test Statisticsb
.000 .000 .000 .000 6.500 .000 .00021.000 21.000 21.000 21.000 27.500 21.000 21.000-2.887 -2.892 -2.882 -2.882 -1.892 -2.882 -2.882
.004 .004 .004 .004 .059 .004 .004
.002a
.002a
.002a
.002a
.065a
.002a
.002a
Mann-Whitney UWilcoxon WZAsymp. Sig. (2-tailed)Exact Sig. [2*(1-tailedSig.)]
kdr_air kdr_lemak antioksidan vit_A kdr_prot TBA_3 karbohidrat
Not corrected for ties.a.
Grouping Variable: konsentrasib.
66
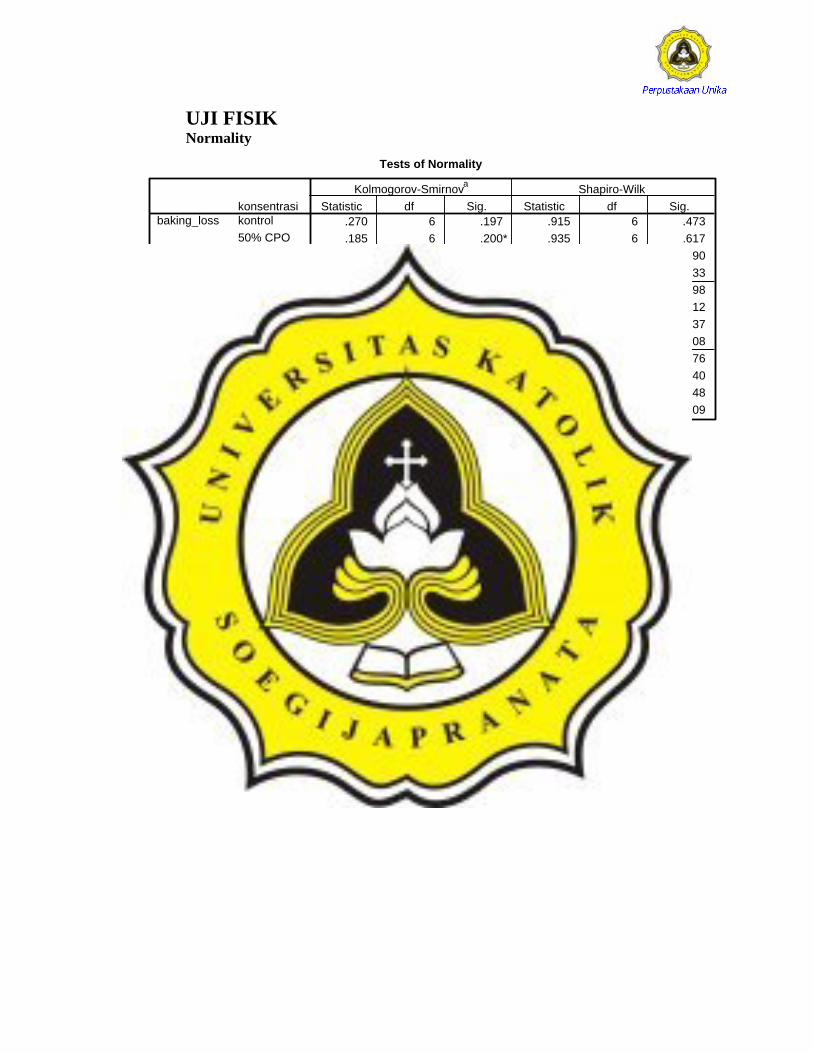
UJI FISIK Normality
Tests of Normality
.270 6 .197 .915 6 .473
.185 6 .200* .935 6 .617
.298 6 .103 .821 6 .090
.275 6 .177 .893 6 .333
.179 6 .200* .957 6 .798
.349 6 .022 .726 6 .012
.301 6 .096 .778 6 .037
.379 6 .007 .708 6 .008
.191 6 .200* .930 6 .576
.186 6 .200* .950 6 .740
.242 6 .200* .875 6 .248
.294 6 .114 .831 6 .109
konsentrasikontrol50% CPO60% CPO70% CPOkontrol50% CPO60% CPO70% CPOkontrol50% CPO60% CPO70% CPO
baking_loss
springiness
hardness
Statistic df Sig. Statistic df Sig.Kolmogorov-Smirnova Shapiro-Wilk
This is a lower bound of the true significance.*.
Lilliefors Significance Correctiona.
Kruskal-Wallis Test
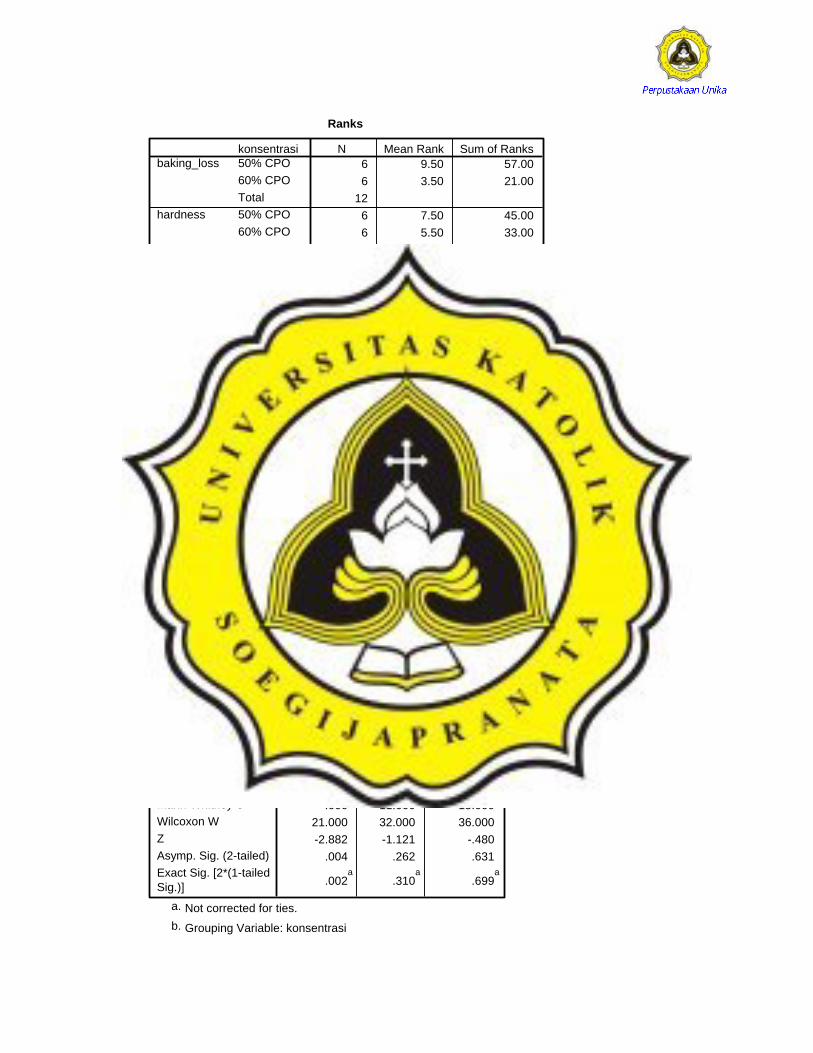
Ranks
6 19.006 17.506 10.006 3.50
246 15.176 14.336 11.506 9.00
246 12.336 15.006 10.336 12.33
24
konsentrasikontrol50% CPO60% CPO70% CPOTotalkontrol50% CPO60% CPO70% CPOTotalkontrol50% CPO60% CPO70% CPOTotal
baking_loss
hardness
springiness
N Mean Rank
67
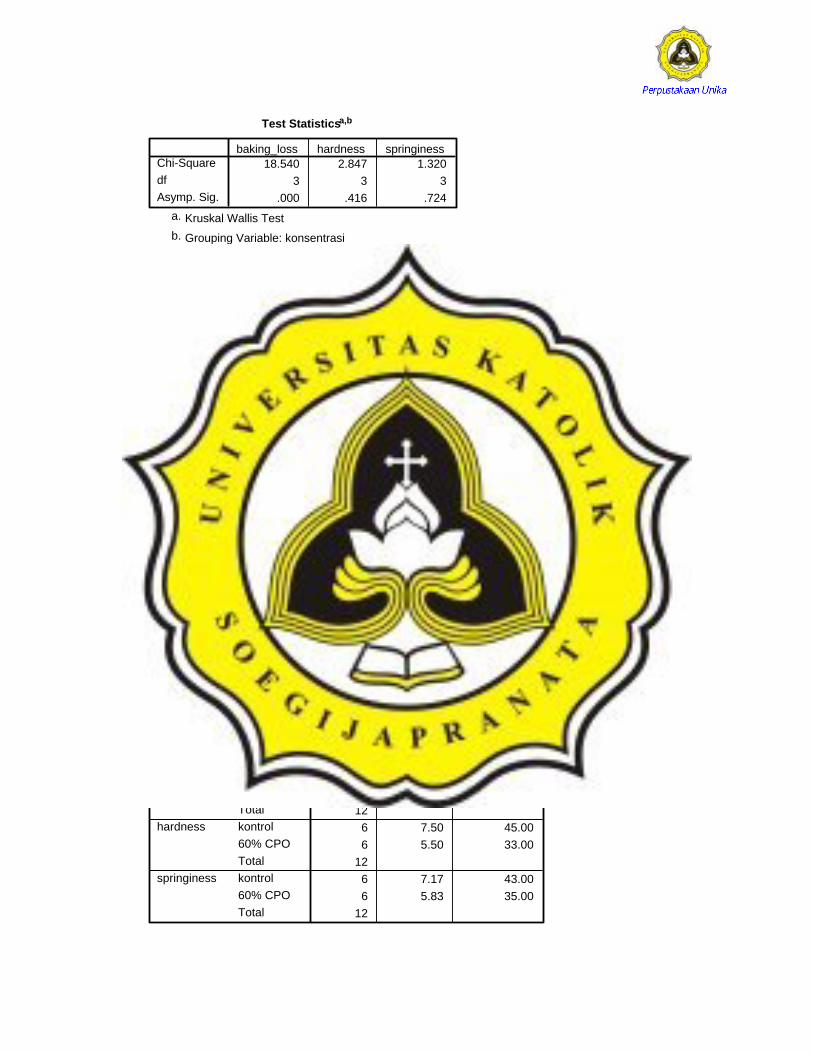
Test Statisticsa,b
18.540 2.847 1.3203 3 3
.000 .416 .724
Chi-SquaredfAsymp. Sig.
baking_loss hardness springiness
Kruskal Wallis Testa.
Grouping Variable: konsentrasib.
Mann-Whitney Test kontrol vs 50%
Ranks
6 7.50 45.006 5.50 33.00
126 6.83 41.006 6.17 37.00
126 5.67 34.006 7.33 44.00
12
konsentrasikontrol50% CPOTotalkontrol50% CPOTotalkontrol50% CPOTotal
baking_loss
hardness
springiness
N Mean Rank Sum of Ranks
Test Statisticsb
12.000 16.000 13.00033.000 37.000 34.000
-.961 -.320 -.801.337 .749 .423
.394a
.818a
.485a
Mann-Whitney UWilcoxon WZAsymp. Sig. (2-tailed)Exact Sig. [2*(1-tailedSig.)]
baking_loss hardness springiness
Not corrected for ties.a.
Grouping Variable: konsentrasib.
kontrol vs 60%
Ranks
6 9.00 54.006 4.00 24.00
126 7.50 45.006 5.50 33.00
126 7.17 43.006 5.83 35.00
12
konsentrasikontrol60% CPOTotalkontrol60% CPOTotalkontrol60% CPOTotal
baking_loss
hardness
springiness
N Mean Rank Sum of Ranks

68
Test Statisticsb
3.000 12.000 14.00024.000 33.000 35.000-2.402 -.961 -.641
.016 .337 .522
.015a
.394a
.589a
Mann-Whitney UWilcoxon WZAsymp. Sig. (2-tailed)Exact Sig. [2*(1-tailedSig.)]
baking_loss hardness springiness
Not corrected for ties.a.
Grouping Variable: konsentrasib.
kontrol vs 70%
Ranks
6 9.50 57.006 3.50 21.00
126 7.83 47.006 5.17 31.00
126 6.50 39.006 6.50 39.00
12
konsentrasikontrol70% CPOTotalkontrol70% CPOTotalkontrol70% CPOTotal
baking_loss
hardness
springiness
N Mean Rank Sum of Ranks
Test Statisticsb
.000 10.000 18.00021.000 31.000 39.000-2.882 -1.281 .000
.004 .200 1.000
.002a
.240a
1.000a
Mann-Whitney UWilcoxon WZAsymp. Sig. (2-tailed)Exact Sig. [2*(1-tailedSig.)]
baking_loss hardness springiness
Not corrected for ties.a.
Grouping Variable: konsentrasib.
50% vs 60%
69
Ranks
6 9.50 57.006 3.50 21.00
126 7.50 45.006 5.50 33.00
126 7.67 46.006 5.33 32.00
12
konsentrasi50% CPO60% CPOTotal50% CPO60% CPOTotal50% CPO60% CPOTotal
baking_loss
hardness
springiness
N Mean Rank Sum of Ranks
Test Statisticsb
.000 12.000 11.00021.000 33.000 32.000-2.882 -.961 -1.121
.004 .337 .262
.002a
.394a
.310a
Mann-Whitney UWilcoxon WZAsymp. Sig. (2-tailed)Exact Sig. [2*(1-tailedSig.)]
baking_loss hardness springiness
Not corrected for ties.a.
Grouping Variable: konsentrasib.
50% vs 70%
Ranks
6 9.50 57.006 3.50 21.00
126 7.67 46.006 5.33 32.00
126 7.00 42.006 6.00 36.00
12
konsentrasi50% CPO70% CPOTotal50% CPO70% CPOTotal50% CPO70% CPOTotal
baking_loss
hardness
springiness
N Mean Rank Sum of Ranks
Test Statisticsb
.000 11.000 15.00021.000 32.000 36.000-2.882 -1.121 -.480
.004 .262 .631
.002a
.310a
.699a
Mann-Whitney UWilcoxon WZAsymp. Sig. (2-tailed)Exact Sig. [2*(1-tailedSig.)]
baking_loss hardness springiness
Not corrected for ties.a.
Grouping Variable: konsentrasib.
70
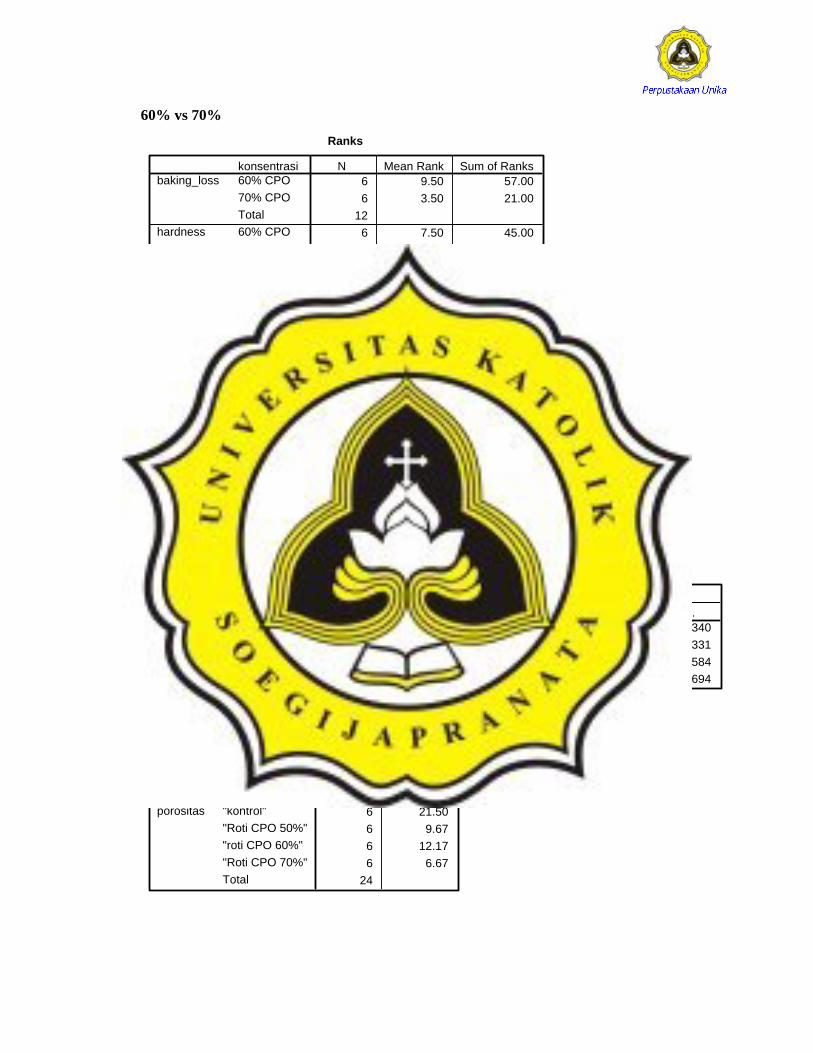
60% vs 70% Ranks
6 9.50 57.006 3.50 21.00
126 7.50 45.006 5.50 33.00
126 6.17 37.006 6.83 41.00
12
konsentrasi60% CPO70% CPOTotal60% CPO70% CPOTotal60% CPO70% CPOTotal
baking_loss
hardness
springiness
N Mean Rank Sum of Ranks
Test Statisticsb
.000 12.000 16.00021.000 33.000 37.000-2.882 -.961 -.320
.004 .337 .749
.002a
.394a
.818a
Mann-Whitney UWilcoxon WZAsymp. Sig. (2-tailed)Exact Sig. [2*(1-tailedSig.)]
baking_loss hardness springiness
Not corrected for ties.a.
Grouping Variable: konsentrasib.
Porositas
Tests of Normality
.227 6 .200* .894 6 .340
.270 6 .197 .892 6 .331
.200 6 .200* .931 6 .584
.193 6 .200* .944 6 .694
konsentrasi"kontrol""Roti CPO 50%""roti CPO 60%""Roti CPO 70%"
porositasStatistic df Sig. Statistic df Sig.
Kolmogorov-Smirnova Shapiro-Wilk
This is a lower bound of the true significance.*.
Lilliefors Significance Correctiona.
kruskal walis Ranks
6 21.506 9.676 12.176 6.67
24
konsentrasi"kontrol""Roti CPO 50%""roti CPO 60%""Roti CPO 70%"Total
porositasN Mean Rank
71
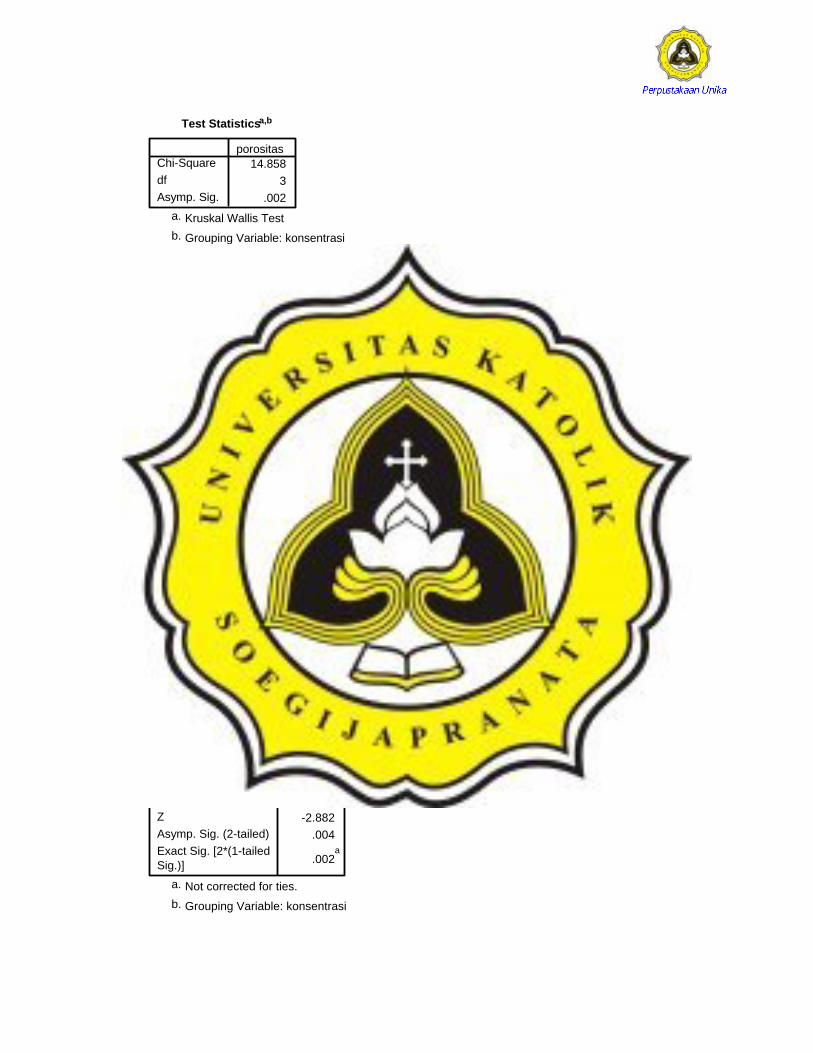
Test Statisticsa,b
14.8583
.002
Chi-SquaredfAsymp. Sig.
porositas
Kruskal Wallis Testa.
Grouping Variable: konsentrasib.
mann whitney kontrol vs 50%
Ranks
6 9.50 57.006 3.50 21.00
12
konsentrasi"kontrol""Roti CPO 50%"Total
porositasN Mean Rank Sum of Ranks
Test Statisticsb
.00021.000-2.887
.004
.002a
Mann-Whitney UWilcoxon WZAsymp. Sig. (2-tailed)Exact Sig. [2*(1-tailedSig.)]
porositas
Not corrected for ties.a.
Grouping Variable: konsentrasib.
kontrol vs 60%
Ranks
6 9.50 57.006 3.50 21.00
12
konsentrasi"kontrol""roti CPO 60%"Total
porositasN Mean Rank Sum of Ranks
Test Statisticsb
.00021.000-2.882
.004
.002a
Mann-Whitney UWilcoxon WZAsymp. Sig. (2-tailed)Exact Sig. [2*(1-tailedSig.)]
porositas
Not corrected for ties.a.
Grouping Variable: konsentrasib.
72
kontrol vs 70%
Ranks
6 9.50 57.006 3.50 21.00
12
konsentrasi"kontrol""Roti CPO 70%"Total
porositasN Mean Rank Sum of Ranks
Test Statisticsb
.00021.000-2.887
.004
.002a
Mann-Whitney UWilcoxon WZAsymp. Sig. (2-tailed)Exact Sig. [2*(1-tailedSig.)]
porositas
Not corrected for ties.a.
Grouping Variable: konsentrasib.
50% vs 60%
Ranks
6 5.50 33.006 7.50 45.00
12
konsentrasi"Roti CPO 50%""roti CPO 60%"Total
porositasN Mean Rank Sum of Ranks
Test Statisticsb
12.00033.000
-.971.332
.394a
Mann-Whitney UWilcoxon WZAsymp. Sig. (2-tailed)Exact Sig. [2*(1-tailedSig.)]
porositas
Not corrected for ties.a.
Grouping Variable: konsentrasib.
50% vs 70%
Ranks
6 7.67 46.006 5.33 32.00
12
konsentrasi"Roti CPO 50%""Roti CPO 70%"Total
porositasN Mean Rank Sum of Ranks

73
Test Statisticsb
11.00032.000-1.129
.259
.310a
Mann-Whitney UWilcoxon WZAsymp. Sig. (2-tailed)Exact Sig. [2*(1-tailedSig.)]
porositas
Not corrected for ties.a.
Grouping Variable: konsentrasib.
60% vs 70%
Ranks
6 8.17 49.006 4.83 29.00
12
konsentrasi"roti CPO 60%""Roti CPO 70%"Total
porositasN Mean Rank Sum of Ranks
Test Statisticsb
8.00029.000-1.610
.107
.132a
Mann-Whitney UWilcoxon WZAsymp. Sig. (2-tailed)Exact Sig. [2*(1-tailedSig.)]
porositas
Not corrected for ties.a.
Grouping Variable: konsentrasib.
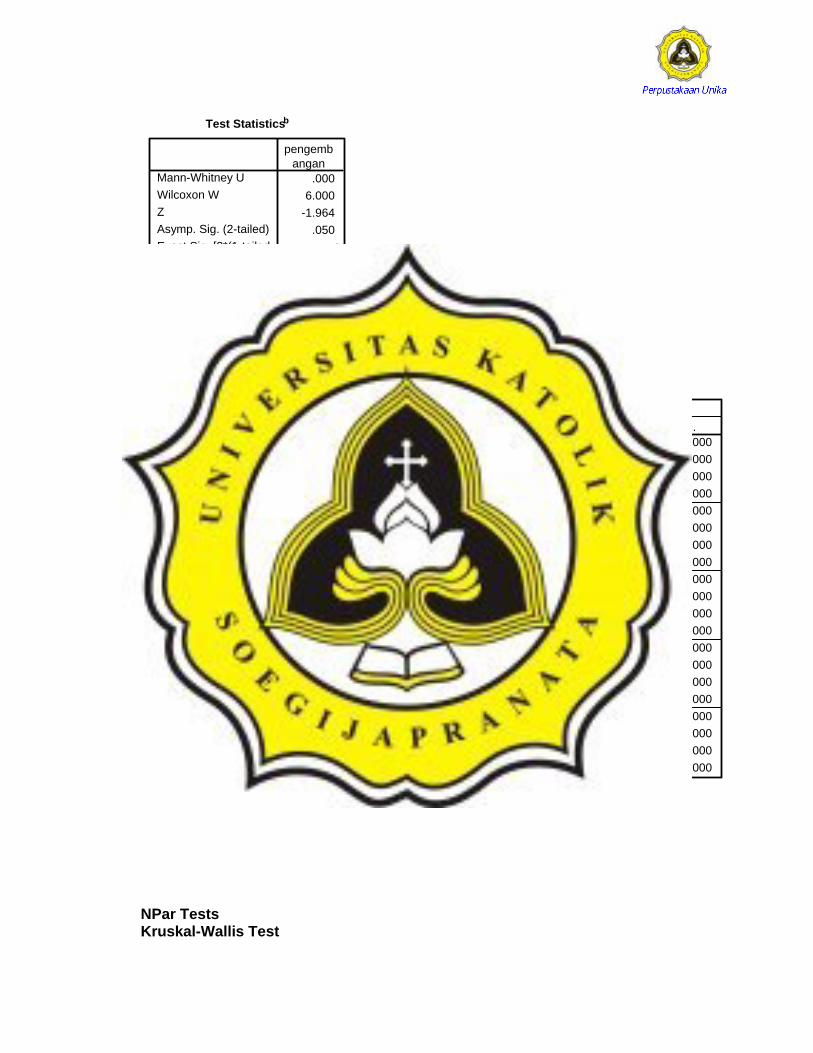
PENGEMBANGAN Kruskal Walis
Ranks
3 2.003 5.003 8.003 11.00
12
konsentrasikontrol50%60%70%Total
pengembanganN Mean Rank

74
Test Statisticsa,b
10.3853
.016
Chi-SquaredfAsymp. Sig.
pengembangan
Kruskal Wallis Testa.
Grouping Variable: konsentrasib.
Mann-whitney kontrol vs 50%
Test Statisticsb
.0006.000
-1.964.050
.100a
Mann-Whitney UWilcoxon WZAsymp. Sig. (2-tailed)Exact Sig. [2*(1-tailedSig.)]
pengembangan
Not corrected for ties.a.
Grouping Variable: konsentrasib.
50% vs 60%
Test Statisticsb
.0006.000
-1.964.050
.100a
Mann-Whitney UWilcoxon WZAsymp. Sig. (2-tailed)Exact Sig. [2*(1-tailedSig.)]
pengembangan
Not corrected for ties.a.
Grouping Variable: konsentrasib.
60% vs 70%

75
Test Statisticsb
.0006.000
-1.964.050
.100a
Mann-Whitney UWilcoxon WZAsymp. Sig. (2-tailed)Exact Sig. [2*(1-tailedSig.)]
pengembangan
Not corrected for ties.a.
Grouping Variable: konsentrasib.
kontrol vs 60%
Test Statisticsb
.0006.000
-1.964.050
.100a
Mann-Whitney UWilcoxon WZAsymp. Sig. (2-tailed)Exact Sig. [2*(1-tailedSig.)]
pengembangan
Not corrected for ties.a.
Grouping Variable: konsentrasib.
kontrol vs 70%
Test Statisticsb
.0006.000
-1.964.050
.100a
Mann-Whitney UWilcoxon WZAsymp. Sig. (2-tailed)Exact Sig. [2*(1-tailedSig.)]
pengembangan
Not corrected for ties.a.
Grouping Variable: konsentrasib.
60% vs 70%
76
Test Statisticsb
.0006.000
-1.964.050
.100a
Mann-Whitney UWilcoxon WZAsymp. Sig. (2-tailed)Exact Sig. [2*(1-tailedSig.)]
pengembangan
Not corrected for ties.a.
Grouping Variable: konsentrasib.
UJI SENSORIS
UJI NORMALITAS Tests of Normality
.315 50 .000 .739 50 .000
.219 50 .000 .876 50 .000
.215 50 .000 .880 50 .000
.243 50 .000 .814 50 .000
.293 50 .000 .754 50 .000
.195 50 .000 .878 50 .000
.260 50 .000 .867 50 .000
.248 50 .000 .803 50 .000
.233 50 .000 .779 50 .000
.236 50 .000 .866 50 .000
.186 50 .000 .876 50 .000
.228 50 .000 .852 50 .000
.194 50 .000 .832 50 .000
.199 50 .000 .876 50 .000
.186 50 .000 .844 50 .000
.188 50 .000 .860 50 .000
.233 50 .000 .823 50 .000
.232 50 .000 .874 50 .000
.220 50 .000 .843 50 .000
.208 50 .000 .835 50 .000
konsentrasi"kontrol""Roti CPO 50%""Roti CPO 60%""Roti CPO 70%""kontrol""Roti CPO 50%""Roti CPO 60%""Roti CPO 70%""kontrol""Roti CPO 50%""Roti CPO 60%""Roti CPO 70%""kontrol""Roti CPO 50%""Roti CPO 60%""Roti CPO 70%""kontrol""Roti CPO 50%""Roti CPO 60%""Roti CPO 70%"
rasa
warna
aroma
tekstur
hardness
Statistic df Sig. Statistic df Sig.Kolmogorov-Smirnova Shapiro-Wilk
Lilliefors Significance Correctiona.
NPar Tests Kruskal-Wallis Test

77
Ranks
50 93.5050 100.5050 117.5050 90.50
20050 124.5050 89.5050 103.5050 84.50
20050 111.5050 98.5050 112.5050 79.50
20050 100.5050 110.5050 97.5050 93.50
20050 100.5050 99.5050 105.5050 96.50
200
konsentrasi"kontrol""Roti CPO 50%""Roti CPO 60%""Roti CPO 70%"Total"kontrol""Roti CPO 50%""Roti CPO 60%""Roti CPO 70%"Total"kontrol""Roti CPO 50%""Roti CPO 60%""Roti CPO 70%"Total"kontrol""Roti CPO 50%""Roti CPO 60%""Roti CPO 70%"Total"kontrol""Roti CPO 50%""Roti CPO 60%""Roti CPO 70%"Total
hardness
rasa
warna
aroma
tekstur
N Mean Rank
Test Statisticsa,b
6.973 15.315 11.303 2.515 .6693 3 3 3 3
.073 .002 .010 .473 .881
Chi-SquaredfAsymp. Sig.
hardness rasa warna aroma tekstur
Kruskal Wallis Testa.
Grouping Variable: konsentrasib.
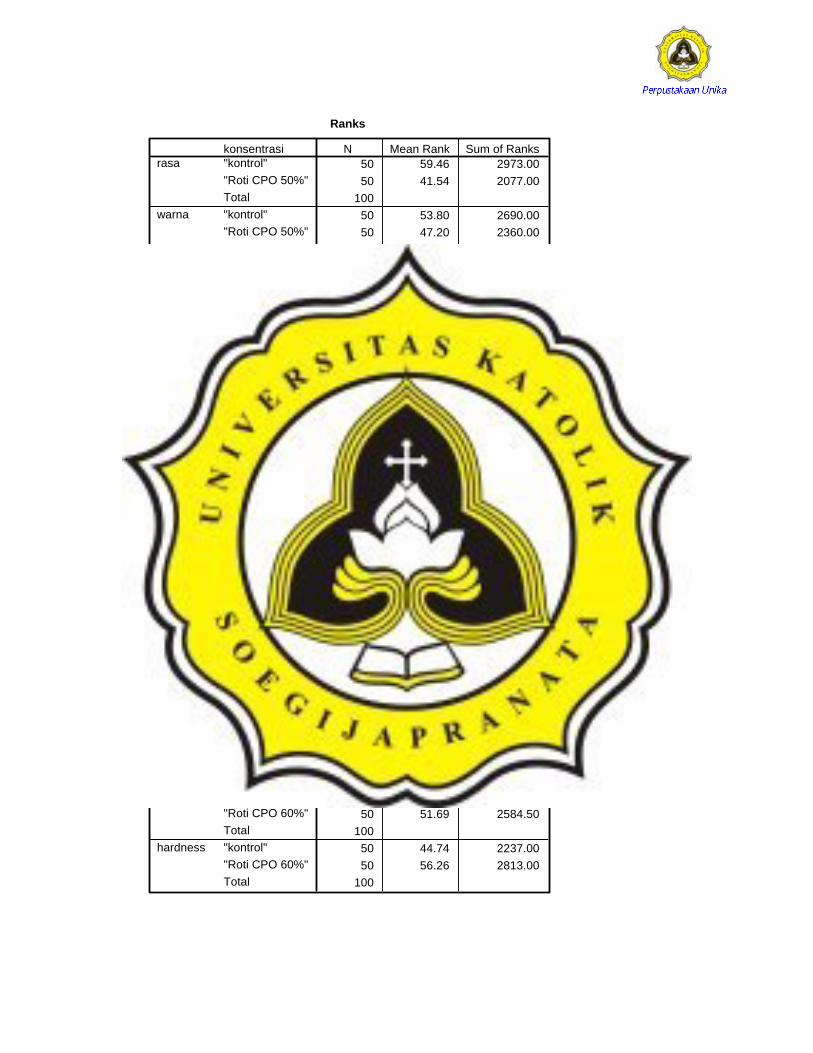
NPar Tests Mann-Whitney Test kontrol vs 50%
78
Ranks
50 59.46 2973.0050 41.54 2077.00
10050 53.80 2690.0050 47.20 2360.00
10050 48.66 2433.0050 52.34 2617.00
10050 50.76 2538.0050 50.24 2512.00
10050 48.67 2433.5050 52.33 2616.50
100
konsentrasi"kontrol""Roti CPO 50%"Total"kontrol""Roti CPO 50%"Total"kontrol""Roti CPO 50%"Total"kontrol""Roti CPO 50%"Total"kontrol""Roti CPO 50%"Total
rasa
warna
aroma
tekstur
hardness
N Mean Rank Sum of Ranks
Test Statisticsa
802.000 1085.000 1158.000 1237.000 1158.5002077.000 2360.000 2433.000 2512.000 2433.500
-3.196 -1.179 -.657 -.093 -.652.001 .239 .511 .926 .514
Mann-Whitney UWilcoxon WZAsymp. Sig. (2-tailed)
rasa warna aroma tekstur hardness
Grouping Variable: konsentrasia.
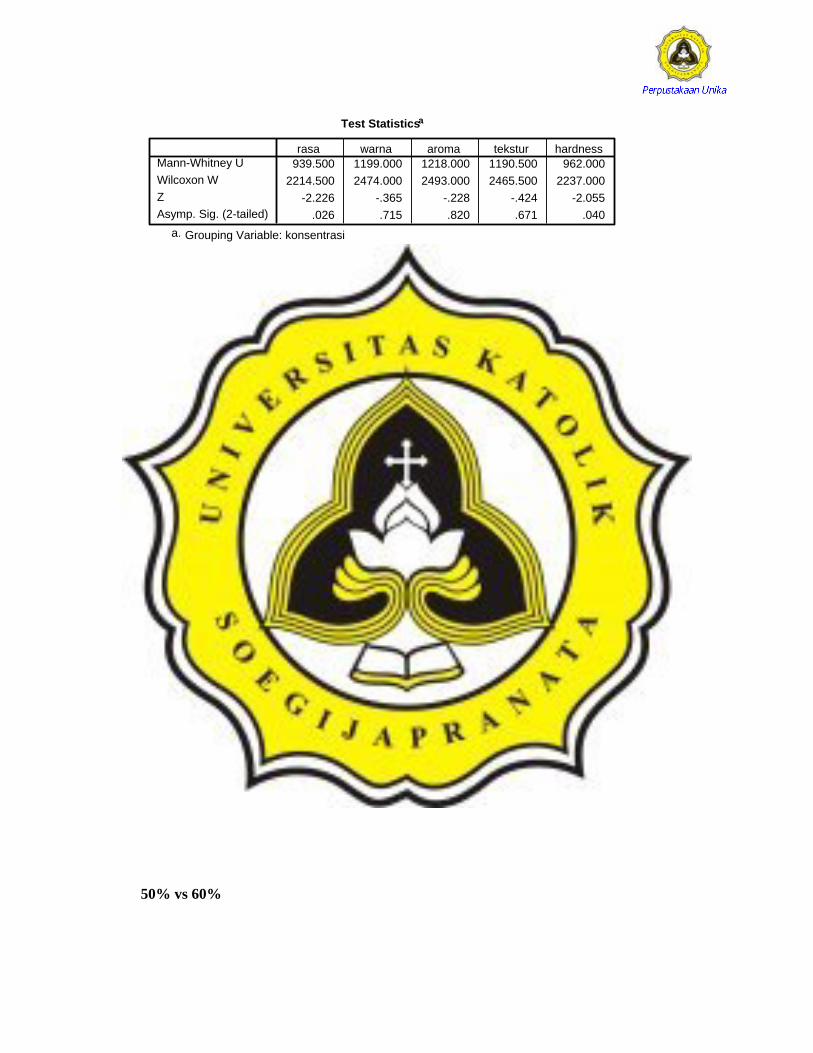
kontrol vs 60%
Ranks
50 56.71 2835.5050 44.29 2214.50
10050 51.52 2576.0050 49.48 2474.00
10050 51.14 2557.0050 49.86 2493.00
10050 49.31 2465.5050 51.69 2584.50
10050 44.74 2237.0050 56.26 2813.00
100
konsentrasi"kontrol""Roti CPO 60%"Total"kontrol""Roti CPO 60%"Total"kontrol""Roti CPO 60%"Total"kontrol""Roti CPO 60%"Total"kontrol""Roti CPO 60%"Total
rasa
warna
aroma
tekstur
hardness
N Mean Rank Sum of Ranks
79
Test Statisticsa
939.500 1199.000 1218.000 1190.500 962.0002214.500 2474.000 2493.000 2465.500 2237.000
-2.226 -.365 -.228 -.424 -2.055.026 .715 .820 .671 .040
Mann-Whitney UWilcoxon WZAsymp. Sig. (2-tailed)
rasa warna aroma tekstur hardness
Grouping Variable: konsentrasia.
kontrol vs 70%
Ranks
50 59.33 2966.5050 41.67 2083.50
10050 57.18 2859.0050 43.82 2191.00
10050 51.70 2585.0050 49.30 2465.00
10050 51.43 2571.5050 49.57 2478.50
10050 51.09 2554.5050 49.91 2495.50
100
konsentrasi"kontrol""Roti CPO 70%"Total"kontrol""Roti CPO 70%"Total"kontrol""Roti CPO 70%"Total"kontrol""Roti CPO 70%"Total"kontrol""Roti CPO 70%"Total
rasa
warna
aroma
tekstur
hardness
N Mean Rank Sum of Ranks
Test Statisticsa
808.500 916.000 1190.000 1203.500 1220.5002083.500 2191.000 2465.000 2478.500 2495.500
-3.182 -2.412 -.429 -.331 -.211.001 .016 .668 .740 .833
Mann-Whitney UWilcoxon WZAsymp. Sig. (2-tailed)
rasa warna aroma tekstur hardness
Grouping Variable: konsentrasia.
50% vs 60%
80
Ranks
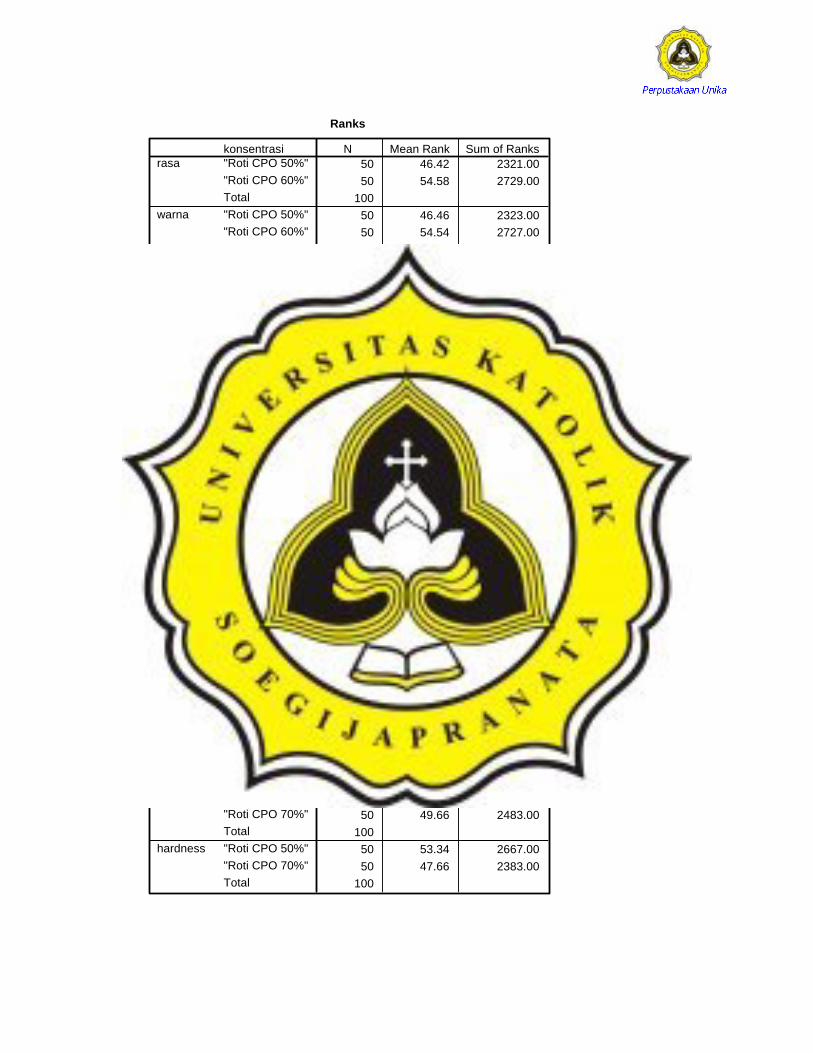
50 46.42 2321.0050 54.58 2729.00
10050 46.46 2323.0050 54.54 2727.00
10050 54.10 2705.0050 46.90 2345.00
10050 48.92 2446.0050 52.08 2604.00
10050 45.83 2291.5050 55.17 2758.50
100
konsentrasi"Roti CPO 50%""Roti CPO 60%"Total"Roti CPO 50%""Roti CPO 60%"Total"Roti CPO 50%""Roti CPO 60%"Total"Roti CPO 50%""Roti CPO 60%"Total"Roti CPO 50%""Roti CPO 60%"Total
rasa
warna
aroma
tekstur
hardness
N Mean Rank Sum of Ranks
Test Statisticsa
1046.000 1048.000 1070.000 1171.000 1016.5002321.000 2323.000 2345.000 2446.000 2291.500
-1.470 -1.460 -1.289 -.563 -1.672.142 .144 .197 .574 .095
Mann-Whitney UWilcoxon WZAsymp. Sig. (2-tailed)
rasa warna aroma tekstur hardness
Grouping Variable: konsentrasia.
50% vs 70%
Ranks
50 52.54 2627.0050 48.46 2423.00
10050 55.84 2792.0050 45.16 2258.00
10050 55.06 2753.0050 45.94 2297.00
10050 51.34 2567.0050 49.66 2483.00
10050 53.34 2667.0050 47.66 2383.00
100
konsentrasi"Roti CPO 50%""Roti CPO 70%"Total"Roti CPO 50%""Roti CPO 70%"Total"Roti CPO 50%""Roti CPO 70%"Total"Roti CPO 50%""Roti CPO 70%"Total"Roti CPO 50%""Roti CPO 70%"Total
rasa
warna
aroma
tekstur
hardness
N Mean Rank Sum of Ranks

81
Test Statisticsa
1148.000 983.000 1022.000 1208.000 1108.0002423.000 2258.000 2297.000 2483.000 2383.000
-.731 -1.909 -1.626 -.300 -1.013.465 .056 .104 .764 .311
Mann-Whitney UWilcoxon WZAsymp. Sig. (2-tailed)
rasa warna aroma tekstur hardness
Grouping Variable: konsentrasia.
60% vs 70%
Ranks
50 55.63 2781.5050 45.37 2268.50
10050 59.48 2974.0050 41.52 2076.00
10050 51.74 2587.0050 49.26 2463.00
10050 52.73 2636.5050 48.27 2413.50
10050 57.07 2853.5050 43.93 2196.50
100
konsentrasi"Roti CPO 60%""Roti CPO 70%"Total"Roti CPO 60%""Roti CPO 70%"Total"Roti CPO 60%""Roti CPO 70%"Total"Roti CPO 60%""Roti CPO 70%"Total"Roti CPO 60%""Roti CPO 70%"Total
rasa
warna
aroma
tekstur
hardness
N Mean Rank Sum of Ranks
Test Statisticsa
993.500 801.000 1188.000 1138.500 921.5002268.500 2076.000 2463.000 2413.500 2196.500
-1.830 -3.206 -.443 -.794 -2.341.067 .001 .658 .427 .019
Mann-Whitney UWilcoxon WZAsymp. Sig. (2-tailed)
rasa warna aroma tekstur hardness
Grouping Variable: konsentrasia.

82
Tabel Hasil Penelitian Uji Kimia
Sample batch Kadar air (%)
Kadar abu (%)
Lemak (%)
Protein (%) Karbo(%)
Antioksidan(%) Vit. A (IU)
TBA-0 TBA-3
kontrol 1 29.43 2.00 3.51 9.58 55.48 8.46 2643.28 0.078 1.527 30.10 1.95 4.21 11.18 52.56 6.18 2562.55 0.078 1.563 29.98 2.00 3.86 10.86 53.30 7.00 2518.28 0.092 1.459 2 29.35 2.05 3.51 9.58 55.51 7.21 2427.13 0.125 1.429 30.28 1.80 4.21 8.94 54.77 6.09 2820.37 0.087 1.331 29.48 1.55 4.35 8.30 56.32 5.93 2450.57 0.109 1.391Rata2 29.77 1.89 3.94 9.74 54.66 6.81 2570.36 0.095 1.450
50% 1 32.38 1.70 4.74 9.58 51.61 9.68 10062.70 0.071 0.359 32.15 1.86 4.74 9.26 51.99 9.24 10075.72 0.088 0.372 32.48 1.72 4.06 9.58 52.16 9.70 10565.32 0.059 0.303 2 32.73 1.62 4.06 9.90 51.69 9.07 9989.78 0.073 0.279 32.23 1.68 4.60 7.98 53.51 8.94 10091.35 0.079 0.312 32.05 1.86 4.53 8.30 53.25 9.79 9948.12 0.083 0.314Rata2 32.33 1.74 4.45 9.10 52.37 9.40 10122.16 0.075 0.323
60% 1 35.50 1.73 4.84 8.62 49.31 13.32 11200.74 0.066 0.276 35.45 1.87 5.16 8.62 48.90 13.89 11161.68 0.125 0.251 34.95 1.60 5.16 7.98 50.31 13.08 11146.06 0.092 0.251 2 35.35 1.72 5.16 8.30 49.47 11.72 11578.36 0.137 0.221 35.60 1.56 5.81 8.30 48.73 13.82 11205.95 0.103 0.225 36.13 1.62 6.45 7.98 47.82 12.80 11607.00 0.065 0.151Rata2 35.50 1.68 5.43 8.30 49.56 13.10 11316.63 0.098 0.229
70% 1 36.40 1.87 6.45 7.98 47.29 18.71 12297.12 0.052 0.130 36.60 1.73 5.76 7.98 47.92 17.74 12672.13 0.092 0.085 37.08 1.87 5.82 7.98 47.25 18.84 12625.25 0.085 0.092 2 36.60 1.43 6.14 8.30 47.52 18.34 12166.91 0.118 0.073 36.75 1.52 7.66 8.30 45.77 17.84 11906.49 0.122 0.139 36.92 1.50 7.53 8.94 45.10 18.05 11817.94 0.084 0.125Rata2 36.73 1.65 6.56 8.25 46.81 18.25 12247.64 0.092 0.107

83
Uji Fisik Sample batch baking loss(%) hardness(N) elastisitas(mm) porositas jumlah pori kontrol 1 10.07 2.42 11.62 1.93 80 10.79 2.54 12.42 1.92 82 9.66 3.24 12.02 1.86 90 2 10.24 2.81 12.81 1.9 83 9.71 3.11 11.46 1.91 86 8.30 2.63 11.88 1.85 89rata-rata 9.80 2.79 12.04 1.90 85.00
50% 1 10.04 2.84 20.31 1.76 102 9.91 2.37 15.20 1.79 105 9.46 2.89 11.89 1.81 98 2 9.57 2.57 11.64 1.75 105 9.78 2.47 12.18 1.80 106 9.40 3.14 11.67 1.76 101rata-rata 9.69 2.71 13.81 1.78 102.83
60% 1 8.17 2.80 10.78 1.83 90 8.61 2.84 11.44 1.81 92 6.96 2.36 11.23 1.80 98 2 8.84 2.45 11.69 1.76 95 8.54 2.49 12.89 1.84 88 8.27 2.75 16.36 1.74 92rata-rata 8.23 2.61 12.40 1.80 92.50
70% 1 6.70 2.35 12.67 1.74 96 6.19 3.39 11.23 1.77 96 6.25 3.09 11.16 1.80 95 2 4.78 2.11 12.80 1.75 90 5.45 2.25 10.82 1.69 97 6.57 2.05 11.72 1.77 99rata-rata 5.99 2.54 11.74 1.75 95.50
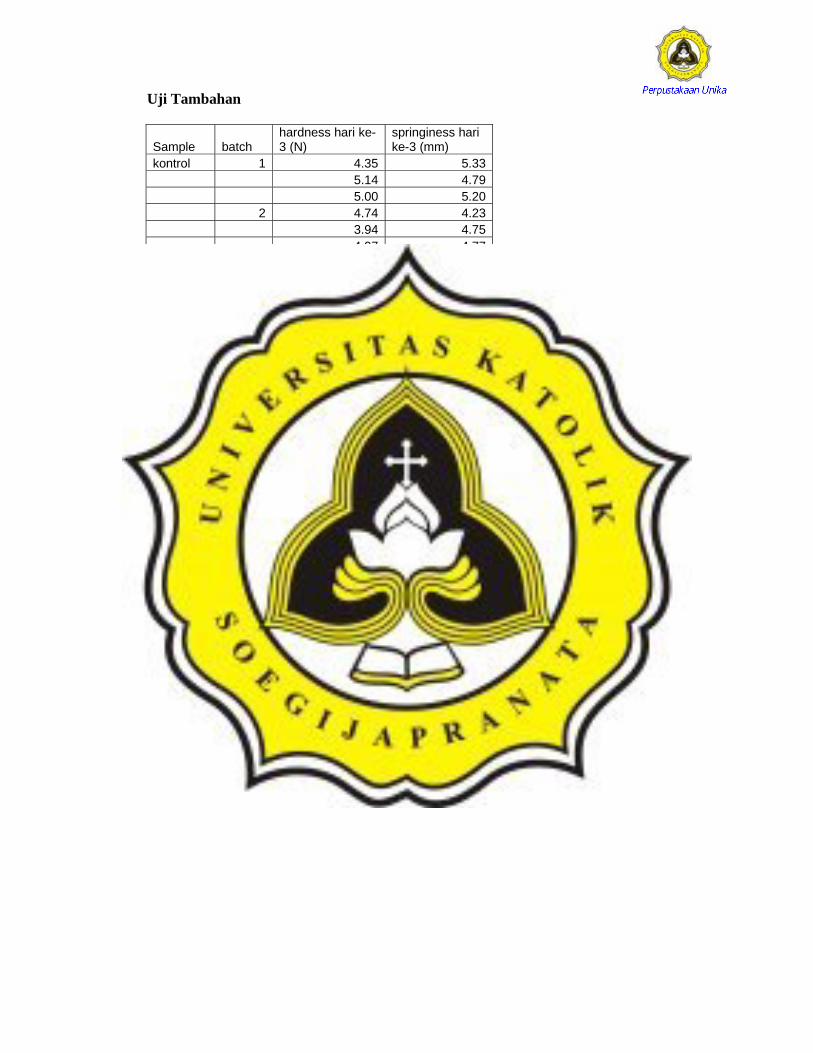
Uji Tambahan
Sample batch hardness hari ke-3 (N)
springiness hari ke-3 (mm)
kontrol 1 4.35 5.33 5.14 4.79 5.00 5.20 2 4.74 4.23 3.94 4.75 4.97 4.77rata-rata 4.69 4.85
50% 1 3.47 7.04 4.11 6.92 3.61 7.40 2 3.65 6.88 4.09 5.39 4.04 5.28rata-rata 3.83 6.48
60% 1 3.47 5.77 3.68 5.05 3.49 4.90 2 3.61 4.08 3.81 4.04 3.39 4.33rata-rata 3.57 4.70
70% 1 2.64 2.94 2.40 3.96 2.20 3.46 2 3.13 2.83 3.68 2.54 3.74 3.65rata-rata 2.96 3.23
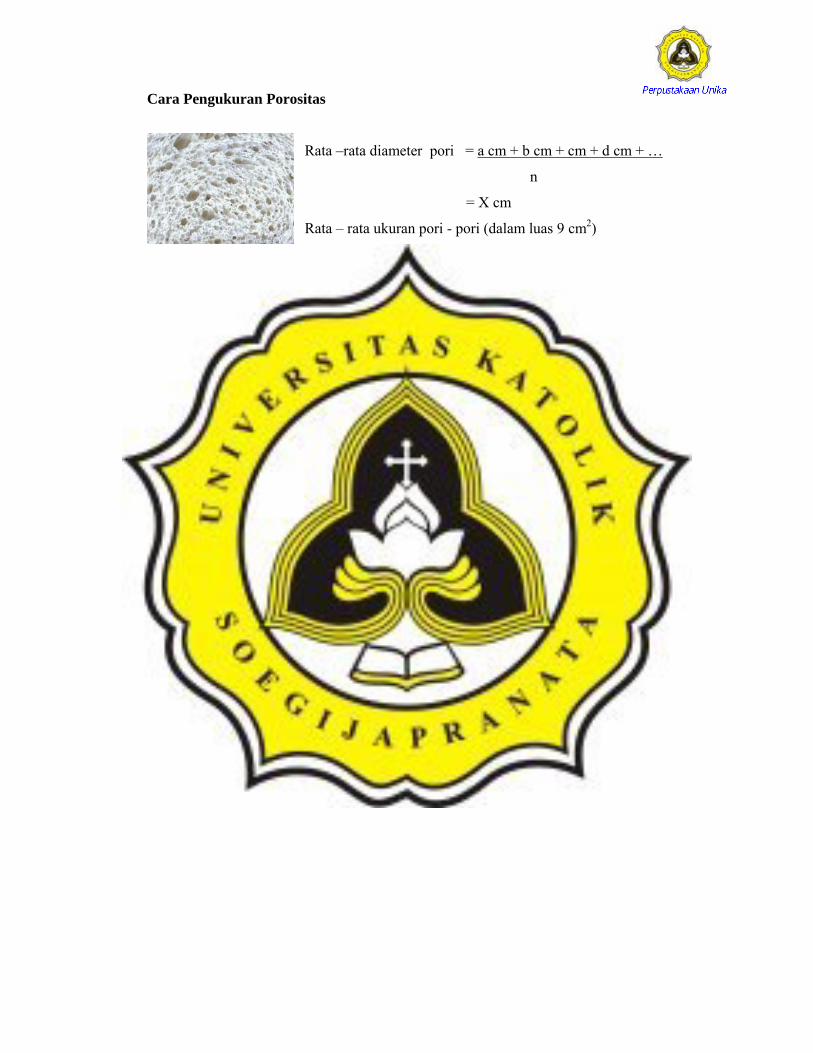
Cara Pengukuran Porositas
Rata –rata diameter pori = a cm + b cm + cm + d cm + …
n
= X cm
Rata – rata ukuran pori - pori (dalam luas 9 cm2)
= X / perbesaran
a,b,c,d,.... = diameter pori
n = jumlah pori – pori