Embed Size (px)
Citation preview

Scholars' Mine Scholars' Mine
Masters Theses Student Theses and Dissertations
Fall 2018
The development of a new formulation of fly ash class C based The development of a new formulation of fly ash class C based
geopolymer and assessing its performance in presence of drilling geopolymer and assessing its performance in presence of drilling
fluid contamination fluid contamination
Mohamed Saad Ahdaya
Follow this and additional works at: https://scholarsmine.mst.edu/masters_theses
Part of the Petroleum Engineering Commons
Department: Department:
Recommended Citation Recommended Citation Ahdaya, Mohamed Saad, "The development of a new formulation of fly ash class C based geopolymer and assessing its performance in presence of drilling fluid contamination" (2018). Masters Theses. 7816. https://scholarsmine.mst.edu/masters_theses/7816
This thesis is brought to you by Scholars' Mine, a service of the Missouri S&T Library and Learning Resources. This work is protected by U. S. Copyright Law. Unauthorized use including reproduction for redistribution requires the permission of the copyright holder. For more information, please contact [email protected].

i
THE DEVELOPMENT OF A NEW FORMULATION OF FLY ASH CLASS C BASED
GEOPOLYMER AND ASSESSING ITS PERFORMANCE IN PRESENCE OF
DRILLING FLUID CONTAMINATION
by
MOHAMED SAAD AHDAYA
A THESIS
Presented to the Faculty of the Graduate School of the
MISSOURI UNIVERSITY OF SCIENCE AND TECHNOLOGY
In Partial Fulfillment of the Requirements for the Degree
MASTER OF SCIENCE IN PETROLEUM ENGINEERING
2018
Approved by
Dr. Abdulmohsin Imqam, Advisor
Dr. Mohamed ElGawady, Co-Advisor
Dr. Shari Dunn Norman

ii
2018
MOHAMED SAAD AHDAYA
All Rights Reserved

iii
PUBLICATION THESIS OPTION
This thesis consists of the following two articles, formatted in the style utilized by
Missouri University of Science and Technology:
Paper I: Pages 57 - 81 have been accepted as a conference paper by the Society of
Petroleum Engineering under the title ‘‘New Formulation of Fly Ash Class C Based
Geopolymer for Oil Well Cementing’’.
Paper II: Pages 82 - 108, have been submitted to The Journal of Petroleum Science
and Engineering, under the tittle ‘‘Investigating Rheological and Mechanical Performance
of Geopolymer Cement in Presence of Water Based Drilling Fluid”.

iv
ABSTRACT
Cementing is one of the most critical steps in the drilling and completion of oil
wells. Traditionally, Portland cement is used for oil cementing operations; however,
geopolymer materials have recently attracted much attention because they are more cost-
effective and have less environmental impacts.
An intensive laboratory work was conducted to obtain a new formulation of fly ash
class C based geopolymer cement to be used as a potential alternative cementing material
to Portland cement in oil and gas cementing. Twenty-four variations of fly ash class C
based geopolymers were prepared, and by comparing several of their properties using API
standard tests, the optimum geopolymer formulation was determined. The selection of the
optimum formulation was based on five different tests, including rheology, density,
compressive strength, and fluid loss. Further tests were performed for optimized
geopolymer, including stability tests. Then, a comparison between the optimum mix design
and Portland cement was done using the same tests.
One of the main issues regarding oil well cementing is drilling fluids’
contamination. This research also investigates the effect of drilling fluid contamination
with geopolymer cement to understand its impact on geopolymer rheological and
mechanical performance. After geopolymer optimum design was selected, the slurries
were mixed with 0, 5, and 10 weight percent drilling fluid ratio to determine the effects of
drilling fluids on geopolymer properties using rheology, density, fluid-loss, and
compressive strength tests. Results showed that geopolymer had better performance
compared to Portland cement in the presence of drilling fluid contaminations, where
geopolymer exhibited higher compressive strength compared to Portland cement.

v
ACKNOWLEDGEMENTS
In the name of Allah, the most Beneficent, the most Merciful.
I would like to thank my family for their support and encouragement.
I would like to sincerely thank my advisor, Dr. Abdulmohsin Imqam, for his
support, guidance, and for supervising the work.
I would like to extend my gratitude to my co-advisor, Dr. Mohamed ElGawady,
for his support and help.
I would like to thank my defense committee member, Dr. Shari Dunn Norman, for
her time and useful feedback.
I would like to acknowledge my research group members for their great help and
valuable discussions.
I would like to thank my wife. I am really grateful for her support which helped a
lot during my study.

vi
TABLE OF CONTENTS
Page
PUBLICATION THESIS OPTION ................................................................................... iii
ABSTRACT ....................................................................................................................... iv
ACKNOWLEDGEMENTS ................................................................................................ v
LIST OF ILLUSTRATIONS ............................................................................................ xii
LIST OF TABLES .......................................................................................................... xvii
SECTION
1. INTRODUCTION .................................................................................................... 1
1.1. STATEMENT AND SIGNIFICANCE OF THE PROBLEM ........................ 1
1.2. EXPECTED IMPACTS AND CONTRIBUTION .......................................... 3
1.3. OBJECTIVES ................................................................................................. 4
1.4. SCOPE OF WORK ......................................................................................... 4
2. BACKGROUND AND EXISTING TECHNOLOGIES ......................................... 6
2.1. FIELD LIFE CYCLE ...................................................................................... 6
2.2. CLASSIFICATION OF CEMENT ................................................................. 8
2.2.1. Natural Cement. ................................................................................... 8
2.2.2. Pozzolanic Cement. ............................................................................. 8
2.2.3. Slag Cement. ....................................................................................... 8

vii
2.2.4. Portland Cement. ................................................................................. 9
2.3. PORTLAND CEMENT .................................................................................. 9
2.3.1. Portland Cement Composition. ......................................................... 10
2.3.2. Portland Cement Activation. ............................................................. 11
2.4. GEOPOLYMER ............................................................................................ 12
2.4.1. Geopolymer Definition. ..................................................................... 13
2.4.2. Benefits of Geopolymer. ................................................................... 13
2.4.3. Fly Ash Activation. ........................................................................... 14
2.4.4. Geopolymer as an Alternative to Portland Cement. .......................... 15
2.4.5. Geopolymer Constituents. ................................................................. 16
2.4.5.1. Fly ash. ............................................................................... 16
2.4.5.2. Alkaline liquids. ................................................................. 18
2.4.6. Geopolymer Properties. ..................................................................... 19
2.4.7. Geopolymer Evaluation Methods. ..................................................... 19
2.4.7.1. Rheological property of cement slurry. .............................. 20
2.4.7.2. Density of cement slurry. ................................................... 24
2.4.7.3. Strength. ............................................................................. 26
2.4.7.4. Setting time. ........................................................................ 28
2.4.7.5. Thickening time .................................................................. 28
2.4.7.6. Cement slurry filter loss. .................................................... 29

viii
2.4.7.7. Permeability. ....................................................................... 31
2.4.7.8. Bond strength. .................................................................... 31
2.4.7.9. Bulk shrinkage. ................................................................... 32
2.5. DRILLING FLUIDS ..................................................................................... 33
2.5.1. Drilling Fluid Function ...................................................................... 33
2.5.2. Drilling Fluid Types. ......................................................................... 33
3. LITERATURE REVIEW ....................................................................................... 35
3.1. GEOPOLYMER FORMALATION OPTIMIZATION ................................ 35
3.1.1. Rheology Behavior. ........................................................................... 35
3.1.2. Density Measurement Test. ............................................................... 36
3.1.3. Compressive Strength. ....................................................................... 38
3.1.4. Bond Strength. ................................................................................... 47
3.1.5. Bulk Shrinkage. ................................................................................. 49
3.1.6. Thickening Time Tests. ..................................................................... 51
3.1.7. Durability Test. .................................................................................. 52
3.1.8. Acid Resistance. ................................................................................ 52
3.2. DRILLING FLUIDS CONTAMINATION OF GEOPOLYMER ................ 52
PAPER
I. NEW FORMULATION OF FLY ASH CLASS C BASED GEOPOLYMER FOR
OIL WELL CEMENTING ............................................................................................ 57

ix
ABSTRACT ...................................................................................................................... 57
1. INTRODUCTION .................................................................................................. 58
2. EXPERIMENTAL DESCRIPTION ...................................................................... 61
2.1. MATERIALS ................................................................................................ 61
2.1.1. Fly Ash. ............................................................................................. 61
2.1.2. Sodium Hydroxide (NaOH). ............................................................. 62
2.1.3. Sodium Silicate (Na2SiO3). .............................................................. 62
2.1.4. Portland Cement. ............................................................................... 62
2.2. GEOPOLYMER PREPARATION PROCEDURE ...................................... 63
2.3. PORTLAND CEMENT PREPARATION PROCEDURE ........................... 64
2.4. EXPERIMENTAL METHODOLOGY ........................................................ 65
2.4.1. Density and Rheology. ...................................................................... 65
2.4.2. Compressive Strength Test. ............................................................... 65
2.4.3. Fluid Loss Test. ................................................................................. 65
2.4.4. Stability Test. ..................................................................................... 66
2.5. RESULTS AND DISCUSSIONS ................................................................. 67
2.5.1. Density and Rheology Results. ......................................................... 67
2.5.2. Compressive Strength Results. .......................................................... 70
2.5.3. Fluid Loss Test Results. .................................................................... 72
2.5.4. Optimized Geopolymer Slurry. ......................................................... 73

x
2.5.5. Stability Test Results. ........................................................................ 74
3. COMPARISON BETWEEN THE OPTIMIZED GEOPOLYMER AND
PORTLAND CEMENT ......................................................................................... 75
4. CONCLUSION ...................................................................................................... 78
NOMENCLATURE ......................................................................................................... 79
REFERENCES ................................................................................................................. 79
II. INVESTIGATING RHEOLOGICAL AND MECHANICAL PERFORMANCE OF
GEOPOLYMER CEMENT IN PRESENCE OF WATER BASED DRILLING
FLUID .......................................................................................................................... 82
ABSTRACT ...................................................................................................................... 82
1. INTRODUCTION .................................................................................................. 83
2. CHEMISTRY OF GEOPOLYMER ...................................................................... 86
3. EXPERIMENTAL DESCRIPTION ...................................................................... 87
3.1. MATERIALS ................................................................................................ 87
3.1.1. Fly Ash. ............................................................................................. 87
3.1.2. Sodium Hydroxide (NaOH). ............................................................. 88
3.1.3. Sodium Silicate (Na2SiO3). ............................................................... 88
3.1.4. Portland Cement. ............................................................................... 88
3.1.5. Drilling Fluids. .................................................................................. 89
3.2. EXPERIMENTAL METHODOLOGY AND PROCEDURE ...................... 90
3.2.1. Geopolymer Preparation Procedure. ................................................. 90

xi
3.2.2. Portland Cement Preparation Procedure. .......................................... 91
3.2.3. Density and Rheology. ...................................................................... 92
3.2.4. Compressive Strength Test. ............................................................... 92
3.2.5. Fluid Loss Test. ................................................................................. 92
3.3. RESULTS AND DISCUSSIONS ................................................................. 93
3.3.1. Density Measurement Results. .......................................................... 93
3.3.2. Rheology Results. .............................................................................. 94
3.3.3. Compressive Strength Results. .......................................................... 96
3.3.4. Fluid Loss Test Results. .................................................................. 100
4. CONCLUSION .................................................................................................... 102
NOMENCLATURE ....................................................................................................... 104
REFERENCES ............................................................................................................... 105
SECTION
4. CONCLUSIONS AND RECOMMENDATIONS ............................................... 109
4.1. CONCLUSIONS ......................................................................................... 109
4.2. RECOMMENDATIONS ............................................................................ 111
BIBLIOGRAPHY ........................................................................................................... 112
VITA ............................................................................................................................... 120

xii
LIST OF ILLUSTRATIONS
SECTION Page
Figure 1.1. An illustration of Portland cement issues.........................................................2
Figure 1.2. Scope of work...................................................................................................5
Figure 2.1. Field life cycle..................................................................................................7
Figure 2.2. The cement making processes (Rahman, 2018)..............................................10
Figure 2.3. Typical oxide composition of a general-purpose Portland cement (Mindess
& Young, 1981)............................................................................................... 11
Figure 2.4. Portland cement activation.............................................................................. 11
Figure 2.5. Geopolymer composition................................................................................ 14
Figure 2.6. Image of geopolymer mix (Salehi et al., 2017).............................................. 14
Figure 2.7. Comparison of Portland slurry vs. geopolymer slurry (Salehi et al., 2016)... 15
Figure 2.8. Source of fly ash……………………………………………………………...16
Figure 2.9. Coal fueled power plant process (Perkins & Will, 2011)…………………….17
Figure 2.10. Mechanism to measure the fluid rheology…………………………………..20
Figure 2.11. Newtonian fluid behavior…………………………………………………...21
Figure 2.12. Fluid behavior………………………………………………………………22
Figure 2.13. OFITE "rotational" viscometer…………………..…………………………23
Figure 2.14. Fluid density balance……………………………………………………….25
Figure 2.15. Fluid density balance device………………………………………………..25
Figure 2.16. Types of strengths…………………………………………………………..26
Figure 2.17. Hydraulic press unit…………………………………………………………27
Figure 2.18. Vicat apparatus (Indiamart)…………………………………………………28

xiii
Figure 2.19. Cement consistometer (Cement Test Equipment)…………………………..29
Figure 2.20. Filter pressure apparatus ……………………………………………….…..30
Figure 2.21. Sample design for the bond strength test……………………………………32
Figure 2.22. Length change shrinkage (length change)……………………………….…32
Figure 3.1. Effect of different ratios of fly ash to alkaline activator on viscosity of
geopolymer cement slurry for different concentration of sodium hydroxide
(Suppiah, et al., 2016)……..............................................................................36
Figure 3.2. Effect of different ratios of fly ash to alkaline activator on density of
geopolymer cement slurry for different concentration of sodium hydroxide
(Suppiah, et al., 2016)…...………………………………………...................37
Figure 3.3. The effect of alkaline activator to fly ash ratio on the compressive strength
(Abdullah, et al., 2012)…………………..……...…………………………...38
Figure 3.4. Compressive strength results of geopolymer and class G cement at
different curing temperature (Nasvi et al., 2012).....………………………..39
Figure 3.5. Effect of temperatures on compressive strength (Sugumaran, 2015).……....40
Figure 3.6. Effect of water to fly ash ratio on compressive strength at different curing
days (Sugumaran, 2015)……………………………….…………………….40
Figure 3.7. Effect of sodium hydroxide molarity on compressive strength at different
curing days (Sugumaran, M. 2015)………..……………………………...…41
Figure 3.8. Effect of molarity of sodium hydroxide on geopolymer compressive
strength (Salehi et al., 2016) ...........................................................................42
Figure 3.9. Compressive strength comparison at different curing times. (Salehi et al.,
2016)……………………………………………………………………..….43
Figure 3.10. Compressive strength at different temperatures. (Salehi et al., 2016)...........43
Figure 3.11. Results of compressive strength (Salehi et al., 2016)....................................44
Figure 3.12. Effect of NaOH concentration on the compressive strength (Suppiah,
et al., 2016)...................................................................................................45
Figure 3.13. Bond strength setup (Liu et al., 2017)...........................................................48

xiv
Figure 3.14. Cement to pipe shear bond strength at 170 ˚F on day 7 (Liu et al., 2017).......48
Figure 3.15. Bulk shrinkage results (Khalifeh et al., 2014)……………………................49
Figure 3.16. Shrinkage results after 10 days (Salehi et al., 2017)......................................50
Figure 3.17. Shrinkage results after 12 hours (Salehi et al., 2017)………………………51
Figure 3.18. Thickening time results at different temperatures (Salehi et al., 2016)….....52
Figure 3.19. Compressive strength results of different type of cement with different
ratios of SBM contamination (Aughenbaugh, et al., 2014)..........................53
Figure 3.20. Compressive strength results for geopolymer and Portland cement with
different SBM ratios (Liu, et al., 2016)........................................................54
Figure 3.21. Rheological properties results of Portland cement and geopolymer with
different SBM ratios (Liu, et al., 2016)........................................................55
Figure 3.22. Thickening time results of geopolymer with different SBM ratios at
125 ˚F (Liu, et al., 2016)…………………………………………………...55
Figure 3.23. The effect of pressure on thickening time (Liu, et al., 2017)……………....56
Figure 3.24. Compressive strength results of geopolymer and Portland cement with
different OBM ratios (Salehi, et al., 2018)…………..………………….....56
PAPER I
Figure 1. Mass measurement setup……………………………………………………....66
Figure 2. Geopolymer mixture for (AA/FA) = 0.8, (SS/SH) = 1, and different sodium
hydroxide concentrations, a) 5 M, b) 10 M, c) 15 M........................................67
Figure 3. Density for different AA/FA ratios and different SH concentrations for
SS/SH = 1 ………………………………………………….............................68
Figure 4. Shear stress vs. shear rate for different SS/SH ratios for the concentration
of 10 M of sodium hydroxide and AA/FA = 0.4 and Portland cement.............69
Figure 5. Plastic viscosity results for different AA/FA ratios with different sodium
hydroxide concentrations at SS/SH = 1.............................................................70
Figure 6. Compressive strength of different SS/SH ratios and different concentrations
of sodium hydroxide with AA/FA = 0.2...........................................................71

xv
Figure 7. Compressive strength of different SS/SH ratios at sodium hydroxide = 10M
with AA/FA = 0.4...............................................................................................72
Figure 8. Fluid loss for different AA/FA ratios and different SH concentrations for
SS/SH = 1...........................................................................................................73
Figure 9. Free fluids test....................................................................................................74
Figure 10. Comparison in rheology behavior between the optimized geopolymer and
Portland cement........……………………………………………….………..76
Figure 11. Comparison in compressive strength between the optimized geopolymer
and Portland cement.………………………………………………………..77
Figure 12. Comparison in fluid loss between the optimized geopolymer and Portland
cement………………………………………………………………………77
PAPER II
Figure 1. Reaction of fly ash with alkaline activator to produce geopolymer...................91
Figure 2. Density of geopolymer and Portland cement slurries after adding drilling
fluids...................................................................................................................93
Figure 3. Viscosity of geopolymer and Portland cement slurries using different
drilling fluid weight percent..............................................................................94
Figure 4. Shear stress verses shear rate using different drilling fluid weight percent at
room temperature for geopolymer.....................................................................95
Figure 5. Shear stress verses shear rate using different drilling fluid weight percent at
room temperature for Portland cement..............................................................96
Figure 6. Compressive strength of geopolymer and Portland cement after 1, 3, and
7 days for no drilling fluid.................................................................................97
Figure 7. Compressive strength of geopolymer and Portland cement after 1, 3, and
7 days using 10 weight percent of drilling fluid................................................98
Figure 8. Reduction of compressive strength of geopolymer and Portland cement after
1 day....................................................................................................................99
Figure 9. Reduction of compressive strength of geopolymer and Portland cement after
3 days.................................................................................................................99

xvi
Figure 10. Reduction of compressive strength of geopolymer and Portland cement
after 7 days......................................................................................................100
Figure 11. Geopolymer fluid loss with different drilling fluids weight percent................101
Figure 12. Portland cement fluid loss with different drilling fluids weight percent..........102

xvii
LIST OF TABLES
SECTION Page
Table 2.1. Main constituents in typical Portland cement (Mindess & Young, 1981)....... 10
Table 2.2. The chemical requirements for fly ash classification (Boxley et al., 2012)..... 17
Table 2.3. Molecular and equivalent weights of some compounds (Dharmadhikari &
Harris, 2017).................................................................................................... 18
Table 3.1. Elemental ratios of fly ash geopolymer (Salehi et al., 2016)........................... 41
Table 3.2. Details of mix proportions (Suppiah, et al., 2016)........................................... 44
Table 3.3. Composition of fly ash (Liu et al., 2017)......................................................... 46
Table 3.4. Compressive strength results at 7 days (Liu et al., 2017)................................ 46
Table 3.5. Average shear bond strength (Salehi et al., 2016)............................................ 47
Table 3.6. Autogenous shrinkage of the geopolymer samples (Khalifeh et al., 2015)..... 50
PAPER I
Table 1. The compositions of fly ash................................................................................ 62
Table 2. The compositions of Portland cement................................................................. 63
Table 3. Geopolymer mix designs for different ratios of SS/SH and AA/FA................... 64
Table 4. Sedimentation test results of Portland cement and geopolymer cured at room
temperature 24 ̊C and Atmospheric pressure...................................................... 75
PAPER II
Table 1. The chemical composition of fly ash.................................................................. 88
Table 2. The chemical composition of Portland cement................................................... 89
Table 3. Drilling fluids properties..................................................................................... 89
Table 4. Geopolymer mixing design................................................................................. 91
Table 5. Portland cement mixing design........................................................................... 91

1
1. INTRODUCTION
1.1. STATEMENT AND SIGNIFICANCE OF THE PROBLEM
Well integrity is defined as “application of technical, operational, and
organizational solutions, to reduce risk of uncontrolled release of formation fluids
throughout the life cycle of a well” (Norsok D-010., 2013). The main goal of cementing is
to provide full zonal isolation. Preventing fluid migration from the formation into wellbores
is one of the most important purposes of the cementing operation. If zonal isolation is lost,
it could result in severe operational difficulties and huge environmental issues as well as
high remedy costs. Figure 1.1 shows an illustration of Portland cement drawbacks. As an
example, the Gulf of Mexico experienced one of the worst blowouts in oil industry in 2010,
Mocondo, which caused a major oil spill. One of the major reasons of this accident is
primary cement failure (Santos & Ribeiro, 2017). Portland cement has been used for many
years in cementing operations in oil and gas wells, but it has many drawbacks, including
high cost, environmental impacts, and failure problems. Portland cement failures include
radial cracks within the cement sheath, micro-annuli at the interfaces of the cement, and
channels through the cement matrix (Bois et al., 2012).
Portland cement productions release an enormous amount of carbon dioxide (CO2),
which is a significant contributor to global warming. Manufacturing Portland cement
requires a huge amount of heat achieved by burning a massive volume of fuel and
decomposition of limestone, thus causing an enormous quantity of CO2 emissions (Kong
& Sanjayan, 2008). Almost one ton of CO2 is released upon producing one ton of Portland
cement (United Nations Environment Programme).

2
Figure 1.1. An illustration of Portland cement issues
Another prominent problem that faces cementing operations is drilling fluid
contaminations. When injecting cement slurries into the casing and back through the
annulus, cement slurry may contact the drilling fluids remaining after drilling operations.
This could change the cement slurry properties, which could impact the cementing
operations negatively. When drilling fluid contacts Portland cement, the compressive
strength of Portland cement is impacted significantly (El Sayed, 1995; Aughenbaugh et al.,
2014). Furthermore, drilling fluids have negative effects on Portland cement rheological
properties; they increase Portland cement slurries’ viscosity, which affects its pumpability
(Liu, et al., 2016).
The main objective of this research is to provide an alternative material to replace
Portland cement in the oil and gas industry, and to investigate the effects of drilling fluids
contaminations on geopolymer properties.
Portland Cement Drawbacks
Environmental Concern
Carbon dioxide emissions
Portland cement manufacturing
Cement Failure
Cracks within the cement
Channels within the cement

3
1.2. EXPECTED IMPACTS AND CONTRIBUTION
The new formulation of fly ash class C based geopolymer was studied in this work
and compared to Portland cement. A summary of the benefits of using the geopolymer is
listed below:
Geopolymer is an environmentally friendly material that can be used in oil
and gas wells as an alternative to Portland cement.
Since fly ash, which is the main material used to manufacture geopolymer,
is a by-product of coal combustion, it is extremely cheap to acquire.
Geopolymer could overcome failures of Portland cement to provide full
zonal isolations.
Geopolymer has the potential to have higher early compressive strength
compared to Portland cement which could result in a reduced wait on
cement time. This could result in a reduction in operational costs.
Geopolymer could have ability to retain its water which would also increase
the potential of reaching the desired height of cement in the annulus.
One of the problems associated with oil cementing operations is the drilling fluid
contaminations because they can affect rheological and mechanical properties of
geopolymer and Portland cement, which makes studying these properties essential.
Expected results are as follows:
Drilling fluids could improve the geopolymer viscosity. This improvement
could increase the flowability of geopolymer.
Geopolymer could perform better compared to Portland cement in presence
of drilling fluids contaminations.

4
1.3. OBJECTIVES
The main objective of this research was to provide an environmentally friendly and
cost-effective material to be a replacement to Portland cement in oil and gas well
cementing. The following objectives will be achieved from this research:
A study of the effect of changing the sodium silicate to sodium hydroxide
ratios on the fly ash class C based geopolymer properties
An investigation of the impact of increasing the sodium hydroxide molarity
on the fly ash class C based geopolymer
An examination of the influence of increasing the amount of fly ash to
alkaline activator on the fly ash class C based geopolymer
Development of a new formulation of geopolymer using fly ash class C to
be used as a cost-effective and environmentally friendly alternative to
Portland cement
An investigation of the effect of drilling fluid contaminations on rheological
and mechanical performance of fly ash class C based geopolymer
A comparison of the results of drilling fluids contamination on geopolymer
to Portland cement
1.4. SCOPE OF WORK
This research includes two main experimental tasks. Figure 1.2 shows the scope of
work for this research. The first task is to develop a new formulation of fly ash class C
based geopolymer by using different sodium hydroxide concentrations (NaOH molarity),
sodium silicate to sodium hydroxide ratios (SS/SH), and alkaline activator to fly ash ratios

5
(AA/FA). The second task is to study the effect of drilling fluid contamination on the
rheological and mechanical properties of geopolymer and Portland cement.
Figure 1.2. Scope of work
6
2. BACKGROUND AND EXISTING TECHNOLOGIES
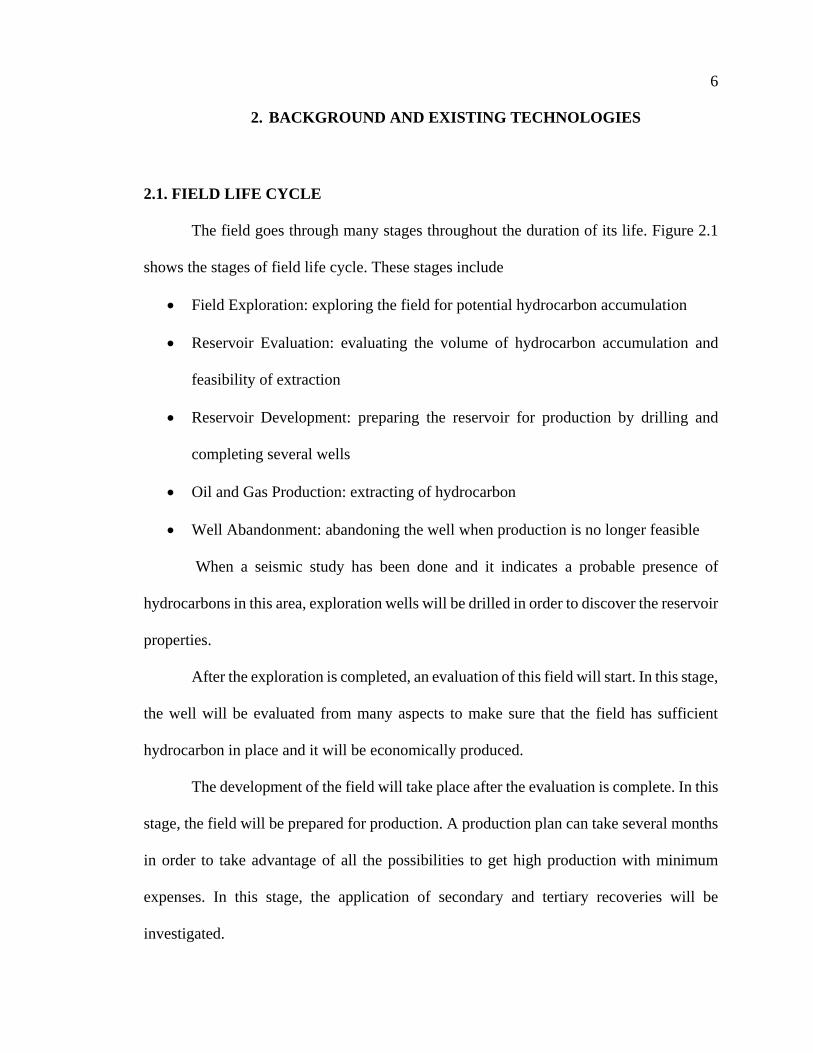
2.1. FIELD LIFE CYCLE
The field goes through many stages throughout the duration of its life. Figure 2.1
shows the stages of field life cycle. These stages include
Field Exploration: exploring the field for potential hydrocarbon accumulation
Reservoir Evaluation: evaluating the volume of hydrocarbon accumulation and
feasibility of extraction
Reservoir Development: preparing the reservoir for production by drilling and
completing several wells
Oil and Gas Production: extracting of hydrocarbon
Well Abandonment: abandoning the well when production is no longer feasible
When a seismic study has been done and it indicates a probable presence of
hydrocarbons in this area, exploration wells will be drilled in order to discover the reservoir
properties.
After the exploration is completed, an evaluation of this field will start. In this stage,
the well will be evaluated from many aspects to make sure that the field has sufficient
hydrocarbon in place and it will be economically produced.
The development of the field will take place after the evaluation is complete. In this
stage, the field will be prepared for production. A production plan can take several months
in order to take advantage of all the possibilities to get high production with minimum
expenses. In this stage, the application of secondary and tertiary recoveries will be
investigated.

7
After the development is completed, the field will be ready for production. In this
stage, most wells will be used as production wells in order to produce at very high rates,
especially if the oil prices are too high.
The last stage of the field life cycle is the abandonment. The abandonment stage is
the final stage at which time the field will be left and isolated. In this stage, the field reaches
the end of its life due to low production rate that cannot cover the field expenses. In this
situation, the field has to be abandoned. All wells have to be plugged to avoid any
contamination in the reservoir.
Figure 2.1. Field life cycle
8
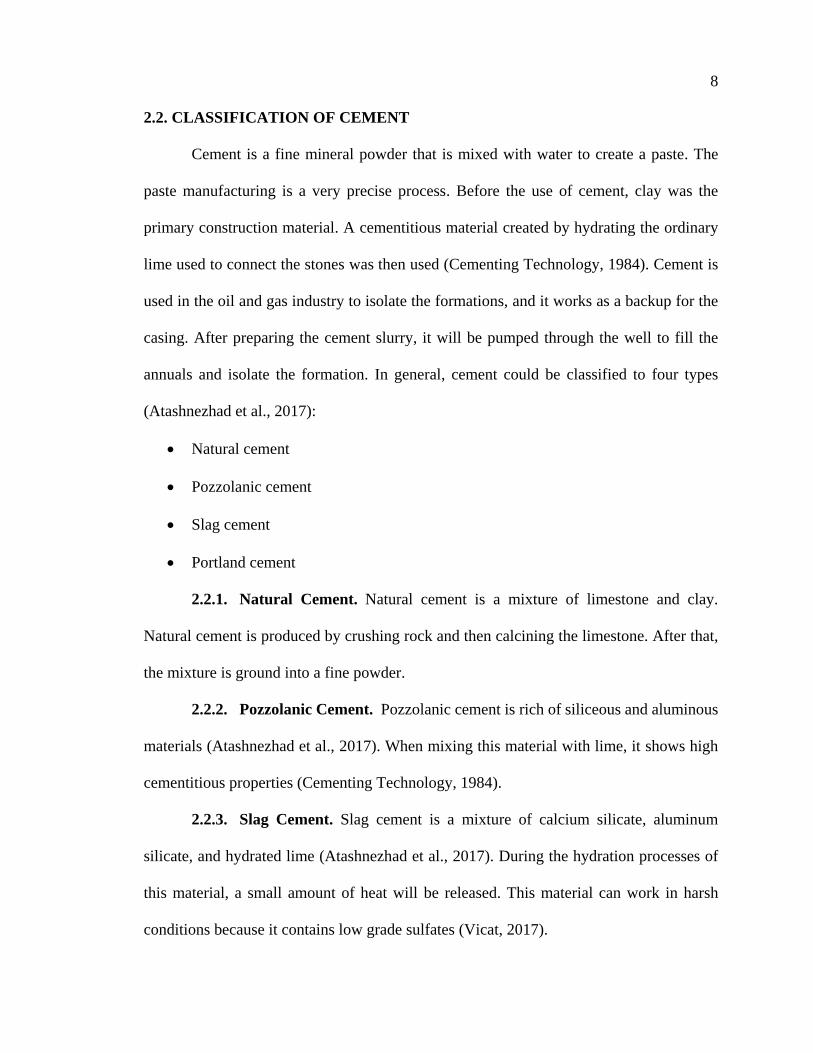
2.2. CLASSIFICATION OF CEMENT
Cement is a fine mineral powder that is mixed with water to create a paste. The
paste manufacturing is a very precise process. Before the use of cement, clay was the
primary construction material. A cementitious material created by hydrating the ordinary
lime used to connect the stones was then used (Cementing Technology, 1984). Cement is
used in the oil and gas industry to isolate the formations, and it works as a backup for the
casing. After preparing the cement slurry, it will be pumped through the well to fill the
annuals and isolate the formation. In general, cement could be classified to four types
(Atashnezhad et al., 2017):
Natural cement
Pozzolanic cement
Slag cement
Portland cement
2.2.1. Natural Cement. Natural cement is a mixture of limestone and clay.
Natural cement is produced by crushing rock and then calcining the limestone. After that,
the mixture is ground into a fine powder.
2.2.2. Pozzolanic Cement. Pozzolanic cement is rich of siliceous and aluminous
materials (Atashnezhad et al., 2017). When mixing this material with lime, it shows high
cementitious properties (Cementing Technology, 1984).
2.2.3. Slag Cement. Slag cement is a mixture of calcium silicate, aluminum
silicate, and hydrated lime (Atashnezhad et al., 2017). During the hydration processes of
this material, a small amount of heat will be released. This material can work in harsh
conditions because it contains low grade sulfates (Vicat, 2017).
9
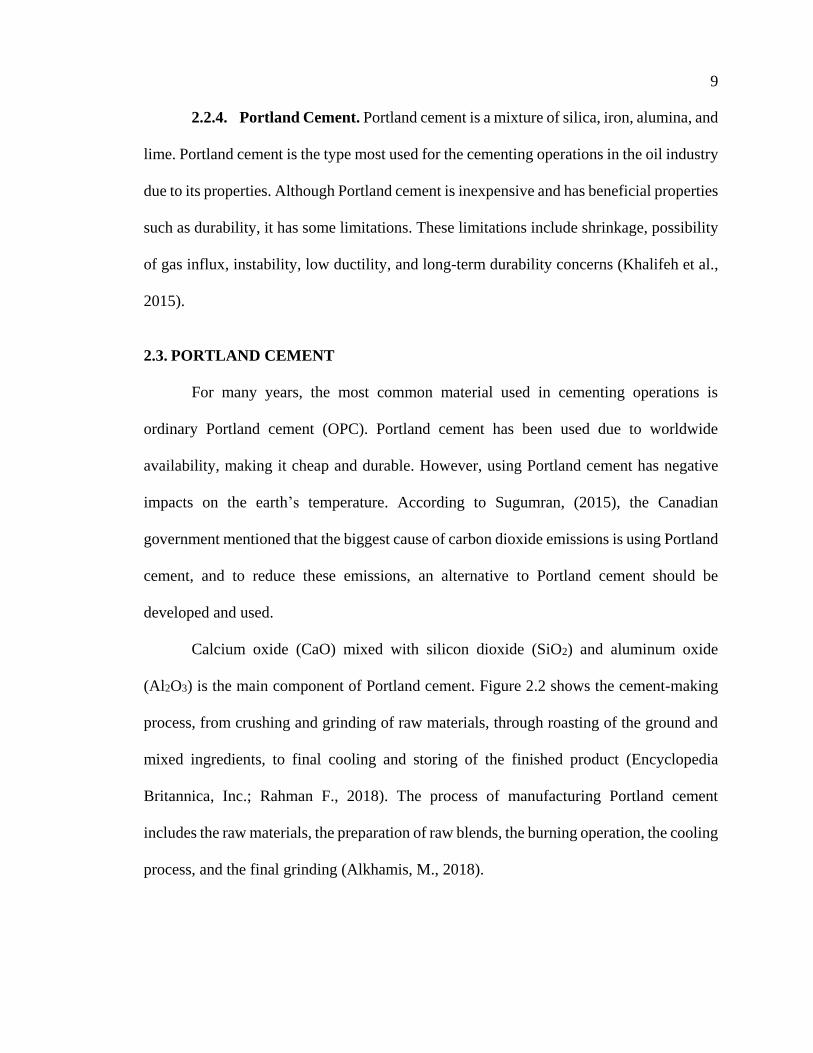
2.2.4. Portland Cement. Portland cement is a mixture of silica, iron, alumina, and
lime. Portland cement is the type most used for the cementing operations in the oil industry
due to its properties. Although Portland cement is inexpensive and has beneficial properties
such as durability, it has some limitations. These limitations include shrinkage, possibility
of gas influx, instability, low ductility, and long-term durability concerns (Khalifeh et al.,
2015).
2.3. PORTLAND CEMENT
For many years, the most common material used in cementing operations is
ordinary Portland cement (OPC). Portland cement has been used due to worldwide
availability, making it cheap and durable. However, using Portland cement has negative
impacts on the earth’s temperature. According to Sugumran, (2015), the Canadian
government mentioned that the biggest cause of carbon dioxide emissions is using Portland
cement, and to reduce these emissions, an alternative to Portland cement should be
developed and used.
Calcium oxide (CaO) mixed with silicon dioxide (SiO2) and aluminum oxide
(Al2O3) is the main component of Portland cement. Figure 2.2 shows the cement-making
process, from crushing and grinding of raw materials, through roasting of the ground and
mixed ingredients, to final cooling and storing of the finished product (Encyclopedia
Britannica, Inc.; Rahman F., 2018). The process of manufacturing Portland cement
includes the raw materials, the preparation of raw blends, the burning operation, the cooling
process, and the final grinding (Alkhamis, M., 2018).

10
Figure 2.2. The cement making processes (Rahman, 2018)
2.3.1. Portland Cement Composition. The main composition of Portland cement
is shown in Table 2.1 and Figure 2.3.
Table 2.1. Main constituents in typical Portland cement (Mindess & Young, 1981)
Chemical Name Chemical Formula Shorthand
Notation
Percent by
Weight
Tricalcium Silicate 3CaO×SiO2 C3S 50
Dicalcium Silicate 2CaO×SiO2 C2S 25
Tricalcium
Aluminate 3CaO×Al2O3 C3A 12
Tetracalcium
Aluminoferrite 4CaO×Al2O3×Fe2O3 C4AF 8
Gypsum CaSO4×H2O CSH2 3.5

11
Figure 2.3. Typical oxide composition of a general-purpose Portland cement (Mindess &
Young, 1981)
2.3.2. Portland Cement Activation. Although there are specific weights for
Portland cement design, it is relatively easy to mix. Figure 2.4 gives an idea about Portland
cement activation. Portland cement slurry mainly consists of Portland cement powder and
water. To make Portland cement ready for use, water is added to the cement powder.
Figure 2.4. Portland cement activation
Production of Portland cement, in most cases, should follow specific standards that
depend on the cement's application. In order to produce the optimum mixture, some
additives have to be added, which include sand, siliceous loams, pozzolans, iron pyrites,
and alumina.
Tricalcium Silicate
50%
Dicalcium Silicate
25%
Tricalcium Aluminate
12%
Tetracalcium
Aluminoferrite8%
Gypsum3%
Other2%
Water Portland cement Portland cement Powder

12
According to Morga (1958), Portland cement is classified into seven types:
Class A: Used when the depth is less than 6,000 ft.
Class B: Also used for shallow depths of less than 6,000 ft. However, its main
application is when sulfate resistance is required.
Class C: Similar to class A and B, but is mainly applied when high early strength
is needed.
Class N: Used for higher depths than the previous types, ranging from 6000 to 9000
ft. It is applicable at moderate temperature and pressure.
Class D: Similar to class N, but it is used at larger depth of 6,000 to 12,000 ft.
Class E: Used for depths of 6,000 to 14,000 ft and for high pressure and temperature
wells.
Class F: Used for higher depths of 10,000 to 16,000 ft and for higher pressure and
higher temperature.
Class G: Where calcium sulfate and water are added during the production of class
G cement, which requires a more thorough mixing.
2.4. GEOPOLYMER
In the last few years, researchers have studied geopolymer properties to be used as
an alternative to Portland cement. A few papers were published in this area showing good
results to consider geopolymer as a replacement to Portland cement. As was mentioned
before, Portland cement is used mostly for cementing operations. However, Portland
cement has a huge effect on the environment because of the way it is manufactured, which
requires burning a huge amount of fuel and decomposition of limestone. This results in an

13
enormous volume of carbon dioxide being released into the atmosphere (Kong & Sanjayan,
2008). Furthermore, there are other advantageous properties that characterize the
geopolymer, which includes thermal stability, low surface roughness, and durability.
(Khalifeh, 2014).
2.4.1. Geopolymer Definition. The thermal reactions between fly ash and
alkaline activator make the geopolymer binders. In other words, the geopolymer can be
defined as a reaction between fly ash and an alkaline activator, which could be sodium
hydroxide (NaOH) or potassium hydroxide (KOH) added to sodium silicate (Na2SiO3).
This result of this reaction is the geopolymer.
2.4.2. Benefits of Geopolymer. Geopolymer has many advantages over Portland
cement including its low cost, and more environmentally friendly.
Geopolymer is More Cost Effective: Although Portland cement is cheap,
geopolymer is cheaper. As was mentioned before, the main component of the geopolymer
is fly ash, the source of which is power plants. Since fly ash is a by-product of coal
combustion, it is extremely cheap to acquire. Most countries depend on power plants to
produce electricity. These power plants burn coal and produce an enormous amount of fly
ash. Because of the availability of the fly ash, it is extremely cheap.
Geopolymer is More Environmentally Friendly: Regarding environmental impacts,
Portland cement has huge environmental effects due to its manufacturing process, which
requires burning a vast amount of fuel and decomposition of limestone, thus causing
enormous volumes of carbon dioxide (CO2) emissions (Kong & Sanjayan., 2008).
Manufacturing Portland cement releases carbon dioxide, and these emissions have negative
14
effects on the climate. However, the main component of the geopolymer is fly ash, which
comes from power plants and has fewer environmental impacts.
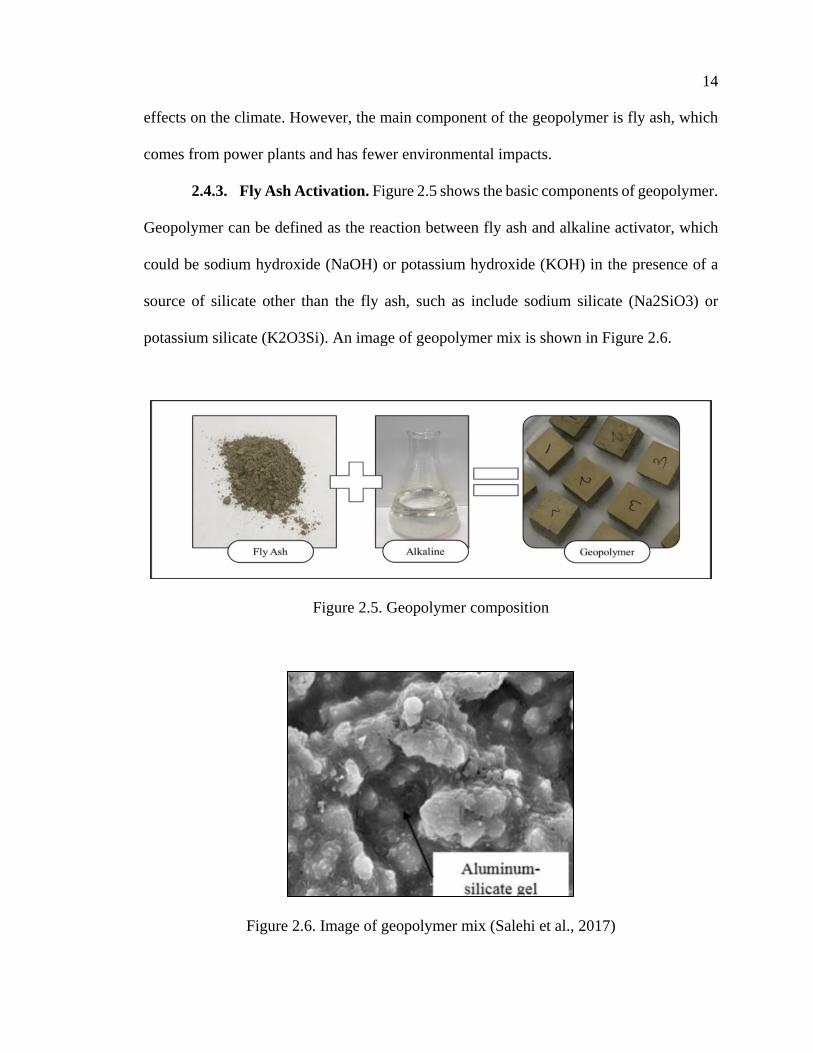
2.4.3. Fly Ash Activation. Figure 2.5 shows the basic components of geopolymer.
Geopolymer can be defined as the reaction between fly ash and alkaline activator, which
could be sodium hydroxide (NaOH) or potassium hydroxide (KOH) in the presence of a
source of silicate other than the fly ash, such as include sodium silicate (Na2SiO3) or
potassium silicate (K2O3Si). An image of geopolymer mix is shown in Figure 2.6.
Figure 2.5. Geopolymer composition
Figure 2.6. Image of geopolymer mix (Salehi et al., 2017)

15
2.4.4. Geopolymer as an Alternative to Portland Cement. Portland cement has
been used as a common material in cementing operations in oil and gas wells for many
years due to its properties and worldwide availability. However, according to Berry, et al.
(2009), emissions of the greenhouse gases due to the manufacturing of the cement were
7% in 2004. Furthermore, according to Sugumaran, (2015), the Canadian government
stated that the biggest cause of carbon dioxide emissions is the production of Portland
cement and to reduce this emission, an alternative to Portland cement should be used.
Geopolymer can be used as alternative material because geopolymer is cost effective and
environmentally friendly.
The thermal reactions between fly ash and alkaline activator make geopolymer
binders. Fly ash is considered a pozzolanic material, which consists of siliceous and
aluminous components (Salehi et al., 2017). Figure 2.7 shows a simple comparison
between Portland cement slurry and geopolymer slurry. As shown in this Figure, Portland
cement consists of calcium hydroxide and calcium silicate, while geopolymer consists of
alumino-silicate gel (Salehi et al., 2016)
Figure 2.7. Comparison of Portland slurry vs. geopolymer slurry (Salehi et al., 2016)

16
2.4.5. Geopolymer Constituents. Geopolymer cement is formed from the
reaction between the fly ash and alkaline activator.
2.4.5.1. Fly ash. Fly ash is a material that is formed at power plants after coal is
combusted. After incineration, fly ash is collected from the flue and bottom ash is collected
from the bottom of the boiler. Figure 2.8 shows this process. Fly ash components vary
because it strongly depends on the properties of the coal that is burned. In general, fly ash
contains large amounts of silicon dioxide (SiO2) and calcium oxide (CaO).
Figure 2.8. Source of fly ash
The difference between bottom ash and fly ash is the chemical compositions. Figure
2.9 shows the source of the ashes. During the combustion processes, lighter components
such as calcium minerals are suspended in the air, thus representing the fly ash. However,
heavier components such as silicate minerals stand in the bottom of the boiler, which is
called the bottom ash.

17
The two most common types of fly ash are class C and class F. According to the
American Society for Testing and Materials (ASTM C 618), the differences between these
two types is that class C has a higher content of calcium oxide than class F, so class C is
also known as high calcium fly ash. Table 2.2 shows the Chemical Requirements for Fly
Ash Classification.
Table 2.2. The chemical requirements for fly ash classification (Boxley et al., 2012)
Properties Fly Ash Classes
Class F Class C
Minimum percentage of silicon dioxide, aluminum
oxide, and iron oxide 70.0 50.0
Maximum percentage of sulfur trioxide 5.0 5.0
Maximum percentage of moisture content, 3.0 3.0
Maximum percentage of material loss on ignition (LOI) 6.0 6.0
Figure 2.9. Coal fueled power plant process (Perkins & Will, 2011)

18
There is a huge amount of fly ash created around the world. The amount of fly ash
will be increased in the next few years because of the huge increase of power demand.
Because of the vast amount of fly ash, it is an extremely inexpensive material.
2.4.5.2. Alkaline liquids. Alkaline liquids are rich in silicate, which could be
sodium silicate or potassium silicate, in addition to sodium hydroxide or potassium
hydroxide, which is important for polymerization operation. Alkaline liquids are needed to
activate fly ash in order to get a geopolymer.
To prepare the different concentrations of sodium hydroxide, specific weight of
sodium hydroxide should be added to the water to make the volume 1 liter. This specific
weight comes from the equivalent weight, which is equal to the molecular weight divided
by 1. The molecular weight for NaOH is 40, so equivalent weight = 40/1 = 40. For instance,
to prepare 1 N of sodium hydroxide solution (NaOH), 40.00 gm of NaOH should be added
to the water to make 1 liter. So, if we need 10 M of sodium hydroxide solution, 400.00 gm
of NaOH should be added to water to make 1 liter. Table 2.3 shows molecular and
equivalent weights of some common compounds.
Table 2.3. Molecular and equivalent weights of some compounds (Dharmadhikari &
Harris, 2017)
Chemical name Formula Molecular weight
(g/mol)
Equivalent weight
(g/equiv)
Hydrochloric acid HCL 36.46 36.46
Nitric acid HNO3 63.01 63.01
Water H2O 18.02 18.02
Sodium hydroxide NaOH 40.00 40.00
Potassium hydroxide KOH 56.11 56.11

19
2.4.6. Geopolymer Properties. The mechanical and chemical properties of the
geopolymer could be affected by the following factors:
Curing temperature
Curing time
Type of alkaline
Concentration of alkaline
Fly ash to alkaline ratio
Water ratio
Alkali to silicate ratio
The curing time has a huge effect on the compressive strength according to several
studies. Many studies indicate that as the concentration of alkaline increases, the
compressive strength increases. However, at some point when the concentration reaches
some level, it does not have a significant effect on the compressive strength.
2.4.7. Geopolymer Evaluation Methods. To ensure that geopolymer can be used
as an alternative to Portland cement, some experiments need to be completed. These
experiments aim to test the following properties of the geopolymer:
Rheological property of cement slurry
Cement slurry density
Compressive strength
Thickening time of cement slurry
Cement slurry filter loss
Permeability of the cement
Bond strength and bulk shrinkage

20
2.4.7.1. Rheological property of cement slurry. Investigating the rheological
behavior of geopolymer slurry is important to understand geopolymer performance. These
properties help the people who work in the field to predict the behavior of the slurry in
wellbore conditions. Due to some factors, the slurry rheological behavior is difficult to
achieve. Rheology could be defined as the flow and deformation of materials as a result of
some stress or force applied on that material.
The most common method to measure the viscosity is using a device that has a
spinning wheel that rotates in the sample, as shown in Figure 2.10. By applying a certain
amount of force and measuring the resulting forces, the fluids’ rheological properties can
be determined.
Figure 2.10. Mechanism to measure the fluid rheology

21
Newtonian fluids:
In general, Newtonian fluids are fluids that have a constant relationship between
shear stress and shear rate. Figure 2.11 shows the relationship between the shear stress and
shear rate for the Newtonian fluid. The viscosity of the non-Newtonian fluids is constant
and does not change with the shear rate change.
Figure 2.11. Newtonian fluid behavior
Non-Newtonian fluids:
In general, non-Newtonian fluids are fluids that have a non-constant relationship
between shear stress and shear rate. Figure 2.12 shows all types for the fluid flow behavior.
The viscosity of the non-Newtonian fluids varies with the change in shear rate. Non-
Newtonian fluids can be classified based on the fluid's viscosity changes into three types:
Pseudo-plastic fluids:
The viscosity of this fluid decreases as the shear rate increases; this is called shear
thinning (e.g., emulsions).

22
Dilatant fluids:
The viscosity of this fluid increases as the shear rate increases (e.g., clay slurries).
Bingham fluids:
To induce this fluid to flow, some force should be applied; this is referred to as
yield stress because these fluids act as a solid in static conditions.
Figure 2.12. Fluid behavior
Viscosity:
Viscosity is defined as the internal resistance of a fluid to flow. Plastic viscosity
can be defined as fluid resistance to flow due to surface conditions that involve mechanical
friction. Figure 2.13 shows an OFITE "rotational" viscometer. Plastic viscosity depends on
several factors such as the number and size of particles in the cement slurry, and their
distribution. To measure the rheology properties, the rotational viscometer is used.

23
Figure 2.13. OFITE "rotational" viscometer
Test procedure:
1. Place the cement sample into the sample cup and place it on the base. Use the
manual rotation sleeve to set it at 600 rpm and take the first reading.
2. Set the rotation sleeve at 300 rpm to take the second reading. The second reading
at 300 rpm is the apparent viscosity. The difference between the two readings is the
plastic viscosity. The difference between the plastic viscosity and the reading at
300 rpm is the yield point.
3. Set the sleeve at 600 rpm and then leave the sample for 10 seconds. Then, set the
sleeve at 3 rpm and take the maximum result that appears. This reading is the 10
second gel strength.
4. Repeat step 3 but increase the setting time to 10 minutes to read the 10-minute gel
strength.

24
2.4.7.2. Density of cement slurry. The density is defined as the mass per unit
volume. Since the density controls the strength of the material, it affects the flow ability.
The density of cement slurry should be higher than the drilling fluid density in the well
because if the density of the cement slurry is lower than the drilling mud density, the
cement will go through the drilling mud and the cementing operations will fail.
Nevertheless, the density of cement should not be very high or it will break the formation
and cause a kick. Furthermore, if cement slurry density is too high, it will be hard to pump
it to the downhole and it will need a stronger pump.
Density calculation:
The material density is equal to the material mass divided by the volume of this material
as is shown in the following equation:
𝜌 =𝑚
𝑣
where 𝜌 is the material density, lb/gal; m is the material mass, lb; and 𝑣 is the volume, gal.
Lab measurement of the density:
Fluid density scale balance is used to estimate the cement density in the lab. Figure
2.14 shows the structure of the fluid density balance, and Figure 2.15 shows the fluid
density balance device.
Test Procedure:
1- Set the base on the flat surface.
2- Use fresh water as a reference to make sure that your reading is accurate.
3- Fill the cup with fresh water and put the lid on. Make sure that some water goes
out of the hole in the lid to verify that all the trapped air has been released. Move

25
the rider until it becomes balanced by checking the bubble. (The fresh water
should give a result of 8.33 lb/gal or 62.4 lb/cft at 70 ˚F).
4- Dry the cup and fill it with the cement that needs to be tested. Put the lid on and
make sure that some cement goes out of the hole in the lid to verify that all the
trapped air has been released.
5- Wash and clean the cement from the outside of the cup and wipe the outside.
6- Set the base on the flat surface and move the rider until the bubble stays in the
center which makes the device balanced. Read the density toward the knife edge
and then add the correction factor if the device needs further calibration.
Figure 2.14. Fluid density balance
Figure 2.15. Fluid density balance device

26
2.4.7.3. Strength. There are three types of strengths as shown in Figure 2.16:
Compressive strength
Tensile strength
Shear strength
Compressive strength is the ability of material to resist the forces that are applied
on it. These forces could affect the volume of the material, which will make it smaller due
to the compression force. However, tensile strength is the opposite of the compressive
strength. Tensile strength is the ability of the material to withstand the opposite pulled
forces applied on two sides of the material and each force tries to pull the material to it.
This could impact the shape of the material by increasing the length.
Figure 2.16. Types of strengths
The most important feature in the cement is the compressive strength. Compressive
strength is the ability of the cement to withstand the pressure in downhole conditions.
Compressive Tensile Shear

27
The measurement of compressive strength:
To measure the compressive strength, a triaxial compressive strength test has to be
done using a device that applies the required force on the sample to calculate the
compressive strength. Figure 2.17 shows the hydraulic pressure unit. The main concept of
the compressive strength test is to estimate the maximum load that the sample can handle.
The test can be done by placing the sample on its location and applying the load from
above. The loading piston forces the sample down until the sample breaks. The pressure
that the sample breaks at is called the compressive strength, which is the maximum pressure
or load that the sample can withstand.
Figure 2.17. Hydraulic press unit
28
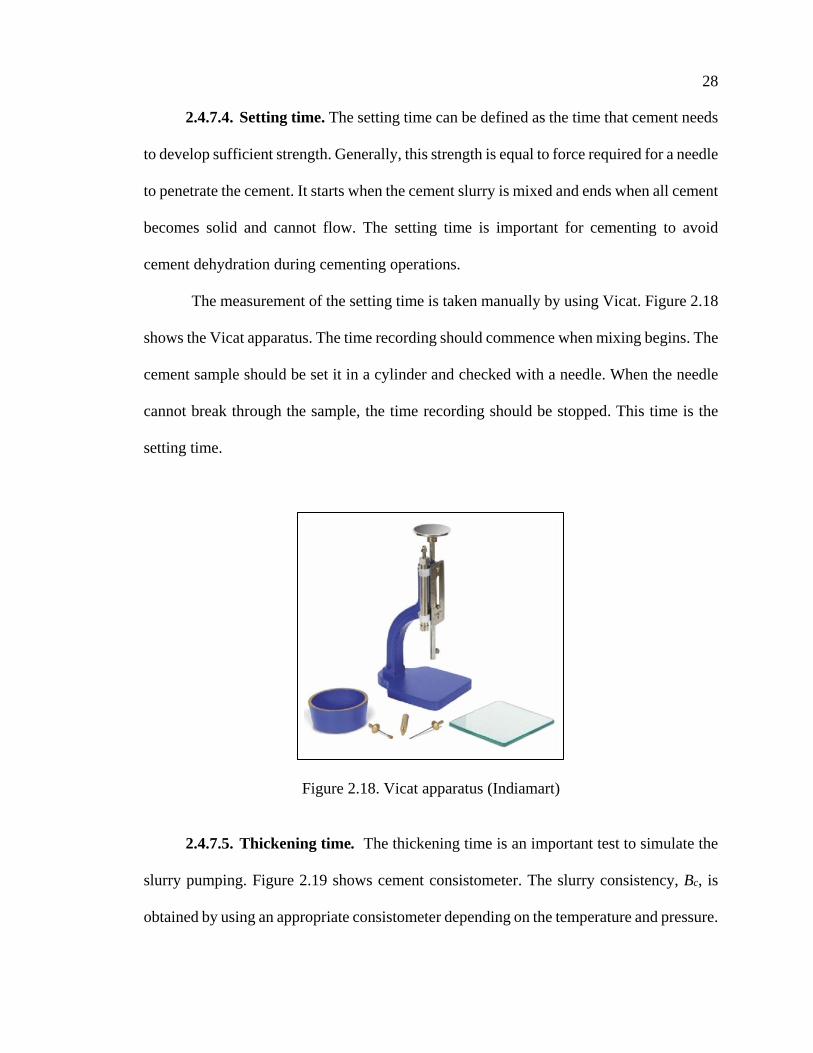
2.4.7.4. Setting time. The setting time can be defined as the time that cement needs
to develop sufficient strength. Generally, this strength is equal to force required for a needle
to penetrate the cement. It starts when the cement slurry is mixed and ends when all cement
becomes solid and cannot flow. The setting time is important for cementing to avoid
cement dehydration during cementing operations.
The measurement of the setting time is taken manually by using Vicat. Figure 2.18
shows the Vicat apparatus. The time recording should commence when mixing begins. The
cement sample should be set it in a cylinder and checked with a needle. When the needle
cannot break through the sample, the time recording should be stopped. This time is the
setting time.
Figure 2.18. Vicat apparatus (Indiamart)
2.4.7.5. Thickening time. The thickening time is an important test to simulate the
slurry pumping. Figure 2.19 shows cement consistometer. The slurry consistency, Bc, is
obtained by using an appropriate consistometer depending on the temperature and pressure.

29
The consistometer consists of a chamber that withstands high conditions such as high
pressure and high temperature. Inside this chamber, a rotating cylindrical slurry container
is equipped with a stationery paddle assembly. The speed rate of the cylindrical slurry
chamber is 150 rpm (Applied Drilling Engineering, 1991). The slurry consistency is
defined in terms of the torque, T, that is exerted on the paddle by the cement slurry:
𝐵𝑐 =𝑇 − 78.2
20.02
where Bc is the slurry consistency in API units and T is the torque in gm-cm. The thickening
time is the time required to reach the upper limit of pumpability, which is 100 Bc.
Figure 2.19. Cement consistometer (Cement Test Equipment)
2.4.7.6. Cement slurry filter loss. The filter loss is when the cement slurry loses
the content of free water. The fluid loss occurs when the water goes from the cement slurry
into the formation through the formation permeability paths in the wellbore and all the
solids and sediments remain at the formation wall. The water loss is a big problem in all
cementing processes because as the water content decreases, all cement properties will

30
change. Furthermore, the decrease in the water content will lead to a reduction in the setting
time and cement flowability. This loss of water will also cause a reduction in cement
pumpability. When cement loses water, its properties change and the possibility increases
of having channels and cracks within the cement formation.
Measure the filter loss:
API filter pressure devices are used to measure the filter loss. Figure 2.20 shows the filter
pressure apparatus.
1- Make sure that you have the filter paper, then install the cup and fill it with cement
slurry. Cover the cup with the top cap and place the cup at its location.
2- Use the T screw to make sure that the cup is closed securely.
3- Set a graduated tube under the cup to measure the filter loss.
4- Plug the pressure pump into the pressure inlet but keep the valve closed.
5- Set the pressure at 100 psi and open the valve.
6- Record the filtrate volume for 1, 2, 3, 5, 7.5, 15, and 30 minutes.
Figure 2.20. Filter pressure apparatus

31
2.4.7.7. Permeability. The permeability is another important property for the
material that is used for cementing in oil and gas wells in order to obtain fully zonal
isolations. As was mentioned before, the main objective of cementing is to prevent fluid
migrations between the well and the formation. The material that is used should be
impermeable to provide full isolation and avoid any contact between the well and the
formation.
2.4.7.8. Bond strength. Bond strength is the ability of the material to interconnect
with other materials. In other words, bond strength is defined as the strength that keeps two
different materials connected to each other. Furthermore, it is a property of the material
that indicates whether it can stick with another type of material or not. The cement should
have a high bond strength in order to give a full isolation. As the bond strength increases,
the cement will give better performance. If the cement fails to give a very good bond
strength measurement, it could fail cementing operations because the cement will break
from the casing or the formations, which will cause paths between them. These paths will
leak fluids from the formation to the wellbore or to other formation and will not keep the
well isolated.
Measurement of bond strength:
In order to measure the bond strength, a sample (as is shown in Figure 2.21) has to
be prepared. This sample is filled with cement and there is a steel pipe inside it. Tensile
strength is used to pull the pipe steel from the cement sample. The force where the steel
pipe is broken apart from the cement is used to calculate the bond strength of the tested
sample.

32
Figure 2.21. Sample design for the bond strength test
2.4.7.9. Bulk shrinkage. The decreasing volume of the cement due to the forces
applied to it is known as bulk shrinkage. In other words, bulk shrinkage can be defined as
the decreasing in the external volume. The length change shrinkage and expansion are
shown in Figure 2.22.
Figure 2.22. Length change shrinkage (length change)
33
2.5. DRILLING FLUIDS
Drilling fluid, also called drilling mud, is a fluid that is used during drilling
operations.
2.5.1. Drilling Fluid Functions. Drilling fluids have many functions during
drilling operations. The main functions of the drilling fluids include
1. To carry the cutting that formed while drilling the well to the surface.
2. To lubricate the drilling bit and drill string.
3. To cool down the temperature of the drilling bit as the friction between the bit and
the formation heat up the bit.
4. To apply hydrostatic pressure to prevent the formation fluids from entering the
wellbore.
5. To maintain wellbore stability.
2.5.2. Drilling Fluid Types. Selection of the drilling fluid is based on many
factors, including formation properties and the cost. Drilling fluids are classified into
different types (ASME Shale Shaker Committee, 2005):
Water based mud (WBM):
Water based mud is most common drilling fluid and mainly used due to its low
cost. However, there are some limitations of using it including shale swelling. Since water
based mud is mainly composed of water, it is considered environmentally friendly (Amani,
et al., 2012).
Oil based mud (OBM):
Oil based mud is mainly used in shale formations. OBM is a good choice in high-
pressure and high-temperature conditions (Amani, et al., 2012).

34
Synthetic based mud (SBM):
Synthetic based mud is considered more expensive than the other drilling fluids.
SBM is considered a nontoxic material, unlike OBM which contains aromatics (Hart, et
al., 2007). In the Gulf of Mexico, SBM drilling fluids have been commonly used in recent
years (Neff, et al., 2000; Hart, et al., 2007).

35
3. LITERATURE REVIEW
3.1. GEOPOLYMER FORMALATION OPTIMIZATION
There are few studies have been published about using geopolymer in oil and gas
wells. In these papers, the effects of changing of the chemical ratios on geopolymer
properties were studied. These properties include:
Rheology measurement
Density measurement
Compressive strength test
Bond strength test
Bulk shrinkage test
Thickening time test
Durability test
Acid resistance
3.1.1. Rheology Behavior. The rheology has been studied due to the importance
of understanding the behavior of the slurry. By studying these properties, better prediction
of the behavior of the cement slurry in the wellbore condition can be achieved. Due to some
factors, the slurry rheological behavior is difficult to obtain. Rheology could be defined as
the flow and deformations of materials as a result of some stress or forces that are applied
on that material.
In 2015, study has been done by Suppiah, et al., (2016). In this study, they
investigated the effects of sodium hydroxide concentration and different ratios of silicate
to hydroxide on the rheology of geopolymer. They produced different geopolymer slurries

36
by mixing different ratios of class F fly ash with different ratios of sodium silicate to
sodium hydroxide.
Figure 3.1 shows the effects of different ratios of fly ash to alkaline activator on
viscosity of geopolymer cement slurry for different concentration of sodium hydroxide. As
the concentration of sodium hydroxide increases, the viscosity of geopolymer increases.
The increasing of viscosity leads to poor pumpability. Also, increasing in fly ash to alkaline
activator ratio leads to increase in geopolymer viscosity.
Figure 3.1. Effect of different ratios of fly ash to alkaline activator on viscosity of
geopolymer cement slurry for different concentration of sodium hydroxide (Suppiah, et
al., 2016)
3.1.2. Density Measurement Test. The density of the cement has big impacts
on the formation. It affects the flowability and the pumpability. The cement density should
be higher than that of the drilling fluid but should not reach the formation breakdown.
Because if the density of cement is lower than that of the drilling fluid, it will fall down
and the plugging will not be reached. And if the density of cement is too high and reaches

37
the formation breakdown, it will cause a break and paths in the formation which will result
in cement failure.
In 2016, the density of the geopolymer has been studied by Suppiah, et al., (2016)
to investigate the effects sodium hydroxide concentration and different ratio of silicate to
hydroxide. They produced different geopolymer slurries by mixing different ratio of class
F fly ash with different ratios of sodium silicate to sodium hydroxide. As is shown in Figure
3.2, the highest density, which is 15.2 lb/gal, is in the cement slurry that was made with 14
Molar of sodium hydroxide and highest fly ash to alkaline ratio. In general, the results
showed that the density of the geopolymer increases as the amount of fly ash to alkaline
ratio increases.
Figure 3.2. Effect of different ratios of fly ash to alkaline activator on density of
geopolymer cement slurry for different concentration of sodium hydroxide (Suppiah, et
al., 2016)

38
3.1.3. Compressive Strength. Compressive strength is the ability of the material
to withstand the pressure or forces applied on it. Because of the downhole conditions (high
pressure and high temperature), the compressive strength is significantly important.
Several studies have been done to evaluate the compressive strength for
geopolymer. In 2012, Abdullah, et al., (2012). They studied the effect of the alkaline
activator to fly ash ratios on the compressive strength. Three samples with three different
alkaline activator to fly ash ratios were prepared. They found that as the alkaline activator
to fly ash ratio increased, the compressive strength increased. Figure 3.3, shows that when
the ratio increased from 0.3 to 0.35, the compressive strength increased rapidly from 3.695
MPa to 8.325 MPa. When the ratio increased from 0.35 to 0.4, the compressive strength
increased as well, however, the increase was not very significant.
Figure 3.3. The effect of alkaline activator to fly ash ratio on the compressive strength
(Abdullah, et al., 2012)
Nasvi et al., (2012) used geopolymer and class G cement to compare their
mechanical behavior at different temperatures. Figure 3.4 shows the variation of uni-axial

39
compressive strength (UCS) of geopolymer and class G cement using different curing
temperature. They came up with a conclusion that the range of temperature 50 – 60 oC is
the optimum curing temperature for high strength of geopolymer and class G cement.
Figure 3.4. Compressive strength results of geopolymer and class G cement at different
curing temperature (Nasvi et al., 2012)
Sugumaran, M. (2015) investigated the impacts of low calcium fly ash on
geopolymer cement. He tested the water ratio, type and molarity of alkaline activator and
alkaline activator ratio. He found that the ratio of water 0.3 in 12 M of sodium hydroxide,
and 0.4 for alkaline activator ratio increased the compressive strength by 31%. Four
experiments were conducted to find out the appropriate composition of fly ash. Figure 3.5
shows the temperature effect on compressive strength. As we can see, after 21 days,
although the compressive strength at 100 ̊ C after 12 days was higher than 60 ̊ C, the sample
was cracked. He found that the water ratio of 40 gm gives a higher compressive strength
compared to 60 gm and 80 gm as is shown in Figure 3.6. Figure 3.7 shows the result of the

40
effect of sodium hydroxide molarity. The 12 M showed a higher compressive strength
compared to the 10 M and 15 M.
Figure 3.5. Effect of temperatures on compressive strength (Sugumaran, 2015)
Figure 3.6. Effect of water to fly ash ratio on compressive strength at different curing
days (Sugumaran, M. 2015)

41
Figure 3.7. Effect of sodium hydroxide molarity on compressive strength at different
curing days (Sugumaran, M. 2015)
Salehi et al. (2016) investigated the effects of sodium hydroxide concentration on
the geopolymer properties. They did four experiments in order to develop the compressive
strength, thickening time, durability and shear bond strength. They used the class F fly ash
geopolymer with different design and class H Portland cement. Table 3.1 shows the
elements ratios of fly ash geopolymer.
Table 3.1. Elemental ratios of fly ash geopolymer (Salehi et al., 2016)
Oxide Ratio
SiO2/Al2O3 1.7 - 9.2
Al2O3/CaO 1.2 - 5.4
Fe2O3/ SiO2 0.1 – 0.9
Three samples were prepared with different sodium hydroxide concentration, 8 M,
10 M, and 12 M solutions. As is shown in Figure 3.8, as the concentration increased, the
compressive strength increased until the concentration reached 10 M. Above the

42
concentration of 10 M no significant change happened (Salehi et al., 2016). Both Salehi
and Sugumaran results were close to each other since both of them reported that 12 M of
sodium hydroxide gives a high compressive strength.
Figure 3.8. Effect of molarity of sodium hydroxide on geopolymer compressive strength
(Salehi et al., 2016)
Salehi et al. (2016) also prepared another three samples to see the effect of curing
time on compressive strength. Figure 3.9 shows the result of curing time effect. As time
increased the compressive strength increased. Also, high improvement in strength for the
first 14 days is shown. Moreover, they prepared 2 mixtures of geopolymer and Portland
cement to examine the temperature impacts. Figure 3.10 shows compressive strength
comparison at different curing temperatures. Their result showed that as temperature
increased the compressive strength for the geopolymers increased. However, the
compressive strength for the Portland cement decreased as temperature increased.

43
Figure 3.9. Compressive strength comparison at different curing times (Salehi et al.,
2016)
Figure 3.10. Compressive strength at different temperatures (Salehi et al., 2016)
Furthermore, another study has been done by Salehi (2016) to compare the
compressive strength of fly ash geopolymer with class H Portland cement at different
curing time. Their results showed that the compressive strength increased with curing time.
As we can see in Figure 3.11, the compressive strength of fly ash reaches about 3,500 psi

44
after 7 days, which is close to the compressive strength of Portland cement after 14 days.
Also, this Figure shows that the compressive strength of fly ash has high improvement after
7 days.
Figure 3.11 Results of compressive strength (Salehi et al., 2016)
Suppiah, et al., (2016) studied the compressive strength of geopolymer cement to
investigate the sodium hydroxide concentration and different ratios of silicate to hydroxide.
They produced different geopolymer slurries by mixing different ratios of class F fly ash
with different ratios of sodium silicate to sodium hydroxide. Table 3.2 shows the different
mixtures that they used.
Table 3.2. Details of mix proportions (Suppiah, et al., 2016)
Mix Ratio Fly Ash /
Alkaline Activator
Sodium Silicate /
Sodium Hydroxide
Concentrations of
Sodium Hydroxide
Mix 1 60:30 0.25, 0.5, 1, 2.5 8 M, 10 M, 12 M, 14 M
Mix 2 45:45 0.25, 0.5, 1, 2.5 8 M, 10 M, 12 M, 14 M
Mix 3 30:60 0.25, 0.5, 1, 2.5 8 M, 10 M, 12 M, 14 M

45
Figure 3.12 shows the effect of the concentration of sodium hydroxide on the
compressive strength. As we can see in Figure 3.12, as the concentration of sodium
hydroxide increased, the compressive strength increased until a specific point. When the
sodium hydroxide concentration reaches 14 molarity, the compressive strength decreased
due to the rate of polymerization being low at high concentrations of sodium hydroxide
solution (Suppiah, et al., 2016). Suppiah, et al., (2016) results is similar to Salehi et al.
(2016) and Sugumaran, (2015) results, where all of them agreed that the highest
compressive strength comes from the concentration of 12 M sodium hydroxide.
Figure 3.12. Effect of NaOH concentration on compressive strength (Suppiah, et al.,
2016)
Liu et al. (2017) compared some properties including compressive strength
between geopolymers, geopolymer hybrid and Portland cement. They used alkaline
solution, which was 8 M sodium hydroxide, to activate the alumini-silicate precursor. Class
F fly ash was used in all experiment. Table 3.3 shows the fly ash composition. The
geopolymer slurries were mixed by using a spatula and then a paddle stirrer at 480 rpm for
30 seconds.

46
Table 3.3. Composition of fly ash (Liu et al., 2017)
Component Weight %
SiO2 49.9
Al2O3 25.3
Fe2O3 15.1
(SiO2 + Al2O3 + Fe2O3) (90.3)
CaO 3.0
MgO 0.91
Alkalis (Na2O + 0.658 K2O) 0.73
SO3 0.44
Liu et al. (2017) investigated geopolymer slurries and geopolymer hybrid, which
consists of 80% of geopolymer and 20% of SBM, which is commonly used in Gulf of
Mexico. On other hand, the Portland slurries were composed of class H Portland cement
and water using 38.5% “by weight of cement”. They used a water bath at 170 ˚F for 7 days
to prepare the samples, which were 2 inches length and with a dimeter of 1 inch (Liu et al.,
2017). As can be seen in Table 3.4, the as confining pressure increases, the confined
compressive strength increases. Even though the compressive strength for geopolymer
hybrid is about 2,870 psi at 500 psi confining stress, it is enough for most types of
cementation operations.
Table 3.4. Compressive strength results at 7 days (Liu et al., 2017)
Pc = 100 Psi Pc = 500 Psi
Geopolymer 3,330 Psi 5,000 Psi
Geopolymer Hybrid 2,000 Psi 2,870 Psi
Portland Cement 5,600 Psi 7,850 Psi
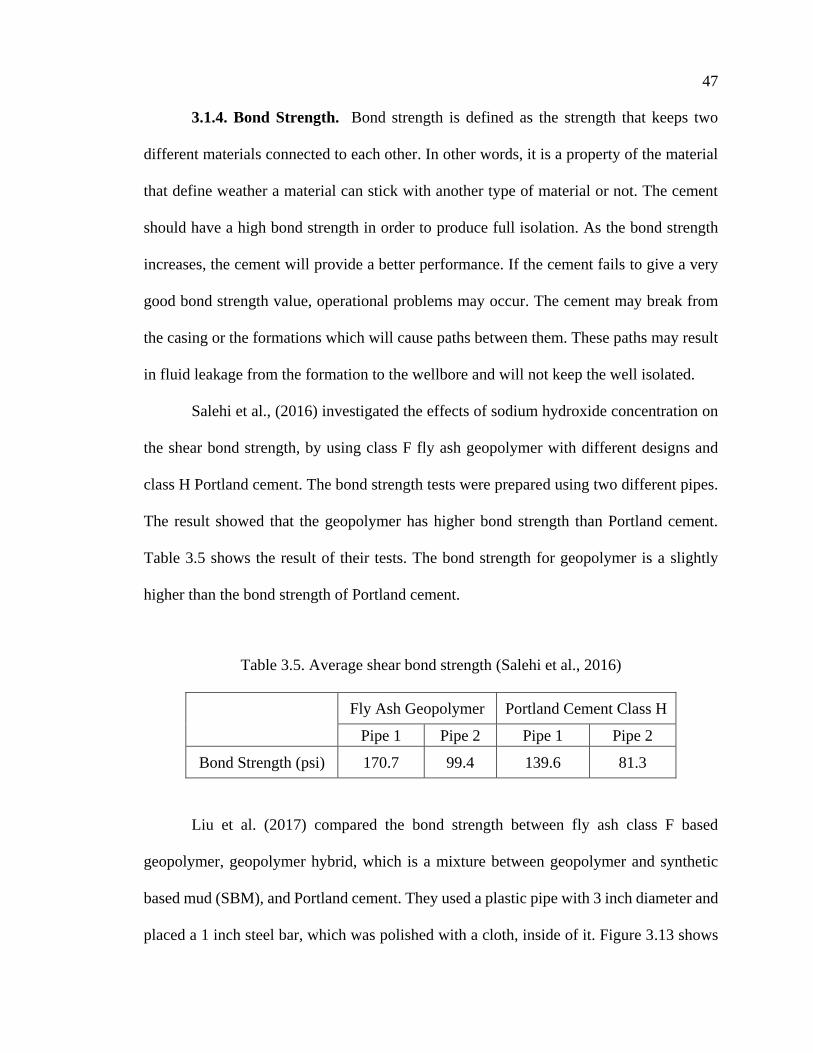
47
3.1.4. Bond Strength. Bond strength is defined as the strength that keeps two
different materials connected to each other. In other words, it is a property of the material
that define weather a material can stick with another type of material or not. The cement
should have a high bond strength in order to produce full isolation. As the bond strength
increases, the cement will provide a better performance. If the cement fails to give a very
good bond strength value, operational problems may occur. The cement may break from
the casing or the formations which will cause paths between them. These paths may result
in fluid leakage from the formation to the wellbore and will not keep the well isolated.
Salehi et al., (2016) investigated the effects of sodium hydroxide concentration on
the shear bond strength, by using class F fly ash geopolymer with different designs and
class H Portland cement. The bond strength tests were prepared using two different pipes.
The result showed that the geopolymer has higher bond strength than Portland cement.
Table 3.5 shows the result of their tests. The bond strength for geopolymer is a slightly
higher than the bond strength of Portland cement.
Table 3.5. Average shear bond strength (Salehi et al., 2016)
Fly Ash Geopolymer Portland Cement Class H
Pipe 1 Pipe 2 Pipe 1 Pipe 2
Bond Strength (psi) 170.7 99.4 139.6 81.3
Liu et al. (2017) compared the bond strength between fly ash class F based
geopolymer, geopolymer hybrid, which is a mixture between geopolymer and synthetic
based mud (SBM), and Portland cement. They used a plastic pipe with 3 inch diameter and
placed a 1 inch steel bar, which was polished with a cloth, inside of it. Figure 3.13 shows

48
their experimental setup. The sample was left at 170 ˚F for 7 days after they poured the
cement in the plastic pipe. Following that, they removed the bottom cover placed the
sample on a hollow base, and pushed the steel bar out. Figure 3.14 shows the cement to
pipe shear bond strength of Portland cement and geopolymer with clean steel pipe at 170
F on day-7. The results showed that geopolymer had a higher bond strength than Portland
cement for both clean steel and steel covered with SBM.
Figure 3.13. Bond strength setup (Liu et al., 2017)
Figure 3.14. Cement to pipe shear bond strength at 170 ˚F on day 7 (Liu et al., 2017)
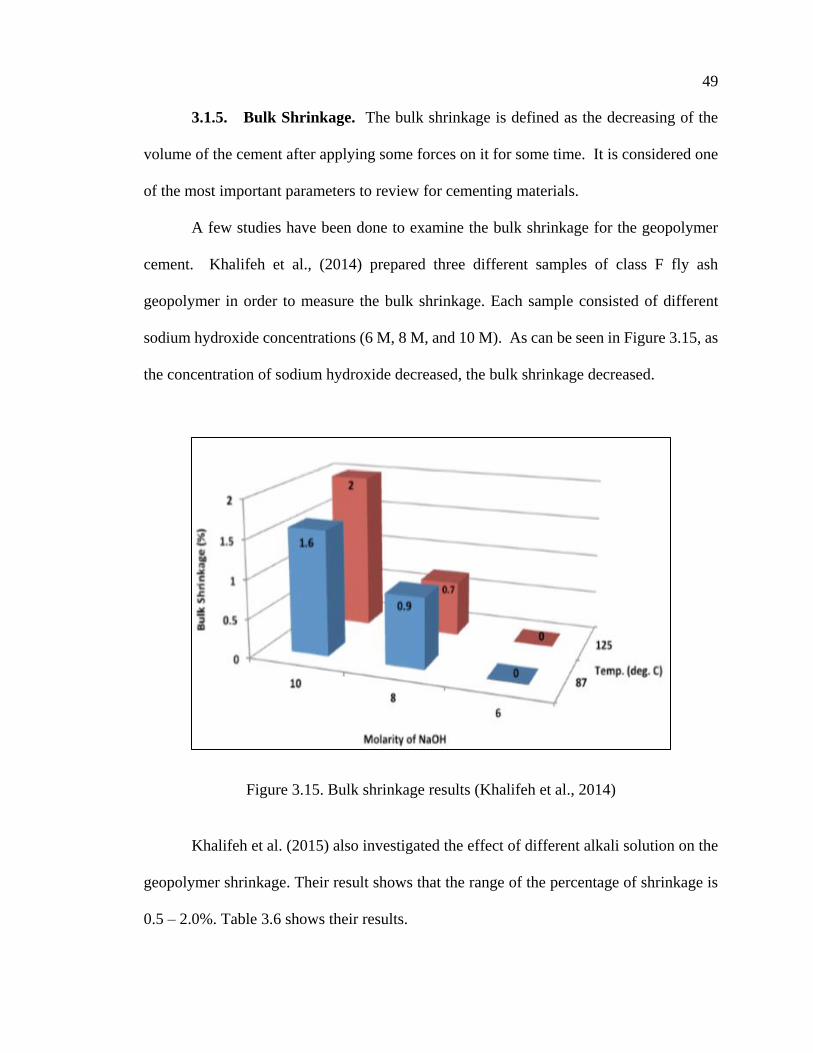
49
3.1.5. Bulk Shrinkage. The bulk shrinkage is defined as the decreasing of the
volume of the cement after applying some forces on it for some time. It is considered one
of the most important parameters to review for cementing materials.
A few studies have been done to examine the bulk shrinkage for the geopolymer
cement. Khalifeh et al., (2014) prepared three different samples of class F fly ash
geopolymer in order to measure the bulk shrinkage. Each sample consisted of different
sodium hydroxide concentrations (6 M, 8 M, and 10 M). As can be seen in Figure 3.15, as
the concentration of sodium hydroxide decreased, the bulk shrinkage decreased.
Figure 3.15. Bulk shrinkage results (Khalifeh et al., 2014)
Khalifeh et al. (2015) also investigated the effect of different alkali solution on the
geopolymer shrinkage. Their result shows that the range of the percentage of shrinkage is
0.5 – 2.0%. Table 3.6 shows their results.
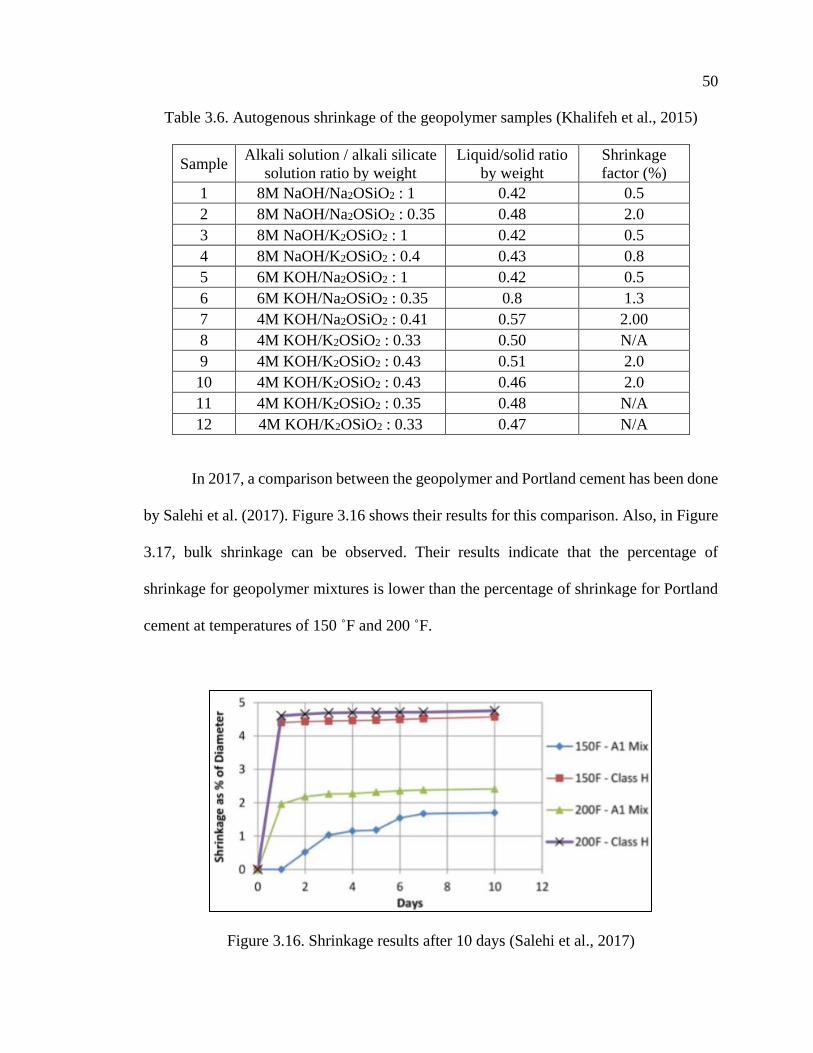
50
Table 3.6. Autogenous shrinkage of the geopolymer samples (Khalifeh et al., 2015)
Sample Alkali solution / alkali silicate
solution ratio by weight
Liquid/solid ratio
by weight
Shrinkage
factor (%)
1 8M NaOH/Na2OSiO2 : 1 0.42 0.5
2 8M NaOH/Na2OSiO2 : 0.35 0.48 2.0
3 8M NaOH/K2OSiO2 : 1 0.42 0.5
4 8M NaOH/K2OSiO2 : 0.4 0.43 0.8
5 6M KOH/Na2OSiO2 : 1 0.42 0.5
6 6M KOH/Na2OSiO2 : 0.35 0.8 1.3
7 4M KOH/Na2OSiO2 : 0.41 0.57 2.00
8 4M KOH/K2OSiO2 : 0.33 0.50 N/A
9 4M KOH/K2OSiO2 : 0.43 0.51 2.0
10 4M KOH/K2OSiO2 : 0.43 0.46 2.0
11 4M KOH/K2OSiO2 : 0.35 0.48 N/A
12 4M KOH/K2OSiO2 : 0.33 0.47 N/A
In 2017, a comparison between the geopolymer and Portland cement has been done
by Salehi et al. (2017). Figure 3.16 shows their results for this comparison. Also, in Figure
3.17, bulk shrinkage can be observed. Their results indicate that the percentage of
shrinkage for geopolymer mixtures is lower than the percentage of shrinkage for Portland
cement at temperatures of 150 ˚F and 200 ˚F.
Figure 3.16. Shrinkage results after 10 days (Salehi et al., 2017)

51
Figure 3.17. Shrinkage results of after 12 hours (Salehi et al., 2017)
3.1.6. Thickening Time Tests. The thickening time is an important test to
simulate the slurry pumping. The slurry consistency Bc is obtained by using an appropriate
consistometer depending on the temperature and pressure. The thickening time is the time
required to reach the upper limit of pumpability which is, 100 Bc.
Researchers have recently begun studying the geopolymer cement properties in
order to use it in plug and abandonment operations. There are only a few studies done in
this area. Salehi et al., (2016) used different mixtures by changing the curing conditions
and also, changing alkali content, silica content, water to binder ratio, and alkali to fly ash
ratio. Their result showed that the temperature had a strong effect on thickening time of fly
ash based geopolymer mixtures as is shown in Figure 3.18. By added an in-house newly
developed mix of retarders and superplasticizers, the thickening time was more than 4
hours for all mixtures.

52
Figure 3.18. Thickening time results at different temperatures (Salehi et al., 2016)
3.1.7. Durability Test. A few studies has been done to test the durability of
geopolymer to see how it can resist chemical attacks, Salehi et al., (2016). Results showed
that the percentage of loss of geopolymer was less than 7%. In comparison, it became 9.1%
in Portland cement. In general, their tests showed that the geopolymer had better durability,
in presence of chemical attacks, than class H Portland cement.
3.1.8. Acid Resistance. Uehar, M. (2010) found that the geopolymer has better
acid resistance properties than OPC. After four months of exposure to acid, The OPC
collapsed, however, the geopolymer was not affected.
3.2. DRILLING FLUIDS CONTAMINATION OF GEOPOLYMER
All the work previously explained was performed on geopolymer alone. In the
section, geopolymer contamination with drilling fluid will be discussed. There are few
studies have been published about drilling fluids contaminations with geopolymer in oil

53
and gas wells. In these papers, they investigated the effects of drilling fluids on geopolymer
rheological and mechanical properties.
When Portland cement is contaminated by syhntatic base mud (SBM) the integrity
of cement is impacted significantly (Aughenbaugh, et al., 2014). Aughenbaugh, et al.,
(2014) investigated the impact of SBM on the integrity of Portland cement. They used three
different types of Portland cement including two types of class H Portland cement and API
class C Portland cement. Two different methods were used to measure the compressive
strength using different ratios of contamination including 5, 10, and 15 volume percent at
170 ˚F and 3000 psi including:
Cured at curing chamber and crushed after 48 hours
Cured in ultrasonic cement analyzer for 48 hours.
Figure 3.19 shows the compressive strength results of Aughenbaugh, et al. (2014)
for different types of cements with different ratios of SBM contamination. Increasing the
SBM weight percent resulted in decreasing in compressive strength.
Figure 3.19. Compressive strength results of different type of cement with different ratios
of SBM contamination (Aughenbaugh, et al., 2014)

54
Liu, et al. (2016) used three different types of fly ash class F based geopolymer to
study the effect of SBM on these material. They use 2”× 2” cubes cured at high
temperature, 170 ˚F, and high pressure, 3000 psi. Figure 3.20 shows the compressive
strength results of Liu, et al. (2016) for geopolymer and Portland cement with different
SBM ratios. The geopolymer strength decreased as the SBM increased. However, a
significant decrease was observed in Portland cement strength when contaminated with
SBM. After 30 volume percent of SBM was added to Portland cement, the compressive
strength was not measurable. Also, SBM impacted the Portland cement viscosity; the
viscosity increased as SBM ratios increased.
Figure 3.20. Compressive strength results for geopolymer and Portland cement with
different SBM ratios (Liu, et al., 2016)
Figure 3.21 shows the rheological properties results of Liu, et al. (2016) of Portland
cement and geopolymer with different SBM ratios. SBM had a negative effect on Portland
cement rheological behavior however, SBM improved the geopolymer rheological
behavior. Figure 3.22 shows the thickening time results of Liu, et al. (2016) of geopolymer
with different SBM ratios at 125 ˚F. As the SBM volume percent increased the thickening
time increased.

55
Figure 3.21. Rheological properties results of Portland cement and geopolymer with
different SBM ratios (Liu, et al., 2016)
Figure 3.22. Thickening time results of geopolymer with different SBM ratios at 125 ˚F
(Liu, et al., 2016)
Liu, et al. (2017) investigated the effect of SMB on geopolymer hybrid using
different types of fly ash class F with different types of activations. Figure 3.23 shows the
effect of pressure on thickening time. Increasing the pressure resulted in decreasing in
geopolymer hybrid pumping time (Liu, et al., 2017). They found that SBM had negative
effects on geopolymer strength; as SBM volume percent increased, the geopolymer
strength decreased.

56
Figure 3.23. The effect of pressure on thickening time (Liu, et al., 2017)
Salehi, et al. (2018) investigated the effect of oil based mud (OBM) on the
geopolymer and Portland cement strengths. Different ratios of OBM were used including
0%, 5%, and 10% by mass. Figure 3.24 shows the compressive strength results of Salehi,
et al. (2018) of geopolymer and Portland cement with different OBM ratios. They found
that OBM had a significant impact on Portland cement, however it had a slight impact on
geopolymer strength. The reduction on Portland cement strength was 35% compared to
geopolymer which only lost 5% of its strength when 5 % by mass of OBM was introduced.
Figure 3.24. Compressive strength results of geopolymer and Portland cement with
different OBM ratios (Salehi, et al., 2018)

57
PAPER
I. NEW FORMULATION OF FLY ASH CLASS C BASED GEOPOLYMER FOR
OIL WELL CEMENTING
ABSTRACT
One of the most important steps in the drilling and completion operation is oil well
cementing to provide wellbore integrity. Currently, Portland cement is mainly used in the
oil industry, however it has many drawbacks including operational and environmental
problems. Fly ash based geopolymer cement has recently gained more attention due to its
low cost and environmental friendliness. This research aims to obtain a new formulation
of class C fly ash based geopolymer cement to be used as an alternative to Portland cement
in oil and gas cementing. Twenty four different geopolymers were prepared, and compared
to decide which will be the optimum formulation to use. The alkaline activator to fly ash
ratios used include 0.2, 0.4, and 0.8, the sodium hydroxide to sodium silicate ratios include
0.25, 0.5, 1, and 2, for three different sodium hydroxide concentration thus having 5, 10,
and 15 molarity. The optimum formulation was chosen based on five different API
recommended tests, including rheology, density, compressive strength, fluid loss test and
stability tests which are sedimentation test and free fluid test. The optimum formulation
was then compared to Portland cement using all the tests mentioned. Based on our results,
increasing sodium hydroxide concentration resulted in an increase in compressive strength
and showed a slight decrease in the plastic viscosity. However, increasing in the alkaline
activator to fly ash ratios increased plastic viscosity, thus, the workability of the slurry was

58
reduced. Increasing in sodium silicate to sodium hydroxide ratio decreased the fluid loss
significantly. The optimum design of geopolymer, which had lower fluid loss, reasonable
compressive strength with an acceptable density and viscosity, was selected. Then the
optimum design was compared to Portland cement. Compressive strength of the optimum
design showed better results than neat Portland cement. Unlike neat Portland cement,
which needs fluid loss additives, the new formulation of geopolymer investigated in this
study showed fluid losses lower than 100 ml in 30 minutes when tested using a low
pressure, low temperature filtrate loss tester. The higher mechanical strength and durability
of geopolymer using fly-ash Class C compared to Portland cement is very promising for
achieving long-term wellbore integrity goals and meeting regulatory criteria for zonal
isolation. These results indicate that fly ash class C based geopolymer has the potential to
be an environmentally friendly alternative to Portland cement when cementing oil wells.
1. INTRODUCTION
One of the important processes during the drilling and completion of the wells is
primary cementing to provide full zonal isolation, which prevents the fluid migrations
between the formation and wells. The main goal of primary cementing is to provide full
zonal isolation. If zonal isolation is lost, it could result in severe operational difficulties
and huge environmental issues as well as high remedy costs. Although Portland cement
has been used for many years for cementing operations, many failures still occur. Failures
including radial cracks within the cement sheath, micro-annuli at the interfaces of the
cement, and channels through the cement matrix (Bois et al., 2012). Recently, a new cost

59
effective and environmentally friendly material has come to light that has properties similar
to Portland cement; this material is called geopolymer. Geopolymer was first researched
by Davidovitts, who began searching for a non-flammable, non-combustible construction
material after the fire in France in 1970. Geopolymer consists of fly ash that is activated
by sodium or potassium hydroxide (NaOH, KOH). The source of fly ash is power plants.
These power plants burn coal and produce an enormous amount of fly ash. Instead of
wasting this fly ash, it can be used to form geopolymer. The thermal reactions between fly
ash and the alkaline activator form the geopolymer. In other words, geopolymer can be
defined as the reaction between the fly ash and the alkaline activator, which could be
sodium hydroxide (NaOH) or potassium hydroxide (KOH) in the presence of an additional
source of silicate, other than the fly ash, which is sodium silicate (Na2SiO3) or potassium
silicate (K2O3Si). The result of this reaction is geopolymer. Geopolymer has many
advantages over Portland cement, including that geopolymer is cheaper and more
environmentally friendly. Since fly ash is a by-product of coal combustion, it is extremely
cheap to acquire. Regarding the environmental impacts, Portland cement has a huge
environmental effect due to its manufacturing process, which requires burning a huge
amount of fuel and decomposition of limestone, thus causing enormous volumes of carbon
dioxide (CO2) emissions (Kong and Sanjayan., 2008). In addition, geopolymer has another
advantage compared to Portland cement, such as higher compressive strength and less fluid
loss. Portland cement consists of calcium hydroxide and calcium silicate, while
geopolymer consists of alumino-silicate gel (Salehi et al., 2016).
In the last few years, researchers have studied geopolymer properties to be used as
an alternative to Portland cement. A few papers were published in this area showing good

60
results to consider geopolymer as a replacement to Portland cement. Reasonable
compressive strength geopolymers can be produced at different NaOH concentrations and
different curing conditions (Bakkali et al., 2016). The compressive strength of geopolymer
increases when higher concentrations of sodium hydroxide were used. The ratio of alkaline
activator to fly ash has impacts on the compressive strength. As the alkaline activator to
fly ash ratios increase, the compressive strength increases (Abdullah, et al., 2012). Nasvi
(2012) used geopolymer and Portland cement class G to compare the mechanical behavior
at different curing temperatures. An investigation of low calcium fly ash (class F) was done
by Sugumran (2015) to study the effects of water ratios and sodium hydroxide ratios.
Investigations have been done by Suppiah (2016) to examine the compressive strength of
geopolymer cement utilizing different sodium hydroxide concentrations and different
ratios of silicate to hydroxide. Their results showed that as sodium hydroxide
concentrations increase, compressive strength increases. Furthermore, another
investigation of using low calcium fly ash (ASTM class F) was performed by Salehi (2016),
who made a comparison between geopolymer and Portland cement; it showed that the
compressive strength of geopolymer has high improvement after seven days compared to
Portland cement. Moreover, the results showed that geopolymer has a higher bond strength
than Portland cement, similar to the results that were obtained by Liu in 2017. Besides
bonding strength, Liu has compared other properties, including, but not limited to,
compressive strength between geopolymers, geopolymer hybrid and Portland cement. In
terms of viscosity and density, viscosity of geopolymer is directly proportional to sodium
hydroxide concentrations. The viscosity increases with increasing sodium hydroxide
concentrations, and the density increases as the ratios of fly ash to alkaline activator

61
increase (Suppiah, et al., 2016). Furthermore, Salehi (2016) studied the effects of different
temperature on the thickening time. According to Uehar (2010), geopolymer has better acid
resistance than Portland cement. In addition, there are other properties that are used to
characterize geopolymer including thermal stability, low surface roughness, and durability
(Khalifeh, 2014). Most previous work was done on class F geopolymer, and most of it was
focused on plugging and abandonment operations.
This paper aims to investigate the performance of using new fly-ash Class C as an
alternative to Portland cement for oil well cement applications. Different ratios of alkaline
activator to fly ash (AA/FA), sodium silicate to sodium hydroxide (SS/SH), and sodium
hydroxide concentrations were used to choose the optimized design depending on the
rheology, density, compressive strength, and fluid loss. Other tests were done to the
optimized geopolymer to compare it with Portland cement.
2. EXPERIMENTAL DESCRIPTION
2.1. MATERIALS
2.1.1. Fly Ash. There are two types of fly ash: Class C and Class F. According to
the American Society for Testing and Materials (ASTM), the differences between these
two types is that Class C has a higher content of calcium oxide (CaO) than Class F, so fly
ash Class C is also known as high calcium fly ash, whereas fly ash Class F is known as a
low calcium fly ash.
Fly ash Class C was used in this study. X-ray fluorescence (XRF) was used to
determine the chemical compositions of the fly ash. The result of XRF showed that the

62
amount of silicon dioxide (SiO2), aluminum oxide (Al2O3), and iron oxide (Fe2O3) is higher
than 50%, which according to ASTM C 618 is fly ash Class C. Table 1 shows the
compositions of fly ash that were obtained from X-ray fluorescence (XRF).
Table 1. The compositions of fly ash
Element Concentration (%)
SiO2 28.93
Al2O3 14.82
Fe2O3 6.40
CaO 39.80
MgO 4.86
Na2O 1.10
K2O 0.56
Other 2.63
2.1.2. Sodium Hydroxide (NaOH). The purity of sodium hydroxide is 96%.
Different concentrations were prepared by weighing dry powder. This sodium hydroxide
powder was added to a certain amount of distilled water and hand stirred until it was fully
dissolved. Then, extra distilled water was added until the desired concentration was
reached. Sodium hydroxide solution was mixed with sodium silicate solutions for the
geopolymer preparations.
2.1.3. Sodium Silicate (Na2SiO3). Sodium silicate, also known as water glass,
was obtained from PQ Corporation. Sodium silicate is an important material to provide
another source of silicate (other than fly ash) to the mixture.
2.1.4. Portland Cement. American Petroleum Institute (API) Portland cement
class H, which was obtained from Haliburton, was used in this study. X-ray fluorescence
(XRF) was used to determine the chemical compositions of the Portland cement. Table 2
shows the compositions of Portland cement class H that were obtained from XRF.

63
Table 2. The compositions of Portland cement
Element Concentration (%)
SiO2 20.36
Al2O3 3.17
Fe2O3 6.19
CaO 65.72
MgO 1.32
SO3 2.26
K2O 0.43
Other components 0.55
2.2. GEOPOLYMER PREPARATION PROCEDURE
Before start mixing the geopolymer, alkaline solution was prepared by mixing
sodium hydroxide and sodium silicate solutions. Then the geopolymer was mixed. All
geopolymer slurries were mixed at ambient temperature and atmospheric pressure. First,
tap water was added to the mixer, then the fly ash was added and the mixing started for 10
seconds at low speed. After that, the alkaline solution, which is a mixture of sodium silicate
and sodium hydroxide, was added. After adding the alkaline solution, the mixture was
mixed for 10 seconds at low speed and 30 seconds at high speed. Twenty four samples
were prepared to measure rheology, density, and fluid loss, and another twenty four
samples were prepared to measure the compressive strength. Different ratios of alkaline
activator to fly ash (AA/FA) (0.2 and 0.4), sodium silicate to sodium hydroxide (SS/SH)
(0.25, 0.5, 1, and 2), and sodium hydroxide concentrations (5 M, 10 M, and 15 M) were
investigated in this study in order to select the optimum design. All geopolymer slurries
have a water ratio of 33%. Table 3 shows the mix designs that were investigated in this
study for different sodium hydroxide concentrations. Along with the previous ratios

64
mentioned, an additional alkaline activator to fly ash ratio was used to investigate the
impacts of increasing alkaline activator to fly ash ratio; the new ratio was (AA/FA) 0.8,
(SS/SH) 1, and NaOH 5, 10, 15 M.
Table 3. Geopolymer mix designs for different ratios of SS/SH and AA/FA
AA/FA FA (gm) SS/SH SH Solution (gm)
SS Solution
(gm)
0.2 600
0.25 96 24
0.5 80 40
1 60 60
2 40 80
0.4 600
0.25 192 48
0.5 160 80
1 120 120
2 80 160
0.8 600 1 240 240
2.3. PORTLAND CEMENT PREPARATION PROCEDURE
Portland cement was mixed according to API recommendations. All Portland
cement slurries were mixed at ambient temperature and atmospheric pressure. First a
distilled water was poured in the blender and mixed at lower speed for 15 seconds while
dry cement was added to the blender. After that, the blender was covered and was left for
35 seconds at high speed.
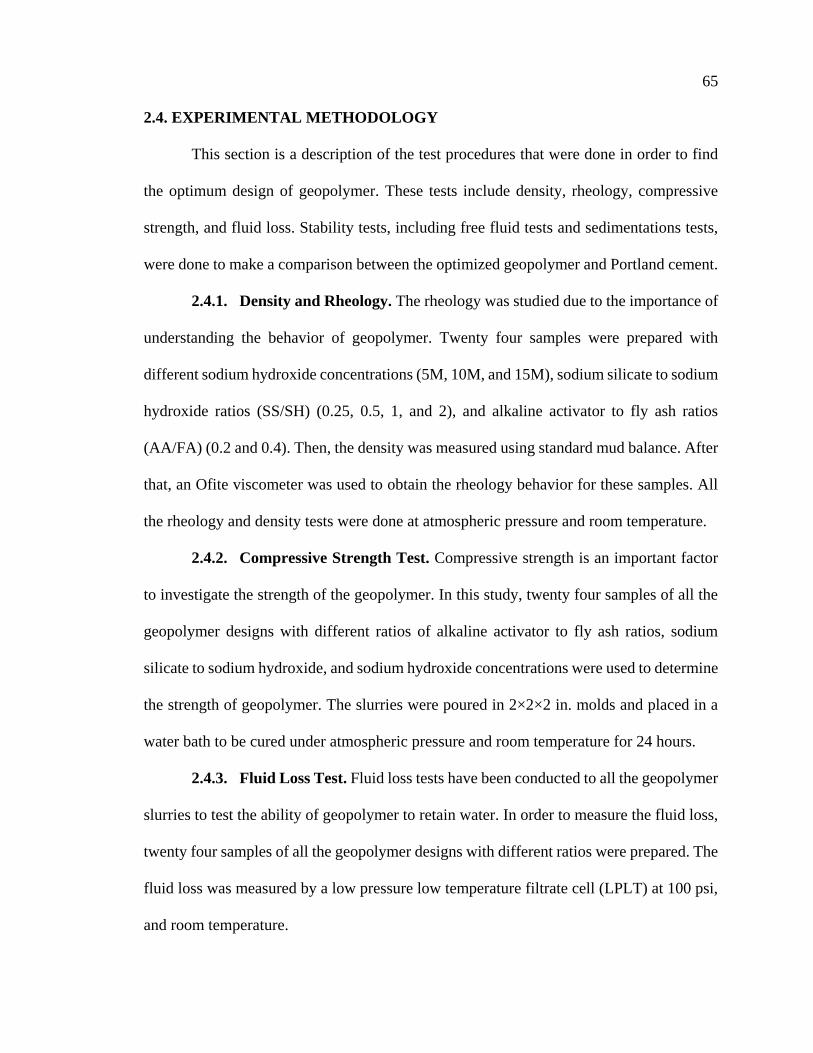
65
2.4. EXPERIMENTAL METHODOLOGY
This section is a description of the test procedures that were done in order to find
the optimum design of geopolymer. These tests include density, rheology, compressive
strength, and fluid loss. Stability tests, including free fluid tests and sedimentations tests,
were done to make a comparison between the optimized geopolymer and Portland cement.
2.4.1. Density and Rheology. The rheology was studied due to the importance of
understanding the behavior of geopolymer. Twenty four samples were prepared with
different sodium hydroxide concentrations (5M, 10M, and 15M), sodium silicate to sodium
hydroxide ratios (SS/SH) (0.25, 0.5, 1, and 2), and alkaline activator to fly ash ratios
(AA/FA) (0.2 and 0.4). Then, the density was measured using standard mud balance. After
that, an Ofite viscometer was used to obtain the rheology behavior for these samples. All
the rheology and density tests were done at atmospheric pressure and room temperature.
2.4.2. Compressive Strength Test. Compressive strength is an important factor
to investigate the strength of the geopolymer. In this study, twenty four samples of all the
geopolymer designs with different ratios of alkaline activator to fly ash ratios, sodium
silicate to sodium hydroxide, and sodium hydroxide concentrations were used to determine
the strength of geopolymer. The slurries were poured in 2×2×2 in. molds and placed in a
water bath to be cured under atmospheric pressure and room temperature for 24 hours.
2.4.3. Fluid Loss Test. Fluid loss tests have been conducted to all the geopolymer
slurries to test the ability of geopolymer to retain water. In order to measure the fluid loss,
twenty four samples of all the geopolymer designs with different ratios were prepared. The
fluid loss was measured by a low pressure low temperature filtrate cell (LPLT) at 100 psi,
and room temperature.

66
2.4.4. Stability Test. Stability tests are another important parameter to ensure that
the cement maintains its desired properties. In this study, free fluids and sedimentation tests
were performed to test the stability of the optimum design. In order to perform the free
fluid test, 250 ml of geopolymer was left in a graduated cylinder for 2 hours. The
sedimentation test was done by preparing a sample of geopolymer and letting it set for 24
hours in a 7.9 in. in length and 1 in. in diameter mold in accordance to (API RP 10B-2
2013). The sample was cut into six segments including top, bottom, and four segments in
between, and the weight of every segment in air and water was taken by using the setup in
Figure 1. The setup is composed of high precision digital balance connected to a 1000 ml
transparent beaker filled with water. The sample is weighed before and after suspension in
water. The density then calculated based on the change in weight using the equations
provided below:
𝜌 =𝑊𝑡𝑎
𝑉𝑜𝑙𝑢𝑚𝑒 ………………………………..………………………………………… (1)
𝑉 =𝑊𝑡𝑎−𝑊𝑡𝑤
𝜌𝑤………………………………………………………………………… (2)
where 𝜌 is the density in gm/cm3, Wta is the weight in air in gm, Wtw is the weight in water
in gm, 𝜌𝑤 is the water density in gm/cm3,and V is the volume of the sample, based on the
change in weight and density, in cm3.
Figure 1. Mass measurement setup
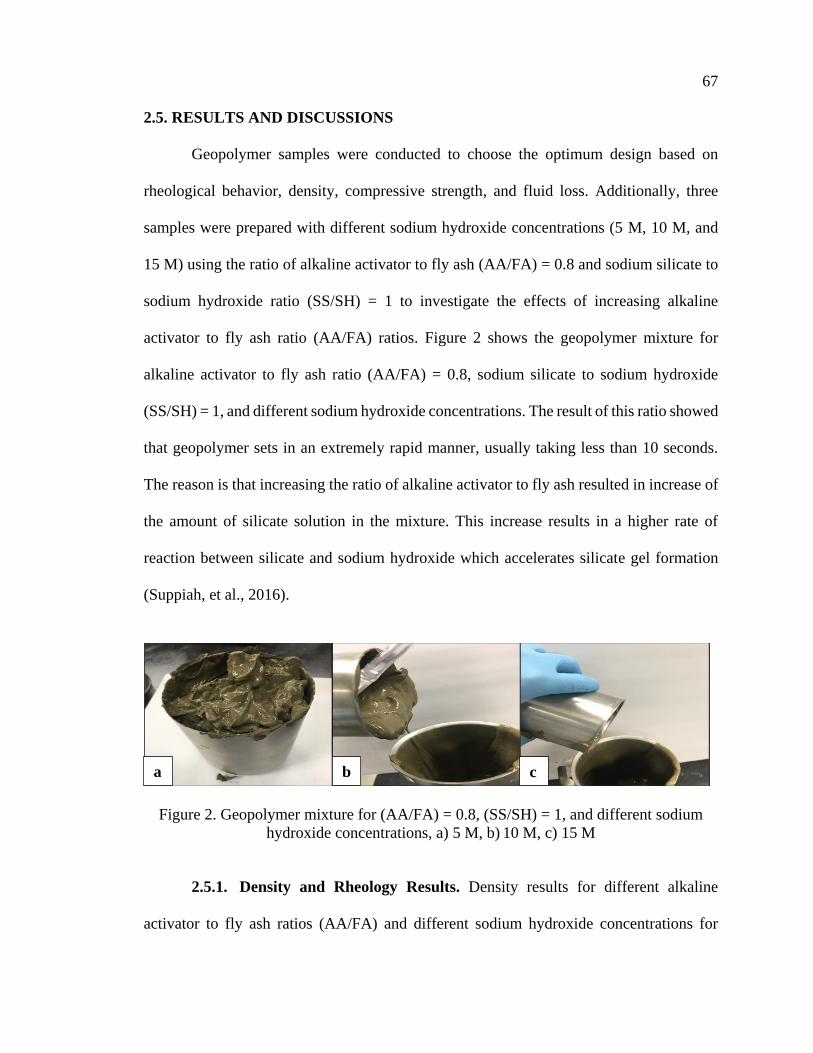
67
2.5. RESULTS AND DISCUSSIONS
Geopolymer samples were conducted to choose the optimum design based on
rheological behavior, density, compressive strength, and fluid loss. Additionally, three
samples were prepared with different sodium hydroxide concentrations (5 M, 10 M, and
15 M) using the ratio of alkaline activator to fly ash (AA/FA) = 0.8 and sodium silicate to
sodium hydroxide ratio (SS/SH) = 1 to investigate the effects of increasing alkaline
activator to fly ash ratio (AA/FA) ratios. Figure 2 shows the geopolymer mixture for
alkaline activator to fly ash ratio (AA/FA) = 0.8, sodium silicate to sodium hydroxide
(SS/SH) = 1, and different sodium hydroxide concentrations. The result of this ratio showed
that geopolymer sets in an extremely rapid manner, usually taking less than 10 seconds.
The reason is that increasing the ratio of alkaline activator to fly ash resulted in increase of
the amount of silicate solution in the mixture. This increase results in a higher rate of
reaction between silicate and sodium hydroxide which accelerates silicate gel formation
(Suppiah, et al., 2016).
Figure 2. Geopolymer mixture for (AA/FA) = 0.8, (SS/SH) = 1, and different sodium
hydroxide concentrations, a) 5 M, b) 10 M, c) 15 M
2.5.1. Density and Rheology Results. Density results for different alkaline
activator to fly ash ratios (AA/FA) and different sodium hydroxide concentrations for
a b c

68
sodium silicate to sodium hydroxide ratio (SS/SH) = 1 are shown in Figure 3. All
geopolymer samples that were investigated showed that geopolymer had regular weight
cement. There is no noticeable effect of sodium hydroxide concentrations on the density;
however there are slight effects of changing the alkaline activator to fly ash ratios. This
indicates that alkaline activator to fly ash ratios are inversely proportional to the density;
as the alkaline activator to fly ash ratios increase, the density slightly decreases. This means
when the amount of fly ash was higher, the density increases. As more alkaline activator
was introduced to the mixture, more bubbles were formed, which creates an unstable
system (Suppiah, et al., 2016).
Figure 4 shows shear stress versus shear strain for Portland cement and geopolymer
slurries with different sodium silicate to sodium hydroxide ratios (SS/SH). The result of
the rheology test showed that most geopolymer samples behave in a way similar to the
Portland cement. Although the geopolymer has less viscosity than Portland cement, it has
a similar manner of rheology behavior.
Figure 3. Density for different AA/FA ratios and different SH concentrations for
SS/SH=1
0
2
4
6
8
10
12
14
16
18
AA/FA = 0.2 AA/FA = 0.4
Den
sity
(lb
/gal
)
5 M10 M15 M

69
Figure 4. Shear stress vs. shear rate for different SS/SH ratios for the concentration of 10
M of sodium hydroxide and AA/FA = 0.4 and Portland cement
Plastic viscosity is an important factor to determine the cement workability. The
plastic viscosity was measured using the Ofite viscometer by reading θ 600 and θ 300 and
plastic viscosity was obtained by using the following equation:
PV= θ600- θ300…………………………………………………………………………(3)
Figure 5 shows the plastic viscosity results for different alkaline activator to fly ash
ratios (AA/FA) with different sodium hydroxide concentrations at a sodium silicate to
sodium hydroxide ratio (SS/SH) = 1. The results showed that an increase of alkaline
activator to fly ash ratios (AA/FA) resulted in an increase in plastic viscosity. However,
sodium hydroxide concentrations are inversely proportional to the plastic viscosity. As the
sodium hydroxide concentrations increase, the plastic viscosity has a slight decrease, which
has an opposite trend from the results found by Suppiah et al., (2016). The plastic viscosity
0
10
20
30
40
50
60
0 100 200 300 400 500 600
Shea
r S
tres
s (P
a)
Shear Rate (1/s)
SS/SH = 0.25
SS/SH = 0.5
SS/SH = 1

70
of the ratio of alkaline activator to fly ash (AA/FA) = 0.4 and sodium hydroxide
concentration = 5 M could not be measured because it has a very short setting time.
Figure 5. Plastic viscosity results for different AA/FA ratios with different sodium
hydroxide concentrations at SS/SH = 1
2.5.2. Compressive Strength Results. Figure 6 shows the compressive strength
measurements at different SS/SH ratios and different concentrations of sodium hydroxide
with AA/FA = 0.2. Compressive strength of different SS/SH ratios at sodium hydroxide =
10M with AA/FA = 0.4 is presented in Figure 7. The laboratory results showed that
increasing sodium hydroxide concentrations would positively affect the compressive
strength, and thus, increases in sodium hydroxide concentrations led to an increase in
compressive strength. The results indicated that for the sodium hydroxide to sodium silicate
(SS/SH) ratio = 0.25, the compressive strength increased about 40% when increasing the
0
50
100
150
200
250
300
350
AA/FA = 0.2 AA/FA = 0.4
Pla
stic
Vis
cosi
ty (
cp)
5 M
10 M
15 M

71
concentration of sodium hydroxide from 5M to 10M, and the compressive strength was
doubled when the sodium hydroxide concentration was increased from 10M to 15M.
Leaching of silicate (Si) and aluminum (Al) starts when fly ash contacts the sodium
hydroxide solution. Therefore, increasing sodium hydroxide concentration results in high
leaching of Si and Al ions in the sodium hydroxide solution, which in turn generates higher
compressive strength (Rattanasak and Chindaprasirt., 2009). The higher compressive
strength of geopolymer is due to the alumino-silicate gel, which formed due to
geopolymerization process (Abdullah et al., 2012).
Figure 6. Compressive strength of different SS/SH ratios and different concentrations of
sodium hydroxide with AA/FA = 0.2
0
500
1000
1500
2000
2500
SS/SH=0.25 SS/SH=0.5 SS/SH=1
Com
pre
ssiv
e S
tren
gth
(psi
)
5 M
10 M
15 M

72
Figure 7. Compressive strength of different SS/SH ratios at sodium hydroxide = 10M
with AA/FA = 0.4
2.5.3. Fluid Loss Test Results. Changing in the cement slurry properties and
cracks within the cement formations are one of the problems that caused due to the loss of
fluid from the cement slurry. Fluid loss additives is used to control the fluid loss. The
obtained results showed that alkaline activator to fly ash ratios have small impacts. As
alkaline activator to fly ash ratios (AA/FA) increase, the volume of the fluid loss decreases.
Figure 8 shows that for the alkaline activator to fly ash ratio 0.4 with sodium hydroxide
(SH) concentration 10M showed the lowest fluid loss volume in 30 minutes, which was 93
ml. The reason for the reduction of the volume of fluid loss is due to the huge availability
of silicates (Si). These silicates react with aluminum (Al) and form alumino-silicate gels
(Suppiah et al., 2016). This result indicates that geopolymer has less fluid loss than Portland
cement. According to API, geopolymer does not require any fluid loss additives in contrast
500
750
1000
1250
1500
SS/SH = 0.25 SS/SH = 0.5 SS/SH = 1
Com
pre
ssiv
e S
tren
gth
(psi
)

73
of Portland cement. When cement loses water, its properties change and the possibility
increases to have channels and cracks within the cement formation. Geopolymer can retain
its properties since it has a low fluid loss compared to Portland cement, which would reduce
the probability of having channels inside the cement.
Figure 8. Fluid loss for different AA/FA ratios and SH concentrations for SS/SH = 1
2.5.4. Optimized Geopolymer Slurry. Based on the results of rheology,
compressive strength, and fluid loss test, the optimum ratios of sodium silicate to sodium
hydroxide, alkaline activator to fly ash, and sodium hydroxide concentration, were 1, 0.4,
and 10 M, respectively. For all slurries, the density and rheology results were in the same
range. Although, the optimized geopolymer did not have the highest compressive strength,
it was still higher than Portland cement. Also, it provided the lowest fluid loss, which was
less than 100 ml in 30 minutes; this, according to API, does not require any fluid loss
0
50
100
150
200
250
300
AA/FA = 0.2 AA/FA = 0.4
Flu
id L
oss
Volu
me
(ml/
30 m
inute
s)
5 M
10 M
15 M

74
additives. This indicates that this system can retain its properties since it has a low fluid
loss, which would reduce the probability of having channels within the cement sheath.
2.5.5. Stability Test Results. In this study, free fluids and sedimentation tests
were performed to test the stability of the optimum design and Portland cement. After the
optimized geopolymer and Portland cement was left for two hours in a 250 ml graduated
cylinder, the volume of free fluids for Geopolymer was 0. However, the volume of free
water for Portland cement was 5.7 ml, it shown in Figure 9. The free fluid portion for
Portland cement was 2.28%. As the results showed, geopolymer had not lost any water
during this time compared to Portland cement, which had 2.28% of free fluid. This
indicates that geopolymer can hold the water, which keeps its properties from changing;
this will reduce the potential of having channels during cementing operations. Increasing
in the free fluids amount have negative effects on cement slurries properties such as the
effective density which decreases as the fee fluids increase. This could reduce the
hydrostatic pressure which leads to increase the probability of having channels within the
cement (Webster and Eikerts., 1979).
Figure 9. Free fluids test

75
The sedimentation test was done by preparing a sample of geopolymer and letting
it set for 24 hours in a 7.9 in. in length and 1 in. in diameter cylindrical mold. Table 4 shows
the results of the sedimentation test. The difference in density for the optimized
geopolymer sample was 0.008 gm/cc, which is very low compared to 0.028 gm/cc for the
Portland cement. This indicates that there are no particles settling for the optimized
geopolymer.
Table 4. Sedimentation test results of Portland cement and geopolymer cured at room
temperature 24 ̊C and Atmospheric pressure
Downgrade (mm) ∆𝝆 (𝒈𝒎
𝒄𝒎𝟑)
Optimized Geopolymer 1.95 0.008
Portland Cement 3.30 0.028
API Limits 5.00 0.060
where ∆𝝆 is the change in the specific density.
3. COMPARISON BETWEEN THE OPTIMIZED GEOPOLYMER AND
PORTLAND CEMENT
Figure 10 shows the comparison in rheology behavior between the optimized
geopolymer and Portland cement. The density investigations showed that the optimized
geopolymer had regular weight cement. The optimized geopolymer showed a behavior
similar to the Portland cement in terms of rheology.

76
Figure 10. Comparison in rheology behavior between the optimized geopolymer and
Portland cement
Figure 11 shows a comparison in compressive strength between the optimized
geopolymer and Class H Portland cement. The obtained results showed that the optimized
geopolymer has a higher compressive strength than Portland cement. These results show
that geopolymer can withstand harsher downhole conditions.
Figure 12 shows a comparison in fluid loss between the optimized geopolymer and
Portland cement. The results also show that the optimized geopolymer has lower fluid loss
than Portland cement after 30 minutes, which is due to the alumino-silicate gels that formed
as a result of the reaction between silicate (Si) and aluminum (Al). These results showed
that optimized geopolymer has the ability to keep its water which would reduce the
probability of having channels inside the cement.
0
10
20
30
40
50
60
70
80
90
0 100 200 300 400 500 600
Sh
ear
stre
ss (
pa)
Shear rate (1/s)
Optimized Geopolymer
Portland Cement

77
Figure 11. Comparison in compressive strength between the optimized geopolymer and
Portland cement
Figure 12. Comparison in fluid loss between the optimized geopolymer and Portland
cement
717
1195
0
200
400
600
800
1000
1200
1400
Portland Cement Optimized Geopolymer
Com
pre
ssiv
e S
tren
gth
(psi
)
199
93
0
50
100
150
200
250
Portland Cement Optimized Geopolymer
Flu
id L
oss
(m
l)

78
4. CONCLUSION
The optimum ratios of sodium silicate to sodium hydroxide, alkaline activator to
fly ash, and sodium hydroxide concentration were 1, 0.4, and 10 M, respectively. These
ratios were obtained based on the results of the rheology, compressive strength, and fluid
loss tests. This optimum design provides a higher compressive strength when compared to
Portland cement and behaves in a similar manner. In addition, this system can retain its
properties as it has low fluid loss, which would reduce the probability of having channels
within the cement sheath.
Sodium hydroxide concentrations are inversely proportional to the plastic viscosity;
as the sodium hydroxide concentrations increases, plastic viscosity has a slight
decrease.
Sodium hydroxide concentrations positively affect the compressive strength. As
sodium hydroxide concentrations increase, the compressive strength increases, which
is due to high leaching of silicate (Si) and aluminum (Al) ions in higher sodium
hydroxide concentrations.
Sodium silicate to sodium hydroxide ratios increasing results in a decrease in fluid
loss, which is due to the alumino-silicate gels that formed due to the high availability
of silicates.
Stability tests indicate that there is no free fluid and particles settling for the optimized
geopolymer.
The optimized geopolymer has a higher compressive strength than Portland cement.
The optimized geopolymer has a lower fluid loss than Portland cement in 30 minutes

79
NOMENCLATURE
kg ⁄ m3 = Kilogram per meter cube.
psi = Pounds per square inch.
lb ⁄ gal = Pounds per gallon.
°C = Degree Celsius.
BWOC = By weight of cement.
VFF = Volume of free fluids, ml.
Vi = Initial volume of cement, ml.
Φ = Free fluids content, vol%.
m = Mass of cement, gm, kg.
drel = Relative density, frac.
ρ = Gram per cubic centimeter, Pounds per gallon.
REFERENCES
Abdullah, Mohd Mustafa Al Bakri & Kamarudin, H & Binhussain, Mohammed & Razak,
Rafiza & Yahya, Zarina. (2012). Effect of Na2SiO3/NaOH Ratios and NaOH
Molarities on Compressive Strength of Fly-Ash-Based Geopolymer. Aci Materials
Journal. 109. 503-508.
Al-Bakari, A. M., Kareem, A., & Myint, S. (2012). Optimization of Alkaline Activator/Fly
Ash Ratio on the Compressive Strength of Fly Ash-Based Geopolymer. Kanger:
University Malaysia Perlis (UniMAP).
API RP 10B-2, Recommended Practice for Testing Well Cements, second edition. 2012.
Washington, DC: API.

80
API Specification 10A/ISO 10426-1, Specification for Cements and Materials for Well
Cementing, Twenty-third Edition.
ASTM C 618, Standard Specification for Coal Fly Ash and Raw or Calcined Natural
Pozzolan for Use in Concrete, 100 Barr Harbour Dr. P.O. box C-700 West
Conshohocken, Pennsylvania United States.
Bakkali, H., Ammari, M., Frar, I., NaOH Alkali-Activated Class F Fly Ash: NaOH
molarity, Curing Conditions and Mass Ratio Effect. J. Mater. Environ. Sci. 2016.
Morocco. Vol.7 No.2 (397-401).
Bois, A.-P., Garnier, A., Galdiolo, G., & Laudet, J.-B. (2012, June 1). Use of a Mechanistic
Model To Forecast Cement-Sheath Integrity. Society of Petroleum Engineers.
doi:10.2118/139668-PA.
Davidovits, J. (1994, October). Properties of geopolymer cements. In First international
conference on alkaline cements and concretes (Vol. 1, pp. 131-149). Kiev State
Technical University, Ukraine: Scientific Research Institute on Binders and Materials.
Khalifeh, M., Saasen, A., Vralstad, T., & Hodne, H. (2014, April 2). Potential Utilization
of Geopolymers in Plug and Abandonment Operations. Society of Petroleum
Engineers. doi:10.2118/169231-MS.
Kong DLY, Sanjayan JG (2008). Damage behaviour of geopolymer composites exposed
to elevated temperature. Cement and Concrete Composites, Volume 30, Issue 10:
pg986–991.
Liu, X., Aughenbaugh, K., Lee, H., Nair, S., & Oort, E. van. (2017, April 3). Geopolymer
- Synthetic Based Mud Hybrid Cements for Primary Cementing and Lost Circulation
Control. Society of Petroleum Engineers. doi:10.2118/184558-MS.

81
Nasvi, M. C. M., Ranjith, P. G., & Sanjayan, J. (2012, January 1). Comparison of
Mechanical Behaviors of Geopolymer And Class G Cement As Well Cement At
Different Curing Temperatures For Geological Sequestration of Carbon Dioxide.
American Rock Mechanics Association.
Rattanasak U., Chindaprasirt P., Miner. Eng., 22 ( 2009) 1073-1078.
Salehi, S., Ali, N., Khattak, M. J., & Rizvi, H. (2016, September 26). Geopolymer
Composites as Efficient and Economical Plugging Materials in Peanuts Price Oil
Market. Society of Petroleum Engineers. doi:10.2118/181426-MS.
Salehi, S., Khattak, M. J., Ali, N., & Rizvi, H. R. (2016, March 1). Development of
Geopolymer-based Cement Slurries with Enhanced Thickening Time, Compressive
and Shear Bond Strength and Durability. Society of Petroleum Engineers.
doi:10.2118/178793-MS.
Sugumaran, M. (2015, October 20). Study on Effect of Low Calcium Fly Ash on
Geopolymer Cement for Oil Well Cementing. Society of Petroleum Engineers.
doi:10.2118/176454-MS.
Suppiah, R. R., Rahman, S. H. A., Irawan, S., & Shafiq, N. (2016, November 12).
Development of New Formulation of Geopolymer Cement for Oil Well Cementing.
International Petroleum Technology Conference. doi:10.2523/IPTC-18757-MS.
UEHARA, M. (2010, March 03). New Concrete with Low Environmental Load Using the
Geopolymer Method. Retrieved from https://www.jstage.jst.go.jp/article/rtriqr/51/1/-
51_1_1/_article.
Webster, W. W., & Eikerts, J. V. (1979, January 1). Flow After Cementing : A Field And
Laboratory Study. Society of Petroleum Engineers. doi:10.2118/8259-MS.

82
II. INVESTIGATING RHEOLOGICAL AND MECHANICAL PERFORMANCE
OF GEOPOLYMER CEMENT IN PRESENCE OF WATER BASED
DRILLING FLUID
ABSTRACT
Oil well cementing is one of the most important steps in drilling and completion
processes and providing a full zonal isolation which is the most important features in the
oil cementing. Traditionally, Portland cement is used for oil cementing operations,
however, a few years ago, a new cost-effective material came to light called geopolymer.
In this research, a fly ash class C based geopolymer was used. This research investigates
the effect of drilling fluid contamination with geopolymer cement to understand its impact
on geopolymer rheological and mechanical performance. Initially, the optimized
geopolymer was prepared and mixed with different drilling fluid ratios, including 0%, 5%,
and 10% by weight of cement. Same percentages were added to Portland cement to
compare it with the geopolymer. Four tests were conducted to determine the effects of
drilling fluids including: rheology, density, fluid-loss, and compressive strength for
different curing time (1 day, 3 days, and 7 days). Results showed that drilling fluids
enhanced the geopolymer rheological behavior by improving geopolymer viscosity and
reducing the fluid loss. In contrast, mixing the drilling fluid with Portland cement had a
negative effect on rheological behavior as well as fluid loss. Mixing the drilling fluid with
Portland cement increased the fluid loss significantly. Furthermore, drilling fluids reduced
the geopolymer viscosity which facilitates the pumping operation during the cementing. In
term of compressive strength, as the amount of drilling fluids increased, the compressive

83
strength of geopolymer was not significantly affected. After 3 days curing time,
geopolymer lost about 8.5% of its strength when 5% of drilling fluids weight percent was
added. Whereas, Portland cement has lost 38.4% of its strength when 5% of drilling fluids
weight percent was added. After 7 days curing time, geopolymer lost about 23% of its
strength when 5% of drilling fluid by weight of cement was added. However, Portland
cement lost 49% of compressive strength in the same condition. These results are very
promising since geopolymer showed a better rheological and mechanical performance than
Portland cement.
1. INTRODUCTION
Cementing is one of the most important processes during the drilling and
completion of the wells. The primary function is preventing the fluid migrations between
the formations and wells to provide full zonal isolation. Severe operational difficulties and
huge environmental issues as well as high remedy costs could be a result of losing zonal
isolation. Portland cement has been used for many years for cementing process. Radial
cracks within the cement sheath, micro-annuli at the interfaces of the cement, and channels
through the cement matrix are challenges facing Portland cement (Bois, et al., 2012;
Alkhamis, & Imqam, 2018). Lately, a new material, called geopolymer, has been
investigated to be used as an alternative to Portland cement. Geopolymer is a result of the
reaction between fly ash, which is a by-product of coal combustion in power plants, and
alkaline activator, which is a mixture of sodium or potassium hydroxide (NaOH, KOH)
and sodium silicate (Na2SiO3) or potassium silicate (K2O3Si).

84
Geopolymer has many advantages over Portland cement, which makes it more appealing
to use. The two main advantages that make geopolymer a better candidate compared to
Portland cement are:
Geopolymer is More Cost Effective: The main component of geopolymer is fly
ash. Fly ash is produced as a byproduct of coal burning, and since it has not major
market, it is extremely cheap to acquire. Portland cement however, requires specific
ingredient that are relatively expensive to acquire, compared to geopolymer
(American Coal Ash Association, 2003).
Geopolymer is More Environmentally Friendly: Since geopolymer is composed
mainly of fly ash, it encourages the use of a byproduct waste material, which in turn
prevents these material from being placed in landfills. Portland cement has a huge
environmental effect due to its manufacturing process, which requires burning a
huge amount of fuel and decomposition of limestone, thus causing enormous
volumes of carbon dioxide (CO2) emissions (Kong D. L. Y., and Sanjayan J. G.,
2008).
Recently, geopolymer properties have been studied in hope that it can be applied as
an environmentally friendly replacement to Portland cement. Contaminated cement slurry
with drilling fluids is considered one of the major cause of the oil cementing failures
(Morgan, & Dumbauld, 1952; Aughenbaugh, et al., 2014). In the last a few years, a few
papers studied the effect of the drilling fluids on the geopolymer slurries. However, many
research studies showed that geopolymer can be an appropriate environmental alternative
to Portland cement in oil and gas wells. Bakkali, et al. (2016) indicated that geopolymer
provides a dependable compressive strength at different sodium hydroxide (NaOH)

85
concentrations and different curing conditions. Sodium hydroxide concentrations
positively affect the compressive strength. The higher compressive strength of geopolymer
is due to the alumino-silicate gel, which formed due to geopolymerization process
(Abdullah, et al., 2012). As sodium hydroxide concentrations increase, the compressive
strength increases. Also, the compressive strength is strongly affected by the ratio of
alkaline activator to fly ash. Increasing the alkaline activator to fly ash ratios resulted in an
increase in the geopolymer strength (Al-Bakri, et al., 2012). Nasvi, et al. (2012) studied the
mechanical properties of geopolymer and Portland cement class G at different curing
temperature. Suppiah, et al. (2016) studied the effects of using different silicate to
hydroxide ratios and different sodium hydroxide concentrations on compressive strength.
Their results showed that increasing in sodium hydroxide concentrations resulted in an
increase in compressive strength. Thermal stability, low surface roughness, and durability
are also used to characterize geopolymer (Khalifeh, et al., 2014). According to Uehar, M.,
(2010), geopolymer has better acid resistance than Portland cement. Ahdaya, et al. (2019)
selected the optimum design of geopolymer by changing the sodium hydroxide
concentrations, sodium silicate to sodium hydroxide ratios, and alkaline activator to fly ash
ratios until the best properties were achieved.
One of the main challenges facing geopolymer is the pumping processes and early
strength. In 2016, a retarder was added to achieve a 4 hour thickening time for the
optimized geopolymer. Geopolymer has better durability compared to Portland cement
when exposure to acid environment (Salehi, et al., 2016). There is not significant influences
on the cement slurry properties when the cement slurries are mixed with low concentrations
of untreated mud (Morgan, B. E., and Dumbauld, G. K., 1952). According to El Sayed,

86
(1995), Portland cement, in 24 hr. curing time, lost about 80% of its strength when a high
concentration of drilling fluids were introduced. Also, Bradford, (1982) studied the effect
of drilling fluids on Portland cement, his result indicated that Portland cement lost about
44% of its strength. Mixing the synthetic-based mud (SBM) with Portland cement also
reduced its strength (Aughenbaugh, et al., 2014). Sufficient compressive strength and
acceptable rheological behavior are obtained when mixing the synthetic-based mud (SBM)
with geopolymer (Liu, et al., 2016). Also, the pumping time was significantly accelerated
when mixing the SBM with geopolymer (Liu, et al., 2017). Most previous work was done
by mixing fly ash class F based geopolymer and Portland cement with the synthetic-based
mud (SBM).
This research studies the mixing of fly ash class C based geopolymer with drilling fluid
as a means to investigate the rheological and mechanical performance of geopolymer
cement in presence of water based drilling fluid. Rheological factors studied include
slurries’ viscosity, density, rheology behavior, and fluid loss to investigate the slurries’
basic properties. Mechanical performance of both geopolymer and Portland cement was
indicated using compressive strength test.
2. CHEMISTRY OF GEOPOLYMER
Geopolymers are synthesized by reacting an aluminosilicate source, such as fly ash,
with the alkaline activator, which is a mixture of the sodium hydroxide and sodium silicate.
This reaction will yield a polymeric bond between the silicate, oxygen, and the aluminum
as shown in equation below (Davidovits, 1994):

87
The SiO4 and the AlO4 are combined covalently by sharing the oxygen atoms. The
aluminum ions create a negative charge, which is neutralized by the sodium, potassium,
and lithium positive ions, which occupy the cavities present in the geopolymer framework.
This is shown in the chemical reaction below (Davidovits, 1994; Yong, et al., 2015):
3. EXPERIMENTAL DESCRIPTION
3.1. MATERIALS
3.1.1. Fly Ash. Fly ash Class C was used in this study. The chemical composition
of the fly ash was determined by using X-ray fluorescence (XRF). The result of XRF
showed that the amount of silicon dioxide (SiO2), aluminum oxide (Al2O3), and iron oxide
(Fe2O3) is higher than 50%, which, according to American Society for Testing and
Materials (ASTM C 618), proves that it is fly ash Class C. Table 1 shows the composition
of fly ash that were obtained from X-ray fluorescence (XRF).

88
Table 1. The chemical composition of fly ash
Element Concentration (%)
SiO2 28.93
Al2O3 14.82
Fe2O3 6.40
CaO 39.80
MgO 4.86
Na2O 1.10
K2O 0.56
Other components 2.63
3.1.2. Sodium Hydroxide (NaOH). Sodium hydroxide with purity of 96% was
used in this study. Sodium hydroxide with concentrations of 10 M was used in this study.
Sodium hydroxide solution was prepared by 400 gm of dry powder and then adding this
amount to a 500 ml of distilled water and hand stirred until it was fully dissolved. Then,
extra distilled water was added until the total volume reached 1 liter.
3.1.3. Sodium Silicate (Na2SiO3). Sodium silicate, also known as water glass,
was obtained from PQ Corporation.
3.1.4. Portland Cement. American Petroleum Institute (API) Portland cement
class H was used in this study. The chemical composition of the Portland cement was
determined using X-ray fluorescence (XRF). The composition of Portland cement class H,
obtained from XRF, is shown in Table 2.

89
Table 2. The chemical composition of Portland cement
Element Concentration (%)
SiO2 20.36
Al2O3 3.17
Fe2O3 6.19
CaO 65.72
MgO 1.32
SO3 2.26
K2O 0.43
Other components 0.55
3.1.5. Drilling Fluids. In this study, water base mud was used. The drilling fluid
was prepared by adding bentonite to water and leaving it for prehydration for 24 hours.
Following that, xanthan gum (XG) was added and mixed for 10 minutes. After that, Low
Viscosity Polyanionic Cellulose (PAC-LV) was added and mixed for another 10 minutes.
Then, the density was measured. Barite was added to keep the drilling fluid’s density at a
constant value of 9.5 lb/gal. Drilling fluids properties are shown in Table 3.
Table 3. Drilling fluids properties
Plastic
Viscosity Density Gel Strength at 10 Sec Gel Strength at 10 min
17 9.5 15 28

90
3.2. EXPERIMENTAL METHODOLOGY AND PROCEDURE
This section is a description of geopolymer and Portland cement preparation
procedure as well as test procedures that were done in order to investigate the effects of
drilling fluids on geopolymer and Portland cement. These tests include density, rheology,
fluid loss, and compressive strength using different curing time. After prepared the drilling
fluids, geopolymer slurries were prepared and mixed with different drilling fluid ratios,
including 0%, 5%, and 10% by weight of cement (BWOC). These drilling fluids ratios
were also mixed with Portland cement slurries to investigate the effects of drilling fluids
on Portland cement properties and made comparison between Portland cement and
geopolymer.
3.2.1. Geopolymer Preparation Procedure. All geopolymer slurries were mixed
at ambient temperature and atmospheric pressure. The blender was filled with the tap water
firstly, after that, the fly ash class C was added and mixed at low speed for 10 seconds.
Then, the alkaline solution, which is a mixture of sodium silicate and sodium hydroxide,
was added. After adding the alkaline solution to the blender, the mixture was mixed for 10
seconds at low speed and 30 seconds at high speed. This slurry was poured in cubic molds
and cured for 24 hours to be used in compressive strength measurement. The basic
components of geopolymer are shown in Figure 1. Initially, thirty different geopolymer
batches were prepared with different ratios of alkaline activator to fly ash (AA/FA), sodium
silicate to sodium hydroxide (SS/SH), and different sodium hydroxide concentrations.
Following an extensive analysis including compressive strength, rheology, density, and
fluid loss. The optimized geopolymer design had a reasonable compressive strength, lower
fluid loss, and acceptable rheological behavior. Table 4 shows the geopolymer mix design.

91
Table 4. Geopolymer mixing design
AA/FA FA (gm) SS/SH SH Solution (gm) SS Solution (gm)
0.4 600 1 60 60
AA Alkaline Activator FA Fly Ash
SS Sodium Silicate SH Sodium Hydroxide
Figure 1. Reaction of fly ash with alkaline activator to produce geopolymer
3.2.2. Portland Cement Preparation Procedure. Portland cement was mixed
according to API recommendations. All Portland cement slurries were mixed at ambient
temperature and atmospheric pressure. The blender was filled with the distilled water and
mixing commenced at low speed for 15 seconds. During the 15 seconds, the dry cement
was added to the blender. Then, the blender was covered and mixing continued for 35
seconds at high speed. The Portland cement mix design is presented in Table 5.
Table 5. Portland cement mixing design
Mass (percent by weight of cement BWOC)
Class H Cement 100
Distilled Water 38

92
A low speed blender was used to mix the drilling fluids with the cement slurries.
Five and ten percent by weight of cement of drilling fluids was added to the cement slurries.
The total weight of the slurry after adding the weight percent of drilling fluids was
maintained similar to the slurry containing no drilling fluids in order to compare the results.
Finally, the mixture was mixed at low speed, 400 rpm, for 30 seconds.
3.2.3. Density and Rheology. The rheology was studied due to the importance of
understanding the behavior of geopolymer and Portland cement when interacting with
drilling fluids. The density was studied to investigate the impacts of mixing the drilling
fluids on the slurries densities. Then, the density was measured using a standard mud
balance. After that, an Ofite viscometer was used to obtain the rheology behavior for these
samples. All the rheology and density tests were done at atmospheric pressure and room
temperature.
3.2.4. Compressive Strength Test. Compressive strength is an important factor
to investigate the strength of the geopolymer. In this study, geopolymer strength and
Portland cement strength were tested after the slurries were mixed with different drilling
fluids ratios to study the effect of these additives on the compressive strength. All
geopolymer slurries were mixed at ambient temperature and atmospheric pressure. Then,
the geopolymer slurries were mixed with drilling fluids. The mixture was poured in 2×2×2
in. molds and placed in a water bath to be cured under atmospheric pressure and room
temperature for different curing time (1 day, 3 days, and 7 days). Similar procedure was
done to Portland cement.
3.2.5. Fluid Loss Test. Fluid loss test is an important test in order to understand
how much water will be lost to the formation during the cementing operation; in other

93
words, to test the ability of cement to retain its water. The fluid loss was measured by a
low-pressure low-temperature filtrate cell (LPLT) using 100 psi pressure, and room
temperature.
3.3. RESULTS AND DISCUSSIONS
3.3.1. Density Measurement Results. Mixing the drilling fluids with cement
slurries did not affect the density significantly on both materials, geopolymer and Portland
cement. Figure 2 shows the densities of geopolymer and Portland cement with different
ratios of drilling fluids. As the drilling fluids weight percentage increased the density
decreased slightly; the density of these slurries still remained within the regular weight
cement density range of 14 to 17 lb/gal (Pang, et al., 2014). Geopolymer density was 14.7
lb/gal when no drilling fluid was added compared to 14.3 lb/gal when 10 weight percent
drilling fluid was added. The slight decrease that happened to the density was due to adding
the drilling fluid that has a lower density compared to the geopolymer and Portland cement
slurries. This resulted in a reduction in the cement slurries density.
Figure 2. Density of geopolymer and Portland cement slurries after adding drilling
fluids
10
11
12
13
14
15
16
17
18
0% 5% 10%
Den
sity
(lb
/gal
)
Drilling fluids weight percent
Geopolymer
Portland Cement

94
3.3.2. Rheology Results. Plastic viscosity is an important factor to determine the
cement flowability. The plastic viscosity was measured using Ofite viscometer.
Figure 3 shows the result of the viscosity of geopolymer and Portland cement after
adding drilling fluids. The results of the rheology test showed that mixing the drilling fluids
with geopolymer decreased its viscosity which increase the slurries workability. However,
mixing the drilling fluids with Portland cement resulted in an increase in the viscosity.
Increasing the amount of drilling fluid was directly proportional to Portland cement
viscosity. Increasing in the amount of the drilling fluids resulted in an increase in the
viscosity of Portland cement slurries, which will affect the cement slurries workability.
Viscosity is important during the pumping processes. Decreasing on the viscosity will
facilitate the pumping processes and also reduce the pumping operations cost due to the
lower pump power needed to pump the lower viscosity slurry (Alzgoul, 2014).
Figure 3. Viscosity of geopolymer and Portland cement slurries using different
drilling fluid weight percent
43
44
45
46
47
48
49
50
51
52
0% 5% 10%
Vis
cosi
ty (
cp)
Drilling fluid weight percent
Geopolymer
Portland Cement

95
The flow curves for the geopolymer, geopolymer plus 5% BWOC of drilling fluids,
and geopolymer plus 10% BWOC of drilling fluids at room temperature (24˚C) are very
close to straight lines. Figure 4 and Figure 5 show shear stress verses shear rate using
different drilling fluid weight percent for geopolymer and Portland cement. These results
indicate that there is a small effect on the rheological behavior of geopolymer, however,
the rheological behavior still in the acceptable level. Mixing drilling fluids with
geopolymer reduced the shear rate verses shear stress which helps during the pumping
processes. In other words, drilling fluids can reduce the cost of pumping during cementing
operations due to its effect on geopolymer slurries. However, mixing drilling fluids with
Portland cement can cause an enormous problems. Drilling fluids have a negative effects
on the rheological behavior of Portland cement, it increases the viscosity and makes the
slurry very thick which will affect the pumping processes and causes many problems
during the cementing operations.
Figure 4. Shear stress verses shear rate using different drilling fluid weight percent at
room temperature for geopolymer
0
10
20
30
40
50
0 100 200 300 400 500 600
Shea
r S
tres
s (P
a)
Shear Rate (1/s)
0%
5%
10%

96
Figure 5. Shear stress verses shear rate using different drilling fluid weight percent at
room temperature for Portland cement
3.3.3. Compressive Strength Results. Geopolymer and Portland slurries were
prepared and mixed with different ratios by weight of cement of drilling fluids using a low
speed mixer. The mixtures were poured in 2*2*2 cubic molds and were cured in water bath
at room temperature, and atmospheric pressure. Compressive strength was measured at
different curing times (1 day, 3 days, and 7 days). Figure 6 show compressive strength of
geopolymer and Portland cement after 1, 3, and 7 days. The laboratory results showed that
curing time positively affects the compressive strength. The obtained results showed that
geopolymer has early strength compared to Portland cement, 1195 and 717 psi
respectively. However, with time, the geopolymer compressive strength increased at a
lower rate compared to Portland cement. After 3 and 7 days, Portland cement had higher
compressive strength, 3441 and 4610 psi respectively, compared to 2330 and 3085 psi of
geopolymer strength.
20
40
60
80
100
120
0 100 200 300 400 500 600
Shea
r S
tres
s (P
a)
Shear Rate (1/s)
0%
5%
10%
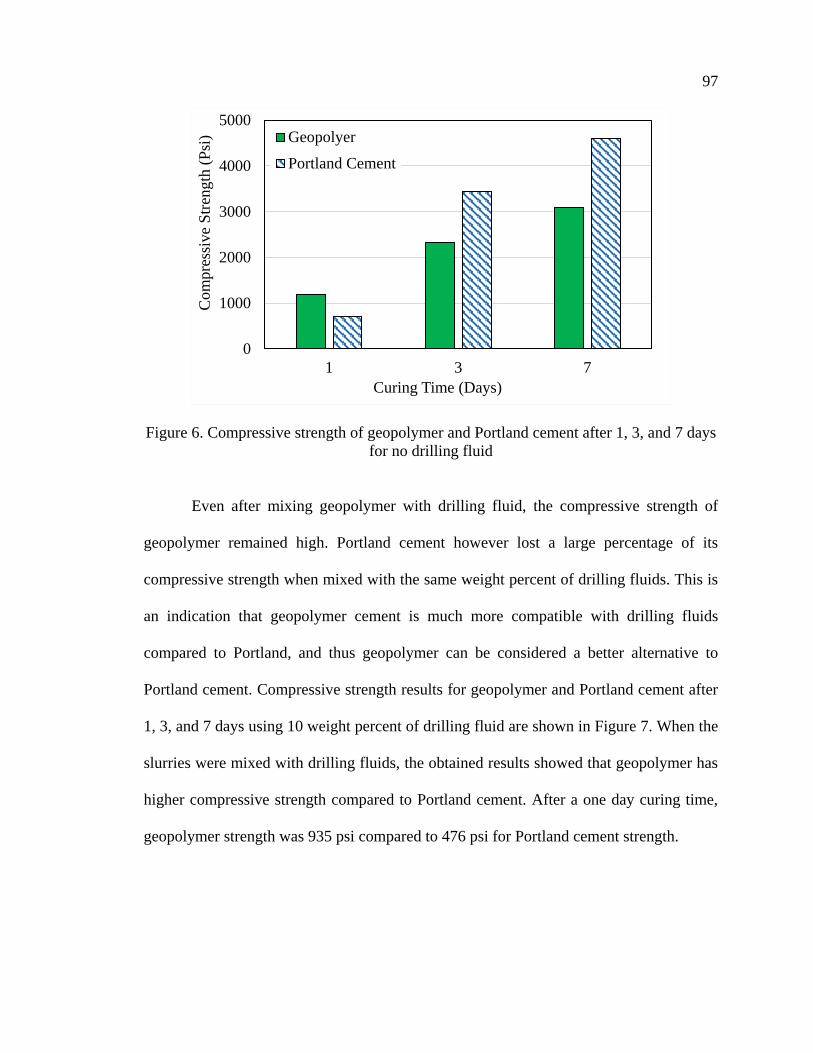
97
Figure 6. Compressive strength of geopolymer and Portland cement after 1, 3, and 7 days
for no drilling fluid
Even after mixing geopolymer with drilling fluid, the compressive strength of
geopolymer remained high. Portland cement however lost a large percentage of its
compressive strength when mixed with the same weight percent of drilling fluids. This is
an indication that geopolymer cement is much more compatible with drilling fluids
compared to Portland, and thus geopolymer can be considered a better alternative to
Portland cement. Compressive strength results for geopolymer and Portland cement after
1, 3, and 7 days using 10 weight percent of drilling fluid are shown in Figure 7. When the
slurries were mixed with drilling fluids, the obtained results showed that geopolymer has
higher compressive strength compared to Portland cement. After a one day curing time,
geopolymer strength was 935 psi compared to 476 psi for Portland cement strength.
0
1000
2000
3000
4000
5000
1 3 7
Com
pre
ssiv
e S
tren
gth
(P
si)
Curing Time (Days)
Geopolyer
Portland Cement

98
Figure 7. Compressive strength of geopolymer and Portland cement after 1, 3, and 7 days
using 10 weight percent of drilling fluid
Referring to Figure 6 and Figure 7, the reduction of compressive strength of
geopolymer and Portland cement after 1 day, 3 days, and 7 days curing time with different
drilling fluids weight percent is shown in Figure 8, Figure 9, and Figure 10. After a one
day curing time, drilling fluids with 5 and 10 weight percent exhibited an 8 and 20 %
reduction in compressive strength respectively.
For Portland cement however, adding 5 and 10 weight percent drilling fluid resulted
in a decrease in compressive strength by 9 and 34 % respectively. After 3 days curing time,
geopolymer lost only 8.5 and 23.9 % of its strength when mixed with 5 and 10 % of drilling
fluids weight percent respectively. However, Portland cement had a huge decrease in
compressive strength when mixed with 5 % and 10 % of drilling fluids weight percent,
with a 38.4 % and 59.2 % loss of its strength, respectively. After 7 days curing time,
geopolymer strength decrease slightly more reaching 24 % reduction for 5 weight percent
drilling fluids compared to Portland cement which exhibited 49 % reduction when exposed
0
400
800
1200
1600
2000
1 3 7
Com
pre
ssiv
e S
tren
gth
(psi
)
Curing Time (Days)
Geopolyer
Portland Cement
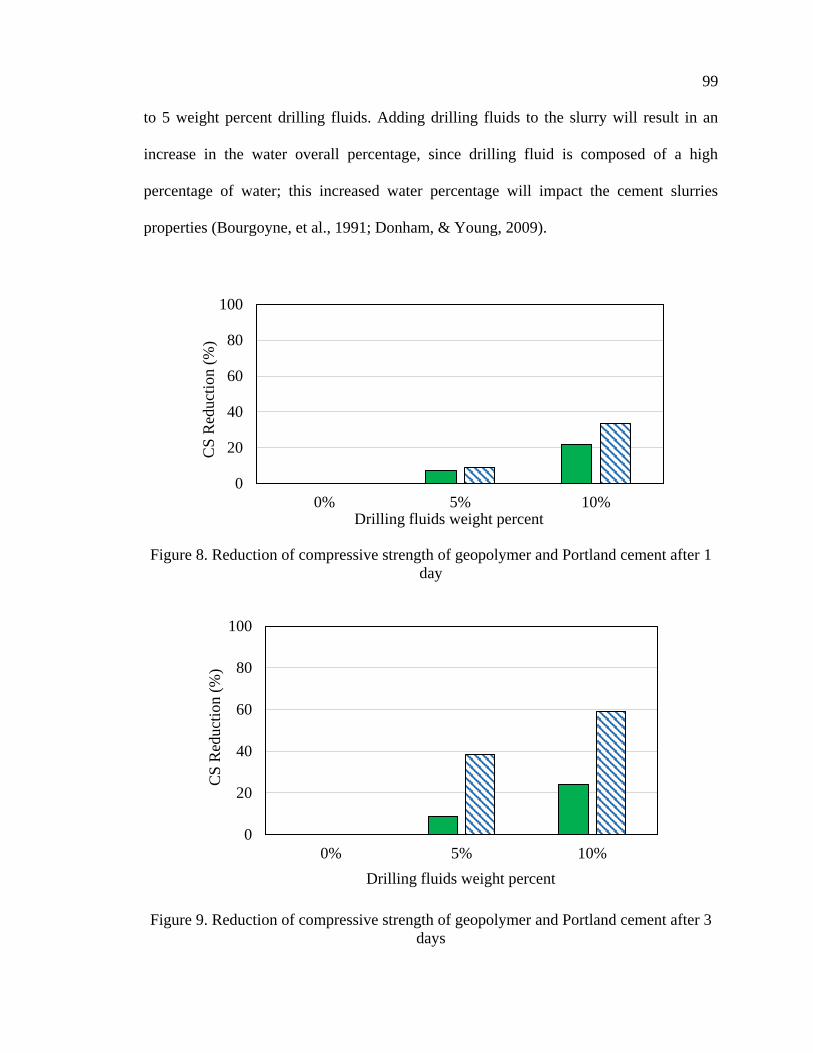
99
to 5 weight percent drilling fluids. Adding drilling fluids to the slurry will result in an
increase in the water overall percentage, since drilling fluid is composed of a high
percentage of water; this increased water percentage will impact the cement slurries
properties (Bourgoyne, et al., 1991; Donham, & Young, 2009).
Figure 8. Reduction of compressive strength of geopolymer and Portland cement after 1
day
Figure 9. Reduction of compressive strength of geopolymer and Portland cement after 3
days
0
20
40
60
80
100
0% 5% 10%
CS
Red
uct
ion (
%)
Drilling fluids weight percent
0
20
40
60
80
100
0% 5% 10%
CS
Red
uct
ion (
%)
Drilling fluids weight percent

100
Figure 10. Reduction of compressive strength of geopolymer and Portland cement after 7
days
3.3.4. Fluid Loss Test Results. Cement properties can be strongly affected by
losing its water, which will increase the possibility of having cracks and channels within
the cement. The fluid loss was measured by a low pressure low temperature filtrate cell
(LPLT). The geopolymer slurries were prepared and mixed with the drilling fluids and
were poured at the cell. The cell was pressurized at 100 psi using air pressure. The
measurement was taken every one minute, for accuracy, for 30 minutes or until the water
stopped, following API recommendations. If the time did not reach 30 minutes, the
following equation was used to obtain the fluid loss volume:
𝐴𝑃𝐼 𝑓𝑙𝑖𝑢𝑑 𝑙𝑜𝑠𝑠 = 2 𝑉𝑡√300
𝑡 ………………………………………………………….…(1)
where Vt is the volume of filtrate at the time air blows through, in ml, and t is the elapsed
time, in minutes.
0
20
40
60
80
100
0% 5% 10%
CS
Red
uct
ion (
%)
Drilling fluids weight percent

101
Figure 11. Shows geopolymer fluid loss with different drilling fluids weight
percent. These obtained results showed that drilling fluids concentrations are inversely
proportional to the fluid loss. This indicates that drilling fluids can work as fluid loss
additives. As drilling fluid weight percent increases the geopolymer fluid loss decreases.
Geopolymer had 93 ml fluid loss in 30 minutes when no drilling fluids was added compared
to only 80 ml fluid loss in 30 minutes when 10 weight percent drilling fluid was added.
This reduction is due to the drilling fluids containing bentonite which contain aluminum
and silicate; the aluminum and silicate were induced by the sodium hydroxide during the
polymerization process. These silicates react with aluminum (Al) and form alumino-
silicate gels (Suppiah, et al., 2016).
Figure 11. Geopolymer fluid loss with different drilling fluids weight percent
70
75
80
85
90
95
0% 5% 10%
Flu
id L
oss
(m
l/30 m
in)
Drilling fluids weight percent

102
However, mixing drilling fluids with Portland cement resulted in a significant
increase on the fluid loss, more than 500 ml in 30 minutes when mixed with 10 percent of
drilling fluids weight percent. Figure 12 shows Portland cement fluid loss with different
drilling fluids weight percent. Increasing the weight percent of the drilling fluids lead to a
huge amount of fluid loss due to the water that was introduced to the mixture by drilling
fluids. In Portland cement, no sodium hydroxide is present, thus no reaction will occur
between the Portland cement and the bentonite, and since the drilling fluid is mainly
composed of water, the fluid loss volume will increase.
Figure 12. Portland cement fluid loss with different drilling fluids weight percent
4. CONCLUSION
Geopolymer has recently attracted attention because it is a cost-effective material
and has less environmental impacts compared to Portland cement. By studying the drilling
fluid contamination effects on geopolymer and Portland cement, it was observed that the
0
100
200
300
400
500
600
0% 5% 10%
Flu
id L
oss
(m
l/30 m
in)
Drilling fluids weight percent

103
drilling fluid with the geopolymer enhanced the geopolymer properties and undermine the
properties of Portland cement. The drilling fluids improved the injectivity of the
geopolymer without any significant effects on mechanical properties. In contrast, mixing
drilling fluids with Portland cement had a negative impact on the Portland cement
properties and reduced the compressive strength significantly. A summary of the
conclusion are listed below:
A slight decrease was observed in the cement slurries density when mixed with
drilling fluids in both materials, geopolymer and Portland cement. As the drilling
fluids weight percentage increased the density decreased slightly.
Drilling fluids concentrations are inversely proportional to the geopolymer viscosity.
As drilling fluids weight percent increased the viscosity of geopolymer decreased.
However, the viscosity increased rapidly as the amount of drilling fluid in Portland
cement slurry increased.
Drilling fluid improved the geopolymer injectivity.
Geopolymer showed higher compressive strength when exposed to drilling fluids
compared to Portland cement.
As the amount of drilling fluids increased, the compressive strength of geopolymer
was not significantly affected. However, increasing the amount of the drilling fluids
resulted in a significant decrease in the Portland cement strength.
Mixing drilling fluids with geopolymer reduced the fluid loss. However, Portland
cement fluid loss significantly increased when drilling fluids were introduced, which
could impact the cement slurry properties.

104
NOMENCLATURE
Vt = Volume of filtrate in ml.
t = Elapsed time in minutes.
psi = Pounds per square inch.
lb ⁄ gal = Pounds per gallon.
°C = Degree Celsius.
BWOC = By weight of cement.
Na2SiO3 = Sodium silicate
K2O3Si = Potassium silicate.
NaOH = Sodium hydroxide.
KOH = Potassium hydroxide.
PV = Plastic viscosity.
m = Mass of cement, gm, kg.
ρ = Gram per cubic centimeter, pounds per gallon.
LPLT = low pressure low temperature fluid loss test
AA = Alkaline activator.
FA = Fly ash.
SS = Sodium silicate.
SH = Sodium hydroxide.
CS = Compressive strength.

105
REFERENCES
Abdullah, Mohd Mustafa Al Bakri & Kamarudin, H & Binhussain, Mohammed & Razak,
Rafiza & Yahya, Zarina. (2012). Effect of Na2SiO3/NaOH Ratios and NaOH
Molarities on Compressive Strength of Fly-Ash-Based Geopolymer. Aci Materials
Journal. 109. 503-508.
Al-Bakari, A. M., Kareem, A., & Myint, S. (2012). Optimization of Alkaline Activator/Fly
Ash Ratio on the Compressive Strength of Fly Ash-Based Geopolymer. Kanger:
University Malaysia Perlis (UniMAP).
Alkhamis, M., & Imqam, A. (2018, August 16). New Cement Formulations Utilizing
Graphene Nano Platelets to Improve Cement Properties and Long-Term Reliability in
Oil Wells. Society of Petroleum Engineers. doi:10.2118/192342-MS.
Alzgoul, B. M. (2014). Reducing the cost of pumping high viscosity fluids for Jordanian
industry. International Journal of Academic Research, 6(2), 236-243.
doi:10.7813/2075-4124.2014/6-2/a.34.
American Coal Ash Association. (2003, June 13). Fly Ash Facts for Highway Engineers.
FHWA-IF-03-019.
API RP 10B-2, Recommended Practice for Testing Well Cements, second edition. 2012.
Washington, DC: API.
API Specification 10A/ISO 10426-1, Specification for Cements and Materials for Well
Cementing, Twenty-third Edition.
ASTM C 618, Standard Specification for Coal Fly Ash and Raw or Calcined Natural
Pozzolan for Use in Concrete, 100 Barr Harbour Dr. P.O. box C-700 West
Conshohocken, Pennsylvania United States.

106
Aughenbaugh, K., Nair, S. D., Cowan, K., & van Oort, E. (2014, September 10).
Contamination of Deepwater Well Cementations by Synthetic-Based Drilling Fluids.
Society of Petroleum Engineers. doi:10.2118/170325-MS.
Bakkali, H., Ammari, M., Frar, I., NaOH Alkali-Activated Class F Fly Ash: NaOH
molarity, Curing Conditions and Mass Ratio Effect. J. Mater. Environ. Sci. 2016.
Morocco. Vol.7 No.2 (397-401).
Bois, A.-P., Garnier, A., Galdiolo, G., & Laudet, J.-B. (2012, June 1). Use of a Mechanistic
Model To Forecast Cement-Sheath Integrity. Society of Petroleum Engineers.
doi:10.2118/139668-PA.
Bourgoyne, A. T., Millheim, K. K., Chenevert, M. E., & Young, F. S. (1991). Applied
drilling engineering. Richardson: Society of Petroleum Engineers.
Bradford, B.B.: "Setting Cement Plugs Requires Careful Planning", Oil & Gas Journal, pp.
102, 1982.
Davidovits, J. (1994, October). Properties of geopolymer cements. In First international
conference on alkaline cements and concretes (Vol. 1, pp. 131-149). Kiev State
Technical University, Ukraine: Scientific Research Institute on Binders and Materials.
Donham, F., & Young, S. (2009, January 1). High Performance Water Based Drilling
Fluids Design. Offshore Mediterranean Conference.
El-Sayed, A.A. H.: "Effect of Drilling Muds Contamination on Cement Slurry Properties",
Fourth Saudi Engineering Conference, pp. 287-295, 1995.
J. Davidovits: J. Mater. Education Vol. 16 (1994), p. 91-139.
Khalifeh, M., Saasen, A., Vralstad, T., & Hodne, H. (2014, April 2). Potential Utilization
of Geopolymers in Plug and Abandonment Operations. Society of Petroleum
Engineers. doi:10.2118/169231-MS.

107
Kong DLY, Sanjayan JG (2008). Damage behaviour of geopolymer composites exposed
to elevated temperature. Cement and Concrete Composites, Volume 30, Issue 10:
pg986–991.
Liu, X., Aughenbaugh, K., Lee, H., Nair, S., & Oort, E. van. (2017, April 3). Geopolymer
- Synthetic Based Mud Hybrid Cements for Primary Cementing and Lost Circulation
Control. Society of Petroleum Engineers. doi:10.2118/184558-MS.
Liu, X., Aughenbaugh, K., Nair, S., Shuck, M., & van Oort, E. (2016, September 14).
Solidification of Synthetic-Based Drilling Mud Using Geopolymers. Society of
Petroleum Engineers. doi:10.2118/180325-MS.
Morgan, B. E., & Dumbauld, G. K. (1952, September 1). Use of Activated Charcoal in
Cement To Combat Effects of Contamination by Drilling Muds. Society of Petroleum
Engineers. doi:10.2118/952225-G.
Murphy, W. C., & Smith, D. K. (1967, August 1). A Critique of Filler Cements. Society of
Petroleum Engineers. doi:10.2118/1753-PA.
Nasvi, M. C. M., Ranjith, P. G., & Sanjayan, J. (2012, January 1). Comparison of
Mechanical Behaviors of Geopolymer And Class G Cement As Well Cement At
Different Curing Temperatures For Geological Sequestration of Carbon Dioxide.
American Rock Mechanics Association.
Pang, X., Boul, P. J., & Cuello Jimenez, W. (2014, March 4). Nanosilicas as Accelerators
in Oilwell Cementing at Low Temperatures. Society of Petroleum Engineers.
doi:10.2118/168037-MS.
Salehi, S., Khattak, M. J., Ali, N., & Rizvi, H. R. (2016, March 1). Development of
Geopolymer-based Cement Slurries with Enhanced Thickening Time, Compressive
and Shear Bond Strength and Durability. Society of Petroleum Engineers.
doi:10.2118/178793-MS.

108
Suppiah, R. R., Rahman, S. H. A., Irawan, S., & Shafiq, N. (2016, November 12).
Development of New Formulation of Geopolymer Cement for Oil Well Cementing.
International Petroleum Technology Conference. doi:10.2523/IPTC-18757-MS.
UEHARA, M. (2010, March 03). New Concrete with Low Environmental Load Using the
Geopolymer Method. Retrieved from https://www.jstage.jst.go.jp/article/rtriqr/51/1/5-
1_1_1/_article.
Yong, Heah & Ming, Liew & Abdullah, Mohd Mustafa Al Bakri & Kamarudin, H. (2015).
Fire Resistant Properties of Geopolymers: A Review. Key Engineering Materials. 660.
39-43. 10.4028/www.scientific.net/KEM.660.39.

109
SECTION
4. CONCLUSIONS AND RECOMMENDATIONS
4.1. CONCLUSIONS
This thesis provides a novel development of fly ash class C based geopolymer to
be used in oil and gas wells. In first paper, different ratios were investigated. The selection
of the optimum formulation was based on five different tests, including rheology, density,
compressive strength, fluid loss test, and stability tests (sedimentation test and free fluid
test). Then, a comparison between the optimum mix design and Portland cement was done
using the same tests. The obtained results showed the following:
Sodium hydroxide concentrations are inversely proportional to the plastic viscosity;
as the sodium hydroxide concentrations increase, plastic viscosity has a slight
decrease.
Sodium hydroxide concentrations positively affect the compressive strength. As
sodium hydroxide concentrations increase, the compressive strength increases.
Increasing sodium silicate to sodium hydroxide ratios results in a decrease in fluid
loss.
Stability tests indicate that there is no free fluid and particle settling for the optimized
geopolymer.
The optimized geopolymer has a higher compressive strength than Portland cement.
The optimized geopolymer has a lower fluid loss than Portland cement after 30
minutes.

110
The optimum ratios of sodium silicate to sodium hydroxide, alkaline activator to
fly ash, and sodium hydroxide concentration were 1, 0.4, and 10 M, respectively. In the
second paper of this thesis, the effect of drilling fluids on geopolymer and Portland cement
has been investigated. By studying the drilling fluid effects on geopolymer and Portland
cement, it was observed that mixing the drilling fluid with the geopolymer enhanced the
rheological performance of geopolymer without a significant impact on its mechanical
performance. A summary of the conclusions is listed below:
A slight decrease occurred in the cement slurry density when mixed with drilling
fluids in both materials, geopolymer and Portland cement.
Drilling fluid concentrations are inversely proportional to the geopolymer viscosity.
As the drilling fluids’ weight percent increased, the viscosity of geopolymer
decreased. However, the viscosity increased rapidly as the amount of drilling fluid in
Portland cement slurry increased.
Drilling fluid improved the geopolymer injectivity.
Geopolymer showed higher compressive strength when exposed to drilling fluids
compared to Portland cement.
As the amount of drilling fluids increased, the compressive strength of geopolymer
was not significantly affected. However, increasing the amount of the drilling fluids
resulted in a significant decrease in the Portland cement strength.
Mixing drilling fluids with geopolymer reduced the fluid loss; however, Portland
cement fluid loss significantly increased when drilling fluids were introduced.

111
4.2. RECOMMENDATIONS
In this work, geopolymer and Portland cement were studied to better understand
the behavior of these materials. Regarding geopolymer, this research studied the effect of
the ratios of sodium silicate to sodium hydroxide, alkaline activator to fly ash, and sodium
hydroxide concentrations on geopolymer properties. The following tests are recommended:
1. Testing thickening time for both materials, geopolymer and Portland cement.
2. Testing both materials using different curing temperatures and pressures to simulate
the downhole conditions.
3. Measuring the tensile strength to examine the mechanical properties for both
materials.
4. Measuring the Young’s modulus and Poisson’s ratio to understand the elastic
behavior of both materials.
5. Investigating the effect of carbon dioxide (CO2) on geopolymer at different
temperatures and different pressures.

112
BIBLIOGRAPHY
Al-Bakari, A. M., Kareem, A., & Myint, S. (2012). Optimization of Alkaline Activator/Fly
Ash Ratio On The Compressive Strength Of Fly Ash-Based Geopolymer. Kanger:
University Malaysia Perlis (UniMAP).
Alkhamis, Mohammed Mousa M., "New wellbore-integrity classification for gas migration
problems and new cement formulations using Graphene Nano Platelets to prevent gas
migration through cement" (2018). Masters Theses. 7751. http://scholarsmine.mst.e-
du/masters_theses/7751
Alkhamis, M., & Imqam, A. (2018, August 16). New Cement Formulations Utilizing
Graphene Nano Platelets to Improve Cement Properties and Long-Term Reliability in
Oil Wells. Society of Petroleum Engineers. doi:10.2118/192342-MS.
Amani, M., Al-Jubouri, M., & Shadravan, A. (2012). Comparative Study of Using Oil-
Based Mud Versus Water-Based Mud in HPHT Fields. Advances in Petroleum
Exploration and Development, 4(2), 18-27. Available from: http://www.cscanada.
net/index.php/aped/-article/view/j.aped.1925543820120402.987 DOI: http://dx.doi.or-
g/10.3968/j.aped.19255-43820120402.987.
American Petroleum Institute, API BULLETIN E3: Well Abandonment and Inactive Well
Practices for U.S. Exploration and Production Operations, American Petroleum
Institute, 1993.
An Introduction to Viscosity and Rheology. (2010, March 04). Retrieved August 05, 2017,
from https://www.atascientific.com.au/introduction-viscosity-rheology.
ASME Shale Shaker Committee. (2005). Drilling Fluids Processing Handbook. Elsevier.
Retrieved from https://app.knovel.com/hotlink/toc/id:kpDFPH0003/drilling-fluids-
proce-ssing/drilling-fluids-processing.
Atashnezhad, A., Coryell, T., & Hareland, G. (2017, March 27). Barite Nanoparticles
Reduce the Cement Fluid Loss. Society of Petroleum Engineers. doi:10.2118/185114-
MS.

113
B. Glazer, C. Graber, C. Roose, P. Syrett and C. Youssef, "Fly Ash in Concrete,"
Perkins+Will, 2011.
Badugunnala,, H. (2017, April 05). What is geopolymer concrete? Retrieved from
https://www.quora.com/What-is-geopolymer-concrete.
Berry, M., Cross, D., Stevens, J. (2009). “Changing the Environment: An Alternative
“Green” Concrete Produced without Portland cement.” Montana State University,
Bozeman, MT.
Bourgoyne, A. T. (1991). Applied drilling engineering. Richardson, TX: Society of
Petroleum Engineers.
Boxley, C., & Mckelvie, J. (2012, July 25). Patent EP2477480A2 - Environmentally-
friendly animal litter. Retrieved from https://www.google.com/patents/EP2477480A-
2?cl= en.
Carpenter, C. (2014, May 1). Stinger or Tailpipe Placement of Cement Plugs. Society of
Petroleum Engineers. doi:10.2118/0514-0147-JPT.
Cement composition and classification. (n.d.). Retrieved August 03, 2017, from
http://petrowiki.org/Cement_composition_and_classification.
Cement. (n.d.). Retrieved July 05, 2017, from https://www.britannica.com/technology/
cement-building-material.
Cementing Technology. (1984). London: Nova Communications.
Cho, H., Shah, S. N., & Jeong, Y.-T. (2002, January 1). Developed Wellbore Abandonment
Grout with Fly Ash. Offshore Technology Conference. doi:10.4043/14283-MS.

114
Consistometers | Worlds Fastest Shipping. (n.d.). Retrieved July 08, 2018, from https://ce-
menttestequipment.com.
DeBruijn, G. (2017, May 1). Technology Focus: Cementing/Zonal Isolation (May 2017).
Society of Petroleum Engineers. doi:10.2118/0517-0078-JPT.
Denney, D. (2012, May 1). More-Effective Plug-and-Abandonment Cementing Technique.
Society of Petroleum Engineers. doi:10.2118/0512-0132-JPT.
Dharmadhikari , M., & Harris, T. (n.d.). Preparing Standard Sodium Hydroxide Solution*.
Retrieved August 06, 2017, from https://www.extension.iastate.edu/wine/preparing-
standard-sodium-hydroxide-solution.
E. B. Nelson and D. Guillot, Well Cementing, Second Edition, Schlumberger, 2006.
Effendi S. (2005, October 10). Drilling Fluid Test on Field. Retrieved August 06, 2017,
from http://petro-leumsupport.com/drilling-fluid-test-on-field.
Environmental Guidance Document: Well Abandonment and Inactive Well Practices for
U.S. Exploration and Production Operations.
Equipment, U. M. (n.d.). Length Change (Shrinkage and Expansion) - Lenght Change
(Shrinkage and Expansion). Retrieved August 01, 2017, from
http://www.utest.com.tr/en/ 23355/Length-Change-Shrinkage-And-Expansion.
Faqir, N. M., Elkatatny, S., Mahmoud, M., & Shawabkeh, R. (2016, November 7).
Development of New Geopolymer Material as Alternative Plug for Cement in CO2
Sequestration. Society of Petroleum Engineers. doi:10.2118/183492-MS.
GRAVEL & SAND CO. (n.d.). Portland Cement. Retrieved August 06, 2017, from
http://www.njgravelsand.com-/products/portland-cement.

115
HAR INTERNATIONAL PRIVATE LIMITED. (n.d.). Indian Portland Cement - Buy
Portland Cement,Bulk Portland Cement Prices,Ordinary Portland Cement Product on
Alibaba.com. Retrieved August 06, 2017, from https://www.alibaba.com/product-
detail/Indian-Portland-cement_50034911536.html.
Hart, Robert A., Svedeman, Steven J. and Viana, Flavia. 2007. FALL VELOCITY OF
SYNTHETIC-BASED DRILLING FLUIDS IN SEAWATER. Report prepared for
Minerals Management Service. March 2007. SwRI Project No. 18.12210.
Khalifeh, M., Hodne, H., Saasen, A., Integrity, O., & Eduok, E. I. (2016, October 25).
Usability of Geopolymers for Oil Well Cementing Applications: Reaction
Mechanisms, Pumpability, and Properties. Society of Petroleum Engineers.
doi:10.2118/182354-MS.
Khalifeh, M., Saasen, A., Vralstad, T., & Hodne, H. (2014, April 2). Potential Utilization
of Geopolymers in Plug and Abandonment Operations. Society of Petroleum
Engineers. doi:10.2118/169231-MS.
Khalifeh, M., Saasen, A., Vrålstad, T., Larsen, H. B., & Hodne, H. (2015, September 8).
Cap Rock Restoration in Plug and Abandonment Operations; Possible Utilization of
Aplite-Based Geopolymers for Permanent Zonal Isolation and Well Plugging. Society
of Petroleum Engineers. doi:10.2118/175457-MS.
Kong DLY, Sanjayan JG (2008). Damage behaviour of geopolymer composites exposed
to elevated temperature. Cement and Concrete Composites, Volume 30, Issue 10:
pg986–991.
Length Change (Shrinkage And Expansion), Physical and Chemical Properties, UTEST
MATERIAL TESTING EQUIPMENT. http://www.utest.com.tr/en/23355/Length-
Change-Shrinkage-And-Expansion.
Liu, X., Aughenbaugh, K., Lee, H., Nair, S., & Oort, E. van. (2017, April 3). Geopolymer
- Synthetic Based Mud Hybrid Cements for Primary Cementing and Lost Circulation
Control. Society of Petroleum Engineers. doi:10.2118/184558-MS.
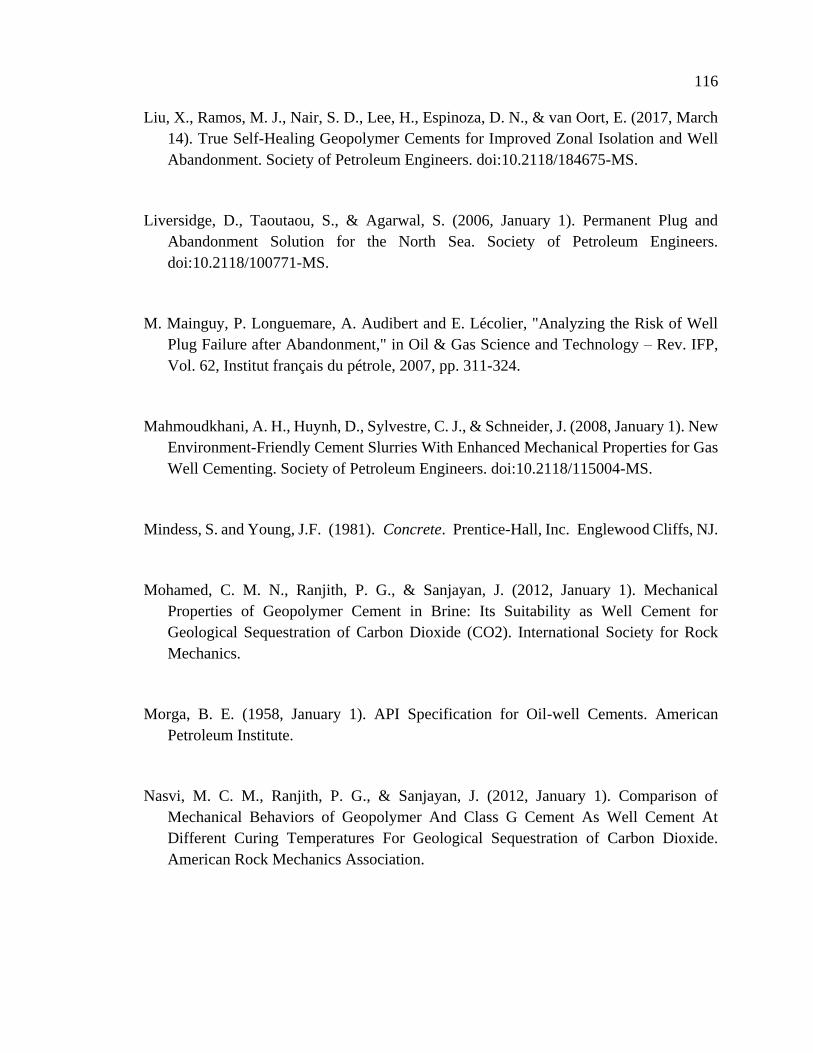
116
Liu, X., Ramos, M. J., Nair, S. D., Lee, H., Espinoza, D. N., & van Oort, E. (2017, March
14). True Self-Healing Geopolymer Cements for Improved Zonal Isolation and Well
Abandonment. Society of Petroleum Engineers. doi:10.2118/184675-MS.
Liversidge, D., Taoutaou, S., & Agarwal, S. (2006, January 1). Permanent Plug and
Abandonment Solution for the North Sea. Society of Petroleum Engineers.
doi:10.2118/100771-MS.
M. Mainguy, P. Longuemare, A. Audibert and E. Lécolier, "Analyzing the Risk of Well
Plug Failure after Abandonment," in Oil & Gas Science and Technology – Rev. IFP,
Vol. 62, Institut français du pétrole, 2007, pp. 311-324.
Mahmoudkhani, A. H., Huynh, D., Sylvestre, C. J., & Schneider, J. (2008, January 1). New
Environment-Friendly Cement Slurries With Enhanced Mechanical Properties for Gas
Well Cementing. Society of Petroleum Engineers. doi:10.2118/115004-MS.
Mindess, S. and Young, J.F. (1981). Concrete. Prentice-Hall, Inc. Englewood Cliffs, NJ.
Mohamed, C. M. N., Ranjith, P. G., & Sanjayan, J. (2012, January 1). Mechanical
Properties of Geopolymer Cement in Brine: Its Suitability as Well Cement for
Geological Sequestration of Carbon Dioxide (CO2). International Society for Rock
Mechanics.
Morga, B. E. (1958, January 1). API Specification for Oil-well Cements. American
Petroleum Institute.
Nasvi, M. C. M., Ranjith, P. G., & Sanjayan, J. (2012, January 1). Comparison of
Mechanical Behaviors of Geopolymer And Class G Cement As Well Cement At
Different Curing Temperatures For Geological Sequestration of Carbon Dioxide.
American Rock Mechanics Association.

117
Neff, J.M., S. McKelvie and R.C. Ayers, Jr. 2000. Environmental impacts of synthetic
based drilling fluids. Report prepared for MMS by Robert Ayers & Associates, Inc.
August 2000. U.S. Department of the Interior, Minerals Management Service, Gulf of
Mexico OCS Region, New Orleans, LA. OCS Study MMS 2000-064. 118 pp.
O. (n.d.). Filter Press. Retrieved July 31, 2018, from http://www.ofite.com/products/drill-
ing-fluids/product/560-filter-press-low-pressure-bench-mount-with-co2-pressure-
assembly.
OFI Testing Equipment, Inc. (n.d.). Filter Press, Low Pressure, Bench Mount, with
Nitrogen Regulator and Cylinder. Retrieved July 05, 2017, from
http://www.ofite.com/products/drilling-fluids/product/564-filter-press-low-pressure-
bench -mount-with-nitrogen-regulator-and-cylinder.
OFI Testing Equipment, Inc. (n.d.). Pressurized Fluid Density Scale. Retrieved July 05,
2017, from http://www.-ofite.com/products/product/10-pressurized-fluid-density-
scale.
Oil viscosity. (n.d.). Retrieved August 03, 2017, from http://petrowiki.org/Oil_viscosity.
Olli, D. (2009, May 9). Comparison of the characteristics of bottom ash and fly ash from a
medium-size (32 MW) municipal district heating plant incinerating forest residues and
peat in a fluidized-bed boiler. Retrieved from http://www.sciencedirect.com/science/
article/pii/S0378382009001088?showall%3Dtrue%26via%3Dihub.
Portland Cement. (n.d.). Retrieved August 01, 2017, from http://www.pavementinter
active. org/portland-cement.
Prentice-Hall, Inc. (n.d.). Acids and Bases. Retrieved August 01, 2017, from
http://wps.prenhall.-com/wps/media/-objects/476/488316/ch14.html.
R. (n.d.). Filter Press API. Retrieved July 31, 2018, from http://www.rigchina.com/produ-
cts/Filter_Press_API_N2Task_en.htm.

118
Rahman F., 2018. Manufacture of Cement- Materials and Manufacturing Process of
Portland Cement. The Constructor Civil Engineering Home.
Rheology . (n.d.). Retrieved July 20, 2017, from http://people.sju.edu/~phabdas/ phys-
ics/rheo.html.
Rheology and Viscosity. (n.d.). Retrieved July 05, 2017, from https://www.malvern.-
com/en/pro-ducts/measurement-type/rheology-viscosity.
Ridha, S., & Yerikania, U. (2015, October 20). New Nano-Geopolymer Cement System
Improves Wellbore Integrity Upon Acidizing Job: Experimental Findings. Society of
Petroleum Engineers. doi:10.2118/176419-MS.
Saasen, A., Fjelde, K. K., Vralstad, T., Raksagati, S., & Moeinikia, F. (2013, May 6). Plug
and Abandonment of Offshore Exploration Wells. Offshore Technology Conference.
doi:10.4043/23909-MS.
Salehi, S., Ali, N., Khattak, M. J., & Rizvi, H. (2016, September 26). Geopolymer
Composites as Efficient and Economical Plugging Materials in Peanuts Price Oil
Market. Society of Petroleum Engineers. doi:10.2118/181426-MS.
Salehi, S., Ezeakacha, C. P., & Khattak, M. J. (2017, March 27). Geopolymer Cements:
How Can You Plug and Abandon a Well with New Class of Cheap Efficient Sealing
Materials. Society of Petroleum Engineers. doi:10.2118/185106-MS.
Salehi, S., Khattak, M. J., Ali, N., & Rizvi, H. R. (2016, March 1). Development of
Geopolymer-based Cement Slurries with Enhanced Thickening Time, Compressive
and Shear Bond Strength and Durability. Society of Petroleum Engineers.
doi:10.2118/178793-MS.
Santos, O. L., & Ribeiro, P. R. (2017, May 17). An Overview of Deepwater Well Integrity
Developments After the Blowout of Macondo. Society of Petroleum Engineers.
doi:10.2118/185599-MS.

119
Smith, D. K. (1993). Handbook on well plugging and abandonment. Tulsa, OK: PennWell
Books.
Sugumaran, M. (2015, October 20). Study on Effect of Low Calcium Fly Ash on
Geopolymer Cement for Oil Well Cementing. Society of Petroleum Engineers.
doi:10.2118/176454-MS.
Suppiah, R. R., Rahman, S. H. A., Irawan, S., & Shafiq, N. (2016, November 12).
Development of New Formulation of Geopolymer Cement for Oil Well Cementing.
International Petroleum Technology Conference. doi:10.2523/IPTC-18757-MS.
Tolhurst, L. (2015, September 14). Commercial Recovery of Metals From Coal Fly Ash.
Retrieved August 01, 2017, from http://cornerstonemag.net/commercial-recovery-of-
metals-from-coal-fly-ash.
Triaxial Test. (2010, October 10). Retrieved July 05, 2017, from http://www.geotechdata.
info/geotest/triaxial-test.html.
United Nations Environment Programme. (n.d.). Retrieved from https://na.unep.net/geas-
/science/alert_2010_10.php.
Vicat Apparatus. Retrieved July 31, 2018, from https://www.indiamart.com/proddetail-
/vicat-apparatus-16579559530.html.
Vicat Group. (n.d.). Retrieved July 11, 2017, from http://www.vicat.com.
Vrålstad, T., Todorovic, J., Saasen, A., & Godøy, R. (2016, April 20). Long-Term Integrity
of Well Cements at Downhole Conditions. Society of Petroleum Engineers.
doi:10.2118/180058-MS.
ZEAL. (n.d.). Cement Testing Equipment. Retrieved July 16, 2017, from http://www.-
zealinternational.in/cement-testing-equipment.html.

120
VITA
Mohamed Saad Mohamed Ahdaya was born in Tripoli, Libya, in December 1988.
He received his bachelor’s degree in petroleum engineering from University of Tripoli,
Tripoli, Libya, in 2012. He started at Missouri University of Science and Technology
during the summer semester of 2016. He earned the best graduate student research poster
among the Geoscience and Geology and Petroleum Engineering award in 2018. He
received his Master of Science degree in Petroleum Engineering from Missouri University
of Science and Technology in December 2018.