Embed Size (px)
Citation preview

The Effect of Director Expertise on
Acquisition Performance
Anahit Mkrtchyan*
Pennsylvania State University
Job market paper
October 29, 2012
Abstract
Corporate boards contribute to firm value by providing oversight and advice during major
strategic decisions such as acquisitions. This study posits that boards’ effectiveness in evaluating
these strategic events can be enhanced by directors’ prior experience in acquisitions. I find that
outside directors’ prior involvement in acquisitions is associated with a significant increase in
acquisition announcement returns. Further analysis identifies two potential channels for this
effect. First, firms with higher board acquisition expertise are better at target selection: they
choose targets with higher synergies and are more likely to avoid large loss acquisitions. Second,
firms with higher board acquisition expertise negotiate more effectively, by securing higher
relative gains. Overall, the results demonstrate that outside directors with relevant experience can
improve the quality of a firm’s strategic decision-making.
*Department of Finance, Smeal College of Business, Penn State University, University Park, PA 16802. E-mail
address: [email protected]. Fax: 814-865-3362. I thank James Conklin, Moussa Diop, Laura Field, Peter Iliev, Yelena
Larkin, Michelle Lowry, Karl Muller, Zhan Shi, Jess Smith, Jianing Zhang, and the participants of a workshop at
Penn State University for helpful comments.
1
1. Introduction
Boards of directors play a crucial role in corporate control and decision-making. In a
survey of directors by Demb and Neubauer (1992), seventy-five percent report involvement in
setting strategy, while forty-five percent of directors indicate involvement in oversight of
management. When asked how they spend their time in board meetings, directors report that they
spend more time on discussion of acquisitions than on any other strategic issue (Korn/Ferry
International, 1999). This is hardly surprising, given that acquisitions are among the most
significant investment projects that firms undertake, often enabling firms to drastically increase
their size in a matter of months. On average, acquisitions generate a zero abnormal return for
acquiring shareholders at the announcement, however, some acquisitions severely destroy
shareholder value.1 Moeller, Schlingemann, and Stulz (2005) show that, in a few large loss deals
in the late 1990s, acquiring shareholders lost a total of $397 billion, or, on average, $2.31 per
dollar spent on acquisition. In addition to these large effects on shareholder value, acquisitions
also have a great impact on the economy as a whole. Over the past two decades, the value of
acquisitions announced by U.S. acquirers, on average, was about 10 percent of GDP and nine
percent of total stock market capitalization.
Given the significance of acquisitions and the important role played by the boards in
these strategic events, this paper examines whether outside directors’ prior acquisition
experience enhances board effectiveness and improves the quality of a firm’s acquisitions.
Through prior acquisitions, directors gain first-hand experience and accumulate valuable insights
about negotiation strategies, legal and regulatory issues surrounding acquisitions, latest industry
developments, synergies assessment, and post-acquisition integration of an acquired firm. In this
paper, I conjecture that such experience will lead to better acquisition performance for firms on
1 See e.g. survey by Betton, Eckbo, and Thornburn (2008).

2
which boards these experienced directors serve. Recent press releases on director appointments
demonstrate that directors’ acquisition experience is perceived as valuable: From IA Global
Inc.’s President upon appointment of a director: “We are pleased to have Masazumi Ishii join the
board of directors. He brings extensive experience in mergers and acquisitions…”; Rayonier
Corp’s chairman and CEO’s commenting on the appointment of a director James H. Miller
states: “His broad experience in acquisitions, energy markets and public policy will be a valuable
addition to our board.”2 In a recent study that demonstrates the importance of acquisition
experience, Harford and Schonlau (2012) find that CEOs and directors participating in
acquisitions hold more directorships in the future.
This paper examines the relationship between board acquisition experience and
subsequent firm acquisition performance. Board acquisition experience is measured using two
metrics. First, I use a count of all acquisitions in other firms in which outside directors were
previously involved. Second, I use the percent of outside directors with acquisition expertise.3
Using a broad sample of firms conducting acquisitions from 1996 to 2011, I find that firms with
higher levels of boards’ acquisition experience earn higher acquisition announcement returns.
This effect is statistically and economically significant: a one standard deviation increase in the
number of board’s prior acquisitions increases average acquisition announcement returns by
about 1.7 times and translates into a $51 million gain in shareholder value based on average
bidder market capitalization.
Having documented that higher board acquisition experience leads to higher acquisition
announcement returns, this study seeks to identify the mechanisms through which board
acquisition experience affects acquisition performance. First, I examine the role of outside
2 See PR Newswire, 19 July 2006; Business Wire, 3 October, 2011.
3 The findings are robust to alternative specifications of the board acquisition experience measure, as further
discussed in section 6.1.

3
directors’ prior acquisition experience in target selection, and then I explore the role of
experienced directors in deal negotiations.
Selecting an appropriate target is arguably one of the most important decisions acquiring
firms make. Yet, as acknowledged by Bao and Edmans (2011), CEOs do not make acquisitions
very often and typically lack relevant experience. Prior literature also shows that overconfident
CEOs may make value-destroying acquisitions, because they overestimate potential synergies
and overpay for the targets (Malmendier and Tate (2008), Roll (1986)). Having outside directors
with acquisition experience can mitigate CEOs’ inexperience and overconfidence. Experienced
directors can assess synergies more accurately and are more likely to probe and challenge
overoptimistic assumptions about growth and cost-savings proposed by management. Firms with
higher levels of board experience, therefore, will be more selective in their acquisition decisions
and will tend to choose targets with which the bidder has higher synergies. Experienced directors
may also better recognize the long-term implications and potential risks of the proposed
acquisition, thus helping managers avoid acquisitions which generate particularly negative
market reactions or which result in extremely large losses for the shareholders.
To examine the effect of board experience in target selection, I first test whether firms
with experienced directors are less likely to make problematic acquisitions. I find that firms with
greater board acquisition experience are likely to avoid bids with especially negative market
reactions, as well as bids generating extremely large dollar losses. Second, I test the relationship
between board acquisition experience and value-weighted combined target and acquirer
announcement returns, which represent the market’s assessment of the total merger gains. I find
that board acquisition experience is positively associated with the combined announcement
returns, suggesting that experienced directors assist the CEO to select better targets. A one

4
standard deviation increase in the number of board’s prior acquisitions increases the mean
combined acquisition announcement return by 41%.
A second venue through which an experienced board can aid in better acquisition
performance is at the negotiation stage. As suggested by studies in the negotiations literature,
more experienced negotiators can earn higher profits and are more likely to achieve preferred
outcomes than those less experienced. Experienced negotiators make lower offers, use less
concessionary negotiation strategies, and are better able to anticipate other party’s behavior.4
Thus, I propose that firms with experienced directors can negotiate acquisitions better by
securing a larger fraction of the merger gains. The results, in fact, show that experienced
directors are better negotiators: firms with higher board acquisition experience secure a larger
share of takeover gains. A one standard deviation increase in the number of board’s prior
acquisitions increases the mean acquirer’s relative gain by 17%.
The empirical evidence presented thus far demonstrates that the acquisition experience of
outside directors enhances the quality of firms’ strategic decisions. However, a potential concern
of the analysis is that the positive association found between board experience and acquisition
performance could be driven by non-random director-firm matching. For example, unobservable
bidder traits could simultaneously determine the presence of directors with acquisition
experience and higher acquisition announcement returns. I address this concern in two ways.
First, I restrict my analysis to outside directors who have no acquisition experience prior to
joining the board, but gain acquisition experience afterwards. Clearly, such directors are not
recruited for their acquisition expertise – they garner such expertise after joining the board.
Using this alternative measure of board acquisition experience, I also find a positive effect of
4 E.g. Thompson (1990a; 1990b), Bazerman, Magliozzi, and Neale (1985), Neale and Northcraft (1986), Neale,
Huber, and Northcraft (1987), Montgomery and Benedict (1989).

5
board expertise on acquisition performance. Second, I find that board acquisition expertise has a
stronger effect on acquisition performance in firms with lower levels of CEO acquisition
experience. This suggests that board expertise is especially valuable when it is needed most,
providing further evidence that the results are not driven by selection.
This paper expands our knowledge about the role of outside directors in strategic
decision-making and is related to the large corporate governance literature on the board of
directors (see for example survey by Adams, Hermalin, and Weisbach (2010)). In particular, this
study is related to the emerging literature focusing on how outside directors with specific
expertise, such as knowledge of foreign operations, financial and industry expertise, can add firm
value (e.g. Daniel, McConnell, and Naveen (2011), Xie, Davidson, and DaDalt (2003), Dass,
Kini, Nanda, Onal, and Wang (2011), Faleye, Hoitash, and Hoitash (2012)). However, rather
than focusing on overall firm performance, which depends on a wide array of organizational and
environmental factors, this study examines a specific situation in which the role played by
directors is especially likely to be consequential. In this respect, this paper complements a study
by Huang, Jiang, Lie and Yang (2011), which finds that directors with investment bank
experience affect positively a firm’s acquisition experience. In this paper I show that directors,
who transfer acquisition knowledge across companies, enable the acquiring firm to conduct
better acquisitions and avoid problematic ones.
This paper is also related to studies examining the link between the negotiation process
and merger outcomes (e.g. Ahern (2012), Hotchkiss, Qian, and Song (2005), Boone and
Mulherin (2007), Aktas, de Bodt, and Roll (2010)). By examining the role of boards’ prior
experience in the negotiation process, I show that board experience enables the acquirer to
capture a greater share of the acquisition gains.
6
The remainder of this paper is organized as follows: Section 2 provides descriptive
statistics of the sample, describes measures of board acquisition experience and discuses
construction of the explanatory variables. Section 3 presents empirical evidence on the
relationship between boards’ acquisition experience and acquisition performance. Section 4
addresses the non-random director-firm matching. Section 5 explores the channels through which
boards’ acquisition experience contribute to better acquisition performance, by focusing on target
selection and deal negotiations. Section 6 discusses robustness tests and Section 7 concludes.
2. Data and Descriptive Statistics
2.1. Sample Description
The sample includes all acquisitions announced by Standard and Poor’s (S&P) 1500
firms between January 1, 1996 and December 31, 2011.5 Acquisitions are identified using
Thomson One’s Mergers and Acquisitions database. The sample includes completed acquisitions
of private, public and subsidiary targets and excludes buybacks, recapitalizations and exchange
offers. Consistent with prior studies, I require that the acquirer obtains at least 51% of the target
shares (e.g. Fuller, Netter, and Stegemoller (2002), Masulis, Wang, and Xie (2007), Moeller et
al. (2005), Malmendier and Tate (2008)). Furthermore, to ensure that the board is likely to be
involved in the acquisition decision, the sample includes only acquisitions that represent at least
1% of the acquirer’s market value, measured at the fiscal year end before the announcement.6
Following previous studies on outside directors, I exclude financial firms (SIC codes 6000-6999)
and utilities (SIC codes 4000-4999), as these firms tend to have different corporate governance
structures than non-regulated firms (Engel, Hayes, and Wang (2010), Yermack (2004)).
5 The sample is restricted to S&P 1500 firms, as IRRC/Risk Metrics Directors database, which is used to obtain
information about the board of directors, as described further, covers only S&P 1500 firms. 6 The results are robust, if a 5% cut-off is used instead.

7
To obtain information on board size, board independence, directors’ age, tenure, and
other directorships, I use the IRRC/Risk Metrics Directors database, which covers S&P 1500
firms. This database is also used to obtain data on CEO tenure, as well as the CEO’s and other
inside directors’ other prior and current directorships. While the IRRC/Risk Metrics database
starts coverage in 1996, it provides information about the start date for directors, even if the start
date is before the year IRRC/Risk Metrics begins to cover the firm. To identify employment
histories of outside and inside directors, I use the Execucomp database, which similarly covers
S&P 1500 firms.
I require that bidders have available stock prices in the Center for Research in Security
Prices (CRSP) database, accounting information in Compustat, and information on anti-takeover
provisions in Risk Metrics Governance database. The data availability requirements lead to a
final sample of 1,894 acquisitions completed by 890 firms.
2.2. Measures of Acquisition Experience
To capture acquisition experience of outside directors at the individual level, I use the
cumulative number of prior acquisitions in which a director participated as a manager or a
director of another firm in the past ten years.7 I focus on directors’ experience in acquisitions
made by other firms to isolate director experience from that of the CEO and the firm conducting
the acquisition in question. In particular, for each director at a given firm and at a given year, I
identify other S&P 1500 firms in which the director currently or previously served on the board.
I then identify all prior acquisitions conducted by these firms during the director’s tenure, using
ThomsonOne’s Mergers database. Similarly, using the Execucomp database, I identify firms that
7 For robustness, the analysis is repeated without time restriction on past acquisition experience. The results are
unchanged. I also examined how discounting the acquisition experience influences my results, by applying linear,
quadratic and square root discounting. The results remain very similar.

8
have currently or previously employed the director and obtain all prior acquisitions conducted by
these firms during the director’s employment from ThomsonOne’s Mergers database.8
I use two measures to aggregate director-level experience. The first measure, entitled
“number of board’s prior acquisitions”, sums the number of acquisitions in which outside
directors previously participated as managers or directors of other firms. Panel A of Table 1
shows that the mean (median) number of board’s prior acquisitions is 10.0 (7.0). The mean
(median) number of prior acquisitions made by CEOs is 3.78 (3.00), and the mean (median)
number of acquisitions made by firms is 2.76 (2.00).
Although cumulative count of boards prior acquisitions represents a simple and intuitive
measure, it does not distinguish between boards in which acquisition experience is spread among
several directors and boards in which acquisition experience is concentrated in just a few
directors. For example, a board with five outside directors, who are each involved in two
acquisitions will have the same number of prior acquisitions as a board with two directors, who
are each involved in five prior acquisitions. For directors who have previously participated in
acquisitions of other firms the median number of acquisitions is three. Thus, I construct a second
measure, called “percent of acquisition experts”, measured as the number of outside directors
with more than three prior acquisitions divided by the total number of outside directors.9 As can
be seen from Panel A of Table 1, the mean (median) percentage of acquisition experts is 13%
(11%). Most of the acquisitions (87%) have at least one director with prior acquisition
experience and slightly more than half of acquisitions (57%) have at least one acquisition expert.
8 Execucomp database provides information on the compensation of up to nine top executives of S&P1500 firms, as
well as the year in which a person has joined the firm. 9 For robustness, I also use five acquisitions (i.e. top quartile number of acquisitions for directors with acquisition
experience), the results remain very similar.

9
2.3. Control Variables
Prior literature has shown that bidder characteristics and deal types affect acquisition
announcement returns ((e.g. Fuller et al. (2002), Moeller, Schlingemann, and Stulz (2004),
Asquith, Bruner, and Mullins (1983), Jensen (1986), Lang, Stulz, and Walkling (1991), Shleifer
and Vishny (2003)). Thus, to control for bidder characteristics, I include firm size, M/B,
leverage, free cash flow, and stock run-up. The controls for deal characteristics include method
of payment, target’s public status, relative deal size, industry relatedness of the acquisition, deal
attitude, and whether the bidder and the target are both from high tech industries.
Prior literature has also shown that firms with higher anti-takeover provisions experience
have lower acquisition announcement returns (Masulis et al. (2007)). Thus, I include the E-index
created by Bebchuk, Cohen, and Ferrell (2009), which is a more parsimonious version of the
anti-takeover index created by Gompers, Ishii, and Metrick (2003). This index is based on the six
provisions considered to be most important from a legal standpoint and which are shown to have
a stronger association with firm value and bidder returns, than the G-index (Bebchuk et al.
(2009), Masulis et al. (2007)).10
To further control for differences in the corporate governance of
acquiring firms, I include board size, CEO tenure, CEO/Chairman duality, and board
independence, as these variables have been shown to influence how effectively a board functions
(e.g. Yermack (1996) Weisbach (1988), Brickley, Coles, and Terry (1994), Byrd and Hickman
(1992)).
To capture the CEO’s and other inside directors’ acquisition experience, I include the
number of prior acquisitions in which the CEO and inside directors were involved as a current or
previous manager or a director. Additionally, to capture the firm’s acquisition experience, I
10
The index is constructed as a sum of six anti-takeover provisions. Higher values of the index indicate more anti-
takeover provisions (Bebchuk et al. (2009))

10
include the number of acquisitions completed by the firm.11
Similar to the measures of board
acquisition experience, I restrict the CEO’s, other insiders’ and a firm’s acquisition experience to
the past ten years.12
Another factor that can potentially influence acquisition performance is managerial
quality, as high quality CEOs can make more profitable acquisitions (Morck, Shleifer, and
Vishny (1990)). Thus, I follow Morck et al. (1990) and proxy for bidder CEO quality by
industry-adjusted operating performance over the three years prior to the acquisition
announcement.
Furthermore, it is possible that directors with acquisition experience are also better
qualified more generally, due to their professional experience or personal characteristics. To
isolate the effects of directors’ acquisition experience from the general director quality, I include
median director age, median director tenure, and the percent of busy directors (i.e. directors
serving on three or more boards). To account for potentially unobserved variation, all regressions
include year and industry dummies, where industries are classified using the 12 industry
classification scheme of Fama and French.13
Detailed definitions of all variables are in the
Appendix.
Panel B of Table 1 presents summary statistics of the control variables. As Risk Metrics
covers S&P 1500 firms, sample firms are relatively large. For example, the mean (median) book
value of total assets is $5.40 ($1.61) billion, while the mean (median) market value of equity is
11
As the number of CEOs’ prior acquisitions is highly correlated with the number of a firm’s prior acquisitions, as a
robustness check, I orthogonalize firm experience with respect to CEO experience, and use the orthogonalized
variable instead. The results remain very similar. 12
The results are similar if no restriction is placed on the CEO’s, other insiders’ and a firm’s experience. 13
The results are robust to alternative definitions of industry, such as 48 Fama French industries (1997). The results
are reported based on 12 Fama French industries, due to a significant loss of observations in logistic regressions, if
48 Fama-French industry classification is used instead. The Fama-French industries are defined on French’s
website, (http://mba.tuck.dartmouth.edu/pages/faculty/ken.french/data library.html).

11
$8.49 ($2.04) billion. The mean (median) firm has a market-to-book ratio of 2.17 (1.72), and
leverage of 12% (9%).
Turning to deal characteristics, about a third of the acquisitions represent those of public
targets. The mean (median) relative deal size for the overall sample is 13% (6%). Forty-eight
percent of deals are all-cash, 29% are diversifying acquisitions, and 23% of are high-tech. Both
firm and deal characteristics are comparable with those reported by Masulis et al. (2007), who
examine a sample of acquisitions made by S&P 1500 firms over the period 1990 to 2003.
Panel C of Table 1 reports that acquisitions generated positive announcement returns on
average. The mean (median) five-day acquisitions announcement return is 0.35% (0.40%), which
is significantly different from zero at a 5% (1%) level. The mean (median) combined value-
weighted bidder-target acquisitions announcement return is 1.69% (1.23%), and both are
significantly different from zero at a 1% level. For each dollar of the combined pre-merger
market equity of the acquirer and target, the acquirers gain about 4.28 cents less than targets on
average. This is slightly higher than 3.5 cents reported by Ahern (2012), who analyzes a sample
of public targets over the period from 1980 to 2008.
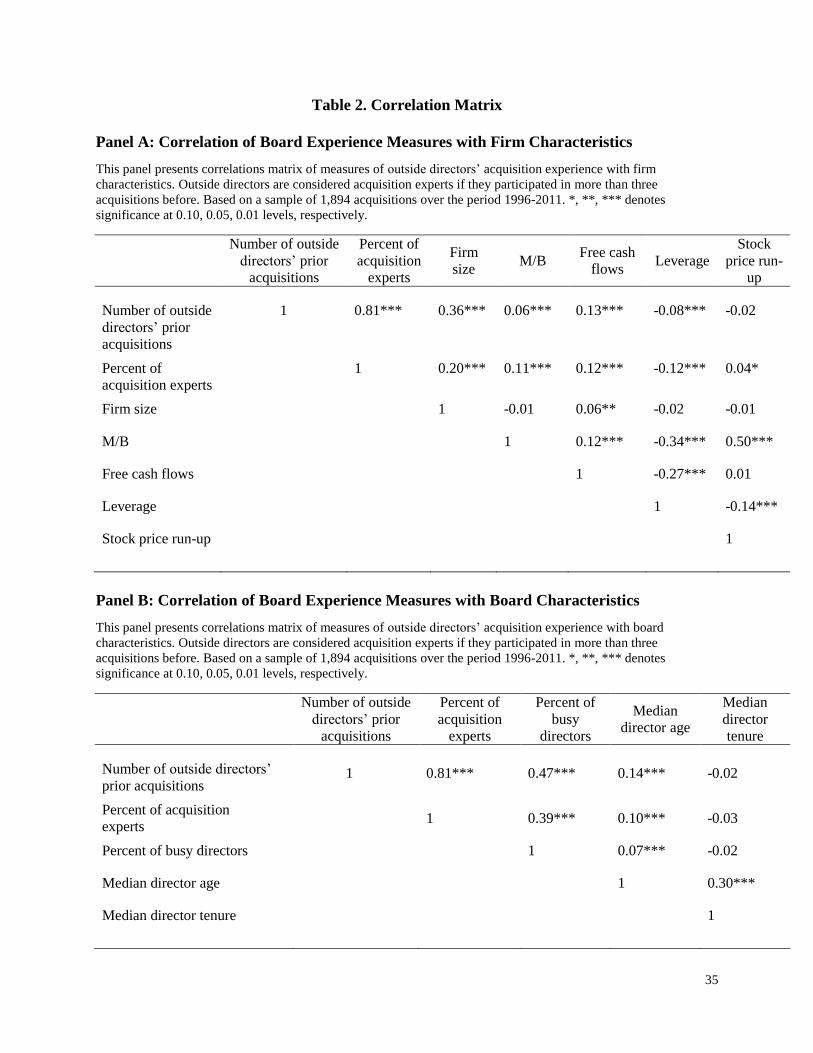
Panel A of Table 2 provides a correlation matrix that shows that both measures of
acquisition experience are highly correlated with firm size. For example, the correlation between
the cumulative number of a board’s acquisitions and firm size is 0.36. However, at least part of
this correlation is mechanical and can be attributed to the variable construction, as bigger firms
also have larger boards, and thus a greater cumulative number of acquisitions. The second
measure, the percent of acquisition experts, is similarly significantly correlated with size, albeit
to a lesser degree – the correlation between percent of acquisition experts and size is 0.20. The
positive correlation by the measures of acquisition experience and size can be explained by the

12
fact that directors with greater experience would be asked to serve on more boards and also on
the boards of more prestigious firms (Fama and Jensen (1983)). In fact, as can be seen in Panel B
of Table 2, both measures of acquisition experience are positively correlated with board busyness
and median director age, further confirming the need to control for the board’s general
experience in the regression analysis.14
3. Board acquisition experience and acquisition performance
3.1. Short-run announcement returns
Boards of directors play an important role in monitoring and advising during acquisitions
(e.g. Byrd and Hickman (1992), Subrahmanyam, Rangan, and Rosenstein (1997), Schonlau and
Singh (2009), Schmidt (2009)). In fact, directors have a fiduciary duty to review acquisitions put
forth by management or financial advisors to assure that shareholders’ interests are served
(Koontz (1967), Weiss (1991)). Directors have to decide whether the proposed acquisition will
strengthen a company’s operations, market position, and growth potential, and how it will impact
the financial standing of the firm. The board must also review analyses prepared by management
and financial advisors about how much value a deal will add and verify key assumptions inherent
in the analysis.
By taking part in acquisitions, directors develop a better understanding of the acquisition
context and accumulate knowledge about the acquisition process that can be very important to
other firms. Prior involvement in acquisitions, as argued by McDonald, Westphal, and Graebner
(2008), enhances directors’ ability to cope with challenges that are endemic to acquisition
14
The correlation coefficients on the director level between acquisition experience and director’s busyness and age
are similar to those reported in Panel B of Table 2. Specifically, the coefficients of correlation between the number
of a director’s prior acquisitions and a busy director dummy and director age are 0.36 and 0.15, respectively.
Similarly, the correlation between an acquisition expert dummy and a busy director dummy and director age are
0.29 and 0.12, respectively.

13
decisions, e.g. information overload, time constraints and the ability to recognize the long-term
strategic implications of the potential acquisitions. Similarly, Kroll, Walters, and Wright (2008)
argue that directors with acquisition expertise not only can be better monitors, but can also be
more useful advisors to top managers. In fact, Harford and Schonlau (2012) find that directors
with prior acquisition experience are invited to serve on more boards in the future, demonstrating
that firms clearly value directors’ prior acquisition experience. As boards can make better
decisions when directors have relatively high levels of relevant knowledge and expertise (e.g. see
Kerr and Tindale (2004)), I propose that the quality of boards’ decision-making is improved with
directors’ acquisition experience.
To test the relationship between board acquisition experience and acquisition
performance, I rely on acquisition announcement returns, which reflect investors’ responses to
the acquisition, based on present expectations about the future cash flows of a combined firm. In
particular, the dependent variable in Table 3 is the acquirer’s cumulative abnormal returns
(CARs) computed over the five-day window [−2, 2] 15
using a standard market adjusted return
model.16
The independent variables of interest are the measures of board acquisition experience.
In Model 1 board acquisition experience is measured as the cumulative number of the outside
directors’ prior acquisitions (“number of board’s prior acquisitions”). As can be seen from the
table, the coefficient on the number of board’s prior acquisitions is positive and significant at 1%
level, indicating that outside directors’ acquisition experience is associated with better short-run
acquisition performance. The relationship is economically significant, a one standard deviation
15
Prior literature has shown that using five-day window captures most of the announcement effect, without
introducing substantial noise (Fuller et al. (2002), Masulis et al. (2007)). For robustness I re-estimate the tests using
three-day window. The results remain very similar. 16
Abnormal return is calculated as the difference between a firm’s return and the value-weighted market (CRSP)
index return. Brown and Warner (1980) show that for short-window event studies, weighting the market return by
the firm’s stock beta does not significantly improve the power of the test, given the estimation error for beta and the
small size of the daily expected return on the market index.

14
increase in the number of board’s prior acquisitions increases average acquirer announcement
returns by about 1.7 times, and translates into a $51 million gain in shareholder value (based on
the average bidder market capitalization). In Model 2, acquisition experience is measured as the
percent of outside directors with more than three prior acquisitions (“percent of acquisition
experts”). This measure, similarly, is positive and significant at 5%. A one standard deviation
increase in the percent of acquisition experts increases acquirer announcement returns by 0.51%,
which is large relative to the mean five day announcement return of 0.36%. Hence, the effect of
outside directors’ acquisition experience on acquirer abnormal announcement returns is both
economically and statistically significant. This result shows that the experience brought by
outside directors can enhance the quality of a firm’s strategic decisions.17
It complements
existing studies on the role of CEOs’ industry experience, investment bankers, as well as director
connections on acquisition performance (e.g. Custodio and Metzger (2010), Bao and Edmands
(2011), Huang et al.(2011), Schonlau and Singh (2009)).
The results reported in Table 3 suggest that boards’ prior experience in acquisition
increases acquisition announcement returns, however, an interesting question is whether the
performance of the past acquisitions, in which directors were involved, matters.18
While directors
can learn from both low and high performing acquisitions (Beckman and Hausnchild (2002), and
the experienced gained even from value-destroying acquisitions can be valuable (Harford and
Schonlau (2012)), it is possible that directors who were involved in more successful acquisitions
make more constructive contributions to a firm’s acquisition decisions. To test this proposition,
in Model 3 of Table 3, I calculate the total cumulative abnormal returns from the announcements
17
This result is also consistent with research in strategic management that suggests that organizations, as well as
individuals, learn from internal and external acquisition experiences (e.g. Meyer-Doyle (2012), Haunschild (1993,
1994), McDonald et al. (2008), Kroll et al. (2008)). 18
At the individual director level, most of the directors have participated in acquisitions that generated both positive
and negative announcement returns.

15
of directors’ all prior acquisitions. As can be seen from the table, the coefficient on the total
cumulative abnormal returns is positive and significant at 5% level, suggesting that directors
which were involved in better performing acquisitions can provide particularly beneficial advice
and monitor the CEO better.
Similar to Masulis et al. (2007) and Harford et al. (2011), I find that CEO quality has a
significant and positive association with acquisition announcement returns, supporting the idea
that managerial quality can affect acquisition outcomes. Additionally, I find that the CEO’s and
other inside directors’ acquisition experience increases acquisition announcement returns. Other
control variables are consistent with prior literature. I find that larger firms, firms combining the
positions of the CEO and chairman of the board, and firms with larger boards experience lower
acquisition announcement returns. Acquisitions of public targets are negatively associated with
the announcement returns, while acquisitions of subsidiaries and cash deals generate positive
announcement returns (e.g. Masulis et al. (2007), Moeller et al. (2004) Yermack (1996)). Finally,
longer tenure of directors and CEOs is associated positively with announcement returns,
reflecting the value of the experience with the firm.
3.2. Acquisition Experts vs. Non-Experts
Earlier results suggest that board acquisition experience is positively associated with
acquisition announcement returns. A valuable question, however, is how much acquisition
expertise do directors need. In this sub-section, I examine whether the amount of acquisition
experience is important in explaining acquisition announcement returns. In particular, I ask
whether is it better to have several directors who have limited acquisition experience or a few
directors who have a large amount of acquisition experience? Having multiple directors with
acquisition experience can encourage more directors to participate in discussions about the

16
acquisition, as the knowledge developed through prior experiences enables individuals to
participate more actively in acquisition decisions (Kroll et al. (2008)). Having more directors
participating in the acquisition discussion and heterogeneity of directors’ experiences might lead
to better decision-making. On the other hand, as argued by Haleblian and Finkelstein (1999)
because acquisitions are complex events, it might require multiple acquisitions to accumulate
acquisition-specific expertise to draw correct generalizations and inferences. Furthermore, since
directors with relevant prior experience have more influence on the board (Westphal and Milton
(2000)), directors with greater accumulated acquisition knowledge are likely to have greater
impact on acquisition decisions.
As the median number of acquisitions for directors who previously participated in
acquisitions is three, I introduce two new measures. The first measure counts the number of
acquisitions performed by directors who have been involved in more than three prior acquisitions
(“acquisition experts”) and the second one sums the number of acquisitions performed by
directors who were involved in three or fewer acquisitions (“non-experts”).19
Model 1 in Table 4
shows that the experience of acquisition experts is positively associated with acquisition
announcement returns, while the experience of non-experts is not. Similarly, in Model 2, I create
two variables: the fraction of outside directors with more than three acquisitions (“percent of
expert directors”) and the fraction of outside directors with three or fewer prior acquisitions
(“percent of non-expert directors”). In this specification, I continue to find that the coefficient on
the percent of expert directors is significant, while the coefficient on the percent on non-expert
directors is not. These results suggest that the positive association between board acquisition
experience and announcement returns is mainly driven by the experience of acquisition experts.
19
For robustness, I also use five (i.e. top quartile number of acquisitions) acquisitions as a cut-off, the results remain
very similar.

17
A natural question that follows is how many experts does the board need? Is having one
acquisition expert enough? To examine these questions in Model 3, I introduce four dummy
variables that equal 1 if the board has one, two, three or more acquisition experts accordingly. As
can be seen from Table 4, firms that have only one acquisition expert do not experience an
increase in the acquisition announcement returns, however, firms with two or more acquisition
experts on the boards make acquisitions that are perceived more favorably by the market. This
result suggests that boards with at least two acquisition experts can exert enough influence over
acquisition decisions.
4. Non-random firm-director matching
Prior literature has emphasized the endogenous nature of board composition (Hermalin
and Weisbach (1998, 2003); Adams et al. (2010)). A plausible scenario could be that firms with
good unobserved acquisition opportunities might recruit directors with more acquisition
experience as a part of their optimal board structure. Such selection on unobservables would
result in omitted factors that simultaneously determine the presence of directors with acquisition
experience and better acquisition performance. I address this selection issue by I focusing on
directors who are less likely to be recruited because of acquisition experience and analyzing sub-
samples in which board experience is more relevant.
4.1. Directors without Prior Acquisition Experience
One way to address a possibility that firms with better acquisition opportunities attract
more experienced directors is to identify directors who did not have any acquisition experience
prior to joining the board, but who participated in acquisitions of other firms after joining the

18
board. Obviously, this type of directors is not recruited because of the acquisition experience, yet
these directors accumulate acquisition experience in other firms after they joined the board.
Thus, I construct an alternative measure of board experience, which counts only acquisitions in
which directors with no experience prior to joining the firm participated after joining the firm.
For example a director A joins Firm A in year t and has no prior acquisition experience.
However, in year t+1 director A participates in an acquisition made by Firm B, where the
director serves as a manager or a director. When Firm A makes an acquisition in year t+2, this
measure will only include acquisition experience of director A at firm B. Panel A of Table 5 re-
estimates the relationship between acquisition announcement returns and board acquisition
experience, using this alternative measure. As can be seen from Panel A of Table 5 when I use
this restricted measure of board experience I continue to find that board acquisition experience is
associated with better announcement returns, providing another piece of evidence that the results
are not driven by selection.
4.2. CEO advising needs
Another way to evaluate whether selection is driving the results, is to analyze sub-
samples in which board experience would be more valuable. I conjecture that the experience of
the board of directors in making acquisitions would be especially helpful for firms in which
CEOs have lower levels of acquisition experience. However, if the results are driven by
selection, there should be no difference in the effect of board acquisition experience across the
subsamples. Thus, I analyze the effect of board experience on acquisition announcement returns
separately for subsamples of firms with high and low CEO acquisition experience. Firms are
considered as having a CEO with high acquisition experience if the number of acquisitions in

19
which CEO participated as a manager or a director is above the median; otherwise firms are
considered to have low levels of CEO acquisition experience. Results are presented in Panel B of
Table 5. The coefficient on board acquisition expertise is positive and significant in both
subsamples; however, it is significant only in the sub-sample of firms in which the CEO has
lower levels of acquisitions experience (Models 1 and 2). Using a Chow test, I confirm that the
coefficients are different across the two sub-samples at 10% level (p-value of 0.09 for the
difference between Models 1 and 3 and p-value of 0.08 for Models 2 and 4). This result suggests
that board experience serves as a complement to the CEO’s skill set and that board acquisition
experience matters more where it is more valuable.
In sum, the results in this section provide evidence that the positive association between
board acquisition experience and acquisition performance is not driven by the endogenous
director-firm matching and board acquisition experience significantly enhances the ability of a
company to create value in an acquisition. The next section examines why firms with higher
board acquisition experience have higher acquisition announcement returns.
5. Why do firms with higher levels of board acquisition experience have higher returns?
This section analyzes potential channels through which boards’ acquisition experience
can influence a firm’s acquisition performance. First, it focuses on target selection, by examining
how outside directors’ acquisition experience is related to the likelihood of engaging in an
especially bad deal and the total value created by the merger. Second, it explores the role of
outside directors’ experience in deal negotiations, by focusing on the relative share of merger
gains.

20
5.1. Target Selection
5.1.1. Probability of undertaking a bad quality deal
Moeller et al. (2005) document that in the merger wave of the late 1990s, acquiring-firm
shareholders experienced significant wealth destruction due to a small number of acquisitions
with extremely large losses. They find that shareholders of these firms lost an average of $2.31
per dollar spent on the acquisition. As argued by Malmendier and Tate (2008), CEO
overconfidence can explain some of these losses, since overconfident CEOs overestimate their
ability to generate returns and undertake value-destroying mergers. As further suggested by
Malmendier and Tate (2008), CEO overconfidence can be counterbalanced by a more active
involvement of independent directors in acquisition assessment and selection. As experienced
directors are more likely to be actively involved in acquisitions (Kroll et al. (2008)) they are
more likely to mitigate CEOs’ overconfidence. Experienced directors can better recognize long-
term implications and assess risks that acquisitions might entail, as they possess more extensive
and more efficiently organized knowledge about acquisitions (McDonald et al. (2008)). Given
how big potential losses from acquisitions can be, the ability of the experienced directors to
prevent managers from engaging in bad quality deals can be very valuable.
I test whether board experience reduces the probability of undertaking value-destroying
acquisitions using two measures of bid quality. First, I create a bad bid dummy, which is equal to
one if acquisition announcement returns are in the lowest quintile. The results of a logistic
regression, in which the dependent variable is the bad quality dummy, are presented in the
Models 1 and 2 of Table 6.
As Table 6 shows, firms with higher board acquisition experience are less likely to make
an acquisition that generates low announcement returns, indicating that experienced directors are

21
more effective in restraining CEOs from making low quality acquisitions. Control variables
suggest that more powerful CEOs, as indicated by CEO/Chairman duality, are more likely to
pursue acquisitions with lower announcement returns. Similarly, acquisitions of targets which
are typically harder to integrate, such as relatively larger targets and public targets, increase the
probability of generating lower announcement returns. The number of firm’s prior acquisitions
also increases the odds of making an acquisition with lower announcement returns, which
suggests that firms exhaust a pool of potential value-increasing acquisition after a while. On the
other hand, acquisition of subsidiaries and acquisitions made by CEOs with more experience
with the firm are less likely to generate lower acquisition returns.
As a second measure of deal quality, I follow Moeller et al. (2005) to define a bad deal as
the one in which shareholders have lost more than one billion in constant 2011 dollars (i.e. large
loss deals). Dollar returns are calculated as the market value of publicly traded equity at the close
of event day +1 minus the market value on the close of event day -2. Models 3 and 4 in Table 6
present a logistic regression, in which the dependent variable equals one if it is a large loss deal.
In Model 3, the coefficient on the number of boards’ prior acquisitions variable has an
insignificantly negative effect on the probability of making a large loss deal. However, the
coefficient on the percent of acquisition experts variable in Model 4 is negative and statistically
significant at 5% level. This result suggests that acquisition experts have a superior ability to
identify and avoid large loss deals, thus preventing shareholders from huge wealth losses.
Consistent with Moeller et al. (2005), I find that several firm characteristics can explain the
incidence of large loss deals. For example, firms that engage in large loss deals are big, have
higher free cash flows, stock price run-up and market-to-book ratios, but lower leverage. Not
surprisingly, large loss deals represent relatively larger transactions.

22
5.1.2. Synergies
Earlier results suggest that experienced directors can prevent managers from engaging in
clearly bad acquisitions. Another possible explanation of why firms with higher board
acquisition experience may earn higher acquisition announcement returns is because more
experienced directors are able to select targets with a better strategic fit. While acquisitions are
typically initiated by management or financial advisors, directors who are actively involved in
the acquisition market may be better positioned to propose prospective high-surplus targets,
reducing potentially large search costs (Bruner (2004)). More importantly, as directors learn
from their prior experiences and mistakes, they can evaluate acquisitions proposed by the
management or investment banks more critically and challenge overoptimistic assumptions about
potential synergies. Due to their prior experience directors can be more selective in their
acquisition decisions and choose targets with which the bidder has higher synergies, leading to
greater shareholder wealth.
A commonly used metric to measure synergies created by the merger is combined value-
weighted abnormal announcement returns of the bidder and the target (Harford, Humphery-
Jenner, and Powell (2011), Lin, Officer, and Zou (2011)). Thus, I next examine the relationship
between board acquisition experience and combined value-weighted abnormal announcement
returns. Following prior literature to combine the announcement returns of the acquirer and
target I use weights based on their market values fifty trading days prior to the acquisition
announcement. Results are presented in Table 7.20
Since this table analyzes announcement
returns of both bidder and target, the regressions include additional controls for the target firm’s
characteristics.
20
Re-estimating earlier results using a subsample of public targets, I confirm that positive association between board
acquisition experience measures and acquisition announcement returns holds in this subsample as well.

23
I find that higher levels of board acquisition experience have a positive effect on
combined acquisition announcement returns, suggesting that acquirers with higher board
experience tend to select targets with which the acquiring firms have higher synergies. The
results are also economically significant. A one-standard-deviation increase in the number of
board’s prior acquisitions (percent of acquisition experts) is associated with 0.70% (0.61%)
higher combined acquisition announcement returns, which represents 41% (36%) of the mean
combined acquisition announcement return. Consistent with the disciplining role of leverage,
higher leverage is positively associated with merger synergies. Additionally, firms with higher
median director age, longer CEO tenure and cash deals are positively associated with merger
synergies, while larger boards and boards with more powerful CEOs, as measured by
CEO/Chairman duality, are significantly negatively related to combined acquisition
announcement returns.
Overall, the results in this section suggest that outside directors with prior acquisition
experience can encourage a more thoughtful target selection, by choosing targets with which the
acquirer has higher synergies and by avoiding particularly bad deals. Next, I turn to examine the
role of outside directors’ experience in deal negotiations.
5.2. Deal negotiations
Board acquisition experience might not only assist directors to better evaluate potential
targets but it may also enable directors to negotiate better terms. Prior literature suggests that
experienced negotiators better anticipate the other party’s behavior, they make higher initial
demands, and they are able to claim more resources than less experienced negotiators (e.g.
Thomson (1990a; 1990b); Neale et al. (1986)). Therefore, directors who have previously
24
participated in deal negotiations can assist the CEO to achieve more favorable negotiated
outcomes. This section examines whether firms with higher levels of board acquisition expertise
can secure a larger share of merger gains.
To measure the relative gains from acquisition, I compute bidder’s abnormal dollar
returns by first estimating abnormal percentage returns in a five-day window surrounding the
merger announcement, and then multiplying the abnormal percentage returns by the bidder’s
market value of equity on the prior day (Malatesta (1983) and Moeller et al. (2004)).21
Summing
the daily dollar returns over the five-day window generates cumulative abnormal dollar returns.22
Target’s abnormal dollar returns are computed in a similar manner. As the announcement returns
can be negative, I construct a measure of relative gains to the acquirer, as the difference in the
dollar announcement returns of the acquirer and target, scaled by the sum of the acquirer’s and
target’s market cap 50 trading days before the merger announcement, similar to Ahern (2012).
Table 8 presents the results in which the dependent variable is the relative gain to the
acquirer, as defined above. Similar to prior tables, Models 1 and 2 report results for the two
measures of board acquisition experience: cumulative number of board’s prior acquisitions and
the percent of acquisition experts. Because this table analyzes the gains to the acquirer relative to
the target, the regressions also include additional controls for target characteristics. The results in
Models 1 and 2 indicate that the acquirer’s gains relative to the target increase with acquirer’s
board’s acquisition experience, suggesting that directors with greater experience are able to
secure a larger fraction of merger synergies relative to firms with lower levels of board
21
I use dollar-based returns, since percentage returns are not very useful in evaluating proportional wealth gains
because they do not account for firm size. Since acquiring firms are generally much bigger than targets, the same
percentage return changes the wealth of the acquiring-firm shareholders more than it does the wealth of the target-
firm shareholders. Instead, as argued by Malatesta (1983), dollar-denominated abnormal wealth gains are better to
measure takeover related gains. 22
As a robustness check, I estimate dollar returns over a wider window (i.e. from five days before to five days after
the acquisition announcement date), to capture the bulk of the target pre-offer runup, which typically occurs within
ten days of the bid. The results remain the same.

25
acquisition expertise. Specifically, the point estimates imply that one standard deviation increase
in the number of board’s prior acquisitions (the fraction of acquisition experts) increases the
share of relative gain to the acquirer to 5.03% (4.98%), a 17% (16%) increase over the mean of
4.28%. These results suggest that firms with more experienced directors enjoy a bargaining
advantage in takeovers and receive larger relative gains. Control variables highlight the
importance of size in negotiations: larger targets reduce the acquirer’s share of the gains, while
larger acquirers secure a greater portion of the gains. In addition, higher target leverage reduces
the target’s bargaining power and is significantly related to larger acquirer gains.
Overall, the results suggest that boards with prior acquisition experience are able to
positively affect firm acquisition experience by selecting better targets and conducting more
effective negotiations.
6. Robustness
6.1. Board Acquisition Experience Measures
To ensure that the results presented earlier are not driven by the way the measures used in
the main analysis are defined, I examine the robustness of the findings to alternative definitions
of board acquisition experience. As board acquisition experience measures are shown to be
positively and significantly correlated with firm size, I first construct measures which purge the
possible effect of size. In particular, as an alternative measure I use the residuals from the cross-
sectional regressions that include firm size as an exogenous variable. Specifically, I regress the
number of board’s prior acquisitions on log size and squared log size to account for any potential
non-linearity. To neutralize the size effect from the second measure of acquisition experience,
percent of acquisition experts, which is bounded by zero and one, I follow the methodology used

26
by Nagel (2005). Specifically, I first perform a logit transformation of the variable and then
regress the transformed variable on the log of firm size and squared log of firm size.23
I use the
residuals from these regressions as my new explanatory variables. Untabulated results show that
all findings are robust to these measures. Alternatively to account for size, I scale the number of
boards’ prior acquisitions by firm size and obtain very similar results.
Additionally, I construct an average number of acquisitions per person, by dividing the
number of boards’ prior acquisitions by board size and confirm that the results remain robust.
6.2. Serial acquirers
Some acquirers make multiple acquisitions during the sample period. Measuring acquirer
announcement returns for these serial acquirers can be difficult because pre-announcement
market prices may already reflect the value expected from repeated acquisitions. At the same
time because repeat acquirers possess a lot of organizational acquisition experience themselves,
they might have less need for boards acquisition expertise. Thus serial acquirers might have
lower demand for board acquisition experience and also lower announcement returns. To address
this concern I re-estimate all regressions by including a dummy for serial acquirers. In particular,
I define an acquirer as serial, if a firm made at least three acquisitions during the sample period.24
In addition, I repeat the analysis on the sample that excludes serial acquirers. Both approaches
produce results similar to those reported in earlier tables.
23
The logit transformation is performed as follows: Logit(percent of acquisitions experts)=log(percent of
acquisitions experts/(1-percent of acquisitions experts)). To accommodate cases in which percent of acquisition
experts is zero I replace zeros with 0.0001. 24
Alternatively, I define an acquirer as serial, if a firm made at least two or at least five acquisitions during the
sample period.

27
6.3. Investment banks
Prior literature has found that investment banks affect acquisition returns (Bao and
Edmans (2011); Kale, Kini, and Ryan (2003)). Similarly, Huang et al. (2011) suggest that when
investment bankers serve on the boards of directors firms experience better acquisition
performance. If firms that attract better investment banks (and/or investment bank directors), also
attract directors with acquisition experience, then the positive relationship between board
experience and announcement returns could be contributed to the investment banks (and/or
investment bank directors). I address this concern in two ways. First, I construct a measure of
investment bank reputation and include it in the regressions. Specifically, I start by determining
the total annual dollar volume of all corporate takeovers in the Thomson One database and
compute each investment banks’ annual share for each year from 1993-2010. For each
acquisition I create a dummy variable, which is equal to one for the ten (twenty-five) biggest
investment banks, as measured by their market share in the three years prior to the acquisition.
Using this measure of investment bank effect, the coefficients on board acquisition expertise
remain positive and significant. Second, I re-estimate all regressions by including investment
bank fixed effects and obtain very similar results.
7. Conclusion
Directors have a fiduciary duty to participate in all major firm decisions and are viewed
as important managerial monitors and advisors. Thus, prior literature has examined how various
board characteristics affect board effectiveness and firm performance. This paper extends this
literature by examining how directors’ prior acquisition experience enhances firm value via
acquisitions. It argues that firms with higher levels of board acquisition expertise will make
better acquisition decisions.
28
Indeed, I find that board acquisition experience has a positive and significant association
with acquisition announcement returns, suggesting that prior experience enables directors to
better monitor and advise the CEO. The economic magnitude of the effect of board experience
on acquisition announcement returns is substantial. Further analysis identifies two channels
through which board acquisition experience facilitates better acquisition performance. First,
more experienced directors are able to select targets with which acquiring firms have higher
synergies and prevent managers from engaging in deals that destroy shareholder value. Second,
boards’ prior acquisition experience enables firms to negotiate deals more effectively, as
measured by the increased relative share of acquirers’ gains.
This paper demonstrates that directors’ knowledge and prior experience is valuable and
has a significant impact on firm acquisition performance. While this article has exclusively
focused on the board experience of the acquiring firms, a natural question concerns the role of
the targets’ board acquisition experience. For instance, how does a target’s board experience
affect its bargaining power? Is experienced board more likely to encourage competitive bidding
when selling the firm? How does a target’s board experience interact with an acquirer’s board
experience? Another question that this paper suggests is related to the effect of board experience
on CEOs’ risk-aversion. Risk-averse CEOs may avoid undertaking risky, yet potentially
profitable acquisitions, as CEOs face considerable risk of being fired following an unsuccessful
bid. Does the board experience reduce the estimated risk of an acquisition, by helping the CEO
evaluate potential synergies more accurately? Are experienced directors less likely to fire the
CEO following a bad bid? These questions are left for future research.

29
References
Adams, Renée B, Benjamin E Hermalin, Michael S. Weisbach, 2010, The role of boards of
directors in corporate governance: a conceptual framework and survey, Journal of Economic
Literature 48, 58-107.
Agrawal, Anup, Tommy Cooper, Qin Lian, and Qiming Wang, 2012, “Common advisors in
mergers and acquisitions: determinants and consequences,” Working paper.
Ahern, Kenneth R., 2012, Bargaining power and industry dependence in mergers, Journal of
Financial Economics 103, 530-550.
Aktas, Nihat, Eric de Bodt, and Richard Roll, 2010, Negotiations under the threat of an auction,
Journal of Financial Economics 98, 241-255.
Asquith, Paul, Robert F. Bruner, and David W. Mullins Jr., 1983, The gains to bidding firms
from merger, Journal of Financial Economics 11, 121-139.
Bazerman, Max H., Thomas Magliozzi, and Margaret A Neale, 1985, Integrative bargaining in a
competitive market, Orgnizational Behavior and Human Performance 34, 294-313.
Bao Jack and Alex Edmans, 2011, Do investment banks matter for M&A returns? Review of
Financial Studies 24, 2286-2315.
Bebchuk, Lucian A., Alma Cohen, and Allen Ferrell, 2009, What matters in corporate
governance? Review of Financial Studies 22, 783-827.
Beckman, Christine M. and Pamela R. Haunschild, 2002. Network learning: the effects of
partners’ heterogeneity of experience on corporate acquisitions. Administrative Science
Quarterly 47: 92–125.
Betton, Sandra, B.Espen Eckbo, and Karin Thornburn, 2008, Corporate takeovers, in: B. Espen
Eckbo, ed.: Handbook of Corporate Finance (Elsevier, North-Holland, Amsterdam), 291-430.
Boone, Audra L. and Harold J. Mulherin, 2007, How are firms sold? Journal of Finance 62,
847–875.
Brickley, James A., Jeffrey L. Coles, and Rory L. Terry, 1994, Outside directors and the
adoption of poison pills, Journal of Financial Economics 35, 371-390.
Brown, Stephen J., and Jerold B. Warner, 1980, Measuring security price performance, Journal
of Financial Economics 8, 205-258.
Bruner, Robert F., 2004, Applied Mergers and Acquisitions. Hoboken, New Jersey: John Wiley
& Sons, Inc.

30
Byrd, John W., and Kent A. Hickman, 1992, Do outside directors monitor managers? Evidence
from tender offer bids, Journal of Financial Economics 32, 195-222.
Cox, David. R., 1972, Regression models and life tables, Journal of the Royal Statistical Society,
34, 187–202.
Custodio, Claudia and Daniel Metzger, 2010, How do CEOs matter? The effect of industry
expertise on acquisition returns, Working Paper.
Daniel, Naveen D., John J. McConnell, and Lalitha Naveen, 2011, The advisory role of
multinational directors in U.S. firms, Working Paper.
Dass, Nishant, Omesh Kini, Vikram K. Nanda, Bunyamin Onal, and Jun Wang, 2011, Board
expertise: do directors from related industries help bridge the information gap? Working Paper.
Demb, Ada and F.-Friedrich Neubauer, 1992, The Corporate Board, Oxford: Oxford University
Press.
Engel, Ellen, Rachel M. Hayes, and Xue Wang, 2010, Audit committee compensation and the
demand for monitoring of the financial reporting process, Journal of Accounting & Economics
49, 136-154.
Faleye, Olubunmi, Hoitash, Rani and Hoitash, Udi, 2011, Advisory directors, Working Paper.
Faleye, Olubunmi, Hoitash, Rani and Hoitash, Udi, 2012, Industry expertise on corporate boards,
Working Paper.
Fama, Eugene F., and Kenneth R. French, 1997, Industry costs of capital, Journal of Financial
Economics 43, 153–193.
Fama, Eugene F., and Michael C. Jensen, 1983, Separation of ownership and control, Journal of
Law and Economics 26, 301–325.
Fuller, Kathleen, Jeffry Netter, and Mike Stegemoller, 2002, What do returns to acquiring firms
tell us? Evidence from firms that make many acquisitions, Journal of Finance 57, 1763–1794.
Gompers, Paul, Joy Ishii, and Andrew Metrick, 2003, Corporate governance and equity prices,
Quarterly Journal of Economics 118, 107-155.
Haleblian, Jerayr, and Sydney Finkelstein, 1999, The influence of organizational acquisition
experience on acquisition performance: A behavioral learning perspective, Administrative
Science Quarterly 44, 22-56.
Harford, Jarrad, Mark Humphery-Jenner, and Ronan Powell, 2011, The sources of value
destruction in acquisitions by entrenched managers, Journal of Financial Economics
Forthcoming.

31
Harford, Jarrad, and Robert J. Schonlau, 2012, “Does the director labor market offer ex post
settling-up for CEO? The case of acquisitions.” Working Paper.
Haunschild, Pamela R., 1993, Interorganizational imitation: the impact of interlocks on corporate
acquisition activity, Administrative Science Quarterly 38, 564-592.
Haunschild, Pamela R., 1994, How much is that company worth? Interorganizational
relationships, uncertainty, and acquisition premiums, Administrative Science Quarterly 39, 391-
411.
Hermalin, Benjamin E., and Michael S. Weibach, 1998, Endogenously chosen boards of
directors and their monitoring of the CEO, American Economic Review 88, 96 – 118.
Hermalin, Benjamin E., and Michael S. Weisbach, 2003, Boards of directors as an endogenously
determined institution: A survey of the economic literature, Economic Policy Review 9, 7-26.
Hotchkiss, Edith, Jun Qian, and Weihong Song, 2005, Holdups, Renegotiation, and deal
protection in mergers, Working paper, Boston College, Boston, MA.
Huang, Qianqian, Feng Jiang, Erik Lie, and Ke Yang, 2011, The role of investment banker
directors in M&A: Can experts help? Working paper.
Jensen, Michael C., 1986, Agency costs of free cash flow, corporate finance, and takeovers,
American Economic Review 76, 323–329.
Kale, Jayant, R., Omesh Kini, and Harley E. Ryan Jr., 2003, Financial advisors and shareholder
wealth gains in corporate takeovers, Journal of Financial and Quantitative Analysis 38, 475-501.
Kerr Nobert L., and R. Scott Tindale, 2004, Group performance and decision making, Annual
Review of Psychology 55, 623–655.
Koontz, Harold, 1967. The board of directors and effective management (McGraw Hill, New
York, NY).
Korn/Ferry International, 1999, 26th Annual Board of Directors Survey.
Kroll, Mark, Bruce A. Walters, and Peter Wright, 2008, Board vigilance, director experience and
corporate outcomes, Strategic Management Journal 29, 363-382.
Lang, Larry H.P., Rene M. Stulz, and Ralph A. Walkling, 1991, A test of the free cash flow
hypothesis: The case of bidder returns, Journal of Financial Economics 29, 315–336.
Lin, Chen, Micah S. Officer, and Hong Zou, 2011, Directors’ and officers’ liability insurance
and acquisition outcomes, Journal of Financial Economics 102, 507–525.

32
Loughran, Tim, and Jay R. Ritter, 2004, Why has IPO underpricing changed over time?
Financial Management 33, 5-37.
Malatesta, Paul H., 1983, The wealth effect of merger activity and the objective functions of
merging firms. Journal of Financial Economics 11, 155–181.
Malmendier Ulrike and Geoffrey Tate, 2008, “Who makes acquisitions? CEO overconfidence
and the market’s reaction,” Journal of Financial Economics 89, 20-43.
Masulis, Ronald W., Cong Wang, and Fei Xie, 2007, Corporate governance and acquirer returns,
Journal of Finance 62, 1851-1889.
McDonald, Michael L, James D. Westphal, and Melissa E. Graebner, 2008, What do they know?
The effects of outside director acquisition experience on firm acquisition performance,
Strategic Management Journal 29, 1155-1177.
Meyer-Doyle, Philipp, 2012, How do firms become good acquirers? Managerial learning and the
acquisition capability of firms, Working Paper.
Moeller, Sara B., Frederik P. Schlingemann, and Rene M. Stulz, 2004, Firm size and the gains
from acquisitions, Journal of Financial Economics 73, 201-228.
Moeller, Sara B., Frederik P. Schlingemann, and Rene M. Stulz, 2005, Wealth destruction on a
massive scale? A study of acquiring-firm returns in the recent merger wave, Journal of Finance
60, 757-782.
Montgomery, Edward, and Mary Ellen Benedict, 1989, The impact of bargainer experience on
teacher strikes, Industrial and Labor Relations Review 42, 380-392.
Morck, Randall, Andrei Shleifer, and Robert W. Vishny, 1990, Do managerial incentives drive
bad acquisitions? Journal of Finance 45, 31-48.
Nagel, Stefan, 2005, Short sales, institutional investors and the cross-section of stock returns,
Journal of Financial Economics 78, 277–309.
Neale, Margaret A., and Gregory B. Northcraft, 1986, Experts, amateurs, and refrigerators:
Comparing expert and amateur negotiators in a novel task, Organizational Behavior and Human
Decision Processes 38, 305-317.
Neale, Margaret A., Vandra L. Huber, and Gregory B. Northcraft, 1987, The framing of
negotiations: Contextual versus task frames, Organizational Behavior and Human Decision
Processes 39, 228-241.
Roll, Richard, 1986, The hubris hypothesis of corporate takeovers, Journal of Business 59, 197-
216.

33
Shleifer, Andrei, and Robert W. Vishny, 2003, Stock market driven acquisitions, Journal of
Financial Economics 70, 295–311.
Schmidt, Breno, 2009, Costs and Benefits of “Friendly” Boards during Mergers and
Acquisitions, EFA 2009 Bergen Meetings Paper.
Schonlau, Robert J. and Param Vir Singh, 2009, Board networks and merger performance,
Working Paper.
Subrahmanyam, Vijaya, Nanda Rangan, and Stuart Rosenstein, 1997, The role of outside
directors in bank acquisitions, Financial Management 26, 23-36.
Thompson, Leigh, 1990a, An examination of naïve and experienced negotiators, Journal of
Personality and Social Psychology 59, 82-90.
Thompson, Leigh, 1990b, The influence of experience on negotiation performance, Journal of
Experimental Social Psychology 26, 528-544.
Xie, Biao, Wallace N. Davidson III, and Peter J. DaDalt, 2003. Earnings management and
corporate governance: The roles of the board and the audit committee, Journal of Corporate
Finance 9, 295–316.
Weisbach, Michael S., 1988, Outside directors and CEO turnover, Journal of Financial
Economics 20, 431-460.
Weiss, Elliot, 1991, The board of directors, management, and corporate takeovers: Opportunities
and pitfalls, in: Arnold W. Sametz, ed.: The Battle for Corporate Control (Business One Irwin,
Homewood, IL).
Westphal, James D., and Laurie P. Milton, 2000, How experience and network ties affect the
influence of demographic minorities on corporate boards, Administrative Science Quarterly 45,
366-398
White, Halbert, 1980, A heteroskedasticity-consistent covariance matrix estimator and a direct
test for heteroskedasticity, Econometrica 48, 817-838.
Yermack, David L., 1996, Higher market valuation of companies with a small board of directors,
Journal of Financial Economics 40, 185-212.
Yermack, David L., 2004, Remuneration, retention, and reputation incentives for outside
directors, Journal of Finance 59, 2281 – 2308.

34
Table 1. Summary Statistics
Panel A presents summary statistics of board, firm and CEO acquisition experience. Outside directors are considered
acquisition experts if they participated in more than three acquisitions before. Panel B presents summary statistics of
firm and deal characteristics. Panel C presents summary statistics of acquisition performance. Based on a sample of
1,894 acquisitions over the period 1996-2011. Variable definitions are in the Appendix.
Mean St. Dev. 25th
percentile
Median 75th
percentile
Panel A: Acquisition Experience
Number of outside directors’ prior acquisitions 10.03 9.97 2.00 7.00 15.00
Percent of acquisition experts 0.13 0.15 0.00 0.11 0.20
Number of inside directors’ prior acquisitions 3.78 3.25 1.00 3.00 5.00
Number of firm’s prior acquisitions 2.76 2.76 1.00 2.00 4.00
Panel B: Control Variables
Firm characteristics (in billions)
Firm size 5.40 13.40 0.71 1.61 4.29
MV equity 8.49 23.22 0.80 2.04 5.60
MV assets 11.56 29.46 1.24 2.94 8.24
M/B 2.17 1.81 1.36 1.72 2.37
Leverage 0.12 0.11 0.03 0.09 0.18
Free cash flows 0.05 0.09 0.03 0.06 0.09
Stock price run-up 0.11 0.66 -0.20 0.02 0.28
CEO tenure 6.84 7.02 2.00 5.00 9.00
Board independence 0.69 0.17 0.57 0.71 0.82
Board size 9.30 2.33 8.00 9.00 11.00
E-index 2.41 1.29 1.00 2.00 3.00
% of busy directors 0.07 0.12 0.00 0.00 0.11
Median director age 61.09 5.07 58.00 61.50 64.50
Median director tenure 6.90 4.00 4.00 6.00 9.00
Deal characteristics (in billions)
Public target 0.31 0.46 0.00 0.00 1.00
Subsidiary target 0.33 0.47 0.00 0.00 1.00
Private target 0.36 0.48 0.00 0.00 1.00
Relative deal size 0.13 0.19 0.02 0.06 0.14
Cash deal 0.48 0.50 0.00 0.00 1.00
Diversifying acquisition 0.29 0.45 0.00 0.00 1.00
High-tech deal 0.23 0.42 0.00 0.00 0.00
Hostile deal 0.01 0.08 0.00 0.00 0.00
Panel C: Acquisition Performance
Acquirer five-day CAR in % 0.35 7.23 -2.95 0.40 3.82
Combined value-weighted acquirer and target
five-day CAR in %
1.69 7.23 -1.97 1.23 5.32
Acquirer’s relative gain in % -4.28 7.64 -8.67 -3.32 0.08
35
Table 2. Correlation Matrix
Panel A: Correlation of Board Experience Measures with Firm Characteristics
This panel presents correlations matrix of measures of outside directors’ acquisition experience with firm
characteristics. Outside directors are considered acquisition experts if they participated in more than three
acquisitions before. Based on a sample of 1,894 acquisitions over the period 1996-2011. *, **, *** denotes
significance at 0.10, 0.05, 0.01 levels, respectively.
Number of outside
directors’ prior
acquisitions
Percent of
acquisition
experts
Firm
size M/B
Free cash
flows Leverage
Stock
price run-
up
Number of outside
directors’ prior
acquisitions
1 0.81*** 0.36*** 0.06*** 0.13*** -0.08*** -0.02
Percent of
acquisition experts
1 0.20*** 0.11*** 0.12*** -0.12*** 0.04*
Firm size 1 -0.01 0.06** -0.02 -0.01
M/B 1 0.12*** -0.34*** 0.50***
Free cash flows 1 -0.27*** 0.01
Leverage 1 -0.14***
Stock price run-up 1
Panel B: Correlation of Board Experience Measures with Board Characteristics
This panel presents correlations matrix of measures of outside directors’ acquisition experience with board
characteristics. Outside directors are considered acquisition experts if they participated in more than three
acquisitions before. Based on a sample of 1,894 acquisitions over the period 1996-2011. *, **, *** denotes
significance at 0.10, 0.05, 0.01 levels, respectively.
Number of outside
directors’ prior
acquisitions
Percent of
acquisition
experts
Percent of
busy
directors
Median
director age
Median
director
tenure
Number of outside directors’
prior acquisitions 1 0.81*** 0.47*** 0.14*** -0.02
Percent of acquisition
experts 1 0.39*** 0.10*** -0.03
Percent of busy directors 1 0.07*** -0.02
Median director age 1 0.30***
Median director tenure 1

36
Table 3. Short-run Acquisition Performance – Baseline Analysis
This table tests the relationship between board acquisition experience and acquisition announcement returns. It
presents estimates from ordinary least squares estimation, based on a sample of 1,894 acquisitions over the period
1996-2011. The dependent variable in Models 1 and 2 is the acquirer’s five-day cumulative abnormal return in
percentage points. In Model 1 outside directors’ acquisition experience is measured as a cumulative number of other
firms’ acquisitions in which outside directors were involved as a manager or as a director. In Model 2 outside
directors’ acquisition experience is measured by the percent of acquisition experts, i.e. outside directors with more
than three prior acquisitions. In Model 3 outside directors’ acquisition experience is measured as the sum of all prior
five-day acquisition announcement returns, in which outside directors were previously involved as a manager or as a
director. All regressions include a constant. In parentheses are standard errors adjusted for heteroskedasticity (White,
1980) and clustered by firm. *, **, *** denotes significance at 0.10, 0.05, 0.01 levels, respectively. All regressions
control for year and industry fixed effects, whose coefficients are suppressed.
Model 1: Model 2: Model 3:
CAR [-2:2] CAR [-2:2] CAR [-2:2]
Outside Directors Acquisition Experience:
Number of outside directors’ prior acquisitions 0.060***
(0.023)
Percent of acquisition experts
3.496**
(1.492)
Cumulative CAR [-2:2] of prior acquisitions
1.802**
(0.736)
Inside Directors and Firm Acquisition Experience:
Number of inside directors’ prior acquisitions 0.119**
(0.048)
0.117**
(0.048)
0.129***
(0.049)
Managerial quality 0.010***
(0.003)
0.010***
(0.003)
0.010***
(0.003)
Number of prior acquisitions by firm -0.155**
(0.077)
-0.161**
(0.077)
-0.183**
(0.077)
Firm and Deal Characteristics:
Ln (Firm Size) -0.405**
(0.176)
-0.391**
(0.172)
-0.275
(0.169)
M/B -0.056
(0.276)
-0.054
(0.275)
-0.043
(0.278)
Free cash flows -0.572
(2.273)
-0.644
(2.285)
-0.493
(2.299)
Leverage 2.131
(2.037)
2.178
(2.042)
1.690
(2.075)
Stock price run-up -0.338
(0.412)
-0.368
(0.412)
-0.394
(0.420)
High-tech deal -0.102
(0.538)
-0.120
(0.537)
-0.030
(0.540)
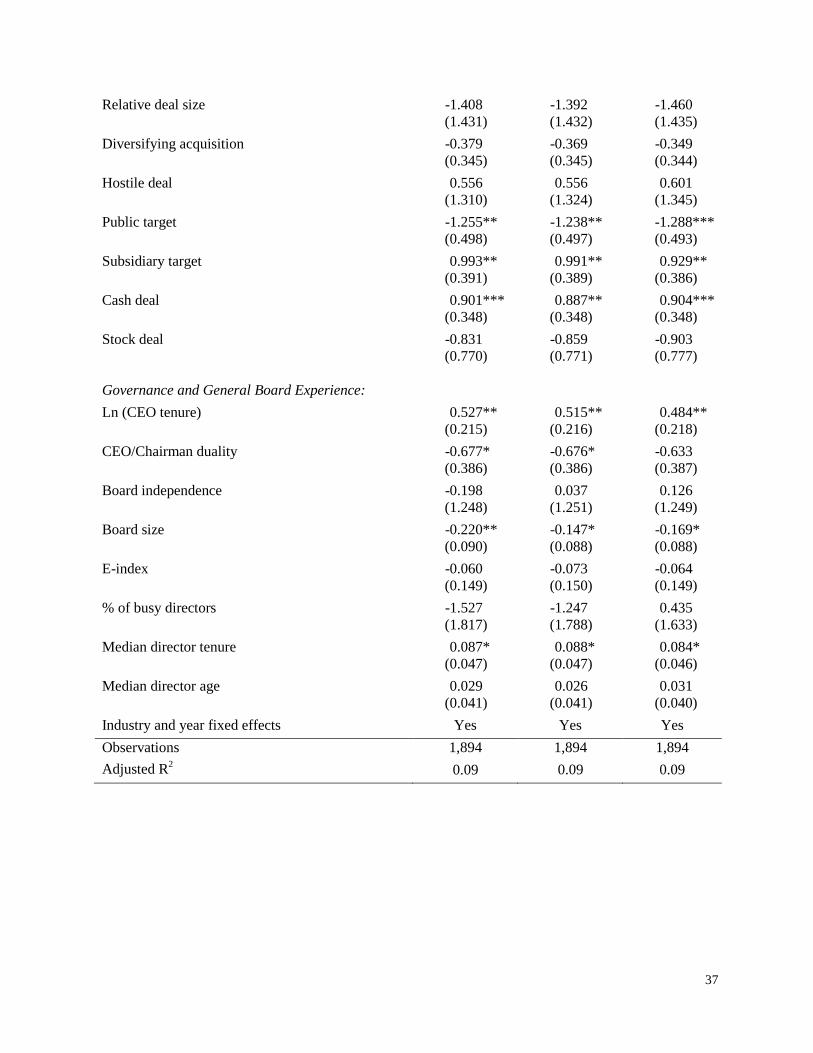
37
Relative deal size -1.408
(1.431)
-1.392
(1.432)
-1.460
(1.435)
Diversifying acquisition -0.379
(0.345)
-0.369
(0.345)
-0.349
(0.344)
Hostile deal 0.556
(1.310)
0.556
(1.324)
0.601
(1.345)
Public target -1.255**
(0.498)
-1.238**
(0.497)
-1.288***
(0.493)
Subsidiary target 0.993**
(0.391)
0.991**
(0.389)
0.929**
(0.386)
Cash deal 0.901***
(0.348)
0.887**
(0.348)
0.904***
(0.348)
Stock deal -0.831
(0.770)
-0.859
(0.771)
-0.903
(0.777)
Governance and General Board Experience:
Ln (CEO tenure) 0.527**
(0.215)
0.515**
(0.216)
0.484**
(0.218)
CEO/Chairman duality -0.677*
(0.386)
-0.676*
(0.386)
-0.633
(0.387)
Board independence -0.198
(1.248)
0.037
(1.251)
0.126
(1.249)
Board size -0.220**
(0.090)
-0.147*
(0.088)
-0.169*
(0.088)
E-index -0.060
(0.149)
-0.073
(0.150)
-0.064
(0.149)
% of busy directors -1.527
(1.817)
-1.247
(1.788)
0.435
(1.633)
Median director tenure 0.087*
(0.047)
0.088*
(0.047)
0.084*
(0.046)
Median director age 0.029
(0.041)
0.026
(0.041)
0.031
(0.040)
Industry and year fixed effects Yes Yes Yes
Observations 1,894 1,894 1,894
Adjusted R2 0.09 0.09 0.09

38
Table 4. Short-run Acquisition Performance - Acquisition Experts vs. Non-Experts
This table tests the relationship between the experience of acquisition experts (i.e. directors with more than three
prior acquisitions) and acquisition announcement returns. It presents estimates from ordinary least squares
estimation, based on a sample of 1,894 acquisitions over the period 1996-2011. The dependent variable in Models 1
and 2 is the acquirer’s five-day cumulative abnormal return in percentage points. In Model 1, number of outside
directors’ prior acquisitions by experts (non-experts) is the cumulative number of other firms’ acquisition in which
outside directors with more than three (three or fewer) prior acquisitions were involved. In Model 2 the percent of
acquisition experts (non-experts), is the percent of outside directors who have participated in more than three (three
or fewer) acquisitions before. All regressions include a constant. In parentheses are standard errors adjusted for
heteroskedasticity (White, 1980) and clustered by firm. *, **, *** denotes significance at 0.10, 0.05, 0.01 levels,
respectively. All regressions control for year and industry fixed effects, whose coefficients are suppressed.
Model 1: Model 2: Model 2:
CAR [-2:2] CAR [-2:2] CAR [-2:2]
Outside Directors Acquisition Experience:
Number of outside directors’ prior acquisitions by
experts (directors with >3 prior acquisitions)
0.064***
(0.024)
Number of outside directors’ prior acquisitions by
non-experts (directors with 1-3 prior acquisitions)
0.017
(0.059)
Percent of experts (directors with >3 prior
acquisitions)
3.340**
(1.510)
Percent of non-experts (directors with 1-3 prior
acquisitions)
-0.805
(0.977)
Number of experts=1
0.603
(0.434)
Number of experts=2
0.778*
(0.468)
Number of experts=3
1.759**
(0.732)
Number of experts>3
2.712***
(1.014)
Inside Directors and Firm Acquisition Experience:
Number of inside directors’ prior acquisitions 0.119**
(0.048)
0.119**
(0.048)
0.120**
(0.048)
Managerial quality 0.010***
(0.003)
0.011***
(0.003)
0.010***
(0.003)
Number of prior acquisitions by firm -0.156**
(0.077)
-0.163**
(0.077)
-0.156**
(0.077)
Firm and Deal Characteristics:
Ln (Firm Size) -0.394**
(0.176)
-0.370**
(0.174)
-0.411**
(0.174)
M/B -0.054
(0.277)
-0.048
(0.276)
-0.058
(0.276)

39
Free cash flows -0.583
(2.274)
-0.669
(2.278)
-0.713
(2.277)
Leverage 2.149
(2.040)
2.159
(2.041)
2.133
(2.052)
Stock price run-up -0.349
(0.414)
-0.387
(0.417)
-0.343
(0.412)
High-tech deal -0.103
(0.538)
-0.127
(0.537)
-0.108
(0.531)
Relative deal size -1.408
(1.433)
-1.392
(1.434)
-1.383
(1.429)
Diversifying acquisition -0.372
(0.345)
-0.356
(0.347)
-0.382
(0.345)
Hostile deal 0.548
(1.307)
0.562
(1.325)
0.456
(1.263)
Public target -1.257**
(0.498)
-1.240**
(0.497)
-1.257**
(0.498)
Subsidiary target 0.995**
(0.391)
0.985**
(0.389)
0.966**
(0.391)
Cash deal 0.906***
(0.348)
0.899***
(0.347)
0.878**
(0.349)
Stock deal -0.826
(0.770)
-0.848
(0.771)
-0.880
(0.777)
Governance and General Board Experience:
Ln (CEO tenure) 0.518**
(0.216)
0.503**
(0.218)
0.530**
(0.216)
CEO/Chairman duality -0.666*
(0.387)
-0.666*
(0.387)
-0.704*
(0.386)
Board independence -0.066
(1.279)
0.188
(1.271)
-0.127
(1.265)
Board size -0.205**
(0.092)
-0.145
(0.088)
-0.205**
(0.087)
E-index -0.056
(0.149)
-0.071
(0.150)
-0.075
(0.151)
% of busy directors -1.409
(1.808)
-0.976
(1.816)
-1.573
(1.792)
Median director tenure 0.087*
(0.047)
0.087*
(0.047)
0.086*
(0.047)
Median director age 0.027
(0.041)
0.025
(0.041)
0.027
(0.041)
Industry and year fixed effects Yes Yes Yes
Observations 1,894 1,894 1,894
Adjusted R2 0.09 0.09 0.09

40
Table 5. Short-run Acquisition Performance, Endogenous Director-Firm Matching
Panel A: Experience Gained After Joining the Board
This panel tests the relationship between acquisition experience directors gain in other firms after joining the board
and acquisition announcement returns. It presents estimates from ordinary least squares estimation, based on a
sample of 1,894 acquisitions over the period 1996-2011. The dependent variable is the acquirer’s five-day
cumulative abnormal return in percentage points. Number of outside directors’ prior acquisitions – Directors with no
experience prior to joining the board represents a cumulative count of other firms’ acquisitions, in which outside
directors, who had no experience prior to joining the board, participated after joining the board. Number of outside
directors’ prior acquisitions – Directors with experience prior to joining the board represents a cumulative count of
other firms’ acquisitions, in which outside directors, who had acquisition experience prior to joining the board,
participated before or after joining the board. All regressions include a constant. In parentheses are standard errors
adjusted for heteroskedasticity (White, 1980) and clustered by firm. *, **, *** denotes significance at 0.10, 0.05,
0.01 levels, respectively. All regressions control for year and industry fixed effects, whose coefficients are
suppressed. Variable definitions are in the Appendix.
Model 1:
CAR [-2:2]
Outside Directors Acquisition Experience:
Number of outside directors’ prior acquisitions – Directors with no
experience prior to joining the board
0.060**
(0.028)
Number of outside directors’ prior acquisitions – Directors with
experience prior to joining the board
0.064**
(0.031)
Inside Directors and Firm Acquisition Experience:
Number of inside directors’ prior acquisitions 0.121**
(0.049)
Managerial quality 0.010***
(0.003)
Number of prior acquisitions by firm -0.161**
(0.078)
Firm and Deal Characteristics:
Ln (Firm Size) -0.423**
(0.180)
M/B -0.198
(0.295)
Free cash flows -0.447
(2.274)
Leverage 2.201
(2.013)
Stock price run-up 0.135
(0.181)

41
High-tech deal -0.094
(0.537)
Relative deal size -1.525
(1.442)
Diversifying acquisition -0.391
(0.347)
Hostile deal 0.647
(1.312)
Public target -1.222**
(0.498)
Subsidiary target 1.008***
(0.389)
Cash deal 0.922***
(0.348)
Stock deal -0.853
(0.766)
Governance and General Board Experience:
Ln (CEO tenure) 0.523**
(0.216)
CEO/Chairman duality -0.157
(1.255)
Board independence -0.681*
(0.387)
Board size -0.216**
(0.091)
E-index -0.063
(0.149)
% of busy directors -1.402
(1.823)
Median director tenure 0.093*
(0.049)
Median director age 0.028
(0.040)
Industry and year fixed effects Yes
Observations 1,894
Adjusted R2 0.09

42
Table 5. Short-run Acquisition Performance, Endogenous Director-Firm
Matching (continued)
Panel B: Board Acquisition Experience and CEO Advising Needs
This panel tests whether the impact of board acquisition experience on acquisition announcement returns varies with
CEO advising needs. It presents estimates from ordinary least squares estimation, based on a sample of 1,894
acquisitions over the period 1996-2011. The dependent variable is the acquirer’s five-day cumulative abnormal
return in percentage points. Models 1 and 2 include acquisitions made by firms in which the number of the CEO’s
prior acquisitions is at or below the median. Models 3 and 4 include acquisitions made by firms in which the number
of the CEO’s prior acquisitions is above the median. In Models 1 and 3 outside directors’ acquisition experience is
measured as a cumulative number of other firms’ acquisitions in which outside directors were involved as a manager
or as a director. In Models 2 and 4 outside directors’ acquisition experience is measured by the percent of
acquisition experts, i.e. outside directors with more than three prior acquisitions. All regressions include a constant.
In parentheses are standard errors adjusted for heteroskedasticity (White, 1980) and clustered by firm. *, **, ***
denotes significance at 0.10, 0.05, 0.01 levels, respectively. All regressions control for year and industry fixed
effects, whose coefficients are suppressed. Variable definitions are in the Appendix.
Low CEO Experience High CEO Experience
Model 1: Model 2: Model 3: Model 4:
CAR [-2:2] CAR [-2:2] CAR [-2:2] CAR [-2:2]
Outside Directors Acquisition
Experience:
Number of outside directors’ prior
acquisitions
0.094***
(0.032)
0.022
(0.030)
Percent of acquisition experts
5.814***
(1.911)
1.050
(2.188)
Inside Directors and Firm Acquisition
Experience:
Number of inside directors’ prior
acquisitions
0.113
(0.080)
0.102
(0.062)
0.102
(0.078)
0.102
(0.063)
Managerial quality 0.115**
(0.054)
0.007***
(0.001)
0.113**
(0.055)
0.007***
(0.001)
Number of prior acquisitions by firm -0.197
(0.146)
-0.086
(0.093)
-0.198
(0.145)
-0.091
(0.093)
Firm and Deal Characteristics:
Ln (Firm Size) -0.496**
(0.234)
-0.248
(0.242)
-0.480**
(0.229)
-0.237
(0.243)
M/B -0.466
(0.297)
0.438**
(0.182)
-0.468
(0.299)
0.442**
(0.182)
Free cash flows -2.830
(2.383)
3.576
(3.810)
-2.862
(2.424)
3.496
(3.814)
Leverage 1.800
(2.430)
2.329
(2.752)
1.901
(2.436)
2.300
(2.756)
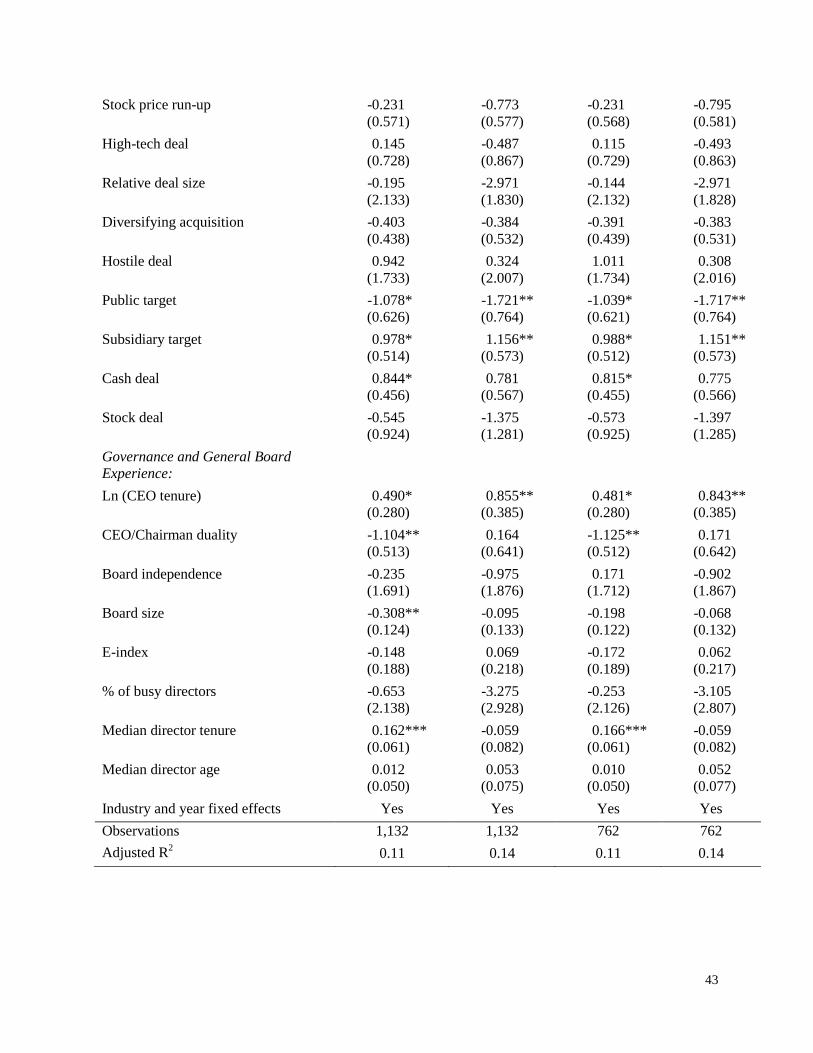
43
Stock price run-up -0.231
(0.571)
-0.773
(0.577)
-0.231
(0.568)
-0.795
(0.581)
High-tech deal 0.145
(0.728)
-0.487
(0.867)
0.115
(0.729)
-0.493
(0.863)
Relative deal size -0.195
(2.133)
-2.971
(1.830)
-0.144
(2.132)
-2.971
(1.828)
Diversifying acquisition -0.403
(0.438)
-0.384
(0.532)
-0.391
(0.439)
-0.383
(0.531)
Hostile deal 0.942
(1.733)
0.324
(2.007)
1.011
(1.734)
0.308
(2.016)
Public target -1.078*
(0.626)
-1.721**
(0.764)
-1.039*
(0.621)
-1.717**
(0.764)
Subsidiary target 0.978*
(0.514)
1.156**
(0.573)
0.988*
(0.512)
1.151**
(0.573)
Cash deal 0.844*
(0.456)
0.781
(0.567)
0.815*
(0.455)
0.775
(0.566)
Stock deal -0.545
(0.924)
-1.375
(1.281)
-0.573
(0.925)
-1.397
(1.285)
Governance and General Board
Experience:
Ln (CEO tenure) 0.490*
(0.280)
0.855**
(0.385)
0.481*
(0.280)
0.843**
(0.385)
CEO/Chairman duality -1.104**
(0.513)
0.164
(0.641)
-1.125**
(0.512)
0.171
(0.642)
Board independence -0.235
(1.691)
-0.975
(1.876)
0.171
(1.712)
-0.902
(1.867)
Board size -0.308**
(0.124)
-0.095
(0.133)
-0.198
(0.122)
-0.068
(0.132)
E-index -0.148
(0.188)
0.069
(0.218)
-0.172
(0.189)
0.062
(0.217)
% of busy directors -0.653
(2.138)
-3.275
(2.928)
-0.253
(2.126)
-3.105
(2.807)
Median director tenure 0.162***
(0.061)
-0.059
(0.082)
0.166***
(0.061)
-0.059
(0.082)
Median director age 0.012
(0.050)
0.053
(0.075)
0.010
(0.050)
0.052
(0.077)
Industry and year fixed effects Yes Yes Yes Yes
Observations 1,132 1,132 762 762
Adjusted R2 0.11 0.14 0.11 0.14
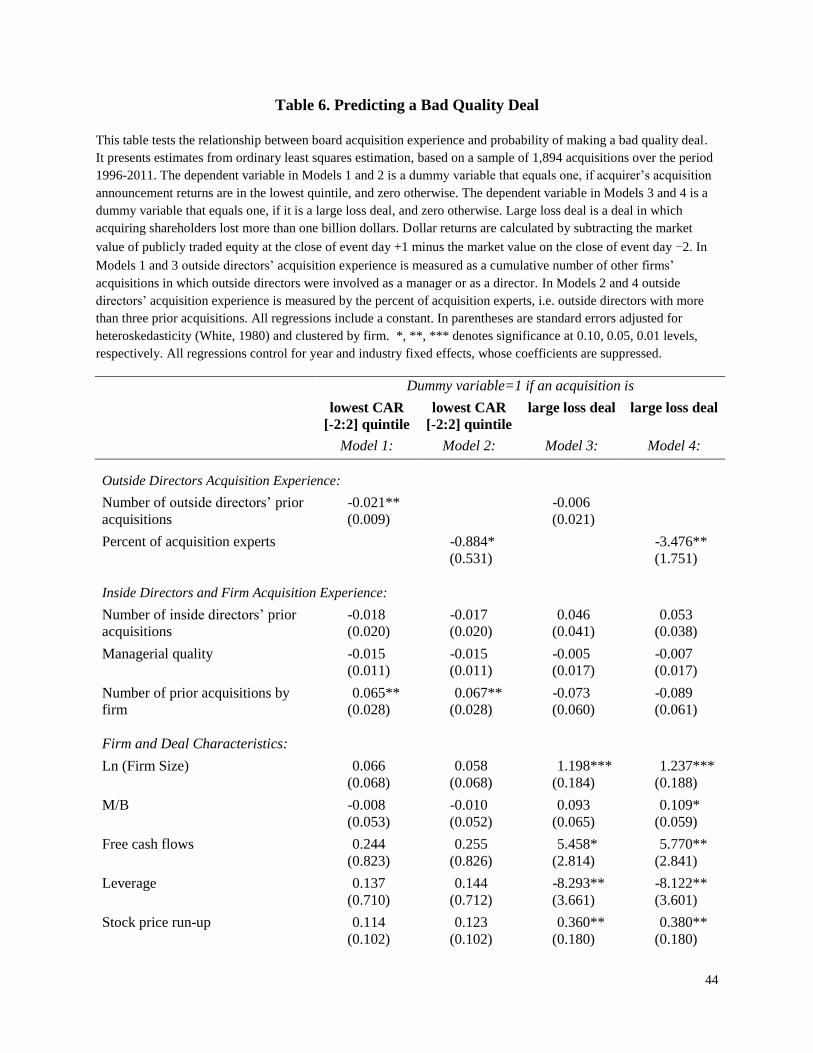
44
Table 6. Predicting a Bad Quality Deal
This table tests the relationship between board acquisition experience and probability of making a bad quality deal.
It presents estimates from ordinary least squares estimation, based on a sample of 1,894 acquisitions over the period
1996-2011. The dependent variable in Models 1 and 2 is a dummy variable that equals one, if acquirer’s acquisition
announcement returns are in the lowest quintile, and zero otherwise. The dependent variable in Models 3 and 4 is a
dummy variable that equals one, if it is a large loss deal, and zero otherwise. Large loss deal is a deal in which
acquiring shareholders lost more than one billion dollars. Dollar returns are calculated by subtracting the market
value of publicly traded equity at the close of event day +1 minus the market value on the close of event day −2. In
Models 1 and 3 outside directors’ acquisition experience is measured as a cumulative number of other firms’
acquisitions in which outside directors were involved as a manager or as a director. In Models 2 and 4 outside
directors’ acquisition experience is measured by the percent of acquisition experts, i.e. outside directors with more
than three prior acquisitions. All regressions include a constant. In parentheses are standard errors adjusted for
heteroskedasticity (White, 1980) and clustered by firm. *, **, *** denotes significance at 0.10, 0.05, 0.01 levels,
respectively. All regressions control for year and industry fixed effects, whose coefficients are suppressed.
Dummy variable=1 if an acquisition is
lowest CAR
[-2:2] quintile
lowest CAR
[-2:2] quintile
large loss deal large loss deal
Model 1: Model 2: Model 3: Model 4:
Outside Directors Acquisition Experience:
Number of outside directors’ prior
acquisitions
-0.021**
(0.009)
-0.006
(0.021)
Percent of acquisition experts
-0.884*
(0.531)
-3.476**
(1.751)
Inside Directors and Firm Acquisition Experience:
Number of inside directors’ prior
acquisitions
-0.018
(0.020)
-0.017
(0.020)
0.046
(0.041)
0.053
(0.038)
Managerial quality -0.015
(0.011)
-0.015
(0.011)
-0.005
(0.017)
-0.007
(0.017)
Number of prior acquisitions by
firm
0.065**
(0.028)
0.067**
(0.028)
-0.073
(0.060)
-0.089
(0.061)
Firm and Deal Characteristics:
Ln (Firm Size) 0.066
(0.068)
0.058
(0.068)
1.198***
(0.184)
1.237***
(0.188)
M/B -0.008
(0.053)
-0.010
(0.052)
0.093
(0.065)
0.109*
(0.059)
Free cash flows 0.244
(0.823)
0.255
(0.826)
5.458*
(2.814)
5.770**
(2.841)
Leverage 0.137
(0.710)
0.144
(0.712)
-8.293**
(3.661)
-8.122**
(3.601)
Stock price run-up 0.114
(0.102)
0.123
(0.102)
0.360**
(0.180)
0.380**
(0.180)
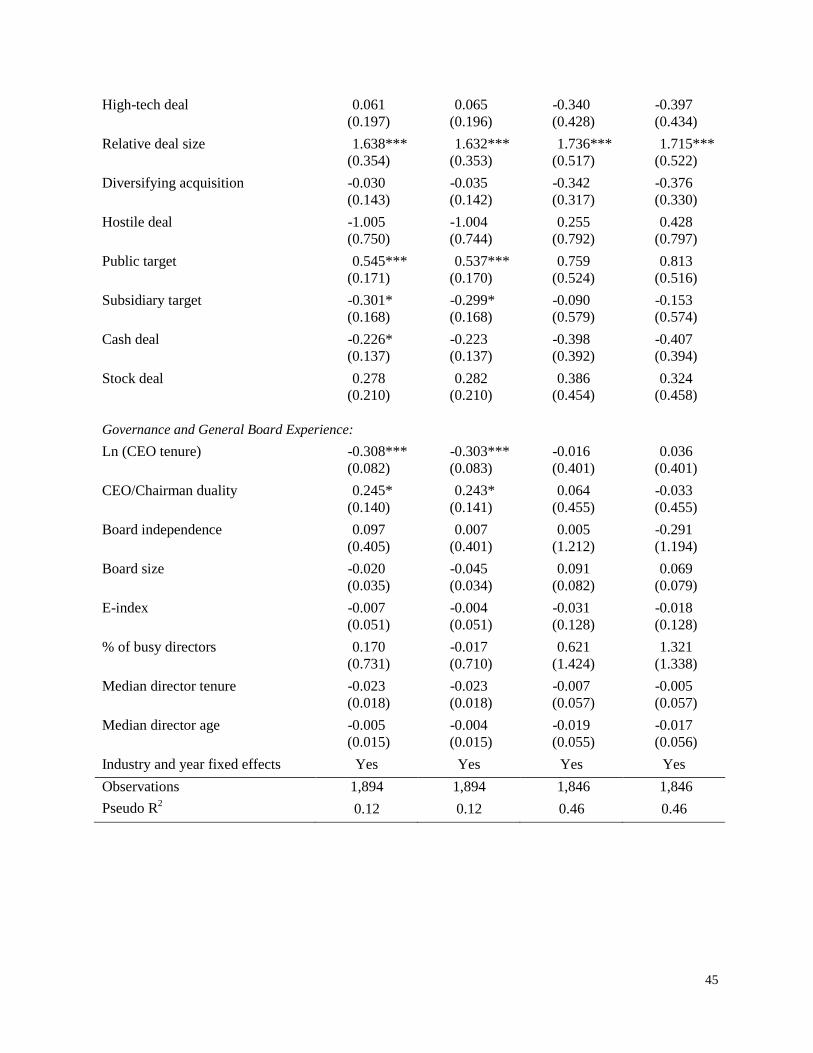
45
High-tech deal 0.061
(0.197)
0.065
(0.196)
-0.340
(0.428)
-0.397
(0.434)
Relative deal size 1.638***
(0.354)
1.632***
(0.353)
1.736***
(0.517)
1.715***
(0.522)
Diversifying acquisition -0.030
(0.143)
-0.035
(0.142)
-0.342
(0.317)
-0.376
(0.330)
Hostile deal -1.005
(0.750)
-1.004
(0.744)
0.255
(0.792)
0.428
(0.797)
Public target 0.545***
(0.171)
0.537***
(0.170)
0.759
(0.524)
0.813
(0.516)
Subsidiary target -0.301*
(0.168)
-0.299*
(0.168)
-0.090
(0.579)
-0.153
(0.574)
Cash deal -0.226*
(0.137)
-0.223
(0.137)
-0.398
(0.392)
-0.407
(0.394)
Stock deal 0.278
(0.210)
0.282
(0.210)
0.386
(0.454)
0.324
(0.458)
Governance and General Board Experience:
Ln (CEO tenure) -0.308***
(0.082)
-0.303***
(0.083)
-0.016
(0.401)
0.036
(0.401)
CEO/Chairman duality 0.245*
(0.140)
0.243*
(0.141)
0.064
(0.455)
-0.033
(0.455)
Board independence 0.097
(0.405)
0.007
(0.401)
0.005
(1.212)
-0.291
(1.194)
Board size -0.020
(0.035)
-0.045
(0.034)
0.091
(0.082)
0.069
(0.079)
E-index -0.007
(0.051)
-0.004
(0.051)
-0.031
(0.128)
-0.018
(0.128)
% of busy directors 0.170
(0.731)
-0.017
(0.710)
0.621
(1.424)
1.321
(1.338)
Median director tenure -0.023
(0.018)
-0.023
(0.018)
-0.007
(0.057)
-0.005
(0.057)
Median director age -0.005
(0.015)
-0.004
(0.015)
-0.019
(0.055)
-0.017
(0.056)
Industry and year fixed effects Yes Yes Yes Yes
Observations 1,894 1,894 1,846 1,846
Pseudo R2 0.12 0.12 0.46 0.46

46
Table 7. Synergies in Acquisitions of Public Targets
This table tests the relationship between board acquisition experience and combined acquisition announcement
returns. It presents estimates from ordinary least squares estimation, based on a sample of 450 acquisitions of public
targets over the period 1996-2011. The dependent variable in Models 1 and 2 is the combined acquirer and target
five-day cumulative abnormal return in percentage points. The acquisition announcement returns are combined,
using weights based on the market values fifty trading days prior to the acquisition announcement. In Model 1
outside directors’ acquisition experience is measured as a cumulative number of other firms’ acquisitions in which
outside directors were involved as a manager or as a director. In Model 2 outside directors’ acquisition experience is
measured by the percent of acquisition experts, i.e. outside directors with more than three prior acquisitions. All
regressions include a constant. In parentheses are standard errors adjusted for heteroskedasticity (White, 1980) and
clustered by firm. *, **, *** denotes significance at 0.10, 0.05, 0.01 levels, respectively. All regressions control for
year and industry fixed effects, whose coefficients are suppressed.
Model 1: Model 2:
Combined
CAR [-2:2]
Combined
CAR [-2:2]
Outside Directors Acquisition Experience:
Number of outside directors’ prior acquisitions 0.070*
(0.042)
Percent of acquisition experts
4.183*
(2.304)
Inside Directors and Firm Acquisition Experience:
Number of inside directors’ prior acquisitions 0.141
(0.114)
0.136
(0.114)
Managerial quality 0.107
(0.137)
0.102
(0.140)
Number of prior acquisitions by firm -0.238
(0.156)
-0.241
(0.156)
Firm and Deal Characteristics:
Ln (Firm Size) 0.153
(0.466)
-0.103
(0.455)
Ln (Firm Size) - Target -0.336
(0.450)
-0.295
(0.449)
M/B 0.026
(0.392)
0.020
(0.395)
M/B - Target 0.218
(0.232)
0.219
(0.233)
Free cash flows -7.595
(6.140)
-7.890
(6.153)
Free cash flows - Target 6.100
(4.086)
6.283
(4.093)

47
Leverage 10.848**
(4.402)
10.840**
(4.423)
Leverage - Target 3.410
(3.092)
3.222
(3.106)
Stock price run-up -0.722
(1.036)
-0.796
(1.047)
Stock price run-up - Target 0.220
(0.493)
0.276
(0.492)
High-tech deal -0.309
(1.154)
-0.343
(1.158)
Relative deal size 2.931
(2.285)
2.933
(2.279)
Diversifying acquisition -1.095
(0.850)
-1.086
(0.847)
Hostile deal 2.168
(2.127)
2.108
(2.128)
Cash deal 3.661***
(0.883)
3.698***
(0.875)
Stock deal 0.117
(1.089)
0.179
(1.095)
Governance and General Board Experience:
Ln (CEO tenure) 0.838*
(0.480)
0.850*
(0.482)
CEO/Chairman duality -1.354
(0.828)
-1.403*
(0.826)
Board independence 2.423
(2.966)
2.581
(3.005)
Board size -0.501**
(0.197)
-0.413**
(0.191)
E-index 0.028
(0.246)
0.038
(0.243)
% of busy directors -4.756
(3.208)
-4.132
(3.050)
Median director tenure -0.138
(0.111)
-0.141
(0.111)
Median director age 0.175**
(0.088)
0.175**
(0.089)
Industry and year fixed effects Yes Yes
Observations 450 450
Adjusted R2 0.22 0.22

48
Table 8. Acquirer’s Gain Relative to Target’s Gain
This table tests the relationship between board acquisition experience and the share of acquirer’s gain relative to the
target’s gain. It presents estimates from ordinary least squares estimation, based on a sample of 450 public targets
acquired over the period 1996-2011. The dependent variable is acquirer’s gain relative to the target’s gain defined as
acquirer five-day CAR minus target five-day CAR divided by the sum of acquirer and target market values 50
trading days before the merger announcement. In Model 1 outside directors’ acquisition experience is measured as a
cumulative number of other firms’ acquisitions in which outside directors were involved as a manager or as a
director. In Model 2 outside directors’ acquisition experience is measured by the percent of acquisition experts, i.e.
outside directors with more than three prior acquisitions. All regressions include a constant. In parentheses are
standard errors adjusted for heteroskedasticity (White, 1980) and clustered by firm. *, **, *** denotes significance
at 0.10, 0.05, 0.01 levels, respectively. All regressions control for year and industry fixed effects, whose coefficients
are suppressed. Variable definitions are in the Appendix.
Model 1: Model 2:
Acquirer’s
Relative Gains
Acquirer’s
Relative Gains
Outside Directors Acquisition Experience:
Number of outside directors’ prior acquisitions 0.075**
(0.037)
Percent of acquisition experts
4.751**
(2.465)
Inside Directors and Firm Acquisition Experience:
Number of inside directors’ prior acquisitions 0.189**
(0.095)
0.183*
(0.094)
Managerial quality 0.092
(0.096)
0.085
(0.099)
Number of prior acquisitions by firm -0.166
(0.147)
-0.174
(0.147)
Firm and Deal Characteristics:
Ln (Firm Size) – Acquirer 1.856***
(0.503)
1.842***
(0.502)
Ln (Firm Size) – Target -1.952***
(0.443)
-1.900***
(0.445)
M/B – Acquirer 0.325
(0.363)
0.308
(0.365)
M/B – Target -0.164
(0.220)
-0.162
(0.223)
Free cash flows – Acquirer -0.967
(5.774)
-1.193
(5.779)
Free cash flows – Target 1.114
(3.358)
1.339
(3.387)
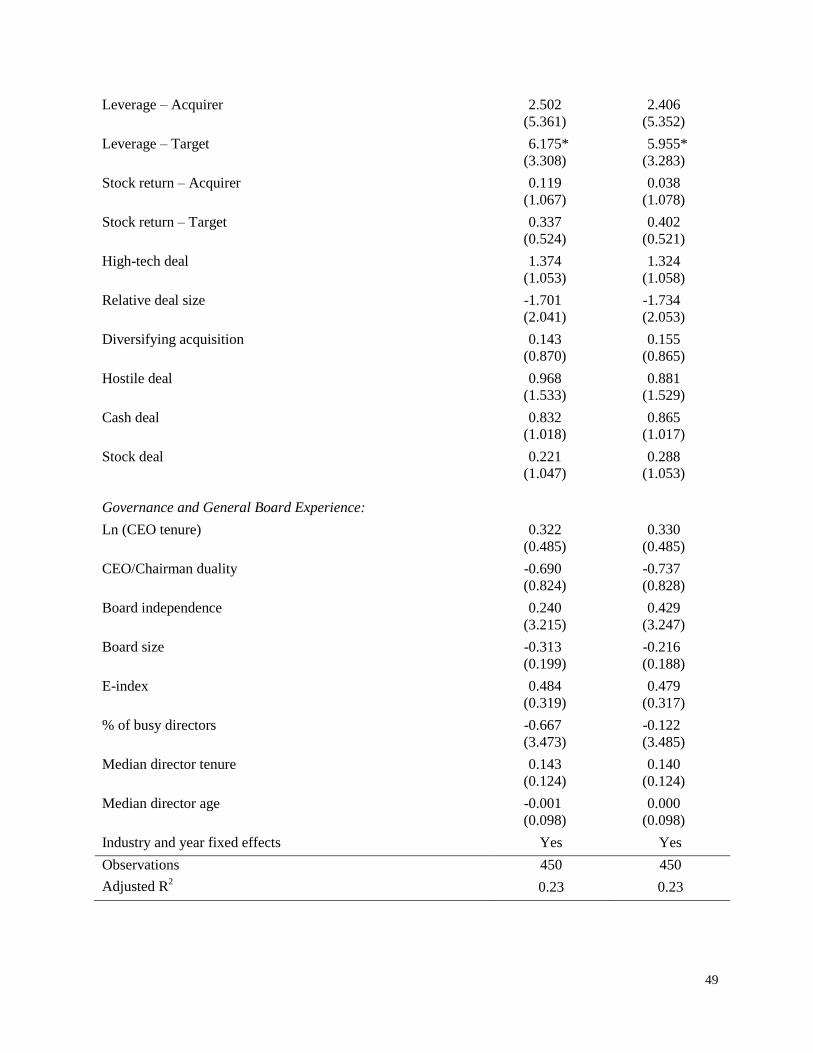
49
Leverage – Acquirer 2.502
(5.361)
2.406
(5.352)
Leverage – Target 6.175*
(3.308)
5.955*
(3.283)
Stock return – Acquirer 0.119
(1.067)
0.038
(1.078)
Stock return – Target 0.337
(0.524)
0.402
(0.521)
High-tech deal 1.374
(1.053)
1.324
(1.058)
Relative deal size -1.701
(2.041)
-1.734
(2.053)
Diversifying acquisition 0.143
(0.870)
0.155
(0.865)
Hostile deal 0.968
(1.533)
0.881
(1.529)
Cash deal 0.832
(1.018)
0.865
(1.017)
Stock deal 0.221
(1.047)
0.288
(1.053)
Governance and General Board Experience:
Ln (CEO tenure) 0.322
(0.485)
0.330
(0.485)
CEO/Chairman duality -0.690
(0.824)
-0.737
(0.828)
Board independence 0.240
(3.215)
0.429
(3.247)
Board size -0.313
(0.199)
-0.216
(0.188)
E-index 0.484
(0.319)
0.479
(0.317)
% of busy directors -0.667
(3.473)
-0.122
(3.485)
Median director tenure 0.143
(0.124)
0.140
(0.124)
Median director age -0.001
(0.098)
0.000
(0.098)
Industry and year fixed effects Yes Yes
Observations 450 450
Adjusted R2 0.23 0.23

50
Appendix: Variable Definition
Variable Definitions
Panel A: Board Acquisition Experience
Number of board’s
prior acquisitions
Cumulative number of other firms’ acquisitions in which outside directors
were involved as a manager or as a director in the past ten years.
Percent of acquisition
experts
Number of acquisition experts divided by the total number of outside
directors. Directors are considered acquisition experts if they have
participated in more than three acquisitions before.
Cumulative CAR [-2:2]
of prior acquisitions
Sum of five day cumulative acquisition returns of all prior acquisitions, in
which directors were involved in the past ten years.
Number of the inside
directors prior
acquisitions
Cumulative number of prior acquisitions in which the CEO and other inside
directors were involved as a manager or as a director in the past ten years.
Number of firm’s prior
acquisitions
Number of acquisitions, conducted by the firm in the past ten years.
Panel B: Board characteristics and Governance variables
E-index Based on six antitakeover provisions, as constructed by Bebchuk et al.
(2009).
CEO tenure Number of years in the position of CEO.
CEO/Chairman duality Dummy variable that equals one if the bidder CEO is also chairman of the
board, and zero otherwise.
Managerial quality (EBITDAt-1-EBITDAt-4)/EBITDAt-4, adjusted for the industry median.
Board size Number of directors on board.
Board independence Percentage of directors who are unaffiliated with the firm beyond their
directorship.
% of busy directors Percent of directors who serve on three or more boards.
Median director tenure Median tenure of outside directors on the board.
Median director age Median age of outside directors on the board.
Panel C: Firm characteristics
MV equity Number of shares outstanding multiplied by the stock price at the fiscal year
end.
MV assets Book value of total assets minus book value of equity plus market value of
equity.
Firm Size Log of book value of total assets.
M/B Market value of assets divided over book value of assets.
Leverage Book value of debt divided over market value of total assets.
Free cash flows Operating income before depreciation minus interest expense, income taxes,
and capital expenditures, scaled by book value of total assets.
Stock price run-up Bidder’s buy-and-hold abnormal return (BHAR) during the period (-210,-
11). The market index is the CRSP value-weighted return.

51
Panel D: Deal characteristics
CAR [-2, 2] Five-day cumulative abnormal return (in percentage points) calculated
using a standard market adjusted return model, where abnormal return is
calculated as the difference between a firm return and the value-weighted
market (CRSP) index return.
Public target Dummy variable that equals one for public targets, and zero otherwise.
Private target Dummy variable that equals one for private targets, and zero otherwise.
Subsidiary target Dummy variable that equals one for subsidiary targets, and zero otherwise.
Cash deal Dummy variable that equals one if financed only by cash and/or liabilities,
and zero otherwise.
Stock deal Dummy variable that equals one if financed by stock only, and zero
otherwise.
Mixed deal Deals that are not classified as cash or stock deals are classified as
combination deals.
Diversifying
acquisition
Dummy variable that equals one if bidder and target are not in the same FF
industry, and zero otherwise.
Relative deal size Deal value, as reported in ThomsonOne, divided by bidder’s market value
of assets.
High tech deal Dummy variable that equals one if bidder and target are both from the high
tech industries defined by Loughran and Ritter (2004), and zero otherwise.
Hostile deal Dummy variable that equals one if deal attitude is indicated as hostile by
ThomsonOne, and zero otherwise.
Relative gains to an
acquirer
Acquirer five-day CAR minus target five-day CAR divided by the sum of
acquirer and target market values 50 trading days before the merger
announcement (Ahern, 2012).