Embed Size (px)
Citation preview
fgene-10-00381 April 29, 2019 Time: 15:10 # 1
REVIEWpublished: 01 May 2019
doi: 10.3389/fgene.2019.00381
Edited by:Marco Pellegrini,
Italian National Research Council(CNR), Italy
Reviewed by:Noel Malod-Dognin,
Barcelona Supercomputing Center,Spain
Gregorio Alanis-Lobato,Francis Crick Institute,
United Kingdom
*Correspondence:Anna Goldenberg
[email protected];[email protected]
Roded [email protected]
Specialty section:This article was submitted to
Systems Biology,a section of the journal
Frontiers in Genetics
Received: 05 February 2019Accepted: 09 April 2019Published: 01 May 2019
Citation:Nelson W, Zitnik M, Wang B,
Leskovec J, Goldenberg A andSharan R (2019) To Embed or Not:
Network Embedding as a Paradigmin Computational Biology.
Front. Genet. 10:381.doi: 10.3389/fgene.2019.00381
To Embed or Not: NetworkEmbedding as a Paradigm inComputational BiologyWalter Nelson1,2, Marinka Zitnik3, Bo Wang3,4,5, Jure Leskovec3,6, Anna Goldenberg1,5,7*and Roded Sharan8*
1 Genetics and Genome Biology, SickKids Research Institute, Toronto, ON, Canada, 2 Department of Cell and SystemsBiology, University of Toronto, Toronto, ON, Canada, 3 Department of Computer Science, Stanford University, Stanford, CA,United States, 4 Peter Munk Cardiac Center, University Health Network, Toronto, ON, Canada, 5 Vector Institute, Toronto,ON, Canada, 6 Chan Zuckerberg Biohub, San Francisco, CA, United States, 7 Department of Computer Science, Universityof Toronto, Toronto, ON, Canada, 8 School of Computer Science, Tel Aviv University, Tel Aviv, Israel
Current technology is producing high throughput biomedical data at an ever-growingrate. A common approach to interpreting such data is through network-based analyses.Since biological networks are notoriously complex and hard to decipher, a growingbody of work applies graph embedding techniques to simplify, visualize, and facilitatethe analysis of the resulting networks. In this review, we survey traditional and newapproaches for graph embedding and compare their application to fundamentalproblems in network biology with using the networks directly. We consider a broadvariety of applications including protein network alignment, community detection, andprotein function prediction. We find that in all of these domains both types of approachesare of value and their performance depends on the evaluation measures being usedand the goal of the project. In particular, network embedding methods outshine directmethods according to some of those measures and are, thus, an essential tool inbioinformatics research.
Keywords: network biology, network embedding, network alignment, community detection, protein functionprediction
INTRODUCTION
Network biology is a powerful paradigm for representing, interpreting and visualizing biologicaldata (Barabási and Oltvai, 2004). One of the standard approaches to computing on networks isto transform such data into vectorial data, aka network embedding, to facilitate similarity search,clustering and visualization (Hamilton et al., 2017b; Cai et al., 2018).
In a network embedding problem, one is given a network and an induced similarity (or distance)function between its nodes; the goal is to find a low dimensional representation of the networknodes in some metric space so that the given similarity (or distance) function is preserved as muchas possible. For example, if the input network is unweighted and the distance between nodes isdefined to be the graph geodesic distance, then a possible goal could be to find an embedding intoEuclidean space that minimizes the sum of squared differences between graph distances and thecorresponding Euclidean distances (Tenenbaum, 2000).
The classical approach to network embedding employs matrix factorization and is based on thefact that if the desired similarity matrix is positive semi-definite then it can be decomposed into the
Frontiers in Genetics | www.frontiersin.org 1 May 2019 | Volume 10 | Article 381
fgene-10-00381 April 29, 2019 Time: 15:10 # 2
Nelson et al. To Embed or Not
product of a real matrix and its transpose. Thus, if onerepresents each node by a row of that matrix then thegiven similarity is completely captured by the dot-productbetween the corresponding vector representations. Similarly, ifone is given distances between nodes that satisfy the triangleinequality then double centering the distance matrix givesa positive semi-definite matrix whose decomposition yieldsvector representations that respect the given distances. Thisapproach is precisely the multidimensional scaling procedure(Cox and Cox, 2000).
Embedding approaches have several potential advantages.Algorithms making use of embeddings are frequently fasterthan their counterparts which operate on the original networks.Additionally, the learned embeddings are often applicable fordownstream analysis, either by direct interpretation of theembedding space or through the application of machine learningtechniques which are designed for vectorial data. Beyond itscomputational advantages, network embedding is natural to usein biological problems that concern physical entities (such asproteins) that function in 3D space. In such scenarios, Euclideanrepresentations may capture many of the functional properties ofthose entities. Finally, by working in lower dimensional space, theresults are more likely to be robust to the noise inherently presentin the networks. Indeed, recent network denoising approachesemployed embedding for this purpose (Wang et al., 2018).
In this review, we describe several current approaches forgraph embedding including spectral-based, diffusion-based anddeep-learning-based methods. We provide comparisons applyingrepresentative embedding approaches to fundamental problemsin network biology with using the networks directly in threedistinct tasks: protein network alignment, protein moduledetection, and protein function prediction (Figure 1). We furtherreview network embedding methods and their application tonetwork denoising and pharmacogenomics. We conclude thatnetwork embedding methods are an essential component in thebioinformatics tool box.
METHODOLOGY
Methods for network embedding aim to optimize the differencebetween the node similarities/distances in the original networkspace and their similarities/distances under the embedding,which is typically constrained to have a low dimension. In thefollowing, we describe various methods for embedding a givennetwork in Euclidean space. For a graph G with n nodes, aweighted adjacency matrix W and a diagonal degree matrix D,we define its Laplacian matrix as L = D-W.
Graph drawing algorithms are perhaps the best-knownembedding techniques, commonly used to visualize a graph in2D space. Initially proposed in (Eades, 1984) as an extensionof (Tutte, 1963), and further developed in (Fruchterman andReingold, 1991), the spring-embedder model is a particularlyelegant example: one can imagine that connected pairs of nodesare attached to springs which bring them closer together, whileall nodes repel each other so as not to be placed too closelytogether. Other classes of graph drawing algorithms, including
multi-level and dimensionality reduction-based techniques, aredescribed in detail in a recent review (Gibson et al., 2013). Spatialanalysis of functional enrichment (Baryshnikova, 2018) is onerecent application of force-directed graph drawing algorithm,designed for the annotation and visualization of large, complexbiological networks.
One of the fundamental methods to decompose a matrix isspectral decomposition, i.e., decomposing the matrix into itseigenvectors and eigenvalues. Given a network, the principaleigenvectors Q of its Laplacian matrix capture membershipof nodes in implicit network clusters, commonly used forembedding (Belkin and Niyogi, 2003). The matrix Q is obtainedby optimizing minQ∈Rn×C Trace
(QTL+Q
), s.t. QTQ = I, where
L+ = I-D−1/2WD−1/2 is a normalized Laplacian and C is thenumber of clusters. However, this spectral embedding reflects theglobal structure in the network without taking into considerationmore fine-grained local structures and is therefore sensitive tonoise. Wang et al. (2017a) recently introduced the Vicus matrix asa local-neighborhood version of the Laplacian matrix. Each cell ofthe Vicus matrix represents the probability of node j having thesame label as node i if we did a random walk around the localneighborhood of node i. Encoding local neighborhoods in thisfashion does not only preserve the geometric properties of theoriginal Laplacian matrix but also reduces the noise and improvesthe quality of the embedding. Wang et al. showed that for avariety of tasks, including network clustering of single-cell RNA-seq data, cluster stability, identification of rare cell populations,and ranking of genes associated with cancer subtypes, Vicus-based spectral methods outperformed Laplacian-based spectralmethods on a wide variety of biological tasks.
Diffusion-based approaches focus on embedding nodes intolow-dimensional vector spaces by first using random walksto construct a network neighborhood of every node in thenetwork, and then optimizing an objective function with networkneighborhoods as input (Perozzi et al., 2014a; Tang et al.,2015; Grover and Leskovec, 2016). The objective functionis carefully designed to preserve both the local and globalnetwork structures. For example, a popular method, Mashup,complements traditional random walks, which yield onlydiffusion states, with a dimensionality reduction step that isaimed at reducing the noise in these diffusion computations.To this end, Mashup approximates each diffusion state siwith a multinomial logistic model based on a latent vectorrepresentation of nodes that uses far fewer dimensions than theoriginal, n-dimensional state. Specifically, if the latent vectorrepresentation for node i is denoted by xi, Mashup also constructsa contextual vector wi that has the same dimensionality as xiand captures the topology of the subnetwork around node i. Tothis end, Mashup computes the probability assigned to node j
in the diffusion state of node i as sij =exp(xT
i wj)∑
k exp(xT
i wk) , so that these
computed diffusion states align with the original diffusion states.Mashup constructs an optimization framework to minimize theKL-divergence of these two diffusion states and applies standardgradient descent methods to solve for the latent representations.
Another widely used network embedding algorithm thatuses random walks is node2vec (Grover and Leskovec, 2016).
Frontiers in Genetics | www.frontiersin.org 2 May 2019 | Volume 10 | Article 381
fgene-10-00381 April 29, 2019 Time: 15:10 # 3
Nelson et al. To Embed or Not
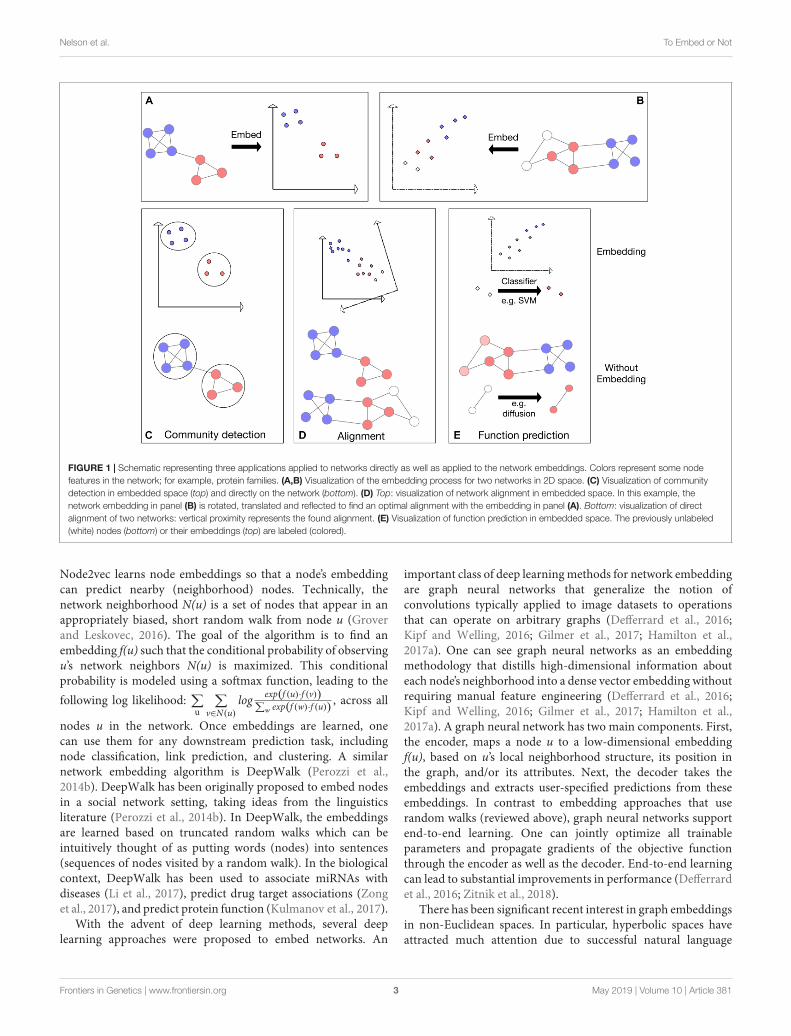
FIGURE 1 | Schematic representing three applications applied to networks directly as well as applied to the network embeddings. Colors represent some nodefeatures in the network; for example, protein families. (A,B) Visualization of the embedding process for two networks in 2D space. (C) Visualization of communitydetection in embedded space (top) and directly on the network (bottom). (D) Top: visualization of network alignment in embedded space. In this example, thenetwork embedding in panel (B) is rotated, translated and reflected to find an optimal alignment with the embedding in panel (A). Bottom: visualization of directalignment of two networks: vertical proximity represents the found alignment. (E) Visualization of function prediction in embedded space. The previously unlabeled(white) nodes (bottom) or their embeddings (top) are labeled (colored).
Node2vec learns node embeddings so that a node’s embeddingcan predict nearby (neighborhood) nodes. Technically, thenetwork neighborhood N(u) is a set of nodes that appear in anappropriately biased, short random walk from node u (Groverand Leskovec, 2016). The goal of the algorithm is to find anembedding f(u) such that the conditional probability of observingu’s network neighbors N(u) is maximized. This conditionalprobability is modeled using a softmax function, leading to thefollowing log likelihood:
∑u
∑v∈N(u)
log exp(f (u)·f (v))∑w exp(f (w)·f (u))
, across all
nodes u in the network. Once embeddings are learned, onecan use them for any downstream prediction task, includingnode classification, link prediction, and clustering. A similarnetwork embedding algorithm is DeepWalk (Perozzi et al.,2014b). DeepWalk has been originally proposed to embed nodesin a social network setting, taking ideas from the linguisticsliterature (Perozzi et al., 2014b). In DeepWalk, the embeddingsare learned based on truncated random walks which can beintuitively thought of as putting words (nodes) into sentences(sequences of nodes visited by a random walk). In the biologicalcontext, DeepWalk has been used to associate miRNAs withdiseases (Li et al., 2017), predict drug target associations (Zonget al., 2017), and predict protein function (Kulmanov et al., 2017).
With the advent of deep learning methods, several deeplearning approaches were proposed to embed networks. An
important class of deep learning methods for network embeddingare graph neural networks that generalize the notion ofconvolutions typically applied to image datasets to operationsthat can operate on arbitrary graphs (Defferrard et al., 2016;Kipf and Welling, 2016; Gilmer et al., 2017; Hamilton et al.,2017a). One can see graph neural networks as an embeddingmethodology that distills high-dimensional information abouteach node’s neighborhood into a dense vector embedding withoutrequiring manual feature engineering (Defferrard et al., 2016;Kipf and Welling, 2016; Gilmer et al., 2017; Hamilton et al.,2017a). A graph neural network has two main components. First,the encoder, maps a node u to a low-dimensional embeddingf(u), based on u’s local neighborhood structure, its position inthe graph, and/or its attributes. Next, the decoder takes theembeddings and extracts user-specified predictions from theseembeddings. In contrast to embedding approaches that userandom walks (reviewed above), graph neural networks supportend-to-end learning. One can jointly optimize all trainableparameters and propagate gradients of the objective functionthrough the encoder as well as the decoder. End-to-end learningcan lead to substantial improvements in performance (Defferrardet al., 2016; Zitnik et al., 2018).
There has been significant recent interest in graph embeddingsin non-Euclidean spaces. In particular, hyperbolic spaces haveattracted much attention due to successful natural language
Frontiers in Genetics | www.frontiersin.org 3 May 2019 | Volume 10 | Article 381

fgene-10-00381 April 29, 2019 Time: 15:10 # 4
Nelson et al. To Embed or Not
processing models which use them for embedding words(Chamberlain et al., 2017). Muscoloni et al. (2017) describea general algorithm termed “coalescent embedding” forembedding vertices in hyperbolic spaces. The algorithmproceeds by pre-weighting the network and applying anon-linear dimension reduction technique, followed bycomputing and adjusting the angular positions of the Euclideanembeddings and radial positioning according to node degree.More generally, networks and their respective embeddingscan be interpreted geometrically, as described in recentreviews (Barthélemy, 2011; Papadopoulos et al., 2015; Moyano,2017). These geometric models have been used successfullyin applications to biological networks, particularly protein–protein interaction (PPI) networks (Serrano et al., 2012;Alanis-Lobato et al., 2016, 2018).
APPLICATIONS
Network AlignmentA basic operation in biological research is to transfer knowledgeacross species. Indeed, sequence alignment has been the powerhorse of computational biology for almost five decades now.With the availability of physical interaction data, it was suggestedto generalize alignment concepts to the network level (Kelleyet al., 2003; Sharan and Ideker, 2006). There are several types ofnetwork alignment problems, here we focus on global networkalignment where given the networks of two species (typically, PPInetworks) one wishes to identify a 1–1 correspondence betweenthe proteins of the two species under which the networks are mostsimilar (Figure 1D).
A leading approach to this problem is the IsoRank algorithm(Singh et al., 2008) which is based on Google’s PageRank method,essentially measuring the correspondence, or similarity, betweentwo proteins from different species based on the similarities oftheir neighboring nodes in the two corresponding networks.Thus, if we denote by Rij the similarity between proteins i andj (from two different species), and we let N(i) denote the (open)neighborhood of protein i in its network, then:
Rij =1
|N(i)||N(j)|
∑u∈N(i),v∈N(j)
Ruv
These recursive equations give rise to an eigenvalue problemand their solution is used as an input to a maximum matchingalgorithm to compute the eventual correspondence.
Another, more recent approach is MAGNA (Saraph andMilenkoviæ, 2014) and its successor MAGNA++ (Vijayan et al.,2015). MAGNA uses a genetic algorithm to find the optimalalignment, where individuals are viewed as permutations of thenodes. Crossover relies on the notion of adjacency, where a pairof permutations is adjacent if they differ only by a single swapof two nodes; the crossover of two permutations is then themidpoint of the shortest path between the two permutations inthe graph constructed from these adjacencies. Selection can bebased on any metric, such as EC. MAGNA++ augments thisapproach by including cross-species node similarity information.
An extensive review of methods for biological network alignmentcan be found in (Guzzi and Milenkovic, 2018) that mentionsover thirty different approaches. Comparative network analysismethods are further reviewed in (Emmert-Streib et al., 2016).
A recent work by Fan et al. (2017) uses an embedding-based approach, MuNK, to compare networks across speciesby assessing similarity via embedded network topologies. Theidea is to project the nodes of the two networks into thesame Euclidean space in a way that preserves their intra-speciesnetwork similarity and inter-species sequence similarity. Foreach species separately, a kernel similarity function is defined,and the corresponding embedding is computed by matrixdecomposition. To tie the projections together, Fan et al. (2017)assume a given set of known matches, regarded as landmarks,between the two networks. A similar embedding approachthat does not require a known subset of correspondences wassuggested in (Heimann et al., 2018).
As a test case for network embedding, we evaluated the twoalgorithms, IsoRank and MuNK, using metrics of alignmentquality. A common and simple metric is the edge correctness(EC), defined as the percentage of edges conserved under themapping f (Kuchaiev et al., 2009; Clark and Kalita, 2014):
EC =|f (EA) ∩ EB|
|EA|× 100%
Note that the EC metric is asymmetric, and the order of thenetworks is traditionally chosen to maximize EC, i.e., A is chosento be the smaller of the two networks. Beyond topologicalsimilarity, one can use different biological annotations, suchas the Gene Ontology (GO) functional annotation, to computebiologically relevant measures of alignment quality such asGO functional consistency (Aladag and Erten, 2013), definedas the proportion of aligned pairs with more than k GOterms in common.
Similar to the use of landmarks in MuNK, IsoRank canincorporate additional similarity information in its computationof the score matrix, so the landmark pairs are provided as abinary information matrix to the IsoRank algorithm. In ourexperiments, we produce two outputs for method comparison:cross-species pairwise similarity scores and the node-to-nodemappings. Thus, in addition to the two measures described abovethat use the node-to-node mappings, we also evaluated IsoRankand MuNK using AUPR as a measure of enrichment of GOfunctional consistency with respect to the cross-species pairwisesimilarity scores. When comparing MuNK to the more recentMAGNA++, MAGNA++ performs very well according to EC(as it optimizes EC directly), but it does not output node scores sowe could not directly compare MuNK to MAGNA++ accordingto AUPR and other metrics. Per the author recommendation,the regularization parameter for the Laplacian in MuNK wasfixed at λ = 0.05. Damping can be used in the PageRank stepof the IsoRank algorithm, and therefore we performed a gridsearch with step size 0.05 over possible convexity parametersα ∈ (0, 1), optimizing for EC score. As input data, we usethe PPI networks for two species of yeast, S. cerevisiae and
Frontiers in Genetics | www.frontiersin.org 4 May 2019 | Volume 10 | Article 381
fgene-10-00381 April 29, 2019 Time: 15:10 # 5
Nelson et al. To Embed or Not
S. pombe, extracted from the BioGRID interaction database(Oughtred et al., 2018).
IsoRank performs better on the measures directly relatedto the node mapping (Table 1). This may be due to the factthat the cross-species similarity coefficients in IsoRank directlyincorporate local neighborhood (i.e., topological) information,a fact that the IsoRank greedy algorithm is designed to takeadvantage of. The MuNK scores predict functional correctnessbetter than the scores produced by IsoRank, suggesting thatMuNK’s learned embedded space is biologically meaningfulpotentially even beyond alignment. In comparing networkalignment methods (Guzzi and Milenkovic, 2018) also foundthat methods that do very well according to the topologicalquality measures are not very good as far as functional qualityis concerned. The interpretability of the embedding space is oneof the primary benefits of embedding techniques over standardapproaches in the case of network alignment. For example,the embedding space learned by MuNK captures biologicalinformation beyond pairwise node alignment, specifically, cross-species synthetic lethal interactions (Fan et al., 2017).
Community DetectionOne of the natural uses of a network is the identificationof clusters, or modules of similar nodes, a task known ascommunity detection (Fortunato, 2010). Community detectionmethods (Figure 1C) have great uses in biology from protein
module identification to disease subnetwork discovery (Ghiassianet al., 2015; Menche et al., 2015). Among the most popularcommunity detection methods on networks are random walk-based approaches including Louvain (Blondel et al., 2008),Infomap (Rosvall and Bergstrom, 2011), Label propagation(Raghavan et al., 2007), and Walktrap (Pons and Latapy, 2005),that came up as best performers in a review comparing theseand other approaches (Yang et al., 2016). Originally developedfor community detection in social networks, these methods arefrequently used in biology (Barabási et al., 2011), for example toidentify cancer drivers (Cantini et al., 2015).
Network embedding for the purpose of community detectionwas covered in a recent review (Hamilton et al., 2017b).The authors hypothesized that due to vector-like embeddingrepresentation of a network, there is a wider range of clusteringand community detection methods that can be applied toembedded networks as compared to graphs directly. Theauthors further introduced an encoder-decoder frameworkthat unifies many of the recently popularized approaches,including DeepWalk (Perozzi et al., 2014a) and node2vec (Groverand Leskovec, 2016). A geometric approach, not covered inthe review, suggests a scalable embedding of networks in ahyperbolic circle and show that the popular random walk-based community detection methods (Louvain, Infomap, Labelpropagation, and Walktrap) can be significantly boosted whenapplied to hyperbolic distances (Muscoloni et al., 2017).
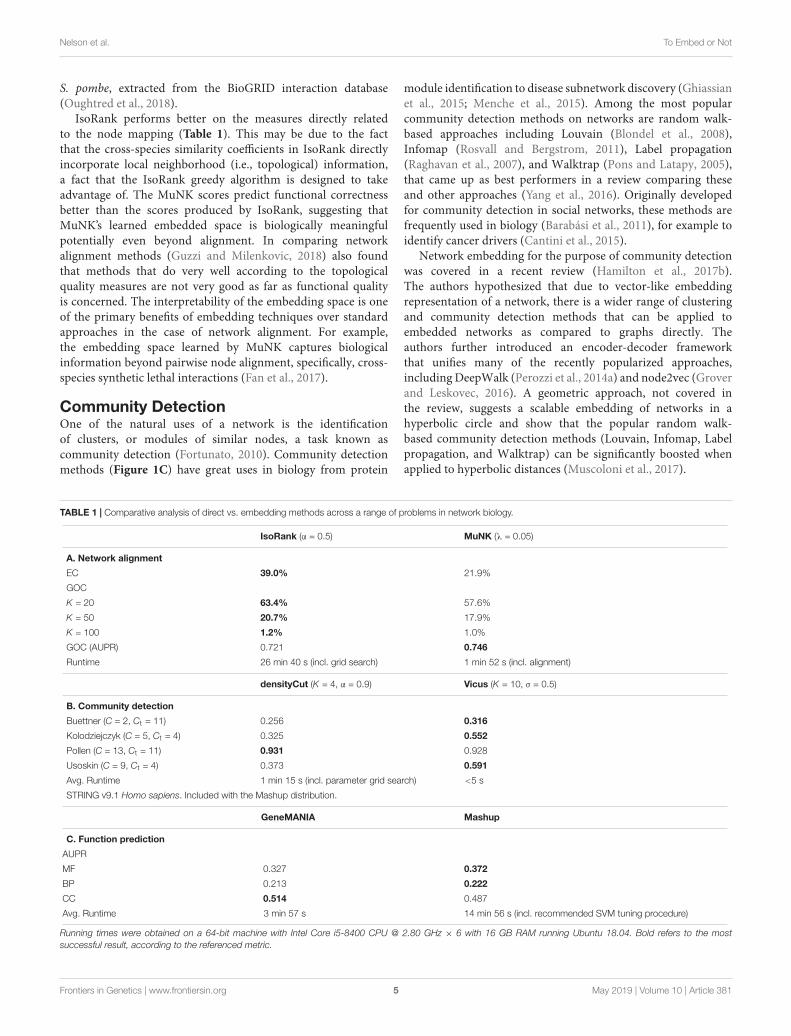
TABLE 1 | Comparative analysis of direct vs. embedding methods across a range of problems in network biology.
IsoRank (α = 0.5) MuNK (λ = 0.05)
A. Network alignment
EC 39.0% 21.9%
GOC
K = 20 63.4% 57.6%
K = 50 20.7% 17.9%
K = 100 1.2% 1.0%
GOC (AUPR) 0.721 0.746
Runtime 26 min 40 s (incl. grid search) 1 min 52 s (incl. alignment)
densityCut (K = 4, α = 0.9) Vicus (K = 10, σ = 0.5)
B. Community detection
Buettner (C = 2, Ct = 11) 0.256 0.316
Kolodziejczyk (C = 5, Ct = 4) 0.325 0.552
Pollen (C = 13, Ct = 11) 0.931 0.928
Usoskin (C = 9, Ct = 4) 0.373 0.591
Avg. Runtime 1 min 15 s (incl. parameter grid search) <5 s
STRING v9.1 Homo sapiens. Included with the Mashup distribution.
GeneMANIA Mashup
C. Function prediction
AUPR
MF 0.327 0.372
BP 0.213 0.222
CC 0.514 0.487
Avg. Runtime 3 min 57 s 14 min 56 s (incl. recommended SVM tuning procedure)
Running times were obtained on a 64-bit machine with Intel Core i5-8400 CPU @ 2.80 GHz × 6 with 16 GB RAM running Ubuntu 18.04. Bold refers to the mostsuccessful result, according to the referenced metric.
Frontiers in Genetics | www.frontiersin.org 5 May 2019 | Volume 10 | Article 381
fgene-10-00381 April 29, 2019 Time: 15:10 # 6
Nelson et al. To Embed or Not
We compared two community detection methods, anembedding-based and a graph-based, on the problem of single-cell RNA-seq (scRNA-seq) analysis. scRNA-seq data has recentlyemerged as a powerful tool to decipher the heterogeneity of cellpopulations. This is an important and growing area of networkapplications where community detection methods are usedto perform clustering on the constructed cell-to-cell networks(Wang et al., 2018). Given a gene expression matrix, Gaussiankernel is usually adopted to construct a pairwise similaritynetwork in which nodes represent cells and edge weights depictthe similarity between cells.
The first method is Vicus, a generalization of spectralclustering, which we combined with k-means clustering inthe embedded space. For the network-based approach, weused densityCut, a random walk-based community detectionmethod, which approximates clusters using the density oflocal neighborhoods. The densityCut method approximatesthe true network using a k-nearest neighbor graph, andselects the number of clusters using an automated procedure.Therefore, this number of clusters was used as input to thek-means step of the Vicus evaluation. We used four scRNA-seqdatasets, all from Mus musculus (Pollen et al., 2014; Buettneret al., 2015; Kolodziejczyk et al., 2015; Usoskin et al., 2015)but which vary according to tissue of origin (neural, bloodand stem cells) and have known ground truth labels. Weevaluated performance using normalized mutual information(NMI). Vicus outperformed densityCut on three of the fourdatasets (Table 1).
Function PredictionAnother fundamental problem in network biology is theinference of protein function from the known functions ofits network neighbors (Sharan et al., 2007). The earliestapproach to this problem, neighborhood counting (Schwikowskiet al., 2000), predicted a protein to be involved in a certainfunction if a sufficient number of its direct (or up to somespecified distance) neighbors had this property. Current stateof the art methods are based on similar guilt-by-associationprinciples (Figure 1E). For example, Cao et al. (2013) definea distance metric between proteins that is based on networkdiffusion, thus capturing similarities that are based on multiplepaths in the network.
These single-network methods were generalized in severalways (Cho et al., 2016) integrate information across multiplenetworks and use a low rank approximation of the networkdiffusion based similarities to reduce potential noise. Theintegration challenge is also tackled by (Gligorijevic et al.,2018) who learn a compact node representation usingdeep autoencoders. In Fan et al. (2017), the cross-speciesembedding is utilized to infer protein function. Zitnik andLeskovec (2017) suggest a network embedding approachfor predicting tissue-specific protein function, whichencourages proteins to share features not only with theirnetwork neighbors but also with proteins that are active insimilar tissues.
Two recent methods were compared on the task ofprotein function prediction using multiple interaction networks.
GeneMANIA performs label diffusion, while Mashup findsan embedding for each of the proteins, allowing one to usetraditional classification techniques such as support vectormachines (SVMs). The area under the precision-recall curve(AUPR) was used as an evaluation metric. Overall, Mashupperformed better with respect to molecular function andbiological process annotations, while GeneMANIA performedbetter on the cellular compartment annotation (Table 1).
Network DenoisingThe application of network biology techniques to experimentaldata depends on the accuracy and completeness of the networkof interest. The challenge of noisy interaction measurementsplagues many different types of biological networks, such asHi-C interaction networks (Rao et al., 2014), cell–cell interactionnetworks (Wang et al., 2017b), and PPI networks (Saito et al.,2002; Przulj et al., 2004; Chua and Wong, 2008; Highamet al., 2008; Kuchaiev et al., 2009; You et al., 2010; Marraset al., 2011; Alanis-Lobato et al., 2013; Cannistraci et al.,2013; Newman, 2018a,b). Such noise adversely impacts theperformance of downstream analysis, calling for methods fornetwork denoising.
The most common approach to denoise any given networkis to perform diffusions on the network to exploit high-order structures that can potentially improve the qualitiesof the direct links between nodes. Diffusion maps (Coifmanet al., 2005) employ high-order random walks and thenuse spectral decomposition to construct an affinity measure.A tensor-based dynamical model (Wang et al., 2012) aimsto search high-order paths between pairs of objects throughtheir common nearest neighbors. A low-rank constraint hasbeen employed to help denoise the network manifold (Wangand Tu, 2013). Diffusion-state distance (DSD) (Cao et al.,2013) was utilized to denoise PPI networks and improve thesignal-to-noise ratio for better prediction of protein functions.To tackle the problem of transitive edges in networks in acomputationally efficient way (Feizi et al., 2013) proposed asimple closed-form solution, called Network Deconvolution(ND), to infer direct links.
An alternative direction of network denoising takesembedding-based approaches. For instance, Mashup (Choet al., 2016) aims to learn compact low-dimensional vectorrepresentation of proteins that best explains their wiringpatterns for the input protein–protein association networksby applying a matrix factorization method on the diffusednetwork. The embeddings of the nodes (proteins) reflect therelational structures of the original network, therefore facilitatingthe downstream applications by feeding the embeddings to asupport vector machine.
A recent study (Wang et al., 2018) performed an in-depthcomparison between these network denoising methods in threedifferent experimental settings: PPI function predictions, HiCnetwork module detection, and species identification. The studyhighlighted the advantages of embedding-based methods such asMashup (Cho et al., 2016) when the network contains distinctcluster structures and the noise level is small. However, it alsoshowed that when the cluster structures are corrupted by high
Frontiers in Genetics | www.frontiersin.org 6 May 2019 | Volume 10 | Article 381

fgene-10-00381 April 29, 2019 Time: 15:10 # 7
Nelson et al. To Embed or Not
noise, existing methods usually fail to uncover the underlyingnetwork structure.
PharmacogenomicsModern pharmaceutical research faces challenges withdecreasing productivity in drug development and apersistent gap between therapeutic needs and availabletreatments (Hodos et al., 2016; Moffat et al., 2017).Network approaches have emerged as a promisingdirection to address these challenges and improve ourunderstanding of the therapeutic and side effects of drugs(Hopkins, 2008; Berger and Iyengar, 2009). We reviewthree practically important problems within the realm ofpharmacogenomics that have been tackled with networkembedding methods: drug-target prediction, drug–druginteraction prediction and prediction problems involvingsmall molecules.
Drugs influence biological systems by binding to targetproteins and affecting their downstream activity (Imminget al., 2006). Network approaches formulate drug–targetinteraction prediction as a link prediction task on a graph
of drugs/chemicals and the proteins which they interact with(Yildirim et al., 2007; Yamanishi et al., 2010; Perlman et al.,2011; Chen et al., 2012; Cheng et al., 2012; Gönen, 2012;Isik et al., 2015; Zitnik and Zupan, 2016; Luo et al., 2017;Wen et al., 2017; Lee and Nam, 2018). Given such a graph(Crichton et al., 2018) use various node embedding methods,including node2vec (Grover and Leskovec, 2016), DeepWalk(Perozzi et al., 2014b), and LINE (Tang et al., 2015), toembed nodes into a compact vector space in a mannerthat preserves local network structure. As a result, drugswith many shared target proteins obtain similar embeddings,and vice-versa, proteins targeted by similar drugs obtainsimilar embeddings. These embeddings are thus well-suited forpredicting drug–target interactions by calculating the similaritybetween embeddings representing the drug and the protein,or by using embeddings as inputs to a machine learningmethod (Crichton et al., 2018). Alternatively, predictions canbe made in an end-to-end fashion, where a neural networklearns node embeddings and predicts interactions directlyfrom the graph (Wang and Zeng, 2013; Gao et al., 2018;Wan et al., 2018).
TABLE 2 | A summary of network embedding tools and their applications.
Name of the tool Availability What was it applied to
Denoising
Network enhancement Matlab code http://snap.stanford.edu/ne/ Hi-C interaction networks combining gene interactionnetworks across tissues
Single-cell representation learning Binary https://github.com/SuntreeLi/SCRL Single-cell RNA-seq data
Geometric denoising http://kuchaev.com/Denoising/ PPI networks
Network alignment
MuNK Python code and all Anaconda-reproducible experimentshttps://github.com/lrgr/munk
Cross-species functional PPIs (yeast, mouse, human)
Community detection
Minimum curvilinearity embedding II https://sites.google.com/site/carlovittoriocannistraci/5-datasets-and-matlab-code/minimum-curvilinearity-ii-april-2012
(i) Cerebrospinal fluid proteomics – neuropathic pain
(ii) Transcription factor expressions – tissue prediction
Vicus Single-cell RNA-seq:
(i) Pollen – neural and stem cells
(ii) Usoskin – mouse neurons, sensory subtypes
(iii) Buettner – embryonic stem cells
(iv) Kolodziejczyk – pluripotent cells
Coalescent embedding https://github.com/biomedical-cybernetics/coalescent_embedding
Non-biological
Function prediction
Mashup http://cb.csail.mit.edu/cb/mashup/ Protein function prediction, gene ontology reconstruction,and genetic interaction prediction
OhmNet http://snap.stanford.edu/ohmnet/ Tissue-specific gene function prediction
Disease gene discovery http://snap.stanford.edu/pathways/ Disease pathway detection
Pharmacogenomics
Molecular fingerprints https://github.com/HIPS/neural-fingerprint Prediction of molecular properties, including drug efficacy,solubility, and photovoltaic efficiency
Decagon http://snap.stanford.edu/decagon/ (i) Polypharmacy side-effect prediction
(ii) Drug–drug interaction prediction
Graph convolutional policy network https://github.com/bowenliu16/rl_graph_generation Molecular graph generation
Residual LSTM Embeddings https://github.com/deepchem/deepchem (i) Drug side-effect prediction
(ii) Drug toxicity prediction
Frontiers in Genetics | www.frontiersin.org 7 May 2019 | Volume 10 | Article 381
fgene-10-00381 April 29, 2019 Time: 15:10 # 8
Nelson et al. To Embed or Not
Detecting drug–drug interactions, in which the activity of onedrug changes, favorably or unfavorably, if taken with anotherdrug, is an important challenge with significant implicationsfor patient mortality and morbidity (Chan and Giaccia, 2011;Guthrie et al., 2015; Han et al., 2017). Ma et al. (2018) modeleach drug as a node in a multi-view drug association graph,where edges between drugs in different views encode differenttypes of similarity between drugs. The approach uses graphconvolutional networks (Kipf and Welling, 2016) to embedthe multi-view graph and attentive mechanisms (Velickovicet al., 2018) to fuse information from multiple views and tomake learning more interpretable. By such embedding, theapproach learns a similarity score between any two drugs anduses the scores to predict drug–drug interactions. While suchan approach can be useful to describe drug interactions atthe cellular level (Sridhar et al., 2016; Ryu et al., 2018), itcannot predict the safety or side effects of drug combinations.To identify the side effects of drug combinations and provideguidance on the development of new drug therapies (Zitniket al., 2018) developed an embedding approach that constructsa multi-modal graph of PPIs, drug–protein interactions, anddrug–drug interactions, where each drug–drug interaction islabeled by a different edge type signifying the type of theside effect. The approach takes the multi-modal graph anduses graph neural networks as an embedding methodology todistill information about each node’s network neighborhood intoan embedding vector without any hand-engineering. The finalapproach is an end-to-end method for predicting side effects ofdrug combinations that considers all types of side effects at once.The approach learns embeddings of side effects that are indicativeof polypharmacy in patients.
Chemical prediction problems represent another class ofpractically important graph problems (Ralaivola et al., 2005;Altae-Tran et al., 2017; Gilmer et al., 2017; Gómez-Bombarelliet al., 2018). One key distinction between these problemsand standard network prediction tasks discussed above isthat chemical prediction problems are graph-level classificationproblems where individual data examples are graphs (ratherthan nodes) representing small molecules. Typical predictiontasks aim to predict various molecular properties such asdrug efficacy or solubility (Coley et al., 2017; Jin et al.,2017), predict which drugs bind to which target proteins(Morris et al., 2018), and identify sites at which a particularcandidate drug binds to a target protein (Feinberg et al.,2018). The input to a predictor is a small molecule, which iscommonly represented as a graph in which nodes and edgesrepresent atoms and bonds between atoms, respectively. Onedifficulty with such inputs is that molecular graphs can beof arbitrary size and shape (Niepert et al., 2016; Xu et al.,2017). However, currently, most machine learning pipelines canonly handle inputs of a fixed size. For this reason, state-of-the-art systems use embedding techniques to embed moleculargraphs into fixed-dimensional embeddings and then use thelearned representations as inputs to a fully connected deepneural network or other standard machine learning methods(Duvenaud et al., 2015; Kearnes et al., 2016). The proposedgraph convolution models do not yet consistently outperform
traditional structural-based fingerprints, however, their flexibilityand potential for further optimization and development have ledto models that provide significant boosts in the predictive powerover older fingerprints.
CONCLUSION
We have reviewed several classes of approaches for networkembedding, including spectral-based methods, random-walkbased approaches and deep neural network techniques. We havedemonstrated the utility of these approaches in a broad set ofapplications, ranging from network alignment to communitydetection, protein function prediction, and network denoising.We have also discussed recent embedding approaches inpharmacogenomics. We were interested in seeing whether thefield of network embedding indeed enhances the types ofquestions that can be answered using graph-based approachesand our conclusion is that there is value in both graph-based andgraph-embedding-based methods in a variety of applications.
In our experiments we found that depending on the taskat hand and metric used, sometimes graph-based methodsoutperformed network embedding tools. This was the casewith, for example, IsoRank beating MuNK with respect toedge conservation in network alignment, whereas MuNKoutperformed IsoRank according to the area under the precisionrecall curve with respect to node mapping. In communitydetection experiments, our results were reversed, where theembedding method outperformed the graph-based method 3 outof 4 times. In fact, there is no single metric according to whichone type of method is consistently better than the other. Evenin compute time, where embedding methods outperform graph-based methods most of the time, on the function prediction taskgraph-based GeneMANIA outperforms the embedding methodMashup. This implies that the choice of graph-based versusembedding-based method will depend on many factors, not justthe task at hand, but also the aspect or evaluation measure ofhighest importance to the user.
The network embedding principles create new opportunitiesto model large network datasets and move beyond standardprediction tasks of node classification, link prediction, and nodeclustering. For example, given a partially observed network ofinteractions between drugs, diseases, and proteins, one might beinterested in posing a logical query: “What proteins are likely tobe associated with diseases that have both symptoms X and Y?”Such a query requires reasoning about all possible proteins thatmight be associated with at least two diseases, which, in turn,clinically manifest through symptoms X and Y. Valid answers tosuch queries correspond to subgraphs. Since edges in the networkmight be missing because of biotechnological limits and naturalvariation, naively answering the queries requires enumerationover all possible combinations of diseases (Hamilton et al.,2018) developed a network embedding approach that answerssuch complex logical queries and achieves a time complexitylinear in the size of a query, compared to the exponentialcomplexity required by a naive enumeration-based approach.The approach embeds nodes into a low-dimensional space and
Frontiers in Genetics | www.frontiersin.org 8 May 2019 | Volume 10 | Article 381

fgene-10-00381 April 29, 2019 Time: 15:10 # 9
Nelson et al. To Embed or Not
represents logical operators as learned geometric operationsin this embedding space. They demonstrated the utility ofthe approach in a study involving a biomedical network ofdrugs, diseases, proteins, side effects, and protein functions withmillions of edges.
We summarize network embedding tools that are used in thebiomedical field in Table 2. We expect the importance of thesetools to grow with the magnitude and complexity of biomedicaldata that are being generated.
AUTHOR CONTRIBUTIONS
WN did the performance comparisons. All authors participatedin writing the manuscript.
FUNDING
AG and RS were supported by a TAU-UOT cooperation grant.
REFERENCESAladag, A. E., and Erten, C. (2013). SPINAL: scalable protein interaction network
alignment. Bioinformatics 29, 917–924. doi: 10.1093/bioinformatics/btt071Alanis-Lobato, G., Cannistraci, C. V., and Ravasi, T. (2013). Exploitation of genetic
interaction network topology for the prediction of epistatic behavior. Genomics102, 202–208. doi: 10.1016/j.ygeno.2013.07.010
Alanis-Lobato, G., Mier, P., and Andrade-Navarro, M. (2018). The latent geometryof the human protein interaction network. Bioinformatics 34, 2826–2834. doi:10.1093/bioinformatics/bty206
Alanis-Lobato, G., Mier, P., and Andrade-Navarro, M. A. (2016). Manifold learningand maximum likelihood estimation for hyperbolic network embedding. Appl.Netw. Sci. 1:10. doi: 10.1007/s41109-016-0013-0
Altae-Tran, H., Ramsundar, B., Pappu, A. S., and Pande, V. (2017). Low datadrug discovery with one-shot learning. ACS Cent. Sci. 3, 283–293. doi: 10.1021/acscentsci.6b00367
Barabási, A.-L., Gulbahce, N., and Loscalzo, J. (2011). Network medicine: anetwork-based approach to human disease. Nat. Rev. Genet. 12, 56–68. doi:10.1038/nrg2918
Barabási, A.-L., and Oltvai, Z. N. (2004). Network biology: understanding the cell’sfunctional organization. Nat. Rev. Genet. 5, 101–113. doi: 10.1038/nrg1272
Barthélemy, M. (2011). Spatial networks. Phys. Rep. 499, 1–101.Baryshnikova, A. (2018). Spatial analysis of functional enrichment (SAFE) in large
biological networks. Methods Mol. Biol. 1819, 249–268. doi: 10.1007/978-1-4939-8618-7_12
Belkin, M., and Niyogi, P. (2003). Laplacian eigenmaps for dimensionalityreduction and data representation. Neural Comput. 15, 1373–1396. doi: 10.1162/089976603321780317
Berger, S. I., and Iyengar, R. (2009). Network analyses in systems pharmacology.Bioinformatics 25, 2466–2472. doi: 10.1093/bioinformatics/btp465
Blondel, V. D., Guillaume, J.-L., Lambiotte, R., and Lefebvre, E. (2008). Fastunfolding of communities in large networks. J. Stat. Mech. 2008:10008.
Buettner, F., Natarajan, K. N., Casale, F. P., Proserpio, V., Scialdone, A., Theis, F. J.,et al. (2015). Computational analysis of cell-to-cell heterogeneity in single-cellRNA-sequencing data reveals hidden subpopulations of cells. Nat. Biotechnol.33, 155–160. doi: 10.1038/nbt.3102
Cai, H., Zheng, V. W., and Chang, K. C.-C. (2018). A comprehensive survey ofgraph embedding: problems, techniques, and applications. IEEE Trans. Knowl.Data Eng. 30, 1616–1637. doi: 10.1109/tkde.2018.2807452
Cannistraci, C. V., Alanis-Lobato, G., and Ravasi, T. (2013). Minimumcurvilinearity to enhance topological prediction of protein interactions bynetwork embedding. Bioinformatics 29, i199–i209. doi: 10.1093/bioinformatics/btt208
Cantini, L., Medico, E., Fortunato, S., and Caselle, M. (2015). Detection of genecommunities in multi-networks reveals cancer drivers. Sci. Rep. 5: 17386.
Cao, M., Zhang, H., Park, J., Daniels, N. M., Crovella, M. E., Cowen, L. J., et al.(2013). Going the distance for protein function prediction: a new distancemetric for protein interaction networks. PLoS One 8:e76339. doi: 10.1371/journal.pone.0076339
Chamberlain, B. P., Clough, J., and Deisenroth, M. P. (2017). Neural embeddings ofgraphs in hyperbolic space. arXiv:1705.10359 [Preprint]. doi: 10.1371/journal.pone.0076339
Chan, D. A., and Giaccia, A. J. (2011). Harnessing synthetic lethal interactions inanticancer drug discovery. Nat. Rev. Drug Discov. 10, 351–364. doi: 10.1038/nrd3374
Chen, X., Liu, M.-X., and Yan, G.-Y. (2012). Drug-target interaction predictionby random walk on the heterogeneous network. Mol. Biosyst. 8, 1970–1978.
Cheng, F., Liu, C., Jiang, J., Lu, W., Li, W., Liu, G., et al. (2012). Prediction of drug-target interactions and drug repositioning via network-based inference. PLoSComput. Biol. 8:e1002503. doi: 10.1371/journal.pcbi.1002503
Cho, H., Berger, B., and Peng, J. (2016). Compact integration of multi-networktopology for functional analysis of genes. Cell Syst. 3, 540.e5–548.e5.
Chua, H. N., and Wong, L. (2008). Increasing the reliability of proteininteractomes. Drug Discov. Today 13, 652–658. doi: 10.1016/j.drudis.2008.05.004
Clark, C., and Kalita, J. (2014). A comparison of algorithms for the pairwisealignment of biological networks. Bioinformatics 30, 2351–2359. doi: 10.1093/bioinformatics/btu307
Coifman, R. R., Lafon, S., Lee, A. B., Maggioni, M., Nadler, B., Warner, F., et al.(2005). Geometric diffusions as a tool for harmonic analysis and structuredefinition of data: diffusion maps. Proc. Natl. Acad. Sci. U.S.A. 102, 7426–7431.doi: 10.1073/pnas.0500334102
Coley, C. W., Barzilay, R., Green, W. H., Jaakkola, T. S., and Jensen, K. F. (2017).Convolutional embedding of attributed molecular graphs for physical propertyprediction. J. Chem. Inf. Model. 57, 1757–1772. doi: 10.1021/acs.jcim.6b00601
Cox, T. F., and Cox, M. A. A. (2000). Multidimensional Scaling, 2nd Edn. BocaRaton, FL: CRC Press.
Crichton, G., Guo, Y., Pyysalo, S., and Korhonen, A. (2018). Neural networks forlink prediction in realistic biomedical graphs: a multi-dimensional evaluation ofgraph embedding-based approaches. BMC Bioinformatics 19:176. doi: 10.1186/s12859-018-2163-9
Defferrard, M., Bresson, X., and Vandergheynst, P. (2016). “Convolutional neuralnetworks on graphs with fast localized spectral filtering,” in Proceedings ofthe 30th Conference on Neural Information Processing Systems (NIPS 2016)(Barcelona: NIPS), 3844–3852.
Duvenaud, D. K., Maclaurin, D., Iparraguirre, J., Bombarell, R., Hirzel, T., Aspuru-Guzik, A., et al. (2015). “Convolutional networks on graphs for learningmolecular fingerprints,” in Proceedings of the Advances in Neural InformationProcessing Systems 28 (NIPS 2015) (Barcelona: NIPS), 2224–2232.
Eades, P. (1984). A heuristic for graph drawing. Congr. Numer. 42, 149–160.Emmert-Streib, F., Dehmer, M., and Shi, Y. (2016). Fifty years of graph matching,
network alignment and network comparison. Inf. Sci. 34, 180–197. doi: 10.1016/j.ins.2016.01.074
Fan, J., Cannistra, A., Fried, I., Lim, T., Schaffner, T., Crovella, M., et al. (2017).A multi-species functional embedding integrating sequence and networkstructure. bioRxiv [Preprint].
Feinberg, E. N., Sur, D., Husic, B. E., Mai, D., Li, Y., Yang, J., et al. (2018). Spatialgraph convolutions for drug discovery. arXiv:1803.04465 [Preprint].
Feizi, S., Marbach, D., Médard, M., and Kellis, M. (2013). Network deconvolutionas a general method to distinguish direct dependencies in networks. Nat.Biotechnol. 31, 726–733. doi: 10.1038/nbt.2635
Fortunato, S. (2010). Community detection in graphs. Phys. Rep. 486, 75–174.doi: 10.1016/j.physrep.2009.11.002
Fruchterman, T. M. J., and Reingold, E. M. (1991). Graph Drawing by Force-Directed Placement. Hoboken, NJ: Wiley.
Gao, K. Y., Fokoue, A., Luo, H., Iyengar, A., Dey, S., and Zhang, P. (2018).“Interpretable drug target prediction using deep neural representation,” inProceedings of the Conference: Twenty-Seventh International Joint Conferenceon Artificial Intelligence (New York, NY: IJCAI), 3371–3377.
Frontiers in Genetics | www.frontiersin.org 9 May 2019 | Volume 10 | Article 381

fgene-10-00381 April 29, 2019 Time: 15:10 # 10
Nelson et al. To Embed or Not
Ghiassian, S. D., Menche, J., and Barabási, A.-L. (2015). A DIseAseMOdule detection (DIAMOnD) algorithm derived from a systematicanalysis of connectivity patterns of disease proteins in the humaninteractome. PLoS Comput. Biol. 11:e1004120. doi: 10.1371/journal.pcbi.1004120
Gibson, H., Faith, J., and Vickers, P. (2013). A survey of two-dimensional graphlayout techniques for information visualisation. Inf. Visual. 12, 324–357. doi:10.1177/1473871612455749
Gilmer, J., Schoenholz, S. S., Riley, P. F., Vinyals, O., and Dahl, G. E. (2017). Neuralmessage passing for quantum chemistry. arXiv:1704.01212v2 [Preprint].
Gligorijevic, V., Barot, M., and Bonneau, R. (2018). deepNF: deep network fusionfor protein function prediction. Bioinformatics 34, 3873–3881. doi: 10.1093/bioinformatics/bty440
Gómez-Bombarelli, R., Wei, J. N., Duvenaud, D., Hernández-Lobato, J. M.,Sánchez-Lengeling, B., Sheberla, D., et al. (2018). Automatic chemical designusing a data-driven continuous representation of molecules. ACS Cent. Sci. 4,268–276. doi: 10.1021/acscentsci.7b00572
Gönen, M. (2012). Predicting drug-target interactions from chemical and genomickernels using Bayesian matrix factorization. Bioinformatics 28, 2304–2310. doi:10.1093/bioinformatics/bts360
Grover, A., and Leskovec, J. (2016). “node2vec: scalable feature learning fornetworks,” in Proceedings of the International Conference on KnowledgeDiscovery and Data Mining (KDD), Vol. 22 (New York, NY: ACM), 855–864.
Guthrie, B., Makubate, B., Hernandez-Santiago, V., and Dreischulte, T. (2015). Therising tide of polypharmacy and drug-drug interactions: population databaseanalysis 1995–2010. BMC Med. 13:74. doi: 10.1186/s12916-015-0322-7
Guzzi, P. H., and Milenkovic, T. (2018). Survey of local and global biologicalnetwork alignment: the need to reconcile the two sides of the same coin. Brief.Bioinform. 19, 472–481.
Hamilton, W. L., Bajaj, P., Zitnik, M., Jurafsky, D., and Leskovec, J.(2018). Embedding logical queries on knowledge graphs. arXiv:1806.01445v3[Preprint].
Hamilton, W. L., Ying, R., and Leskovec, J. (2017a). Inductive representationlearning on large graphs. arxiv.
Hamilton, W. L., Ying, R., and Leskovec, J. (2017b). Representation learning ongraphs: methods and applications. arxiv.
Han, K., Jeng, E. E., Hess, G. T., Morgens, D. W., Li, A., and Bassik, M. C. (2017).Synergistic drug combinations for cancer identified in a CRISPR screen forpairwise genetic interactions. Nat. Biotechnol. 35, 463–474. doi: 10.1038/nbt.3834
Heimann, M., Shen, H., Safavi, T., and Koutra, D. (2018). “REGAL: representationlearning-based graph alignment,” in Proceedings of the 27th ACM InternationalConference on Information and Knowledge Management – CIKM ’18 (New York,NY: ACM), doi: 10.1145/3269206.3271788
Higham, D. J., Rašajski, M., and Pržulj, N. (2008). Fitting a geometric graphto a protein–protein interaction network. Bioinformatics 24, 1093–1099. doi:10.1093/bioinformatics/btn079
Hodos, R. A., Kidd, B. A., Shameer, K., Readhead, B. P., and Dudley, J. T. (2016).In silico methods for drug repurposing and pharmacology. Wiley Interdiscip.Rev. Syst. Biol. Med. 8, 186–210. doi: 10.1002/wsbm.1337
Hopkins, A. L. (2008). Network pharmacology: the next paradigm in drugdiscovery. Nat. Chem. Biol. 4, 682–690. doi: 10.1038/nchembio.118
Imming, P., Sinning, C., and Meyer, A. (2006). Drugs, their targets and the natureand number of drug targets. Nat. Rev. Drug Discov. 5, 821–834. doi: 10.1038/nrd2132
Isik, Z., Baldow, C., Cannistraci, C. V., and Schroeder, M. (2015). Drug targetprioritization by perturbed gene expression and network information. Sci. Rep.5:17417.
Jin, W., Coley, C., Barzilay, R., and Jaakkola, T. (2017). “Predicting organic reactionoutcomes with weisfeiler-lehman network,” in Advances in Neural InformationProcessing Systems 30, eds I. Guyon, U. V. Luxburg, S. Bengio, H. Wallach,R. Fergus, S. Vishwanathan, et al. (New York, NY: Curran Associates, Inc.),2607–2616.
Kearnes, S., McCloskey, K., Berndl, M., Pande, V., and Riley, P. (2016). Moleculargraph convolutions: moving beyond fingerprints. J. Comput. Aided Mol. Des.30, 595–608. doi: 10.1007/s10822-016-9938-8
Kelley, B. P., Sharan, R., Karp, R. M., Sittler, T., Root, D. E., Stockwell, B. R., et al.(2003). Conserved pathways within bacteria and yeast as revealed by global
protein network alignment. Proc. Natl. Acad. Sci. U.S.A. 100, 11394–11399.doi: 10.1073/pnas.1534710100
Kipf, T. N., and Welling, M. (2016). Semi-supervised classification with graphconvolutional networks. arXiv:1609.02907v4 [Preprint].
Kolodziejczyk, A. A., Kim, J. K., Tsang, J. C. H., Ilicic, T., Henriksson, J., Natarajan,K. N., et al. (2015). Single cell RNA-sequencing of pluripotent states unlocksmodular transcriptional variation. Cell Stem Cell 17, 471–485. doi: 10.1016/j.stem.2015.09.011
Kuchaiev, O., Rasajski, M., Higham, D. J., and Przulj, N. (2009). Geometricde-noising of protein-protein interaction networks. PLoS Comput. Biol.5:e1000454. doi: 10.1371/journal.pcbi.1000454
Kulmanov, M., Khan, M. A., Hoehndorf, R., and Wren, J. (2017). DeepGO:predicting protein functions from sequence using a deep ontology-aware classifier. Bioinformatics 34, 660–668. doi: 10.1093/bioinformatics/btx624
Lee, I., and Nam, H. (2018). Identification of drug-target interaction by a randomwalk with restart method on an interactome network. BMC Bioinformatics19:208. doi: 10.1186/s12859-018-2199-x
Li, G., Luo, J., Xiao, Q., Liang, C., Ding, P., and Cao, B. (2017). PredictingMicroRNA-disease associations using network topological similarity based ondeepwalk. IEEE Access 5, 24032–24039. doi: 10.1109/access.2017.2766758
Luo, Y., Zhao, X., Zhou, J., Yang, J., Zhang, Y., Kuang, W., et al. (2017). A networkintegration approach for drug-target interaction prediction and computationaldrug repositioning from heterogeneous information. Nat. Commun. 8:573.
Ma, T., Xiao, C., Zhou, J., and Wang, F. (2018). Drug similarity integration throughattentive multi-view graph auto-encoders. arXiv:1804.10850v1 [Preprint].
Marras, E., Travaglione, A., and Capobianco, E. (2011). Manifold learning inprotein interactomes. J. Comput. Biol. 18, 81–96. doi: 10.1089/cmb.2009.0258
Menche, J., Sharma, A., Kitsak, M., Ghiassian, S. D., Vidal, M., Loscalzo, J., et al.(2015). Disease networks. Uncovering disease-disease relationships through theincomplete interactome. Science 347:1257601. doi: 10.1126/science.1257601
Moffat, J. G., Vincent, F., Lee, J. A., Eder, J., and Prunotto, M. (2017). Opportunitiesand challenges in phenotypic drug discovery: an industry perspective. Nat. Rev.Drug Discov. 16, 531–543. doi: 10.1038/nrd.2017.111
Morris, P., DaSilva, Y., Clark, E., Hahn, W. E., and Barenholtz, E. (2018).“Convolutional neural networks for predicting molecular binding affinity toHIV-1 proteins,” in Proceedings of the 2018 ACM International Conferenceon Bioinformatics, Computational Biology, and Health Informatics BCB ’18(New York, NY: ACM), 220–225.
Moyano, L. G. (2017). Learning network representations. Eur. Phys. J. Spec. Top.226, 499–518.
Muscoloni, A., Thomas, J. M., Ciucci, S., Bianconi, G., and Cannistraci, C. V.(2017). Machine learning meets complex networks via coalescent embeddingin the hyperbolic space. Nat. Commun. 8:1615.
Newman, M. E. J. (2018a). Estimating network structure from unreliablemeasurements. Phys. Rev. E 98:062321.
Newman, M. E. J. (2018b). Network structure from rich but noisy data. Nat. Phys.14, 542–545. doi: 10.1038/s41567-018-0076-1
Niepert, M., Ahmed, M., and Kutzkov, K. (2016). “Learning convolutional neuralnetworks for graphs,” in Proceedings of the International Conference on MachineLearning (jmlr.org), Bejing, 2014–2023.
Oughtred, R., Stark, C., Breitkreutz, B.-J., Rust, J., Boucher, L., Chang, C., et al.(2018). The BioGRID interaction database: 2019 update. Nucleic Acids Res. 47,D529–D541.
Papadopoulos, F., Aldecoa, R., and Krioukov, D. (2015). Network geometryinference using common neighbors. Phys. Rev. E 92:022807.
Perlman, L., Gottlieb, A., Atias, N., Ruppin, E., and Sharan, R. (2011). Combiningdrug and gene similarity measures for drug-target elucidation. J. Comput. Biol.18, 133–145. doi: 10.1089/cmb.2010.0213
Perozzi, B., Al-Rfou, R., and Skiena, S. (2014a). “Deepwalk: online learning of socialrepresentations,” in Proceedings of the International Conference on KnowledgeDiscovery and Data Mining (KDD) (New York, NY: ACM), 701–710.
Perozzi, B., Al-Rfou, R., and Skiena, S. (2014b). “DeepWalk: online learning ofsocial representations,” in Proceedings of the 20th ACM SIGKDD InternationalConference on Knowledge Discovery and Data Mining KDD ’14 (New York, NY:ACM), 701–710.
Pollen, A. A., Nowakowski, T. J., Shuga, J., Wang, X., Leyrat, A. A., Lui, J. H.,et al. (2014). Low-coverage single-cell mRNA sequencing reveals cellular
Frontiers in Genetics | www.frontiersin.org 10 May 2019 | Volume 10 | Article 381

fgene-10-00381 April 29, 2019 Time: 15:10 # 11
Nelson et al. To Embed or Not
heterogeneity and activated signaling pathways in developing cerebral cortex.Nat. Biotechnol. 32, 1053–1058. doi: 10.1038/nbt.2967
Pons, P., and Latapy, M. (2005). “Computing communities in large networks usingrandom walks,” in Computer and Information Sciences – ISCIS 2005 LectureNotes in Computer Science, eds P. Yolum, T. Güngör, F. Gürgen, and C. Özturan(Berlin: Springer), 284–293. doi: 10.1007/11569596_31
Przulj, N., Corneil, D. G., and Jurisica, I. (2004). Modeling interactome: scale-free or geometric? Bioinformatics 20, 3508–3515. doi: 10.1093/bioinformatics/bth436
Raghavan, U. N., Albert, R., and Kumara, S. (2007). Near linear time algorithm todetect community structures in large-scale networks. Phys. Rev. E 76:036106.
Ralaivola, L., Swamidass, S. J., Saigo, H., and Baldi, P. (2005). Graph kernels forchemical informatics. Neural Netw. 18, 1093–1110. doi: 10.1016/j.neunet.2005.07.009
Rao, S. S. P., Huntley, M. H., Durand, N. C., Stamenova, E. K., Bochkov, I. D.,Robinson, J. T., et al. (2014). A 3D map of the human genome at kilobaseresolution reveals principles of chromatin looping. Cell 159, 1665–1680. doi:10.1016/j.cell.2014.11.021
Rosvall, M., and Bergstrom, C. T. (2011). Multilevel compression of random walkson networks reveals hierarchical organization in large integrated systems. PLoSOne 6:e18209. doi: 10.1371/journal.pone.0018209
Ryu, J. Y., Kim, H. U., and Lee, S. Y. (2018). Deep learning improves predictionof drug–drug and drug-food interactions. Proc. Natl. Acad. Sci. U.S.A. 115,E4304–E4311.
Saito, R., Suzuki, H., and Hayashizaki, Y. (2002). Interaction generality, ameasurement to assess the reliability of a protein-protein interaction. NucleicAcids Res. 30, 1163–1168. doi: 10.1093/nar/30.5.1163
Saraph, V., and Milenkoviæ, T. (2014). MAGNA: maximizing accuracy in globalnetwork alignment. Bioinformatics 30, 2931–2940. doi: 10.1093/bioinformatics/btu409
Schwikowski, B., Uetz, P., and Fields, S. (2000). A network of protein-proteininteractions in yeast. Nat. Biotechnol. 18, 1257–1261. doi: 10.1038/82360
Serrano, M. Á, Boguñá, M., and Sagués, F. (2012). Uncovering the hidden geometrybehind metabolic networks. Mol. Biosyst. 8, 843–850.
Sharan, R., and Ideker, T. (2006). Modeling cellular machinery through biologicalnetwork comparison. Nat. Biotechnol. 24, 427–433. doi: 10.1038/nbt1196
Sharan, R., Ulitsky, I., and Shamir, R. (2007). Network-based prediction of proteinfunction. Mol. Syst. Biol. 3:88.
Singh, R., Xu, J., and Berger, B. (2008). Global alignment of multiple proteininteraction networks with application to functional orthology detection.Proc. Natl. Acad. Sci. U.S.A. 105, 12763–12768. doi: 10.1073/pnas.0806627105
Sridhar, D., Fakhraei, S., and Getoor, L. (2016). A probabilistic approach forcollective similarity-based drug–drug interaction prediction. Bioinformatics 32,3175–3182. doi: 10.1093/bioinformatics/btw342
Tang, J., Qu, M., Wang, M., Zhang, M., Yan, J., and Mei, Q. (2015). “LINE: large-scale information network embedding,” in Proceedings of the 24th InternationalConference on World Wide Web WWW ’15 (Geneva: International World WideWeb Conferences Steering Committee), 1067–1077.
Tenenbaum, J. B. (2000). A global geometric framework for nonlineardimensionality reduction. Science 290, 2319–2323. doi: 10.1126/science.290.5500.2319
Tutte, W. T. (1963). How to draw a graph. Proc. Lond. Math. Soc. 3, 743–767.Usoskin, D., Furlan, A., Islam, S., Abdo, H., Lönnerberg, P., Lou, D., et al. (2015).
Unbiased classification of sensory neuron types by large-scale single-cell RNAsequencing. Nat. Neurosci. 18, 145–153. doi: 10.1038/nn.3881
Velickovic, P., Cucurull, G., Casanova, A., Romero, A., Liò, P., and Bengio, Y.(2018). Graph attention networks. arXiv:1710.10903v3 [Preprint].
Vijayan, V., Saraph, V., and Milenkoviæ, T. (2015). MAGNA++: maximizingaccuracy in global network alignment via both node and edgeconservation. Bioinformatics 31, 2409–2411. doi: 10.1093/bioinformatics/btv161
Wan, F., Hong, L., Xiao, A., Jiang, T., and Zeng, J. (2018). NeoDTI: neuralintegration of neighbor information from a heterogeneous network fordiscovering new drug-target interactions. bioRxiv [Preprint].
Wang, B., Huang, L., Zhu, Y., Kundaje, A., Batzoglou, S., and Goldenberg, A.(2017a). Vicus: exploiting local structures to improve network-based analysisof biological data. PLoS Comput. Biol. 13:e1005621. doi: 10.1371/journal.pcbi.1005621
Wang, B., Zhu, J., Pierson, E., Ramazzotti, D., and Batzoglou, S. (2017b).Visualization and analysis of single-cell RNA-seq data by kernel-based similaritylearning. Nat. Methods 14, 414–416. doi: 10.1038/nmeth.4207
Wang, B., Jiang, J., Wang, W., Zhou, Z., and Tu, Z. (2012). “Unsupervised metricfusion by cross diffusion,” in Proceedings of the 2012 IEEE Conference onComputer Vision and Pattern Recognition (Washington, DC: IEEE ComputerSociety), 2997–3004.
Wang, B., Pourshafeie, A., Zitnik, M., Zhu, J., Bustamante, C. D., Batzoglou, S.,et al. (2018). Network enhancement as a general method to denoise weightedbiological networks. Nat. Commun. 9:3108.
Wang, B., and Tu, Z. (2013). “Sparse subspace denoising for image manifolds,” inProceedings of the IEEE Conference on Computer Vision and Pattern Recognition,Seattle, WA, 468–475.
Wang, Y., and Zeng, J. (2013). Predicting drug-target interactions usingrestricted Boltzmann machines. Bioinformatics 29, i126–i134. doi: 10.1093/bioinformatics/btt234
Wen, M., Zhang, Z., Niu, S., Sha, H., Yang, R., Yun, Y., et al. (2017). Deep-learning-based drug-target interaction prediction. J. Proteome Res. 16, 1401–1409. doi:10.1021/acs.jproteome.6b00618
Xu, Z., Wang, S., Zhu, F., and Huang, J. (2017). “Seq2Seq fingerprint: anunsupervised deep molecular embedding for drug discovery,” in Proceedingsof the 8th ACM International Conference on Bioinformatics, ComputationalBiology, and Health Informatics ACM-BCB ’17 (New York, NY: ACM),285–294.
Yamanishi, Y., Kotera, M., Kanehisa, M., and Goto, S. (2010). Drug-targetinteraction prediction from chemical, genomic and pharmacological datain an integrated framework. Bioinformatics 26, i246–i254. doi: 10.1093/bioinformatics/btq176
Yang, Z., Algesheimer, R., and Tessone, C. J. (2016). A comparative analysis ofcommunity detection algorithms on artificial networks. Sci. Rep. 6:30750.
Yildirim, M. A., Goh, K.-I., Cusick, M. E., Barabási, A.-L., and Vidal, M. (2007).Drug-target network. Nat. Biotechnol. 25:1119.
You, Z.-H., Lei, Y.-K., Gui, J., Huang, D.-S., and Zhou, X. (2010). Usingmanifold embedding for assessing and predicting protein interactions fromhigh-throughput experimental data. Bioinformatics 26, 2744–2751. doi: 10.1093/bioinformatics/btq510
Zitnik, M., Agrawal, M., and Leskovec, J. (2018). Modeling polypharmacyside effects with graph convolutional networks. Bioinformatics 34,457–466.
Zitnik, M., and Leskovec, J. (2017). Predicting multicellular function throughmulti-layer tissue networks. Bioinformatics 33, i190–i198. doi: 10.1093/bioinformatics/btx252
Zitnik, M., and Zupan, B. (2016). “Collective pairwise classification for multi-wayanalysis of disease and drug data,” in Proceedings of the Pacific Symposium onBiocomputing (Bethesda MD: NIH Public Access), 81.
Zong, N., Kim, H., Ngo, V., and Harismendy, O. (2017). Deep miningheterogeneous networks of biomedical linked data to predict novel drug-target associations. Bioinformatics 33, 2337–2344. doi: 10.1093/bioinformatics/btx160
Conflict of Interest Statement: The authors declare that the research wasconducted in the absence of any commercial or financial relationships that couldbe construed as a potential conflict of interest.
Copyright © 2019 Nelson, Zitnik, Wang, Leskovec, Goldenberg and Sharan. This is anopen-access article distributed under the terms of the Creative Commons AttributionLicense (CC BY). The use, distribution or reproduction in other forums is permitted,provided the original author(s) and the copyright owner(s) are credited and that theoriginal publication in this journal is cited, in accordance with accepted academicpractice. No use, distribution or reproduction is permitted which does not complywith these terms.
Frontiers in Genetics | www.frontiersin.org 11 May 2019 | Volume 10 | Article 381