Embed Size (px)
Citation preview

Visual Acuity Is Correlated with theArea of the Foveal Avascular Zonein Diabetic Retinopathy and RetinalVein Occlusion
Chandrakumar Balaratnasingam, MD, PhD,1,2,3,4 Maiko Inoue, MD,1,2 Seungjun Ahn, MS,5
Jesse McCann, MD, PhD,1,2,3 Elona Dhrami-Gavazi, MD,1,2,3 Lawrence A. Yannuzzi, MD,1,2
K. Bailey Freund, MD1,2,3
Purpose: To determine if the area of the foveal avascular zone (FAZ) is correlated with visual acuity (VA) indiabetic retinopathy (DR) and retinal vein occlusion (RVO).
Design: Cross-sectional study.Participants: Ninety-five eyes of 66 subjects with DR (65 eyes), branch retinal vein occlusion (19 eyes), and
central retinal vein occlusion (11 eyes).Methods: Structural optical coherence tomography (OCT; Spectralis, Heidelberg Engineering) and OCT
angiography (OCTA; Avanti, Optovue RTVue XR) data from a single visit were analyzed. FAZ area, point thicknessof central fovea, central 1-mm subfield thickness, the occurrence of intraretinal cysts, ellipsoid zone disruption,and disorganization of retinal inner layers (DRIL) length were measured. VA was also recorded. Correlationsbetween FAZ area and VA were explored using regression models. Main outcome measure was VA.
Results: Mean age was 62.9!13.2 years. There was no difference in demographic and OCT-derivedanatomic measurements between branch retinal vein occlusion and central retinal vein occlusion groups (allP " 0.058); therefore, data from the 2 groups were pooled together to a single RVO group for further statisticalcomparisons. Univariate and multiple regression analysis showed that the area of the FAZ was significantlycorrelated with VA in DR and RVO (all P # 0.003). The relationship between FAZ area and VA varied with age(P ¼ 0.026) such that for a constant FAZ area, an increase in patient age was associated with poorer vision (rise inlogarithm of the minimum angle of resolution visual acuity). Disruption of the ellipsoid zone was significantlycorrelated with VA in univariate and multiple regression analysis (both P < 0.001). Occurrence of intraretinal cysts,DRIL length, and lens status were significantly correlated with VA in the univariate regression analysis (P # 0.018)but not the multiple regression analysis (P " 0.210). Remaining variables evaluated in this study were notpredictive of VA (all P " 0.225).
Conclusions: The area of the FAZ is significantly correlated with VA in DR and RVO and this relationship ismodulated by patient age. Further study about FAZ area and VA correlations during the natural course of retinalvascular diseases and following treatment is warranted. Ophthalmology 2016;123:2352-2367 ª 2016 by theAmerican Academy of Ophthalmology.
Supplemental material is available at www.aaojournal.org.
Diabetic retinopathy (DR) is the leading cause of vision lossin the working-age population in developed countries.1
According to data from the National Eye Institute, therewere approximately 7.7 million diagnosed cases of DR inthe United States alone in 2010.2 Retinal venous occlusion(RVO), due to central retinal vein occlusion (CRVO) orbranch retinal vein occlusion (BRVO), is the second mostcommon retinal vascular disorder leading to significantvision loss, with an estimated number of global cases in2010 exceeding 16.4 million.3 The prevalence of DR andRVO is projected to increase to pandemic portions over
the next 30 years, as is the socioeconomic burdenassociated with these conditions.4 Thus, there is an urgentneed to improve our understanding of the pathophysiologicmechanisms and anatomic correlates for significant visualloss due to these disorders.
The foveal avascular zone (FAZ) is a specialized regionof the human retina that approximates the region of highestcone photoreceptor density and oxygen consumption.5,6
Histologic techniques7e9 and a range of in vivo imagingmodalities10e19 have highlighted the variability in FAZtopology in normal human eyes. In healthy eyes, the size of
2352 ª 2016 by the American Academy of OphthalmologyPublished by Elsevier Inc.
http://dx.doi.org/10.1016/j.ophtha.2016.07.008ISSN 0161-6420/16

the FAZ does not seem to influence visual function,9,17,20
but the relationship between FAZ size and visual acuity(VA) in retinal vascular diseases remains a matter ofconjecture. Much of our understanding concerning therelationship between FAZ topology and visual function hasbeen attained from studies that utilized fluorescein angiog-raphy (FA) techniques to visualize the retinal circula-tion.21,22 Although these studies significantly aided ourunderstanding of the pathogenic mechanisms leading tovision loss in retinal vascular diseases, they seldomaccounted for the influence of other anatomic changes, suchas ellipsoid zone (EZ) disruption,23 that may have alsoaffected visual function.
Volumetric imaging using optical coherence tomogra-phy angiography (OCTA) permits rapid, noninvasiveevaluation of the retinal circulation.24e29 Recent work hasshown that OCTA permits reproducible measurement ofFAZ dimensions and provides quantitative vascular infor-mation comparable to histologic examination.9,30 Thetechnique of OCTA thus appears suited for delineatingrelationships between the morphometric properties of theFAZ and VA. In this report, a biomorphometric analysisincorporating OCTA and structural optical coherencetomography (OCT) data is used to determine the significantpredictors of VA in DR and RVO. We show that FAZ areais an independent predictor of VA in DR and RVO. Wealso demonstrate that patient age modulates the relationshipbetween FAZ area and VA in retinal vascular diseases. Theresults of this report, therefore, have important clinicalapplications.
Methods
This study followed the tenets of the Declaration of Helsinki andwas approved by the Institutional Review Board at North ShoreLong Island Jewish Health System. Data were stored and managedin compliance with guidelines from the Health Insurance Porta-bility and Accountability Act.
Subjects
Consecutive cases of DR, BRVO, and CRVO seen betweenAugust 2014 and October 2015 by 2 retina specialists (L.A.Y.and K.B.F.) at Vitreous Retina Macula Consultants of New Yorkwere enrolled in this study. Treatment-naïve and treated caseswere included. The diagnosis of diabetes mellitus was based onthe results of fasting blood samples and glycosylated hemoglobin(HbA1c). Only patients with clinical signs of diabetic retinop-athy, according to the Early Treatment Diabetic RetinopathyStudy (ETDRS) grading criteria,31 were included in this study(Fig 1). Patients with diabetes mellitus without evidence ofdiabetic retinopathy (level 10 scale ETDRS criteria) were notincluded in this study. Central retinal vein occlusion wasdetermined by the presence of retinal vein dilation, retinaledema, or scattered superficial or deep hemorrhages with orwithout the presence of optic disc edema/hyperemia (Fig 1).Branch retinal vein occlusion was determined by the presenceof the same clinical features as CRVO, but confined to a focalregion in the retina corresponding to a specific arteriovenouscrossing (Fig 1). Long-standing vein occlusion was determinedby the presence of occluded or sheathed retinal veins and/orvascular anastomoses. With the exception of 4 cases (1 case of
BRVO and 3 cases of DR), the clinical evaluation of all subjectsincluded imaging with FA (Optos 200Tx [Optos, Dunfermline,Scotland, United Kingdom], Topcon TRC 501x fundus camera[Topcon Imagenet, Tokyo, Japan], or Heidelberg SpectralisHRAþOCT [Heidelberg Engineering, Heidelberg, Germany]).Other inclusion criteria for this study included the following: (1)clear ocular media; (2) absence of significant refractive error; (3)absence of significant concurrent ocular diseases. Patientsdeemed to have unsatisfactory OCTA images such that FAZ areacould not be reliably measured, as described below, were alsoexcluded from this study. All subjects underwent slit-lamp bio-microscopy, dilated funduscopic examination, and measurementof pinhole VA on the day of OCTA imaging. Demographic andclinical information, including treatment history, lens status(phakic or pseudophakic), and duration of disease, was obtainedfrom patient records.
Optical Coherence TomographyeDerivedMeasurements of Foveal Anatomy
All patients were imaged with Spectralis spectral-domain OCT (SDOCT) (Heidelberg Engineering, Heidelberg, Germany) on the dayof OCTA imaging. A raster scan protocol centered at the fovea(range, 20&'25&e30&'20&) was used. The following assessmentsof foveal structure were attained using the macular volume scan(Figs 2 and 3):
1. Point thickness of the central fovea (point foveal thickness,PFT): Determined using the B-scan image of the centralfovea and defined as the distance between the retinalpigment epithelium and inner limiting membrane (ILM).Calipers provided by the OCT software were used todetermine this measurement. Point thickness of the centralfovea was measured by 2 independent examiners (M.I. andJ.M.) and the average measurement was used for statisticalanalysis.
2. Occurrence of intraretinal cystoid changes: Categoricallygraded as being present or absent by 2 independentobservers (M.I. and J.M.). Intraretinal cysts were iden-tified using previously determined OCT criteria32 andwere defined as the occurrence of round or ovalhyporeflective spaces arranged in linear aggregates atthe level of the inner nuclear or outer nuclear/Henlefiber layers. When the evaluation was inconsistentbetween the 2 graders, a third masked reader (C.B.)made the final arbitration.
3. Integrity of the ellipsoid zone in the central fovea: Thecentral 3 mm of the fovea, as circumscribed by the ETDRSgrid, was evaluated. Disruption of the EZ was categoricallygraded as being present or absent by 2 independentobservers (M.I. and J.M.). An absent grading was denotedif there was any disruption of the EZ on OCT. When theevaluation was inconsistent between the 2 graders, a thirdmasked reader (C.B.) made the final arbitration.
4. Central 1-mm subfield thickness (CST): Recorded from theretinal thickness ETDRS grid generated by Spectralis soft-ware (Heidelberg Engineering, Heidelberg, Germany). Theoccurrence of diabetic macular edema, defined as a centralfoveal thickness of greater than 275 mm (ETDRS centralsubfield),33 was also evaluated in the diabetic cohort.
5. Disorganization of the retinal inner layers (DRIL) length:Previously reported definitions of DRIL were used.34,35
Disorganization of the retinal inner layers length wasdefined as the horizontal extent (in microns) for which anyboundaries between the ganglion celleinner plexiformlayer complex, inner nuclear layer, and outer nuclear layer
Balaratnasingam et al ( Foveal Avascular Zone
2353

could not be identified. The horizontal extent of DRILwithin each B-scan image within the central 3 mm of thefovea, circumscribed using the ETDRS grid, was assessed.Average of measurements was used to derive a globalDRIL measurement for the eye. Global DRIL measurementwas determined by 2 independent examiners (M.I. andC.B.) and the average measurement was used for quanti-tative analysis.
6. Foveal pit volume: This measurement was determined byapplying the Cavalieri principle of stereologic analysis36 asillustrated in Figure 3. The following steps were used tocalculate foveal pit volume:
i. The rim of the foveal pit on each B-scan image wasdetermined using ImageJ (a publicly available imageprocessing program developed by Wayne Rasband,
Figure 1. Clinical and fluorescein angiographic features of typical cases of diabetic retinopathy (A, B), branch retinal vein occlusion (C, D), and centralretinal vein occlusion (E, F) included in this study.
Ophthalmology Volume 123, Number 11, November 2016
2354

National Institutes of Health, Bethesda, MD; http://rsb.info.nih.gov/ij/index.html). Specifically, the firstpoint away from the foveal center (in nasal and tem-poral directions) where the slope of the ILM wasmeasured to be zero was defined as the rim. The angletool on ImageJ was used to determine thismeasurement.
ii. The area confined by the ILM and a straight line con-necting the 2 points denoting the foveal pit rim on theB-scan image, as determined in step (i), was thencalculated using manual planimetry.
iii. The volume of the foveal pit between 2 adjacent OCTslices (herein called a segment) was then determinedusing this equation:
Vol ¼ d!Ax þ Axþ1
2
"
where: Vol ¼ volume of foveal pit within segment bounded byOCT slice number x and xþ1
d ¼ distance between adjacent slices in mm
A ¼ area between the ILM and a straight line connectingthe edges of the foveal pit rim in mm2
x ¼ OCT slice number
iv. Foveal pit volume was calculated by summing the volumesof individual segments. The number of segments in theOCT volume was (n)1), where n ¼ total number of slicesthat spanned the foveal pit.
Measurement of the Area of the FovealAvascular Zone
The area of the FAZ was measured using OCTA. The instrumentused was based on the Optovue RTVue XR Avanti (Optovue, Inc,Fremont, CA) to obtain split-spectrum amplitude-decorrelationangiography images. This instrument has an A-scan rate of 70 000scans per second, using a light source centered on 840 nm and abandwidth of 45 nm. Each OCTA volume contains 304'304A-scans with 2 consecutive B-scans captured at each fixed positionbefore proceeding to the next sampling location. The scan area was
Figure 2. Optical coherence tomography (OCT)-derived anatomic measurements of the fovea. Color fundus (A), OCT angiography (B), and structural OCTimage of the fovea (C) from an eye with diabetic retinopathy are provided. Foveal avascular zone (FAZ) area (red shade) was determined using the OCTangiography image and manual tracing techniques. B-scan images of the fovea were used to categorically grade the presence or absence of intraretinal cysts andellipsoid zone (EZ) disruption. Point foveal thickness (PFT)wasmeasured as the distance between the retinal pigment epithelium and inner limitingmembrane.Disorganization of the retinal inner layers length was also measured. Automated measurement of the 1-mm central subfield thickness (213 mm in this case),calculated using Heidelberg Spectralis software (top right corner of the color image), was also used in the regression analysis. The area imaged by OCT angi-ography (green inset) and the region from where the single B-scan image was acquired (white line) are illustrated in the color photograph.
Balaratnasingam et al ( Foveal Avascular Zone
2355

2'2 mm or 3'3 mm centered on the fovea. Each OCTA volume isacquired in approximately 3 seconds and 2 orthogonal OCTAvolumes were acquired to perform motion correction to minimizemotion artifacts arising from microsaccades and fixation changes.Angiography information displayed is the average of the decorre-lation values when viewed perpendicularly through the thicknessbeing evaluated. If the image processed with motion-correctionsoftware demonstrated artifact involving the FAZ in the form of
doubling of vascular structures or sideways shearing, then the casewas excluded from analysis. Only OCTA images with signalstrength above 50 were included in this study.
Image analysis to calculate FAZ area was performed usingAdobe Photoshop CC (Adobe Systems, Inc., San Jose, CA) andour previously reported technique.37 Images from screen captureprogram integrated in the AngioView software, representing thefull thickness of the retina (inner and outer capillary networks
Figure 3. Calculation of foveal pit volume using optical coherence tomography (OCT). Color fundus (A) and OCT angiography image (B) of a patientwith a superior branch retinal vein occlusion are presented. Three contiguous OCT slices illustrate the application of the Cavalieri principle in stereology forcalculating foveal pit volume. Areas of the central fovea from which B-scan images were acquired are presented on the reflectance image (C; white lines).The rim of the foveal pit was defined as the first point away from the central fovea in the B-scan image where the slope of the inner limiting membrane(ILM) was zero. Manual tracing of the ILM and a straight line connecting the 2 points denoting the foveal rim was used to calculate the cross-sectional areaof the foveal pit (pink shade) in each B-scan image. The volume of a segment, defined as the volume between 2 contiguous OCT slices, was then determinedby averaging the area of the foveal pit in the 2 slices and multiplying it by the distance (d) separating the slices. Summation of volumetric measurements fromeach segment allowed calculation of the entire volume of the foveal pit. The area of the foveal avascular zone as seen on OCT angiography (red shade) isclearly discernible as is the contour of the foveal pit upon 3-dimensional visualization of the structural OCT (D) data. The area of OCT angiography imagingis denoted by a green inset on the color image.
Ophthalmology Volume 123, Number 11, November 2016
2356

combined), were used for quantitative analysis. Gain and contrastwere adjusted if necessary, using the brightness/contrast function,to allow clear delineation of the FAZ. The magic wand tool wasthen used to manually demarcate the boundaries of the FAZ afterthe innermost capillaries in the fovea were identified. We used atolerance of 15 and repeatedly used the magic wand tool to selectthe FAZ. If the selection spilled outside of the FAZ, the excessselection was trimmed using the lasso tool. If there wereregions in the FAZ where pixel value exceeded the selectedpixel value plus tolerance, then they were not selected by themagic wand tool. In these instances, the lasso tool was alsoused to manually select pixel outliers. The area measurementfunction was then used to determine the area of the FAZ inpixels2 and this value was converted to micrometers squared(mm2) using scale conversion. The FAZ area was determinedby 2 independent examiners (M.I. and J.M.) and the averagemeasurement was used for quantitative analysis.
Statistical Analysis
Data were summarized with descriptive statistics. Univariateregression models estimated using generalized estimating equa-tions (GEE) were fit using FAZ area, foveal pit volume, age, lensstatus (phakic or pseudophakic), PFT, CST, disease (DR or RVO),sex (male or female), occurrence of intraretinal cysts, occurrence ofEZ disruption, DRIL length, or previous treatment (no treatment,laser photocoagulation, intravitreal antievascular endothelialgrowth factor [VEGF] therapy, vitrectomy, or combination ther-apy) as a single predictor and VA as the outcome. Treatment was acategorical variable with 5 levels; thus, we created 4 dummy var-iables (laser photocoagulation, intravitreal anti-VEGF injection,combination therapy, and vitrectomy) to be directly included in theregression model, and also contain the same information as thesingle categorical variable. The reference group for treatment wasthe cohort of subjects that had not received any previous treatment.Generalized estimating equations were used to account for corre-lations of observations from the same subject, as some patients hadbilateral imaging. Interactions between FAZ area and age/CST/disease (DR or RVO)/integrity of the EZ/occurrence of intraretinalcysts/DRIL length/foveal pit volume were then explored usingregression analysis (Appendix, available at www.aaojournal.org).Results from univariate regression models and also modelsassessing interactions were then used to create a finalmultivariate model in which VA was the outcome. A summaryof all the models explored in this study is provided in theAppendix. Visual acuity measurements were converted tologarithm of the minimum angle of resolution (logMAR) unitsbefore analysis. A P value less than or equal to 0.05 wasconsidered significant. Statistical analysis was performed usingR 3.1.2 and Stata 12. Descriptive results in this manuscript areprovided as mean ! standard deviation.
Results
General
A total of 95 eyes from 66 subjects (36 male and 30 female) wereanalyzed. Themean ageof the cohortwas 62.9!13.2 years.MeanVAwas 0.25!0.24 logMAR (meanSnellen acuity of 20/35).A total of 53right eyes and 42 left eyes were evaluated. Twenty-six eyes werepseudophakic. The cohort comprised 65 eyes with DR and 30 eyeswith RVO (19 with BRVO and 11 with CRVO). The diabetic cohortcomprised 13 eyes with mild DR, 22 eyes with moderate DR, 6 eyeswith severe DR, and 24 eyes with proliferative DR according to the
ETDRS scale. Twenty-five eyes in the entire cohort had not receivedany previous treatment, 25 eyes had previously received intravitrealanti-VEGF therapy, 17 eyes had received laser photocoagulation, 3eyes had undergone vitrectomy, and 25 eyes had received a combi-nation of the above nonsurgical treatments. The condition of diabeticmacular edema, defined as a central subfield thickness greater than275 mm,33 was present in 38 of 65 diabetic eyes (58.4%).Mean signalstrength of OCTA images for the cohort was 65.2!5.1.
Summary statistics for FAZ area, lens status, VA, duration ofdisease, PFT, CST, frequency of intraretinal cysts, foveal pit vol-ume, DRIL length, and frequency of EZ disruption for the entirecohort are provided in Table 1. There was no difference indemographic and OCT-derived anatomic measurements (allP " 0.058) between BRVO and CRVO groups (Table S1,available at www.aaojournal.org); therefore, data from the 2groups were pooled together to a single RVO group for furtherstatistical comparisons. Interobserver disagreement on the statusof the ellipsoid zone or intraretinal cysts required a tie-breakerexamination in 3 and 4 instances, respectively.
Mean age (P ¼ 0.822), VA (P ¼ 0.974), PFT (P ¼ 0.050), CST(P¼ 0.056), DRIL length (P¼ 0.252), foveal pit volume (P¼ 0.060),frequency of pseudophakia (P ¼ 0.274), and frequency of EZdisruption (P¼ 0.473)was not significantly different between theDRand RVO groups. Duration of disease was significantly greater in theDR group compared with the RVO group (91.8 vs. 34.9 months;P < 0.001). The frequency of treatment variables was significantlygreater in the DR group than in the RVO group (P ¼ 0.042). MeanFAZ area was significantly greater in the DR group (P ¼ 0.019). Agreater proportion of eyes in the RVO demonstrated intraretinal cystson OCT (46.7% vs. 24.6%; P ¼ 0.033).
Mean DRIL length for the cohort was 235.2!506.4 mm. Therewas a moderate positive correlation between FAZ area and DRILlength (Pearson correlation coefficient ¼ 0.3961) that was statis-tically significant (P < 0.001; Fig 4).
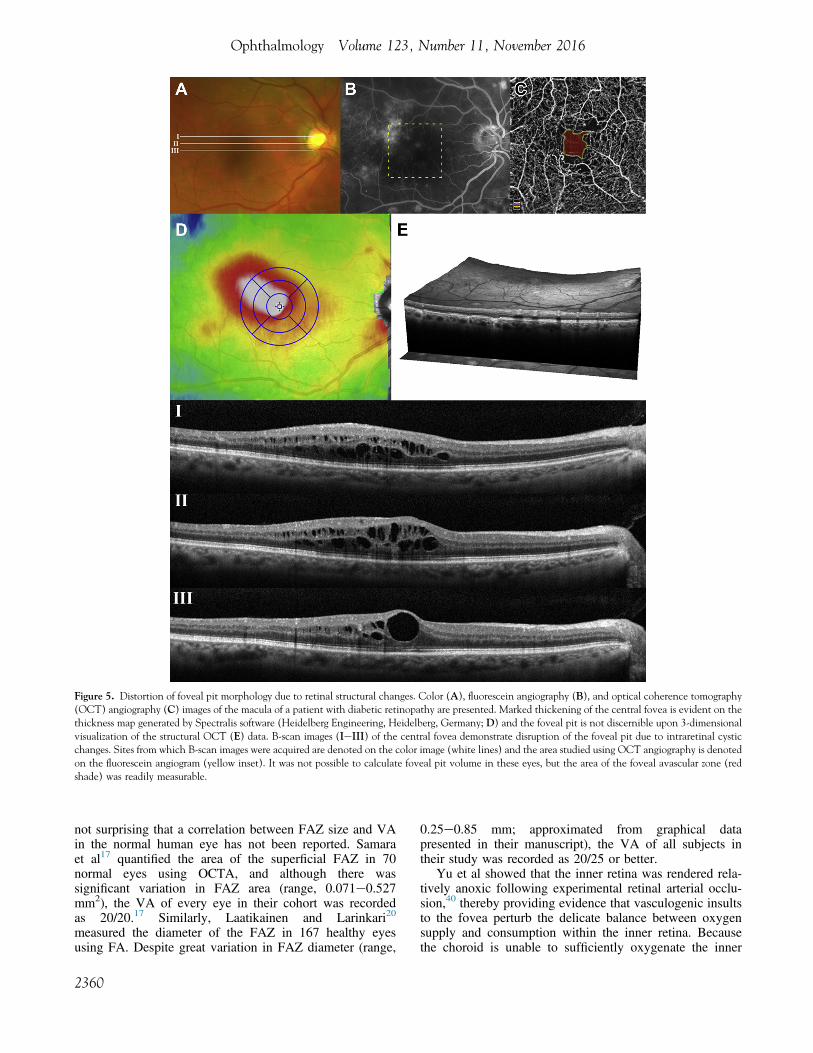
It was possible to calculate foveal pit volume in only 73 of 95eyes. In the remaining eyes, retinal thickening and intraretinalcystic changes distorted the shape of the foveal pit such that it wasnot possible to reliably identify its margins (Fig 5). Mean foveal pitvolume for the eyes that were measured was 0.14!0.11 mm3. Amoderate positive correlation between FAZ area and foveal pitvolume (P ¼ 0.001) was identified, with a Pearson correlationcoefficient of 0.3744 (Fig 6).
Association of Foveal Avascular Zone Area andOther Variables with Visual Acuity
Results from univariate GEE analyses are summarized in Table 2.Foveal avascular zone area (P < 0.001), the occurrence of EZdisruption (P < 0.001), the occurrence of intraretinalcysts (P ¼ 0.018), lens status (P ¼ 0.002), and DRIL length(P < 0.001) were significantly associated with VA. Age(P ¼ 0.600), PFT (P ¼ 0.283), CST (P ¼ 0.226), foveal pitvolume (P ¼ 0.237), disease (DR or RVO; P ¼ 0.489), femalesex (P ¼ 0.225), and history of previous treatment were notassociated with VA (all P " 0.072).
Point foveal thickness and CST were highly correlated(r ¼ 0.893) and similarly associated with VA. Therefore, CST wasused as a predictor in subsequent multiple regression models andPFT measurements were excluded from further analyses.
Balaratnasingam et al ( Foveal Avascular Zone
2357

Interactions Between Foveal Avascular ZoneArea and Other Variables
The results of multivariate GEE analyses where interactionsbetween FAZ area and another predictor were explored using VAas the outcome are summarized in Table 3. The only interactionthat was observed to be significant was the interaction betweenFAZ area and age (P ¼ 0.026). Interactions between FAZarea and CST (P ¼ 0.615), FAZ area and disease (DR or RVO;P ¼ 0.598), FAZ area and the occurrence of intraretinal cysts(P ¼ 0.453), FAZ area and the integrity of the EZ (P ¼ 0.655),FAZ area and DRIL length (P ¼ 0.245), and FAZ area andfoveal pit volume (P ¼ 0.810) were not significant.
Predictive Model of Visual Acuity Using FovealAvascular Zone Area and Other Variables
Because FAZ area, the occurrence of intraretinal cysts, the occurrenceof EZ disruption, DRIL length, and lens status were found to be sig-nificant predictors ofVAinunivariateGEEanalyses, theywere used inthe final predictive model. Age was also used in the final predictivemodel because the interaction between age and FAZ areawas found tobe significant in multivariate GEE analyses. We also wanted todetermine if the type of retinal vascular disease (DRorRVO)would bea significant predictor of VA, so this variable was also included in thefinal model. The final model was therefore defined as follows:
Outcome: VA. Predictors: FAZ area, age, disease (DR orRVO), occurrence of intraretinal cysts, occurrence of EZ disrup-tion, lens status (phakic or pseudophakic), DRIL length, and aninteraction between FAZ area and age.
The results of thismodel are summarized inTable 4. FAZarea (P¼0.003), age (P< 0.001), EZdisruption (P< 0.001), and the interactionbetween FAZ area and age (P< 0.001) were significant predictors ofVA. Disease (DR or RVO), lens status (phakic or pseudophakic),DRIL length, and the occurrence of intraretinal cysts were not foundto be significant predictors of VA using this model (all P " 0.210).
Figure 7B is a graphical illustration of the final regressionmodel demonstrating how the relationship between FAZ area andmean VA varies with age. Data from subjects above the meanage of the cohort (62.9 years) are denoted in red and thosebelow the mean age are denoted in blue. Statistical techniquespreviously described by Cohen et al38 were used to generate
simple slopes for different age groups using the predictivemodel. The predicted slope of the relationship between FAZ areaand VA for a population 1 standard deviation above the meanage of the cohort (dashed line), the mean age of the cohort(continuous line), and 1 standard deviation below the mean ageof the cohort (dotted line) are provided. The slopes of the 3 linesare different, thereby providing evidence that the relationshipbetween FAZ area and VA varies with age.
Case Illustrations
A comparison of VA from 2 patients with DR of similar age andOCT-derived anatomic measurements (aside from FAZ area) arepresented in Figure 8.
Case A is the right eye of a 70-year-old female patient that wasdiagnosed with type 2 diabetes mellitus 26 years ago. Intraretinalcysts were seen on SD OCT, PFT was 239 mm, the integrity ofthe EZ was judged to be intact, and DRIL was present. The area ofthe FAZ was measured as 0.44 mm2 and the VA was recordedas 20/40.
Case B is the left eye of a 71-year-old male patient that wasdiagnosed with type 2 diabetes mellitus 29 years previously.Intraretinal cysts were seen on SD OCT, PFT was 254 mm, the EZwas intact, and DRIL was present. The area of the FAZ wasmeasured as 0.76 mm2 and the VA was recorded as 20/100.
Discussion
We utilized OCT-derived anatomic measurements andregression models to determine if FAZ area is a significantpredictor of VA in DR and RVO. Although robust statisticalevaluations demonstrated consistent findings across multipleanalyses, we emphasize that the strength of our conclusionsis modulated by the limited sample size of our cohort. Themajor findings of this study are as follows: (1) FAZ area issignificantly correlated with VA in diabetic retinopathy andretinal vein occlusion; (2) age modulates the relationshipbetween FAZ area and VA such that for a constant FAZ areaa relatively older group of patients will have poorer vision(i.e., a higher mean logMAR visual acuity).
Table 1. Summary of Clinical and Optical Coherence TomographyeDerived Anatomic Measurements for Entire Cohort
Mean SD
Quantiles
Minimum First Quantile Median Third Quantile Maximum
Age (yrs) 62.90 13.20 27.00 57.00 65.00 71.00 93.00VA (logMAR) 0.25 0.24 0.00 0.10 0.18 0.30 1.30Duration of disease (mos) 78.00 101.90 0.00 4.50 30.00 134.00 480.00Frequency of pseudophakia (%) 27.40 d d d d d dFAZ area (mm2) 0.55 0.32 0.12 0.34 0.47 0.66 1.96Point foveal thickness (mm) 256.80 91.00 103.00 204.50 230.00 281.00 642.00Central 1-mm subfield thickness (mm) 311.70 84.40 149.00 258.00 300.00 346.00 638.00DRIL length (mm) 235.20 506.40 0.00 d d d 2305.70Foveal pit volume (mm3) 0.14 0.11 0.01 0.07 0.12 0.17 0.70Frequency of intraretinal cysts (%) 31.60 d d d d d dFrequency of ellipsoid zone disruption (%) 28.40 d d d d d d
DRIL ¼ disorganization of the retinal inner layers; FAZ ¼ foveal avascular zone; logMAR ¼ logarithm of the minimum angle of resolution; VA ¼ visualacuity.
Ophthalmology Volume 123, Number 11, November 2016
2358

The FAZ is a specialized region of the human maculathat contains the highest density of cone photoreceptors.5
With respect to metabolic activity, oxygen consumptionwithin the macula, per gram of tissue, is also greater than
most other organs in the human body.39 Cells within theFAZ are principally nourished by the choroid and duringphysiologic conditions the choroidal circulation is able tomeet the metabolic demands of the FAZ. Therefore, it is
Figure 4. Relationship between foveal avascular zone (FAZ) area and disorganization of retinal inner layers (DRIL) length. FAZ area was significantly andpositively correlated to DRIL length, as illustrated by the clinical images of 2 different patients (A, B). The area imaged by optical coherence tomographyangiography is denoted by the green inset on each fluorescein angiogram image and the area of the FAZ in each eye is highlighted in red shade. DRIL lengthwas defined as the horizontal extent (in microns) for which any boundaries between the ganglion celleinner plexiform layer complex, inner nuclear layer,and outer nuclear layer could not be identified.
Balaratnasingam et al ( Foveal Avascular Zone
2359
not surprising that a correlation between FAZ size and VAin the normal human eye has not been reported. Samaraet al17 quantified the area of the superficial FAZ in 70normal eyes using OCTA, and although there wassignificant variation in FAZ area (range, 0.071e0.527mm2), the VA of every eye in their cohort was recordedas 20/20.17 Similarly, Laatikainen and Larinkari20
measured the diameter of the FAZ in 167 healthy eyesusing FA. Despite great variation in FAZ diameter (range,
0.25e0.85 mm; approximated from graphical datapresented in their manuscript), the VA of all subjects intheir study was recorded as 20/25 or better.
Yu et al showed that the inner retina was rendered rela-tively anoxic following experimental retinal arterial occlu-sion,40 thereby providing evidence that vasculogenic insultsto the fovea perturb the delicate balance between oxygensupply and consumption within the inner retina. Becausethe choroid is unable to sufficiently oxygenate the inner
Figure 5. Distortion of foveal pit morphology due to retinal structural changes. Color (A), fluorescein angiography (B), and optical coherence tomography(OCT) angiography (C) images of the macula of a patient with diabetic retinopathy are presented. Marked thickening of the central fovea is evident on thethickness map generated by Spectralis software (Heidelberg Engineering, Heidelberg, Germany; D) and the foveal pit is not discernible upon 3-dimensionalvisualization of the structural OCT (E) data. B-scan images (IeIII) of the central fovea demonstrate disruption of the foveal pit due to intraretinal cysticchanges. Sites from which B-scan images were acquired are denoted on the color image (white lines) and the area studied using OCT angiography is denotedon the fluorescein angiogram (yellow inset). It was not possible to calculate foveal pit volume in these eyes, but the area of the foveal avascular zone (redshade) was readily measurable.
Ophthalmology Volume 123, Number 11, November 2016
2360

retina following retinal vascular injury, it is plausible thatFAZ size, and therefore the area of the macula devoid ofa retinal blood supply, would correlate to the degree ofvisual dysfunction in DR and RVO. However, previousreports concerning the relationship between FAZ size andVA in retinal vascular diseases have reached discordantconclusions. Arend et al21 compared FAZ size betweendiabetic patients with decreased VA (20/50 or worse) and
unaffected VA (median VA of 20/25) and showed that theFAZ was enlarged by 73% in eyes with decreased VA. Intheir study, scanning laser video-fluorescein angiogramswere used to quantify FAZ topology and fundus photog-raphy was used to grade the occurrence of macular edema.Remky et al22 evaluated FAZ size, using digitized FAimages acquired with a scanning laser ophthalmoscope, in24 eyes with acute CRVO and compared it tomeasurements from 98 healthy volunteers. Although FAZsize was increased in the CRVO group (0.32!0.17 mm2)compared with the control group (0.22!0.07 mm2), it wasnot found to be correlated with VA. Parodi et al41 alsoused FA techniques to compare FAZ area between 20patients with BRVO and 41 control subjects. Mean FAZarea was shown to be greater in eyes with BRVO(0.56!0.34 mm2) compared with controls (0.26!0.07mm2). Their study also showed that VA impairment dueto BRVO was correlated with FAZ enlargement. Most ofthese studies only examined the association between FAZsize and VA using FA and omitted the influence of otherdisease-induced structural changes, such as EZ disrup-tion,23 DRIL length,35 and intraretinal cystic changes,42 intheir statistical models. This may be one explanation forthe discrepancies in findings between previous FA-basedstudies.
Optical coherence tomography angiography is a rela-tively new imaging modality that utilizes flow propertieswithin a defined volume of tissue to visualize vascularstructures and therefore obviates dye administration.43 Overthe past year, there have been a considerable number ofstudies that have reported the spectrum of retinal vascularchanges due to DR, BRVO, and CRVO usingOCTA.24,44e47 With regard to quantitative evaluation,recent evidence also suggests that OCTA is a reliabletechnique for measuring FAZ area that compares favorably
Figure 6. Relationship between foveal avascular zone (FAZ) area andfoveal pit volume in diabetic retinopathy and retinal vein occlusion. Ascatterplot demonstrates a significant relationship, with a Pearson correla-tion coefficient of 0.3744.
Table 2. Results of Simple Regression Models (Generalized Estimating Equations) Using Visual Acuity as the Outcome
Coefficient Standard Error P Value 95% CI
FAZ area (mm2) 0.34 0.07 <0.001 (0.19, 0.48)Age (yrs) 0.001 0.002 0.600 ()0.003, 0.005)Lens status 0.1735 0.0566 0.002 (0.06263, 0.2844)Point foveal thickness (mm) 0.0004 0.0003 0.283 ()0.0003, 0.001)Central 1-mm subfield thickness (mm) 0.0006 0.0005 0.226 ()0.0004, 0.002)Disease (DR or RVO) 0.04 0.06 0.489 ()0.081, 0.169)Female 0.07 0.05 0.225 ()0.04, 0.17)Intraretinal cysts 0.14 0.06 0.018 (0.02, 0.25)Ellipsoid zone disruption 0.34 0.06 <0.001 (0.22, 0.45)DRIL length (mm) 0.00018 0.000046 <0.001 (0.00009, 0.00027)Foveal pit volume (mm3) 0.2641 0.2232 0.237 ()0.1732, 0.7015)TreatmentNo treatment (Reference Group)Laser photocoagulation 0.007 0.051 0.897 ()0.09, 0.11)Anti-VEGF injection 0.101 0.06 0.091 ()0.02, 0.22)Combination therapy* 0.127 0.071 0.072 ()0.01, 0.27)Vitrectomy 0.003 0.032 0.918 ()0.059, 0.066)
CI ¼ confidence interval; DR ¼ diabetic retinopathy; DRIL ¼ disorganization of the retinal inner layers; FAZ ¼ foveal avascular zone; RVO ¼ retinal veinocclusion; VEGF ¼ vascular endothelial growth factor.*Two or more of the listed treatments.
Balaratnasingam et al ( Foveal Avascular Zone
2361

to histology.9 Carpineto et al30 quantified FAZ area in 60eyes using OCTA and demonstrated a high intraobserverintersession concordance correlation coefficient (mean0.99) and high interobserver intrasession concordancecorrelation coefficient (mean 0.99). The advantages ofOCTA for reliably evaluating FAZ size were exploited ina number of recent studies that quantified the topologicfeatures of the FAZ in DR and RVO. Salz et al48 used aprototype swept-source OCT to delineate the innermostvessels surrounding the avascular zone in DR, which theydenoted as the foveal nonflow zone, and showed that thesize of the foveal nonflow zone was significantly greater ineyes with proliferative DR compared with normal eyes andthose with nonproliferative DR. Takase et al49 used OCTAto show that FAZ area was significantly greater in the DRgroup compared with a control group but, similar to thereport by Salz et al,48 correlations between FAZ size andVA were not performed. Samara et al50 evaluated 17 eyeswith BRVO and compared FAZ area measurementsbetween the eye with BRVO and the fellow normal eyefrom the same subject. They found that FAZ area inBRVO was significantly enlarged at the level of the deepcapillary network only. They also reported that the area ofthe deep FAZ correlated positively with logMAR VA.The important work by Samara et al,50 however, did notconsider the influence of other disease-induced anatomic
changes, such as EZ disruption and intraretinal cysts, whichmay have also influenced VA. Therefore, it was not possibleto determine if VA change was correlated to FAZ size orwas due to other retinal anatomic changes that may haveconfounded the analysis. Similarly, a number of otherstudies that have reported the correlation between FAZ sizeand VA also did not account for the effects of confoundingvariables.21,22,33,41,51
In this study, FAZ area together with other OCT-derivedanatomic measurements such as PFT, CST, intraretinalcysts, DRIL length, and the integrity of the EZ were used todetermine the significant predictors of VA in DR and RVO.Important clinical variables such as age, sex, and diseasetype (DR or RVO) were also used in the analysis. Weattained FAZ measurements using the entire volume scanand did not stratify capillary networks into superficial anddeep networks to avoid errors associated with imagesegmentationdShahlaee et al52 previously showed thatinterobserver agreement did not meet the lowestacceptable grader agreement for isolated measurements ofthe deep vascular network using OCTA. We demonstratethat FAZ area is a significant predictor of VA in DR andRVO. Univariate and multiple regression analysis usingGEEs revealed that irrespective of disease type (DR orRVO), FAZ area was significantly correlated with VA,thereby implicating a degree of overlap in the pathways
Table 3. Multiple Regression Models (Generalized Estimating Equations) Exploring Interactions Between Foveal Avascular Zone Areaand Other Variables Using Visual Acuity as the Outcome
Interaction Terms Coefficient Standard Error P Value 95% CI
FAZ area ' Age 0.014 0.006 0.026 (0.002, 0.026)FAZ area ' CST )0.001 0.002 0.615 ()0.004, 0.002)FAZ area ' Disease )0.081 0.154 0.598 ()0.382, 0.220)FAZ area ' Integrity of EZ 0.063 0.14 0.655 ()0.213, 0.338)FAZ area ' Intraretinal cysts 0.098 0.131 0.453 ()0.159, 0.355)FAZ area ' DRIL length )0.002 0.0001 0.245 ()0.0004, 0.0001)FAZ area ' Foveal pit volume 0.135 0.561 0.810 ()0.965, 1.234)
CI ¼ confidence interval; CST ¼ central 1-mm subfield thickness; DRIL ¼ disorganization of the retinal inner layers; EZ ¼ ellipsoid zone; FAZ ¼ fovealavascular zone.
Table 4. Results of the Final Multiple Regression Model where the Outcome Was Visual Acuity and the Predictors Included FovealAvascular Zone Area, Age, Disease, Occurrence of Ellipsoid Zone Disruption, Occurrence of Intraretinal Cysts, Lens Status, Disorgani-
zation of the Retinal Inner Layers, and the Interaction Between Foveal Avascular Zone Area and Age
Coefficient Standard Error P Value 95% CI
FAZ area (mm2) )0.703 0.239 0.003 ()1.171, )0.235)Age (yrs) )0.007 0.002 0.001 ()0.011, )0.003)Disease (DR or RVO) 0.041 0.043 0.344 ()0.044, 0.126)Ellipsoid zone disruption 0.245 0.057 <0.001 (0.133, 0.357)Intraretinal cysts )0.002 0.043 0.962 ()0.087, 0.083)Lens status (phakic or pseudophakic) 0.077 0.062 0.210 ()0.044, 0.126)DRIL length 0.000 0.000 0.240 ()0.000, )0.001)FAZ area ' Age 0.012 0.003 <0.001 (0.006, 0.018)Constant 0.531 0.147 <0.001 (0.244, 0.818)
CI ¼ confidence interval; DR ¼ diabetic retinopathy; DRIL ¼ disorganization of the retinal inner layers; FAZ ¼ foveal avascular zone; RVO ¼ retinal veinocclusion.
Ophthalmology Volume 123, Number 11, November 2016
2362

by which retinal vascular diseases lead to visualdysfunction.
Foveal homeostasis is critically regulated by retinal glia.53
Astrocytes andMuller cells are the predominant glia subtypes
in the primatemacula.53,54 From an embryological standpoint,the pattern of astrocyte development closely approximatesretinal vascularization and a number of studies have shownthat glial cells codistributewith blood vessels in the retina.54,55
Therefore, it is expected that eyes with a relatively larger FAZalso have a lower number of glia in the macula. Duringphysiologic states, the concentration of glial and vascular el-ements in the fovea in thosewith larger FAZsmaybe sufficientto maintain visual function. However, following insults thatperturb the structural and biochemical systems that ordinarilysupport macular homeostasis,56 these mechanisms mayrapidly decompensate; more so when there is an associatedincrease in energy demands by regional neurons. Wepostulate that eyes with larger FAZs have an increasedsusceptibility to visual dysfunction due to the lower baselineconcentrations of glial and vascular elements. We alsopostulate that such eyes are more vulnerable to imbalancesin energy supply/demand relationships during disease statesand may suffer a greater level of injury than an eye with asmaller FAZ, following an insult of comparable magnitude.We emphasize, however, that our hypothesis is entirelyspeculative and focused work with histologic correlation isrequired for validation of these concepts.
The other major finding in this study is that age modu-lates the relationship between FAZ area and VA in DR andRVO. For a constant FAZ area, mean logMAR VA wasfound to be higher in a relatively older age group. Age-related decline in VA is known to occur in patients absentof ocular disease; however, there is little evidence to suggestthat it is due to age-related changes in FAZ topology.57 Inthe study by Laatikainen and Larinkari,20 a gradualenlargement in FAZ size was noted until the fifth decadeof life in healthy eyes after which significant increaseswere not detected. Their study concluded that the size ofthe FAZ did not affect VA in healthy eyes. Further workis required to understand the cellular basis for theinteraction between FAZ area and age in retinal vasculardiseases. Again, disease-induced alterations to Mullercells58 and astrocytes59 may underlie this interaction.
Disorganization of inner retinal layers is an OCT-derivedbiomarker that is predictive of baseline VA and VA afterresolution of diabetic macular edema.34,35 Histologic cor-relations for DRIL have not been performed, but DRIL isthought to correlate to regions where synaptic connectionsof bipolar, horizontal, and amacrine cells within the innerretina have been disrupted.35 The inner retina ispredominantly nourished by the retinal circulation60,61;therefore, it is plausible that vasculogenic insults at the levelof the inner retina will result in observable retinal structuralchanges that manifest as DRIL on OCT. The data in ourstudy support this speculation, as we found a significantpositive correlation between FAZ size and DRIL length.Although our results implicate an important relationshipbetween FAZ size and DRIL, it will be essential to validatethese findings by defining the temporal relationshipsbetween these 2 variables.
The FAZ is required for foveal development and com-plete foveal excavation.62 Although causeeeffectrelationships in foveal development are being refined, the
Figure 7. Correlation between area of the foveal avascular zone (FAZ) andvisual acuity (VA). A, A scatterplot of the entire cohort is provided. B, Agraphical illustration of the final regression model demonstrating how therelationship between FAZ area and mean VA varies with age is presented.Blue and red circles represent subjects below and above the mean age of thecohort (62.9 years), respectively. The predicted slope of the relationshipbetween FAZ area and VA for a population 1 standard deviation above themean age of the cohort (dashed line), the mean age of the cohort(continuous line), and 1 standard deviation below the mean age of thecohort (dotted line) are provided. The slopes of the 3 lines are different,thereby providing evidence that the relationship between FAZ area andVA varies with age. BCVA ¼ best-corrected visual acuity.
Balaratnasingam et al ( Foveal Avascular Zone
2363

formation of the FAZ before the foveal pit duringembryologic development suggests that the size of theFAZ regulates the degree of foveal excavation.63 Dubiset al18 calculated foveal pit volume in 42 subjects usingOCT techniques and demonstrated that it was significantlycorrelated with FAZ area. Because foveal pit volume isintrinsically related to FAZ area, foveal pit volume might
be considered a useful biomarker of visual function inretinal vascular disease. However, in this study we foundthat it was not possible to reliably measure foveal pitvolume in 22 of 95 eyes (23.2%) due to retinal thickeningand intraretinal cystic changes that subsequently distortedthe contour of the foveal pit. Furthermore, foveal pitvolume was not shown to be significantly associated with
Figure 8. Case illustrations. Patient A and patient B are of similar age and demonstrate similar foveal anatomic changes due to diabetic retinopathy, with theexception of the area of the foveal avascular zone. Patient B has a significantly larger foveal avascular zone area and also a lower visual acuity (VA).
Ophthalmology Volume 123, Number 11, November 2016
2364

VA using regression analysis. Collectively, these findingssuggest that FAZ area has greater utility as a biomarker ofvisual function than foveal pit volume in DR and RVO.Arguably, FAZ area is also easier to quantify than fovealpit volume in the clinical setting using current imageanalysis software.
We acknowledge several limitations of this study,including its retrospective design and the limited number ofsubjects. Prospective studies of larger sample size will beimportant to reaffirm the findings of this report. Anotherlimitation of this study is the nonstandardized manner inwhich VA measurements were attained. Future studies thataim to evaluate the relationship between VA and FAZ areashould utilize standardized VA measurement protocols suchas those used in clinical trials.64 Also, because imageartifacts due to poor fixation or media opacities maypreclude clear visualization of the macula, it may not bepossible to measure FAZ area using OCTA in all patientswith retinal vascular disease.65 Additionally, whencapillary flow rates fall below the threshold detected byOCTA algorithms, the terminal capillary ring may not becompletely visualized in certain instances and FAZ areameasurements may therefore be influenced. We alsoemphasize that the etiopathology of retinal vasculardiseases, particularly DR, is complex. Several importantpredictors that have been shown to correlate with diseaseprogression and visual loss, such as age of disease onset,duration of disease, HbA1c measurements, renal disease,and hypertension, were not used in the regressionanalyses.66e68 Some of these parameters can be difficultto reliably discern from patient medical records.69,70
Furthermore, The Diabetes Control and ComplicationTrial showed that approximately 11% of the variation inretinopathy risk was associated with HbA1c readings andduration of diabetes,71 suggesting that 89% of the variationin risk was due to factors independent of HbA1c.72 BecauseOCT is widely used in the clinical management of retinalvascular diseases, the purpose of this report was todemonstrate that FAZ area is a useful metric for gradingthe functional severity of maculopathy due to DR andRVO. Automated algorithms and advances in OCTAsoftware may facilitate rapid acquisition of FAZ areameasurements, thereby enabling clinicians to routinelyintegrate morphologic information about the FAZ intoclinical practice.48,51 Because FAZ area is also correlatedto foveal capillary density and foveal intercapillary dis-tances in some conditions,73 by extension, it is possible thatthese latter quantitative metrics may also be correlated withVA. We emphasize that biomorphometric modelingperformed in this study utilized data from a single visit;therefore, the results of this study cannot be used todetermine the risk of disease progression or predictresponse to treatment. The previous study by Sim et al74
showed that the rate of FAZ enlargement ranged between5% and 10% of baseline FAZ area per year in eyes withdiabetic macular ischemia; therefore, further study aboutFAZ area and VA correlations during the natural courseof retinal vascular diseases and following treatment iswarranted.
References
1. From the Centers for Disease Control and Prevention. Blind-ness caused by diabeteseMassachusetts, 1987-1994. JAMA1996;276:1865–6.
2. Diabetic Retinopathy. Available at: https://nei.nih.gov/eyedata/diabetic. Accessed May 2, 2016.
3. Rogers S, McIntosh RL, Cheung N, et al. The prevalence ofretinal vein occlusion: pooled data from population studiesfrom the United States, Europe, Asia, and Australia.Ophthalmology 2010;117:313–319 e1.
4. Boyle JP, Honeycutt AA, Narayan KM, et al. Projection ofdiabetes burden through 2050: impact of changing demog-raphy and disease prevalence in the U.S. Diabetes Care2001;24:1936–40.
5. Jonas JB, Schneider U, Naumann GO. Count and density ofhuman retinal photoreceptors. Graefes Arch Clin Exp Oph-thalmol 1992;230:505–10.
6. Yu DY, Cringle SJ, Su EN. Intraretinal oxygen distribution inthe monkey retina and the response to systemic hyperoxia.Invest Ophthalmol Vis Sci 2005;46:4728–33.
7. Yu PK, Balaratnasingam C, Cringle SJ, et al. Microstructureand network organization of the microvasculature in thehuman macula. Invest Ophthalmol Vis Sci 2010;51:6735–43.
8. Yu PK, Balaratnasingam C, Morgan WH, et al. The structuralrelationship between the microvasculature, neurons, and gliain the human retina. Invest Ophthalmol Vis Sci 2010;51:447–58.
9. Mammo Z, Balaratnasingam C, Yu P, et al. Quantitativenoninvasive angiography of the fovea centralis using specklevariance optical coherence tomography. Invest OphthalmolVis Sci 2015;56:5074–86.
10. Kim DY, Fingler J, Zawadzki RJ, et al. Noninvasive imagingof the foveal avascular zone with high-speed, phase-varianceoptical coherence tomography. Invest Ophthalmol Vis Sci2012;53:85–92.
11. Zheng Y, Gandhi JS, Stangos AN, et al. Automated segmen-tation of foveal avascular zone in fundus fluorescein angiog-raphy. Invest Ophthalmol Vis Sci 2010;51:3653–9.
12. Popovic Z, Knutsson P, Thaung J, et al. Noninvasive imagingof human foveal capillary network using dual-conjugateadaptive optics. Invest Ophthalmol Vis Sci 2011;52:2649–55.
13. Chui TY, VanNasdale DA, Elsner AE, Burns SA. The asso-ciation between the foveal avascular zone and retinal thick-ness. Invest Ophthalmol Vis Sci 2014;55:6870–7.
14. Pinhas A, Razeen M, Dubow M, et al. Assessment of perfusedfoveal microvascular density and identification of nonperfusedcapillaries in healthy and vasculopathic eyes. InvestOphthalmol Vis Sci 2014;55:8056–66.
15. Schmoll T, Singh AS, Blatter C, et al. Imaging of the paraf-oveal capillary network and its integrity analysis using fractaldimension. Biomed Opt Express 2011;2:1159–68.
16. Kuehlewein L, Tepelus TC, An L, et al. Noninvasive visual-ization and analysis of the human parafoveal capillary networkusing swept source OCT optical microangiography. InvestOphthalmol Vis Sci 2015;56:3984–8.
17. Samara WA, Say EA, Khoo CT, et al. Correlation of fovealavascular zone size with foveal morphology in normal eyesusing optical coherence tomography angiography. Retina2015;35:2188–95.
18. Dubis AM, Hansen BR, Cooper RF, et al. Relationshipbetween the foveal avascular zone and foveal pit morphology.Invest Ophthalmol Vis Sci 2012;53:1628–36.
Balaratnasingam et al ( Foveal Avascular Zone
2365

19. Tam J, Martin JA, Roorda A. Noninvasive visualizationand analysis of parafoveal capillaries in humans. InvestOphthalmol Vis Sci 2010;51:1691–8.
20. Laatikainen L, Larinkari J. Capillary-free area of the fovea withadvancing age. Invest Ophthalmol Vis Sci 1977;16:1154–7.
21. Arend O, Wolf S, Harris A, Reim M. The relationship ofmacular microcirculation to visual acuity in diabetic patients.Arch Ophthalmol 1995;113:610–4.
22. Remky A, Wolf S, Knabben H, et al. Perifoveal capillarynetwork in patients with acute central retinal vein occlusion.Ophthalmology 1997;104:33–7.
23. Maheshwary AS, Oster SF, Yuson RM, et al. The associationbetween percent disruption of the photoreceptor innersegment-outer segment junction and visual acuity in diabeticmacular edema. Am J Ophthalmol 2010;150:63–67.e1.
24. Schwartz DM, Fingler J, Kim DY, et al. Phase-variance opticalcoherence tomography: a technique for noninvasive angiog-raphy. Ophthalmology 2014;121:180–7.
25. Fingler J, Readhead C, Schwartz DM, Fraser SE. Phase-contrast OCT imaging of transverse flows in the mouseretina and choroid. Invest Ophthalmol Vis Sci 2008;49:5055–9.
26. Makita S, Jaillon F, Yamanari M, et al. Comprehensive in vivomicro-vascular imaging of the human eye by dual-beam-scanDoppler optical coherence angiography. Opt Express2011;19:1271–83.
27. Jia Y, Bailey ST, Hwang TS, et al. Quantitative opticalcoherence tomography angiography of vascular abnormalitiesin the living human eye. Proc Natl Acad Sci U S A 2015;112:E2395–402.
28. Xu J, Han S, Balaratnasingam C, et al. Retinal angiographywith real-time speckle variance optical coherence tomography.Br J Ophthalmol 2015;99:1315–9.
29. An L, Wang RK. In vivo volumetric imaging of vascularperfusion within human retina and choroids with optical mi-cro-angiography. Opt Express 2008;16:11438–52.
30. Carpineto P, Mastropasqua R, Marchini G, et al. Reproduc-ibility and repeatability of foveal avascular zone measurementsin healthy subjects by optical coherence tomography angiog-raphy. Br J Ophthalmol 2016;100:671–6.
31. Grading diabetic retinopathy from stereoscopic color fundusphotographsean extension of the modified Airlie Houseclassification. ETDRS report number 10. Early TreatmentDiabetic Retinopathy Study Research Group. Ophthalmology1991;98(5 Suppl):786–806.
32. Trichonas G, Kaiser PK. Optical coherence tomography imagingof macular oedema. Br J Ophthalmol 2014;98(Suppl 2):ii24–9.
33. Sim DA, Keane PA, Fung S, et al. Quantitative analysis ofdiabetic macular ischemia using optical coherence tomogra-phy. Invest Ophthalmol Vis Sci 2014;55:417–23.
34. Radwan SH, Soliman AZ, Tokarev J, et al. Association ofdisorganization of retinal inner layers with vision after reso-lution of center-involved diabetic macular edema. JAMAOphthalmol 2015;133:820–5.
35. Sun JK, Lin MM, Lammer J, et al. Disorganization of theretinal inner layers as a predictor of visual acuity in eyes withcenter-involved diabetic macular edema. JAMA Ophthalmol2014;132:1309–16.
36. Prakash YS, Smithson KG, Sieck GC. Application of theCavalieri principle in volume estimation using laser confocalmicroscopy. Neuroimage 1994;1:325–33.
37. Balaratnasingam C, Chae B, Remmer MH, et al. The spatialprofile of macular pigments is related to the topologicalcharacteristics of the foveal avascular zone. Invest OphthalmolVis Sci 2015;56:7859–65.
38. Cohen J, Cohen P, West SG, Aiken LS. Applied MultipleRegression/Correlation Analysis for the Behavioral Sciences.3rd ed. Mahwah, New Jersey: Lawrence Erlbaum Associates;2003.
39. Roach ES, Bettermann K, Biller J. Toole’s Cerebrovascular Dis-orders. 6th ed. New York: Cambridge University Press; 2010:33.
40. Yu DY, Cringle SJ, Yu PK, Su EN. Intraretinal oxygen dis-tribution and consumption during retinal artery occlusion andgraded hyperoxic ventilation in the rat. Invest Ophthalmol VisSci 2007;48:2290–6.
41. Parodi MB, Visintin F, Della Rupe P, Ravalico G. Fovealavascular zone in macular branch retinal vein occlusion. IntOphthalmol 1995;19:25–8.
42. Simader C, Ritter M, Bolz M, et al. Morphologic parametersrelevant for visual outcome during anti-angiogenic therapy ofneovascular age-related macular degeneration. Ophthalmology2014;121:1237–45.
43. Mariampillai A, Standish BA, Moriyama EH, et al. Specklevariance detection of microvasculature using swept-sourceoptical coherence tomography. Opt Lett 2008;33:1530–2.
44. de Carlo TE, Chin AT, Bonini Filho MA, et al. Detection ofmicrovascular changes in eyes of patients with diabetes but notclinical diabetic retinopathy using optical coherence tomog-raphy angiography. Retina 2015;35:2364–70.
45. Coscas F, Glacet-Bernard A, Miere A, et al. Optical coherencetomography angiography in retinal vein occlusion: evaluationof superficial and deep capillary plexa. Am J Ophthalmol2016;161:160–71. e1e2.
46. Agemy SA, Scripsema NK, Shah CM, et al. Retinal vascularperfusion density mapping using optical coherence tomogra-phy angiography in normals and diabetic retinopathy patients.Retina 2015;35:2353–63.
47. Kashani AH, Lee SY, Moshfeghi A, et al. Optical coherencetomography angiography of retinal venous occlusion. Retina2015;35:2323–31.
48. Salz DA, de Carlo TE, Adhi M, et al. Select features ofdiabetic retinopathy on swept-source optical coherencetomographic angiography compared with fluorescein angi-ography and normal eyes. JAMA Ophthalmol 2016;134:644–50.
49. Takase N, Nozaki M, Kato A, et al. Enlargement of fovealavascular zone in diabetic eyes evaluated by en face opticalcoherence tomography angiography. Retina 2015;35:2377–83.
50. Samara WA, Shahlaee A, Sridhar J, et al. Quantitative opticalcoherence tomography angiography features and visual func-tion in eyes with branch retinal vein occlusion. Am J Oph-thalmol 2016;166:76–83.
51. Hwang TS, Gao SS, Liu L, et al. Automated quantification ofcapillary nonperfusion using optical coherence tomographyangiography in diabetic retinopathy. JAMA Ophthalmol2016;134:367–73.
52. Shahlaee A, Pefkianaki M, Hsu J, Ho AC. Measurement offoveal avascular zone dimensions and its reliability in healthyeyes using optical coherence tomography angiography. Am JOphthalmol 2016;165:201–2.
53. Bringmann A, Pannicke T, Grosche J, et al. Muller cells in thehealthy and diseased retina. Prog Retin Eye Res 2006;25:397–424.
54. Distler C, Weigel H, Hoffmann KP. Glia cells of the monkeyretina. I. Astrocytes. J Comp Neurol 1993;333:134–47.
55. Gariano RF, Sage EH, Kaplan HJ, Hendrickson AE.Development of astrocytes and their relation to blood ves-sels in fetal monkey retina. Invest Ophthalmol Vis Sci1996;37:2367–75.
Ophthalmology Volume 123, Number 11, November 2016
2366

56. Cai J, Boulton M. The pathogenesis of diabetic retinopathy:old concepts and new questions. Eye 2002;16:242–60.
57. Gittings NS, Fozard JL. Age related changes in visual acuity.Exp Gerontol 1986;21:423–33.
58. Mizutani M, Gerhardinger C, Lorenzi M. Muller cell changesin human diabetic retinopathy. Diabetes 1998;47:445–9.
59. Ly A, Yee P, Vessey KA, et al. Early inner retinal astrocytedysfunction during diabetes and development of hypoxia,retinal stress, and neuronal functional loss. Invest OphthalmolVis Sci 2011;52:9316–26.
60. Yu DY, Yu PK, Cringle SJ, et al. Functional and morpho-logical characteristics of the retinal and choroidal vasculature.Prog Retin Eye Res 2014;40:53–93.
61. YuDY, Cringle SJ. Oxygen distribution and consumption withinthe retina in vascularised and avascular retinas and in animalmodels of retinal disease. Prog Retin Eye Res 2001;20:175–208.
62. Springer AD, Hendrickson AE. Development of the primatearea of high acuity, 3: temporal relationships between pitformation, retinal elongation and cone packing. Vis Neurosci2005;22:171–85.
63. Provis JM, Sandercoe T, Hendrickson AE. Astrocytes andblood vessels define the foveal rim during primate retinaldevelopment. Invest Ophthalmol Vis Sci 2000;41:2827–36.
64. Dong LM, Marsh MJ, Hawkins BS. Measurement and analysisof visual acuity in multicenter randomized clinical trials in theUnited States: findings from a survey. Ophthalmic Epidemiol2003;10:149–65.
65. Spaide RF, Fujimoto JG, Waheed NK. Image artifacts in op-tical coherence tomography angiography. Retina 2015;35:2163–80.
66. Leese G. Longitudinal study examining the risk factors forproliferative retinopathy and maculopathy in type-I diabetes:The Royal College of Physicians of Edinburgh DiabetesRegister Group. Eye 2004;18:814–20.
67. Yau JW, Rogers SL, Kawasaki R, et al. Global prevalence andmajor risk factors of diabetic retinopathy. Diabetes Care2012;35:556–64.
68. Moss SE, Klein R, Klein BE. Ten-year incidence of visual lossin a diabetic population. Ophthalmology 1994;101:1061–70.
69. Banerjee D, Chung S, Wong EC, et al. Underdiagnosis ofhypertension using electronic health records. Am J Hypertens2012;25:97–102.
70. Staff M, Roberts C, March L. The completeness of electronicmedical record data for patients with Type 2 Diabetes in pri-mary care and its implications for computer modelling ofpredicted clinical outcomes. Prim Care Diabetes 2016;10:352–9.
71. Lachin JM, Genuth S, Nathan DM, et al. Effect of glycemicexposure on the risk of microvascular complications in thediabetes control and complications trial)revisited. Diabetes2008;57:995–1001.
72. Hirsch IB, Brownlee M. Beyond hemoglobin A1c)need foradditional markers of risk for diabetic microvascular compli-cations. JAMA 2010;303:2291–2.
73. Miri S, Shrier EM, Glazman S, et al. The avascular zone andneuronal remodeling of the fovea in Parkinson disease. AnnClin Transl Neurol 2015;2:196–201.
74. Sim DA, Keane PA, Zarranz-Ventura J, et al. Predictive fac-tors for the progression of diabetic macular ischemia. Am JOphthalmol 2013;156:684–92.
Footnotes and Financial Disclosures
Originally received: May 17, 2016.Final revision: July 3, 2016.Accepted: July 10, 2016.Available online: August 11, 2016. Manuscript no. 2016-1056.1 LuEsther T. Mertz Retinal Research Center, Manhattan Eye, Ear andThroat Hospital, New York, New York.2 Vitreous Retina Macula Consultants of New York, New York, New York.3 Department of Ophthalmology, New York University School of Medi-cine, New York, New York.4 Centre for Ophthalmology and Visual Science, Lions Eye Institute, Uni-versity of Western Australia, Perth, Australia.5 Department of Biostatistics, Columbia University Medical Center, NewYork, New York.
Financial Disclosures:
The authors have made the following disclosures: L.Y.: Honorarium eGenentech (San Franciscio, CA) for the retina fellow teaching program.
K.B.F.: Consultant e Genentech (San Francisco, CA), Optos (Dunfermline,UK), Bayer HealthCare (New York), Optovue (Fremont, CA), DigiSight(San Francisco, CA), and Heidelberg Engineering (Heidelberg, Germany)(honorarium for each).
Financial Support: LuEsther T. Mertz Retinal Research Center, ManhattanEye, Ear and Throat Hospital, New York, New York, The Macula Foun-dation, Inc., New York, New York, and RANZCO Eye Foundation, NewSouth Wales, Australia. The funding organizations had no role in the designor conduct of this research.
Author Contributions:
Conception and design: Balaratnasingam, Inoue, Ahn, Yannuzzi, Freund
Analysis and interpretation: Balaratnasingam, Inoue, Ahn, McCann,Dhrami-Gavazi, Freund
Data acquisition and/or research execution: Balaratnasingam, Inoue, Ahn,McCann, Dhrami-Gavazi, Yannuzzi
Obtained funding: Not applicable
Overall responsibility: Balaratnasingam, Inoue, Ahn, Yannuzzi, Freund
Abbreviations and Acronyms:BRVO ¼ branch retinal vein occlusion; CRVO ¼ central retinal veinocclusion; CST ¼ central subfield thickness; DR ¼ diabetic retinopathy;DRIL ¼ disorganization of the retinal inner layers; ETDRS ¼ EarlyTreatment Diabetic Retinopathy Study; EZ ¼ ellipsoid zone;FA ¼ fluorescein angiography; FAZ ¼ foveal avascular zone;GEE¼ generalized estimating equations; ILM ¼ inner limiting membrane;LogMAR ¼ logarithm of the minimum angle of resolution; OCT ¼ opticalcoherence tomography; OCTA ¼ optical coherence tomography angiog-raphy; PFT ¼ point foveal thickness; RVO ¼ retinal venous occlusion;SD OCT ¼ spectral-domain optical coherence tomography; VA ¼ visualacuity; VEGF ¼ vascular endothelial growth factor.
Correspondence:Chandrakumar Balaratnasingam, MD, PhD, LuEsther T Mertz RetinalResearch Center and Vitreous, Retina, Macula Consultants of New York,Manhattan Eye, Ear and Throat Hospital, New York, NY 10022. E-mail:[email protected].
Balaratnasingam et al ( Foveal Avascular Zone
2367