Embed Size (px)
Citation preview
Working Paper 27
Job Attribute Preferences in Scotland
John Sutherland
Centre for Public Policy for RegionsUniversity of GlasgowAdam Smith Building
Glasgow G12 8RT
email: [email protected]
Job Attribute Preferences in Scotland
ABSTRACT
This paper examines the job attribute preferences of workers resident in Scotland, by which is meant the extent to which individuals attach or desire a variety of specific qualities and outcomes from their paid work. Having identified 15 job attribute preferences and categorised them as being either extrinsic or intrinsic, the job attribute preferences are ranked. Then possible personal work and non-work characteristics with which they are statistically associated are identified using both bivariate and multivariate analysis. Finally, the possibility that the job attribute preferences of workers resident in Scotland differ from those of workers resident elsewhere in the United Kingdom is explored. The data set used in the examination is the 2006 Employees’ Skills Survey.
Intrinsic job attributes are relatively more important than extrinsic job attributes. Four of the top five ranked job attribute preferences reflect intrinsic job attributes viz. ‘work you like doing’ at 1; ‘the ability to use your abilities’ at 3; ‘friendly people to work with’ at 4; and ‘a job where you can use your initiative’ at 5. The exception is ‘a secure job’, which is ranked 2. Conversely, four of the bottom five job attribute preferences reflect extrinsic job attributes viz. ‘good fringe benefits’ at 14; ‘good promotion prospects’ at 13; ‘choice in the hours of work’ at 12; and ‘convenient hours of work’ at 11. The exception is ‘an easy work load’, which is ranked 15.
Gender, family circumstances, educational qualifications and employment status are seen to be the more salient influences on worker job attribute preferences, much in accord with expectations. For example: males relative to females are less likely to value more highly job attributes such as ‘convenient hours’, ‘choice of hours’ and ‘good working conditions’; those with financially dependent children, relative to those who do not have the same, are more likely to value more highly job attributes such as ‘good pay’, a ‘secure job’ and ‘choice of hours’; those with level 4 or level 5 as their highest qualification level, relative to those with no qualifications, are more likely to value more highly job attributes such as a job which makes ‘use of initiative’ and work they ‘like to do’; and those working full time, relative to those not working full time, are more likely to value more highly job attributes such as ‘good promotion prospects’ and ‘good training provision’.
Intra United Kingdom differences in worker job attribute preferences are more likely than not. Generally, with respect to most job attribute preferences, workers resident in England – and, sometimes, Wales and Northern Ireland – relative to workers resident in Scotland, are more likely to value more highly job preferences such as ‘convenient hours’, ‘choice of hours’ and ‘good fringe benefits’.
Job Attribute Preferences in Scotland 1
1. CONTEXT AND MOTIVATION
The problematical role of ‘work’ in individuals’ lives remains central to many
of the continuing controversies in the social science disciplines of economics and
sociology.
According to writers associated with the Classical School of Economic Thought, such
as, for example, Smith, Malthus, Bentham, and McCulloch, work was a ‘bad’, “by its
very nature a pain”, whereas, in contrast, “idleness was associated with pleasure”
(Spencer, 2009, p. 4). Some contemporaneous writers, notably Marx, challenged this
assumption. Potentially, work could be a ‘good’, a fulfilling, rewarding and uplifting
activity. It was the capitalist system which had alienated workers from their work,
turning it into a “loathsome activity” (Spencer, 2009, p. 5). ‘Economic Man’,
however, was the product of the Neo- Classical School of Economic Thought.
According to this perspective, work was assumed to be a ‘disutility’. Consequently,
the isolated individual, motivated only by self interest and seeking to maximise his
utility required monetary compensation in order to sacrifice his time to work, thereby
ensuring the supply of his labour, if not necessarily his effort (Marsden, 1986).
Although ‘work’ was not uniform in its quality, variants on Smith’s original theory of
compensating wage differentials ensured that the market produced a match between
the different characteristics of jobs and the job preferences of workers (Becker, 1965:
Kennedy, 2008). It was assumed that there existed a locus of wage and job
characteristics. As a consequence, workers’ marginal willingness to pay for job
attributes could be calculated by means of an appropriately specified wage equation
using hedonic wage methodology (Manning, 2003).2 1 The 2006 Employee Skills Survey was deposited by Francis Green, University of Kent, Department of Economics. Crown copyright is held jointly with the ESRC Centre for Skills, Knowledge and Organisational Performance (SCOPE) and the University of Kent. Crown copyright material is reproduced with the permission of the Controller of HMSO and the Queen’s Printer for Scotland. The data were collected by BMRB, Socal Research. The funders of the survey were the Economic and Social Research Council, the Department for Education and Skills, the Department of Trade and Industry, the Learning and Skills Council, the Sector Skills Development Agency, Scottish Enterprise, the Learning and Skills Observatory for Wales, the East Midlands Development Agency, Highlands and Islands Enterprise and the Northern Ireland Department for Employment and Learning. The data were distributed by the UK Data Archive, University of Essex, Colchester. The original data creators, the depositors, the copyright holders, the funders and the UK Data Archive bear no responsibility for the analysis or interpretation of the data made in this paper. 2 For example, Bender and Elliott (2002) use a variant of this approach – what they call a ‘hybrid approach’- to examine wage differences between the private and public sectors in the UK, arguing that to explain sectoral wage differences requires cognisance to be made not only of differences in
1
Much of the early developments in Industrial Sociology were associated with
criticising the neo-classical economists’ perspective of ‘economic man’ and
attempting to construct an alternative viz. ‘social man’. Towards this end, writers
associated with the Human Relations movement made alternative assumptions:
individuals were not isolated but members of social groups. Moreover, individuals
responded to the social norms of these groups, formed by life experiences derived
from both inside and outside the workplace, often to their personal disadvantage
(Mayo, 1949). Certain human needs were assumed to be met by paid work. In
publications which were to come to inform much of the management literature of later
decades, Maslow (1943) argued that these human needs were organised into a
hierarchy of prepotency; and Hertzberg (1966) identified the factors which
determined job satisfaction, the five motivators of achievement, recognition, the work
itself, responsibility and advancement. As advanced societies shifted from an
‘industrial’ to a ‘post industrial’ structure, so work experience was seen to be a major
source of personal enrichment (Bell, 1974). However, this generally optimistic
perspective of work was challenged by Braverman (1974). In the re-emergence of a
Marxian analysis of work, Braverman’s thesis was that the ever increasing division of
labour for both manual and non-manual workers would lead inexorably to the de-
skilling of work tasks and tighter managerial control of work processes.
An assumption common to both writers associated with the Human Relations
movement and Braverman was the deterministic nature of the work situation,
producing either well-being or degradation, respectively. The fundamental assumption
of the ‘action frame of reference’ perspective was that the intrinsic characteristics of
work situations were indeterminate and that workers’ attitudes and behaviours were
dependent upon the prior expectations that workers brought to their places of work
(Goldthorpe et al, 1968). Whereas writers associated with the Human Relations
movement had argued that an individual’s social and psychological needs were
realised through employment, writers associated with the action frame of reference
maintained that employment was an instrumental activity. As consumer values and
family replaced work as the central element within individuals’ identities, workers
acted like ‘economic man’, in a manner little different from the neo-classical
paradigm in Economics. Further, as typified by the affluent worker studies, the locus
individuals’ human capital but also differences in what they do, manifest in terms of sets of job attributes.
2
of empirical research shifted from the closed system of the workplace to the external
labour market.
Subsequent writers were to be critical of the single, fundamental assumption of the
predominance of work orientations within the action frame of reference perspective.
Daniel (1969) argued that note had to be made of the contexts within which workers
operated because work orientations could neither be examined nor explained outwith
the totality of individuals’ social experiences; Blackburn and Mann (1979) argued that
workers’ job orientations were neither strong nor fixed but were subject to
modification with changes in life cycles and life styles, and that workers possessed
multiple often complex job preferences; and Fox (1980) argued that many individuals
often experienced limited choice with respect to jobs, and that as a consequence their
work expectations had to be adjusted to conform with the realities they confronted
(Silverman, 1970: Brown, 1992: Watson, 1994 and 2003). It is less than appropriate,
therefore, to view the action frame of reference as providing a wholly appropriate
account of the employment relationship (Brown, 1988). Nonetheless, the element
within it which emphasises the socially constructed and socially constrained nature of
employee expectations and priorities regarding work is of relevance to the subject
matter of this paper.
On the assumption that individuals have values and work orientations which they
bring to the workplace, ceteris paribus, they will aspire to select types of work which
are congruent with these values and orientations. However, there are two distinct
dimensions to work attitudes viz. work commitment and job attitude preferences
(Gallie et al, 1998). Work commitment is about the importance an individual
voluntarily chooses to attach to employment, something which will be influenced,
inter alia, by family and schooling; competition from out of work commitments, for
example to family, dependents and pastimes; and changes in the labour market,
notably the number and nature of job opportunities available. By job attribute
preferences is meant the extent to which individuals attach or desire a variety of
specific qualities and outcomes from their paid work. Conventionally, job attribute
preferences are categorised as being either ‘extrinsic’ i.e. fulfilling – or facilitating the
fulfilment of – material needs or ‘intrinsic’ i.e. fulfilling – or facilitating the fulfilment
3
of - other, often higher order needs, such as self determination, self expression etc.
(Konrad et al, 2000).
Accepting the premise of the salience of individual heterogeneity, therefore, this
paper examines workers’ job attribute preferences in Scotland. First, job attribute
preferences are ranked. Then possible personal characteristics with which they are
statistically associated are examined using both bivariate and multivariate analysis.
The data set used in these explorations is the Scottish sub population of the 2006
Employees’ Skills Survey. Finally, the possibility of intra- United Kingdom (UK)
differences in workers’ job attribute preferences is examined, for which exercise
recourse is made to the full UK-wide data set.
2. THE DATA SET
The data source used is the 2006 Employee Skills Survey. The core sample for
the survey was based on a multi-stage design, with addresses being drawn from a
random starting point within the 297 geographical boundaries (i.e. post codes)
selected. 4,800 productive interviews of individuals aged 20 – 65 in employment were
undertaken during a seven month period during 2006. There were five areas within
the UK where this core sample was boosted viz. East Midlands, Wales, the Scottish
Enterprise Area, the Highlands and Islands (of Scotland) and Northern Ireland, with
the boosts being achieved using the same sampling methodology. As a consequence,
the total number of observations available within the data set is 7,787. For the
particular purpose of the first two components of this working paper, the sub
population of those living in Scotland is extracted from the full data set. The working
data set in this instance has, nominally, 2,000 observations.
The 2006 Employee Skills Survey has its origins in the surveys associated with the
innovative Social Change and Economic Life Initiative (SCELI) of 1986. Subsequent
to the SCELI surveys, other employee skills surveys have been undertaken, part
designed to establish a degree of continuity with respect to the nature and content of
certain questions about skills possessed and required by individuals in their current
jobs. Information is collected also about the context (e.g. the working environment) in
which these skills are acquired, developed and applied (Felstead et al, 2007). More
recently, other related questions have come to be included, for example seeking to
4
elicit employee perspectives on factors such as job quality, job satisfaction and task
discretion (Green, 2008).
A novel feature of the 2006 survey was the inclusion of a series of questions designed
to explore employee attitudes to skills use and skills development (Felstead et al,
2007). These attitudes, however, are dependent upon the individual’s latent values
about work and his/her, sometimes explicit sometimes not, job attribute preferences.
Accordingly, following a strategy employed in the 1992 Employment in Britain
survey (Gallie et al, 1998), respondents were asked about their job attribute
preferences, the relative importance they attached to 15 job attributes. The interviewer
showed a card and said: “I am going to read out a list of some things people may look
for in a job and I would like you to tell me how important you feel each is for you…”.
For each job attribute preference, interviewees were offered four degrees of relative
importance by way of response viz. ‘essential’, ‘very important’, ‘fairly important’
and ‘not very important’.3
The 15 job attribute preferences are identified in Table 1, and categorised (by the
author) as to whether they reflect extrinsic or intrinsic job attributes.4
3. JOB ATTRIBUTE PREFERENCES: A RANKING EXERCISE
The percentage frequency distribution of all the responses given, by job
attribute preference and by category, is reported in columns 2, 3, 4 and 5 of Table 2.
Looking at the percentage who respond ‘essential’, ‘work you like doing’ (at 44.60
percent), ‘a secure job’ (at 38.02 percent), ‘friendly people to work with (at 30.60
percent) and ‘good pay’ (at 30.55 percent) are the four job attribute preferences cited
most frequently. ‘An easy work load’ (at 4.02 percent), ‘good fringe benefits’ (at 6.98
percent), ‘good promotion prospects’ (at 9.92 percent) and ‘choice in the hours you
work’ (at 11.36) are the four job attribute preferences cited least frequently.
3 There is a literature (e.g. Williamson et al, 2002) which considers survey methodology to be inappropriate to elicit this type of information, advocating ‘policy capturing’ as an alternative. 4 The categorisation used in the paper, therefore, is both arbitrary and subjective. It is used primarily for the convenience of exposition, presentation and argument. It is better to examine specific job attribute preferences separately. Consequently, dependent upon the reader’s own preferences, a particular job attribute preference could be re-categorised to suit or the whole exercise of categorisation may be dismissed and attention focussed instead upon the particular job attribute preference/s in question.
5
One feature of the frequency distribution of the responses is that the percentage who
respond ‘very important’ is greater than the percentage who respond ‘essential’,
without exception across the 15 job attribute preferences. Looking at the ranking from
the perspective of the percentage reporting ‘essential’ combined with the percentage
reporting ‘very important’, the four job attribute preferences deemed most
consequential change: ‘work you like doing’ remains first (at 90.08 percent);
‘opportunities to use your abilities’ (at 85.1 percent) is now second (from a position of
being ranked fifth in terms of the percentage responding ‘essential’); ‘a secure job’ (at
83.74 percent) drops from second place to third; and ‘a job where you can use your
initiative’ (at 81.95 percent) is now fourth (from a position of being ranked seventh in
terms of the percentage responding ‘essential’). ‘Good pay’ (at 73.8 percent) drops
from the top four and is now ranked seventh. The job attribute preferences cited least
frequently – and their ranking – does not change, with ‘an easy work load’ at 19.4
percent, ‘good fringe benefits’ at 37.65 percent, ‘good promotion prospects’ at 41.5
percent and ‘choice in the hours you work’ at 42.63 percent.
The nature of these rankings are partially confirmed by looking, conversely, at the
percentages responding ‘not very important’. ‘Work you like doing’ (at 0.90 percent),
‘opportunities to use your abilities’ at (1.95 percent), ‘a job where you can use your
initiative’ (at 2.10 percent) and ‘friendly people to work with’ (at 2.25 percent) are the
four job attribute preferences cited least frequently. In contrast, ‘an easy work load’
(at 45.13 percent), ‘good promotion prospects’ (at 27.17 percent), ‘good fringe
benefits’ (at 26.26 percent) and ‘choice in your hours of work’ (at 21.61 percent) are
the four job attribute preferences cited most frequently.
By means of an heroic assumption, these ordinal responses may be re-interpreted as
cardinal responses – assuming ‘essential’ = 4; ‘very important’ = 3 etc. – and their
mean values (and standard deviations) calculated. Taking these mean values, the 15
job attribute preferences may be ranked in terms of their relative importance. The
ranking appears as the final column of Table 2. From this alternative perspective, in
this order, ‘work you like doing’, ‘a secure job’, ‘opportunities to use your abilities’
and ‘friendly people to work with’ are the four highest ranked job attribute
preferences, whereas, again in this order, ‘an easy work load’, ‘good fringe benefits’,
‘good promotion prospects’ and ‘choice in your hours of work’ are the four lowest
6
ranked job attribute preferences. There would appear to be, therefore, some
congruence between the ordinal and cardinal perspectives of the ranking of the 15 job
attribute preferences.
Using ranking as the more expedient criterion as the basis for direct comparison,
intrinsic job attributes are relatively more important than extrinsic job attributes.5 Four
of the top five ranked job attribute preferences are associated with intrinsic job
attributes viz. ‘work you like doing’ at 1; ‘opportunities to use your abilities’ at 3;
‘friendly people to work with’ at 4; and ‘a job where you can use your initiative’ at 5.
The exception is ‘a secure job’, which is ranked 2. Conversely, four of the bottom five
job attribute preferences are associated with extrinsic job attributes viz. ‘good fringe
benefits’ at 14; ‘good promotion prospects’ at 13; ‘choice in the hours of work’ at 12;
and ‘convenient hours of work’ at 11. The exception is ‘an easy work load’, which is
ranked 15.
4. JOB ATTRIBUTE PREFERENCES: SOME CROSS TABULATIONS
The results reported in the previous section relate to an examination of all
respondents within the Scottish sub population data set. As the literature suggests (e.g.
Gallie et al, 1998) , it is possible that the nature of the responses made on the relative
importance of each of the 15 job attribute preferences will vary by the characteristics
of the individuals interviewed. Accordingly, for the same sub population, each job
attribute preference is cross tabulated with the following 16 variables, deemed to be
salient differentiating characteristics of individuals in employment, both personal
characteristics and characteristics associated with the nature of their employment viz.
• Gender;
• Age, via four dummy variables denoting the following categories: aged 20 –
25, aged 26 - 45, aged 46 - 55 and aged 56 – 65;
• Marital status, whether married or living together as a couple, or otherwise;
• Whether with a financially dependent child (or children) under the age of 15,
or otherwise;
5 This outcome differs from the original in Gallie et al (1998), where, for their UK data set, respondents placed equal emphasis on extrinsic and intrinsic job attributes.
7
• Highest qualification held, in levels, via five dummy variables denoting the
following categories: has no qualifications, level 1, level 2, level 3 and level 4
or 5 6;
• Work experience, via five dummy variables denoting the following categories:
between 1 and 2 years, between 3 and 6 years, between 7 and 10 years,
between 11 and 25 years and over 25 years;
• Whether working full time, or otherwise;
• Whether in a permanent job, or otherwise;
• Whether working in a supervisory or managerial capacity, or otherwise;
• Tenure, via five dummy variables denoting the following categories: less than
1 year, between 1 and 2 years, between 3 and 5 years, between 6 and 10 years
and over 10 years;
• Whether has more than 1 job, or otherwise;
• Whether a member of a union or staff association, or otherwise;
• Sector of employment, via three dummy variables denoting private sector,
public sector and non-profit making sector;
• Employment status i.e. whether working as an employee or self employed;
• Occupation, via nine dummy variables, denoting the following broad
occupational groupings: managers, professional, associate professional,
administrative and secretarial, skilled trades, personal services, sales,
operatives and elementary; and
• Whether seeking a better job, or otherwise
For each cross tabulation, two statistical tests are undertaken and their results
reported:
• The Pearson chi-squared test, identifying independence between the two
variables in question 7
6 Qualifications levels are as follows, broadly: level 1 equates with lower school leaving qualifications; level 2 equates with higher school leaving qualifications and their professional and vocational equivalents; level 3 equates with professional and vocational qualifications which are sub-degree, usually obtained in colleges of further education; level 4 equates with first degrees and their professional equivalents; and level 5 equates with higher degrees. 7 The value of the Pearson chi-squared statistic and its associated significance level determine whether two categorical variables are independent. In this exercise, when the reported significance level of the statistic is (p < 0.05) the null hypothesis that the two variables are independent is rejected. Conventionally, this is interpreted as the two variables being associated with each other.
8
• Cramer’s V, measuring the strength of association between the two variables
in question 8
These results are reported in Tables A1 through to A15 in Statistical Appendix A.
The results of the cross tabulations of the 15 job attribute preferences and the 16
variables identified above which are statistically significant at (p < 0.05) are reported
in detail in the complementary tables, identified as Table A1A, A1B etc.. A short
verbal note on the more salient results is also produced.
The essence of the outcome of this exercise is reported in Tables 3 and 4 which
identify the statistically significant results, for the cross tabulation of the extrinsic job
attribute preferences and the intrinsic job attribute preferences, respectively, by the
variables identified. Tables 5 and 6, respectively, report the corresponding values of
Cramer’s V.
The variable gender is statistically significant five times in the context of extrinsic job
attribute preferences and four times in the context of intrinsic job attribute
preferences. Most, if not all the statistically significant associations are in accord with
expectations, with, for example, ‘good pay’, ‘convenient hours’, ‘choice of hours’ and
‘good training provision’ in the context of the former and ‘work like doing’ and
‘friendly people’ in the context of the latter. Furthermore, the values of Cramer’s V
are relatively large on a number of occasions, notably ‘convenient hours’ (at .2381)
and ‘choice of hours’ (at 0.1539) in the context of extrinsic job attribute preferences
and ‘good relations with supervisor’ (at 0.1888), ‘good working conditions’ (at
0.1888) and ‘friendly people’ (at 0.1838) in the context of intrinsic job attribute
preferences.
The variable age is relatively more consequential in the context of extrinsic job
attribute preferences, where it is statistically significant six times, in contrast to the
three occasions when it is statistically significant in the context of intrinsic job
8 Cramer’s V is an imperfect measure of the extent of association between two categorical variables, which is based upon the chi-square statistic. The statistic is used to compare different strengths of association between variables in different cross tabulations, although the exact magnitude of the extent of any difference cannot be quantified. In 2 X 2 tables -1 ≤ V ≤ 1. In larger tables (i.e. all those associated with this exercise) 0 ≤ V ≤ 1.
9
attribute preferences. The statistically significant results in the context of the former
accord with expectations e.g. ‘good promotion prospects’, ‘good pay’, ‘secure job’
etc., although, notably, only the first has a relatively high value for Cramer’s V (at
0.1542).
In contrast, neither marital status nor dependent child would appear to be of
consequence. In the context of extrinsic job attribute preferences, marital status is
statistically significant twice – with the job attribute preferences of ‘good promotion
prospects’ and ‘choice of hours’, both in accordance with expectations. In the context
of intrinsic job attribute preferences, it is again statistically significant twice – with
the job attribute preferences of ‘good relations with supervisor’ and ‘friendly people’.
In total, the variable dependent child is statistically significant five times, three times
in the context of extrinsic job attribute preferences – with the job attribute preferences
being ‘good pay’, ‘convenient hours’ and ‘choice of hours’ – and twice in the context
of intrinsic job attribute preferences – with the two job attribute preferences in
question being ‘use abilities’ and ‘friendly people’. The former results especially
accord with expectations. Notably, the values of Cramer’s V for ‘convenient hours’
and ‘choice of hours’ are relatively high for the exercise, at 0.1103 and 0.1504,
respectively.
The variable highest qualification held is statistically significant on five occasions in
the context of extrinsic job attribute preferences, where these job attribute preferences
are: ‘good promotion prospects’, ‘good pay’, ‘secure job’, ‘choice of hours’ and ‘good
training provision’. Notably, the value of Cramer’s V for the job preference ‘secure
job’ is 0.1044. The intrinsic job attribute preferences which are associated with
statistically significant results are: ‘use initiative’, ‘work like doing’, ‘use abilities’,
‘easy work load’ and ‘variety in work’, several of which accord with a priori
expectations. The value of Cramer’s V for four of these five results is relatively high
for the exercise in that the values exceed 0.1000. The exception is the job attribute
preference ‘work like doing’.
The variable work experience would appear to be of relatively more consequence in
the context of extrinsic job attribute preferences. Five results in the context of
10
extrinsic job attribute preferences are statistically significant, being ‘good promotion
prospects’, ‘good pay’, ‘convenient hours’, ‘choice of hours’ and ‘good training
provision’. The value of Cramer’s V for the first of these is relatively large at 0.1605.
In contrast, only two results in the context of intrinsic job attribute preferences are
statistically significant viz. ‘work like doing’ and ‘friendly people’.
Similarly, the variable working full time would appear to be of relatively more
consequence in the context of extrinsic job attribute preferences, where six results are
statistically significant. Moreover, for five of the six results, the value of Cramer’s V
is relatively large. The six extrinsic job attribute preferences in question (and the
value of the corresponding Cramer’s V) are as follows: ‘good promotion prospects’
(0.1481), ‘good pay’ (0.1682), ‘secure job’ (0.1036), ‘convenient hours’ (0.2072),
‘choice of hours’ (0.1766) and ‘good fringe benefits’ (0.0695). Several of these
statistically significant results would accord with a priori expectations. There are four
statistically significant results in the context of intrinsic job attribute preferences.
However, the values of the corresponding Cramer’s V are lower. The four intrinsic job
attribute preferences in question are: ‘good relations with supervisor’, ‘use initiative’,
‘variety in work’ and ‘friendly people’. Only the last of these has a value for Cramer’s
V which (at 0.1015) exceeds 0.1000.
The variable in a permanent job is statistically significant on four occasions – and
none of the corresponding values of Cramer’s V exceeds 0.1000. Three of the four are
in the context of extrinsic job attribute preferences, being ‘good pay’, ‘secure job’ and
‘choice of hours’, each as expected. The fourth statistically significant result is for the
intrinsic job attribute preference of ‘good relations with supervisor’.
The variable working in a supervisory or managerial capacity is relatively more
important in the context of intrinsic job attribute preferences than extrinsic job
attribute preferences, with five statistically significant results as opposed to three. The
five intrinsic job preferences are: ‘use initiative’, ‘work like doing’, ‘use abilities’,
‘easy work load’ and ‘variety in work’. The respective values of Cramer’s V for ‘use
initiative’, ‘use abilities’ and ‘easy work load’ are 0.1503, 0.1450 and 0.1401. The
three statistically significant results with extrinsic job attribute preferences are for
11
‘good promotion prospects’, ‘convenient hours’ and ‘choice of hours’. The value of
Cramer’s V for the first two is relatively high, at 0.1533 and 0.1257, respectively.
The variables tenure and having more than one job would appear to be of little
consequence. Tenure is statistically significant only once, in the context of the
extrinsic job attribute preference ‘good promotion prospects’, an outcome perhaps in
accordance with expectations although this is not reflected in the value of Cramer’s V.
The variable having more than one job is statistically significant on three occasions,
twice in the context of extrinsic job attribute preferences (viz. ‘good pay’ and ‘secure
job’) and once in the context of intrinsic job attribute preferences (viz. ‘friendly
people’).
The variable a member of a trade union or staff association is statistically significant
three times in the context of extrinsic job attribute preferences: ‘good promotion
prospects’, ‘secure job’ and ‘good training provision’, outcomes much in accord with
expectations. The value of Cramer’s V for the last of these is relatively high at 0.1639.
This variable is statistically significant in the context of four intrinsic job attribute
preferences. The job attributes in question are ‘good relations with supervisor’, ‘use
abilities’, ‘good working conditions’ and ‘variety in work’. Only one of these results
(‘good working conditions’ at 0.1086) has a value of Cramer’s V which exceeds
0.1000.
The variable sector is statistically significant on four occasions in the context of
extrinsic job attribute preferences, where the job attribute preferences in question are:
‘good pay’, ‘secure job’, ‘good fringe benefits’ and ‘good training provision’. The
value of Cramer’s V for ‘good pay’ is 0.1161. None of the other values of the statistic
exceeds 0.1000. It is statistically significant five times in the context on intrinsic job
attribute preferences, although the values of Cramer’s V never exceed 0.1000. The
five job attribute preferences in question are ‘work like doing’, ‘use abilities’, ‘easy
work load’, ‘good working conditions’ and ‘variety in work’.
The variable employment status would appear to be of some consequence, perhaps as
expected. In the context of extrinsic job attribute preferences it is statistically
significant six times, with the job attribute preferences ‘good promotion prospects’,
12
‘secure job’, ‘convenient hours’, ‘choice of hours’, ‘good fringe benefits’ and ‘good
training provision’. The values of Cramer’s V for ‘good promotion prospects’, ‘secure
job’, ‘convenient hours’ and ‘good training provision’ are 0.1154, 0.1984, 0.1183 and
0.1322, respectively. The variable is statistically significant in the context of intrinsic
job attribute preferences five times, where the job attribute preferences in question
are: ‘good relations with supervisor’, ‘use initiative’, ‘work like doing’, ‘use abilities’
and ‘good working conditions’. The values of Cramer’s V for ‘good relations with
supervisor’ and ‘use abilities’, at 0.3191 and 0.1090, respectively, are relatively high
for the exercise as a whole.
There is no instance in the 15 cross tabulations in which the variable occupation is not
statistically significant, reflecting the salience of this variable, which accords with
expectations. The salience of the variable is further reflected in some of the values of
the Cramer’s V statistic, although this is relatively more evident in the context of
intrinsic job attribute preferences. In the context of the extrinsic job attribute
preferences, the value of Cramer’s V for ‘good pay’ is 0.1020; for ‘convenient hours’
it is 0.1007; and for ‘good training provision’ it is 0.1025. In the context of the
intrinsic job attribute preferences, the values of Cramer’s V for ‘use initiative’ is
0.1326; for ‘work like doing’ it is 0.1261; for ‘use abilities’ it is 0.1605; for ‘easy
work load’ it is 0.1281; and for ‘variety in work’ it is 0.1121.
Finally, and somewhat in contrast to occupation, the variable seeking a better job is
statistically significant only three times. Two of these occasions are in the context of
extrinsic job attribute preferences, being ‘secure job’ and ‘good training provision’,
where the value of Cramer’s V for the latter is relatively high at 0.1079. The single
occasion in which it is statistically significant in the context of intrinsic job attribute
preferences is for the job attribute preference ‘use initiative’.
5. JOB ATTRIBUTE PREFERENCES: SOME ORDERED PROBITS
Although frequently undertaken and reported in examinations of data sets,
cross tabulating two variables and seeking to identify statistically significant
associations between the variables in question is a less than perfect method of
statistical analysis. Bivariate analysis of this type is undertaken for two variables only.
All the other variables are ignored and no note is made of their potential impact.
13
Multivariate analysis is preferable, therefore, whereby cognisance is made of (at least
some of) the additional variables of potential consequence. Given the intention of
examining the relationship between ordered response outcomes (such as ‘not very
important’, ‘fairly important’, ‘very important’ and ‘essential’ and other such Likert
scale configurations) within a multi-variate framework, the most appropriate
estimation strategy is to make use of the ordered probit model (Long and Freeze,
2006).9
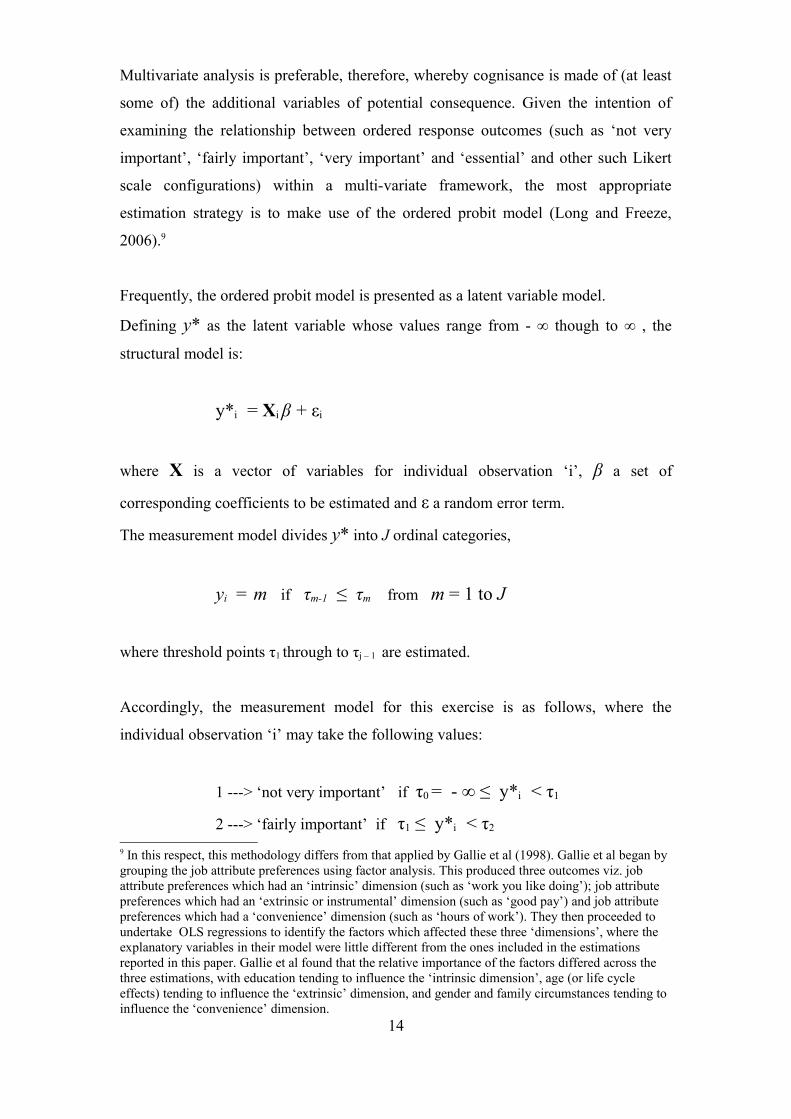
Frequently, the ordered probit model is presented as a latent variable model.
Defining y* as the latent variable whose values range from - ∞ though to ∞ , the
structural model is:
y*i = Xi β + εi
where X is a vector of variables for individual observation ‘i’, β a set of
corresponding coefficients to be estimated and ε a random error term.
The measurement model divides y* into J ordinal categories,
yi = m if τm-1 ≤ τm from m = 1 to J
where threshold points τ1 through to τj – 1 are estimated.
Accordingly, the measurement model for this exercise is as follows, where the
individual observation ‘i’ may take the following values:
1 ---> ‘not very important’ if τ0 = - ∞ ≤ y*i < τ1
2 ---> ‘fairly important’ if τ1 ≤ y*i < τ2
9 In this respect, this methodology differs from that applied by Gallie et al (1998). Gallie et al began by grouping the job attribute preferences using factor analysis. This produced three outcomes viz. job attribute preferences which had an ‘intrinsic’ dimension (such as ‘work you like doing’); job attribute preferences which had an ‘extrinsic or instrumental’ dimension (such as ‘good pay’) and job attribute preferences which had a ‘convenience’ dimension (such as ‘hours of work’). They then proceeded to undertake OLS regressions to identify the factors which affected these three ‘dimensions’, where the explanatory variables in their model were little different from the ones included in the estimations reported in this paper. Gallie et al found that the relative importance of the factors differed across the three estimations, with education tending to influence the ‘intrinsic dimension’, age (or life cycle effects) tending to influence the ‘extrinsic’ dimension, and gender and family circumstances tending to influence the ‘convenience’ dimension.
14
3 ---> ‘very important’ if τ2 ≤ y*i < τ3
4 ---> ‘essential’ if τ3 ≤ y*i < τ4 = ∞
The ordered probit model which is estimated contains 15 of the 16 variables identified
and used in the cross tabulation exercise reported in the previous section.10 Several of
these (e.g. age, highest qualification, labour market experience) are de-constructed
and discrete dummy variables generated to reflect the individual categories identified.
The detail is presented in column 1 of Table B1.11
In the ordered probit model, coefficients on the explanatory variables have a
qualitative interpretation, with a positive sign being interpreted as meaning that an
individual, relative to the appropriate reference counterpart, has a higher value of the
importance of the job attribute preference in question and is, therefore, more likely to
report a higher category of that job attribute preference. (And vice versa.) 12
Accordingly, only the signs of the respective variables and whether the coefficients of
the variables are statistically significant (again at p < 0.05) are reported in Tables B1
through to B15 in Statistical Appendix B. The essence of the detailed results
presented in these tables is encapsulated in Tables 7 and 8, which identify the signs
of those explanatory variables which are statistically significant in the context of
extrinsic and intrinsic job attribute preferences, respectively.13
The first observation to be made from these tables is the paucity of variables which
are statistically significant.14 The second is the relative absence from the variables
which are statistically significant of sets of dummy variables associated with age and 10 In the ordered probit estimations, the variable employment status proved to be collinear. Consequently, to obviate this problem, those who were not employees i.e. the self employed were dropped from the estimations. The results of the ordered probit estimations, therefore, are not for individuals in employment, as was the case for the cross tabulations, but only for employees in employment. One implication of this is that it removes the problem of the potentially ambiguous responses associated with the self-employed’s replies to certain job attribute preference questions, such as ‘good promotion prospects’ or ‘good relations with supervisor’. 11 No attempt is made to incorporate additional variables. Quite legitimately, therefore, the model estimated may be criticised as being mis-specified. 12 In contrast to bivariate analysis, however, the nature of multivariate analysis is such that the reported coefficients for each variable take cognisance of the impact of the other variables within the model. 13 These results are to be interpreted as follows, using the extrinsic job attribute preference ‘good promotion prospects’ as an illustrative example: individuals who are married or living together, relative to those who are not, are less likely to have a higher value of the importance of ‘good promotion prospects’: those who have level 1 as their highest qualification, relative to the reference category of those who have no qualifications, are more likely to have a higher value of the importance of ‘good promotion prospects’: and those who are working full time, relative to those who are not working full time, are more likely to have a higher value of the importance of ‘good promotion prospects’.
15
tenure.15 The third is that when certain dummy variables are seen to be statistically
significant, such as those associated with labour market experience, they relate only to
certain job attribute preferences, such as ‘good promotion prospects’ or ‘good fringe
benefits’, but not, for example, ‘secure job’ or ‘convenient hours’ or ‘work like doing’
or ‘good working conditions’. The fourth is that when certain variables are seen to be
statistically correlated with specific job attribute preferences, the nature of their
correlation may differ. For example, whereas the statistically significant dummy
variables associated with labour market experience are positively related to ‘good
promotion prospects’, they are negatively related to ‘good fringe benefits’.
However, it is possible to identify certain statistically significant correlations, several
of which do accord with expectations.
In the context of extrinsic job attribute preferences:
• Males (relative to females): are less likely to value more highly ‘convenient
hours’, ‘choice of hours’ and ‘good training provision’;
• Those with financially dependent children (relative to those who do not have
financially dependent children): are more likely to value more highly ‘good
pay’, a ‘secure job’, ‘convenient hours’ and a ‘choice of hours’; and
• Those working full time (relative to those who do not work full time): are
more likely to value more highly ‘good promotion prospects’, ‘good pay’, a
‘secure job’ and ‘good training provision’, but are less likely to value more
highly ‘convenient hours’ and ‘choice of hours’
In the context of intrinsic job attribute preferences:
• Males (relative to females): are less likely to value more highly ‘good relations
with the supervisor’, a job which makes ‘use of abilities’, ‘good working
conditions’ and ‘friendly people’ to work with; and
14 This MAY be attributable to the relatively small number of observations, given the number of independent variables in the ordered probit model. OR, it may merely reflect the absence of any statistical significance for the variables in the model.15 This is established further when, rather than examining the statistical significance of individual variables the joint significance of several are examined. The results of the joint significance tests undertaken are reported as supplementary notes to Tables B1 through to B15.
16
• Those with level 4 or 5 as their highest qualification (relative to those with no
qualifications, the reference category); are more likely to value more highly a
job which makes ‘use of initiative’, work that they ‘like doing’ and work
which make ‘use of abilities’. On the other hand, they are less likely to value
more highly an ‘easy work load’ and ‘good working conditions’.
6. JOB ATTRIBUTE PREFERENCES: ARE WORKERS IN SCOTLAND
‘DIFFERENT’?
To establish whether inter ‘country/province’ differences in worker job
attribute preferences exist within the UK, the 15 ordered probits are re-estimated
using the full i.e. UK-wide data set, with the addition of dummy variables for
England, Wales and Northern Ireland, with Scotland as the excluded, reference,
category. The signs of the coefficients of the additional dummy variables only are
reported in Tables 9 and 10, again by job attribute preference, by extrinsic and
intrinsic categories.16
Intra UK differences are more likely than not. There are only two extrinsic job
attribute preferences where no statistically significant differences are reported: ‘good
pay’ and ‘good training provision’. Workers in England – and, sometimes, Wales and
Northern Ireland – relative to workers in Scotland, are more likely to have higher
values of the importance of the four extrinsic job attribute preferences ‘good
promotion prospects’, ‘convenient hours’, ‘choice of hours’ and ‘good fringe
benefits’. In this category, the job attribute preference ‘secure job’ is the exception.
With respect to this job attribute preference, workers in England, relative to workers
in Scotland, are less likely to have higher values of its importance. Again, there are
only two intrinsic job attribute preferences where no statistically significant
differences are reported: ‘good relations with supervisor’ and ‘good working
conditions’. Once again, workers in England, relative to workers in Scotland, are
more likely to have higher values of the importance of the five intrinsic job attribute
preferences of ‘use initiative’, ‘work like doing’, ‘use abilities’, ‘variety in work’ and
‘friendly people’. In this instance, however, there are proportionately more negative
16 A positive sign for the coefficient of the country/province in question, therefore, indicates that a higher value of the importance of the job attribute preference in question is more likely, relative to Scotland, the reference category; and, conversely, a negative sign for the coefficient, that a higher value of the importance of the job attribute preference in question is less likely, again relative to Scotland.
17
signs – not always statistically significant – associated with Wales and Northern
Ireland.
There is an extensive literature which seeks to explain cross country differences in
employment behaviour (e.g. Sorge, 2004). One perspective within this emphasises the
role of culture, with its origin in the psyche of populations, producing a value system
which influences worker attitudes and behaviour. Consequently, when cultures differ,
so do worker attitudes and behaviour. A second perspective emphasises the role of
institutions, codes and standards of behaviour and legal systems, for example. These
produce conformity with accepted norms for worker attitudes and behaviour.
Consequently, when institutions differ, so too do worker attitudes and behaviour. A
third perspective seeks to integrate culture and institution. Within this holistic,
societal perspective, actors and institutions interact to produce the outcomes in
question.
Conventionally, there are central elements within the societal perspective:
• the organisation of work, for example the size structure of firms
and their ownership patterns;
• human resources, for example the systems of education and
training
• the industrial and sectoral balance within the economy, such as the
role and relative importance of the private, public and not-for-profit
sectors; and
• the labour market, such as patterns and modes of participation.
Just as changes over time in these central elements within a nation state may influence
changes in worker attitudes and behaviour (Watson, 2003), so identifying cross
country differences in these same factors facilitates possible explanation of cross
country differences in worker attitudes and behaviour.
So where are the differences between Scotland and the other constituent parts of the
UK, more especially England, which may (part) explain the different outcomes in job
attribute preferences identified above, not only in terms of the 12 occasions on which
18
the England coefficient is positively signed but also in terms of the particular three
occasions (viz. ‘secure job’, ‘good training provision’ and ‘good working conditions’)
when the England coefficient is negatively signed? In a Scottish economy dominated
by large, often externally owned, organisations with the relative absence of small,
owner managed concerns, perhaps? In the Scottish education system, if not the
training system, perhaps? In the predominance of a public sector in Scotland,
perhaps?
7. CONCLUSIONS
This paper has examined worker job attribute preferences in Scotland, using
the 2006 Employee Skills Survey. In a ranking exercise, intrinsic job attributes were
found to be relatively more important than extrinsic job attributes. Four of the top five
ranked job attribute preferences were associated with intrinsic job attributes viz.
‘work you like doing’ at 1; ‘the ability to use your abilities’ at 3; ‘friendly people to
work with’ at 4; and ‘a job where you can use your initiative’ at 5. Conversely, four of
the bottom five job attribute preferences were associated with extrinsic job attributes
viz. ‘good fringe benefits’ at 14; ‘good promotion prospects’ at 13; ‘choice in the
hours of work’ at 12; and ‘convenient hours of work’ at 11. Worker job attribute
preferences, however, differed by the characteristics of the worker. Gender, family
circumstances, educational qualifications and employment status were identified as
having salient influences on several worker job attribute preferences, much in accord
with expectations. Males relative to females were less likely to value more highly job
attributes such as ‘convenient hours’, ‘choice of hours’ and ‘good working
conditions’; those with financially dependent children, relative to those who did not
have financially dependent children, were more likely to value more highly job
attributes such as ‘good pay’, a ‘secure job’ and ‘choice of hours’; those with level 4
or level 5 as their highest qualification level, relative to those with no qualifications,
were more likely to value more highly job attributes such as a job which makes ‘use
of initiative’ and work they ‘like to do’: and those working full time, relative to those
who were not working full time, were more likely to value more highly job attributes
such as ‘good promotion prospects’ and ‘good training provision’.
In economic theory, it is the function of omnipresent efficient markets to match
heterogeneous individuals with jobs which have complicated bundles of complex
19
characteristics. In organisations, however, it is the task of those who manage the
recruitment and selection process to ensure that effective procedures operate both to
identify likely candidates and to predict who from this list is/are most likely to fit the
requirements of the job and the organisation. An insight into job attributes and worker
job attribute preferences facilitates this task. Making explicit the attributes of jobs;
targeting the sources of individuals who prefer these job attributes; using the same job
search channels employed by these individuals; and re-emphasising the salient job
attributes in job previews are all more likely to make for a more efficacious hiring
process. In (private and public) employment agencies, it is the task of careers advisers
and employment counsellors to facilitate the search process of job seekers. An insight
into job attributes and worker job attribute preferences is advantageous in this context
too. Job seekers are different in their personal characteristics and job aspirations; jobs
and job vacancies (and the organisations associated with these jobs and vacancies)
consist of different bundles of job attributes. Ceteris paribus, the problematical task of
the agent is to effect a match which is to the mutual satisfaction of those who are
seeking work and those who are seeking workers. Other things are not necessarily
equal, however. In times when employment opportunities are constrained, the job
seeker’s aspirations are too frequently compromised. The job attribute preferences of
workers which will be reported in the 2010 Employee Skills Survey, for example, are
most likely to be very different from those examined in this paper.
A novel finding within the paper was that intra UK differences in worker job attribute
preferences were more likely than not. Generally, with respect to both extrinsic and
intrinsic job attribute preferences, workers in England – and, sometimes, Wales and
Northern Ireland – relative to workers in Scotland, were more likely to value their
importance more highly. Possible cross cultural differences were explored which
might explain these differences. Further research rather than further speculation,
however, is needed to pursue this interesting finding further. Are the differences to be
explained by differences in the objective reality of the jobs, for example; or
differences in the subjective dispositions of the job holders?
20
REFERENCES
Becker, G. (1965) A Theory of the allocation of time. Economic Journal, 75, pp 493
-517.
Bell, D. (1974) The Coming of Post-Industrial Society. London: Heinemann.
Bender, K.A. and Elliott, R.F. (2002) The Role of job attributes in understanding the
public-private wage differential. Industrial Relations, 41, pp 407 – 421.
Blackburn, R.M. and Mann, M. (1979) The Working Class in the Labour Market.
Basingstoke: Macmillan Press.
Braverman, H. (1974) Labor and Monopoly Capital: The Degradation of Work in the
Twentieth Century. New York, USA.: Monthly Review Press.
Brown, R. (1988) The Employment relationship in Sociological theory. In Gallie, D
(ed.) Employment in Britain. Oxford: Basil Blackwell.
Brown, R. (1992) Understanding Industrial Organisations: Theoretical Perspectives
in Industrial Sociology. London: Routledge.
Daniel, W.W. (1969) Industrial behaviour and orientation to work: a critique. Journal
of Management Studies, 6, pp 366 -375.
Felstead, A., Gallie, D., Green, F. and Zhou, Y. (2007) Skills at Work, 1986 -2006.
Oxford and Cardiff: ESRC Centre on Skills, Knowledge and Organisational
Performance (SCOPE).
Fox, A. (1980) The Meaning of work. In Elsland, G and Salaman, G. (eds.) The
Politics of Work and Organisations. Milton Keynes: Open University Press.
Gallie, D., White, M., Cheng, Y. and Tomlinson, M. (1998) Restructuring the
Employment Relationship. Oxford: Oxford University Press.
Goldthorpe, J., Lockwood, D. Bechhofer, F. and Platt, J. (1968) The Affluent Worker:
Industrial Attitudes and Behaviours. Cambridge: Cambridge University Press.
Green, F. (2008) Leeway for the Loyal: a Model of Employee Discretion. British
Journal of Industrial Relations, 46, pp 1 – 32.
Hertzberg, F. (1966) Work and the Nature of Man. New York, USA.: World
Publishing Company
Kennedy, G. (2008) Adam Smith. Basingstoke: Palgrave Macmillan.
Konrad, A.M., Corrigall, E., Lieb, P. and Ritchie, J.E. (2000) Sex differences in job
attribute preferences among managers and business students. Group &
Organisational Management, 25, pp 108 -131.
21
Long, J.S. and Freese, J. (2006) Regression Models for Categorical Dependent
Variables Using Stata. College Station, Texas, USA: Stata Press.
Manning, A. (2003) The Real thin theory: monopsony in modern labour markets.
Labour Economics, 10, pp 105 -131.
Marsden, D. (1986) The End of Economic Man? Custom and Competition in Labour
Markets. Brighton: Wheatsheaf.
Maslow, A.H. (1943) A Theory of Human Motivation. Psychological Review, 50, pp
370 -396.
Mayo, E. (1949) The Social Problems of an Industrial Civilisation. London:
Routledge and Kegan Paul.
Silverman, D. (1970) The Theory of Organisations: A Sociological Framework.
London: Heinemann
Sorge, A. (2004) Cross national differences in human resources and organisation. In
Harzing, A.W. and Ruysseveldt, J.V. (eds.) International Human Resource
Management. 2nd edition. London: Sage Publishing.
Spencer, D.A. (2009) The Political Economy of Work. London: Routledge.
Watson, T.J. (1994) In Search of Management: Culture, Chaos and Control in
Managerial Work. London: International Thomson Business Press.
Watson, T. J. (2003) Sociology, Work and Industry. 4th edition. London: Routledge.
Williamson, C.L., Cope, J.B., Thompson, L.F. and Wuensch, K.L. (2002) Policy
capturing as a tool to enhance recruitment. Career Development International,
7, pp 159 -166.
22
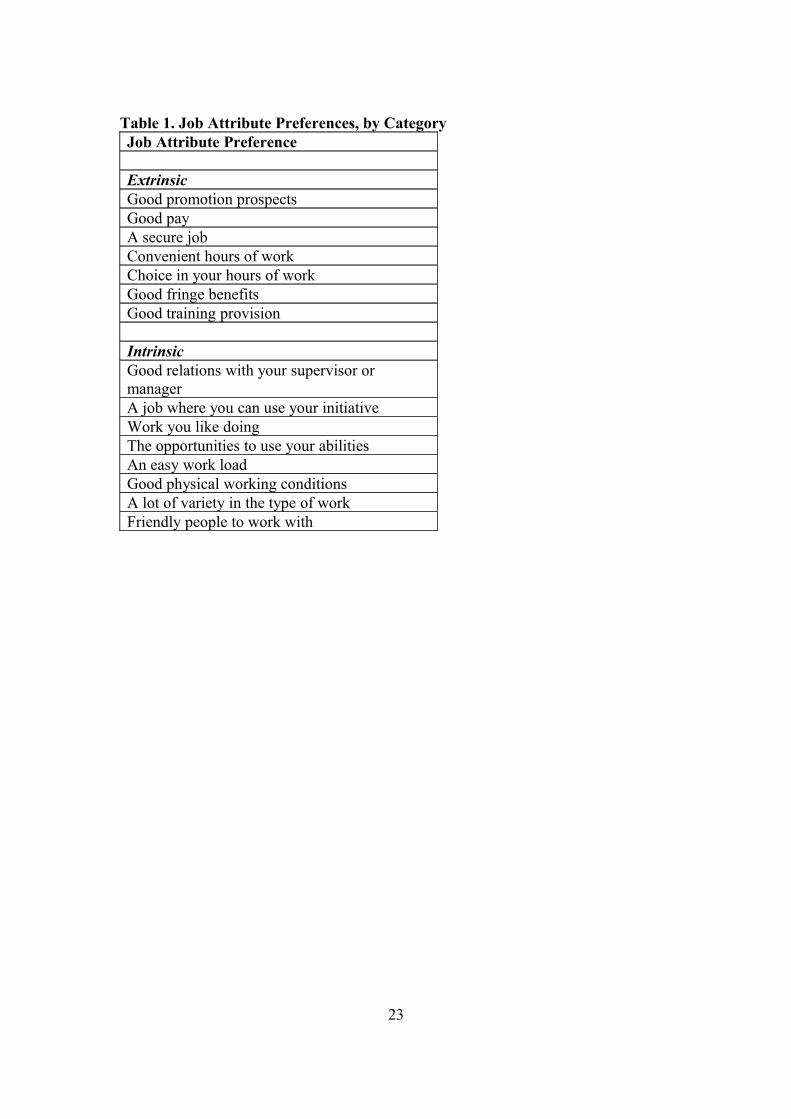
Table 1. Job Attribute Preferences, by CategoryJob Attribute Preference
ExtrinsicGood promotion prospectsGood pay A secure jobConvenient hours of workChoice in your hours of workGood fringe benefitsGood training provision
Intrinsic Good relations with your supervisor or managerA job where you can use your initiativeWork you like doingThe opportunities to use your abilities An easy work loadGood physical working conditionsA lot of variety in the type of workFriendly people to work with
23
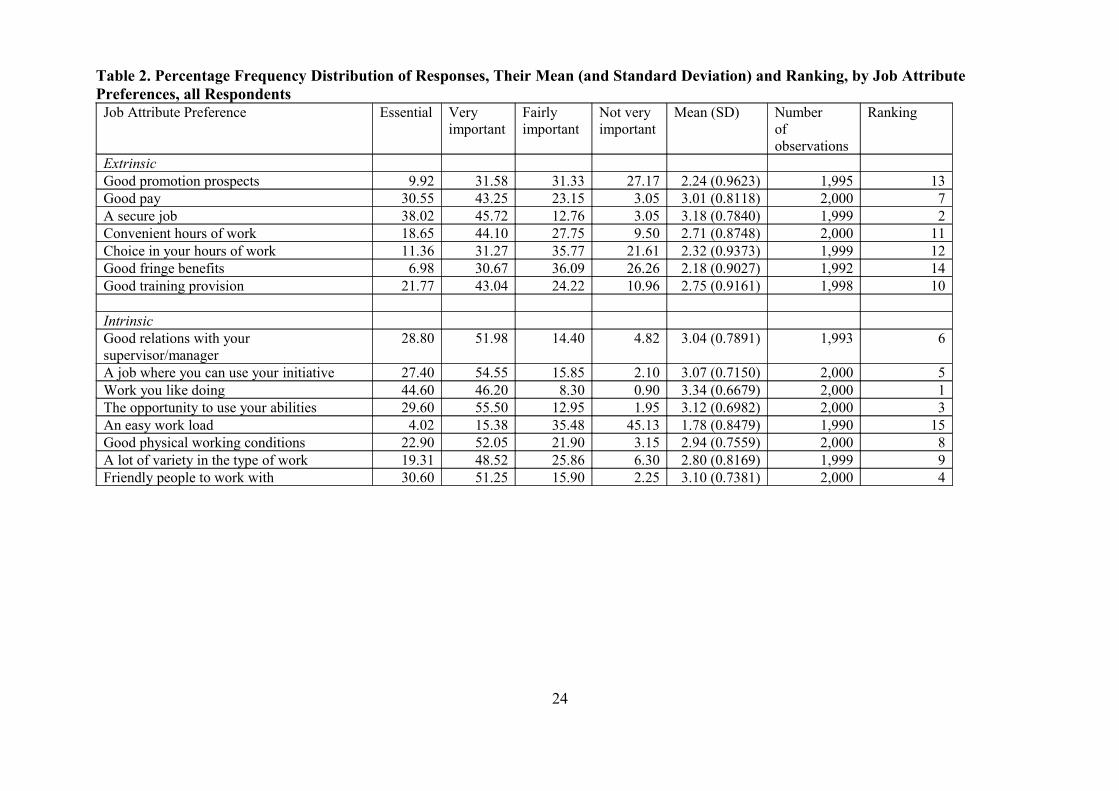
Table 2. Percentage Frequency Distribution of Responses, Their Mean (and Standard Deviation) and Ranking, by Job Attribute Preferences, all Respondents
Job Attribute Preference Essential Veryimportant
Fairlyimportant
Not veryimportant
Mean (SD) Numberofobservations
Ranking
ExtrinsicGood promotion prospects 9.92 31.58 31.33 27.17 2.24 (0.9623) 1,995 13Good pay 30.55 43.25 23.15 3.05 3.01 (0.8118) 2,000 7A secure job 38.02 45.72 12.76 3.05 3.18 (0.7840) 1,999 2Convenient hours of work 18.65 44.10 27.75 9.50 2.71 (0.8748) 2,000 11Choice in your hours of work 11.36 31.27 35.77 21.61 2.32 (0.9373) 1,999 12Good fringe benefits 6.98 30.67 36.09 26.26 2.18 (0.9027) 1,992 14Good training provision 21.77 43.04 24.22 10.96 2.75 (0.9161) 1,998 10
IntrinsicGood relations with your supervisor/manager
28.80 51.98 14.40 4.82 3.04 (0.7891) 1,993 6
A job where you can use your initiative 27.40 54.55 15.85 2.10 3.07 (0.7150) 2,000 5Work you like doing 44.60 46.20 8.30 0.90 3.34 (0.6679) 2,000 1The opportunity to use your abilities 29.60 55.50 12.95 1.95 3.12 (0.6982) 2,000 3An easy work load 4.02 15.38 35.48 45.13 1.78 (0.8479) 1,990 15Good physical working conditions 22.90 52.05 21.90 3.15 2.94 (0.7559) 2,000 8A lot of variety in the type of work 19.31 48.52 25.86 6.30 2.80 (0.8169) 1,999 9Friendly people to work with 30.60 51.25 15.90 2.25 3.10 (0.7381) 2,000 4
24
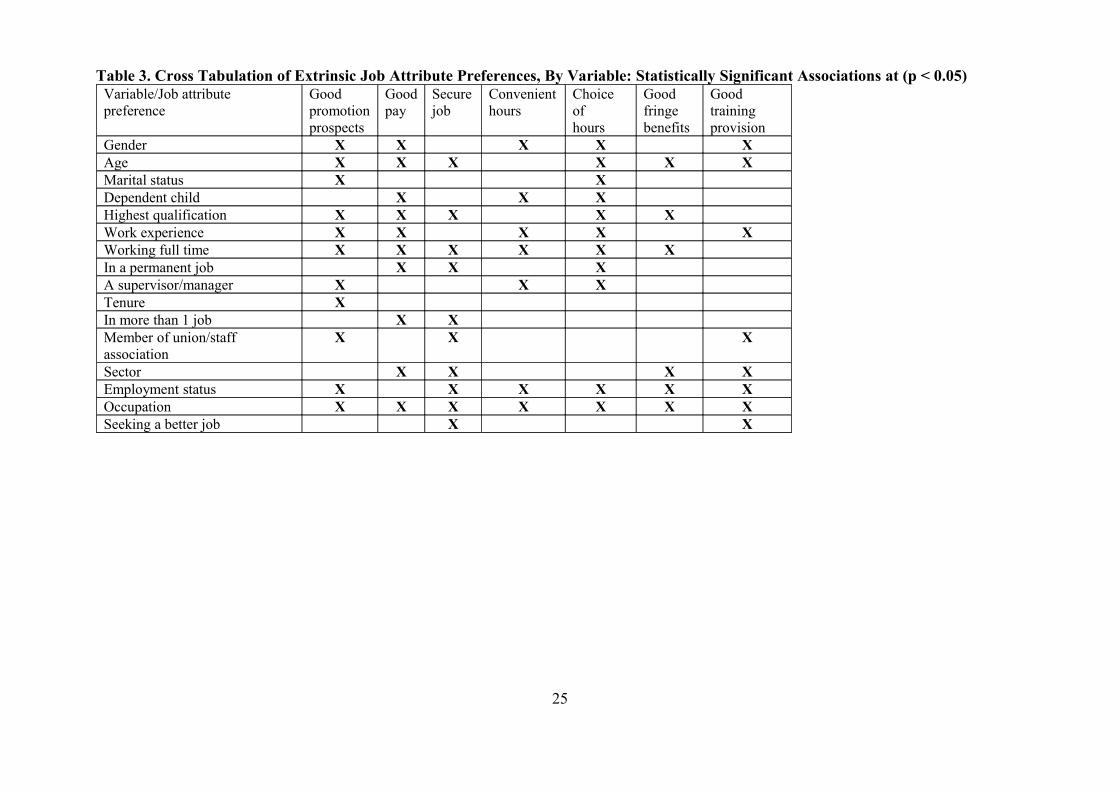
Table 3. Cross Tabulation of Extrinsic Job Attribute Preferences, By Variable: Statistically Significant Associations at (p < 0.05)Variable/Job attribute preference
Good promotionprospects
Good pay
Secure job
Convenienthours
Choice of hours
Good fringebenefits
Goodtrainingprovision
Gender X X X X XAge X X X X X XMarital status X XDependent child X X XHighest qualification X X X X XWork experience X X X X XWorking full time X X X X X XIn a permanent job X X XA supervisor/manager X X XTenure XIn more than 1 job X XMember of union/staff association
X X X
Sector X X X XEmployment status X X X X X XOccupation X X X X X X XSeeking a better job X X
25
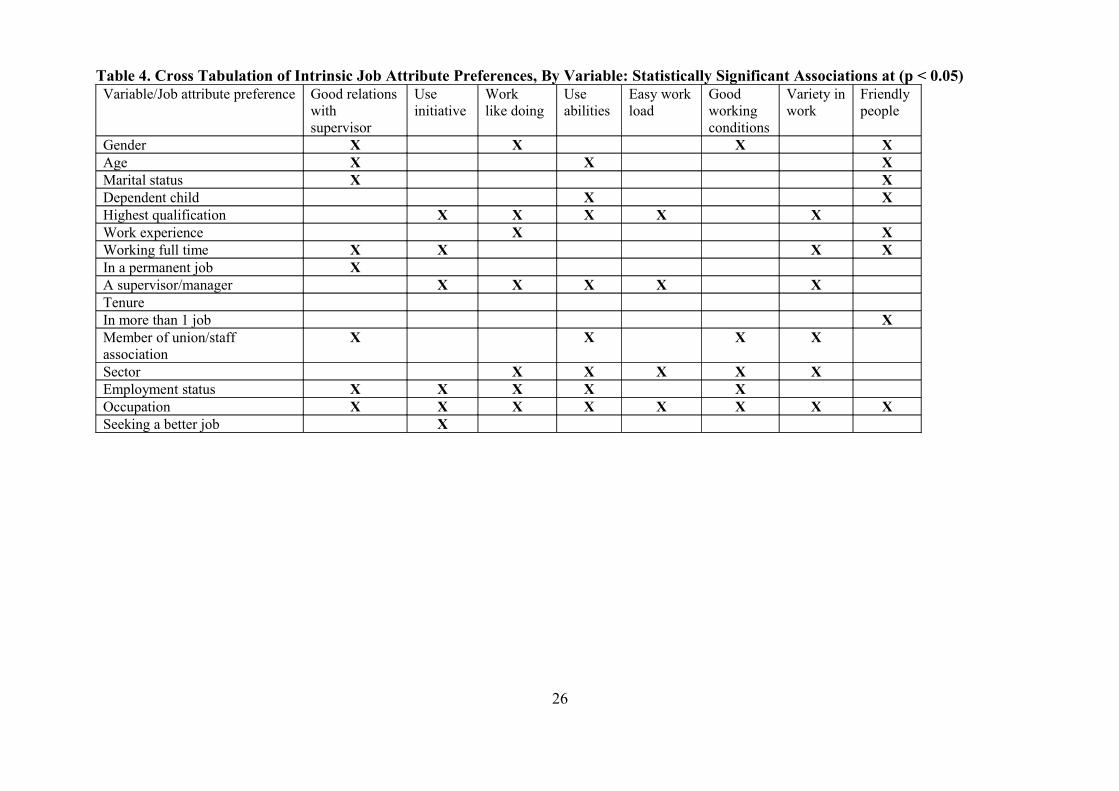
Table 4. Cross Tabulation of Intrinsic Job Attribute Preferences, By Variable: Statistically Significant Associations at (p < 0.05)Variable/Job attribute preference Good relations
with supervisor
Useinitiative
Work like doing
Useabilities
Easy workload
Good workingconditions
Variety inwork
Friendlypeople
Gender X X X XAge X X XMarital status X XDependent child X XHighest qualification X X X X XWork experience X XWorking full time X X X XIn a permanent job XA supervisor/manager X X X X XTenureIn more than 1 job XMember of union/staff association
X X X X
Sector X X X X XEmployment status X X X X XOccupation X X X X X X X XSeeking a better job X
26
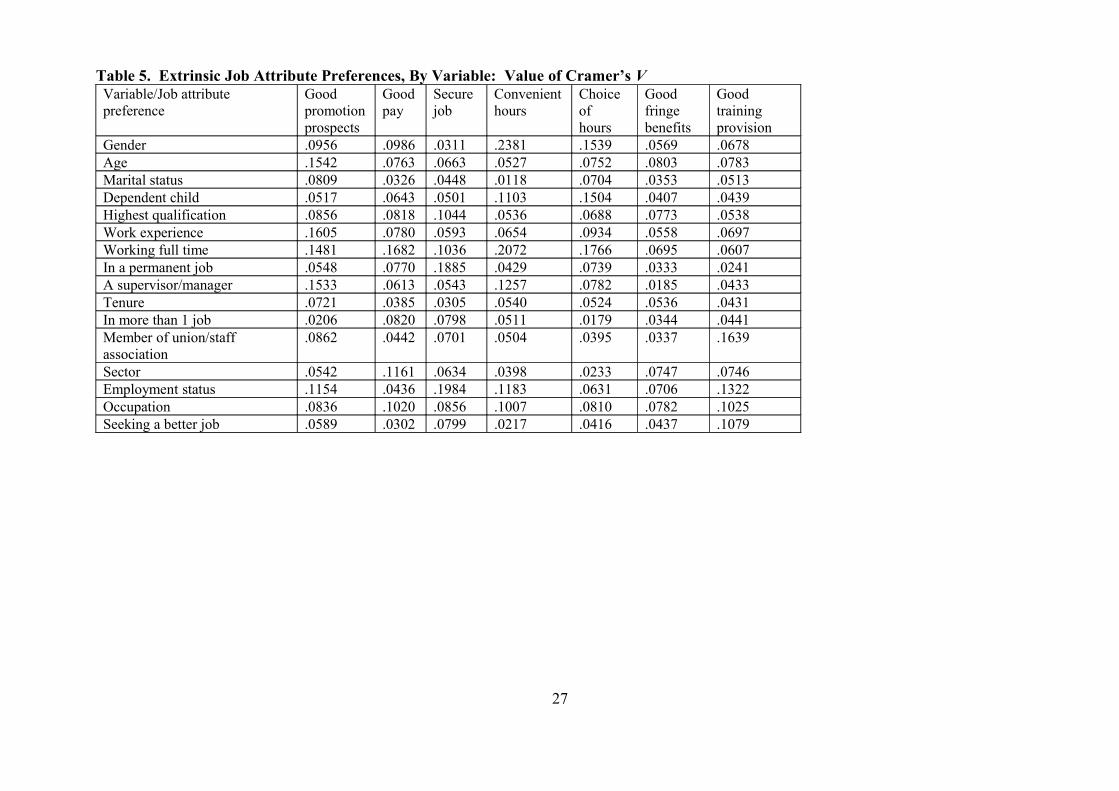
Table 5. Extrinsic Job Attribute Preferences, By Variable: Value of Cramer’s VVariable/Job attribute preference
Good promotionprospects
Good pay
Secure job
Convenienthours
Choice ofhours
Good fringebenefits
Goodtrainingprovision
Gender .0956 .0986 .0311 .2381 .1539 .0569 .0678Age .1542 .0763 .0663 .0527 .0752 .0803 .0783Marital status .0809 .0326 .0448 .0118 .0704 .0353 .0513Dependent child .0517 .0643 .0501 .1103 .1504 .0407 .0439Highest qualification .0856 .0818 .1044 .0536 .0688 .0773 .0538Work experience .1605 .0780 .0593 .0654 .0934 .0558 .0697Working full time .1481 .1682 .1036 .2072 .1766 .0695 .0607In a permanent job .0548 .0770 .1885 .0429 .0739 .0333 .0241A supervisor/manager .1533 .0613 .0543 .1257 .0782 .0185 .0433Tenure .0721 .0385 .0305 .0540 .0524 .0536 .0431In more than 1 job .0206 .0820 .0798 .0511 .0179 .0344 .0441Member of union/staff association
.0862 .0442 .0701 .0504 .0395 .0337 .1639
Sector .0542 .1161 .0634 .0398 .0233 .0747 .0746Employment status .1154 .0436 .1984 .1183 .0631 .0706 .1322Occupation .0836 .1020 .0856 .1007 .0810 .0782 .1025Seeking a better job .0589 .0302 .0799 .0217 .0416 .0437 .1079
27
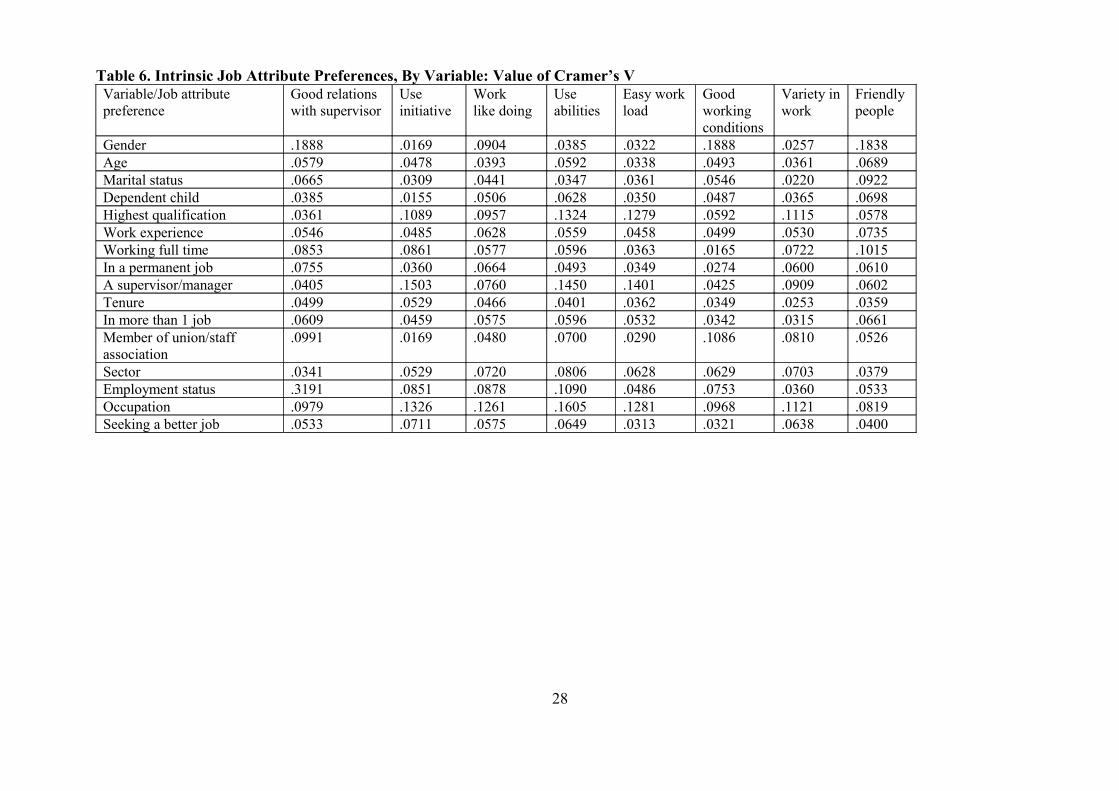
Table 6. Intrinsic Job Attribute Preferences, By Variable: Value of Cramer’s VVariable/Job attribute preference
Good relationswith supervisor
Useinitiative
Work like doing
Useabilities
Easy workload
Good workingconditions
Variety inwork
Friendlypeople
Gender .1888 .0169 .0904 .0385 .0322 .1888 .0257 .1838Age .0579 .0478 .0393 .0592 .0338 .0493 .0361 .0689Marital status .0665 .0309 .0441 .0347 .0361 .0546 .0220 .0922Dependent child .0385 .0155 .0506 .0628 .0350 .0487 .0365 .0698Highest qualification .0361 .1089 .0957 .1324 .1279 .0592 .1115 .0578Work experience .0546 .0485 .0628 .0559 .0458 .0499 .0530 .0735Working full time .0853 .0861 .0577 .0596 .0363 .0165 .0722 .1015In a permanent job .0755 .0360 .0664 .0493 .0349 .0274 .0600 .0610A supervisor/manager .0405 .1503 .0760 .1450 .1401 .0425 .0909 .0602Tenure .0499 .0529 .0466 .0401 .0362 .0349 .0253 .0359In more than 1 job .0609 .0459 .0575 .0596 .0532 .0342 .0315 .0661Member of union/staff association
.0991 .0169 .0480 .0700 .0290 .1086 .0810 .0526
Sector .0341 .0529 .0720 .0806 .0628 .0629 .0703 .0379Employment status .3191 .0851 .0878 .1090 .0486 .0753 .0360 .0533Occupation .0979 .1326 .1261 .1605 .1281 .0968 .1121 .0819Seeking a better job .0533 .0711 .0575 .0649 .0313 .0321 .0638 .0400
28
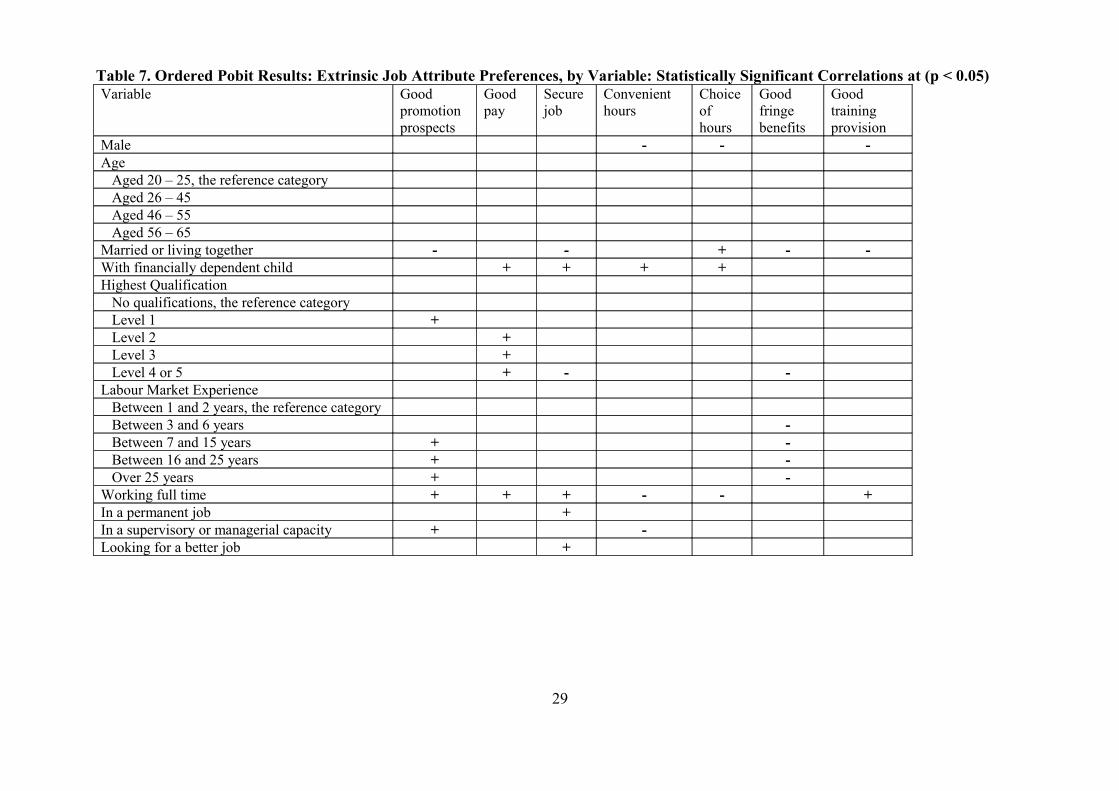
Table 7. Ordered Pobit Results: Extrinsic Job Attribute Preferences, by Variable: Statistically Significant Correlations at (p < 0.05)Variable Good
promotionprospects
Goodpay
Securejob
Convenienthours
Choiceofhours
Good fringebenefits
Goodtrainingprovision
Male - - -Age Aged 20 – 25, the reference category Aged 26 – 45 Aged 46 – 55 Aged 56 – 65Married or living together - - + - -With financially dependent child + + + +Highest Qualification No qualifications, the reference category Level 1 + Level 2 + Level 3 + Level 4 or 5 + - -Labour Market Experience Between 1 and 2 years, the reference category Between 3 and 6 years - Between 7 and 15 years + - Between 16 and 25 years + - Over 25 years + -Working full time + + + - - +In a permanent job +In a supervisory or managerial capacity + -Looking for a better job +
29
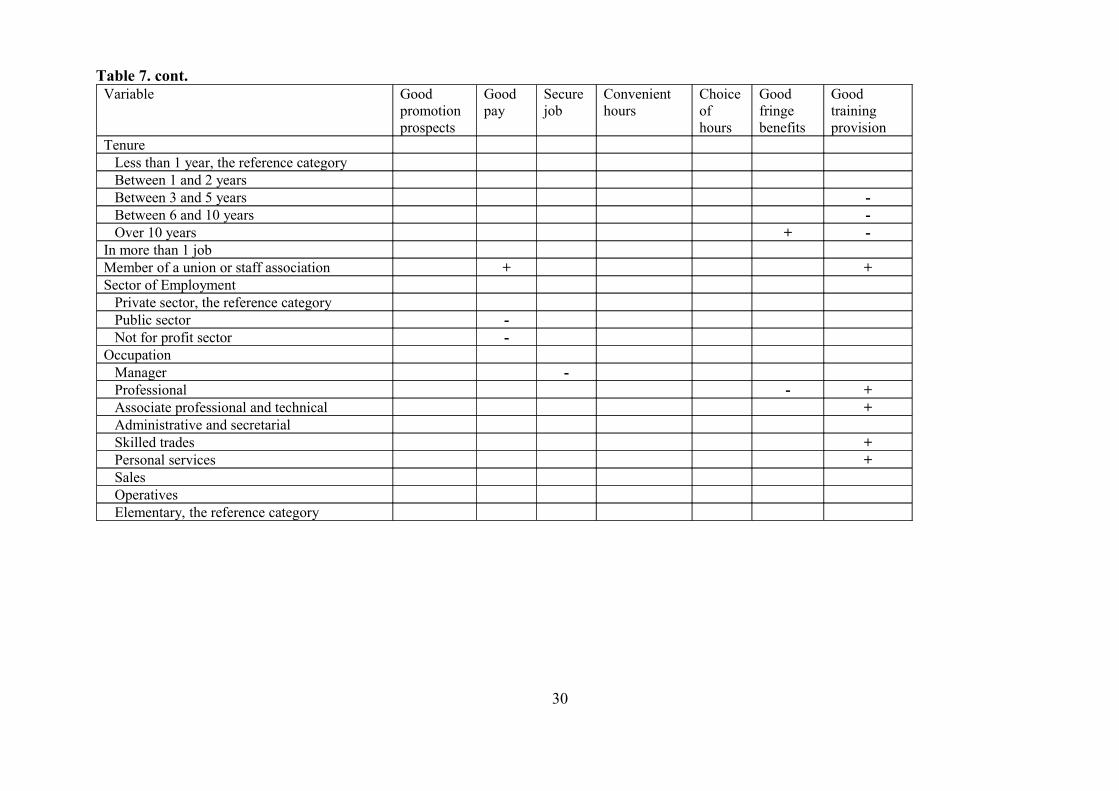
Table 7. cont.Variable Good
promotionprospects
Goodpay
Securejob
Convenienthours
Choiceof hours
Goodfringebenefits
Goodtrainingprovision
Tenure Less than 1 year, the reference category Between 1 and 2 years Between 3 and 5 years - Between 6 and 10 years - Over 10 years + -In more than 1 jobMember of a union or staff association + +Sector of Employment Private sector, the reference category Public sector - Not for profit sector -Occupation Manager - Professional - + Associate professional and technical + Administrative and secretarial Skilled trades + Personal services + Sales Operatives Elementary, the reference category
30
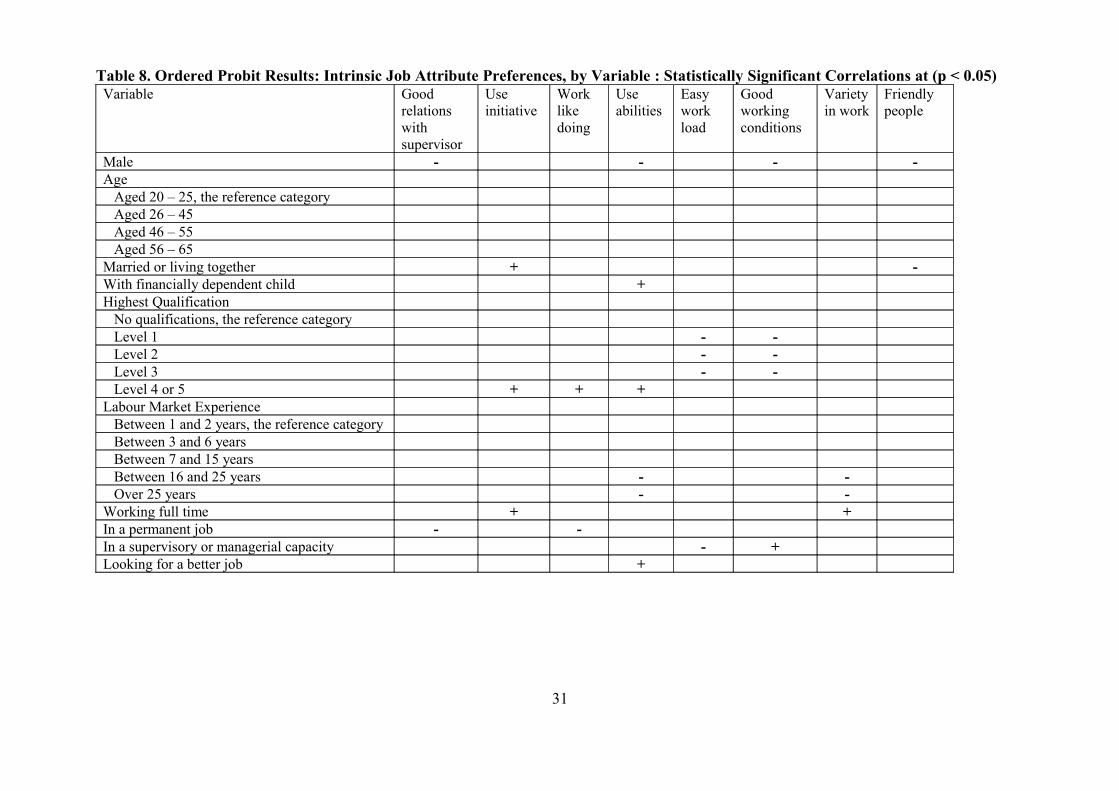
Table 8. Ordered Probit Results: Intrinsic Job Attribute Preferences, by Variable : Statistically Significant Correlations at (p < 0.05)Variable Good
relationswithsupervisor
Use initiative
Worklikedoing
Useabilities
Easyworkload
Goodworkingconditions
Varietyin work
Friendlypeople
Male - - - -Age Aged 20 – 25, the reference category Aged 26 – 45 Aged 46 – 55 Aged 56 – 65Married or living together + -With financially dependent child +Highest Qualification No qualifications, the reference category Level 1 - - Level 2 - - Level 3 - - Level 4 or 5 + + +Labour Market Experience Between 1 and 2 years, the reference category Between 3 and 6 years Between 7 and 15 years Between 16 and 25 years - - Over 25 years - -Working full time + +In a permanent job - -In a supervisory or managerial capacity - +Looking for a better job +
31
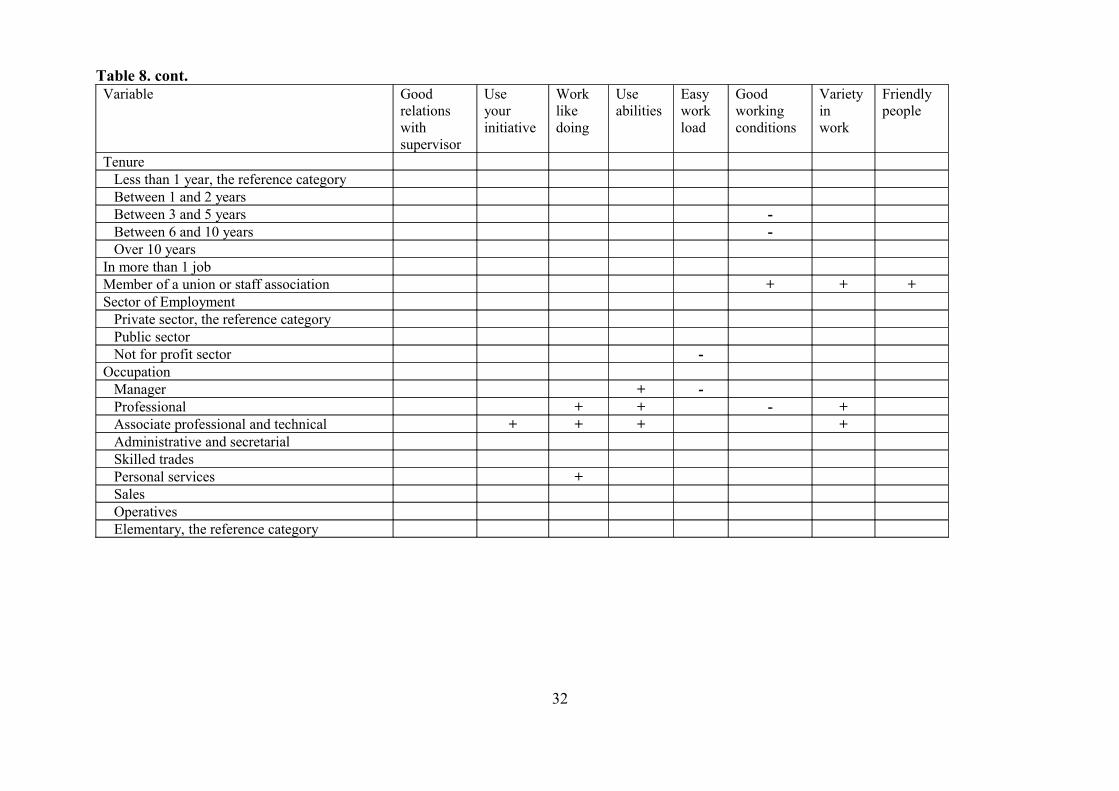
Table 8. cont.Variable Good
relationswithsupervisor
Useyourinitiative
Worklikedoing
Useabilities
Easyworkload
Goodworkingconditions
Varietyin work
Friendlypeople
Tenure Less than 1 year, the reference category Between 1 and 2 years Between 3 and 5 years - Between 6 and 10 years - Over 10 yearsIn more than 1 job Member of a union or staff association + + +Sector of Employment Private sector, the reference category Public sector Not for profit sector -Occupation Manager + - Professional + + - + Associate professional and technical + + + + Administrative and secretarial Skilled trades Personal services + Sales Operatives Elementary, the reference category
32
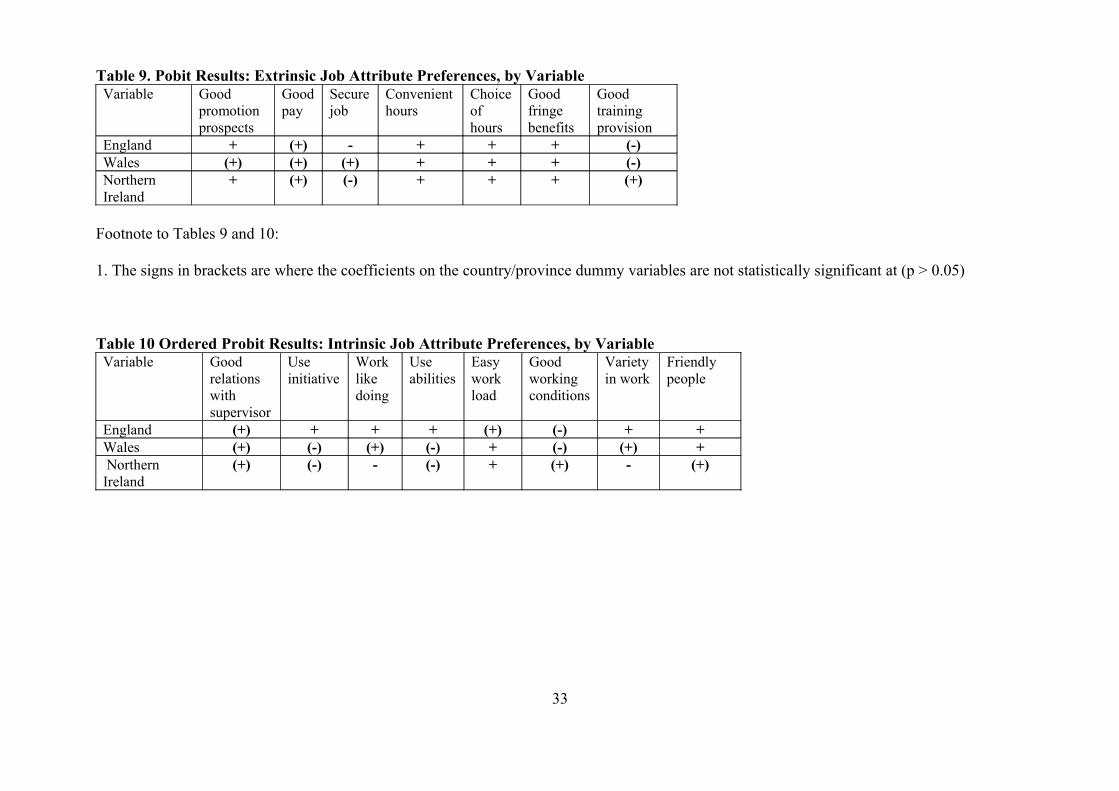
Table 9. Pobit Results: Extrinsic Job Attribute Preferences, by Variable Variable Good
promotionprospects
Goodpay
Securejob
Convenienthours
Choiceofhours
Good fringebenefits
Goodtrainingprovision
England + (+) - + + + (-)Wales (+) (+) (+) + + + (-)Northern Ireland
+ (+) (-) + + + (+)
Footnote to Tables 9 and 10:
1. The signs in brackets are where the coefficients on the country/province dummy variables are not statistically significant at (p > 0.05)
Table 10 Ordered Probit Results: Intrinsic Job Attribute Preferences, by Variable Variable Good
relationswithsupervisor
Use initiative
Worklikedoing
Useabilities
Easyworkload
Goodworkingconditions
Varietyin work
Friendlypeople
England (+) + + + (+) (-) + +Wales (+) (-) (+) (-) + (-) (+) + Northern Ireland
(+) (-) - (-) + (+) - (+)
33
STATISTICAL APPENDIX A: DETAILS OF THE CROSS TABULATIONS
Table A1. Results of the Cross Tabulation of ‘Good Promotion Prospects’Variable Value of
Pearson chi-squared statistic
Statisticalsignificance
Value of Cramer’s V
Gender (3) 18.2222 0.000 0.0956Age (9) 142.2914 0.000 0.1542Marital status (3) 12.9885 0.005 0.0809Financially dependent child (3) 5.3026 0.151 0.0517Highest qualification held (12) 43.8199 0.000 0.0856Work experience (12) 153.0539 0.000 0.1605Working full time (3) 43.7603 0.000 0.1481In a permanent job (3) 5.3219 0.150 0.0548Working in a supervisory/managerial capacity
(3) 40.8909 0.000 0.1533
Tenure (12) 31.1546 0.002 0.0721Whether has more than 1 job (3) 0.8442 0.839 0.0206Whether a member of a union or staff association
(3) 14.7922 0.002 0.0862
Sector of employment (6) 10.4169 0.108 0.0542Whether working as an employee or self employed
(3) 26.5714 0.000 0.1154
Occupation (24) 41.7913 0.014 0.0836Whether seeking a better job (3) 5.8364 0.120 0.0589
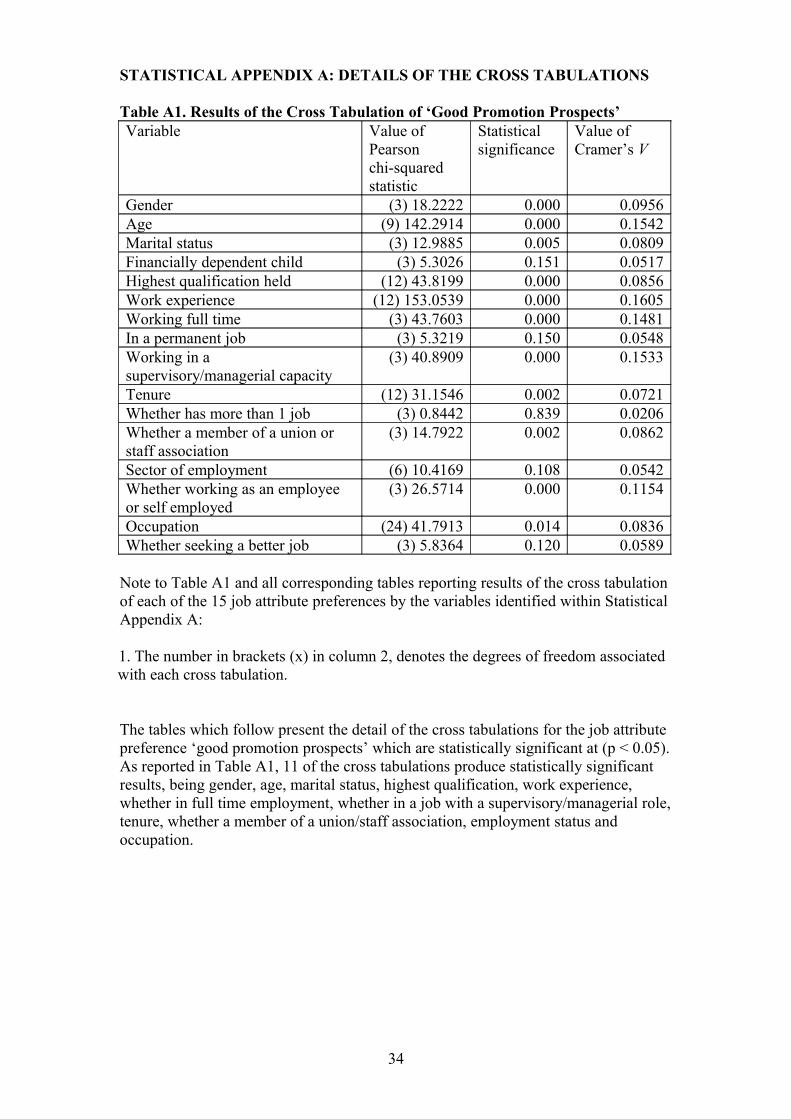
Note to Table A1 and all corresponding tables reporting results of the cross tabulation of each of the 15 job attribute preferences by the variables identified within Statistical Appendix A:
1. The number in brackets (x) in column 2, denotes the degrees of freedom associated with each cross tabulation.
The tables which follow present the detail of the cross tabulations for the job attribute preference ‘good promotion prospects’ which are statistically significant at (p < 0.05). As reported in Table A1, 11 of the cross tabulations produce statistically significant results, being gender, age, marital status, highest qualification, work experience, whether in full time employment, whether in a job with a supervisory/managerial role, tenure, whether a member of a union/staff association, employment status and occupation.
34
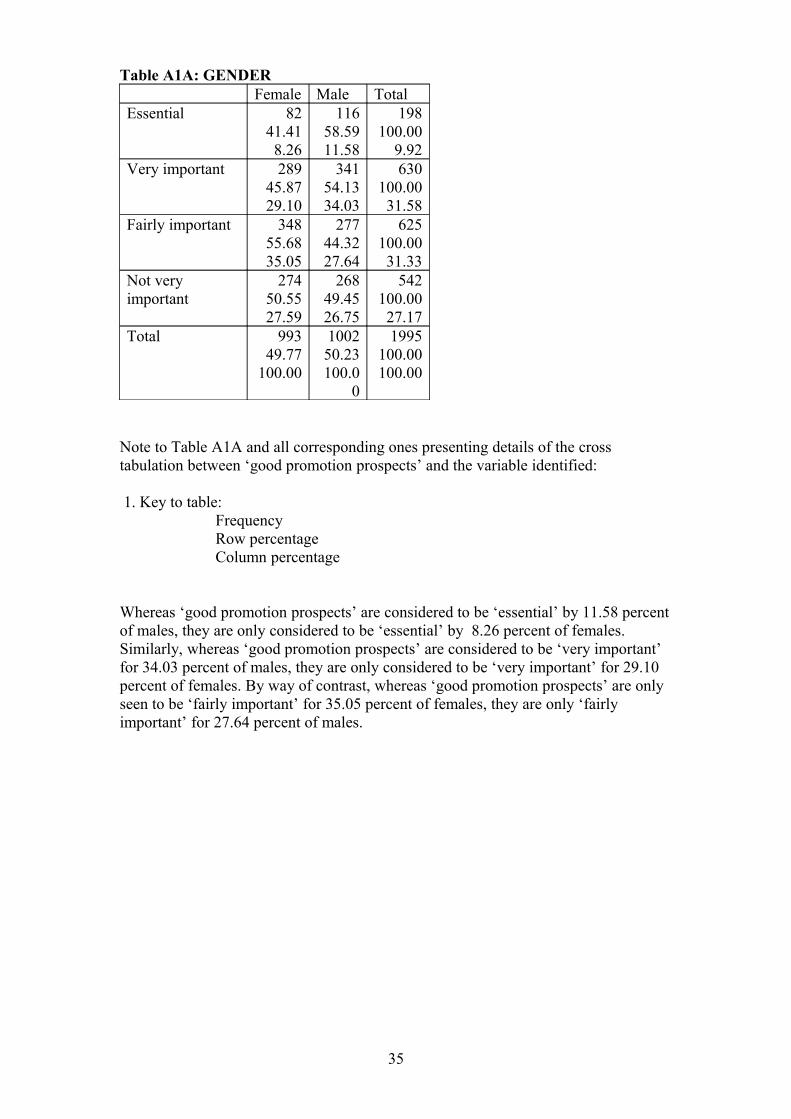
Table A1A: GENDERFemale Male Total
Essential 8241.418.26
11658.5911.58
198100.00
9.92Very important 289
45.8729.10
34154.1334.03
630100.0031.58
Fairly important 34855.6835.05
27744.3227.64
625100.0031.33
Not very important
27450.5527.59
26849.4526.75
542100.0027.17
Total 99349.77
100.00
100250.23100.0
0
1995100.00100.00
Note to Table A1A and all corresponding ones presenting details of the cross tabulation between ‘good promotion prospects’ and the variable identified:
1. Key to table:FrequencyRow percentageColumn percentage
Whereas ‘good promotion prospects’ are considered to be ‘essential’ by 11.58 percent of males, they are only considered to be ‘essential’ by 8.26 percent of females. Similarly, whereas ‘good promotion prospects’ are considered to be ‘very important’ for 34.03 percent of males, they are only considered to be ‘very important’ for 29.10 percent of females. By way of contrast, whereas ‘good promotion prospects’ are only seen to be ‘fairly important’ for 35.05 percent of females, they are only ‘fairly important’ for 27.64 percent of males.
35
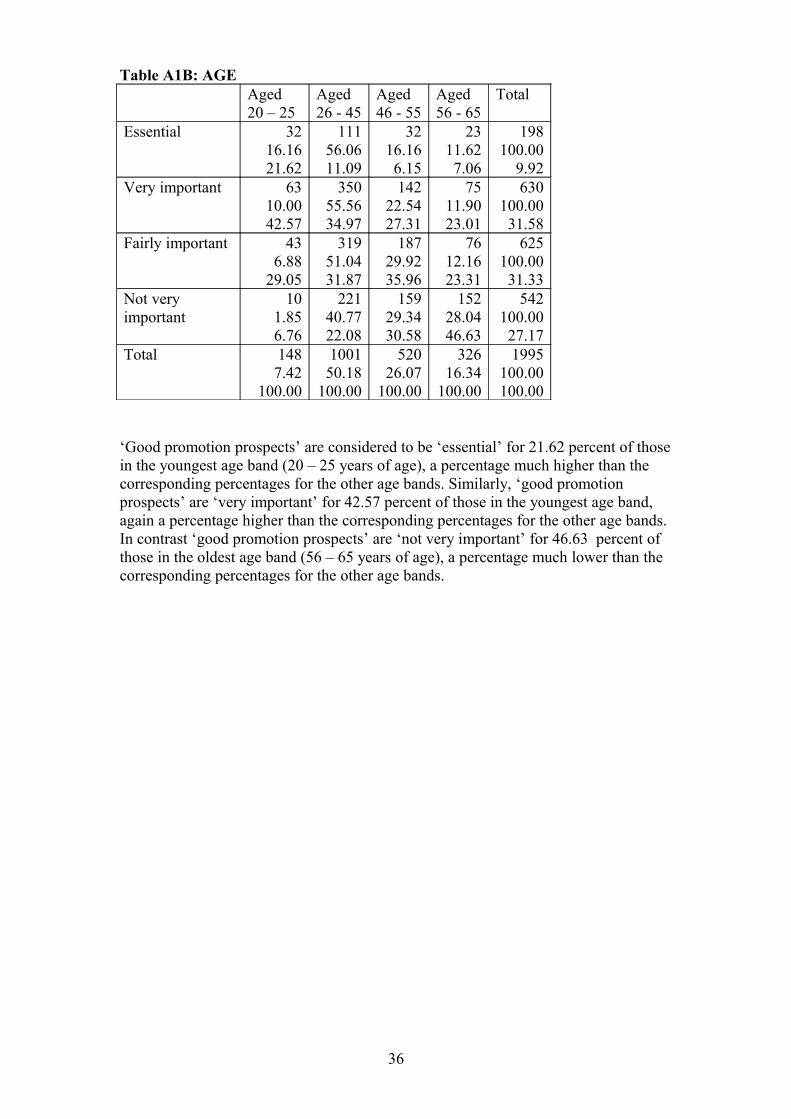
Table A1B: AGEAged20 – 25
Aged26 - 45
Aged46 - 55
Aged56 - 65
Total
Essential 3216.1621.62
11156.0611.09
3216.166.15
2311.627.06
198100.00
9.92Very important 63
10.0042.57
35055.5634.97
14222.5427.31
7511.9023.01
630100.0031.58
Fairly important 436.88
29.05
31951.0431.87
18729.9235.96
7612.1623.31
625100.0031.33
Not very important
101.856.76
22140.7722.08
15929.3430.58
15228.0446.63
542100.0027.17
Total 1487.42
100.00
100150.18
100.00
52026.07
100.00
32616.34
100.00
1995100.00100.00
‘Good promotion prospects’ are considered to be ‘essential’ for 21.62 percent of those in the youngest age band (20 – 25 years of age), a percentage much higher than the corresponding percentages for the other age bands. Similarly, ‘good promotion prospects’ are ‘very important’ for 42.57 percent of those in the youngest age band, again a percentage higher than the corresponding percentages for the other age bands. In contrast ‘good promotion prospects’ are ‘not very important’ for 46.63 percent of those in the oldest age band (56 – 65 years of age), a percentage much lower than the corresponding percentages for the other age bands.
36
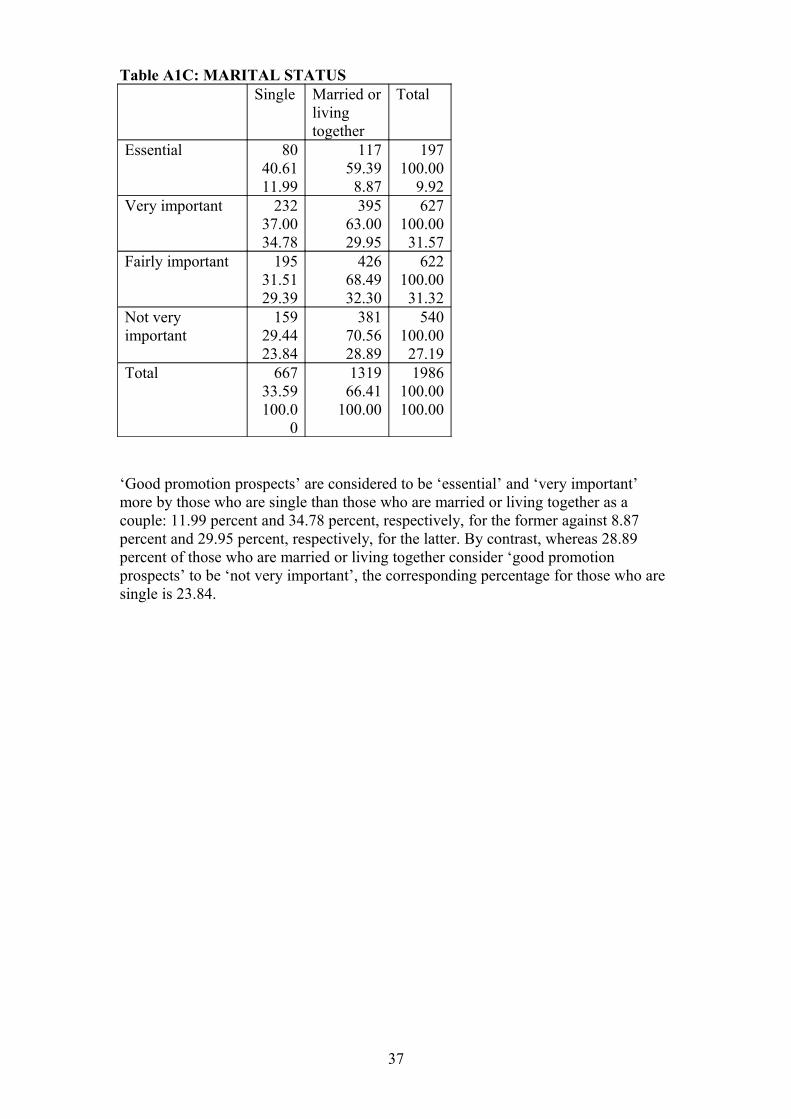
Table A1C: MARITAL STATUSSingle Married or
living together
Total
Essential 8040.6111.99
11759.398.87
197100.00
9.92Very important 232
37.0034.78
39563.0029.95
627100.0031.57
Fairly important 19531.5129.39
42668.4932.30
622100.0031.32
Not very important
15929.4423.84
38170.5628.89
540100.0027.19
Total 66733.59100.0
0
131966.41
100.00
1986100.00100.00
‘Good promotion prospects’ are considered to be ‘essential’ and ‘very important’ more by those who are single than those who are married or living together as a couple: 11.99 percent and 34.78 percent, respectively, for the former against 8.87 percent and 29.95 percent, respectively, for the latter. By contrast, whereas 28.89 percent of those who are married or living together consider ‘good promotion prospects’ to be ‘not very important’, the corresponding percentage for those who are single is 23.84.
37
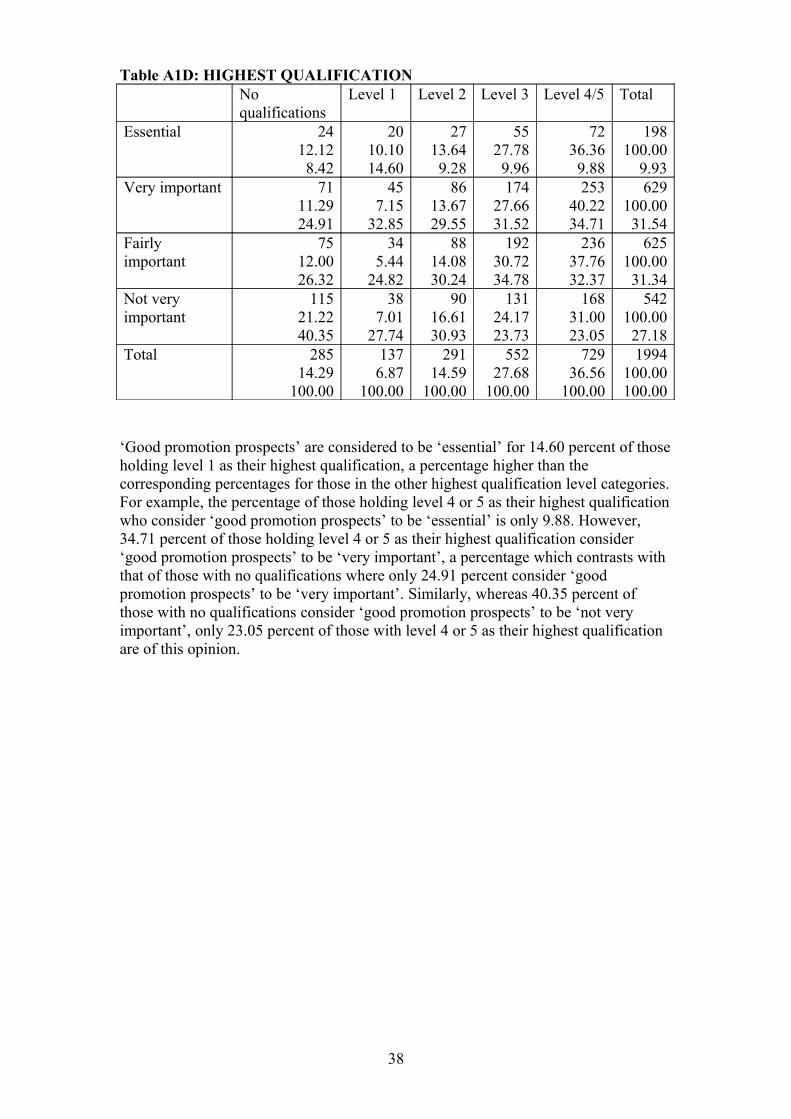
Table A1D: HIGHEST QUALIFICATIONNoqualifications
Level 1 Level 2 Level 3 Level 4/5 Total
Essential 2412.128.42
2010.1014.60
2713.649.28
5527.789.96
7236.369.88
198100.00
9.93Very important 71
11.2924.91
457.15
32.85
8613.6729.55
17427.6631.52
25340.2234.71
629100.0031.54
Fairly important
7512.0026.32
345.44
24.82
8814.0830.24
19230.7234.78
23637.7632.37
625100.0031.34
Not very important
11521.2240.35
387.01
27.74
9016.6130.93
13124.1723.73
16831.0023.05
542100.0027.18
Total 28514.29
100.00
1376.87
100.00
29114.59
100.00
55227.68
100.00
72936.56
100.00
1994100.00100.00
‘Good promotion prospects’ are considered to be ‘essential’ for 14.60 percent of those holding level 1 as their highest qualification, a percentage higher than the corresponding percentages for those in the other highest qualification level categories. For example, the percentage of those holding level 4 or 5 as their highest qualification who consider ‘good promotion prospects’ to be ‘essential’ is only 9.88. However, 34.71 percent of those holding level 4 or 5 as their highest qualification consider ‘good promotion prospects’ to be ‘very important’, a percentage which contrasts with that of those with no qualifications where only 24.91 percent consider ‘good promotion prospects’ to be ‘very important’. Similarly, whereas 40.35 percent of those with no qualifications consider ‘good promotion prospects’ to be ‘not very important’, only 23.05 percent of those with level 4 or 5 as their highest qualification are of this opinion.
38
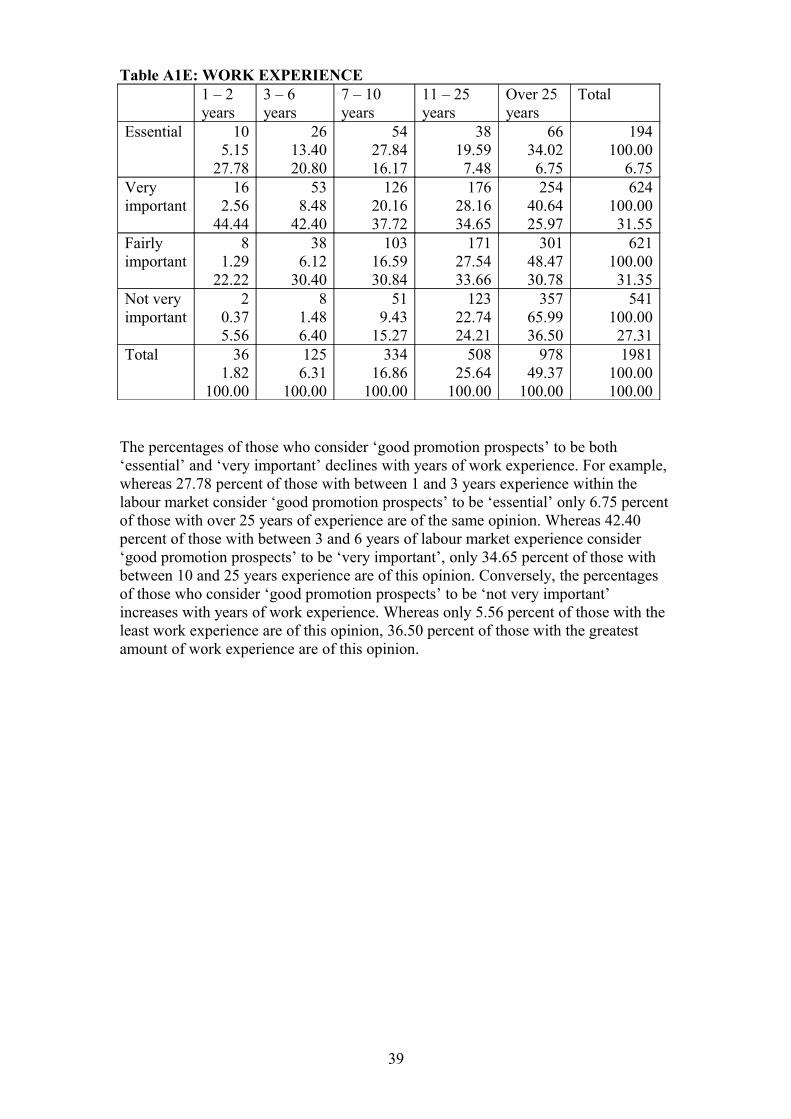
Table A1E: WORK EXPERIENCE1 – 2 years
3 – 6 years
7 – 10 years
11 – 25 years
Over 25 years
Total
Essential 105.15
27.78
2613.4020.80
5427.8416.17
3819.597.48
6634.026.75
194100.00
6.75Very important
162.56
44.44
538.48
42.40
12620.1637.72
17628.1634.65
25440.6425.97
624100.0031.55
Fairly important
81.29
22.22
386.12
30.40
10316.5930.84
17127.5433.66
30148.4730.78
621100.0031.35
Not very important
20.375.56
81.486.40
519.43
15.27
12322.7424.21
35765.9936.50
541100.0027.31
Total 361.82
100.00
1256.31
100.00
33416.86
100.00
50825.64
100.00
97849.37
100.00
1981100.00100.00
The percentages of those who consider ‘good promotion prospects’ to be both ‘essential’ and ‘very important’ declines with years of work experience. For example, whereas 27.78 percent of those with between 1 and 3 years experience within the labour market consider ‘good promotion prospects’ to be ‘essential’ only 6.75 percent of those with over 25 years of experience are of the same opinion. Whereas 42.40 percent of those with between 3 and 6 years of labour market experience consider ‘good promotion prospects’ to be ‘very important’, only 34.65 percent of those with between 10 and 25 years experience are of this opinion. Conversely, the percentages of those who consider ‘good promotion prospects’ to be ‘not very important’ increases with years of work experience. Whereas only 5.56 percent of those with the least work experience are of this opinion, 36.50 percent of those with the greatest amount of work experience are of this opinion.
39
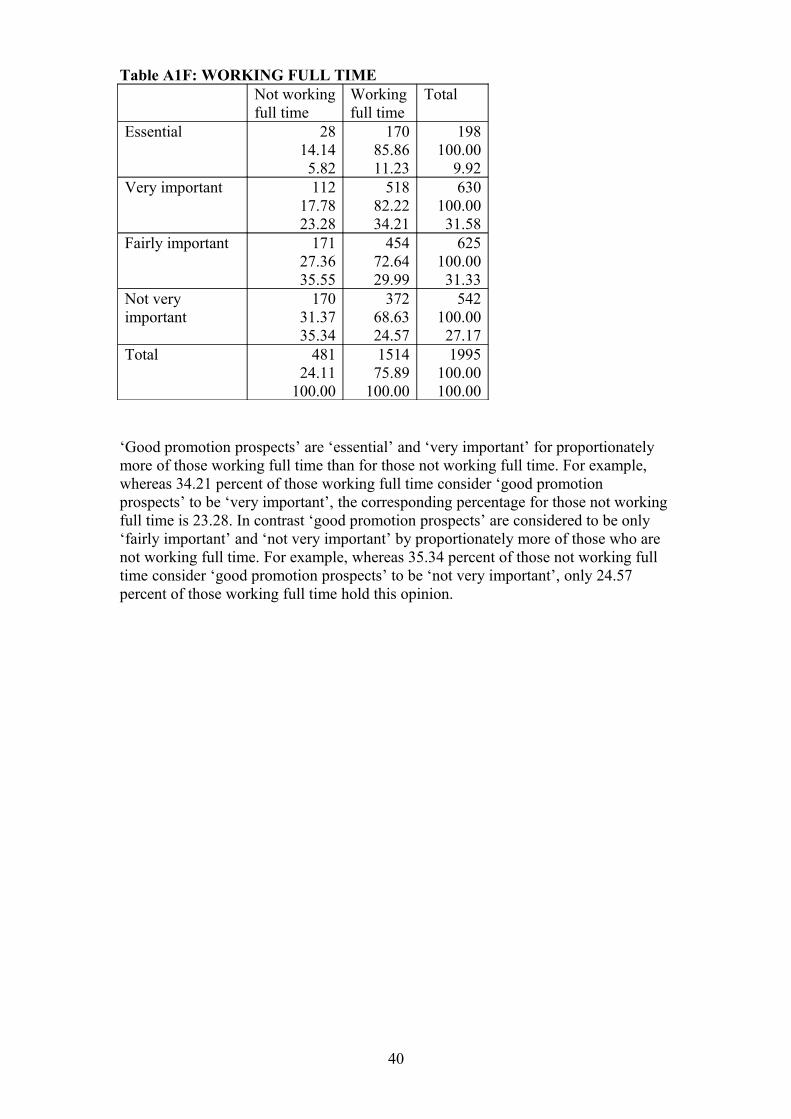
Table A1F: WORKING FULL TIME Not workingfull time
Workingfull time
Total
Essential 2814.145.82
17085.8611.23
198100.00
9.92Very important 112
17.7823.28
51882.2234.21
630100.0031.58
Fairly important 17127.3635.55
45472.6429.99
625100.0031.33
Not very important
17031.3735.34
37268.6324.57
542100.0027.17
Total 48124.11
100.00
151475.89
100.00
1995100.00100.00
‘Good promotion prospects’ are ‘essential’ and ‘very important’ for proportionately more of those working full time than for those not working full time. For example, whereas 34.21 percent of those working full time consider ‘good promotion prospects’ to be ‘very important’, the corresponding percentage for those not working full time is 23.28. In contrast ‘good promotion prospects’ are considered to be only ‘fairly important’ and ‘not very important’ by proportionately more of those who are not working full time. For example, whereas 35.34 percent of those not working full time consider ‘good promotion prospects’ to be ‘not very important’, only 24.57 percent of those working full time hold this opinion.
40
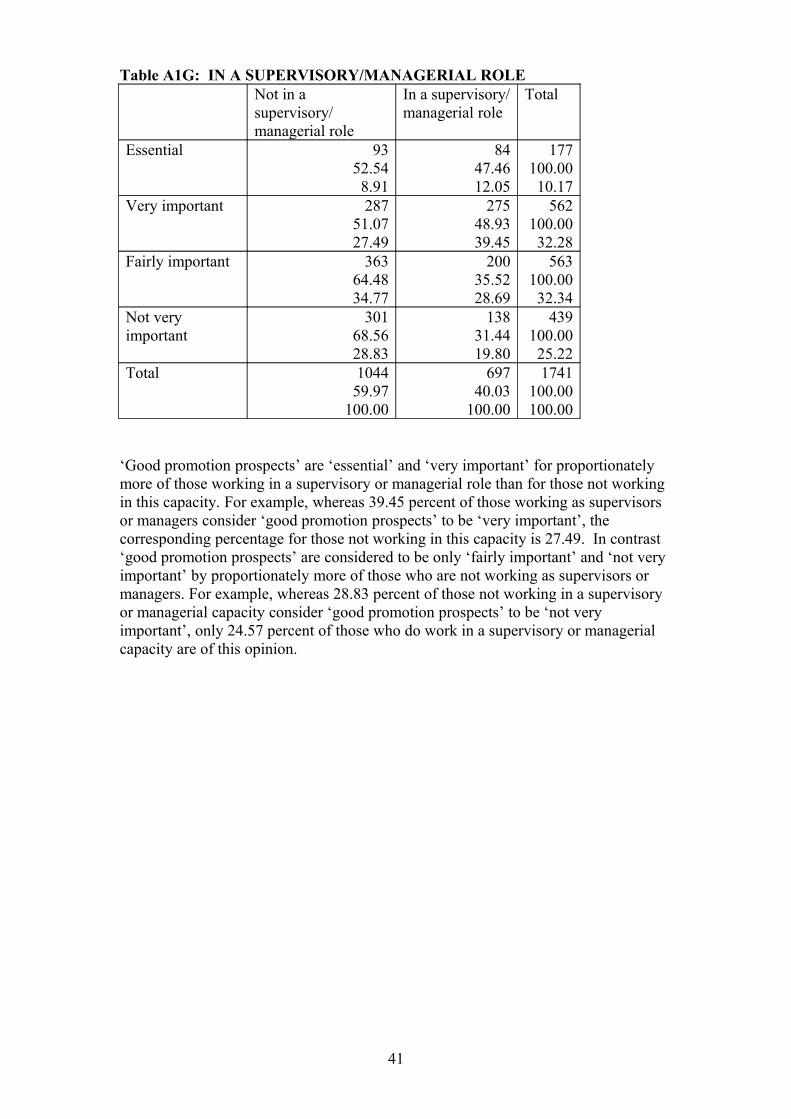
Table A1G: IN A SUPERVISORY/MANAGERIAL ROLENot in a supervisory/managerial role
In a supervisory/managerial role
Total
Essential 9352.548.91
8447.4612.05
177100.0010.17
Very important 28751.0727.49
27548.9339.45
562100.0032.28
Fairly important 36364.4834.77
20035.5228.69
563100.0032.34
Not very important
30168.5628.83
13831.4419.80
439100.0025.22
Total 104459.97
100.00
69740.03
100.00
1741100.00100.00
‘Good promotion prospects’ are ‘essential’ and ‘very important’ for proportionately more of those working in a supervisory or managerial role than for those not working in this capacity. For example, whereas 39.45 percent of those working as supervisors or managers consider ‘good promotion prospects’ to be ‘very important’, the corresponding percentage for those not working in this capacity is 27.49. In contrast ‘good promotion prospects’ are considered to be only ‘fairly important’ and ‘not very important’ by proportionately more of those who are not working as supervisors or managers. For example, whereas 28.83 percent of those not working in a supervisory or managerial capacity consider ‘good promotion prospects’ to be ‘not very important’, only 24.57 percent of those who do work in a supervisory or managerial capacity are of this opinion.
41
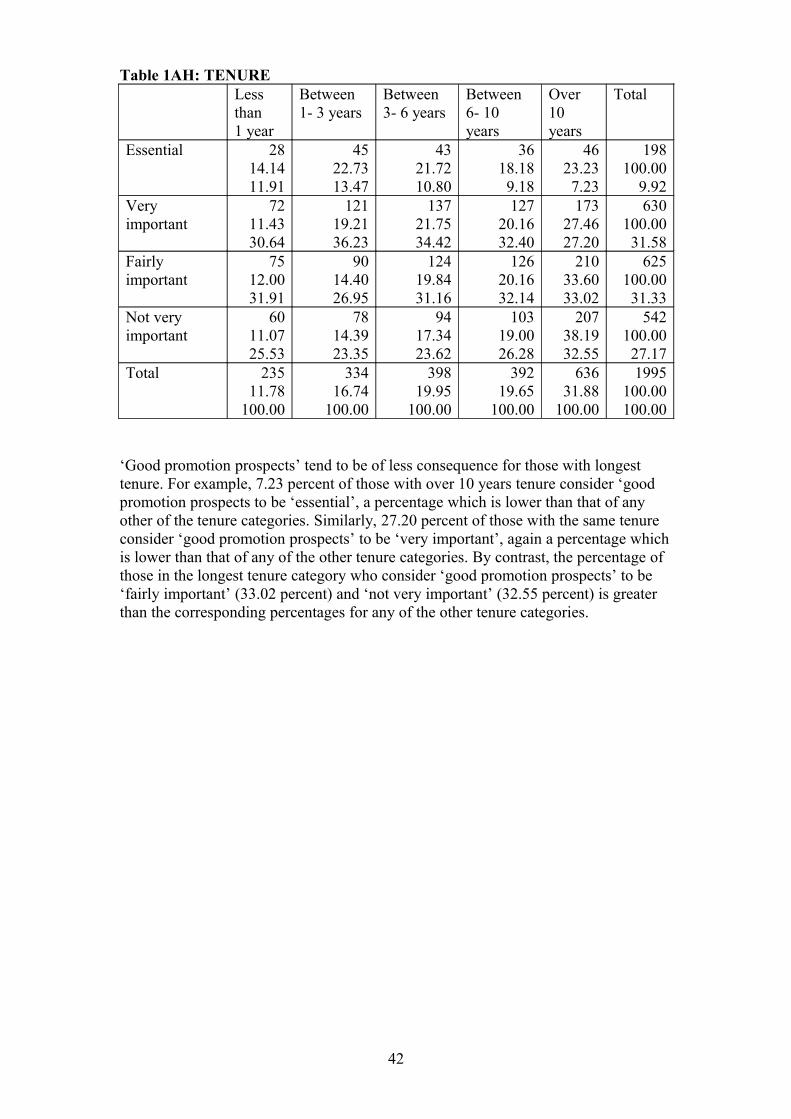
Table 1AH: TENURELess than1 year
Between 1- 3 years
Between 3- 6 years
Between 6- 10 years
Over 10years
Total
Essential 2814.1411.91
4522.7313.47
4321.7210.80
3618.189.18
4623.237.23
198100.00
9.92Very important
7211.4330.64
12119.2136.23
13721.7534.42
12720.1632.40
17327.4627.20
630100.0031.58
Fairly important
7512.0031.91
9014.4026.95
12419.8431.16
12620.1632.14
21033.6033.02
625100.0031.33
Not very important
6011.0725.53
7814.3923.35
9417.3423.62
10319.0026.28
20738.1932.55
542100.0027.17
Total 23511.78
100.00
33416.74
100.00
39819.95
100.00
39219.65
100.00
63631.88
100.00
1995100.00100.00
‘Good promotion prospects’ tend to be of less consequence for those with longest tenure. For example, 7.23 percent of those with over 10 years tenure consider ‘good promotion prospects to be ‘essential’, a percentage which is lower than that of any other of the tenure categories. Similarly, 27.20 percent of those with the same tenure consider ‘good promotion prospects’ to be ‘very important’, again a percentage which is lower than that of any of the other tenure categories. By contrast, the percentage of those in the longest tenure category who consider ‘good promotion prospects’ to be ‘fairly important’ (33.02 percent) and ‘not very important’ (32.55 percent) is greater than the corresponding percentages for any of the other tenure categories.
42
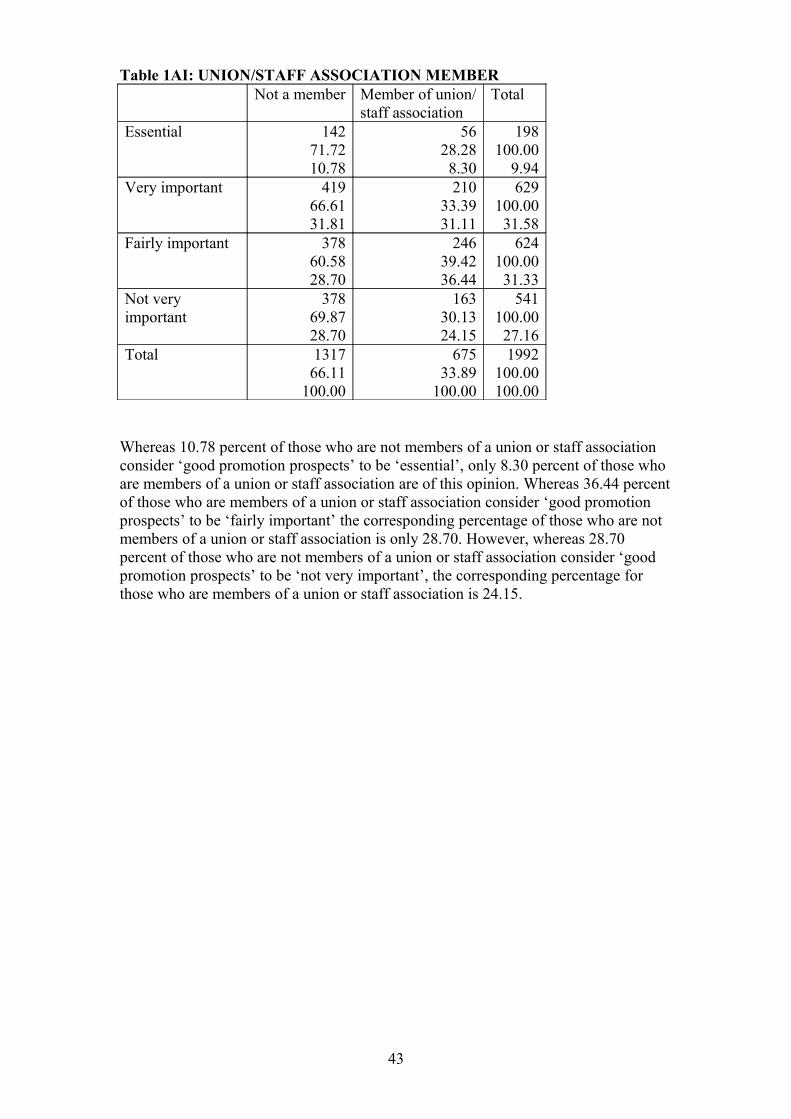
Table 1AI: UNION/STAFF ASSOCIATION MEMBERNot a member Member of union/
staff associationTotal
Essential 14271.7210.78
5628.288.30
198100.00
9.94Very important 419
66.6131.81
21033.3931.11
629100.0031.58
Fairly important 37860.5828.70
24639.4236.44
624100.0031.33
Not very important
37869.8728.70
16330.1324.15
541100.0027.16
Total 131766.11
100.00
67533.89
100.00
1992100.00100.00
Whereas 10.78 percent of those who are not members of a union or staff association consider ‘good promotion prospects’ to be ‘essential’, only 8.30 percent of those who are members of a union or staff association are of this opinion. Whereas 36.44 percent of those who are members of a union or staff association consider ‘good promotion prospects’ to be ‘fairly important’ the corresponding percentage of those who are not members of a union or staff association is only 28.70. However, whereas 28.70 percent of those who are not members of a union or staff association consider ‘good promotion prospects’ to be ‘not very important’, the corresponding percentage for those who are members of a union or staff association is 24.15.
43
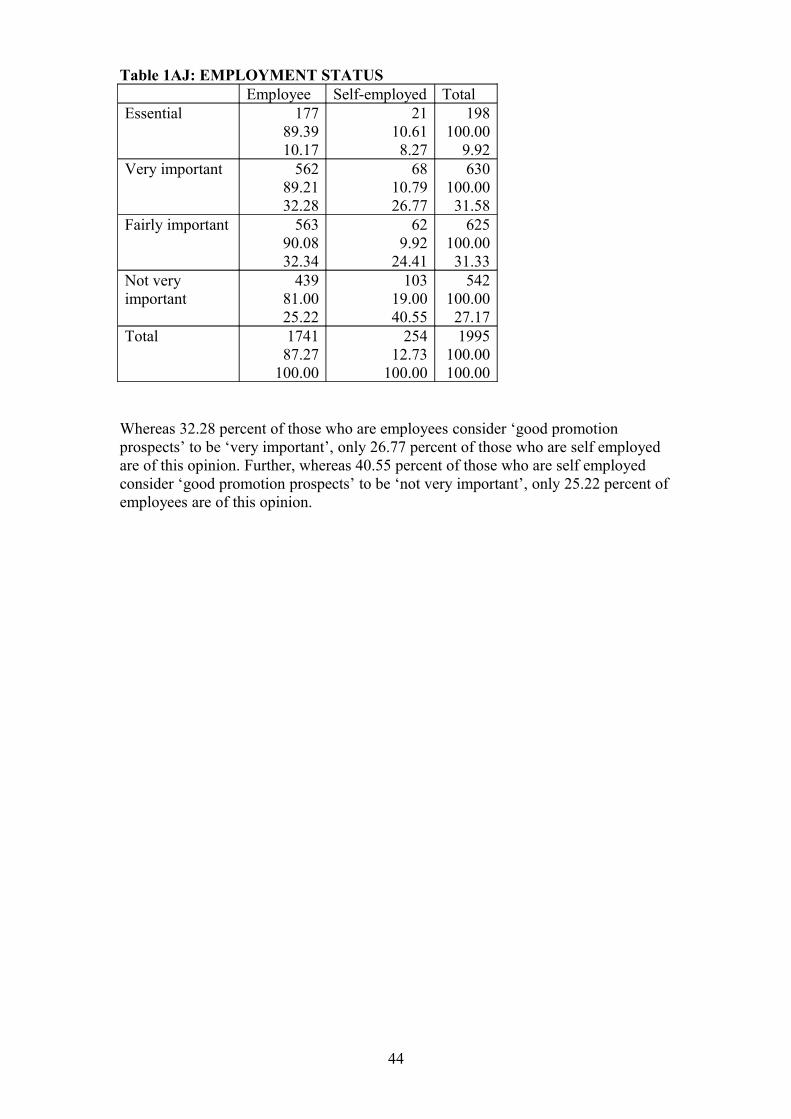
Table 1AJ: EMPLOYMENT STATUSEmployee Self-employed Total
Essential 17789.3910.17
2110.618.27
198100.00
9.92Very important 562
89.2132.28
6810.7926.77
630100.0031.58
Fairly important 56390.0832.34
629.92
24.41
625100.0031.33
Not very important
43981.0025.22
10319.0040.55
542100.0027.17
Total 174187.27
100.00
25412.73
100.00
1995100.00100.00
Whereas 32.28 percent of those who are employees consider ‘good promotion prospects’ to be ‘very important’, only 26.77 percent of those who are self employed are of this opinion. Further, whereas 40.55 percent of those who are self employed consider ‘good promotion prospects’ to be ‘not very important’, only 25.22 percent of employees are of this opinion.
44
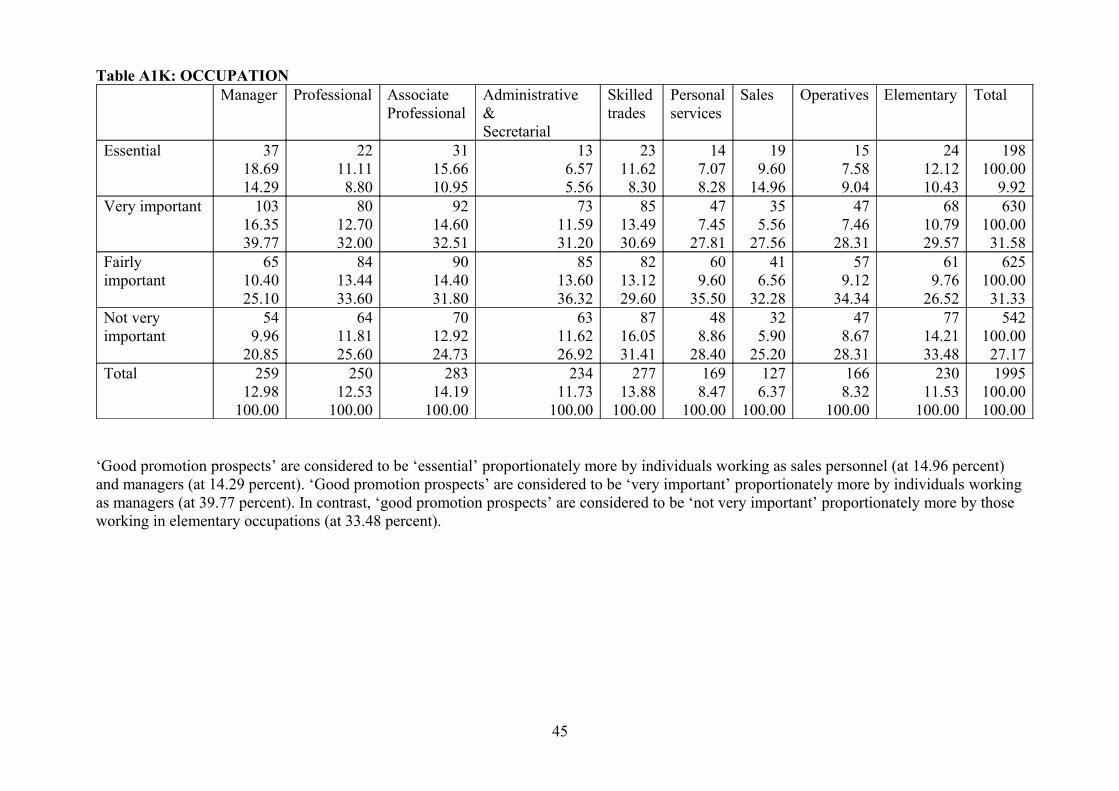
Table A1K: OCCUPATIONManager Professional Associate
ProfessionalAdministrative &Secretarial
Skilledtrades
Personal services
Sales Operatives Elementary Total
Essential 3718.6914.29
2211.118.80
3115.6610.95
136.575.56
2311.628.30
147.078.28
199.60
14.96
157.589.04
2412.1210.43
198100.00
9.92Very important 103
16.3539.77
8012.7032.00
9214.6032.51
7311.5931.20
8513.4930.69
477.45
27.81
355.56
27.56
477.46
28.31
6810.7929.57
630100.0031.58
Fairly important
6510.4025.10
8413.4433.60
9014.4031.80
8513.6036.32
8213.1229.60
609.60
35.50
416.56
32.28
579.12
34.34
619.76
26.52
625100.0031.33
Not very important
549.96
20.85
6411.8125.60
7012.9224.73
6311.6226.92
8716.0531.41
488.86
28.40
325.90
25.20
478.67
28.31
7714.2133.48
542100.0027.17
Total 25912.98
100.00
25012.53
100.00
28314.19
100.00
23411.73
100.00
27713.88
100.00
1698.47
100.00
1276.37
100.00
1668.32
100.00
23011.53
100.00
1995100.00100.00
‘Good promotion prospects’ are considered to be ‘essential’ proportionately more by individuals working as sales personnel (at 14.96 percent) and managers (at 14.29 percent). ‘Good promotion prospects’ are considered to be ‘very important’ proportionately more by individuals working as managers (at 39.77 percent). In contrast, ‘good promotion prospects’ are considered to be ‘not very important’ proportionately more by those working in elementary occupations (at 33.48 percent).
45
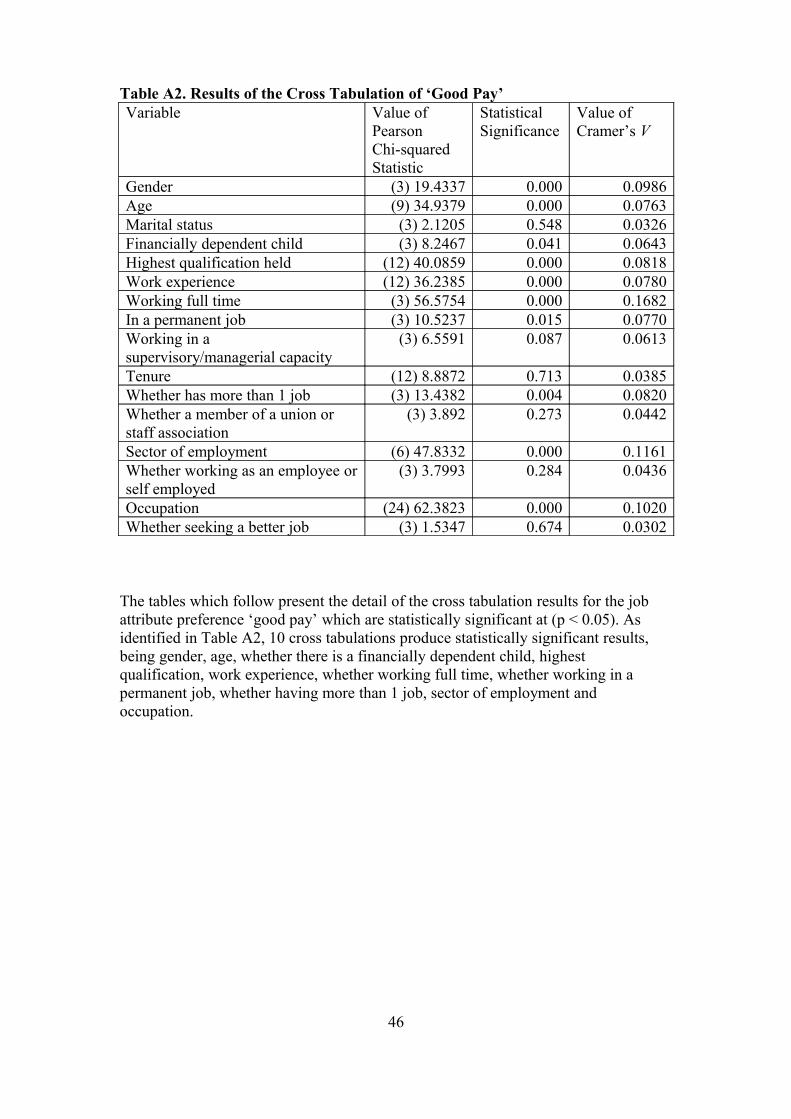
Table A2. Results of the Cross Tabulation of ‘Good Pay’Variable Value of
Pearson Chi-squared Statistic
StatisticalSignificance
Value of Cramer’s V
Gender (3) 19.4337 0.000 0.0986Age (9) 34.9379 0.000 0.0763Marital status (3) 2.1205 0.548 0.0326Financially dependent child (3) 8.2467 0.041 0.0643Highest qualification held (12) 40.0859 0.000 0.0818Work experience (12) 36.2385 0.000 0.0780Working full time (3) 56.5754 0.000 0.1682In a permanent job (3) 10.5237 0.015 0.0770Working in a supervisory/managerial capacity
(3) 6.5591 0.087 0.0613
Tenure (12) 8.8872 0.713 0.0385Whether has more than 1 job (3) 13.4382 0.004 0.0820Whether a member of a union or staff association
(3) 3.892 0.273 0.0442
Sector of employment (6) 47.8332 0.000 0.1161Whether working as an employee or self employed
(3) 3.7993 0.284 0.0436
Occupation (24) 62.3823 0.000 0.1020Whether seeking a better job (3) 1.5347 0.674 0.0302
The tables which follow present the detail of the cross tabulation results for the job attribute preference ‘good pay’ which are statistically significant at (p < 0.05). As identified in Table A2, 10 cross tabulations produce statistically significant results, being gender, age, whether there is a financially dependent child, highest qualification, work experience, whether working full time, whether working in a permanent job, whether having more than 1 job, sector of employment and occupation.
46
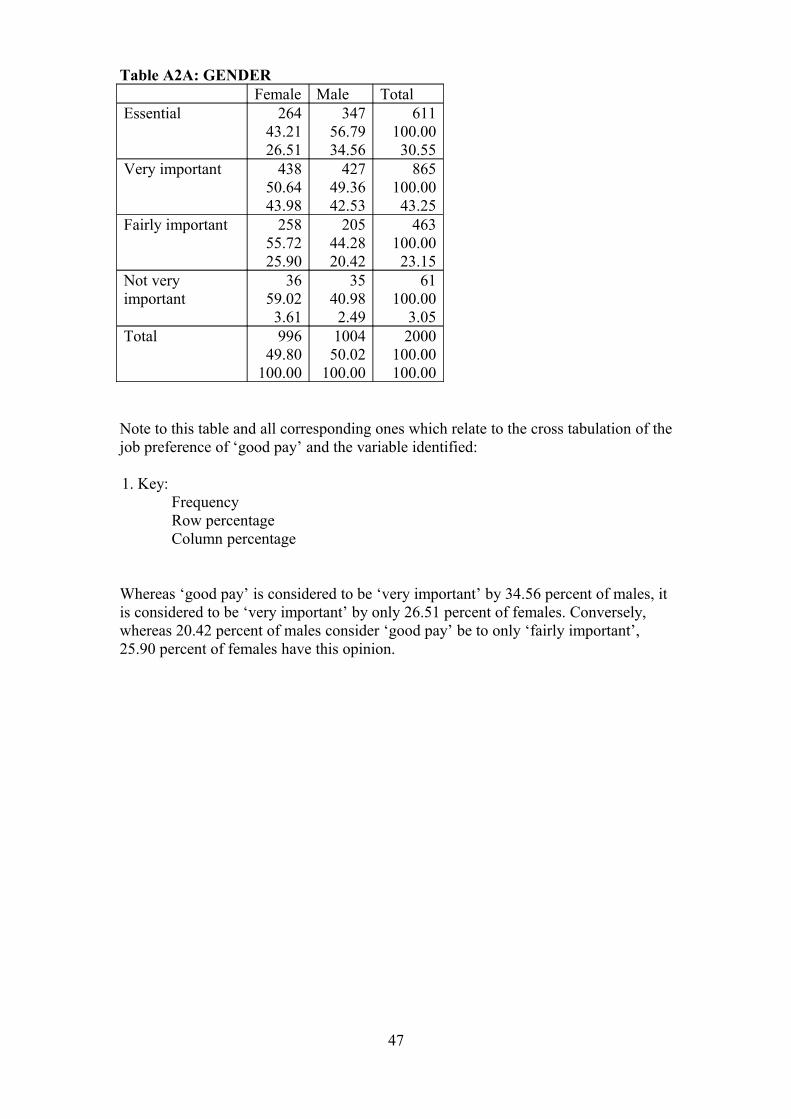
Table A2A: GENDERFemale Male Total
Essential 26443.2126.51
34756.7934.56
611100.0030.55
Very important 43850.6443.98
42749.3642.53
865100.0043.25
Fairly important 25855.7225.90
20544.2820.42
463100.0023.15
Not very important
3659.023.61
3540.982.49
61100.00
3.05Total 996
49.80100.00
100450.02
100.00
2000100.00100.00
Note to this table and all corresponding ones which relate to the cross tabulation of the job preference of ‘good pay’ and the variable identified:
1. Key:FrequencyRow percentageColumn percentage
Whereas ‘good pay’ is considered to be ‘very important’ by 34.56 percent of males, it is considered to be ‘very important’ by only 26.51 percent of females. Conversely, whereas 20.42 percent of males consider ‘good pay’ be to only ‘fairly important’, 25.90 percent of females have this opinion.
47
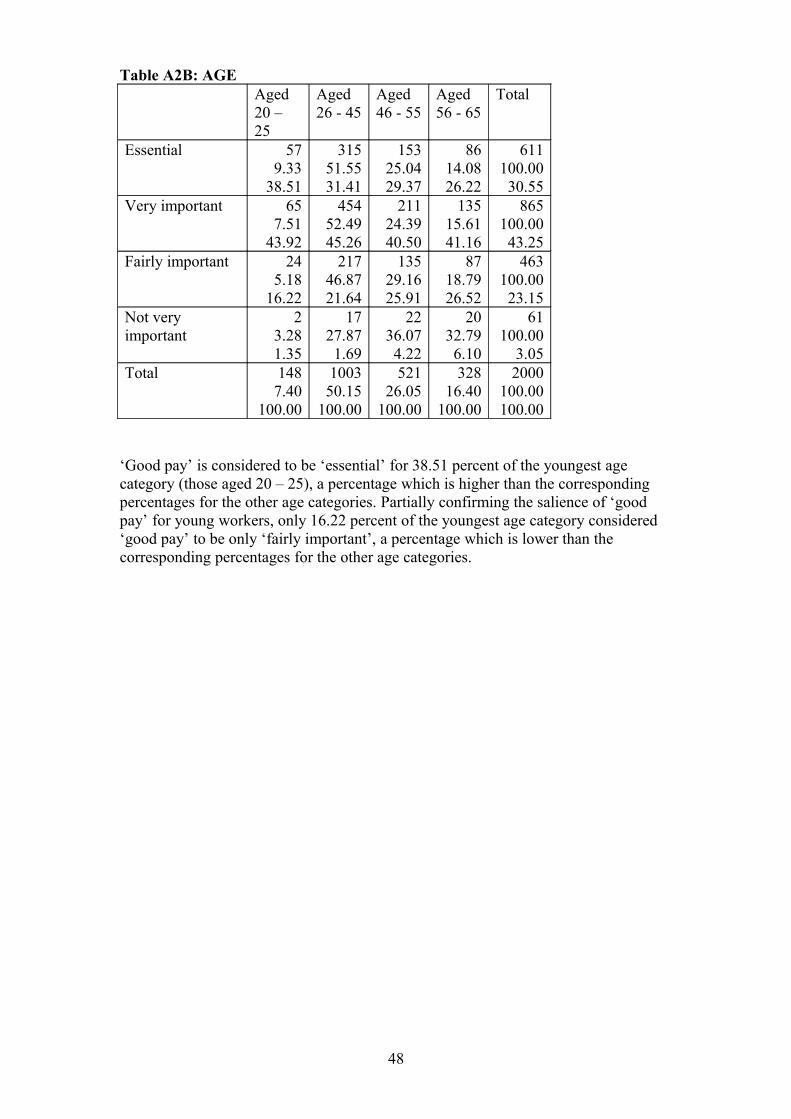
Table A2B: AGEAged20 – 25
Aged26 - 45
Aged46 - 55
Aged56 - 65
Total
Essential 579.33
38.51
31551.5531.41
15325.0429.37
8614.0826.22
611100.0030.55
Very important 657.51
43.92
45452.4945.26
21124.3940.50
13515.6141.16
865100.0043.25
Fairly important 245.18
16.22
21746.8721.64
13529.1625.91
8718.7926.52
463100.0023.15
Not very important
23.281.35
1727.871.69
2236.074.22
2032.796.10
61100.00
3.05Total 148
7.40100.00
100350.15
100.00
52126.05
100.00
32816.40
100.00
2000100.00100.00
‘Good pay’ is considered to be ‘essential’ for 38.51 percent of the youngest age category (those aged 20 – 25), a percentage which is higher than the corresponding percentages for the other age categories. Partially confirming the salience of ‘good pay’ for young workers, only 16.22 percent of the youngest age category considered ‘good pay’ to be only ‘fairly important’, a percentage which is lower than the corresponding percentages for the other age categories.
48
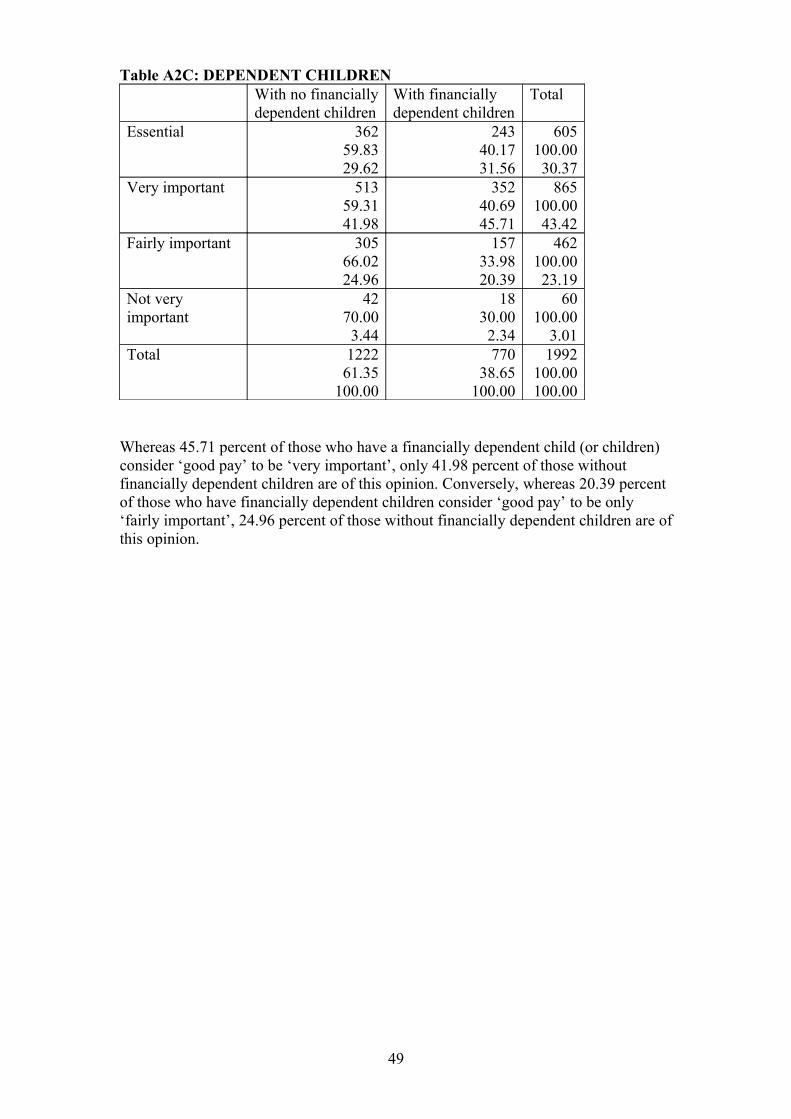
Table A2C: DEPENDENT CHILDRENWith no financiallydependent children
With financiallydependent children
Total
Essential 36259.8329.62
24340.1731.56
605100.0030.37
Very important 51359.3141.98
35240.6945.71
865100.0043.42
Fairly important 30566.0224.96
15733.9820.39
462100.0023.19
Not very important
4270.003.44
1830.002.34
60100.00
3.01Total 1222
61.35100.00
77038.65
100.00
1992100.00100.00
Whereas 45.71 percent of those who have a financially dependent child (or children) consider ‘good pay’ to be ‘very important’, only 41.98 percent of those without financially dependent children are of this opinion. Conversely, whereas 20.39 percent of those who have financially dependent children consider ‘good pay’ to be only ‘fairly important’, 24.96 percent of those without financially dependent children are of this opinion.
49
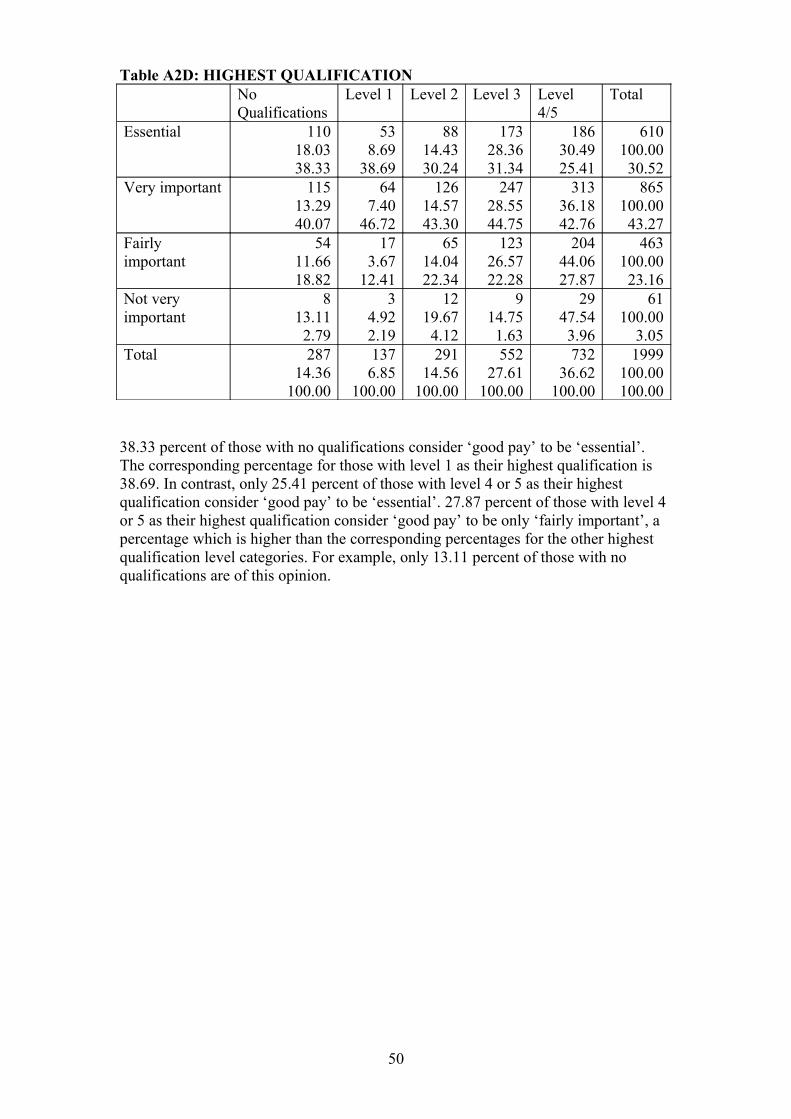
Table A2D: HIGHEST QUALIFICATIONNoQualifications
Level 1 Level 2 Level 3 Level 4/5
Total
Essential 11018.0338.33
538.69
38.69
8814.4330.24
17328.3631.34
18630.4925.41
610100.0030.52
Very important 11513.2940.07
647.40
46.72
12614.5743.30
24728.5544.75
31336.1842.76
865100.0043.27
Fairly important
5411.6618.82
173.67
12.41
6514.0422.34
12326.5722.28
20444.0627.87
463100.0023.16
Not very important
813.112.79
34.922.19
1219.674.12
914.751.63
2947.543.96
61100.00
3.05Total 287
14.36100.00
1376.85
100.00
29114.56
100.00
55227.61
100.00
73236.62
100.00
1999100.00100.00
38.33 percent of those with no qualifications consider ‘good pay’ to be ‘essential’. The corresponding percentage for those with level 1 as their highest qualification is 38.69. In contrast, only 25.41 percent of those with level 4 or 5 as their highest qualification consider ‘good pay’ to be ‘essential’. 27.87 percent of those with level 4 or 5 as their highest qualification consider ‘good pay’ to be only ‘fairly important’, a percentage which is higher than the corresponding percentages for the other highest qualification level categories. For example, only 13.11 percent of those with no qualifications are of this opinion.
50
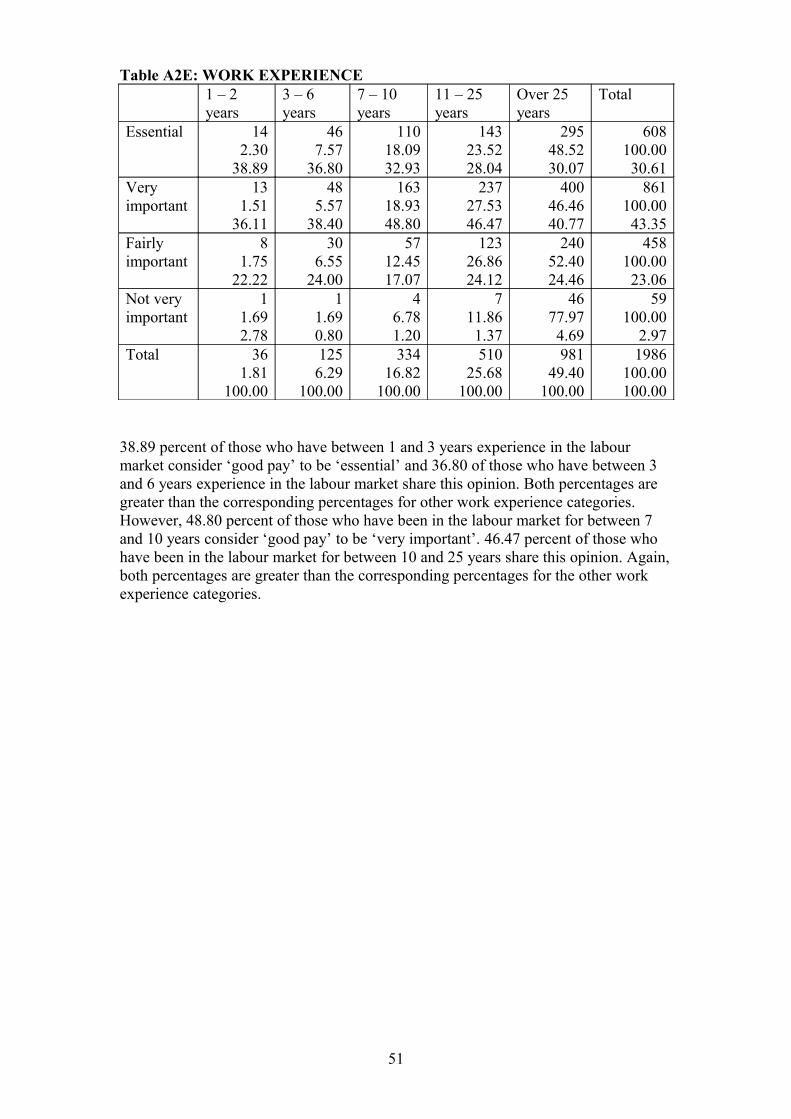
Table A2E: WORK EXPERIENCE1 – 2 years
3 – 6 years
7 – 10 years
11 – 25 years
Over 25 years
Total
Essential 142.30
38.89
467.57
36.80
11018.0932.93
14323.5228.04
29548.5230.07
608100.0030.61
Very important
131.51
36.11
485.57
38.40
16318.9348.80
23727.5346.47
40046.4640.77
861100.0043.35
Fairly important
81.75
22.22
306.55
24.00
5712.4517.07
12326.8624.12
24052.4024.46
458100.0023.06
Not very important
11.692.78
11.690.80
46.781.20
711.861.37
4677.974.69
59100.00
2.97Total 36
1.81100.00
1256.29
100.00
33416.82
100.00
51025.68
100.00
98149.40
100.00
1986100.00100.00
38.89 percent of those who have between 1 and 3 years experience in the labour market consider ‘good pay’ to be ‘essential’ and 36.80 of those who have between 3 and 6 years experience in the labour market share this opinion. Both percentages are greater than the corresponding percentages for other work experience categories. However, 48.80 percent of those who have been in the labour market for between 7 and 10 years consider ‘good pay’ to be ‘very important’. 46.47 percent of those who have been in the labour market for between 10 and 25 years share this opinion. Again, both percentages are greater than the corresponding percentages for the other work experience categories.
51
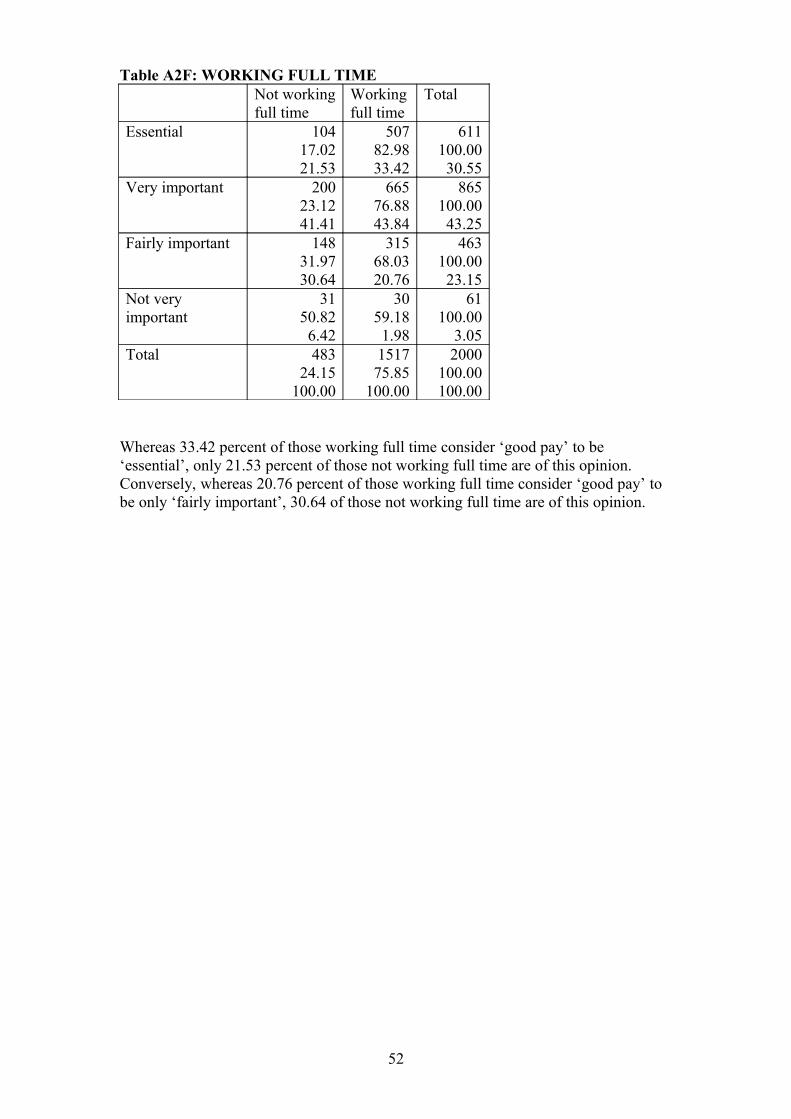
Table A2F: WORKING FULL TIMENot workingfull time
Workingfull time
Total
Essential 10417.0221.53
50782.9833.42
611100.0030.55
Very important 20023.1241.41
66576.8843.84
865100.0043.25
Fairly important 14831.9730.64
31568.0320.76
463100.0023.15
Not very important
3150.826.42
3059.181.98
61100.00
3.05Total 483
24.15100.00
151775.85
100.00
2000100.00100.00
Whereas 33.42 percent of those working full time consider ‘good pay’ to be ‘essential’, only 21.53 percent of those not working full time are of this opinion. Conversely, whereas 20.76 percent of those working full time consider ‘good pay’ to be only ‘fairly important’, 30.64 of those not working full time are of this opinion.
52
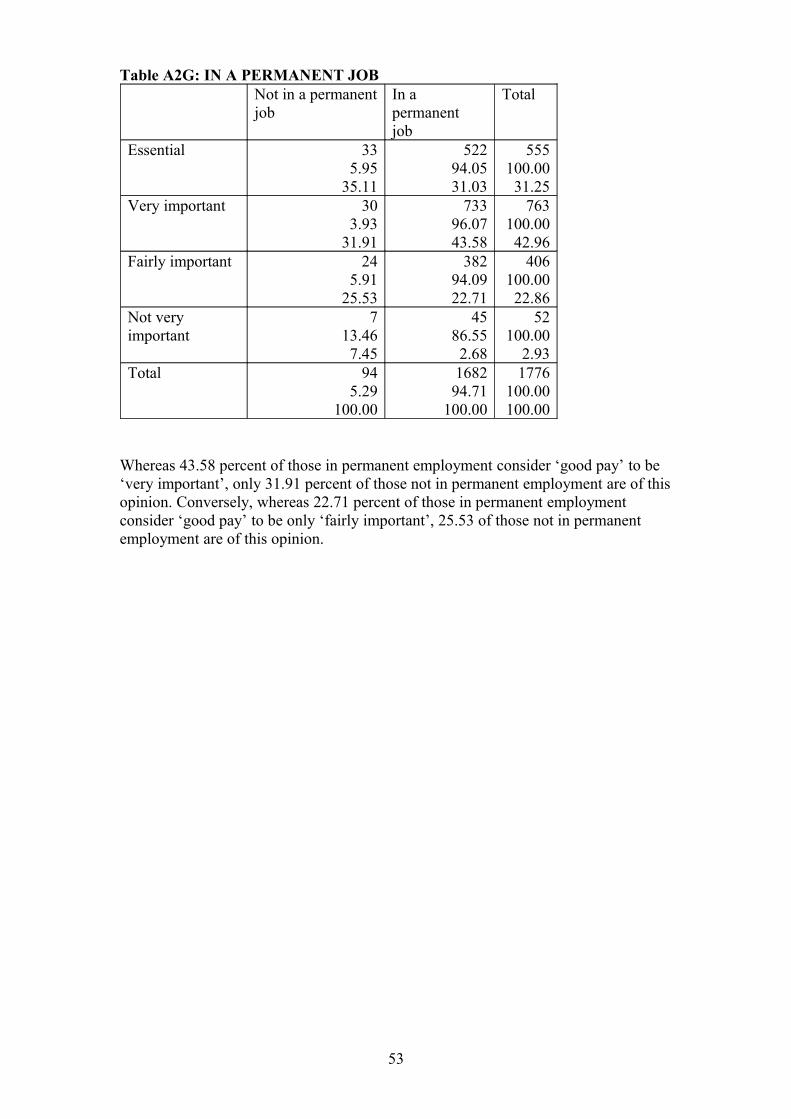
Table A2G: IN A PERMANENT JOBNot in a permanentjob
In a permanentjob
Total
Essential 335.95
35.11
52294.0531.03
555100.0031.25
Very important 303.93
31.91
73396.0743.58
763100.0042.96
Fairly important 245.91
25.53
38294.0922.71
406100.0022.86
Not very important
713.467.45
4586.552.68
52100.00
2.93Total 94
5.29100.00
168294.71
100.00
1776100.00100.00
Whereas 43.58 percent of those in permanent employment consider ‘good pay’ to be ‘very important’, only 31.91 percent of those not in permanent employment are of this opinion. Conversely, whereas 22.71 percent of those in permanent employment consider ‘good pay’ to be only ‘fairly important’, 25.53 of those not in permanent employment are of this opinion.
53
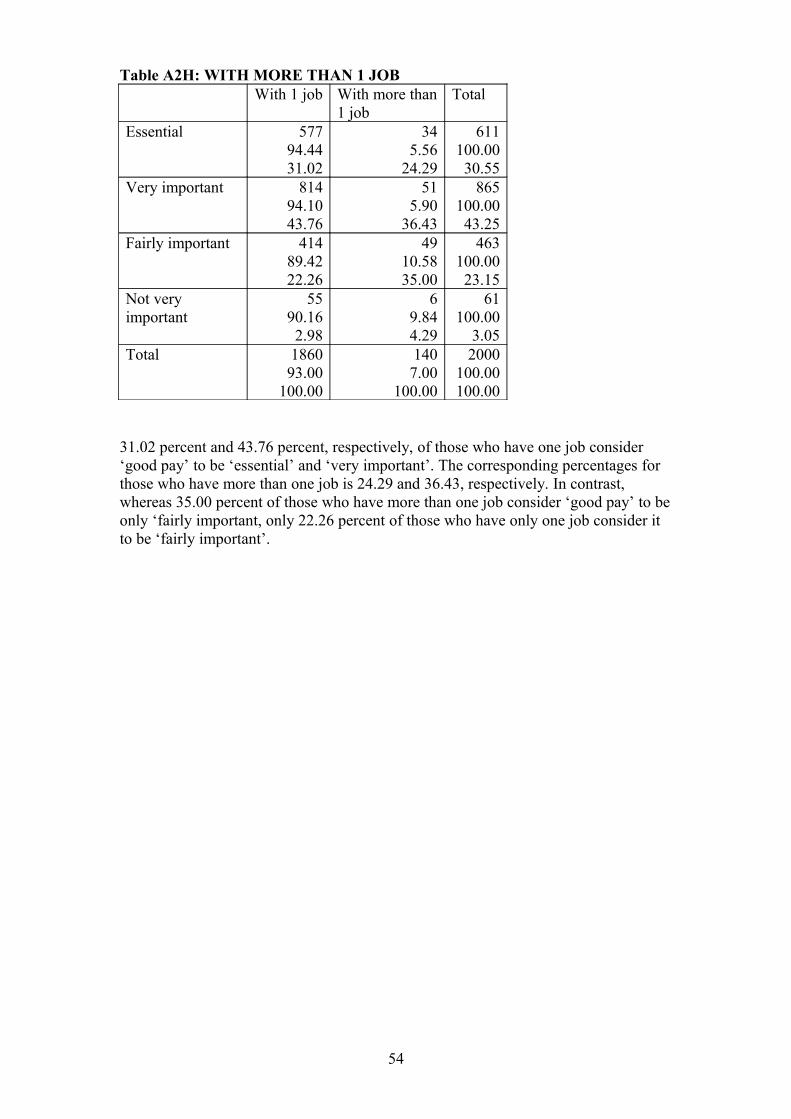
Table A2H: WITH MORE THAN 1 JOBWith 1 job With more than
1 jobTotal
Essential 57794.4431.02
345.56
24.29
611100.0030.55
Very important 81494.1043.76
515.90
36.43
865100.0043.25
Fairly important 41489.4222.26
4910.5835.00
463100.0023.15
Not very important
5590.162.98
69.844.29
61100.00
3.05Total 1860
93.00100.00
1407.00
100.00
2000100.00100.00
31.02 percent and 43.76 percent, respectively, of those who have one job consider ‘good pay’ to be ‘essential’ and ‘very important’. The corresponding percentages for those who have more than one job is 24.29 and 36.43, respectively. In contrast, whereas 35.00 percent of those who have more than one job consider ‘good pay’ to be only ‘fairly important, only 22.26 percent of those who have only one job consider it to be ‘fairly important’.
54
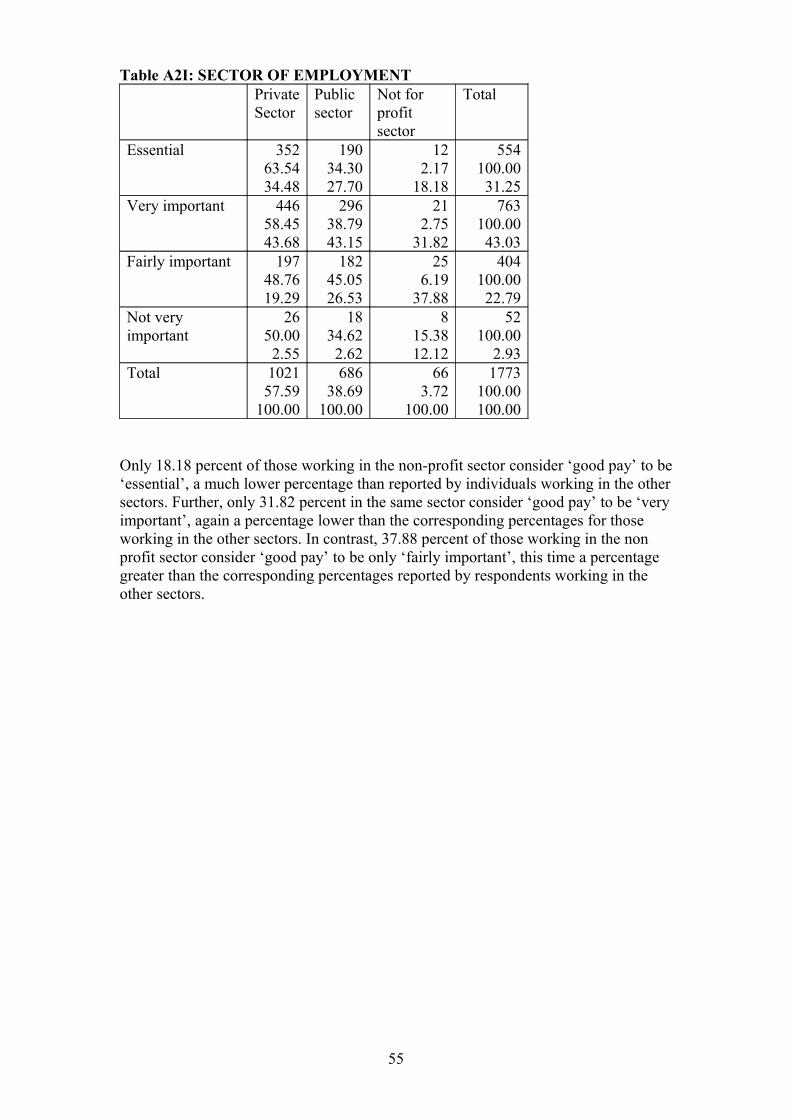
Table A2I: SECTOR OF EMPLOYMENTPrivateSector
Publicsector
Not for profitsector
Total
Essential 35263.5434.48
19034.3027.70
122.17
18.18
554100.0031.25
Very important 44658.4543.68
29638.7943.15
212.75
31.82
763100.0043.03
Fairly important 19748.7619.29
18245.0526.53
256.19
37.88
404100.0022.79
Not very important
2650.002.55
1834.622.62
815.3812.12
52100.00
2.93Total 1021
57.59100.00
68638.69
100.00
663.72
100.00
1773100.00100.00
Only 18.18 percent of those working in the non-profit sector consider ‘good pay’ to be ‘essential’, a much lower percentage than reported by individuals working in the other sectors. Further, only 31.82 percent in the same sector consider ‘good pay’ to be ‘very important’, again a percentage lower than the corresponding percentages for those working in the other sectors. In contrast, 37.88 percent of those working in the non profit sector consider ‘good pay’ to be only ‘fairly important’, this time a percentage greater than the corresponding percentages reported by respondents working in the other sectors.
55
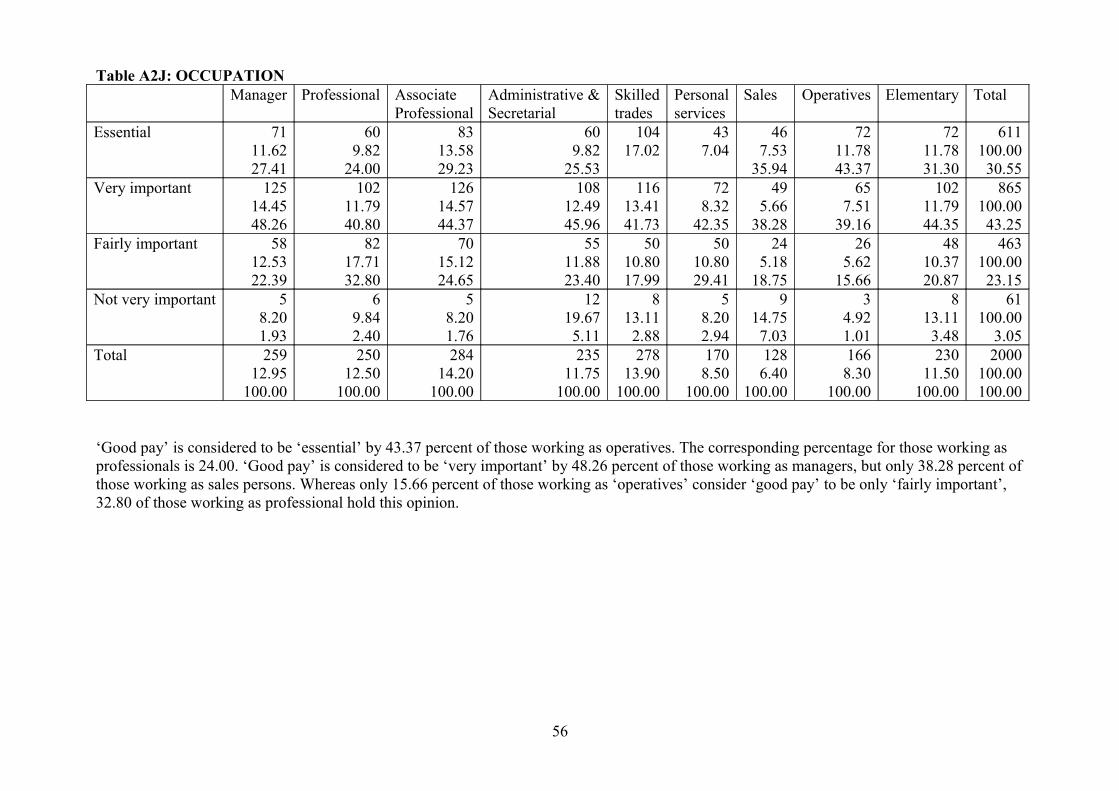
Table A2J: OCCUPATIONManager Professional Associate
ProfessionalAdministrative &Secretarial
Skilledtrades
Personal services
Sales Operatives Elementary Total
Essential 7111.6227.41
609.82
24.00
8313.5829.23
609.82
25.53
10417.02
437.04
467.53
35.94
7211.7843.37
7211.7831.30
611100.0030.55
Very important 12514.4548.26
10211.7940.80
12614.5744.37
10812.4945.96
11613.4141.73
728.32
42.35
495.66
38.28
657.51
39.16
10211.7944.35
865100.0043.25
Fairly important 5812.5322.39
8217.7132.80
7015.1224.65
5511.8823.40
5010.8017.99
5010.8029.41
245.18
18.75
265.62
15.66
4810.3720.87
463100.0023.15
Not very important 58.201.93
69.842.40
58.201.76
1219.675.11
813.112.88
58.202.94
914.757.03
34.921.01
813.113.48
61100.00
3.05Total 259
12.95100.00
25012.50
100.00
28414.20
100.00
23511.75
100.00
27813.90
100.00
1708.50
100.00
1286.40
100.00
1668.30
100.00
23011.50
100.00
2000100.00100.00
‘Good pay’ is considered to be ‘essential’ by 43.37 percent of those working as operatives. The corresponding percentage for those working as professionals is 24.00. ‘Good pay’ is considered to be ‘very important’ by 48.26 percent of those working as managers, but only 38.28 percent of those working as sales persons. Whereas only 15.66 percent of those working as ‘operatives’ consider ‘good pay’ to be only ‘fairly important’, 32.80 of those working as professional hold this opinion.
56
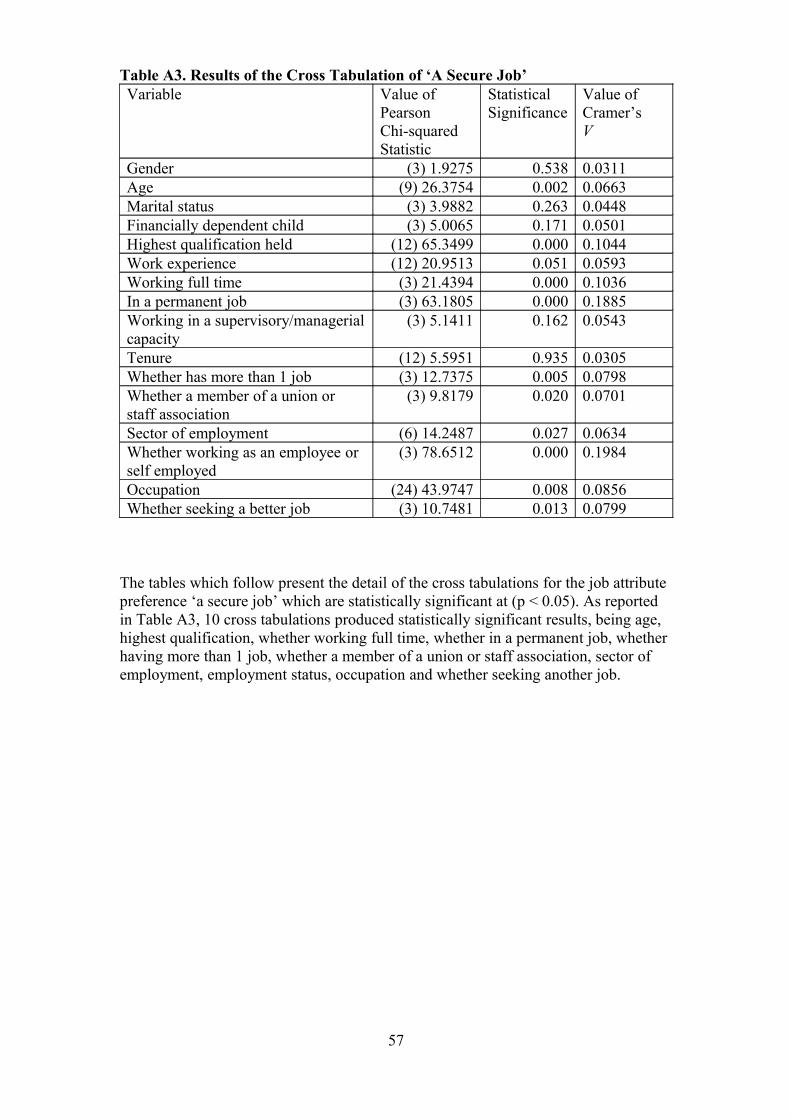
Table A3. Results of the Cross Tabulation of ‘A Secure Job’Variable Value of
Pearson Chi-squared Statistic
StatisticalSignificance
Value of Cramer’s V
Gender (3) 1.9275 0.538 0.0311Age (9) 26.3754 0.002 0.0663Marital status (3) 3.9882 0.263 0.0448Financially dependent child (3) 5.0065 0.171 0.0501Highest qualification held (12) 65.3499 0.000 0.1044Work experience (12) 20.9513 0.051 0.0593Working full time (3) 21.4394 0.000 0.1036In a permanent job (3) 63.1805 0.000 0.1885Working in a supervisory/managerial capacity
(3) 5.1411 0.162 0.0543
Tenure (12) 5.5951 0.935 0.0305Whether has more than 1 job (3) 12.7375 0.005 0.0798Whether a member of a union or staff association
(3) 9.8179 0.020 0.0701
Sector of employment (6) 14.2487 0.027 0.0634Whether working as an employee or self employed
(3) 78.6512 0.000 0.1984
Occupation (24) 43.9747 0.008 0.0856Whether seeking a better job (3) 10.7481 0.013 0.0799
The tables which follow present the detail of the cross tabulations for the job attribute preference ‘a secure job’ which are statistically significant at (p < 0.05). As reported in Table A3, 10 cross tabulations produced statistically significant results, being age, highest qualification, whether working full time, whether in a permanent job, whether having more than 1 job, whether a member of a union or staff association, sector of employment, employment status, occupation and whether seeking another job.
57
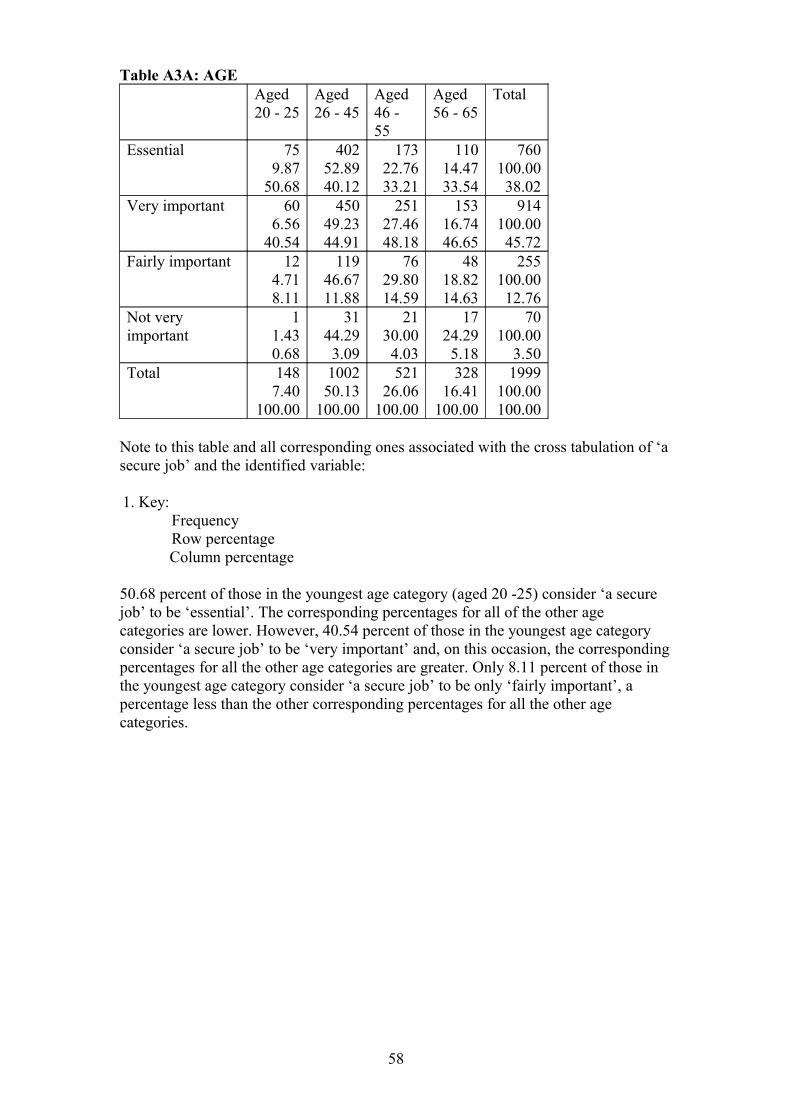
Table A3A: AGEAged20 - 25
Aged26 - 45
Aged46 - 55
Aged56 - 65
Total
Essential 759.87
50.68
40252.8940.12
17322.7633.21
11014.4733.54
760100.0038.02
Very important 606.56
40.54
45049.2344.91
25127.4648.18
15316.7446.65
914100.0045.72
Fairly important 124.718.11
11946.6711.88
7629.8014.59
4818.8214.63
255100.0012.76
Not very important
11.430.68
3144.293.09
2130.004.03
1724.295.18
70100.00
3.50Total 148
7.40100.00
100250.13
100.00
52126.06
100.00
32816.41
100.00
1999100.00100.00
Note to this table and all corresponding ones associated with the cross tabulation of ‘a secure job’ and the identified variable:
1. Key:FrequencyRow percentageColumn percentage
50.68 percent of those in the youngest age category (aged 20 -25) consider ‘a secure job’ to be ‘essential’. The corresponding percentages for all of the other age categories are lower. However, 40.54 percent of those in the youngest age category consider ‘a secure job’ to be ‘very important’ and, on this occasion, the corresponding percentages for all the other age categories are greater. Only 8.11 percent of those in the youngest age category consider ‘a secure job’ to be only ‘fairly important’, a percentage less than the other corresponding percentages for all the other age categories.
58
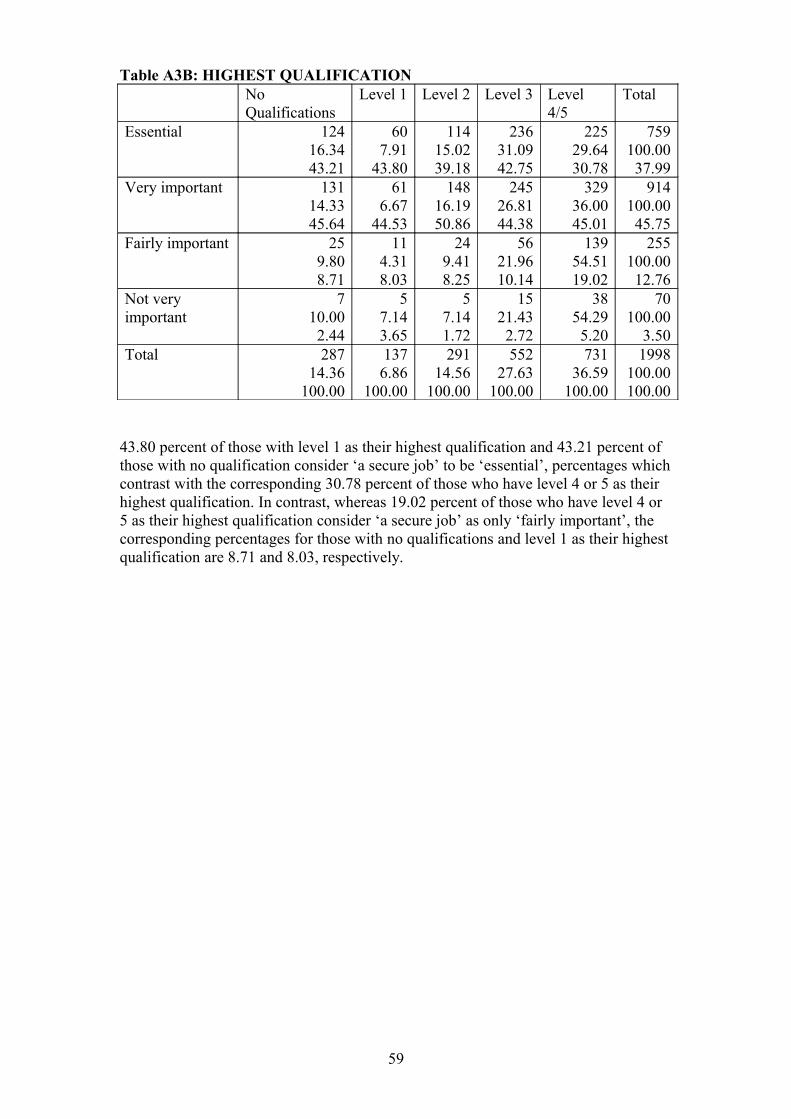
Table A3B: HIGHEST QUALIFICATIONNoQualifications
Level 1 Level 2 Level 3 Level 4/5
Total
Essential 12416.3443.21
607.91
43.80
11415.0239.18
23631.0942.75
22529.6430.78
759100.0037.99
Very important 13114.3345.64
616.67
44.53
14816.1950.86
24526.8144.38
32936.0045.01
914100.0045.75
Fairly important 259.808.71
114.318.03
249.418.25
5621.9610.14
13954.5119.02
255100.0012.76
Not very important
710.002.44
57.143.65
57.141.72
1521.432.72
3854.295.20
70100.00
3.50Total 287
14.36100.00
1376.86
100.00
29114.56
100.00
55227.63
100.00
73136.59
100.00
1998100.00100.00
43.80 percent of those with level 1 as their highest qualification and 43.21 percent of those with no qualification consider ‘a secure job’ to be ‘essential’, percentages which contrast with the corresponding 30.78 percent of those who have level 4 or 5 as their highest qualification. In contrast, whereas 19.02 percent of those who have level 4 or 5 as their highest qualification consider ‘a secure job’ as only ‘fairly important’, the corresponding percentages for those with no qualifications and level 1 as their highest qualification are 8.71 and 8.03, respectively.
59
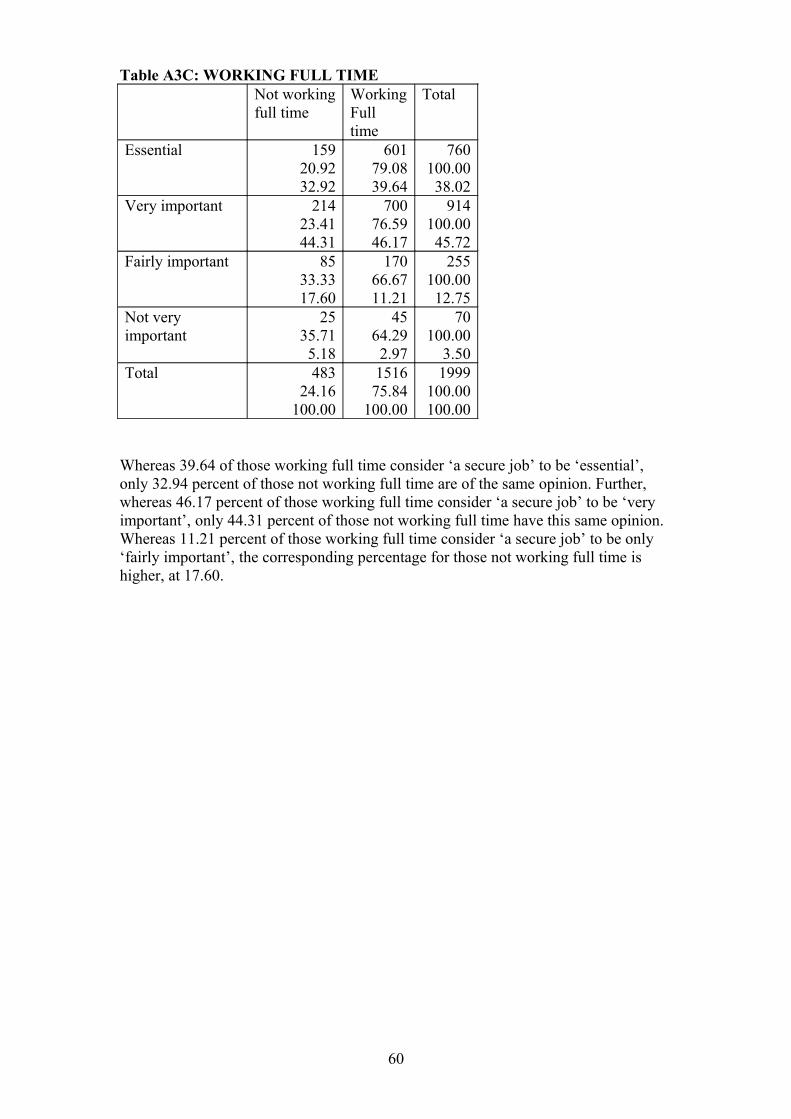
Table A3C: WORKING FULL TIMENot workingfull time
WorkingFull time
Total
Essential 15920.9232.92
60179.0839.64
760100.0038.02
Very important 21423.4144.31
70076.5946.17
914100.0045.72
Fairly important 8533.3317.60
17066.6711.21
255100.0012.75
Not very important
2535.715.18
4564.292.97
70100.00
3.50Total 483
24.16100.00
151675.84
100.00
1999100.00100.00
Whereas 39.64 of those working full time consider ‘a secure job’ to be ‘essential’, only 32.94 percent of those not working full time are of the same opinion. Further, whereas 46.17 percent of those working full time consider ‘a secure job’ to be ‘very important’, only 44.31 percent of those not working full time have this same opinion. Whereas 11.21 percent of those working full time consider ‘a secure job’ to be only ‘fairly important’, the corresponding percentage for those not working full time is higher, at 17.60.
60
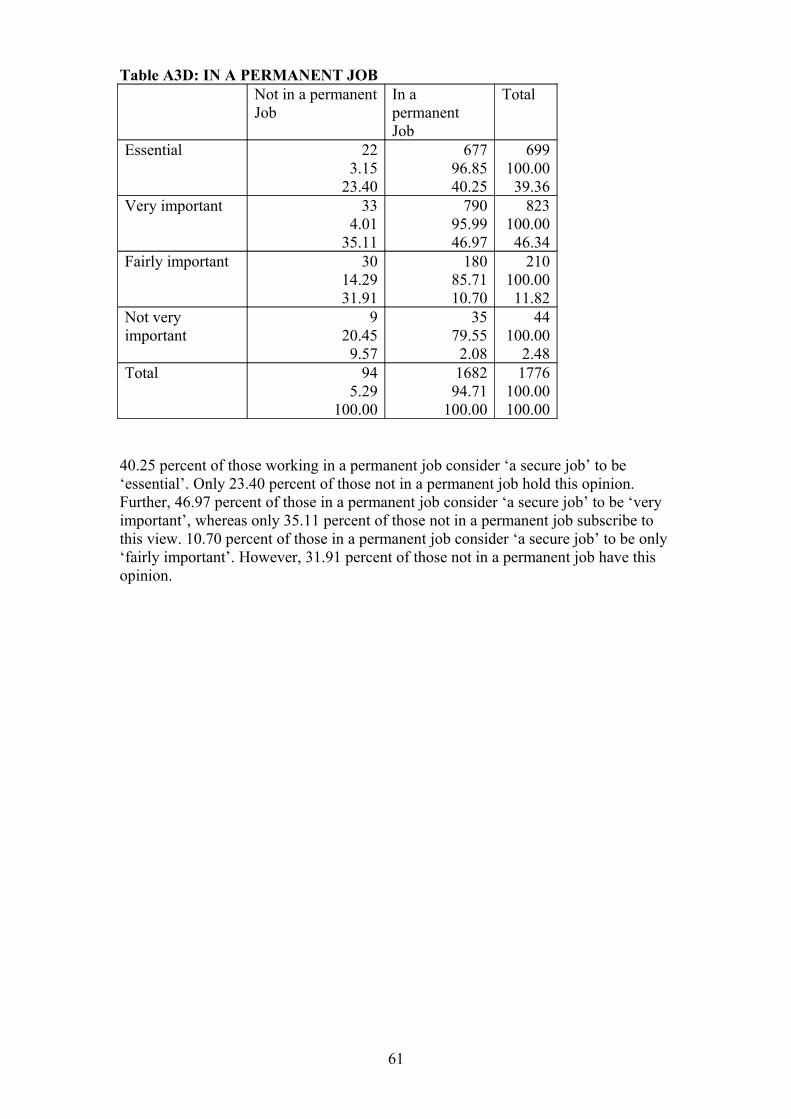
Table A3D: IN A PERMANENT JOBNot in a permanentJob
In a permanentJob
Total
Essential 223.15
23.40
67796.8540.25
699100.0039.36
Very important 334.01
35.11
79095.9946.97
823100.0046.34
Fairly important 3014.2931.91
18085.7110.70
210100.0011.82
Not very important
920.459.57
3579.552.08
44100.00
2.48Total 94
5.29100.00
168294.71
100.00
1776100.00100.00
40.25 percent of those working in a permanent job consider ‘a secure job’ to be ‘essential’. Only 23.40 percent of those not in a permanent job hold this opinion. Further, 46.97 percent of those in a permanent job consider ‘a secure job’ to be ‘very important’, whereas only 35.11 percent of those not in a permanent job subscribe to this view. 10.70 percent of those in a permanent job consider ‘a secure job’ to be only ‘fairly important’. However, 31.91 percent of those not in a permanent job have this opinion.
61
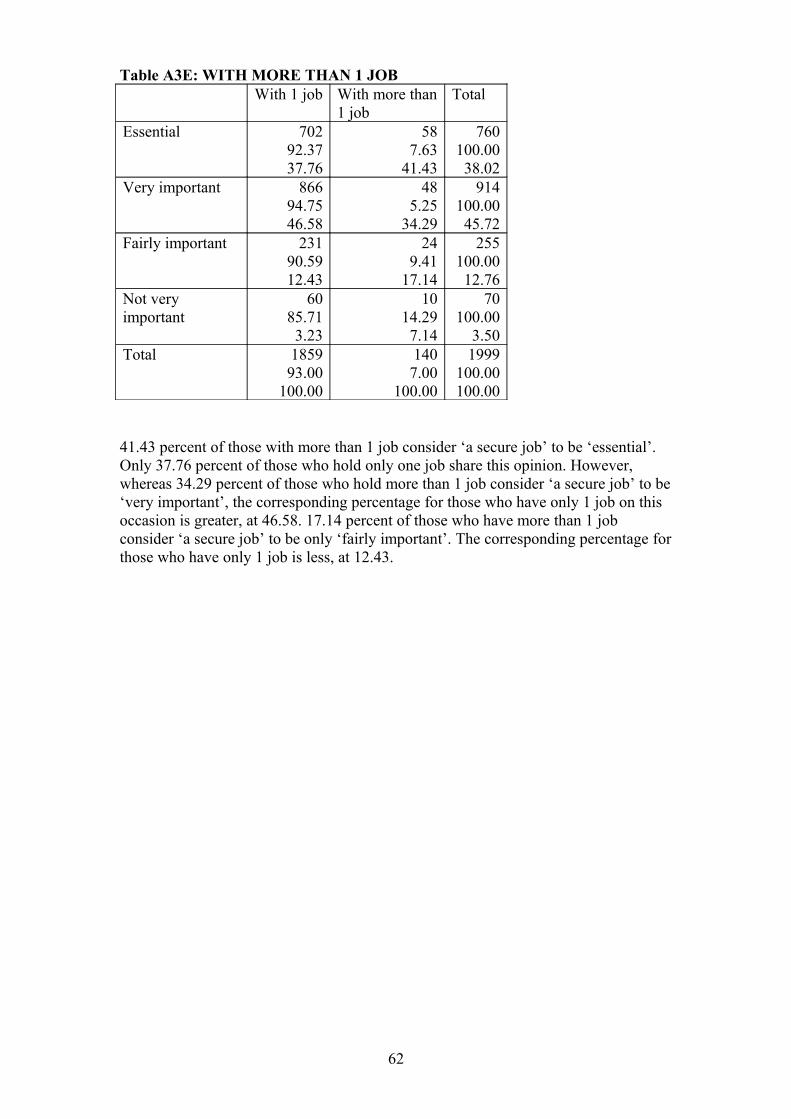
Table A3E: WITH MORE THAN 1 JOBWith 1 job With more than
1 jobTotal
Essential 70292.3737.76
587.63
41.43
760100.0038.02
Very important 86694.7546.58
485.25
34.29
914100.0045.72
Fairly important 23190.5912.43
249.41
17.14
255100.0012.76
Not very important
6085.713.23
1014.297.14
70100.00
3.50Total 1859
93.00100.00
1407.00
100.00
1999100.00100.00
41.43 percent of those with more than 1 job consider ‘a secure job’ to be ‘essential’. Only 37.76 percent of those who hold only one job share this opinion. However, whereas 34.29 percent of those who hold more than 1 job consider ‘a secure job’ to be ‘very important’, the corresponding percentage for those who have only 1 job on this occasion is greater, at 46.58. 17.14 percent of those who have more than 1 job consider ‘a secure job’ to be only ‘fairly important’. The corresponding percentage for those who have only 1 job is less, at 12.43.
62
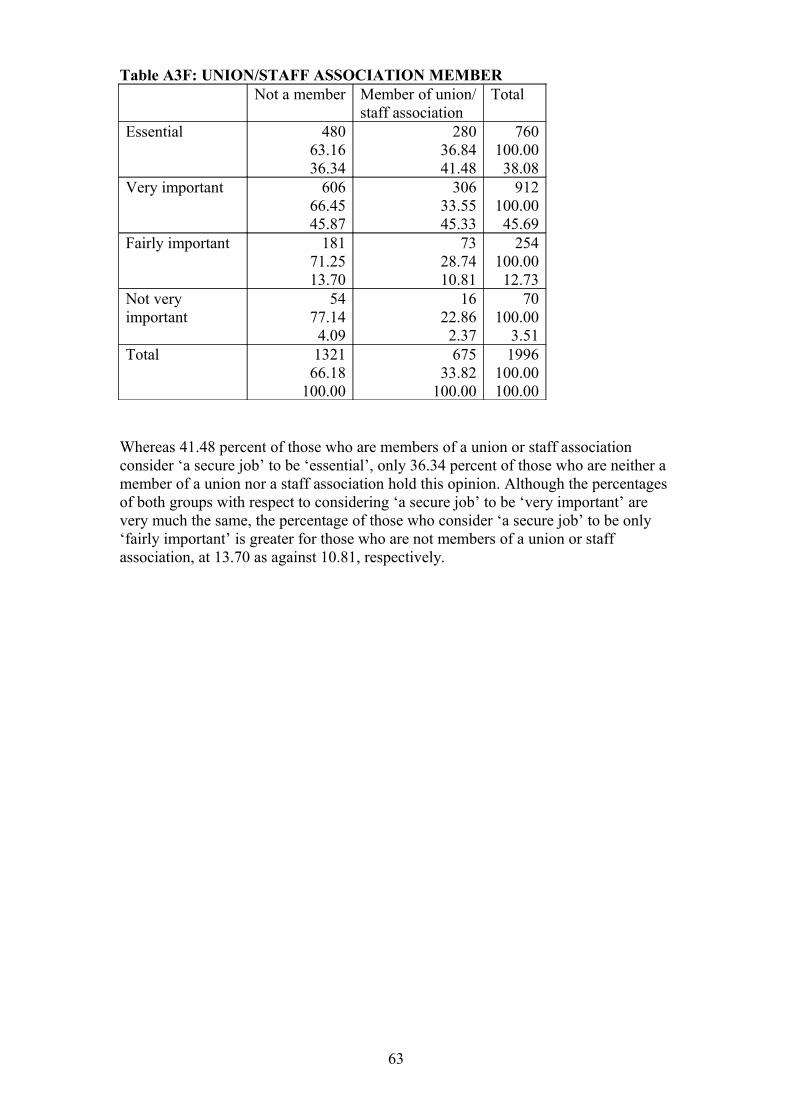
Table A3F: UNION/STAFF ASSOCIATION MEMBERNot a member Member of union/
staff associationTotal
Essential 48063.1636.34
28036.8441.48
760100.0038.08
Very important 60666.4545.87
30633.5545.33
912100.0045.69
Fairly important 18171.2513.70
7328.7410.81
254100.0012.73
Not very important
5477.144.09
1622.862.37
70100.00
3.51Total 1321
66.18100.00
67533.82
100.00
1996100.00100.00
Whereas 41.48 percent of those who are members of a union or staff association consider ‘a secure job’ to be ‘essential’, only 36.34 percent of those who are neither a member of a union nor a staff association hold this opinion. Although the percentages of both groups with respect to considering ‘a secure job’ to be ‘very important’ are very much the same, the percentage of those who consider ‘a secure job’ to be only ‘fairly important’ is greater for those who are not members of a union or staff association, at 13.70 as against 10.81, respectively.
63
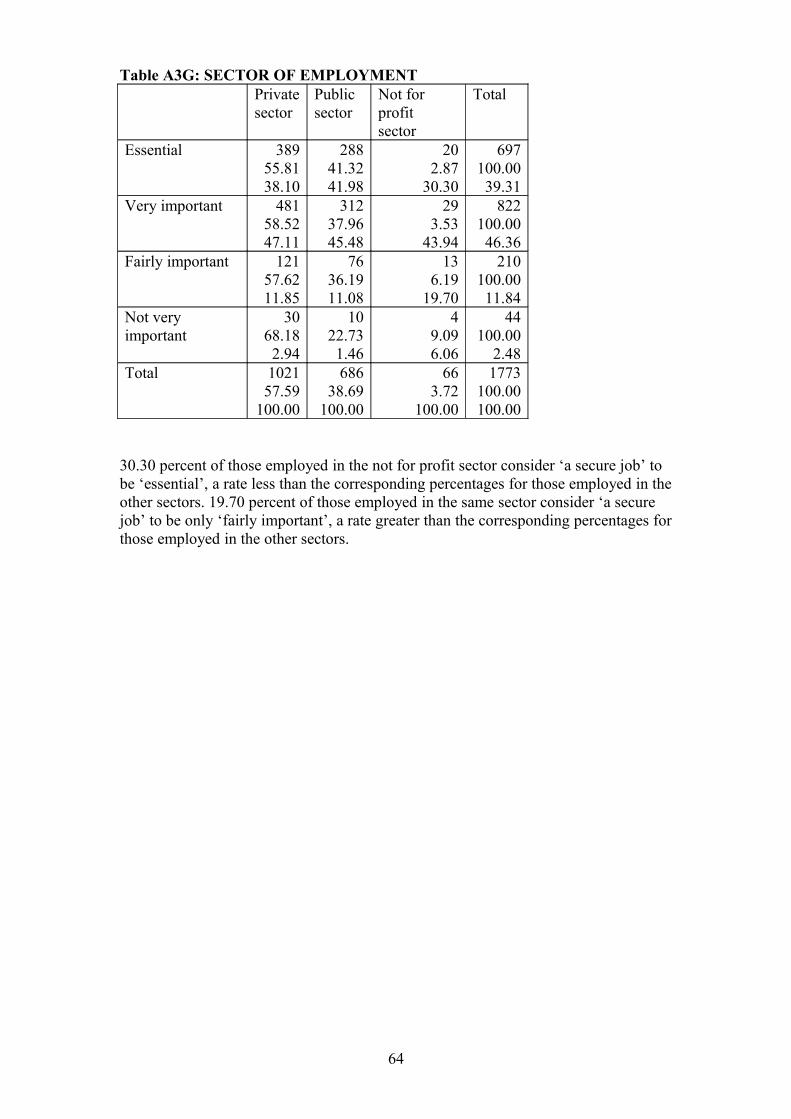
Table A3G: SECTOR OF EMPLOYMENTPrivatesector
Publicsector
Not for profitsector
Total
Essential 38955.8138.10
28841.3241.98
202.87
30.30
697100.0039.31
Very important 48158.5247.11
31237.9645.48
293.53
43.94
822100.0046.36
Fairly important 12157.6211.85
7636.1911.08
136.19
19.70
210100.0011.84
Not very important
3068.182.94
1022.731.46
49.096.06
44100.00
2.48Total 1021
57.59100.00
68638.69
100.00
663.72
100.00
1773100.00100.00
30.30 percent of those employed in the not for profit sector consider ‘a secure job’ to be ‘essential’, a rate less than the corresponding percentages for those employed in the other sectors. 19.70 percent of those employed in the same sector consider ‘a secure job’ to be only ‘fairly important’, a rate greater than the corresponding percentages for those employed in the other sectors.
64
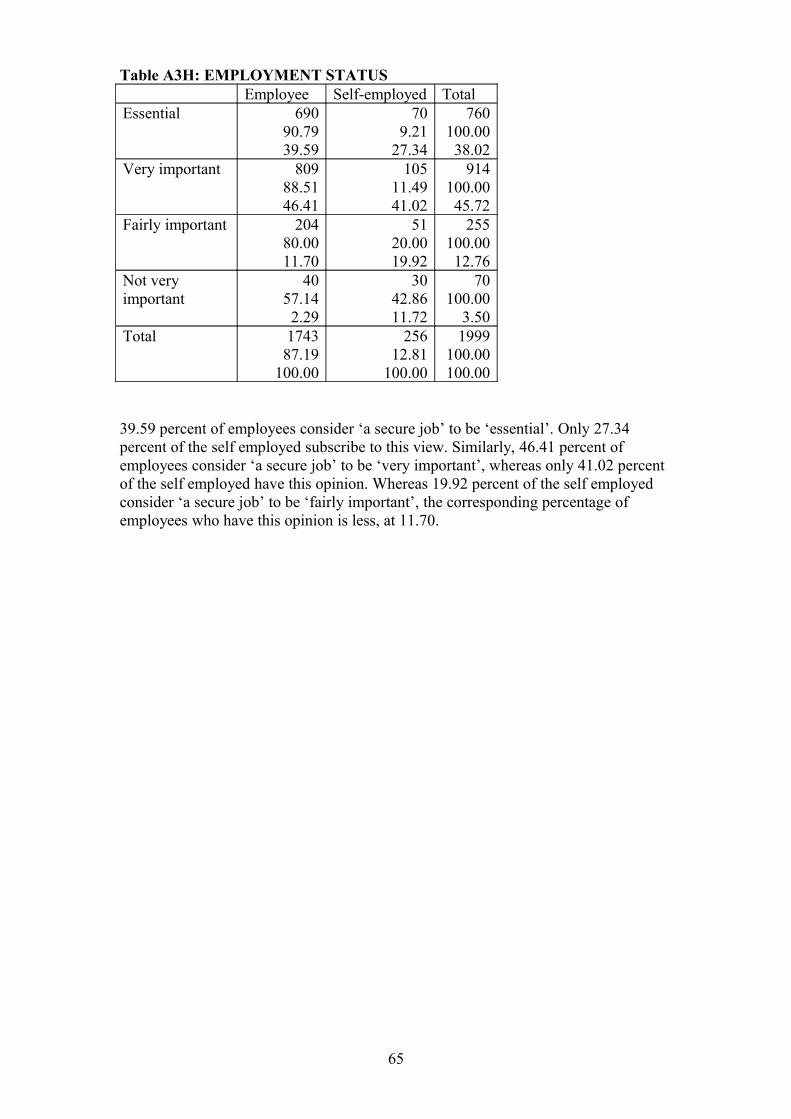
Table A3H: EMPLOYMENT STATUSEmployee Self-employed Total
Essential 69090.7939.59
709.21
27.34
760100.0038.02
Very important 80988.5146.41
10511.4941.02
914100.0045.72
Fairly important 20480.0011.70
5120.0019.92
255100.0012.76
Not very important
4057.142.29
3042.8611.72
70100.00
3.50Total 1743
87.19100.00
25612.81
100.00
1999100.00100.00
39.59 percent of employees consider ‘a secure job’ to be ‘essential’. Only 27.34 percent of the self employed subscribe to this view. Similarly, 46.41 percent of employees consider ‘a secure job’ to be ‘very important’, whereas only 41.02 percent of the self employed have this opinion. Whereas 19.92 percent of the self employed consider ‘a secure job’ to be ‘fairly important’, the corresponding percentage of employees who have this opinion is less, at 11.70.
65
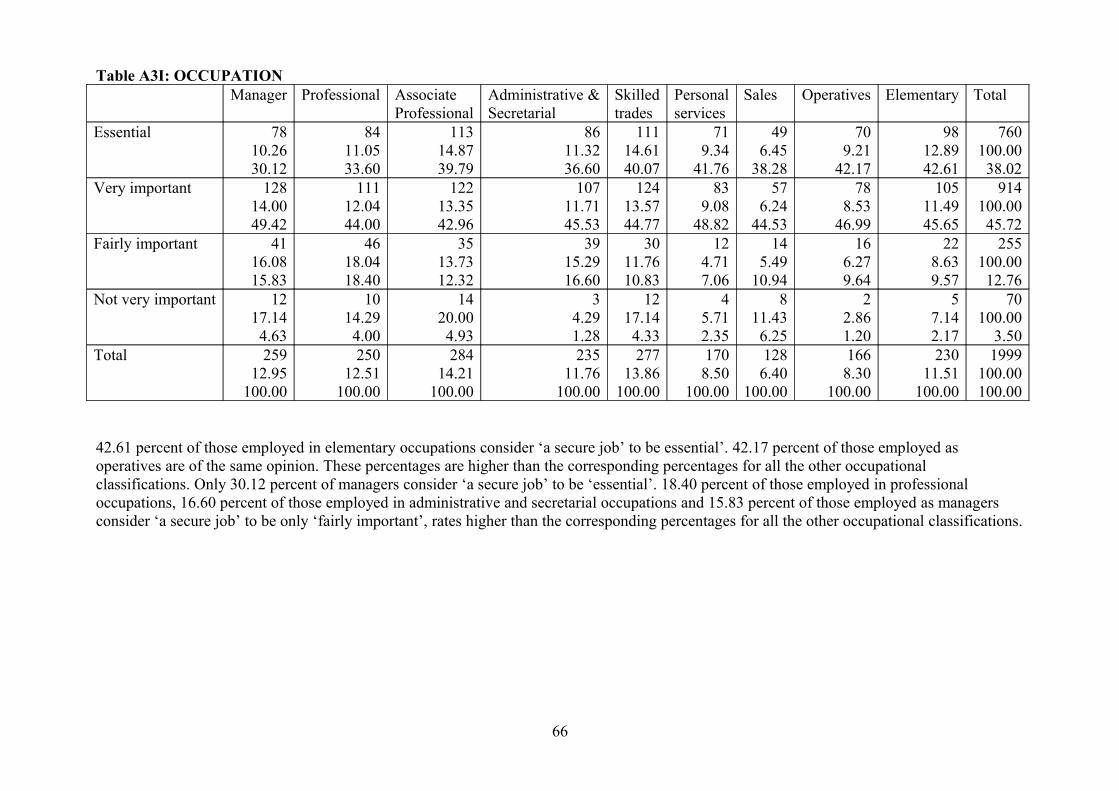
Table A3I: OCCUPATIONManager Professional Associate
ProfessionalAdministrative &Secretarial
Skilledtrades
Personal services
Sales Operatives Elementary Total
Essential 7810.2630.12
8411.0533.60
11314.8739.79
8611.3236.60
11114.6140.07
719.34
41.76
496.45
38.28
709.21
42.17
9812.8942.61
760100.0038.02
Very important 12814.0049.42
11112.0444.00
12213.3542.96
10711.7145.53
12413.5744.77
839.08
48.82
576.24
44.53
788.53
46.99
10511.4945.65
914100.0045.72
Fairly important 4116.0815.83
4618.0418.40
3513.7312.32
3915.2916.60
3011.7610.83
124.717.06
145.49
10.94
166.279.64
228.639.57
255100.0012.76
Not very important 1217.144.63
1014.294.00
1420.004.93
34.291.28
1217.144.33
45.712.35
811.436.25
22.861.20
57.142.17
70100.00
3.50Total 259
12.95100.00
25012.51
100.00
28414.21
100.00
23511.76
100.00
27713.86
100.00
1708.50
100.00
1286.40
100.00
1668.30
100.00
23011.51
100.00
1999100.00100.00
42.61 percent of those employed in elementary occupations consider ‘a secure job’ to be essential’. 42.17 percent of those employed as operatives are of the same opinion. These percentages are higher than the corresponding percentages for all the other occupational classifications. Only 30.12 percent of managers consider ‘a secure job’ to be ‘essential’. 18.40 percent of those employed in professional occupations, 16.60 percent of those employed in administrative and secretarial occupations and 15.83 percent of those employed as managers consider ‘a secure job’ to be only ‘fairly important’, rates higher than the corresponding percentages for all the other occupational classifications.
66
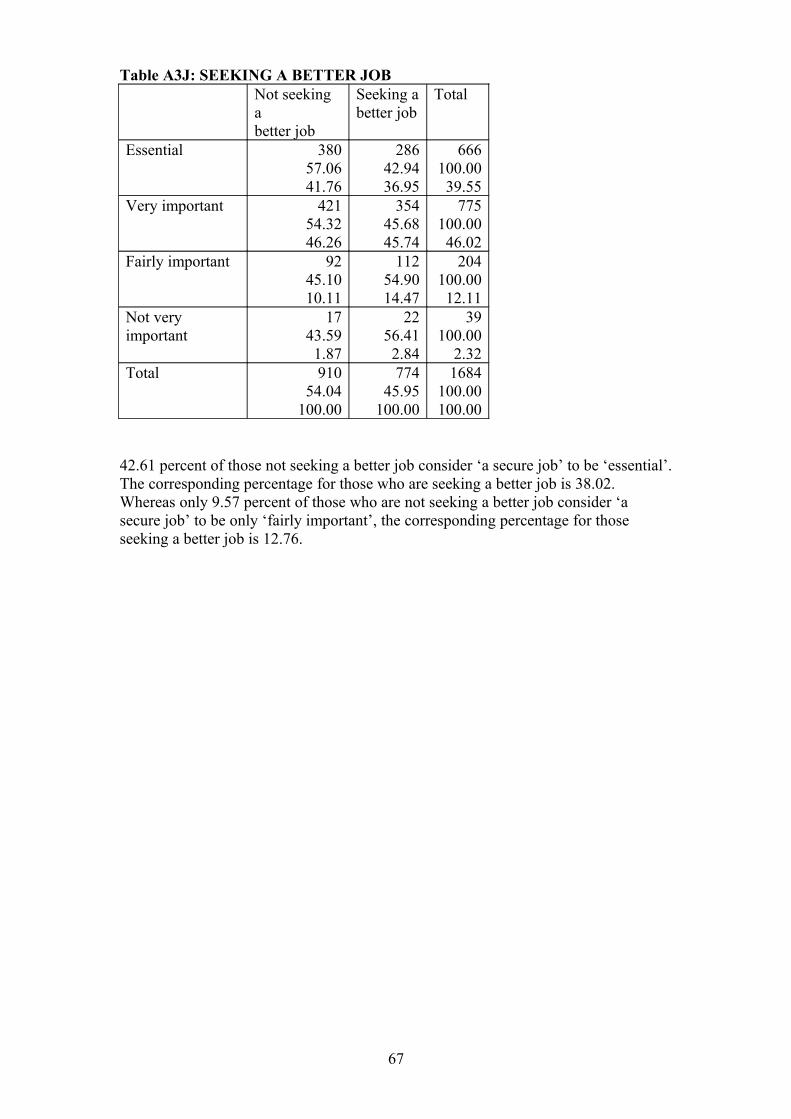
Table A3J: SEEKING A BETTER JOBNot seeking abetter job
Seeking a better job
Total
Essential 38057.0641.76
28642.9436.95
666100.0039.55
Very important 42154.3246.26
35445.6845.74
775100.0046.02
Fairly important 9245.1010.11
11254.9014.47
204100.0012.11
Not very important
1743.591.87
2256.412.84
39100.00
2.32Total 910
54.04100.00
77445.95
100.00
1684100.00100.00
42.61 percent of those not seeking a better job consider ‘a secure job’ to be ‘essential’. The corresponding percentage for those who are seeking a better job is 38.02. Whereas only 9.57 percent of those who are not seeking a better job consider ‘a secure job’ to be only ‘fairly important’, the corresponding percentage for those seeking a better job is 12.76.
67
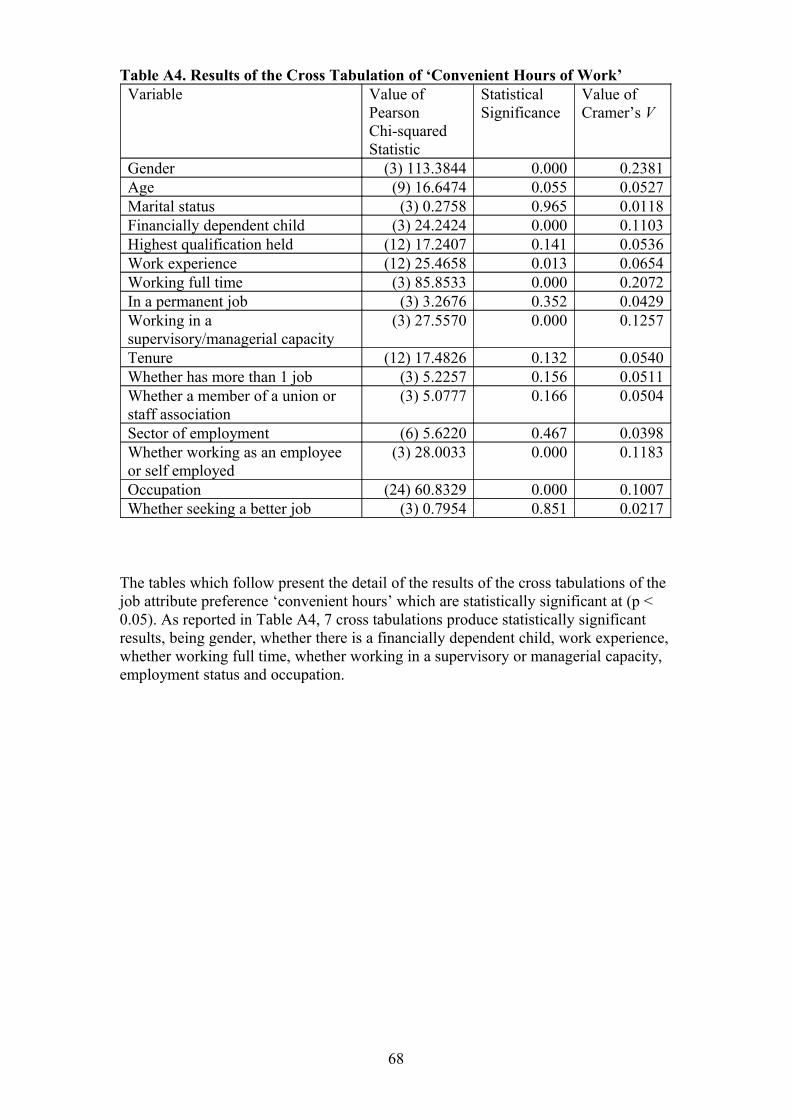
Table A4. Results of the Cross Tabulation of ‘Convenient Hours of Work’Variable Value of
Pearson Chi-squared Statistic
StatisticalSignificance
Value of Cramer’s V
Gender (3) 113.3844 0.000 0.2381Age (9) 16.6474 0.055 0.0527Marital status (3) 0.2758 0.965 0.0118Financially dependent child (3) 24.2424 0.000 0.1103Highest qualification held (12) 17.2407 0.141 0.0536Work experience (12) 25.4658 0.013 0.0654Working full time (3) 85.8533 0.000 0.2072In a permanent job (3) 3.2676 0.352 0.0429Working in a supervisory/managerial capacity
(3) 27.5570 0.000 0.1257
Tenure (12) 17.4826 0.132 0.0540Whether has more than 1 job (3) 5.2257 0.156 0.0511Whether a member of a union or staff association
(3) 5.0777 0.166 0.0504
Sector of employment (6) 5.6220 0.467 0.0398Whether working as an employee or self employed
(3) 28.0033 0.000 0.1183
Occupation (24) 60.8329 0.000 0.1007Whether seeking a better job (3) 0.7954 0.851 0.0217
The tables which follow present the detail of the results of the cross tabulations of the job attribute preference ‘convenient hours’ which are statistically significant at (p < 0.05). As reported in Table A4, 7 cross tabulations produce statistically significant results, being gender, whether there is a financially dependent child, work experience, whether working full time, whether working in a supervisory or managerial capacity, employment status and occupation.
68
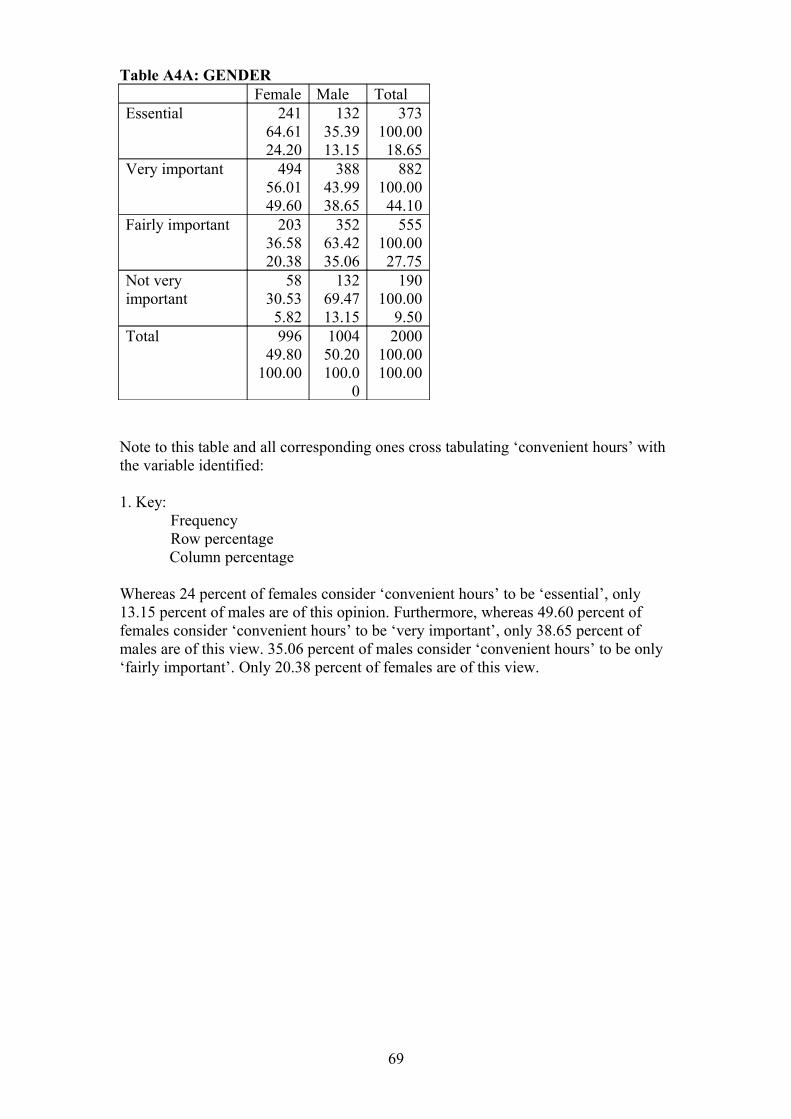
Table A4A: GENDERFemale Male Total
Essential 24164.6124.20
13235.3913.15
373100.0018.65
Very important 49456.0149.60
38843.9938.65
882100.0044.10
Fairly important 20336.5820.38
35263.4235.06
555100.0027.75
Not very important
5830.535.82
13269.4713.15
190100.00
9.50Total 996
49.80100.00
100450.20100.0
0
2000100.00100.00
Note to this table and all corresponding ones cross tabulating ‘convenient hours’ with the variable identified:
1. Key:FrequencyRow percentageColumn percentage
Whereas 24 percent of females consider ‘convenient hours’ to be ‘essential’, only 13.15 percent of males are of this opinion. Furthermore, whereas 49.60 percent of females consider ‘convenient hours’ to be ‘very important’, only 38.65 percent of males are of this view. 35.06 percent of males consider ‘convenient hours’ to be only ‘fairly important’. Only 20.38 percent of females are of this view.
69
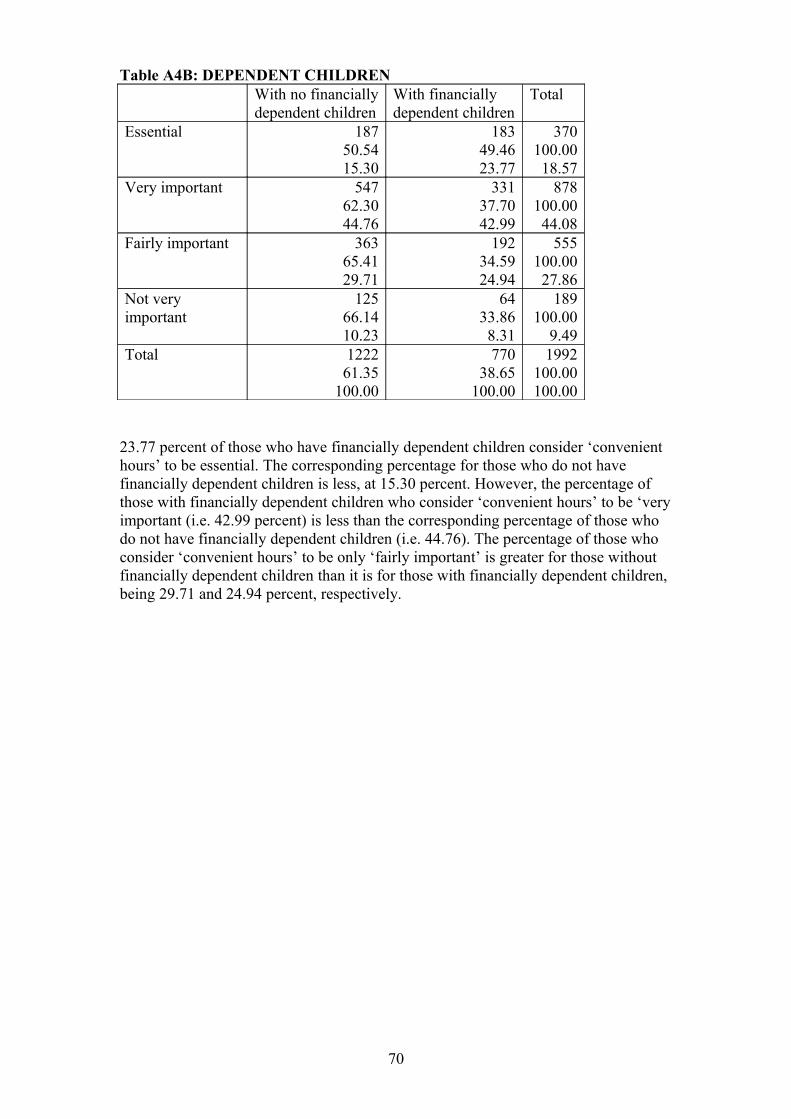
Table A4B: DEPENDENT CHILDRENWith no financiallydependent children
With financiallydependent children
Total
Essential 18750.5415.30
18349.4623.77
370100.0018.57
Very important 54762.3044.76
33137.7042.99
878100.0044.08
Fairly important 36365.4129.71
19234.5924.94
555100.0027.86
Not very important
12566.1410.23
6433.868.31
189100.00
9.49Total 1222
61.35100.00
77038.65
100.00
1992100.00100.00
23.77 percent of those who have financially dependent children consider ‘convenient hours’ to be essential. The corresponding percentage for those who do not have financially dependent children is less, at 15.30 percent. However, the percentage of those with financially dependent children who consider ‘convenient hours’ to be ‘very important (i.e. 42.99 percent) is less than the corresponding percentage of those who do not have financially dependent children (i.e. 44.76). The percentage of those who consider ‘convenient hours’ to be only ‘fairly important’ is greater for those without financially dependent children than it is for those with financially dependent children, being 29.71 and 24.94 percent, respectively.
70
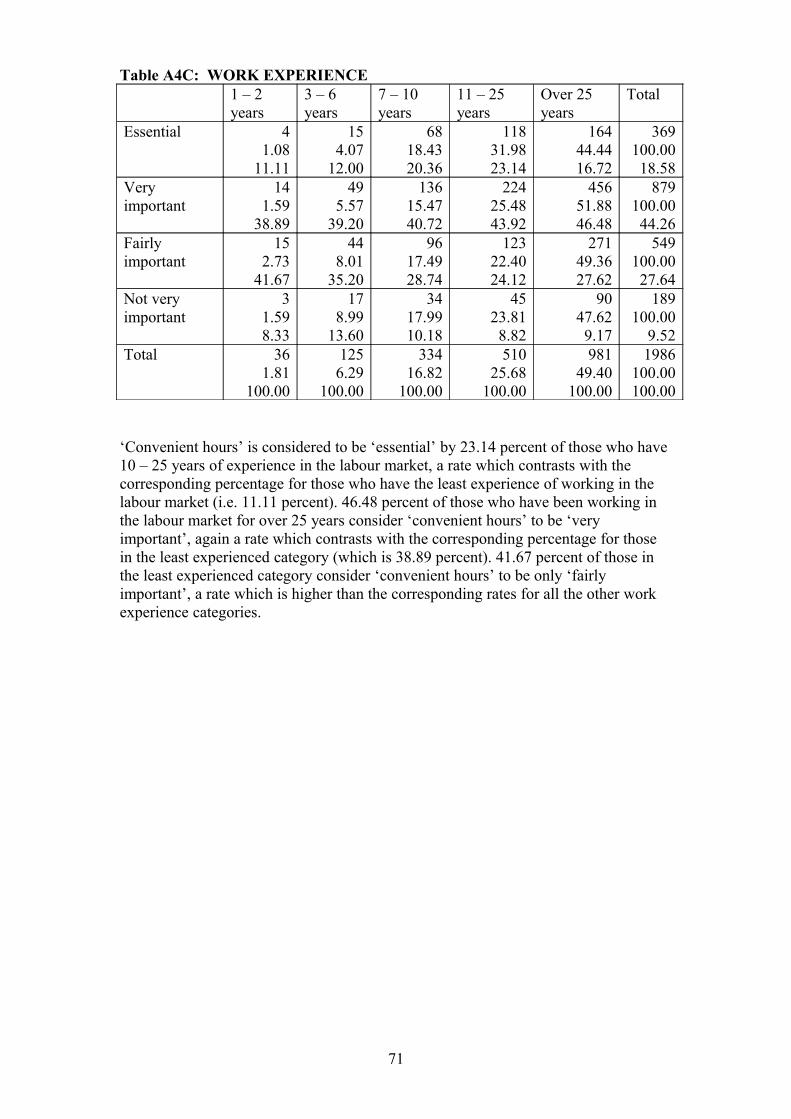
Table A4C: WORK EXPERIENCE1 – 2 years
3 – 6 years
7 – 10 years
11 – 25 years
Over 25 years
Total
Essential 41.08
11.11
154.07
12.00
6818.4320.36
11831.9823.14
16444.4416.72
369100.0018.58
Very important
141.59
38.89
495.57
39.20
13615.4740.72
22425.4843.92
45651.8846.48
879100.0044.26
Fairly important
152.73
41.67
448.01
35.20
9617.4928.74
12322.4024.12
27149.3627.62
549100.0027.64
Not very important
31.598.33
178.99
13.60
3417.9910.18
4523.818.82
9047.629.17
189100.00
9.52Total 36
1.81100.00
1256.29
100.00
33416.82
100.00
51025.68
100.00
98149.40
100.00
1986100.00100.00
‘Convenient hours’ is considered to be ‘essential’ by 23.14 percent of those who have 10 – 25 years of experience in the labour market, a rate which contrasts with the corresponding percentage for those who have the least experience of working in the labour market (i.e. 11.11 percent). 46.48 percent of those who have been working in the labour market for over 25 years consider ‘convenient hours’ to be ‘very important’, again a rate which contrasts with the corresponding percentage for those in the least experienced category (which is 38.89 percent). 41.67 percent of those in the least experienced category consider ‘convenient hours’ to be only ‘fairly important’, a rate which is higher than the corresponding rates for all the other work experience categories.
71
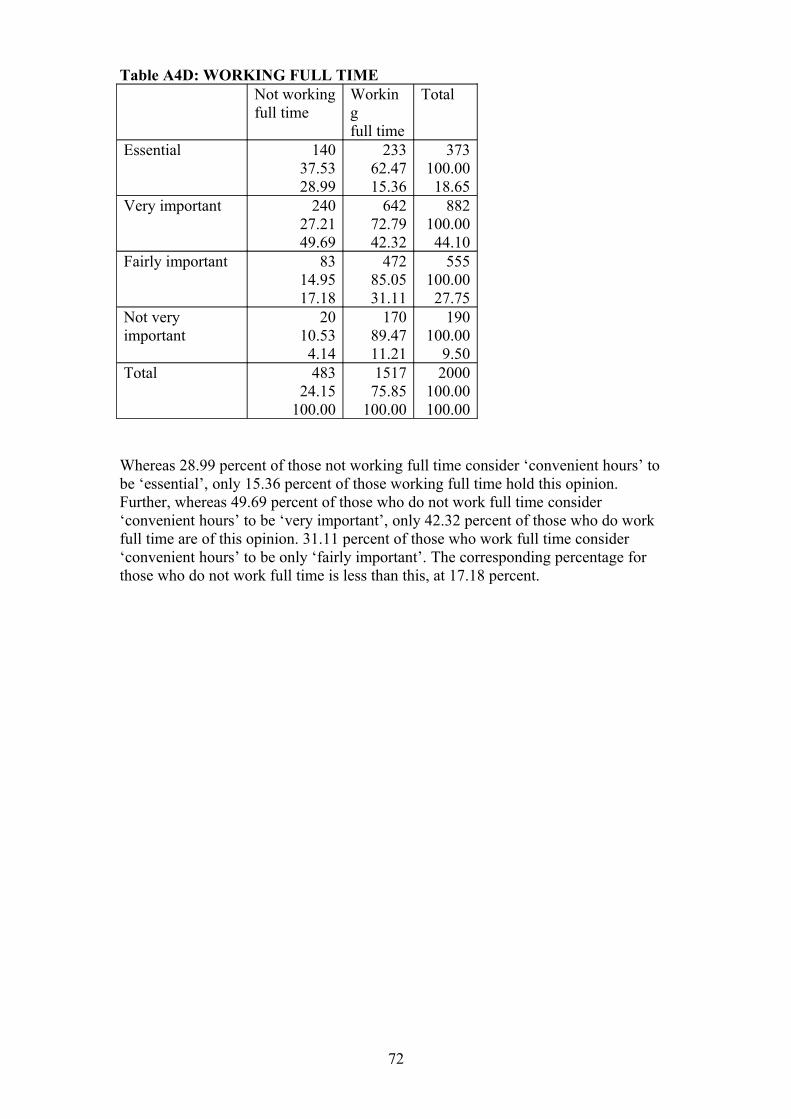
Table A4D: WORKING FULL TIMENot workingfull time
Workingfull time
Total
Essential 14037.5328.99
23362.4715.36
373100.0018.65
Very important 24027.2149.69
64272.7942.32
882100.0044.10
Fairly important 8314.9517.18
47285.0531.11
555100.0027.75
Not very important
2010.534.14
17089.4711.21
190100.00
9.50Total 483
24.15100.00
151775.85
100.00
2000100.00100.00
Whereas 28.99 percent of those not working full time consider ‘convenient hours’ to be ‘essential’, only 15.36 percent of those working full time hold this opinion. Further, whereas 49.69 percent of those who do not work full time consider ‘convenient hours’ to be ‘very important’, only 42.32 percent of those who do work full time are of this opinion. 31.11 percent of those who work full time consider ‘convenient hours’ to be only ‘fairly important’. The corresponding percentage for those who do not work full time is less than this, at 17.18 percent.
72
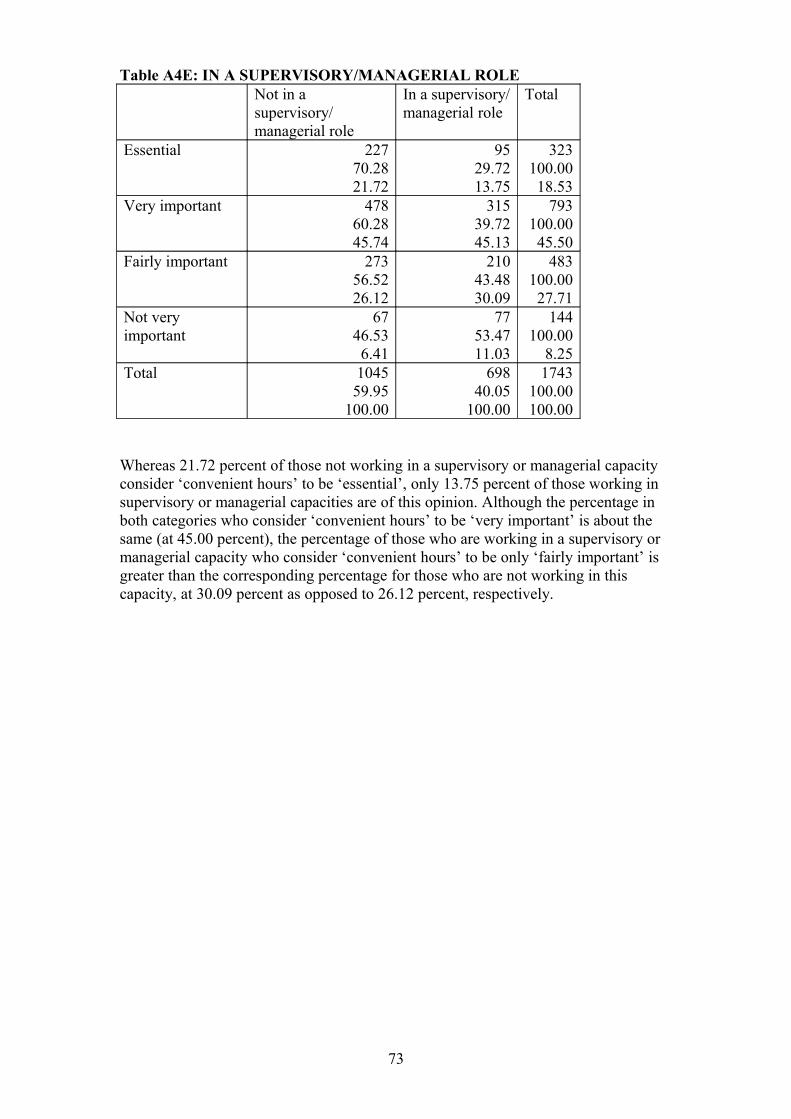
Table A4E: IN A SUPERVISORY/MANAGERIAL ROLENot in a supervisory/managerial role
In a supervisory/managerial role
Total
Essential 22770.2821.72
9529.7213.75
323100.0018.53
Very important 47860.2845.74
31539.7245.13
793100.0045.50
Fairly important 27356.5226.12
21043.4830.09
483100.0027.71
Not very important
6746.536.41
7753.4711.03
144100.00
8.25Total 1045
59.95100.00
69840.05
100.00
1743100.00100.00
Whereas 21.72 percent of those not working in a supervisory or managerial capacity consider ‘convenient hours’ to be ‘essential’, only 13.75 percent of those working in supervisory or managerial capacities are of this opinion. Although the percentage in both categories who consider ‘convenient hours’ to be ‘very important’ is about the same (at 45.00 percent), the percentage of those who are working in a supervisory or managerial capacity who consider ‘convenient hours’ to be only ‘fairly important’ is greater than the corresponding percentage for those who are not working in this capacity, at 30.09 percent as opposed to 26.12 percent, respectively.
73
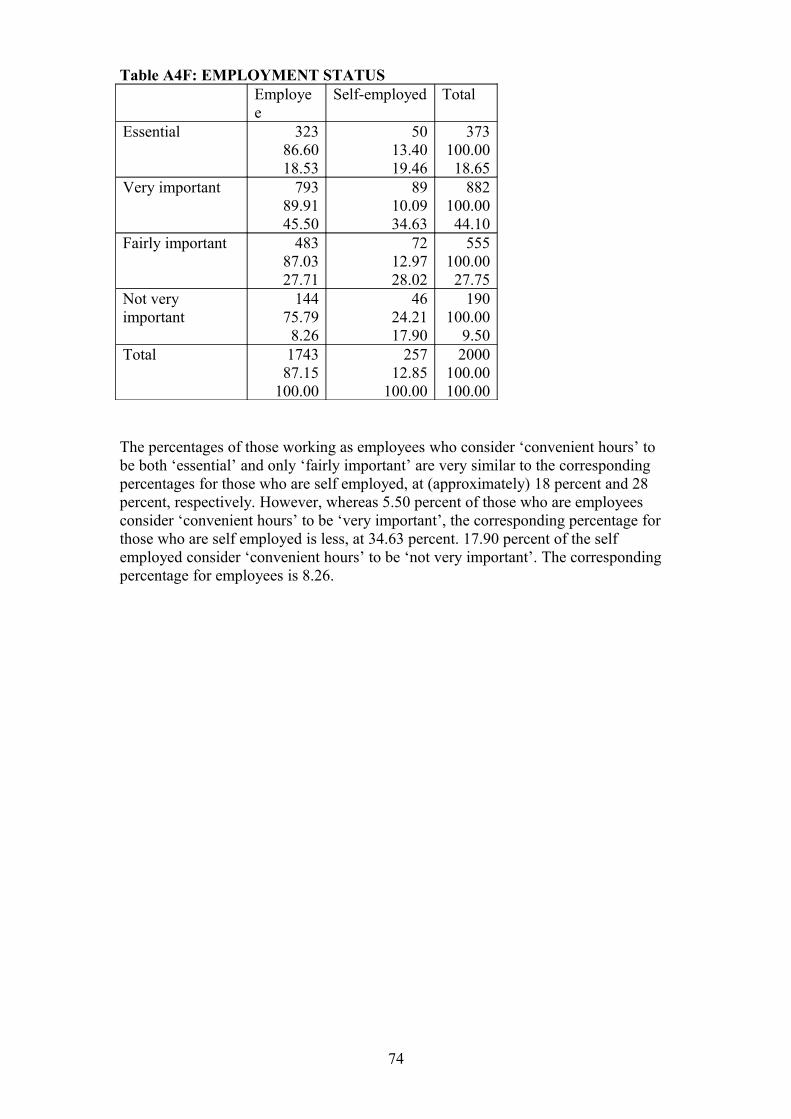
Table A4F: EMPLOYMENT STATUSEmployee
Self-employed Total
Essential 32386.6018.53
5013.4019.46
373100.0018.65
Very important 79389.9145.50
8910.0934.63
882100.0044.10
Fairly important 48387.0327.71
7212.9728.02
555100.0027.75
Not very important
14475.798.26
4624.2117.90
190100.00
9.50Total 1743
87.15100.00
25712.85
100.00
2000100.00100.00
The percentages of those working as employees who consider ‘convenient hours’ to be both ‘essential’ and only ‘fairly important’ are very similar to the corresponding percentages for those who are self employed, at (approximately) 18 percent and 28 percent, respectively. However, whereas 5.50 percent of those who are employees consider ‘convenient hours’ to be ‘very important’, the corresponding percentage for those who are self employed is less, at 34.63 percent. 17.90 percent of the self employed consider ‘convenient hours’ to be ‘not very important’. The corresponding percentage for employees is 8.26.
74
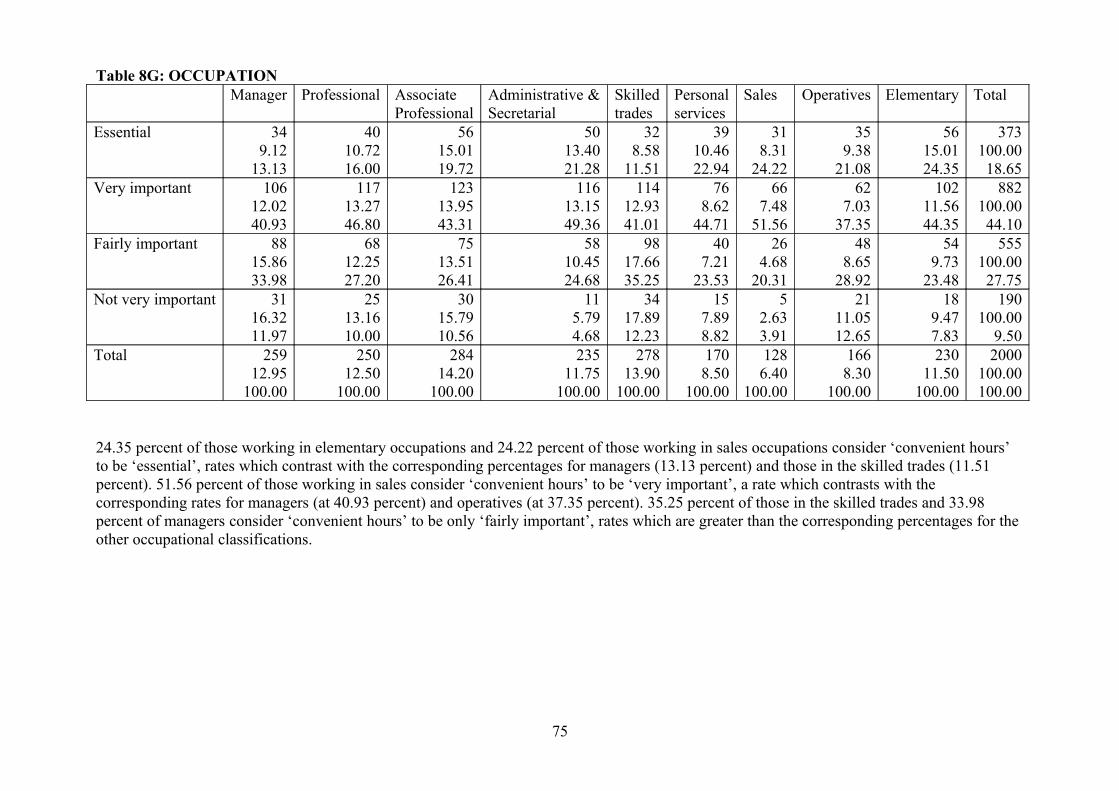
Table 8G: OCCUPATIONManager Professional Associate
ProfessionalAdministrative &Secretarial
Skilledtrades
Personal services
Sales Operatives Elementary Total
Essential 349.12
13.13
4010.7216.00
5615.0119.72
5013.4021.28
328.58
11.51
3910.4622.94
318.31
24.22
359.38
21.08
5615.0124.35
373100.0018.65
Very important 10612.0240.93
11713.2746.80
12313.9543.31
11613.1549.36
11412.9341.01
768.62
44.71
667.48
51.56
627.03
37.35
10211.5644.35
882100.0044.10
Fairly important 8815.8633.98
6812.2527.20
7513.5126.41
5810.4524.68
9817.6635.25
407.21
23.53
264.68
20.31
488.65
28.92
549.73
23.48
555100.0027.75
Not very important 3116.3211.97
2513.1610.00
3015.7910.56
115.794.68
3417.8912.23
157.898.82
52.633.91
2111.0512.65
189.477.83
190100.00
9.50Total 259
12.95100.00
25012.50
100.00
28414.20
100.00
23511.75
100.00
27813.90
100.00
1708.50
100.00
1286.40
100.00
1668.30
100.00
23011.50
100.00
2000100.00100.00
24.35 percent of those working in elementary occupations and 24.22 percent of those working in sales occupations consider ‘convenient hours’ to be ‘essential’, rates which contrast with the corresponding percentages for managers (13.13 percent) and those in the skilled trades (11.51 percent). 51.56 percent of those working in sales consider ‘convenient hours’ to be ‘very important’, a rate which contrasts with the corresponding rates for managers (at 40.93 percent) and operatives (at 37.35 percent). 35.25 percent of those in the skilled trades and 33.98 percent of managers consider ‘convenient hours’ to be only ‘fairly important’, rates which are greater than the corresponding percentages for the other occupational classifications.
75
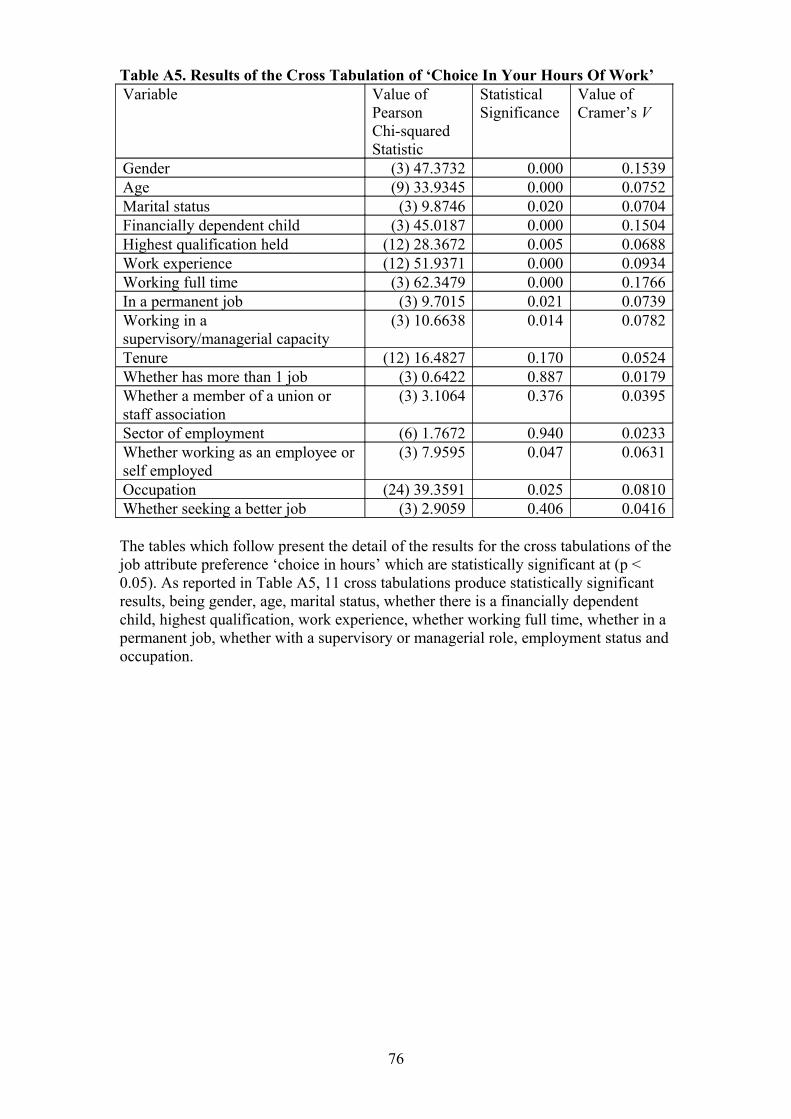
Table A5. Results of the Cross Tabulation of ‘Choice In Your Hours Of Work’Variable Value of
Pearson Chi-squared Statistic
StatisticalSignificance
Value of Cramer’s V
Gender (3) 47.3732 0.000 0.1539Age (9) 33.9345 0.000 0.0752Marital status (3) 9.8746 0.020 0.0704Financially dependent child (3) 45.0187 0.000 0.1504Highest qualification held (12) 28.3672 0.005 0.0688Work experience (12) 51.9371 0.000 0.0934Working full time (3) 62.3479 0.000 0.1766In a permanent job (3) 9.7015 0.021 0.0739Working in a supervisory/managerial capacity
(3) 10.6638 0.014 0.0782
Tenure (12) 16.4827 0.170 0.0524Whether has more than 1 job (3) 0.6422 0.887 0.0179Whether a member of a union or staff association
(3) 3.1064 0.376 0.0395
Sector of employment (6) 1.7672 0.940 0.0233Whether working as an employee or self employed
(3) 7.9595 0.047 0.0631
Occupation (24) 39.3591 0.025 0.0810Whether seeking a better job (3) 2.9059 0.406 0.0416 The tables which follow present the detail of the results for the cross tabulations of the job attribute preference ‘choice in hours’ which are statistically significant at (p < 0.05). As reported in Table A5, 11 cross tabulations produce statistically significant results, being gender, age, marital status, whether there is a financially dependent child, highest qualification, work experience, whether working full time, whether in a permanent job, whether with a supervisory or managerial role, employment status and occupation.
76
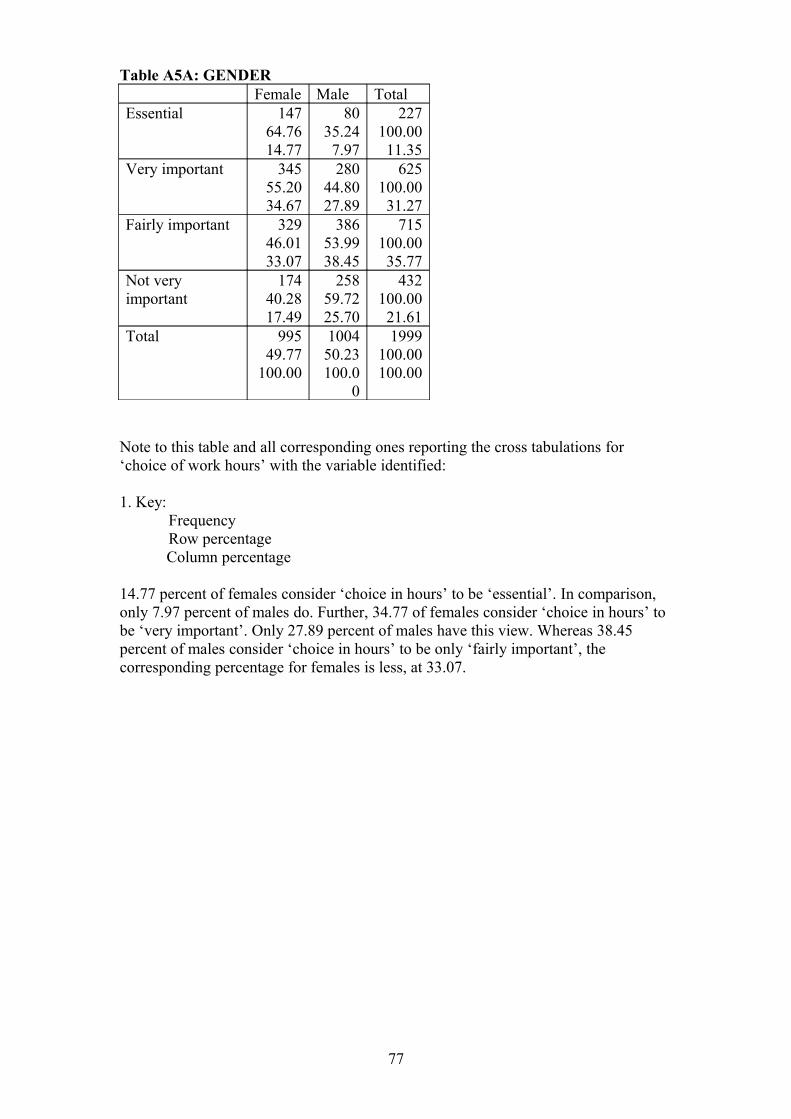
Table A5A: GENDERFemale Male Total
Essential 14764.7614.77
8035.247.97
227100.0011.35
Very important 34555.2034.67
28044.8027.89
625100.0031.27
Fairly important 32946.0133.07
38653.9938.45
715100.0035.77
Not very important
17440.2817.49
25859.7225.70
432100.0021.61
Total 99549.77
100.00
100450.23100.0
0
1999100.00100.00
Note to this table and all corresponding ones reporting the cross tabulations for ‘choice of work hours’ with the variable identified:
1. Key:FrequencyRow percentageColumn percentage
14.77 percent of females consider ‘choice in hours’ to be ‘essential’. In comparison, only 7.97 percent of males do. Further, 34.77 of females consider ‘choice in hours’ to be ‘very important’. Only 27.89 percent of males have this view. Whereas 38.45 percent of males consider ‘choice in hours’ to be only ‘fairly important’, the corresponding percentage for females is less, at 33.07.
77
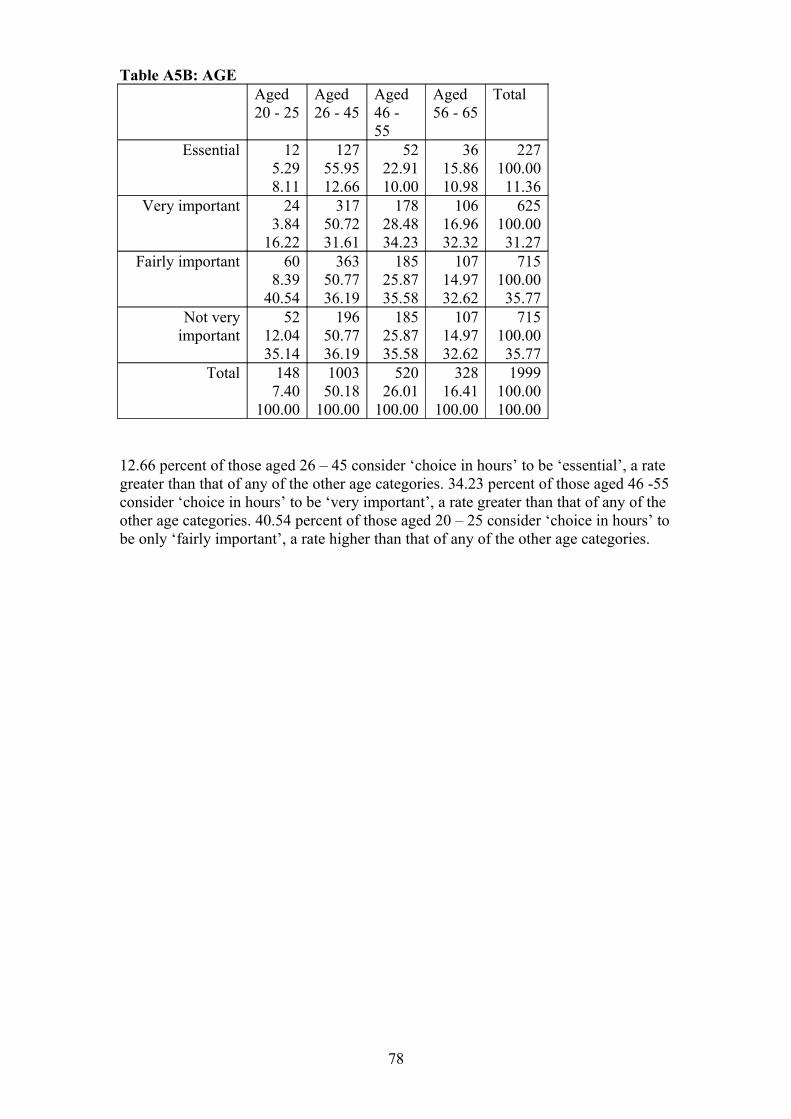
Table A5B: AGEAged20 - 25
Aged26 - 45
Aged46 - 55
Aged56 - 65
Total
Essential 125.298.11
12755.9512.66
5222.9110.00
3615.8610.98
227100.0011.36
Very important 243.84
16.22
31750.7231.61
17828.4834.23
10616.9632.32
625100.0031.27
Fairly important 608.39
40.54
36350.7736.19
18525.8735.58
10714.9732.62
715100.0035.77
Not very important
5212.0435.14
19650.7736.19
18525.8735.58
10714.9732.62
715100.0035.77
Total 1487.40
100.00
100350.18
100.00
52026.01
100.00
32816.41
100.00
1999100.00100.00
12.66 percent of those aged 26 – 45 consider ‘choice in hours’ to be ‘essential’, a rate greater than that of any of the other age categories. 34.23 percent of those aged 46 -55 consider ‘choice in hours’ to be ‘very important’, a rate greater than that of any of the other age categories. 40.54 percent of those aged 20 – 25 consider ‘choice in hours’ to be only ‘fairly important’, a rate higher than that of any of the other age categories.
78
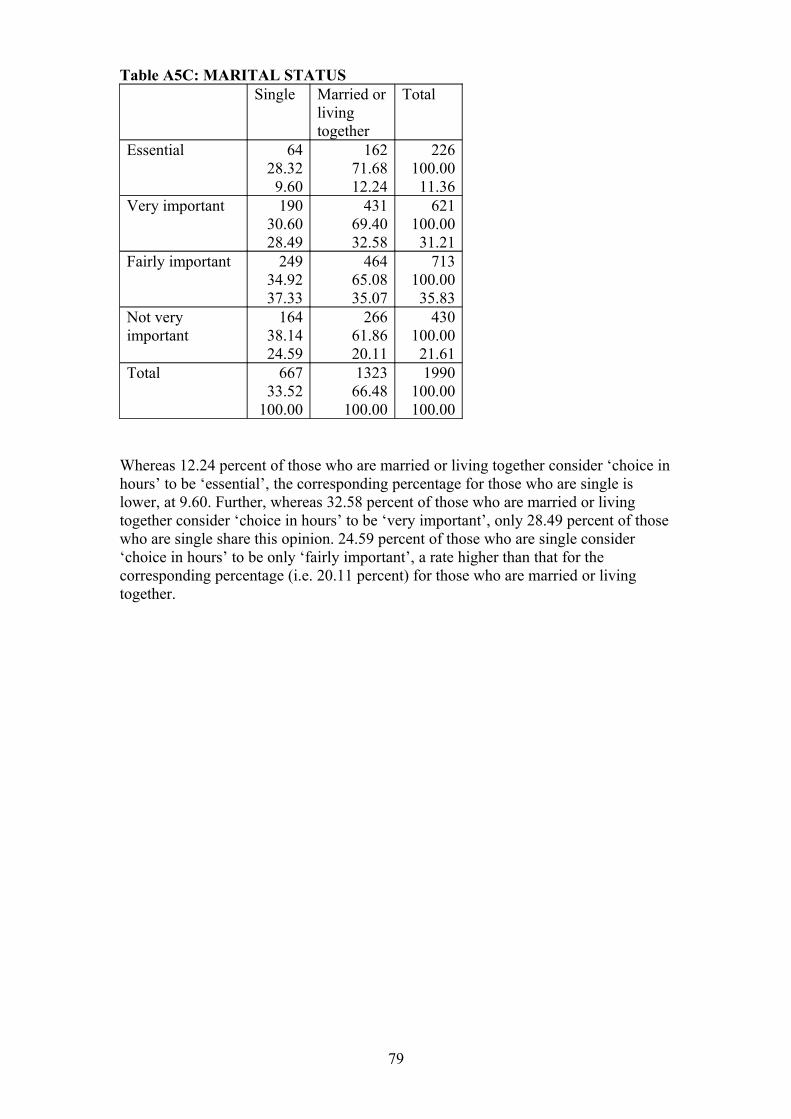
Table A5C: MARITAL STATUSSingle Married or
living together
Total
Essential 6428.329.60
16271.6812.24
226100.0011.36
Very important 19030.6028.49
43169.4032.58
621100.0031.21
Fairly important 24934.9237.33
46465.0835.07
713100.0035.83
Not very important
16438.1424.59
26661.8620.11
430100.0021.61
Total 66733.52
100.00
132366.48
100.00
1990100.00100.00
Whereas 12.24 percent of those who are married or living together consider ‘choice in hours’ to be ‘essential’, the corresponding percentage for those who are single is lower, at 9.60. Further, whereas 32.58 percent of those who are married or living together consider ‘choice in hours’ to be ‘very important’, only 28.49 percent of those who are single share this opinion. 24.59 percent of those who are single consider ‘choice in hours’ to be only ‘fairly important’, a rate higher than that for the corresponding percentage (i.e. 20.11 percent) for those who are married or living together.
79
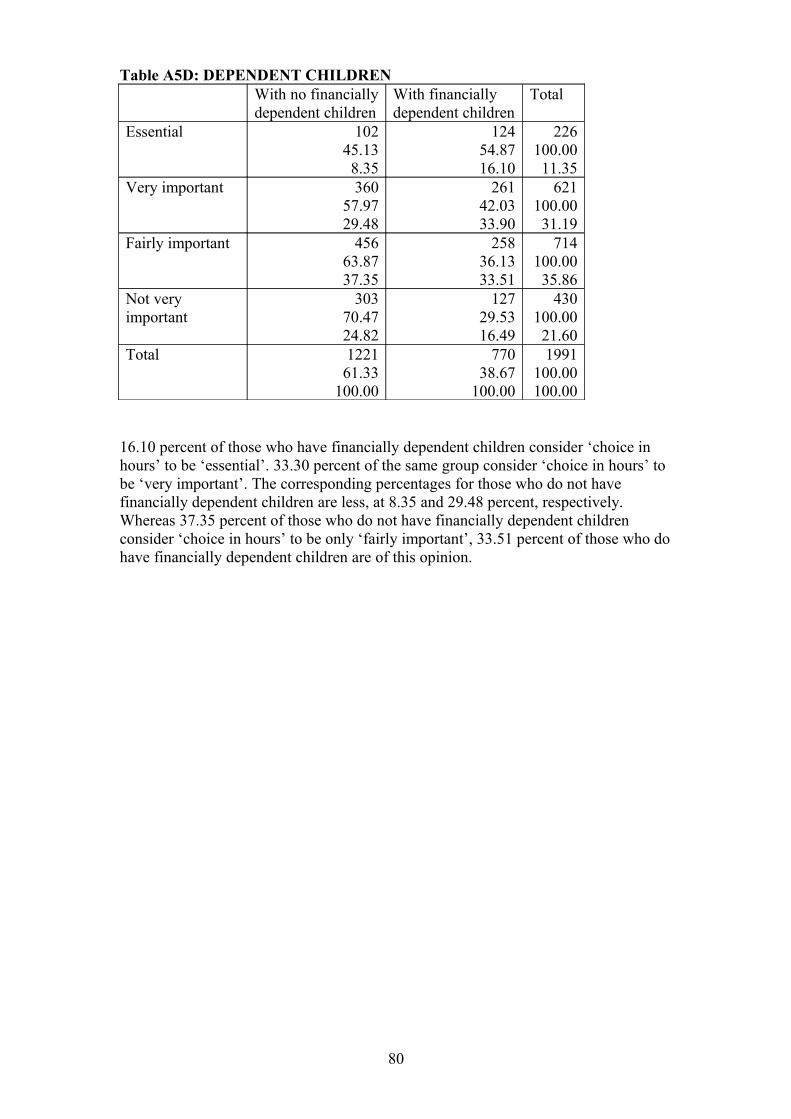
Table A5D: DEPENDENT CHILDRENWith no financiallydependent children
With financiallydependent children
Total
Essential 10245.138.35
12454.8716.10
226100.0011.35
Very important 36057.9729.48
26142.0333.90
621100.0031.19
Fairly important 45663.8737.35
25836.1333.51
714100.0035.86
Not very important
30370.4724.82
12729.5316.49
430100.0021.60
Total 122161.33
100.00
77038.67
100.00
1991100.00100.00
16.10 percent of those who have financially dependent children consider ‘choice in hours’ to be ‘essential’. 33.30 percent of the same group consider ‘choice in hours’ to be ‘very important’. The corresponding percentages for those who do not have financially dependent children are less, at 8.35 and 29.48 percent, respectively. Whereas 37.35 percent of those who do not have financially dependent children consider ‘choice in hours’ to be only ‘fairly important’, 33.51 percent of those who do have financially dependent children are of this opinion.
80
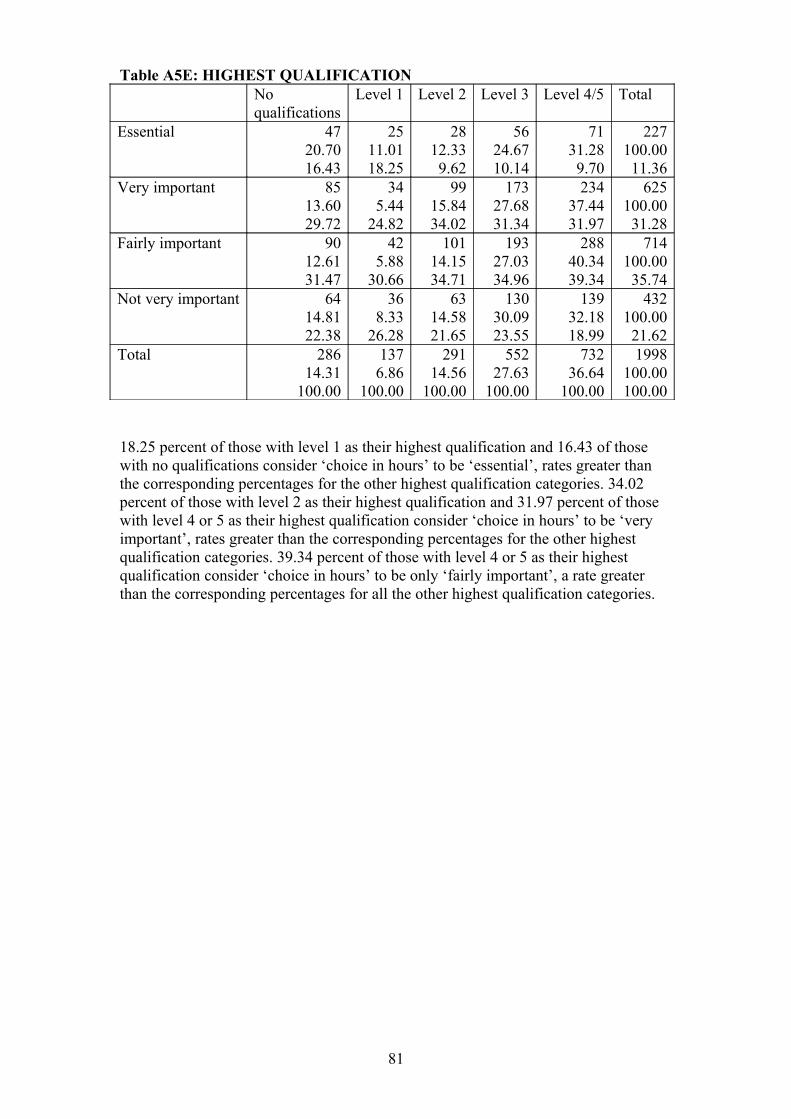
Table A5E: HIGHEST QUALIFICATIONNoqualifications
Level 1 Level 2 Level 3 Level 4/5 Total
Essential 4720.7016.43
2511.0118.25
2812.339.62
5624.6710.14
7131.289.70
227100.0011.36
Very important 8513.6029.72
345.44
24.82
9915.8434.02
17327.6831.34
23437.4431.97
625100.0031.28
Fairly important 9012.6131.47
425.88
30.66
10114.1534.71
19327.0334.96
28840.3439.34
714100.0035.74
Not very important 6414.8122.38
368.33
26.28
6314.5821.65
13030.0923.55
13932.1818.99
432100.0021.62
Total 28614.31
100.00
1376.86
100.00
29114.56
100.00
55227.63
100.00
73236.64
100.00
1998100.00100.00
18.25 percent of those with level 1 as their highest qualification and 16.43 of those with no qualifications consider ‘choice in hours’ to be ‘essential’, rates greater than the corresponding percentages for the other highest qualification categories. 34.02 percent of those with level 2 as their highest qualification and 31.97 percent of those with level 4 or 5 as their highest qualification consider ‘choice in hours’ to be ‘very important’, rates greater than the corresponding percentages for the other highest qualification categories. 39.34 percent of those with level 4 or 5 as their highest qualification consider ‘choice in hours’ to be only ‘fairly important’, a rate greater than the corresponding percentages for all the other highest qualification categories.
81
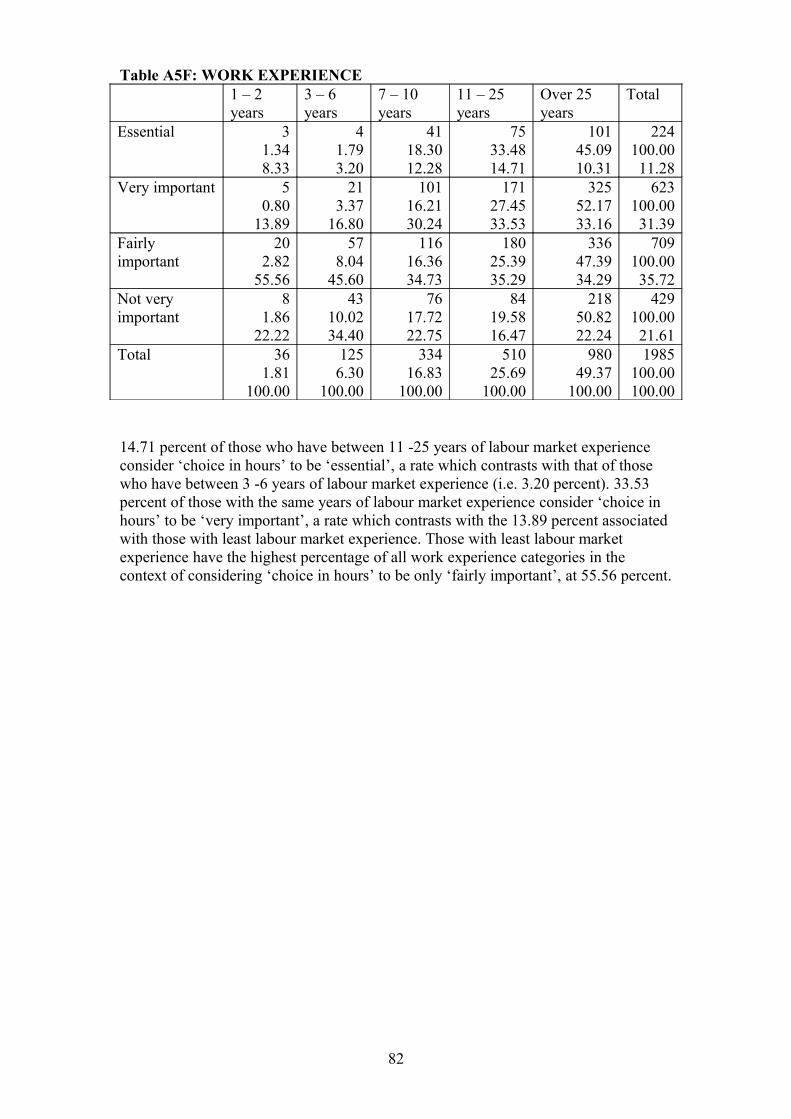
Table A5F: WORK EXPERIENCE1 – 2 years
3 – 6 years
7 – 10 years
11 – 25 years
Over 25 years
Total
Essential 31.348.33
41.793.20
4118.3012.28
7533.4814.71
10145.0910.31
224100.0011.28
Very important 50.80
13.89
213.37
16.80
10116.2130.24
17127.4533.53
32552.1733.16
623100.0031.39
Fairly important
202.82
55.56
578.04
45.60
11616.3634.73
18025.3935.29
33647.3934.29
709100.0035.72
Not very important
81.86
22.22
4310.0234.40
7617.7222.75
8419.5816.47
21850.8222.24
429100.0021.61
Total 361.81
100.00
1256.30
100.00
33416.83
100.00
51025.69
100.00
98049.37
100.00
1985100.00100.00
14.71 percent of those who have between 11 -25 years of labour market experience consider ‘choice in hours’ to be ‘essential’, a rate which contrasts with that of those who have between 3 -6 years of labour market experience (i.e. 3.20 percent). 33.53 percent of those with the same years of labour market experience consider ‘choice in hours’ to be ‘very important’, a rate which contrasts with the 13.89 percent associated with those with least labour market experience. Those with least labour market experience have the highest percentage of all work experience categories in the context of considering ‘choice in hours’ to be only ‘fairly important’, at 55.56 percent.
82
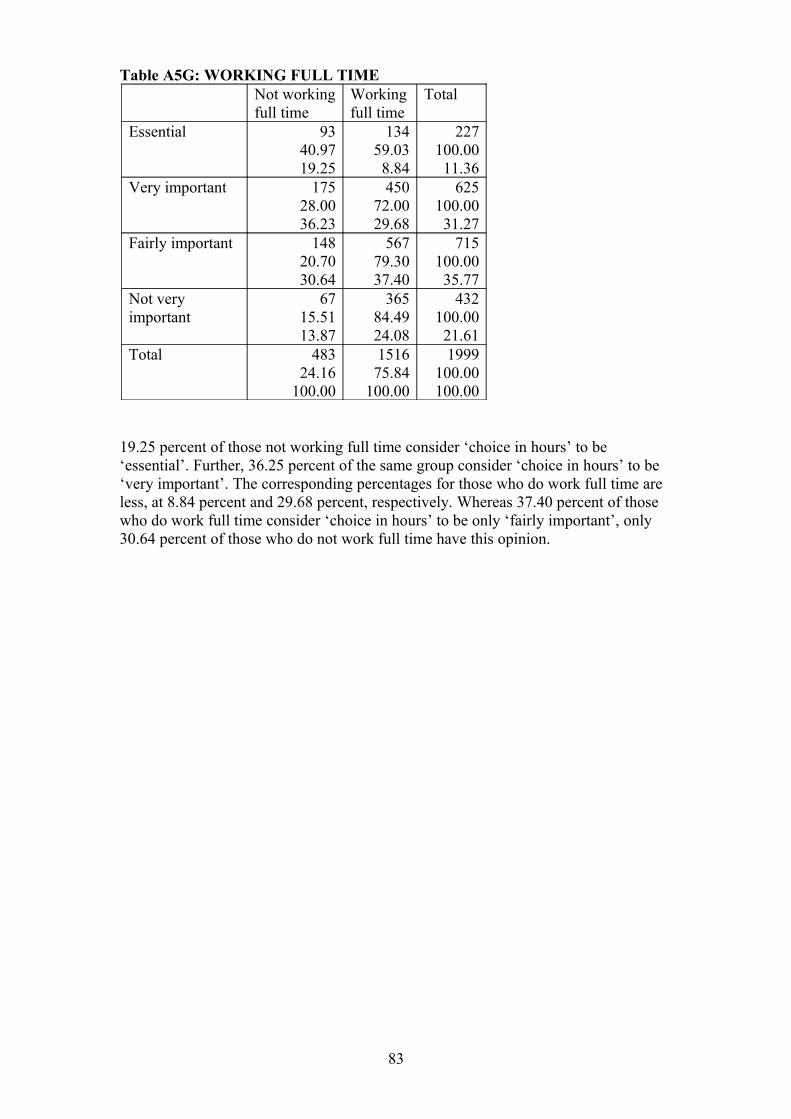
Table A5G: WORKING FULL TIMENot workingfull time
Workingfull time
Total
Essential 9340.9719.25
13459.038.84
227100.0011.36
Very important 17528.0036.23
45072.0029.68
625100.0031.27
Fairly important 14820.7030.64
56779.3037.40
715100.0035.77
Not very important
6715.5113.87
36584.4924.08
432100.0021.61
Total 48324.16
100.00
151675.84
100.00
1999100.00100.00
19.25 percent of those not working full time consider ‘choice in hours’ to be ‘essential’. Further, 36.25 percent of the same group consider ‘choice in hours’ to be ‘very important’. The corresponding percentages for those who do work full time are less, at 8.84 percent and 29.68 percent, respectively. Whereas 37.40 percent of those who do work full time consider ‘choice in hours’ to be only ‘fairly important’, only 30.64 percent of those who do not work full time have this opinion.
83
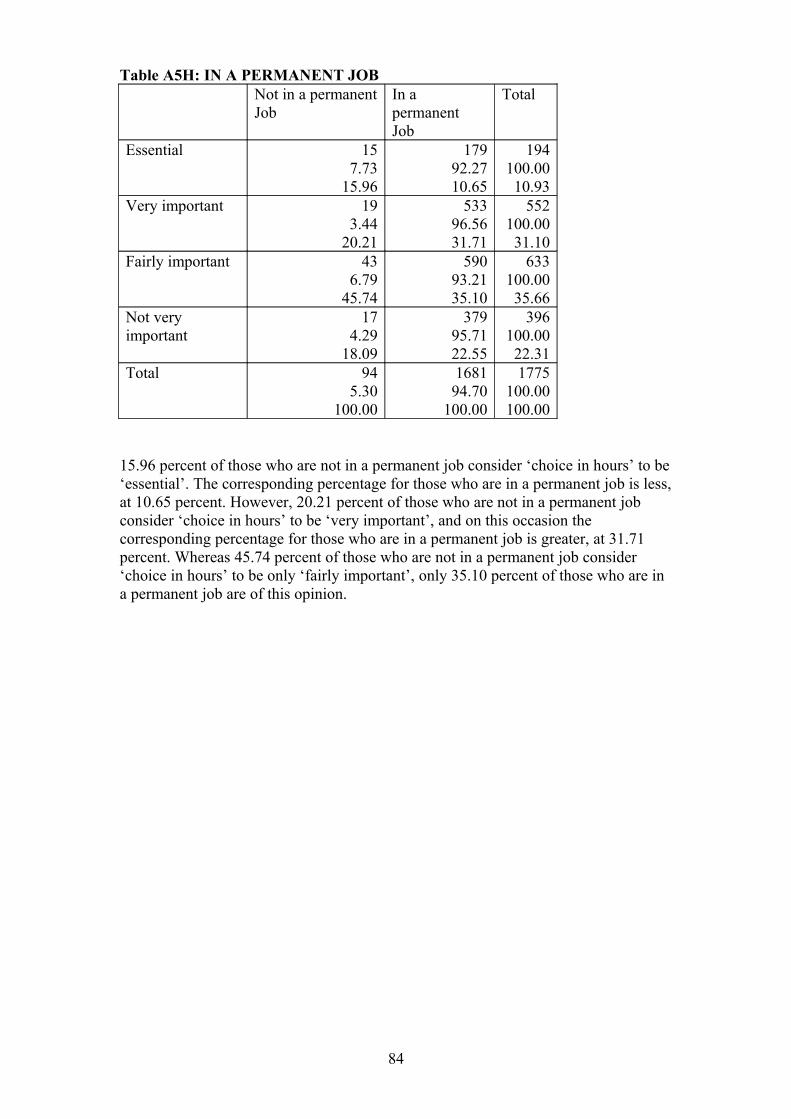
Table A5H: IN A PERMANENT JOBNot in a permanentJob
In a permanentJob
Total
Essential 157.73
15.96
17992.2710.65
194100.0010.93
Very important 193.44
20.21
53396.5631.71
552100.0031.10
Fairly important 436.79
45.74
59093.2135.10
633100.0035.66
Not very important
174.29
18.09
37995.7122.55
396100.0022.31
Total 945.30
100.00
168194.70
100.00
1775100.00100.00
15.96 percent of those who are not in a permanent job consider ‘choice in hours’ to be ‘essential’. The corresponding percentage for those who are in a permanent job is less, at 10.65 percent. However, 20.21 percent of those who are not in a permanent job consider ‘choice in hours’ to be ‘very important’, and on this occasion the corresponding percentage for those who are in a permanent job is greater, at 31.71 percent. Whereas 45.74 percent of those who are not in a permanent job consider ‘choice in hours’ to be only ‘fairly important’, only 35.10 percent of those who are in a permanent job are of this opinion.
84
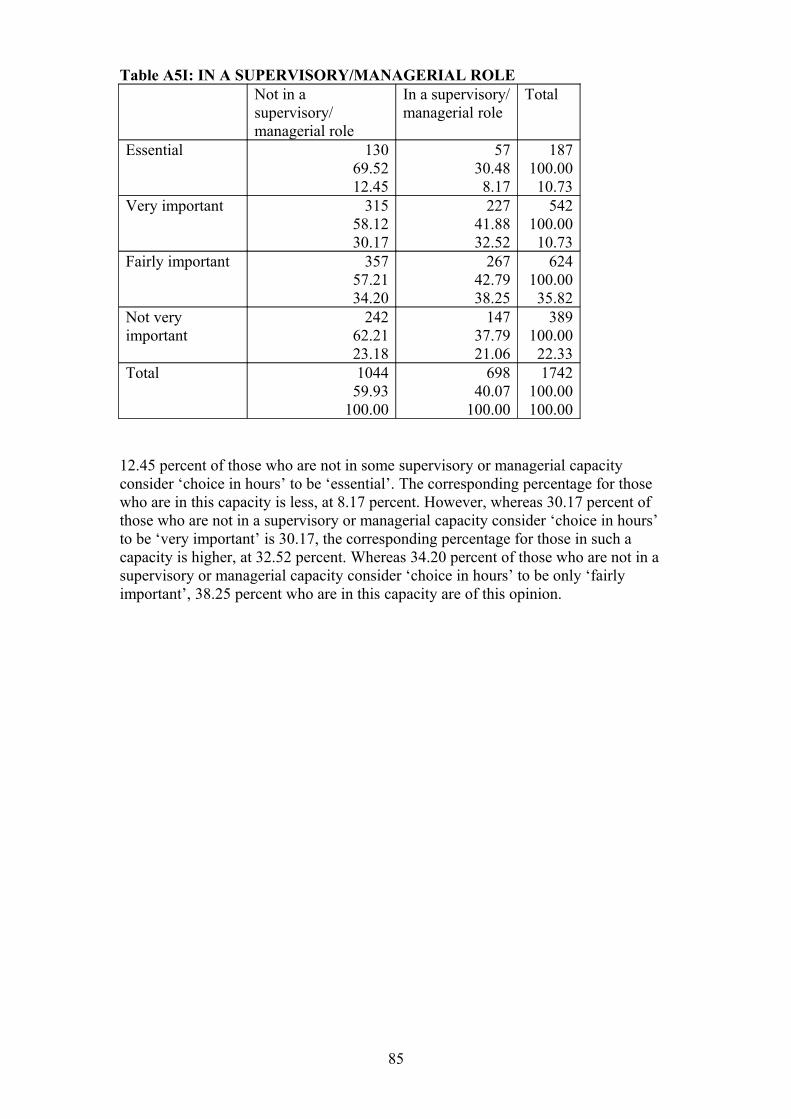
Table A5I: IN A SUPERVISORY/MANAGERIAL ROLENot in a supervisory/managerial role
In a supervisory/managerial role
Total
Essential 13069.5212.45
5730.488.17
187100.0010.73
Very important 31558.1230.17
22741.8832.52
542100.0010.73
Fairly important 35757.2134.20
26742.7938.25
624100.0035.82
Not very important
24262.2123.18
14737.7921.06
389100.0022.33
Total 104459.93
100.00
69840.07
100.00
1742100.00100.00
12.45 percent of those who are not in some supervisory or managerial capacity consider ‘choice in hours’ to be ‘essential’. The corresponding percentage for those who are in this capacity is less, at 8.17 percent. However, whereas 30.17 percent of those who are not in a supervisory or managerial capacity consider ‘choice in hours’ to be ‘very important’ is 30.17, the corresponding percentage for those in such a capacity is higher, at 32.52 percent. Whereas 34.20 percent of those who are not in a supervisory or managerial capacity consider ‘choice in hours’ to be only ‘fairly important’, 38.25 percent who are in this capacity are of this opinion.
85

Table A5J: EMPLOYMENT STATUSEmployee Self-employed Total
Essential 18782.3810.73
4017.6215.56
227100.0011.36
Very important 54286.7231.11
8313.2832.30
625100.0031.27
Fairly important 62487.2735.82
9112.7335.41
715100.0035.77
Not very important
38990.0522.33
439.95
16.73
432100.0021.61
Total 174287.14
100.00
25712.86
100.00
1999100.00100.00
15.56 percent of those who are self employed consider ‘choice in hours’ to be ‘essential’. 32.30 percent of the same group consider ‘choice in hours’ to be ‘very important’. The corresponding percentages for those who are employees are less, at 10.73 and 31.11 percent, respectively. Whereas 22.23 percent of employees consider ‘choice in hours’ to be ‘not very important’, only 16.73 percent of the self employed are of this opinion.
86
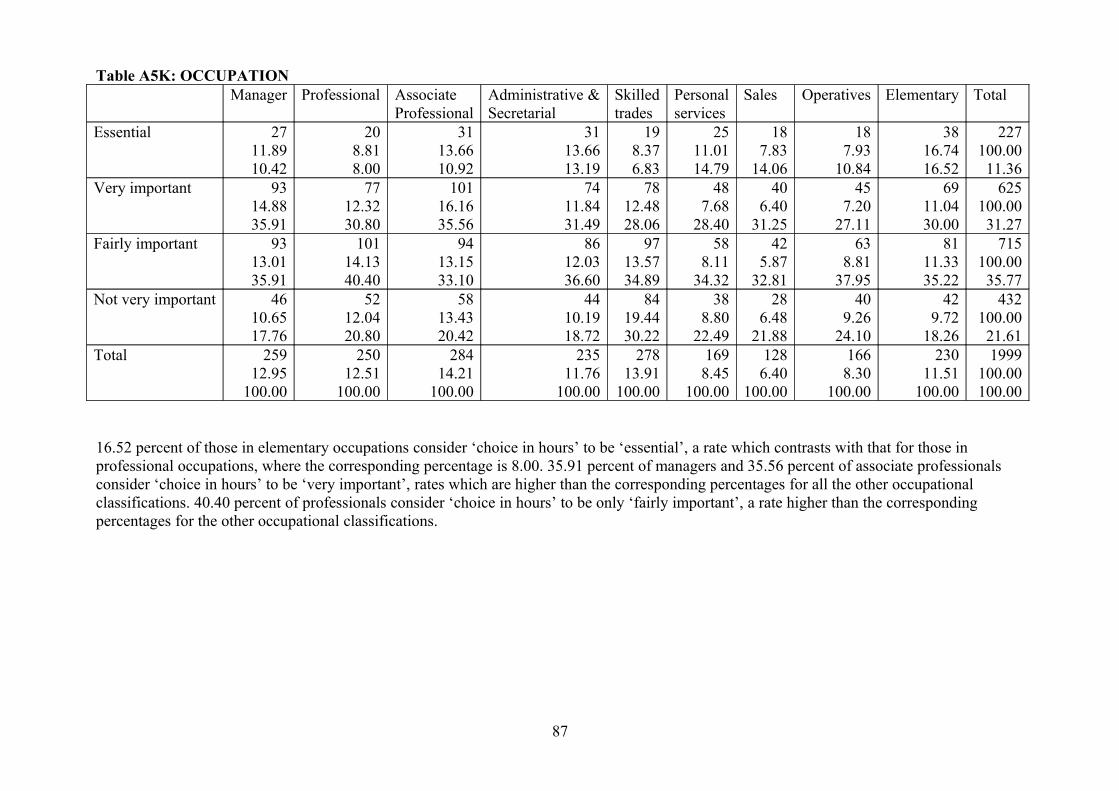
Table A5K: OCCUPATIONManager Professional Associate
ProfessionalAdministrative &Secretarial
Skilledtrades
Personal services
Sales Operatives Elementary Total
Essential 2711.8910.42
208.818.00
3113.6610.92
3113.6613.19
198.376.83
2511.0114.79
187.83
14.06
187.93
10.84
3816.7416.52
227100.0011.36
Very important 9314.8835.91
7712.3230.80
10116.1635.56
7411.8431.49
7812.4828.06
487.68
28.40
406.40
31.25
457.20
27.11
6911.0430.00
625100.0031.27
Fairly important 9313.0135.91
10114.1340.40
9413.1533.10
8612.0336.60
9713.5734.89
588.11
34.32
425.87
32.81
638.81
37.95
8111.3335.22
715100.0035.77
Not very important 4610.6517.76
5212.0420.80
5813.4320.42
4410.1918.72
8419.4430.22
388.80
22.49
286.48
21.88
409.26
24.10
429.72
18.26
432100.0021.61
Total 25912.95
100.00
25012.51
100.00
28414.21
100.00
23511.76
100.00
27813.91
100.00
1698.45
100.00
1286.40
100.00
1668.30
100.00
23011.51
100.00
1999100.00100.00
16.52 percent of those in elementary occupations consider ‘choice in hours’ to be ‘essential’, a rate which contrasts with that for those in professional occupations, where the corresponding percentage is 8.00. 35.91 percent of managers and 35.56 percent of associate professionals consider ‘choice in hours’ to be ‘very important’, rates which are higher than the corresponding percentages for all the other occupational classifications. 40.40 percent of professionals consider ‘choice in hours’ to be only ‘fairly important’, a rate higher than the corresponding percentages for the other occupational classifications.
87
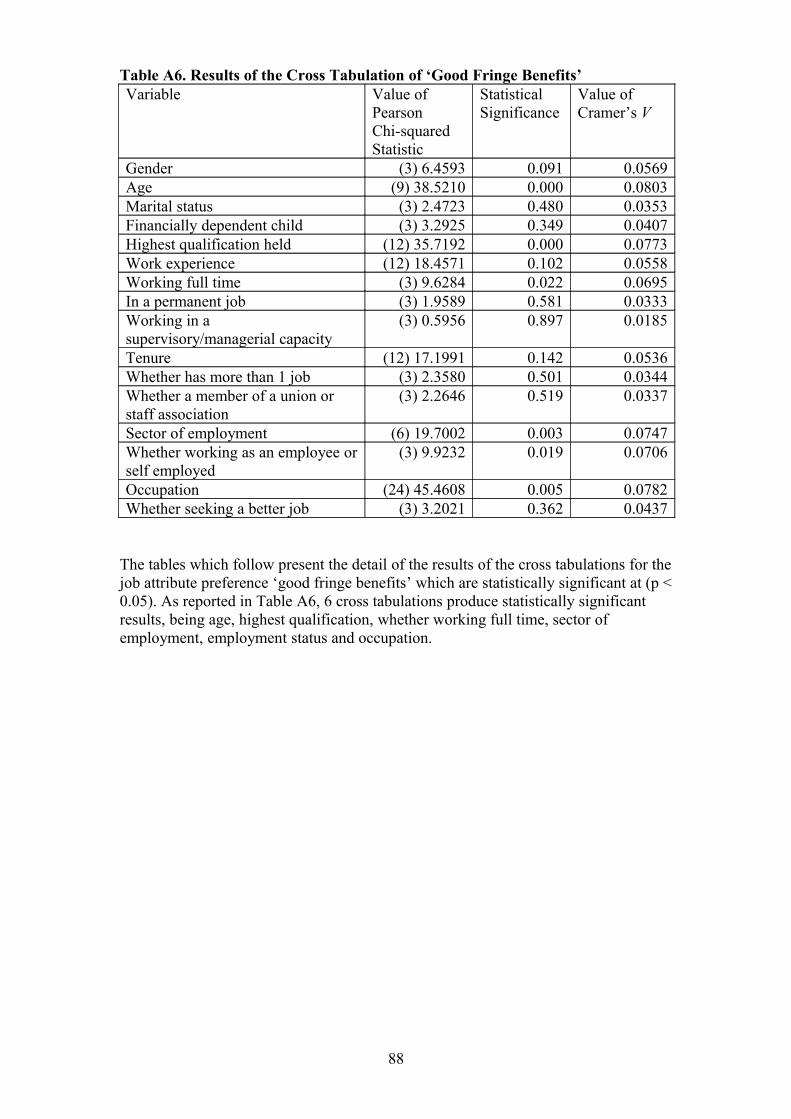
Table A6. Results of the Cross Tabulation of ‘Good Fringe Benefits’Variable Value of
Pearson Chi-squared Statistic
StatisticalSignificance
Value of Cramer’s V
Gender (3) 6.4593 0.091 0.0569Age (9) 38.5210 0.000 0.0803Marital status (3) 2.4723 0.480 0.0353Financially dependent child (3) 3.2925 0.349 0.0407Highest qualification held (12) 35.7192 0.000 0.0773Work experience (12) 18.4571 0.102 0.0558Working full time (3) 9.6284 0.022 0.0695In a permanent job (3) 1.9589 0.581 0.0333Working in a supervisory/managerial capacity
(3) 0.5956 0.897 0.0185
Tenure (12) 17.1991 0.142 0.0536Whether has more than 1 job (3) 2.3580 0.501 0.0344Whether a member of a union or staff association
(3) 2.2646 0.519 0.0337
Sector of employment (6) 19.7002 0.003 0.0747Whether working as an employee or self employed
(3) 9.9232 0.019 0.0706
Occupation (24) 45.4608 0.005 0.0782Whether seeking a better job (3) 3.2021 0.362 0.0437
The tables which follow present the detail of the results of the cross tabulations for the job attribute preference ‘good fringe benefits’ which are statistically significant at (p < 0.05). As reported in Table A6, 6 cross tabulations produce statistically significant results, being age, highest qualification, whether working full time, sector of employment, employment status and occupation.
88
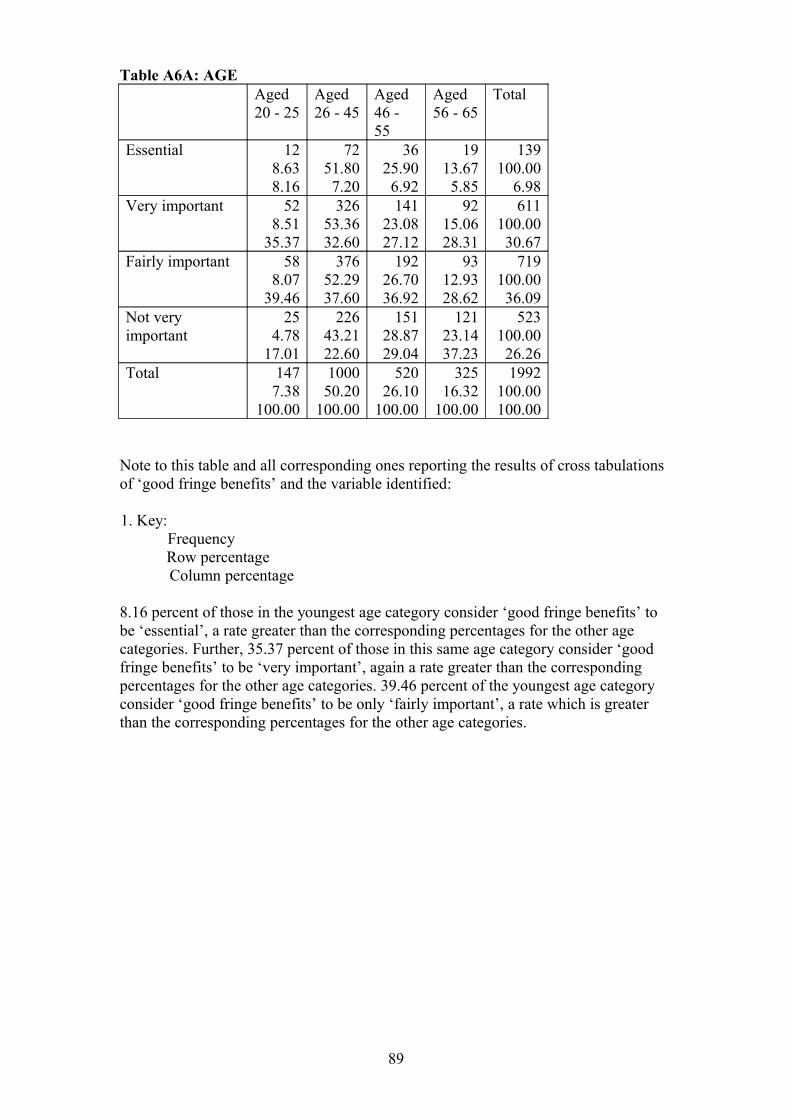
Table A6A: AGEAged20 - 25
Aged26 - 45
Aged46 - 55
Aged56 - 65
Total
Essential 128.638.16
7251.807.20
3625.906.92
1913.675.85
139100.00
6.98Very important 52
8.5135.37
32653.3632.60
14123.0827.12
9215.0628.31
611100.0030.67
Fairly important 588.07
39.46
37652.2937.60
19226.7036.92
9312.9328.62
719100.0036.09
Not very important
254.78
17.01
22643.2122.60
15128.8729.04
12123.1437.23
523100.0026.26
Total 1477.38
100.00
100050.20
100.00
52026.10
100.00
32516.32
100.00
1992100.00100.00
Note to this table and all corresponding ones reporting the results of cross tabulations of ‘good fringe benefits’ and the variable identified:
1. Key:FrequencyRow percentageColumn percentage
8.16 percent of those in the youngest age category consider ‘good fringe benefits’ to be ‘essential’, a rate greater than the corresponding percentages for the other age categories. Further, 35.37 percent of those in this same age category consider ‘good fringe benefits’ to be ‘very important’, again a rate greater than the corresponding percentages for the other age categories. 39.46 percent of the youngest age category consider ‘good fringe benefits’ to be only ‘fairly important’, a rate which is greater than the corresponding percentages for the other age categories.
89
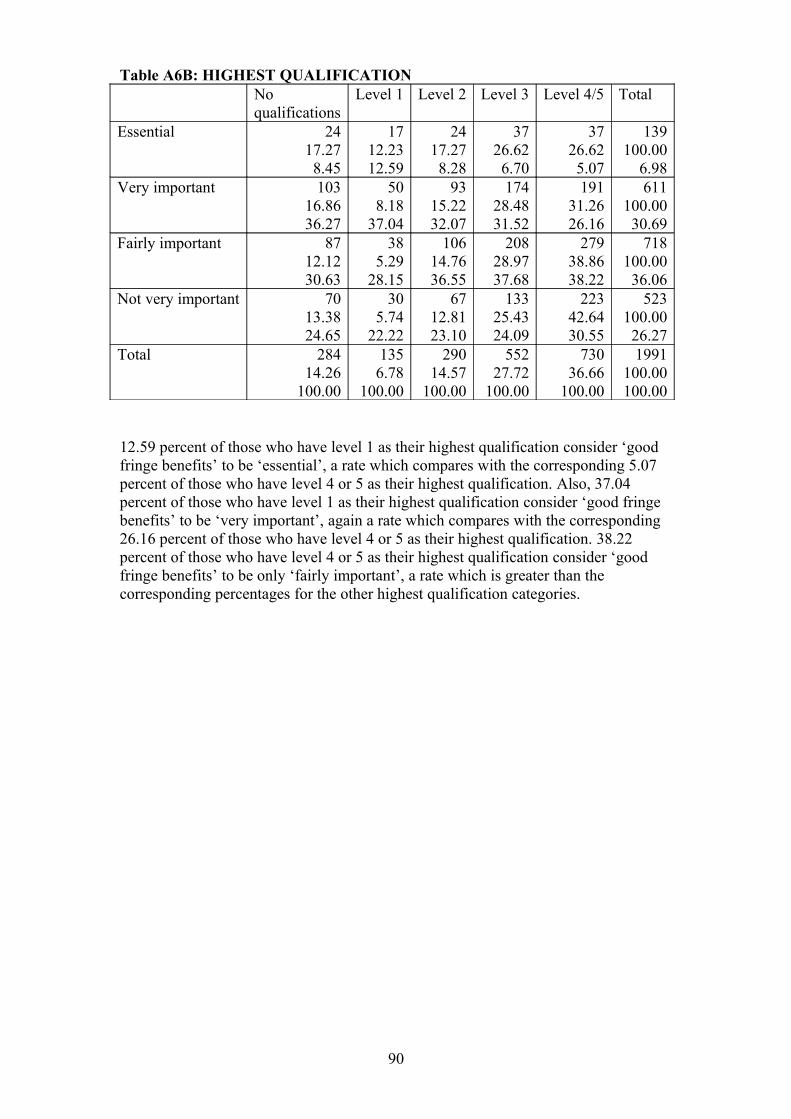
Table A6B: HIGHEST QUALIFICATIONNoqualifications
Level 1 Level 2 Level 3 Level 4/5 Total
Essential 2417.278.45
1712.2312.59
2417.278.28
3726.626.70
3726.625.07
139100.00
6.98Very important 103
16.8636.27
508.18
37.04
9315.2232.07
17428.4831.52
19131.2626.16
611100.0030.69
Fairly important 8712.1230.63
385.29
28.15
10614.7636.55
20828.9737.68
27938.8638.22
718100.0036.06
Not very important 7013.3824.65
305.74
22.22
6712.8123.10
13325.4324.09
22342.6430.55
523100.0026.27
Total 28414.26
100.00
1356.78
100.00
29014.57
100.00
55227.72
100.00
73036.66
100.00
1991100.00100.00
12.59 percent of those who have level 1 as their highest qualification consider ‘good fringe benefits’ to be ‘essential’, a rate which compares with the corresponding 5.07 percent of those who have level 4 or 5 as their highest qualification. Also, 37.04 percent of those who have level 1 as their highest qualification consider ‘good fringe benefits’ to be ‘very important’, again a rate which compares with the corresponding 26.16 percent of those who have level 4 or 5 as their highest qualification. 38.22 percent of those who have level 4 or 5 as their highest qualification consider ‘good fringe benefits’ to be only ‘fairly important’, a rate which is greater than the corresponding percentages for the other highest qualification categories.
90
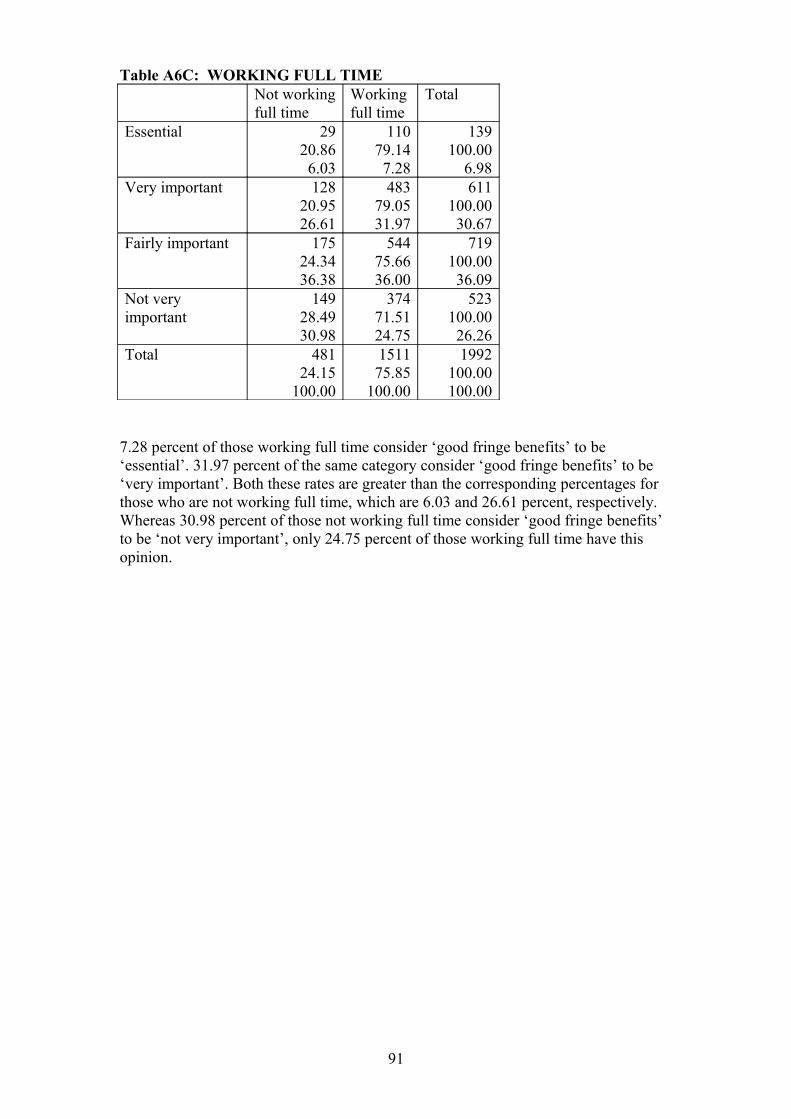
Table A6C: WORKING FULL TIMENot workingfull time
Workingfull time
Total
Essential 2920.866.03
11079.147.28
139100.00
6.98Very important 128
20.9526.61
48379.0531.97
611100.0030.67
Fairly important 17524.3436.38
54475.6636.00
719100.0036.09
Not very important
14928.4930.98
37471.5124.75
523100.0026.26
Total 48124.15
100.00
151175.85
100.00
1992100.00100.00
7.28 percent of those working full time consider ‘good fringe benefits’ to be ‘essential’. 31.97 percent of the same category consider ‘good fringe benefits’ to be ‘very important’. Both these rates are greater than the corresponding percentages for those who are not working full time, which are 6.03 and 26.61 percent, respectively. Whereas 30.98 percent of those not working full time consider ‘good fringe benefits’ to be ‘not very important’, only 24.75 percent of those working full time have this opinion.
91
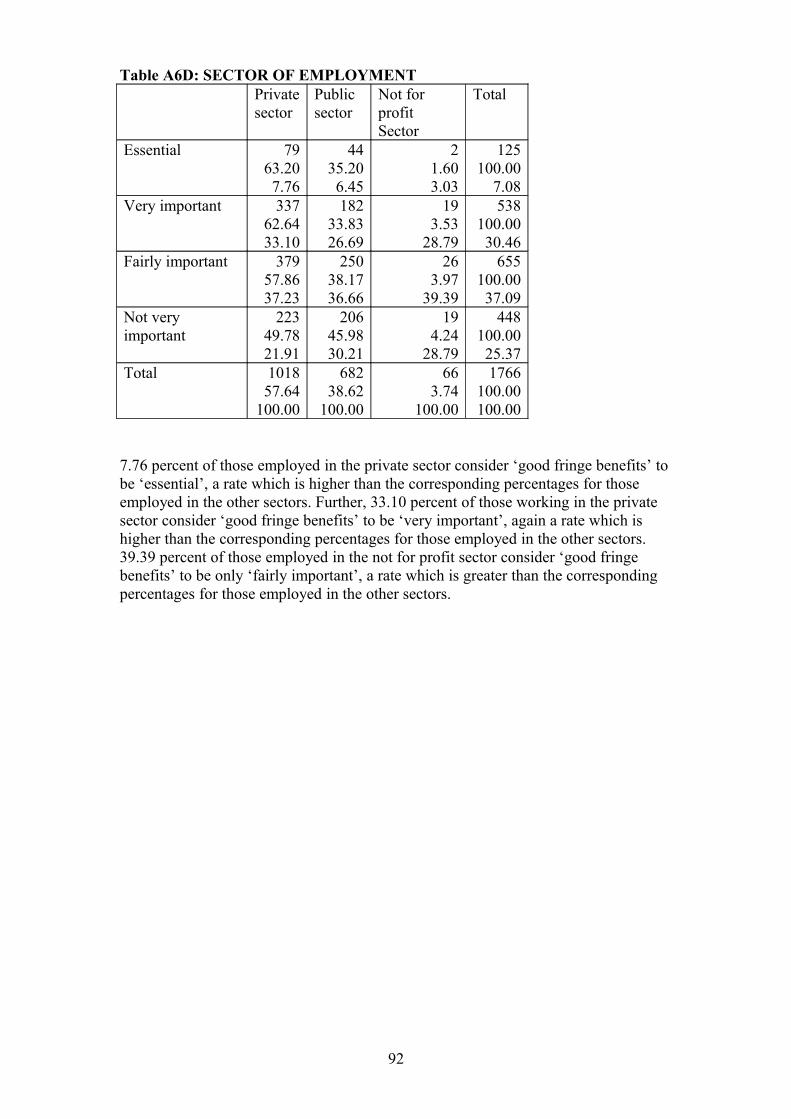
Table A6D: SECTOR OF EMPLOYMENTPrivatesector
Publicsector
Not for profitSector
Total
Essential 7963.207.76
4435.206.45
21.603.03
125100.00
7.08Very important 337
62.6433.10
18233.8326.69
193.53
28.79
538100.0030.46
Fairly important 37957.8637.23
25038.1736.66
263.97
39.39
655100.0037.09
Not very important
22349.7821.91
20645.9830.21
194.24
28.79
448100.0025.37
Total 101857.64
100.00
68238.62
100.00
663.74
100.00
1766100.00100.00
7.76 percent of those employed in the private sector consider ‘good fringe benefits’ to be ‘essential’, a rate which is higher than the corresponding percentages for those employed in the other sectors. Further, 33.10 percent of those working in the private sector consider ‘good fringe benefits’ to be ‘very important’, again a rate which is higher than the corresponding percentages for those employed in the other sectors. 39.39 percent of those employed in the not for profit sector consider ‘good fringe benefits’ to be only ‘fairly important’, a rate which is greater than the corresponding percentages for those employed in the other sectors.
92

Table A6E: EMPLOYMENT STATUSEmployee Self-employed Total
Essential 12489.217.14
1510.795.88
139100.00
6.98Very important 527
86.2530.34
8413.7532.94
611100.0030.67
Fairly important 64689.8537.19
7310.1528.63
719100.0036.09
Not very important
44084.1325.33
8315.8732.55
523100.0026.26
Total 173787.20
100.00
25512.89
100.00
1992100.00100.00
Whereas 7.14 of employees consider ‘good fringe benefits’ to be essential, only 5.88 percent of the self employed are of this opinion. Whereas 30.34 percent of employees consider ‘good fringe benefits’ to be ‘very important’, 32.94 percent of the self employed are of this opinion. Whereas 37.19 percent of employees consider ‘good fringe benefits’ to be only ‘fairly important’, only 28.63 percent of the self employed are of this opinion.
93
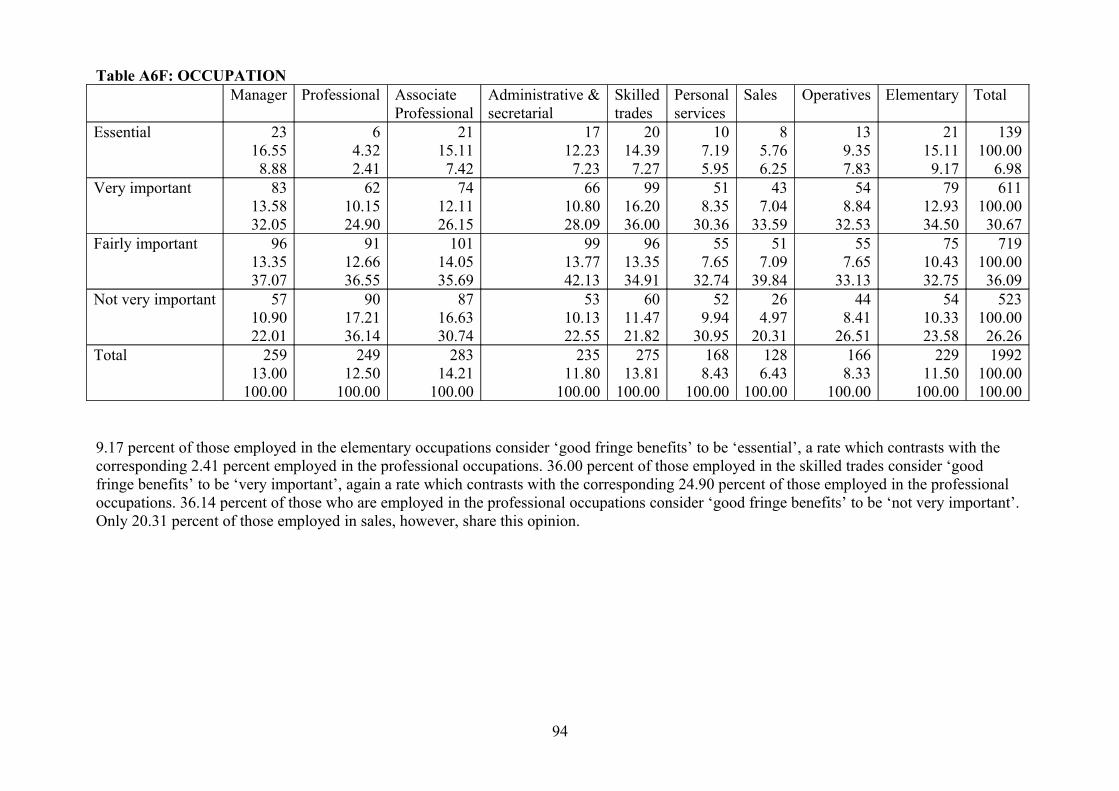
Table A6F: OCCUPATIONManager Professional Associate
ProfessionalAdministrative &secretarial
Skilledtrades
Personal services
Sales Operatives Elementary Total
Essential 2316.558.88
64.322.41
2115.117.42
1712.237.23
2014.397.27
107.195.95
85.766.25
139.357.83
2115.119.17
139100.00
6.98Very important 83
13.5832.05
6210.1524.90
7412.1126.15
6610.8028.09
9916.2036.00
518.35
30.36
437.04
33.59
548.84
32.53
7912.9334.50
611100.0030.67
Fairly important 9613.3537.07
9112.6636.55
10114.0535.69
9913.7742.13
9613.3534.91
557.65
32.74
517.09
39.84
557.65
33.13
7510.4332.75
719100.0036.09
Not very important 5710.9022.01
9017.2136.14
8716.6330.74
5310.1322.55
6011.4721.82
529.94
30.95
264.97
20.31
448.41
26.51
5410.3323.58
523100.0026.26
Total 25913.00
100.00
24912.50
100.00
28314.21
100.00
23511.80
100.00
27513.81
100.00
1688.43
100.00
1286.43
100.00
1668.33
100.00
22911.50
100.00
1992100.00100.00
9.17 percent of those employed in the elementary occupations consider ‘good fringe benefits’ to be ‘essential’, a rate which contrasts with the corresponding 2.41 percent employed in the professional occupations. 36.00 percent of those employed in the skilled trades consider ‘good fringe benefits’ to be ‘very important’, again a rate which contrasts with the corresponding 24.90 percent of those employed in the professional occupations. 36.14 percent of those who are employed in the professional occupations consider ‘good fringe benefits’ to be ‘not very important’. Only 20.31 percent of those employed in sales, however, share this opinion.
94
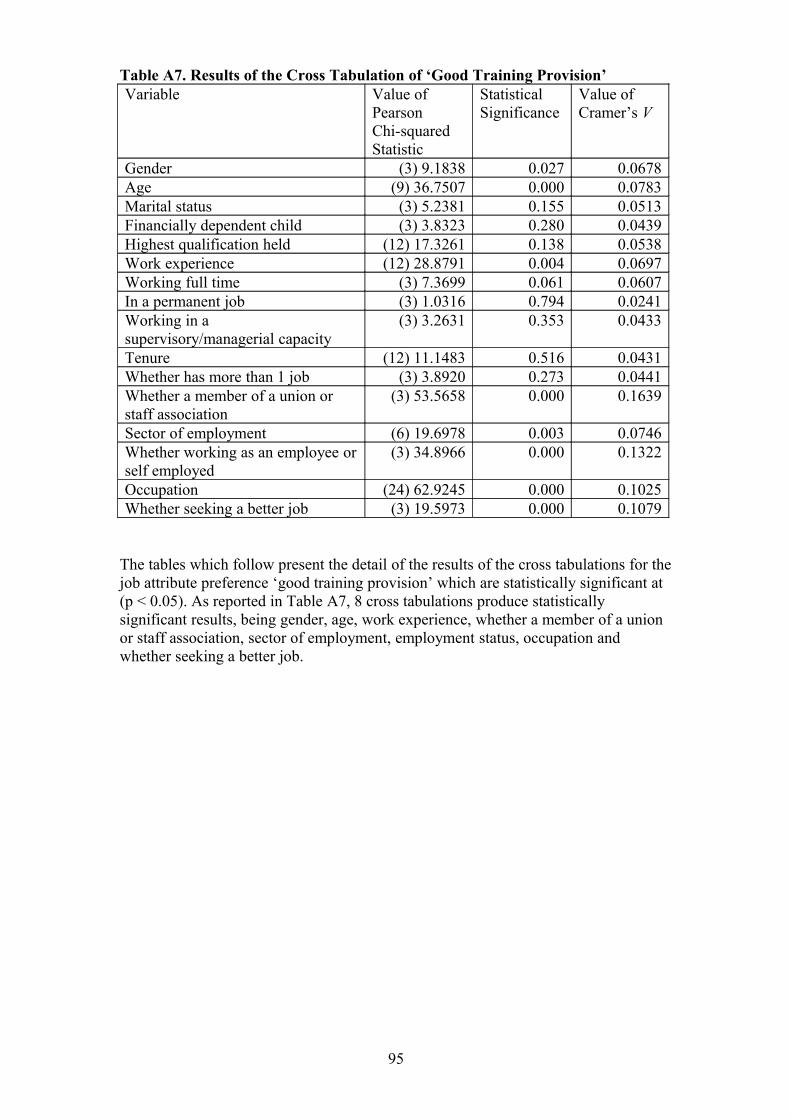
Table A7. Results of the Cross Tabulation of ‘Good Training Provision’Variable Value of
Pearson Chi-squared Statistic
StatisticalSignificance
Value of Cramer’s V
Gender (3) 9.1838 0.027 0.0678Age (9) 36.7507 0.000 0.0783Marital status (3) 5.2381 0.155 0.0513Financially dependent child (3) 3.8323 0.280 0.0439Highest qualification held (12) 17.3261 0.138 0.0538Work experience (12) 28.8791 0.004 0.0697Working full time (3) 7.3699 0.061 0.0607In a permanent job (3) 1.0316 0.794 0.0241Working in a supervisory/managerial capacity
(3) 3.2631 0.353 0.0433
Tenure (12) 11.1483 0.516 0.0431Whether has more than 1 job (3) 3.8920 0.273 0.0441Whether a member of a union or staff association
(3) 53.5658 0.000 0.1639
Sector of employment (6) 19.6978 0.003 0.0746Whether working as an employee or self employed
(3) 34.8966 0.000 0.1322
Occupation (24) 62.9245 0.000 0.1025Whether seeking a better job (3) 19.5973 0.000 0.1079
The tables which follow present the detail of the results of the cross tabulations for the job attribute preference ‘good training provision’ which are statistically significant at (p < 0.05). As reported in Table A7, 8 cross tabulations produce statistically significant results, being gender, age, work experience, whether a member of a union or staff association, sector of employment, employment status, occupation and whether seeking a better job.
95
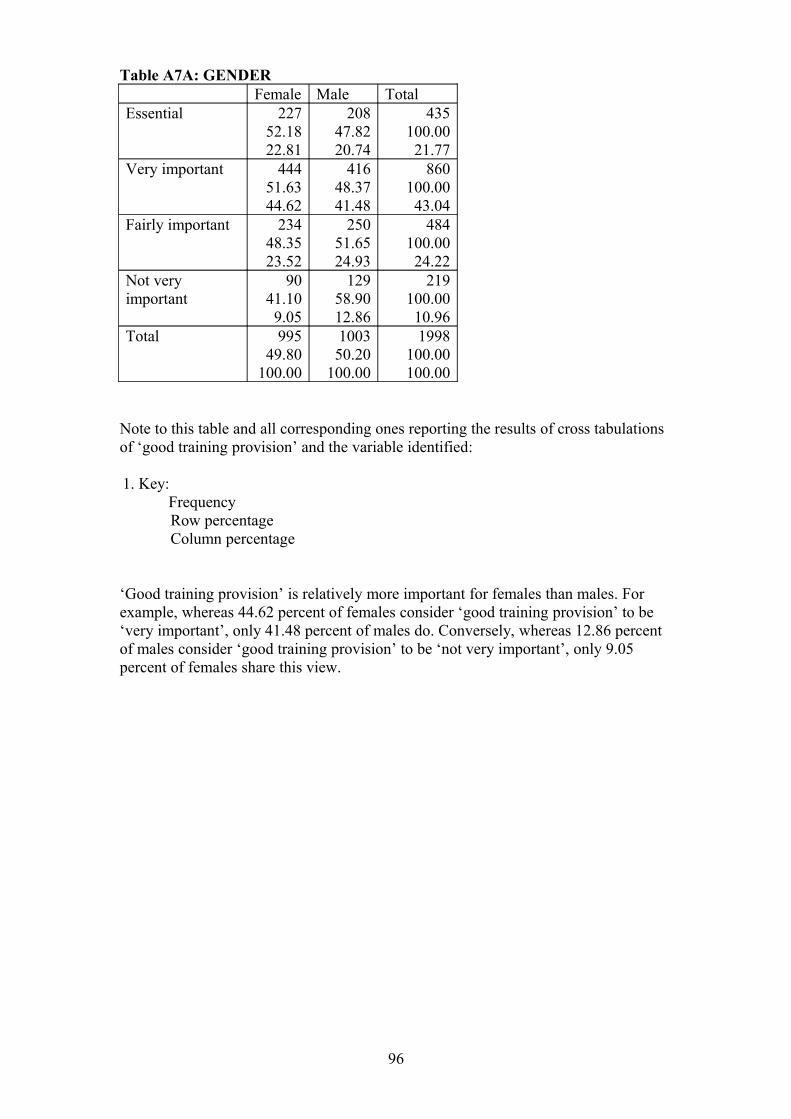
Table A7A: GENDERFemale Male Total
Essential 22752.1822.81
20847.8220.74
435100.0021.77
Very important 44451.6344.62
41648.3741.48
860100.0043.04
Fairly important 23448.3523.52
25051.6524.93
484100.0024.22
Not very important
9041.109.05
12958.9012.86
219100.0010.96
Total 99549.80
100.00
100350.20
100.00
1998100.00100.00
Note to this table and all corresponding ones reporting the results of cross tabulations of ‘good training provision’ and the variable identified:
1. Key:FrequencyRow percentageColumn percentage
‘Good training provision’ is relatively more important for females than males. For example, whereas 44.62 percent of females consider ‘good training provision’ to be ‘very important’, only 41.48 percent of males do. Conversely, whereas 12.86 percent of males consider ‘good training provision’ to be ‘not very important’, only 9.05 percent of females share this view.
96

Table A7B: AGEAged20 - 25
Aged26 – 45
Aged46 - 55
Aged56 - 65
Total
Essential 4510.3430.41
19945.7519.84
12528.7424.04
6615.1720.18
435100.0021.77
Very important 627.21
41.89
45152.4444.97
21925.4742.12
12814.8839.14
860100.0043.04
Fairly important 357.23
23.65
25753.1025.62
11924.5922.88
7315.0822.32
484100.0024.22
Not very important
62.744.05
9643.849.57
5726.0310.96
6027.4018.35
219100.0010.96
Total 1487.41
100.00
100350.20
100.00
52026.03
100.00
32716.37
100.00
1998100.00100.00
‘Good training provision’ is considered to be ‘essential’ by 30.41 percent of those in the youngest age category (aged 20 -25), a rate greater than the corresponding rates for the other age categories. ‘Good training provision’ is considered to be ‘very important’ by 44.97 percent of those in the second youngest age category (aged 26 – 45), a rate greater than the corresponding rates for the other age categories.
97
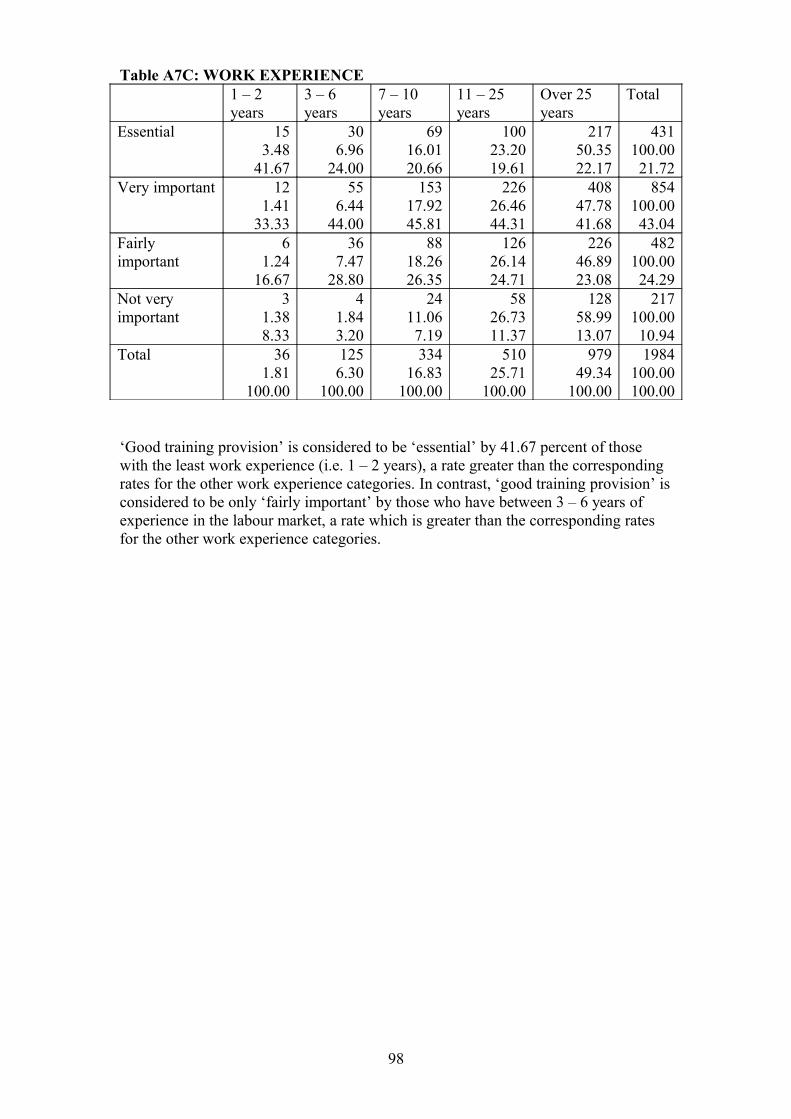
Table A7C: WORK EXPERIENCE1 – 2 years
3 – 6 years
7 – 10 years
11 – 25 years
Over 25 years
Total
Essential 153.48
41.67
306.96
24.00
6916.0120.66
10023.2019.61
21750.3522.17
431100.0021.72
Very important 121.41
33.33
556.44
44.00
15317.9245.81
22626.4644.31
40847.7841.68
854100.0043.04
Fairly important
61.24
16.67
367.47
28.80
8818.2626.35
12626.1424.71
22646.8923.08
482100.0024.29
Not very important
31.388.33
41.843.20
2411.067.19
5826.7311.37
12858.9913.07
217100.0010.94
Total 361.81
100.00
1256.30
100.00
33416.83
100.00
51025.71
100.00
97949.34
100.00
1984100.00100.00
‘Good training provision’ is considered to be ‘essential’ by 41.67 percent of those with the least work experience (i.e. 1 – 2 years), a rate greater than the corresponding rates for the other work experience categories. In contrast, ‘good training provision’ is considered to be only ‘fairly important’ by those who have between 3 – 6 years of experience in the labour market, a rate which is greater than the corresponding rates for the other work experience categories.
98
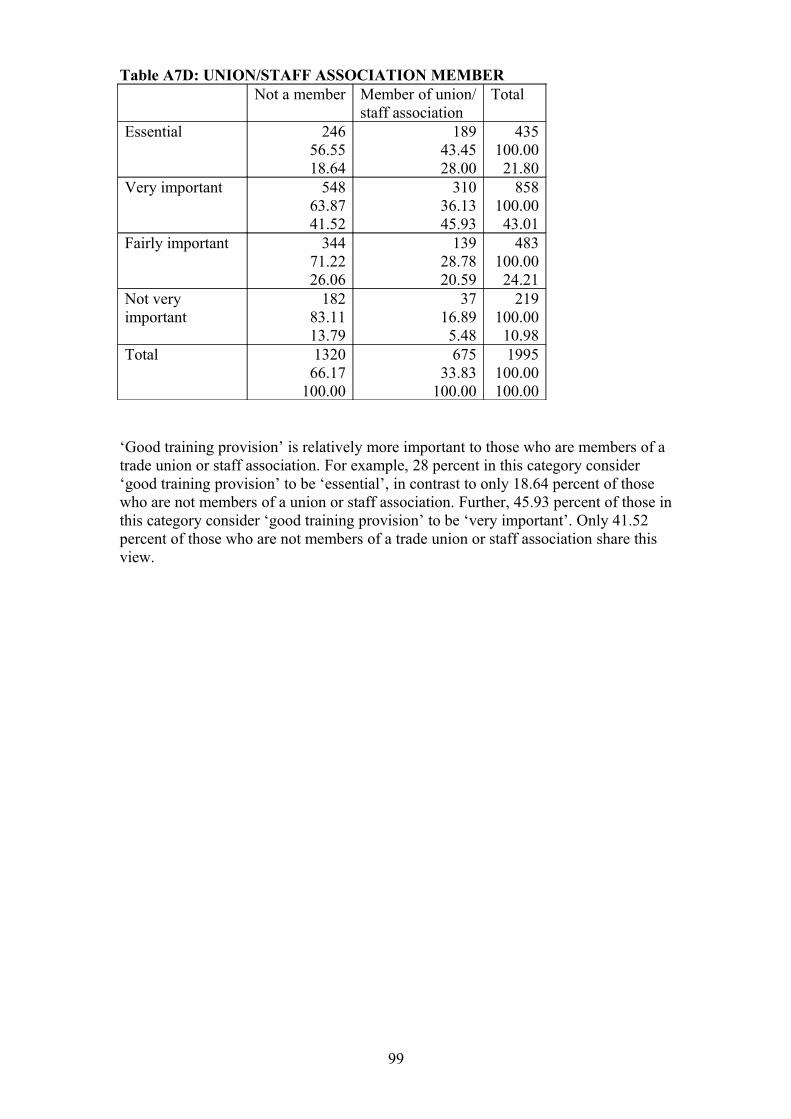
Table A7D: UNION/STAFF ASSOCIATION MEMBERNot a member Member of union/
staff associationTotal
Essential 24656.5518.64
18943.4528.00
435100.0021.80
Very important 54863.8741.52
31036.1345.93
858100.0043.01
Fairly important 34471.2226.06
13928.7820.59
483100.0024.21
Not very important
18283.1113.79
3716.895.48
219100.0010.98
Total 132066.17
100.00
67533.83
100.00
1995100.00100.00
‘Good training provision’ is relatively more important to those who are members of a trade union or staff association. For example, 28 percent in this category consider ‘good training provision’ to be ‘essential’, in contrast to only 18.64 percent of those who are not members of a union or staff association. Further, 45.93 percent of those in this category consider ‘good training provision’ to be ‘very important’. Only 41.52 percent of those who are not members of a trade union or staff association share this view.
99
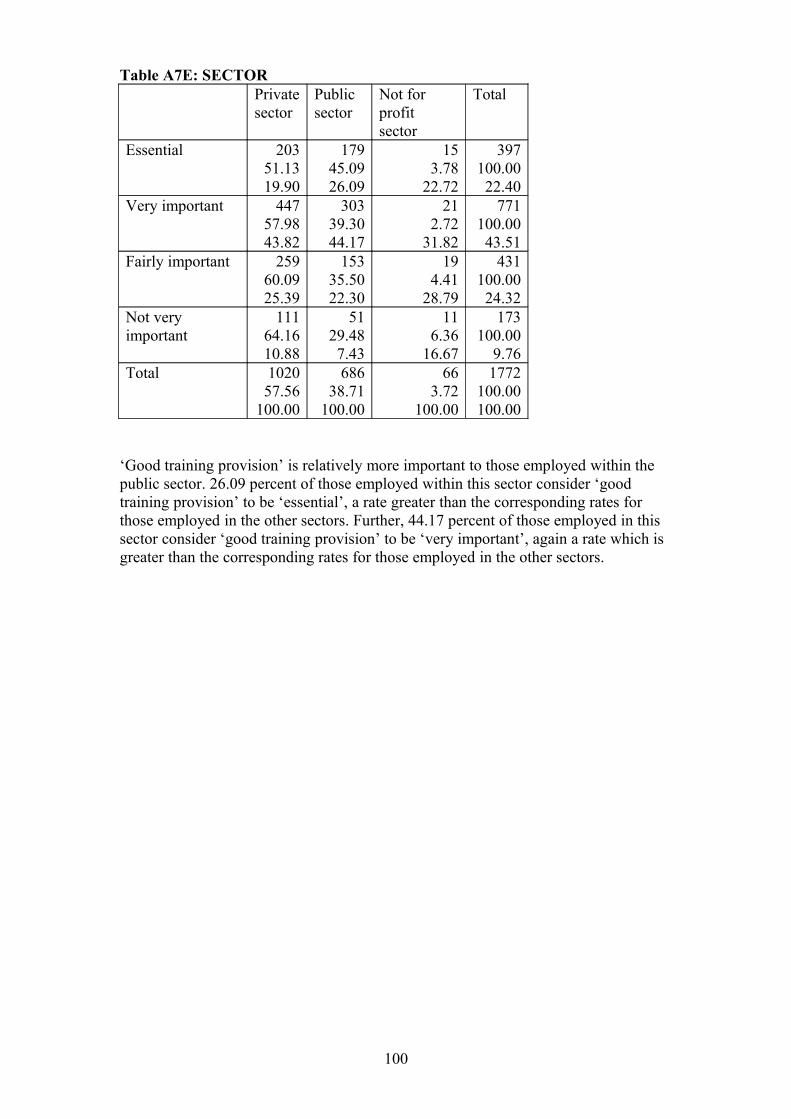
Table A7E: SECTORPrivatesector
Publicsector
Not for profitsector
Total
Essential 20351.1319.90
17945.0926.09
153.78
22.72
397100.0022.40
Very important 44757.9843.82
30339.3044.17
212.72
31.82
771100.0043.51
Fairly important 25960.0925.39
15335.5022.30
194.41
28.79
431100.0024.32
Not very important
11164.1610.88
5129.487.43
116.36
16.67
173100.00
9.76Total 1020
57.56100.00
68638.71
100.00
663.72
100.00
1772100.00100.00
‘Good training provision’ is relatively more important to those employed within the public sector. 26.09 percent of those employed within this sector consider ‘good training provision’ to be ‘essential’, a rate greater than the corresponding rates for those employed in the other sectors. Further, 44.17 percent of those employed in this sector consider ‘good training provision’ to be ‘very important’, again a rate which is greater than the corresponding rates for those employed in the other sectors.
100
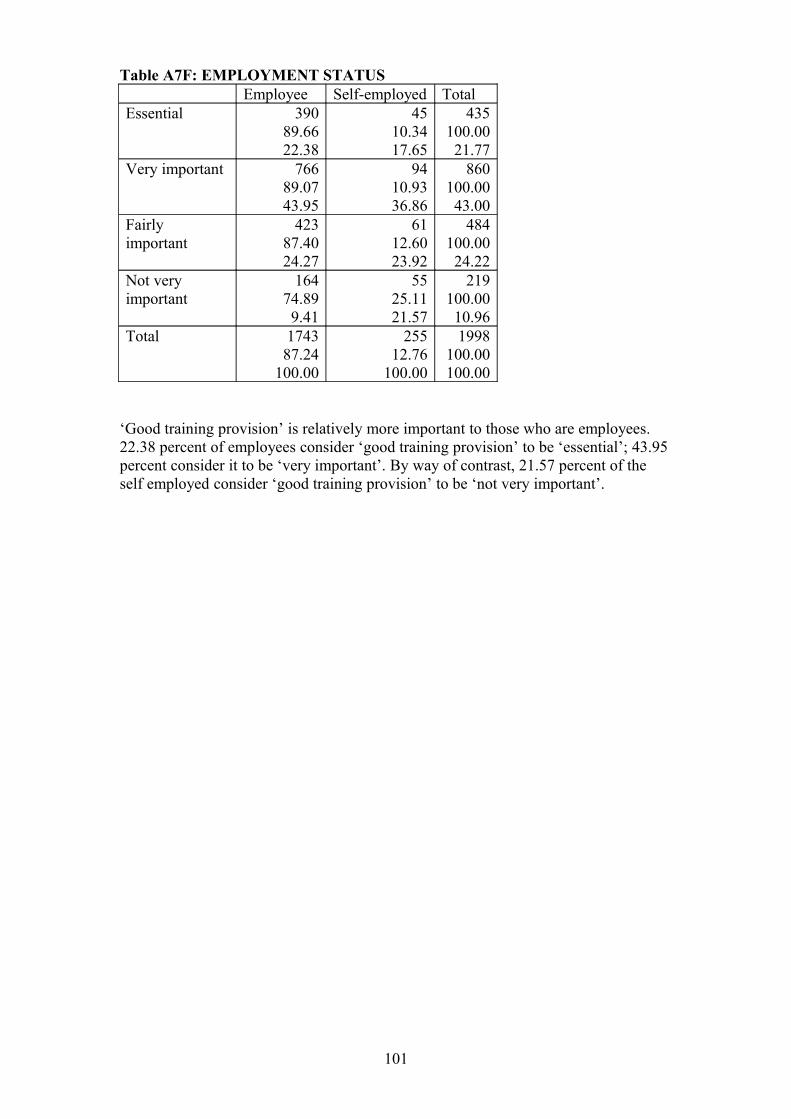
Table A7F: EMPLOYMENT STATUSEmployee Self-employed Total
Essential 39089.6622.38
4510.3417.65
435100.0021.77
Very important 76689.0743.95
9410.9336.86
860100.0043.00
Fairly important
42387.4024.27
6112.6023.92
484100.0024.22
Not very important
16474.899.41
5525.1121.57
219100.0010.96
Total 174387.24
100.00
25512.76
100.00
1998100.00100.00
‘Good training provision’ is relatively more important to those who are employees. 22.38 percent of employees consider ‘good training provision’ to be ‘essential’; 43.95 percent consider it to be ‘very important’. By way of contrast, 21.57 percent of the self employed consider ‘good training provision’ to be ‘not very important’.
101
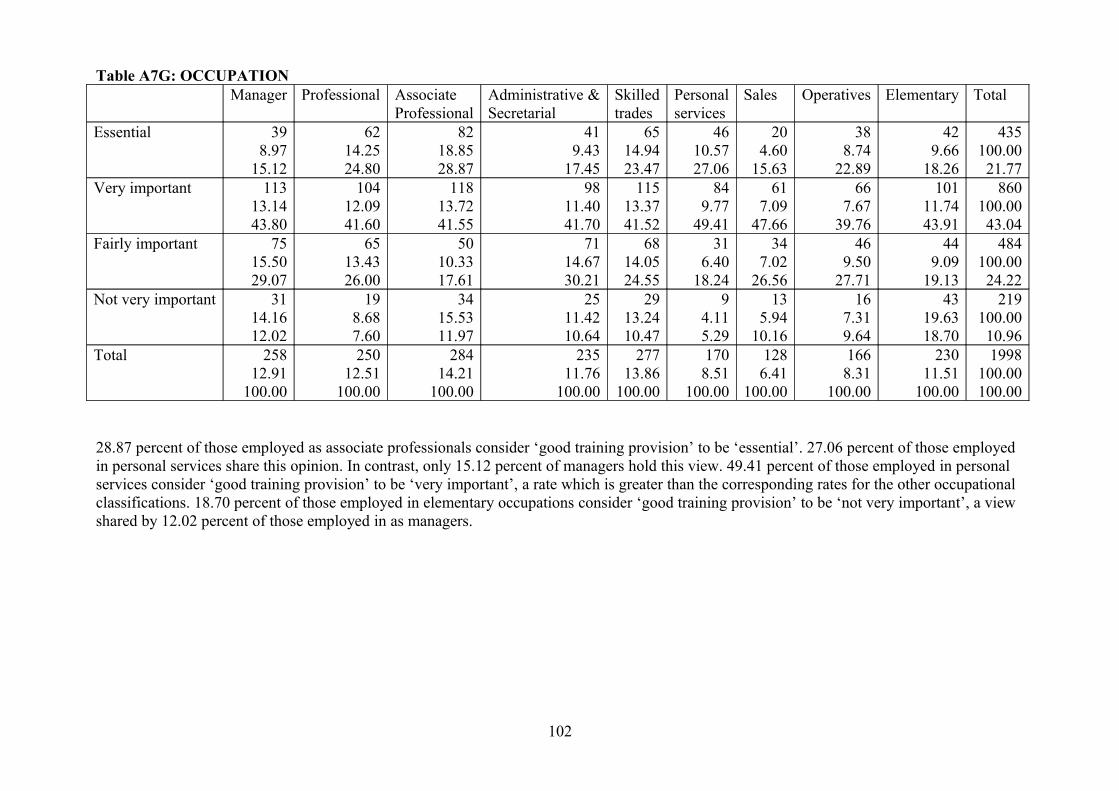
Table A7G: OCCUPATIONManager Professional Associate
ProfessionalAdministrative &Secretarial
Skilledtrades
Personal services
Sales Operatives Elementary Total
Essential 398.97
15.12
6214.2524.80
8218.8528.87
419.43
17.45
6514.9423.47
4610.5727.06
204.60
15.63
388.74
22.89
429.66
18.26
435100.0021.77
Very important 11313.1443.80
10412.0941.60
11813.7241.55
9811.4041.70
11513.3741.52
849.77
49.41
617.09
47.66
667.67
39.76
10111.7443.91
860100.0043.04
Fairly important 7515.5029.07
6513.4326.00
5010.3317.61
7114.6730.21
6814.0524.55
316.40
18.24
347.02
26.56
469.50
27.71
449.09
19.13
484100.0024.22
Not very important 3114.1612.02
198.687.60
3415.5311.97
2511.4210.64
2913.2410.47
94.115.29
135.94
10.16
167.319.64
4319.6318.70
219100.0010.96
Total 25812.91
100.00
25012.51
100.00
28414.21
100.00
23511.76
100.00
27713.86
100.00
1708.51
100.00
1286.41
100.00
1668.31
100.00
23011.51
100.00
1998100.00100.00
28.87 percent of those employed as associate professionals consider ‘good training provision’ to be ‘essential’. 27.06 percent of those employed in personal services share this opinion. In contrast, only 15.12 percent of managers hold this view. 49.41 percent of those employed in personal services consider ‘good training provision’ to be ‘very important’, a rate which is greater than the corresponding rates for the other occupational classifications. 18.70 percent of those employed in elementary occupations consider ‘good training provision’ to be ‘not very important’, a view shared by 12.02 percent of those employed in as managers.
102
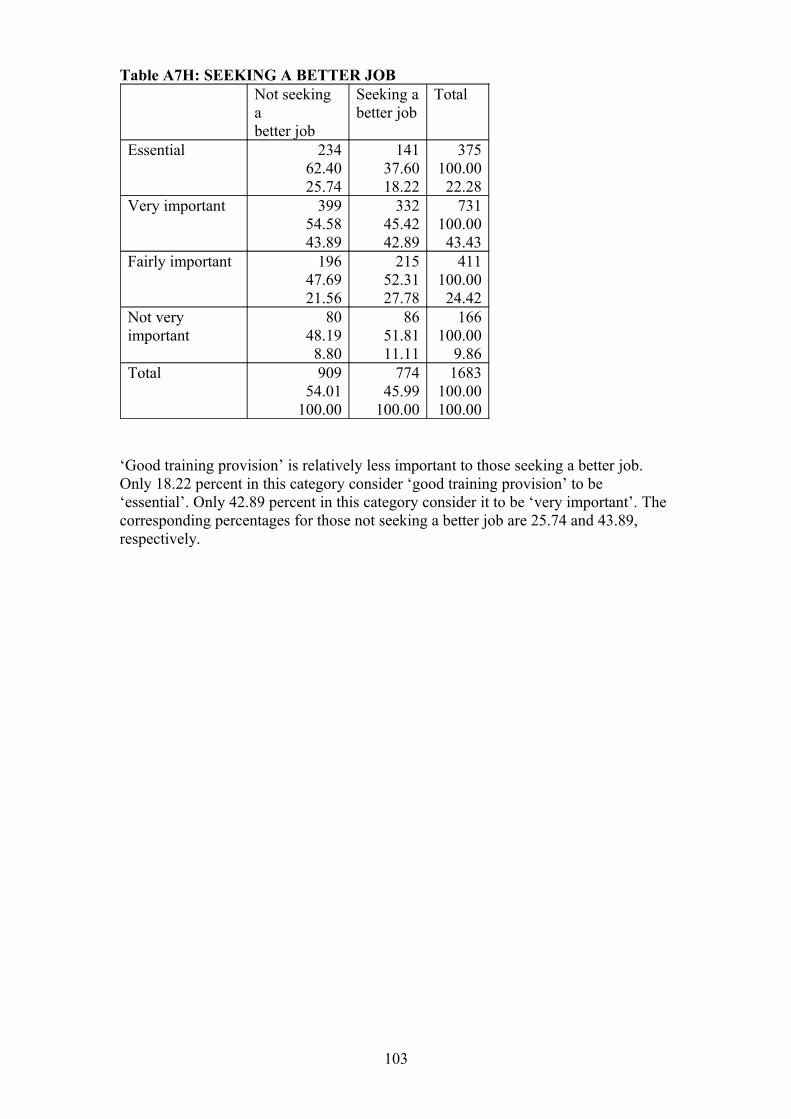
Table A7H: SEEKING A BETTER JOBNot seeking abetter job
Seeking a better job
Total
Essential 23462.4025.74
14137.6018.22
375100.0022.28
Very important 39954.5843.89
33245.4242.89
731100.0043.43
Fairly important 19647.6921.56
21552.3127.78
411100.0024.42
Not very important
8048.198.80
8651.8111.11
166100.00
9.86Total 909
54.01100.00
77445.99
100.00
1683100.00100.00
‘Good training provision’ is relatively less important to those seeking a better job. Only 18.22 percent in this category consider ‘good training provision’ to be ‘essential’. Only 42.89 percent in this category consider it to be ‘very important’. The corresponding percentages for those not seeking a better job are 25.74 and 43.89, respectively.
103

Table A8. Results of the Cross Tabulation of ‘Good Relations with your Supervisor’Variable Value of
Pearson Chi-squared Statistic
StatisticalSignificance
Value of Cramer’s V
Gender (3) 71.0484 0.000 0.1888Age (9) 20.0545 0.018 0.0579Marital status (3) 8.7775 0.032 0.0665Financially dependent child (3) 2.9487 0.400 0.0385Highest qualification held (12) 7.7817 0.802 0.0361Work experience (12) 17.6907 0.125 0.0546Working full time (3) 14.5035 0.002 0.0853In a permanent job (3) 10.1089 0.018 0.0755Working in a supervisory/managerial capacity
(3) 2.8618 0.413 0.0405
Tenure (12) 14.9091 0.246 0.0499Whether has more than 1 job (3) 7.3935 0.060 0.0609Whether a member of a union or staff association
(3) 19.5282 0.000 0.0991
Sector of employment (6) 4.1208 0.660 0.0341Whether working as an employee or self employed
(3) 202.9521 0.000 0.3191
Occupation (24) 57.3615 0.000 0.0979Whether seeking a better job (3) 5.1414 0.162 0.0533
The tables which follow present the detail of the cross tabulation results which are statistically significant at (p < 0.05) for the job attribute preference ‘good relations with your supervisor’. As reported in Table A8, 8 cross tabulations produce statistically significant results, being gender, age, marital status, whether working full time, whether in a full time job, whether a member of a union or staff association, employment status and occupation.
104
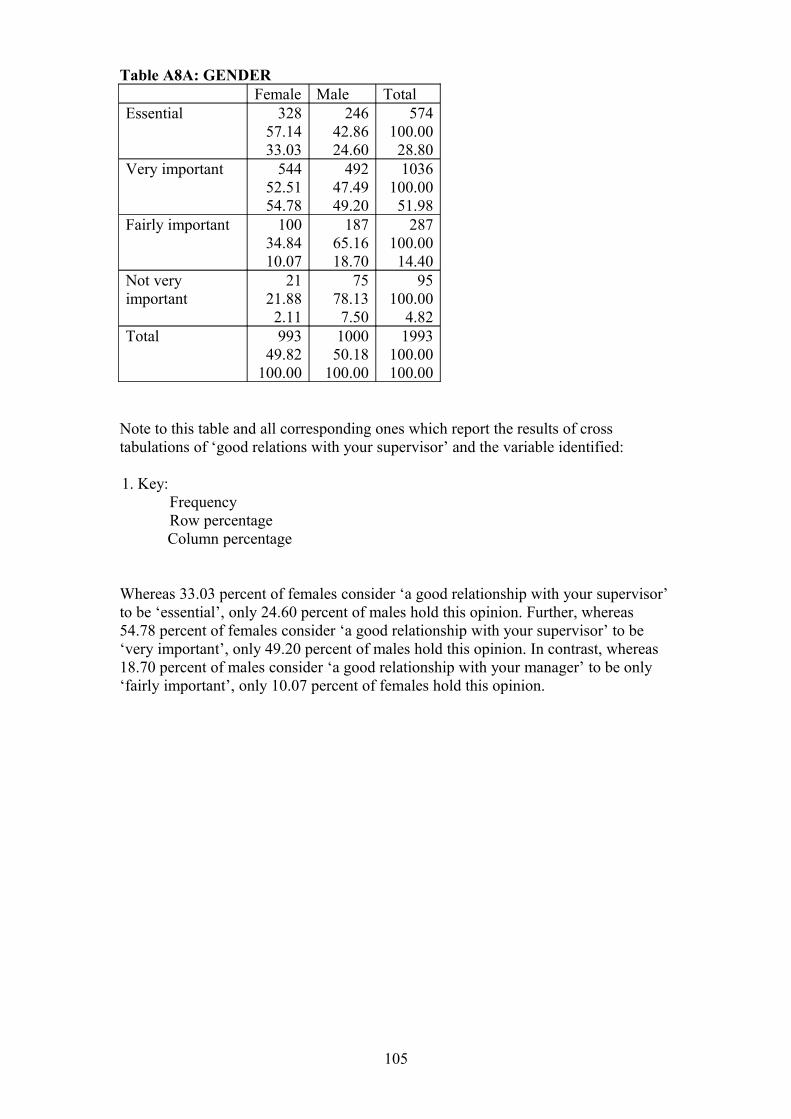
Table A8A: GENDERFemale Male Total
Essential 32857.1433.03
24642.8624.60
574100.0028.80
Very important 54452.5154.78
49247.4949.20
1036100.0051.98
Fairly important 10034.8410.07
18765.1618.70
287100.0014.40
Not very important
2121.882.11
7578.137.50
95100.00
4.82Total 993
49.82100.00
100050.18
100.00
1993100.00100.00
Note to this table and all corresponding ones which report the results of cross tabulations of ‘good relations with your supervisor’ and the variable identified:
1. Key:FrequencyRow percentageColumn percentage
Whereas 33.03 percent of females consider ‘a good relationship with your supervisor’ to be ‘essential’, only 24.60 percent of males hold this opinion. Further, whereas 54.78 percent of females consider ‘a good relationship with your supervisor’ to be ‘very important’, only 49.20 percent of males hold this opinion. In contrast, whereas 18.70 percent of males consider ‘a good relationship with your manager’ to be only ‘fairly important’, only 10.07 percent of females hold this opinion.
105
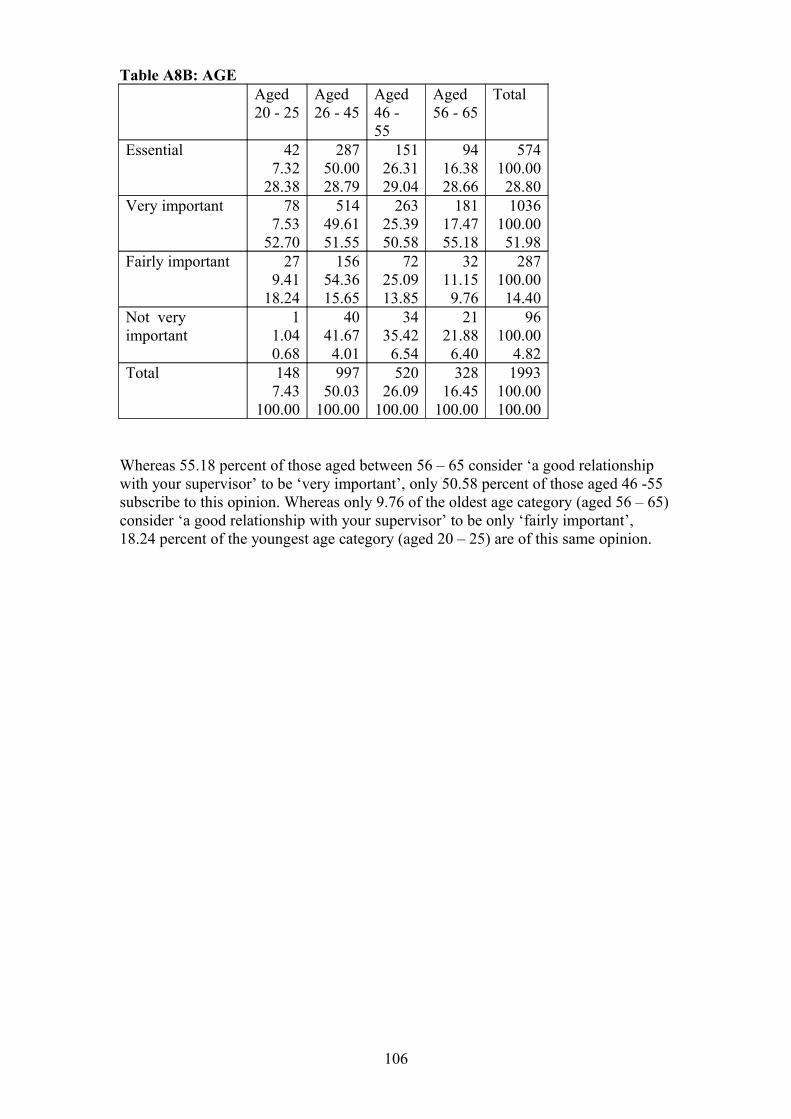
Table A8B: AGEAged20 - 25
Aged26 - 45
Aged46 - 55
Aged56 - 65
Total
Essential 427.32
28.38
28750.0028.79
15126.3129.04
9416.3828.66
574100.0028.80
Very important 787.53
52.70
51449.6151.55
26325.3950.58
18117.4755.18
1036100.0051.98
Fairly important 279.41
18.24
15654.3615.65
7225.0913.85
3211.159.76
287100.0014.40
Not very important
11.040.68
4041.674.01
3435.426.54
2121.886.40
96100.00
4.82Total 148
7.43100.00
99750.03
100.00
52026.09
100.00
32816.45
100.00
1993100.00100.00
Whereas 55.18 percent of those aged between 56 – 65 consider ‘a good relationship with your supervisor’ to be ‘very important’, only 50.58 percent of those aged 46 -55 subscribe to this opinion. Whereas only 9.76 of the oldest age category (aged 56 – 65) consider ‘a good relationship with your supervisor’ to be only ‘fairly important’, 18.24 percent of the youngest age category (aged 20 – 25) are of this same opinion.
106
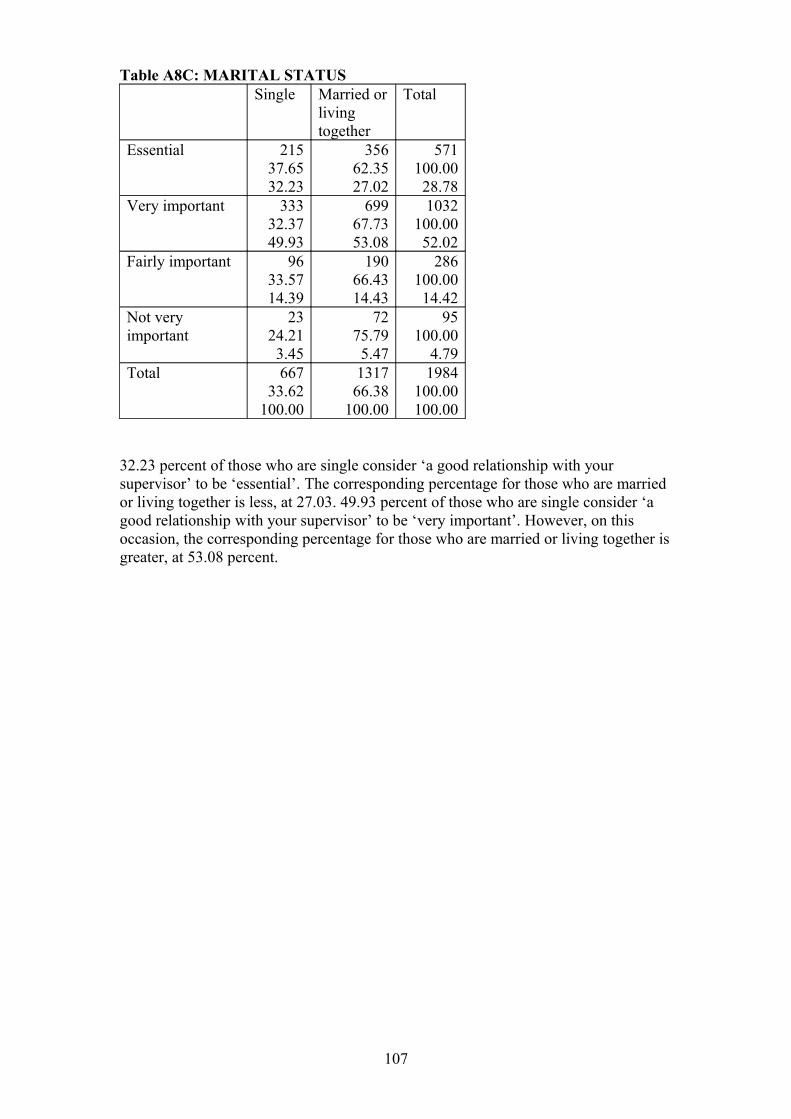
Table A8C: MARITAL STATUSSingle Married or
living together
Total
Essential 21537.6532.23
35662.3527.02
571100.0028.78
Very important 33332.3749.93
69967.7353.08
1032100.0052.02
Fairly important 9633.5714.39
19066.4314.43
286100.0014.42
Not very important
2324.213.45
7275.795.47
95100.00
4.79Total 667
33.62100.00
131766.38
100.00
1984100.00100.00
32.23 percent of those who are single consider ‘a good relationship with your supervisor’ to be ‘essential’. The corresponding percentage for those who are married or living together is less, at 27.03. 49.93 percent of those who are single consider ‘a good relationship with your supervisor’ to be ‘very important’. However, on this occasion, the corresponding percentage for those who are married or living together is greater, at 53.08 percent.
107
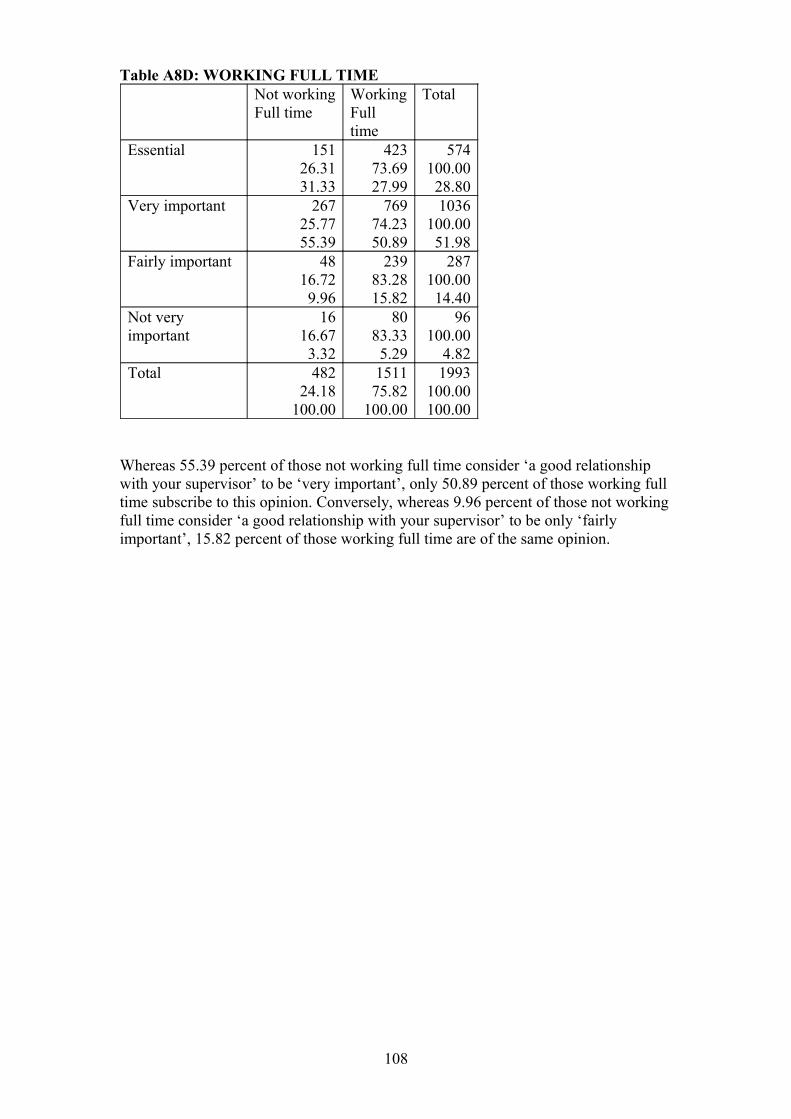
Table A8D: WORKING FULL TIMENot workingFull time
WorkingFull time
Total
Essential 15126.3131.33
42373.6927.99
574100.0028.80
Very important 26725.7755.39
76974.2350.89
1036100.0051.98
Fairly important 4816.729.96
23983.2815.82
287100.0014.40
Not very important
1616.673.32
8083.335.29
96100.00
4.82Total 482
24.18100.00
151175.82
100.00
1993100.00100.00
Whereas 55.39 percent of those not working full time consider ‘a good relationship with your supervisor’ to be ‘very important’, only 50.89 percent of those working full time subscribe to this opinion. Conversely, whereas 9.96 percent of those not working full time consider ‘a good relationship with your supervisor’ to be only ‘fairly important’, 15.82 percent of those working full time are of the same opinion.
108
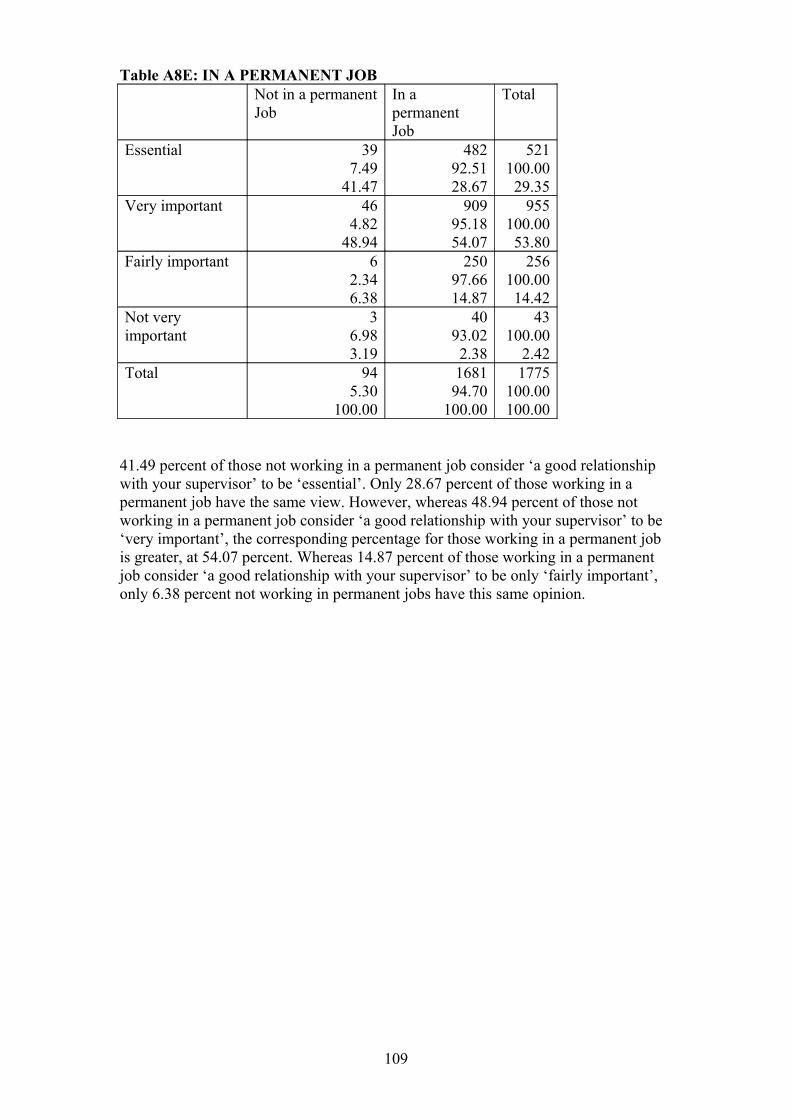
Table A8E: IN A PERMANENT JOBNot in a permanentJob
In a permanentJob
Total
Essential 397.49
41.47
48292.5128.67
521100.0029.35
Very important 464.82
48.94
90995.1854.07
955100.0053.80
Fairly important 62.346.38
25097.6614.87
256100.0014.42
Not very important
36.983.19
4093.022.38
43100.00
2.42Total 94
5.30100.00
168194.70
100.00
1775100.00100.00
41.49 percent of those not working in a permanent job consider ‘a good relationship with your supervisor’ to be ‘essential’. Only 28.67 percent of those working in a permanent job have the same view. However, whereas 48.94 percent of those not working in a permanent job consider ‘a good relationship with your supervisor’ to be ‘very important’, the corresponding percentage for those working in a permanent job is greater, at 54.07 percent. Whereas 14.87 percent of those working in a permanent job consider ‘a good relationship with your supervisor’ to be only ‘fairly important’, only 6.38 percent not working in permanent jobs have this same opinion.
109
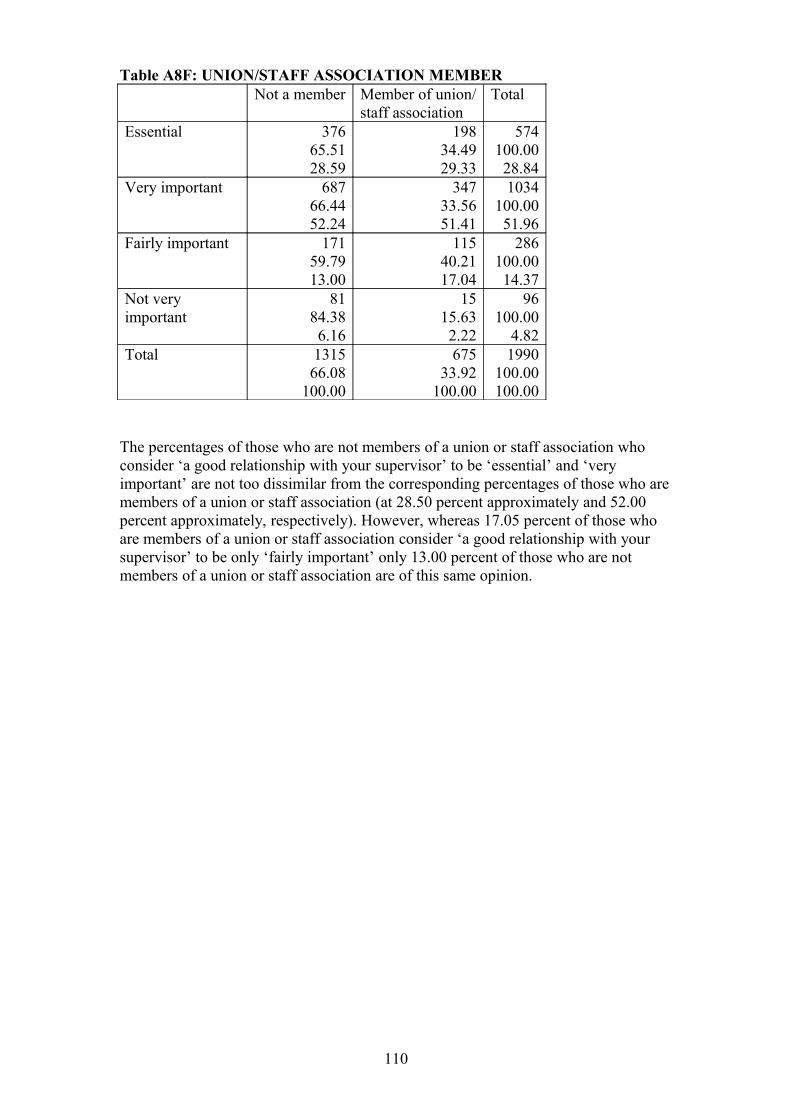
Table A8F: UNION/STAFF ASSOCIATION MEMBERNot a member Member of union/
staff associationTotal
Essential 37665.5128.59
19834.4929.33
574100.0028.84
Very important 68766.4452.24
34733.5651.41
1034100.0051.96
Fairly important 17159.7913.00
11540.2117.04
286100.0014.37
Not very important
8184.386.16
1515.632.22
96100.00
4.82Total 1315
66.08100.00
67533.92
100.00
1990100.00100.00
The percentages of those who are not members of a union or staff association who consider ‘a good relationship with your supervisor’ to be ‘essential’ and ‘very important’ are not too dissimilar from the corresponding percentages of those who are members of a union or staff association (at 28.50 percent approximately and 52.00 percent approximately, respectively). However, whereas 17.05 percent of those who are members of a union or staff association consider ‘a good relationship with your supervisor’ to be only ‘fairly important’ only 13.00 percent of those who are not members of a union or staff association are of this same opinion.
110
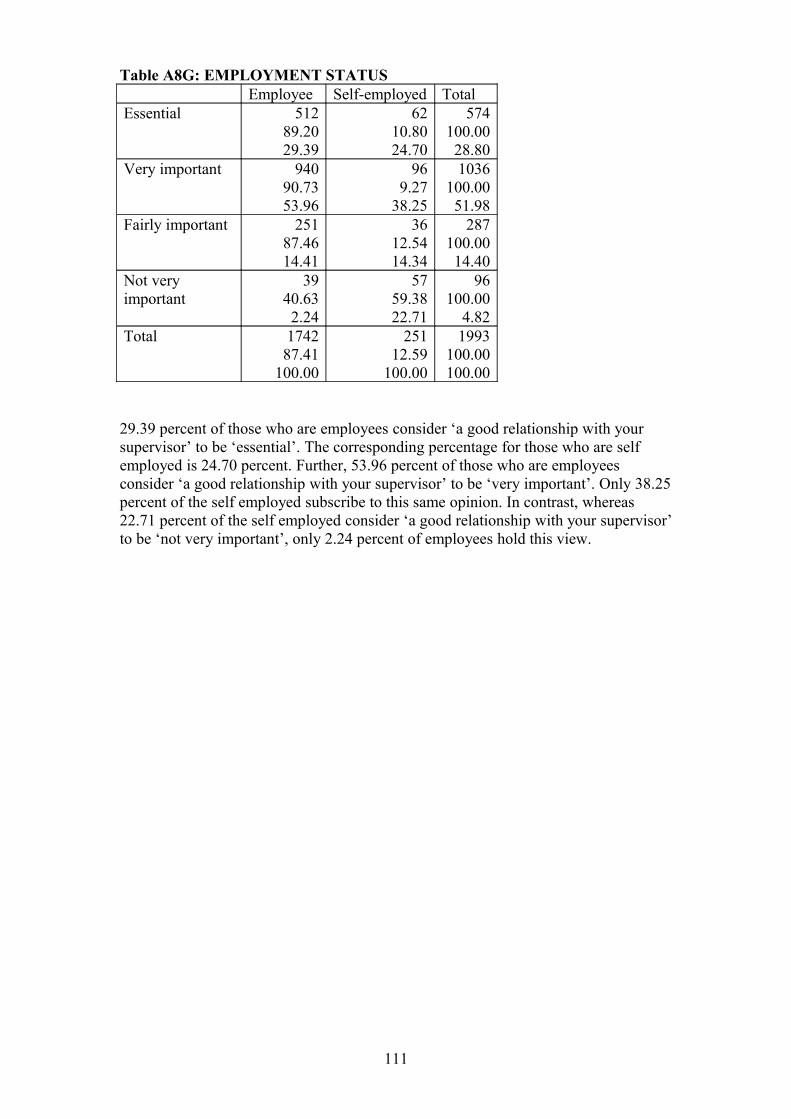
Table A8G: EMPLOYMENT STATUSEmployee Self-employed Total
Essential 51289.2029.39
6210.8024.70
574100.0028.80
Very important 94090.7353.96
969.27
38.25
1036100.0051.98
Fairly important 25187.4614.41
3612.5414.34
287100.0014.40
Not very important
3940.632.24
5759.3822.71
96100.00
4.82Total 1742
87.41100.00
25112.59
100.00
1993100.00100.00
29.39 percent of those who are employees consider ‘a good relationship with your supervisor’ to be ‘essential’. The corresponding percentage for those who are self employed is 24.70 percent. Further, 53.96 percent of those who are employees consider ‘a good relationship with your supervisor’ to be ‘very important’. Only 38.25 percent of the self employed subscribe to this same opinion. In contrast, whereas 22.71 percent of the self employed consider ‘a good relationship with your supervisor’ to be ‘not very important’, only 2.24 percent of employees hold this view.
111
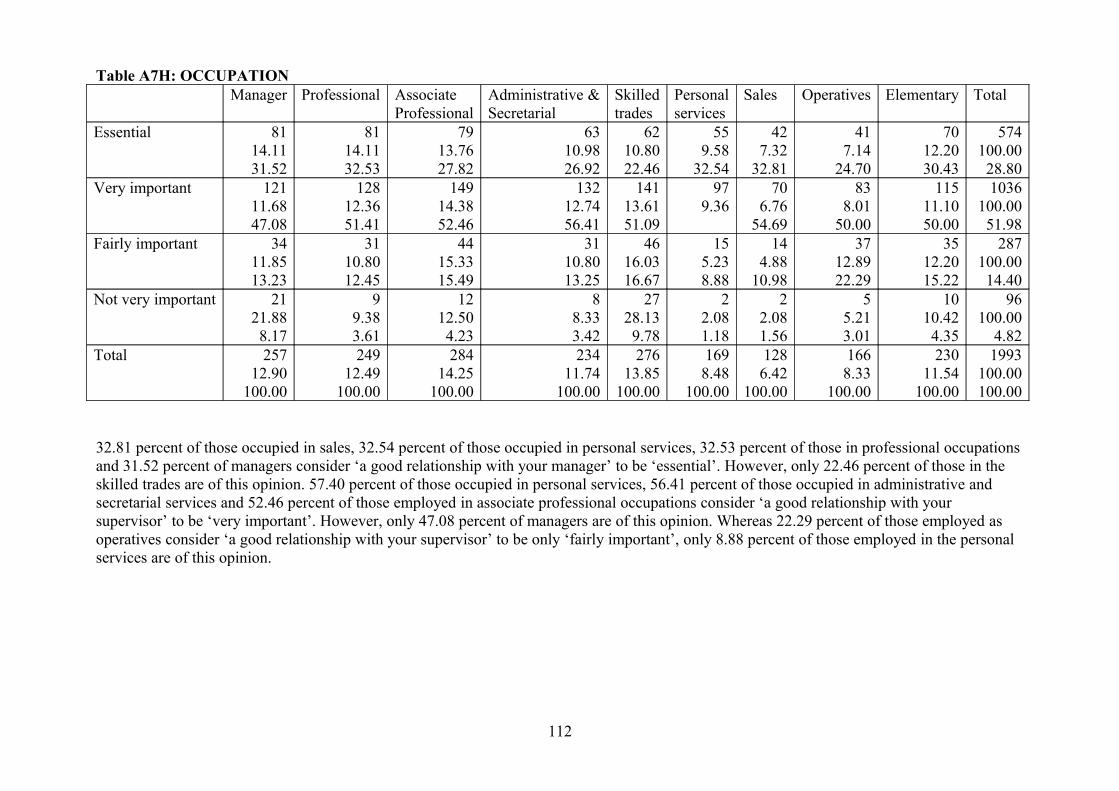
Table A7H: OCCUPATIONManager Professional Associate
ProfessionalAdministrative &Secretarial
Skilledtrades
Personal services
Sales Operatives Elementary Total
Essential 8114.1131.52
8114.1132.53
7913.7627.82
6310.9826.92
6210.8022.46
559.58
32.54
427.32
32.81
417.14
24.70
7012.2030.43
574100.0028.80
Very important 12111.6847.08
12812.3651.41
14914.3852.46
13212.7456.41
14113.6151.09
979.36
706.76
54.69
838.01
50.00
11511.1050.00
1036100.0051.98
Fairly important 3411.8513.23
3110.8012.45
4415.3315.49
3110.8013.25
4616.0316.67
155.238.88
144.88
10.98
3712.8922.29
3512.2015.22
287100.0014.40
Not very important 2121.888.17
99.383.61
1212.504.23
88.333.42
2728.139.78
22.081.18
22.081.56
55.213.01
1010.424.35
96100.00
4.82Total 257
12.90100.00
24912.49
100.00
28414.25
100.00
23411.74
100.00
27613.85
100.00
1698.48
100.00
1286.42
100.00
1668.33
100.00
23011.54
100.00
1993100.00100.00
32.81 percent of those occupied in sales, 32.54 percent of those occupied in personal services, 32.53 percent of those in professional occupations and 31.52 percent of managers consider ‘a good relationship with your manager’ to be ‘essential’. However, only 22.46 percent of those in the skilled trades are of this opinion. 57.40 percent of those occupied in personal services, 56.41 percent of those occupied in administrative and secretarial services and 52.46 percent of those employed in associate professional occupations consider ‘a good relationship with your supervisor’ to be ‘very important’. However, only 47.08 percent of managers are of this opinion. Whereas 22.29 percent of those employed as operatives consider ‘a good relationship with your supervisor’ to be only ‘fairly important’, only 8.88 percent of those employed in the personal services are of this opinion.
112
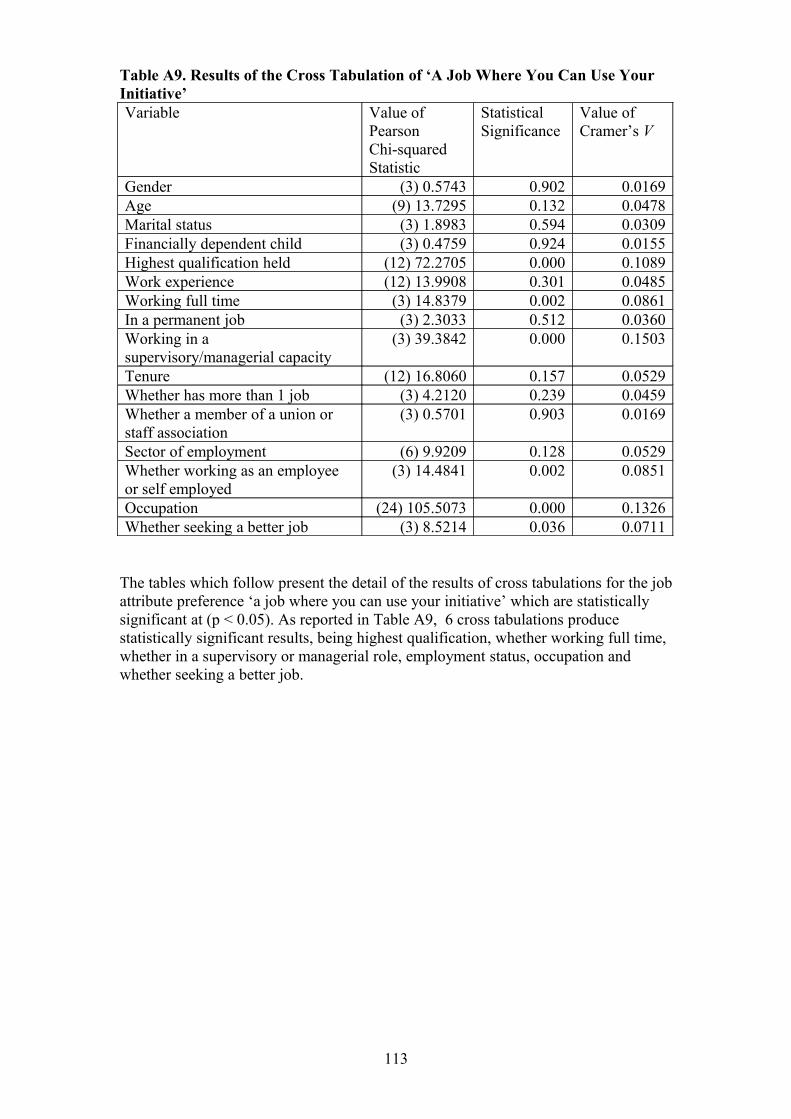
Table A9. Results of the Cross Tabulation of ‘A Job Where You Can Use Your Initiative’Variable Value of
Pearson Chi-squared Statistic
StatisticalSignificance
Value of Cramer’s V
Gender (3) 0.5743 0.902 0.0169Age (9) 13.7295 0.132 0.0478Marital status (3) 1.8983 0.594 0.0309Financially dependent child (3) 0.4759 0.924 0.0155Highest qualification held (12) 72.2705 0.000 0.1089Work experience (12) 13.9908 0.301 0.0485Working full time (3) 14.8379 0.002 0.0861In a permanent job (3) 2.3033 0.512 0.0360Working in a supervisory/managerial capacity
(3) 39.3842 0.000 0.1503
Tenure (12) 16.8060 0.157 0.0529Whether has more than 1 job (3) 4.2120 0.239 0.0459Whether a member of a union or staff association
(3) 0.5701 0.903 0.0169
Sector of employment (6) 9.9209 0.128 0.0529Whether working as an employee or self employed
(3) 14.4841 0.002 0.0851
Occupation (24) 105.5073 0.000 0.1326Whether seeking a better job (3) 8.5214 0.036 0.0711
The tables which follow present the detail of the results of cross tabulations for the job attribute preference ‘a job where you can use your initiative’ which are statistically significant at (p < 0.05). As reported in Table A9, 6 cross tabulations produce statistically significant results, being highest qualification, whether working full time, whether in a supervisory or managerial role, employment status, occupation and whether seeking a better job.
113
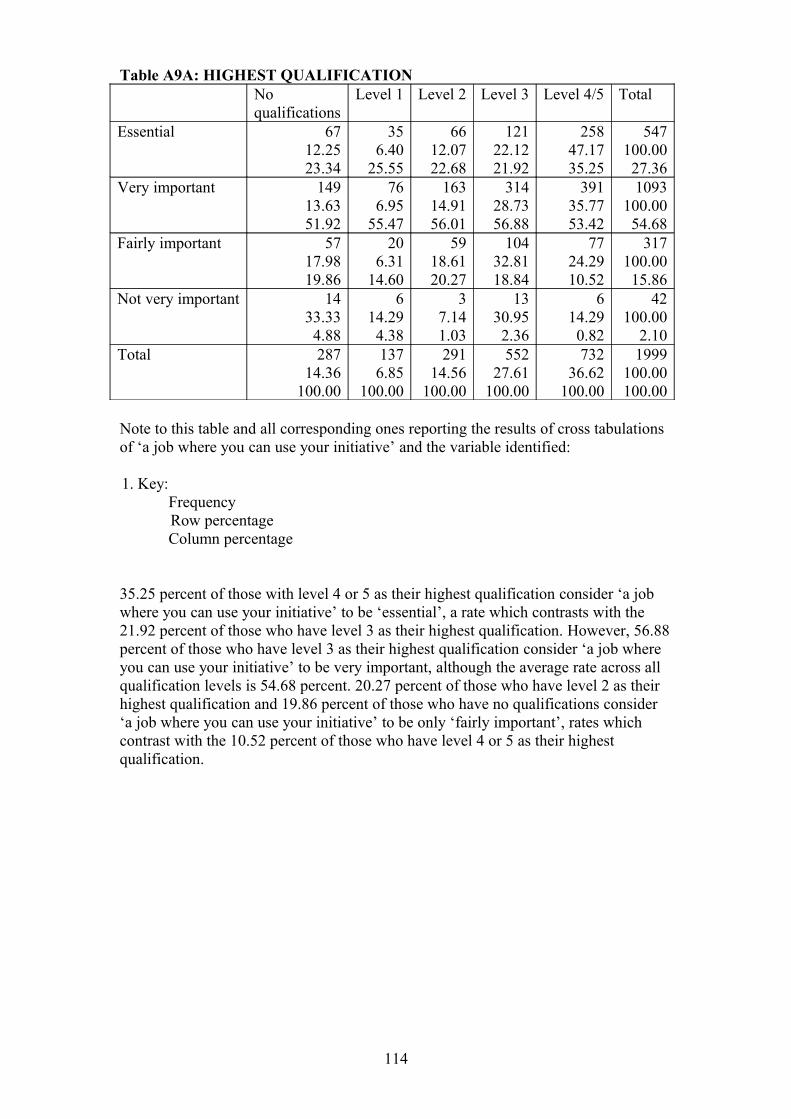
Table A9A: HIGHEST QUALIFICATIONNoqualifications
Level 1 Level 2 Level 3 Level 4/5 Total
Essential 6712.2523.34
356.40
25.55
6612.0722.68
12122.1221.92
25847.1735.25
547100.0027.36
Very important 14913.6351.92
766.95
55.47
16314.9156.01
31428.7356.88
39135.7753.42
1093100.0054.68
Fairly important 5717.9819.86
206.31
14.60
5918.6120.27
10432.8118.84
7724.2910.52
317100.0015.86
Not very important 1433.334.88
614.294.38
37.141.03
1330.952.36
614.290.82
42100.00
2.10Total 287
14.36100.00
1376.85
100.00
29114.56
100.00
55227.61
100.00
73236.62
100.00
1999100.00100.00
Note to this table and all corresponding ones reporting the results of cross tabulations of ‘a job where you can use your initiative’ and the variable identified:
1. Key:FrequencyRow percentageColumn percentage
35.25 percent of those with level 4 or 5 as their highest qualification consider ‘a job where you can use your initiative’ to be ‘essential’, a rate which contrasts with the 21.92 percent of those who have level 3 as their highest qualification. However, 56.88 percent of those who have level 3 as their highest qualification consider ‘a job where you can use your initiative’ to be very important, although the average rate across all qualification levels is 54.68 percent. 20.27 percent of those who have level 2 as their highest qualification and 19.86 percent of those who have no qualifications consider ‘a job where you can use your initiative’ to be only ‘fairly important’, rates which contrast with the 10.52 percent of those who have level 4 or 5 as their highest qualification.
114
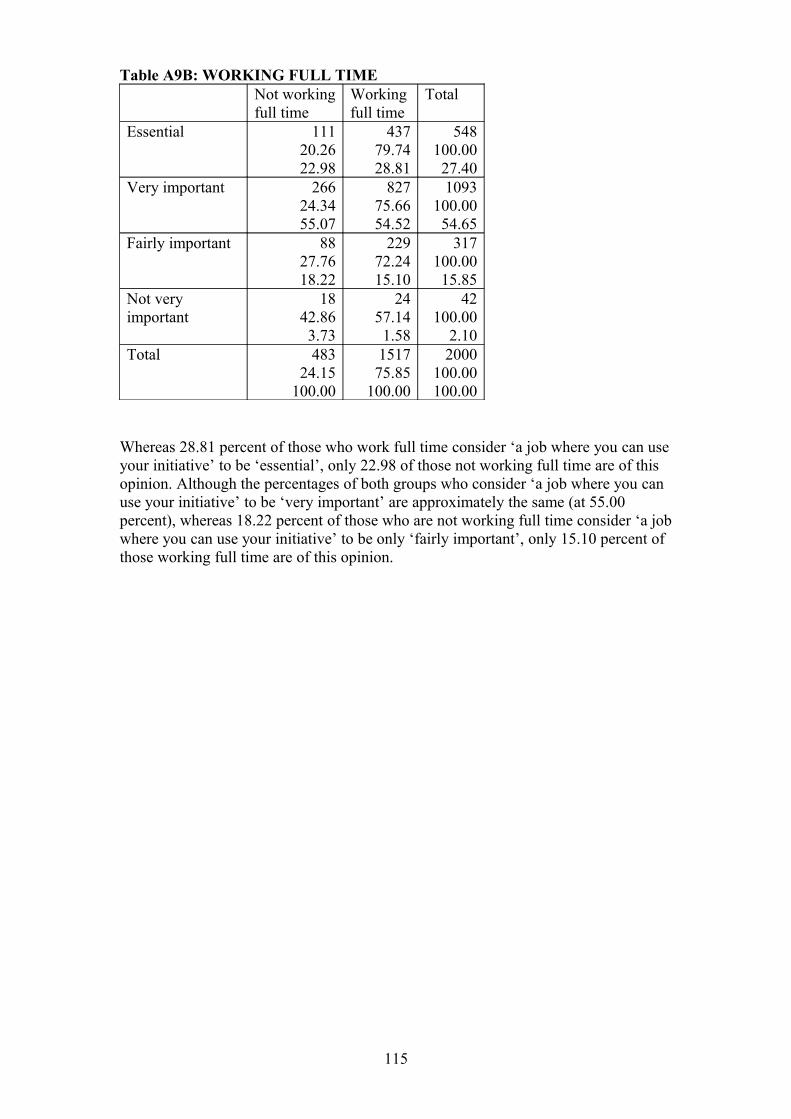
Table A9B: WORKING FULL TIMENot workingfull time
Workingfull time
Total
Essential 11120.2622.98
43779.7428.81
548100.0027.40
Very important 26624.3455.07
82775.6654.52
1093100.0054.65
Fairly important 8827.7618.22
22972.2415.10
317100.0015.85
Not very important
1842.863.73
2457.141.58
42100.00
2.10Total 483
24.15100.00
151775.85
100.00
2000100.00100.00
Whereas 28.81 percent of those who work full time consider ‘a job where you can use your initiative’ to be ‘essential’, only 22.98 of those not working full time are of this opinion. Although the percentages of both groups who consider ‘a job where you can use your initiative’ to be ‘very important’ are approximately the same (at 55.00 percent), whereas 18.22 percent of those who are not working full time consider ‘a job where you can use your initiative’ to be only ‘fairly important’, only 15.10 percent of those working full time are of this opinion.
115
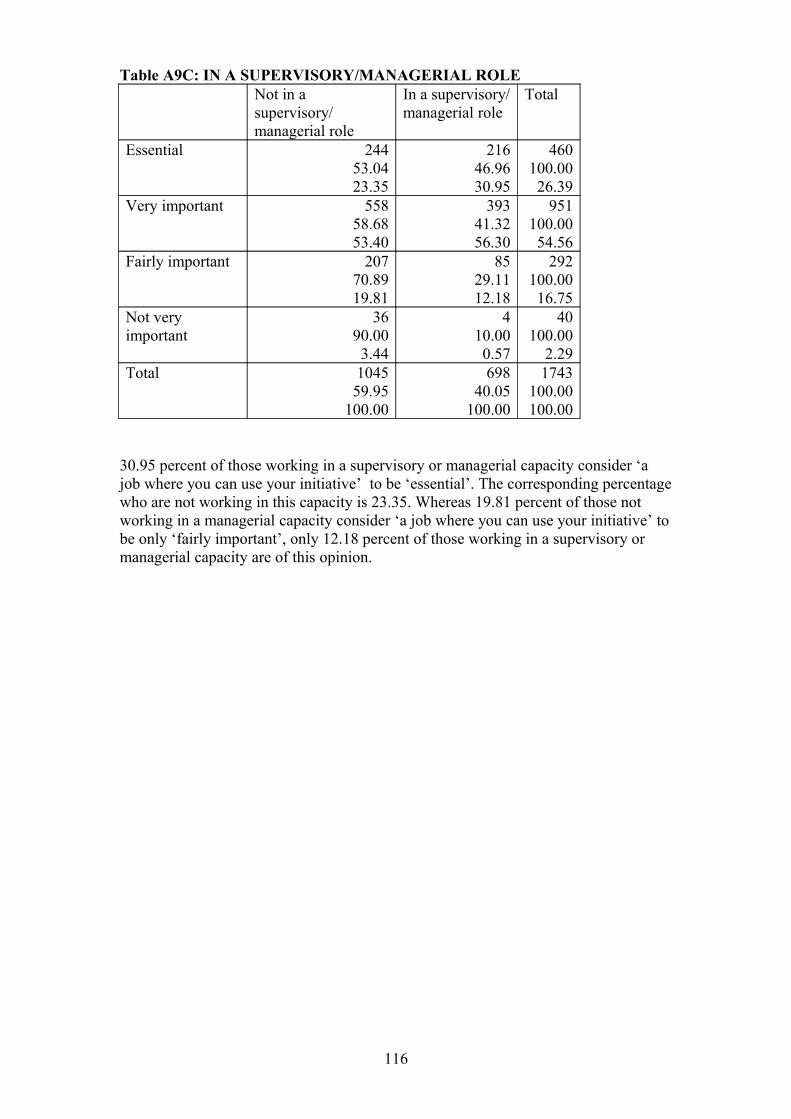
Table A9C: IN A SUPERVISORY/MANAGERIAL ROLENot in a supervisory/managerial role
In a supervisory/managerial role
Total
Essential 24453.0423.35
21646.9630.95
460100.0026.39
Very important 55858.6853.40
39341.3256.30
951100.0054.56
Fairly important 20770.8919.81
8529.1112.18
292100.0016.75
Not very important
3690.003.44
410.000.57
40100.00
2.29Total 1045
59.95100.00
69840.05
100.00
1743100.00100.00
30.95 percent of those working in a supervisory or managerial capacity consider ‘a job where you can use your initiative’ to be ‘essential’. The corresponding percentage who are not working in this capacity is 23.35. Whereas 19.81 percent of those not working in a managerial capacity consider ‘a job where you can use your initiative’ to be only ‘fairly important’, only 12.18 percent of those working in a supervisory or managerial capacity are of this opinion.
116

Table A9D: EMPLOYMENT STATUSEmployee Self-employed Total
Essential 46083.9426.39
8816.0634.24
548100.0027.40
Very important 95187.0154.56
14212.9955.25
1093100.0054.65
Fairly important 29292.1116.75
257.899.73
317100.0015.85
Not very important
4095.242.29
24.760.78
42100.00
2.10Total 1743
87.15100.00
25712.85
100.00
2000100.00100.00
Although the percentages of those who consider ‘a job where you can use your initiative’ to be ‘very important’ are approximately the same for both employees and the self employed (at 54.50 percent), whereas 34.24 percent of the latter consider ‘a job where you can use your initiative’ to be ‘essential’, only 26.39 percent of the former have this opinion. Whereas 16.75 percent of employees consider ‘a job where you can use your initiative’ to be only ‘fairly important’, only 9.73 percent of the self employed are of this opinion.
117
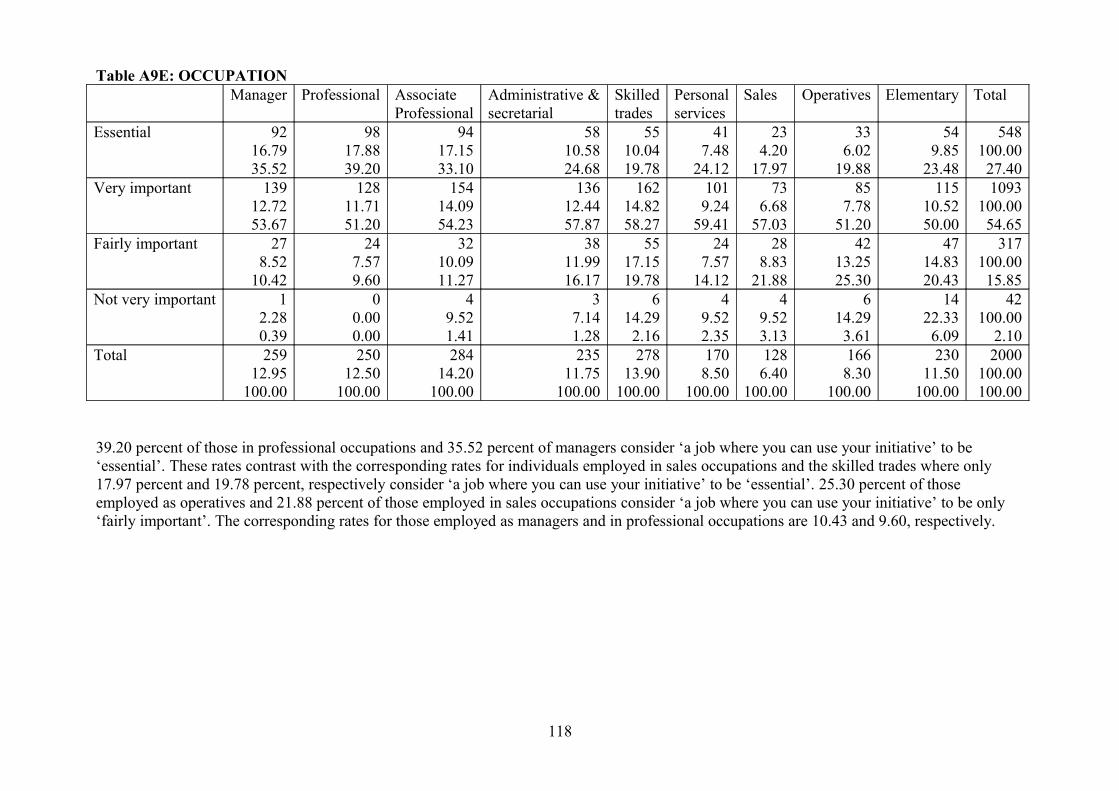
Table A9E: OCCUPATIONManager Professional Associate
ProfessionalAdministrative &secretarial
Skilledtrades
Personal services
Sales Operatives Elementary Total
Essential 9216.7935.52
9817.8839.20
9417.1533.10
5810.5824.68
5510.0419.78
417.48
24.12
234.20
17.97
336.02
19.88
549.85
23.48
548100.0027.40
Very important 13912.7253.67
12811.7151.20
15414.0954.23
13612.4457.87
16214.8258.27
1019.24
59.41
736.68
57.03
857.78
51.20
11510.5250.00
1093100.0054.65
Fairly important 278.52
10.42
247.579.60
3210.0911.27
3811.9916.17
5517.1519.78
247.57
14.12
288.83
21.88
4213.2525.30
4714.8320.43
317100.0015.85
Not very important 12.280.39
00.000.00
49.521.41
37.141.28
614.292.16
49.522.35
49.523.13
614.293.61
1422.336.09
42100.00
2.10Total 259
12.95100.00
25012.50
100.00
28414.20
100.00
23511.75
100.00
27813.90
100.00
1708.50
100.00
1286.40
100.00
1668.30
100.00
23011.50
100.00
2000100.00100.00
39.20 percent of those in professional occupations and 35.52 percent of managers consider ‘a job where you can use your initiative’ to be ‘essential’. These rates contrast with the corresponding rates for individuals employed in sales occupations and the skilled trades where only 17.97 percent and 19.78 percent, respectively consider ‘a job where you can use your initiative’ to be ‘essential’. 25.30 percent of those employed as operatives and 21.88 percent of those employed in sales occupations consider ‘a job where you can use your initiative’ to be only ‘fairly important’. The corresponding rates for those employed as managers and in professional occupations are 10.43 and 9.60, respectively.
118
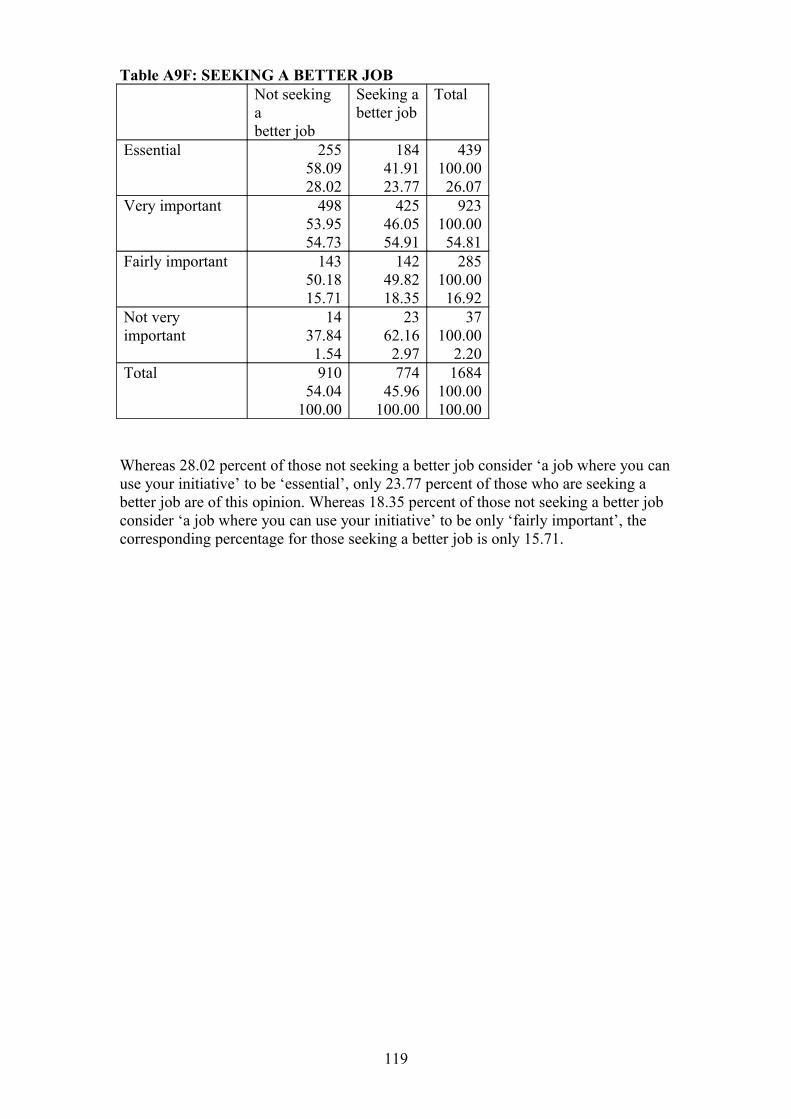
Table A9F: SEEKING A BETTER JOBNot seeking abetter job
Seeking a better job
Total
Essential 25558.0928.02
18441.9123.77
439100.0026.07
Very important 49853.9554.73
42546.0554.91
923100.0054.81
Fairly important 14350.1815.71
14249.8218.35
285100.0016.92
Not very important
1437.841.54
2362.162.97
37100.00
2.20Total 910
54.04100.00
77445.96
100.00
1684100.00100.00
Whereas 28.02 percent of those not seeking a better job consider ‘a job where you can use your initiative’ to be ‘essential’, only 23.77 percent of those who are seeking a better job are of this opinion. Whereas 18.35 percent of those not seeking a better job consider ‘a job where you can use your initiative’ to be only ‘fairly important’, the corresponding percentage for those seeking a better job is only 15.71.
119

Table A10. Results of the Cross Tabulation of ‘Work You Like Doing’Variable Value of
Pearson Chi-squared Statistic
StatisticalSignificance
Value of Cramer’s V
Gender (3) 16.3340 0.001 0.0904Age (9) 9.2554 0.414 0.0393Marital status (3) 3.8673 0.276 0.0441Financially dependent child (3) 5.1090 0.164 0.0506Highest qualification held (12) 54.8902 0.000 0.0957Work experience (12) 23.5327 0.024 0.0628Working full time (3) 6.6508 0.084 0.0577In a permanent job (3) 7.8194 0.050 0.0664Working in a supervisory/managerial capacity
(3) 10.0662 0.018 0.0760
Tenure (12) 13.0252 0.367 0.0466Whether has more than 1 job (3) 6.6115 0.085 0.0575Whether a member of a union or staff association
(3) 4.6047 0.203 0.0480
Sector of employment (6) 18.3954 0.005 0.0720Whether working as an employee or self employed
(3) 15.4121 0.001 0.0878
Occupation (24) 95.3598 0.000 0.1261Whether seeking a better job (3) 5.5753 0.134 0.0575
The tables which follow present the detail of the cross tabulation results for the job attribute preference ‘work you like doing’ which are statistically significant at (p < 0.05). As reported in Table A10, 7 cross tabulations produce statistically significant results, being gender, highest qualification, work experience, whether in a supervisory or managerial role, sector of employment, employment status and occupation.
120
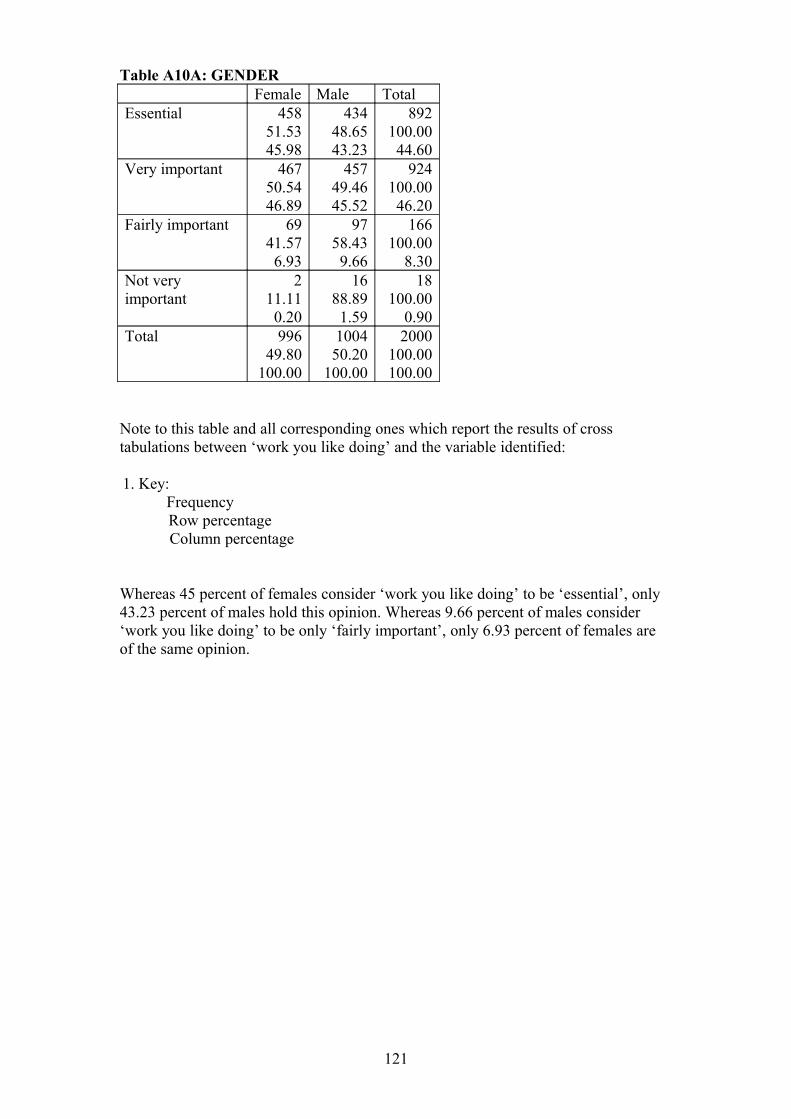
Table A10A: GENDERFemale Male Total
Essential 45851.5345.98
43448.6543.23
892100.0044.60
Very important 46750.5446.89
45749.4645.52
924100.0046.20
Fairly important 6941.576.93
9758.439.66
166100.00
8.30Not very important
211.110.20
1688.891.59
18100.00
0.90Total 996
49.80100.00
100450.20
100.00
2000100.00100.00
Note to this table and all corresponding ones which report the results of cross tabulations between ‘work you like doing’ and the variable identified:
1. Key:FrequencyRow percentageColumn percentage
Whereas 45 percent of females consider ‘work you like doing’ to be ‘essential’, only 43.23 percent of males hold this opinion. Whereas 9.66 percent of males consider ‘work you like doing’ to be only ‘fairly important’, only 6.93 percent of females are of the same opinion.
121
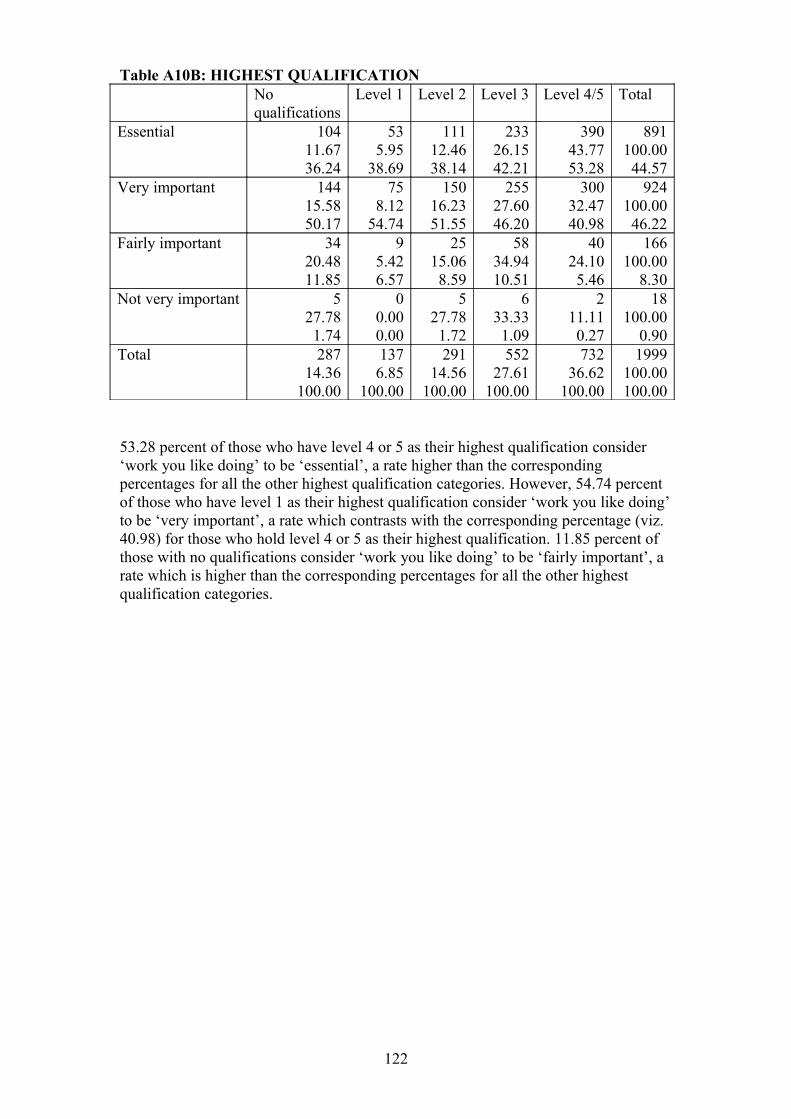
Table A10B: HIGHEST QUALIFICATIONNoqualifications
Level 1 Level 2 Level 3 Level 4/5 Total
Essential 10411.6736.24
535.95
38.69
11112.4638.14
23326.1542.21
39043.7753.28
891100.0044.57
Very important 14415.5850.17
758.12
54.74
15016.2351.55
25527.6046.20
30032.4740.98
924100.0046.22
Fairly important 3420.4811.85
95.426.57
2515.068.59
5834.9410.51
4024.105.46
166100.00
8.30Not very important 5
27.781.74
00.000.00
527.781.72
633.331.09
211.110.27
18100.00
0.90Total 287
14.36100.00
1376.85
100.00
29114.56
100.00
55227.61
100.00
73236.62
100.00
1999100.00100.00
53.28 percent of those who have level 4 or 5 as their highest qualification consider ‘work you like doing’ to be ‘essential’, a rate higher than the corresponding percentages for all the other highest qualification categories. However, 54.74 percent of those who have level 1 as their highest qualification consider ‘work you like doing’ to be ‘very important’, a rate which contrasts with the corresponding percentage (viz. 40.98) for those who hold level 4 or 5 as their highest qualification. 11.85 percent of those with no qualifications consider ‘work you like doing’ to be ‘fairly important’, a rate which is higher than the corresponding percentages for all the other highest qualification categories.
122
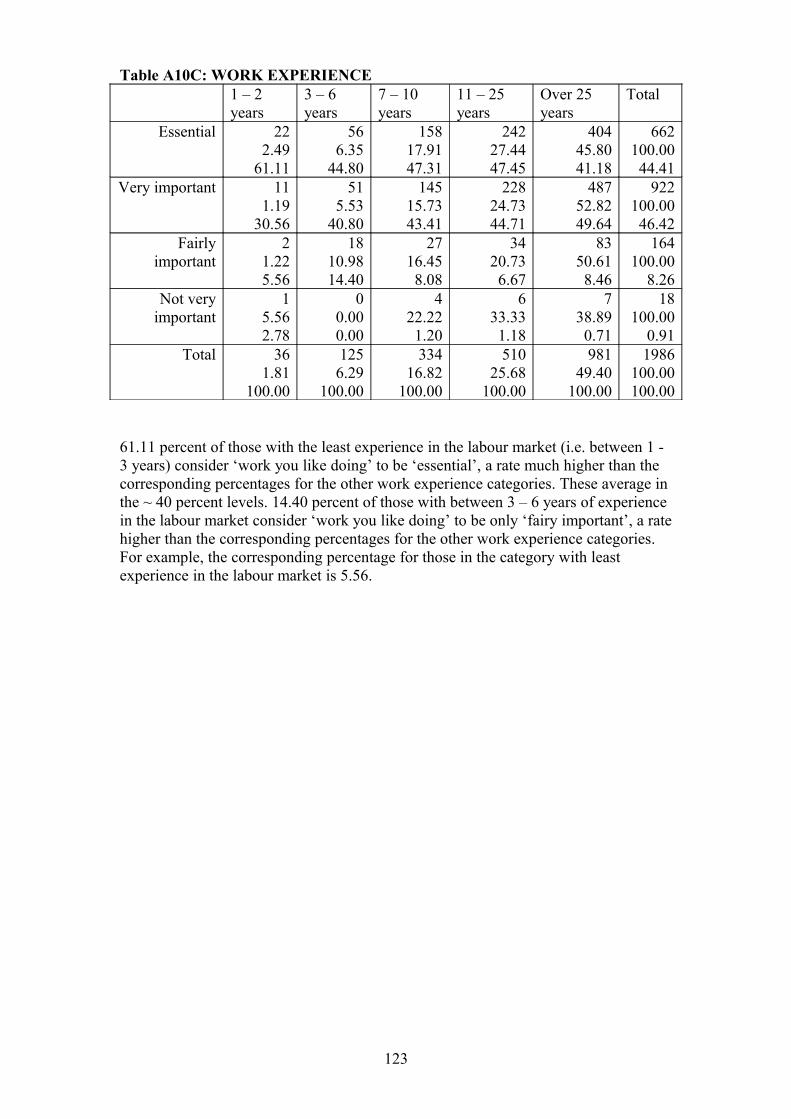
Table A10C: WORK EXPERIENCE1 – 2 years
3 – 6 years
7 – 10 years
11 – 25 years
Over 25 years
Total
Essential 222.49
61.11
566.35
44.80
15817.9147.31
24227.4447.45
40445.8041.18
662100.0044.41
Very important 111.19
30.56
515.53
40.80
14515.7343.41
22824.7344.71
48752.8249.64
922100.0046.42
Fairly important
21.225.56
1810.9814.40
2716.458.08
3420.736.67
8350.618.46
164100.00
8.26Not very
important1
5.562.78
00.000.00
422.221.20
633.331.18
738.890.71
18100.00
0.91Total 36
1.81100.00
1256.29
100.00
33416.82
100.00
51025.68
100.00
98149.40
100.00
1986100.00100.00
61.11 percent of those with the least experience in the labour market (i.e. between 1 - 3 years) consider ‘work you like doing’ to be ‘essential’, a rate much higher than the corresponding percentages for the other work experience categories. These average in the ~ 40 percent levels. 14.40 percent of those with between 3 – 6 years of experience in the labour market consider ‘work you like doing’ to be only ‘fairy important’, a rate higher than the corresponding percentages for the other work experience categories. For example, the corresponding percentage for those in the category with least experience in the labour market is 5.56.
123
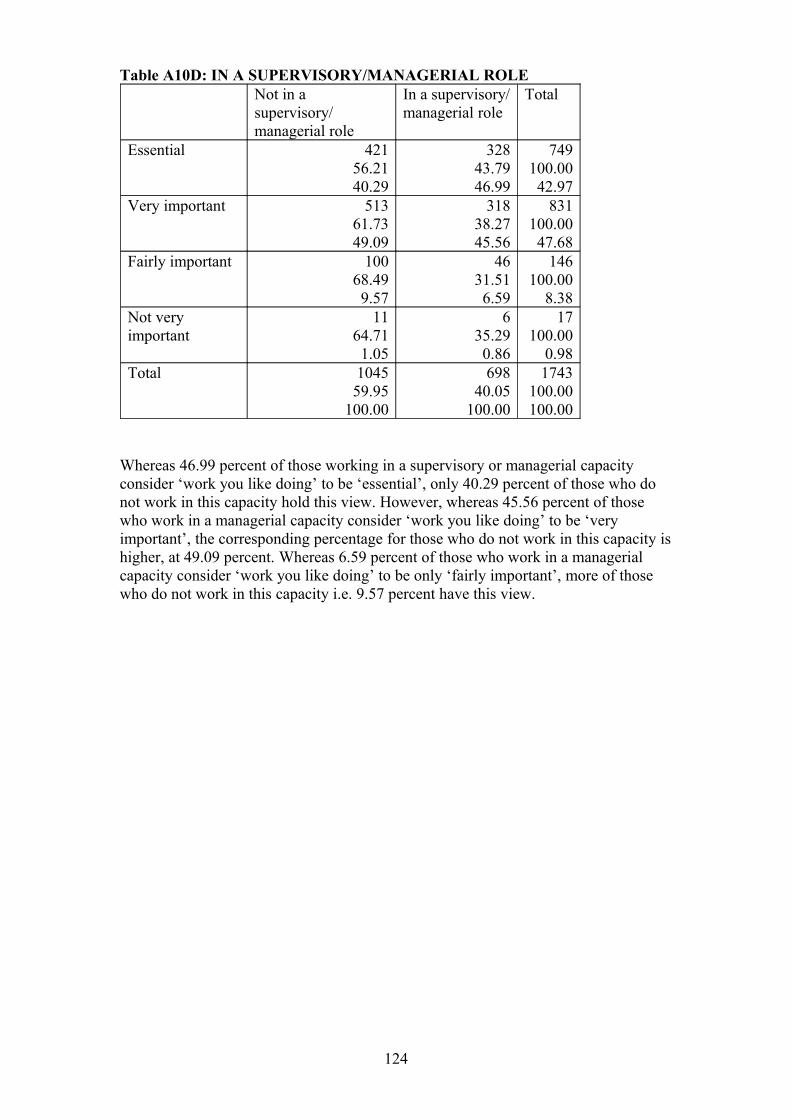
Table A10D: IN A SUPERVISORY/MANAGERIAL ROLENot in a supervisory/managerial role
In a supervisory/managerial role
Total
Essential 42156.2140.29
32843.7946.99
749100.0042.97
Very important 51361.7349.09
31838.2745.56
831100.0047.68
Fairly important 10068.499.57
4631.516.59
146100.00
8.38Not very important
1164.711.05
635.290.86
17100.00
0.98Total 1045
59.95100.00
69840.05
100.00
1743100.00100.00
Whereas 46.99 percent of those working in a supervisory or managerial capacity consider ‘work you like doing’ to be ‘essential’, only 40.29 percent of those who do not work in this capacity hold this view. However, whereas 45.56 percent of those who work in a managerial capacity consider ‘work you like doing’ to be ‘very important’, the corresponding percentage for those who do not work in this capacity is higher, at 49.09 percent. Whereas 6.59 percent of those who work in a managerial capacity consider ‘work you like doing’ to be only ‘fairly important’, more of those who do not work in this capacity i.e. 9.57 percent have this view.
124

Table A10E: SECTOR OF EMPLOYMENTPrivatesector
Publicsector
Not for profitsector
Total
Essential 40452.9539.57
32442.4647.23
354.59
53.03
763100.0043.03
Very important 50459.9349.36
31337.2245.63
242.85
36.36
841100.0047.43
Fairly important 10468.4210.19
4227.636.12
63.959.09
152100.00
8.57Not very important
952.940.88
741.181.02
15.881.52
17100.00
0.96Total 1021
57.59100.00
68538.69
100.00
663.72
100.00
1773100.00100.00
53.03 percent of those who work in the not for profit sector consider ‘work you like doing’ to be ‘essential’, a rate higher than the corresponding percentages for those employed in the other sectors. For example, only 39.57 percent of those employed in the private sector are of this opinion. However, 49.36 percent of those employed in the private sector consider ‘work you like doing’ to be ‘very important’, a rate which is higher than the corresponding percentages for those employed in the other sectors. 10.19 percent of those employed in the private sector consider ‘work you like doing’ to be only ‘fairly important’, a rate which is higher than the corresponding percentages for those employed in the other sectors.
125
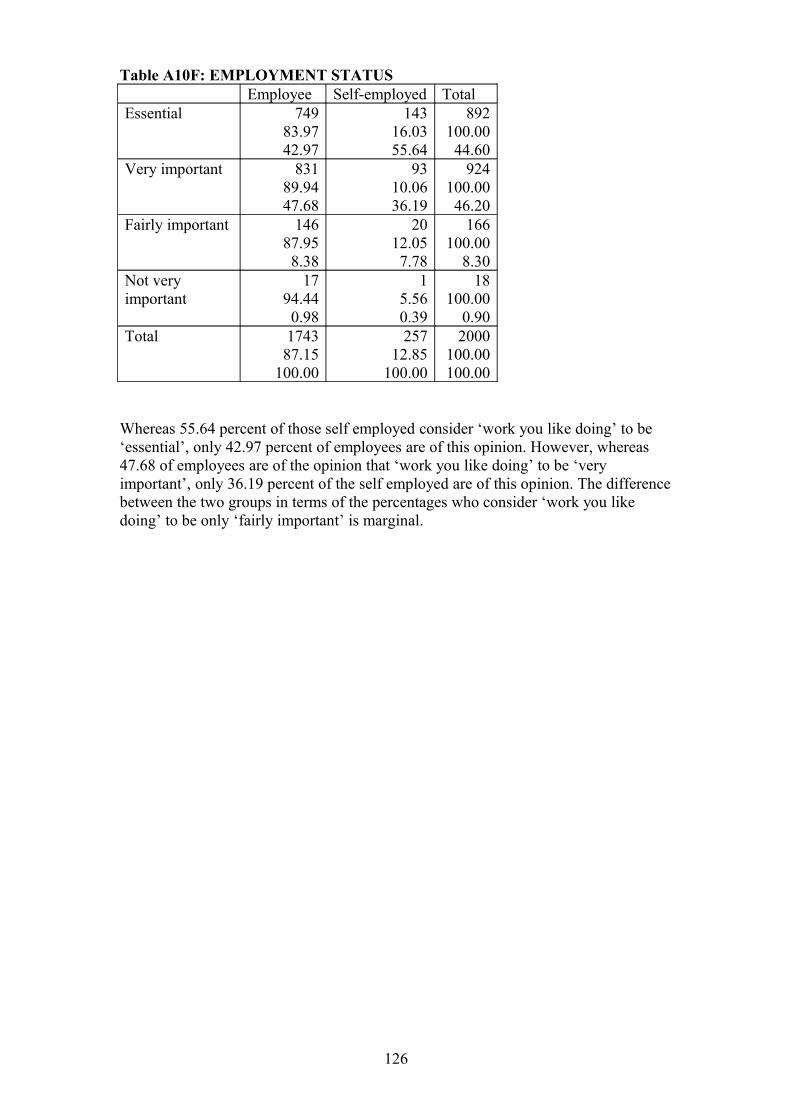
Table A10F: EMPLOYMENT STATUSEmployee Self-employed Total
Essential 74983.9742.97
14316.0355.64
892100.0044.60
Very important 83189.9447.68
9310.0636.19
924100.0046.20
Fairly important 14687.958.38
2012.057.78
166100.00
8.30Not very important
1794.440.98
15.560.39
18100.00
0.90Total 1743
87.15100.00
25712.85
100.00
2000100.00100.00
Whereas 55.64 percent of those self employed consider ‘work you like doing’ to be ‘essential’, only 42.97 percent of employees are of this opinion. However, whereas 47.68 of employees are of the opinion that ‘work you like doing’ to be ‘very important’, only 36.19 percent of the self employed are of this opinion. The difference between the two groups in terms of the percentages who consider ‘work you like doing’ to be only ‘fairly important’ is marginal.
126
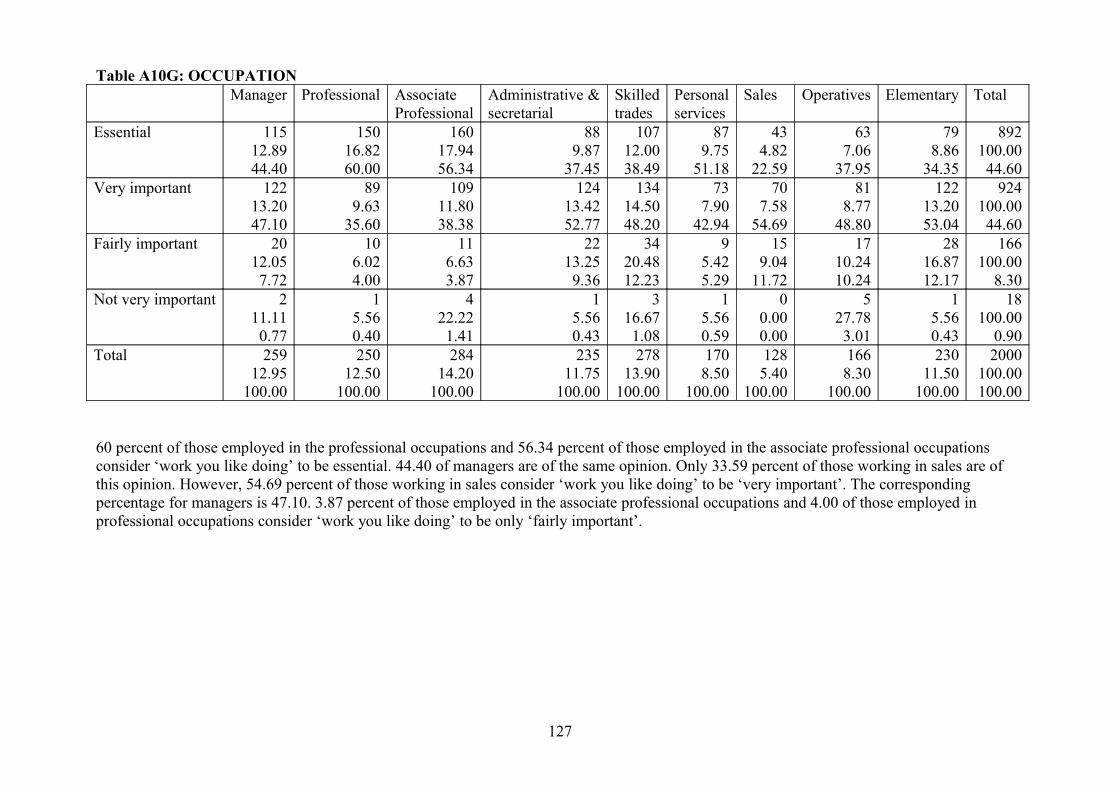
Table A10G: OCCUPATIONManager Professional Associate
ProfessionalAdministrative &secretarial
Skilledtrades
Personal services
Sales Operatives Elementary Total
Essential 11512.8944.40
15016.8260.00
16017.9456.34
889.87
37.45
10712.0038.49
879.75
51.18
434.82
22.59
637.06
37.95
798.86
34.35
892100.0044.60
Very important 12213.2047.10
899.63
35.60
10911.8038.38
12413.4252.77
13414.5048.20
737.90
42.94
707.58
54.69
818.77
48.80
12213.2053.04
924100.0044.60
Fairly important 2012.057.72
106.024.00
116.633.87
2213.259.36
3420.4812.23
95.425.29
159.04
11.72
1710.2410.24
2816.8712.17
166100.00
8.30Not very important 2
11.110.77
15.560.40
422.221.41
15.560.43
316.671.08
15.560.59
00.000.00
527.783.01
15.560.43
18100.00
0.90Total 259
12.95100.00
25012.50
100.00
28414.20
100.00
23511.75
100.00
27813.90
100.00
1708.50
100.00
1285.40
100.00
1668.30
100.00
23011.50
100.00
2000100.00100.00
60 percent of those employed in the professional occupations and 56.34 percent of those employed in the associate professional occupations consider ‘work you like doing’ to be essential. 44.40 of managers are of the same opinion. Only 33.59 percent of those working in sales are of this opinion. However, 54.69 percent of those working in sales consider ‘work you like doing’ to be ‘very important’. The corresponding percentage for managers is 47.10. 3.87 percent of those employed in the associate professional occupations and 4.00 of those employed in professional occupations consider ‘work you like doing’ to be only ‘fairly important’.
127
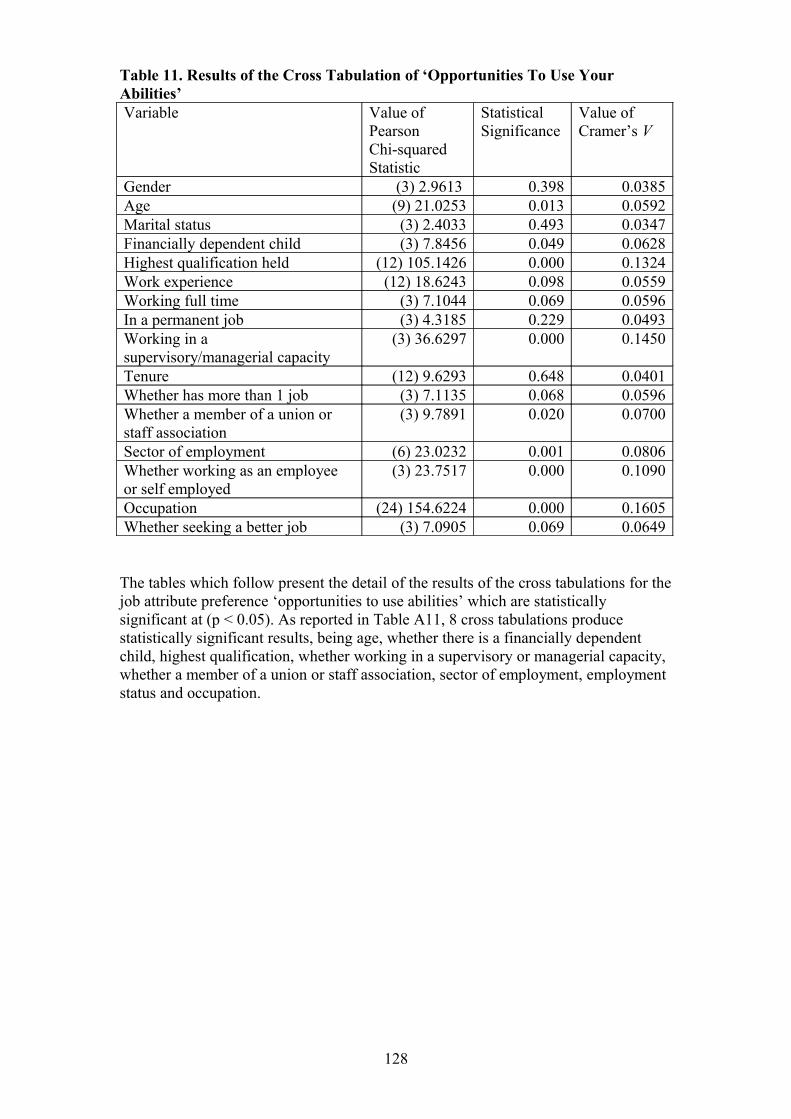
Table 11. Results of the Cross Tabulation of ‘Opportunities To Use Your Abilities’Variable Value of
Pearson Chi-squared Statistic
StatisticalSignificance
Value of Cramer’s V
Gender (3) 2.9613 0.398 0.0385Age (9) 21.0253 0.013 0.0592Marital status (3) 2.4033 0.493 0.0347Financially dependent child (3) 7.8456 0.049 0.0628Highest qualification held (12) 105.1426 0.000 0.1324Work experience (12) 18.6243 0.098 0.0559Working full time (3) 7.1044 0.069 0.0596In a permanent job (3) 4.3185 0.229 0.0493Working in a supervisory/managerial capacity
(3) 36.6297 0.000 0.1450
Tenure (12) 9.6293 0.648 0.0401Whether has more than 1 job (3) 7.1135 0.068 0.0596Whether a member of a union or staff association
(3) 9.7891 0.020 0.0700
Sector of employment (6) 23.0232 0.001 0.0806Whether working as an employee or self employed
(3) 23.7517 0.000 0.1090
Occupation (24) 154.6224 0.000 0.1605Whether seeking a better job (3) 7.0905 0.069 0.0649
The tables which follow present the detail of the results of the cross tabulations for the job attribute preference ‘opportunities to use abilities’ which are statistically significant at (p < 0.05). As reported in Table A11, 8 cross tabulations produce statistically significant results, being age, whether there is a financially dependent child, highest qualification, whether working in a supervisory or managerial capacity, whether a member of a union or staff association, sector of employment, employment status and occupation.
128
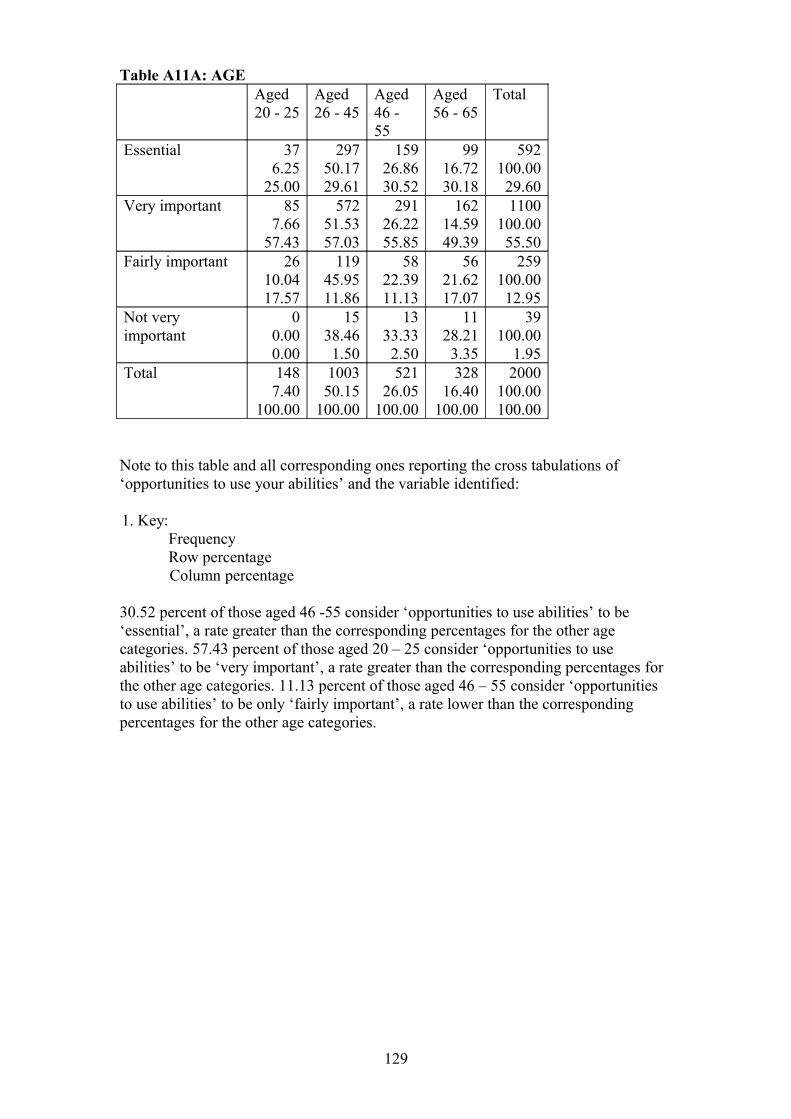
Table A11A: AGEAged20 - 25
Aged26 - 45
Aged46 - 55
Aged56 - 65
Total
Essential 376.25
25.00
29750.1729.61
15926.8630.52
9916.7230.18
592100.0029.60
Very important 857.66
57.43
57251.5357.03
29126.2255.85
16214.5949.39
1100100.0055.50
Fairly important 2610.0417.57
11945.9511.86
5822.3911.13
5621.6217.07
259100.0012.95
Not very important
00.000.00
1538.461.50
1333.332.50
1128.213.35
39100.00
1.95Total 148
7.40100.00
100350.15
100.00
52126.05
100.00
32816.40
100.00
2000100.00100.00
Note to this table and all corresponding ones reporting the cross tabulations of ‘opportunities to use your abilities’ and the variable identified:
1. Key:FrequencyRow percentageColumn percentage
30.52 percent of those aged 46 -55 consider ‘opportunities to use abilities’ to be ‘essential’, a rate greater than the corresponding percentages for the other age categories. 57.43 percent of those aged 20 – 25 consider ‘opportunities to use abilities’ to be ‘very important’, a rate greater than the corresponding percentages for the other age categories. 11.13 percent of those aged 46 – 55 consider ‘opportunities to use abilities’ to be only ‘fairly important’, a rate lower than the corresponding percentages for the other age categories.
129
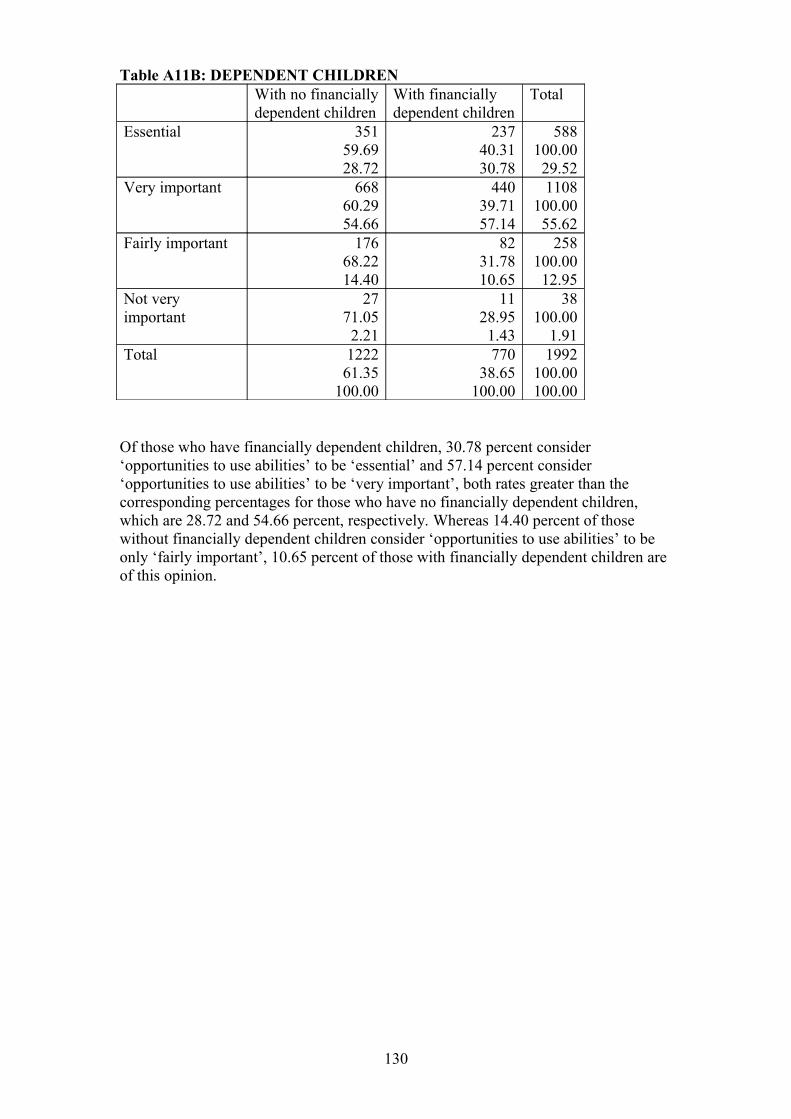
Table A11B: DEPENDENT CHILDRENWith no financiallydependent children
With financiallydependent children
Total
Essential 35159.6928.72
23740.3130.78
588100.0029.52
Very important 66860.2954.66
44039.7157.14
1108100.0055.62
Fairly important 17668.2214.40
8231.7810.65
258100.0012.95
Not very important
2771.052.21
1128.951.43
38100.00
1.91Total 1222
61.35100.00
77038.65
100.00
1992100.00100.00
Of those who have financially dependent children, 30.78 percent consider ‘opportunities to use abilities’ to be ‘essential’ and 57.14 percent consider ‘opportunities to use abilities’ to be ‘very important’, both rates greater than the corresponding percentages for those who have no financially dependent children, which are 28.72 and 54.66 percent, respectively. Whereas 14.40 percent of those without financially dependent children consider ‘opportunities to use abilities’ to be only ‘fairly important’, 10.65 percent of those with financially dependent children are of this opinion.
130
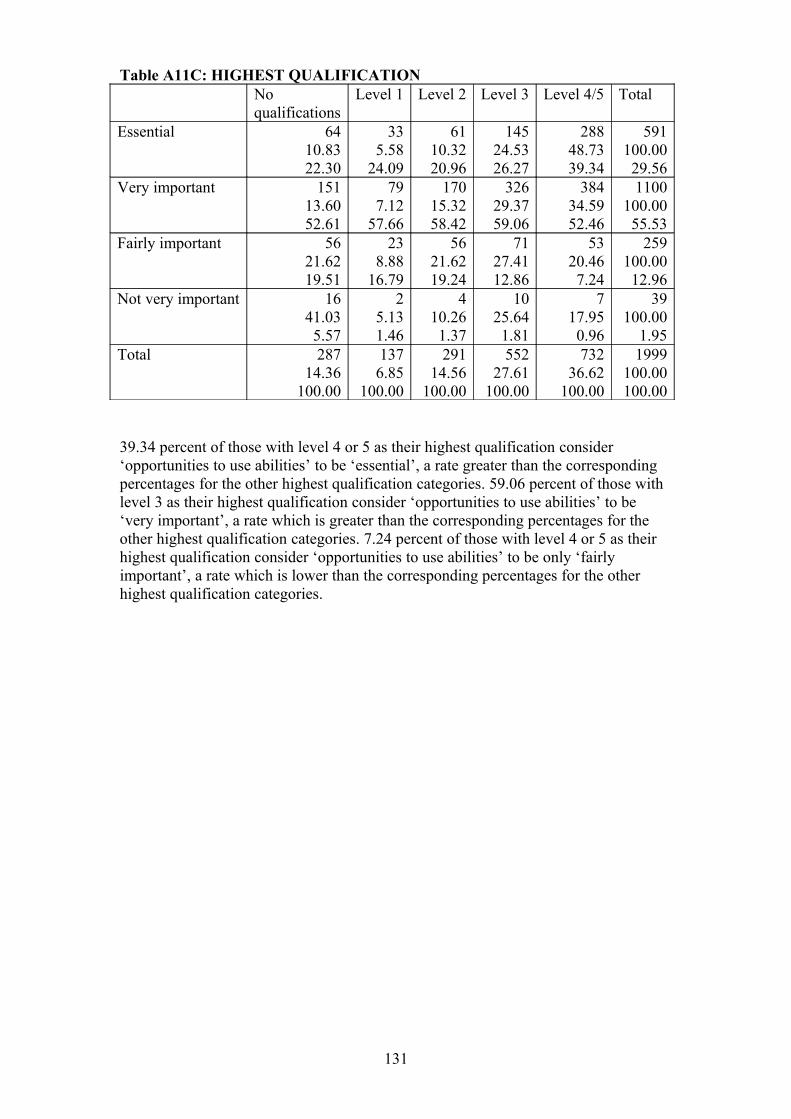
Table A11C: HIGHEST QUALIFICATIONNoqualifications
Level 1 Level 2 Level 3 Level 4/5 Total
Essential 6410.8322.30
335.58
24.09
6110.3220.96
14524.5326.27
28848.7339.34
591100.0029.56
Very important 15113.6052.61
797.12
57.66
17015.3258.42
32629.3759.06
38434.5952.46
1100100.0055.53
Fairly important 5621.6219.51
238.88
16.79
5621.6219.24
7127.4112.86
5320.467.24
259100.0012.96
Not very important 1641.035.57
25.131.46
410.261.37
1025.641.81
717.950.96
39100.00
1.95Total 287
14.36100.00
1376.85
100.00
29114.56
100.00
55227.61
100.00
73236.62
100.00
1999100.00100.00
39.34 percent of those with level 4 or 5 as their highest qualification consider ‘opportunities to use abilities’ to be ‘essential’, a rate greater than the corresponding percentages for the other highest qualification categories. 59.06 percent of those with level 3 as their highest qualification consider ‘opportunities to use abilities’ to be ‘very important’, a rate which is greater than the corresponding percentages for the other highest qualification categories. 7.24 percent of those with level 4 or 5 as their highest qualification consider ‘opportunities to use abilities’ to be only ‘fairly important’, a rate which is lower than the corresponding percentages for the other highest qualification categories.
131
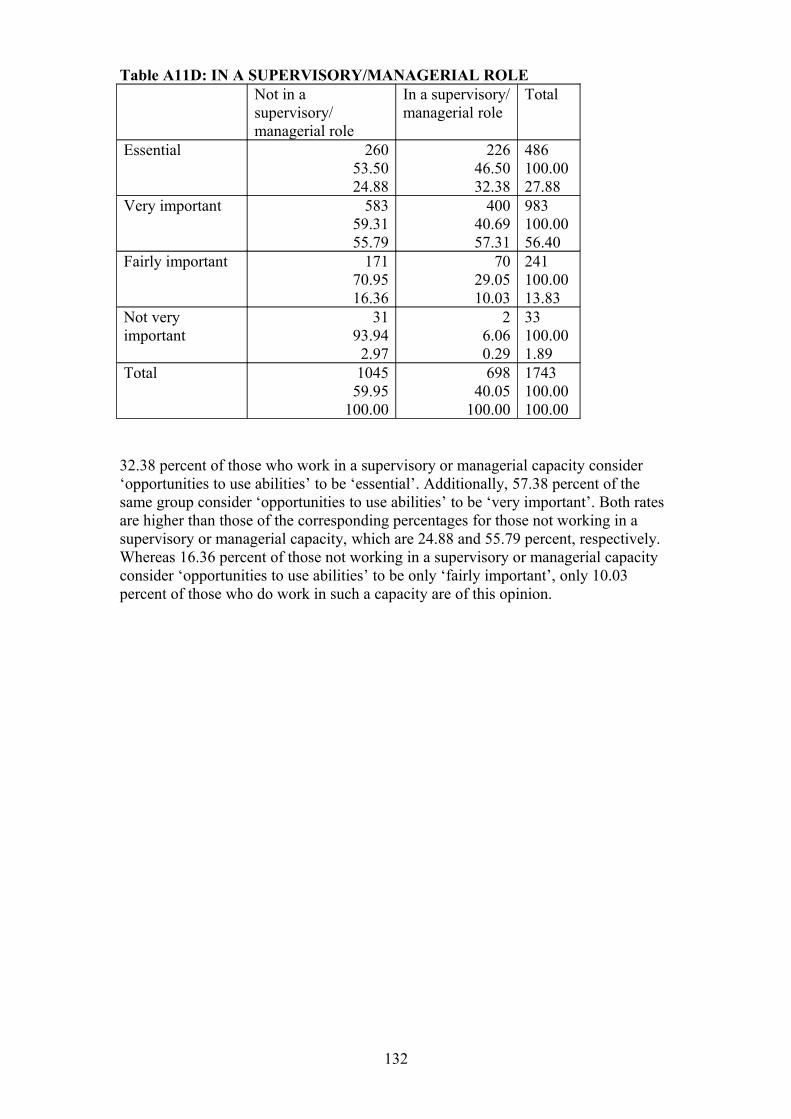
Table A11D: IN A SUPERVISORY/MANAGERIAL ROLENot in a supervisory/managerial role
In a supervisory/managerial role
Total
Essential 26053.5024.88
22646.5032.38
486100.0027.88
Very important 58359.3155.79
40040.6957.31
983100.0056.40
Fairly important 17170.9516.36
7029.0510.03
241100.0013.83
Not very important
3193.942.97
26.060.29
33100.001.89
Total 104559.95
100.00
69840.05
100.00
1743100.00100.00
32.38 percent of those who work in a supervisory or managerial capacity consider ‘opportunities to use abilities’ to be ‘essential’. Additionally, 57.38 percent of the same group consider ‘opportunities to use abilities’ to be ‘very important’. Both rates are higher than those of the corresponding percentages for those not working in a supervisory or managerial capacity, which are 24.88 and 55.79 percent, respectively. Whereas 16.36 percent of those not working in a supervisory or managerial capacity consider ‘opportunities to use abilities’ to be only ‘fairly important’, only 10.03 percent of those who do work in such a capacity are of this opinion.
132
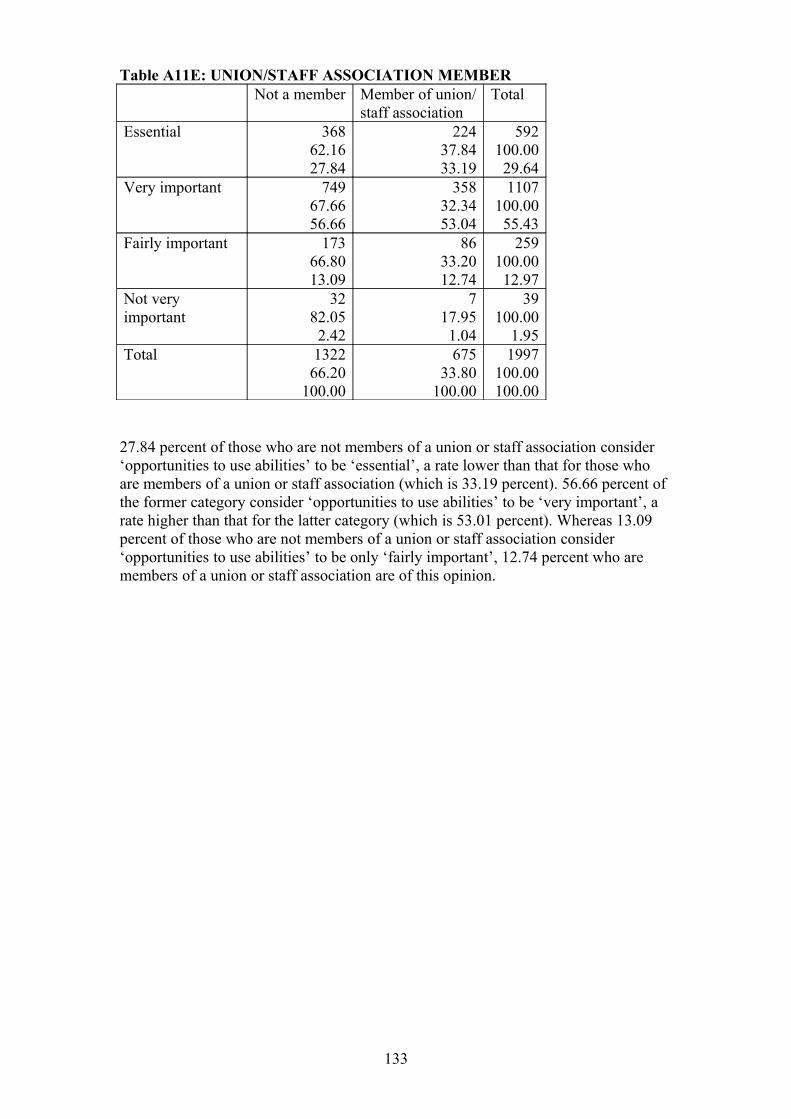
Table A11E: UNION/STAFF ASSOCIATION MEMBERNot a member Member of union/
staff associationTotal
Essential 36862.1627.84
22437.8433.19
592100.0029.64
Very important 74967.6656.66
35832.3453.04
1107100.0055.43
Fairly important 17366.8013.09
8633.2012.74
259100.0012.97
Not very important
3282.052.42
717.951.04
39100.00
1.95Total 1322
66.20100.00
67533.80
100.00
1997100.00100.00
27.84 percent of those who are not members of a union or staff association consider ‘opportunities to use abilities’ to be ‘essential’, a rate lower than that for those who are members of a union or staff association (which is 33.19 percent). 56.66 percent of the former category consider ‘opportunities to use abilities’ to be ‘very important’, a rate higher than that for the latter category (which is 53.01 percent). Whereas 13.09 percent of those who are not members of a union or staff association consider ‘opportunities to use abilities’ to be only ‘fairly important’, 12.74 percent who are members of a union or staff association are of this opinion.
133
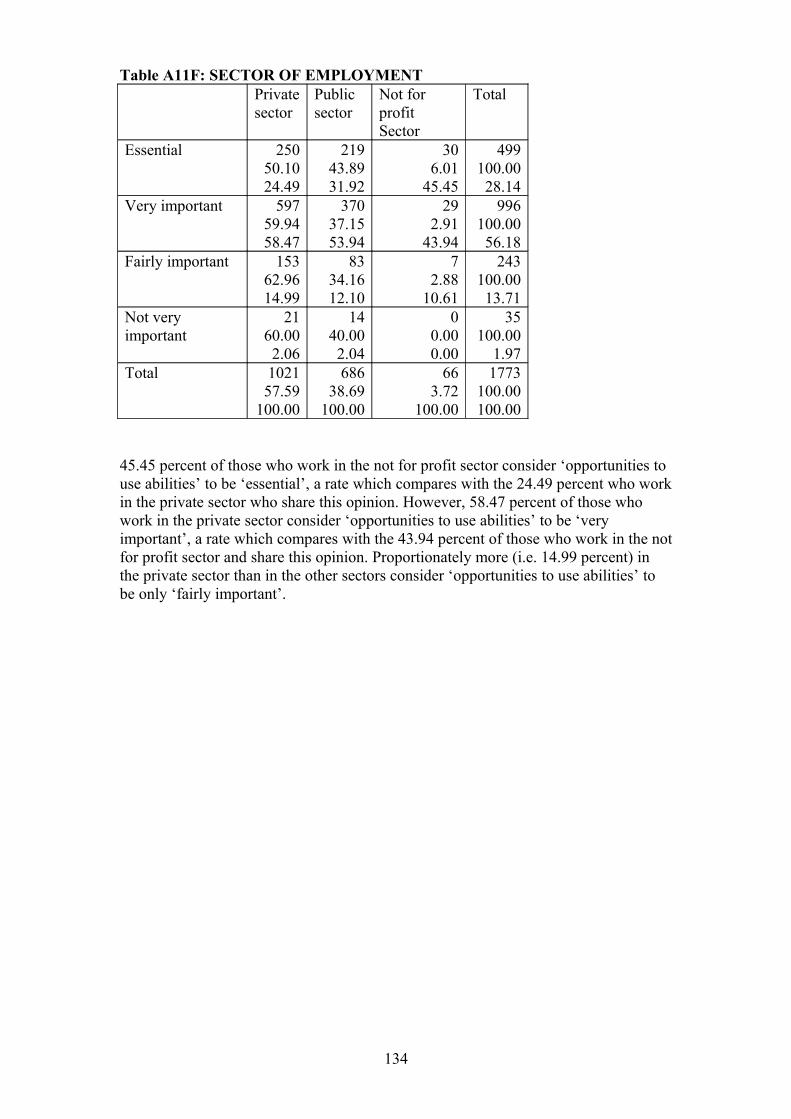
Table A11F: SECTOR OF EMPLOYMENTPrivatesector
Publicsector
Not for profitSector
Total
Essential 25050.1024.49
21943.8931.92
306.01
45.45
499100.0028.14
Very important 59759.9458.47
37037.1553.94
292.91
43.94
996100.0056.18
Fairly important 15362.9614.99
8334.1612.10
72.88
10.61
243100.0013.71
Not very important
2160.002.06
1440.002.04
00.000.00
35100.00
1.97Total 1021
57.59100.00
68638.69
100.00
663.72
100.00
1773100.00100.00
45.45 percent of those who work in the not for profit sector consider ‘opportunities to use abilities’ to be ‘essential’, a rate which compares with the 24.49 percent who work in the private sector who share this opinion. However, 58.47 percent of those who work in the private sector consider ‘opportunities to use abilities’ to be ‘very important’, a rate which compares with the 43.94 percent of those who work in the not for profit sector and share this opinion. Proportionately more (i.e. 14.99 percent) in the private sector than in the other sectors consider ‘opportunities to use abilities’ to be only ‘fairly important’.
134
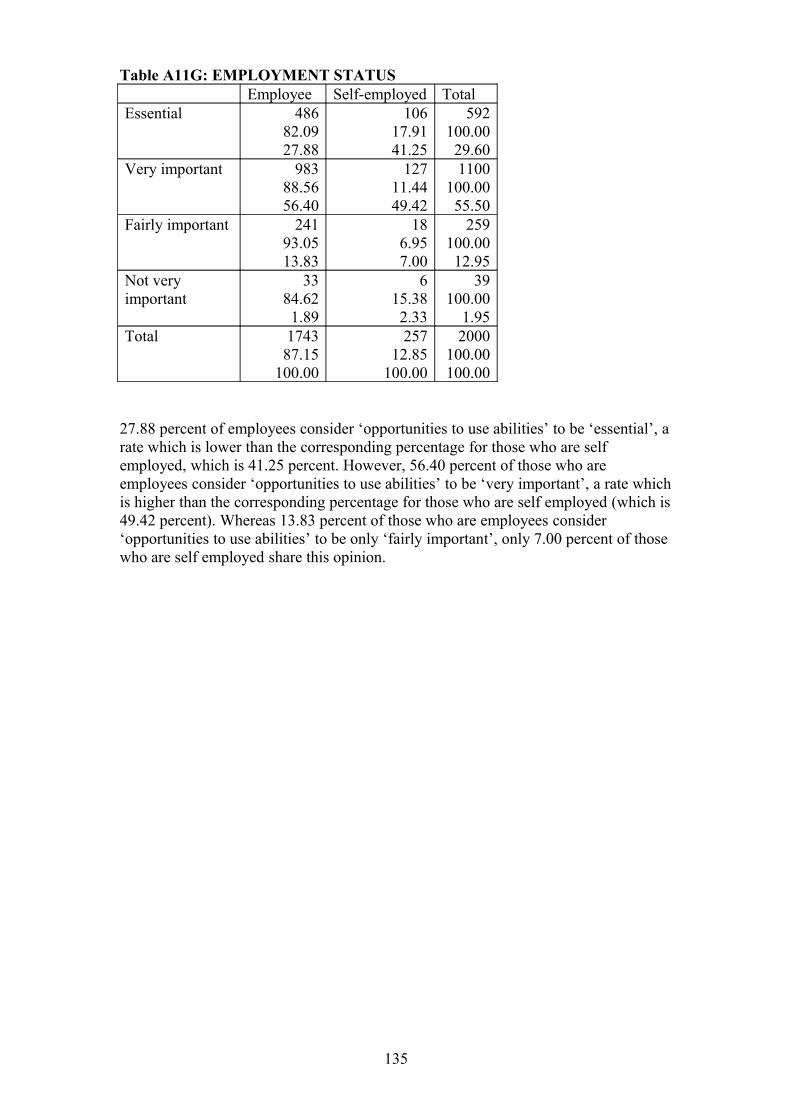
Table A11G: EMPLOYMENT STATUSEmployee Self-employed Total
Essential 48682.0927.88
10617.9141.25
592100.0029.60
Very important 98388.5656.40
12711.4449.42
1100100.0055.50
Fairly important 24193.0513.83
186.957.00
259100.0012.95
Not very important
3384.621.89
615.382.33
39100.00
1.95Total 1743
87.15100.00
25712.85
100.00
2000100.00100.00
27.88 percent of employees consider ‘opportunities to use abilities’ to be ‘essential’, a rate which is lower than the corresponding percentage for those who are self employed, which is 41.25 percent. However, 56.40 percent of those who are employees consider ‘opportunities to use abilities’ to be ‘very important’, a rate which is higher than the corresponding percentage for those who are self employed (which is 49.42 percent). Whereas 13.83 percent of those who are employees consider ‘opportunities to use abilities’ to be only ‘fairly important’, only 7.00 percent of those who are self employed share this opinion.
135
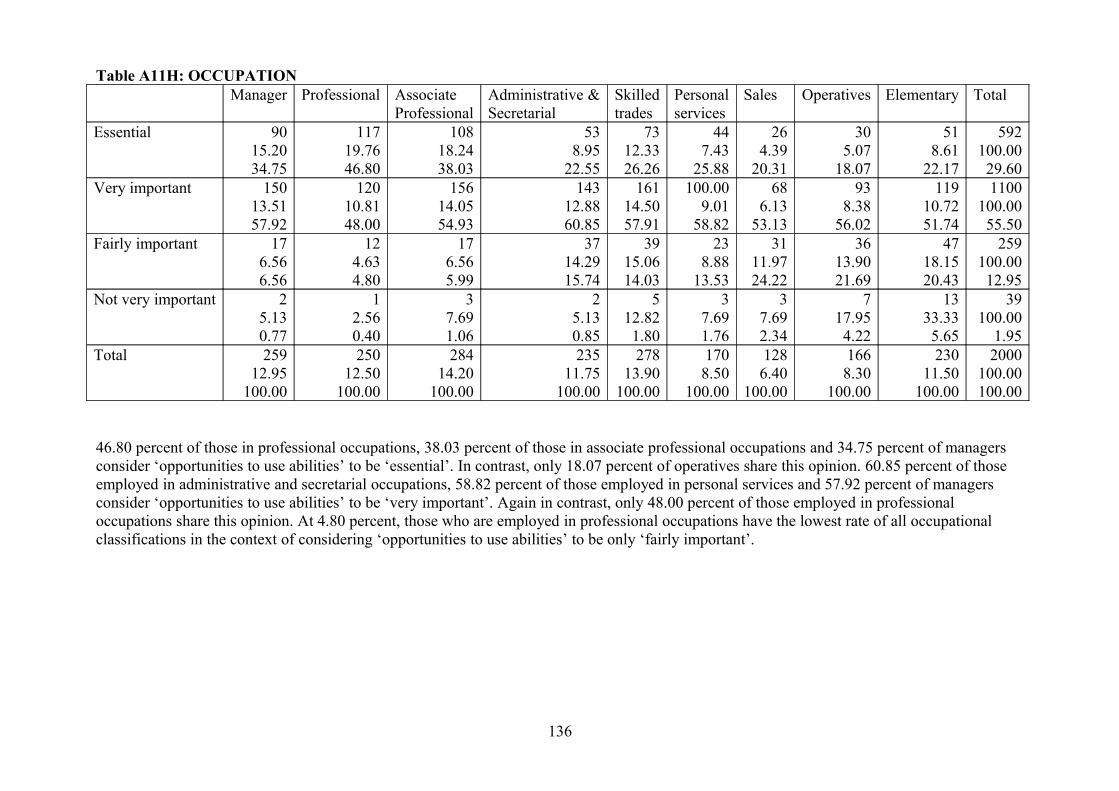
Table A11H: OCCUPATIONManager Professional Associate
ProfessionalAdministrative &Secretarial
Skilledtrades
Personal services
Sales Operatives Elementary Total
Essential 9015.2034.75
11719.7646.80
10818.2438.03
538.95
22.55
7312.3326.26
447.43
25.88
264.39
20.31
305.07
18.07
518.61
22.17
592100.0029.60
Very important 15013.5157.92
12010.8148.00
15614.0554.93
14312.8860.85
16114.5057.91
100.009.01
58.82
686.13
53.13
938.38
56.02
11910.7251.74
1100100.0055.50
Fairly important 176.566.56
124.634.80
176.565.99
3714.2915.74
3915.0614.03
238.88
13.53
3111.9724.22
3613.9021.69
4718.1520.43
259100.0012.95
Not very important 25.130.77
12.560.40
37.691.06
25.130.85
512.821.80
37.691.76
37.692.34
717.954.22
1333.335.65
39100.00
1.95Total 259
12.95100.00
25012.50
100.00
28414.20
100.00
23511.75
100.00
27813.90
100.00
1708.50
100.00
1286.40
100.00
1668.30
100.00
23011.50
100.00
2000100.00100.00
46.80 percent of those in professional occupations, 38.03 percent of those in associate professional occupations and 34.75 percent of managers consider ‘opportunities to use abilities’ to be ‘essential’. In contrast, only 18.07 percent of operatives share this opinion. 60.85 percent of those employed in administrative and secretarial occupations, 58.82 percent of those employed in personal services and 57.92 percent of managers consider ‘opportunities to use abilities’ to be ‘very important’. Again in contrast, only 48.00 percent of those employed in professional occupations share this opinion. At 4.80 percent, those who are employed in professional occupations have the lowest rate of all occupational classifications in the context of considering ‘opportunities to use abilities’ to be only ‘fairly important’.
136
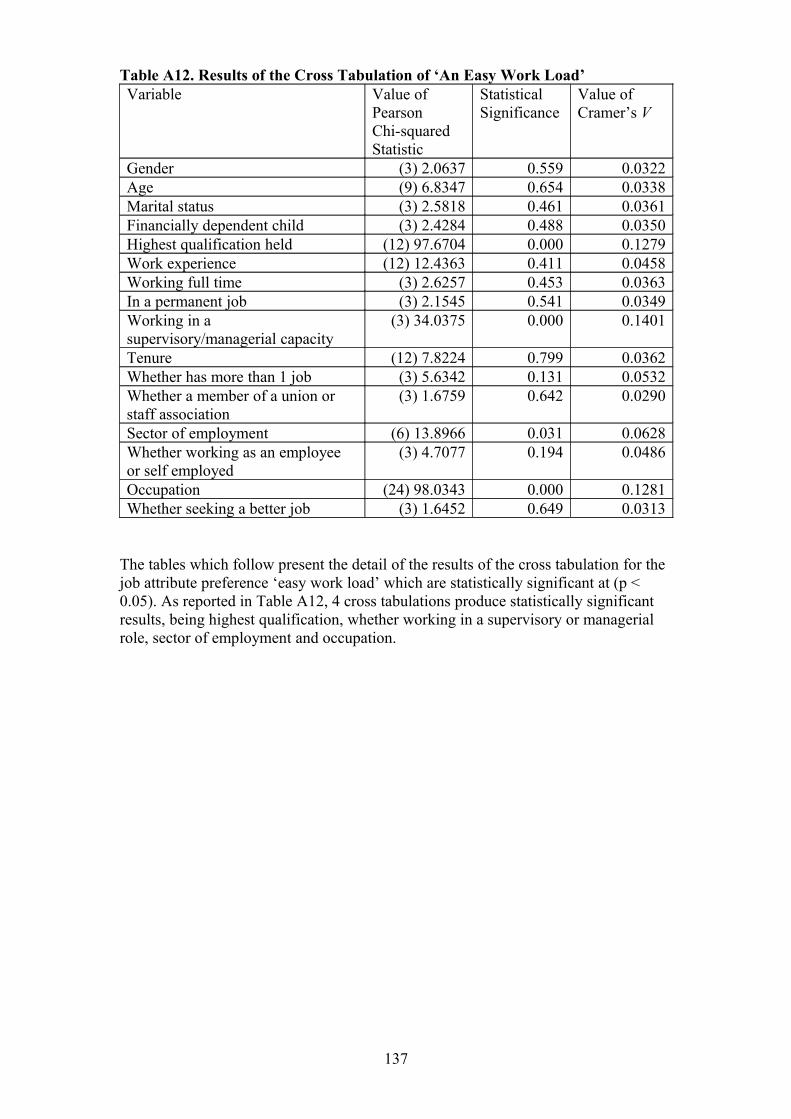
Table A12. Results of the Cross Tabulation of ‘An Easy Work Load’Variable Value of
Pearson Chi-squared Statistic
StatisticalSignificance
Value of Cramer’s V
Gender (3) 2.0637 0.559 0.0322Age (9) 6.8347 0.654 0.0338Marital status (3) 2.5818 0.461 0.0361Financially dependent child (3) 2.4284 0.488 0.0350Highest qualification held (12) 97.6704 0.000 0.1279Work experience (12) 12.4363 0.411 0.0458Working full time (3) 2.6257 0.453 0.0363In a permanent job (3) 2.1545 0.541 0.0349Working in a supervisory/managerial capacity
(3) 34.0375 0.000 0.1401
Tenure (12) 7.8224 0.799 0.0362Whether has more than 1 job (3) 5.6342 0.131 0.0532Whether a member of a union or staff association
(3) 1.6759 0.642 0.0290
Sector of employment (6) 13.8966 0.031 0.0628Whether working as an employee or self employed
(3) 4.7077 0.194 0.0486
Occupation (24) 98.0343 0.000 0.1281Whether seeking a better job (3) 1.6452 0.649 0.0313
The tables which follow present the detail of the results of the cross tabulation for the job attribute preference ‘easy work load’ which are statistically significant at (p < 0.05). As reported in Table A12, 4 cross tabulations produce statistically significant results, being highest qualification, whether working in a supervisory or managerial role, sector of employment and occupation.
137
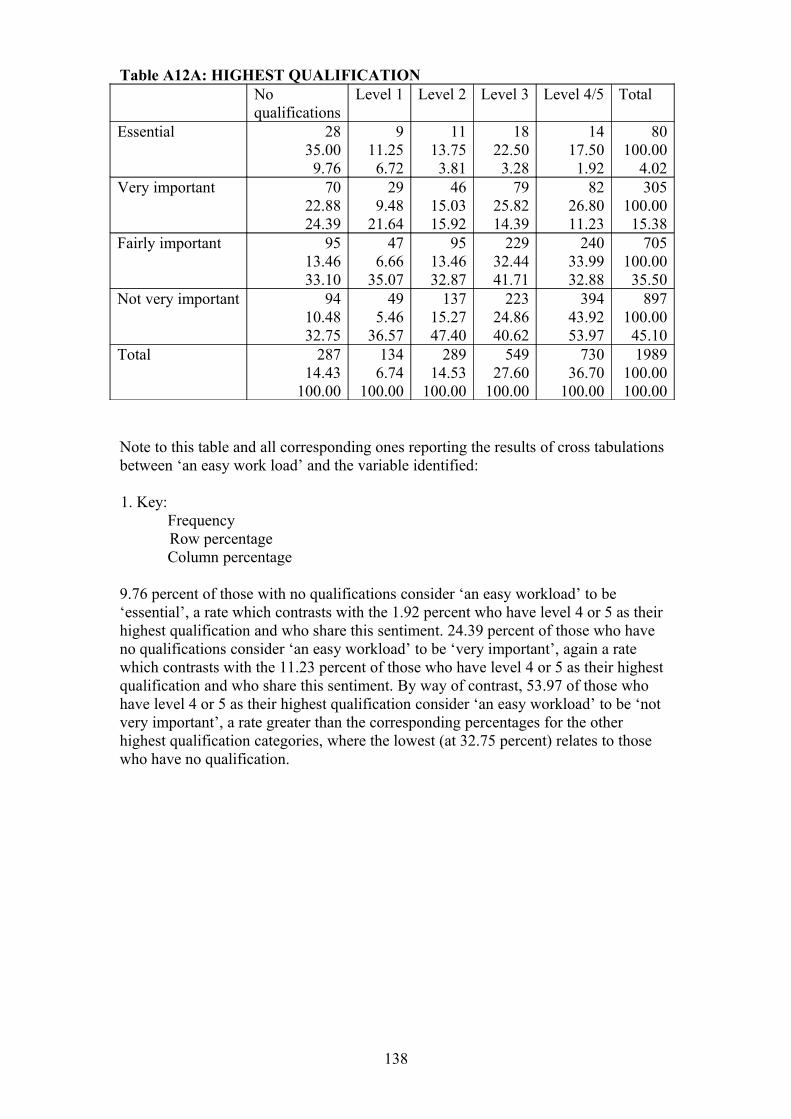
Table A12A: HIGHEST QUALIFICATIONNoqualifications
Level 1 Level 2 Level 3 Level 4/5 Total
Essential 2835.009.76
911.256.72
1113.753.81
1822.503.28
1417.501.92
80100.00
4.02Very important 70
22.8824.39
299.48
21.64
4615.0315.92
7925.8214.39
8226.8011.23
305100.0015.38
Fairly important 9513.4633.10
476.66
35.07
9513.4632.87
22932.4441.71
24033.9932.88
705100.0035.50
Not very important 9410.4832.75
495.46
36.57
13715.2747.40
22324.8640.62
39443.9253.97
897100.0045.10
Total 28714.43
100.00
1346.74
100.00
28914.53
100.00
54927.60
100.00
73036.70
100.00
1989100.00100.00
Note to this table and all corresponding ones reporting the results of cross tabulations between ‘an easy work load’ and the variable identified:
1. Key:FrequencyRow percentageColumn percentage
9.76 percent of those with no qualifications consider ‘an easy workload’ to be ‘essential’, a rate which contrasts with the 1.92 percent who have level 4 or 5 as their highest qualification and who share this sentiment. 24.39 percent of those who have no qualifications consider ‘an easy workload’ to be ‘very important’, again a rate which contrasts with the 11.23 percent of those who have level 4 or 5 as their highest qualification and who share this sentiment. By way of contrast, 53.97 of those who have level 4 or 5 as their highest qualification consider ‘an easy workload’ to be ‘not very important’, a rate greater than the corresponding percentages for the other highest qualification categories, where the lowest (at 32.75 percent) relates to those who have no qualification.
138
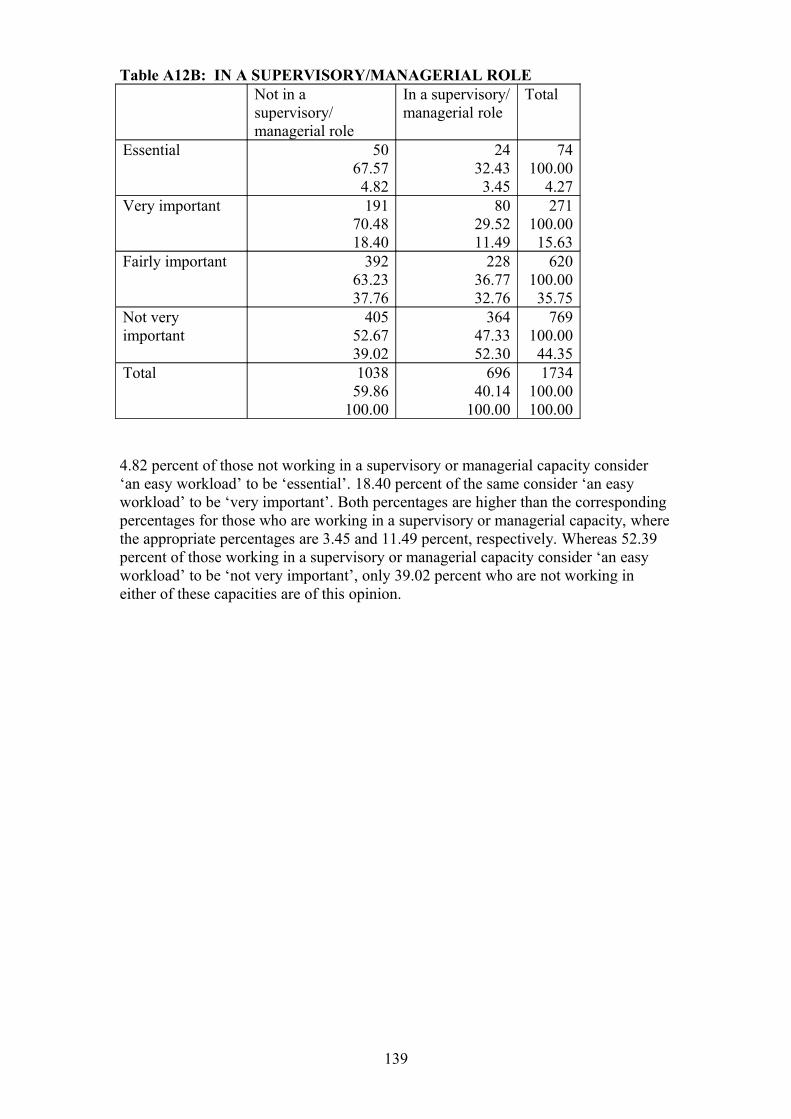
Table A12B: IN A SUPERVISORY/MANAGERIAL ROLENot in a supervisory/managerial role
In a supervisory/managerial role
Total
Essential 5067.574.82
2432.433.45
74100.00
4.27Very important 191
70.4818.40
8029.5211.49
271100.0015.63
Fairly important 39263.2337.76
22836.7732.76
620100.0035.75
Not very important
40552.6739.02
36447.3352.30
769100.0044.35
Total 103859.86
100.00
69640.14
100.00
1734100.00100.00
4.82 percent of those not working in a supervisory or managerial capacity consider ‘an easy workload’ to be ‘essential’. 18.40 percent of the same consider ‘an easy workload’ to be ‘very important’. Both percentages are higher than the corresponding percentages for those who are working in a supervisory or managerial capacity, where the appropriate percentages are 3.45 and 11.49 percent, respectively. Whereas 52.39 percent of those working in a supervisory or managerial capacity consider ‘an easy workload’ to be ‘not very important’, only 39.02 percent who are not working in either of these capacities are of this opinion.
139
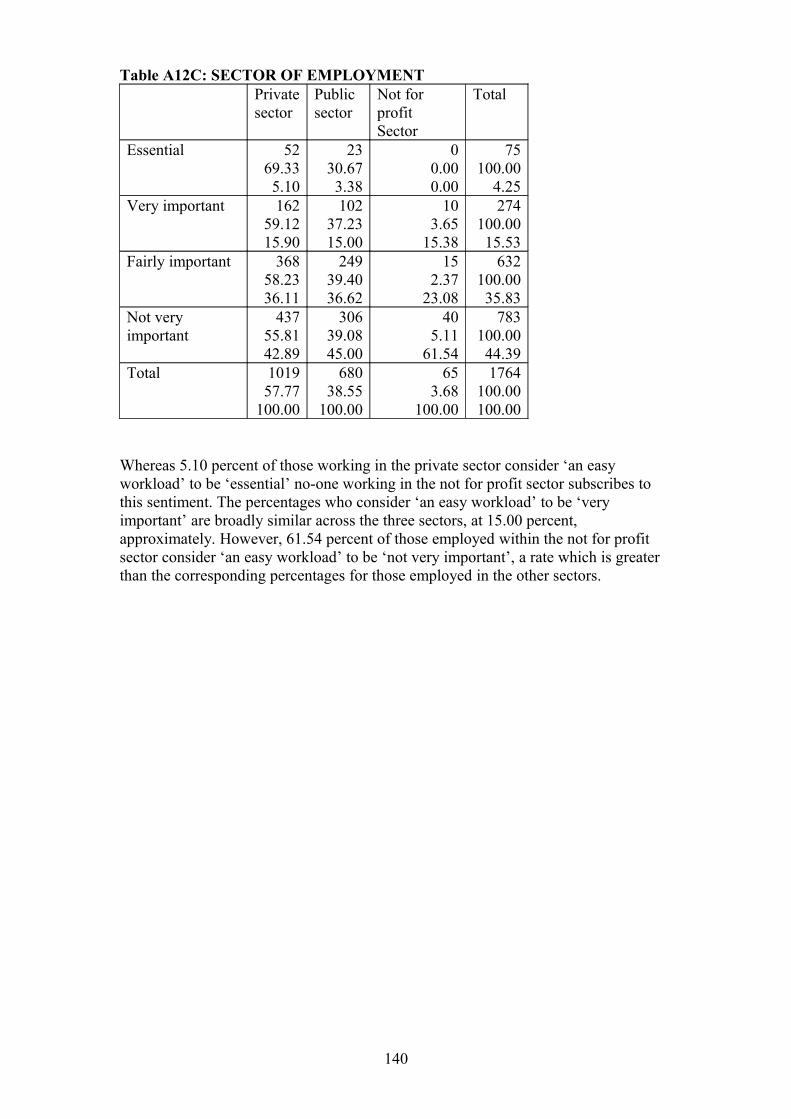
Table A12C: SECTOR OF EMPLOYMENTPrivatesector
Publicsector
Not for profitSector
Total
Essential 5269.335.10
2330.673.38
00.000.00
75100.00
4.25Very important 162
59.1215.90
10237.2315.00
103.65
15.38
274100.0015.53
Fairly important 36858.2336.11
24939.4036.62
152.37
23.08
632100.0035.83
Not very important
43755.8142.89
30639.0845.00
405.11
61.54
783100.0044.39
Total 101957.77
100.00
68038.55
100.00
653.68
100.00
1764100.00100.00
Whereas 5.10 percent of those working in the private sector consider ‘an easy workload’ to be ‘essential’ no-one working in the not for profit sector subscribes to this sentiment. The percentages who consider ‘an easy workload’ to be ‘very important’ are broadly similar across the three sectors, at 15.00 percent, approximately. However, 61.54 percent of those employed within the not for profit sector consider ‘an easy workload’ to be ‘not very important’, a rate which is greater than the corresponding percentages for those employed in the other sectors.
140
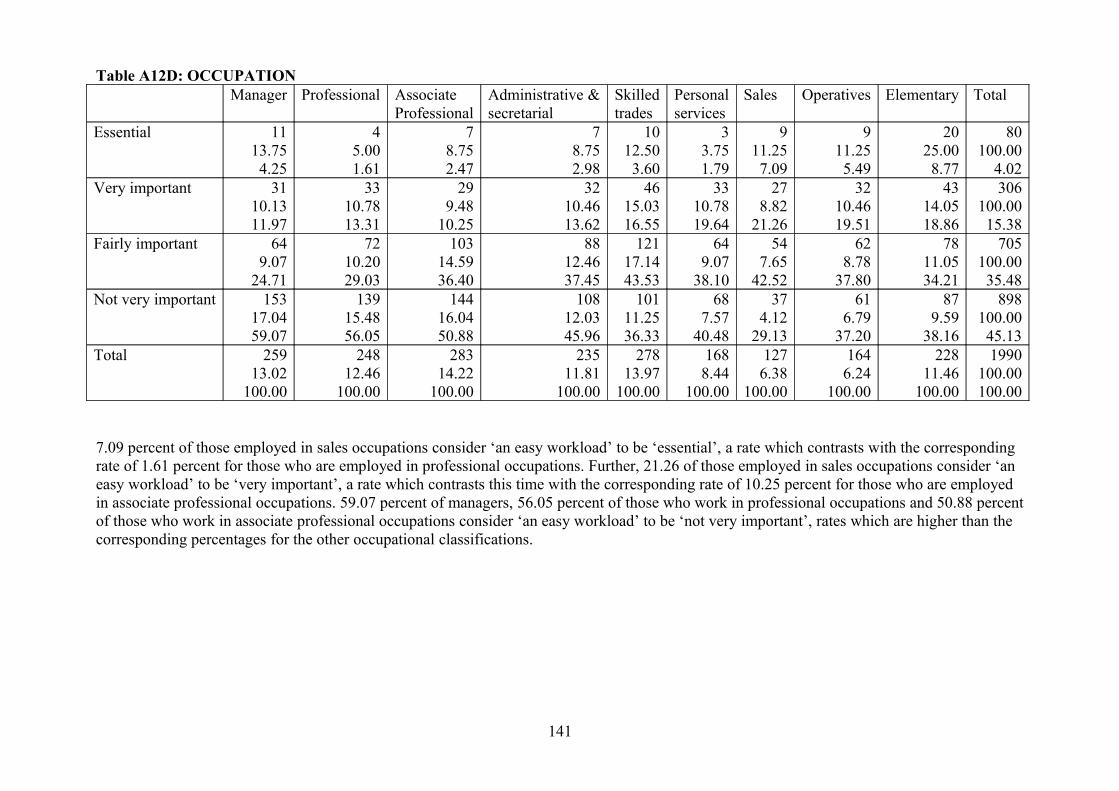
Table A12D: OCCUPATIONManager Professional Associate
ProfessionalAdministrative &secretarial
Skilledtrades
Personal services
Sales Operatives Elementary Total
Essential 1113.754.25
45.001.61
78.752.47
78.752.98
1012.503.60
33.751.79
911.257.09
911.255.49
2025.008.77
80100.00
4.02Very important 31
10.1311.97
3310.7813.31
299.48
10.25
3210.4613.62
4615.0316.55
3310.7819.64
278.82
21.26
3210.4619.51
4314.0518.86
306100.0015.38
Fairly important 649.07
24.71
7210.2029.03
10314.5936.40
8812.4637.45
12117.1443.53
649.07
38.10
547.65
42.52
628.78
37.80
7811.0534.21
705100.0035.48
Not very important 15317.0459.07
13915.4856.05
14416.0450.88
10812.0345.96
10111.2536.33
687.57
40.48
374.12
29.13
616.79
37.20
879.59
38.16
898100.0045.13
Total 25913.02
100.00
24812.46
100.00
28314.22
100.00
23511.81
100.00
27813.97
100.00
1688.44
100.00
1276.38
100.00
1646.24
100.00
22811.46
100.00
1990100.00100.00
7.09 percent of those employed in sales occupations consider ‘an easy workload’ to be ‘essential’, a rate which contrasts with the corresponding rate of 1.61 percent for those who are employed in professional occupations. Further, 21.26 of those employed in sales occupations consider ‘an easy workload’ to be ‘very important’, a rate which contrasts this time with the corresponding rate of 10.25 percent for those who are employed in associate professional occupations. 59.07 percent of managers, 56.05 percent of those who work in professional occupations and 50.88 percent of those who work in associate professional occupations consider ‘an easy workload’ to be ‘not very important’, rates which are higher than the corresponding percentages for the other occupational classifications.
141
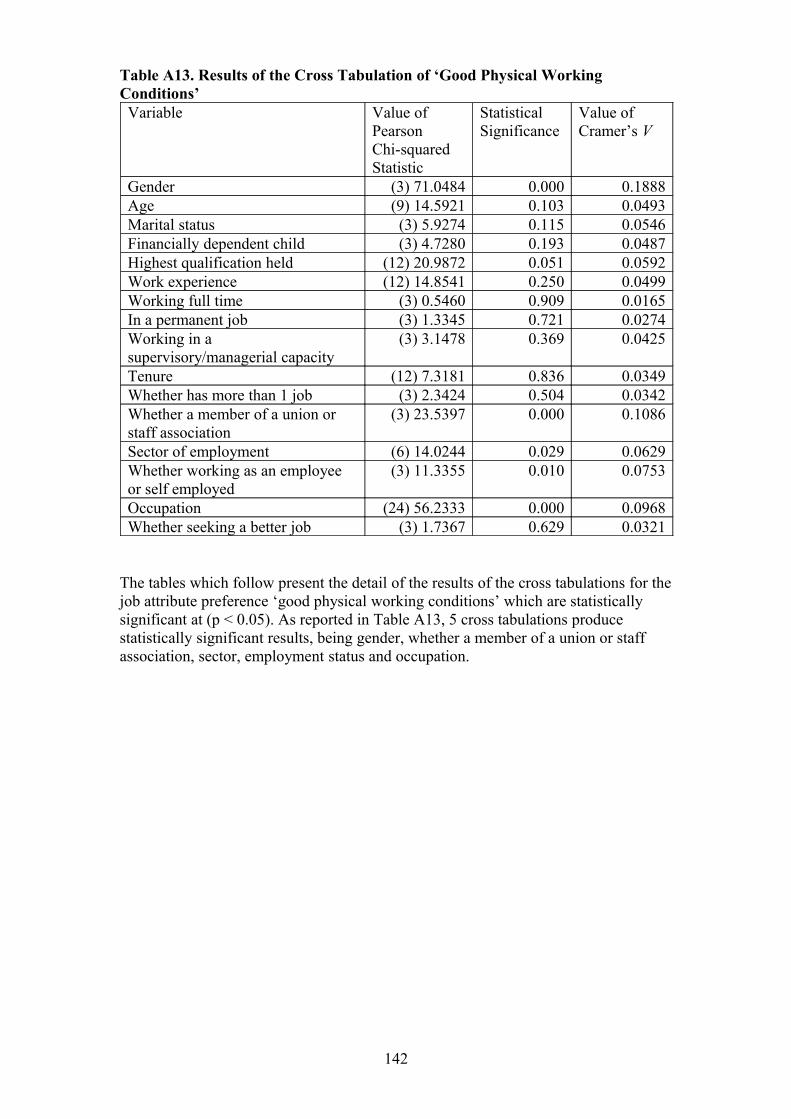
Table A13. Results of the Cross Tabulation of ‘Good Physical Working Conditions’Variable Value of
Pearson Chi-squared Statistic
StatisticalSignificance
Value of Cramer’s V
Gender (3) 71.0484 0.000 0.1888Age (9) 14.5921 0.103 0.0493Marital status (3) 5.9274 0.115 0.0546Financially dependent child (3) 4.7280 0.193 0.0487Highest qualification held (12) 20.9872 0.051 0.0592Work experience (12) 14.8541 0.250 0.0499Working full time (3) 0.5460 0.909 0.0165In a permanent job (3) 1.3345 0.721 0.0274Working in a supervisory/managerial capacity
(3) 3.1478 0.369 0.0425
Tenure (12) 7.3181 0.836 0.0349Whether has more than 1 job (3) 2.3424 0.504 0.0342Whether a member of a union or staff association
(3) 23.5397 0.000 0.1086
Sector of employment (6) 14.0244 0.029 0.0629Whether working as an employee or self employed
(3) 11.3355 0.010 0.0753
Occupation (24) 56.2333 0.000 0.0968Whether seeking a better job (3) 1.7367 0.629 0.0321
The tables which follow present the detail of the results of the cross tabulations for the job attribute preference ‘good physical working conditions’ which are statistically significant at (p < 0.05). As reported in Table A13, 5 cross tabulations produce statistically significant results, being gender, whether a member of a union or staff association, sector, employment status and occupation.
142
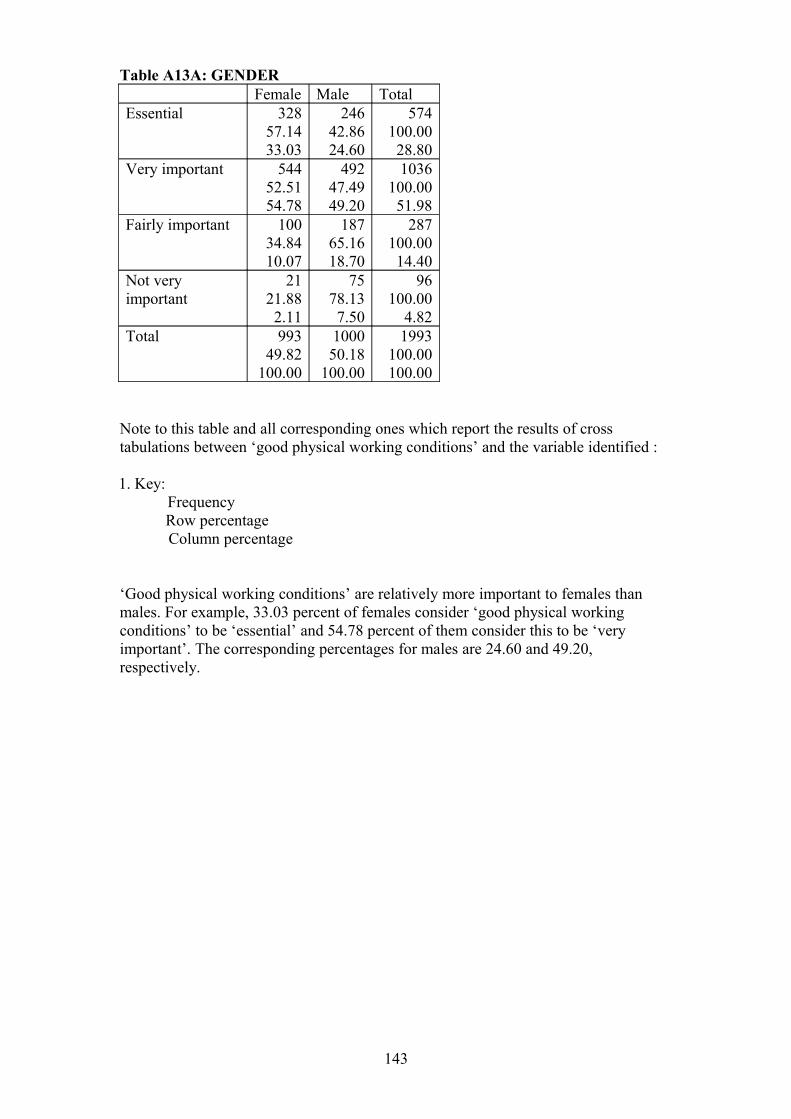
Table A13A: GENDERFemale Male Total
Essential 32857.1433.03
24642.8624.60
574100.0028.80
Very important 54452.5154.78
49247.4949.20
1036100.0051.98
Fairly important 10034.8410.07
18765.1618.70
287100.0014.40
Not very important
2121.882.11
7578.137.50
96100.00
4.82Total 993
49.82100.00
100050.18
100.00
1993100.00100.00
Note to this table and all corresponding ones which report the results of cross tabulations between ‘good physical working conditions’ and the variable identified :
1. Key:FrequencyRow percentageColumn percentage
‘Good physical working conditions’ are relatively more important to females than males. For example, 33.03 percent of females consider ‘good physical working conditions’ to be ‘essential’ and 54.78 percent of them consider this to be ‘very important’. The corresponding percentages for males are 24.60 and 49.20, respectively.
143
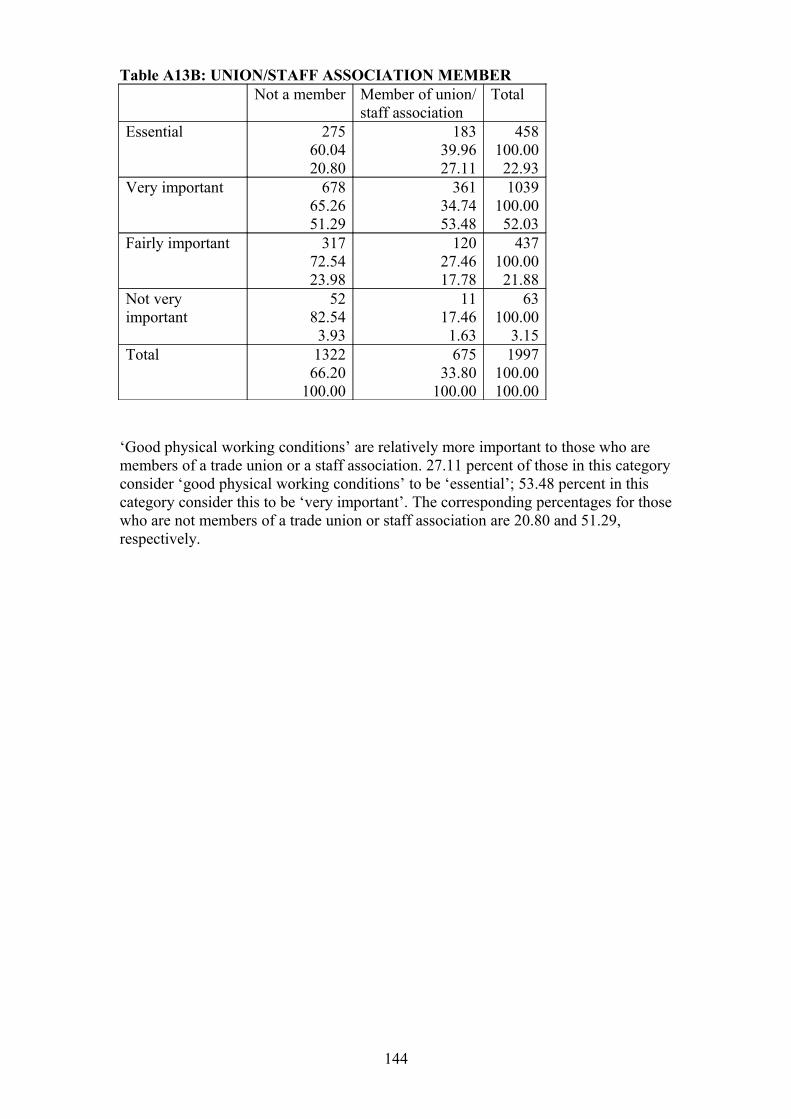
Table A13B: UNION/STAFF ASSOCIATION MEMBERNot a member Member of union/
staff associationTotal
Essential 27560.0420.80
18339.9627.11
458100.0022.93
Very important 67865.2651.29
36134.7453.48
1039100.0052.03
Fairly important 31772.5423.98
12027.4617.78
437100.0021.88
Not very important
5282.543.93
1117.461.63
63100.00
3.15Total 1322
66.20100.00
67533.80
100.00
1997100.00100.00
‘Good physical working conditions’ are relatively more important to those who are members of a trade union or a staff association. 27.11 percent of those in this category consider ‘good physical working conditions’ to be ‘essential’; 53.48 percent in this category consider this to be ‘very important’. The corresponding percentages for those who are not members of a trade union or staff association are 20.80 and 51.29, respectively.
144
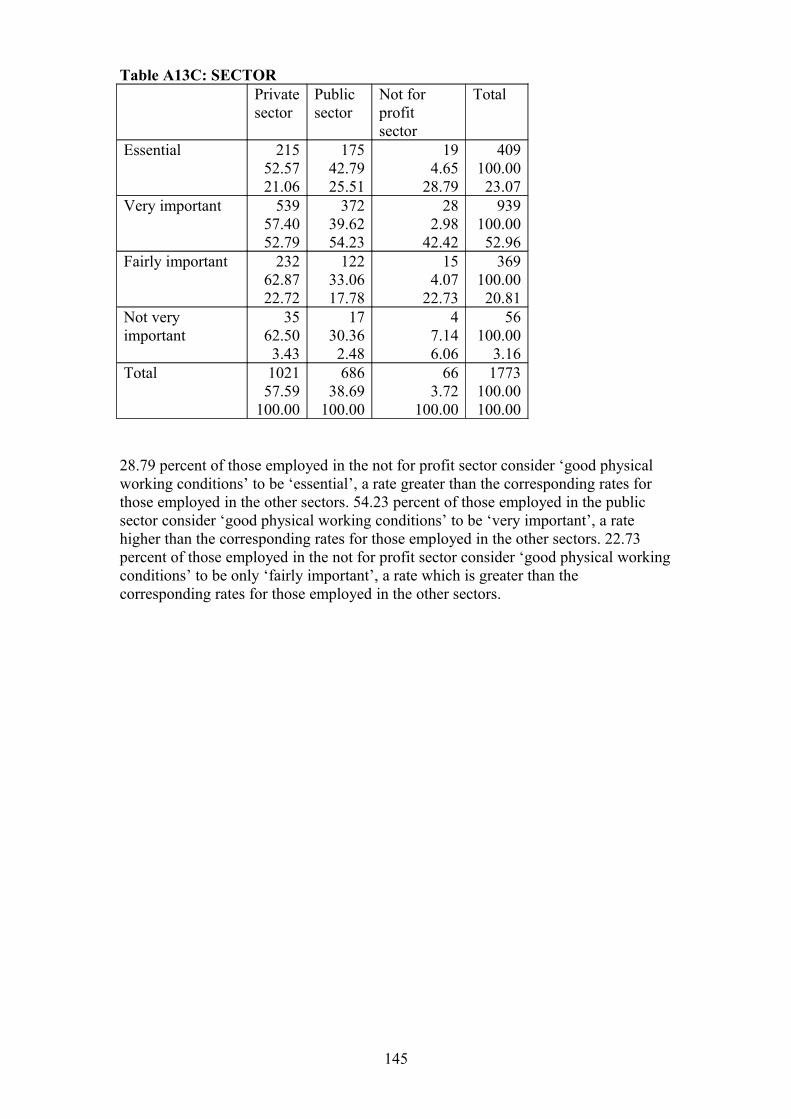
Table A13C: SECTORPrivatesector
Publicsector
Not for profitsector
Total
Essential 21552.5721.06
17542.7925.51
194.65
28.79
409100.0023.07
Very important 53957.4052.79
37239.6254.23
282.98
42.42
939100.0052.96
Fairly important 23262.8722.72
12233.0617.78
154.07
22.73
369100.0020.81
Not very important
3562.503.43
1730.362.48
47.146.06
56100.00
3.16Total 1021
57.59100.00
68638.69
100.00
663.72
100.00
1773100.00100.00
28.79 percent of those employed in the not for profit sector consider ‘good physical working conditions’ to be ‘essential’, a rate greater than the corresponding rates for those employed in the other sectors. 54.23 percent of those employed in the public sector consider ‘good physical working conditions’ to be ‘very important’, a rate higher than the corresponding rates for those employed in the other sectors. 22.73 percent of those employed in the not for profit sector consider ‘good physical working conditions’ to be only ‘fairly important’, a rate which is greater than the corresponding rates for those employed in the other sectors.
145
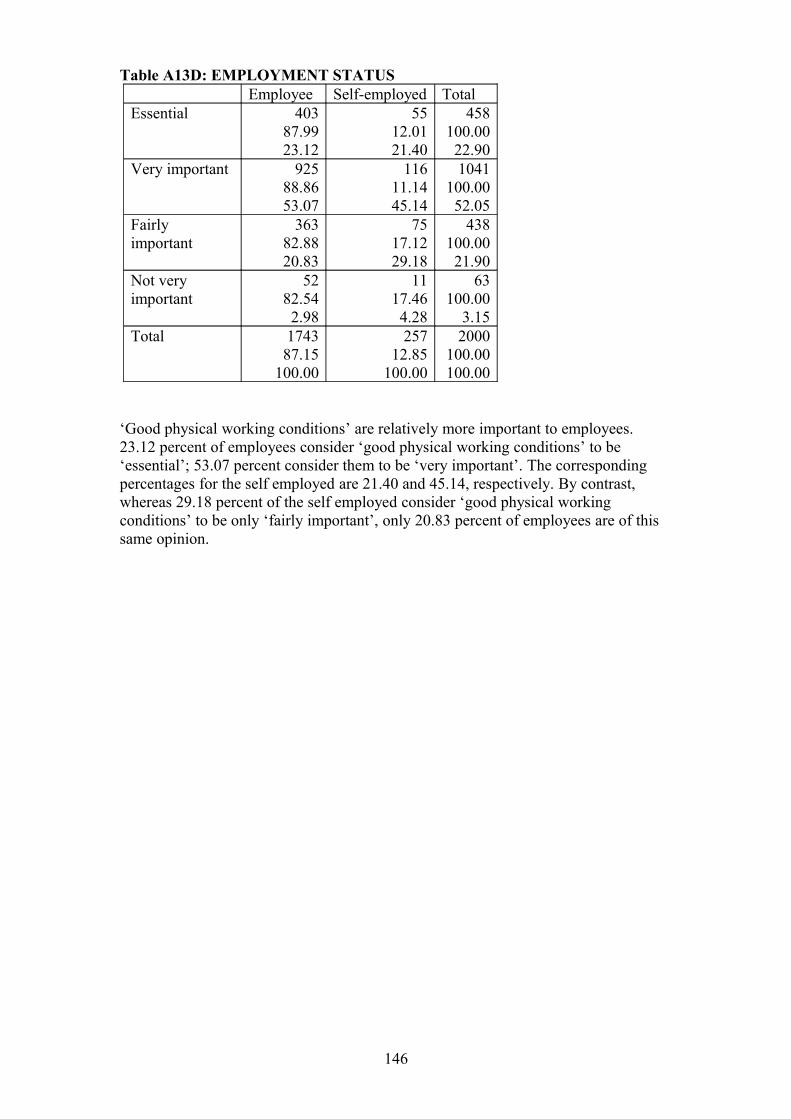
Table A13D: EMPLOYMENT STATUSEmployee Self-employed Total
Essential 40387.9923.12
5512.0121.40
458100.0022.90
Very important 92588.8653.07
11611.1445.14
1041100.0052.05
Fairly important
36382.8820.83
7517.1229.18
438100.0021.90
Not very important
5282.542.98
1117.464.28
63100.00
3.15Total 1743
87.15100.00
25712.85
100.00
2000100.00100.00
‘Good physical working conditions’ are relatively more important to employees. 23.12 percent of employees consider ‘good physical working conditions’ to be ‘essential’; 53.07 percent consider them to be ‘very important’. The corresponding percentages for the self employed are 21.40 and 45.14, respectively. By contrast, whereas 29.18 percent of the self employed consider ‘good physical working conditions’ to be only ‘fairly important’, only 20.83 percent of employees are of this same opinion.
146
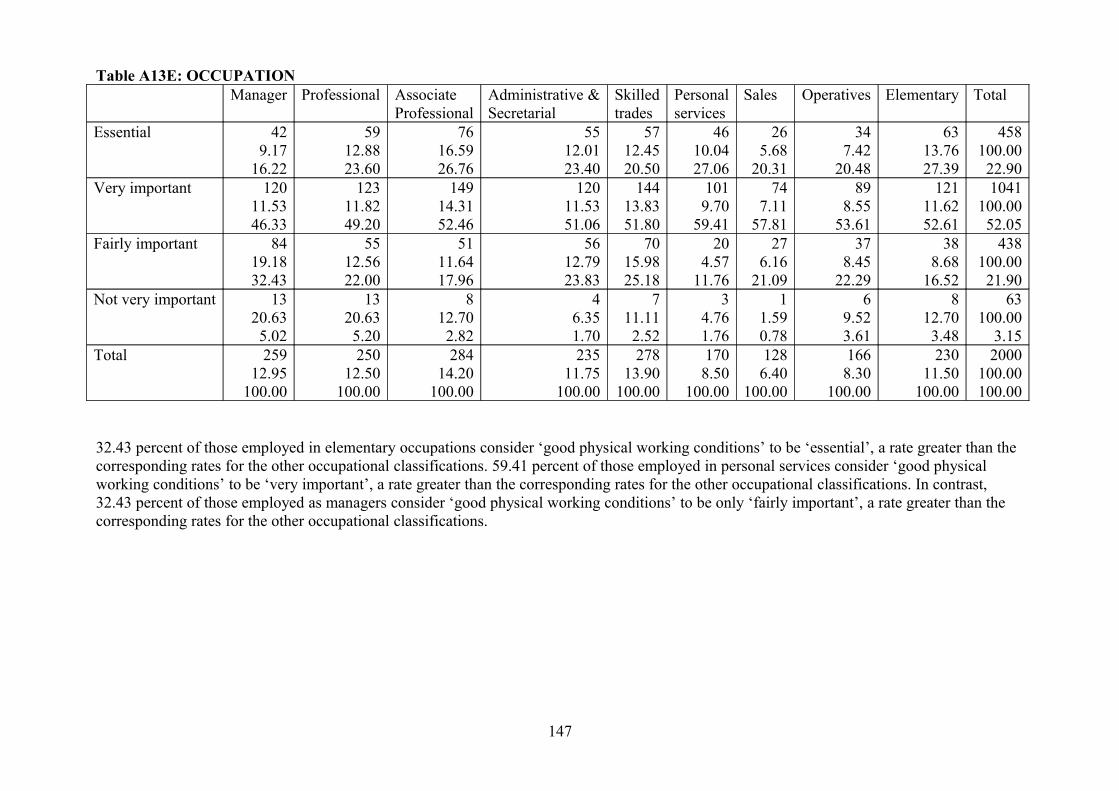
Table A13E: OCCUPATIONManager Professional Associate
ProfessionalAdministrative &Secretarial
Skilledtrades
Personal services
Sales Operatives Elementary Total
Essential 429.17
16.22
5912.8823.60
7616.5926.76
5512.0123.40
5712.4520.50
4610.0427.06
265.68
20.31
347.42
20.48
6313.7627.39
458100.0022.90
Very important 12011.5346.33
12311.8249.20
14914.3152.46
12011.5351.06
14413.8351.80
1019.70
59.41
747.11
57.81
898.55
53.61
12111.6252.61
1041100.0052.05
Fairly important 8419.1832.43
5512.5622.00
5111.6417.96
5612.7923.83
7015.9825.18
204.57
11.76
276.16
21.09
378.45
22.29
388.68
16.52
438100.0021.90
Not very important 1320.635.02
1320.635.20
812.702.82
46.351.70
711.112.52
34.761.76
11.590.78
69.523.61
812.703.48
63100.00
3.15Total 259
12.95100.00
25012.50
100.00
28414.20
100.00
23511.75
100.00
27813.90
100.00
1708.50
100.00
1286.40
100.00
1668.30
100.00
23011.50
100.00
2000100.00100.00
32.43 percent of those employed in elementary occupations consider ‘good physical working conditions’ to be ‘essential’, a rate greater than the corresponding rates for the other occupational classifications. 59.41 percent of those employed in personal services consider ‘good physical working conditions’ to be ‘very important’, a rate greater than the corresponding rates for the other occupational classifications. In contrast, 32.43 percent of those employed as managers consider ‘good physical working conditions’ to be only ‘fairly important’, a rate greater than the corresponding rates for the other occupational classifications.
147

Table 14. Results of the Cross Tabulation of ‘A Lot Of Variety In The Type Of Work’Variable Value of
Pearson Chi-squared Statistic
StatisticalSignificance
Value of Cramer’s V
Gender (3) 1.3249 0.723 0.0257Age (9) 7.8329 0.551 0.0361Marital status (3) 0.9605 0.811 0.0220Financially dependent child (3) 2.6493 0.449 0.0365Highest qualification held (12) 74.5725 0.000 0.1115Work experience (12) 16.6987 0.161 0.0530Working full time (3) 10.4179 0.015 0.0722In a permanent job (3) 6.3906 0.094 0.0600Working in a supervisory/managerial capacity
(3) 14.4068 0.002 0.0909
Tenure (12) 3.8521 0.986 0.0253Whether has more than 1 job (3) 1.9857 0.575 0.0315Whether a member of a union or staff association
(3) 13.0850 0.004 0.0810
Sector of employment (6) 17.5383 0.007 0.0703Whether working as an employee or self employed
(3) 2.5918 0.459 0.0360
Occupation (24) 75.3045 0.000 0.1121Whether seeking a better job (3) 6.8560 0.077 0.0638
The tables which follow present the detail of the results of the cross tabulations for the job attribute preference ‘a lot of variety in the type of work’ which are statistically significant at (p < 0.05). As reported in Table A14, 6 cross tabulations produce statistically significant results, being highest qualification, whether working full time, whether in a supervisory or managerial capacity, whether a member of a union or staff association, sector and occupation.
148
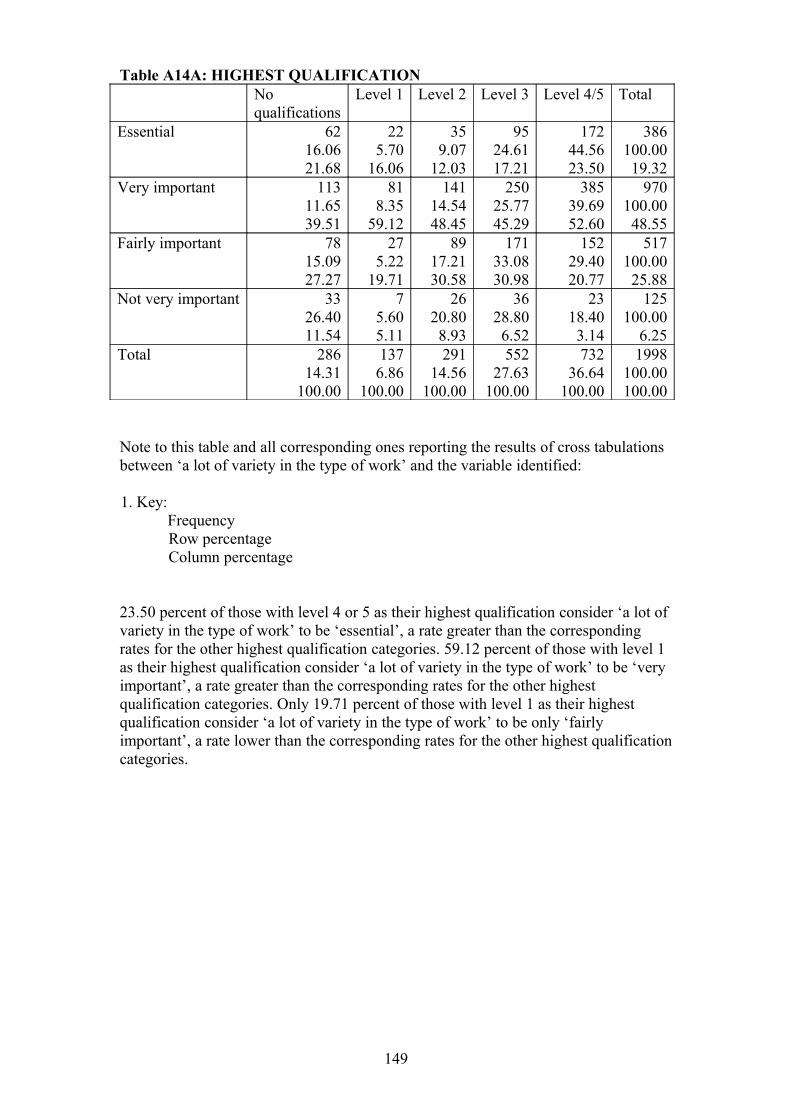
Table A14A: HIGHEST QUALIFICATIONNoqualifications
Level 1 Level 2 Level 3 Level 4/5 Total
Essential 6216.0621.68
225.70
16.06
359.07
12.03
9524.6117.21
17244.5623.50
386100.0019.32
Very important 11311.6539.51
818.35
59.12
14114.5448.45
25025.7745.29
38539.6952.60
970100.0048.55
Fairly important 7815.0927.27
275.22
19.71
8917.2130.58
17133.0830.98
15229.4020.77
517100.0025.88
Not very important 3326.4011.54
75.605.11
2620.808.93
3628.806.52
2318.403.14
125100.00
6.25Total 286
14.31100.00
1376.86
100.00
29114.56
100.00
55227.63
100.00
73236.64
100.00
1998100.00100.00
Note to this table and all corresponding ones reporting the results of cross tabulations between ‘a lot of variety in the type of work’ and the variable identified:
1. Key:FrequencyRow percentageColumn percentage
23.50 percent of those with level 4 or 5 as their highest qualification consider ‘a lot of variety in the type of work’ to be ‘essential’, a rate greater than the corresponding rates for the other highest qualification categories. 59.12 percent of those with level 1 as their highest qualification consider ‘a lot of variety in the type of work’ to be ‘very important’, a rate greater than the corresponding rates for the other highest qualification categories. Only 19.71 percent of those with level 1 as their highest qualification consider ‘a lot of variety in the type of work’ to be only ‘fairly important’, a rate lower than the corresponding rates for the other highest qualification categories.
149
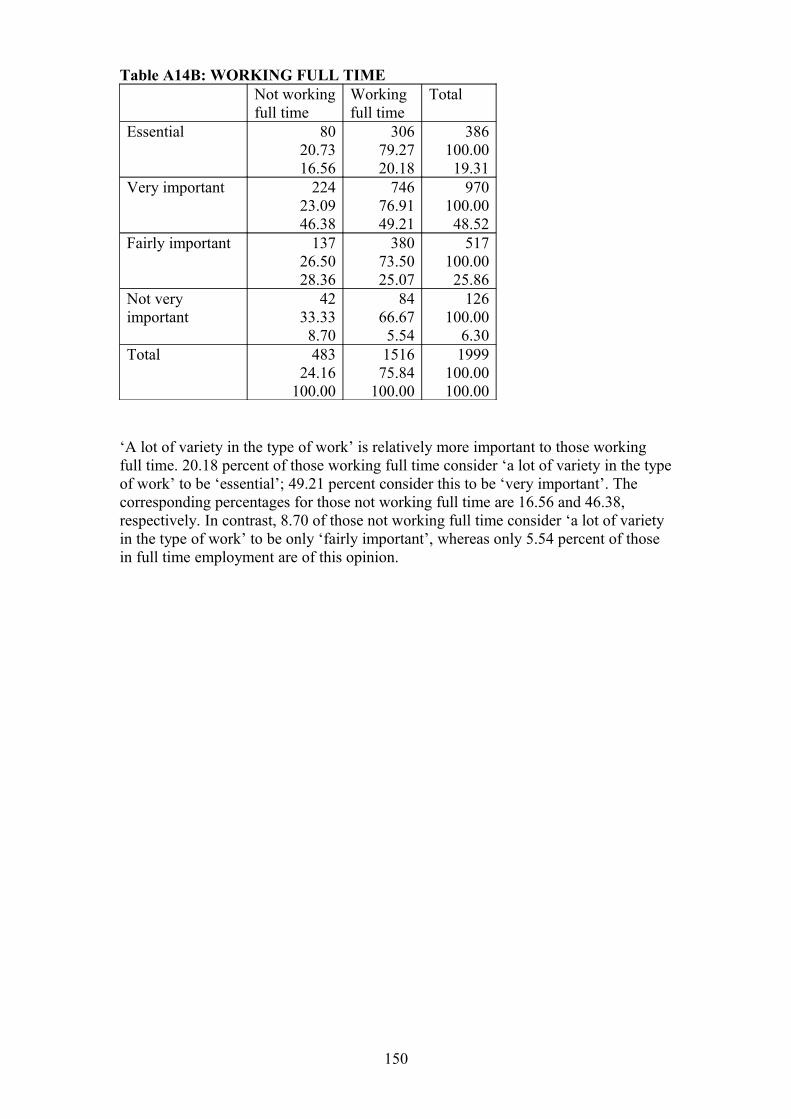
Table A14B: WORKING FULL TIMENot workingfull time
Workingfull time
Total
Essential 8020.7316.56
30679.2720.18
386100.0019.31
Very important 22423.0946.38
74676.9149.21
970100.0048.52
Fairly important 13726.5028.36
38073.5025.07
517100.0025.86
Not very important
4233.338.70
8466.675.54
126100.00
6.30Total 483
24.16100.00
151675.84
100.00
1999100.00100.00
‘A lot of variety in the type of work’ is relatively more important to those working full time. 20.18 percent of those working full time consider ‘a lot of variety in the type of work’ to be ‘essential’; 49.21 percent consider this to be ‘very important’. The corresponding percentages for those not working full time are 16.56 and 46.38, respectively. In contrast, 8.70 of those not working full time consider ‘a lot of variety in the type of work’ to be only ‘fairly important’, whereas only 5.54 percent of those in full time employment are of this opinion.
150

Table A14C: IN A SUPERVISORY/MANAGERIAL ROLENot in a supervisory/managerial role
In a supervisory/managerial role
Total
Essential 18155.1817.34
14744.8221.06
328100.0018.83
Very important 48957.8046.84
35742.2051.15
846100.0048.56
Fairly important 29664.6328.35
16235.3723.21
458100.0026.29
Not very important
7870.917.47
3229.094.58
110100.00
6.31Total 1044
59.93100.00
69840.07
100.00
1742100.00100.00
‘A lot of variety in the type of work’ is relatively more important to those working in a supervisory or managerial capacity. 21.06 percent working in such a capacity consider ‘a lot of variety in the type of work’ to be ‘essential’; 51.15 of the same group consider ‘a lot of variety in the type of work’ to be ‘very important’. The corresponding percentages for those not working in a supervisory or managerial capacity are 17.34 and 46.84, respectively. In contrast 7.47 percent of those not working in a supervisory or managerial capacity consider ‘a lot of variety in the type of work’ to be ‘not very important’. Only 4.58 percent of those working in a supervisory or managerial capacity are of this opinion.
151
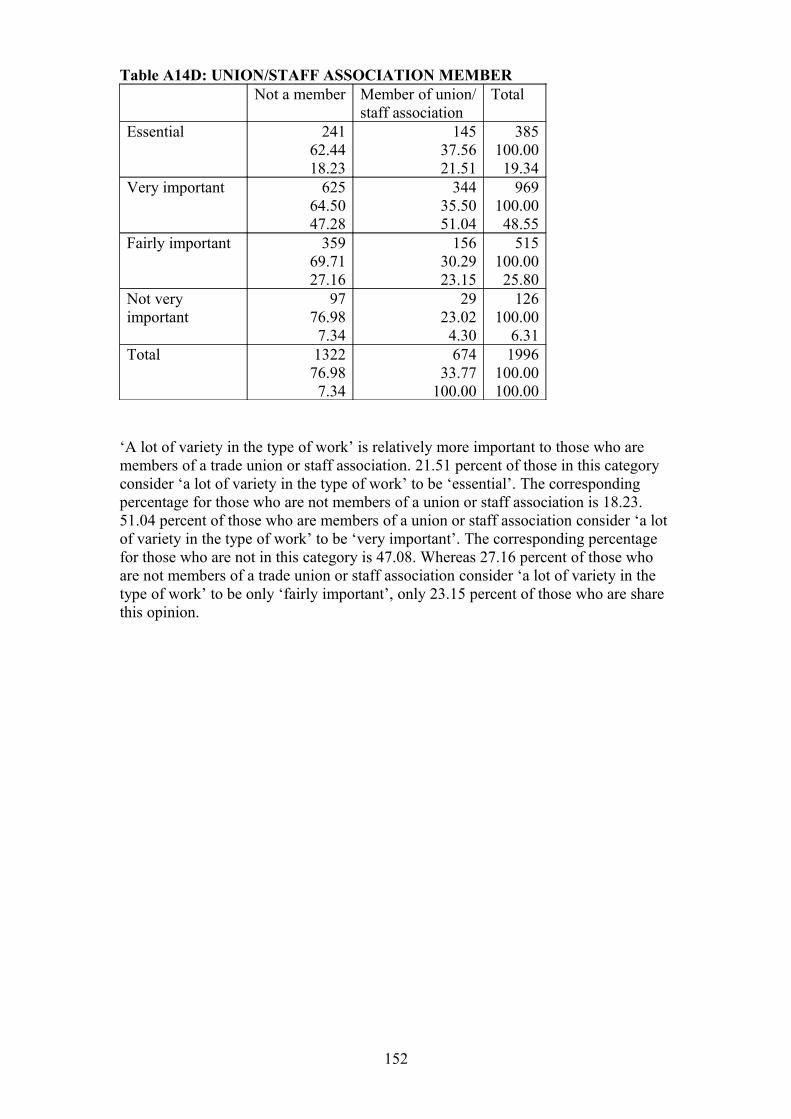
Table A14D: UNION/STAFF ASSOCIATION MEMBERNot a member Member of union/
staff associationTotal
Essential 24162.4418.23
14537.5621.51
385100.0019.34
Very important 62564.5047.28
34435.5051.04
969100.0048.55
Fairly important 35969.7127.16
15630.2923.15
515100.0025.80
Not very important
9776.987.34
2923.024.30
126100.00
6.31Total 1322
76.987.34
67433.77
100.00
1996100.00100.00
‘A lot of variety in the type of work’ is relatively more important to those who are members of a trade union or staff association. 21.51 percent of those in this category consider ‘a lot of variety in the type of work’ to be ‘essential’. The corresponding percentage for those who are not members of a union or staff association is 18.23. 51.04 percent of those who are members of a union or staff association consider ‘a lot of variety in the type of work’ to be ‘very important’. The corresponding percentage for those who are not in this category is 47.08. Whereas 27.16 percent of those who are not members of a trade union or staff association consider ‘a lot of variety in the type of work’ to be only ‘fairly important’, only 23.15 percent of those who are share this opinion.
152
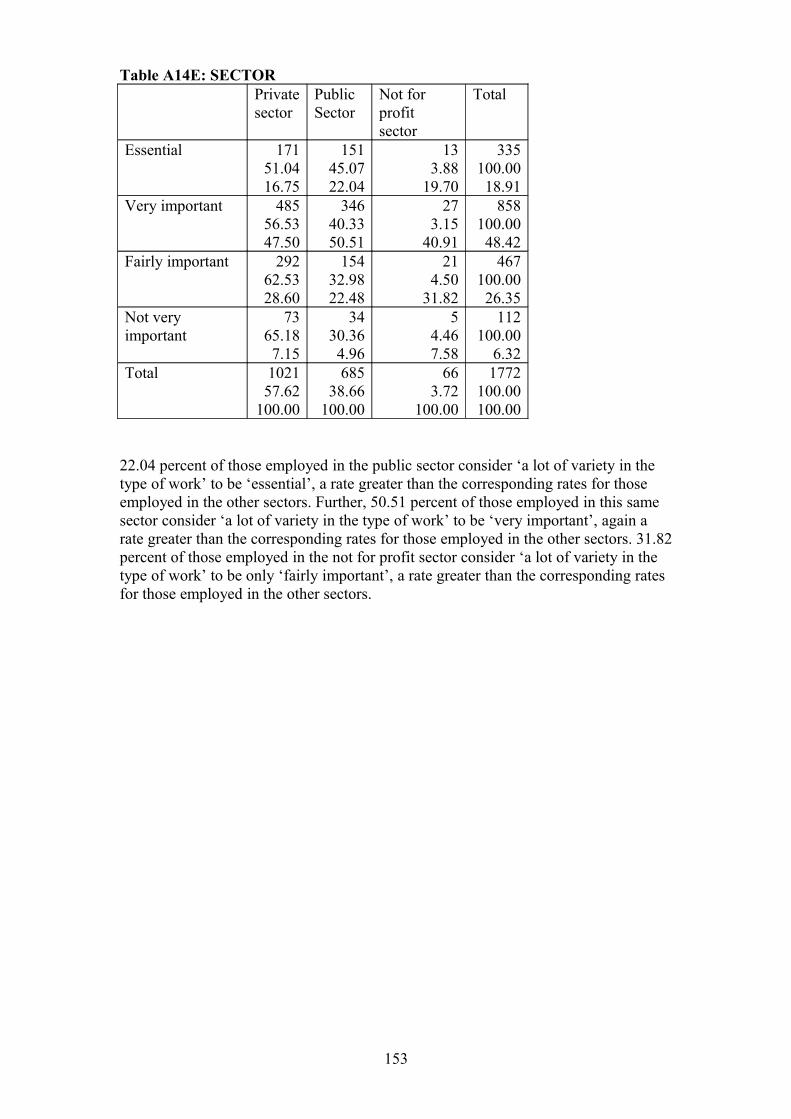
Table A14E: SECTORPrivatesector
PublicSector
Not for profitsector
Total
Essential 17151.0416.75
15145.0722.04
133.88
19.70
335100.0018.91
Very important 48556.5347.50
34640.3350.51
273.15
40.91
858100.0048.42
Fairly important 29262.5328.60
15432.9822.48
214.50
31.82
467100.0026.35
Not very important
7365.187.15
3430.364.96
54.467.58
112100.00
6.32Total 1021
57.62100.00
68538.66
100.00
663.72
100.00
1772100.00100.00
22.04 percent of those employed in the public sector consider ‘a lot of variety in the type of work’ to be ‘essential’, a rate greater than the corresponding rates for those employed in the other sectors. Further, 50.51 percent of those employed in this same sector consider ‘a lot of variety in the type of work’ to be ‘very important’, again a rate greater than the corresponding rates for those employed in the other sectors. 31.82 percent of those employed in the not for profit sector consider ‘a lot of variety in the type of work’ to be only ‘fairly important’, a rate greater than the corresponding rates for those employed in the other sectors.
153
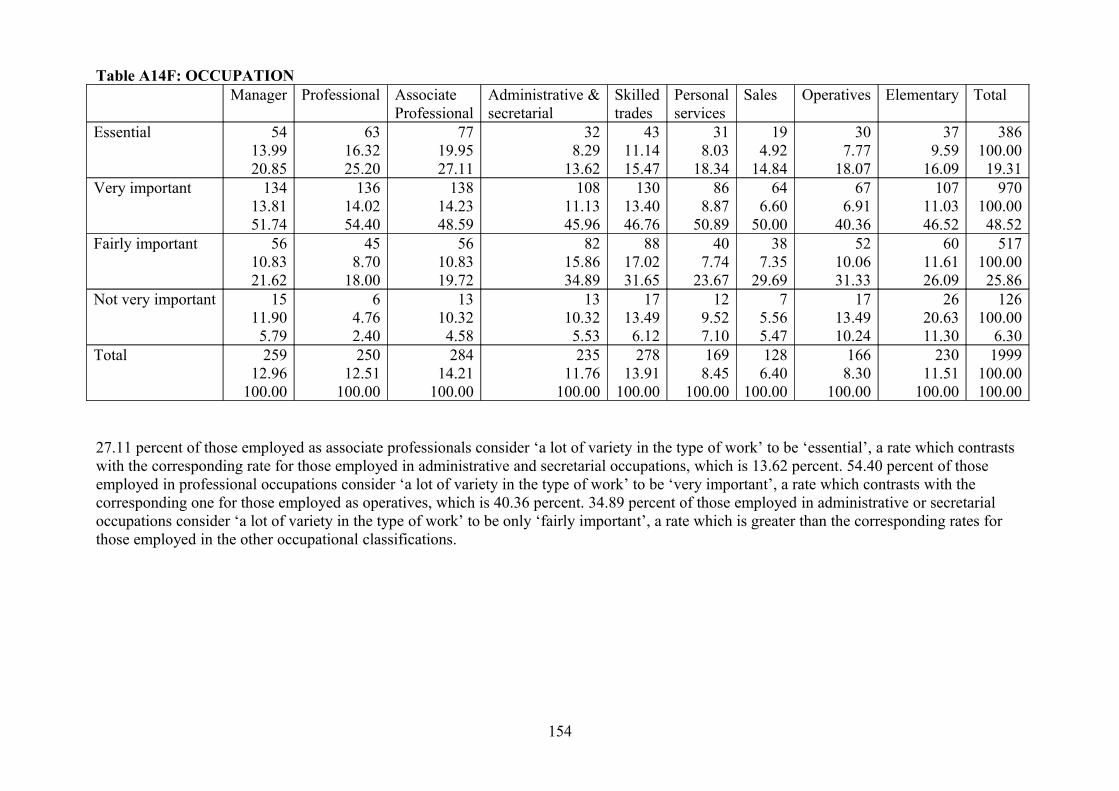
Table A14F: OCCUPATIONManager Professional Associate
ProfessionalAdministrative &secretarial
Skilledtrades
Personal services
Sales Operatives Elementary Total
Essential 5413.9920.85
6316.3225.20
7719.9527.11
328.29
13.62
4311.1415.47
318.03
18.34
194.92
14.84
307.77
18.07
379.59
16.09
386100.0019.31
Very important 13413.8151.74
13614.0254.40
13814.2348.59
10811.1345.96
13013.4046.76
868.87
50.89
646.60
50.00
676.91
40.36
10711.0346.52
970100.0048.52
Fairly important 5610.8321.62
458.70
18.00
5610.8319.72
8215.8634.89
8817.0231.65
407.74
23.67
387.35
29.69
5210.0631.33
6011.6126.09
517100.0025.86
Not very important 1511.905.79
64.762.40
1310.324.58
1310.325.53
1713.496.12
129.527.10
75.565.47
1713.4910.24
2620.6311.30
126100.00
6.30Total 259
12.96100.00
25012.51
100.00
28414.21
100.00
23511.76
100.00
27813.91
100.00
1698.45
100.00
1286.40
100.00
1668.30
100.00
23011.51
100.00
1999100.00100.00
27.11 percent of those employed as associate professionals consider ‘a lot of variety in the type of work’ to be ‘essential’, a rate which contrasts with the corresponding rate for those employed in administrative and secretarial occupations, which is 13.62 percent. 54.40 percent of those employed in professional occupations consider ‘a lot of variety in the type of work’ to be ‘very important’, a rate which contrasts with the corresponding one for those employed as operatives, which is 40.36 percent. 34.89 percent of those employed in administrative or secretarial occupations consider ‘a lot of variety in the type of work’ to be only ‘fairly important’, a rate which is greater than the corresponding rates for those employed in the other occupational classifications.
154
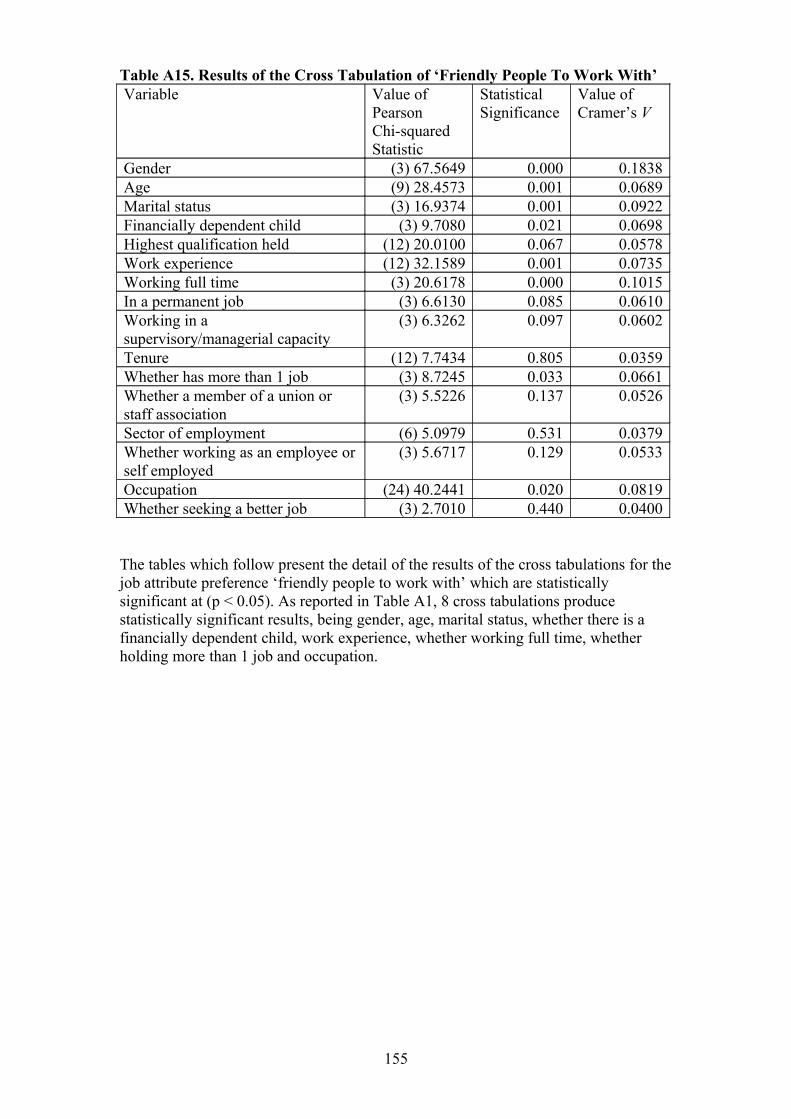
Table A15. Results of the Cross Tabulation of ‘Friendly People To Work With’Variable Value of
Pearson Chi-squared Statistic
StatisticalSignificance
Value of Cramer’s V
Gender (3) 67.5649 0.000 0.1838Age (9) 28.4573 0.001 0.0689Marital status (3) 16.9374 0.001 0.0922Financially dependent child (3) 9.7080 0.021 0.0698Highest qualification held (12) 20.0100 0.067 0.0578Work experience (12) 32.1589 0.001 0.0735Working full time (3) 20.6178 0.000 0.1015In a permanent job (3) 6.6130 0.085 0.0610Working in a supervisory/managerial capacity
(3) 6.3262 0.097 0.0602
Tenure (12) 7.7434 0.805 0.0359Whether has more than 1 job (3) 8.7245 0.033 0.0661Whether a member of a union or staff association
(3) 5.5226 0.137 0.0526
Sector of employment (6) 5.0979 0.531 0.0379Whether working as an employee or self employed
(3) 5.6717 0.129 0.0533
Occupation (24) 40.2441 0.020 0.0819Whether seeking a better job (3) 2.7010 0.440 0.0400
The tables which follow present the detail of the results of the cross tabulations for the job attribute preference ‘friendly people to work with’ which are statistically significant at (p < 0.05). As reported in Table A1, 8 cross tabulations produce statistically significant results, being gender, age, marital status, whether there is a financially dependent child, work experience, whether working full time, whether holding more than 1 job and occupation.
155
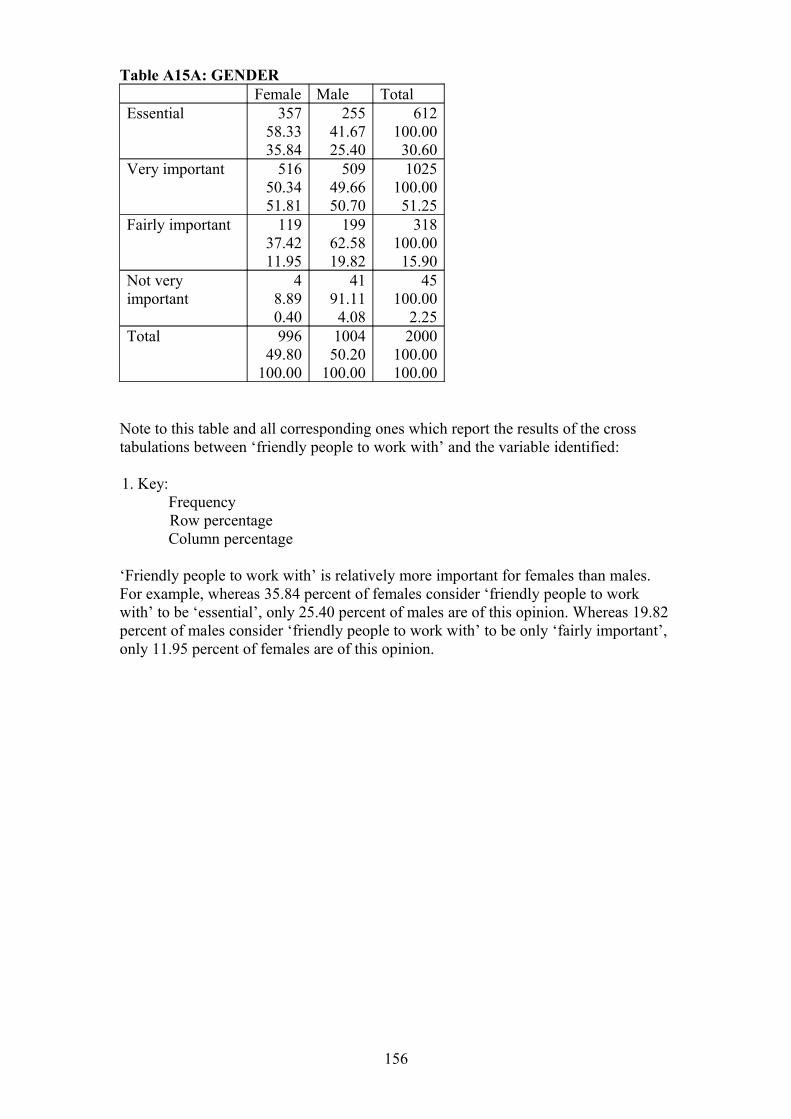
Table A15A: GENDERFemale Male Total
Essential 35758.3335.84
25541.6725.40
612100.0030.60
Very important 51650.3451.81
50949.6650.70
1025100.0051.25
Fairly important 11937.4211.95
19962.5819.82
318100.0015.90
Not very important
48.890.40
4191.114.08
45100.00
2.25Total 996
49.80100.00
100450.20
100.00
2000100.00100.00
Note to this table and all corresponding ones which report the results of the cross tabulations between ‘friendly people to work with’ and the variable identified:
1. Key:Frequency Row percentageColumn percentage
‘Friendly people to work with’ is relatively more important for females than males. For example, whereas 35.84 percent of females consider ‘friendly people to work with’ to be ‘essential’, only 25.40 percent of males are of this opinion. Whereas 19.82 percent of males consider ‘friendly people to work with’ to be only ‘fairly important’, only 11.95 percent of females are of this opinion.
156
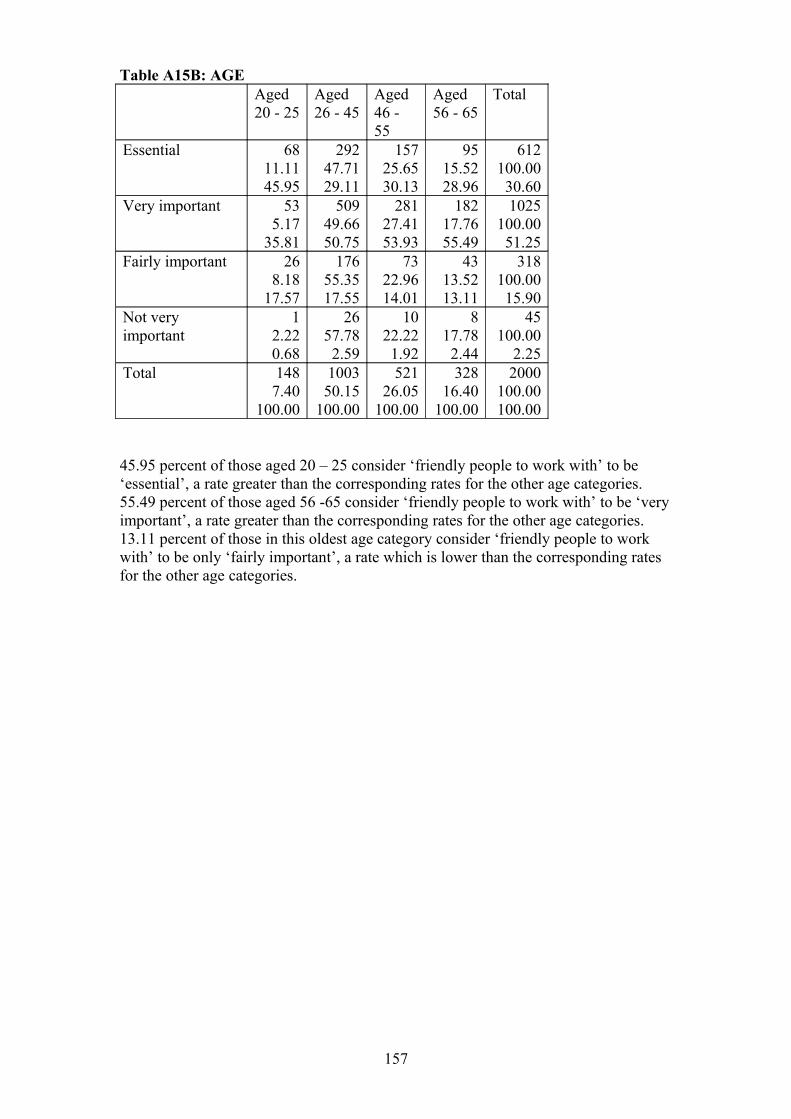
Table A15B: AGEAged20 - 25
Aged26 - 45
Aged46 - 55
Aged56 - 65
Total
Essential 6811.1145.95
29247.7129.11
15725.6530.13
9515.5228.96
612100.0030.60
Very important 535.17
35.81
50949.6650.75
28127.4153.93
18217.7655.49
1025100.0051.25
Fairly important 268.18
17.57
17655.3517.55
7322.9614.01
4313.5213.11
318100.0015.90
Not very important
12.220.68
2657.782.59
1022.221.92
817.782.44
45100.00
2.25Total 148
7.40100.00
100350.15
100.00
52126.05
100.00
32816.40
100.00
2000100.00100.00
45.95 percent of those aged 20 – 25 consider ‘friendly people to work with’ to be ‘essential’, a rate greater than the corresponding rates for the other age categories. 55.49 percent of those aged 56 -65 consider ‘friendly people to work with’ to be ‘very important’, a rate greater than the corresponding rates for the other age categories. 13.11 percent of those in this oldest age category consider ‘friendly people to work with’ to be only ‘fairly important’, a rate which is lower than the corresponding rates for the other age categories.
157
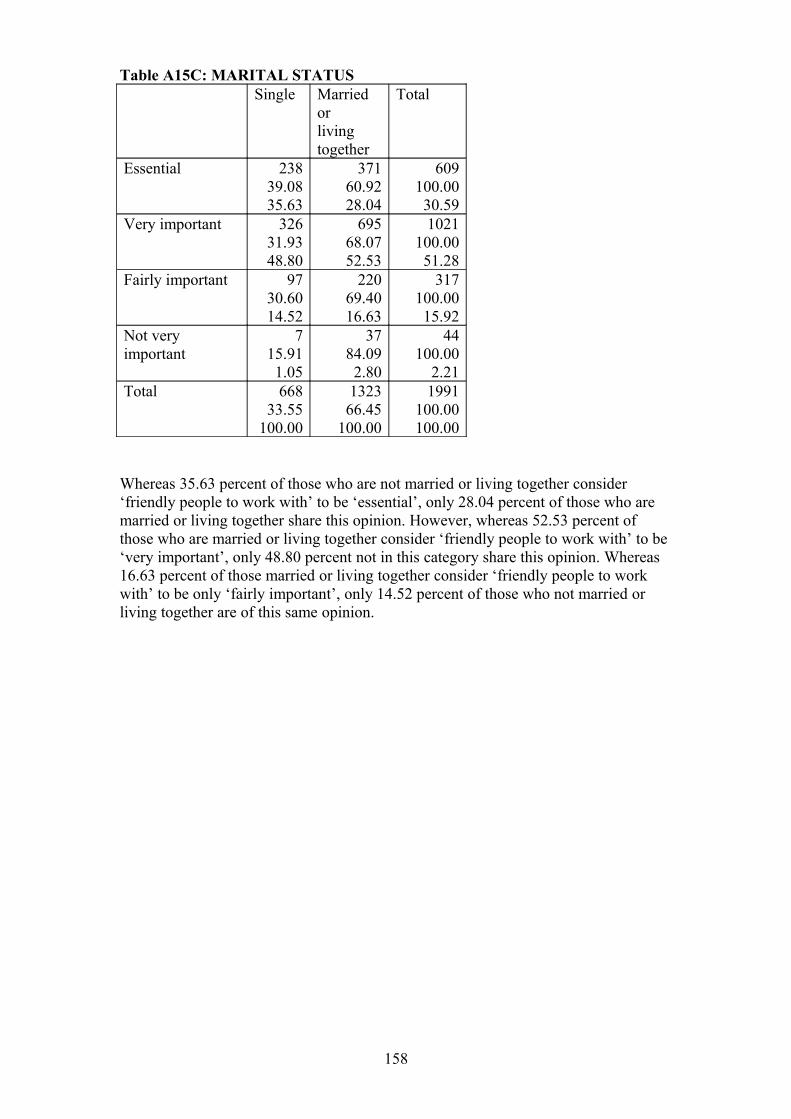
Table A15C: MARITAL STATUSSingle Married
orliving together
Total
Essential 23839.0835.63
37160.9228.04
609100.0030.59
Very important 32631.9348.80
69568.0752.53
1021100.0051.28
Fairly important 9730.6014.52
22069.4016.63
317100.0015.92
Not very important
715.911.05
3784.092.80
44100.00
2.21Total 668
33.55100.00
132366.45
100.00
1991100.00100.00
Whereas 35.63 percent of those who are not married or living together consider ‘friendly people to work with’ to be ‘essential’, only 28.04 percent of those who are married or living together share this opinion. However, whereas 52.53 percent of those who are married or living together consider ‘friendly people to work with’ to be ‘very important’, only 48.80 percent not in this category share this opinion. Whereas 16.63 percent of those married or living together consider ‘friendly people to work with’ to be only ‘fairly important’, only 14.52 percent of those who not married or living together are of this same opinion.
158

Table A15D: DEPENDENT CHILDRENWith no financiallydependent children
With financiallydependent children
Total
Essential 39564.8632.32
21435.1427.79
609100.0030.57
Very important 62861.5151.39
39338.4951.04
1021100.0051.26
Fairly important 17655.5214.40
14144.4818.31
317100.0015.91
Not very important
2351.111.88
2248.892.86
45100.0015.91
Total 122261.35
100.00
77038.65
100.00
1992100.00100.00
‘Friendly people to work with’ is relatively more important for those who do not have financially dependent children. For example, 32.32 percent in this category consider ‘friendly people to work with’ to be ‘essential’. 51.39 percent in the same category consider ‘friendly people to work with’ to be ‘very important’. The corresponding percentages for those who have financially dependent children are 27.79 and 51.04, respectively.
159
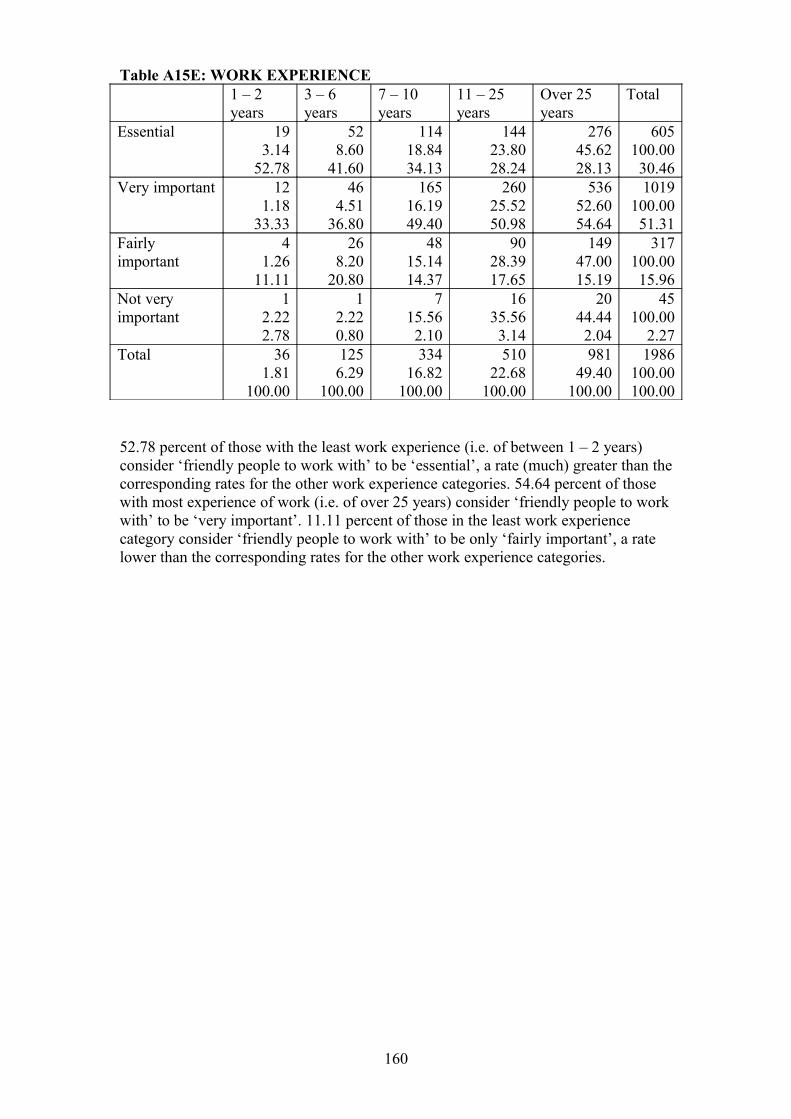
Table A15E: WORK EXPERIENCE1 – 2 years
3 – 6 years
7 – 10 years
11 – 25 years
Over 25 years
Total
Essential 193.14
52.78
528.60
41.60
11418.8434.13
14423.8028.24
27645.6228.13
605100.0030.46
Very important 121.18
33.33
464.51
36.80
16516.1949.40
26025.5250.98
53652.6054.64
1019100.0051.31
Fairly important
41.26
11.11
268.20
20.80
4815.1414.37
9028.3917.65
14947.0015.19
317100.0015.96
Not very important
12.222.78
12.220.80
715.562.10
1635.563.14
2044.442.04
45100.00
2.27Total 36
1.81100.00
1256.29
100.00
33416.82
100.00
51022.68
100.00
98149.40
100.00
1986100.00100.00
52.78 percent of those with the least work experience (i.e. of between 1 – 2 years) consider ‘friendly people to work with’ to be ‘essential’, a rate (much) greater than the corresponding rates for the other work experience categories. 54.64 percent of those with most experience of work (i.e. of over 25 years) consider ‘friendly people to work with’ to be ‘very important’. 11.11 percent of those in the least work experience category consider ‘friendly people to work with’ to be only ‘fairly important’, a rate lower than the corresponding rates for the other work experience categories.
160
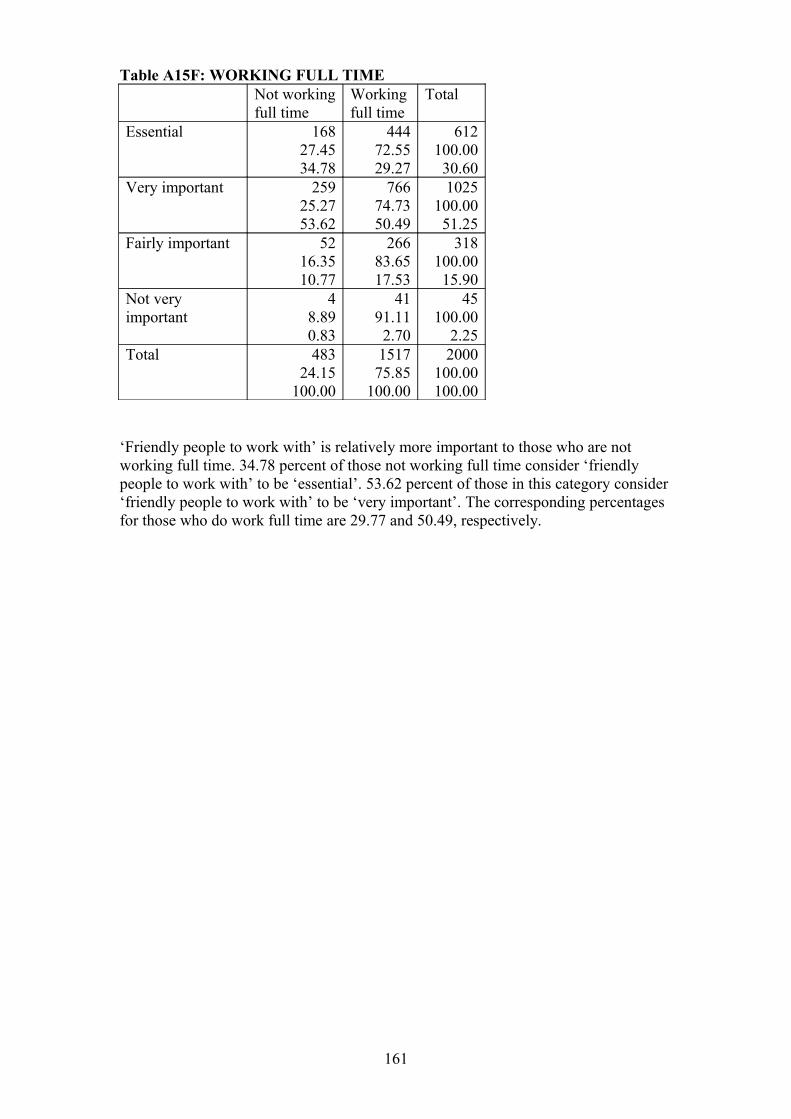
Table A15F: WORKING FULL TIMENot workingfull time
Workingfull time
Total
Essential 16827.4534.78
44472.5529.27
612100.0030.60
Very important 25925.2753.62
76674.7350.49
1025100.0051.25
Fairly important 5216.3510.77
26683.6517.53
318100.0015.90
Not very important
48.890.83
4191.112.70
45100.00
2.25Total 483
24.15100.00
151775.85
100.00
2000100.00100.00
‘Friendly people to work with’ is relatively more important to those who are not working full time. 34.78 percent of those not working full time consider ‘friendly people to work with’ to be ‘essential’. 53.62 percent of those in this category consider ‘friendly people to work with’ to be ‘very important’. The corresponding percentages for those who do work full time are 29.77 and 50.49, respectively.
161
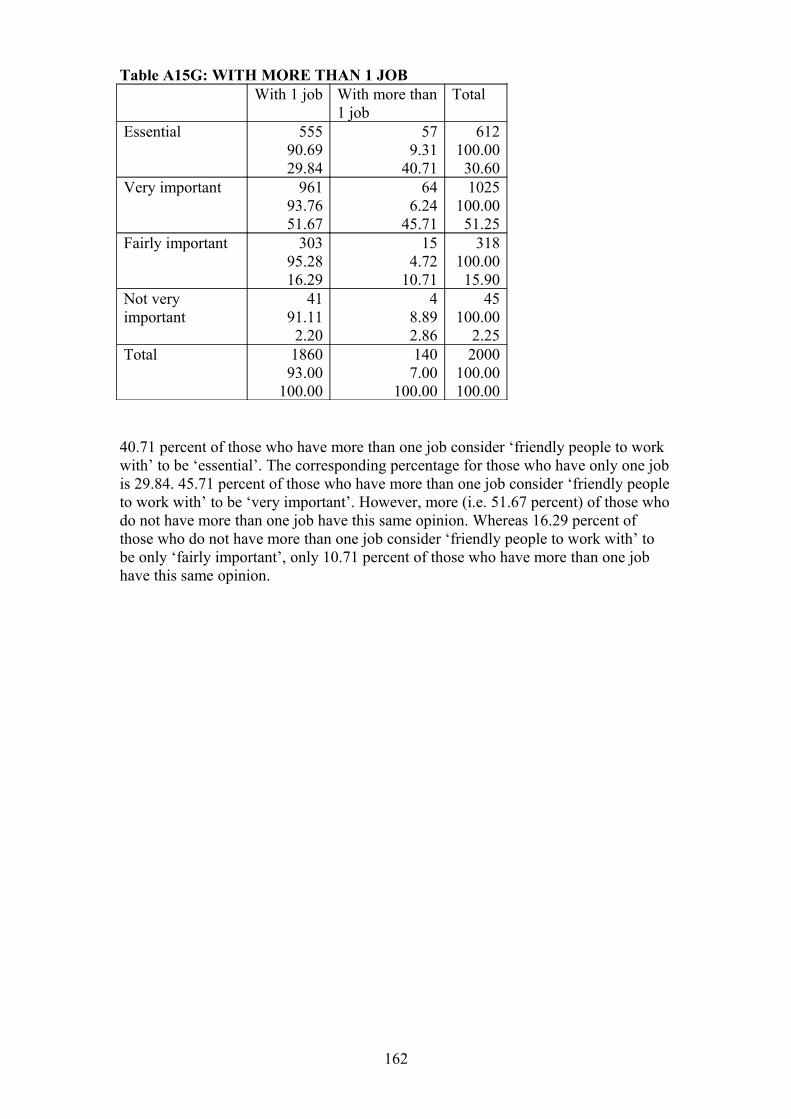
Table A15G: WITH MORE THAN 1 JOBWith 1 job With more than
1 jobTotal
Essential 55590.6929.84
579.31
40.71
612100.0030.60
Very important 96193.7651.67
646.24
45.71
1025100.0051.25
Fairly important 30395.2816.29
154.72
10.71
318100.0015.90
Not very important
4191.112.20
48.892.86
45100.00
2.25Total 1860
93.00100.00
1407.00
100.00
2000100.00100.00
40.71 percent of those who have more than one job consider ‘friendly people to work with’ to be ‘essential’. The corresponding percentage for those who have only one job is 29.84. 45.71 percent of those who have more than one job consider ‘friendly people to work with’ to be ‘very important’. However, more (i.e. 51.67 percent) of those who do not have more than one job have this same opinion. Whereas 16.29 percent of those who do not have more than one job consider ‘friendly people to work with’ to be only ‘fairly important’, only 10.71 percent of those who have more than one job have this same opinion.
162
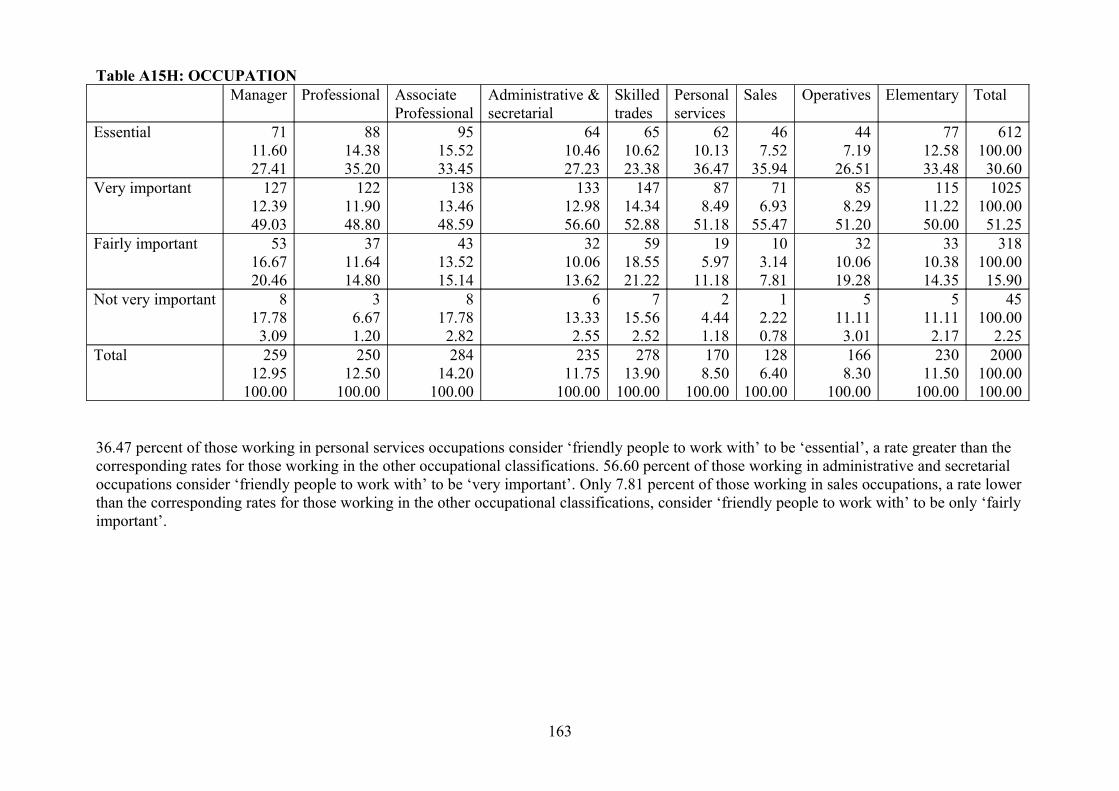
Table A15H: OCCUPATIONManager Professional Associate
ProfessionalAdministrative &secretarial
Skilledtrades
Personal services
Sales Operatives Elementary Total
Essential 7111.6027.41
8814.3835.20
9515.5233.45
6410.4627.23
6510.6223.38
6210.1336.47
467.52
35.94
447.19
26.51
7712.5833.48
612100.0030.60
Very important 12712.3949.03
12211.9048.80
13813.4648.59
13312.9856.60
14714.3452.88
878.49
51.18
716.93
55.47
858.29
51.20
11511.2250.00
1025100.0051.25
Fairly important 5316.6720.46
3711.6414.80
4313.5215.14
3210.0613.62
5918.5521.22
195.97
11.18
103.147.81
3210.0619.28
3310.3814.35
318100.0015.90
Not very important 817.783.09
36.671.20
817.782.82
613.332.55
715.562.52
24.441.18
12.220.78
511.113.01
511.112.17
45100.00
2.25Total 259
12.95100.00
25012.50
100.00
28414.20
100.00
23511.75
100.00
27813.90
100.00
1708.50
100.00
1286.40
100.00
1668.30
100.00
23011.50
100.00
2000100.00100.00
36.47 percent of those working in personal services occupations consider ‘friendly people to work with’ to be ‘essential’, a rate greater than the corresponding rates for those working in the other occupational classifications. 56.60 percent of those working in administrative and secretarial occupations consider ‘friendly people to work with’ to be ‘very important’. Only 7.81 percent of those working in sales occupations, a rate lower than the corresponding rates for those working in the other occupational classifications, consider ‘friendly people to work with’ to be only ‘fairly important’.
163
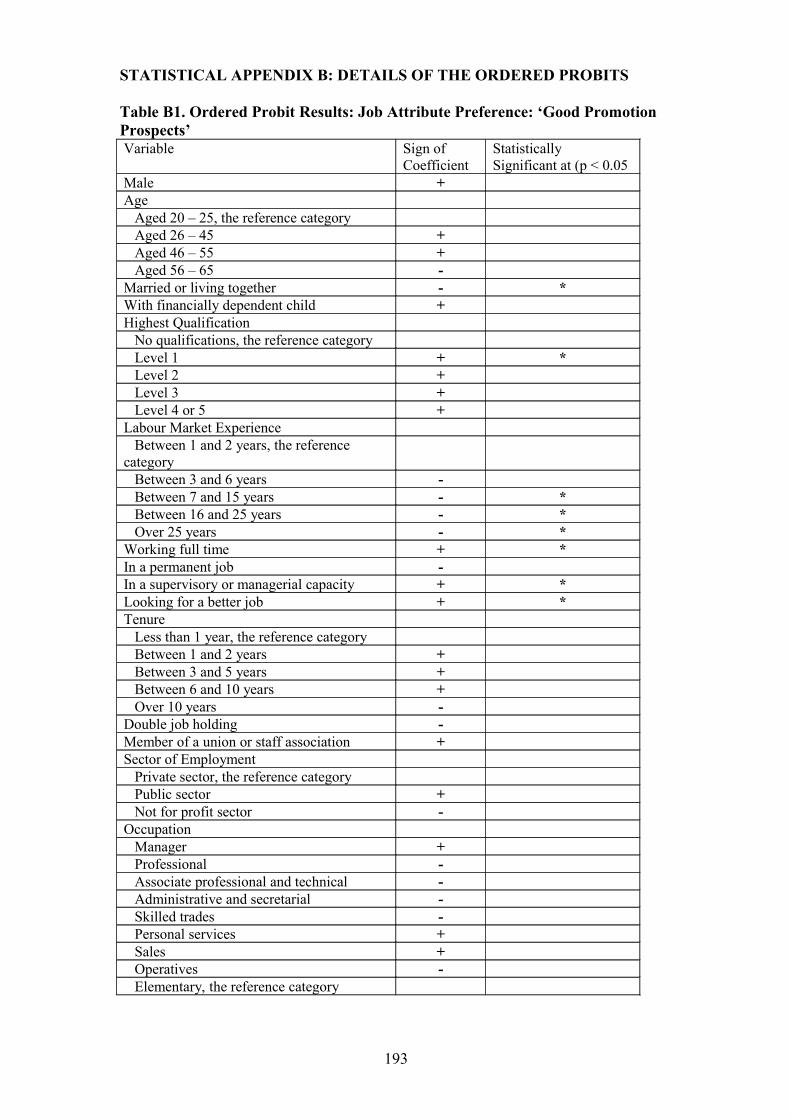
STATISTICAL APPENDIX B: DETAILS OF THE ORDERED PROBITS
Table B1. Ordered Probit Results: Job Attribute Preference: ‘Good Promotion Prospects’Variable Sign of
CoefficientStatisticallySignificant at (p < 0.05
Male +Age Aged 20 – 25, the reference category Aged 26 – 45 + Aged 46 – 55 + Aged 56 – 65 -Married or living together - *With financially dependent child +Highest Qualification No qualifications, the reference category Level 1 + * Level 2 + Level 3 + Level 4 or 5 +Labour Market Experience Between 1 and 2 years, the reference category Between 3 and 6 years - Between 7 and 15 years - * Between 16 and 25 years - * Over 25 years - *Working full time + *In a permanent job -In a supervisory or managerial capacity + *Looking for a better job + *Tenure Less than 1 year, the reference category Between 1 and 2 years + Between 3 and 5 years + Between 6 and 10 years + Over 10 years -Double job holding -Member of a union or staff association +Sector of Employment Private sector, the reference category Public sector + Not for profit sector -Occupation Manager + Professional - Associate professional and technical - Administrative and secretarial - Skilled trades - Personal services + Sales + Operatives - Elementary, the reference category
193

Number of Observations: 1634Wald chi(2) = 262.62Prob > chi2 = 0.0000Pseudo R2 = 0.0606
Test statistics for the joint significance of age variables:Chi2 (3) = 9.97 : prob > chi2 = 0.0189
Test statistics for the joint significance of highest qualification variables:Chi2 (4) = 6.79 : prob > chi2 = 0.1473
Test statistics for the joint significance of the labour market experience variables:Chi2 (4) = 32.13 : prob > chi2 = 0.0000
Test statistics for the joint significance of the tenure variables:Chi2 (4) = 4.88 : prob > chi2 = 0.2994
Test statistics for the joint significance of the sector variables:Chi2 (2) = 3.03 : prob > chi2 = 0.2203
Test statistics for the joint significance of the occupation variables:Chi2 (8) = 10.12 : prob > chi2 = 0.2568
193
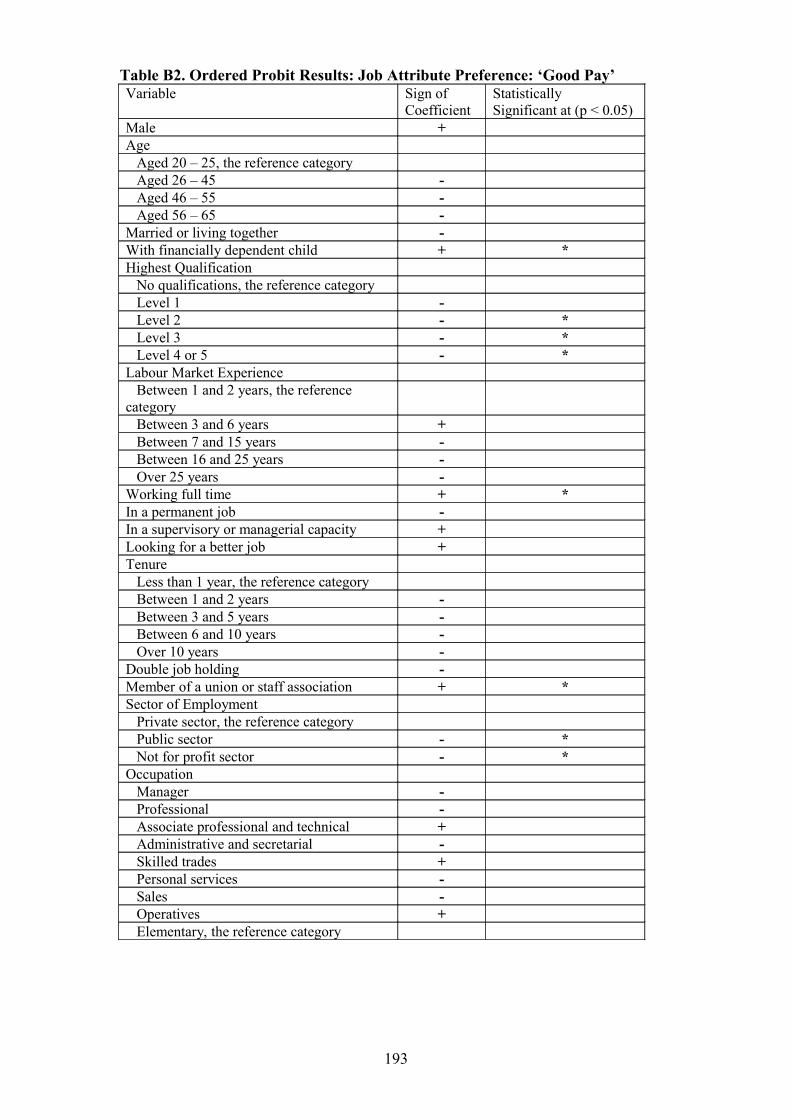
Table B2. Ordered Probit Results: Job Attribute Preference: ‘Good Pay’Variable Sign of
CoefficientStatisticallySignificant at (p < 0.05)
Male +Age Aged 20 – 25, the reference category Aged 26 – 45 - Aged 46 – 55 - Aged 56 – 65 -Married or living together -With financially dependent child + *Highest Qualification No qualifications, the reference category Level 1 - Level 2 - * Level 3 - * Level 4 or 5 - *Labour Market Experience Between 1 and 2 years, the reference category Between 3 and 6 years + Between 7 and 15 years - Between 16 and 25 years - Over 25 years -Working full time + *In a permanent job -In a supervisory or managerial capacity +Looking for a better job +Tenure Less than 1 year, the reference category Between 1 and 2 years - Between 3 and 5 years - Between 6 and 10 years - Over 10 years -Double job holding -Member of a union or staff association + *Sector of Employment Private sector, the reference category Public sector - * Not for profit sector - *Occupation Manager - Professional - Associate professional and technical + Administrative and secretarial - Skilled trades + Personal services - Sales - Operatives + Elementary, the reference category
193

Number of Observations: 1634Wald chi(2) = 160.82Prob > chi2 = 0.0000Pseudo R2 = 0.0416
Test statistics for the joint significance of age variables:Chi2 (3) = 4.78 : prob > chi2 = 0.1888
Test statistics for the joint significance of highest qualification variables:Chi2 (4) = 20.62 : prob > chi2 = 0.0004
Test statistics for the joint significance of the labour market experience variables:Chi2 (4) = 2.91 : prob > chi2 = 0.5727
Test statistics for the joint significance of the tenure variables:Chi2 (4) = 2.44 : prob > chi2 = 0.6556
Test statistics for the joint significance of the sector variables:Chi2 (2) = 14.97 : prob > chi2 = 0.0006
Test statistics for the joint significance of the occupation variables:Chi2 (8) = 9.57 : prob > chi2 = 0.2962
193
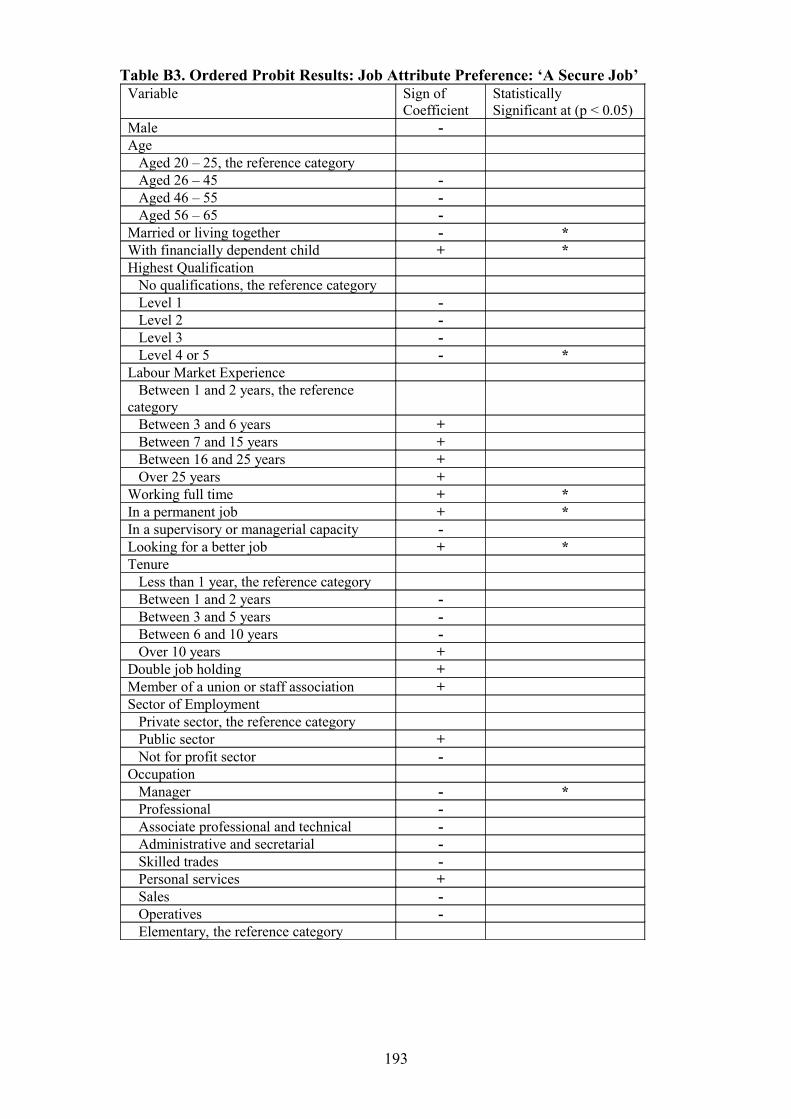
Table B3. Ordered Probit Results: Job Attribute Preference: ‘A Secure Job’Variable Sign of
CoefficientStatisticallySignificant at (p < 0.05)
Male -Age Aged 20 – 25, the reference category Aged 26 – 45 - Aged 46 – 55 - Aged 56 – 65 -Married or living together - *With financially dependent child + *Highest Qualification No qualifications, the reference category Level 1 - Level 2 - Level 3 - Level 4 or 5 - *Labour Market Experience Between 1 and 2 years, the reference category Between 3 and 6 years + Between 7 and 15 years + Between 16 and 25 years + Over 25 years +Working full time + *In a permanent job + *In a supervisory or managerial capacity -Looking for a better job + *Tenure Less than 1 year, the reference category Between 1 and 2 years - Between 3 and 5 years - Between 6 and 10 years - Over 10 years +Double job holding +Member of a union or staff association +Sector of Employment Private sector, the reference category Public sector + Not for profit sector -Occupation Manager - * Professional - Associate professional and technical - Administrative and secretarial - Skilled trades - Personal services + Sales - Operatives - Elementary, the reference category
193

Number of Observations: 1634Wald chi(2) = 161.74Prob > chi2 = 0.0000Pseudo R2 = 0.0480
Test statistics for the joint significance of age variables:Chi2 (3) = 3.90 : prob > chi2 = 0.2722
Test statistics for the joint significance of highest qualification variables:Chi2 (4) = 34.11 : prob > chi2 = 0.0000
Test statistics for the joint significance of the labour market experience variables:Chi2 (4) = 6.61 : prob > chi2 = 0.1579
Test statistics for the joint significance of the tenure variables:Chi2 (4) = 2.54 : prob > chi2 = 0.6369
Test statistics for the joint significance of the sector variables:Chi2 (2) = 4.86 : prob > chi2 = 0.0882
Test statistics for the joint significance of the occupation variables:Chi2 (8) = 9.49 : prob > chi2 = 0.3027
193
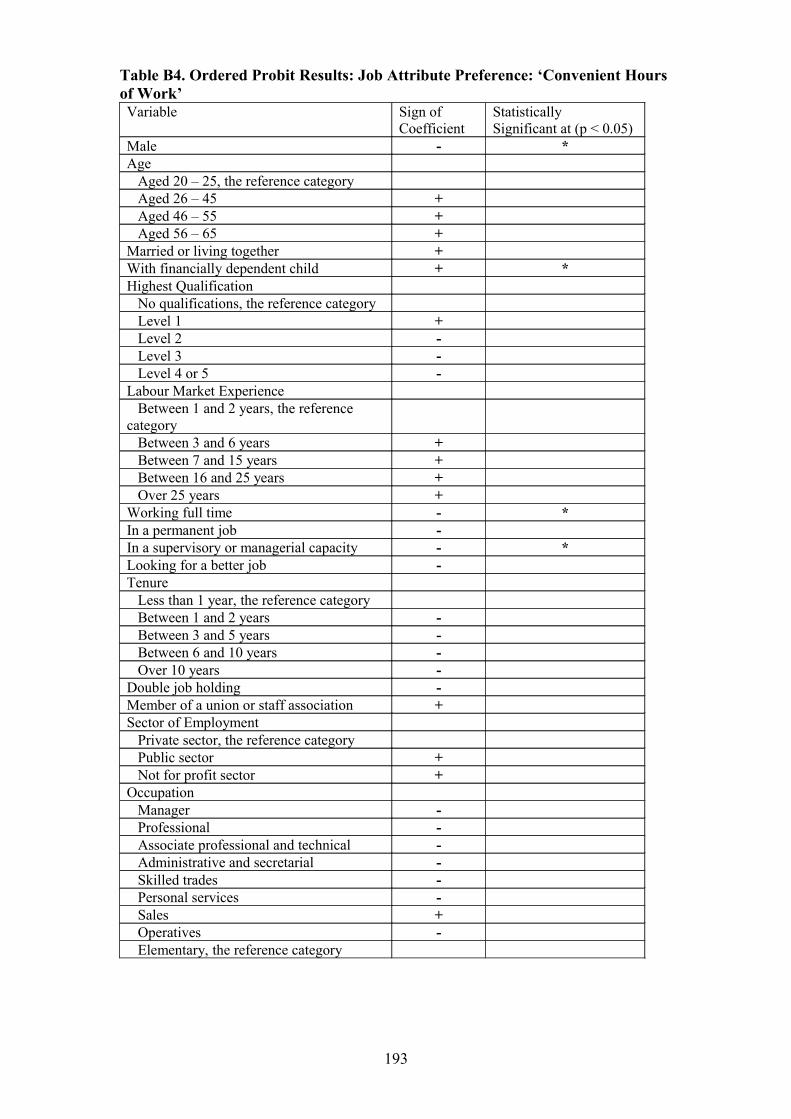
Table B4. Ordered Probit Results: Job Attribute Preference: ‘Convenient Hours of Work’Variable Sign of
CoefficientStatisticallySignificant at (p < 0.05)
Male - *Age Aged 20 – 25, the reference category Aged 26 – 45 + Aged 46 – 55 + Aged 56 – 65 +Married or living together +With financially dependent child + *Highest Qualification No qualifications, the reference category Level 1 + Level 2 - Level 3 - Level 4 or 5 -Labour Market Experience Between 1 and 2 years, the reference category Between 3 and 6 years + Between 7 and 15 years + Between 16 and 25 years + Over 25 years +Working full time - *In a permanent job -In a supervisory or managerial capacity - *Looking for a better job -Tenure Less than 1 year, the reference category Between 1 and 2 years - Between 3 and 5 years - Between 6 and 10 years - Over 10 years -Double job holding -Member of a union or staff association +Sector of Employment Private sector, the reference category Public sector + Not for profit sector +Occupation Manager - Professional - Associate professional and technical - Administrative and secretarial - Skilled trades - Personal services - Sales + Operatives - Elementary, the reference category
193

Number of Observations: 1634Wald chi(2) = 182 39Prob > chi2 = 0.0000Pseudo R2 = 0.0453
Test statistics for the joint significance of age variables:Chi2 (3) = 3.56 : prob > chi2 = 0.3135
Test statistics for the joint significance of highest qualification variables:Chi2 (4) = 3.46 : prob > chi2 = 0.4836
Test statistics for the joint significance of the labour market experience variables:Chi2 (4) = 5.73 : prob > chi2 = 0.2202
Test statistics for the joint significance of the tenure variables:Chi2 (4) = 3.20 : prob > chi2 = 0.5244
Test statistics for the joint significance of the sector variables:Chi2 (2) = 1.41 : prob > chi2 = 0.4945
Test statistics for the joint significance of the occupation variables:Chi2 (8) = 11.47 : prob > chi2 = 0.1764
193
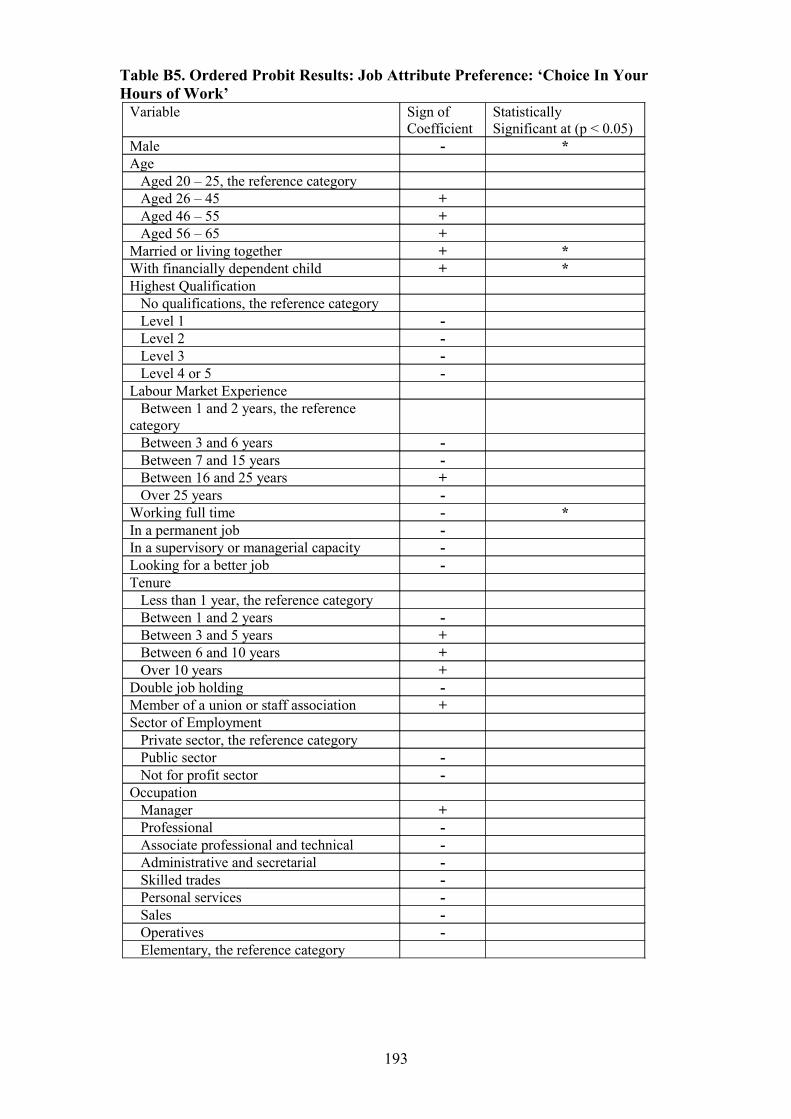
Table B5. Ordered Probit Results: Job Attribute Preference: ‘Choice In Your Hours of Work’
Variable Sign ofCoefficient
StatisticallySignificant at (p < 0.05)
Male - *Age Aged 20 – 25, the reference category Aged 26 – 45 + Aged 46 – 55 + Aged 56 – 65 +Married or living together + *With financially dependent child + *Highest Qualification No qualifications, the reference category Level 1 - Level 2 - Level 3 - Level 4 or 5 -Labour Market Experience Between 1 and 2 years, the reference category Between 3 and 6 years - Between 7 and 15 years - Between 16 and 25 years + Over 25 years -Working full time - *In a permanent job -In a supervisory or managerial capacity -Looking for a better job -Tenure Less than 1 year, the reference category Between 1 and 2 years - Between 3 and 5 years + Between 6 and 10 years + Over 10 years +Double job holding -Member of a union or staff association +Sector of Employment Private sector, the reference category Public sector - Not for profit sector -Occupation Manager + Professional - Associate professional and technical - Administrative and secretarial - Skilled trades - Personal services - Sales - Operatives - Elementary, the reference category
193

Number of Observations: 1633Wald chi(2) = 152.85Prob > chi2 = 0.0000Pseudo R2 = 0.0360
Test statistics for the joint significance of age variables:Chi2 (3) = 2.73 : prob > chi2 = 0.4355
Test statistics for the joint significance of highest qualification variables:Chi2 (4) = 2.68 : prob > chi2 = 0.6129
Test statistics for the joint significance of the labour market experience variables:Chi2 (4) = 5.05 : prob > chi2 = 0.2827
Test statistics for the joint significance of the tenure variables:Chi2 (4) = 3.75 : prob > chi2 = 0.4403
Test statistics for the joint significance of the sector variables:Chi2 (2) = 0.27 : prob > chi2 = 0.8729
Test statistics for the joint significance of the occupation variables:Chi2 (8) = 9.36 : prob > chi2 = 0.3126
193
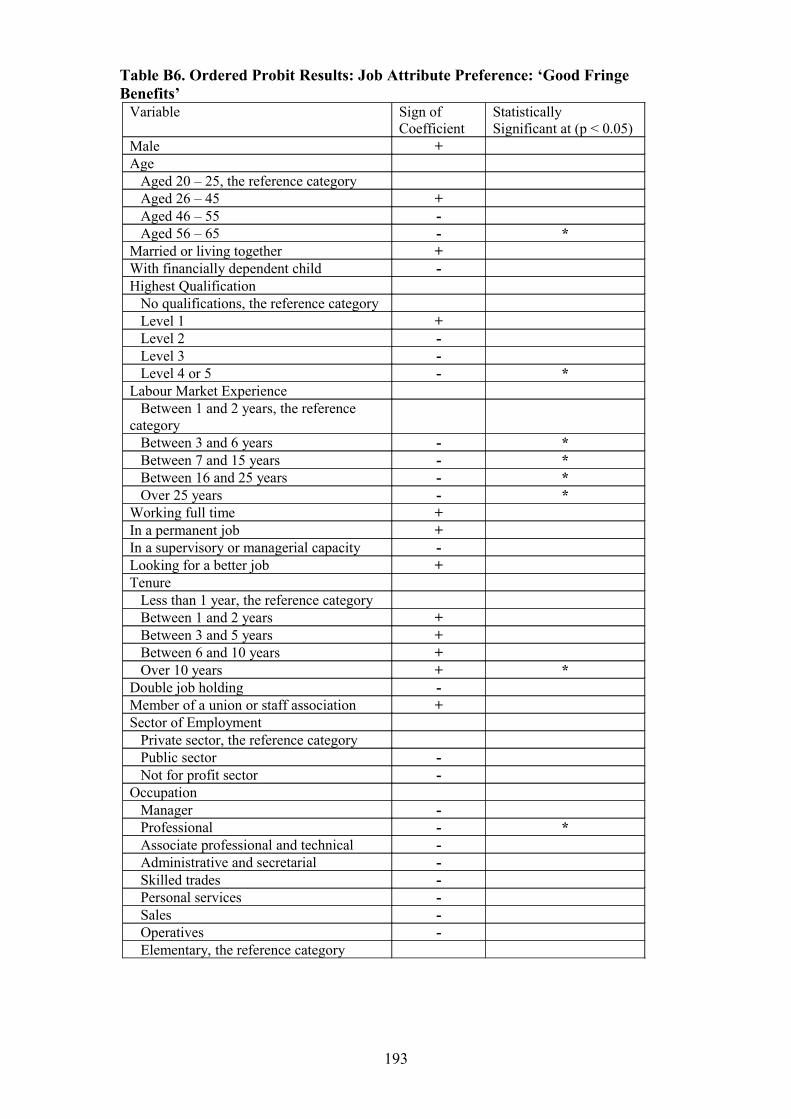
Table B6. Ordered Probit Results: Job Attribute Preference: ‘Good Fringe Benefits’
Variable Sign ofCoefficient
StatisticallySignificant at (p < 0.05)
Male +Age Aged 20 – 25, the reference category Aged 26 – 45 + Aged 46 – 55 - Aged 56 – 65 - *Married or living together +With financially dependent child -Highest Qualification No qualifications, the reference category Level 1 + Level 2 - Level 3 - Level 4 or 5 - *Labour Market Experience Between 1 and 2 years, the reference category Between 3 and 6 years - * Between 7 and 15 years - * Between 16 and 25 years - * Over 25 years - *Working full time +In a permanent job +In a supervisory or managerial capacity -Looking for a better job +Tenure Less than 1 year, the reference category Between 1 and 2 years + Between 3 and 5 years + Between 6 and 10 years + Over 10 years + *Double job holding -Member of a union or staff association +Sector of Employment Private sector, the reference category Public sector - Not for profit sector -Occupation Manager - Professional - * Associate professional and technical - Administrative and secretarial - Skilled trades - Personal services - Sales - Operatives - Elementary, the reference category
193

Number of Observations: 1630Wald chi(2) = 108.79Prob > chi2 = 0.0000Pseudo R2 = 0.0251
Test statistics for the joint significance of age variables:Chi2 (3) = 17.17 : prob > chi2 = 0.0007
Test statistics for the joint significance of highest qualification variables:Chi2 (4) = 16.67 : prob > chi2 = 0.0022
Test statistics for the joint significance of the labour market experience variables:Chi2 (4) = 6.48 : prob > chi2 = 0.1660
Test statistics for the joint significance of the tenure variables:Chi2 (4) = 5.64 : prob > chi2 = 0.2274
Test statistics for the joint significance of the sector variables:Chi2 (2) = 3.39 : prob > chi2 = 0.1835
Test statistics for the joint significance of the occupation variables:Chi2 (8) = 11.82 : prob > chi2 = 0.1594
193
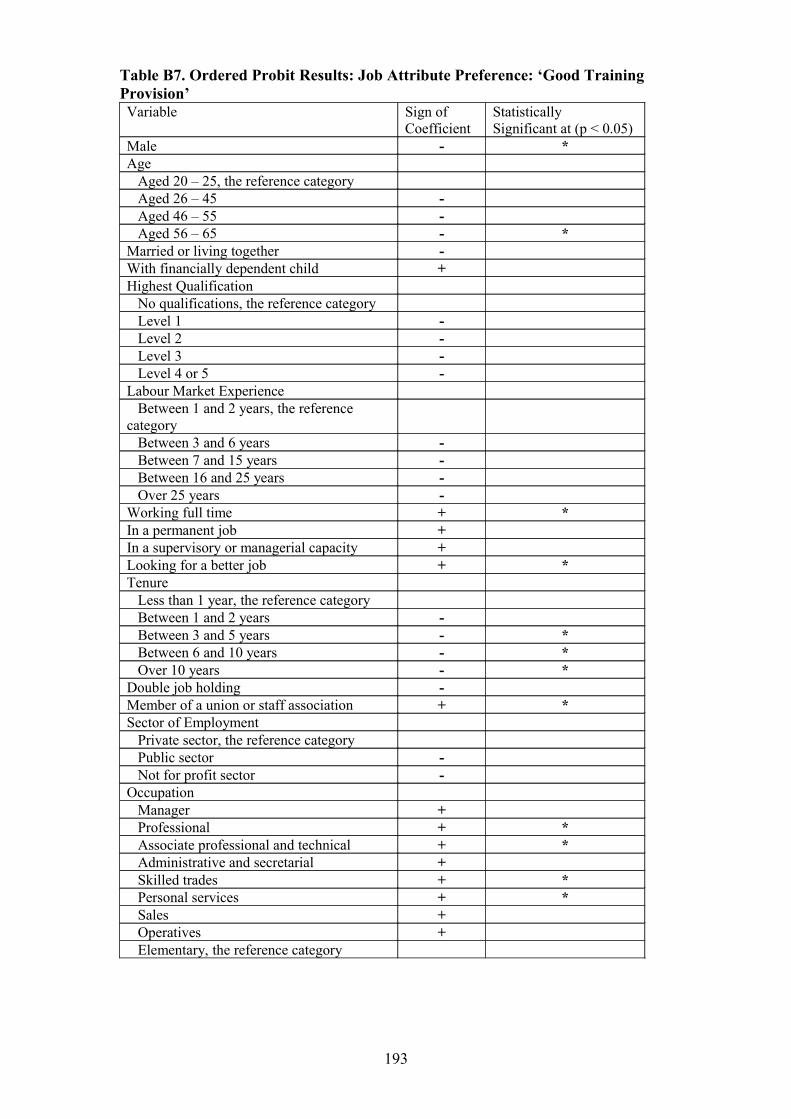
Table B7. Ordered Probit Results: Job Attribute Preference: ‘Good Training Provision’Variable Sign of
CoefficientStatisticallySignificant at (p < 0.05)
Male - *Age Aged 20 – 25, the reference category Aged 26 – 45 - Aged 46 – 55 - Aged 56 – 65 - *Married or living together -With financially dependent child +Highest Qualification No qualifications, the reference category Level 1 - Level 2 - Level 3 - Level 4 or 5 -Labour Market Experience Between 1 and 2 years, the reference category Between 3 and 6 years - Between 7 and 15 years - Between 16 and 25 years - Over 25 years -Working full time + *In a permanent job +In a supervisory or managerial capacity +Looking for a better job + *Tenure Less than 1 year, the reference category Between 1 and 2 years - Between 3 and 5 years - * Between 6 and 10 years - * Over 10 years - *Double job holding -Member of a union or staff association + *Sector of Employment Private sector, the reference category Public sector - Not for profit sector -Occupation Manager + Professional + * Associate professional and technical + * Administrative and secretarial + Skilled trades + * Personal services + * Sales + Operatives + Elementary, the reference category
193
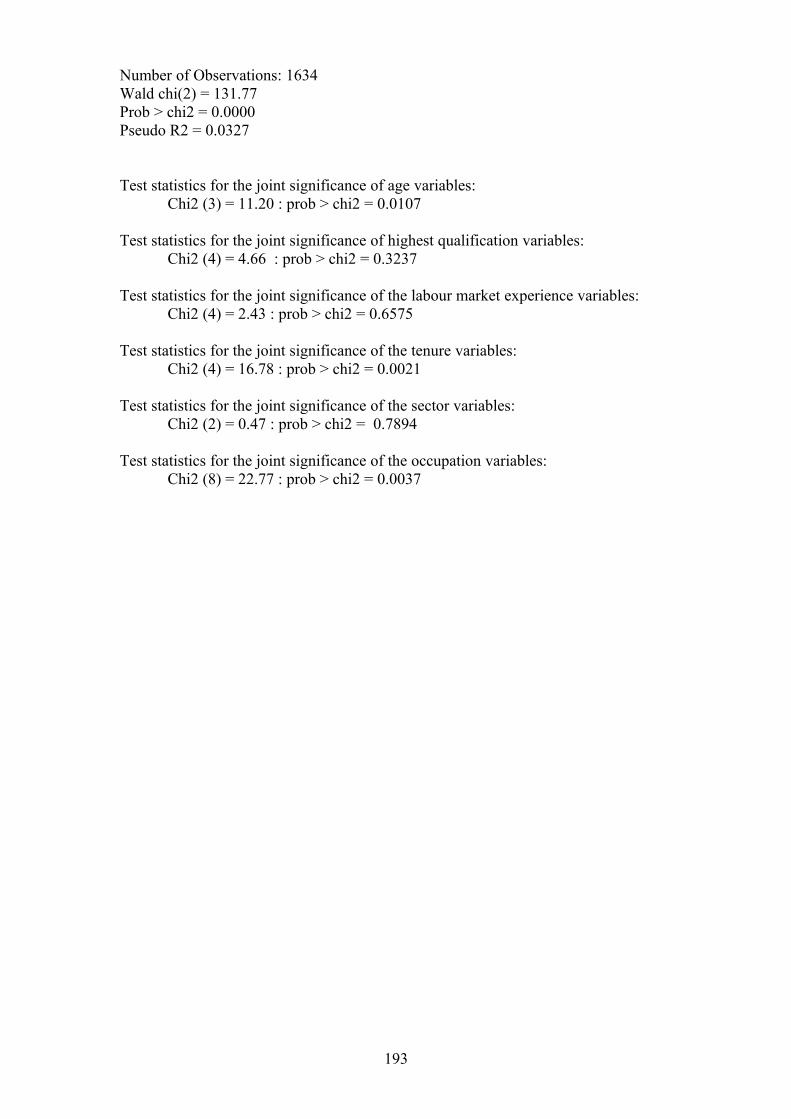
Number of Observations: 1634Wald chi(2) = 131.77Prob > chi2 = 0.0000Pseudo R2 = 0.0327
Test statistics for the joint significance of age variables:Chi2 (3) = 11.20 : prob > chi2 = 0.0107
Test statistics for the joint significance of highest qualification variables:Chi2 (4) = 4.66 : prob > chi2 = 0.3237
Test statistics for the joint significance of the labour market experience variables:Chi2 (4) = 2.43 : prob > chi2 = 0.6575
Test statistics for the joint significance of the tenure variables:Chi2 (4) = 16.78 : prob > chi2 = 0.0021
Test statistics for the joint significance of the sector variables:Chi2 (2) = 0.47 : prob > chi2 = 0.7894
Test statistics for the joint significance of the occupation variables:Chi2 (8) = 22.77 : prob > chi2 = 0.0037
193

Table B8. Ordered Probit Results: Job Attribute Preference: ‘Good Relations with your Supervisor/Manager’Variable Sign of
CoefficientStatisticallySignificant at (p < 0.05)
Male - *Age Aged 20 – 25, the reference category Aged 26 – 45 + Aged 46 – 55 + Aged 56 – 65 +Married or living together -With financially dependent child +Highest Qualification No qualifications, the reference category Level 1 + Level 2 + Level 3 - Level 4 or 5 -Labour Market Experience Between 1 and 2 years, the reference category Between 3 and 6 years - Between 7 and 15 years - Between 16 and 25 years - Over 25 years -Working full time +In a permanent job - *In a supervisory or managerial capacity +Looking for a better job +Tenure Less than 1 year, the reference category Between 1 and 2 years - Between 3 and 5 years - Between 6 and 10 years - Over 10 years -Double job holding +Member of a union or staff association -Sector of Employment Private sector, the reference category Public sector + Not for profit sector +Occupation Manager + Professional + Associate professional and technical + Administrative and secretarial - Skilled trades + Personal services + Sales + Operatives - Elementary, the reference category
193

Number of Observations: 1634Wald chi(2) = 74.78Prob > chi2 = 0.0001Pseudo R2 = 0.0203
Test statistics for the joint significance of age variables:Chi2 (3) = 1.18 : prob > chi2 = 0.7584
Test statistics for the joint significance of highest qualification variables:Chi2 (4) = 2.93 : prob > chi2 = 0.5692
Test statistics for the joint significance of the labour market experience variables:Chi2 (4) = 2.61 : prob > chi2 = 0.6256
Test statistics for the joint significance of the tenure variables:Chi2 (4) = 4.24 : prob > chi2 = 0.3739
Test statistics for the joint significance of the sector variables:Chi2 (2) = 1.37 : prob > chi2 = 0.5044
Test statistics for the joint significance of the occupation variables:Chi2 (8) = 9.93 : prob > chi2 = 0.2699
193
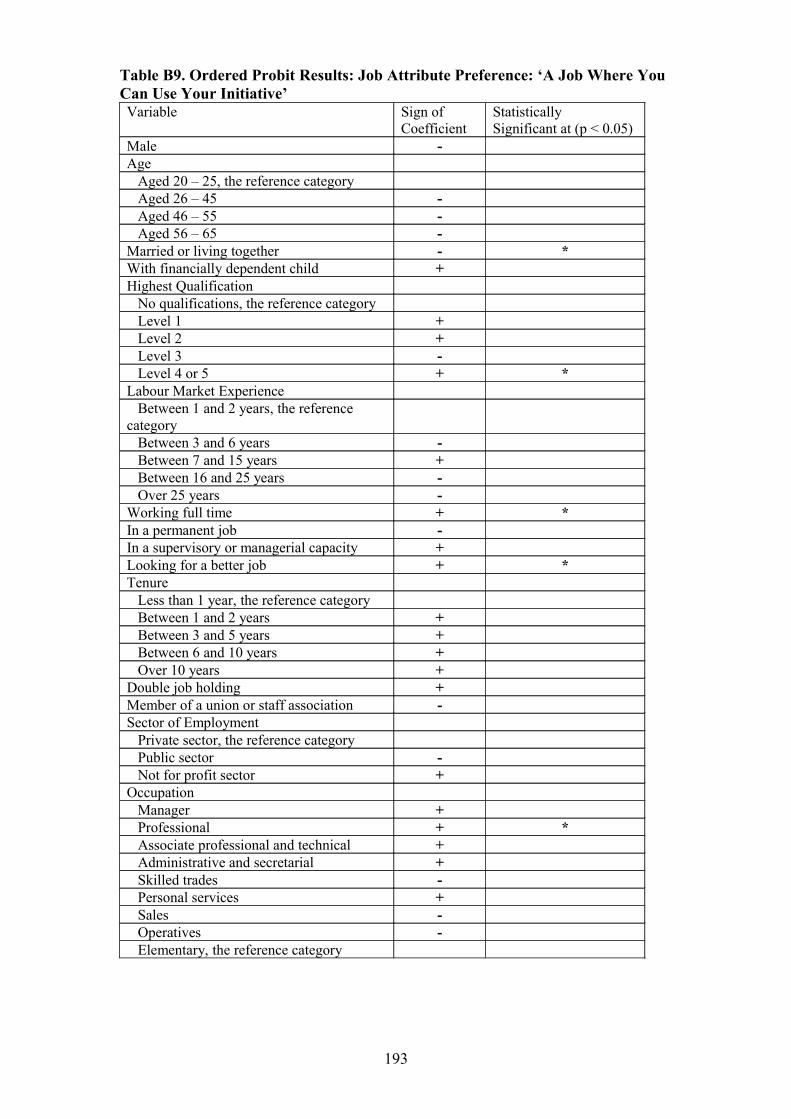
Table B9. Ordered Probit Results: Job Attribute Preference: ‘A Job Where You Can Use Your Initiative’Variable Sign of
CoefficientStatisticallySignificant at (p < 0.05)
Male -Age Aged 20 – 25, the reference category Aged 26 – 45 - Aged 46 – 55 - Aged 56 – 65 -Married or living together - *With financially dependent child +Highest Qualification No qualifications, the reference category Level 1 + Level 2 + Level 3 - Level 4 or 5 + *Labour Market Experience Between 1 and 2 years, the reference category Between 3 and 6 years - Between 7 and 15 years + Between 16 and 25 years - Over 25 years -Working full time + *In a permanent job -In a supervisory or managerial capacity +Looking for a better job + *Tenure Less than 1 year, the reference category Between 1 and 2 years + Between 3 and 5 years + Between 6 and 10 years + Over 10 years +Double job holding +Member of a union or staff association -Sector of Employment Private sector, the reference category Public sector - Not for profit sector +Occupation Manager + Professional + * Associate professional and technical + Administrative and secretarial + Skilled trades - Personal services + Sales - Operatives - Elementary, the reference category
193

Number of Observations: 1634Wald chi(2) = 108.47Prob > chi2 = 0.0000Pseudo R2 = 0.0313
Test statistics for the joint significance of age variables:Chi2 (3) = 0.98 : prob > chi2 = 0.8057
Test statistics for the joint significance of highest qualification variables:Chi2 (4) = 11.90 : prob > chi2 = 0.0181
Test statistics for the joint significance of the labour market experience variables:Chi2 (4) = 4.47 : prob > chi2 = 0.3460
Test statistics for the joint significance of the tenure variables:Chi2 (4) = 3.79 : prob > chi2 = 0.4353
Test statistics for the joint significance of the sector variables:Chi2 (2) = 0.88 : prob > chi2 = 0.6442
Test statistics for the joint significance of the occupation variables:Chi2 (8) = 16.79 : prob > chi2 = 0.0323
193
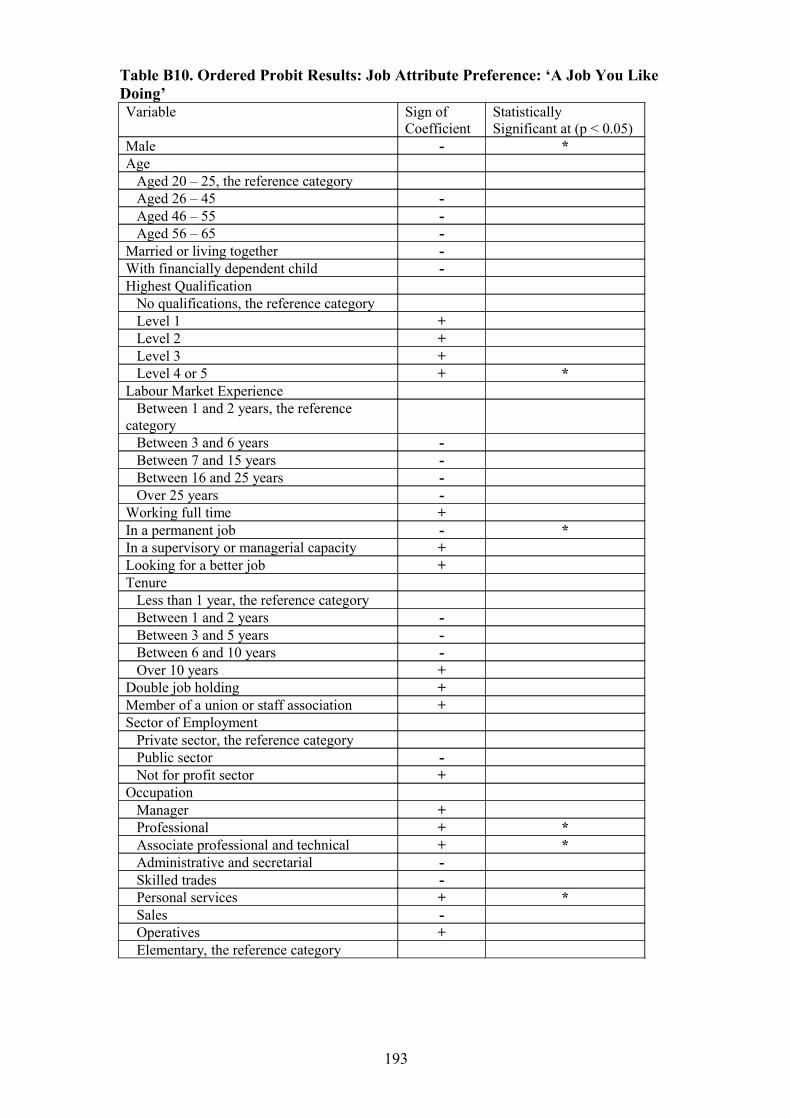
Table B10. Ordered Probit Results: Job Attribute Preference: ‘A Job You Like Doing’Variable Sign of
CoefficientStatisticallySignificant at (p < 0.05)
Male - *Age Aged 20 – 25, the reference category Aged 26 – 45 - Aged 46 – 55 - Aged 56 – 65 -Married or living together -With financially dependent child -Highest Qualification No qualifications, the reference category Level 1 + Level 2 + Level 3 + Level 4 or 5 + *Labour Market Experience Between 1 and 2 years, the reference category Between 3 and 6 years - Between 7 and 15 years - Between 16 and 25 years - Over 25 years -Working full time +In a permanent job - *In a supervisory or managerial capacity +Looking for a better job +Tenure Less than 1 year, the reference category Between 1 and 2 years - Between 3 and 5 years - Between 6 and 10 years - Over 10 years +Double job holding +Member of a union or staff association +Sector of Employment Private sector, the reference category Public sector - Not for profit sector +Occupation Manager + Professional + * Associate professional and technical + * Administrative and secretarial - Skilled trades - Personal services + * Sales - Operatives + Elementary, the reference category
193

Number of Observations: 1634Wald chi(2) = 92.42Prob > chi2 = 0.0000Pseudo R2 = 0.0297
Test statistics for the joint significance of age variables:Chi2 (3) = 2.88 : prob > chi2 = 0.4098
Test statistics for the joint significance of highest qualification variables:Chi2 (4) = 7.70 : prob > chi2 = 0.1034
Test statistics for the joint significance of the labour market experience variables:Chi2 (4) = 5.57 : prob > chi2 = 0.2340
Test statistics for the joint significance of the tenure variables:Chi2 (4) = 5.59 : prob > chi2 = 0.2320
Test statistics for the joint significance of the sector variables:Chi2 (2) = 0.06 : prob > chi2 = 0.9728
Test statistics for the joint significance of the occupation variables:Chi2 (8) = 25.19 : prob > chi2 = 0.0014
193
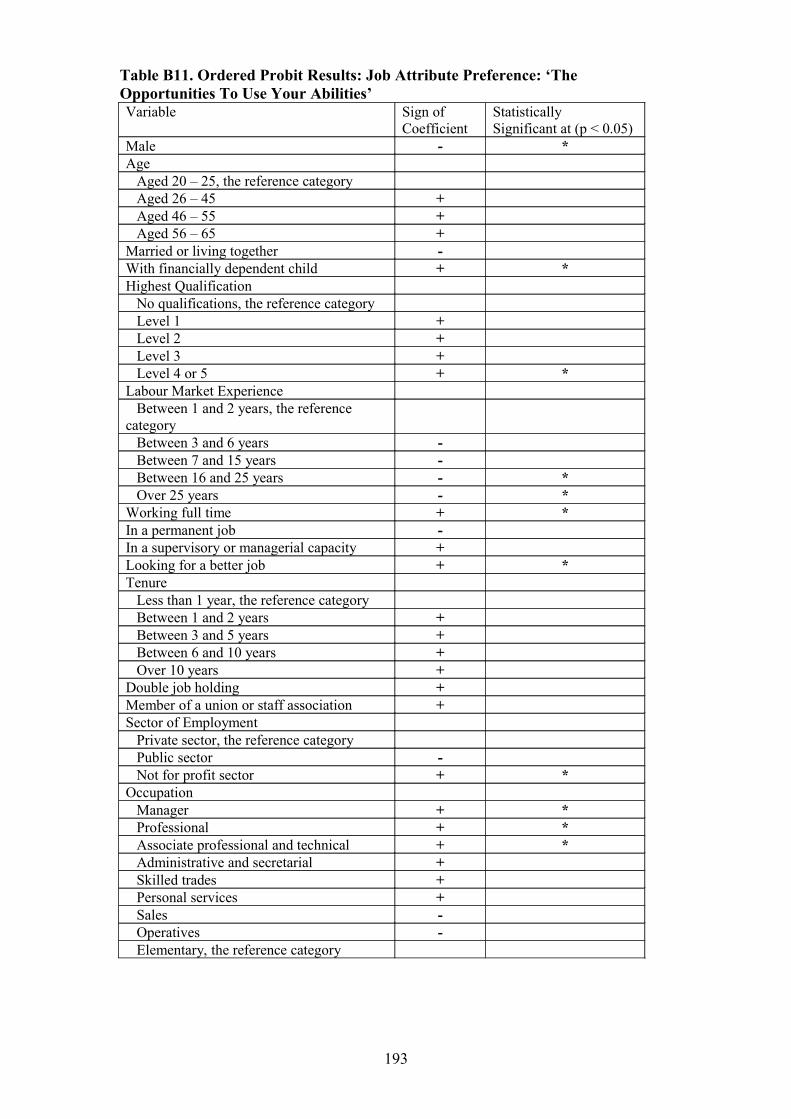
Table B11. Ordered Probit Results: Job Attribute Preference: ‘The Opportunities To Use Your Abilities’Variable Sign of
CoefficientStatisticallySignificant at (p < 0.05)
Male - *Age Aged 20 – 25, the reference category Aged 26 – 45 + Aged 46 – 55 + Aged 56 – 65 +Married or living together -With financially dependent child + *Highest Qualification No qualifications, the reference category Level 1 + Level 2 + Level 3 + Level 4 or 5 + *Labour Market Experience Between 1 and 2 years, the reference category Between 3 and 6 years - Between 7 and 15 years - Between 16 and 25 years - * Over 25 years - *Working full time + *In a permanent job -In a supervisory or managerial capacity +Looking for a better job + *Tenure Less than 1 year, the reference category Between 1 and 2 years + Between 3 and 5 years + Between 6 and 10 years + Over 10 years +Double job holding +Member of a union or staff association +Sector of Employment Private sector, the reference category Public sector - Not for profit sector + *Occupation Manager + * Professional + * Associate professional and technical + * Administrative and secretarial + Skilled trades + Personal services + Sales - Operatives - Elementary, the reference category
193
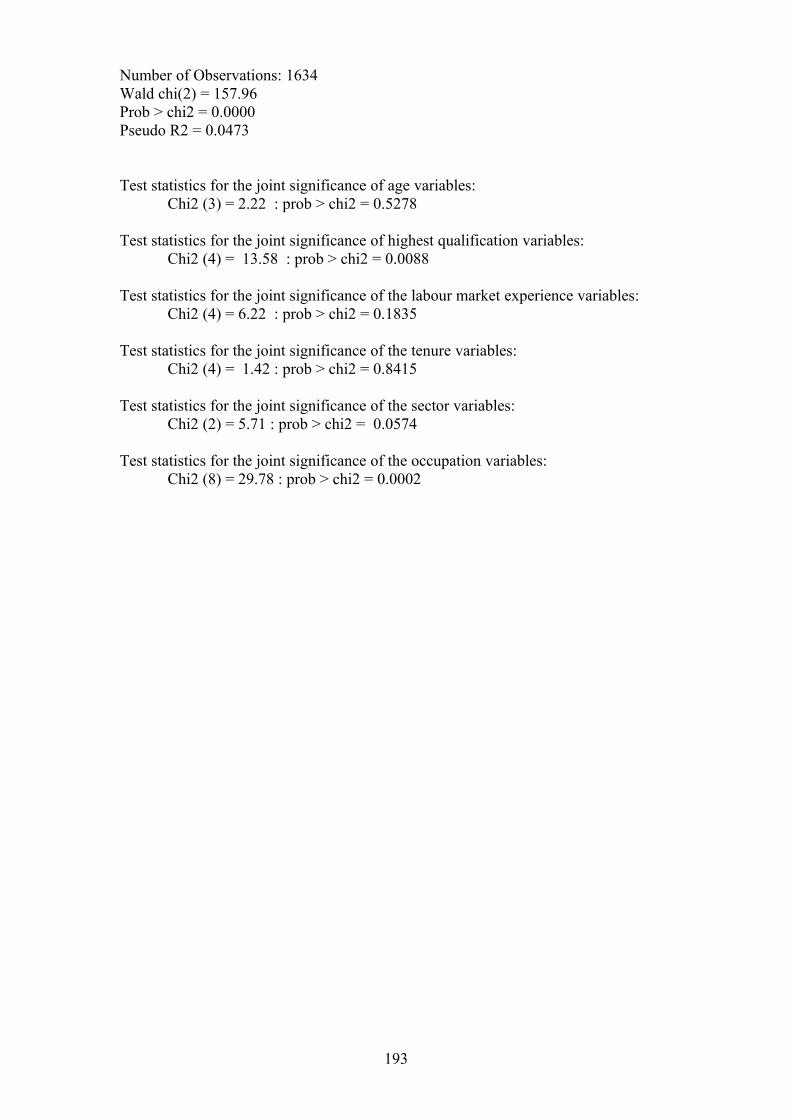
Number of Observations: 1634Wald chi(2) = 157.96Prob > chi2 = 0.0000Pseudo R2 = 0.0473
Test statistics for the joint significance of age variables:Chi2 (3) = 2.22 : prob > chi2 = 0.5278
Test statistics for the joint significance of highest qualification variables:Chi2 (4) = 13.58 : prob > chi2 = 0.0088
Test statistics for the joint significance of the labour market experience variables:Chi2 (4) = 6.22 : prob > chi2 = 0.1835
Test statistics for the joint significance of the tenure variables:Chi2 (4) = 1.42 : prob > chi2 = 0.8415
Test statistics for the joint significance of the sector variables:Chi2 (2) = 5.71 : prob > chi2 = 0.0574
Test statistics for the joint significance of the occupation variables:Chi2 (8) = 29.78 : prob > chi2 = 0.0002
193

Table B12. Ordered Probit Results: Job Attribute Preference: ‘An Easy Work Load’Variable Sign of
CoefficientStatisticallySignificant at (p < 0.05)
Male -Age Aged 20 – 25, the reference category Aged 26 – 45 + Aged 46 – 55 + Aged 56 – 65 +Married or living together +With financially dependent child +Highest Qualification No qualifications, the reference category Level 1 - Level 2 - * Level 3 - * Level 4 or 5 - *Labour Market Experience Between 1 and 2 years, the reference category Between 3 and 6 years - Between 7 and 15 years - Between 16 and 25 years + Over 25 years -Working full time +In a permanent job -In a supervisory or managerial capacity - *Looking for a better job +Tenure Less than 1 year, the reference category Between 1 and 2 years + Between 3 and 5 years + Between 6 and 10 years + Over 10 years +Double job holding -Member of a union or staff association +Sector of Employment Private sector, the reference category Public sector + Not for profit sector - *Occupation Manager - * Professional - Associate professional and technical - Administrative and secretarial - Skilled trades + Personal services - Sales + Operatives - Elementary, the reference category
193

Number of Observations: 1626Wald chi(2) = 113.66Prob > chi2 = 0.0000Pseudo R2 = 0.0318
Test statistics for the joint significance of age variables:Chi2 (3) = 0.71 : prob > chi2 = 0.8720
Test statistics for the joint significance of highest qualification variables:Chi2 (4) = 18.85 : prob > chi2 = 0.0008
Test statistics for the joint significance of the labour market experience variables:Chi2 (4) = 5.21 : prob > chi2 = 0.2661
Test statistics for the joint significance of the tenure variables:Chi2 (4) = 1.33 : prob > chi2 = 0.8559
Test statistics for the joint significance of the sector variables:Chi2 (2) = 4.04 : prob > chi2 = 0.1328
Test statistics for the joint significance of the occupation variables:Chi2 (8) = 19.66 : prob > chi2 = 0.0177
193
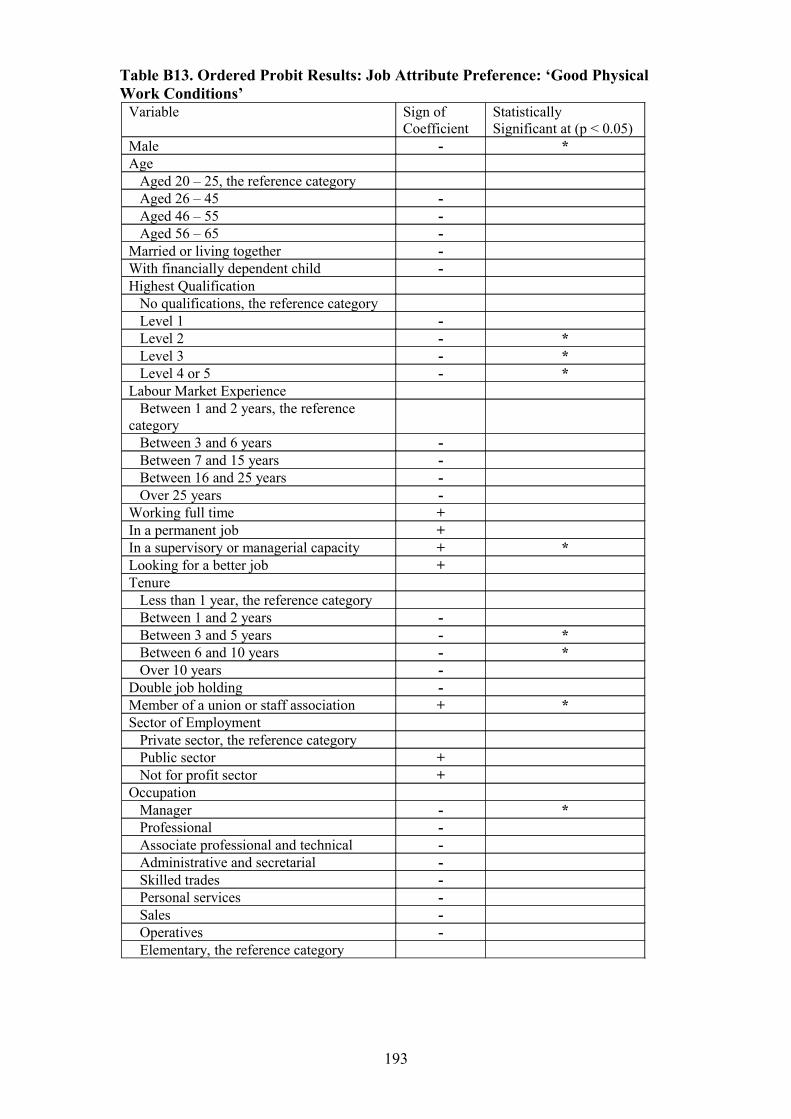
Table B13. Ordered Probit Results: Job Attribute Preference: ‘Good Physical Work Conditions’
Variable Sign ofCoefficient
StatisticallySignificant at (p < 0.05)
Male - *Age Aged 20 – 25, the reference category Aged 26 – 45 - Aged 46 – 55 - Aged 56 – 65 -Married or living together -With financially dependent child -Highest Qualification No qualifications, the reference category Level 1 - Level 2 - * Level 3 - * Level 4 or 5 - *Labour Market Experience Between 1 and 2 years, the reference category Between 3 and 6 years - Between 7 and 15 years - Between 16 and 25 years - Over 25 years -Working full time +In a permanent job +In a supervisory or managerial capacity + *Looking for a better job +Tenure Less than 1 year, the reference category Between 1 and 2 years - Between 3 and 5 years - * Between 6 and 10 years - * Over 10 years -Double job holding -Member of a union or staff association + *Sector of Employment Private sector, the reference category Public sector + Not for profit sector +Occupation Manager - * Professional - Associate professional and technical - Administrative and secretarial - Skilled trades - Personal services - Sales - Operatives - Elementary, the reference category
193

Number of Observations: 1634Wald chi(2) = 84.88Prob > chi2 = 0.0000Pseudo R2 = 0.0243
Test statistics for the joint significance of age variables:Chi2 (3) = 2.37 : prob > chi2 = 0.4999
Test statistics for the joint significance of highest qualification variables:Chi2 (4) = 10.97 : prob > chi2 = 0.0269
Test statistics for the joint significance of the labour market experience variables:Chi2 (4) = 2.39 : prob > chi2 = 0.6642
Test statistics for the joint significance of the tenure variables:Chi2 (4) = 7.74 : prob > chi2 = 0.1017
Test statistics for the joint significance of the sector variables:Chi2 (2) = 0.19 : prob > chi2 = 0.9097
Test statistics for the joint significance of the occupation variables:Chi2 (8) = 21.27 : prob > chi2 = 0.0065
193
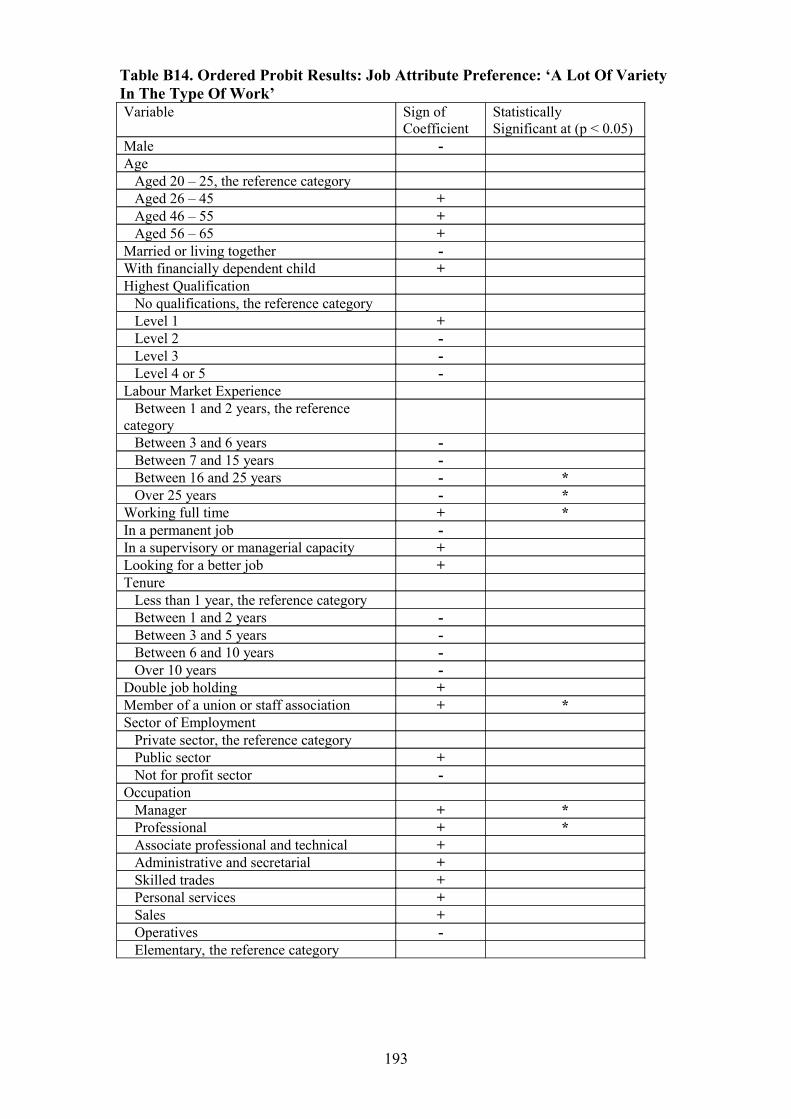
Table B14. Ordered Probit Results: Job Attribute Preference: ‘A Lot Of Variety In The Type Of Work’Variable Sign of
CoefficientStatisticallySignificant at (p < 0.05)
Male -Age Aged 20 – 25, the reference category Aged 26 – 45 + Aged 46 – 55 + Aged 56 – 65 +Married or living together -With financially dependent child +Highest Qualification No qualifications, the reference category Level 1 + Level 2 - Level 3 - Level 4 or 5 -Labour Market Experience Between 1 and 2 years, the reference category Between 3 and 6 years - Between 7 and 15 years - Between 16 and 25 years - * Over 25 years - *Working full time + *In a permanent job -In a supervisory or managerial capacity +Looking for a better job +Tenure Less than 1 year, the reference category Between 1 and 2 years - Between 3 and 5 years - Between 6 and 10 years - Over 10 years -Double job holding +Member of a union or staff association + *Sector of Employment Private sector, the reference category Public sector + Not for profit sector -Occupation Manager + * Professional + * Associate professional and technical + Administrative and secretarial + Skilled trades + Personal services + Sales + Operatives - Elementary, the reference category
193

Number of Observations: 1633Wald chi(2) = 100.94Prob > chi2 = 0.0000Pseudo R2 = 0.0241
Test statistics for the joint significance of age variables:Chi2 (3) = 5.09 : prob > chi2 = 0.1654
Test statistics for the joint significance of highest qualification variables:Chi2 (4) = 12.47 : prob > chi2 = 0.0142
Test statistics for the joint significance of the labour market experience variables:Chi2 (4) = 8.65 : prob > chi2 = 0.0705
Test statistics for the joint significance of the tenure variables:Chi2 (4) = 4.34 : prob > chi2 = 0.3601
Test statistics for the joint significance of the sector variables:Chi2 (2) = 3.71 : prob > chi2 = 0.1564
Test statistics for the joint significance of the occupation variables:Chi2 (8) = 14.49 : prob > chi2 = 0.0700
193

Table B15. Ordered Probit Results: Job Attribute Preference: ‘Friendly People To Work With’Variable Sign of
CoefficientStatisticallySignificant at (p > 0.05)
Male - *Age Aged 20 – 25, the reference category Aged 26 – 45 - Aged 46 – 55 - Aged 56 – 65 -Married or living together - *With financially dependent child -Highest Qualification No qualifications, the reference category Level 1 + Level 2 - Level 3 - Level 4 or 5 -Labour Market Experience Between 1 and 2 years, the reference category Between 3 and 6 years - Between 7 and 15 years - Between 16 and 25 years - Over 25 years -Working full time -In a permanent job -In a supervisory or managerial capacity -Looking for a better job +Tenure Less than 1 year, the reference category Between 1 and 2 years - Between 3 and 5 years - Between 6 and 10 years - Over 10 years -Double job holding + *Member of a union or staff association +Sector of Employment Private sector, the reference category Public sector - Not for profit sector -Occupation Manager - Professional + Associate professional and technical + Administrative and secretarial - Skilled trades - Personal services + Sales + Operatives - Elementary, the reference category
193
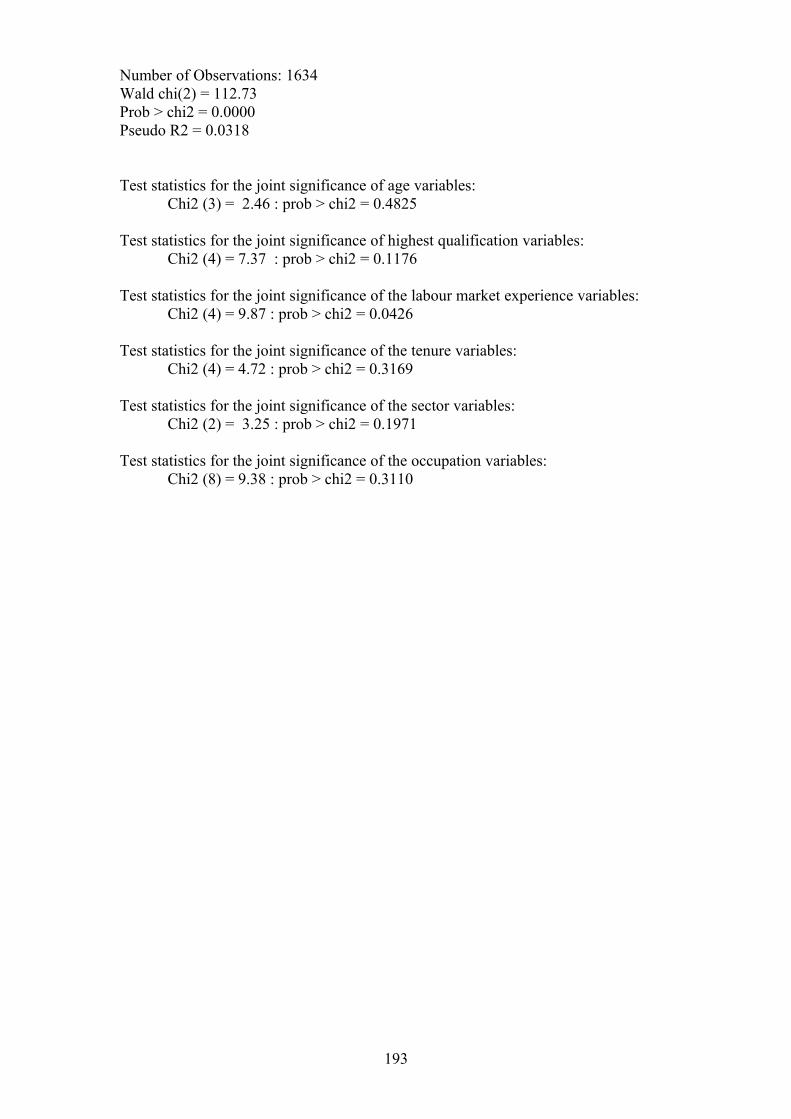
Number of Observations: 1634Wald chi(2) = 112.73Prob > chi2 = 0.0000Pseudo R2 = 0.0318
Test statistics for the joint significance of age variables:Chi2 (3) = 2.46 : prob > chi2 = 0.4825
Test statistics for the joint significance of highest qualification variables:Chi2 (4) = 7.37 : prob > chi2 = 0.1176
Test statistics for the joint significance of the labour market experience variables:Chi2 (4) = 9.87 : prob > chi2 = 0.0426
Test statistics for the joint significance of the tenure variables:Chi2 (4) = 4.72 : prob > chi2 = 0.3169
Test statistics for the joint significance of the sector variables:Chi2 (2) = 3.25 : prob > chi2 = 0.1971
Test statistics for the joint significance of the occupation variables:Chi2 (8) = 9.38 : prob > chi2 = 0.3110
193