Embed Size (px)
Citation preview

This article was downloaded by: [Harvard College]On: 14 August 2011, At: 14:40Publisher: RoutledgeInforma Ltd Registered in England and Wales Registered Number: 1072954Registered office: Mortimer House, 37-41 Mortimer Street, London W1T 3JH,UK
Ethnic and Racial StudiesPublication details, including instructions for authorsand subscription information:http://www.tandfonline.com/loi/rers20
Segmented assimilationrevisited: types of acculturationand socioeconomic mobility inyoung adulthoodMary C. Waters, Van C. Tran, Philip Kasinitz & John H.Mollenkopf
Available online: 01 Mar 2010
To cite this article: Mary C. Waters, Van C. Tran, Philip Kasinitz & John H. Mollenkopf(2010): Segmented assimilation revisited: types of acculturation and socioeconomicmobility in young adulthood, Ethnic and Racial Studies, 33:7, 1168-1193
To link to this article: http://dx.doi.org/10.1080/01419871003624076
PLEASE SCROLL DOWN FOR ARTICLE
Full terms and conditions of use: http://www.tandfonline.com/page/terms-and-conditions
This article may be used for research, teaching and private study purposes.Any substantial or systematic reproduction, re-distribution, re-selling, loan,sub-licensing, systematic supply or distribution in any form to anyone isexpressly forbidden.
The publisher does not give any warranty express or implied or make anyrepresentation that the contents will be complete or accurate or up todate. The accuracy of any instructions, formulae and drug doses should beindependently verified with primary sources. The publisher shall not be liablefor any loss, actions, claims, proceedings, demand or costs or damageswhatsoever or howsoever caused arising directly or indirectly in connectionwith or arising out of the use of this material.

Segmented assimilation revisited: types of
acculturation and socioeconomic mobility
in young adulthood
Mary C. Waters, Van C. Tran, Philip Kasinitz and John H. Mollenkopf
(First submission May 2009; First published March 2010)
Abstract
This article examines the debate between key theories of immigrantassimilation by exploring the effect of acculturation types � dissonant,consonant and selective � on socioeconomic outcomes in young adult-hood. Drawing on survey data from the Immigrant Second Generation inMetropolitan New York, we show that, while all three types occur,dissonant acculturation is the exception, not the norm, among second-generation young adults. Our results also suggest that neither the type ofacculturation nor the level of ethnic embeddedness can account for thevariation in mobility patterns both across and within second-generationgroups. These findings lead us to question assumptions about theprotective effect of selective acculturation and the negative effect ofdissonant acculturation.
Keywords: Straight-line assimilation; segmented assimilation; second generation;
acculturation; socioeconomic mobility; young adulthood.
Introduction
The study of the ‘new second generation’ � children born to post-1965immigrants in the US � has expanded rapidly as they have enteredadulthood. Understanding how they are integrating into Americansociety is both theoretically important and a key policy issue. Since thechildren of immigrants are now one-tenth of the American populationand one-fifth of those under 18, their fate is enormously important tothe future of the country. It is important not only to understand trendsfor the second generation as a whole, but why some of its members aresucceeding and others doing poorly. What factors lead the children ofimmigrants to do better than their parents and what factors lead to
Ethnic and Racial Studies Vol. 33 No. 7 July 2010 pp. 1168�1193
# 2010 Taylor & FrancisISSN 0141-9870 print/1466-4356 onlineDOI: 10.1080/01419871003624076
Dow
nloa
ded
by [
Har
vard
Col
lege
] at
14:
40 1
4 A
ugus
t 201
1

downward social mobility? Drawing on data from the study of theImmigrant Second Generation in Metropolitan New York,1 this paperexamines how types of acculturation shape socioeconomic outcomesamong young adult respondents.
Theories of straight-line and segmented assimilation revisited
Two major theories � straight-line assimilation and segmentedassimilation � point to different processes underlying second-genera-tion outcomes. The standard assimilation theory is associated with thefounders of the Chicago School of Sociology, who studied theintegration of the first- and second-generation European immigrantsin the early twentieth century (Park and Burgess 1925). This modelargues that assimilation processes will enable each succeeding genera-tion to show upward social mobility in education and occupation, bemore integrated into the American mainstream and show less ethnicdistinctiveness in language use, residential concentration and inter-marriage patterns (Warner and Srole 1945).
Segmented assimilation theory emerged as an alternative to thismodel in the 1990s and has been enormously influential. Formulatedby Alejandro Portes and his collaborators and elaborated and testedempirically by Portes and Ruben Rumbaut (Portes and Zhou 1993;Portes and Rumbaut 2001), this approach argues that starkly differentoutcomes are possible for the second generation. Its members can endup ‘ascending into the ranks of a prosperous middle class or join inlarge numbers the ranks of a racialized, permanently impoverishedpopulation at the bottom of society’ (Portes, Fernandez-Kelly andHaller 2005, p. 1004).
Segmented assimilation theory posits three possible outcomes forthe second generation: upward assimilation, downward assimilationand upward mobility combined with persistent biculturalism. Thesepaths correspond to three processes that summarize the relationsbetween immigrant children, their parents and the wider ethniccommunity � consonant, dissonant and selective acculturation. Con-sonant acculturation occurs when the children and parents both learnAmerican culture and gradually abandon their home language and‘old country’ ways at about the same pace. As these children enter theAmerican mainstream, they achieve upward mobility with the supportof their parents. Dissonant acculturation occurs when children learnEnglish and adopt American ways far faster than do their immigrantparents. Portes and Rumbaut (2001) argue that this process can lead todownward assimilation when young people confront racial discrimina-tion, bifurcated labour markets and often nihilistic inner-city youthculture on their own, without strong parental authority or communitysupport. The third process, selective acculturation, leads to upward
Segmented assimilation revisited 1169
Dow
nloa
ded
by [
Har
vard
Col
lege
] at
14:
40 1
4 A
ugus
t 201
1

assimilation and biculturalism. This occurs when parents and childrenboth gradually learn American ways while remaining embedded, atleast in part, in the ethnic community. It is characterized by‘preservation of parental authority, little or no intergenerationalconflict and fluent bilingualism among children’ (Portes and Rumbaut2001, p. 52). Portes and his collaborators argue that selectiveacculturation is especially important for groups facing discrimination
because individuals and families do not face the strains ofacculturation alone but rather within the framework of their owncommunities. This situation slows down the process while placingthe acquisition of new cultural knowledge and language within asupportive context. (Portes and Rumbaut 2001, p. 54)
Segmented assimilation theory also stresses the importance of parentalhuman capital (including parents’ education and income), modes ofincorporation (state definitions of immigrant groups, eligibility forwelfare, degree of discrimination and antipathy towards immigrantgroups) and family structure (single vs. married couple families as wellas multigenerational vs. nuclear family living arrangements). Althoughless explicitly stated, the model also points to the varying degrees oftransnational connection among immigrant groups as an importantelement of the context of reception.
This theory has inspired a large volume of work on immigrantincorporation. The concept of ‘modes of incorporation’, for instance,has been extremely useful in systematizing how varying political andcultural reactions to immigrant groups shape their individual experi-ences. Yet the most innovative causal mechanism of the theory �selective acculturation � has not been as closely examined as onewould expect. This is unfortunate because this aspect of the segmentedassimilation approach most clearly separates it from other accounts ofimmigrant incorporation. After all, standard sociological models ofstatus attainment predict that children from two-parent householdswill have better outcomes, as whites will compared to blacks andHispanics, given the reality of ongoing racial discrimination in the US.It also predicts that the children of parents with high levels ofeducation and income will do well, on average.
Where segmented assimilation departs from these standard inter-pretations is in predicting two specific outcomes as in part the result ofintra-family dynamics: that downward assimilation occurs not becauseof the failure to Americanize, but because of doing it too quickly(dissonant acculturation), and that upward mobility is possible forthose with low income or poorly educated parents who stay at leastpartially tied to the ‘ethnic’ community. In these two predictions,segmented assimilation stands the standard sociological account of
1170 Mary C. Waters et al.
Dow
nloa
ded
by [
Har
vard
Col
lege
] at
14:
40 1
4 A
ugus
t 201
1

assimilation on its head. For at least some immigrants, it argues thatquickly coming to share American (or at least lower-class American)ways is bad for the second generation, while holding on to immigrantdistinctiveness can turn out to be an advantage.
In response to this approach, Alba and Nee (2003) formulated a newversion of (more or less) straight-line assimilation for the post-1965immigrants. Retaining many key insights from earlier theorists, Alba andNee predict that most members of the contemporary second generationwill experience gradually increasing social integration and upwardmobility. In contrast to the segmented assimilation model, they find littlesupport for the notions that many will experience ‘downward assimila-tion’ or that embeddedness in dense ethnic networks will prove beneficial.In contrast to earlier versions of straight-line assimilation, however, Albaand Nee reject the overly prescriptive assertion that the second generationmust adopt ‘American norms’ and stress that the American ‘mainstream’is highly dynamic and heterogeneous. Drawing on segmented assimila-tion and other contemporary accounts, they understand the variationin immigrants’ pre-migration backgrounds, current positions within ahighly stratified American society and emphasize the importance ofhistorically contingent contexts of reception.
Types of acculturation and socioeconomic mobility
Many studies in the US and increasingly in Europe show support forthe theory of segmented assimilation, including work arising from theChildren of Immigrants Longitudinal Study (CILS) and impor-tant case studies of particular second-generation groups includingVietnamese (Zhou and Bankston 1998), West Indians (Waters 1999;Vickerman 1999), Chinese (Zhou and Kim 2006), Salvadorans(Menjıvar 2000) and Haitians (Stepick 1998; Zephir 2001). There isclose to universal agreement that American society is not an undiffer-entiated whole � and in that sense immigrants clearly assimilate into oneof its segments. Virtually all studies show that the children of immigrantsdo not follow a single trajectory and that second-generation outcomesare highly contingent on the segment of American society into whichthey are being incorporated (Greenman and Xie 2008).
That said, one key point of disagreement between Alba and Nee’sreformulated assimilation theory and segmented assimilation theory iswhether the processes and mechanisms that led the previous waves ofEuropean immigrants in the early part of the twentieth century tointegrate successfully will work for the current wave of immigrants andtheir children. Indeed, while segmented assimilation claims that the non-white racial status of most current immigrants and the very differenteconomy they face in twenty-first-century America puts them and theirchildren at greater risk, Perlmann and Waldinger (1997), Waldinger and
Segmented assimilation revisited 1171
Dow
nloa
ded
by [
Har
vard
Col
lege
] at
14:
40 1
4 A
ugus
t 201
1

Perlmann (1998) and Gratton (2002) have all criticized segmentedassimilation’s characterization of the past. Further, many studies ofthe contemporary second generation find little evidence of second-generation decline or downward assimilation (Boyd 2002; Hirschman2001; Farley and Alba 2002; Kasinitz, Mollenkopf and Waters 2002,2004; Smith 2003; Waldinger and Feliciano 2004; Waldinger 2007;Kasinitz et al. 2008).
Of course, segmented assimilation does not predict universal downwardmobility any more than classic assimilation predicts universal upwardmobility. Alba and Nee (2001) and Portes and Zhou (1993) both argue thatsome members of the second generation will do well compared to theirparents, while others will not. Both theories posit that racial discriminationwill make it much more difficult for those defined as non-white to achieveupward mobility in America’s racially stratified economy. The differencebetween the two approaches lies in which mechanisms the theories suggestlead to successful outcomes for the second generation. Alba and Nee(2003) posit that similar historical processes will blur the differencesbetween the immigrant groups and the mainstream. Segmented assimila-tion argues that, especially for non-white poor immigrants, maintainingethnic differenceswith the American mainstream� selective acculturation�will lead to successful outcomes for the second generation.
Scholars have not yet put this key difference to a rigorous test. In arecent special issue on the European second generation, Crul andThomson conclude that ‘upward mobility through ethnic cohesionremains a limited phenomenon in the European context. (2007,p. 1036). In the US, the lack of intergenerational data and the lackof a census question on parents’ birthplace have hampered quantita-tive research on this question, although evidence for selectiveacculturation has accumulated through qualitative case studies. Asidefrom the longitudinal data provided by CILS, no studies of the secondgeneration have addressed this question.
This paper takes advantage of the Immigrant Second Generation inMetropolitan New York Study, which includes information on ethnicembeddedness in neighbourhoods and the labour market as well asdetailed information on the language abilities of the first and secondgeneration, to examine the relationships between these factors andsecond-generation mobility pathways. Since predictions about theadaptation trajectories of the new second generation have mostly beenspeculative, this analysis provides one of the first tests of the effect ofacculturation types on second-generation outcomes.
Data and methods
The Immigrant Second Generation in Metropolitan New York Study isa random telephone survey of 3,415 respondents who live in New York
1172 Mary C. Waters et al.
Dow
nloa
ded
by [
Har
vard
Col
lege
] at
14:
40 1
4 A
ugus
t 201
1

City and the inner suburbs in New Jersey, Westchester and Long Island.The study includes young adults aged 18 to 32 at the time of theinterview in 1999�2000 who were born in the US to parents whoimmigrated after 1965 (the second generation) or who were born abroadbut arrived in the US by age 12 and grew up in the US (the ‘1.5generation’). The study includes five second-generation groups (WestIndian, Dominican, Chinese, South American2 and Russian Jews) andthree native-born comparison groups (white, black and Puerto Rican).This analysis is limited to respondents from the five groups whoseparental language is not English and thus we do not include nativewhites, blacks and West Indians, although we present descriptive dataon them in Table 1.
The dependent variables include seven measures of socioeconomicoutcomes in young adulthood. All measures are dichotomous, based onself-reported levels of education, occupation, employment status, teenparent status, as well as history of arrest and incarceration. Because weare interested in understanding how different acculturation types leadto negative and positive adaptation trajectories, we investigate sevenoutcomes: being a high school dropout, being unemployed, having beenarrested, having been incarcerated, being a teen parent by age 18, being acollege graduate by age 22 and being in a professional/entrepreneurialoccupation by age 25. Table 1 provides the frequency distribution foreach socioeconomic outcome by group. It highlights systematic varia-tions across the eight groups. Chinese, Russian Jews and whites reportthe lowest rates of dropping out of high school, unemployment, teenpregnancy or having an arrest or incarceration record, whereasDominicans, Puerto Ricans and African Americans report the highestrates. Chinese and Russian Jews are also the most likely to be collegeeducated and in a professional occupation.
We use four clusters of independent variables to explain variations insocioeconomic outcomes. We operationalize these variables to bestcapture the three factors that segmented assimilation theory posits asimportant determinants of adaptation outcomes across and withingroups: human capital, family structure and mode of incorporationamong the immigrant parents.
Demographic characteristics include national origin, age, gender andimmigrant generation status (1.5 generation vs. second generation).
Acculturation type is a recoded categorical variable with three values(1�dissonant acculturation; 2�consonant acculturation and 3�selective acculturation).
Ethnic embeddedness includes whether respondent’s parent orrespondent works in an ethnically concentrated industry, whetherrespondent belongs to an ethnic organization or watches ethnic mediaprogrammes.
Segmented assimilation revisited 1173
Dow
nloa
ded
by [
Har
vard
Col
lege
] at
14:
40 1
4 A
ugus
t 201
1

Table 1. Socioeconomic outcomes by ethnic group
Dropout%
Unemployed%
Arrested1
%Incarcerated1
%Teen parent2
%
Collegegraduate3
%
Professionaloccupation4
%Total
N
SA 6.7 7.0 20.1 10.3 9.6 22.3 26.3 402DR 11.9 14.2 22.2 11.4 19.4 18.7 29.3 428PR 18.2 20.8 27.6 10.9 23.2 11.7 23.9 433CH 2.0 5.6 8.8 2.4 0.4 54.8 54.5 607RJ 3.9 6.5 10.0 3.8 1.3 45.6 54.1 309WI 6.9 11.8 24.2 7.7 12.7 22.7 26.3 407NB 11.4 21.9 31.9 15.7 24.7 16.5 16.3 421NW 4.2 9.1 22.9 10.6 3.5 59.4 47.6 408
Notes
1 Male respondents only.
2 Female respondents only.
3 Respondents age 22 or older.
4 Respondents age 25 or older.
11
74
Ma
ryC
.W
aters
eta
l.
Dow
nloa
ded
by [
Har
vard
Col
lege
] at
14:
40 1
4 A
ugus
t 201
1

Background characteristics include respondent’s high school gradepoint average [GPA] and highest level of education, parental educa-tion, number of earners in household while growing up (a proxy for thelevel of financial resources available), family structure, number ofsiblings and residential stability which was measured by the timesrespondent moved between the ages of 6 and 18.
Across the seven outcomes, we apply five nested logistic regressionmodels and report the odds ratios along with robust standard errorsfor ease of interpretation. For each outcome, the first model includesonly ethnicity to establish the initial outcome differences across thefive groups. We use Puerto Rican as the reference group because it is anative minority group. The subsequent four models introduce demo-graphic characteristics, acculturation types, ethnic context and back-ground characteristics to further account for individual variations.Recognizing the potential heterogeneity of effects across groups, weran the same nested models on each outcome by ethnic group as wellas on a sample that excludes Puerto Ricans, but these additionalanalyses did not lead to substantively different results (full resultsavailable upon request).
Operationalizing types of acculturation
Portes and Rumbaut (2001) summarize their research on the secondgeneration in Miami and San Diego by arguing that the dynamicsbetween parents and children in immigrant families crucially shapesecond-generation outcomes. They determine the type of acculturationby comparing the relative fluency of English and immigrant languageamong the first-generation parents and their second-generationchildren (Portes and Rumbaut 2001, p. 145). Because our studycontains detailed information about what our respondents reportabout their own language fluency as well as that of their parents, wehave the unique opportunity to operationalize this variable andexplore its potential effects.
Figure 1 provides our detailed coding strategy for a three-categoryordinal measure of parents’ fluency of English: those who are not
Figure 1. Coding strategies for parents’ knowledge of English
Father’s knowledge of English Limited Fluent
Mother’s None None
knowledge Limitedof English Fluent
Note
1 ‘P’ refers to parents’ knowledge of English.
P1 = none P = limited P = fluent P = limited P = limited P = fluent P = fluent P = fluent P = fluent
Segmented assimilation revisited 1175
Dow
nloa
ded
by [
Har
vard
Col
lege
] at
14:
40 1
4 A
ugus
t 201
1

proficient, those who have limited proficiency and those who arefluent. To code respondents’ knowledge of the parental language, werely on two questions on the respondent’s ability to speak andunderstand the parental language. The parental languages includeChinese, Russian and Spanish. Figure 2 outlines the coding strategyfor the categorical variable on respondent’s fluency in the parentallanguage. Finally, we combine these two measures to construct acategorical variable for types of acculturation: dissonant, consonantand selective acculturation (see Figure 3). Our regression models use‘dissonant acculturation’ as the reference category because we areinterested in testing the prediction that consonant and selectiveacculturations yield better socioeconomic outcomes.
Table 2 presents descriptive statistics on acculturation types bygroup. These results make clear that selective acculturation is the normwhereas dissonant acculturation is quite exceptional. Respondentsreported high rates of selective acculturation, with 69.5 per cent bothspeaking and understanding the parental language well. An over-whelming majority of Russian Jews (78.9 per cent), South Americans(82.1 per cent), Dominicans (83.7 per cent) and, to a lesser extent,Puerto Ricans (51 per cent) and Chinese (59.5 per cent), can beclassified as having selectively acculturated. Puerto Ricans andChinese reported relatively high rates of dissonant acculturation(20.8 per cent and 10.7 per cent) while Dominicans, Russian Jewsand South Americans reported low rates (6.5 per cent, 5.2 per cent and4.9 per cent). Finally, consonant acculturation is most common amongChinese (29.8 per cent) and Puerto Ricans (28.2 per cent) and least
Figure 2. Coding strategies for respondents’ knowledge of parental language
Respondent’s knowledge of parental language (speaking)Respondent’s None Limited Fluent knowledge None of parental Limited language Fluent (understanding)
Note
1 ‘R’ refers to respondents’ knowledge of parental language. From a theoretical standpoint, understanding andspeaking abilities are most relevant to the intergenerational dynamics within the immigrant family.
R1 = none R = none R = limited R = none R = limited R = limited R = limited R = limited R = fluent
Figure 3. Generational language knowledge and types of acculturation
Children’s knowledge of parental language None Limited Fluent
Parents’ None knowledge Limited of English1 Fluent
Source: Adapted from Portes and Rumbaut (2001, p. 145, fig. 6.6)
Note
1 We also coded this variable using only mother’s knowledge of English or only father’s knowledge of English, but none of these alternative coding strategies yield substantially different results.
Dissonant Dissonant Selective Dissonant Consonant Selective Consonant Consonant Selective
1176 Mary C. Waters et al.
Dow
nloa
ded
by [
Har
vard
Col
lege
] at
14:
40 1
4 A
ugus
t 201
1

Table 2. Types of acculturation by ethnic group
South Americans Dominican Puerto Rican Chinese Russian Total
Type of Acculturation N % N % N % N % N % N %
Dissonant 21 5.2 28 6.5 90 20.8 65 10.7 15 4.9 219 10.0Consonant 51 12.0 42 9.8 122 28.2 181 29.8 50 16.2 446 20.5Selective 330 82.1 358 83.7 221 51.0 361 59.5 244 78.9 1514 69.5Total 402 100.0 428 100.0 433 100.0 607 100.0 309 100.0 2,179 100.0
Seg
men
teda
ssimila
tion
revisited1
17
7
Dow
nloa
ded
by [
Har
vard
Col
lege
] at
14:
40 1
4 A
ugus
t 201
1

common among Dominicans (9.8 per cent) and South Americans(12 per cent).
In the following analyses, we test the effect of type of acculturation �the main causal mechanism suggested by Portes and Rumbaut (2001,p. 145) � on a series of outcomes. We also examine whether measuresof ethnic embeddedness � having parents working in the ethnic enclave,belonging to ethnic organizations or consuming ethnic media � make adifference in second-generation outcomes. While there are many waysto measure this concept, our choice of language practices of parentsand children directly follows the path outlined by Portes and Rumbaut(2001).
Multivariate analyses
Table 3 presents logistic regression results on the likelihood of beinga high school dropout. In the uncontrolled model, all the second-generation groups are significantly less likely to drop out than PuertoRicans. These initial differences remain significant even after control-ling for demographic factors, acculturation types, the extent of ethnicembeddedness and other background characteristics. In the finalmodel, a second-generation respondent is almost half as likely todrop out of high school as a 1.5-generation respondent (Model 5: OR�1.79, pB.05). Type of acculturation has no effect on the likelihood ofbeing a high school dropout: while respondents with consonant andselective acculturation are slightly less likely to drop out than those withdissonant acculturation, the differences are not significant (Model 5:OR�0.9, ns; OR�.69, ns). Nor do any of the measures of ethnicembeddedness carry predictive power, suggesting that ethnic commu-nity is neither protective nor detrimental. As expected, parentaleducation and family resources significantly protect against droppingout (Model 5: OR�.66, pB.01; OR�.76, pB.05; OR�.84, pB.05),whereas the number of siblings in the household while growing up isassociated with a higher dropout rate (Model 5: OR�1.12, pB.05).This finding confirms previous research on the importance of parentaleducation on socioeconomic outcomes among the second generation(Zhou and Xiong 2005; Abada, Hou and Ram 2009).
Table 4 shows that Russian Jews, Chinese and South Americans aresignificantly less likely to be unemployed than Puerto Ricans. Thesedifferences remain strong after controlling for other demographicfactors, whereas acculturation types and ethnic embeddedness have nosignificant effect. In the final model, women are twice as likely to beunemployed as men (Model 5: OR�2.08, pB.001), while those withmore education are less likely to be out of work (Model 5: OR�.52,pB.001). Education explains the initial advantage among RussianJews and Chinese over Puerto Ricans (Model 5: OR�.55, ns;
1178 Mary C. Waters et al.
Dow
nloa
ded
by [
Har
vard
Col
lege
] at
14:
40 1
4 A
ugus
t 201
1

Table 3. Logistic regressions predicting the likelihood of high school dropout
Model 1 Model 2 Model 3 Model 4 Model 5
Demographic characteristicsRussian .16** .09*** .09*** .09*** .29**
(.05) (.04) (.04) (.04) (.13)Chinese .09** .06*** .06*** .06*** .07***
(.03) (.02) (.02) (.02) (.03)South Americans .33** .24*** .26*** .23*** .25***
(.08) (.07) (.07) (.08) (.09)Dominican .61* .46*** .49** .45** .40**
(.12) (.11) (.12) (.13) (.12)Age 1.00 1.01 1.01 .99
(.02) (.02) (.02) (.02)Female .95 .95 .92 .88
(.18) (.18) (.18) (.17)1.5 generation 1.93** 1.94** 1.92** 1.79*
(.45) (.46) (.46) (.43)
Acculturation typeConsonant vs. dissonant .74 .77 .90
(.23) (.25) (.30)Selective vs. dissonant .68 .66 .69
(.18) (.18) (.19)
Ethnic embeddednessM in ethnic industry 1.05 1.23
(.26) (.33)F in ethnic industry 1.25 1.57
(.34) (.43)Participate in ethnicorganization
1.04 1.03
(.32) (.32)Watch ethnic media 1.13 1.09
(.14) (.14)
Background characteristicsMother’s education .66**
(.09)Father’s education .76*
(.10)No. of earners inhousehold
.84*
(.06)Grew up with both parents .81
(.18)No. of siblings 1.12*
(.06)Residential mobility 1.03
(.04)Log likelihood �796.829 �793.021 �79.68 �788.821 �738.147N 2179 2179 2179 2179 2179
Note
*** pB0.001; ** pB0.01; * pB0.05.
Segmented assimilation revisited 1179
Dow
nloa
ded
by [
Har
vard
Col
lege
] at
14:
40 1
4 A
ugus
t 201
1

Table 4. Logistic regressions predicting the likelihood of being unemployed
Model 1 Model 2 Model 3 Model 4 Model 5
Demographic characteristicsRussian .25** .18*** .18*** .23*** .55
(.07) (.06) (.06) (.08) (.25)Chinese .23** .19*** .20*** .22*** .53
(.05) (.05) (.05) (.06) (.18)South American .31** .26*** .26*** .32*** .43*
(.08) (.07) (.07) (.10) (.14)Dominican .70 .57** .57* .73 .89
(.13) (.12) (.13) (.19) (.26)Age 2.22** 2.24** 2.40** 3.16***
(.66) (.67) (.73) (.99)Age-square .98** .98** .98** .98***
(.01) (.01) (.01) (.01)Female 1.92*** 1.89*** 1.77** 2.08***
(.35) (.35) (.34) (.42)1.5 generation 1.43 1.40 1.31 1.15
(.30) (.30) (.28) (.25)
Acculturation typeConsonant vs. .67 .71 .84
dissonant (.20) (.23) (.28)Selective vs. .84 .80 .96
dissonant (.22) (.22) (.27)
Ethnic embeddednessM in ethnic .97 1.05
industry (.23) (.30)F in ethnic .76 .83
industry (.19) (.21)R in ethnic .78 .81
industry (.19) (.22)Participate in 1.01 .97
ethnicorganization
(.29) (.28)
Watch ethnic 1.06 .98media (.12) (.12)
Background characteristicsHigh school .94
GPA (.04)Respondent’s .52***
education (.06)Mother’s 1.05
education (.11)Father’s .90
education (.10)No. of earners .98
in household (.06)Grew up with .80
both parents (.17)No. of siblings 1.03
(.06)
1180 Mary C. Waters et al.
Dow
nloa
ded
by [
Har
vard
Col
lege
] at
14:
40 1
4 A
ugus
t 201
1

OR�.53, ns), but not that of South Americans (Model 5: OR�.43,pB.05).
Table 5 presents results on the likelihood of having ever beenarrested. Without other controls, Chinese and Russian Jewish malesare less likely to have been arrested than their Puerto Rican counter-parts (Model 1: OR�.30, pB.01; OR�.25, pB.01). Once again,acculturation types, level of ethnic embeddedness and family back-ground factors have no significant effect. Consistent with establishedfindings in criminological research, age and educational level arestrong predictors of having been arrested and account for the initialdifferences in arrest rate across the ethnic groups.
Table 6 reports results on the likelihood of having ever beenincarcerated and show that Chinese and Russian Jewish males havesignificantly lower incarceration rates compared to Puerto Ricans.However, these differences disappear after accounting for the Chineseand Russian Jews’ relative advantage in education (Model 5: OR�.74,pB0.001; OR�.58, pB.01), whereas acculturation types and level ofethnic embeddedness have neither protective nor detrimental effect. Interms of background characteristics, residential stability clearlymatters, as each additional move between the ages of 6 and 18 isassociated with a higher likelihood of having been incarcerated (Model5: OR�1.16; pB.001). (Of course, this pattern may stem fromunmeasured family background factors that cause residential instabil-ity, rather than the mere fact of moving, but the destabilizing impact ofmoving frequently cannot be dismissed.)
Table 7 presents logistic regression results on the likelihood of beinga teen parent. Without any control, Chinese, Russian Jews and SouthAmerican females are significantly less likely to have a child before theage of 18 than Puerto Ricans. Acculturation types and co-ethniccontext hardly matter, though watching ethnic media is associated witha lower likelihood of being a teen parent (Model 5: OR�.67, pB.05).
Table 4 (Continued)
Model 1 Model 2 Model 3 Model 4 Model 5
Residential .94mobility (.04)
PseudoR-squared
�887.92 �864.69 �862.69 �839.74 �772.54
N 2179 2179 2179 2179 2179
Note
*** pB0.001; ** pB0.01; * pB0.05.
Segmented assimilation revisited 1181
Dow
nloa
ded
by [
Har
vard
Col
lege
] at
14:
40 1
4 A
ugus
t 201
1

Table 5. Logistic regressions predicting the likelihood of being arrested
Model 1 Model 2 Model 3 Model 4 Model 5
Demographic characteristicsRussian .30** .45* .46 .57 .95
(.10) (.18) (.19) (.24) (.45)Chinese .25** .31*** .31*** .38** .75
(.07) (.09) (.10) (.12) (.27)South American .66 .72 .75 .92 1.18
(.17) (.19) (.21) (.27) (.40)Dominican .73 .79 .83 1.01 1.11
(.19) (.22) (.24) (.31) (.36)Age 3.26*** 3.39*** 3.47*** 4.59***
(1.17) (1.25) (1.28) (1.75)Age-square .98** .98** .98*** .97***
(.01) (.01) (.01) (.01)1.5 generation .65 .68 .71 .65
(.16) (.17) (.18) (.16)
Types of acculturationConsonant vs. .80 .82 1.06
dissonant (.30) (.31) (.41)Selective vs. .70 .69 .83
dissonant (.24) (.24) (.31)
Ethnic embeddednessM in ethnic industry .69 .67
(.14) (.15)F in ethnic industry .91 .99
(.24) (.30)R in ethnic industry .85 .86
(.25) (.25)Participate in ethnic .63 .66
organization (.25) (.26)Watch ethnic media 1.06 1.08
(.15) (.16)
Background characteristicsHigh school GPA .88*
(.06)Respondent’s .67**
education (.10)Mother’s education 1.15
(.12)Father’s education .96
(.12)No. of earners in .97
household (.08)Grew up with both .72
parents (.20)No. of siblings 1.06
(.08)Residential mobility 1.02
(.04)
1182 Mary C. Waters et al.
Dow
nloa
ded
by [
Har
vard
Col
lege
] at
14:
40 1
4 A
ugus
t 201
1
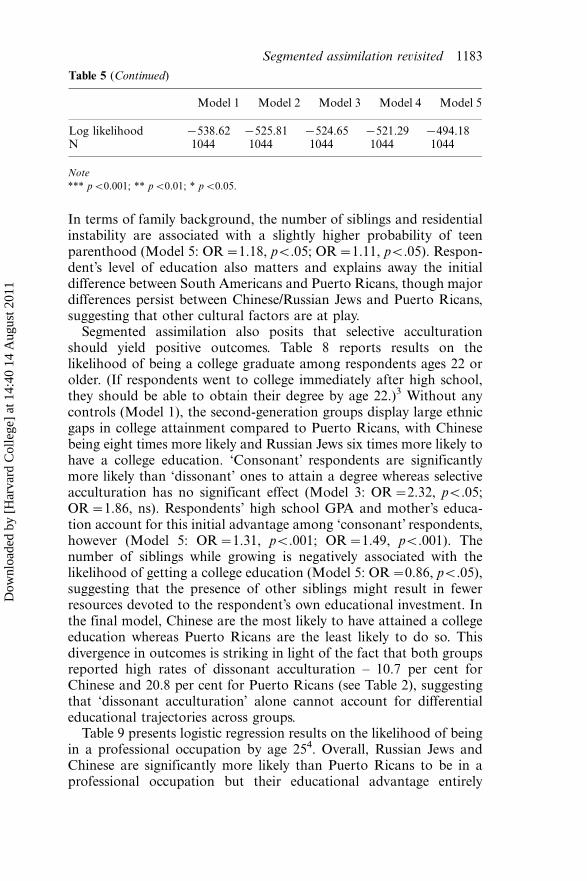
In terms of family background, the number of siblings and residentialinstability are associated with a slightly higher probability of teenparenthood (Model 5: OR�1.18, pB.05; OR�1.11, pB.05). Respon-dent’s level of education also matters and explains away the initialdifference between South Americans and Puerto Ricans, though majordifferences persist between Chinese/Russian Jews and Puerto Ricans,suggesting that other cultural factors are at play.
Segmented assimilation also posits that selective acculturationshould yield positive outcomes. Table 8 reports results on thelikelihood of being a college graduate among respondents ages 22 orolder. (If respondents went to college immediately after high school,they should be able to obtain their degree by age 22.)3 Without anycontrols (Model 1), the second-generation groups display large ethnicgaps in college attainment compared to Puerto Ricans, with Chinesebeing eight times more likely and Russian Jews six times more likely tohave a college education. ‘Consonant’ respondents are significantlymore likely than ‘dissonant’ ones to attain a degree whereas selectiveacculturation has no significant effect (Model 3: OR�2.32, pB.05;OR�1.86, ns). Respondents’ high school GPA and mother’s educa-tion account for this initial advantage among ‘consonant’ respondents,however (Model 5: OR�1.31, pB.001; OR�1.49, pB.001). Thenumber of siblings while growing is negatively associated with thelikelihood of getting a college education (Model 5: OR�0.86, pB.05),suggesting that the presence of other siblings might result in fewerresources devoted to the respondent’s own educational investment. Inthe final model, Chinese are the most likely to have attained a collegeeducation whereas Puerto Ricans are the least likely to do so. Thisdivergence in outcomes is striking in light of the fact that both groupsreported high rates of dissonant acculturation � 10.7 per cent forChinese and 20.8 per cent for Puerto Ricans (see Table 2), suggestingthat ‘dissonant acculturation’ alone cannot account for differentialeducational trajectories across groups.
Table 9 presents logistic regression results on the likelihood of beingin a professional occupation by age 254. Overall, Russian Jews andChinese are significantly more likely than Puerto Ricans to be in aprofessional occupation but their educational advantage entirely
Table 5 (Continued)
Model 1 Model 2 Model 3 Model 4 Model 5
Log likelihood �538.62 �525.81 �524.65 �521.29 �494.18N 1044 1044 1044 1044 1044
Note
*** pB0.001; ** pB0.01; * pB0.05.
Segmented assimilation revisited 1183
Dow
nloa
ded
by [
Har
vard
Col
lege
] at
14:
40 1
4 A
ugus
t 201
1

Table 6. Logistic regressions predicting the likelihood of being incarcerated
Model 1 Model 2 Model 3 Model 4 Model 5
Demographic characteristicsRussian .32* .40 .42 .45 1.71
(.16) (.24) (.25) (.27) (1.18)Chinese .21** .24** .24** .24** .73
(.09) (.11) (.11) (.12) (.41)South American .89 .92 .99 1.13 2.09
(.30) (.33) (.36) (.42) (.89)Dominican 1.04 1.09 1.18 1.33 1.74
(.36) (.41) (.45) (.52) (.76)Age 2.40 2.51 2.57 4.35**
(1.19) (1.29) (1.32) (2.43)Age-square .98 .98 .98 .97*
(.01) (.01) (.01) (.01)1.5 generation .81 .86 .89 .74
(.27) (.30) (.31) (.28)
Acculturation typeConsonant vs. .75 .75 1.00
dissonant (.41) (.40) (.54)Selective vs. .62 .63 .81
dissonant (.31) (.32) (.44)
Ethnic embeddednessMother in ethnic 1.08 .76
industry (.29) (.27)Father in ethnic .74 .77
industry (.23) (.28)Respondent in .68 .55
ethnic industry (.23) (.22)Participate in .75 1.02
ethnicorganization
(.33) (.49)
Watch ethnic .98 .98media (.17) (.17)
Background characteristicsHigh school GPA .74***
(.07)Respondent’s .58**
education (.10)Mother’s .89
education (.14)Father’s education .84
(.14)No. of earners in 1.21
household (.16)Grew up with both .59
parents (.23)No. of siblings 1.00
(.09)
1184 Mary C. Waters et al.
Dow
nloa
ded
by [
Har
vard
Col
lege
] at
14:
40 1
4 A
ugus
t 201
1

explains these initial differences (Model 5: OR�1.58, ns; OR�1.37,ns). Acculturation types and the co-ethnic context have no effect,though respondents’ participation in an ethnic organization ispositively associated with professional attainment (Model 5: OR�2.06, pB.05). Consistent with past findings, respondent’s educationis the single most important predictor of occupational attainment5
(Model 5: OR�2.38, pB.001).
Discussion and conclusion
Three key findings from our analyses of the effects of acculturationtypes on second-generation socioeconomic outcomes in New YorkCity should be highlighted. First, in light of the pervasive concernsthat dissonant acculturation will have a negative impact on the secondgeneration, we note that dissonant acculturation is the exception, notthe norm, among the new second generation. Though groups vary,only 10 per cent of our respondents experience dissonant accultura-tion, whereas 20 per cent can be classified as consonant and another70 per cent as selective acculturation. This alone should lessen concernabout intergenerational dynamics within these groups because anoverwhelming 90 per cent of our respondents have few problemscommunicating with their parents either in English or in their nativelanguage.
Second, types of acculturation do not seem to matter much forsocioeconomic outcomes among the second generation. The mostinteresting predictions of segmented assimilation are that dissonantacculturation leads to negative adaptation outcomes whereas selectiveacculturation leads to higher educational and professional attain-ments. Our multivariate analyses provide no support for eitherprediction. In fact, type of acculturation hardly matters for any of theoutcomes that we examined.
Segmented assimilation also argues that the context and level ofethnic embeddedness matter, above and beyond what happens withinthe immigrant family between first-generation parents and their
Table 6 (Continued)
Model 1 Model 2 Model 3 Model 4 Model 5
Residential 1.16***mobility (.05)
Log likelihood �308.68 �304.68 �303.55 �302.22 �260.46N 1044 1044 1044 1044 1044
Note
*** pB0.001; ** pB0.01; * pB0.05.
Segmented assimilation revisited 1185
Dow
nloa
ded
by [
Har
vard
Col
lege
] at
14:
40 1
4 A
ugus
t 201
1

Table 7. Logistic regressions predicting the likelihood of teen parenthood
Model 1 Model 2 Model 3 Model 4 Model 5
Demographic characteristicsRussian .04** .03*** .03*** .02*** .06***
(.02) (.02) (.02) (.02) (.05)Chinese .01** .01*** .01*** .01*** .02***
(.01) (.01) (.01) (.01) (.02)South Americans .38** .33** .31** .32** .51
(.12) (.12) (.11) (.12) (.20)Dominican .75 .67 .63 .61 .75
(.17) (.17) (.16) (.19) (.26)Age 1.94 1.94 1.89 2.11*
(.67) (.67) (.66) (.77)Age-square .99 .99 .99 .99*
(.01) (.01) (.01) (.01)1.5 generation 1.27 1.30 1.31 1.04
(.36) (.36) (.36) (.31)
Acculturation typeConsonant vs. 1.73 1.52 1.65
dissonant (.75) (.68) (.83)Selective vs. 1.58 1.62 1.93
dissonant (.59) (.59) (.74)
Ethnic embeddednessM in ethnic 1.01 1.39
industry (.28) (.41)F in ethnic .80 .86
industry (.24) (.25)R in ethnic 1.66 1.82
industry (.54) (.60)Participate in 1.03 .94
ethnicorganization
(.39) (.38)
Watch ethnic .80 .67*media (.12) (.11)
Background characteristicsHigh school GPA .99
(.05)Respondent’s .55***
education (.08)Mothers’ .96
education (.13)Father’s .86
education (.12)No. of earners in .89
household (.08)Grew up with .81
both parents (.24)No. of siblings 1.18*
(.09)
1186 Mary C. Waters et al.
Dow
nloa
ded
by [
Har
vard
Col
lege
] at
14:
40 1
4 A
ugus
t 201
1

second-generation children. Our analyses tried to capture thesecontextual effects with several clear measures of embeddedness �parents working in an ethnically concentrated industry or respondentsparticipating in ethnic organizations or consuming ethnic media. Few ofthese measures matter and none explains away initial differences inoutcomes either across groups or within them.6 These findings challengethe assumption among immigration researchers that the type ofacculturation is a key mechanism explaining divergent outcomes acrossgroups (Portes and Rumbaut 2001, p. 145).
Further, segmented assimilation is thought to stem from a labourmarket bifurcated between high-paid professional jobs requiring agreat deal of education and low-paid, low-skilled, dead-end jobs at thebottom. As Portes, Fernandez-Kelly and Haller put it:
The promise of American society, which makes so many foreignerscome, lies in the access it provides to well remunerated professionaland entrepreneurial careers and the affluent lifestyles associatedwith them. At the same time, it is obvious that not everyone gainsaccess to those positions and that, at the opposite end of society,there is a very unenviable scenario of youth gangs, drug dictatedlifestyles, premature childbearing, imprisonment and early death.Immigrant families navigate between these opposite extremesseeking to steer their youths in the direction of the true mainstream.(Portes, Fernandez-Kelly and Haller 2005, p. 1005)
Yet, among the second-generation New Yorkers we studied, the largemajority are neither high school dropouts nor medical doctors. Moretypical are young people with some college education working inwhite-collar clerical or service industries. Indeed, members of thesecond generation more closely resemble other New Yorkers their agethan they do their immigrant parents.
The two groups whose outcomes are most surprising are PuertoRicans and Chinese. The Puerto Ricans are doing worse in terms oftheir educations and occupations than might be expected from their
Table 7 (Continued)
Model 1 Model 2 Model 3 Model 4 Model 5
Residential 1.11*mobility (.05)
Log likelihood �501.49 �497.28 �495.04 �490.24 �430.28N 1135 1135 1135 1135 1135
Note
*** pB0.001; ** pB0.01; * pB0.05.
Segmented assimilation revisited 1187
Dow
nloa
ded
by [
Har
vard
Col
lege
] at
14:
40 1
4 A
ugus
t 201
1

Table 8. Logistic regressions predicting the likelihood of being a collegegraduate
Model 1 Model 2 Model 3 Model 4 Model 5
Demographic characteristicsRussian 6.12** 11.08*** 1.34*** 8.07*** 2.05
(1.6) (3.64) (3.46) (2.82) (.92)Chinese 7.88** 14.22*** 13.34*** 11.37*** 6.68***
(1.8) (3.87) (3.65) (3.34) (2.12)South American 1.91** 2.56*** 2.47** 2.32** 1.67
(.48) (.70) (.69) (.72) (.55)Dominican 1.49 1.82* 1.80* 1.74 1.69
(.38) (.49) (.50) (.52) (.52)Age 13.05*** 13.98*** 14.74*** 24.19***
(7.62) (8.28) (8.94) (16.50)Age-square .96*** .96*** .95*** .95***
(.01) (.01) (.01) (.01)Female 1.50* 1.59* 1.66** 1.50
(.30) (.30) (.31) (.31)1.5 generation .83 .90 .92 1.04
(.15) (.17) (.18) (.23)
Acculturation typeConsonant vs. 2.62* 2.32* 1.88
dissonant (1.05) (.93) (.83)Selective vs. 1.75 1.86 1.75
dissonant (.63) (.70) (.68)
Ethnic embeddednessM in ethnic 1.07 1.27
industry (.23) (.31)F in ethnic 1.12 .95
industry (.23) (.21)R in ethnic 1.17 1.02
industry (.33) (.28)Participate in 1.12 1.05
ethnicorganization
(.34) (.38)
Watch ethnic .78* .81media (.09) (.10)
Background characteristicsHigh school 1.31***
GPA (.05)Mother’s 1.49***
education (.16)Father’s 1.13
education (.11)No. of earners in .97
household (.08)Grew up with 1.66
both parents (.47)No. of siblings .86*
(.06)
1188 Mary C. Waters et al.
Dow
nloa
ded
by [
Har
vard
Col
lege
] at
14:
40 1
4 A
ugus
t 201
1

parents’ socioeconomic status and the Chinese are doing much better.Types of acculturation explain neither of these outliers. Both groupshave high rates of dissonant acculturation, yet their socioeconomicattainment could not be more different.
Indeed, other aspects of segmented assimilation theory better explainthe disparate mobility trajectories of the Puerto Ricans and the Chinese.Clearly, Puerto Ricans suffer from a negative reception context �including racial discrimination in housing and the labour force,substandard inner-city schools and circular migration to the islandfacilitated by their American citizenship. The Chinese second genera-tion benefits from greater class heterogeneity within the immigrantcommunity, together with a strong sense of group boundaries andestablished ethnic institutions and media. While many members of theChinese second generation have poorly educated parents, some havecollege degrees and professional jobs. Information is exchanged withinthe Chinese community among parents of different social class back-grounds and members of the second generation can benefit fromadvantageous social ties. This suggests that it is not the overall level ofties to the ethnic group or selective acculturation at the individual levelthat leads to better outcomes. Rather it is maintaining ethnic ties withinthose groups which have significant numbers of middle-class, educatedmembers that help children of poor immigrants. Ethnic embeddednessand social capital are helpful when they connect people to those withsignificant resources. They are of far less use for groups that are moreuniformly poor.
Selective acculturation is an attractive concept. It recognizes the fearof many immigrant parents that their children are Americanizing tooquickly. It also suggests an easily implemented policy solution. Insteadof focusing on improving inner-city schools or ending racial discrimina-tion, the theory suggests that the lives of inner-city second-generationyouths can be improved by strengthening the bonds of social capitalwithin their ethnic communities, encouraging bilingual education andstrengthening family ties. While these goals may be worthwhile in their
Table 8 (Continued)
Model 1 Model 2 Model 3 Model 4 Model 5
Residential .94mobility (.05)
Log likelihood �619.99 �578.521 �572.88 �568.82 �497.98N 1301 1301 1301 1301 1301
Note
*** pB0.001; ** pB0.01; * pB0.05.
Segmented assimilation revisited 1189
Dow
nloa
ded
by [
Har
vard
Col
lege
] at
14:
40 1
4 A
ugus
t 201
1

Table 9. Logistic regressions predicting the likelihood of being in a professionaloccupation
Model 1 Model 2 Model 3 Model 4 Model 5
Demographic characteristicsRussian 4.76** 5.91*** 5.59*** 4.88*** 1.58
(1.39) (2.17) (2.10) (2.05) (.73)Chinese 3.46** 4.06*** 3.89*** 3.73*** 1.37
(.81) (1.09) (1.07) (1.15) (.48)South Americans 1.07 1.12 1.07 1.04 .59
(.28) (.31) (.31) (.33) (.20)Dominican 1.22 1.33 1.27 1.31 .91
(.30) (.34) (.33) (.37) (.27)Age 1.37 1.36 1.50 .92
(1.72) (1.70) (1.92) (1.22)Age-square 1.00 1.00 1.00 1.00
(.02) (.02) (.02) (.02)Female .87 .88 .90 .79
(.18) (.18) (.19) (.18)1.5 generation .91 .91 .91 .95
(.20) (.20) (.21) (.23)
Acculturation typeConsonant vs. 1.52 1.34 1.03
dissonant (.62) (.56) (.49)Selective vs. 1.49 1.49 1.32
dissonant (.50) (.51) (.49)
Ethnic embeddednessM in ethnic .88 .91
industry (.21) (.26)F in ethnic 1.00 1.13
industry (.22) (.26)R in ethnic 1.78 1.76
industry (.54) (.56)Participate in 1.84 2.06*
ethnicorganization
(.61) (.73)
Watch ethnic .86 .95media (.12) (.13)
Family backgroundHigh school GPA 1.02
(.05)Respondent’s 2.38***
education (.44)Mother’s 1.23
education (.13)Father’s .97
education (.10)No. of earners in .95
household (.08)
1190 Mary C. Waters et al.
Dow
nloa
ded
by [
Har
vard
Col
lege
] at
14:
40 1
4 A
ugus
t 201
1

own right, our analyses suggest that they will do little to promotepositive outcomes in the second generation.
Acknowledgements
We are grateful to Richard Alba, Maurice Crul, Nicole Deterding, EvaRosen, Jens Schneider, three anonymous reviewers and participants inthe Harvard Migration Workshop for their helpful feedback onprevious drafts.
Notes
1. For a detailed description of the study, refer to the methodological appendix in Kasinitz
et al. (2008).
2. South American includes Columbian, Ecuadoran and Peruvian.
3. Many respondents in our sample may take longer to finish, might be employed full-time
or part-time while working towards their bachelor’s degree and might eventually get their
bachelor’s degree after the age of 22. However, using different cut-off ages does not affect our
findings (results available upon request).
4. Similarly, many individuals may still be enrolled in advanced degree programmes by age
25, but using different cut-off ages did not lead to substantively different results.
5. One might argue that types of acculturation might have contributed to higher levels of
educational attainment among the second generation and, as a result, indirectly contributed
to professional attainment among the second generation. This would imply that the effect of
acculturation on professional attainment is mediated by educational achievement. However,
even if we remove respondent’s level of education from our model (results not shown, but
available upon request), type of acculturation still has no significant predictive power on
professional attainment.
6. Our measures of ethnic embeddedness could be crude and better measures would
be desirable, but experimenting with contextual measures such as the percentage of
immigrant population and one’s own ethnic group at the zip-code level did not yield
significant results.
Table 9 (Continued)
Model 1 Model 2 Model 3 Model 4 Model 5
Grew up with 1.44both parents (.42)
No. of siblings .96(.07)
Residential .98mobility (.04)
Log likelihood �463.07 �456.61 �455.31 �448.65 �400.15N 784 784 784 784 784
Note
*** pB0.001; ** pB0.01; * pB0.05.
Segmented assimilation revisited 1191
Dow
nloa
ded
by [
Har
vard
Col
lege
] at
14:
40 1
4 A
ugus
t 201
1
References
ABADA, TERESA, HOU, FENG and RAM, BALI 2009 ‘Ethnic differences in educational
attainment among the children of Canadian immigrants’, Canadian Journal of Sociology, vol.
34, no. 1, pp. 1�28
ALBA, RICHARD and NEE, VICTOR 2003 Remaking the American Mainstream:
Assimilation and Contemporary Immigration, Cambridge, MA: Harvard University Press
BOYD, MONICA 2002 ‘Educational attainments of immigrant offspring: success or
segmented assimilation?’, International Migration Review, vol. 36, no. 4, pp. 1037�60
FARLEY, REYNOLDS and ALBA, RICHARD 2002 ‘The new second generation in the
United States’, International Migration Review, vol. 36, no. 3, pp. 669�701
GANS, HERBERT J. 2007 ‘Acculturation, assimilation and mobility’, Ethnic and Racial
Studies, vol. 30, no. 1, pp. 152�64
GRATTON, BRIAN 2002 ‘Race, the children of immigrants, and social science theory’,
Journal of American Ethnic History, vol. 21, no. 4, pp. 74�84
GREENMAN, EMILY and XIE, YU 2008 ‘Is assimilation theory dead? The effect of
assimilation on adolescent well-being’, Social Science Research, vol. 37, no. 1, pp. 109�37
HIRSCHMAN, CHARLES 2001 ‘The educational enrollment of immigrant youth: a test of
the segmented-assimilation hypothesis’, Demography, vol. 3, no. 38, pp. 317�36
KASINITZ, PHILIP, MOLLENKOPF, JOHN and WATERS, MARY C. 2002 ‘Becoming
American/becoming New Yorkers: immigrant incorporation in a majority minority city’,
International Migration Review, vol. 36, no. 4, pp. 1020�36
*** 2004 Becoming New Yorkers: Ethnographies of the New Second Generation, New
York: Russell Sage Foundation
KASINITZ, PHILIP, MOLLENKOPF, JOHN, WATERS, MARY and HOLDAWAY,
JENNIFER 2008 Inheriting the City: The Children of Immigrants Come of Age, New
York: Russell Sage Foundation
MENJIVAR, CECILIA 2000 Fragmented Ties: Salvadoran Immigrant Networks in America,
Berkeley, CA: University of California Press
PARK, ROBERT E. and BURGESS, ERNEST 1925 The City, Chicago, IL: The University
of Chicago Press
PERLMAN, JOEL and WALDINGER, ROGER 1997 ‘Second generation decline?
Children of immigrants, past and present � a reconsideration’, International Migration
Review, vol. 31, no. 4, pp. 893�922
PORTES, ALEJANDRO and RUMBAUT, RUBEN G. 2001 Legacies: The Story of the
Immigrant Second Generation, Berkeley, CA: University of California Press
PORTES, ALEJANDRO and ZHOU, MIN 1993 ‘The new second generation: segmented
assimilation and its variants’, Annals of the American Academy of Political and Social
Science, vol. 530, no. 1, pp. 74�96
PORTES, ALEJANDRO, FERNANDEZ-KELLY, PATRICIA and HALLER, WILLIAM
2005 ‘Segmented assimilation on the ground: the new second generation in early adulthood’,
Ethnic and Racial Studies, vol. 28, no. 6, pp. 1000�40
SMITH, JAMES 2003 ‘Assimilation across the Latino generations’, American Economic
Review, vol. 93, no. 2, pp. 315�19
STEPICK, ALEX 1998 Pride against Prejudice: Haitians in the U.S, Boston, MA: Allyn &
Bacon
THOMSON, MARK and CRUL, MAURICE 2007 ‘The second generation in Europe and
the United States: how is the transatlantic debate relevant for further research on the
European second generation?’, Journal of Ethnic and Migration Studies, vol. 33, no. 7,
pp. 1025�41
VICKERMAN, MILTON 1999 Crosscurrents: West Indian Immigrants and Race, New York:
Oxford University Press
WALDINGER, ROGER 2007 ‘Did manufacturing matter? The experience of yesterday’s
second generation: a reassessment’, International Migration Review, vol. 41, no. 1, pp. 3�39
1192 Mary C. Waters et al.
Dow
nloa
ded
by [
Har
vard
Col
lege
] at
14:
40 1
4 A
ugus
t 201
1

WALDINGER, ROGER and FELICIANO, CYNTHIA 2004 ‘Will the new second
generation experience ‘downward assimilation’? Segmented assimilation re-assessed’, Ethnic
and Racial Studies, vol. 27, no. 3, pp. 376�402
WALDINGER, ROGER and PERLMAN, JOEL 1998 ‘Second generations: past, present,
future’, Journal of Ethnic and Migration Studies, vol. 24, no. 1, pp. 5�24
WARNER, W. LLOYD and SROLE, LEO 1945 The Social Systems of American Ethnic
Groups, New Haven, CT: Yale University Press
WATERS, MARY C. 1999 Black Identities: West Indian Immigrant Dreams and American
Realities, New York: Russell Sage Foundation
ZEPHIR, FLORE 2001 Trends in Ethnic Identification among Second-Generation Haitian
Immigrants in New York City, Westport, CT: Bergin & Garvey
ZHOU, MIN and BANKSTON, CARL L. 1998 Growing Up American: How Vietnamese
Children Adapt to Life in the United States, New York: Russell Sage Foundation
ZHOU, MIN and KIM, SUSAN S. 2006 ‘Community forces, social capital, and educational
achievement: the case of supplementary education in the Chinese and Korean immigrant
communities’, Harvard Educational Review, vol. 76, no. 1, pp. 1�29
ZHOU, MIN and XIONG, YANG SAO 2005 ‘The multifaceted American experiences of the
children of Asian immigrants: lessons from segmented assimilation’, Ethnic and Racial
Studies, vol. 28, no. 6, pp. 1119�52
MARY C. WATERS is M. E. Zukerman Professor in the Departmentof Sociology at Harvard University.ADDRESS: 33 Kirkland St., Cambridge, MA 02138, USA.Email: [email protected]
VAN C. TRAN is a PhD candidate in the Department of Sociologyand Social Policy at Harvard University.ADDRESS: 33 Kirkland St., Cambridge, MA 02138, USA.Email: [email protected]
PHILIP KASINITZ is Professor in the Department of Sociology atthe Graduate Center of the City University of New York.ADDRESS: 365 Fifth Avenue, New York, NY 10016, USA.Email: [email protected]
JOHN H. MOLLENKOPF is Distinguished Professor in the Depart-ments of Political Science and Sociology at the Graduate Center of theCity University of New York.ADDRESS: 365 Fifth Avenue, New York, NY 10016, USA.Email: [email protected]
Segmented assimilation revisited 1193
Dow
nloa
ded
by [
Har
vard
Col
lege
] at
14:
40 1
4 A
ugus
t 201
1