Embed Size (px)
Citation preview
ZION NUCLEAR POWER STATIONUNITS 1 and 2
Annual RadiologicalEnvironmental Operating Report
1 January Through 31 December 2010
Prepared By
May 2011
Zion Nuclear Power StationZion, IL 60099
NRC Docket No:
50-304
50-295
Teledyne Brown EngineeringEnvironmental Services

i
Table Of Contents
I. Summary and Conclusions .............................................................................................. 1
II. Introduction ..................................................................................................................... 3 A. Objectives of the REMP ...................................................................................... 3 B. Implementation of the Objectives ........................................................................ 3
III. Program Description ...................................................................................................... 3 A. Sample Collection ............................................................................................... 3 B. Sample Analysis .................................................................................................. 5 C. Data Interpretation .............................................................................................. 5 D. Program Exceptions ............................................................................................ 6 E. Program Changes ............................................................................................... 7
IV. Results and Discussion ................................................................................................. 7 A. Aquatic Environment ........................................................................................... 7
1. Public Water ............................................................................................. 7 2. Fish ........................................................................................................... 8 3. Sediment ................................................................................................... 8
B. Atmospheric Environment ................................................................................... 8 1. Airborne .................................................................................................... 8
a. Air Particulates ............................................................................... 8 C. Ambient Gamma Radiation ................................................................................. 9 D. Land Use Survey ................................................................................................. 9 E. Summary of Results – Inter-laboratory Comparison Program .......................... 10
ii
Appendices
Appendix A Radiological Environmental Monitoring Report Summary
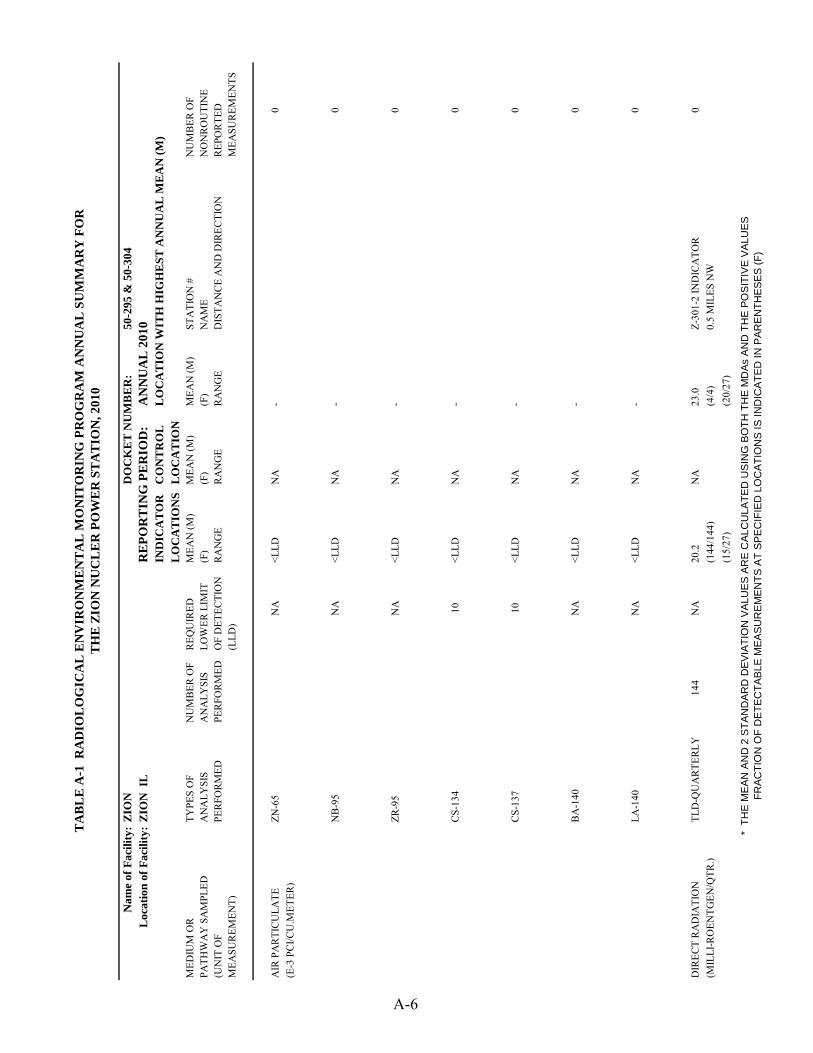
Table A-1 Radiological Environmental Monitoring Program Quarterly and Annual Summaries for the Zion Nuclear Power Station, 2010
Tables
Appendix B Location Designation, Distance & Direction, and Sample Collection &
Analytical Methods
Table B-1 Radiological Environmental Monitoring Program - Sampling Locations, Distance and Direction, Zion Nuclear Power Station, 2010
Tables
Table B-2 Radiological Environmental Monitoring Program - Summary of Sample Collection and Analytical Methods, Zion Nuclear Power Station, 2010
Figure B-1 Inner Ring TLD Locations and Fixed Air Samplers of the Zion Nuclear Power Station, 2010
Figures
Figure B-2 Fish, Water and Sediment Locations of the Zion Nuclear Power Station, 2010
Appendix C Data Tables and Figures - Primary Laboratory
Table C-I.1 Concentrations of Gross Beta in Public Water Samples Collected in the Vicinity of Zion Nuclear Power Station, 2010
Tables
Table C-I.2 Concentrations of Tritium in Public Water Samples Collected in the Vicinity of Zion Nuclear Power Station, 2010.
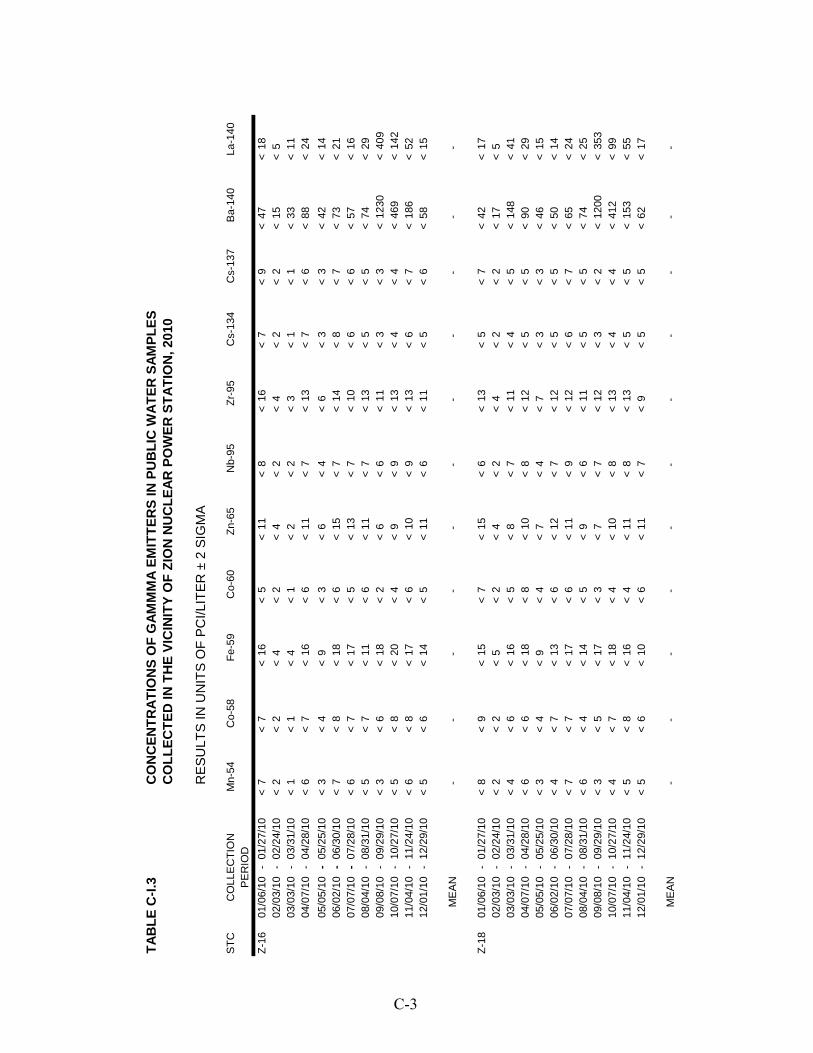
Table C-I.3 Concentrations of Gamma Emitters in Public Water Samples Collected in the Vicinity of Zion Nuclear Power Station, 2010.
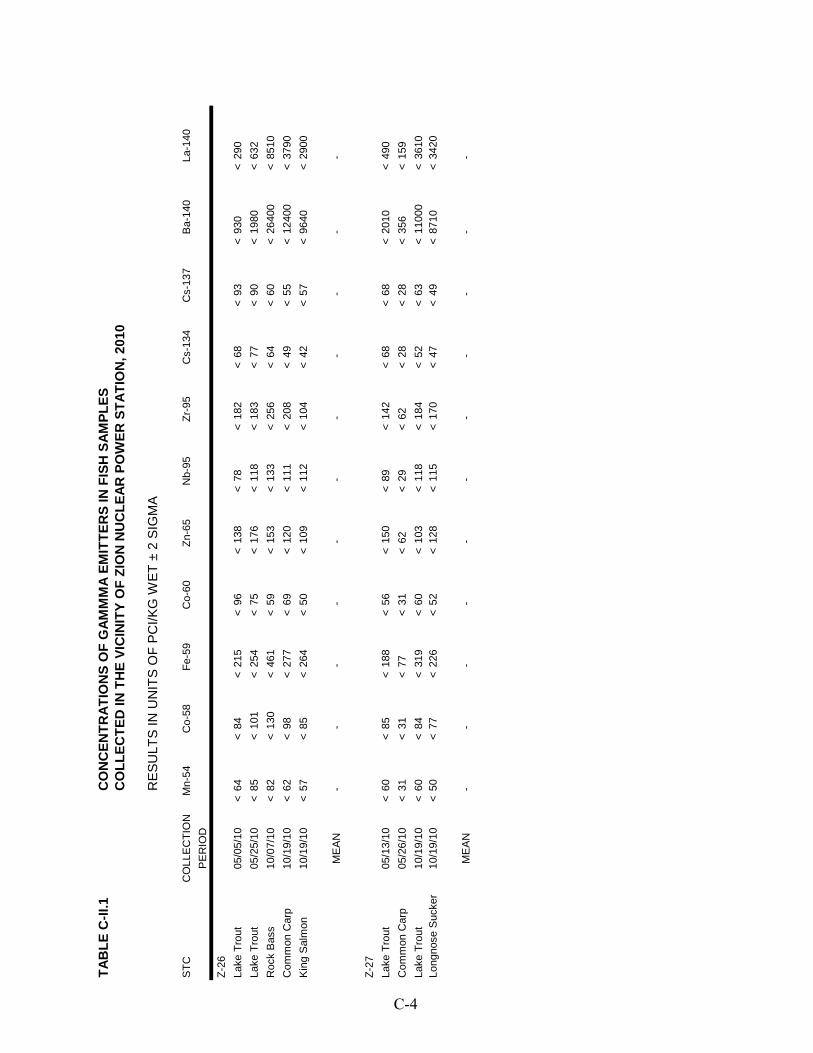
Table C-II.1 Concentrations of Gamma Emitters in Fish Samples Collected in the Vicinity of Zion Nuclear Power Station, 2010.
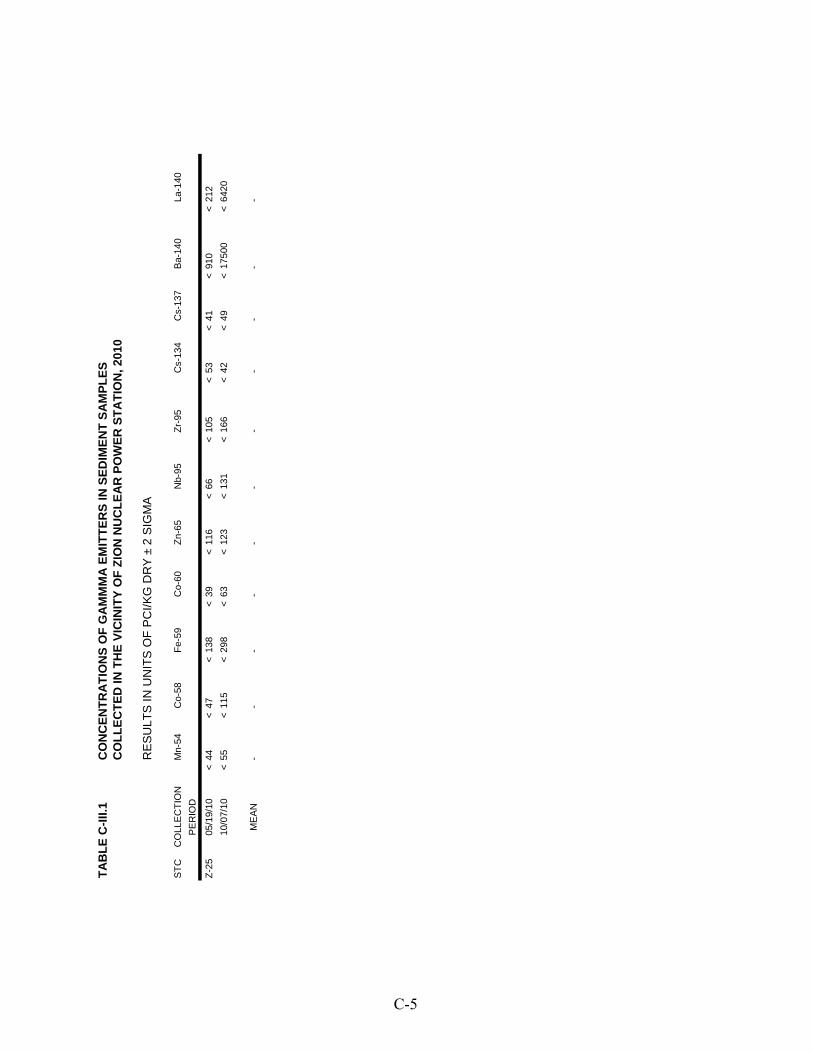
Table C-III.1 Concentrations of Gamma Emitters in Sediment Samples Collected in the Vicinity of Zion Nuclear Power Station, 2010.
Table C-IV.1 Concentrations of Gross Beta in Air Particulate Samples Collected in the Vicinity of Zion Nuclear Power Station, 2010.
iii
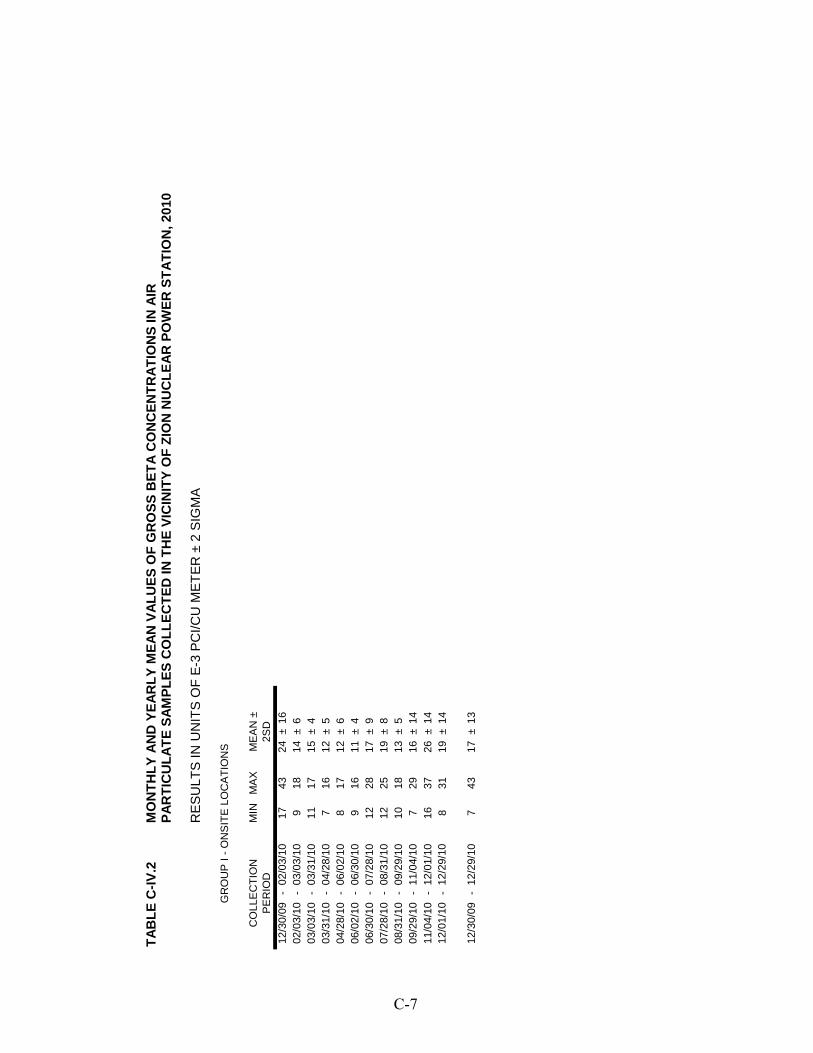
Table C-IV.2 Monthly and Yearly Mean Values of Gross Beta Concentrations (E-3 pCi/cu meter) in Air Particulate Samples Collected in the Vicinity of Zion Nuclear Power Station, 2010.
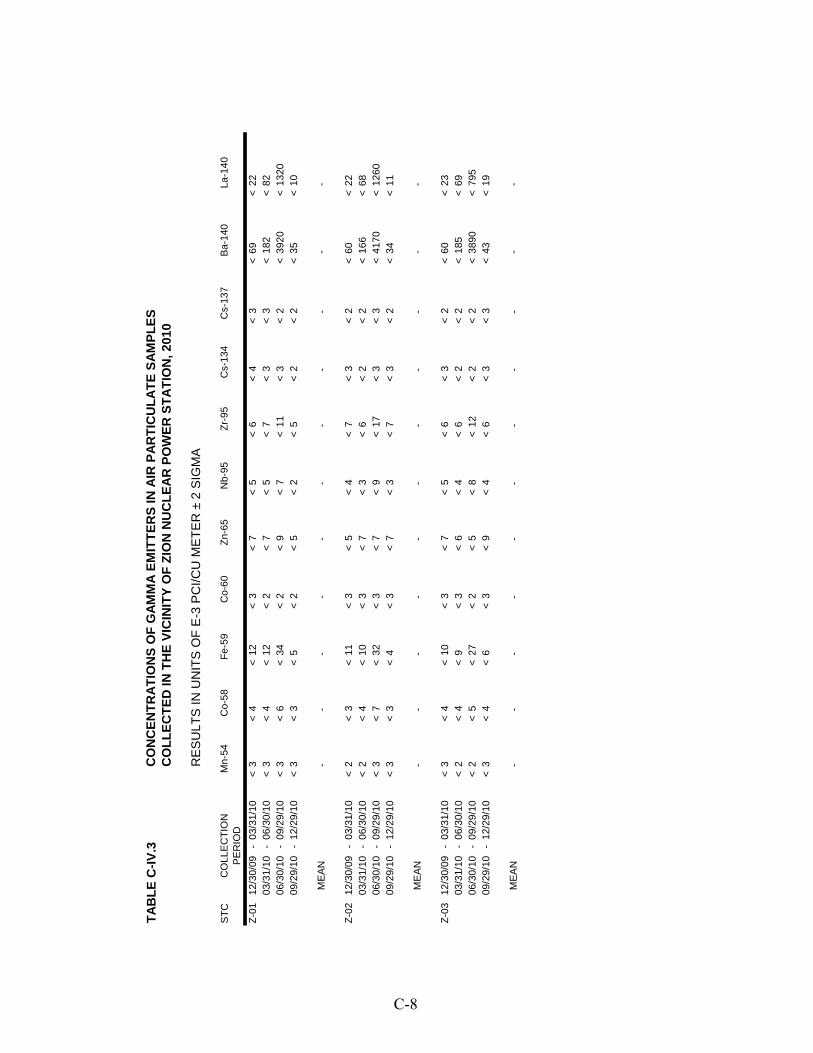
Table C-IV.3 Concentrations of Gamma Emitters in Air Particulate Samples Collected in the Vicinity of Zion Nuclear Power Station, 2010.
Table C-V.1 Quarterly TLD Results for Zion Nuclear Power Station, 2010. Table C-V.2 Mean Quarterly TLD Results for the Inner and Other Locations for Zion
Nuclear Power Station, 2010. Table C-V.3 Summary of the Ambient Dosimetry Program for Zion Nuclear Power
Station, 2010. Figures Figure C-1 Public Water - Gross Beta – Stations Z-14 and Z-15 Collected in the
Vicinity of ZNPS, 2000 - 2010.
Figure C-2 Public Water – Gross Beta – Stations Z-16 and Z-18 Collected in the Vicinity of ZNPS, 2000 - 2010.
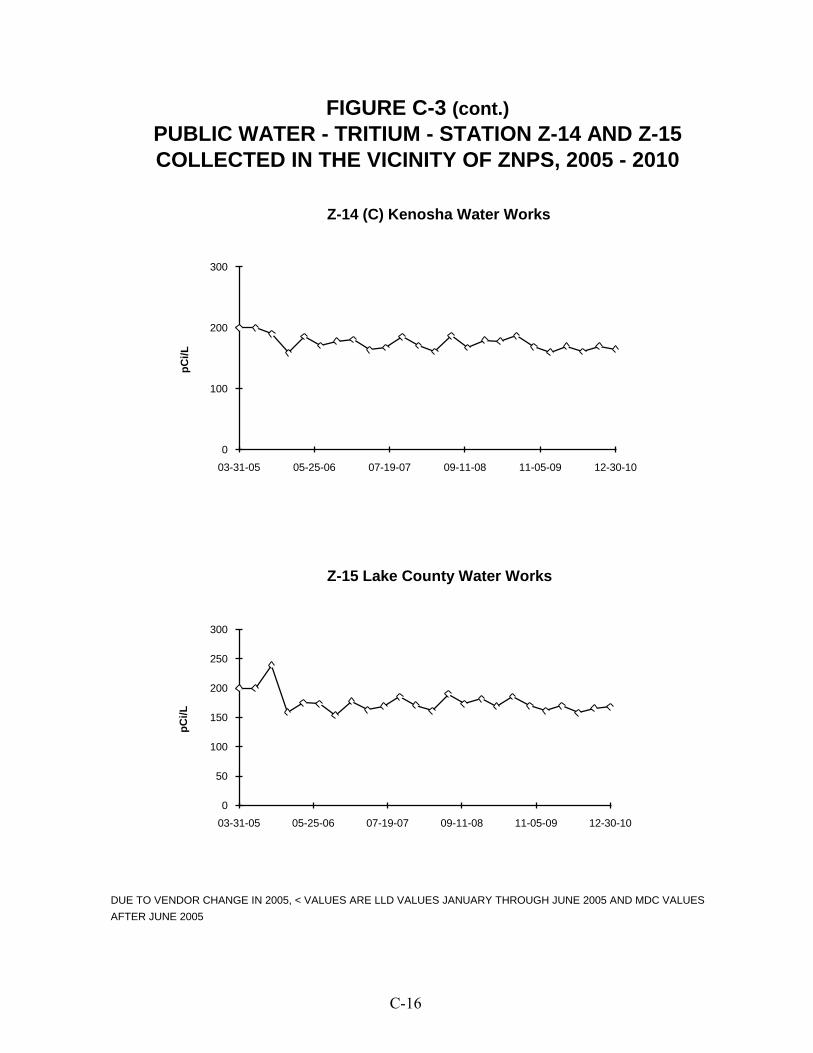
Figure C-3 Public Water - Tritium – Stations Z-14 and Z-15 Collected in the Vicinity of ZNPS, 2000 - 2010.
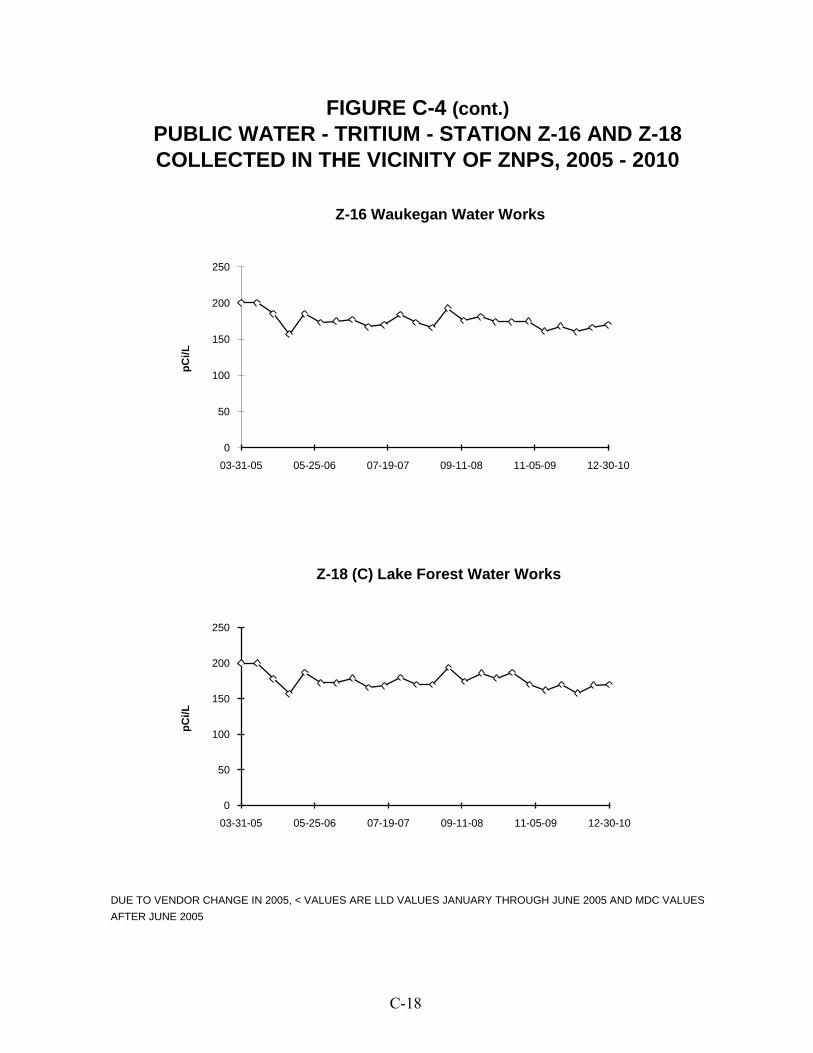
Figure C-4 Public Water - Tritium – Stations Z-16 and Z-18 Collected in the Vicinity of ZNPS, 2000 - 2010.
Figure C-5 Air Particulates - Gross Beta – Stations Z-01 and Z-02 Collected in the Vicinity of ZNPS, 2000 - 2010.
Figure C-6 Air Particulate – Gross Beta – Station Z-03 Collected in the Vicinity of ZNPS, 2000 - 2010.
Appendix D Inter-Laboratory Comparison Program
Table D-1 Analytics Environmental Radioactivity Cross Check Program Tables
Teledyne Brown Engineering, 2010 Table D-2 ERA Environmental Radioactivity Cross Check Program Teledyne Brown Engineering, 2010 Table D-3 DOE’s Mixed Analyte Performance Evaluation Program (MAPEP) Teledyne Brown Engineering, 2010 Table D-4 ERA Statistical Summary Proficiency Testing Program Environmental, Inc., 2010 Table D-5 DOE’s Mixed Analyte Performance Evaluation Program (MAPEP)
Environmental, Inc., 2010

iv
Appendix E Effluent Data Appendix F Meteorological Data Appendix G Annual Radiological Groundwater Protection Program Report
(ARGPPR)

- 1 -
I. Summary and Conclusions
This report on the Radiological Environmental Monitoring Program conducted for the Zion Nuclear Power Station (ZNPS) by ZionSolutions (ZS) (Exelon was the licensee up to 08/31/2010; ZS became the licensee on 09/01/2010) covers the period 1 January 2010 through 31 December 2010. During that time period, 435 analyses were performed on 359 samples. In assessing all the data gathered for this report and comparing these results with preoperational data, it was concluded that the operation of ZNPS had no adverse radiological impact on the environment. Public water samples were analyzed for concentrations of gross beta, tritium and gamma emitting nuclides. No fission or activation products were detected. Gross beta activities detected were consistent with those detected in previous years. Fish (commercially and recreationally important species) and sediment samples were analyzed for concentrations of gamma emitting nuclides. No Cs-137 activity was detected in fish. No Cs-137 was detected in sediment samples. No plant produced fission or activation products were found in sediment. Air particulate samples were analyzed for concentrations of gross beta and gamma emitting nuclides. No fission or activation products were detected. Environmental gamma radiation measurements were performed quarterly using thermoluminescent dosimeters. Levels detected were consistent with those observed in previous years.

- 2 -
Intentionally left blank
- 3 -
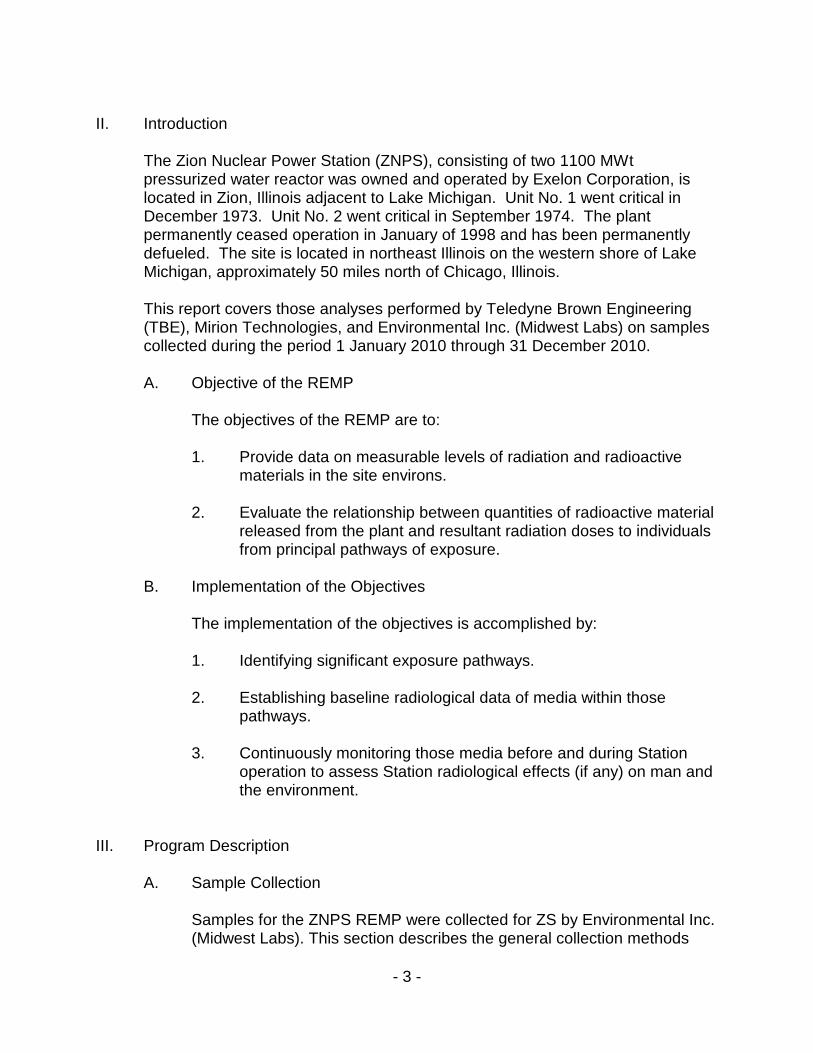
II. Introduction
The Zion Nuclear Power Station (ZNPS), consisting of two 1100 MWt pressurized water reactor was owned and operated by Exelon Corporation, is located in Zion, Illinois adjacent to Lake Michigan. Unit No. 1 went critical in December 1973. Unit No. 2 went critical in September 1974. The plant permanently ceased operation in January of 1998 and has been permanently defueled. The site is located in northeast Illinois on the western shore of Lake Michigan, approximately 50 miles north of Chicago, Illinois. This report covers those analyses performed by Teledyne Brown Engineering (TBE), Mirion Technologies, and Environmental Inc. (Midwest Labs) on samples collected during the period 1 January 2010 through 31 December 2010. A. Objective of the REMP
The objectives of the REMP are to:
1. Provide data on measurable levels of radiation and radioactive
materials in the site environs. 2. Evaluate the relationship between quantities of radioactive material
released from the plant and resultant radiation doses to individuals from principal pathways of exposure.
B. Implementation of the Objectives
The implementation of the objectives is accomplished by:
1. Identifying significant exposure pathways. 2. Establishing baseline radiological data of media within those
pathways. 3. Continuously monitoring those media before and during Station
operation to assess Station radiological effects (if any) on man and the environment.
III. Program Description
A. Sample Collection
Samples for the ZNPS REMP were collected for ZS by Environmental Inc. (Midwest Labs). This section describes the general collection methods
- 4 -
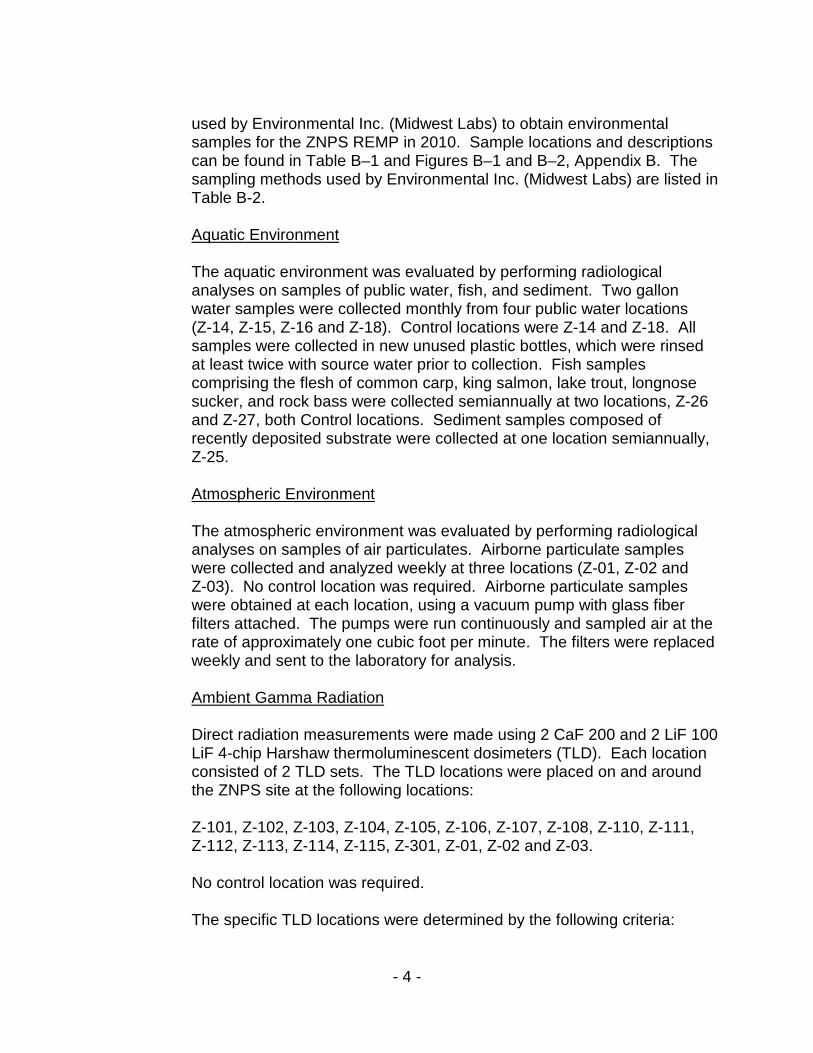
used by Environmental Inc. (Midwest Labs) to obtain environmental samples for the ZNPS REMP in 2010. Sample locations and descriptions can be found in Table B–1 and Figures B–1 and B–2, Appendix B. The sampling methods used by Environmental Inc. (Midwest Labs) are listed in Table B-2.
Aquatic Environment
The aquatic environment was evaluated by performing radiological analyses on samples of public water, fish, and sediment. Two gallon water samples were collected monthly from four public water locations (Z-14, Z-15, Z-16 and Z-18). Control locations were Z-14 and Z-18. All samples were collected in new unused plastic bottles, which were rinsed at least twice with source water prior to collection. Fish samples comprising the flesh of common carp, king salmon, lake trout, longnose sucker, and rock bass were collected semiannually at two locations, Z-26 and Z-27, both Control locations. Sediment samples composed of recently deposited substrate were collected at one location semiannually, Z-25.
Atmospheric Environment
The atmospheric environment was evaluated by performing radiological analyses on samples of air particulates. Airborne particulate samples were collected and analyzed weekly at three locations (Z-01, Z-02 and Z-03). No control location was required. Airborne particulate samples were obtained at each location, using a vacuum pump with glass fiber filters attached. The pumps were run continuously and sampled air at the rate of approximately one cubic foot per minute. The filters were replaced weekly and sent to the laboratory for analysis.
Ambient Gamma Radiation
Direct radiation measurements were made using 2 CaF 200 and 2 LiF 100 LiF 4-chip Harshaw thermoluminescent dosimeters (TLD). Each location consisted of 2 TLD sets. The TLD locations were placed on and around the ZNPS site at the following locations: Z-101, Z-102, Z-103, Z-104, Z-105, Z-106, Z-107, Z-108, Z-110, Z-111, Z-112, Z-113, Z-114, Z-115, Z-301, Z-01, Z-02 and Z-03. No control location was required. The specific TLD locations were determined by the following criteria:
- 5 -
1. The presence of relatively dense population;
2. Site meteorological data taking into account distance and elevation for each of the sixteen–22 1/2 degree sectors around the site, where estimated annual dose from ZNPS, if any, would be most significant;
3. On hills free from local obstructions and within sight of the vents
(where practical); 4. And near the closest dwelling to the vents in the prevailing
downwind direction.
(Two TLDs – each comprised of two CaF2 200 and 2 LiF 100 LiF 4-chip thermoluminescent phosphors enclosed in plastic – were placed at each location in a PVC conduit located approximately four to eight feet above ground level. The TLDs were exchanged quarterly and sent to Mirion Technologies for analysis.
B. Sample Analysis
This section describes the general analytical methodologies used by TBE and Environmental Inc. (Midwest Labs) to analyze the environmental samples for radioactivity for the ZNPS REMP in 2010. The analytical procedures used by the laboratories are listed in Table B-2. In order to achieve the stated objectives, the current program includes the following analyses:
1. Concentrations of beta emitters in public water and air particulates. 2. Concentrations of gamma emitters in public water, air particulates,
fish and sediment. 3. Concentrations of tritium in public water. 4. Ambient gamma radiation levels at various site environs.
C. Data Interpretation
The radiological and direct radiation data collected prior to Zion Nuclear Power Station becoming operational were used as a baseline with which these operational data were compared. For the purpose of this report, Zion Nuclear Power Station was considered operational at initial criticality. In addition, data were compared to previous years' operational data for
- 6 -
consistency and trending. Several factors were important in the interpretation of the data: 1.
Lower Limit of Detection and Minimum Detectable Concentration
The lower limit of detection (LLD) was defined as the smallest concentration of radioactive material in a sample that would yield a net count (above background) that would be detected with only a 5% probability of falsely concluding that a blank observation represents a "real" signal. The LLD was intended as a before the fact estimate of a system (including instrumentation, procedure and sample type) and not as an after the fact criteria for the presence of activity. All analyses were designed to achieve the required ZNPS detection capabilities for environmental sample analysis.
The minimum detectable concentration (MDC) is defined above with the exception that the measurement is an after the fact estimate of the presence of activity.
2.
Net Activity Calculation and Reporting of Results
Net activity for a sample was calculated by subtracting background activity from the sample activity. Since the REMP measures extremely small changes in radioactivity in the environment, background variations may result in sample activity being lower than the background activity effecting a negative number. An MDC was reported in all cases where positive activity was not detected. Gamma spectroscopy results for each type of sample were grouped as follows:
For public water, sediment and air particulates 11 nuclides, Mn-54, Co-58, Fe-59, Co-60, Zn-65, Nb-95, Zr-95, Cs-134, Cs-137, Ba-140 and La-140 were reported.
Means and standard deviations of the results were calculated. The standard deviations represent the variability of measured results for different samples rather than single analysis uncertainty.
D. Program Exceptions
For 2010 the ZNPS REMP had a sample recovery rate in excess of 99%. Sample anomalies and missed samples are listed in the tables below:
- 7 -
Table D-1
LISTING OF SAMPLE ANOMALIES
Sample Location Collection Reason Type Code Date There were no sample anomalies in 2010.
Table D-2
LISTING OF MISSED SAMPLES
Sample Location Collection Reason Type Code Date
There were no missed samples for 2010. Each program exception was reviewed to understand the causes of the program exception. Sampling and maintenance errors were reviewed with the personnel involved to prevent recurrence. Occasional equipment breakdowns and power outages were unavoidable. The overall sample recovery rate indicates that the appropriate procedures and equipment are in place to assure reliable program implementation.
E. Program Changes
There were no changes to the REMP program in 2010.
IV. Results and Discussion
A. Aquatic Environment
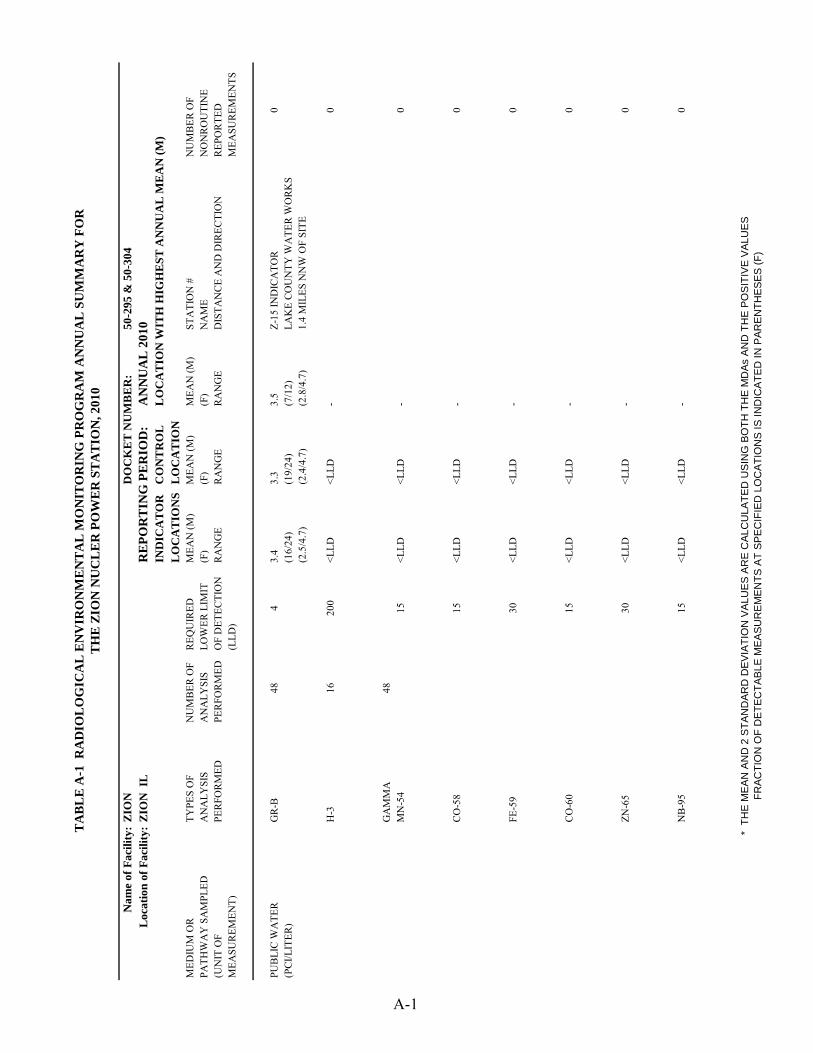
1. Public Water
Samples were taken weekly and composited monthly at four locations (Z-14, Z-15, Z-16 and Z-18). The following analyses were performed.
Gross Beta
Samples from all locations were analyzed for concentrations of gross beta (Table C–I.1, Appendix C). The values ranged from 2.4 pCi/l to 4.7 pCi/l. Concentrations detected were consistent with those detected in previous years (Figures C–1 and C–2, Appendix C).
- 8 -
Tritium
Quarterly composites of weekly collections were analyzed for tritium activity (Table C–I.2, Appendix C). No tritium was detected and the LLD was met (Figures C–3 and C–4, Appendix C).
Gamma Spectrometry
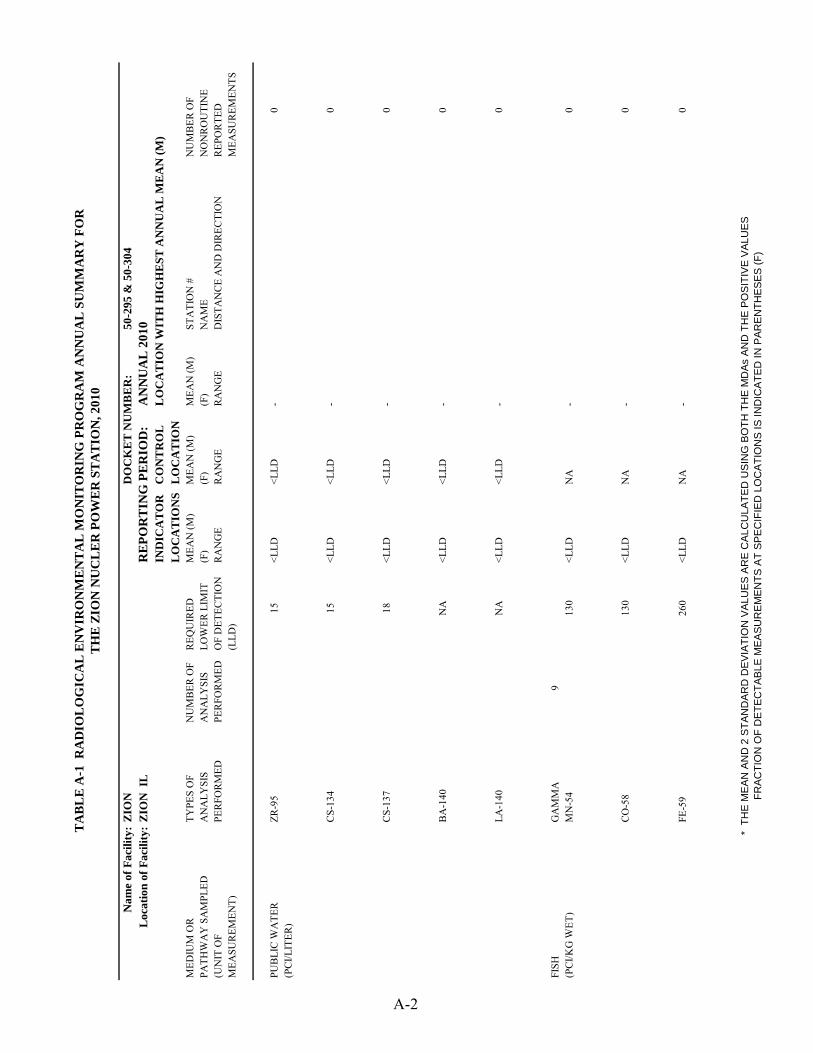
Samples from both locations were analyzed for gamma emitting nuclides (Table C–I.3, Appendix C). No nuclides were detected and all required LLDs were met.
2. Fish
Fish samples comprised of common carp, king salmon, lake trout, longnose sucker, and rock bass were collected at two locations (Z-26 and Z-27) semiannually. The following analysis was performed:
Gamma Spectrometry
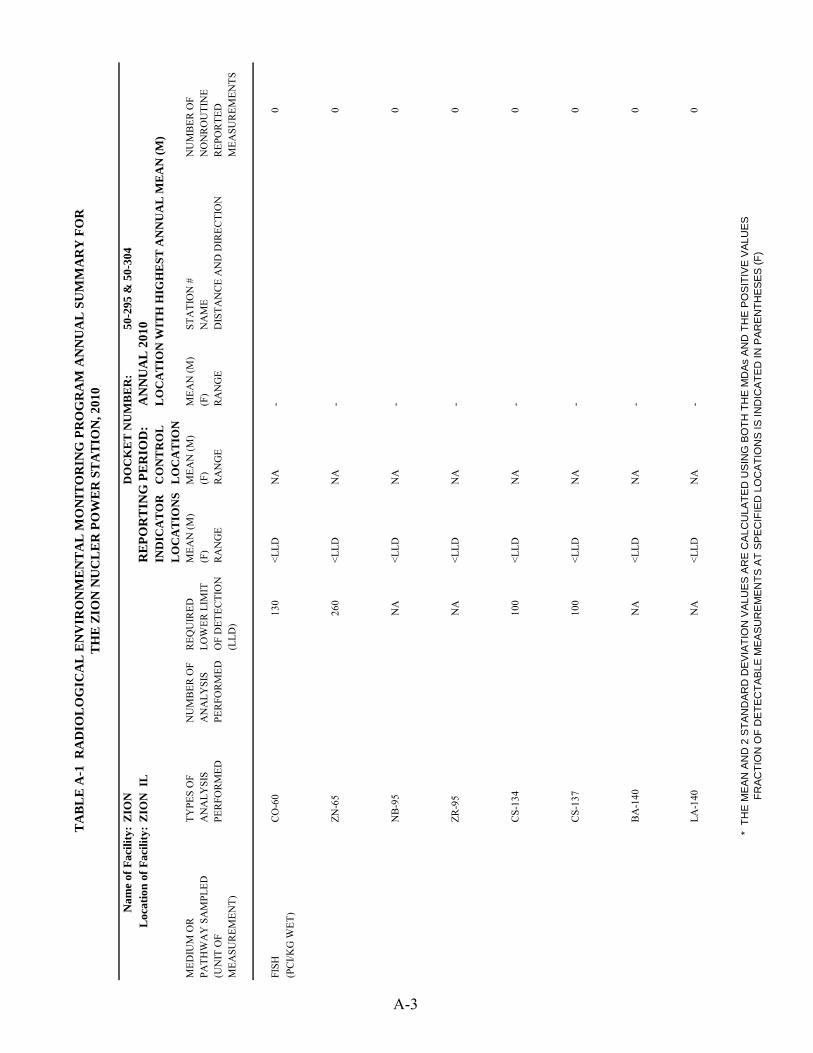
The edible portion of fish samples from both locations was analyzed for gamma emitting nuclides (Table C–II.1, Appendix C). No nuclides were detected and all required LLDs were met.
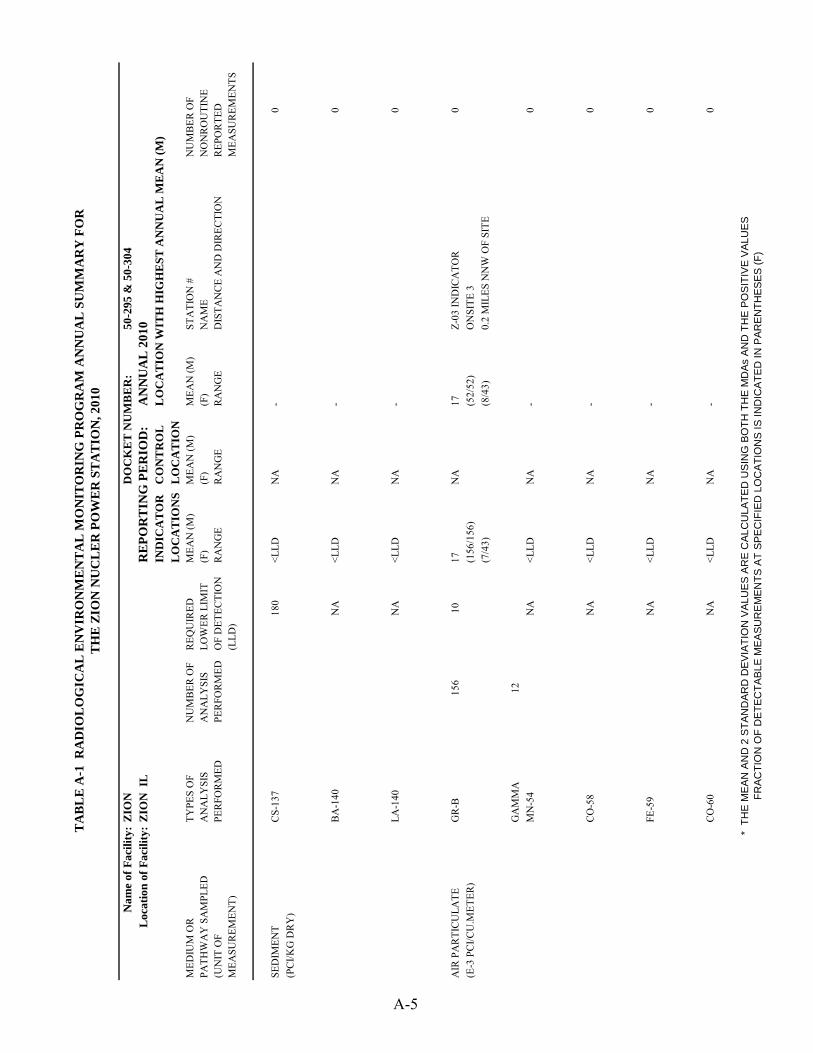
3. Sediment
Aquatic sediment samples were collected at one location (Z-25) semiannually. The following analysis was performed:
Gamma Spectrometry
Sediment samples from Z-25 were analyzed for gamma emitting nuclides (Table C–III.1, Appendix C). No nuclides were detected and all required LLDs were met.
B. Atmospheric Environment
1. Airborne
a. Air Particulates
Continuous air particulate samples were collected from three locations on a weekly basis. The three locations were within the ZNPS site boundary (Z-01, Z-02 and Z-03). The following analyses were performed:
- 9 -
Gross Beta
Weekly samples were analyzed for concentrations of beta emitters (Table C–IV.1 and C–IV.2, Appendix C).
Detectable gross beta activity was observed at all locations. Comparison of results among the three groups aid in determining the effects, if any, resulting from the operation of ZNPS. The results from the On-Site locations ranged from 7 E-3 pCi/m3 to 43 E–3 pCi/m3 with a mean of 17 E–3 pCi/m3. Comparison of the 2010 air particulate data with previous years data indicate no effects from the operation of ZNPS. Concentrations detected were consistent with those detected in previous years.
Gamma Spectrometry
Weekly samples were composited quarterly and analyzed for gamma emitting nuclides (Table C–IV.3, Appendix C). No nuclides were detected and all required LLDs were met.
C. Ambient Gamma Radiation
Ambient gamma radiation levels were measured utilizing Harshaw (CaF and LiF) thermoluminescent dosimeters. Thirty-six TLD locations were established around the site. Results of TLD measurements are listed in Tables C–V.1 to C–V.3, Appendix C.
Most TLD measurements were below 25 mR/quarter, with a range of 15 mR/quarter to 27 mR/quarter.
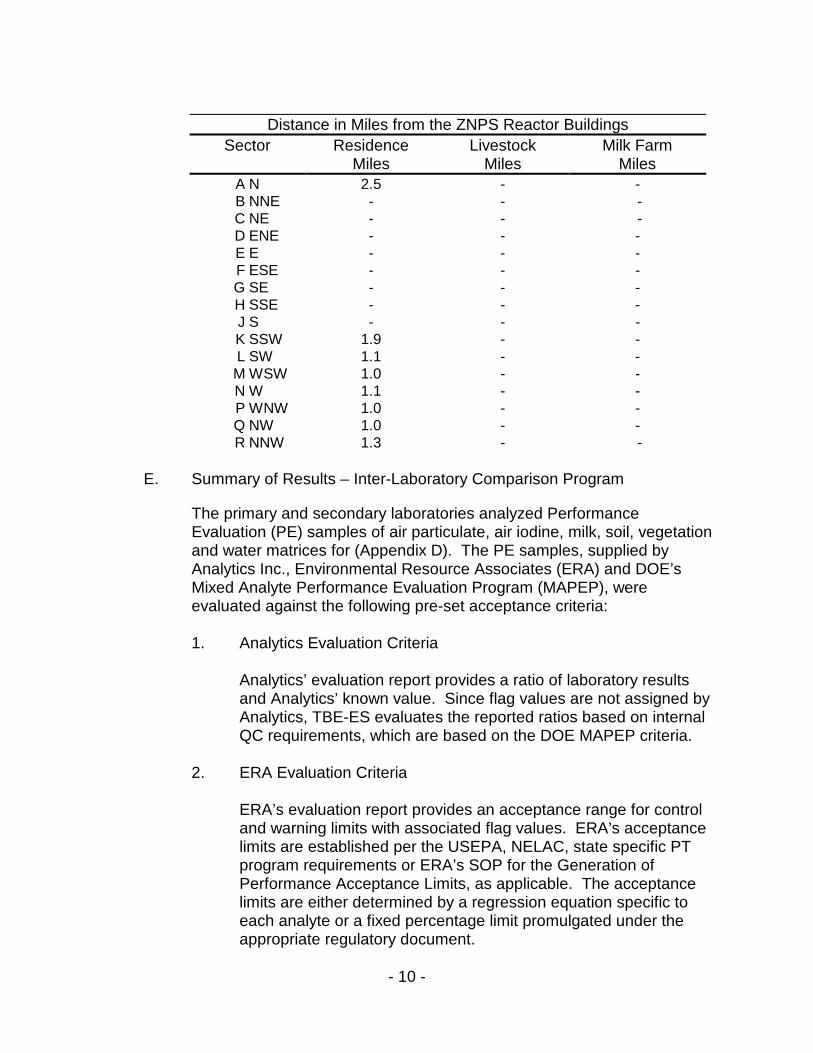
D. Land Use Survey A Land Use Survey conducted during August 2010 around the Zion Nuclear Power Station (ZNPS) was performed by Environmental Inc. (Midwest Labs) for ZS to comply with Chapter 3 of the Zion’ Offsite Dose Calculation Manual. The purpose of the survey was to document the nearest resident, milk producing animal and garden of greater than 500 ft2 in each of the sixteen 22 ½ degree sectors around the site. There were no changes required to the ZNPS REMP, as a result of this survey. The results of this survey are summarized below.
- 10 -
Distance in Miles from the ZNPS Reactor Buildings Sector Residence
Miles Livestock
Miles Milk Farm
Miles A N 2.5 - - B NNE - - - C NE - - - D ENE - - - E E - - - F ESE - - - G SE - - - H SSE - - - J S - - - K SSW 1.9 - - L SW 1.1 - - M WSW 1.0 - - N W 1.1 - - P WNW 1.0 - - Q NW 1.0 - - R NNW 1.3 - -
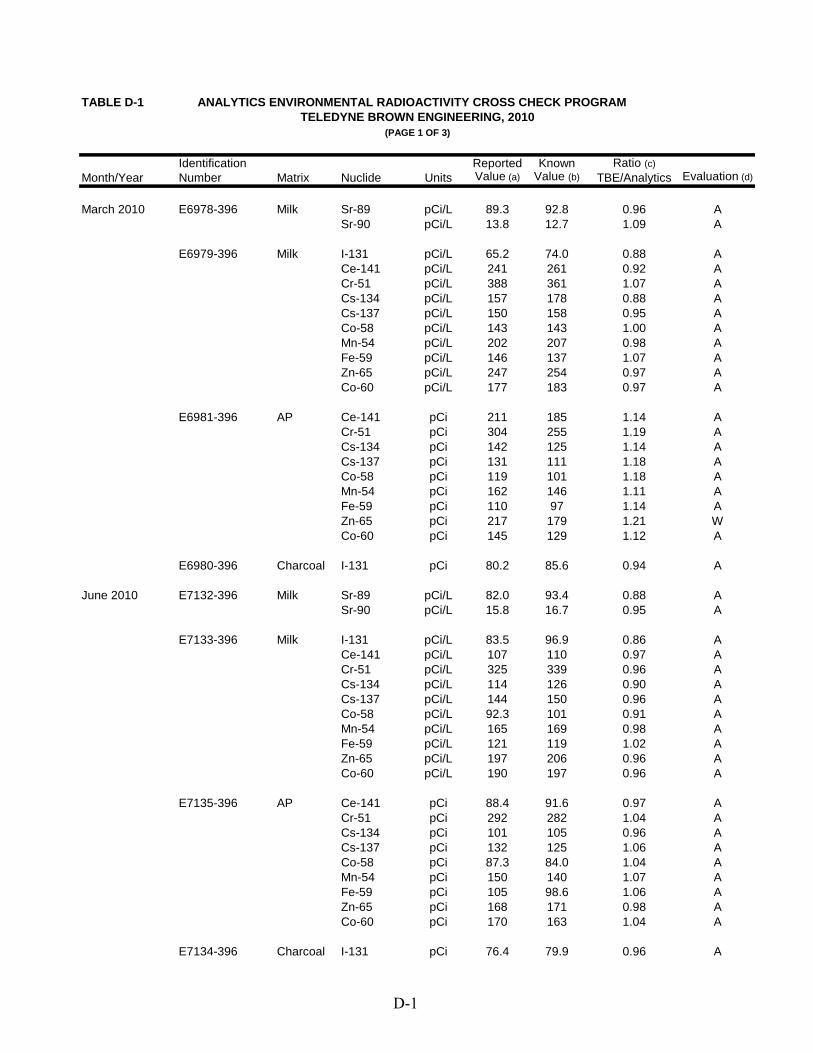
E. Summary of Results – Inter-Laboratory Comparison Program
The primary and secondary laboratories analyzed Performance Evaluation (PE) samples of air particulate, air iodine, milk, soil, vegetation and water matrices for (Appendix D). The PE samples, supplied by Analytics Inc., Environmental Resource Associates (ERA) and DOE’s Mixed Analyte Performance Evaluation Program (MAPEP), were evaluated against the following pre-set acceptance criteria: 1. Analytics Evaluation Criteria
Analytics’ evaluation report provides a ratio of laboratory results and Analytics’ known value. Since flag values are not assigned by Analytics, TBE-ES evaluates the reported ratios based on internal QC requirements, which are based on the DOE MAPEP criteria.
2. ERA Evaluation Criteria
ERA’s evaluation report provides an acceptance range for control and warning limits with associated flag values. ERA’s acceptance limits are established per the USEPA, NELAC, state specific PT program requirements or ERA’s SOP for the Generation of Performance Acceptance Limits, as applicable. The acceptance limits are either determined by a regression equation specific to each analyte or a fixed percentage limit promulgated under the appropriate regulatory document.
- 11 -
3. DOE Evaluation Criteria
MAPEP’s evaluation report provides an acceptance range with associated flag values.
The MAPEP defines three levels of performance: Acceptable (flag = “A”), Acceptable with Warning (flag = “W”), and Not Acceptable (flag = “N”). Performance is considered acceptable when a mean result for the specified analyte is ± 20% of the reference value. Performance is acceptable with warning when a mean result falls in the range from ±20% to ±30% of the reference value (i.e., 20% < bias < 30%). If the bias is greater than 30%, the results are deemed not acceptable.
For the primary laboratory, 16 out of 18 analytes met the specified acceptance criteria. Two analytes did not meet the specified acceptance criteria for the following reason:
1. Teledyne Brown Engineering’s ERA November 2010 Sr-89 in water
result of 77.8 pCi/L was higher than the known value of 68.5 pCi/L, resulting in a found to known ratio of 1.14. NCR 10-09 was initiated to investigate this failure. Since the ratio of 1.14 fell within an acceptance range of 20%, Teledyne considers this an acceptable result.
2. Teledyne Brown Engineering’s ERA November 2010 Zn-65 in water result of 11.0 pCi/L was lower than the known value of 102 pCi/L. NCR 10-09 was initiated to investigate this failure. The Zn-65 result of 111 was incorrectly reported as 11.0.
For the secondary laboratory, Environmental, Inc., 14 out of 14 analytes met the specified acceptance criteria. The Inter-Laboratory Comparison Program provides evidence of “in control” counting systems and methods, and that the laboratories are producing accurate and reliable data.

Intentionally left blank
APPENDIX A
RADIOLOGICAL ENVIRONMENTAL MONITORING REPORT SUMMARY

* TH
E M
EAN
AN
D 2
STA
ND
ARD
DEV
IATI
ON
VAL
UES
AR
E C
ALC
ULA
TED
USI
NG
BO
TH T
HE
MD
As A
ND
TH
E PO
SITI
VE V
ALU
ESFR
ACTI
ON
OF
DET
ECTA
BLE
MEA
SUR
EMEN
TS A
T SP
ECIF
IED
LO
CAT
ION
S IS
IND
ICAT
ED IN
PAR
ENTH
ESES
(F)
TA
BL
E A
-1 R
AD
IOL
OG
ICA
L E
NV
IRO
NM
EN
TA
L M
ON
ITO
RIN
G P
RO
GR
AM
AN
NU
AL
SU
MM
AR
Y F
OR
TH
E Z
ION
NU
CL
ER
PO
WE
R S
TA
TIO
N, 2
010
Nam
e of
Fac
ility
:ZI
ON
DO
CK
ET
NU
MB
ER
:50
-295
& 5
0-30
4L
ocat
ion
of F
acili
ty:
ZIO
N I
LR
EPO
RT
ING
PE
RIO
D:
AN
NU
AL
201
0IN
DIC
AT
OR
CO
NT
RO
LL
OC
AT
ION
WIT
H H
IGH
EST
AN
NU
AL
ME
AN
(M)
LO
CA
TIO
NS
LO
CA
TIO
NM
EDIU
M O
RTY
PES
OF
NU
MB
ER O
FR
EQU
IRED
MEA
N (M
)M
EAN
(M)
MEA
N (M
)ST
ATI
ON
#N
UM
BER
OF
PATH
WA
Y S
AM
PLED
AN
ALY
SIS
AN
ALY
SIS
LOW
ER L
IMIT
(F)
(F)
(F)
NA
ME
NO
NR
OU
TIN
E(U
NIT
OF
PER
FOR
MED
PER
FOR
MED
OF
DET
ECTI
ON
RA
NG
ER
AN
GE
RA
NG
ED
ISTA
NC
E A
ND
DIR
ECTI
ON
REP
OR
TED
MEA
SUR
EMEN
T)(L
LD)
MEA
SUR
EMEN
TS
PUB
LIC
WA
TER
GR
-B48
43.
43.
33.
5Z-
15 IN
DIC
ATO
R0
(PC
I/LIT
ER)
(16/
24)
(19/
24)
(7/1
2)LA
KE
CO
UN
TY W
ATE
R W
OR
KS
(2.5
/4.7
)(2
.4/4
.7)
(2.8
/4.7
)1.
4 M
ILES
NN
W O
F SI
TE
H-3
1620
0<L
LD<L
LD-
0
GA
MM
A48
MN
-54
15<L
LD<L
LD-
0
CO
-58
15<L
LD<L
LD-
0
FE-5
930
<LLD
<LLD
-
0
CO
-60
15<L
LD<L
LD-
0
ZN-6
530
<LLD
<LLD
-
0
NB
-95
15<L
LD<L
LD-
0
A-1
* T H
E M
EAN
AN
D 2
STA
ND
ARD
DEV
IATI
ON
VAL
UES
AR
E C
ALC
ULA
TED
USI
NG
BO
TH T
HE
MD
As A
ND
TH
E PO
SITI
VE V
ALU
ESFR
ACTI
ON
OF
DET
ECTA
BLE
MEA
SUR
EMEN
TS A
T SP
ECIF
IED
LO
CAT
ION
S IS
IND
ICAT
ED IN
PAR
ENTH
ESES
(F)
TA
BL
E A
-1 R
AD
IOL
OG
ICA
L E
NV
IRO
NM
EN
TA
L M
ON
ITO
RIN
G P
RO
GR
AM
AN
NU
AL
SU
MM
AR
Y F
OR
TH
E Z
ION
NU
CL
ER
PO
WE
R S
TA
TIO
N, 2
010
Nam
e of
Fac
ility
:ZI
ON
DO
CK
ET
NU
MB
ER
:50
-295
& 5
0-30
4L
ocat
ion
of F
acili
ty:
ZIO
N I
LR
EPO
RT
ING
PE
RIO
D:
AN
NU
AL
201
0IN
DIC
AT
OR
CO
NT
RO
LL
OC
AT
ION
WIT
H H
IGH
EST
AN
NU
AL
ME
AN
(M)
LO
CA
TIO
NS
LO
CA
TIO
NM
EDIU
M O
RTY
PES
OF
NU
MB
ER O
FR
EQU
IRED
MEA
N (M
)M
EAN
(M)
MEA
N (M
)ST
ATI
ON
#N
UM
BER
OF
PATH
WA
Y S
AM
PLED
AN
ALY
SIS
AN
ALY
SIS
LOW
ER L
IMIT
(F)
(F)
(F)
NA
ME
NO
NR
OU
TIN
E(U
NIT
OF
PER
FOR
MED
PER
FOR
MED
OF
DET
ECTI
ON
RA
NG
ER
AN
GE
RA
NG
ED
ISTA
NC
E A
ND
DIR
ECTI
ON
REP
OR
TED
MEA
SUR
EMEN
T)(L
LD)
MEA
SUR
EMEN
TS
PUB
LIC
WA
TER
ZR-9
515
<LLD
<LLD
-
0(P
CI/L
ITER
)
CS-
134
15<L
LD<L
LD-
0
CS-
137
18<L
LD<L
LD-
0
BA
-140
NA
<LLD
<LLD
-
0
LA-1
40N
A<L
LD<L
LD-
0
FISH
GA
MM
A9
(PC
I/KG
WET
)M
N-5
413
0<L
LDN
A-
0
CO
-58
130
<LLD
NA
-
0
FE-5
926
0<L
LDN
A-
0
A-2
* TH
E M
EAN
AN
D 2
STA
ND
ARD
DEV
IATI
ON
VAL
UES
AR
E C
ALC
ULA
TED
USI
NG
BO
TH T
HE
MD
As A
ND
TH
E PO
SITI
VE V
ALU
ESFR
ACTI
ON
OF
DET
ECTA
BLE
MEA
SUR
EMEN
TS A
T SP
ECIF
IED
LO
CAT
ION
S IS
IND
ICAT
ED IN
PAR
ENTH
ESES
(F)
TA
BL
E A
-1 R
AD
IOL
OG
ICA
L E
NV
IRO
NM
EN
TA
L M
ON
ITO
RIN
G P
RO
GR
AM
AN
NU
AL
SU
MM
AR
Y F
OR
TH
E Z
ION
NU
CL
ER
PO
WE
R S
TA
TIO
N, 2
010
Nam
e of
Fac
ility
:ZI
ON
DO
CK
ET
NU
MB
ER
:50
-295
& 5
0-30
4L
ocat
ion
of F
acili
ty:
ZIO
N I
LR
EPO
RT
ING
PE
RIO
D:
AN
NU
AL
201
0IN
DIC
AT
OR
CO
NT
RO
LL
OC
AT
ION
WIT
H H
IGH
EST
AN
NU
AL
ME
AN
(M)
LO
CA
TIO
NS
LO
CA
TIO
NM
EDIU
M O
RTY
PES
OF
NU
MB
ER O
FR
EQU
IRED
MEA
N (M
)M
EAN
(M)
MEA
N (M
)ST
ATI
ON
#N
UM
BER
OF
PATH
WA
Y S
AM
PLED
AN
ALY
SIS
AN
ALY
SIS
LOW
ER L
IMIT
(F)
(F)
(F)
NA
ME
NO
NR
OU
TIN
E(U
NIT
OF
PER
FOR
MED
PER
FOR
MED
OF
DET
ECTI
ON
RA
NG
ER
AN
GE
RA
NG
ED
ISTA
NC
E A
ND
DIR
ECTI
ON
REP
OR
TED
MEA
SUR
EMEN
T)(L
LD)
MEA
SUR
EMEN
TS
FISH
CO
-60
130
<LLD
NA
-
0(P
CI/K
G W
ET)
ZN-6
526
0<L
LDN
A-
0
NB
-95
NA
<LLD
NA
-
0
ZR-9
5N
A<L
LDN
A-
0
CS-
134
100
<LLD
NA
-
0
CS-
137
100
<LLD
NA
-
0
BA
-140
NA
<LLD
NA
-
0
LA-1
40N
A<L
LDN
A-
0
A-3

* TH
E M
EAN
AN
D 2
STA
ND
ARD
DEV
IATI
ON
VAL
UES
AR
E C
ALC
ULA
TED
USI
NG
BO
TH T
HE
MD
As A
ND
TH
E PO
SITI
VE V
ALU
ESFR
ACTI
ON
OF
DET
ECTA
BLE
MEA
SUR
EMEN
TS A
T SP
ECIF
IED
LO
CAT
ION
S IS
IND
ICAT
ED IN
PAR
ENTH
ESES
(F)
TA
BL
E A
-1 R
AD
IOL
OG
ICA
L E
NV
IRO
NM
EN
TA
L M
ON
ITO
RIN
G P
RO
GR
AM
AN
NU
AL
SU
MM
AR
Y F
OR
TH
E Z
ION
NU
CL
ER
PO
WE
R S
TA
TIO
N, 2
010
Nam
e of
Fac
ility
:ZI
ON
DO
CK
ET
NU
MB
ER
:50
-295
& 5
0-30
4L
ocat
ion
of F
acili
ty:
ZIO
N I
LR
EPO
RT
ING
PE
RIO
D:
AN
NU
AL
201
0IN
DIC
AT
OR
CO
NT
RO
LL
OC
AT
ION
WIT
H H
IGH
EST
AN
NU
AL
ME
AN
(M)
LO
CA
TIO
NS
LO
CA
TIO
NM
EDIU
M O
RTY
PES
OF
NU
MB
ER O
FR
EQU
IRED
MEA
N (M
)M
EAN
(M)
MEA
N (M
)ST
ATI
ON
#N
UM
BER
OF
PATH
WA
Y S
AM
PLED
AN
ALY
SIS
AN
ALY
SIS
LOW
ER L
IMIT
(F)
(F)
(F)
NA
ME
NO
NR
OU
TIN
E(U
NIT
OF
PER
FOR
MED
PER
FOR
MED
OF
DET
ECTI
ON
RA
NG
ER
AN
GE
RA
NG
ED
ISTA
NC
E A
ND
DIR
ECTI
ON
REP
OR
TED
MEA
SUR
EMEN
T)(L
LD)
MEA
SUR
EMEN
TS
SED
IMEN
TG
AM
MA
2(P
CI/K
G D
RY
)M
N-5
4N
A<L
LDN
A-
0
CO
-58
NA
<LLD
NA
-
0
FE-5
9N
A<L
LDN
A-
0
CO
-60
NA
<LLD
NA
-
0
ZN-6
5N
A<L
LDN
A-
0
NB
-95
NA
<LLD
NA
-
0
ZR-9
5N
A<L
LDN
A-
0
CS-
134
150
<LLD
NA
-
0
A-4
* TH
E M
EAN
AN
D 2
STA
ND
ARD
DEV
IATI
ON
VAL
UES
AR
E C
ALC
ULA
TED
USI
NG
BO
TH T
HE
MD
As A
ND
TH
E PO
SITI
VE V
ALU
ESFR
ACTI
ON
OF
DET
ECTA
BLE
MEA
SUR
EMEN
TS A
T SP
ECIF
IED
LO
CAT
ION
S IS
IND
ICAT
ED IN
PAR
ENTH
ESES
(F)
TA
BL
E A
-1 R
AD
IOL
OG
ICA
L E
NV
IRO
NM
EN
TA
L M
ON
ITO
RIN
G P
RO
GR
AM
AN
NU
AL
SU
MM
AR
Y F
OR
TH
E Z
ION
NU
CL
ER
PO
WE
R S
TA
TIO
N, 2
010
Nam
e of
Fac
ility
:ZI
ON
DO
CK
ET
NU
MB
ER
:50
-295
& 5
0-30
4L
ocat
ion
of F
acili
ty:
ZIO
N I
LR
EPO
RT
ING
PE
RIO
D:
AN
NU
AL
201
0IN
DIC
AT
OR
CO
NT
RO
LL
OC
AT
ION
WIT
H H
IGH
EST
AN
NU
AL
ME
AN
(M)
LO
CA
TIO
NS
LO
CA
TIO
NM
EDIU
M O
RTY
PES
OF
NU
MB
ER O
FR
EQU
IRED
MEA
N (M
)M
EAN
(M)
MEA
N (M
)ST
ATI
ON
#N
UM
BER
OF
PATH
WA
Y S
AM
PLED
AN
ALY
SIS
AN
ALY
SIS
LOW
ER L
IMIT
(F)
(F)
(F)
NA
ME
NO
NR
OU
TIN
E(U
NIT
OF
PER
FOR
MED
PER
FOR
MED
OF
DET
ECTI
ON
RA
NG
ER
AN
GE
RA
NG
ED
ISTA
NC
E A
ND
DIR
ECTI
ON
REP
OR
TED
MEA
SUR
EMEN
T)(L
LD)
MEA
SUR
EMEN
TS
SED
IMEN
TC
S-13
718
0<L
LDN
A-
0
(PC
I/KG
DR
Y)
BA
-140
NA
<LLD
NA
-
0
LA-1
40N
A<L
LDN
A-
0
AIR
PA
RTI
CU
LATE
GR
-B15
610
17N
A17
Z-03
IND
ICA
TOR
0(E
-3 P
CI/C
U.M
ETER
)(1
56/1
56)
(52/
52)
ON
SITE
3(7
/43)
(8/4
3)0.
2 M
ILES
NN
W O
F SI
TE
GA
MM
A12
MN
-54
NA
<LLD
NA
-
0
CO
-58
NA
<LLD
NA
-
0
FE-5
9N
A<L
LDN
A-
0
CO
-60
NA
<LLD
NA
-
0
A-5
* TH
E M
EAN
AN
D 2
STA
ND
ARD
DEV
IATI
ON
VAL
UES
AR
E C
ALC
ULA
TED
USI
NG
BO
TH T
HE
MD
As A
ND
TH
E PO
SITI
VE V
ALU
ESFR
ACTI
ON
OF
DET
ECTA
BLE
MEA
SUR
EMEN
TS A
T SP
ECIF
IED
LO
CAT
ION
S IS
IND
ICAT
ED IN
PAR
ENTH
ESES
(F)
TA
BL
E A
-1 R
AD
IOL
OG
ICA
L E
NV
IRO
NM
EN
TA
L M
ON
ITO
RIN
G P
RO
GR
AM
AN
NU
AL
SU
MM
AR
Y F
OR
TH
E Z
ION
NU
CL
ER
PO
WE
R S
TA
TIO
N, 2
010
Nam
e of
Fac
ility
:ZI
ON
DO
CK
ET
NU
MB
ER
:50
-295
& 5
0-30
4L
ocat
ion
of F
acili
ty:
ZIO
N I
LR
EPO
RT
ING
PE
RIO
D:
AN
NU
AL
201
0IN
DIC
AT
OR
CO
NT
RO
LL
OC
AT
ION
WIT
H H
IGH
EST
AN
NU
AL
ME
AN
(M)
LO
CA
TIO
NS
LO
CA
TIO
NM
EDIU
M O
RTY
PES
OF
NU
MB
ER O
FR
EQU
IRED
MEA
N (M
)M
EAN
(M)
MEA
N (M
)ST
ATI
ON
#N
UM
BER
OF
PATH
WA
Y S
AM
PLED
AN
ALY
SIS
AN
ALY
SIS
LOW
ER L
IMIT
(F)
(F)
(F)
NA
ME
NO
NR
OU
TIN
E(U
NIT
OF
PER
FOR
MED
PER
FOR
MED
OF
DET
ECTI
ON
RA
NG
ER
AN
GE
RA
NG
ED
ISTA
NC
E A
ND
DIR
ECTI
ON
REP
OR
TED
MEA
SUR
EMEN
T)(L
LD)
MEA
SUR
EMEN
TS
AIR
PA
RTI
CU
LATE
ZN-6
5N
A<L
LDN
A-
0
(E-3
PC
I/CU
.MET
ER)
NB
-95
NA
<LLD
NA
-
0
ZR-9
5N
A<L
LDN
A-
0
CS-
134
10<L
LDN
A-
0
CS-
137
10<L
LDN
A-
0
BA
-140
NA
<LLD
NA
-
0
LA-1
40N
A<L
LDN
A-
0
DIR
ECT
RA
DIA
TIO
NTL
D-Q
UA
RTE
RLY
144
NA
20.2
NA
23.0
Z-30
1-2
IND
ICA
TOR
0(M
ILLI
-RO
ENTG
EN/Q
TR.)
(144
/144
)(4
/4)
0.5
MIL
ES N
W(1
5/27
)(2
0/27
)
A-6
APPENDIX B
LOCATION DESIGNATION, DISTANCE & DIRECTION, AND SAMPLE COLLECTION & ANALYTICAL METHODS

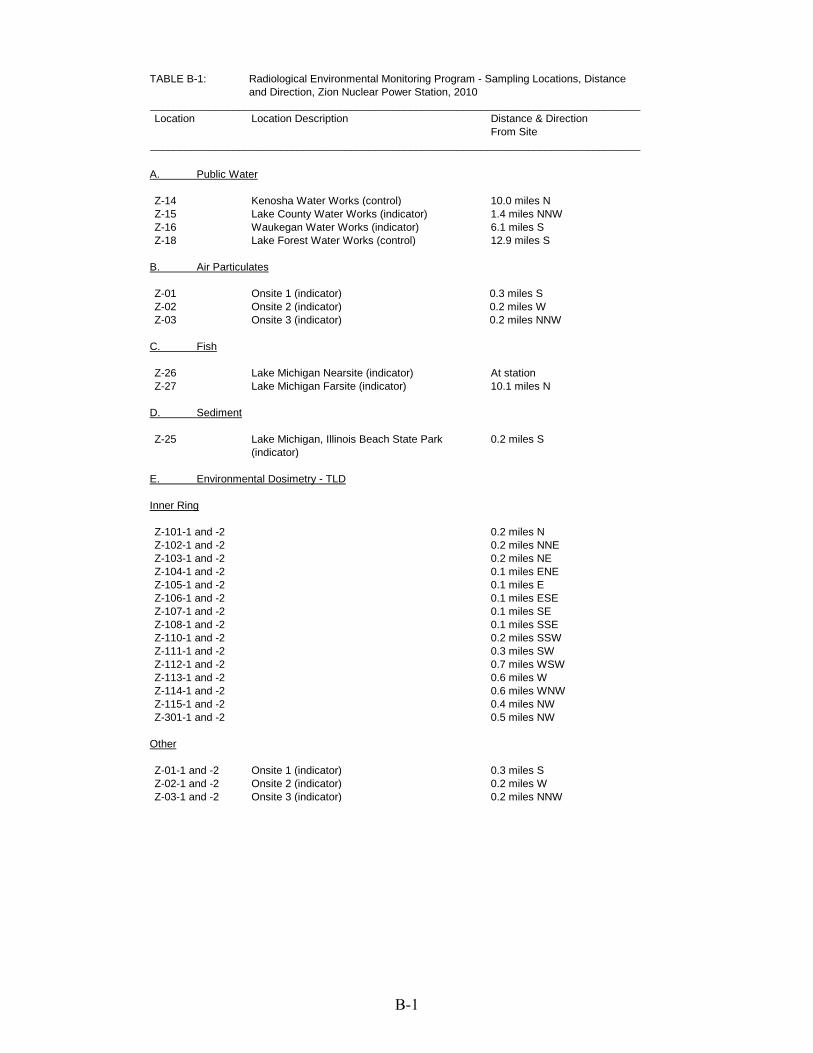
TABLE B-1: Radiological Environmental Monitoring Program - Sampling Locations, Distance and Direction, Zion Nuclear Power Station, 2010
___________________________________________________________________________________ Location Location Description Distance & Direction
From Site ___________________________________________________________________________________
A. Public Water
Z-14 Kenosha Water Works (control) 10.0 miles N Z-15 Lake County Water Works (indicator) 1.4 miles NNW Z-16 Waukegan Water Works (indicator) 6.1 miles S Z-18 Lake Forest Water Works (control) 12.9 miles S
B. Air Particulates
Z-01 Onsite 1 (indicator) 0.3 miles S Z-02 Onsite 2 (indicator) 0.2 miles W Z-03 Onsite 3 (indicator) 0.2 miles NNW
C. Fish
Z-26 Lake Michigan Nearsite (indicator) At station Z-27 Lake Michigan Farsite (indicator) 10.1 miles N
D. Sediment
Z-25 Lake Michigan, Illinois Beach State Park
(indicator) 0.2 miles S
E. Environmental Dosimetry - TLD
Inner Ring
Z-101-1 and -2 0.2 miles N Z-102-1 and -2 0.2 miles NNE Z-103-1 and -2 0.2 miles NE Z-104-1 and -2 0.1 miles ENE Z-105-1 and -2 0.1 miles E Z-106-1 and -2 0.1 miles ESE Z-107-1 and -2 0.1 miles SE Z-108-1 and -2 0.1 miles SSE Z-110-1 and -2 0.2 miles SSW Z-111-1 and -2 0.3 miles SW Z-112-1 and -2 0.7 miles WSW Z-113-1 and -2 0.6 miles W Z-114-1 and -2 0.6 miles WNW Z-115-1 and -2 0.4 miles NW Z-301-1 and -2 0.5 miles NW
Other
Z-01-1 and -2 Onsite 1 (indicator) 0.3 miles S Z-02-1 and -2 Onsite 2 (indicator) 0.2 miles W Z-03-1 and -2 Onsite 3 (indicator) 0.2 miles NNW
B-1
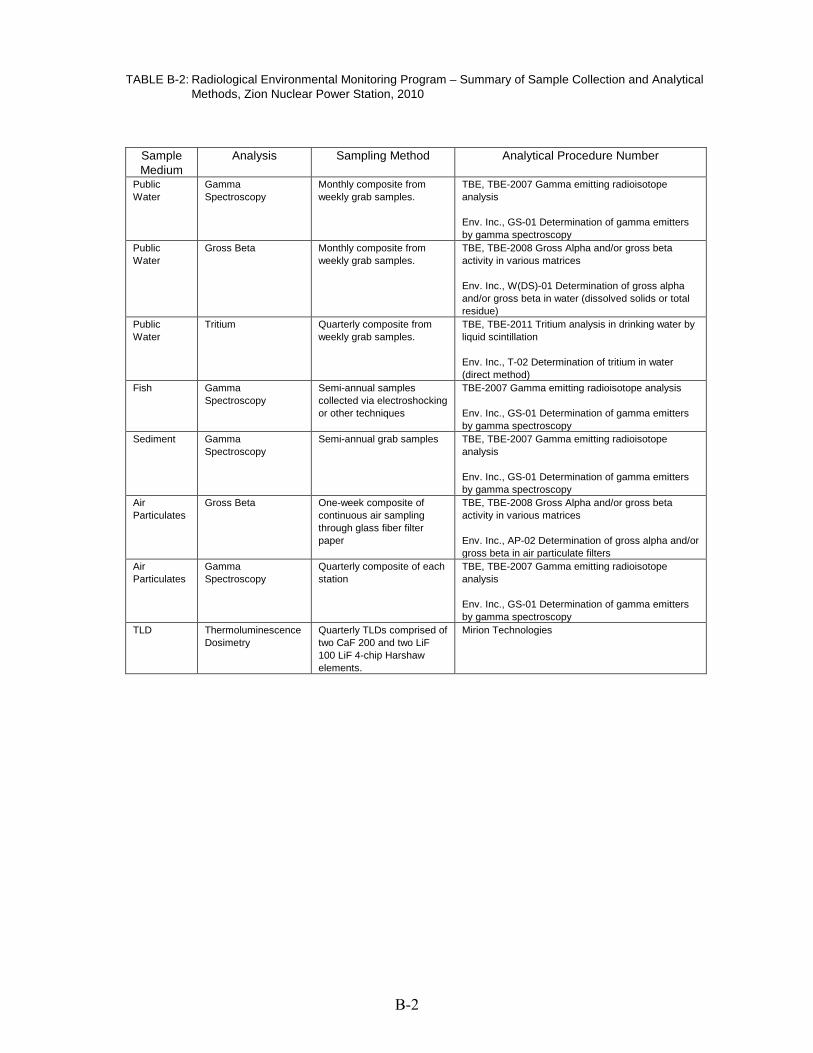
TABLE B-2: Radiological Environmental Monitoring Program – Summary of Sample Collection and Analytical Methods, Zion Nuclear Power Station, 2010
Sample Medium
Analysis Sampling Method Analytical Procedure Number
Public Water
Gamma Spectroscopy
Monthly composite from weekly grab samples.
TBE, TBE-2007 Gamma emitting radioisotope analysis Env. Inc., GS-01 Determination of gamma emitters by gamma spectroscopy
Public Water
Gross Beta Monthly composite from weekly grab samples.
TBE, TBE-2008 Gross Alpha and/or gross beta activity in various matrices Env. Inc., W(DS)-01 Determination of gross alpha and/or gross beta in water (dissolved solids or total residue)
Public Water
Tritium Quarterly composite from weekly grab samples.
TBE, TBE-2011 Tritium analysis in drinking water by liquid scintillation Env. Inc., T-02 Determination of tritium in water (direct method)
Fish Gamma Spectroscopy
Semi-annual samples collected via electroshocking or other techniques
TBE-2007 Gamma emitting radioisotope analysis Env. Inc., GS-01 Determination of gamma emitters by gamma spectroscopy
Sediment Gamma Spectroscopy
Semi-annual grab samples TBE, TBE-2007 Gamma emitting radioisotope analysis Env. Inc., GS-01 Determination of gamma emitters by gamma spectroscopy
Air Particulates
Gross Beta One-week composite of continuous air sampling through glass fiber filter paper
TBE, TBE-2008 Gross Alpha and/or gross beta activity in various matrices Env. Inc., AP-02 Determination of gross alpha and/or gross beta in air particulate filters
Air Particulates
Gamma Spectroscopy
Quarterly composite of each station
TBE, TBE-2007 Gamma emitting radioisotope analysis Env. Inc., GS-01 Determination of gamma emitters by gamma spectroscopy
TLD Thermoluminescence Dosimetry
Quarterly TLDs comprised of two CaF 200 and two LiF 100 LiF 4-chip Harshaw elements.
Mirion Technologies
B-2
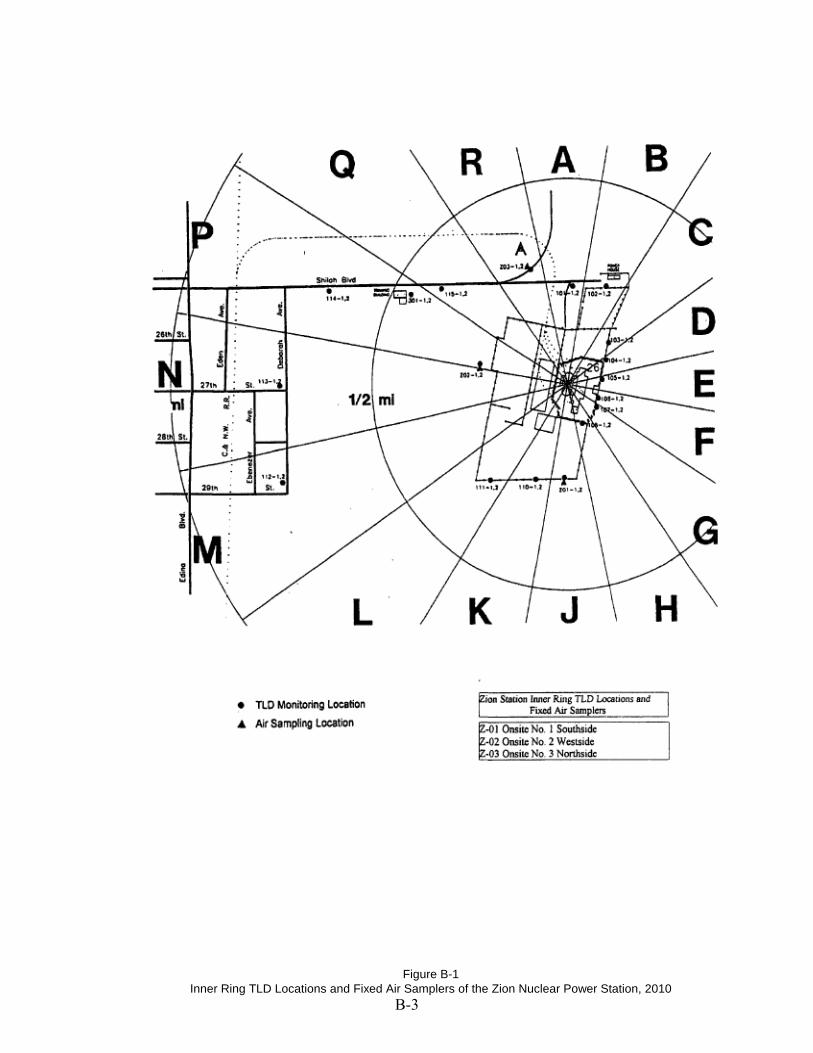
Figure B-1 Inner Ring TLD Locations and Fixed Air Samplers of the Zion Nuclear Power Station, 2010
B-3
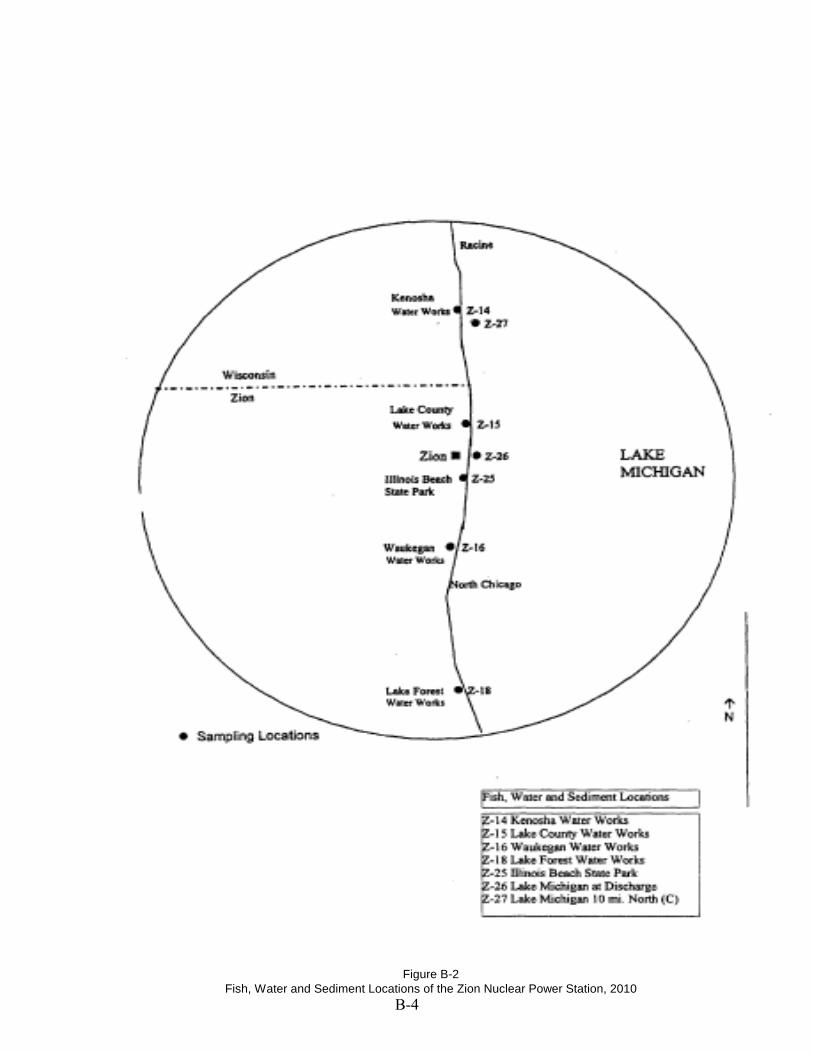
Figure B-2 Fish, Water and Sediment Locations of the Zion Nuclear Power Station, 2010
B-4
APPENDIX C
DATA TABLES PRIMARY LABORATORY

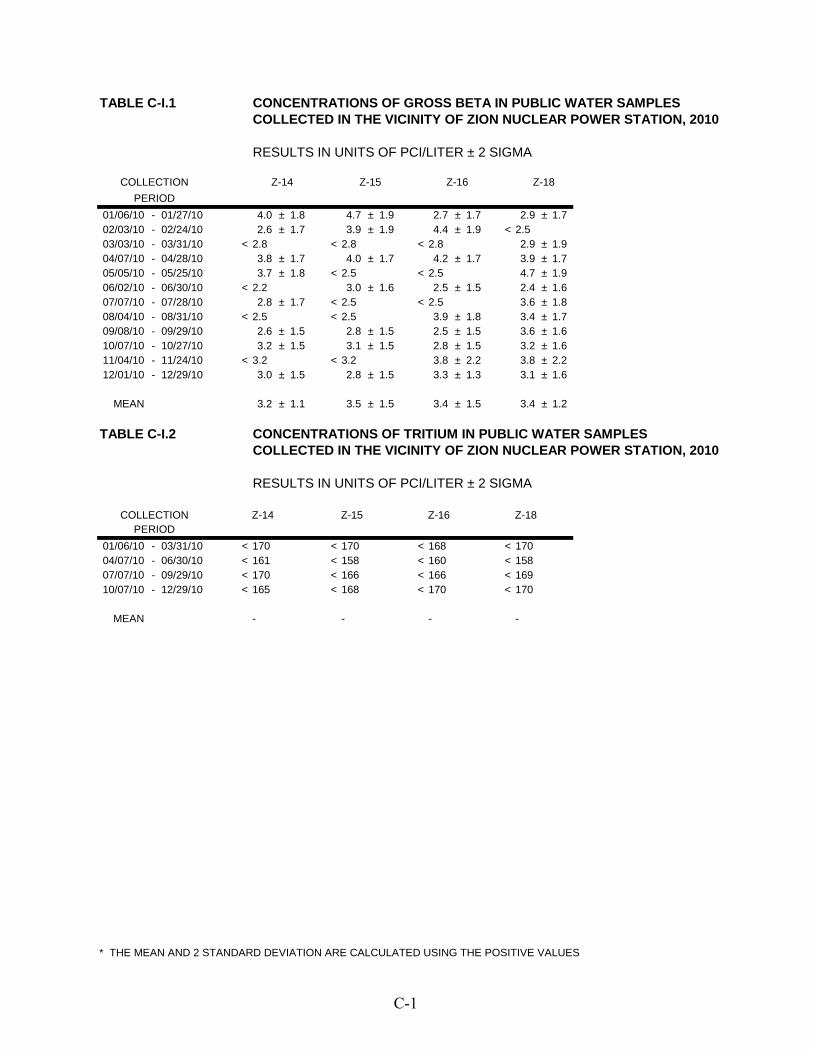
TABLE C-I.1 CONCENTRATIONS OF GROSS BETA IN PUBLIC WATER SAMPLESCOLLECTED IN THE VICINITY OF ZION NUCLEAR POWER STATION, 2010
RESULTS IN UNITS OF PCI/LITER ± 2 SIGMA
COLLECTION Z-14 Z-15 Z-16 Z-18PERIOD
01/06/10 - 01/27/10 4.0 ± 1.8 4.7 ± 1.9 2.7 ± 1.7 2.9 ± 1.702/03/10 - 02/24/10 2.6 ± 1.7 3.9 ± 1.9 4.4 ± 1.9 < 2.503/03/10 - 03/31/10 < 2.8 < 2.8 < 2.8 2.9 ± 1.904/07/10 - 04/28/10 3.8 ± 1.7 4.0 ± 1.7 4.2 ± 1.7 3.9 ± 1.705/05/10 - 05/25/10 3.7 ± 1.8 < 2.5 < 2.5 4.7 ± 1.906/02/10 - 06/30/10 < 2.2 3.0 ± 1.6 2.5 ± 1.5 2.4 ± 1.607/07/10 - 07/28/10 2.8 ± 1.7 < 2.5 < 2.5 3.6 ± 1.808/04/10 - 08/31/10 < 2.5 < 2.5 3.9 ± 1.8 3.4 ± 1.709/08/10 - 09/29/10 2.6 ± 1.5 2.8 ± 1.5 2.5 ± 1.5 3.6 ± 1.610/07/10 - 10/27/10 3.2 ± 1.5 3.1 ± 1.5 2.8 ± 1.5 3.2 ± 1.611/04/10 - 11/24/10 < 3.2 < 3.2 3.8 ± 2.2 3.8 ± 2.212/01/10 - 12/29/10 3.0 ± 1.5 2.8 ± 1.5 3.3 ± 1.3 3.1 ± 1.6
MEAN 3.2 ± 1.1 3.5 ± 1.5 3.4 ± 1.5 3.4 ± 1.2
TABLE C-I.2 CONCENTRATIONS OF TRITIUM IN PUBLIC WATER SAMPLESCOLLECTED IN THE VICINITY OF ZION NUCLEAR POWER STATION, 2010
RESULTS IN UNITS OF PCI/LITER ± 2 SIGMA
COLLECTION Z-14 Z-15 Z-16 Z-18PERIOD
01/06/10 - 03/31/10 < 170 < 170 < 168 < 17004/07/10 - 06/30/10 < 161 < 158 < 160 < 15807/07/10 - 09/29/10 < 170 < 166 < 166 < 16910/07/10 - 12/29/10 < 165 < 168 < 170 < 170
MEAN - - - -
* THE MEAN AND 2 STANDARD DEVIATION ARE CALCULATED USING THE POSITIVE VALUES
C-1

TAB
LE C
-I.3
CO
NC
ENTR
ATIO
NS
OF
GAM
MM
A EM
ITTE
RS
IN P
UB
LIC
WAT
ER S
AMPL
ESC
OLL
ECTE
D IN
TH
E VI
CIN
ITY
OF
ZIO
N N
UC
LEAR
PO
WER
STA
TIO
N, 2
010
RES
ULT
S IN
UN
ITS
OF
PCI/L
ITER
± 2
SIG
MA
STC
CO
LLE
CTI
ON
Mn-
54C
o-58
Fe-5
9C
o-60
Zn-6
5N
b-95
Zr-9
5C
s-13
4C
s-13
7B
a-14
0La
-140
PE
RIO
DZ-
1401
/06/
10-
01/2
7/10
<4
<6
<9
<4
<11
<6
<8
<5
<6
<35
<10
02/0
3/10
-02
/24/
10<
3<
3<
7<
3<
6<
3<
6<
3<
3<
25<
803
/03/
10-
03/3
1/10
<1
<1
<2
<1
<1
<1
<1
<0
<1
<16
<6
04/0
7/10
-04
/28/
10<
5<
7<
17<
5<
10<
6<
11<
4<
5<
66<
2405
/05/
10-
05/2
5/10
<4
<4
<10
<3
<8
<5
<7
<3
<4
<47
<15
06/0
2/10
-06
/30/
10<
4<
5<
11<
4<
9<
6<
8<
4<
5<
44<
1207
/07/
10-
07/2
8/10
<3
<3
<9
<3
<6
<4
<6
<3
<3
<29
<11
08/0
4/10
-08
/31/
10<
5<
7<
22<
7<
14<
7<
14<
6<
6<
86<
2409
/08/
10-
09/2
9/10
<3
<5
<15
<2
<5
<6
<9
<2
<2
<10
40<
309
10/0
7/10
-10
/27/
10<
5<
7<
25<
5<
10<
10<
14<
5<
5<
517
<15
811
/04/
10-
11/2
4/10
<4
<5
<16
<3
<9
<7
<12
<4
<4
<11
8<
4212
/01/
10-
12/2
9/10
<5
<6
<15
<4
<9
<6
<11
<6
<6
<51
<14
ME
AN
--
--
--
--
--
-
Z-15
01/0
6/10
-01
/27/
10<
9<
6<
17<
6<
13<
8<
15<
6<
8<
56<
1902
/03/
10-
02/2
4/10
<3
<3
<7
<3
<7
<4
<6
<3
<4
<28
<9
03/0
3/10
-03
/31/
10<
1<
1<
3<
1<
2<
1<
2<
1<
1<
23<
704
/07/
10-
04/2
8/10
<5
<6
<14
<5
<10
<6
<11
<4
<5
<64
<23
05/0
5/10
-05
/25/
10<
4<
5<
12<
4<
8<
5<
9<
5<
5<
67<
1806
/02/
10-
06/3
0/10
<4
<6
<13
<5
<11
<7
<9
<5
<5
<48
<16
07/0
7/10
-07
/28/
10<
6<
7<
13<
6<
14<
6<
15<
5<
7<
63<
2108
/04/
10-
08/3
1/10
<5
<7
<13
<6
<10
<6
<8
<4
<6
<81
<21
09/0
8/10
-09
/29/
10<
3<
6<
21<
3<
7<
7<
12<
3<
3<
1190
<41
210
/07/
10-
10/2
7/10
<4
<8
<23
<4
<11
<9
<13
<5
<4
<41
3<
127
11/0
4/10
-11
/24/
10<
6<
7<
17<
4<
12<
8<
12<
5<
5<
171
<45
12/0
1/10
-12
/29/
10<
5<
6<
11<
5<
10<
5<
10<
5<
4<
51<
18
ME
AN
--
--
--
--
--
-
C-2
TAB
LE C
-I.3
CO
NC
ENTR
ATIO
NS
OF
GAM
MM
A EM
ITTE
RS
IN P
UB
LIC
WAT
ER S
AMPL
ESC
OLL
ECTE
D IN
TH
E VI
CIN
ITY
OF
ZIO
N N
UC
LEAR
PO
WER
STA
TIO
N, 2
010
RES
ULT
S IN
UN
ITS
OF
PCI/L
ITER
± 2
SIG
MA
STC
CO
LLE
CTI
ON
Mn-
54C
o-58
Fe-5
9C
o-60
Zn-6
5N
b-95
Zr-9
5C
s-13
4C
s-13
7B
a-14
0La
-140
PE
RIO
DZ-
1601
/06/
10-
01/2
7/10
<7
<7
<16
<5
<11
<8
<16
<7
<9
<47
<18
02/0
3/10
-02
/24/
10<
2<
2<
4<
2<
4<
2<
4<
2<
2<
15<
503
/03/
10-
03/3
1/10
<1
<1
<4
<1
<2
<2
<3
<1
<1
<33
<11
04/0
7/10
-04
/28/
10<
6<
7<
16<
6<
11<
7<
13<
7<
6<
88<
2405
/05/
10-
05/2
5/10
<3
<4
<9
<3
<6
<4
<6
<3
<3
<42
<14
06/0
2/10
-06
/30/
10<
7<
8<
18<
6<
15<
7<
14<
8<
7<
73<
2107
/07/
10-
07/2
8/10
<6
<7
<17
<5
<13
<7
<10
<6
<6
<57
<16
08/0
4/10
-08
/31/
10<
5<
7<
11<
6<
11<
7<
13<
5<
5<
74<
2909
/08/
10-
09/2
9/10
<3
<6
<18
<2
<6
<6
<11
<3
<3
<12
30<
409
10/0
7/10
-10
/27/
10<
5<
8<
20<
4<
9<
9<
13<
4<
4<
469
<14
211
/04/
10-
11/2
4/10
<6
<8
<17
<6
<10
<9
<13
<6
<7
<18
6<
5212
/01/
10-
12/2
9/10
<5
<6
<14
<5
<11
<6
<11
<5
<6
<58
<15
ME
AN
--
--
--
--
--
-
Z-18
01/0
6/10
-01
/27/
10<
8<
9<
15<
7<
15<
6<
13<
5<
7<
42<
1702
/03/
10-
02/2
4/10
<2
<2
<5
<2
<4
<2
<4
<2
<2
<17
<5
03/0
3/10
-03
/31/
10<
4<
6<
16<
5<
8<
7<
11<
4<
5<
148
<41
04/0
7/10
-04
/28/
10<
6<
6<
18<
8<
10<
8<
12<
5<
5<
90<
2905
/05/
10-
05/2
5/10
<3
<4
<9
<4
<7
<4
<7
<3
<3
<46
<15
06/0
2/10
-06
/30/
10<
4<
7<
13<
6<
12<
7<
12<
5<
5<
50<
1407
/07/
10-
07/2
8/10
<7
<7
<17
<6
<11
<9
<12
<6
<7
<65
<24
08/0
4/10
-08
/31/
10<
6<
4<
14<
5<
9<
6<
11<
5<
5<
74<
2509
/08/
10-
09/2
9/10
<3
<5
<17
<3
<7
<7
<12
<3
<2
<12
00<
353
10/0
7/10
-10
/27/
10<
4<
7<
18<
4<
10<
8<
13<
4<
4<
412
<99
11/0
4/10
-11
/24/
10<
5<
8<
16<
4<
11<
8<
13<
5<
5<
153
<55
12/0
1/10
-12
/29/
10<
5<
6<
10<
6<
11<
7<
9<
5<
5<
62<
17
ME
AN
--
--
--
--
--
-
C-3
TAB
LE C
-II.1
CO
NC
ENTR
ATIO
NS
OF
GAM
MM
A EM
ITTE
RS
IN F
ISH
SAM
PLES
CO
LLEC
TED
IN T
HE
VIC
INIT
Y O
F ZI
ON
NU
CLE
AR P
OW
ER S
TATI
ON
, 201
0
RES
ULT
S IN
UN
ITS
OF
PCI/K
G W
ET ±
2 S
IGM
A
STC
CO
LLE
CTI
ON
Mn-
54C
o-58
Fe-5
9C
o-60
Zn-6
5N
b-95
Zr-9
5C
s-13
4C
s-13
7B
a-14
0La
-140
PE
RIO
D
Z-26
Lake
Tro
ut05
/05/
10<
64<
84<
215
<96
<13
8<
78<
182
<68
<93
<93
0<
290
Lake
Tro
ut05
/25/
10<
85<
101
<25
4<
75<
176
<11
8<
183
<77
<90
<19
80<
632
Roc
k B
ass
10/0
7/10
<82
<13
0<
461
<59
<15
3<
133
<25
6<
64<
60<
2640
0<
8510
Com
mon
Car
p10
/19/
10<
62<
98<
277
<69
<12
0<
111
<20
8<
49<
55<
1240
0<
3790
Kin
g S
alm
on10
/19/
10<
57<
85<
264
<50
<10
9<
112
<10
4<
42<
57<
9640
<29
00
ME
AN
--
--
--
--
--
-
Z-27
Lake
Tro
ut05
/13/
10<
60<
85<
188
<56
<15
0<
89<
142
<68
<68
<20
10<
490
Com
mon
Car
p05
/26/
10<
31<
31<
77<
31<
62<
29<
62<
28<
28<
356
<15
9La
ke T
rout
10/1
9/10
<60
<84
<31
9<
60<
103
<11
8<
184
<52
<63
<11
000
<36
10Lo
ngno
se S
ucke
r10
/19/
10<
50<
77<
226
<52
<12
8<
115
<17
0<
47<
49<
8710
<34
20
ME
AN
--
--
--
--
--
-
C-4
TAB
LE C
-III.1
CO
NC
ENTR
ATI
ON
S O
F G
AM
MM
A E
MIT
TER
S IN
SED
IMEN
T SA
MPL
ESC
OLL
ECTE
D IN
TH
E VI
CIN
ITY
OF
ZIO
N N
UC
LEA
R P
OW
ER S
TATI
ON
, 201
0
RE
SU
LTS
IN U
NIT
S O
F P
CI/K
G D
RY
± 2
SIG
MA
STC
CO
LLE
CTI
ON
Mn-
54C
o-58
Fe-5
9C
o-60
Zn-6
5N
b-95
Zr-9
5C
s-13
4C
s-13
7B
a-14
0La
-140
PE
RIO
D
Z-25
05/1
9/10
<44
<47
<13
8<
39<
116
<66
<10
5<
53<
41<
910
<21
210
/07/
10<
55<
115
<29
8<
63<
123
<13
1<
166
<42
<49
<17
500
<64
20
ME
AN
--
--
--
--
--
-
C-5
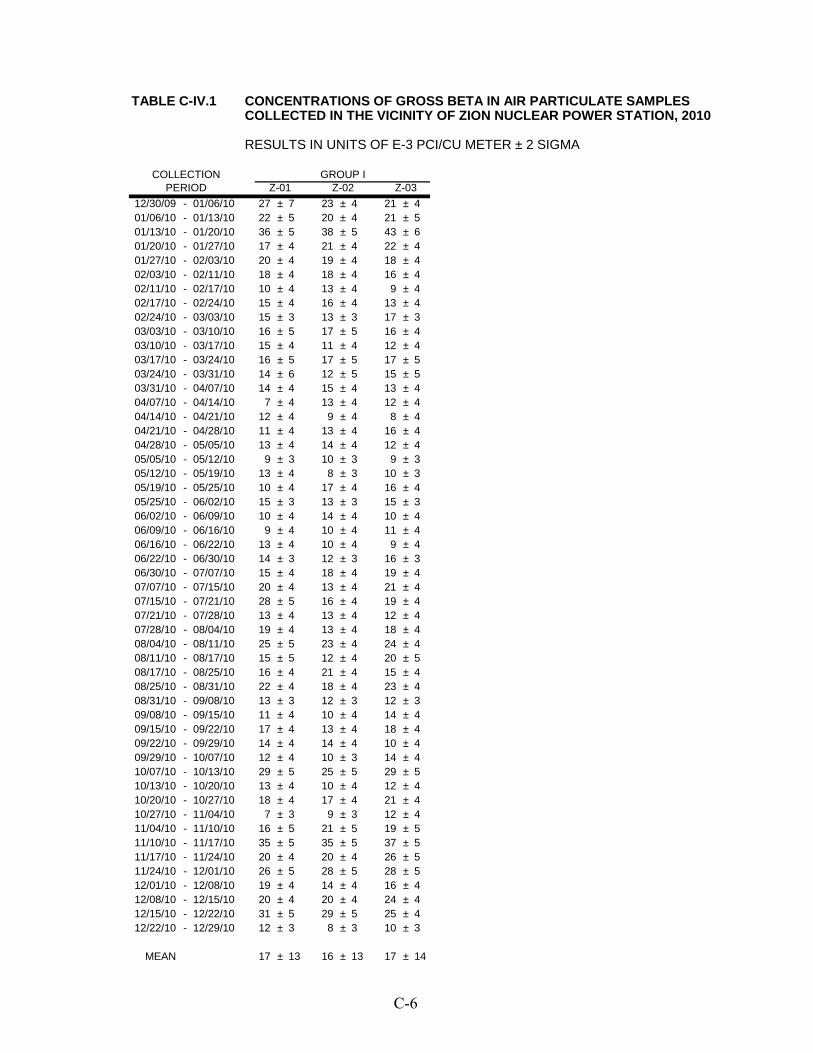
TABLE C-IV.1 CONCENTRATIONS OF GROSS BETA IN AIR PARTICULATE SAMPLESCOLLECTED IN THE VICINITY OF ZION NUCLEAR POWER STATION, 2010
RESULTS IN UNITS OF E-3 PCI/CU METER ± 2 SIGMA
COLLECTION GROUP IPERIOD Z-01 Z-02 Z-03
12/30/09 - 01/06/10 27 ± 7 23 ± 4 21 ± 401/06/10 - 01/13/10 22 ± 5 20 ± 4 21 ± 501/13/10 - 01/20/10 36 ± 5 38 ± 5 43 ± 601/20/10 - 01/27/10 17 ± 4 21 ± 4 22 ± 401/27/10 - 02/03/10 20 ± 4 19 ± 4 18 ± 402/03/10 - 02/11/10 18 ± 4 18 ± 4 16 ± 402/11/10 - 02/17/10 10 ± 4 13 ± 4 9 ± 402/17/10 - 02/24/10 15 ± 4 16 ± 4 13 ± 402/24/10 - 03/03/10 15 ± 3 13 ± 3 17 ± 303/03/10 - 03/10/10 16 ± 5 17 ± 5 16 ± 403/10/10 - 03/17/10 15 ± 4 11 ± 4 12 ± 403/17/10 - 03/24/10 16 ± 5 17 ± 5 17 ± 503/24/10 - 03/31/10 14 ± 6 12 ± 5 15 ± 503/31/10 - 04/07/10 14 ± 4 15 ± 4 13 ± 404/07/10 - 04/14/10 7 ± 4 13 ± 4 12 ± 404/14/10 - 04/21/10 12 ± 4 9 ± 4 8 ± 404/21/10 - 04/28/10 11 ± 4 13 ± 4 16 ± 404/28/10 - 05/05/10 13 ± 4 14 ± 4 12 ± 405/05/10 - 05/12/10 9 ± 3 10 ± 3 9 ± 305/12/10 - 05/19/10 13 ± 4 8 ± 3 10 ± 305/19/10 - 05/25/10 10 ± 4 17 ± 4 16 ± 405/25/10 - 06/02/10 15 ± 3 13 ± 3 15 ± 306/02/10 - 06/09/10 10 ± 4 14 ± 4 10 ± 406/09/10 - 06/16/10 9 ± 4 10 ± 4 11 ± 406/16/10 - 06/22/10 13 ± 4 10 ± 4 9 ± 406/22/10 - 06/30/10 14 ± 3 12 ± 3 16 ± 306/30/10 - 07/07/10 15 ± 4 18 ± 4 19 ± 407/07/10 - 07/15/10 20 ± 4 13 ± 4 21 ± 407/15/10 - 07/21/10 28 ± 5 16 ± 4 19 ± 407/21/10 - 07/28/10 13 ± 4 13 ± 4 12 ± 407/28/10 - 08/04/10 19 ± 4 13 ± 4 18 ± 408/04/10 - 08/11/10 25 ± 5 23 ± 4 24 ± 408/11/10 - 08/17/10 15 ± 5 12 ± 4 20 ± 508/17/10 - 08/25/10 16 ± 4 21 ± 4 15 ± 408/25/10 - 08/31/10 22 ± 4 18 ± 4 23 ± 408/31/10 - 09/08/10 13 ± 3 12 ± 3 12 ± 309/08/10 - 09/15/10 11 ± 4 10 ± 4 14 ± 409/15/10 - 09/22/10 17 ± 4 13 ± 4 18 ± 409/22/10 - 09/29/10 14 ± 4 14 ± 4 10 ± 409/29/10 - 10/07/10 12 ± 4 10 ± 3 14 ± 410/07/10 - 10/13/10 29 ± 5 25 ± 5 29 ± 510/13/10 - 10/20/10 13 ± 4 10 ± 4 12 ± 410/20/10 - 10/27/10 18 ± 4 17 ± 4 21 ± 410/27/10 - 11/04/10 7 ± 3 9 ± 3 12 ± 411/04/10 - 11/10/10 16 ± 5 21 ± 5 19 ± 511/10/10 - 11/17/10 35 ± 5 35 ± 5 37 ± 511/17/10 - 11/24/10 20 ± 4 20 ± 4 26 ± 511/24/10 - 12/01/10 26 ± 5 28 ± 5 28 ± 512/01/10 - 12/08/10 19 ± 4 14 ± 4 16 ± 412/08/10 - 12/15/10 20 ± 4 20 ± 4 24 ± 412/15/10 - 12/22/10 31 ± 5 29 ± 5 25 ± 412/22/10 - 12/29/10 12 ± 3 8 ± 3 10 ± 3
MEAN 17 ± 13 16 ± 13 17 ± 14
C-6
TAB
LE C
-IV.2
MO
NTH
LY A
ND
YEA
RLY
MEA
N V
ALU
ES O
F G
RO
SS B
ETA
CO
NC
ENTR
ATIO
NS
IN A
IRPA
RTI
CU
LATE
SAM
PLES
CO
LLEC
TED
IN T
HE
VIC
INIT
Y O
F ZI
ON
NU
CLE
AR P
OW
ER S
TATI
ON
, 201
0
RES
ULT
S IN
UN
ITS
OF
E-3
PCI/C
U M
ETER
± 2
SIG
MA
GR
OU
P I
- ON
SIT
E L
OC
ATI
ON
S
CO
LLE
CTI
ON
MIN
MA
XM
EA
N ±
PE
RIO
D2S
D12
/30/
09-
02/0
3/10
1743
24±
1602
/03/
10-
03/0
3/10
918
14±
603
/03/
10-
03/3
1/10
1117
15±
403
/31/
10-
04/2
8/10
716
12±
504
/28/
10-
06/0
2/10
817
12±
606
/02/
10-
06/3
0/10
916
11±
406
/30/
10-
07/2
8/10
1228
17±
907
/28/
10-
08/3
1/10
1225
19±
808
/31/
10-
09/2
9/10
1018
13±
509
/29/
10-
11/0
4/10
729
16±
1411
/04/
10-
12/0
1/10
1637
26±
1412
/01/
10-
12/2
9/10
831
19±
14
12/3
0/09
-12
/29/
107
4317
±13
C-7
TAB
LE C
-IV.3
CO
NC
ENTR
ATI
ON
S O
F G
AM
MA
EM
ITTE
RS
IN A
IR P
AR
TIC
ULA
TE S
AM
PLES
CO
LLEC
TED
IN T
HE
VIC
INIT
Y O
F ZI
ON
NU
CLE
AR
PO
WER
STA
TIO
N, 2
010
RE
SU
LTS
IN U
NIT
S O
F E
-3 P
CI/C
U M
ETE
R ±
2 S
IGM
A
STC
CO
LLE
CTI
ON
Mn-
54C
o-58
Fe-5
9C
o-60
Zn-6
5N
b-95
Zr-9
5C
s-13
4C
s-13
7B
a-14
0La
-140
PE
RIO
DZ-
0112
/30/
09-
03/3
1/10
<3
<4
<12
<3
<7
<5
<6
<4
<3
<69
<22
03/3
1/10
-06
/30/
10<
3<
4<
12<
2<
7<
5<
7<
3<
3<
182
<82
06/3
0/10
-09
/29/
10<
3<
6<
34<
2<
9<
7<
11<
3<
2<
3920
<13
2009
/29/
10-
12/2
9/10
<3
<3
<5
<2
<5
<2
<5
<2
<2
<35
<10
ME
AN
--
--
--
--
--
-
Z-02
12/3
0/09
-03
/31/
10<
2<
3<
11<
3<
5<
4<
7<
3<
2<
60<
2203
/31/
10-
06/3
0/10
<2
<4
<10
<3
<7
<3
<6
<2
<2
<16
6<
6806
/30/
10-
09/2
9/10
<3
<7
<32
<3
<7
<9
<17
<3
<3
<41
70<
1260
09/2
9/10
-12
/29/
10<
3<
3<
4<
3<
7<
3<
7<
3<
2<
34<
11
ME
AN
--
--
--
--
--
-
Z-03
12/3
0/09
-03
/31/
10<
3<
4<
10<
3<
7<
5<
6<
3<
2<
60<
2303
/31/
10-
06/3
0/10
<2
<4
<9
<3
<6
<4
<6
<2
<2
<18
5<
6906
/30/
10-
09/2
9/10
<2
<5
<27
<2
<5
<8
<12
<2
<2
<38
90<
795
09/2
9/10
-12
/29/
10<
3<
4<
6<
3<
9<
4<
6<
3<
3<
43<
19
ME
AN
--
--
--
--
--
-
C-8
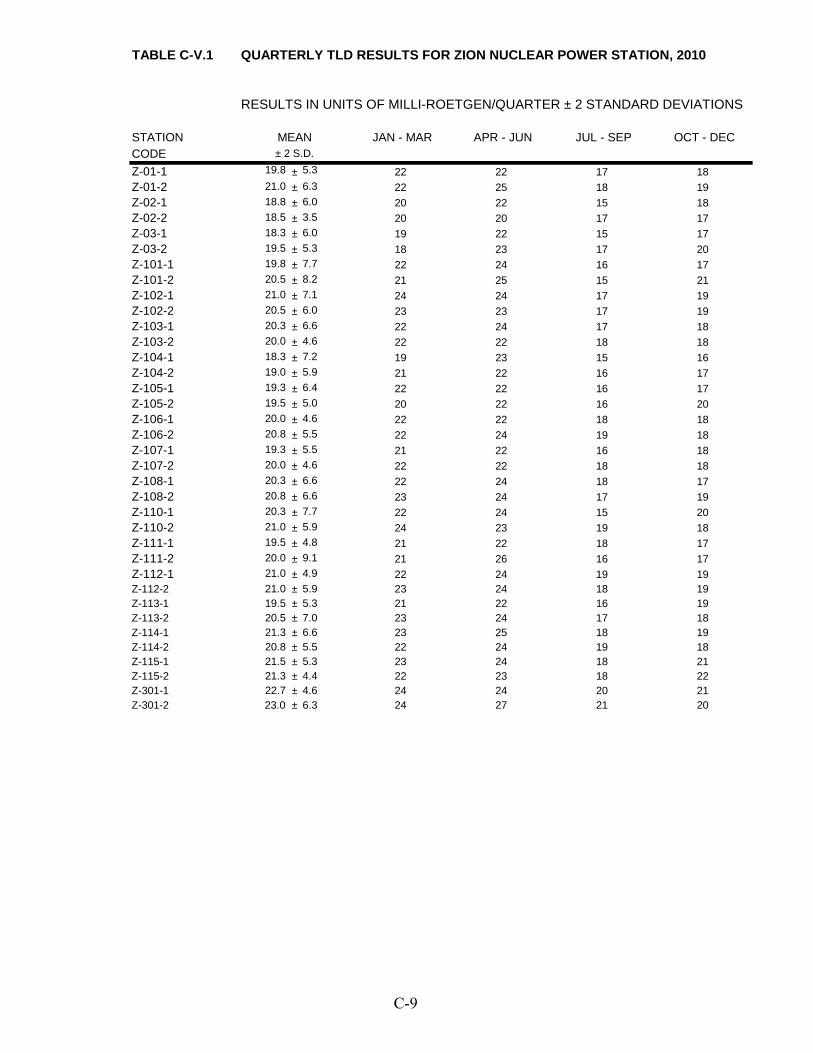
TABLE C-V.1 QUARTERLY TLD RESULTS FOR ZION NUCLEAR POWER STATION, 2010
RESULTS IN UNITS OF MILLI-ROETGEN/QUARTER ± 2 STANDARD DEVIATIONS
STATION MEAN JAN - MAR APR - JUN JUL - SEP OCT - DECCODE ± 2 S.D.
Z-01-1 19.8 ± 5.3 22 22 17 18Z-01-2 21.0 ± 6.3 22 25 18 19Z-02-1 18.8 ± 6.0 20 22 15 18Z-02-2 18.5 ± 3.5 20 20 17 17Z-03-1 18.3 ± 6.0 19 22 15 17Z-03-2 19.5 ± 5.3 18 23 17 20Z-101-1 19.8 ± 7.7 22 24 16 17Z-101-2 20.5 ± 8.2 21 25 15 21Z-102-1 21.0 ± 7.1 24 24 17 19Z-102-2 20.5 ± 6.0 23 23 17 19Z-103-1 20.3 ± 6.6 22 24 17 18Z-103-2 20.0 ± 4.6 22 22 18 18Z-104-1 18.3 ± 7.2 19 23 15 16Z-104-2 19.0 ± 5.9 21 22 16 17Z-105-1 19.3 ± 6.4 22 22 16 17Z-105-2 19.5 ± 5.0 20 22 16 20Z-106-1 20.0 ± 4.6 22 22 18 18Z-106-2 20.8 ± 5.5 22 24 19 18Z-107-1 19.3 ± 5.5 21 22 16 18Z-107-2 20.0 ± 4.6 22 22 18 18Z-108-1 20.3 ± 6.6 22 24 18 17Z-108-2 20.8 ± 6.6 23 24 17 19Z-110-1 20.3 ± 7.7 22 24 15 20Z-110-2 21.0 ± 5.9 24 23 19 18Z-111-1 19.5 ± 4.8 21 22 18 17Z-111-2 20.0 ± 9.1 21 26 16 17Z-112-1 21.0 ± 4.9 22 24 19 19Z-112-2 21.0 ± 5.9 23 24 18 19Z-113-1 19.5 ± 5.3 21 22 16 19Z-113-2 20.5 ± 7.0 23 24 17 18Z-114-1 21.3 ± 6.6 23 25 18 19Z-114-2 20.8 ± 5.5 22 24 19 18Z-115-1 21.5 ± 5.3 23 24 18 21Z-115-2 21.3 ± 4.4 22 23 18 22Z-301-1 22.7 ± 4.6 24 24 20 21Z-301-2 23.0 ± 6.3 24 27 21 20
C-9
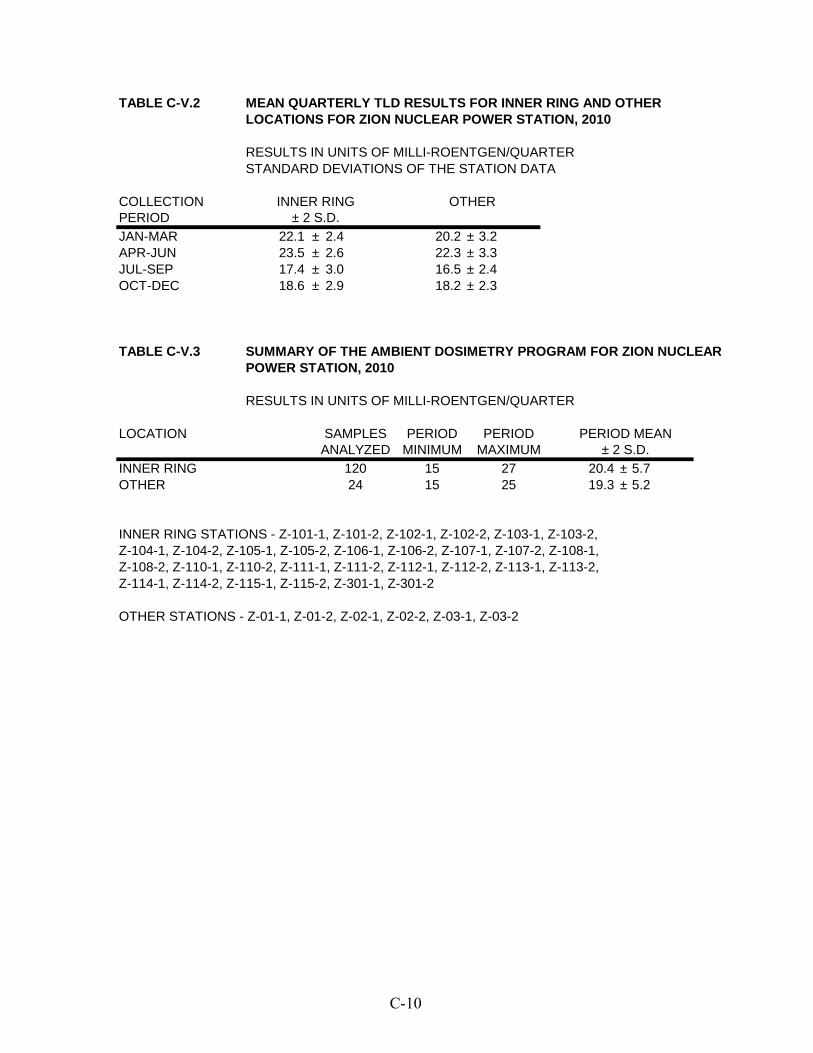
TABLE C-V.2 MEAN QUARTERLY TLD RESULTS FOR INNER RING AND OTHERLOCATIONS FOR ZION NUCLEAR POWER STATION, 2010
RESULTS IN UNITS OF MILLI-ROENTGEN/QUARTERSTANDARD DEVIATIONS OF THE STATION DATA
COLLECTION INNER RING OTHERPERIOD ± 2 S.D.JAN-MAR 22.1 ± 2.4 20.2 ± 3.2APR-JUN 23.5 ± 2.6 22.3 ± 3.3JUL-SEP 17.4 ± 3.0 16.5 ± 2.4OCT-DEC 18.6 ± 2.9 18.2 ± 2.3
TABLE C-V.3 SUMMARY OF THE AMBIENT DOSIMETRY PROGRAM FOR ZION NUCLEARPOWER STATION, 2010
RESULTS IN UNITS OF MILLI-ROENTGEN/QUARTER
LOCATION SAMPLES PERIOD PERIOD PERIOD MEANANALYZED MINIMUM MAXIMUM ± 2 S.D.
INNER RING 120 15 27 20.4 ± 5.7OTHER 24 15 25 19.3 ± 5.2
INNER RING STATIONS - Z-101-1, Z-101-2, Z-102-1, Z-102-2, Z-103-1, Z-103-2, Z-104-1, Z-104-2, Z-105-1, Z-105-2, Z-106-1, Z-106-2, Z-107-1, Z-107-2, Z-108-1, Z-108-2, Z-110-1, Z-110-2, Z-111-1, Z-111-2, Z-112-1, Z-112-2, Z-113-1, Z-113-2, Z-114-1, Z-114-2, Z-115-1, Z-115-2, Z-301-1, Z-301-2
OTHER STATIONS - Z-01-1, Z-01-2, Z-02-1, Z-02-2, Z-03-1, Z-03-2
C-10
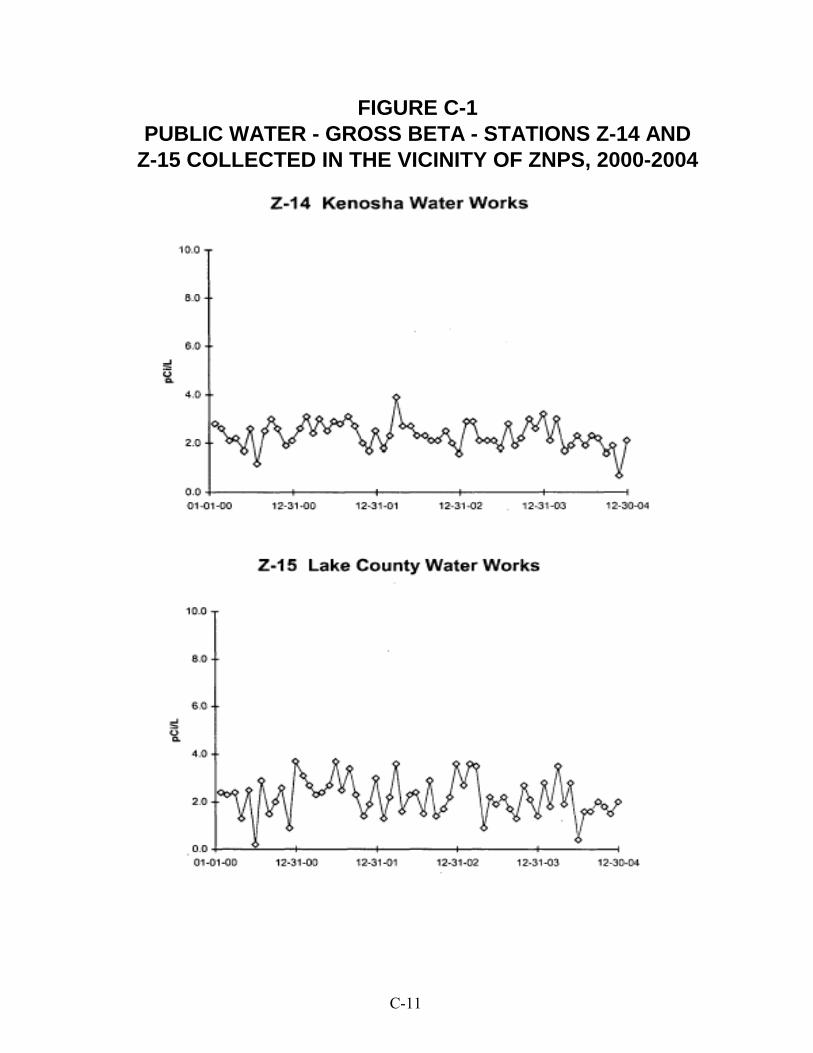
FIGURE C-1PUBLIC WATER - GROSS BETA - STATIONS Z-14 AND
Z-15 COLLECTED IN THE VICINITY OF ZNPS, 2000-2004
C-11
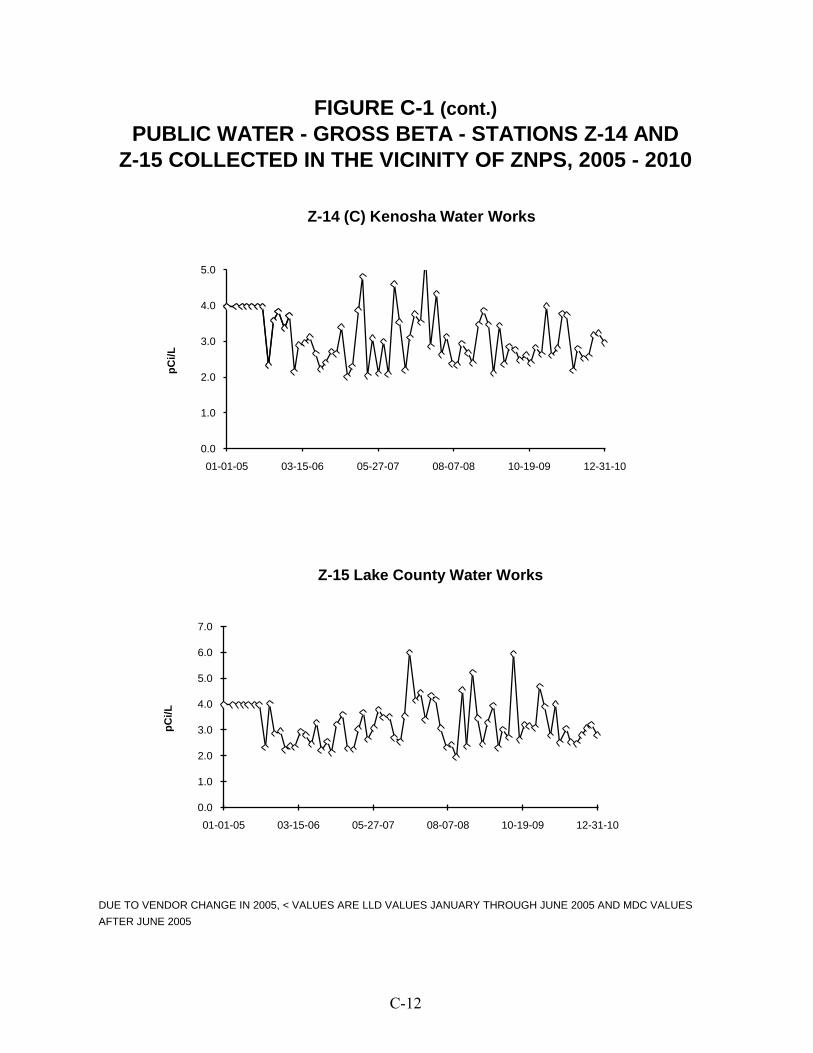
DUE TO VENDOR CHANGE IN 2005, < VALUES ARE LLD VALUES JANUARY THROUGH JUNE 2005 AND MDC VALUESAFTER JUNE 2005
PUBLIC WATER - GROSS BETA - STATIONS Z-14 ANDZ-15 COLLECTED IN THE VICINITY OF ZNPS, 2005 - 2010
FIGURE C-1 (cont.)
0.0
1.0
2.0
3.0
4.0
5.0
01-01-05 03-15-06 05-27-07 08-07-08 10-19-09 12-31-10
pCi/L
Z-14 (C) Kenosha Water Works
0.0
1.0
2.0
3.0
4.0
5.0
6.0
7.0
01-01-05 03-15-06 05-27-07 08-07-08 10-19-09 12-31-10
pCi/L
Z-15 Lake County Water Works
C-12
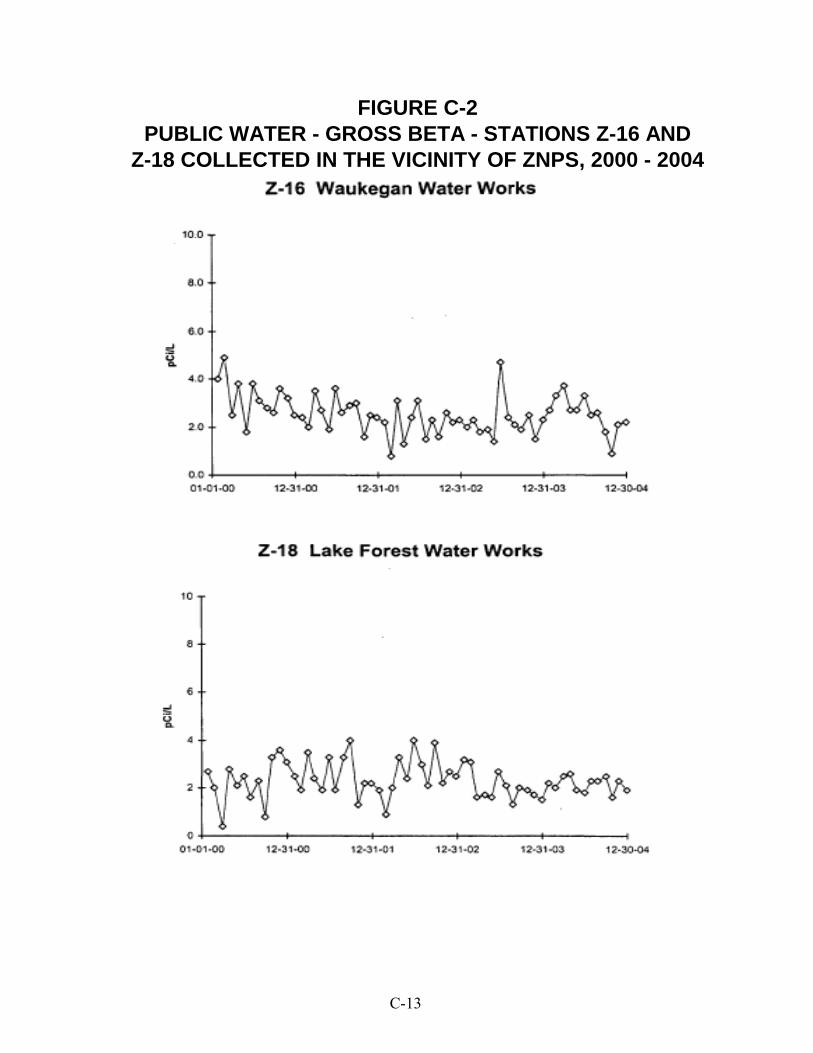
FIGURE C-2PUBLIC WATER - GROSS BETA - STATIONS Z-16 AND
Z-18 COLLECTED IN THE VICINITY OF ZNPS, 2000 - 2004
C-13
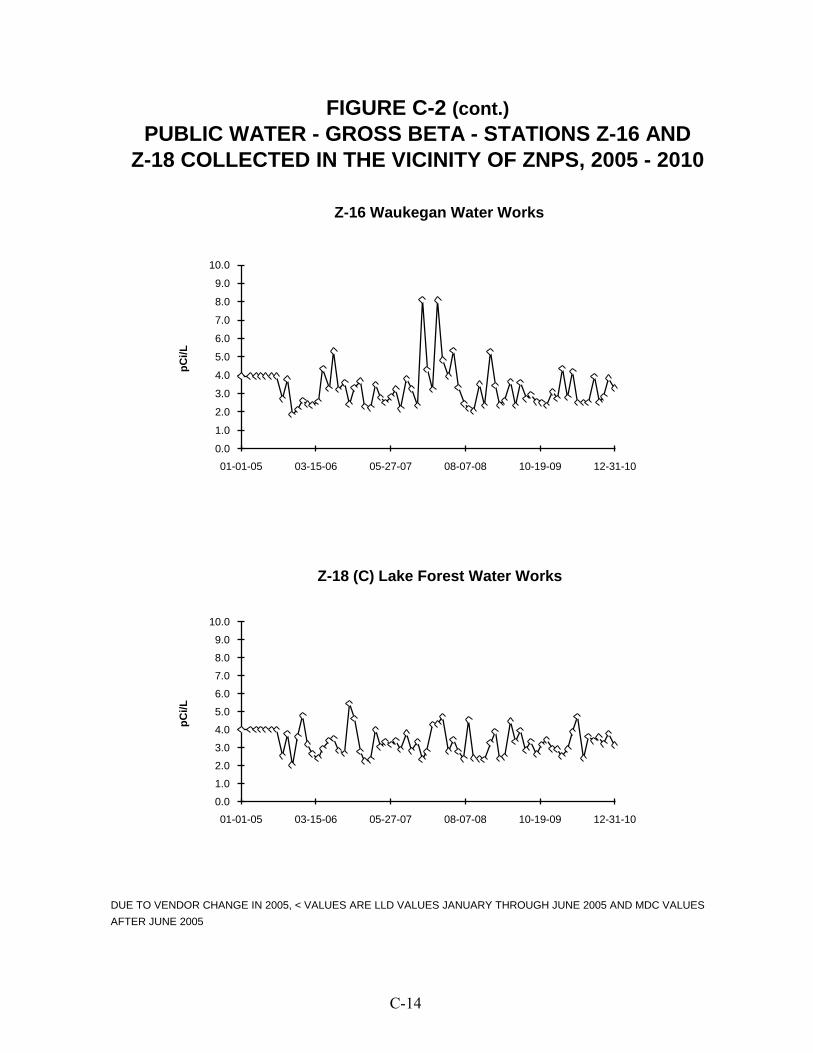
DUE TO VENDOR CHANGE IN 2005, < VALUES ARE LLD VALUES JANUARY THROUGH JUNE 2005 AND MDC VALUESAFTER JUNE 2005
FIGURE C-2 (cont.)
Z-18 COLLECTED IN THE VICINITY OF ZNPS, 2005 - 2010PUBLIC WATER - GROSS BETA - STATIONS Z-16 AND
0.0
1.0
2.0
3.0
4.0
5.0
6.0
7.0
8.0
9.0
10.0
01-01-05 03-15-06 05-27-07 08-07-08 10-19-09 12-31-10
pCi/L
Z-16 Waukegan Water Works
0.0
1.0
2.0
3.0
4.0
5.0
6.0
7.0
8.0
9.0
10.0
01-01-05 03-15-06 05-27-07 08-07-08 10-19-09 12-31-10
pCi/L
Z-18 (C) Lake Forest Water Works
C-14
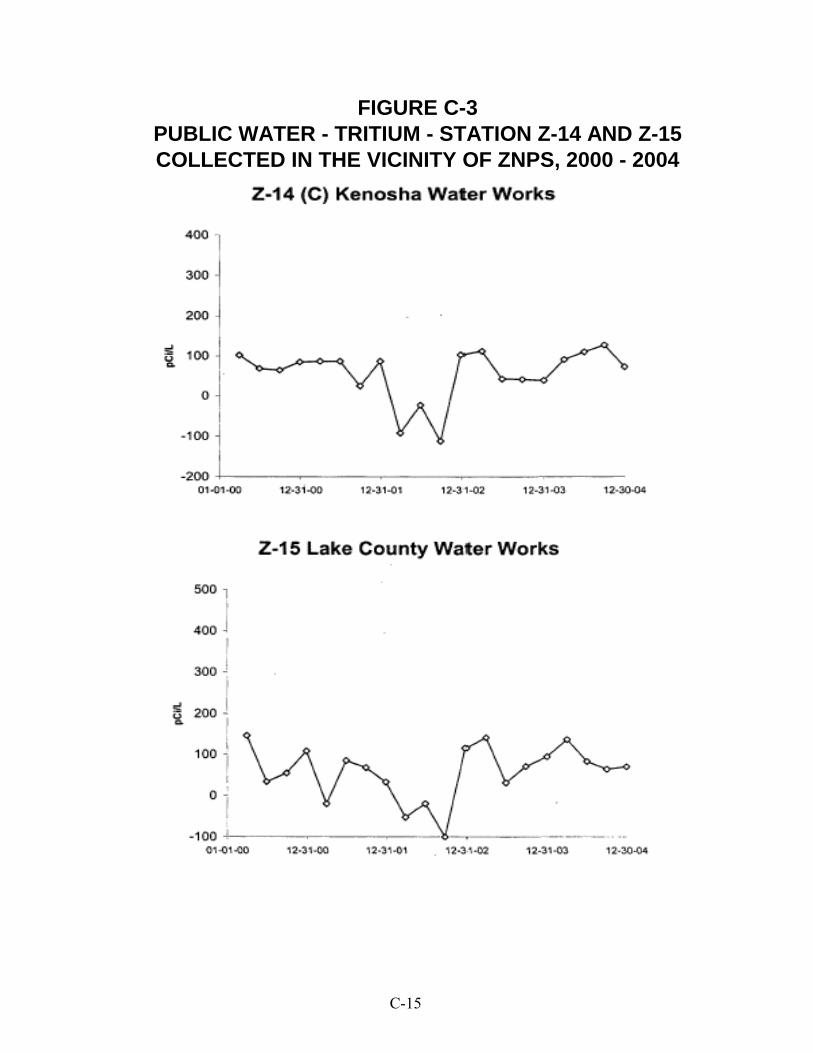
FIGURE C-3PUBLIC WATER - TRITIUM - STATION Z-14 AND Z-15COLLECTED IN THE VICINITY OF ZNPS, 2000 - 2004
C-15
DUE TO VENDOR CHANGE IN 2005, < VALUES ARE LLD VALUES JANUARY THROUGH JUNE 2005 AND MDC VALUESAFTER JUNE 2005
FIGURE C-3 (cont.)
COLLECTED IN THE VICINITY OF ZNPS, 2005 - 2010PUBLIC WATER - TRITIUM - STATION Z-14 AND Z-15
0
100
200
300
03-31-05 05-25-06 07-19-07 09-11-08 11-05-09 12-30-10
pCi/L
Z-14 (C) Kenosha Water Works
0
50
100
150
200
250
300
03-31-05 05-25-06 07-19-07 09-11-08 11-05-09 12-30-10
pCi/L
Z-15 Lake County Water Works
C-16
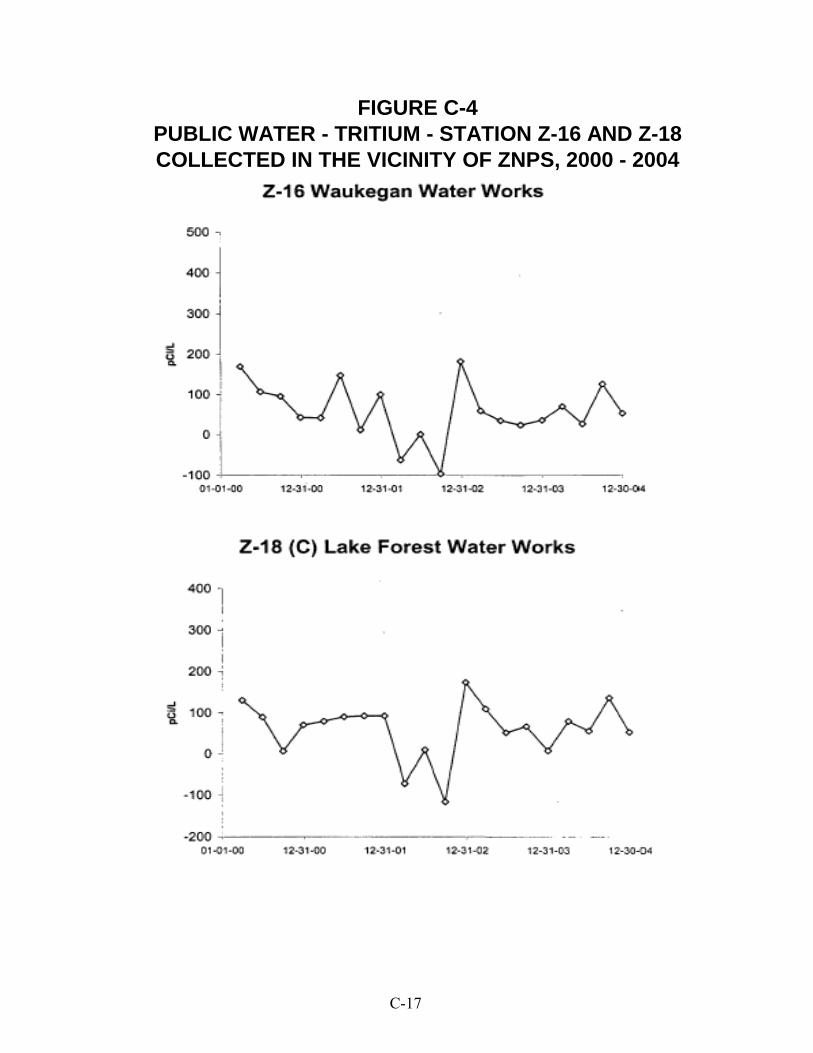
FIGURE C-4PUBLIC WATER - TRITIUM - STATION Z-16 AND Z-18COLLECTED IN THE VICINITY OF ZNPS, 2000 - 2004
C-17
DUE TO VENDOR CHANGE IN 2005, < VALUES ARE LLD VALUES JANUARY THROUGH JUNE 2005 AND MDC VALUESAFTER JUNE 2005
FIGURE C-4 (cont.)
COLLECTED IN THE VICINITY OF ZNPS, 2005 - 2010PUBLIC WATER - TRITIUM - STATION Z-16 AND Z-18
0
50
100
150
200
250
03-31-05 05-25-06 07-19-07 09-11-08 11-05-09 12-30-10
pCi/L
Z-16 Waukegan Water Works
0
50
100
150
200
250
03-31-05 05-25-06 07-19-07 09-11-08 11-05-09 12-30-10
pCi/L
Z-18 (C) Lake Forest Water Works
C-18
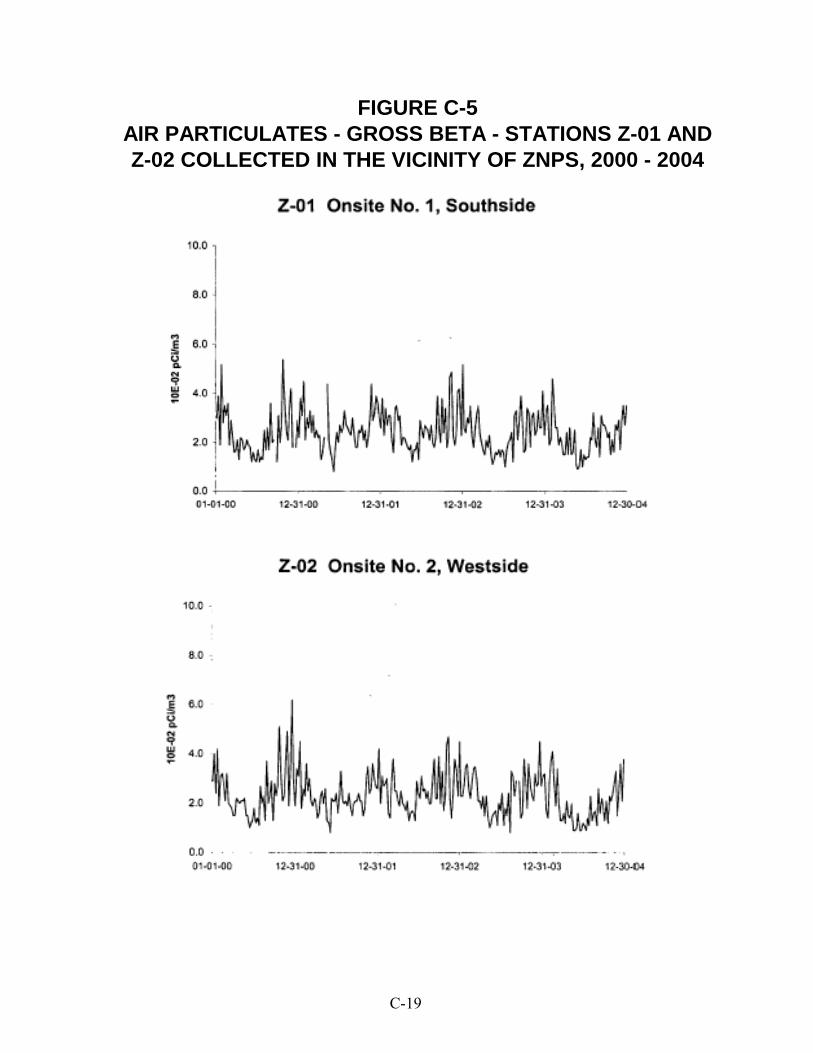
FIGURE C-5AIR PARTICULATES - GROSS BETA - STATIONS Z-01 ANDZ-02 COLLECTED IN THE VICINITY OF ZNPS, 2000 - 2004
C-19
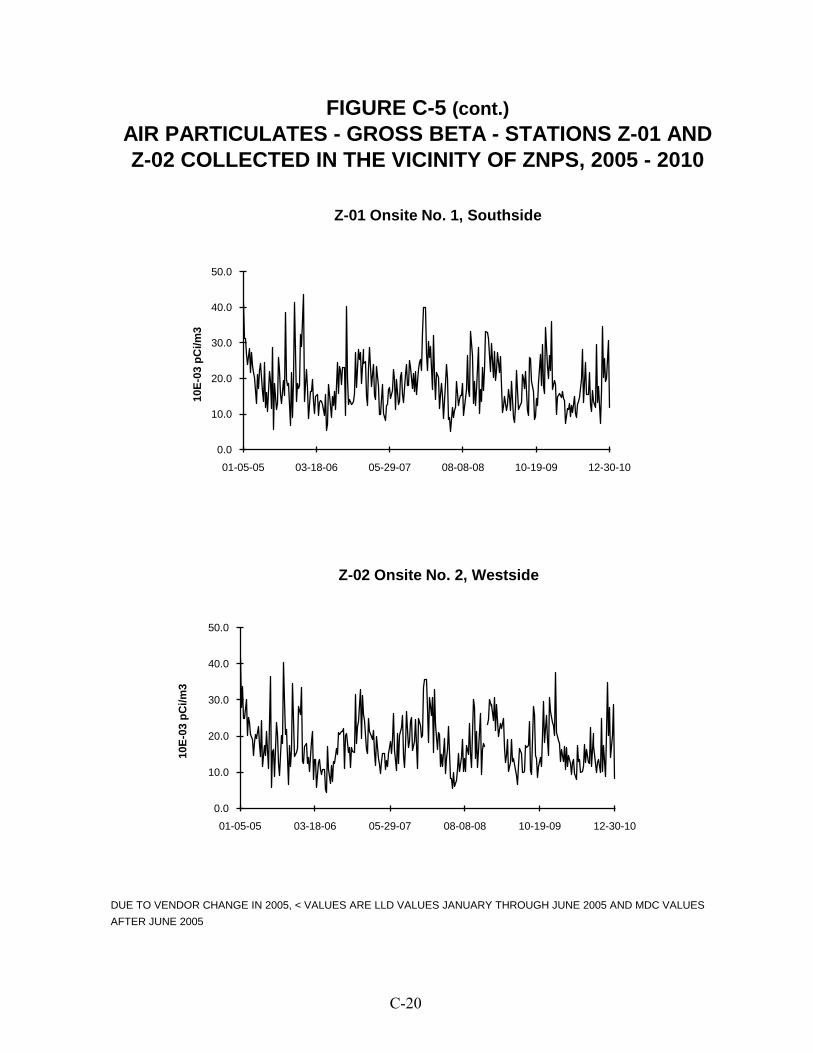
DUE TO VENDOR CHANGE IN 2005, < VALUES ARE LLD VALUES JANUARY THROUGH JUNE 2005 AND MDC VALUESAFTER JUNE 2005
AIR PARTICULATES - GROSS BETA - STATIONS Z-01 ANDFIGURE C-5 (cont.)
Z-02 COLLECTED IN THE VICINITY OF ZNPS, 2005 - 2010
0.0
10.0
20.0
30.0
40.0
50.0
01-05-05 03-18-06 05-29-07 08-08-08 10-19-09 12-30-10
10E-
03 p
Ci/m
3
Z-01 Onsite No. 1, Southside
0.0
10.0
20.0
30.0
40.0
50.0
01-05-05 03-18-06 05-29-07 08-08-08 10-19-09 12-30-10
10E-
03 p
Ci/m
3
Z-02 Onsite No. 2, Westside
C-20
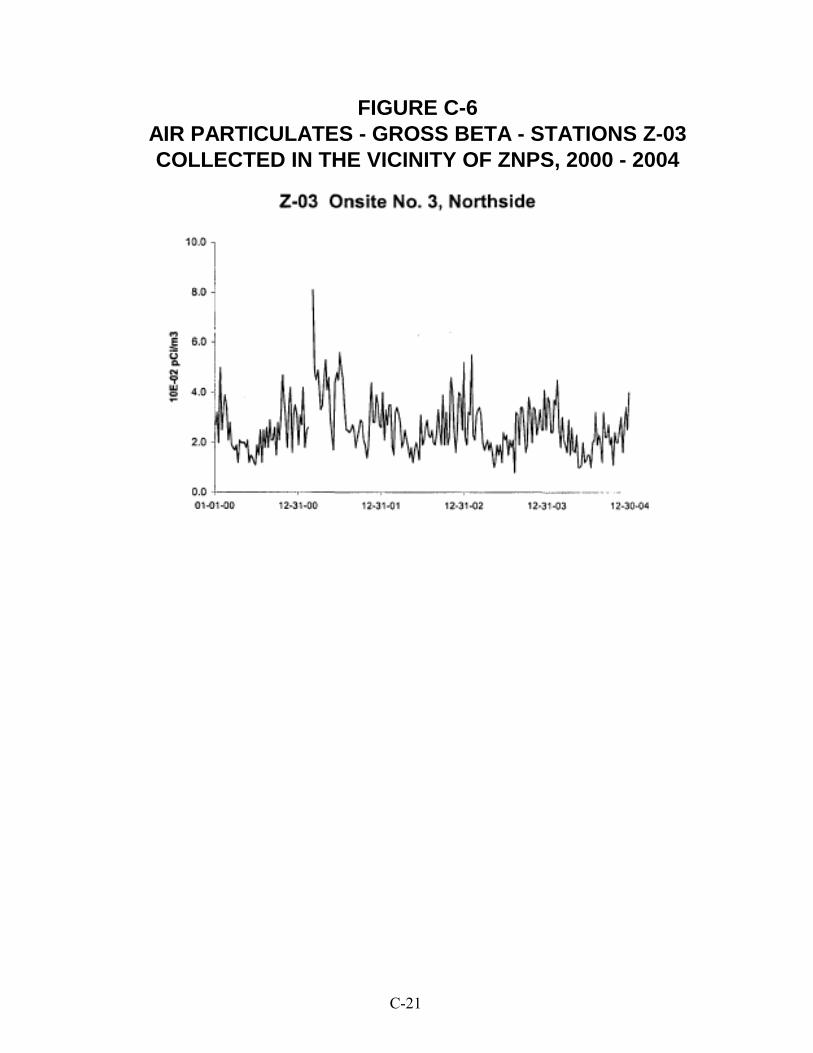
FIGURE C-6AIR PARTICULATES - GROSS BETA - STATIONS Z-03COLLECTED IN THE VICINITY OF ZNPS, 2000 - 2004
C-21
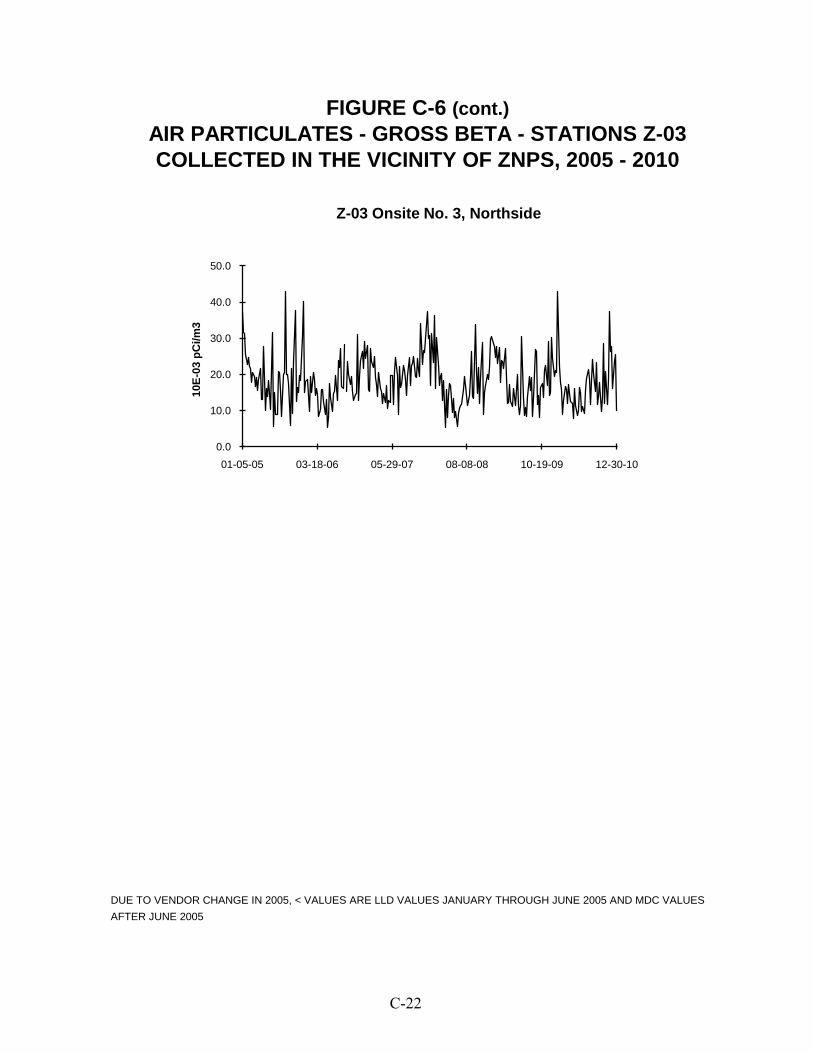
DUE TO VENDOR CHANGE IN 2005, < VALUES ARE LLD VALUES JANUARY THROUGH JUNE 2005 AND MDC VALUESAFTER JUNE 2005
AIR PARTICULATES - GROSS BETA - STATIONS Z-03FIGURE C-6 (cont.)
COLLECTED IN THE VICINITY OF ZNPS, 2005 - 2010
0.0
10.0
20.0
30.0
40.0
50.0
01-05-05 03-18-06 05-29-07 08-08-08 10-19-09 12-30-10
10E-
03 p
Ci/m
3Z-03 Onsite No. 3, Northside
C-22
APPENDIX D
INTER-LABORATORY COMPARISON PROGRAM

Identification Reported Known Ratio (c)Month/Year Number Matrix Nuclide Units Value (a) Value (b) TBE/Analytics Evaluation (d)
March 2010 E6978-396 Milk Sr-89 pCi/L 89.3 92.8 0.96 ASr-90 pCi/L 13.8 12.7 1.09 A
E6979-396 Milk I-131 pCi/L 65.2 74.0 0.88 ACe-141 pCi/L 241 261 0.92 ACr-51 pCi/L 388 361 1.07 ACs-134 pCi/L 157 178 0.88 ACs-137 pCi/L 150 158 0.95 ACo-58 pCi/L 143 143 1.00 AMn-54 pCi/L 202 207 0.98 AFe-59 pCi/L 146 137 1.07 AZn-65 pCi/L 247 254 0.97 ACo-60 pCi/L 177 183 0.97 A
E6981-396 AP Ce-141 pCi 211 185 1.14 ACr-51 pCi 304 255 1.19 ACs-134 pCi 142 125 1.14 ACs-137 pCi 131 111 1.18 ACo-58 pCi 119 101 1.18 AMn-54 pCi 162 146 1.11 AFe-59 pCi 110 97 1.14 AZn-65 pCi 217 179 1.21 WCo-60 pCi 145 129 1.12 A
E6980-396 Charcoal I-131 pCi 80.2 85.6 0.94 A
June 2010 E7132-396 Milk Sr-89 pCi/L 82.0 93.4 0.88 ASr-90 pCi/L 15.8 16.7 0.95 A
E7133-396 Milk I-131 pCi/L 83.5 96.9 0.86 ACe-141 pCi/L 107 110 0.97 ACr-51 pCi/L 325 339 0.96 ACs-134 pCi/L 114 126 0.90 ACs-137 pCi/L 144 150 0.96 ACo-58 pCi/L 92.3 101 0.91 AMn-54 pCi/L 165 169 0.98 AFe-59 pCi/L 121 119 1.02 AZn-65 pCi/L 197 206 0.96 ACo-60 pCi/L 190 197 0.96 A
E7135-396 AP Ce-141 pCi 88.4 91.6 0.97 ACr-51 pCi 292 282 1.04 ACs-134 pCi 101 105 0.96 ACs-137 pCi 132 125 1.06 ACo-58 pCi 87.3 84.0 1.04 AMn-54 pCi 150 140 1.07 AFe-59 pCi 105 98.6 1.06 AZn-65 pCi 168 171 0.98 ACo-60 pCi 170 163 1.04 A
E7134-396 Charcoal I-131 pCi 76.4 79.9 0.96 A
TABLE D-1 ANALYTICS ENVIRONMENTAL RADIOACTIVITY CROSS CHECK PROGRAMTELEDYNE BROWN ENGINEERING, 2010
(PAGE 1 OF 3)
D-1
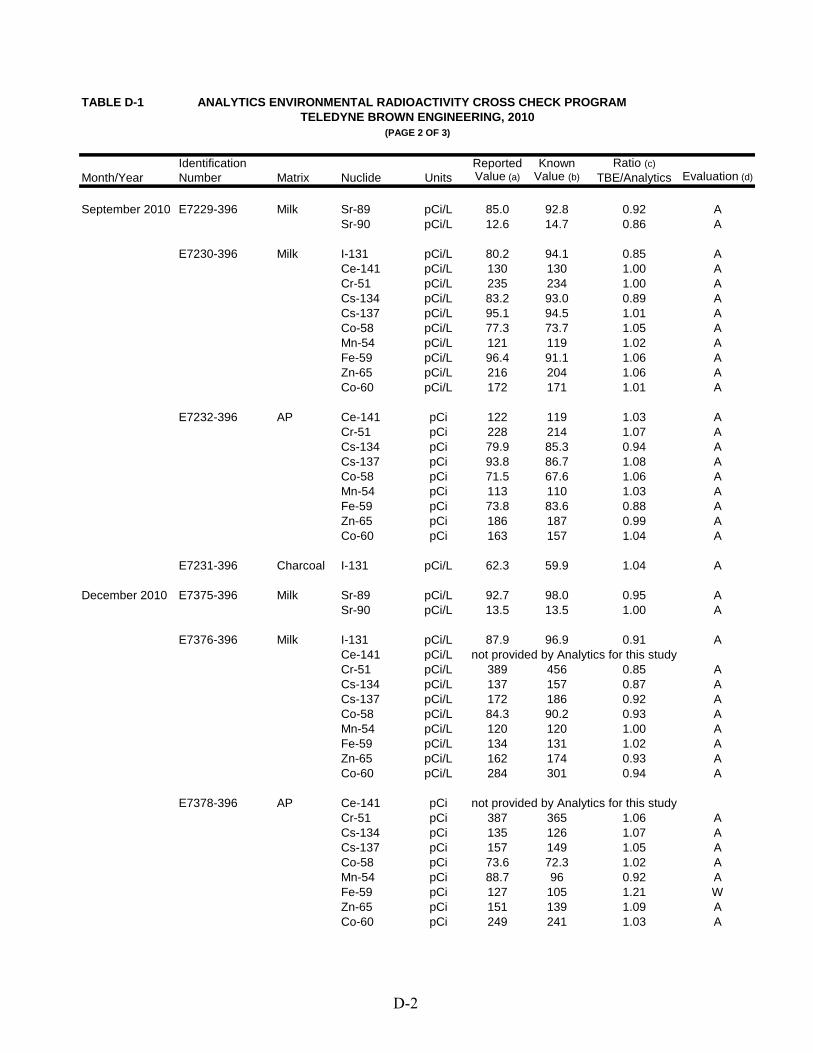
Identification Reported Known Ratio (c)Month/Year Number Matrix Nuclide Units Value (a) Value (b) TBE/Analytics Evaluation (d)
September 2010 E7229-396 Milk Sr-89 pCi/L 85.0 92.8 0.92 ASr-90 pCi/L 12.6 14.7 0.86 A
E7230-396 Milk I-131 pCi/L 80.2 94.1 0.85 ACe-141 pCi/L 130 130 1.00 ACr-51 pCi/L 235 234 1.00 ACs-134 pCi/L 83.2 93.0 0.89 ACs-137 pCi/L 95.1 94.5 1.01 ACo-58 pCi/L 77.3 73.7 1.05 AMn-54 pCi/L 121 119 1.02 AFe-59 pCi/L 96.4 91.1 1.06 AZn-65 pCi/L 216 204 1.06 ACo-60 pCi/L 172 171 1.01 A
E7232-396 AP Ce-141 pCi 122 119 1.03 ACr-51 pCi 228 214 1.07 ACs-134 pCi 79.9 85.3 0.94 ACs-137 pCi 93.8 86.7 1.08 ACo-58 pCi 71.5 67.6 1.06 AMn-54 pCi 113 110 1.03 AFe-59 pCi 73.8 83.6 0.88 AZn-65 pCi 186 187 0.99 ACo-60 pCi 163 157 1.04 A
E7231-396 Charcoal I-131 pCi/L 62.3 59.9 1.04 A
December 2010 E7375-396 Milk Sr-89 pCi/L 92.7 98.0 0.95 ASr-90 pCi/L 13.5 13.5 1.00 A
E7376-396 Milk I-131 pCi/L 87.9 96.9 0.91 ACe-141 pCi/L not provided by Analytics for this studyCr-51 pCi/L 389 456 0.85 ACs-134 pCi/L 137 157 0.87 ACs-137 pCi/L 172 186 0.92 ACo-58 pCi/L 84.3 90.2 0.93 AMn-54 pCi/L 120 120 1.00 AFe-59 pCi/L 134 131 1.02 AZn-65 pCi/L 162 174 0.93 ACo-60 pCi/L 284 301 0.94 A
E7378-396 AP Ce-141 pCi not provided by Analytics for this studyCr-51 pCi 387 365 1.06 ACs-134 pCi 135 126 1.07 ACs-137 pCi 157 149 1.05 ACo-58 pCi 73.6 72.3 1.02 AMn-54 pCi 88.7 96 0.92 AFe-59 pCi 127 105 1.21 WZn-65 pCi 151 139 1.09 ACo-60 pCi 249 241 1.03 A
TELEDYNE BROWN ENGINEERING, 2010TABLE D-1 ANALYTICS ENVIRONMENTAL RADIOACTIVITY CROSS CHECK PROGRAM
(PAGE 2 OF 3)
D-2
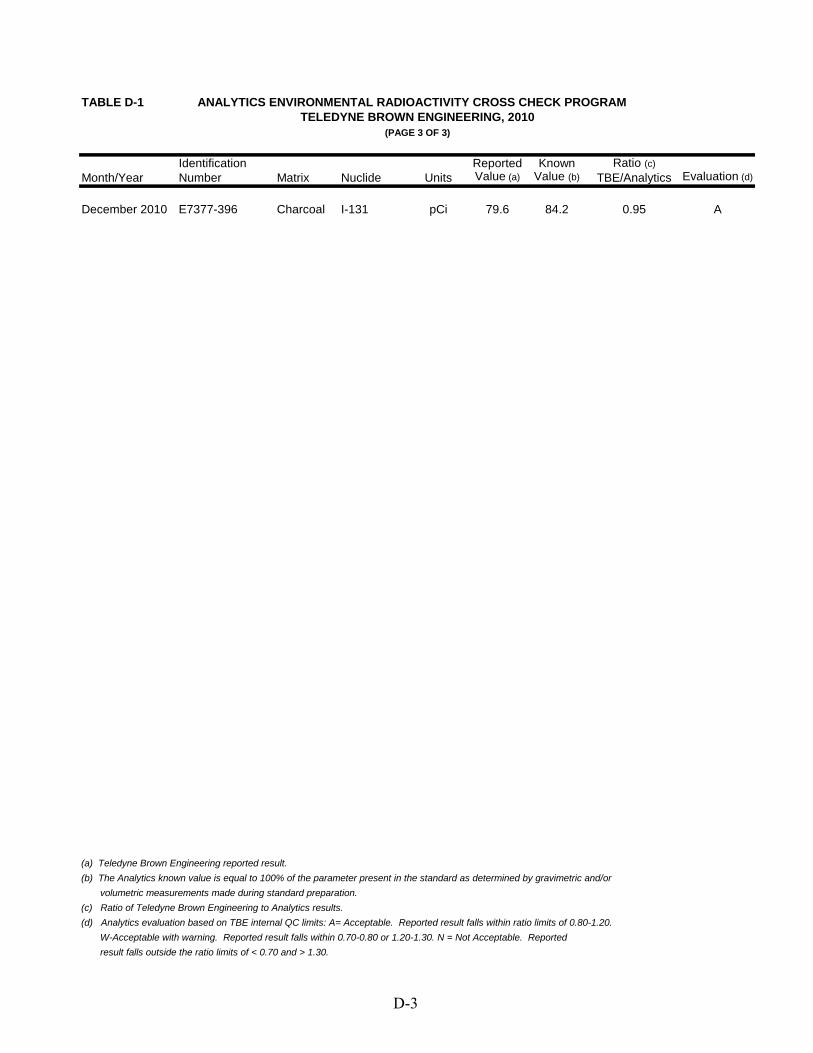
Identification Reported Known Ratio (c)Month/Year Number Matrix Nuclide Units Value (a) Value (b) TBE/Analytics Evaluation (d)
December 2010 E7377-396 Charcoal I-131 pCi 79.6 84.2 0.95 A
(a) Teledyne Brown Engineering reported result.(b) The Analytics known value is equal to 100% of the parameter present in the standard as determined by gravimetric and/or volumetric measurements made during standard preparation.(c) Ratio of Teledyne Brown Engineering to Analytics results.(d) Analytics evaluation based on TBE internal QC limits: A= Acceptable. Reported result falls within ratio limits of 0.80-1.20. W-Acceptable with warning. Reported result falls within 0.70-0.80 or 1.20-1.30. N = Not Acceptable. Reported result falls outside the ratio limits of < 0.70 and > 1.30.
(PAGE 3 OF 3)
TABLE D-1 ANALYTICS ENVIRONMENTAL RADIOACTIVITY CROSS CHECK PROGRAMTELEDYNE BROWN ENGINEERING, 2010
D-3
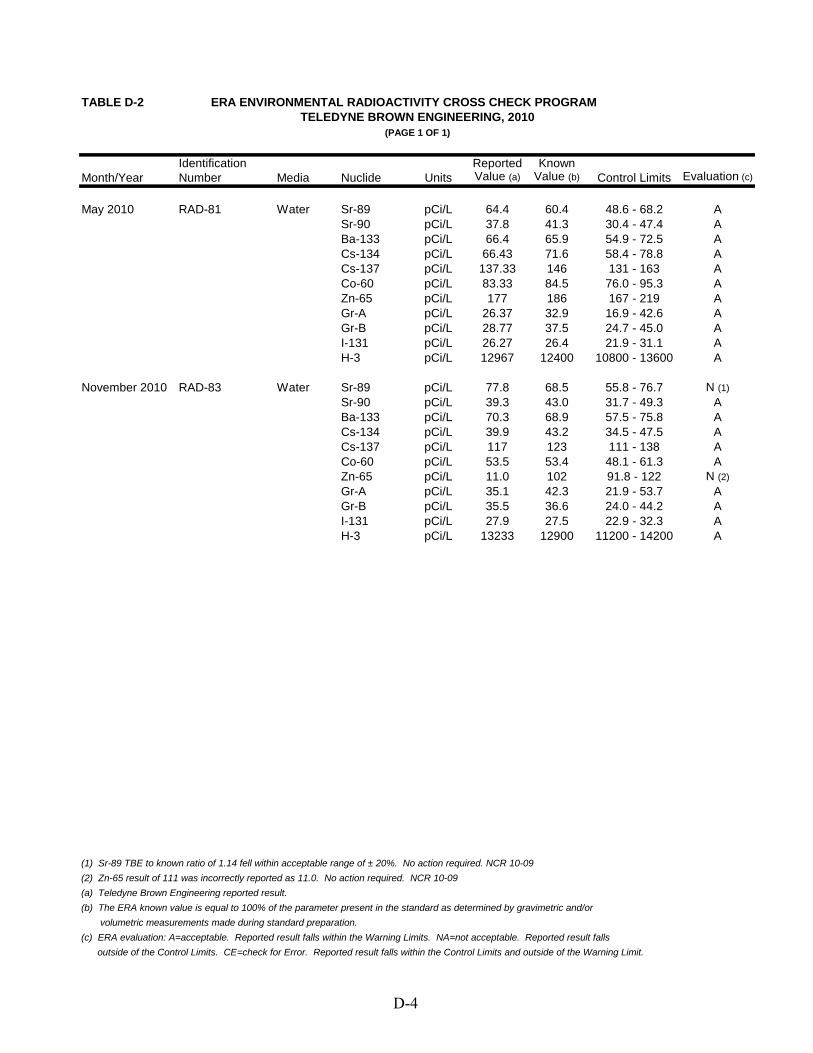
Identification Reported KnownMonth/Year Number Media Nuclide Units Value (a) Value (b) Control Limits Evaluation (c)
May 2010 RAD-81 Water Sr-89 pCi/L 64.4 60.4 48.6 - 68.2 ASr-90 pCi/L 37.8 41.3 30.4 - 47.4 ABa-133 pCi/L 66.4 65.9 54.9 - 72.5 ACs-134 pCi/L 66.43 71.6 58.4 - 78.8 ACs-137 pCi/L 137.33 146 131 - 163 ACo-60 pCi/L 83.33 84.5 76.0 - 95.3 AZn-65 pCi/L 177 186 167 - 219 AGr-A pCi/L 26.37 32.9 16.9 - 42.6 AGr-B pCi/L 28.77 37.5 24.7 - 45.0 AI-131 pCi/L 26.27 26.4 21.9 - 31.1 AH-3 pCi/L 12967 12400 10800 - 13600 A
November 2010 RAD-83 Water Sr-89 pCi/L 77.8 68.5 55.8 - 76.7 N (1)Sr-90 pCi/L 39.3 43.0 31.7 - 49.3 ABa-133 pCi/L 70.3 68.9 57.5 - 75.8 ACs-134 pCi/L 39.9 43.2 34.5 - 47.5 ACs-137 pCi/L 117 123 111 - 138 ACo-60 pCi/L 53.5 53.4 48.1 - 61.3 AZn-65 pCi/L 11.0 102 91.8 - 122 N (2)Gr-A pCi/L 35.1 42.3 21.9 - 53.7 AGr-B pCi/L 35.5 36.6 24.0 - 44.2 AI-131 pCi/L 27.9 27.5 22.9 - 32.3 AH-3 pCi/L 13233 12900 11200 - 14200 A
(1) Sr-89 TBE to known ratio of 1.14 fell within acceptable range of ± 20%. No action required. NCR 10-09(2) Zn-65 result of 111 was incorrectly reported as 11.0. No action required. NCR 10-09(a) Teledyne Brown Engineering reported result.(b) The ERA known value is equal to 100% of the parameter present in the standard as determined by gravimetric and/or volumetric measurements made during standard preparation.(c) ERA evaluation: A=acceptable. Reported result falls within the Warning Limits. NA=not acceptable. Reported result falls outside of the Control Limits. CE=check for Error. Reported result falls within the Control Limits and outside of the Warning Limit.
TELEDYNE BROWN ENGINEERING, 2010(PAGE 1 OF 1)
TABLE D-2 ERA ENVIRONMENTAL RADIOACTIVITY CROSS CHECK PROGRAM
D-4
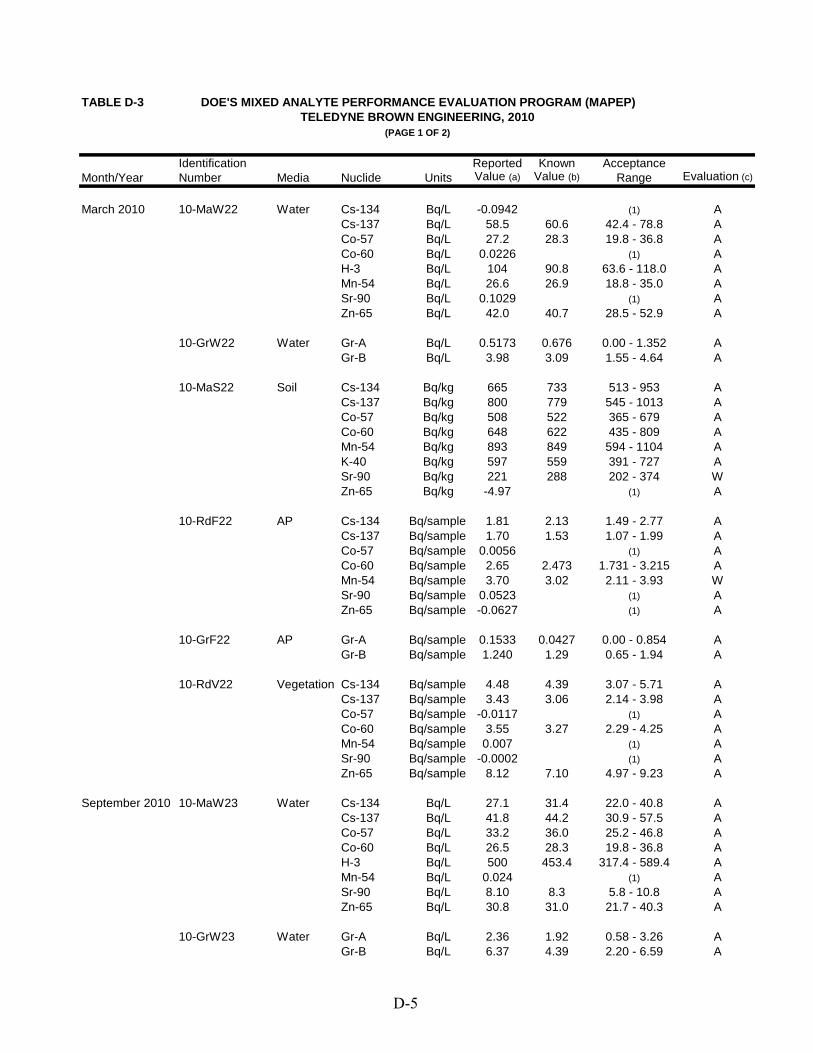
Identification Reported Known AcceptanceMonth/Year Number Media Nuclide Units Value (a) Value (b) Range Evaluation (c)
March 2010 10-MaW22 Water Cs-134 Bq/L -0.0942 (1) ACs-137 Bq/L 58.5 60.6 42.4 - 78.8 ACo-57 Bq/L 27.2 28.3 19.8 - 36.8 ACo-60 Bq/L 0.0226 (1) AH-3 Bq/L 104 90.8 63.6 - 118.0 AMn-54 Bq/L 26.6 26.9 18.8 - 35.0 ASr-90 Bq/L 0.1029 (1) AZn-65 Bq/L 42.0 40.7 28.5 - 52.9 A
10-GrW22 Water Gr-A Bq/L 0.5173 0.676 0.00 - 1.352 AGr-B Bq/L 3.98 3.09 1.55 - 4.64 A
10-MaS22 Soil Cs-134 Bq/kg 665 733 513 - 953 ACs-137 Bq/kg 800 779 545 - 1013 ACo-57 Bq/kg 508 522 365 - 679 ACo-60 Bq/kg 648 622 435 - 809 AMn-54 Bq/kg 893 849 594 - 1104 AK-40 Bq/kg 597 559 391 - 727 ASr-90 Bq/kg 221 288 202 - 374 WZn-65 Bq/kg -4.97 (1) A
10-RdF22 AP Cs-134 Bq/sample 1.81 2.13 1.49 - 2.77 ACs-137 Bq/sample 1.70 1.53 1.07 - 1.99 ACo-57 Bq/sample 0.0056 (1) ACo-60 Bq/sample 2.65 2.473 1.731 - 3.215 AMn-54 Bq/sample 3.70 3.02 2.11 - 3.93 WSr-90 Bq/sample 0.0523 (1) AZn-65 Bq/sample -0.0627 (1) A
10-GrF22 AP Gr-A Bq/sample 0.1533 0.0427 0.00 - 0.854 AGr-B Bq/sample 1.240 1.29 0.65 - 1.94 A
10-RdV22 Vegetation Cs-134 Bq/sample 4.48 4.39 3.07 - 5.71 ACs-137 Bq/sample 3.43 3.06 2.14 - 3.98 ACo-57 Bq/sample -0.0117 (1) ACo-60 Bq/sample 3.55 3.27 2.29 - 4.25 AMn-54 Bq/sample 0.007 (1) ASr-90 Bq/sample -0.0002 (1) AZn-65 Bq/sample 8.12 7.10 4.97 - 9.23 A
September 2010 10-MaW23 Water Cs-134 Bq/L 27.1 31.4 22.0 - 40.8 ACs-137 Bq/L 41.8 44.2 30.9 - 57.5 ACo-57 Bq/L 33.2 36.0 25.2 - 46.8 ACo-60 Bq/L 26.5 28.3 19.8 - 36.8 AH-3 Bq/L 500 453.4 317.4 - 589.4 AMn-54 Bq/L 0.024 (1) ASr-90 Bq/L 8.10 8.3 5.8 - 10.8 AZn-65 Bq/L 30.8 31.0 21.7 - 40.3 A
10-GrW23 Water Gr-A Bq/L 2.36 1.92 0.58 - 3.26 AGr-B Bq/L 6.37 4.39 2.20 - 6.59 A
(PAGE 1 OF 2)TELEDYNE BROWN ENGINEERING, 2010
TABLE D-3 DOE'S MIXED ANALYTE PERFORMANCE EVALUATION PROGRAM (MAPEP)
D-5
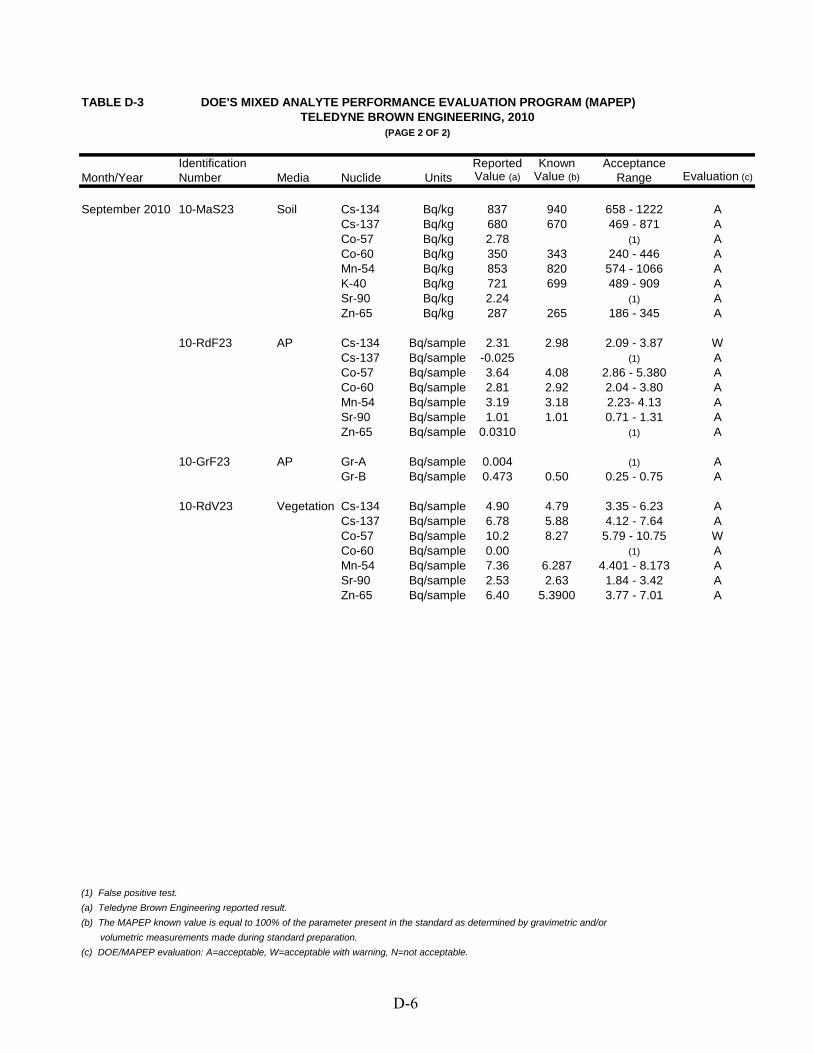
Identification Reported Known AcceptanceMonth/Year Number Media Nuclide Units Value (a) Value (b) Range Evaluation (c)
September 2010 10-MaS23 Soil Cs-134 Bq/kg 837 940 658 - 1222 ACs-137 Bq/kg 680 670 469 - 871 ACo-57 Bq/kg 2.78 (1) ACo-60 Bq/kg 350 343 240 - 446 AMn-54 Bq/kg 853 820 574 - 1066 AK-40 Bq/kg 721 699 489 - 909 ASr-90 Bq/kg 2.24 (1) AZn-65 Bq/kg 287 265 186 - 345 A
10-RdF23 AP Cs-134 Bq/sample 2.31 2.98 2.09 - 3.87 WCs-137 Bq/sample -0.025 (1) ACo-57 Bq/sample 3.64 4.08 2.86 - 5.380 ACo-60 Bq/sample 2.81 2.92 2.04 - 3.80 AMn-54 Bq/sample 3.19 3.18 2.23- 4.13 ASr-90 Bq/sample 1.01 1.01 0.71 - 1.31 AZn-65 Bq/sample 0.0310 (1) A
10-GrF23 AP Gr-A Bq/sample 0.004 (1) AGr-B Bq/sample 0.473 0.50 0.25 - 0.75 A
10-RdV23 Vegetation Cs-134 Bq/sample 4.90 4.79 3.35 - 6.23 ACs-137 Bq/sample 6.78 5.88 4.12 - 7.64 ACo-57 Bq/sample 10.2 8.27 5.79 - 10.75 WCo-60 Bq/sample 0.00 (1) AMn-54 Bq/sample 7.36 6.287 4.401 - 8.173 ASr-90 Bq/sample 2.53 2.63 1.84 - 3.42 AZn-65 Bq/sample 6.40 5.3900 3.77 - 7.01 A
(1) False positive test.(a) Teledyne Brown Engineering reported result.(b) The MAPEP known value is equal to 100% of the parameter present in the standard as determined by gravimetric and/or volumetric measurements made during standard preparation.(c) DOE/MAPEP evaluation: A=acceptable, W=acceptable with warning, N=not acceptable.
TABLE D-3 DOE'S MIXED ANALYTE PERFORMANCE EVALUATION PROGRAM (MAPEP)TELEDYNE BROWN ENGINEERING, 2010
(PAGE 2 OF 2)
D-6
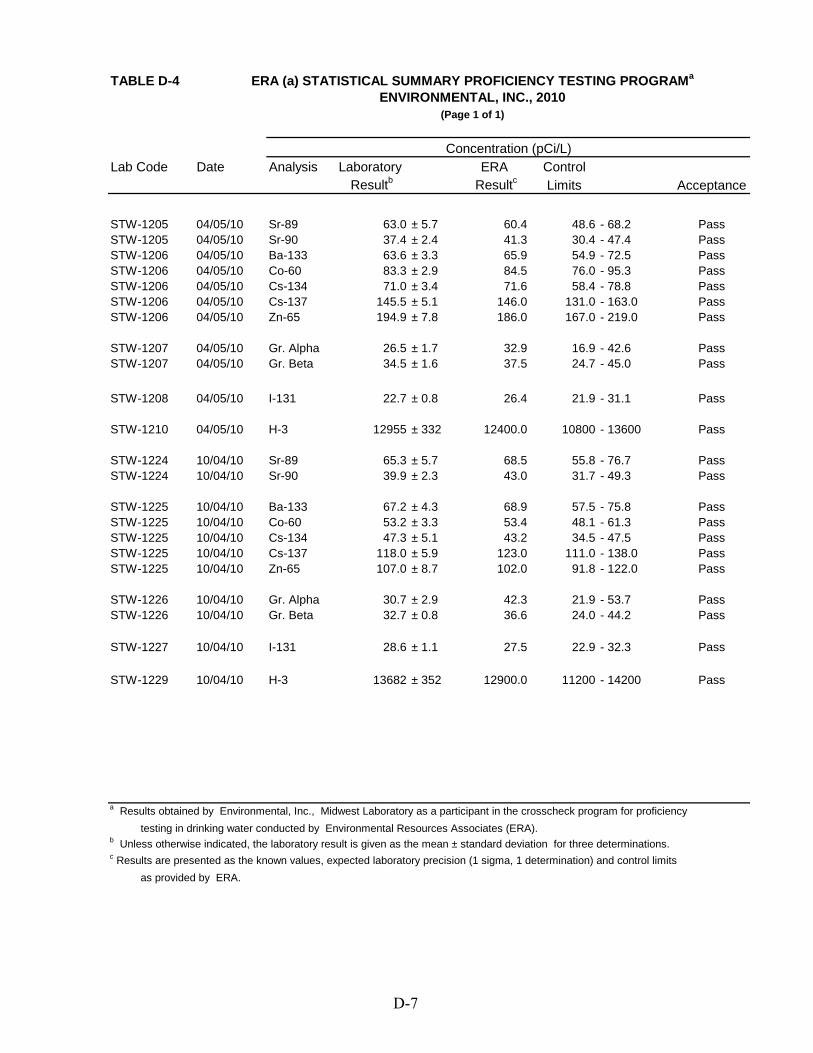
TABLE D-4
Concentration (pCi/L)Lab Code Date Analysis Laboratory ERA Control
Resultb Resultc Limits Acceptance
STW-1205 04/05/10 Sr-89 63.0 ± 5.7 60.4 48.6 - 68.2 PassSTW-1205 04/05/10 Sr-90 37.4 ± 2.4 41.3 30.4 - 47.4 PassSTW-1206 04/05/10 Ba-133 63.6 ± 3.3 65.9 54.9 - 72.5 PassSTW-1206 04/05/10 Co-60 83.3 ± 2.9 84.5 76.0 - 95.3 PassSTW-1206 04/05/10 Cs-134 71.0 ± 3.4 71.6 58.4 - 78.8 PassSTW-1206 04/05/10 Cs-137 145.5 ± 5.1 146.0 131.0 - 163.0 PassSTW-1206 04/05/10 Zn-65 194.9 ± 7.8 186.0 167.0 - 219.0 Pass
STW-1207 04/05/10 Gr. Alpha 26.5 ± 1.7 32.9 16.9 - 42.6 PassSTW-1207 04/05/10 Gr. Beta 34.5 ± 1.6 37.5 24.7 - 45.0 Pass
STW-1208 04/05/10 I-131 22.7 ± 0.8 26.4 21.9 - 31.1 Pass
STW-1210 04/05/10 H-3 12955 ± 332 12400.0 10800 - 13600 Pass
STW-1224 10/04/10 Sr-89 65.3 ± 5.7 68.5 55.8 - 76.7 PassSTW-1224 10/04/10 Sr-90 39.9 ± 2.3 43.0 31.7 - 49.3 Pass
STW-1225 10/04/10 Ba-133 67.2 ± 4.3 68.9 57.5 - 75.8 PassSTW-1225 10/04/10 Co-60 53.2 ± 3.3 53.4 48.1 - 61.3 PassSTW-1225 10/04/10 Cs-134 47.3 ± 5.1 43.2 34.5 - 47.5 PassSTW-1225 10/04/10 Cs-137 118.0 ± 5.9 123.0 111.0 - 138.0 PassSTW-1225 10/04/10 Zn-65 107.0 ± 8.7 102.0 91.8 - 122.0 Pass
STW-1226 10/04/10 Gr. Alpha 30.7 ± 2.9 42.3 21.9 - 53.7 PassSTW-1226 10/04/10 Gr. Beta 32.7 ± 0.8 36.6 24.0 - 44.2 Pass
STW-1227 10/04/10 I-131 28.6 ± 1.1 27.5 22.9 - 32.3 Pass
STW-1229 10/04/10 H-3 13682 ± 352 12900.0 11200 - 14200 Pass
a Results obtained by Environmental, Inc., Midwest Laboratory as a participant in the crosscheck program for proficiency testing in drinking water conducted by Environmental Resources Associates (ERA).b Unless otherwise indicated, the laboratory result is given as the mean ± standard deviation for three determinations.c Results are presented as the known values, expected laboratory precision (1 sigma, 1 determination) and control limits as provided by ERA.
ERA (a) STATISTICAL SUMMARY PROFICIENCY TESTING PROGRAMa
ENVIRONMENTAL, INC., 2010(Page 1 of 1)
D-7
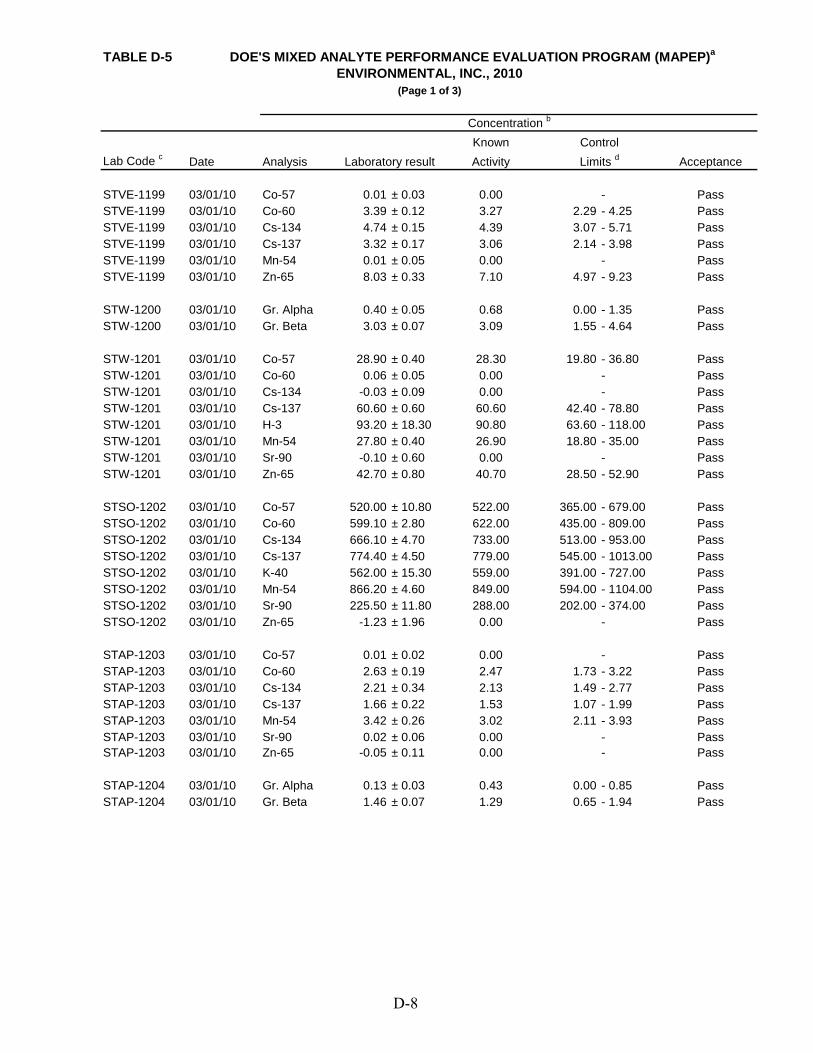
TABLE D-5
KnownLab Code c Date Analysis Activity Acceptance
STVE-1199 03/01/10 Co-57 0.01 ± 0.03 0.00 - PassSTVE-1199 03/01/10 Co-60 3.39 ± 0.12 3.27 2.29 - 4.25 PassSTVE-1199 03/01/10 Cs-134 4.74 ± 0.15 4.39 3.07 - 5.71 PassSTVE-1199 03/01/10 Cs-137 3.32 ± 0.17 3.06 2.14 - 3.98 PassSTVE-1199 03/01/10 Mn-54 0.01 ± 0.05 0.00 - PassSTVE-1199 03/01/10 Zn-65 8.03 ± 0.33 7.10 4.97 - 9.23 Pass
STW-1200 03/01/10 Gr. Alpha 0.40 ± 0.05 0.68 0.00 - 1.35 PassSTW-1200 03/01/10 Gr. Beta 3.03 ± 0.07 3.09 1.55 - 4.64 Pass
STW-1201 03/01/10 Co-57 28.90 ± 0.40 28.30 19.80 - 36.80 PassSTW-1201 03/01/10 Co-60 0.06 ± 0.05 0.00 - PassSTW-1201 03/01/10 Cs-134 -0.03 ± 0.09 0.00 - PassSTW-1201 03/01/10 Cs-137 60.60 ± 0.60 60.60 42.40 - 78.80 PassSTW-1201 03/01/10 H-3 93.20 ± 18.30 90.80 63.60 - 118.00 PassSTW-1201 03/01/10 Mn-54 27.80 ± 0.40 26.90 18.80 - 35.00 PassSTW-1201 03/01/10 Sr-90 -0.10 ± 0.60 0.00 - PassSTW-1201 03/01/10 Zn-65 42.70 ± 0.80 40.70 28.50 - 52.90 Pass
STSO-1202 03/01/10 Co-57 520.00 ± 10.80 522.00 365.00 - 679.00 PassSTSO-1202 03/01/10 Co-60 599.10 ± 2.80 622.00 435.00 - 809.00 PassSTSO-1202 03/01/10 Cs-134 666.10 ± 4.70 733.00 513.00 - 953.00 PassSTSO-1202 03/01/10 Cs-137 774.40 ± 4.50 779.00 545.00 - 1013.00 PassSTSO-1202 03/01/10 K-40 562.00 ± 15.30 559.00 391.00 - 727.00 PassSTSO-1202 03/01/10 Mn-54 866.20 ± 4.60 849.00 594.00 - 1104.00 PassSTSO-1202 03/01/10 Sr-90 225.50 ± 11.80 288.00 202.00 - 374.00 PassSTSO-1202 03/01/10 Zn-65 -1.23 ± 1.96 0.00 - Pass
STAP-1203 03/01/10 Co-57 0.01 ± 0.02 0.00 - PassSTAP-1203 03/01/10 Co-60 2.63 ± 0.19 2.47 1.73 - 3.22 PassSTAP-1203 03/01/10 Cs-134 2.21 ± 0.34 2.13 1.49 - 2.77 PassSTAP-1203 03/01/10 Cs-137 1.66 ± 0.22 1.53 1.07 - 1.99 PassSTAP-1203 03/01/10 Mn-54 3.42 ± 0.26 3.02 2.11 - 3.93 PassSTAP-1203 03/01/10 Sr-90 0.02 ± 0.06 0.00 - PassSTAP-1203 03/01/10 Zn-65 -0.05 ± 0.11 0.00 - Pass
STAP-1204 03/01/10 Gr. Alpha 0.13 ± 0.03 0.43 0.00 - 0.85 PassSTAP-1204 03/01/10 Gr. Beta 1.46 ± 0.07 1.29 0.65 - 1.94 Pass
ControlLaboratory result Limits d
DOE'S MIXED ANALYTE PERFORMANCE EVALUATION PROGRAM (MAPEP)a
ENVIRONMENTAL, INC., 2010(Page 1 of 3)
Concentration b
D-8
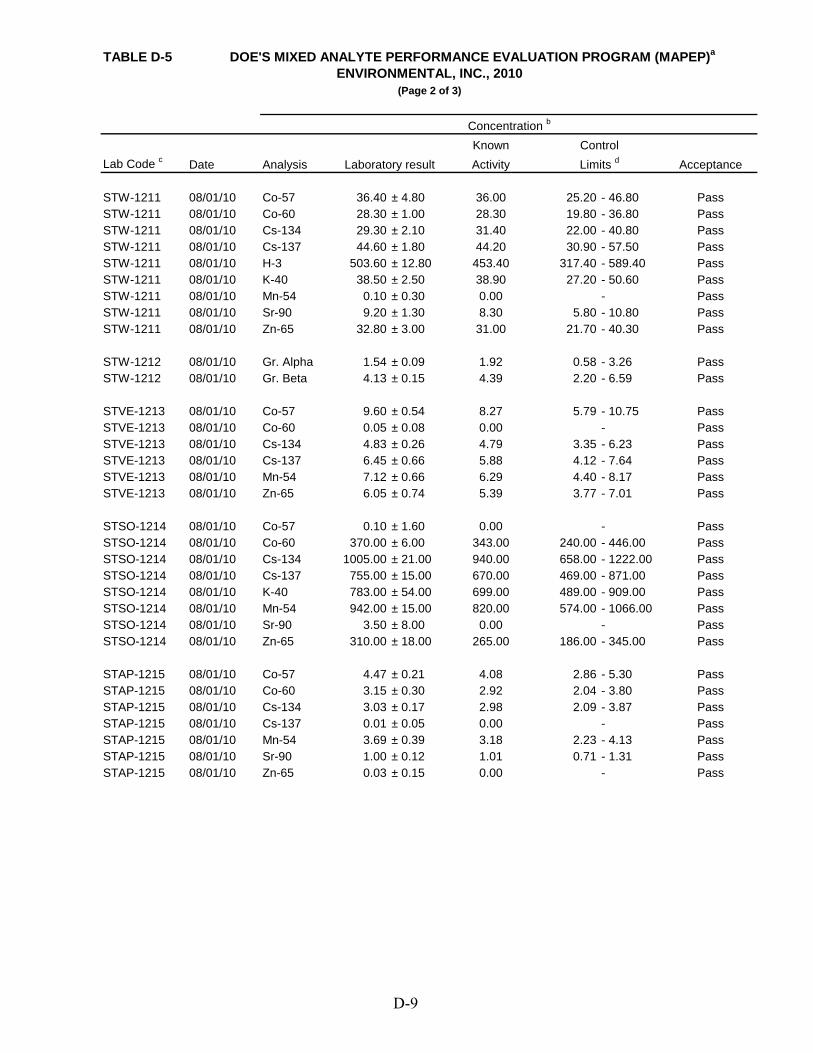
TABLE D-5
KnownLab Code c Date Analysis Activity Acceptance
STW-1211 08/01/10 Co-57 36.40 ± 4.80 36.00 25.20 - 46.80 PassSTW-1211 08/01/10 Co-60 28.30 ± 1.00 28.30 19.80 - 36.80 PassSTW-1211 08/01/10 Cs-134 29.30 ± 2.10 31.40 22.00 - 40.80 PassSTW-1211 08/01/10 Cs-137 44.60 ± 1.80 44.20 30.90 - 57.50 PassSTW-1211 08/01/10 H-3 503.60 ± 12.80 453.40 317.40 - 589.40 PassSTW-1211 08/01/10 K-40 38.50 ± 2.50 38.90 27.20 - 50.60 PassSTW-1211 08/01/10 Mn-54 0.10 ± 0.30 0.00 - PassSTW-1211 08/01/10 Sr-90 9.20 ± 1.30 8.30 5.80 - 10.80 PassSTW-1211 08/01/10 Zn-65 32.80 ± 3.00 31.00 21.70 - 40.30 Pass
STW-1212 08/01/10 Gr. Alpha 1.54 ± 0.09 1.92 0.58 - 3.26 PassSTW-1212 08/01/10 Gr. Beta 4.13 ± 0.15 4.39 2.20 - 6.59 Pass
STVE-1213 08/01/10 Co-57 9.60 ± 0.54 8.27 5.79 - 10.75 PassSTVE-1213 08/01/10 Co-60 0.05 ± 0.08 0.00 - PassSTVE-1213 08/01/10 Cs-134 4.83 ± 0.26 4.79 3.35 - 6.23 PassSTVE-1213 08/01/10 Cs-137 6.45 ± 0.66 5.88 4.12 - 7.64 PassSTVE-1213 08/01/10 Mn-54 7.12 ± 0.66 6.29 4.40 - 8.17 PassSTVE-1213 08/01/10 Zn-65 6.05 ± 0.74 5.39 3.77 - 7.01 Pass
STSO-1214 08/01/10 Co-57 0.10 ± 1.60 0.00 - PassSTSO-1214 08/01/10 Co-60 370.00 ± 6.00 343.00 240.00 - 446.00 PassSTSO-1214 08/01/10 Cs-134 1005.00 ± 21.00 940.00 658.00 - 1222.00 PassSTSO-1214 08/01/10 Cs-137 755.00 ± 15.00 670.00 469.00 - 871.00 PassSTSO-1214 08/01/10 K-40 783.00 ± 54.00 699.00 489.00 - 909.00 PassSTSO-1214 08/01/10 Mn-54 942.00 ± 15.00 820.00 574.00 - 1066.00 PassSTSO-1214 08/01/10 Sr-90 3.50 ± 8.00 0.00 - PassSTSO-1214 08/01/10 Zn-65 310.00 ± 18.00 265.00 186.00 - 345.00 Pass
STAP-1215 08/01/10 Co-57 4.47 ± 0.21 4.08 2.86 - 5.30 PassSTAP-1215 08/01/10 Co-60 3.15 ± 0.30 2.92 2.04 - 3.80 PassSTAP-1215 08/01/10 Cs-134 3.03 ± 0.17 2.98 2.09 - 3.87 PassSTAP-1215 08/01/10 Cs-137 0.01 ± 0.05 0.00 - PassSTAP-1215 08/01/10 Mn-54 3.69 ± 0.39 3.18 2.23 - 4.13 PassSTAP-1215 08/01/10 Sr-90 1.00 ± 0.12 1.01 0.71 - 1.31 PassSTAP-1215 08/01/10 Zn-65 0.03 ± 0.15 0.00 - Pass
Control
ENVIRONMENTAL, INC., 2010
Laboratory result Limits d
(Page 2 of 3)
Concentration b
DOE'S MIXED ANALYTE PERFORMANCE EVALUATION PROGRAM (MAPEP)a
D-9
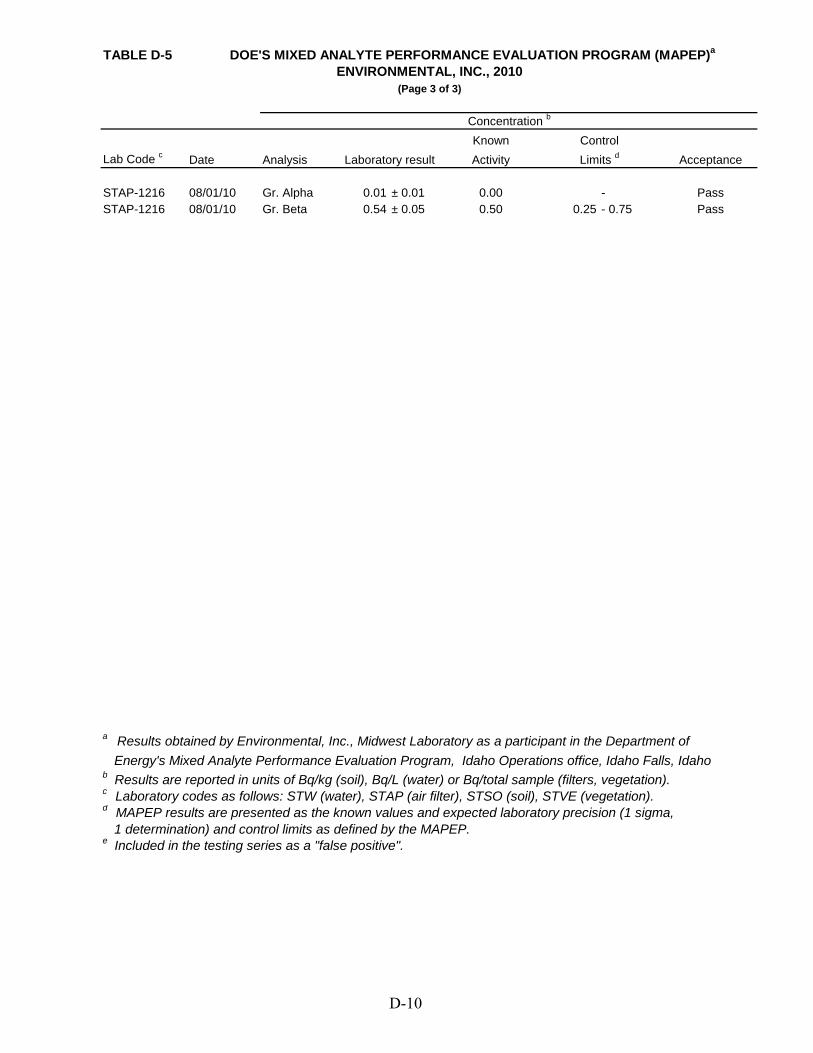
TABLE D-5
KnownLab Code c Date Analysis Activity Acceptance
STAP-1216 08/01/10 Gr. Alpha 0.01 ± 0.01 0.00 - PassSTAP-1216 08/01/10 Gr. Beta 0.54 ± 0.05 0.50 0.25 - 0.75 Pass
a Results obtained by Environmental, Inc., Midwest Laboratory as a participant in the Department of Energy's Mixed Analyte Performance Evaluation Program, Idaho Operations office, Idaho Falls, Idahob Results are reported in units of Bq/kg (soil), Bq/L (water) or Bq/total sample (filters, vegetation).c Laboratory codes as follows: STW (water), STAP (air filter), STSO (soil), STVE (vegetation). d MAPEP results are presented as the known values and expected laboratory precision (1 sigma, 1 determination) and control limits as defined by the MAPEP.e Included in the testing series as a "false positive".
ControlLaboratory result Limits d
DOE'S MIXED ANALYTE PERFORMANCE EVALUATION PROGRAM (MAPEP)a
ENVIRONMENTAL, INC., 2010(Page 3 of 3)
Concentration b
D-10
APPENDIX E
EFFLUENT DATA

i
TABLE OF CONTENTS
INTRODUCTION ................................................................................................................. 1
SUMMARY ........................................................................................................................... 2
1.0. EFFLUENTS ..................................................................................................... 3 1.1. Gaseous Effluents to the Atmosphere .................................................. 3 1.2. Liquids Released to Lake Michigan ....................................................... 3
2.0. SOLID RADIOACTIVE WASTE ....................................................................... 3 3.0. DOSE TO MAN................................................................................................. 3
3.1. Gaseous Effluent Pathways .................................................................. 3 3.1.1. Gaseous Releases .................................................................. 4
3.1.1.1. Gamma Dose Rates .................................................. 4 3.1.1.2. Beta Air and Skin Dose Rate .................................... 4
3.1.2. Radioactive Iodine ................................................................... 5 3.1.3. Dose to Thyroid ....................................................................... 5
3.2. Liquid Effluent Pathways ....................................................................... 5 3.3. Assessment of Dose to Member of Public ............................................ 5
4.0. SITE METEOROLOGY .................................................................................... 6
ii
Table of Contents (cont.)
APPENDIX E-1 DATA TABLES AND FIGURES ............................................................. E-1.1 Station Releases Table 2.0-1 Solid Radioactive Waste........................................................... E-1.2 Table 3.1-1 Maximum Doses Resulting from Airborne Releases ................ E-1.3 Table 3.2-1 Maximum Doses Resulting from Liquid Effluents ..................... E-1.5 Table 3.3-1 10CFR20 Compliance Assessment .......................................... E-1.6 Table 3.4-1 Maximum doses Resulting from Airborne Releases Based On Concurrent Meteorological Data ......................................... E-1.7
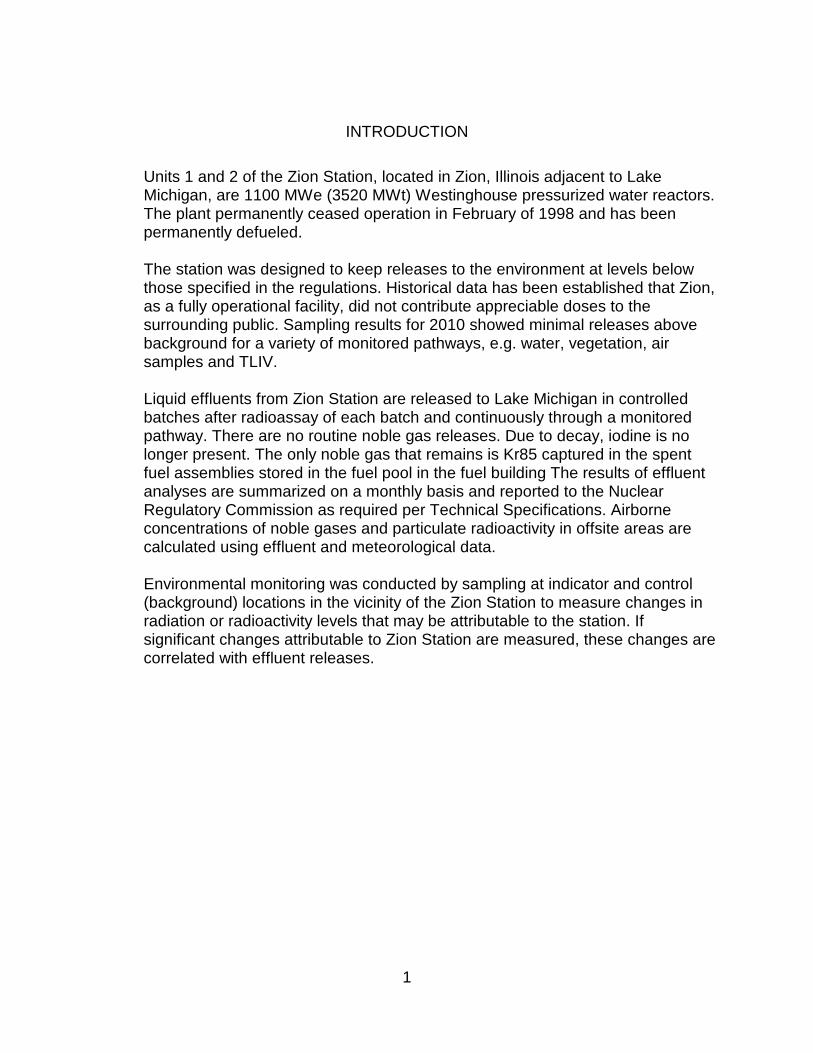
1
INTRODUCTION
Units 1 and 2 of the Zion Station, located in Zion, Illinois adjacent to Lake Michigan, are 1100 MWe (3520 MWt) Westinghouse pressurized water reactors. The plant permanently ceased operation in February of 1998 and has been permanently defueled. The station was designed to keep releases to the environment at levels below those specified in the regulations. Historical data has been established that Zion, as a fully operational facility, did not contribute appreciable doses to the surrounding public. Sampling results for 2010 showed minimal releases above background for a variety of monitored pathways, e.g. water, vegetation, air samples and TLIV. Liquid effluents from Zion Station are released to Lake Michigan in controlled batches after radioassay of each batch and continuously through a monitored pathway. There are no routine noble gas releases. Due to decay, iodine is no longer present. The only noble gas that remains is Kr85 captured in the spent fuel assemblies stored in the fuel pool in the fuel building The results of effluent analyses are summarized on a monthly basis and reported to the Nuclear Regulatory Commission as required per Technical Specifications. Airborne concentrations of noble gases and particulate radioactivity in offsite areas are calculated using effluent and meteorological data. Environmental monitoring was conducted by sampling at indicator and control (background) locations in the vicinity of the Zion Station to measure changes in radiation or radioactivity levels that may be attributable to the station. If significant changes attributable to Zion Station are measured, these changes are correlated with effluent releases.
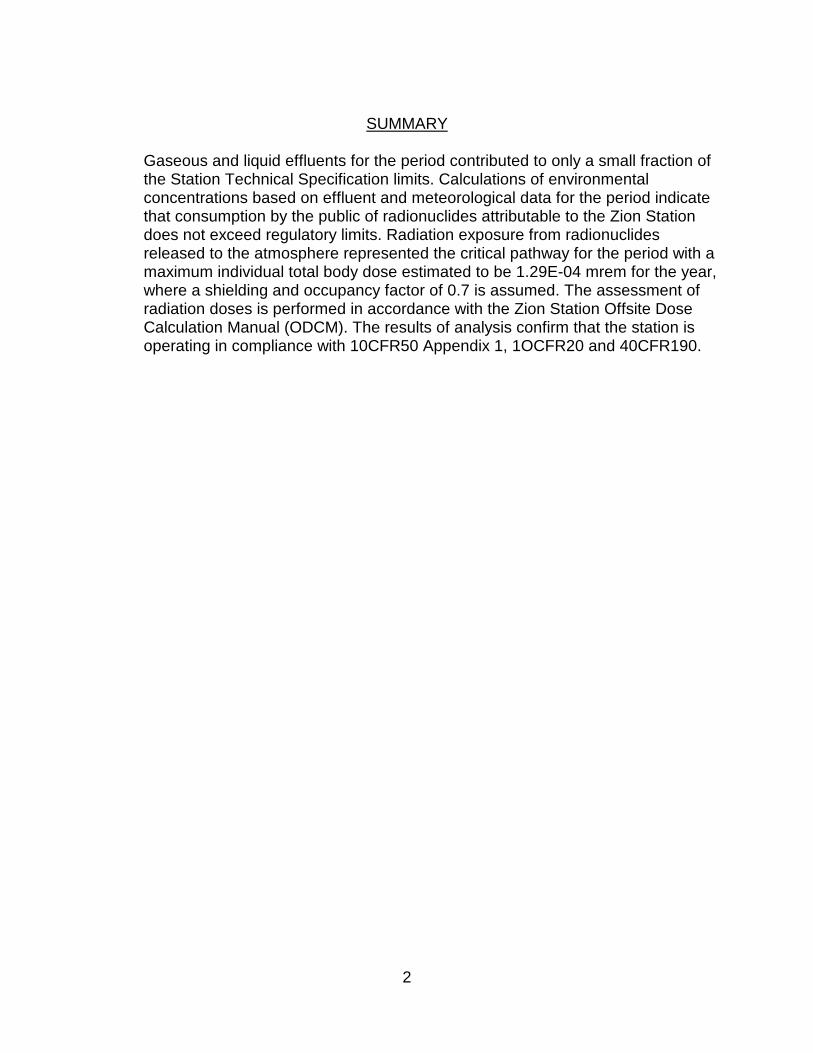
2
SUMMARY
Gaseous and liquid effluents for the period contributed to only a small fraction of the Station Technical Specification limits. Calculations of environmental concentrations based on effluent and meteorological data for the period indicate that consumption by the public of radionuclides attributable to the Zion Station does not exceed regulatory limits. Radiation exposure from radionuclides released to the atmosphere represented the critical pathway for the period with a maximum individual total body dose estimated to be 1.29E-04 mrem for the year, where a shielding and occupancy factor of 0.7 is assumed. The assessment of radiation doses is performed in accordance with the Zion Station Offsite Dose Calculation Manual (ODCM). The results of analysis confirm that the station is operating in compliance with 10CFR50 Appendix 1, 1OCFR20 and 40CFR190.
3
1.0 EFFLUENTS 1.1
Gaseous Effluents to the Atmosphere
Measured concentrations and isotopic composition of noble gases and particulate radioactivity released to the atmosphere were monitored during the year. A total of 0.00E+00 microcuries of fission and activation gases was released with a maximum average release rate of 0.00E+00 µCi/sec during any one quarter period.
A total of 0.00E+00 microcuries of beta-gamma emitters was released as airborne particulate matter with a maximum average quarterly release rate of 0.00E+00 µCi/sec. quarterly only. Alpha-emitting radionuclides were not measurable. Also, 5.08E-02 curies of tritium were released with a maximum average quarterly release rate of 8.35E-04 µCi/sec.
1.2
Liquids Released to Lake Michigan
A total of 2.74E+07 liters of liquid waste containing 0.00E+00 microcuries was discharged from the station via an approved pathway after dilution with a total of 4.37E+10 liters of water. These wastes were released at a maximum quarterly average concentration of 0.00E+00 µCi/ml. A total of 0.00E-00 curies of tritium was released. Alpha activity released totaled 0.00 µCi for the year. Monthly release estimates and principal radionuclides in liquid effluents are reported in the Zion Nuclear Power Station Radioactive Effluent Report for 2010.
2.0
SOLID RADIOACTIVE WASTE
There were NO solid radioactive waste shipment in 2010.
3.0
DOSE TO MAN
3.1
Gaseous Effluent Pathways
Table 3.1-1 summarizes the doses resulting from releases of airborne radioactivity via the different exposure pathways.
4
3.1.1
Gaseous Releases
3.1.1.1
Gamma Dose Rates
Offsite Gamma air and whole (total) body dose rates are shown in Table 3.1-1 and were calculated based on measured release rates, isotopic composition of the gases, and meteorological data for the period. Based on measured effluents and average meteorological data, the maximum total body dose to an individual would be 1.29 E-04 mrem (child) for the year (Table 3.1-1), with an occupancy or shielding factor of 0.7 included, and based on measured effluents and concurrent meteorological data would be 0.00E+00 mrem (Table 3.4-1). The maximum gamma air dose was 0.00E+00 mrad based on measured effluents and average meteorological data (Table 3.1-1), and 0.00E+00 mrad based on measured effluents and concurrent meteorological data (Table 3.4-1).
3.1.1.2
Beta Air and Skin Dose Rates
The range of beta particles in air is relatively small (on the order of a few meters or less); consequently, plumes of gaseous effluents may be considered "infinite" for purpose of calculating the dose from beta radiation incident on the skin. However, the actual dose to sensitive skin tissues is difficult to calculate due to the effect of the beta particle energies, thickness of inert skin and clothing covering sensitive tissues. For purposes of this report the skin is taken to have a thickness of 7.0 mg/cm2 and an occupancy factor of 1.0 is used. The skin dose from beta and gamma radiation for the year was 0.00E+00 mrem based on measured effluents and average meteorological data (Table 3.1-1), and 0.00E+00 mrem based on measured effluents and concurrent meteorological data (Table 3.4-1).
5
The maximum offsite beta air dose for the year was 0.00E+00 mrad based on measured effluents and average meteorological data (Table 3.1-1), and 0.00E+00 mrad based on measured effluents and concurrent meteorological data (Table 3.4-1).
3.1.2
Radioactive Iodine
The human thyroid exhibits a significant capacity to concentrate ingested or inhaled iodine. The radioiodine, 1-131, released during routine operation of the station, may be made available to man resulting in a dose to the thyroid. The principal pathway of interest for this radionuclide is ingestion of radioiodine in milk. As Zion Station is not operational and I-131 has decayed away, the maximum offsite concentration is estimated to be zero, as expected.
3.1.3
Dose to Thyroid
The hypothetical thyroid dose to a maximum exposed individual living near the station via ingestion of milk was calculated. As Zion Station is not operational and 1-131 has decayed away, the maximum offsite concentration is estimated to be zero, as expected.
3.2
Liquid Effluent Pathways
The three principal pathways through the aquatic environment for potential doses to man from liquid waste are ingestion of potable water, eating aquatic foods, and exposure while on the shoreline. Not all of these pathways are significant or applicable at a given time but a reasonable approximation of the dose can be made by adjusting the dose formula for season of the year or type and degree of use of the aquatic environment. NRC developed equations* were used to calculate the doses to the whole body, lower GI tracts, thyroid, bone, skin; specific parameters for use in the equations are given in the Zion Station Offsite Dose Calculation Manual. The maximum whole body dose (total body) for the year was 0.00E+00 mrem and no organ dose exceeded 0.00E+00 mrem (Table 3.2-1).
3.3
Assessment of Dose to Member of Public
During the period January to December, 2010, Zion Station did not
6
exceed the below limits as shown in Table 3.1-1 and Table 3.2-1 (based on yearly average meteorological data), and Figure 3.1-1 (based on concurrent meteorological data):
• The RETS limits on dose or dose commitment to an
individual due to radioactive materials in liquid effluents from each reactor unit (3 mrem to the whole body or 10 mrem to any organ during any calendar year).
• The RETS limits on air dose in noble gases released in
gaseous effluents to a member of the public from each reactor unit (10 mrads for gamma radiation or 20 mrad for beta radiation during any calendar year).
• The RETS limits on dose to a member of the public due to
iodine-131, iodine-133, tritium, and radionuclides in particulate form 'with half-lives greater than eight days in gaseous effluents released from each reactor unit (15 mrem to any organ during any calendar year).
• The 10CFR20 limit on Total Effective Dose Equivalent to
individual members of the public (100 mrem).
4.0
SITE METEOROLOGY
A summary of the site meteorological measurements taken during each calendar quarter of the year is given in Appendix 11. The data are presented as cumulative joint frequency
*Nuclear Regulatory Commission, Regulatory Guide 1.109 (Rev. 1) distributions of the wind direction for the 250' level and wind speed class by atmospheric stability class determined from the temperature difference between the 250' and 35' levels. Data recovery for these measurements was 99.7% during 2010 (Table 3.4-1).

APPENDIX E-1
DATA TABLES AND FIGURES
E - 1.1E - 1.1
Table 2.0-1 Solid Radioactive Waste
Table 2.0-1 has been deliberately deleted. For details on solid waste disposal, see the Zion 2010 Annual Effluent Report
E-1.2
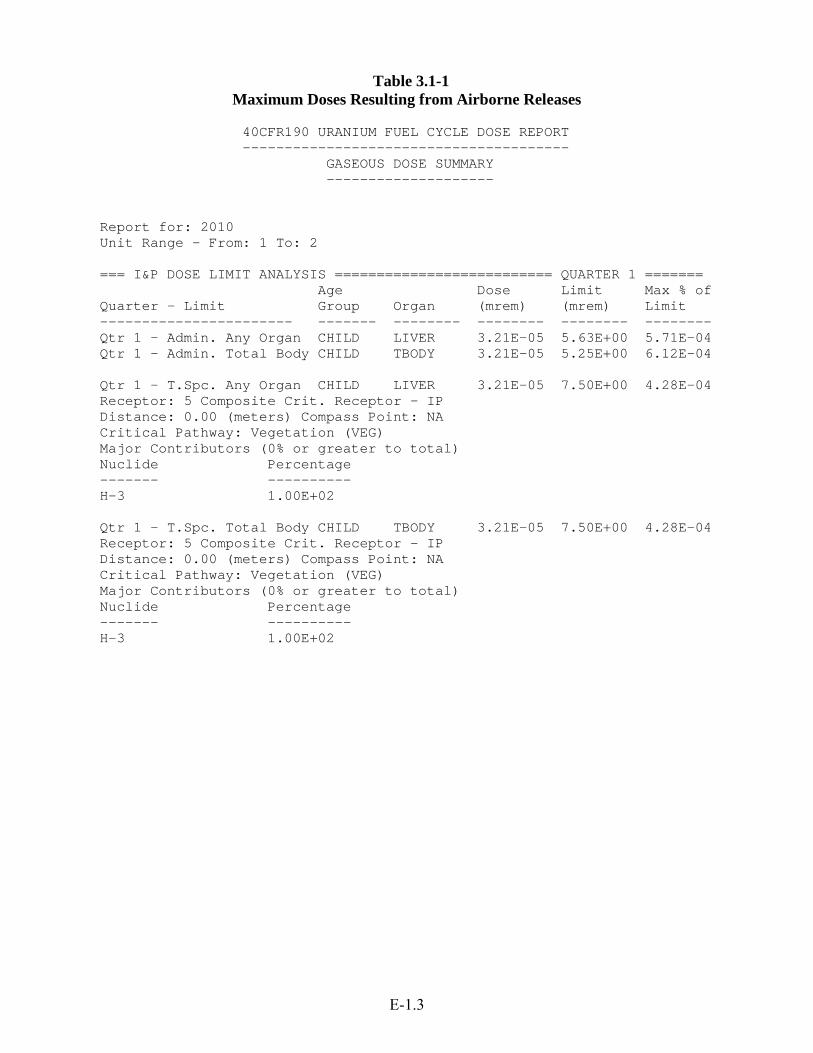
Table 3.1-1 Maximum Doses Resulting from Airborne Releases
40CFR190 URANIUM FUEL CYCLE DOSE REPORT --------------------------------------- GASEOUS DOSE SUMMARY -------------------- Report for: 2010 Unit Range - From: 1 To: 2 === I&P DOSE LIMIT ANALYSIS ========================== QUARTER 1 ======= Age Dose Limit Max % of Quarter - Limit Group Organ (mrem) (mrem) Limit ----------------------- ------- -------- -------- -------- -------- Qtr 1 - Admin. Any Organ CHILD LIVER 3.21E-05 5.63E+00 5.71E-04 Qtr 1 - Admin. Total Body CHILD TBODY 3.21E-05 5.25E+00 6.12E-04 Qtr 1 - T.Spc. Any Organ CHILD LIVER 3.21E-05 7.50E+00 4.28E-04 Receptor: 5 Composite Crit. Receptor - IP Distance: 0.00 (meters) Compass Point: NA Critical Pathway: Vegetation (VEG) Major Contributors (0% or greater to total) Nuclide Percentage ------- ---------- H-3 1.00E+02 Qtr 1 - T.Spc. Total Body CHILD TBODY 3.21E-05 7.50E+00 4.28E-04 Receptor: 5 Composite Crit. Receptor - IP Distance: 0.00 (meters) Compass Point: NA Critical Pathway: Vegetation (VEG) Major Contributors (0% or greater to total) Nuclide Percentage ------- ---------- H-3 1.00E+02
E-1.3
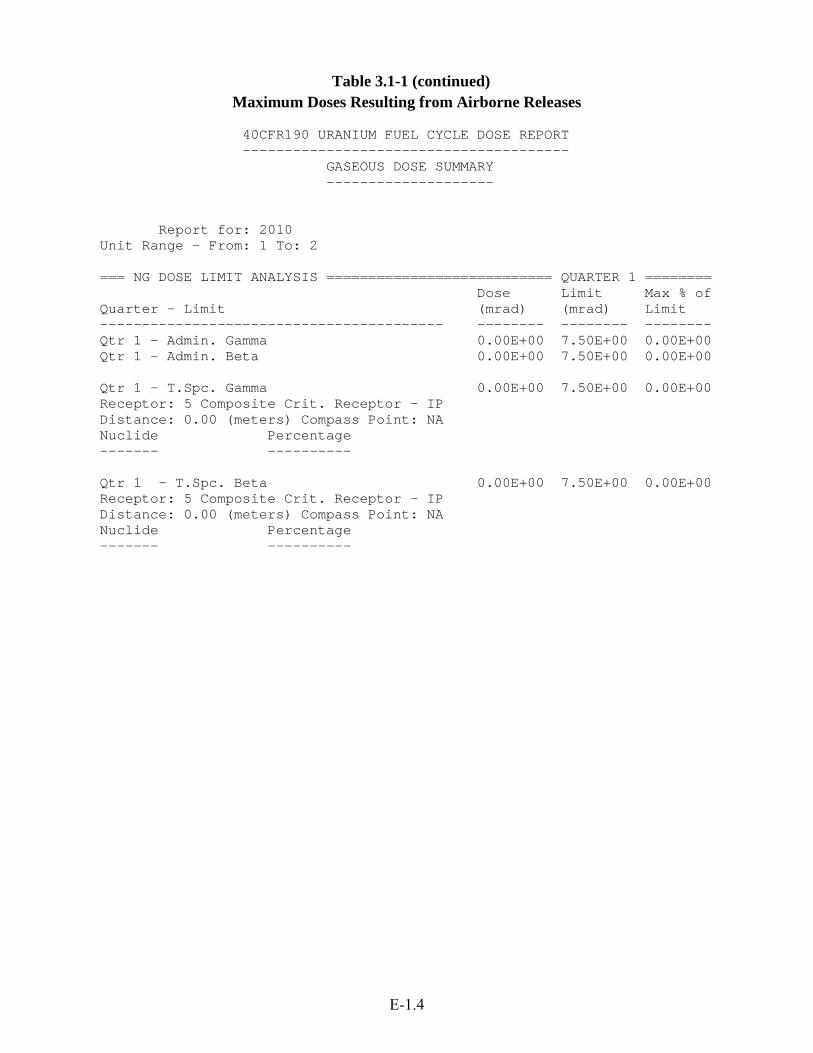
Table 3.1-1 (continued) Maximum Doses Resulting from Airborne Releases
40CFR190 URANIUM FUEL CYCLE DOSE REPORT --------------------------------------- GASEOUS DOSE SUMMARY -------------------- Report for: 2010 Unit Range - From: 1 To: 2 === NG DOSE LIMIT ANALYSIS =========================== QUARTER 1 ======== Dose Limit Max % of Quarter - Limit (mrad) (mrad) Limit ----------------------------------------- -------- -------- -------- Qtr 1 - Admin. Gamma 0.00E+00 7.50E+00 0.00E+00 Qtr 1 - Admin. Beta 0.00E+00 7.50E+00 0.00E+00 Qtr 1 - T.Spc. Gamma 0.00E+00 7.50E+00 0.00E+00 Receptor: 5 Composite Crit. Receptor - IP Distance: 0.00 (meters) Compass Point: NA Nuclide Percentage ------- ---------- Qtr 1 - T.Spc. Beta 0.00E+00 7.50E+00 0.00E+00 Receptor: 5 Composite Crit. Receptor - IP Distance: 0.00 (meters) Compass Point: NA Nuclide Percentage ------- ----------
E-1.4
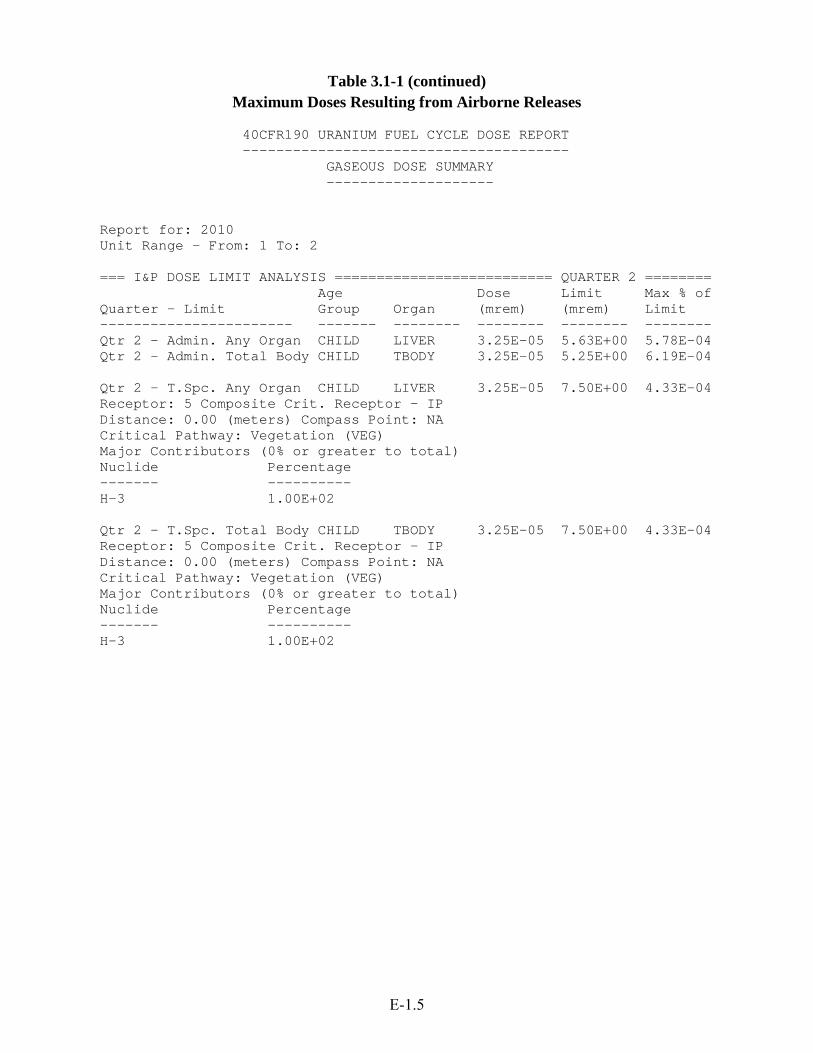
Table 3.1-1 (continued) Maximum Doses Resulting from Airborne Releases
40CFR190 URANIUM FUEL CYCLE DOSE REPORT --------------------------------------- GASEOUS DOSE SUMMARY -------------------- Report for: 2010 Unit Range - From: 1 To: 2 === I&P DOSE LIMIT ANALYSIS ========================== QUARTER 2 ======== Age Dose Limit Max % of Quarter - Limit Group Organ (mrem) (mrem) Limit ----------------------- ------- -------- -------- -------- -------- Qtr 2 - Admin. Any Organ CHILD LIVER 3.25E-05 5.63E+00 5.78E-04 Qtr 2 - Admin. Total Body CHILD TBODY 3.25E-05 5.25E+00 6.19E-04 Qtr 2 - T.Spc. Any Organ CHILD LIVER 3.25E-05 7.50E+00 4.33E-04 Receptor: 5 Composite Crit. Receptor - IP Distance: 0.00 (meters) Compass Point: NA Critical Pathway: Vegetation (VEG) Major Contributors (0% or greater to total) Nuclide Percentage ------- ---------- H-3 1.00E+02 Qtr 2 - T.Spc. Total Body CHILD TBODY 3.25E-05 7.50E+00 4.33E-04 Receptor: 5 Composite Crit. Receptor - IP Distance: 0.00 (meters) Compass Point: NA Critical Pathway: Vegetation (VEG) Major Contributors (0% or greater to total) Nuclide Percentage ------- ---------- H-3 1.00E+02
E-1.5
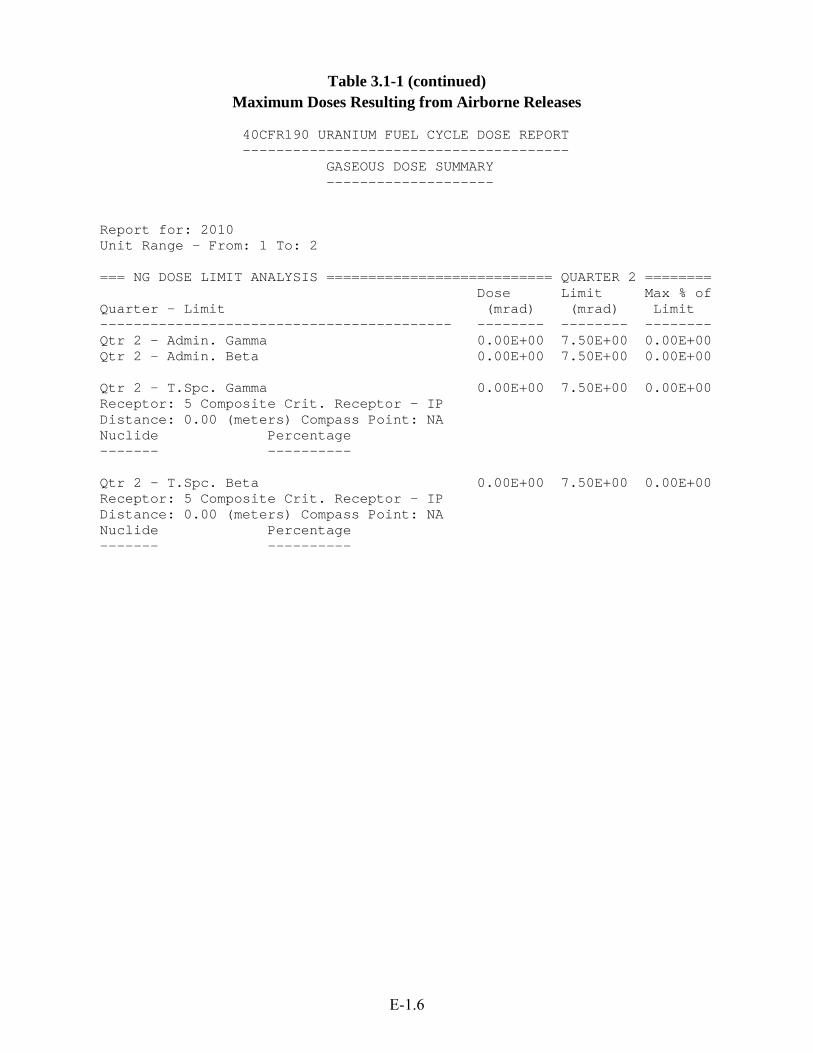
Table 3.1-1 (continued) Maximum Doses Resulting from Airborne Releases
40CFR190 URANIUM FUEL CYCLE DOSE REPORT --------------------------------------- GASEOUS DOSE SUMMARY -------------------- Report for: 2010 Unit Range - From: 1 To: 2 === NG DOSE LIMIT ANALYSIS =========================== QUARTER 2 ======== Dose Limit Max % of Quarter - Limit (mrad) (mrad) Limit ------------------------------------------ -------- -------- -------- Qtr 2 - Admin. Gamma 0.00E+00 7.50E+00 0.00E+00 Qtr 2 - Admin. Beta 0.00E+00 7.50E+00 0.00E+00 Qtr 2 - T.Spc. Gamma 0.00E+00 7.50E+00 0.00E+00 Receptor: 5 Composite Crit. Receptor - IP Distance: 0.00 (meters) Compass Point: NA Nuclide Percentage ------- ---------- Qtr 2 - T.Spc. Beta 0.00E+00 7.50E+00 0.00E+00 Receptor: 5 Composite Crit. Receptor - IP Distance: 0.00 (meters) Compass Point: NA Nuclide Percentage ------- ----------
E-1.6
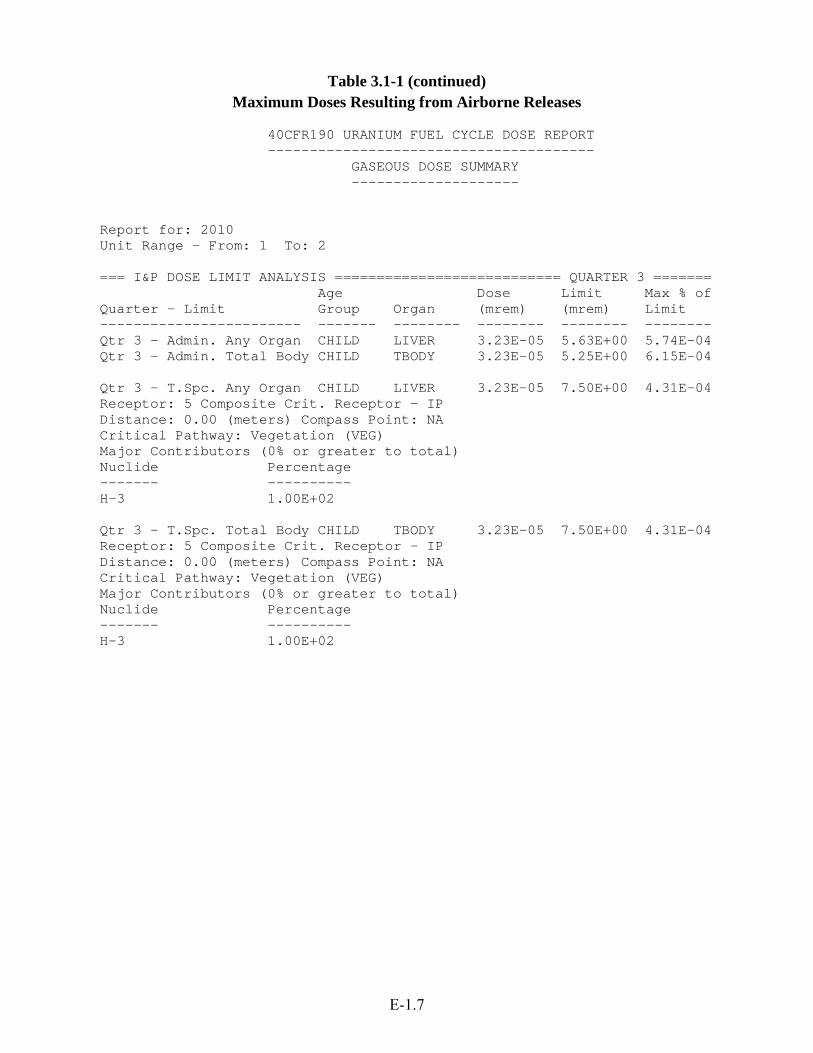
Table 3.1-1 (continued) Maximum Doses Resulting from Airborne Releases
40CFR190 URANIUM FUEL CYCLE DOSE REPORT --------------------------------------- GASEOUS DOSE SUMMARY -------------------- Report for: 2010 Unit Range - From: 1 To: 2 === I&P DOSE LIMIT ANALYSIS =========================== QUARTER 3 ======= Age Dose Limit Max % of Quarter - Limit Group Organ (mrem) (mrem) Limit ------------------------ ------- -------- -------- -------- -------- Qtr 3 - Admin. Any Organ CHILD LIVER 3.23E-05 5.63E+00 5.74E-04 Qtr 3 - Admin. Total Body CHILD TBODY 3.23E-05 5.25E+00 6.15E-04 Qtr 3 - T.Spc. Any Organ CHILD LIVER 3.23E-05 7.50E+00 4.31E-04 Receptor: 5 Composite Crit. Receptor - IP Distance: 0.00 (meters) Compass Point: NA Critical Pathway: Vegetation (VEG) Major Contributors (0% or greater to total) Nuclide Percentage ------- ---------- H-3 1.00E+02 Qtr 3 - T.Spc. Total Body CHILD TBODY 3.23E-05 7.50E+00 4.31E-04 Receptor: 5 Composite Crit. Receptor - IP Distance: 0.00 (meters) Compass Point: NA Critical Pathway: Vegetation (VEG) Major Contributors (0% or greater to total) Nuclide Percentage ------- ---------- H-3 1.00E+02
E-1.7

Table 3.1-1 (continued) Maximum Doses Resulting from Airborne Releases
40CFR190 URANIUM FUEL CYCLE DOSE REPORT --------------------------------------- GASEOUS DOSE SUMMARY -------------------- Report for: 2010 Unit Range - From: 1 To: 2 === NG DOSE LIMIT ANALYSIS =========================== QUARTER 3 ======== Dose Limit Max % of Quarter - Limit (mrad) (mrad) Limit ------------------------------------------ -------- -------- -------- Qtr 3 - Admin. Gamma 0.00E+00 7.50E+00 0.00E+00 Qtr 3 - Admin. Beta 0.00E+00 7.50E+00 0.00E+00 Qtr 3 - T.Spc. Gamma 0.00E+00 7.50E+00 0.00E+00 Receptor: 5 Composite Crit. Receptor - IP Distance: 0.00 (meters) Compass Point: NA Nuclide Percentage ------- ---------- Qtr 3 - T.Spc. Beta 0.00E+00 7.50E+00 0.00E+00 Receptor: 5 Composite Crit. Receptor - IP Distance: 0.00 (meters) Compass Point: NA Nuclide Percentage ------- ----------
E-1.8
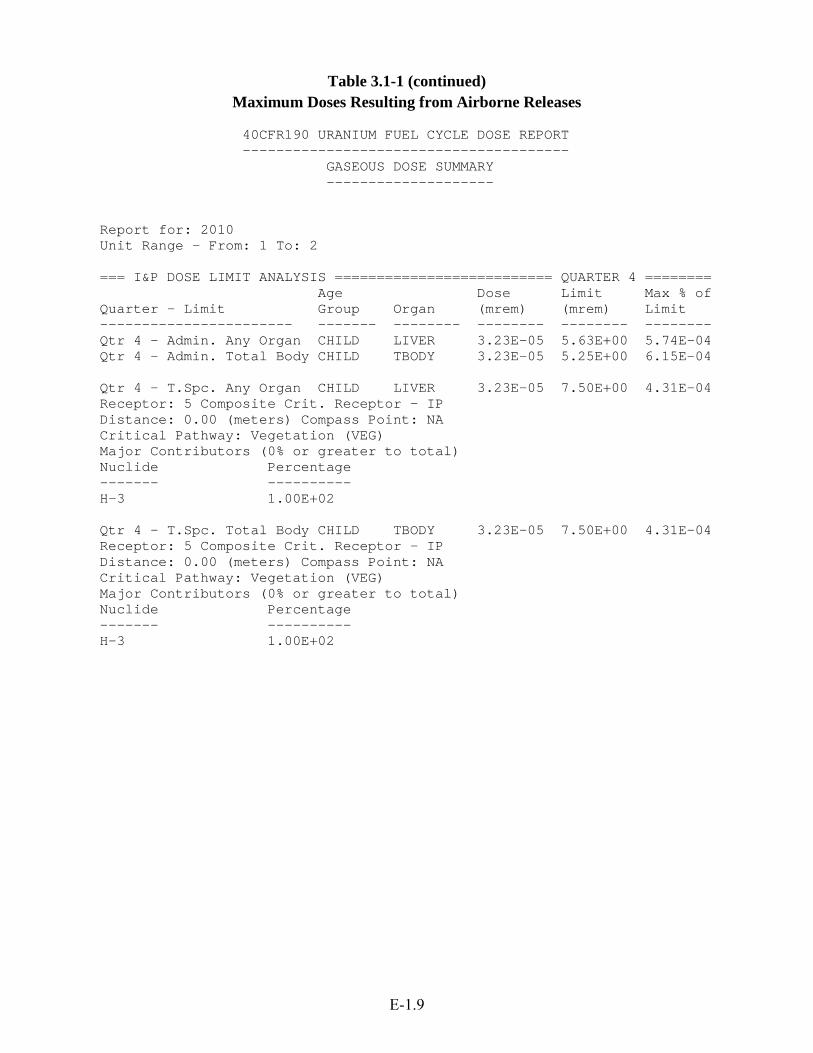
Table 3.1-1 (continued) Maximum Doses Resulting from Airborne Releases
40CFR190 URANIUM FUEL CYCLE DOSE REPORT --------------------------------------- GASEOUS DOSE SUMMARY -------------------- Report for: 2010 Unit Range - From: 1 To: 2 === I&P DOSE LIMIT ANALYSIS ========================== QUARTER 4 ======== Age Dose Limit Max % of Quarter - Limit Group Organ (mrem) (mrem) Limit ----------------------- ------- -------- -------- -------- -------- Qtr 4 - Admin. Any Organ CHILD LIVER 3.23E-05 5.63E+00 5.74E-04 Qtr 4 - Admin. Total Body CHILD TBODY 3.23E-05 5.25E+00 6.15E-04 Qtr 4 - T.Spc. Any Organ CHILD LIVER 3.23E-05 7.50E+00 4.31E-04 Receptor: 5 Composite Crit. Receptor - IP Distance: 0.00 (meters) Compass Point: NA Critical Pathway: Vegetation (VEG) Major Contributors (0% or greater to total) Nuclide Percentage ------- ---------- H-3 1.00E+02 Qtr 4 - T.Spc. Total Body CHILD TBODY 3.23E-05 7.50E+00 4.31E-04 Receptor: 5 Composite Crit. Receptor - IP Distance: 0.00 (meters) Compass Point: NA Critical Pathway: Vegetation (VEG) Major Contributors (0% or greater to total) Nuclide Percentage ------- ---------- H-3 1.00E+02
E-1.9
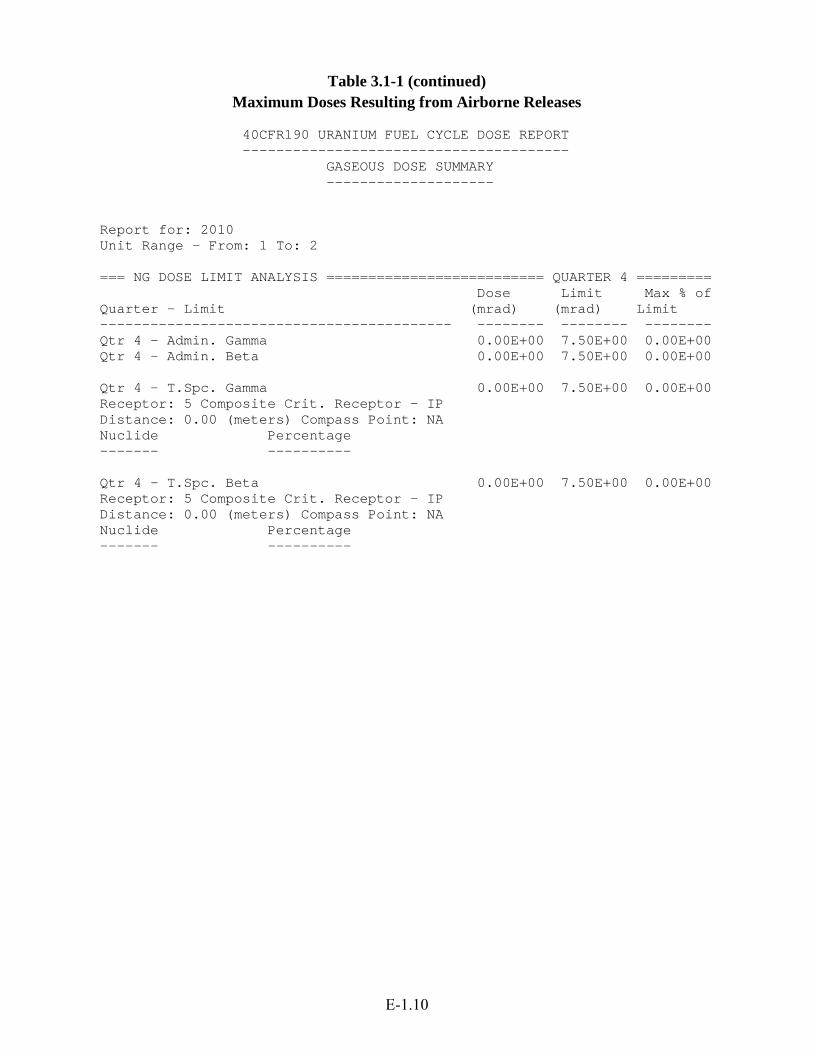
Table 3.1-1 (continued) Maximum Doses Resulting from Airborne Releases
40CFR190 URANIUM FUEL CYCLE DOSE REPORT --------------------------------------- GASEOUS DOSE SUMMARY -------------------- Report for: 2010 Unit Range - From: 1 To: 2 === NG DOSE LIMIT ANALYSIS ========================== QUARTER 4 ========= Dose Limit Max % of Quarter - Limit (mrad) (mrad) Limit ------------------------------------------ -------- -------- -------- Qtr 4 - Admin. Gamma 0.00E+00 7.50E+00 0.00E+00 Qtr 4 - Admin. Beta 0.00E+00 7.50E+00 0.00E+00 Qtr 4 - T.Spc. Gamma 0.00E+00 7.50E+00 0.00E+00 Receptor: 5 Composite Crit. Receptor - IP Distance: 0.00 (meters) Compass Point: NA Nuclide Percentage ------- ---------- Qtr 4 - T.Spc. Beta 0.00E+00 7.50E+00 0.00E+00 Receptor: 5 Composite Crit. Receptor - IP Distance: 0.00 (meters) Compass Point: NA Nuclide Percentage ------- ----------
E-1.10
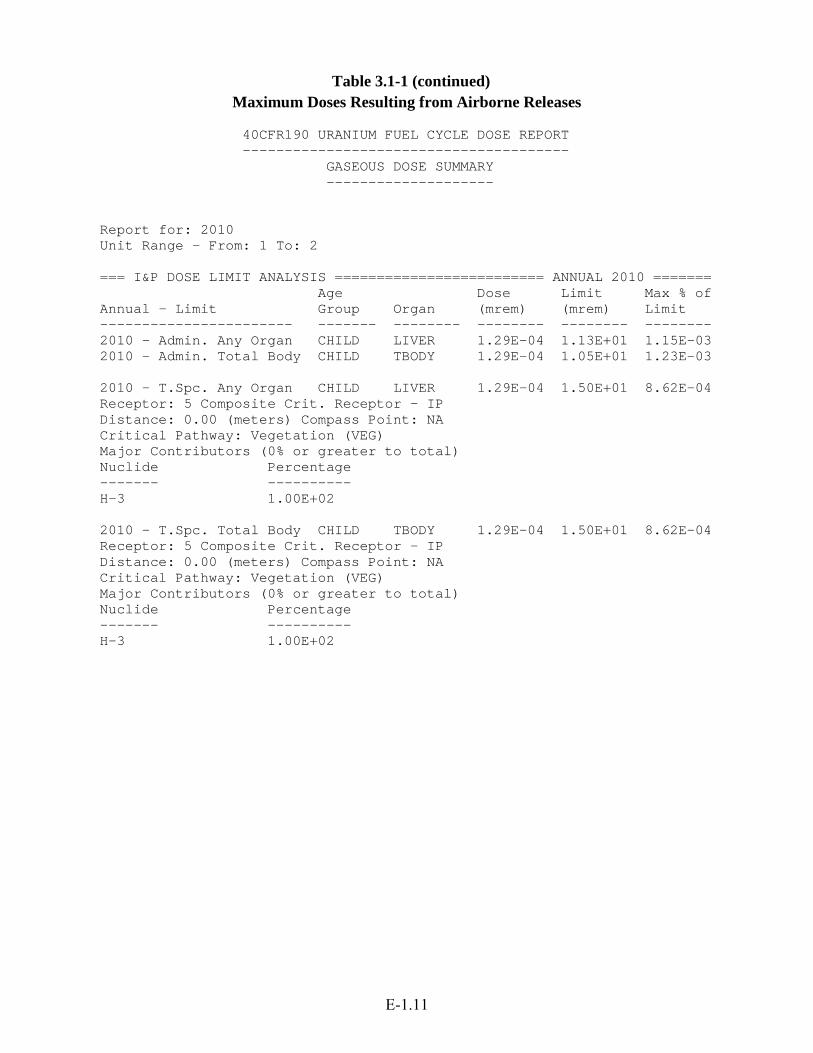
Table 3.1-1 (continued) Maximum Doses Resulting from Airborne Releases
40CFR190 URANIUM FUEL CYCLE DOSE REPORT --------------------------------------- GASEOUS DOSE SUMMARY -------------------- Report for: 2010 Unit Range - From: 1 To: 2 === I&P DOSE LIMIT ANALYSIS ========================= ANNUAL 2010 ======= Age Dose Limit Max % of Annual - Limit Group Organ (mrem) (mrem) Limit ----------------------- ------- -------- -------- -------- -------- 2010 - Admin. Any Organ CHILD LIVER 1.29E-04 1.13E+01 1.15E-03 2010 - Admin. Total Body CHILD TBODY 1.29E-04 1.05E+01 1.23E-03 2010 - T.Spc. Any Organ CHILD LIVER 1.29E-04 1.50E+01 8.62E-04 Receptor: 5 Composite Crit. Receptor - IP Distance: 0.00 (meters) Compass Point: NA Critical Pathway: Vegetation (VEG) Major Contributors (0% or greater to total) Nuclide Percentage ------- ---------- H-3 1.00E+02 2010 - T.Spc. Total Body CHILD TBODY 1.29E-04 1.50E+01 8.62E-04 Receptor: 5 Composite Crit. Receptor - IP Distance: 0.00 (meters) Compass Point: NA Critical Pathway: Vegetation (VEG) Major Contributors (0% or greater to total) Nuclide Percentage ------- ---------- H-3 1.00E+02
E-1.11
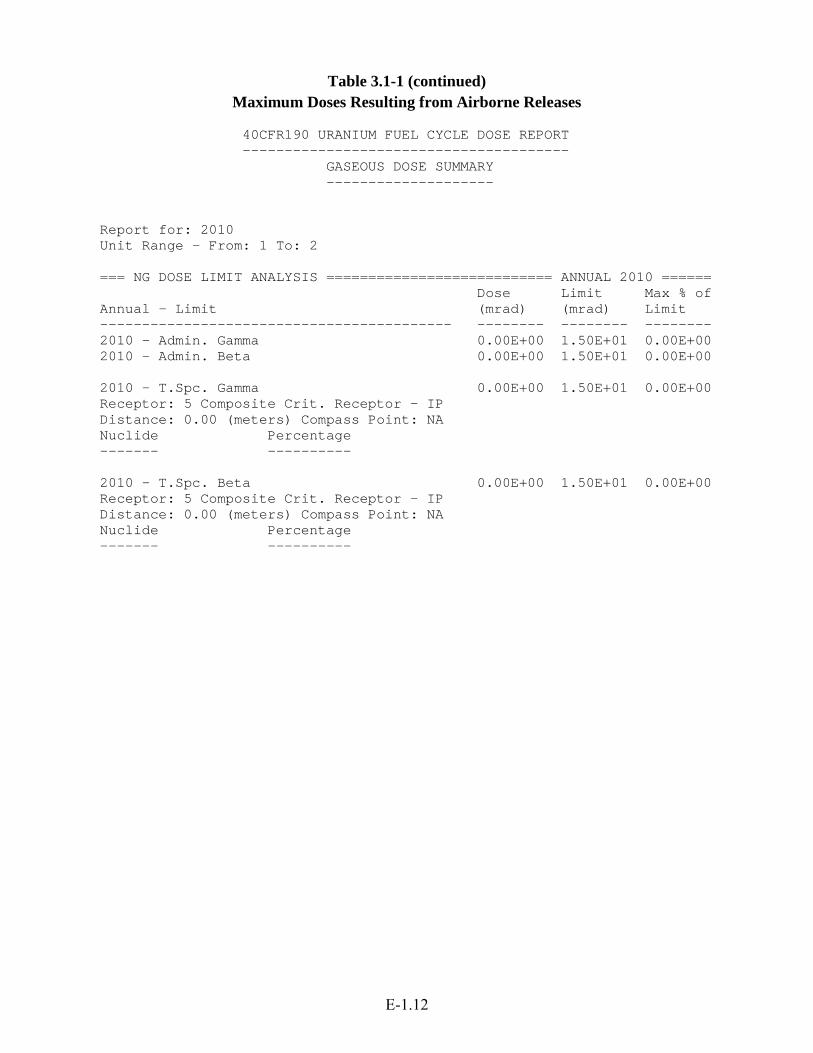
Table 3.1-1 (continued) Maximum Doses Resulting from Airborne Releases
40CFR190 URANIUM FUEL CYCLE DOSE REPORT --------------------------------------- GASEOUS DOSE SUMMARY -------------------- Report for: 2010 Unit Range - From: 1 To: 2 === NG DOSE LIMIT ANALYSIS =========================== ANNUAL 2010 ====== Dose Limit Max % of Annual - Limit (mrad) (mrad) Limit ------------------------------------------ -------- -------- -------- 2010 - Admin. Gamma 0.00E+00 1.50E+01 0.00E+00 2010 - Admin. Beta 0.00E+00 1.50E+01 0.00E+00 2010 - T.Spc. Gamma 0.00E+00 1.50E+01 0.00E+00 Receptor: 5 Composite Crit. Receptor - IP Distance: 0.00 (meters) Compass Point: NA Nuclide Percentage ------- ---------- 2010 - T.Spc. Beta 0.00E+00 1.50E+01 0.00E+00 Receptor: 5 Composite Crit. Receptor - IP Distance: 0.00 (meters) Compass Point: NA Nuclide Percentage ------- ----------
E-1.12
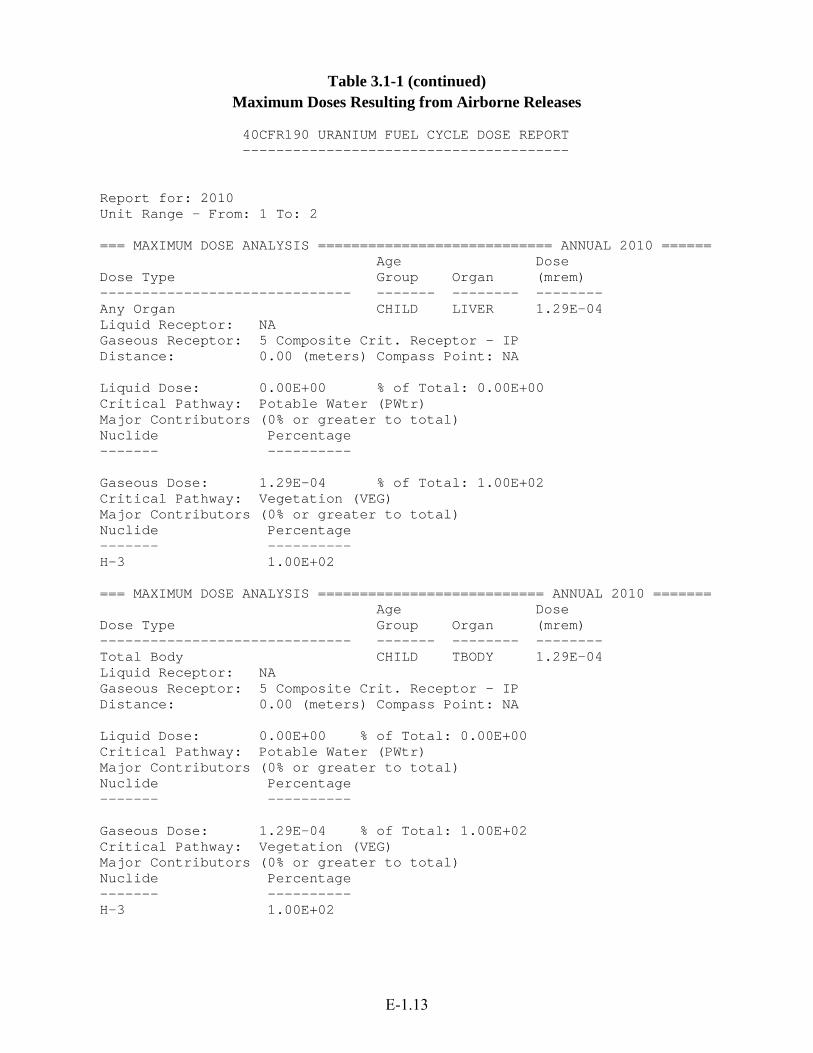
Table 3.1-1 (continued) Maximum Doses Resulting from Airborne Releases
40CFR190 URANIUM FUEL CYCLE DOSE REPORT --------------------------------------- Report for: 2010 Unit Range - From: 1 To: 2 === MAXIMUM DOSE ANALYSIS ============================ ANNUAL 2010 ====== Age Dose Dose Type Group Organ (mrem) ------------------------------ ------- -------- -------- Any Organ CHILD LIVER 1.29E-04 Liquid Receptor: NA Gaseous Receptor: 5 Composite Crit. Receptor - IP Distance: 0.00 (meters) Compass Point: NA Liquid Dose: 0.00E+00 % of Total: 0.00E+00 Critical Pathway: Potable Water (PWtr) Major Contributors (0% or greater to total) Nuclide Percentage ------- ---------- Gaseous Dose: 1.29E-04 % of Total: 1.00E+02 Critical Pathway: Vegetation (VEG) Major Contributors (0% or greater to total) Nuclide Percentage ------- ---------- H-3 1.00E+02 === MAXIMUM DOSE ANALYSIS =========================== ANNUAL 2010 ======= Age Dose Dose Type Group Organ (mrem) ------------------------------ ------- -------- -------- Total Body CHILD TBODY 1.29E-04 Liquid Receptor: NA Gaseous Receptor: 5 Composite Crit. Receptor - IP Distance: 0.00 (meters) Compass Point: NA Liquid Dose: 0.00E+00 % of Total: 0.00E+00 Critical Pathway: Potable Water (PWtr) Major Contributors (0% or greater to total) Nuclide Percentage ------- ---------- Gaseous Dose: 1.29E-04 % of Total: 1.00E+02 Critical Pathway: Vegetation (VEG) Major Contributors (0% or greater to total) Nuclide Percentage ------- ---------- H-3 1.00E+02
E-1.13
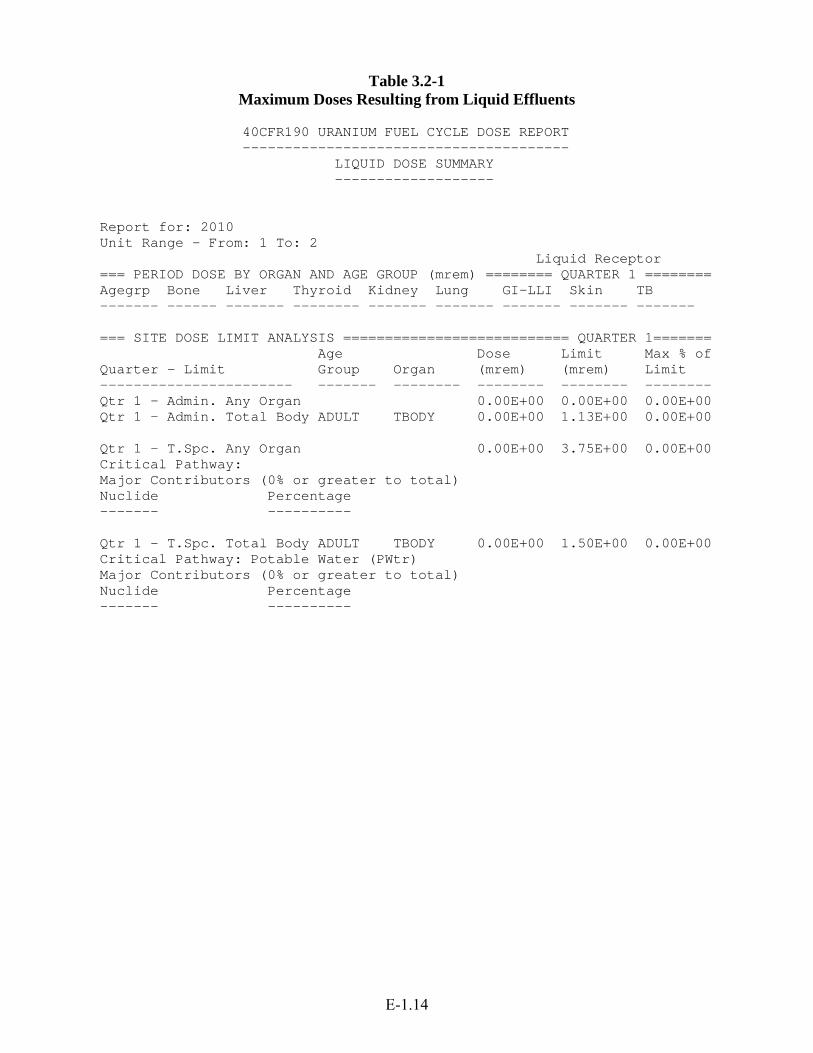
Table 3.2-1 Maximum Doses Resulting from Liquid Effluents
40CFR190 URANIUM FUEL CYCLE DOSE REPORT --------------------------------------- LIQUID DOSE SUMMARY ------------------- Report for: 2010 Unit Range - From: 1 To: 2 Liquid Receptor === PERIOD DOSE BY ORGAN AND AGE GROUP (mrem) ======== QUARTER 1 ======== Agegrp Bone Liver Thyroid Kidney Lung GI-LLI Skin TB ------- ------ ------- -------- ------- ------- ------- ------- ------- === SITE DOSE LIMIT ANALYSIS =========================== QUARTER 1======= Age Dose Limit Max % of Quarter - Limit Group Organ (mrem) (mrem) Limit ----------------------- ------- -------- -------- -------- -------- Qtr 1 - Admin. Any Organ 0.00E+00 0.00E+00 0.00E+00 Qtr 1 - Admin. Total Body ADULT TBODY 0.00E+00 1.13E+00 0.00E+00 Qtr 1 - T.Spc. Any Organ 0.00E+00 3.75E+00 0.00E+00 Critical Pathway: Major Contributors (0% or greater to total) Nuclide Percentage ------- ---------- Qtr 1 - T.Spc. Total Body ADULT TBODY 0.00E+00 1.50E+00 0.00E+00 Critical Pathway: Potable Water (PWtr) Major Contributors (0% or greater to total) Nuclide Percentage ------- ----------
E-1.14

Table 3.2-1 (continued) Maximum Doses Resulting from Liquid Effluents
40CFR190 URANIUM FUEL CYCLE DOSE REPORT --------------------------------------- LIQUID DOSE SUMMARY ------------------- Report for: 2010 Unit Range - From: 1 To: 2 Liquid Receptor === PERIOD DOSE BY ORGAN AND AGE GROUP (mrem) ======== QUARTER 2 ======== Agegrp Bone Liver Thyroid Kidney Lung GI-LLI Skin TB ------- ------- -------- -------- -------- ------ -------- ------ ------- === SITE DOSE LIMIT ANALYSIS ============================ QUARTER 2 ===== Age Dose Limit Max % of Quartr - Limit Group Organ (mrem) (mrem) Limit ------------------------- ------- -------- -------- -------- -------- Qtr 2 - Admin. Any Organ 0.00E+00 5.00E+00 0.00E+00 Qtr 2 - Admin. Total Body ADULT TBODY 0.00E+00 1.13E+00 0.00E+00 Qtr 2 - T.Spc. Any Organ 0.00E+00 3.75E+00 0.00E+00 Critical Pathway: Major Contributors (0% or greater to total) Nuclide Percentage ------- ---------- Qtr 2 - T.Spc. Total Body ADULT TBODY 0.00E+00 1.50E+00 0.00E+00 Critical Pathway: Potable Water (PWtr) Major Contributors (0% or greater to total) Nuclide Percentage ------- ----------
E-1.15
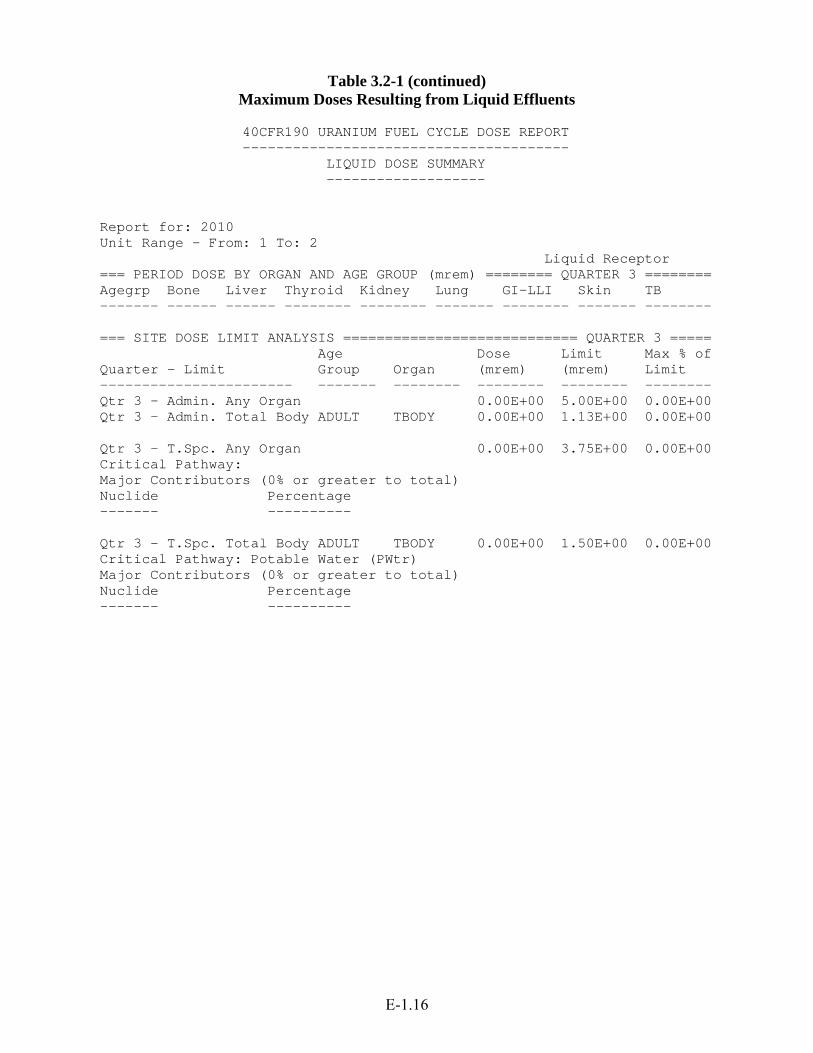
Table 3.2-1 (continued) Maximum Doses Resulting from Liquid Effluents
40CFR190 URANIUM FUEL CYCLE DOSE REPORT --------------------------------------- LIQUID DOSE SUMMARY ------------------- Report for: 2010 Unit Range - From: 1 To: 2 Liquid Receptor === PERIOD DOSE BY ORGAN AND AGE GROUP (mrem) ======== QUARTER 3 ======== Agegrp Bone Liver Thyroid Kidney Lung GI-LLI Skin TB ------- ------ ------ -------- -------- ------- -------- ------- -------- === SITE DOSE LIMIT ANALYSIS ============================ QUARTER 3 ===== Age Dose Limit Max % of Quarter - Limit Group Organ (mrem) (mrem) Limit ----------------------- ------- -------- -------- -------- -------- Qtr 3 - Admin. Any Organ 0.00E+00 5.00E+00 0.00E+00 Qtr 3 - Admin. Total Body ADULT TBODY 0.00E+00 1.13E+00 0.00E+00 Qtr 3 - T.Spc. Any Organ 0.00E+00 3.75E+00 0.00E+00 Critical Pathway: Major Contributors (0% or greater to total) Nuclide Percentage ------- ---------- Qtr 3 - T.Spc. Total Body ADULT TBODY 0.00E+00 1.50E+00 0.00E+00 Critical Pathway: Potable Water (PWtr) Major Contributors (0% or greater to total) Nuclide Percentage ------- ----------
E-1.16
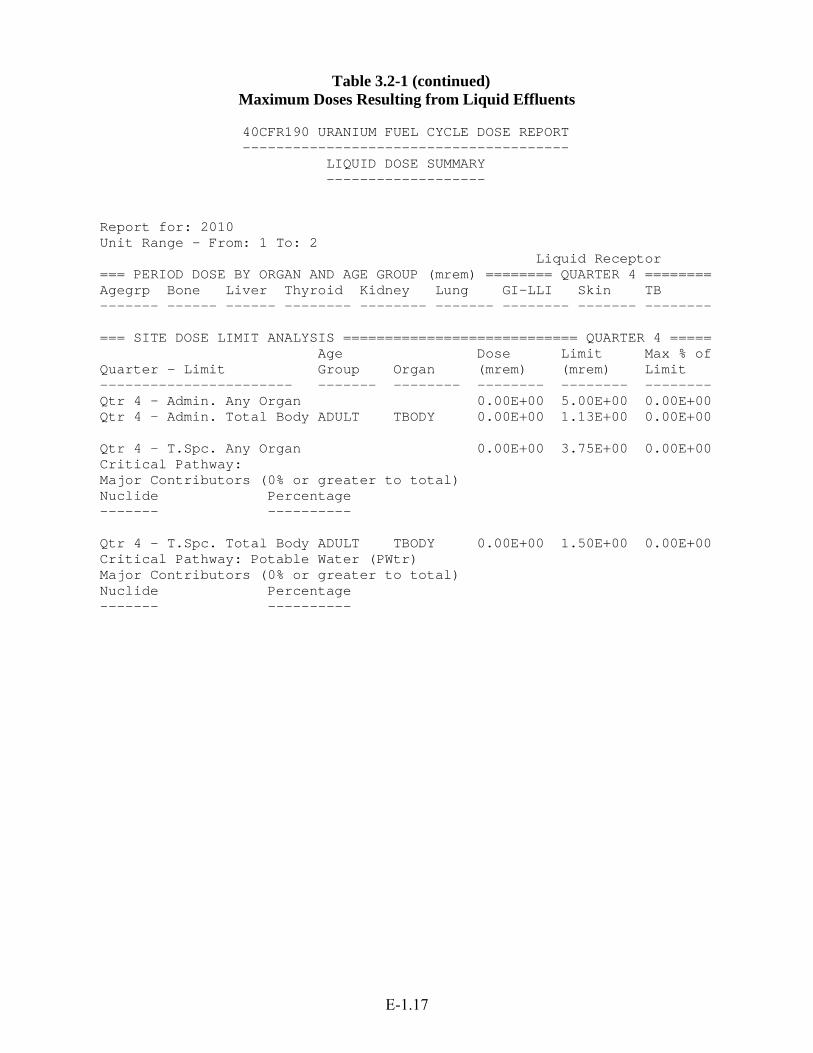
Table 3.2-1 (continued) Maximum Doses Resulting from Liquid Effluents
40CFR190 URANIUM FUEL CYCLE DOSE REPORT --------------------------------------- LIQUID DOSE SUMMARY ------------------- Report for: 2010 Unit Range - From: 1 To: 2 Liquid Receptor === PERIOD DOSE BY ORGAN AND AGE GROUP (mrem) ======== QUARTER 4 ======== Agegrp Bone Liver Thyroid Kidney Lung GI-LLI Skin TB ------- ------ ------ -------- -------- ------- -------- ------- -------- === SITE DOSE LIMIT ANALYSIS ============================ QUARTER 4 ===== Age Dose Limit Max % of Quarter - Limit Group Organ (mrem) (mrem) Limit ----------------------- ------- -------- -------- -------- -------- Qtr 4 - Admin. Any Organ 0.00E+00 5.00E+00 0.00E+00 Qtr 4 - Admin. Total Body ADULT TBODY 0.00E+00 1.13E+00 0.00E+00 Qtr 4 - T.Spc. Any Organ 0.00E+00 3.75E+00 0.00E+00 Critical Pathway: Major Contributors (0% or greater to total) Nuclide Percentage ------- ---------- Qtr 4 - T.Spc. Total Body ADULT TBODY 0.00E+00 1.50E+00 0.00E+00 Critical Pathway: Potable Water (PWtr) Major Contributors (0% or greater to total) Nuclide Percentage ------- ----------
E-1.17
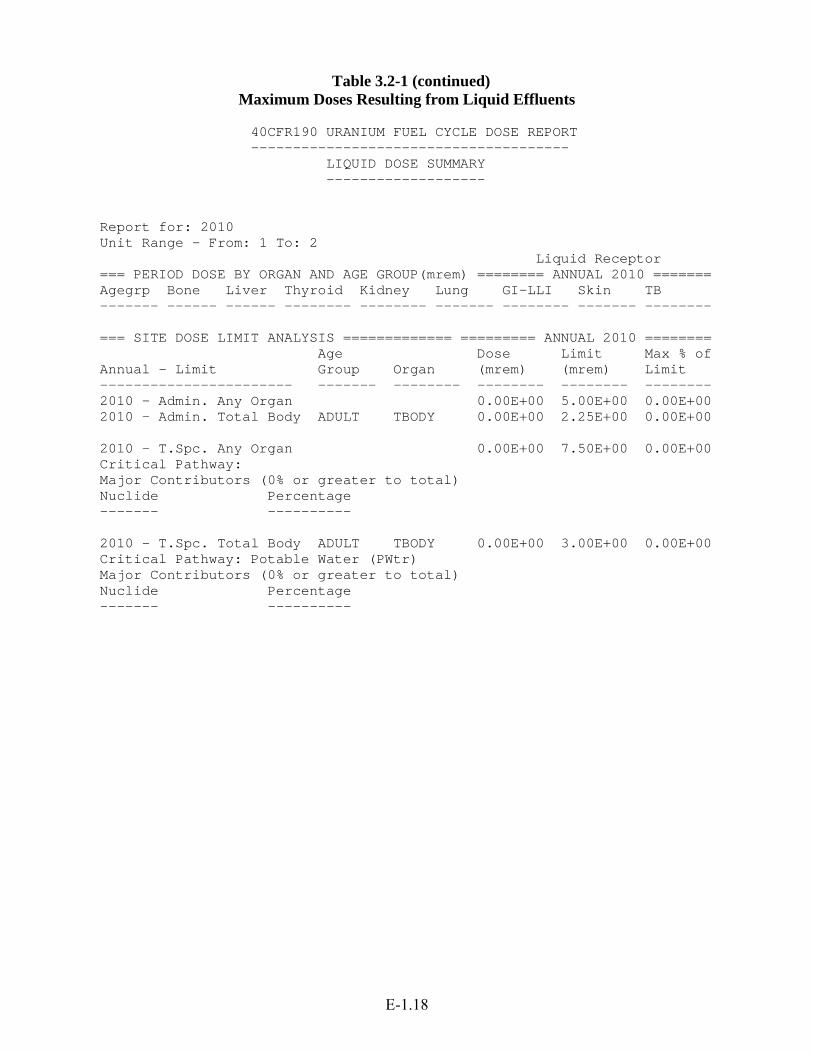
Table 3.2-1 (continued) Maximum Doses Resulting from Liquid Effluents
40CFR190 URANIUM FUEL CYCLE DOSE REPORT -------------------------------------- LIQUID DOSE SUMMARY ------------------- Report for: 2010 Unit Range - From: 1 To: 2 Liquid Receptor === PERIOD DOSE BY ORGAN AND AGE GROUP(mrem) ======== ANNUAL 2010 ======= Agegrp Bone Liver Thyroid Kidney Lung GI-LLI Skin TB ------- ------ ------ -------- -------- ------- -------- ------- -------- === SITE DOSE LIMIT ANALYSIS ============= ========= ANNUAL 2010 ======== Age Dose Limit Max % of Annual - Limit Group Organ (mrem) (mrem) Limit ----------------------- ------- -------- -------- -------- -------- 2010 - Admin. Any Organ 0.00E+00 5.00E+00 0.00E+00 2010 - Admin. Total Body ADULT TBODY 0.00E+00 2.25E+00 0.00E+00 2010 - T.Spc. Any Organ 0.00E+00 7.50E+00 0.00E+00 Critical Pathway: Major Contributors (0% or greater to total) Nuclide Percentage ------- ---------- 2010 - T.Spc. Total Body ADULT TBODY 0.00E+00 3.00E+00 0.00E+00 Critical Pathway: Potable Water (PWtr) Major Contributors (0% or greater to total) Nuclide Percentage ------- ----------
E-1.18
APPENDIX F
METEOROLOGICAL DATA

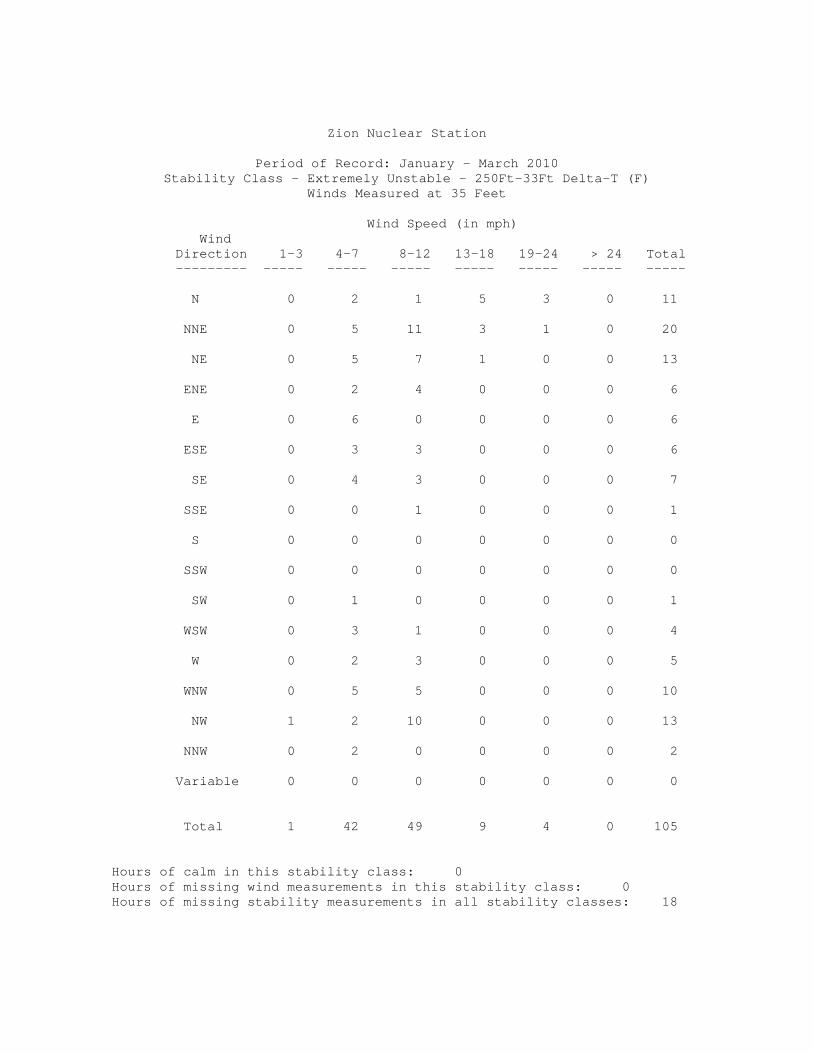
Zion Nuclear Station
Period of Record: January - March 2010 Stability Class - Extremely Unstable - 250Ft-33Ft Delta-T (F)
Winds Measured at 35 Feet Wind Speed (in mph) Wind Direction 1-3 4-7 8-12 13-18 19-24 > 24 Total --------- ----- ----- ----- ----- ----- ----- ----- N 0 2 1 5 3 0 11 NNE 0 5 11 3 1 0 20 NE 0 5 7 1 0 0 13 ENE 0 2 4 0 0 0 6 E 0 6 0 0 0 0 6 ESE 0 3 3 0 0 0 6 SE 0 4 3 0 0 0 7 SSE 0 0 1 0 0 0 1 S 0 0 0 0 0 0 0 SSW 0 0 0 0 0 0 0 SW 0 1 0 0 0 0 1 WSW 0 3 1 0 0 0 4 W 0 2 3 0 0 0 5 WNW 0 5 5 0 0 0 10 NW 1 2 10 0 0 0 13 NNW 0 2 0 0 0 0 2 Variable 0 0 0 0 0 0 0 Total 1 42 49 9 4 0 105 Hours of calm in this stability class: 0 Hours of missing wind measurements in this stability class: 0 Hours of missing stability measurements in all stability classes: 18

Zion Nuclear Station
Period of Record: January - March 2010 Stability Class - Moderately Unstable - 250Ft-33Ft Delta-T (F)
Winds Measured at 35 Feet Wind Speed (in mph) Wind Direction 1-3 4-7 8-12 13-18 19-24 > 24 Total --------- ----- ----- ----- ----- ----- ----- ----- N 0 0 3 5 1 0 9 NNE 0 4 3 1 3 0 11 NE 0 1 0 1 0 0 2 ENE 0 1 1 0 0 0 2 E 2 3 1 0 0 0 6 ESE 0 2 1 0 0 0 3 SE 0 1 0 0 0 0 1 SSE 0 0 0 0 0 0 0 S 0 0 0 0 0 0 0 SSW 0 0 0 0 0 0 0 SW 0 2 0 0 0 0 2 WSW 0 1 0 0 0 0 1 W 0 2 0 0 0 0 2 WNW 0 2 2 0 0 0 4 NW 0 2 10 0 0 0 12 NNW 0 1 1 0 0 0 2 Variable 0 0 0 0 0 0 0 Total 2 22 22 7 4 0 57 Hours of calm in this stability class: 0 Hours of missing wind measurements in this stability class: 0 Hours of missing stability measurements in all stability classes: 18
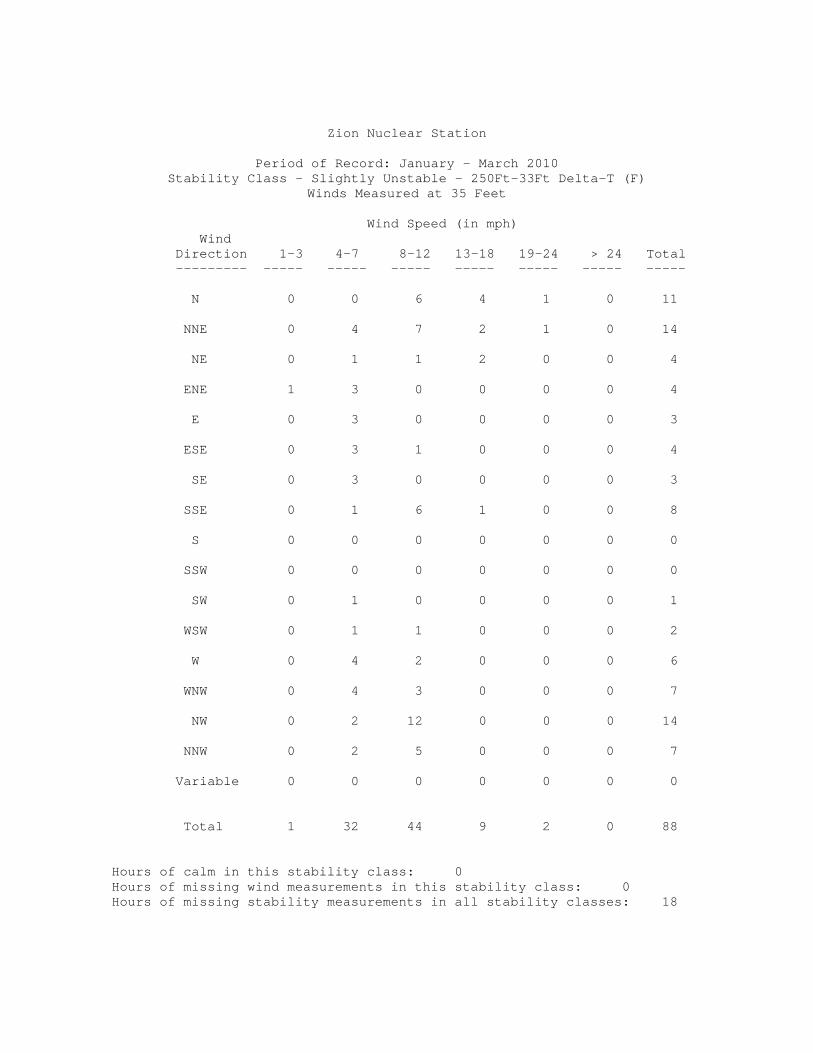
Zion Nuclear Station
Period of Record: January - March 2010 Stability Class - Slightly Unstable - 250Ft-33Ft Delta-T (F)
Winds Measured at 35 Feet Wind Speed (in mph) Wind Direction 1-3 4-7 8-12 13-18 19-24 > 24 Total --------- ----- ----- ----- ----- ----- ----- ----- N 0 0 6 4 1 0 11 NNE 0 4 7 2 1 0 14 NE 0 1 1 2 0 0 4 ENE 1 3 0 0 0 0 4 E 0 3 0 0 0 0 3 ESE 0 3 1 0 0 0 4 SE 0 3 0 0 0 0 3 SSE 0 1 6 1 0 0 8 S 0 0 0 0 0 0 0 SSW 0 0 0 0 0 0 0 SW 0 1 0 0 0 0 1 WSW 0 1 1 0 0 0 2 W 0 4 2 0 0 0 6 WNW 0 4 3 0 0 0 7 NW 0 2 12 0 0 0 14 NNW 0 2 5 0 0 0 7 Variable 0 0 0 0 0 0 0 Total 1 32 44 9 2 0 88 Hours of calm in this stability class: 0 Hours of missing wind measurements in this stability class: 0 Hours of missing stability measurements in all stability classes: 18
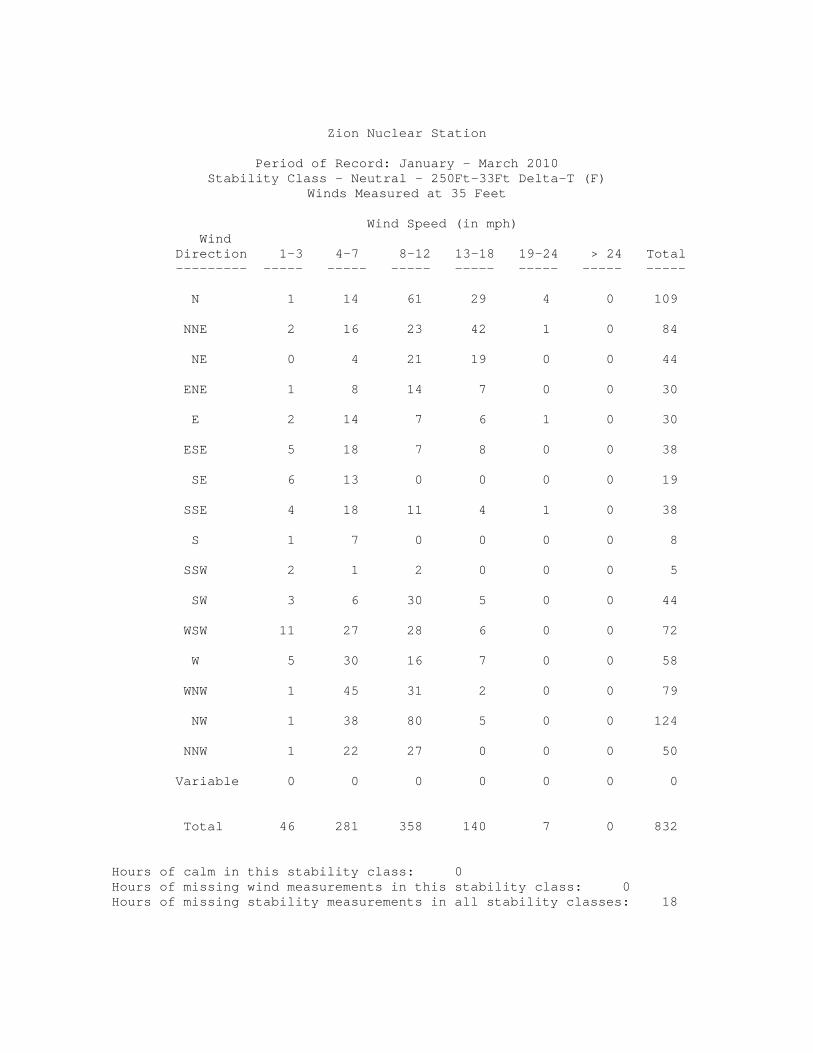
Zion Nuclear Station
Period of Record: January - March 2010 Stability Class - Neutral - 250Ft-33Ft Delta-T (F)
Winds Measured at 35 Feet Wind Speed (in mph) Wind Direction 1-3 4-7 8-12 13-18 19-24 > 24 Total --------- ----- ----- ----- ----- ----- ----- ----- N 1 14 61 29 4 0 109 NNE 2 16 23 42 1 0 84 NE 0 4 21 19 0 0 44 ENE 1 8 14 7 0 0 30 E 2 14 7 6 1 0 30 ESE 5 18 7 8 0 0 38 SE 6 13 0 0 0 0 19 SSE 4 18 11 4 1 0 38 S 1 7 0 0 0 0 8 SSW 2 1 2 0 0 0 5 SW 3 6 30 5 0 0 44 WSW 11 27 28 6 0 0 72 W 5 30 16 7 0 0 58 WNW 1 45 31 2 0 0 79 NW 1 38 80 5 0 0 124 NNW 1 22 27 0 0 0 50 Variable 0 0 0 0 0 0 0 Total 46 281 358 140 7 0 832 Hours of calm in this stability class: 0 Hours of missing wind measurements in this stability class: 0 Hours of missing stability measurements in all stability classes: 18
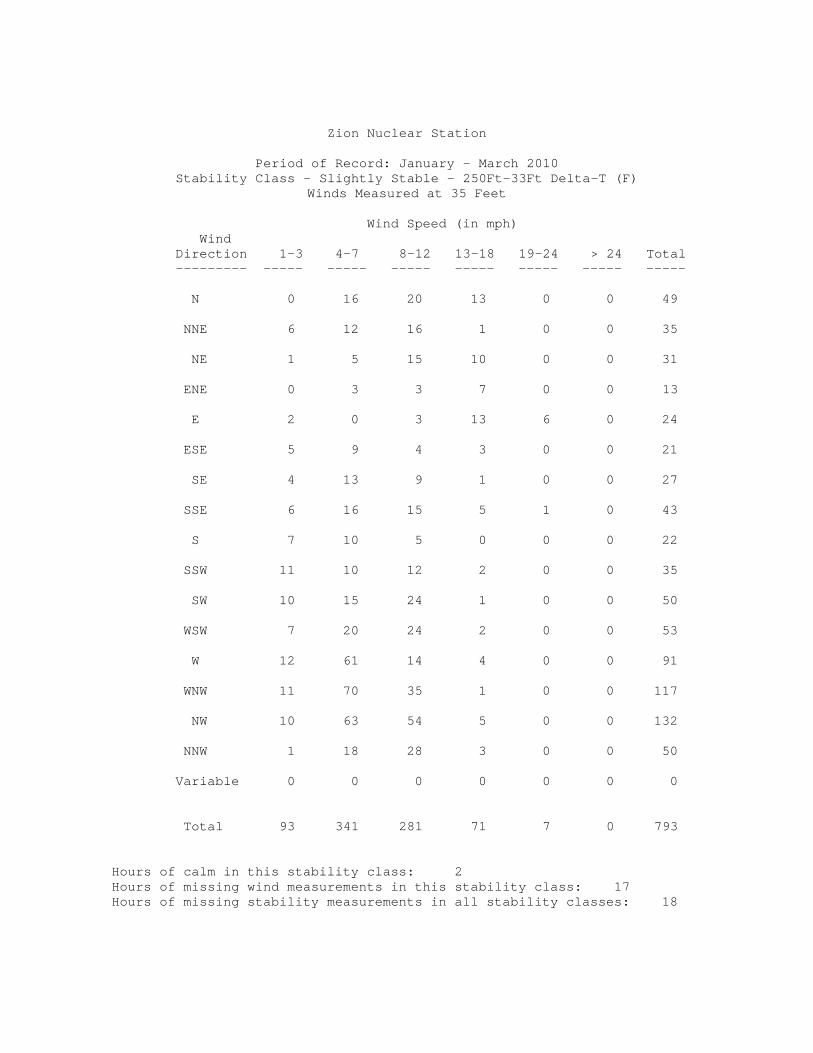
Zion Nuclear Station
Period of Record: January - March 2010 Stability Class - Slightly Stable - 250Ft-33Ft Delta-T (F)
Winds Measured at 35 Feet Wind Speed (in mph) Wind Direction 1-3 4-7 8-12 13-18 19-24 > 24 Total --------- ----- ----- ----- ----- ----- ----- ----- N 0 16 20 13 0 0 49 NNE 6 12 16 1 0 0 35 NE 1 5 15 10 0 0 31 ENE 0 3 3 7 0 0 13 E 2 0 3 13 6 0 24 ESE 5 9 4 3 0 0 21 SE 4 13 9 1 0 0 27 SSE 6 16 15 5 1 0 43 S 7 10 5 0 0 0 22 SSW 11 10 12 2 0 0 35 SW 10 15 24 1 0 0 50 WSW 7 20 24 2 0 0 53 W 12 61 14 4 0 0 91 WNW 11 70 35 1 0 0 117 NW 10 63 54 5 0 0 132 NNW 1 18 28 3 0 0 50 Variable 0 0 0 0 0 0 0 Total 93 341 281 71 7 0 793 Hours of calm in this stability class: 2 Hours of missing wind measurements in this stability class: 17 Hours of missing stability measurements in all stability classes: 18

Zion Nuclear Station
Period of Record: January - March 2010 Stability Class - Moderately Stable - 250Ft-33Ft Delta-T (F)
Winds Measured at 35 Feet Wind Speed (in mph) Wind Direction 1-3 4-7 8-12 13-18 19-24 > 24 Total --------- ----- ----- ----- ----- ----- ----- ----- N 1 3 0 0 0 0 4 NNE 0 2 0 0 0 0 2 NE 1 0 0 0 0 0 1 ENE 1 0 0 0 0 0 1 E 2 3 0 0 0 0 5 ESE 2 7 2 0 0 0 11 SE 1 4 2 0 0 0 7 SSE 1 0 1 2 0 0 4 S 1 3 7 0 0 0 11 SSW 5 0 0 0 0 0 5 SW 4 2 0 0 0 0 6 WSW 3 1 1 0 0 0 5 W 8 20 0 0 0 0 28 WNW 12 18 0 0 0 0 30 NW 9 20 1 0 0 0 30 NNW 2 2 0 0 0 0 4 Variable 0 0 0 0 0 0 0 Total 53 85 14 2 0 0 154 Hours of calm in this stability class: 2 Hours of missing wind measurements in this stability class: 0 Hours of missing stability measurements in all stability classes: 18
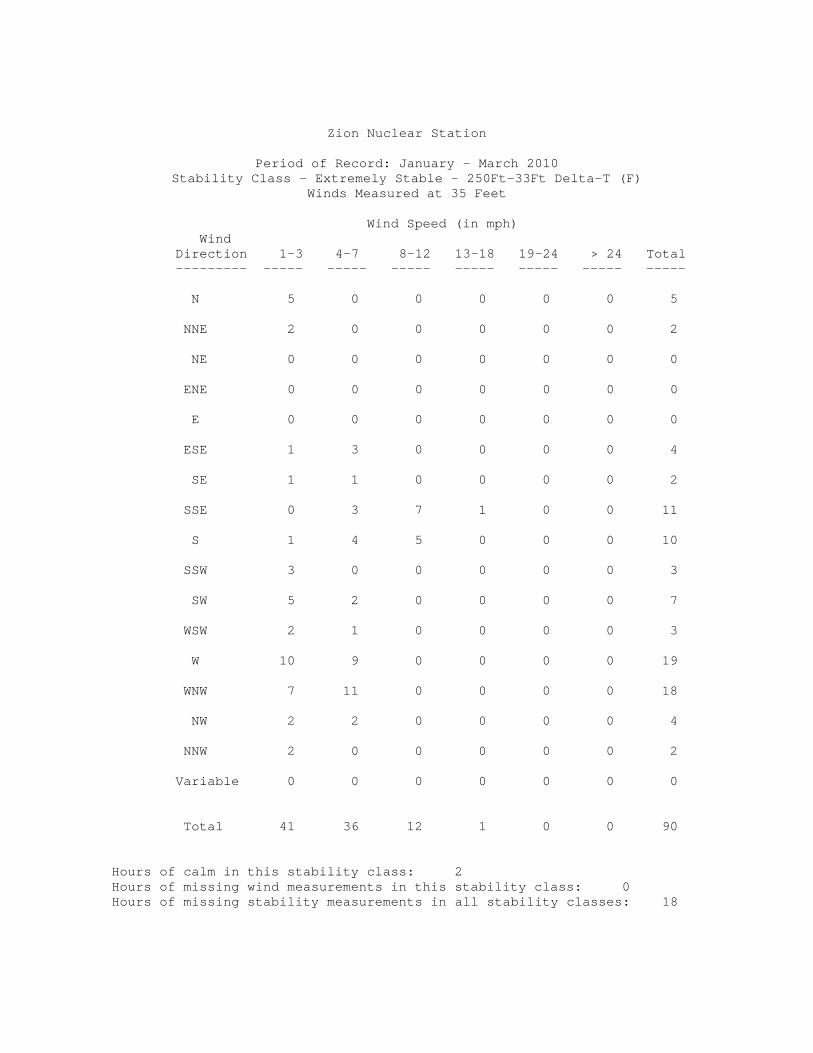
Zion Nuclear Station
Period of Record: January - March 2010 Stability Class - Extremely Stable - 250Ft-33Ft Delta-T (F)
Winds Measured at 35 Feet Wind Speed (in mph) Wind Direction 1-3 4-7 8-12 13-18 19-24 > 24 Total --------- ----- ----- ----- ----- ----- ----- ----- N 5 0 0 0 0 0 5 NNE 2 0 0 0 0 0 2 NE 0 0 0 0 0 0 0 ENE 0 0 0 0 0 0 0 E 0 0 0 0 0 0 0 ESE 1 3 0 0 0 0 4 SE 1 1 0 0 0 0 2 SSE 0 3 7 1 0 0 11 S 1 4 5 0 0 0 10 SSW 3 0 0 0 0 0 3 SW 5 2 0 0 0 0 7 WSW 2 1 0 0 0 0 3 W 10 9 0 0 0 0 19 WNW 7 11 0 0 0 0 18 NW 2 2 0 0 0 0 4 NNW 2 0 0 0 0 0 2 Variable 0 0 0 0 0 0 0 Total 41 36 12 1 0 0 90 Hours of calm in this stability class: 2 Hours of missing wind measurements in this stability class: 0 Hours of missing stability measurements in all stability classes: 18

Zion Nuclear Station
Period of Record: January - March 2010 Stability Class - Extremely Unstable - 250Ft-33Ft Delta-T (F)
Winds Measured at 250 Feet Wind Speed (in mph) Wind Direction 1-3 4-7 8-12 13-18 19-24 > 24 Total --------- ----- ----- ----- ----- ----- ----- ----- N 0 3 1 1 2 5 12 NNE 0 0 10 6 2 2 20 NE 0 4 6 2 1 0 13 ENE 0 0 3 1 0 0 4 E 0 3 1 0 0 0 4 ESE 0 3 1 0 0 0 4 SE 0 6 2 4 0 0 12 SSE 0 1 0 0 0 0 1 S 0 0 0 0 0 0 0 SSW 0 0 0 0 0 0 0 SW 0 0 0 0 0 0 0 WSW 0 1 0 2 0 0 3 W 0 2 3 0 0 0 5 WNW 0 1 6 2 0 0 9 NW 0 5 5 7 0 0 17 NNW 0 1 0 0 0 0 1 Variable 0 0 0 0 0 0 0 Total 0 30 38 25 5 7 105 Hours of calm in this stability class: 0 Hours of missing wind measurements in this stability class: 0 Hours of missing stability measurements in all stability classes: 18

Zion Nuclear Station
Period of Record: January - March 2010 Stability Class - Moderately Unstable - 250Ft-33Ft Delta-T (F)
Winds Measured at 250 Feet Wind Speed (in mph) Wind Direction 1-3 4-7 8-12 13-18 19-24 > 24 Total --------- ----- ----- ----- ----- ----- ----- ----- N 0 0 0 1 3 3 7 NNE 0 1 3 5 1 3 13 NE 0 1 0 1 0 0 2 ENE 0 1 0 1 0 0 2 E 0 3 0 1 0 0 4 ESE 1 1 1 0 0 0 3 SE 0 1 1 0 0 0 2 SSE 0 0 0 0 0 0 0 S 0 0 0 0 0 0 0 SSW 0 0 0 0 0 0 0 SW 0 0 0 0 0 0 0 WSW 0 0 1 0 0 0 1 W 0 1 2 0 0 0 3 WNW 0 1 2 0 0 0 3 NW 0 0 2 10 1 0 13 NNW 0 1 1 2 0 0 4 Variable 0 0 0 0 0 0 0 Total 1 11 13 21 5 6 57 Hours of calm in this stability class: 0 Hours of missing wind measurements in this stability class: 0 Hours of missing stability measurements in all stability classes: 18

Zion Nuclear Station
Period of Record: January - March 2010 Stability Class - Slightly Unstable - 250Ft-33Ft Delta-T (F)
Winds Measured at 250 Feet Wind Speed (in mph) Wind Direction 1-3 4-7 8-12 13-18 19-24 > 24 Total --------- ----- ----- ----- ----- ----- ----- ----- N 0 1 3 2 1 4 11 NNE 0 1 1 8 1 2 13 NE 0 2 1 2 2 0 7 ENE 0 0 0 0 0 0 0 E 0 5 0 0 0 0 5 ESE 0 0 0 0 0 0 0 SE 0 2 4 2 0 0 8 SSE 0 0 3 4 0 0 7 S 0 0 0 0 0 0 0 SSW 0 0 0 0 0 0 0 SW 0 0 0 0 0 0 0 WSW 0 0 2 1 0 0 3 W 0 2 2 2 0 0 6 WNW 0 0 1 1 0 0 2 NW 0 0 5 13 0 0 18 NNW 0 0 3 5 0 0 8 Variable 0 0 0 0 0 0 0 Total 0 13 25 40 4 6 88 Hours of calm in this stability class: 0 Hours of missing wind measurements in this stability class: 0 Hours of missing stability measurements in all stability classes: 18
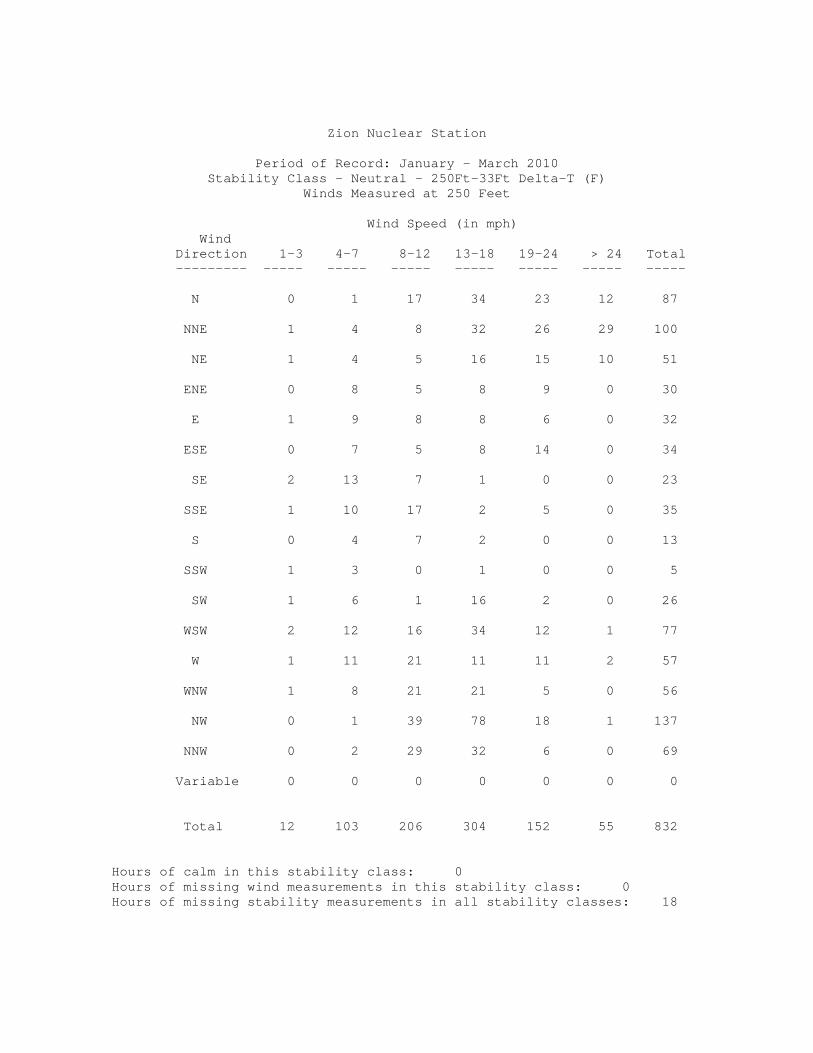
Zion Nuclear Station
Period of Record: January - March 2010 Stability Class - Neutral - 250Ft-33Ft Delta-T (F)
Winds Measured at 250 Feet Wind Speed (in mph) Wind Direction 1-3 4-7 8-12 13-18 19-24 > 24 Total --------- ----- ----- ----- ----- ----- ----- ----- N 0 1 17 34 23 12 87 NNE 1 4 8 32 26 29 100 NE 1 4 5 16 15 10 51 ENE 0 8 5 8 9 0 30 E 1 9 8 8 6 0 32 ESE 0 7 5 8 14 0 34 SE 2 13 7 1 0 0 23 SSE 1 10 17 2 5 0 35 S 0 4 7 2 0 0 13 SSW 1 3 0 1 0 0 5 SW 1 6 1 16 2 0 26 WSW 2 12 16 34 12 1 77 W 1 11 21 11 11 2 57 WNW 1 8 21 21 5 0 56 NW 0 1 39 78 18 1 137 NNW 0 2 29 32 6 0 69 Variable 0 0 0 0 0 0 0 Total 12 103 206 304 152 55 832 Hours of calm in this stability class: 0 Hours of missing wind measurements in this stability class: 0 Hours of missing stability measurements in all stability classes: 18
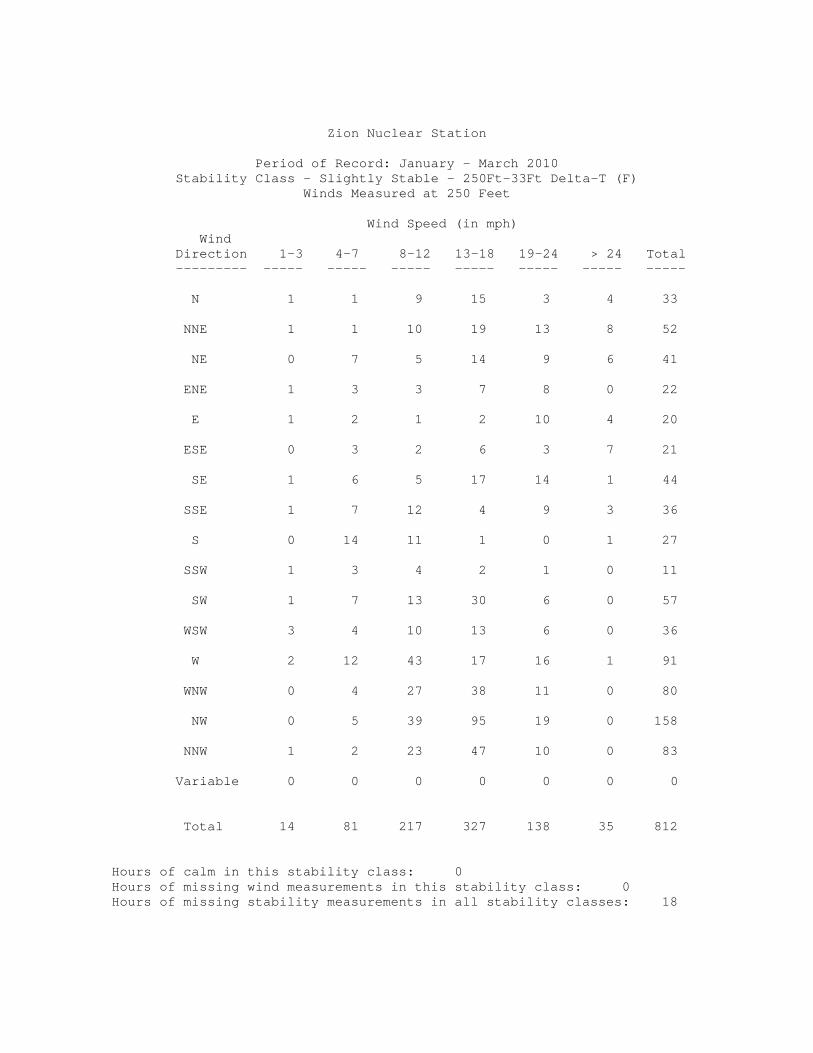
Zion Nuclear Station
Period of Record: January - March 2010 Stability Class - Slightly Stable - 250Ft-33Ft Delta-T (F)
Winds Measured at 250 Feet Wind Speed (in mph) Wind Direction 1-3 4-7 8-12 13-18 19-24 > 24 Total --------- ----- ----- ----- ----- ----- ----- ----- N 1 1 9 15 3 4 33 NNE 1 1 10 19 13 8 52 NE 0 7 5 14 9 6 41 ENE 1 3 3 7 8 0 22 E 1 2 1 2 10 4 20 ESE 0 3 2 6 3 7 21 SE 1 6 5 17 14 1 44 SSE 1 7 12 4 9 3 36 S 0 14 11 1 0 1 27 SSW 1 3 4 2 1 0 11 SW 1 7 13 30 6 0 57 WSW 3 4 10 13 6 0 36 W 2 12 43 17 16 1 91 WNW 0 4 27 38 11 0 80 NW 0 5 39 95 19 0 158 NNW 1 2 23 47 10 0 83 Variable 0 0 0 0 0 0 0 Total 14 81 217 327 138 35 812 Hours of calm in this stability class: 0 Hours of missing wind measurements in this stability class: 0 Hours of missing stability measurements in all stability classes: 18

Zion Nuclear Station
Period of Record: January - March 2010 Stability Class - Moderately Stable - 250Ft-33Ft Delta-T (F)
Winds Measured at 250 Feet Wind Speed (in mph) Wind Direction 1-3 4-7 8-12 13-18 19-24 > 24 Total --------- ----- ----- ----- ----- ----- ----- ----- N 0 1 5 15 0 0 21 NNE 0 2 2 1 0 0 5 NE 0 5 0 1 0 0 6 ENE 0 3 0 1 0 0 4 E 0 1 2 0 0 0 3 ESE 0 2 0 0 6 3 11 SE 1 2 1 1 4 3 12 SSE 1 0 4 3 2 1 11 S 0 2 2 1 4 0 9 SSW 1 4 1 2 2 0 10 SW 2 0 1 1 0 0 4 WSW 1 0 0 0 0 0 1 W 0 3 0 2 3 0 8 WNW 0 3 4 12 4 0 23 NW 1 1 2 8 0 0 12 NNW 0 4 5 6 1 0 16 Variable 0 0 0 0 0 0 0 Total 7 33 29 54 26 7 156 Hours of calm in this stability class: 0 Hours of missing wind measurements in this stability class: 0 Hours of missing stability measurements in all stability classes: 18

Zion Nuclear Station
Period of Record: January - March 2010 Stability Class - Extremely Stable - 250Ft-33Ft Delta-T (F)
Winds Measured at 250 Feet Wind Speed (in mph) Wind Direction 1-3 4-7 8-12 13-18 19-24 > 24 Total --------- ----- ----- ----- ----- ----- ----- ----- N 0 0 4 2 0 0 6 NNE 2 2 1 0 0 0 5 NE 0 2 0 0 0 0 2 ENE 0 1 0 0 0 0 1 E 0 2 0 0 0 0 2 ESE 2 2 0 2 1 2 9 SE 0 1 1 0 1 1 4 SSE 0 0 0 0 0 1 1 S 4 5 2 7 3 1 22 SSW 2 0 6 8 0 0 16 SW 1 0 1 3 1 0 6 WSW 1 0 0 0 1 0 2 W 0 0 0 0 0 0 0 WNW 0 0 1 4 2 0 7 NW 0 0 0 4 1 0 5 NNW 0 1 2 0 0 0 3 Variable 0 0 0 0 0 0 0 Total 12 16 18 30 10 5 91 Hours of calm in this stability class: 1 Hours of missing wind measurements in this stability class: 0 Hours of missing stability measurements in all stability classes: 18

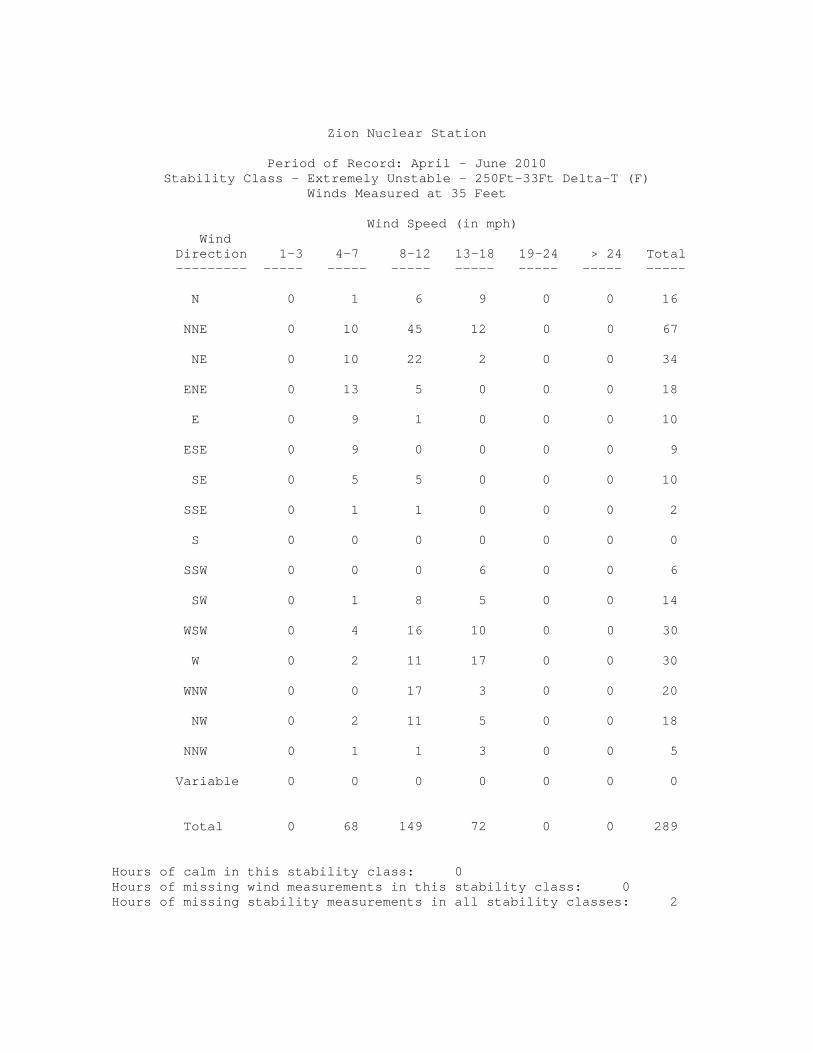
Zion Nuclear Station
Period of Record: April - June 2010 Stability Class - Extremely Unstable - 250Ft-33Ft Delta-T (F)
Winds Measured at 35 Feet Wind Speed (in mph) Wind Direction 1-3 4-7 8-12 13-18 19-24 > 24 Total --------- ----- ----- ----- ----- ----- ----- ----- N 0 1 6 9 0 0 16 NNE 0 10 45 12 0 0 67 NE 0 10 22 2 0 0 34 ENE 0 13 5 0 0 0 18 E 0 9 1 0 0 0 10 ESE 0 9 0 0 0 0 9 SE 0 5 5 0 0 0 10 SSE 0 1 1 0 0 0 2 S 0 0 0 0 0 0 0 SSW 0 0 0 6 0 0 6 SW 0 1 8 5 0 0 14 WSW 0 4 16 10 0 0 30 W 0 2 11 17 0 0 30 WNW 0 0 17 3 0 0 20 NW 0 2 11 5 0 0 18 NNW 0 1 1 3 0 0 5 Variable 0 0 0 0 0 0 0 Total 0 68 149 72 0 0 289 Hours of calm in this stability class: 0 Hours of missing wind measurements in this stability class: 0 Hours of missing stability measurements in all stability classes: 2

Zion Nuclear Station
Period of Record: April - June 2010 Stability Class - Moderately Unstable - 250Ft-33Ft Delta-T (F)
Winds Measured at 35 Feet Wind Speed (in mph) Wind Direction 1-3 4-7 8-12 13-18 19-24 > 24 Total --------- ----- ----- ----- ----- ----- ----- ----- N 0 1 8 2 0 0 11 NNE 0 6 7 1 0 0 14 NE 0 9 0 0 0 0 9 ENE 0 0 0 0 0 0 0 E 0 4 0 0 0 0 4 ESE 0 1 1 0 0 0 2 SE 0 6 2 0 0 0 8 SSE 0 0 3 0 0 0 3 S 0 0 1 0 0 0 1 SSW 0 0 2 0 0 0 2 SW 0 0 4 2 0 0 6 WSW 0 3 1 1 0 0 5 W 0 2 1 0 0 0 3 WNW 0 1 2 1 0 0 4 NW 1 1 5 0 0 0 7 NNW 0 0 0 1 0 0 1 Variable 0 0 0 0 0 0 0 Total 1 34 37 8 0 0 80 Hours of calm in this stability class: 0 Hours of missing wind measurements in this stability class: 0 Hours of missing stability measurements in all stability classes: 2
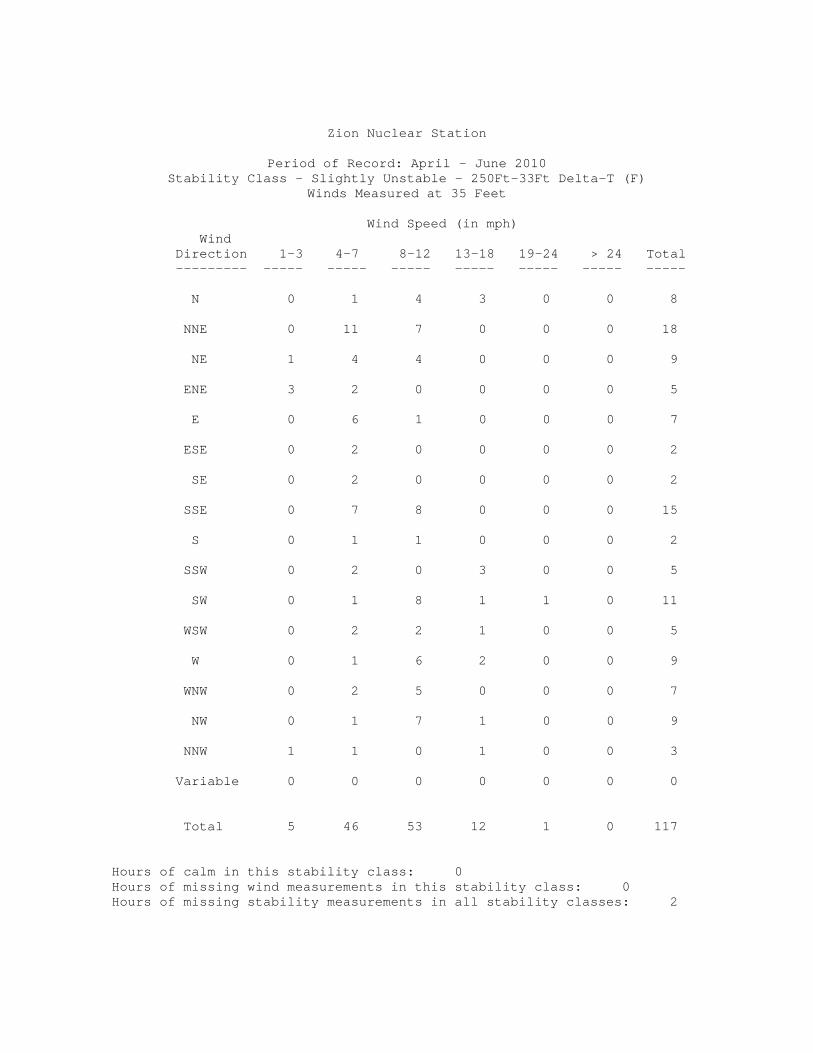
Zion Nuclear Station
Period of Record: April - June 2010 Stability Class - Slightly Unstable - 250Ft-33Ft Delta-T (F)
Winds Measured at 35 Feet Wind Speed (in mph) Wind Direction 1-3 4-7 8-12 13-18 19-24 > 24 Total --------- ----- ----- ----- ----- ----- ----- ----- N 0 1 4 3 0 0 8 NNE 0 11 7 0 0 0 18 NE 1 4 4 0 0 0 9 ENE 3 2 0 0 0 0 5 E 0 6 1 0 0 0 7 ESE 0 2 0 0 0 0 2 SE 0 2 0 0 0 0 2 SSE 0 7 8 0 0 0 15 S 0 1 1 0 0 0 2 SSW 0 2 0 3 0 0 5 SW 0 1 8 1 1 0 11 WSW 0 2 2 1 0 0 5 W 0 1 6 2 0 0 9 WNW 0 2 5 0 0 0 7 NW 0 1 7 1 0 0 9 NNW 1 1 0 1 0 0 3 Variable 0 0 0 0 0 0 0 Total 5 46 53 12 1 0 117 Hours of calm in this stability class: 0 Hours of missing wind measurements in this stability class: 0 Hours of missing stability measurements in all stability classes: 2
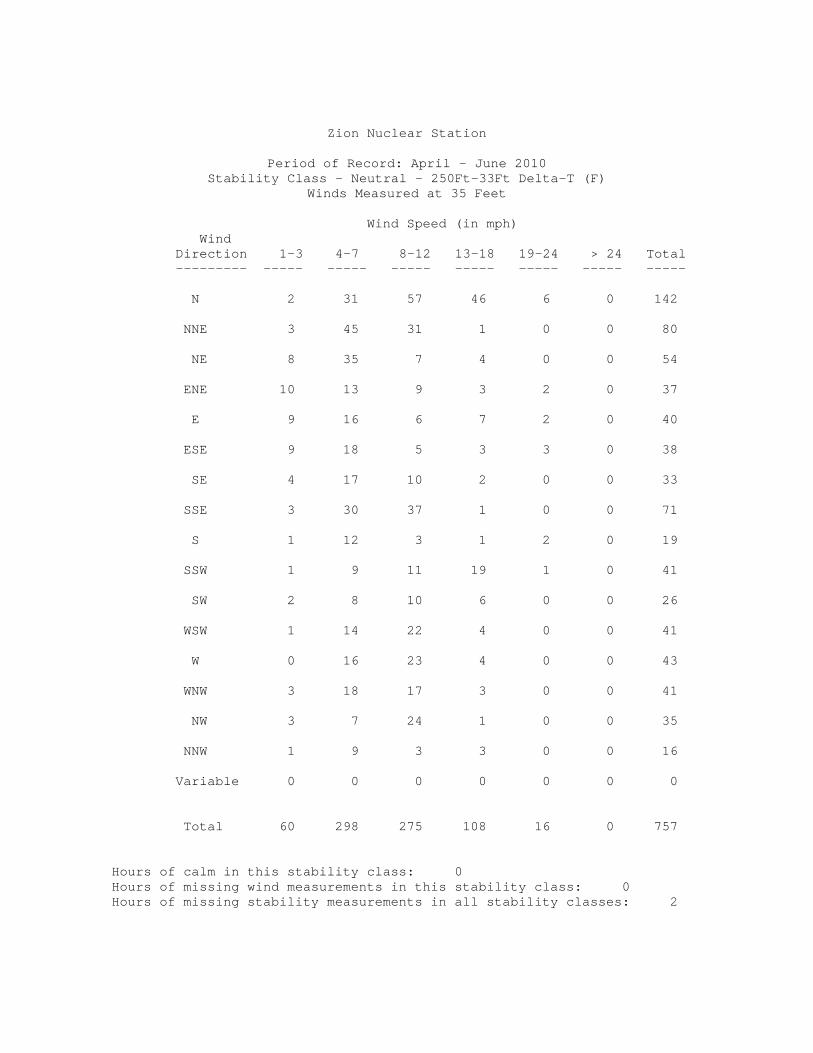
Zion Nuclear Station
Period of Record: April - June 2010 Stability Class - Neutral - 250Ft-33Ft Delta-T (F)
Winds Measured at 35 Feet Wind Speed (in mph) Wind Direction 1-3 4-7 8-12 13-18 19-24 > 24 Total --------- ----- ----- ----- ----- ----- ----- ----- N 2 31 57 46 6 0 142 NNE 3 45 31 1 0 0 80 NE 8 35 7 4 0 0 54 ENE 10 13 9 3 2 0 37 E 9 16 6 7 2 0 40 ESE 9 18 5 3 3 0 38 SE 4 17 10 2 0 0 33 SSE 3 30 37 1 0 0 71 S 1 12 3 1 2 0 19 SSW 1 9 11 19 1 0 41 SW 2 8 10 6 0 0 26 WSW 1 14 22 4 0 0 41 W 0 16 23 4 0 0 43 WNW 3 18 17 3 0 0 41 NW 3 7 24 1 0 0 35 NNW 1 9 3 3 0 0 16 Variable 0 0 0 0 0 0 0 Total 60 298 275 108 16 0 757 Hours of calm in this stability class: 0 Hours of missing wind measurements in this stability class: 0 Hours of missing stability measurements in all stability classes: 2

Zion Nuclear Station
Period of Record: April - June 2010 Stability Class - Slightly Stable - 250Ft-33Ft Delta-T (F)
Winds Measured at 35 Feet Wind Speed (in mph) Wind Direction 1-3 4-7 8-12 13-18 19-24 > 24 Total --------- ----- ----- ----- ----- ----- ----- ----- N 15 24 11 0 0 0 50 NNE 9 18 5 0 0 0 32 NE 7 11 5 1 0 0 24 ENE 16 7 9 1 2 0 35 E 6 10 3 8 0 0 27 ESE 3 10 4 1 0 0 18 SE 5 18 2 3 2 0 30 SSE 3 28 35 8 0 0 74 S 3 34 16 2 0 0 55 SSW 8 28 9 0 0 0 45 SW 3 17 4 0 0 0 24 WSW 1 21 4 0 0 0 26 W 2 25 0 0 0 0 27 WNW 9 23 2 0 0 0 34 NW 11 10 1 0 0 0 22 NNW 10 14 0 0 0 0 24 Variable 0 0 0 0 0 0 0 Total 111 298 110 24 4 0 547 Hours of calm in this stability class: 3 Hours of missing wind measurements in this stability class: 0 Hours of missing stability measurements in all stability classes: 2

Zion Nuclear Station
Period of Record: April - June 2010 Stability Class - Moderately Stable - 250Ft-33Ft Delta-T (F)
Winds Measured at 35 Feet Wind Speed (in mph) Wind Direction 1-3 4-7 8-12 13-18 19-24 > 24 Total --------- ----- ----- ----- ----- ----- ----- ----- N 9 4 0 0 0 0 13 NNE 4 1 0 0 0 0 5 NE 7 5 2 0 0 0 14 ENE 2 3 2 3 0 0 10 E 4 3 2 1 0 0 10 ESE 3 6 5 0 0 0 14 SE 2 4 0 0 0 0 6 SSE 2 10 22 7 0 0 41 S 8 25 7 0 0 0 40 SSW 11 5 0 0 0 0 16 SW 6 2 0 0 0 0 8 WSW 9 4 2 0 0 0 15 W 5 6 0 0 0 0 11 WNW 9 11 0 0 0 0 20 NW 12 7 0 0 0 0 19 NNW 8 3 0 0 0 0 11 Variable 0 0 0 0 0 0 0 Total 101 99 42 11 0 0 253 Hours of calm in this stability class: 4 Hours of missing wind measurements in this stability class: 0 Hours of missing stability measurements in all stability classes: 2

Zion Nuclear Station
Period of Record: April - June 2010 Stability Class - Extremely Stable - 250Ft-33Ft Delta-T (F)
Winds Measured at 35 Feet Wind Speed (in mph) Wind Direction 1-3 4-7 8-12 13-18 19-24 > 24 Total --------- ----- ----- ----- ----- ----- ----- ----- N 2 0 0 0 0 0 2 NNE 3 0 0 0 0 0 3 NE 2 0 0 1 0 0 3 ENE 0 1 2 3 0 0 6 E 3 1 3 0 0 0 7 ESE 2 2 3 1 0 0 8 SE 1 2 0 0 0 0 3 SSE 2 5 13 2 0 0 22 S 3 16 4 1 0 0 24 SSW 4 2 0 0 0 0 6 SW 4 7 0 0 0 0 11 WSW 8 0 0 0 0 0 8 W 8 2 0 0 0 0 10 WNW 8 5 0 0 0 0 13 NW 1 0 0 0 0 0 1 NNW 4 0 0 0 0 0 4 Variable 0 0 0 0 0 0 0 Total 55 43 25 8 0 0 131 Hours of calm in this stability class: 1 Hours of missing wind measurements in this stability class: 0 Hours of missing stability measurements in all stability classes: 2
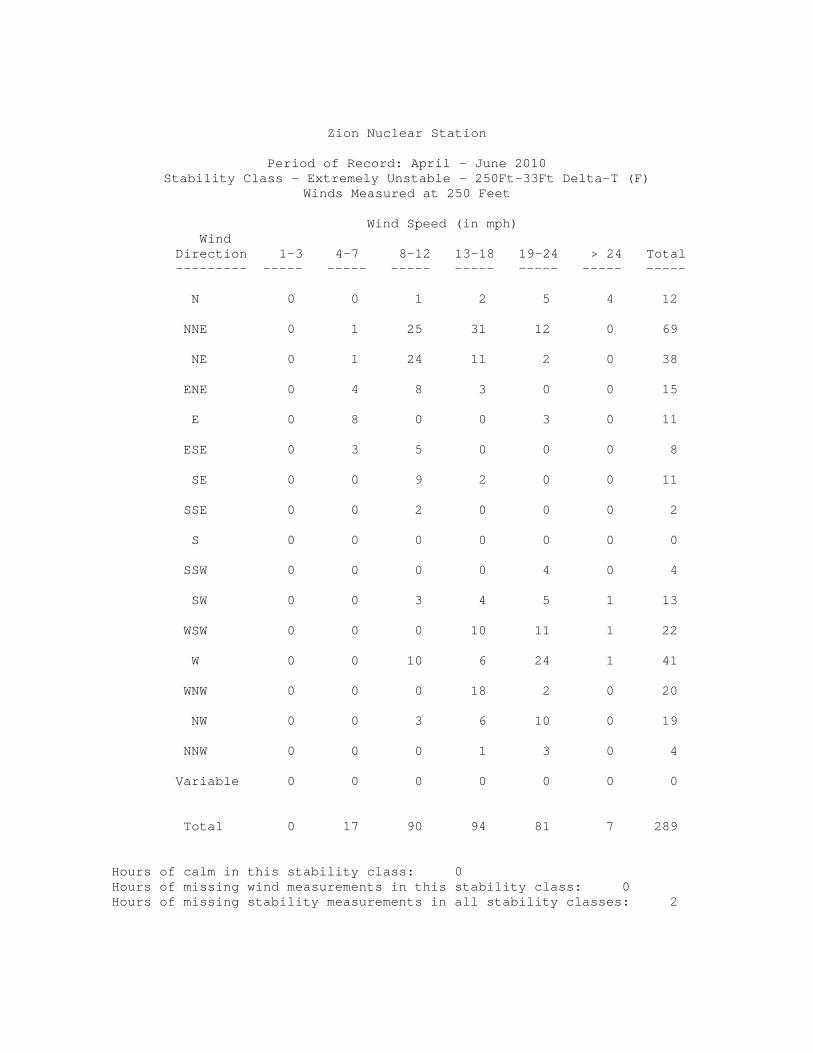
Zion Nuclear Station
Period of Record: April - June 2010 Stability Class - Extremely Unstable - 250Ft-33Ft Delta-T (F)
Winds Measured at 250 Feet Wind Speed (in mph) Wind Direction 1-3 4-7 8-12 13-18 19-24 > 24 Total --------- ----- ----- ----- ----- ----- ----- ----- N 0 0 1 2 5 4 12 NNE 0 1 25 31 12 0 69 NE 0 1 24 11 2 0 38 ENE 0 4 8 3 0 0 15 E 0 8 0 0 3 0 11 ESE 0 3 5 0 0 0 8 SE 0 0 9 2 0 0 11 SSE 0 0 2 0 0 0 2 S 0 0 0 0 0 0 0 SSW 0 0 0 0 4 0 4 SW 0 0 3 4 5 1 13 WSW 0 0 0 10 11 1 22 W 0 0 10 6 24 1 41 WNW 0 0 0 18 2 0 20 NW 0 0 3 6 10 0 19 NNW 0 0 0 1 3 0 4 Variable 0 0 0 0 0 0 0 Total 0 17 90 94 81 7 289 Hours of calm in this stability class: 0 Hours of missing wind measurements in this stability class: 0 Hours of missing stability measurements in all stability classes: 2

Zion Nuclear Station
Period of Record: April – June 2010 Stability Class - Moderately Unstable - 250Ft-33Ft Delta-T (F)
Winds Measured at 250 Feet Wind Speed (in mph) Wind Direction 1-3 4-7 8-12 13-18 19-24 > 24 Total --------- ----- ----- ----- ----- ----- ----- ----- N 0 0 2 2 2 0 6 NNE 0 4 5 11 1 0 21 NE 0 3 2 0 0 0 5 ENE 0 1 1 0 0 0 2 E 0 0 1 0 0 0 1 ESE 0 3 1 1 0 0 5 SE 0 0 5 1 0 0 6 SSE 0 0 5 0 0 0 5 S 0 0 0 0 0 0 0 SSW 0 0 1 1 0 0 2 SW 0 0 1 2 1 2 6 WSW 0 0 0 1 1 0 2 W 0 2 3 2 0 0 7 WNW 0 1 0 2 0 1 4 NW 0 0 2 1 3 0 6 NNW 0 1 0 0 1 0 2 Variable 0 0 0 0 0 0 0 Total 0 15 29 24 9 3 80 Hours of calm in this stability class: 0 Hours of missing wind measurements in this stability class: 0 Hours of missing stability measurements in all stability classes: 2

Zion Nuclear Station
Period of Record: April - June 2010 Stability Class - Slightly Unstable - 250Ft-33Ft Delta-T (F)
Winds Measured at 250 Feet Wind Speed (in mph) Wind Direction 1-3 4-7 8-12 13-18 19-24 > 24 Total --------- ----- ----- ----- ----- ----- ----- ----- N 0 3 0 1 4 1 9 NNE 0 3 6 5 1 0 15 NE 0 4 2 3 1 0 10 ENE 0 2 1 0 0 0 3 E 0 3 2 1 1 0 7 ESE 0 3 1 0 0 0 4 SE 0 1 4 1 0 0 6 SSE 0 0 8 1 0 0 9 S 0 0 1 2 1 0 4 SSW 0 0 0 1 2 1 4 SW 0 0 3 4 3 1 11 WSW 0 1 1 4 0 1 7 W 0 1 0 4 3 1 9 WNW 0 1 0 4 0 0 5 NW 0 1 1 5 4 0 11 NNW 0 2 0 0 1 0 3 Variable 0 0 0 0 0 0 0 Total 0 25 30 36 21 5 117 Hours of calm in this stability class: 0 Hours of missing wind measurements in this stability class: 0 Hours of missing stability measurements in all stability classes: 2
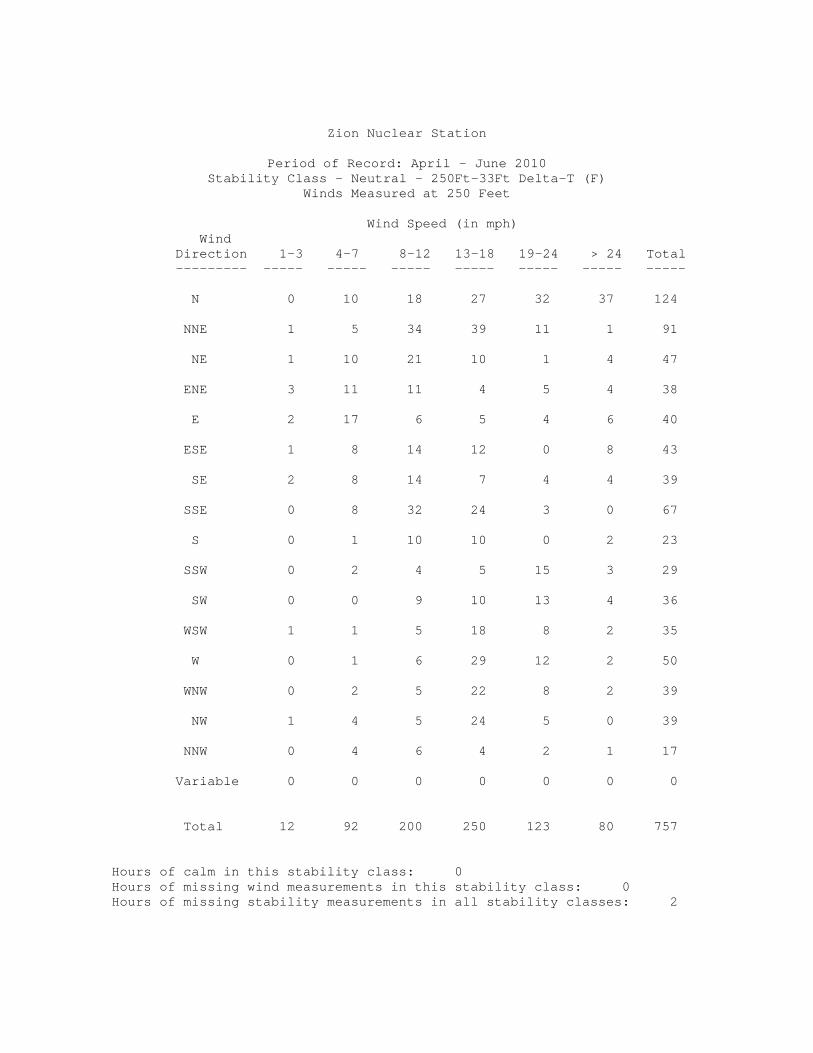
Zion Nuclear Station
Period of Record: April - June 2010 Stability Class - Neutral - 250Ft-33Ft Delta-T (F)
Winds Measured at 250 Feet Wind Speed (in mph) Wind Direction 1-3 4-7 8-12 13-18 19-24 > 24 Total --------- ----- ----- ----- ----- ----- ----- ----- N 0 10 18 27 32 37 124 NNE 1 5 34 39 11 1 91 NE 1 10 21 10 1 4 47 ENE 3 11 11 4 5 4 38 E 2 17 6 5 4 6 40 ESE 1 8 14 12 0 8 43 SE 2 8 14 7 4 4 39 SSE 0 8 32 24 3 0 67 S 0 1 10 10 0 2 23 SSW 0 2 4 5 15 3 29 SW 0 0 9 10 13 4 36 WSW 1 1 5 18 8 2 35 W 0 1 6 29 12 2 50 WNW 0 2 5 22 8 2 39 NW 1 4 5 24 5 0 39 NNW 0 4 6 4 2 1 17 Variable 0 0 0 0 0 0 0 Total 12 92 200 250 123 80 757 Hours of calm in this stability class: 0 Hours of missing wind measurements in this stability class: 0 Hours of missing stability measurements in all stability classes: 2
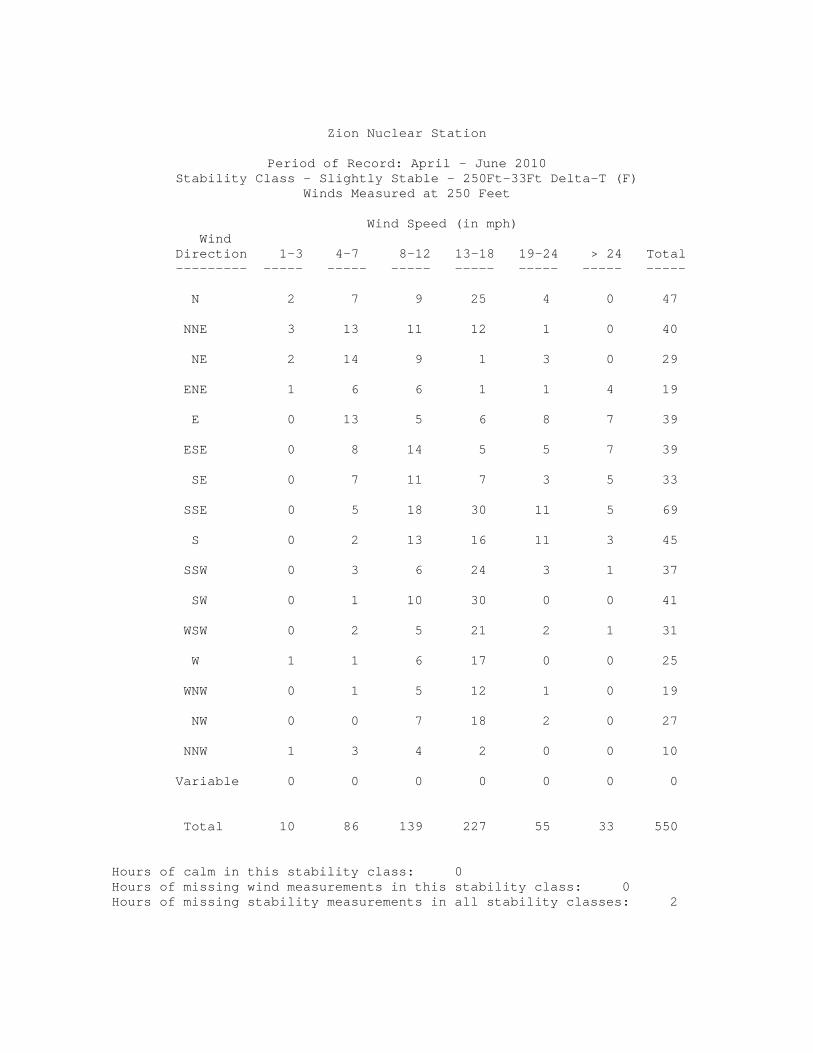
Zion Nuclear Station
Period of Record: April - June 2010 Stability Class - Slightly Stable - 250Ft-33Ft Delta-T (F)
Winds Measured at 250 Feet Wind Speed (in mph) Wind Direction 1-3 4-7 8-12 13-18 19-24 > 24 Total --------- ----- ----- ----- ----- ----- ----- ----- N 2 7 9 25 4 0 47 NNE 3 13 11 12 1 0 40 NE 2 14 9 1 3 0 29 ENE 1 6 6 1 1 4 19 E 0 13 5 6 8 7 39 ESE 0 8 14 5 5 7 39 SE 0 7 11 7 3 5 33 SSE 0 5 18 30 11 5 69 S 0 2 13 16 11 3 45 SSW 0 3 6 24 3 1 37 SW 0 1 10 30 0 0 41 WSW 0 2 5 21 2 1 31 W 1 1 6 17 0 0 25 WNW 0 1 5 12 1 0 19 NW 0 0 7 18 2 0 27 NNW 1 3 4 2 0 0 10 Variable 0 0 0 0 0 0 0 Total 10 86 139 227 55 33 550 Hours of calm in this stability class: 0 Hours of missing wind measurements in this stability class: 0 Hours of missing stability measurements in all stability classes: 2

Zion Nuclear Station
Period of Record: April - June 2010 Stability Class - Moderately Stable - 250Ft-33Ft Delta-T (F)
Winds Measured at 250 Feet Wind Speed (in mph) Wind Direction 1-3 4-7 8-12 13-18 19-24 > 24 Total --------- ----- ----- ----- ----- ----- ----- ----- N 2 9 6 1 0 0 18 NNE 1 6 8 2 0 0 17 NE 1 5 2 0 1 0 9 ENE 1 1 5 1 1 1 10 E 1 3 4 3 0 4 15 ESE 0 3 2 1 2 6 14 SE 1 3 6 7 4 0 21 SSE 1 3 17 10 9 2 42 S 0 6 11 17 6 5 45 SSW 1 0 8 5 2 0 16 SW 0 1 1 3 1 0 6 WSW 0 0 3 4 2 0 9 W 1 2 2 0 2 0 7 WNW 2 1 0 4 0 0 7 NW 3 1 1 4 0 0 9 NNW 0 5 5 2 0 0 12 Variable 0 0 0 0 0 0 0 Total 15 49 81 64 30 18 257 Hours of calm in this stability class: 0 Hours of missing wind measurements in this stability class: 0 Hours of missing stability measurements in all stability classes: 2
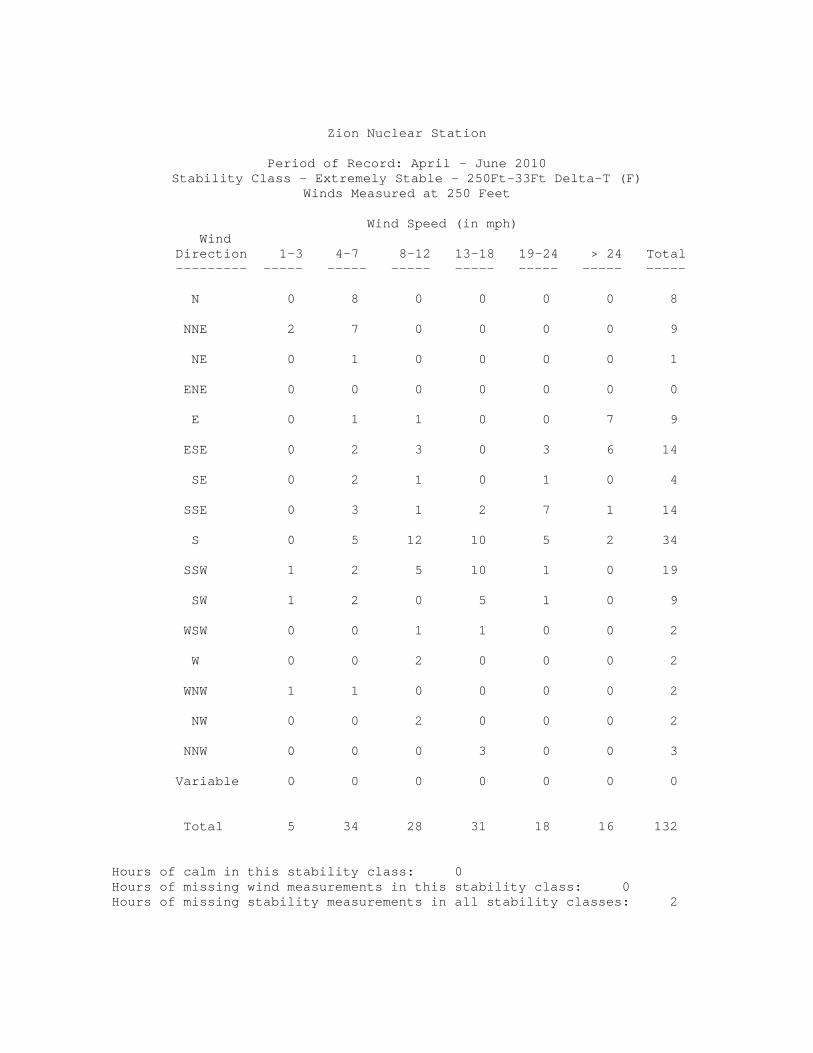
Zion Nuclear Station
Period of Record: April - June 2010 Stability Class - Extremely Stable - 250Ft-33Ft Delta-T (F)
Winds Measured at 250 Feet Wind Speed (in mph) Wind Direction 1-3 4-7 8-12 13-18 19-24 > 24 Total --------- ----- ----- ----- ----- ----- ----- ----- N 0 8 0 0 0 0 8 NNE 2 7 0 0 0 0 9 NE 0 1 0 0 0 0 1 ENE 0 0 0 0 0 0 0 E 0 1 1 0 0 7 9 ESE 0 2 3 0 3 6 14 SE 0 2 1 0 1 0 4 SSE 0 3 1 2 7 1 14 S 0 5 12 10 5 2 34 SSW 1 2 5 10 1 0 19 SW 1 2 0 5 1 0 9 WSW 0 0 1 1 0 0 2 W 0 0 2 0 0 0 2 WNW 1 1 0 0 0 0 2 NW 0 0 2 0 0 0 2 NNW 0 0 0 3 0 0 3 Variable 0 0 0 0 0 0 0 Total 5 34 28 31 18 16 132 Hours of calm in this stability class: 0 Hours of missing wind measurements in this stability class: 0 Hours of missing stability measurements in all stability classes: 2

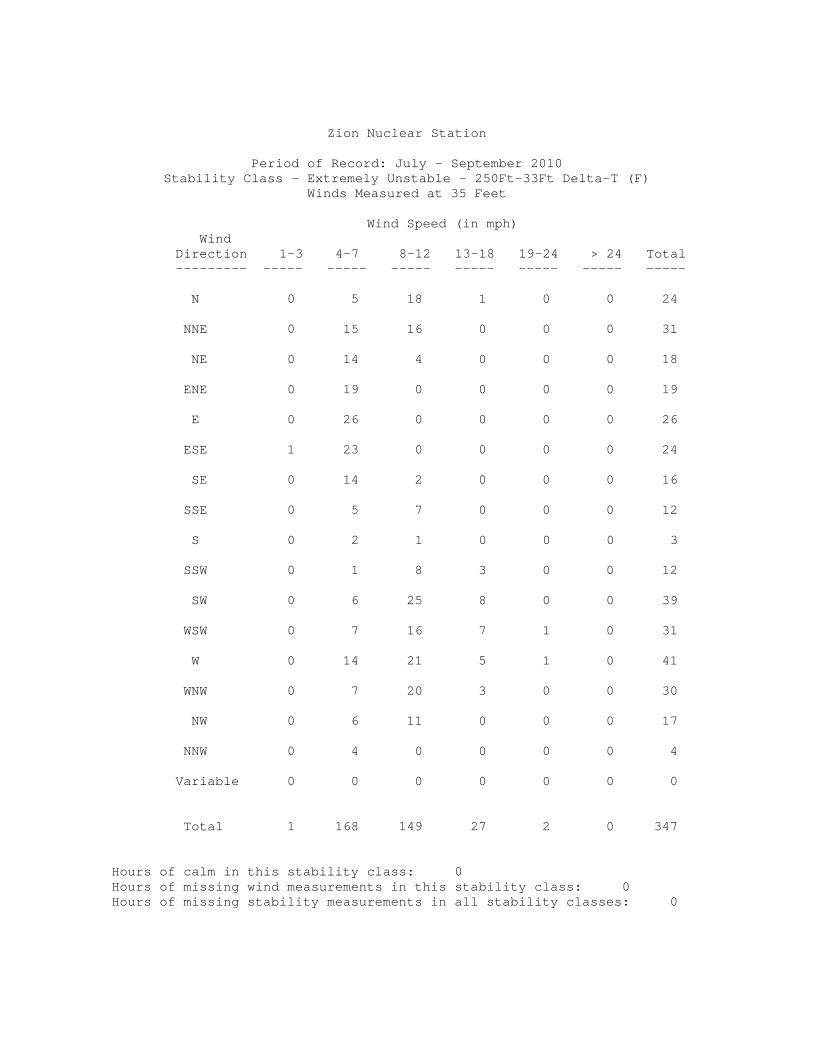
Zion Nuclear Station
Period of Record: July - September 2010 Stability Class - Extremely Unstable - 250Ft-33Ft Delta-T (F)
Winds Measured at 35 Feet Wind Speed (in mph) Wind Direction 1-3 4-7 8-12 13-18 19-24 > 24 Total --------- ----- ----- ----- ----- ----- ----- ----- N 0 5 18 1 0 0 24 NNE 0 15 16 0 0 0 31 NE 0 14 4 0 0 0 18 ENE 0 19 0 0 0 0 19 E 0 26 0 0 0 0 26 ESE 1 23 0 0 0 0 24 SE 0 14 2 0 0 0 16 SSE 0 5 7 0 0 0 12 S 0 2 1 0 0 0 3 SSW 0 1 8 3 0 0 12 SW 0 6 25 8 0 0 39 WSW 0 7 16 7 1 0 31 W 0 14 21 5 1 0 41 WNW 0 7 20 3 0 0 30 NW 0 6 11 0 0 0 17 NNW 0 4 0 0 0 0 4 Variable 0 0 0 0 0 0 0 Total 1 168 149 27 2 0 347 Hours of calm in this stability class: 0 Hours of missing wind measurements in this stability class: 0 Hours of missing stability measurements in all stability classes: 0

Zion Nuclear Station
Period of Record: July - September 2010 Stability Class - Moderately Unstable - 250Ft-33Ft Delta-T (F)
Winds Measured at 35 Feet Wind Speed (in mph) Wind Direction 1-3 4-7 8-12 13-18 19-24 > 24 Total --------- ----- ----- ----- ----- ----- ----- ----- N 0 4 1 0 0 0 5 NNE 0 4 1 0 0 0 5 NE 1 3 0 0 0 0 4 ENE 0 1 0 0 0 0 1 E 1 2 0 0 0 0 3 ESE 0 1 0 0 0 0 1 SE 0 7 1 0 0 0 8 SSE 0 7 11 0 0 0 18 S 0 3 2 0 0 0 5 SSW 0 0 4 0 0 0 4 SW 1 4 6 3 0 0 14 WSW 0 3 5 2 0 0 10 W 0 8 5 2 0 0 15 WNW 0 4 2 0 0 0 6 NW 0 2 3 0 0 0 5 NNW 0 1 1 1 0 0 3 Variable 0 0 0 0 0 0 0 Total 3 54 42 8 0 0 107 Hours of calm in this stability class: 0 Hours of missing wind measurements in this stability class: 0 Hours of missing stability measurements in all stability classes: 0

Zion Nuclear Station
Period of Record: July - September 2010 Stability Class - Slightly Unstable - 250Ft-33Ft Delta-T (F)
Winds Measured at 35 Feet Wind Speed (in mph) Wind Direction 1-3 4-7 8-12 13-18 19-24 > 24 Total --------- ----- ----- ----- ----- ----- ----- ----- N 0 8 3 1 0 0 12 NNE 0 4 3 0 0 0 7 NE 2 3 0 0 0 0 5 ENE 0 3 0 0 0 0 3 E 0 5 0 0 0 0 5 ESE 2 7 0 0 0 0 9 SE 1 10 3 0 0 0 14 SSE 0 9 8 2 0 0 19 S 0 6 1 0 0 0 7 SSW 0 2 4 2 0 0 8 SW 0 5 5 3 0 0 13 WSW 0 3 0 2 0 0 5 W 0 3 4 2 0 0 9 WNW 0 8 3 0 0 0 11 NW 0 1 3 0 0 0 4 NNW 0 2 2 0 0 0 4 Variable 0 0 0 0 0 0 0 Total 5 79 39 12 0 0 135 Hours of calm in this stability class: 0 Hours of missing wind measurements in this stability class: 0 Hours of missing stability measurements in all stability classes: 0
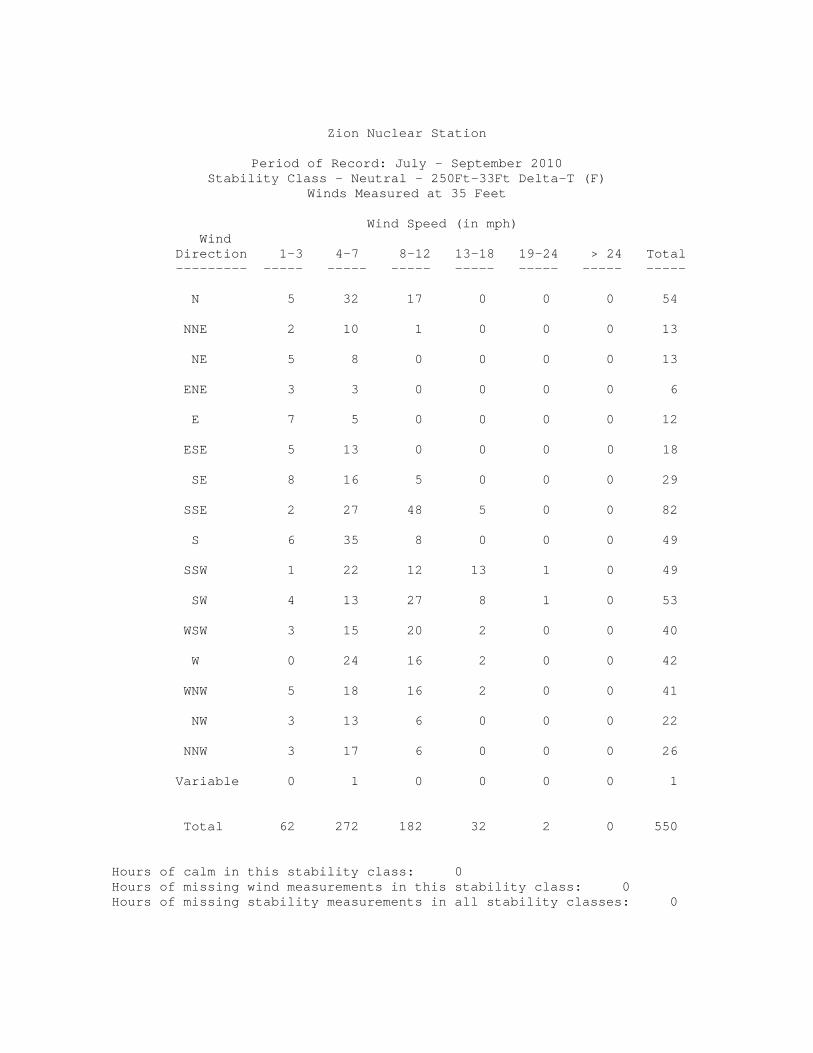
Zion Nuclear Station
Period of Record: July - September 2010 Stability Class - Neutral - 250Ft-33Ft Delta-T (F)
Winds Measured at 35 Feet Wind Speed (in mph) Wind Direction 1-3 4-7 8-12 13-18 19-24 > 24 Total --------- ----- ----- ----- ----- ----- ----- ----- N 5 32 17 0 0 0 54 NNE 2 10 1 0 0 0 13 NE 5 8 0 0 0 0 13 ENE 3 3 0 0 0 0 6 E 7 5 0 0 0 0 12 ESE 5 13 0 0 0 0 18 SE 8 16 5 0 0 0 29 SSE 2 27 48 5 0 0 82 S 6 35 8 0 0 0 49 SSW 1 22 12 13 1 0 49 SW 4 13 27 8 1 0 53 WSW 3 15 20 2 0 0 40 W 0 24 16 2 0 0 42 WNW 5 18 16 2 0 0 41 NW 3 13 6 0 0 0 22 NNW 3 17 6 0 0 0 26 Variable 0 1 0 0 0 0 1 Total 62 272 182 32 2 0 550 Hours of calm in this stability class: 0 Hours of missing wind measurements in this stability class: 0 Hours of missing stability measurements in all stability classes: 0
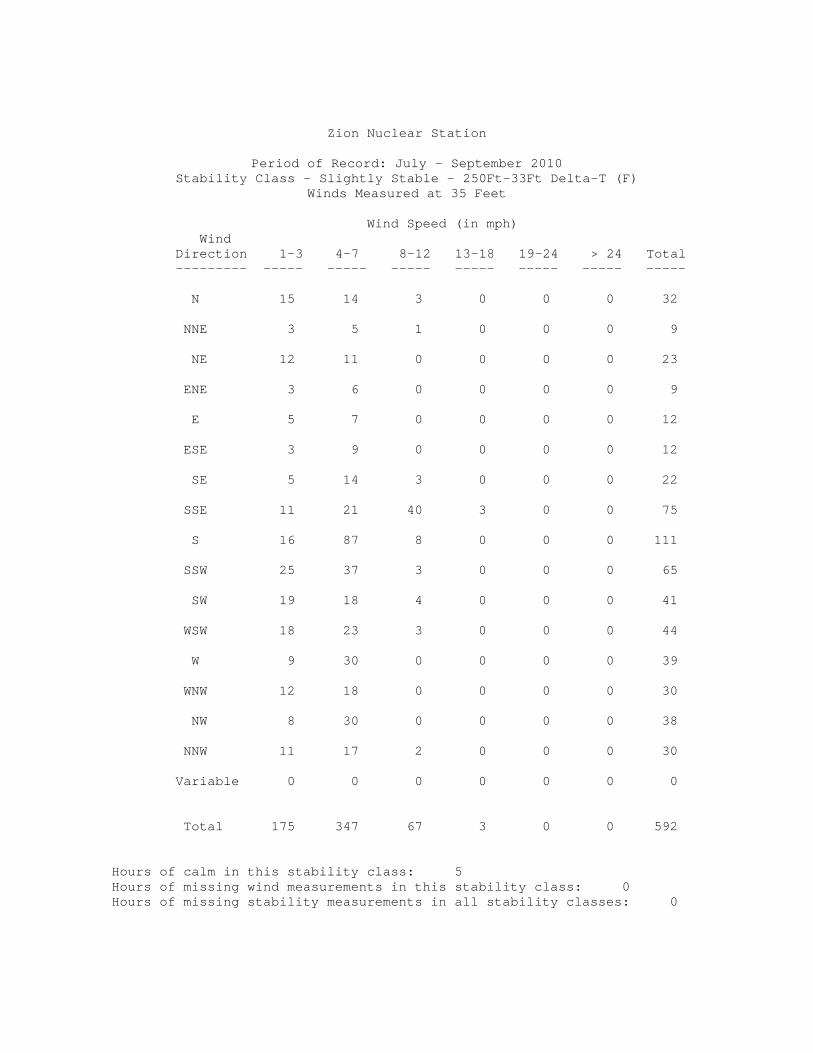
Zion Nuclear Station
Period of Record: July - September 2010 Stability Class - Slightly Stable - 250Ft-33Ft Delta-T (F)
Winds Measured at 35 Feet Wind Speed (in mph) Wind Direction 1-3 4-7 8-12 13-18 19-24 > 24 Total --------- ----- ----- ----- ----- ----- ----- ----- N 15 14 3 0 0 0 32 NNE 3 5 1 0 0 0 9 NE 12 11 0 0 0 0 23 ENE 3 6 0 0 0 0 9 E 5 7 0 0 0 0 12 ESE 3 9 0 0 0 0 12 SE 5 14 3 0 0 0 22 SSE 11 21 40 3 0 0 75 S 16 87 8 0 0 0 111 SSW 25 37 3 0 0 0 65 SW 19 18 4 0 0 0 41 WSW 18 23 3 0 0 0 44 W 9 30 0 0 0 0 39 WNW 12 18 0 0 0 0 30 NW 8 30 0 0 0 0 38 NNW 11 17 2 0 0 0 30 Variable 0 0 0 0 0 0 0 Total 175 347 67 3 0 0 592 Hours of calm in this stability class: 5 Hours of missing wind measurements in this stability class: 0 Hours of missing stability measurements in all stability classes: 0
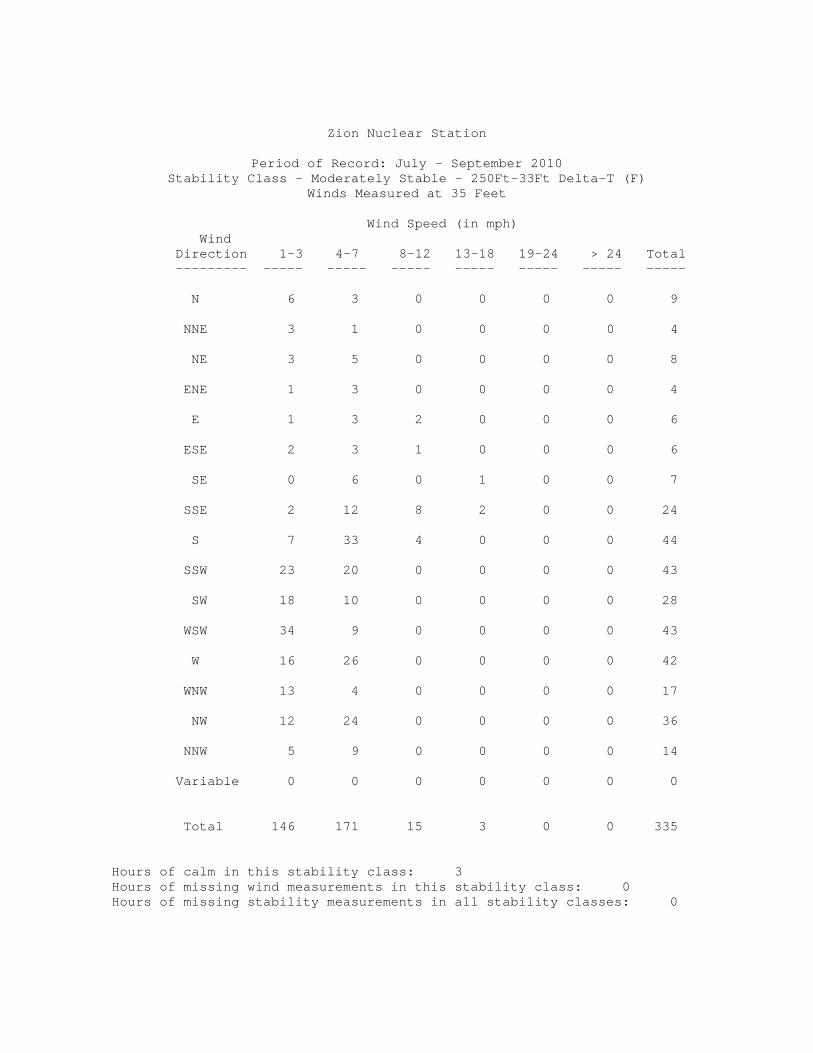
Zion Nuclear Station
Period of Record: July - September 2010 Stability Class - Moderately Stable - 250Ft-33Ft Delta-T (F)
Winds Measured at 35 Feet Wind Speed (in mph) Wind Direction 1-3 4-7 8-12 13-18 19-24 > 24 Total --------- ----- ----- ----- ----- ----- ----- ----- N 6 3 0 0 0 0 9 NNE 3 1 0 0 0 0 4 NE 3 5 0 0 0 0 8 ENE 1 3 0 0 0 0 4 E 1 3 2 0 0 0 6 ESE 2 3 1 0 0 0 6 SE 0 6 0 1 0 0 7 SSE 2 12 8 2 0 0 24 S 7 33 4 0 0 0 44 SSW 23 20 0 0 0 0 43 SW 18 10 0 0 0 0 28 WSW 34 9 0 0 0 0 43 W 16 26 0 0 0 0 42 WNW 13 4 0 0 0 0 17 NW 12 24 0 0 0 0 36 NNW 5 9 0 0 0 0 14 Variable 0 0 0 0 0 0 0 Total 146 171 15 3 0 0 335 Hours of calm in this stability class: 3 Hours of missing wind measurements in this stability class: 0 Hours of missing stability measurements in all stability classes: 0

Zion Nuclear Station
Period of Record: July - September 2010 Stability Class - Extremely Stable - 250Ft-33Ft Delta-T (F)
Winds Measured at 35 Feet Wind Speed (in mph) Wind Direction 1-3 4-7 8-12 13-18 19-24 > 24 Total --------- ----- ----- ----- ----- ----- ----- ----- N 2 0 0 0 0 0 2 NNE 0 0 0 0 0 0 0 NE 0 0 0 0 0 0 0 ENE 0 2 0 0 0 0 2 E 1 1 0 0 0 0 2 ESE 1 1 0 0 0 0 2 SE 0 0 0 0 0 0 0 SSE 0 2 0 0 0 0 2 S 6 7 1 0 0 0 14 SSW 9 3 0 0 0 0 12 SW 10 2 0 0 0 0 12 WSW 22 5 0 0 0 0 27 W 25 8 0 0 0 0 33 WNW 9 4 0 0 0 0 13 NW 3 3 0 0 0 0 6 NNW 1 0 0 0 0 0 1 Variable 0 0 0 0 0 0 0 Total 89 38 1 0 0 0 128 Hours of calm in this stability class: 6 Hours of missing wind measurements in this stability class: 0 Hours of missing stability measurements in all stability classes: 0
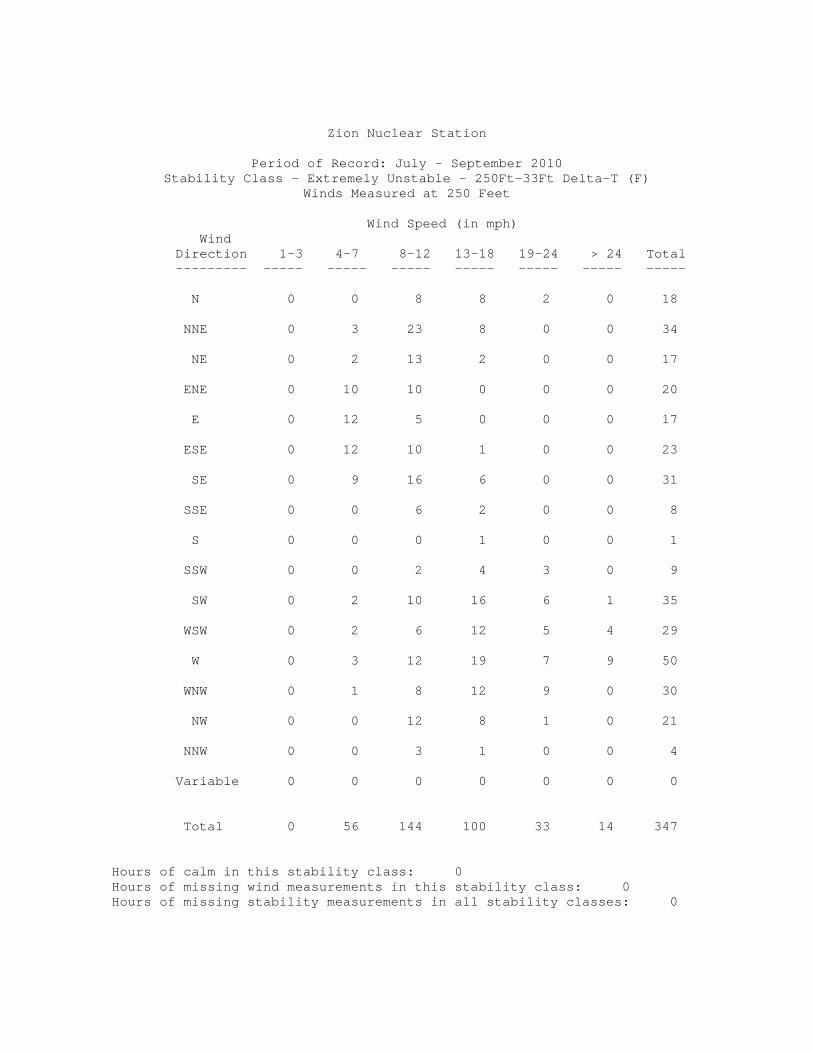
Zion Nuclear Station
Period of Record: July - September 2010 Stability Class - Extremely Unstable - 250Ft-33Ft Delta-T (F)
Winds Measured at 250 Feet Wind Speed (in mph) Wind Direction 1-3 4-7 8-12 13-18 19-24 > 24 Total --------- ----- ----- ----- ----- ----- ----- ----- N 0 0 8 8 2 0 18 NNE 0 3 23 8 0 0 34 NE 0 2 13 2 0 0 17 ENE 0 10 10 0 0 0 20 E 0 12 5 0 0 0 17 ESE 0 12 10 1 0 0 23 SE 0 9 16 6 0 0 31 SSE 0 0 6 2 0 0 8 S 0 0 0 1 0 0 1 SSW 0 0 2 4 3 0 9 SW 0 2 10 16 6 1 35 WSW 0 2 6 12 5 4 29 W 0 3 12 19 7 9 50 WNW 0 1 8 12 9 0 30 NW 0 0 12 8 1 0 21 NNW 0 0 3 1 0 0 4 Variable 0 0 0 0 0 0 0 Total 0 56 144 100 33 14 347 Hours of calm in this stability class: 0 Hours of missing wind measurements in this stability class: 0 Hours of missing stability measurements in all stability classes: 0

Zion Nuclear Station
Period of Record: July - September 2010 Stability Class - Moderately Unstable - 250Ft-33Ft Delta-T (F)
Winds Measured at 250 Feet Wind Speed (in mph) Wind Direction 1-3 4-7 8-12 13-18 19-24 > 24 Total --------- ----- ----- ----- ----- ----- ----- ----- N 0 2 2 0 0 0 4 NNE 0 3 3 0 0 0 6 NE 0 1 0 0 0 0 1 ENE 0 3 1 0 0 0 4 E 0 0 0 0 0 0 0 ESE 0 1 2 1 0 0 4 SE 0 3 3 1 0 0 7 SSE 0 2 12 5 0 0 19 S 0 0 2 2 0 0 4 SSW 0 0 1 2 0 0 3 SW 0 1 4 4 3 0 12 WSW 0 1 3 6 1 0 11 W 0 1 4 3 2 3 13 WNW 0 0 5 2 1 1 9 NW 0 1 3 2 0 0 6 NNW 0 1 2 0 1 0 4 Variable 0 0 0 0 0 0 0 Total 0 20 47 28 8 4 107 Hours of calm in this stability class: 0 Hours of missing wind measurements in this stability class: 0 Hours of missing stability measurements in all stability classes: 0

Zion Nuclear Station
Period of Record: July - September 2010 Stability Class - Slightly Unstable - 250Ft-33Ft Delta-T (F)
Winds Measured at 250 Feet Wind Speed (in mph) Wind Direction 1-3 4-7 8-12 13-18 19-24 > 24 Total --------- ----- ----- ----- ----- ----- ----- ----- N 0 1 3 5 0 1 10 NNE 0 2 4 2 0 0 8 NE 0 0 0 0 0 0 0 ENE 0 7 1 0 0 0 8 E 0 2 0 1 0 0 3 ESE 0 3 2 1 0 0 6 SE 0 9 3 5 1 0 18 SSE 0 3 8 6 0 0 17 S 0 3 3 3 0 0 9 SSW 0 0 1 3 1 0 5 SW 0 0 7 6 3 2 18 WSW 0 2 2 0 1 1 6 W 0 1 0 3 2 2 8 WNW 0 1 5 3 1 0 10 NW 0 0 2 4 0 0 6 NNW 0 0 2 1 0 0 3 Variable 0 0 0 0 0 0 0 Total 0 34 43 43 9 6 135 Hours of calm in this stability class: 0 Hours of missing wind measurements in this stability class: 0 Hours of missing stability measurements in all stability classes: 0
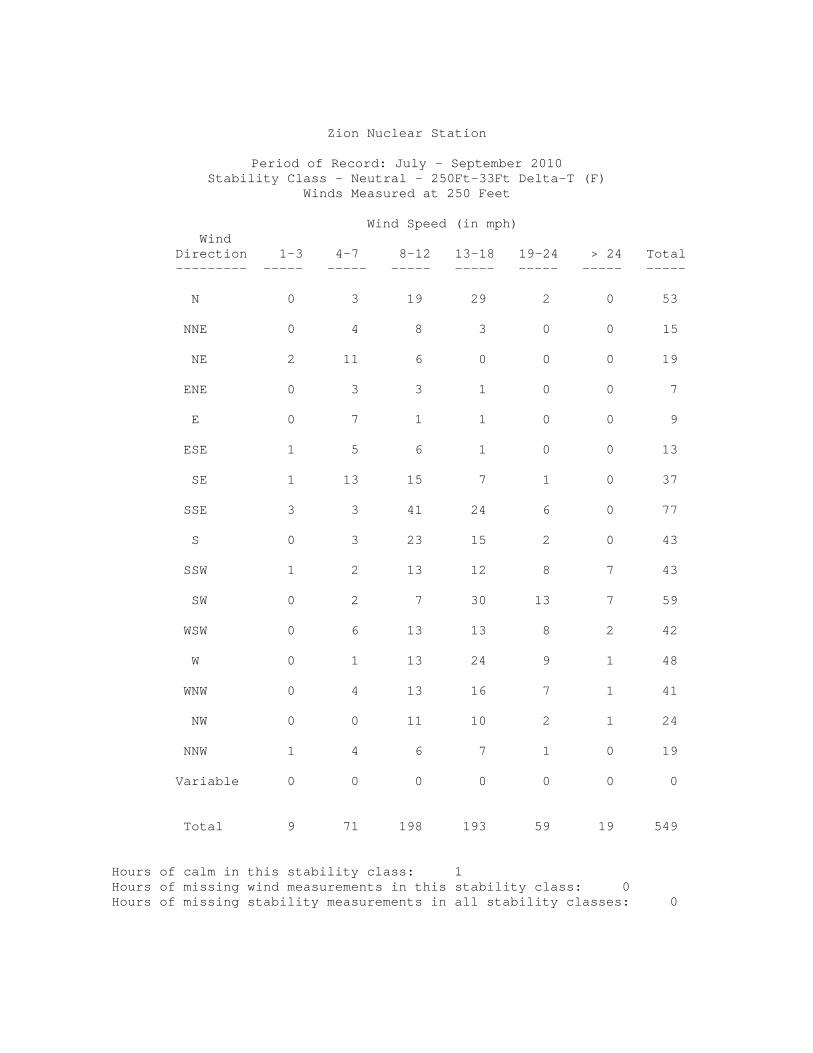
Zion Nuclear Station
Period of Record: July - September 2010 Stability Class - Neutral - 250Ft-33Ft Delta-T (F)
Winds Measured at 250 Feet Wind Speed (in mph) Wind Direction 1-3 4-7 8-12 13-18 19-24 > 24 Total --------- ----- ----- ----- ----- ----- ----- ----- N 0 3 19 29 2 0 53 NNE 0 4 8 3 0 0 15 NE 2 11 6 0 0 0 19 ENE 0 3 3 1 0 0 7 E 0 7 1 1 0 0 9 ESE 1 5 6 1 0 0 13 SE 1 13 15 7 1 0 37 SSE 3 3 41 24 6 0 77 S 0 3 23 15 2 0 43 SSW 1 2 13 12 8 7 43 SW 0 2 7 30 13 7 59 WSW 0 6 13 13 8 2 42 W 0 1 13 24 9 1 48 WNW 0 4 13 16 7 1 41 NW 0 0 11 10 2 1 24 NNW 1 4 6 7 1 0 19 Variable 0 0 0 0 0 0 0 Total 9 71 198 193 59 19 549 Hours of calm in this stability class: 1 Hours of missing wind measurements in this stability class: 0 Hours of missing stability measurements in all stability classes: 0
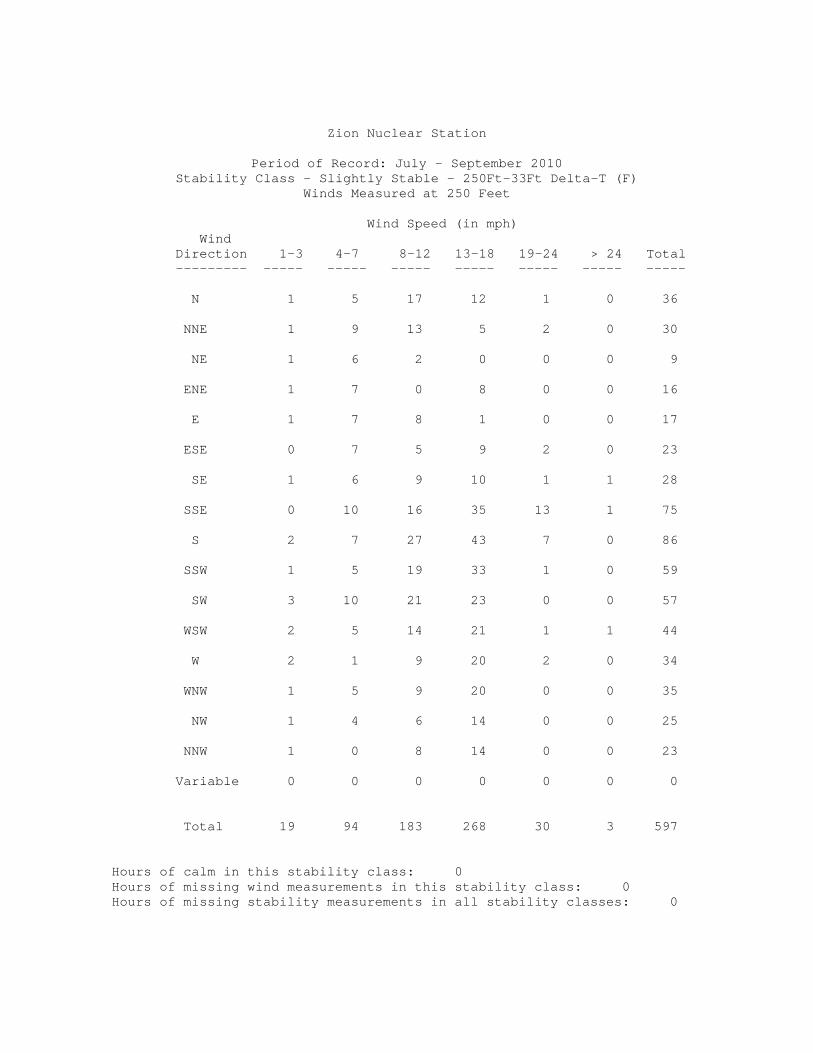
Zion Nuclear Station
Period of Record: July - September 2010 Stability Class - Slightly Stable - 250Ft-33Ft Delta-T (F)
Winds Measured at 250 Feet Wind Speed (in mph) Wind Direction 1-3 4-7 8-12 13-18 19-24 > 24 Total --------- ----- ----- ----- ----- ----- ----- ----- N 1 5 17 12 1 0 36 NNE 1 9 13 5 2 0 30 NE 1 6 2 0 0 0 9 ENE 1 7 0 8 0 0 16 E 1 7 8 1 0 0 17 ESE 0 7 5 9 2 0 23 SE 1 6 9 10 1 1 28 SSE 0 10 16 35 13 1 75 S 2 7 27 43 7 0 86 SSW 1 5 19 33 1 0 59 SW 3 10 21 23 0 0 57 WSW 2 5 14 21 1 1 44 W 2 1 9 20 2 0 34 WNW 1 5 9 20 0 0 35 NW 1 4 6 14 0 0 25 NNW 1 0 8 14 0 0 23 Variable 0 0 0 0 0 0 0 Total 19 94 183 268 30 3 597 Hours of calm in this stability class: 0 Hours of missing wind measurements in this stability class: 0 Hours of missing stability measurements in all stability classes: 0
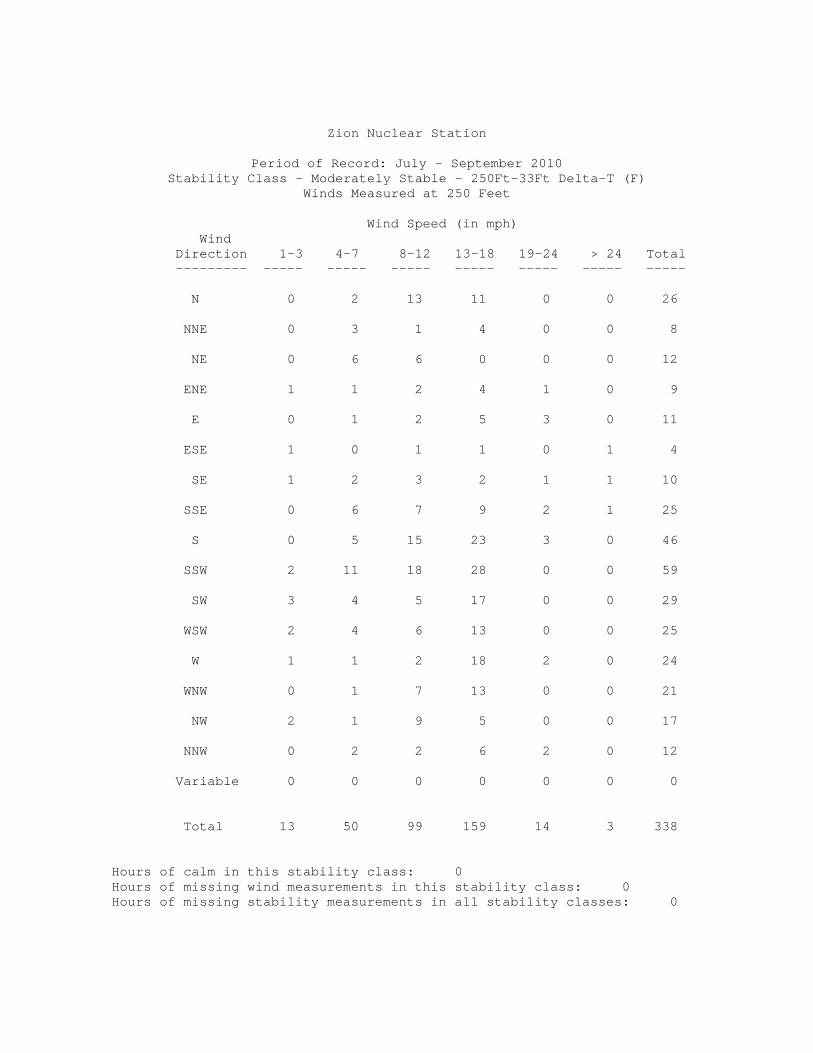
Zion Nuclear Station
Period of Record: July - September 2010 Stability Class - Moderately Stable - 250Ft-33Ft Delta-T (F)
Winds Measured at 250 Feet Wind Speed (in mph) Wind Direction 1-3 4-7 8-12 13-18 19-24 > 24 Total --------- ----- ----- ----- ----- ----- ----- ----- N 0 2 13 11 0 0 26 NNE 0 3 1 4 0 0 8 NE 0 6 6 0 0 0 12 ENE 1 1 2 4 1 0 9 E 0 1 2 5 3 0 11 ESE 1 0 1 1 0 1 4 SE 1 2 3 2 1 1 10 SSE 0 6 7 9 2 1 25 S 0 5 15 23 3 0 46 SSW 2 11 18 28 0 0 59 SW 3 4 5 17 0 0 29 WSW 2 4 6 13 0 0 25 W 1 1 2 18 2 0 24 WNW 0 1 7 13 0 0 21 NW 2 1 9 5 0 0 17 NNW 0 2 2 6 2 0 12 Variable 0 0 0 0 0 0 0 Total 13 50 99 159 14 3 338 Hours of calm in this stability class: 0 Hours of missing wind measurements in this stability class: 0 Hours of missing stability measurements in all stability classes: 0
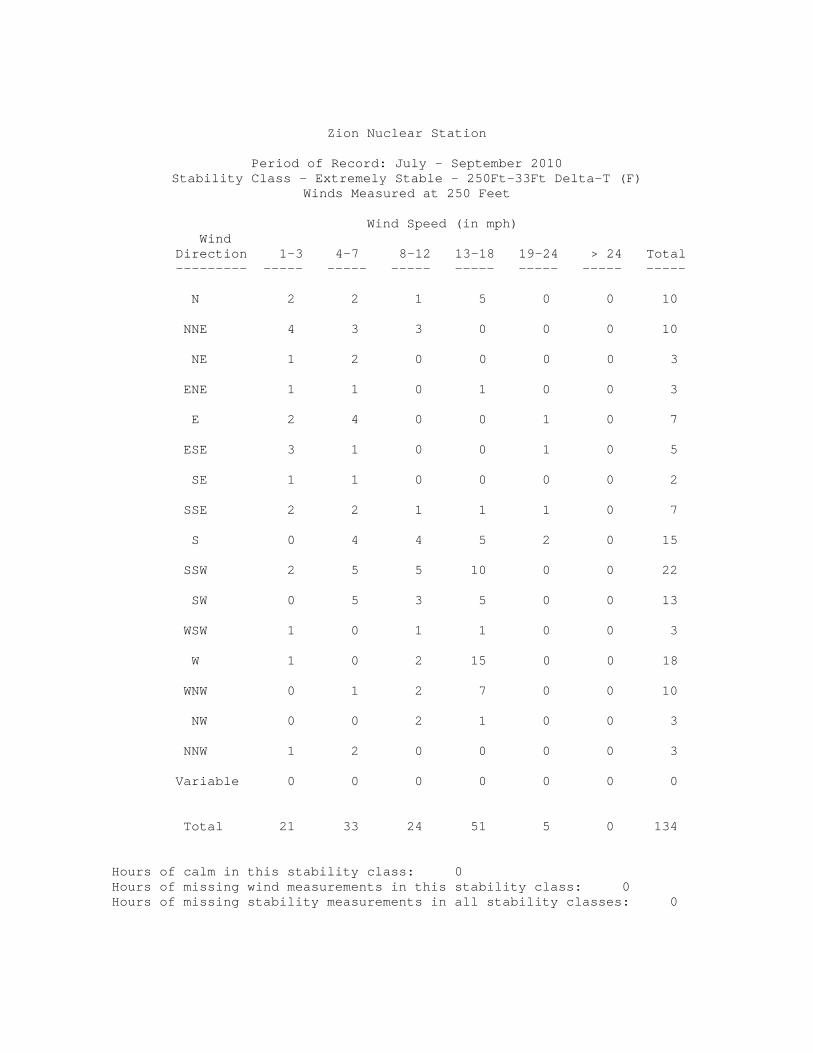
Zion Nuclear Station
Period of Record: July - September 2010 Stability Class - Extremely Stable - 250Ft-33Ft Delta-T (F)
Winds Measured at 250 Feet Wind Speed (in mph) Wind Direction 1-3 4-7 8-12 13-18 19-24 > 24 Total --------- ----- ----- ----- ----- ----- ----- ----- N 2 2 1 5 0 0 10 NNE 4 3 3 0 0 0 10 NE 1 2 0 0 0 0 3 ENE 1 1 0 1 0 0 3 E 2 4 0 0 1 0 7 ESE 3 1 0 0 1 0 5 SE 1 1 0 0 0 0 2 SSE 2 2 1 1 1 0 7 S 0 4 4 5 2 0 15 SSW 2 5 5 10 0 0 22 SW 0 5 3 5 0 0 13 WSW 1 0 1 1 0 0 3 W 1 0 2 15 0 0 18 WNW 0 1 2 7 0 0 10 NW 0 0 2 1 0 0 3 NNW 1 2 0 0 0 0 3 Variable 0 0 0 0 0 0 0 Total 21 33 24 51 5 0 134 Hours of calm in this stability class: 0 Hours of missing wind measurements in this stability class: 0 Hours of missing stability measurements in all stability classes: 0

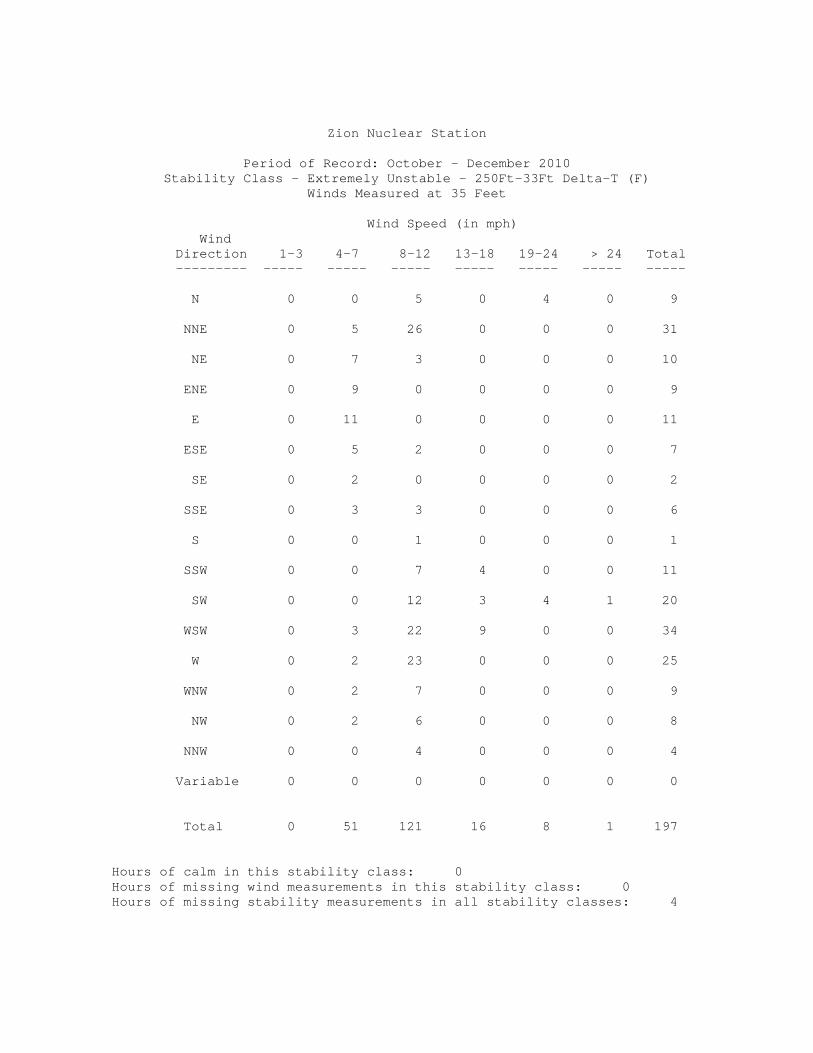
Zion Nuclear Station
Period of Record: October – December 2010 Stability Class - Extremely Unstable - 250Ft-33Ft Delta-T (F)
Winds Measured at 35 Feet Wind Speed (in mph) Wind Direction 1-3 4-7 8-12 13-18 19-24 > 24 Total --------- ----- ----- ----- ----- ----- ----- ----- N 0 0 5 0 4 0 9 NNE 0 5 26 0 0 0 31 NE 0 7 3 0 0 0 10 ENE 0 9 0 0 0 0 9 E 0 11 0 0 0 0 11 ESE 0 5 2 0 0 0 7 SE 0 2 0 0 0 0 2 SSE 0 3 3 0 0 0 6 S 0 0 1 0 0 0 1 SSW 0 0 7 4 0 0 11 SW 0 0 12 3 4 1 20 WSW 0 3 22 9 0 0 34 W 0 2 23 0 0 0 25 WNW 0 2 7 0 0 0 9 NW 0 2 6 0 0 0 8 NNW 0 0 4 0 0 0 4 Variable 0 0 0 0 0 0 0 Total 0 51 121 16 8 1 197 Hours of calm in this stability class: 0 Hours of missing wind measurements in this stability class: 0 Hours of missing stability measurements in all stability classes: 4

Zion Nuclear Station
Period of Record: October – December 2010 Stability Class - Moderately Unstable - 250Ft-33Ft Delta-T (F)
Winds Measured at 35 Feet Wind Speed (in mph) Wind Direction 1-3 4-7 8-12 13-18 19-24 > 24 Total --------- ----- ----- ----- ----- ----- ----- ----- N 0 1 3 2 0 0 6 NNE 0 1 1 0 0 0 2 NE 0 0 0 0 0 0 0 ENE 0 2 0 0 0 0 2 E 0 1 0 0 0 0 1 ESE 0 2 0 0 0 0 2 SE 0 3 0 0 0 0 3 SSE 0 0 0 0 0 0 0 S 0 0 2 0 0 0 2 SSW 0 0 1 4 0 0 5 SW 0 0 3 2 0 1 6 WSW 0 0 11 3 0 0 14 W 0 3 7 0 0 0 10 WNW 0 0 6 0 0 0 6 NW 0 1 3 2 0 0 6 NNW 0 0 2 1 0 0 3 Variable 0 0 0 0 0 0 0 Total 0 14 39 14 0 1 68 Hours of calm in this stability class: 0 Hours of missing wind measurements in this stability class: 0 Hours of missing stability measurements in all stability classes: 4

Zion Nuclear Station
Period of Record: October – December 2010 Stability Class - Slightly Unstable - 250Ft-33Ft Delta-T (F)
Winds Measured at 35 Feet Wind Speed (in mph) Wind Direction 1-3 4-7 8-12 13-18 19-24 > 24 Total --------- ----- ----- ----- ----- ----- ----- ----- N 0 0 5 0 0 0 5 NNE 0 1 2 0 0 0 3 NE 0 3 0 0 0 0 3 ENE 0 1 0 0 0 0 1 E 0 3 0 0 0 0 3 ESE 0 1 1 1 0 0 3 SE 0 1 0 4 0 0 5 SSE 0 1 5 2 0 0 8 S 0 1 4 0 0 0 5 SSW 0 0 3 1 0 0 4 SW 0 1 6 3 4 1 15 WSW 0 3 6 2 1 0 12 W 0 5 9 2 0 0 16 WNW 0 3 12 0 0 0 15 NW 1 5 7 0 0 0 13 NNW 0 2 6 2 0 0 10 Variable 0 0 0 0 0 0 0 Total 1 31 66 17 5 1 121 Hours of calm in this stability class: 0 Hours of missing wind measurements in this stability class: 0 Hours of missing stability measurements in all stability classes: 4
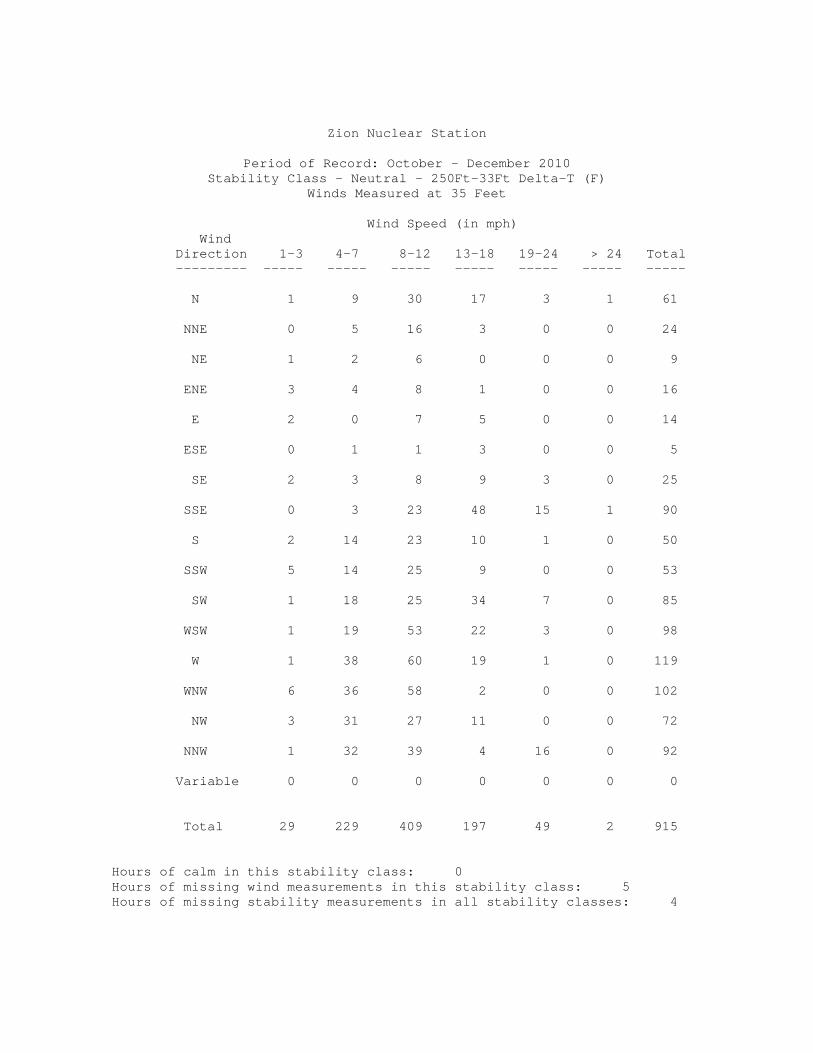
Zion Nuclear Station
Period of Record: October – December 2010 Stability Class - Neutral - 250Ft-33Ft Delta-T (F)
Winds Measured at 35 Feet Wind Speed (in mph) Wind Direction 1-3 4-7 8-12 13-18 19-24 > 24 Total --------- ----- ----- ----- ----- ----- ----- ----- N 1 9 30 17 3 1 61 NNE 0 5 16 3 0 0 24 NE 1 2 6 0 0 0 9 ENE 3 4 8 1 0 0 16 E 2 0 7 5 0 0 14 ESE 0 1 1 3 0 0 5 SE 2 3 8 9 3 0 25 SSE 0 3 23 48 15 1 90 S 2 14 23 10 1 0 50 SSW 5 14 25 9 0 0 53 SW 1 18 25 34 7 0 85 WSW 1 19 53 22 3 0 98 W 1 38 60 19 1 0 119 WNW 6 36 58 2 0 0 102 NW 3 31 27 11 0 0 72 NNW 1 32 39 4 16 0 92 Variable 0 0 0 0 0 0 0 Total 29 229 409 197 49 2 915 Hours of calm in this stability class: 0 Hours of missing wind measurements in this stability class: 5 Hours of missing stability measurements in all stability classes: 4
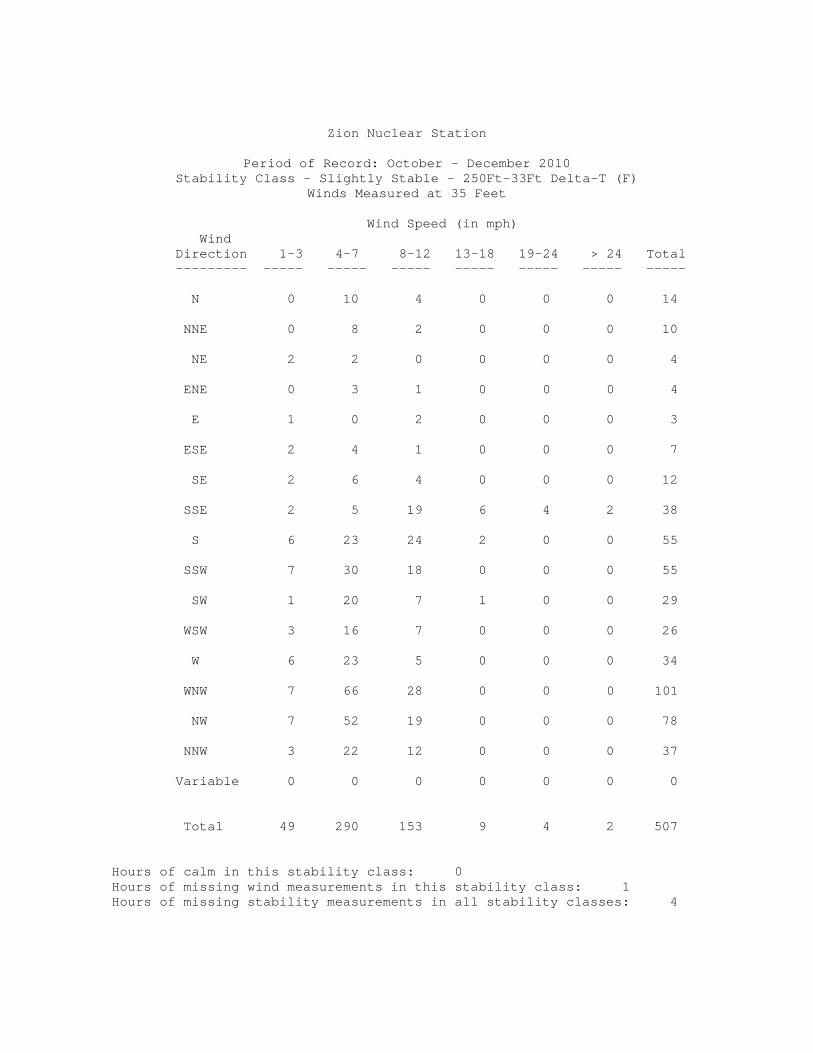
Zion Nuclear Station
Period of Record: October – December 2010 Stability Class - Slightly Stable - 250Ft-33Ft Delta-T (F)
Winds Measured at 35 Feet Wind Speed (in mph) Wind Direction 1-3 4-7 8-12 13-18 19-24 > 24 Total --------- ----- ----- ----- ----- ----- ----- ----- N 0 10 4 0 0 0 14 NNE 0 8 2 0 0 0 10 NE 2 2 0 0 0 0 4 ENE 0 3 1 0 0 0 4 E 1 0 2 0 0 0 3 ESE 2 4 1 0 0 0 7 SE 2 6 4 0 0 0 12 SSE 2 5 19 6 4 2 38 S 6 23 24 2 0 0 55 SSW 7 30 18 0 0 0 55 SW 1 20 7 1 0 0 29 WSW 3 16 7 0 0 0 26 W 6 23 5 0 0 0 34 WNW 7 66 28 0 0 0 101 NW 7 52 19 0 0 0 78 NNW 3 22 12 0 0 0 37 Variable 0 0 0 0 0 0 0 Total 49 290 153 9 4 2 507 Hours of calm in this stability class: 0 Hours of missing wind measurements in this stability class: 1 Hours of missing stability measurements in all stability classes: 4
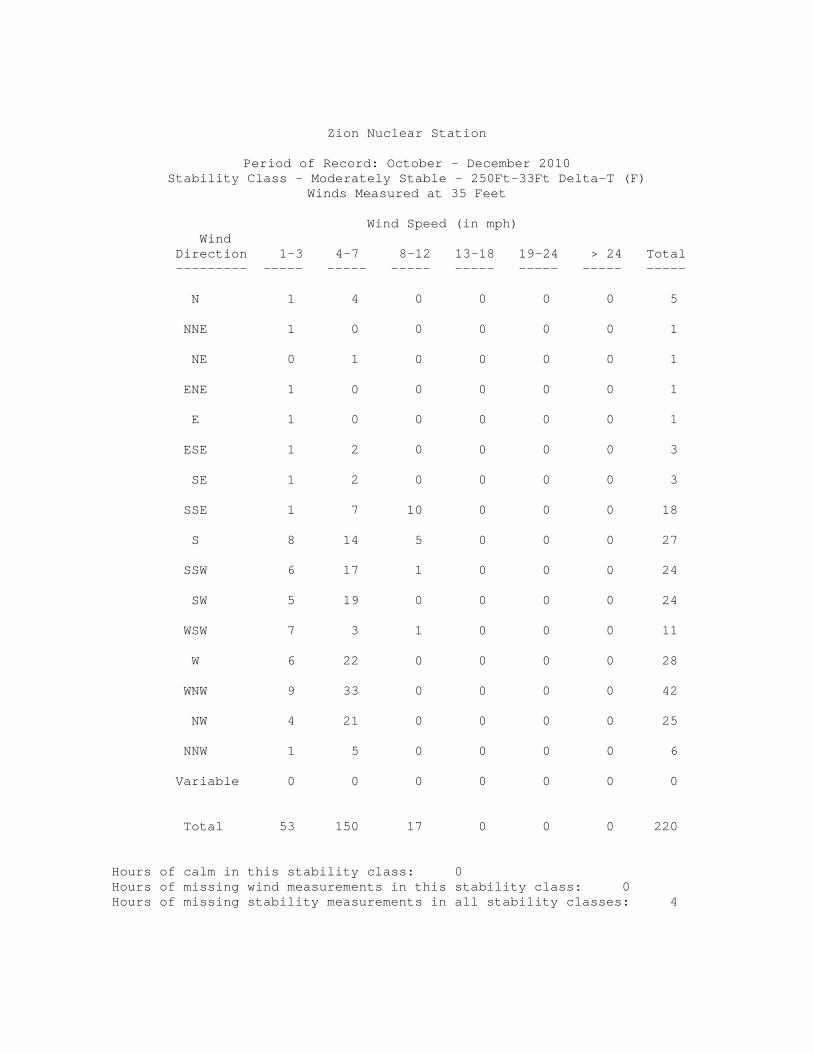
Zion Nuclear Station
Period of Record: October – December 2010 Stability Class - Moderately Stable - 250Ft-33Ft Delta-T (F)
Winds Measured at 35 Feet Wind Speed (in mph) Wind Direction 1-3 4-7 8-12 13-18 19-24 > 24 Total --------- ----- ----- ----- ----- ----- ----- ----- N 1 4 0 0 0 0 5 NNE 1 0 0 0 0 0 1 NE 0 1 0 0 0 0 1 ENE 1 0 0 0 0 0 1 E 1 0 0 0 0 0 1 ESE 1 2 0 0 0 0 3 SE 1 2 0 0 0 0 3 SSE 1 7 10 0 0 0 18 S 8 14 5 0 0 0 27 SSW 6 17 1 0 0 0 24 SW 5 19 0 0 0 0 24 WSW 7 3 1 0 0 0 11 W 6 22 0 0 0 0 28 WNW 9 33 0 0 0 0 42 NW 4 21 0 0 0 0 25 NNW 1 5 0 0 0 0 6 Variable 0 0 0 0 0 0 0 Total 53 150 17 0 0 0 220 Hours of calm in this stability class: 0 Hours of missing wind measurements in this stability class: 0 Hours of missing stability measurements in all stability classes: 4

Zion Nuclear Station
Period of Record: October – December 2010 Stability Class - Extremely Stable - 250Ft-33Ft Delta-T (F)
Winds Measured at 35 Feet Wind Speed (in mph) Wind Direction 1-3 4-7 8-12 13-18 19-24 > 24 Total --------- ----- ----- ----- ----- ----- ----- ----- N 1 0 0 0 0 0 1 NNE 0 0 0 0 0 0 0 NE 0 0 0 0 0 0 0 ENE 0 0 0 0 0 0 0 E 0 0 0 0 0 0 0 ESE 2 0 0 0 0 0 2 SE 1 4 0 0 0 0 5 SSE 0 1 4 0 0 0 5 S 1 6 4 0 0 0 11 SSW 2 2 0 0 0 0 4 SW 5 5 0 0 0 0 10 WSW 12 12 0 0 0 0 24 W 20 68 0 0 0 0 88 WNW 4 8 0 0 0 0 12 NW 3 4 0 0 0 0 7 NNW 1 0 0 0 0 0 1 Variable 0 0 0 0 0 0 0 Total 52 110 8 0 0 0 170 Hours of calm in this stability class: 0 Hours of missing wind measurements in this stability class: 0 Hours of missing stability measurements in all stability classes: 4

Zion Nuclear Station
Period of Record: October – December 2010 Stability Class - Extremely Unstable - 250Ft-33Ft Delta-T (F)
Winds Measured at 250 Feet Wind Speed (in mph) Wind Direction 1-3 4-7 8-12 13-18 19-24 > 24 Total --------- ----- ----- ----- ----- ----- ----- ----- N 0 0 1 2 0 4 7 NNE 0 2 12 13 0 0 27 NE 0 1 12 2 0 0 15 ENE 0 1 5 0 0 0 6 E 0 3 8 0 0 0 11 ESE 0 6 3 0 0 0 9 SE 0 1 3 0 0 0 4 SSE 0 2 4 0 0 0 6 S 0 0 0 0 0 0 0 SSW 0 0 2 0 1 0 3 SW 0 0 5 8 3 2 18 WSW 0 0 4 15 10 3 32 W 0 0 14 18 5 0 37 WNW 0 0 4 2 0 0 6 NW 0 1 4 6 1 0 12 NNW 0 0 0 4 0 0 4 Variable 0 0 0 0 0 0 0 Total 0 17 81 70 20 9 197 Hours of calm in this stability class: 0 Hours of missing wind measurements in this stability class: 0 Hours of missing stability measurements in all stability classes: 4

Zion Nuclear Station
Period of Record: October – December 2010 Stability Class - Moderately Unstable - 250Ft-33Ft Delta-T (F)
Winds Measured at 250 Feet Wind Speed (in mph) Wind Direction 1-3 4-7 8-12 13-18 19-24 > 24 Total --------- ----- ----- ----- ----- ----- ----- ----- N 0 1 0 1 0 2 4 NNE 0 0 2 3 0 0 5 NE 0 0 0 0 0 0 0 ENE 0 1 0 0 0 0 1 E 0 2 0 0 0 0 2 ESE 0 1 0 0 0 0 1 SE 0 0 2 0 0 0 2 SSE 0 1 1 0 0 0 2 S 0 0 0 1 0 0 1 SSW 0 0 1 1 2 0 4 SW 0 0 0 3 3 1 7 WSW 0 0 1 5 2 0 8 W 0 1 5 9 2 0 17 WNW 0 0 0 3 1 0 4 NW 0 0 3 1 4 0 8 NNW 0 0 0 1 1 0 2 Variable 0 0 0 0 0 0 0 Total 0 7 15 28 15 3 68 Hours of calm in this stability class: 0 Hours of missing wind measurements in this stability class: 0 Hours of missing stability measurements in all stability classes: 4
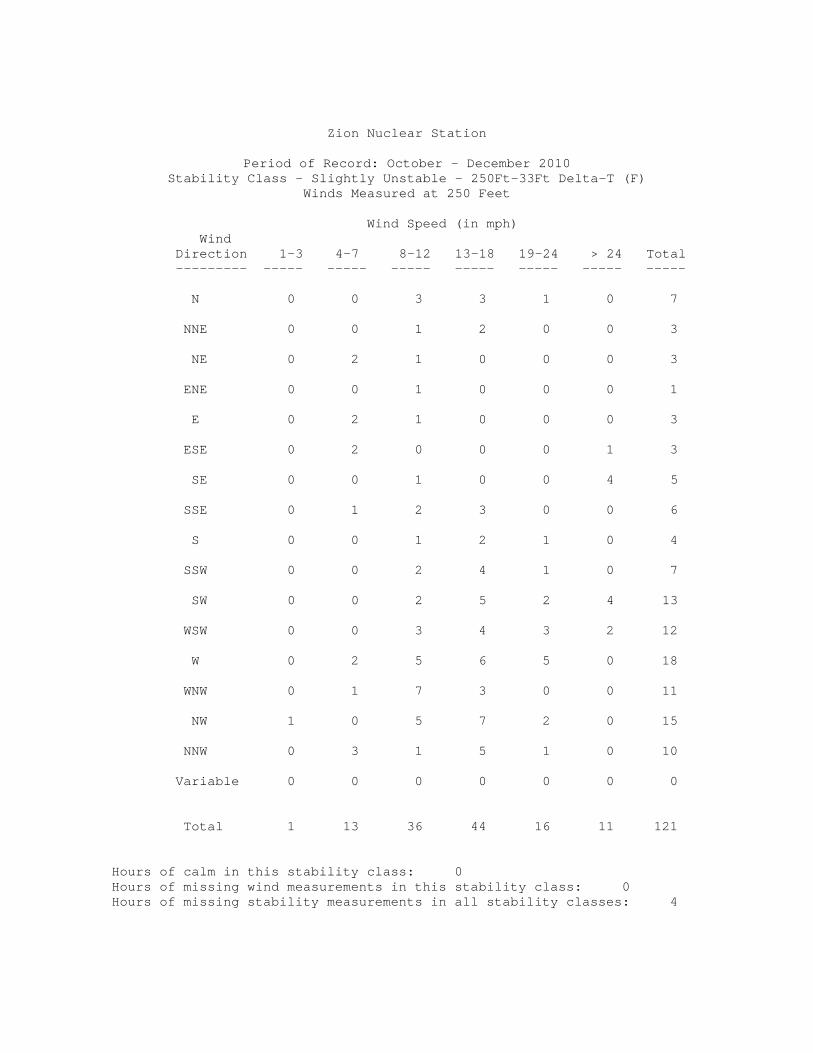
Zion Nuclear Station
Period of Record: October – December 2010 Stability Class - Slightly Unstable - 250Ft-33Ft Delta-T (F)
Winds Measured at 250 Feet Wind Speed (in mph) Wind Direction 1-3 4-7 8-12 13-18 19-24 > 24 Total --------- ----- ----- ----- ----- ----- ----- ----- N 0 0 3 3 1 0 7 NNE 0 0 1 2 0 0 3 NE 0 2 1 0 0 0 3 ENE 0 0 1 0 0 0 1 E 0 2 1 0 0 0 3 ESE 0 2 0 0 0 1 3 SE 0 0 1 0 0 4 5 SSE 0 1 2 3 0 0 6 S 0 0 1 2 1 0 4 SSW 0 0 2 4 1 0 7 SW 0 0 2 5 2 4 13 WSW 0 0 3 4 3 2 12 W 0 2 5 6 5 0 18 WNW 0 1 7 3 0 0 11 NW 1 0 5 7 2 0 15 NNW 0 3 1 5 1 0 10 Variable 0 0 0 0 0 0 0 Total 1 13 36 44 16 11 121 Hours of calm in this stability class: 0 Hours of missing wind measurements in this stability class: 0 Hours of missing stability measurements in all stability classes: 4
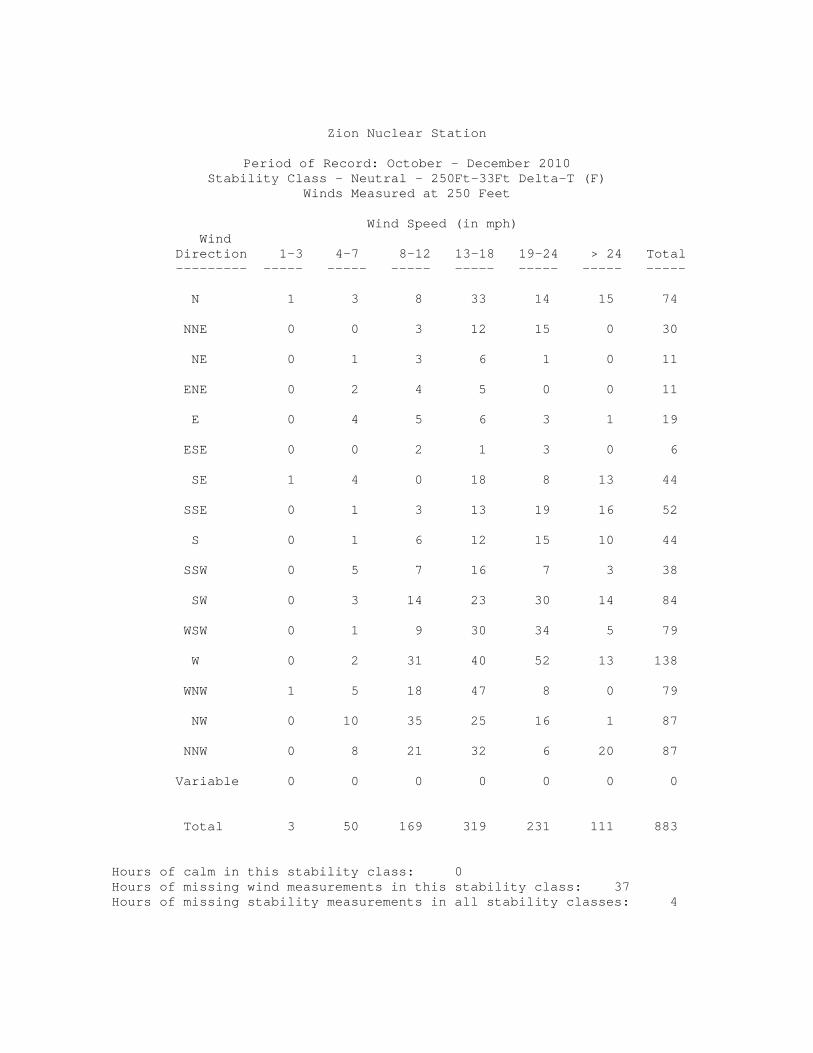
Zion Nuclear Station
Period of Record: October – December 2010 Stability Class - Neutral - 250Ft-33Ft Delta-T (F)
Winds Measured at 250 Feet Wind Speed (in mph) Wind Direction 1-3 4-7 8-12 13-18 19-24 > 24 Total --------- ----- ----- ----- ----- ----- ----- ----- N 1 3 8 33 14 15 74 NNE 0 0 3 12 15 0 30 NE 0 1 3 6 1 0 11 ENE 0 2 4 5 0 0 11 E 0 4 5 6 3 1 19 ESE 0 0 2 1 3 0 6 SE 1 4 0 18 8 13 44 SSE 0 1 3 13 19 16 52 S 0 1 6 12 15 10 44 SSW 0 5 7 16 7 3 38 SW 0 3 14 23 30 14 84 WSW 0 1 9 30 34 5 79 W 0 2 31 40 52 13 138 WNW 1 5 18 47 8 0 79 NW 0 10 35 25 16 1 87 NNW 0 8 21 32 6 20 87 Variable 0 0 0 0 0 0 0 Total 3 50 169 319 231 111 883 Hours of calm in this stability class: 0 Hours of missing wind measurements in this stability class: 37 Hours of missing stability measurements in all stability classes: 4
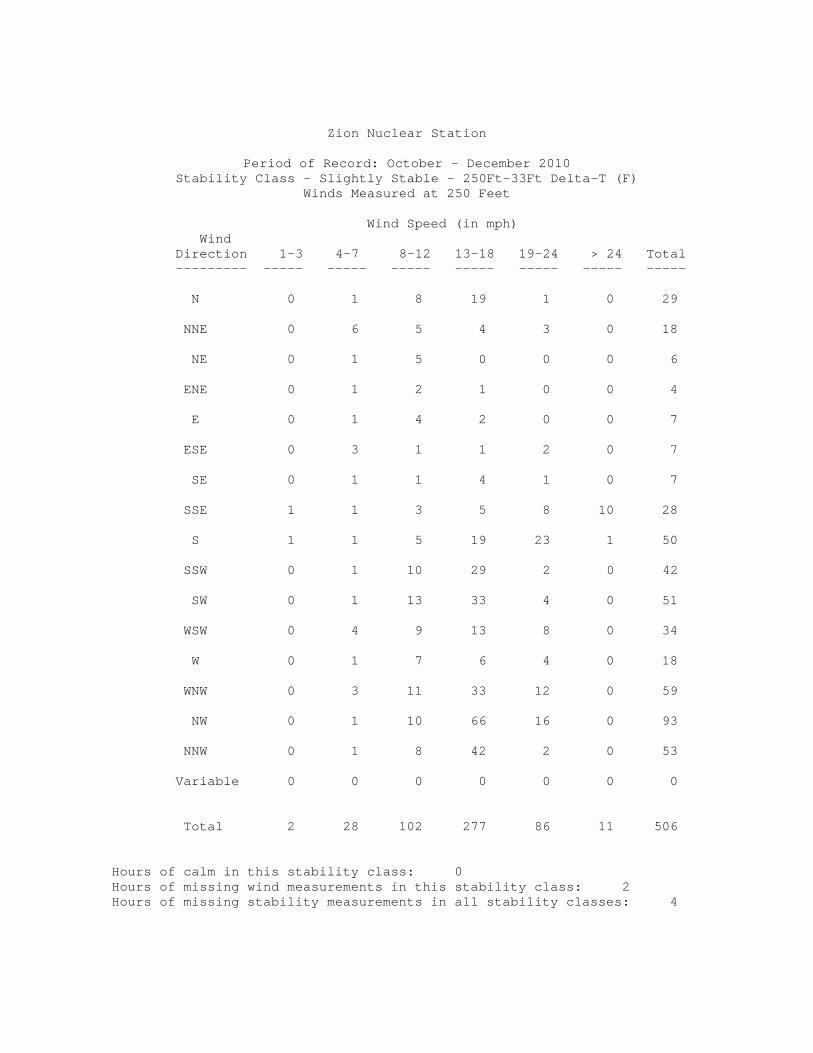
Zion Nuclear Station
Period of Record: October – December 2010 Stability Class - Slightly Stable - 250Ft-33Ft Delta-T (F)
Winds Measured at 250 Feet Wind Speed (in mph) Wind Direction 1-3 4-7 8-12 13-18 19-24 > 24 Total --------- ----- ----- ----- ----- ----- ----- ----- N 0 1 8 19 1 0 29 NNE 0 6 5 4 3 0 18 NE 0 1 5 0 0 0 6 ENE 0 1 2 1 0 0 4 E 0 1 4 2 0 0 7 ESE 0 3 1 1 2 0 7 SE 0 1 1 4 1 0 7 SSE 1 1 3 5 8 10 28 S 1 1 5 19 23 1 50 SSW 0 1 10 29 2 0 42 SW 0 1 13 33 4 0 51 WSW 0 4 9 13 8 0 34 W 0 1 7 6 4 0 18 WNW 0 3 11 33 12 0 59 NW 0 1 10 66 16 0 93 NNW 0 1 8 42 2 0 53 Variable 0 0 0 0 0 0 0 Total 2 28 102 277 86 11 506 Hours of calm in this stability class: 0 Hours of missing wind measurements in this stability class: 2 Hours of missing stability measurements in all stability classes: 4

Zion Nuclear Station
Period of Record: October – December 2010 Stability Class - Moderately Stable - 250Ft-33Ft Delta-T (F)
Winds Measured at 250 Feet Wind Speed (in mph) Wind Direction 1-3 4-7 8-12 13-18 19-24 > 24 Total --------- ----- ----- ----- ----- ----- ----- ----- N 0 2 10 5 0 0 17 NNE 1 2 1 3 0 0 7 NE 1 1 3 0 0 0 5 ENE 0 1 1 0 0 0 2 E 1 0 0 0 0 0 1 ESE 1 2 0 0 0 0 3 SE 0 1 1 1 1 0 4 SSE 2 1 5 6 6 0 20 S 0 3 3 8 8 0 22 SSW 0 1 7 13 2 0 23 SW 2 1 9 14 4 0 30 WSW 0 0 6 7 1 0 14 W 3 3 4 1 2 0 13 WNW 0 0 0 8 0 0 8 NW 1 1 3 30 4 0 39 NNW 0 2 1 9 0 0 12 Variable 0 0 0 0 0 0 0 Total 12 21 54 105 28 0 220 Hours of calm in this stability class: 0 Hours of missing wind measurements in this stability class: 0 Hours of missing stability measurements in all stability classes: 4
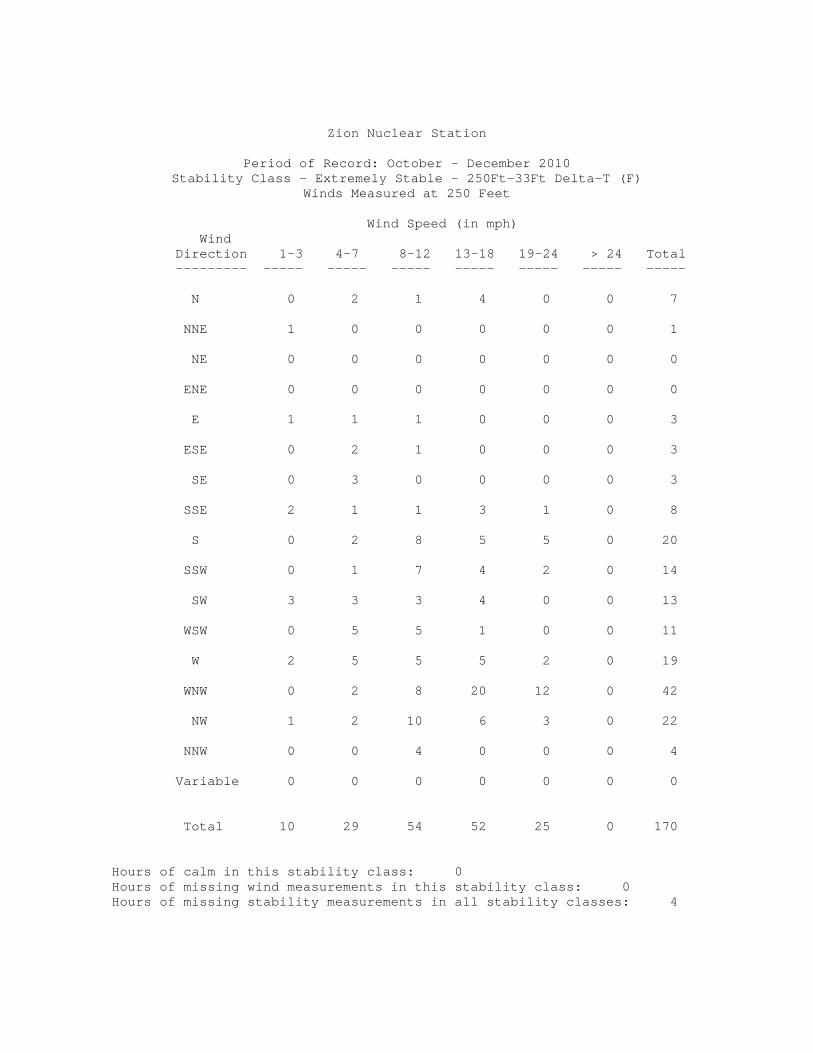
Zion Nuclear Station
Period of Record: October – December 2010 Stability Class - Extremely Stable - 250Ft-33Ft Delta-T (F)
Winds Measured at 250 Feet Wind Speed (in mph) Wind Direction 1-3 4-7 8-12 13-18 19-24 > 24 Total --------- ----- ----- ----- ----- ----- ----- ----- N 0 2 1 4 0 0 7 NNE 1 0 0 0 0 0 1 NE 0 0 0 0 0 0 0 ENE 0 0 0 0 0 0 0 E 1 1 1 0 0 0 3 ESE 0 2 1 0 0 0 3 SE 0 3 0 0 0 0 3 SSE 2 1 1 3 1 0 8 S 0 2 8 5 5 0 20 SSW 0 1 7 4 2 0 14 SW 3 3 3 4 0 0 13 WSW 0 5 5 1 0 0 11 W 2 5 5 5 2 0 19 WNW 0 2 8 20 12 0 42 NW 1 2 10 6 3 0 22 NNW 0 0 4 0 0 0 4 Variable 0 0 0 0 0 0 0 Total 10 29 54 52 25 0 170 Hours of calm in this stability class: 0 Hours of missing wind measurements in this stability class: 0 Hours of missing stability measurements in all stability classes: 4

Intentionally left blank
APPENDIX G
ANNUAL RADIOLOGICAL GROUNDWATER PROTECTION PROGRAM REPORT (ARGPPR)

ZION NUCLEAR POWER STATIONUNITS 1 and 2
Annual RadiologicalGroundwater Protection Program Report
1 January Through 31 December 2010
Prepared By
May 2011
Zion Nuclear Power StationZion, IL 60099
Docket No:50-30450-295
Teledyne Brown EngineeringEnvironmental Services

i
Table Of Contents
I. Summary and Conclusions .............................................................................................. 1
II. Introduction ..................................................................................................................... 3 A. Objectives of the RGPP ...................................................................................... 3 B. Implementation of the Objectives ........................................................................ 3 C. Program Description ........................................................................................... 4 D. Characteristics of Tritium (H-3) ........................................................................... 4
III. Program Description ...................................................................................................... 5 A. Sample Analysis .................................................................................................. 5 B. Data Interpretation ............................................................................................... 6 C. Background Analysis ........................................................................................... 7
1. Background Concentrations of Tritium ..................................................... 8 A. Groundwater and Surface Water Results ......................................................... 10 B. Drinking Water Well Survey .............................................................................. 10 C. Summary of Results – Inter-laboratory Comparison Program.......................... 10 D. Leaks, Spills, and Releases .............................................................................. 10 E. Trends ............................................................................................................... 11 F. Investigations ..................................................................................................... 11 G. Actions Taken ................................................................................................... 11
ii
Appendices
Appendix A Location Designation
Table A-1 Radiological Groundwater Protection Program - Sampling Locations, Distance and Direction, Zion Nuclear Power Station, 2010
Tables
Figure A-1 Radiological Groundwater Protection Program Groundwater and Surface Water Locations of the Zion Nuclear Power Station, 2010
Figures
Appendix B Data Tables
Table B-I.1 Concentrations of Tritium in Groundwater Samples Collected in the Vicinity of Zion Nuclear Power Station, 2010.
Tables
Table B-I.2 Concentrations of Gamma Emitters in Groundwater Samples Collected in the Vicinity of Zion Nuclear Power Station, 2010.
Table B-II.1 Concentrations of Tritium in Surface Water Samples Collected in the Vicinity of Zion Nuclear Power Station, 2010.
Table B-II.2 Concentrations of Gamma Emitters in Surface Water Samples Collected in the Vicinity of Zion Nuclear Power Station, 2010.
- 1 -
I. Summary and Conclusions In 2006, Exelon instituted a comprehensive program to evaluate the impact of station operations on groundwater and surface water in the vicinity of Zion Nuclear Power Station. This is the fifth in a series of annual reports on the status of the Radiological Groundwater Protection Program (RGPP) conducted at Zion Nuclear Power Station. This report covers both groundwater and surface water samples, collected from the environment, on station property in 2010. During that time period, 24 analyses were performed on 16 samples from eight locations. Phase 1 of the monitoring was part of a comprehensive study initiated by Exelon to determine whether groundwater or surface water at and in the vicinity of Zion Nuclear Power Station had been adversely impacted by any releases of radionuclides. Phase 1 was conducted by Conestoga Rovers and Associates (CRA) and the conclusions were made available to state and federal regulators as well as the public in station specific reports. Phase 2 of the RGPP was conducted by ZionSolutions (Exelon was responsible for the program up to 8/31/2010; ZionSolutions became the licensee on 9/1/2010, thus assuming responsibility for the RGPP) personnel to initiate follow up of Phase 1 and begin long-term monitoring at groundwater and surface water locations selected during Phase 1. All analytical results from Phase 2 monitoring are reported herein. In assessing all the data gathered for this report, it was concluded that the operation of Zion Nuclear Power Station had no adverse radiological impact on the environment, and there are no known active releases into the groundwater at Zion Nuclear Power Station. Gamma-emitting radionuclides were not detected at concentrations greater than their respective Lower Limits of Detection (LLDs) as specified in the Offsite Dose Calculation Manual (ODCM) in any of the groundwater or surface water samples. Strontium-90 was not analyzed in 2010. Tritium was not detected in any of the groundwater or surface water samples analyzed in 2010. In the case of tritium, ZionSolutions specified that it’s laboratories achieve a lower limit of detection 10 times lower than that required by federal regulation.

- 2 -
Intentionally left blank
- 3 -
II. Introduction
The Zion Nuclear Power Station (ZNPS), consisting of two 1100 MWt pressurized water reactor was owned and operated by Exelon Corporation, is located in Zion, Illinois adjacent to Lake Michigan. Unit No. 1 went critical in December 1973. Unit No. 2 went critical in September 1974. The plant permanently ceased operation in January of 1998 and has been permanently defueled. The site is located in northeast Illinois on the western shore of Lake Michigan, approximately 50 miles north of Chicago, Illinois. This report covers those analyses performed by Teledyne Brown Engineering (TBE) and Environmental Inc. (Midwest Labs) on samples collected in 2010. A. Objective of the RGPP
The long-term objectives of the RGPP are as follows:
1. Identify suitable locations to monitor and evaluate potential impacts
from station operations before significant radiological impact to the environment and potential drinking water sources.
2. Understand the local hydrogeologic regime in the vicinity of the station
and maintain up-to-date knowledge of flow patterns on the surface and shallow subsurface.
3. Perform routine water sampling and radiological analysis of water from
selected locations.
4. Report new leaks, spills, or other detections with potential radiological significance to stakeholders in a timely manner.
5. Regularly assess analytical results to identify adverse trends.
6. Take necessary corrective actions to protect groundwater resources.
B. Implementation of the Objectives
The objectives identified have been implemented at Zion Nuclear Power Station as discussed below:
1. Exelon and its consultant identified locations as described in the
Phase 1 study. Phase 1 studies were conducted by Conestoga Rovers and Associates (CRA) and the results and conclusions were made available to state and federal regulators as well as the public in station specific reports.
- 4 -
2. The Zion Nuclear Power Station reports describe the local hydrogeologic regime. Periodically, the flow patterns on the surface and shallow subsurface are updated based on ongoing measurements.
3. Zion Nuclear Power Station will continue to perform routine
sampling and radiological analysis of water from selected locations.
4. Zion Nuclear Power Station has implemented new procedures to identify and report new leaks, spills, or other detections with potential radiological significance in a timely manner.
5. Zion Nuclear Power Station staff and consulting hydrogeologist
assess analytical results on an ongoing basis to identify adverse trends.
C. Program Description
1. Sample Collection
Sample locations can be found in Table A–-1 and Figures A–1 and A–2, Appendix A.
Groundwater and Surface Water
Samples of water are collected, managed, transported and analyzed in accordance with approved procedures following EPA methods. Groundwater samples were collected. Sample locations, sample collection frequencies and analytical frequencies are controlled in accordance with approved station procedures. Contractor and/or station personnel are trained in the collection, preservation management, and shipment of samples, as well as in documentation of sampling events. Analytical laboratories are subject to internal quality assurance programs, industry cross-check programs, as well as nuclear industry audits. Station personnel review and evaluate all analytical data deliverables as data are received. Analytical data results are reviewed by both station personnel and an independent hydrogeologist for adverse trends or changes to hydrogeologic conditions.
D. Characteristics of Tritium (H-3)
Tritium (chemical symbol H-3) is a radioactive isotope of hydrogen. The
- 5 -
most common form of tritium is tritium oxide, which is also called "tritiated water". The chemical properties of tritium are essentially those of ordinary hydrogen. Tritiated water behaves the same as ordinary water in both the environment and the body. Tritium can be taken into the body by drinking water, breathing air, eating food, or absorption through skin. Once tritium enters the body, it disperses quickly and is uniformly distributed throughout the body. Tritium is excreted primarily through urine with a clearance rate characterized by an effective biological half-life of about 14 days. Within one month or so after ingestion, essentially all tritium is cleared. Organically bound tritium (tritium that is incorporated in organic compounds) can remain in the body for a longer period. Tritium is produced naturally in the upper atmosphere when cosmic rays strike air molecules. Tritium is also produced during nuclear weapons explosions, as a by-product in reactors producing electricity, and in special production reactors, where the isotopes lithium-7 and/or boron-10 are activated to produce tritium. Like normal water, tritiated water is colorless and odorless. Tritiated water behaves chemically and physically like non-tritiated water in the subsurface, and therefore tritiated water will travel at the same velocity as the average groundwater velocity. Tritium has a half-life of approximately 12.3 years. It decays spontaneously to helium-3 (3He). This radioactive decay releases a beta particle (low-energy electron). The radioactive decay of tritium is the source of the health risk from exposure to tritium. Tritium is one of the least dangerous radionuclides because it emits very weak radiation and leaves the body relatively quickly. Since tritium is almost always found as water, it goes directly into soft tissues and organs. The associated dose to these tissues is generally uniform and is dependent on the water content of the specific tissue.
III. Program Description
A. Sample Analysis
This section describes the general analytical methodologies used by TBE to analyze the environmental samples for radioactivity for the Zion Nuclear Power Station RGPP in 2010. In order to achieve the stated objectives, the current program includes the following analyses:
- 6 -
1. Concentrations of gamma emitters in groundwater and surface water.
2. Concentrations of strontium in groundwater and surface water. 3. Concentrations of tritium in groundwater and surface water.
B. Data Interpretation
The radiological data collected prior to Zion Nuclear Power Station becoming operational were used as a baseline with which these operational data were compared. For the purpose of this report, Zion Nuclear Power Station was considered operational at initial criticality. Several factors were important in the interpretation of the data: 1.
Lower Limit of Detection and Minimum Detectable Concentration
The lower limit of detection (LLD) is specified by federal regulation as a minimum sensitivity value that must be achieved routinely by the analytical parameter.
2.
Laboratory Measurements Uncertainty
The estimated uncertainty in measurement of tritium in environmental samples is frequently on the order of 50% of the measurement value. Statistically, the exact value of a measurement is expressed as a range with a stated level of confidence. The convention is to report results with a 95% level of confidence. The uncertainty comes from calibration standards, sample volume or weight measurements, sampling uncertainty and other factors. ZionSolutions reports the uncertainty of a measurement created by statistical process (counting error) as well as all sources of error (Total Propagated Uncertainty or TPU). Each result has two values calculated. ZionSolutions reports the TPU by following the result with plus or minus ± the estimated sample standard deviation, as TPU, that is obtained by propagating all sources of analytical uncertainty in measurements. Analytical uncertainties are reported at the 95% confidence level in this report for reporting consistency with the AREOR.
- 7 -
C. Background Analysis A pre-operational radiological environmental monitoring program (pre-operational REMP) was conducted to establish background radioactivity levels prior to operation of the Station. The environmental media sampled and analyzed during the pre-operational REMP were atmospheric radiation, fall-out, domestic water, surface water, marine life, and foodstuffs. The results of the monitoring were detailed in the report entitled, Environmental Radiological Monitoring for Zion Nuclear Power Nuclear Power Station, Commonwealth Edison Company, Annual Report 1973, May 1974. The pre-operational REMP contained analytical results from samples collected from the surface water and groundwater. Tritium levels in Lake Michigan water were studied in the vicinity of Zion Station throughout 1970. The concentration of tritium in the surface water samples from the Lake at Zion ranged from approximately 311 ± 20 pCi/L to 374 ± 34 pCi/L and averaged 340 pCi/L. There was no statistical difference in average tritium concentrations among the stations (eight stations from Kenosha to Waukegan). Prior to 1998, surface water samples were collected at the following six locations along Lake Michigan:
• Kenosha, Wisconsin (intake located 10 miles north of the station) • Lake County Public Water District (intake located 1.1 miles north of
the Station) • Waukegan, Illinois (intake located 6 miles south of the Station) • North Chicago, Illinois (intake located 10 miles south of the Station) • Great Lakes NTS (intake located 13 miles south of the Station) • Lake Forest, Illinois (intake located 16.5 miles south of the Station)
After 1998, surface water samples were collected at the following four locations along Lake Michigan:
• Kenosha, Wisconsin (intake located 10 miles north of the station) • Lake County Public Water District (intake located 1.1 miles north of
the Station) • Waukegan, Illinois (intake located 6 miles south of the Station) • Lake Forest, Illinois (intake located 16.5 miles south of the Station)
Lake Michigan surface water data are collected as part of the REMP. Tritium concentrations in surface water samples from Lake Michigan ranged from non-detect to 660 pCi/L.
- 8 -
Groundwater was collected from one off-site well on a quarterly basis. Gamma isotopic, radiostrontium and tritium analyses were performed on all samples. Strontium-89, strontium-90, tritium and gamma emitters were below their respective LLDs. 1. Background Concentrations of Tritium
The purpose of the following discussion is to summarize background measurements of tritium in various media performed by others. Additional detail may be found by consulting references (CRA 2006). a. Tritium Production
Tritium is created in the environment from naturally occurring processes both cosmic and subterranean, as well as from anthropogenic (i.e., man-made) sources. In the upper atmosphere, “Cosmogenic” tritium is produced from the bombardment of stable nuclides and combines with oxygen to form tritiated water, which will then enter the hydrologic cycle. Below ground, “lithogenic” tritium is produced by the bombardment of natural lithium present in crystalline rocks by neutrons produced by the radioactive decay of naturally abundant uranium and thorium. Lithogenic production of tritium is usually negligible compared to other sources due to the limited abundance of lithium in rock. The lithogenic tritium is introduced directly to groundwater. A major anthropogenic source of tritium and strontium-90 comes from the former atmospheric testing of thermonuclear weapons. Levels of tritium in precipitation increased significantly during the 1950s and early 1960s, and later with additional testing, resulting in the release of significant amounts of tritium to the atmosphere. The Canadian heavy water nuclear power reactors, other commercial power reactors, nuclear research and weapons production continue to influence tritium concentrations in the environment.
b. Precipitation Data Precipitation samples are routinely collected at stations around the world for the analysis of tritium and other radionuclides. Two publicly available databases that provide tritium concentrations in precipitation are Global Network of Isotopes in Precipitation (GNIP) and USEPA’s RadNet
- 9 -
database. GNIP provides tritium precipitation concentration data for samples collected world wide from 1960 to 2006. RadNet provides tritium precipitation concentration data for samples collected at stations through out the U.S. from 1960 up to and including 2006. Based on GNIP data for sample stations located in the U.S. Midwest, tritium concentrations peaked around 1963. This peak, which approached 10,000 pCi/L for some stations, coincided with the atmospheric testing of thermonuclear weapons. Tritium concentrations in surface water showed a sharp decline up until 1975 followed by a gradual decline since that time. Tritium concentrations in Midwest precipitation have typically been below 100 pCi/L since around 1980. Tritium concentrations in wells may still be above the 200 pCi/L detection limit from the external causes described above. Water from previous years and decades is naturally captured in groundwater, so some well water sources today are affected by the surface water from the 1960s that were elevated in tritium.
c. Surface Water Data
Tritium concentrations are routinely measured in large surface water bodies, including Lake Michigan and the Mississippi River. Illinois surface water data were typically less than 100 pCi/L. The USEPA RadNet surface water data typically has a reported ‘Combined Standard Uncertainty’ of 35 to 50 pCi/L. According to USEPA, this corresponds to a ± 70 to 100 pCi/L 95% confidence bound on each given measurement. Therefore, the typical background data provided may be subject to measurement uncertainty of approximately ± 70 to 100 pCi/L.
The radio-analytical laboratory is counting tritium results to an Exelon specified LLD of 200 pCi/L. Typically, the lowest positive measurement will be reported within a range of 40 – 240 pCi/L or 140 ± 100 pCi/L. Clearly, these sample results cannot be distinguished as different from background at this concentration.

- 10 -
IV. Results and Discussion
A. Groundwater and Surface Water Results
Groundwater and Surface Water Samples were collected from on -site wells throughout the year in accordance with the station radiological groundwater protection program. Analytical results and anomalies are discussed below.
Tritium
Samples from all locations were analyzed for tritium activity (Table B–I.1, Appendix B) (Table B–II.1, Appendix B). Tritium was not detected in any of the groundwater or surface water samples analyzed. Zion Nuclear Power Station does not have any off-site wells and therefore there is no risk to off-site users.
Strontium
Strontium-90 was not analyzed in 2010.
Gamma Emitters
Naturally occurring Potassium-40 was detected in four of seven groundwater samples. The concentrations ranged from 53 to 207 pCi/l. Other gamma-emitting radionuclides were not detected in either groundwater or surface water samples analyzed (Table B–I.2, Appendix B) (Table B–II.1, Appendix B)
B. Drinking Water Well Survey A drinking water well survey was conducted during the summer 2006 by CRA (CRA 2006) around the Zion Nuclear Power Station.
C. Summary of Results – Inter-Laboratory Comparison Program Inter-Laboratory Comparison Program results for TBE and Environmental Inc. (Midwest Labs) are presented in the AREOR.
D. Leaks, Spills, and Releases There were no leaks, spills or releases.
- 11 -
E. Trends There are no previously identified plumes therefore there are no trends.
F. Investigations Conclusions from the Phase 1 report have been made available to state and federal regulators as well as the public in station specific reports.
G. Actions Taken
1. Compensatory Actions There have been no station events requiring compensatory actions at the Zion Nuclear Power Station.
2. Installation of Monitoring Wells
No new wells were required to be installed.
3. Actions to Recover/Reverse Plumes
There have been no station events requiring actions to recover/reverse any plumes.

Intentionally left blank
APPENDIX A
LOCATION & DIRECTION

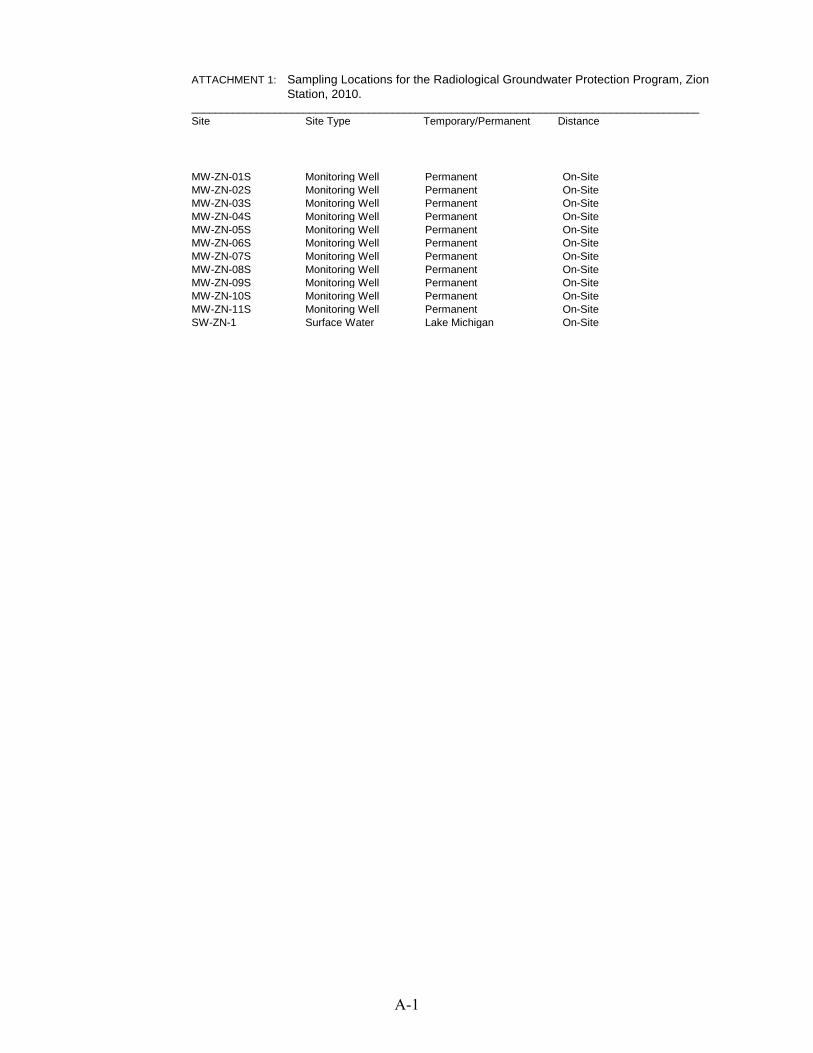
ATTACHMENT 1: Sampling Locations for the Radiological Groundwater Protection Program, Zion Station, 2010.
______________________________________________________________________________________ Site Site Type Temporary/Permanent Distance
MW-ZN-01S Monitoring Well Permanent On-Site MW-ZN-02S Monitoring Well Permanent On-Site MW-ZN-03S Monitoring Well Permanent On-Site MW-ZN-04S Monitoring Well Permanent On-Site MW-ZN-05S Monitoring Well Permanent On-Site MW-ZN-06S Monitoring Well Permanent On-Site MW-ZN-07S Monitoring Well Permanent On-Site MW-ZN-08S Monitoring Well Permanent On-Site MW-ZN-09S Monitoring Well Permanent On-Site MW-ZN-10S Monitoring Well Permanent On-Site MW-ZN-11S Monitoring Well Permanent On-Site SW-ZN-1 Surface Water Lake Michigan On-Site
A-1
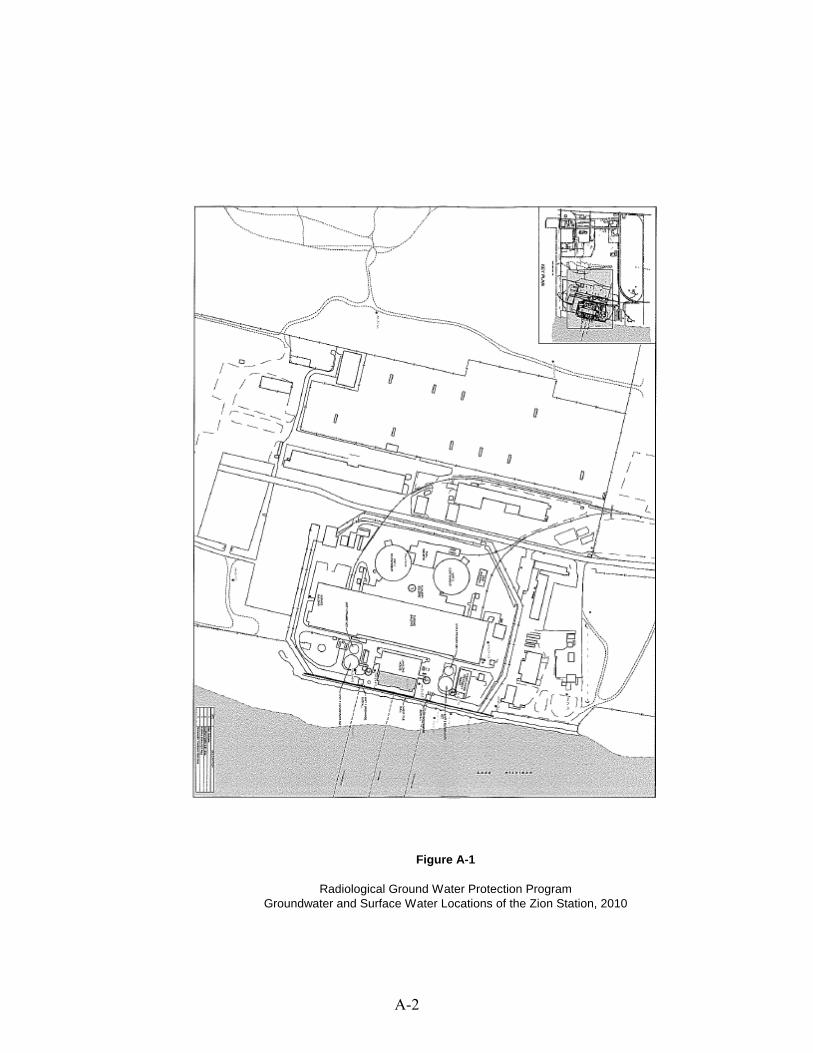
Figure A-1
Radiological Ground Water Protection Program Groundwater and Surface Water Locations of the Zion Station, 2010
A-2

APPENDIX B
DATA TABLES

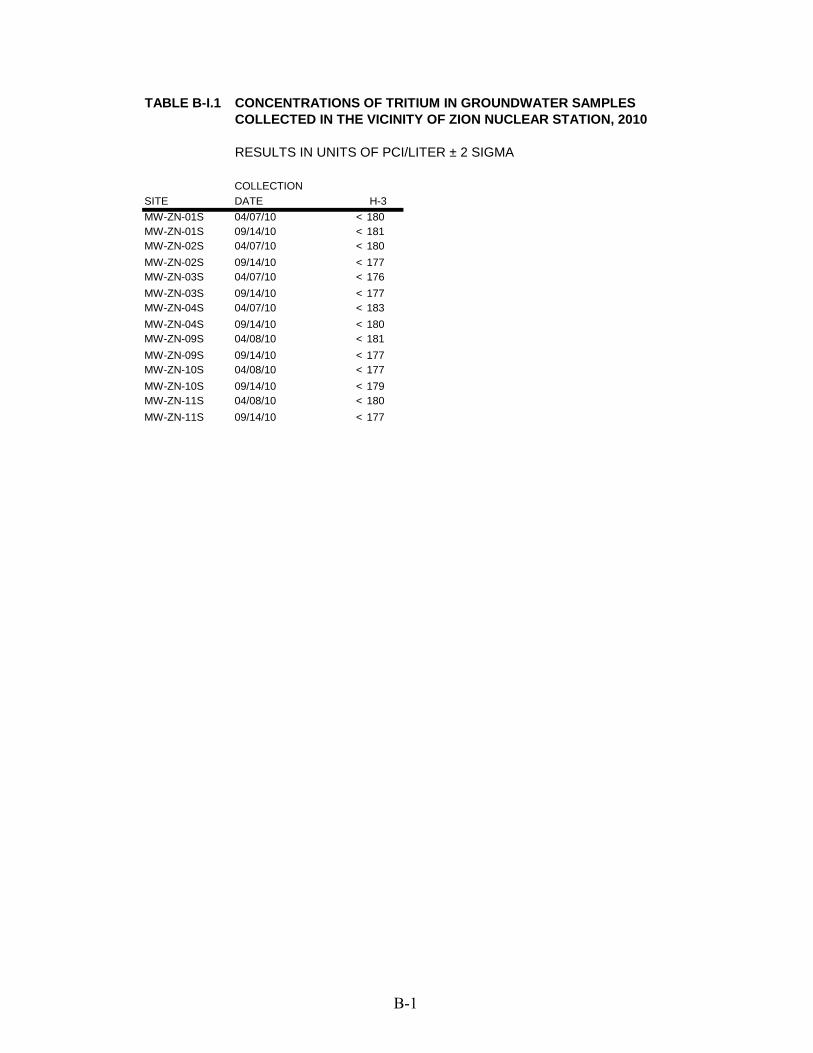
TABLE B-I.1 CONCENTRATIONS OF TRITIUM IN GROUNDWATER SAMPLESCOLLECTED IN THE VICINITY OF ZION NUCLEAR STATION, 2010
RESULTS IN UNITS OF PCI/LITER ± 2 SIGMA
COLLECTIONSITE DATE H-3MW-ZN-01S 04/07/10 < 180MW-ZN-01S 09/14/10 < 181MW-ZN-02S 04/07/10 < 180MW-ZN-02S 09/14/10 < 177MW-ZN-03S 04/07/10 < 176MW-ZN-03S 09/14/10 < 177MW-ZN-04S 04/07/10 < 183MW-ZN-04S 09/14/10 < 180MW-ZN-09S 04/08/10 < 181MW-ZN-09S 09/14/10 < 177MW-ZN-10S 04/08/10 < 177MW-ZN-10S 09/14/10 < 179MW-ZN-11S 04/08/10 < 180MW-ZN-11S 09/14/10 < 177
B-1
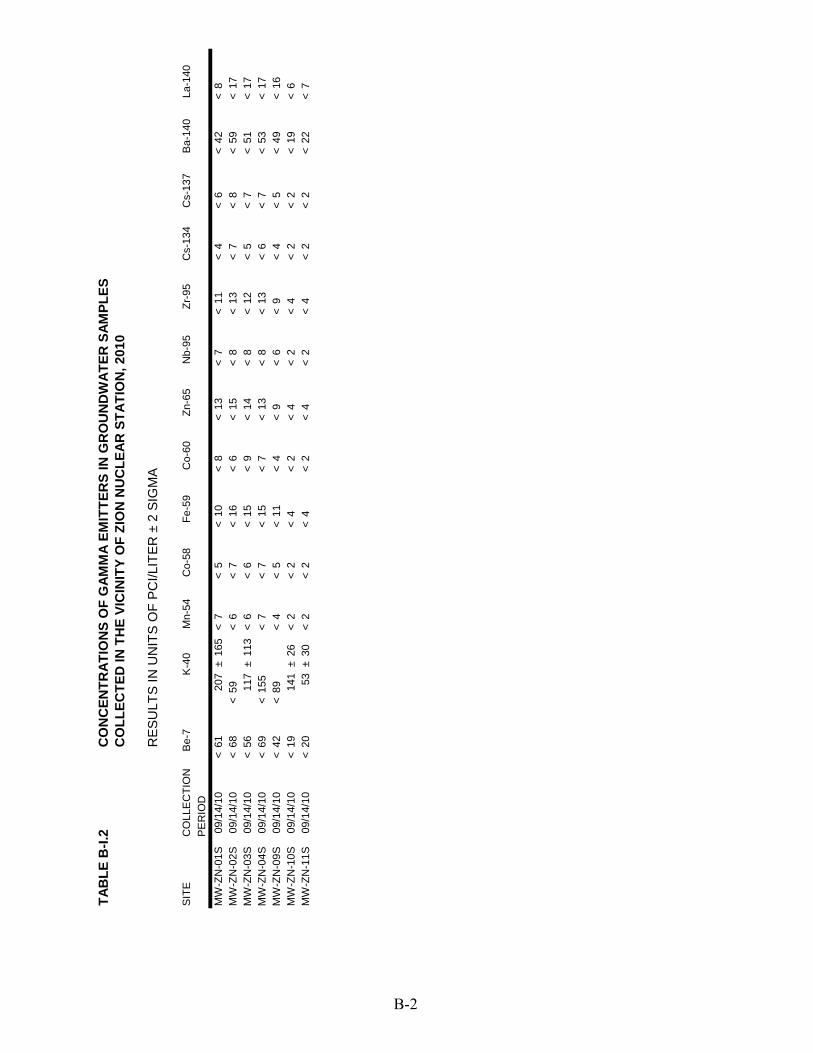
TAB
LE B
-I.2
CO
NC
ENTR
ATIO
NS
OF
GAM
MA
EMIT
TER
S IN
GR
OU
ND
WAT
ER S
AMPL
ESC
OLL
ECTE
D IN
TH
E VI
CIN
ITY
OF
ZIO
N N
UC
LEAR
STA
TIO
N, 2
010
RES
ULT
S IN
UN
ITS
OF
PCI/L
ITER
± 2
SIG
MA
SIT
EC
OLL
EC
TIO
NB
e-7
K-4
0M
n-54
Co-
58Fe
-59
Co-
60Zn
-65
Nb-
95Zr
-95
Cs-
134
Cs-
137
Ba-
140
La-1
40P
ER
IOD
MW
-ZN
-01S
09/1
4/10
<61
207
±16
5<
7<
5<
10<
8<
13<
7<
11<
4<
6<
42<
8M
W-Z
N-0
2S09
/14/
10<
68<
59<
6<
7<
16<
6<
15<
8<
13<
7<
8<
59<
17M
W-Z
N-0
3S09
/14/
10<
5611
7±
113
<6
<6
<15
<9
<14
<8
<12
<5
<7
<51
<17
MW
-ZN
-04S
09/1
4/10
<69
<15
5<
7<
7<
15<
7<
13<
8<
13<
6<
7<
53<
17M
W-Z
N-0
9S09
/14/
10<
42<
89<
4<
5<
11<
4<
9<
6<
9<
4<
5<
49<
16M
W-Z
N-1
0S09
/14/
10<
1914
1±
26<
2<
2<
4<
2<
4<
2<
4<
2<
2<
19<
6M
W-Z
N-1
1S09
/14/
10<
2053
±30
<2
<2
<4
<2
<4
<2
<4
<2
<2
<22
<7
B-2
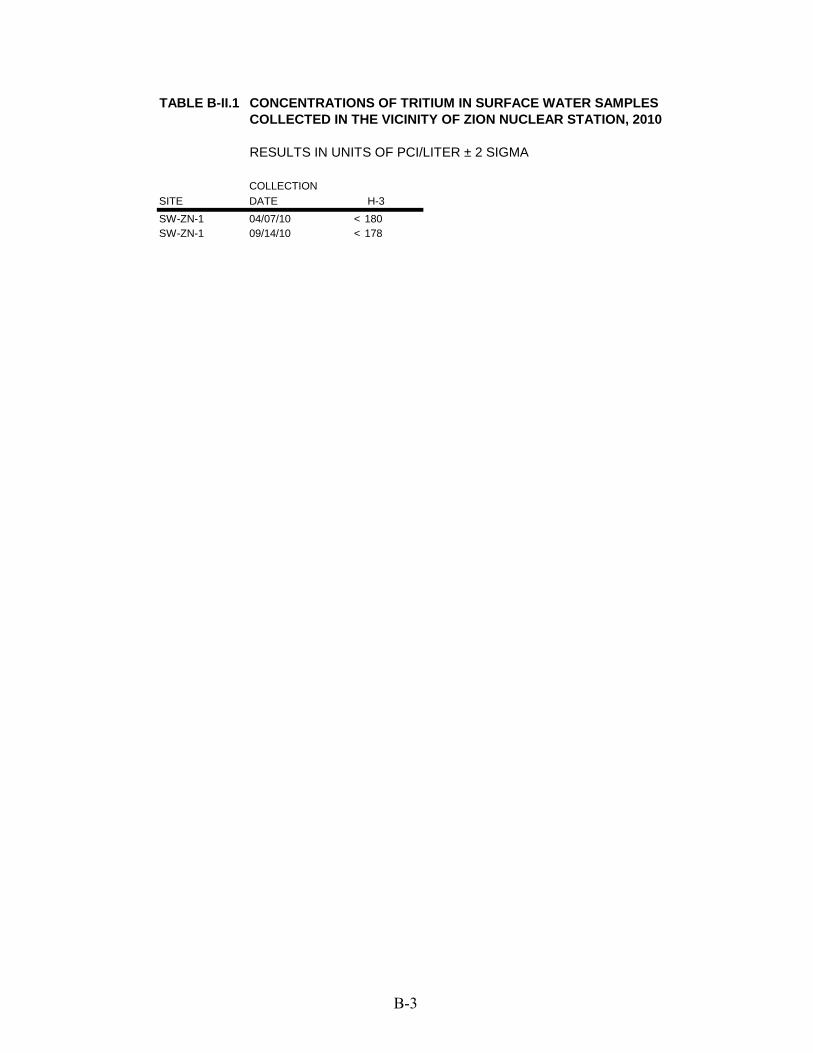
TABLE B-II.1 CONCENTRATIONS OF TRITIUM IN SURFACE WATER SAMPLESCOLLECTED IN THE VICINITY OF ZION NUCLEAR STATION, 2010
RESULTS IN UNITS OF PCI/LITER ± 2 SIGMA
COLLECTIONSITE DATE H-3SW-ZN-1 04/07/10 < 180SW-ZN-1 09/14/10 < 178
B-3
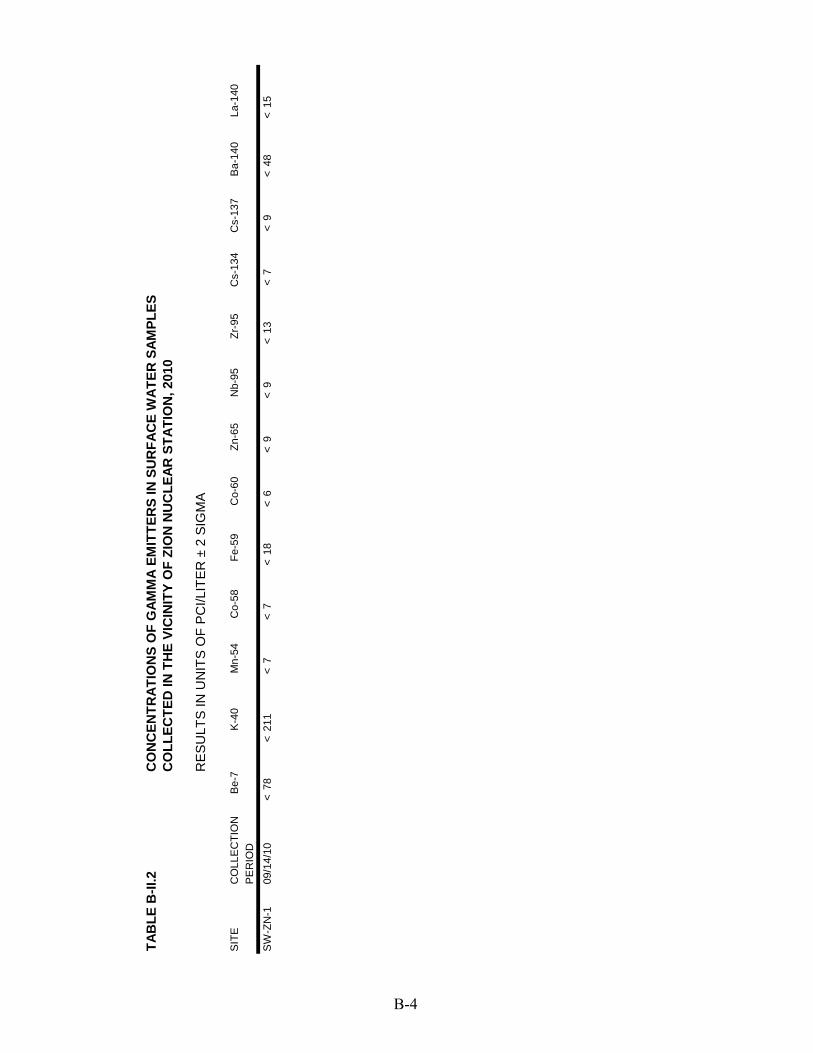
TAB
LE B
-II.2
CO
NC
ENTR
ATIO
NS
OF
GAM
MA
EMIT
TER
S IN
SU
RFA
CE
WAT
ER S
AMPL
ESC
OLL
ECTE
D IN
TH
E VI
CIN
ITY
OF
ZIO
N N
UC
LEAR
STA
TIO
N, 2
010
RES
ULT
S IN
UN
ITS
OF
PCI/L
ITER
± 2
SIG
MA
SIT
EC
OLL
EC
TIO
NB
e-7
K-4
0M
n-54
Co-
58Fe
-59
Co-
60Zn
-65
Nb-
95Zr
-95
Cs-
134
Cs-
137
Ba-
140
La-1
40P
ER
IOD
SW
-ZN
-109
/14/
10<
78<
211
<7
<7
<18
<6
<9
<9
<13
<7
<9
<48
<15
B-4