Review ArticlePhotoacoustic Spectroscopy in the Optical Characterization ofFoodstuff: A Review
Claudia Hernandez-Aguilar ,1 Arturo Domınguez-Pacheco,1 Alfredo Cruz-Orea ,2
and Rumen Ivanov3
1Programa en Ingenierıa de Sistemas-SBAAM, SEPI-ESIME, Instituto Politecnico Nacional-ESIME Zacatenco,Col. Lindavista. 07738, Ciudad de Mexico, Mexico2Departamento de Fısica, CINVESTAV–IPN, A. P. 14-740. 07360, Ciudad de Mexico, Mexico3Unidad Academica de Fısica, Universidad Autonoma de Zacatecas, A.P. 580, Zacatecas, Mexico
Correspondence should be addressed to Claudia Hernandez-Aguilar; [email protected]
Received 24 June 2018; Revised 25 October 2018; Accepted 18 November 2018; Published 13 January 2019
Academic Editor: Johannes Kiefer
Copyright © 2019 Claudia Hernandez-Aguilar et al. .is is an open access article distributed under the Creative CommonsAttribution License, which permits unrestricted use, distribution, and reproduction in anymedium, provided the original work isproperly cited.
In this review, the application of the photoacustic spectroscopy (PAS) is presented as an option to evaluate the quality offood. .is technique is a type of spectroscopy based on photothermal phenomena, which allow spectroscopic studies.According to the literature review, it was found that its application is increasing in several countries. Spectroscopic studiescarried out by employing PAS in the food industry include, among others, fruit, vegetables, condiments, grains, legumes,flours, “tortillas,” milk, water, eggs, etc. Additionally, this technique has been used to evaluate adulterated, irradiated, andcontaminated food and so on. .e literature review has shown the applicability of PAS to one of the problems of the realworld, i.e., food quality assessment. .erefore, PAS can contribute in the future with a wide potential for new applications inthe food agroindustry.
1. Introduction
One of the problems worldwide is the quality and quantity offood. In developing countries, this is even more evident,causing several chronic diseases such as cancer and mal-nutrition, according to Hernandez et al. [1]. .erefore, thedevelopment of technologies to improve global food pro-duction is necessary since one of the main challenges of ourtime is to feed a growing worldwide population [2–6]. In thisorder of ideas, it is also mandatory to develop technologiesthat evaluate food quality, before the direct impact that theyhave on population’s health and consequently on theirquality of life. Several authors and public health pro-fessionals indicate a relationship between dietary behaviourand the food quality associated with the risk of some cancersand other existing chronic diseases [7, 8]. In this sense, thequality of the food is very important; in the case of cancerdiseases, a close relationship between the diet and the
different types of cancers has been reported [9–11]. Cancer,among other factors, could be due to the intake of com-pounds in food that initiate or promote it. .e food and itssubstances which are consumed provide the nutritionalsupport for an organism and help for the disease prevention.However, sometimes they increase chemical substances, andinstead of helping, they damage the organism [8]. .ishighlights the need for a greater level of food control: equalin quantity and quality (i.e., sometimes foodstuff containsboth substances that harm and benefit human health. .at isto say, to evaluate food in order to avoid consuming con-taminated or degraded food (chemically or biologically) andto promote the consumption of food rich in phytonutrients(increasing the proposals for food integrated with superfoodand/or fibre), etc. .is, among other aspects, is relevant tothe prevention of diseases [12]. In food production chain, itis known that contamination and/or degradation can occurat any stage due to contaminants: environmental,
HindawiJournal of SpectroscopyVolume 2019, Article ID 5920948, 34 pageshttps://doi.org/10.1155/2019/5920948
agricultural, or incorporated during some agroindustrialprocess or storage [13]. On the one hand, it is essential to beaware of not consuming food that exceeds allowed limits ofmycotoxins, nitrates, and nitrites, harmful fats, addition ofpreservatives, dyes, or sugar solutions. On the other hand, itis essential to consume food that provides health benefits,such as super-food, cholesterol free, rich source of proteins,minerals, iron, etc. Food rich in phytochemical may play animportant role in the reduction of mortality. For theaforementioned facts, the need of a rapid and reliablequantification of compounds in food that contains disease-preventing constituents or food constituents that cause themis urgent, as it is recognized by the food processing industry[14].
.en, the development of technologies that support theevaluation of food quality every day becomes more relevant,due to the increase of diseases. Among the technologies forfood analysis and determination of compounds, the pho-tothermal techniques stand out. In particular, photoacousticspectroscopy (PAS) is considered by some authors as a“green” technology for the food analysis [15], i.e., a methodwith less chemical waste and a minimal sample amount anda nondestructive technique [16]. PAS has some additionalcharacteristics such as the fact that it does not require ex-traction or sample preparation and it does not use solvents,among others [17]..e reduction or elimination of the use ofsolvents is very important. For example, in the process ofmanufacturing, the use and disposal of chemical productsand many toxic materials that are dangerous to humans andto the environment are frequent. In fact, these techniques arepromising because they can be carried out by nondestructiveanalysis and without the use of solvents [15].
Currently, PAS technique, thanks to the technologicaladvances, could be a convenient option to be incorporatedin the agrofood industry, for example, in food qualityassessment systems, with diverse specific applications(according to production systems and specific food ofeach case). PAS technique allows to obtain optical qual-ities of food, depending on its colour, which is the mostuseful parameter in the agrofood industry since qualityand food flavours are closely associated with its colour[18]. .erefore, our objective is to perform a literaturereview of PAS applications in the food characterizationfrom its origin to recent advances. In this way, it will bepossible to know the current state, what has been done andwhat still needs to be done to reach the application of it inthe real world. .e PAS experimental setup continues tobe optimized and focused on the specific problems of thereal world where it could serve as a supportive technique,in order to improve and have attainable techniques for theevaluation of food quality and their respective control inthe production process. It is one of the great worries ofhumanity, both to increase the food production and totake care of its quality, being this a key element in thedevelopment and life quality of societies.
1.1. Era before Photoacoustic Spectroscopy in Agriculture andFood. Isaac Newton in 1666, using a prism, observed and
recorded the dispersion of white (visible) light into itsconstituent colours [19] to describe the colours of therainbow. He used the word “spectrum” for the first time inhistory. More than 100 years later, in 1802, Hyde Wollastonexpanded Newton’s earlier observation by showing thatsunlight possesses discrete bands of light, rather than acontinuous spectrum. Wollaston became one of the mostfamous scientists for his observations of dark lines in thesolar spectrum, which eventually led to the discovery of theSun elements. In 1814, Fraunhofer discovered over 500bands of sunlight, afterward called “Fraunhofer lines.” In1859, Kirchoff and Bunsen invented the spectroscope [20],and they were the ones who developed the chemical analysisby using spectral lines [21, 22].
1.2. Photoacoustic Spectroscopy History. .e photoacoustic(PA) effect was discovered, according to Rosencwaig [23,24], by Tyndall, Rontgen, and Alexander Graham Bell, in1881. Bell was working together with Charles SummerTainter in the photophone. Bell discovered that selenium(and other solid materials) emits a sound when illuminatedby a modulated light, which was achieved by passing itthrough a rotating disk with holes. Bell, using the spec-trophotometer, discovered that the emitted sound intensitydepends on the wavelength or colour of the incident lightand that therefore the effect should be attributed to anoptical absorption process [25].
Fifty years after its discovery, the PA effect was used ingas studies. It has ever since become a well-establishedtechnique for gas analysis and was well understood [26]with some applications also in environmental and foodareas. However, the PA’s effect in solids was apparentlyignored for 90 years until 1973, when Rosencwaig began hisstudy of the PA effect in solids. Probably, this delay was dueto the lack of sensitive sound detectors and high-power lightsources [27].
.e first photoacoustic spectra obtained by Rosencwaigwere specifically of carbon-black, powder of Cr2O3 (nor-malized), a Cr2O3 crystal, rhodamine-B in a glycerol solu-tion, and rhodamine-B powder [24]. Photoacousticspectroscopy as a new tool for solid research was presentedby Rosencwaig [27]. Since that time, he pointed out the mainadvantages of photoacoustic spectroscopy, paraphrasinghim: “.e principal advantage of photoacoustic spectros-copy is that it enables to obtain similar spectra on any type ofsolid or semisolid material, whether it be crystalline, powder,amorphous, smear, gel, etc. Furthermore, since only theabsorbed light is converted to sound, light scattering (a veryserious problem when dealing with many solid materials byconventional spectroscopic techniques) presents no diffi-culties in PAS.” In this sense, the PAS applications weredivided under three main headings: bulk, surface, and de-excitation studies.
Also, pioneer applications of PAS in biology were madeby Rosencwaig [27]. He obtained the photoacoustic spectraof smears of whole blood, of red blood cells freed fromplasma, and of haemoglobin extracted from red blood cells,using the spectral region from 200 to 800 nm. Also, PAS
2 Journal of Spectroscopy
spectra of guinea pig epidermis (250–650 nm) in differentconditions were obtained. He also reported a block diagramof single-beam photoacoustic spectrometer with digitaldata acquisition, integrated by: Xe Lamp, monochromator,chopper, photoacoustic cell, lock-in amplifier, voltagefrequency converter, and multichannel analyzer. .e firstcommercial spectrometer (Model 6001) was manufacturedin 1980 by Princeton Applied Research Corporation[26, 28].
Other results were obtained with dried solids containingseveral other hemoproteins, including both soluble ones,such as cytochrome c and insoluble or membrane-boundones such as cytochrome P-450. Further experimentsshowed that it is possible to identify absorbing substances(including some drugs) in dried urine samples (e.g., drops ofurine over the filter paper)[28].
Regarding the area of the agrofood industry, the firstphotoacoustic spectra in plants were obtained in flowers byHarshbarger and Robin [29] among others.
1.3. Applications of PAS. Spectroscopy is the study of theinteraction of electromagnetic radiation with atoms andmolecules to provide qualitative and quantitative chemicaland physical (structural) information, that is containedwithin the wavelength or frequency spectrum of energy thatis either absorbed or emitted [30]. According to Sunandana[31]; Photoacoustic spectroscopy (PAS), the oldest form ofphotothermal techniques, is a type of spectroscopy and itsname “photoacoustic” (PA) generally implies a particulartechnique or mechanism of detecting and measuring theoptical absorption of opaque and diffuse materials, amongothers. .e basic principle of photothermal spectroscopy isthe detection of heat produced in a sample due to non-radiative de-excitation processes resulting from the ab-sorption of intensity-modulated light (wave of pulsed light)by the sample..us, according to its basic principle, the PAShas been applied in Biology, Biophysics, Physics, Medicine,and in the Agrofood areas [32], rescuing an old technologyfor today’s needs.
Bicanic [14] mentioned that PAS is a sort of spectroscopy,nondestructive based on photothermal phenomena, whichallows spectroscopic studies. .e basic configuration uses Xelamps, mainly in the UV-VIS range. .is conventional con-figuration has been applied to the foodstuff analysis (obtainingPA spectra, as a function of wavelength) including plants,seeds, etc. Among the foodstuff that have been investigated byusing PAS are grains and legumes (Zea mays L., Triticum,Hordeum vulgare, Phaseolus vulgaris L., and coffee), vegetables(spinach, lettuce, Raphanus sativus L., Solanum lycopersicumL., and Capsicum annuum), marine vegetables (algae andphytoplankton), fruit (açai, cupuaçu, Brazil nut, persimmon,mango, and strawberries), other liquids or semiliquid food(e.g., milk, water, juice, mustard, and ketchup), flours (maize,wheat, soybeans, peas, white bread flour, and rye), “tortillas”(maize (white and blue), wheat flour (integral or not integral),maize and “nopal,” linseed and “nopal,” etc.), condiments(turmeric and “chile pasilla”), powder (gelatins, curry, andcacao), food with coloring additives, etc. Furthermore,
adulterated food and fortified food, among others, have beenanalysed by using PAS technique.
.e first PA spectra (in plants or food) were obtained inblack-eyed susan petals, red rose petals, green leaf, andchloroplast of lettuce, marine algae, and spinach[27, 28, 29, 33, 34], among others. Harshbarger and Robin[30] reported photoacoustic spectra (PA or optoacoustic) offlower petals. With regard to susan blackeyed petals, theauthors obtained an optical absorbance spectral band cor-responding to carotenoids and another band in the ultra-violet region, related to the content of flavonol glucosides..e photoacoustic spectrum of a rose petal had two max-imums, at 530 and 340 nm; the first maxima is due to cyanineabsorbance in the flower, and the second one must be due tosome other ultraviolet-absorbing compound in the petal.
Meanwhile, Rosencwaig showed photoacoustic spec-trum of an intact green leaf with all the optical charac-teristics of leaf chloroplasts, including Soret’s peak(420 nm), carotenoids (450–550 nm), and chlorophylls(600–700 nm) bands. He points out that PAS can be usedto observe secondary metabolites. Species of air-driedmarine algae were also evaluated by Rosencwaig andHall [32]. .e authors showed that PAS can be used toestimate the amount of certain metabolites, and they alsosuggested that PAS could reduce the amount of materialrequired for the screening of such substances (since ex-traction procedures generally require more material) andthat it can greatly reduce the time required for theidentification of plant components. Adams et al. [34]studied spinach leaf, where he demonstrated that themajor absorbing components in the spinach were thechlorophylls. .e chlorophylls are similar to the hemo-proteins; they contain a porphyrin ring, this being che-lated to magnesium at the ring centre. .en, the techniqueallowed it to be useful to determine quickly and easily thespinach components, directly and only using a small pieceof spinach (10mm), in the spectral region from 250 to700 nm, finding spectral peaks at 450 and 650 nm. Otherphotoacoustic spectra were also obtained, in the initial eraof photoacoustic applications for this purpose, in coty-ledons, Raphanus pigments, Tradescantia leaves, etc.[35–37].
Since the initial PAS applications in agriculture andfood until now, different spectral regions have been used,from ultraviolet to far infrared, including UV (200–400 nm), visible light (400–700 nm), and near infraredradiation (750–1100 nm). Also, it is important to take intoaccount the lamp power, and there are several studies thatindicate that the optimal Xe lamp power ranges from 300to 1600W.
According to the present review on PAS applications infood and plants, from the PA spectrum obtained by PAS, it ispossible to determine concentrations or presence of com-pounds: rutin, red beet (in case of adulterated food), fla-vonoids and flavonols, carotenoids (lycopene, capsanthin,capsorubin, carotene, zeaxanthin, cryptoxanthin, lutein,etc.), basic amino acids (tryptophan, lysine, leucine, phe-nylalanine, etc.), anthocyanins, peroxide, and lead tetra-oxide, among others. Also, by using PAS, it is possible to
Journal of Spectroscopy 3
detect changes in seeds due to induced radiation effects, useof dyes, differences in sanitary qualities, adulterated food,etc. In this sense, for some researchers, PAS is considered asan analytical method.
1.4. PAS Applications in Food and Agrofood Industry.One of the industries which could be benefited by the use ofPAS technology would be the milk industry. Martel et al.[30] carried out measurements by PAS of milk products..ey analysed whole milk, 3.25% fat, skim milk, part skim,milk 2% fat, mild cheddar cheese, aged cheddar cheese, plainyogurt, and strawberry-flavoured yogurt drink. .eir ob-tained spectra were in the ultraviolet region. .ey found astrong absorption peak at 280 nm for all products. For cheesesamples, they observed in the spectra a tail, corresponding tofat presence, from 250 to 260 nm. Photoacoustic signal in-creases when protein concentration increases; the authorsrelate the UV absorbance band with aromatic amino acids(tryptophan, tyrosine, and phenylalanine), as a measure ofprotein content. .ey demonstrated the applicability of PASto study different milk products, highlighting their utility forthe milk industry.
PA spectra of tablets, made out of lyophilized raw milk,showed an absorption peak at 280 nm, corresponding to theabsorption of proteins and a smaller absorbance band in thevisible (400–500 nm) that might be assigned to milk ca-rotenoids. When the tablets were heated, they gradually turnbrown, which contributed to the changes in the PA spectra,appearing to a new band around 335 nm as a consequence ofthe Maillard reactions. .e spectra became broader, to thered side of the spectrum. .is could be the sign of manyother reactions occurring in the sample according toNsoukpog-Kossi et al. [38], demonstrating another possibleutility of the photoacoustic technique.
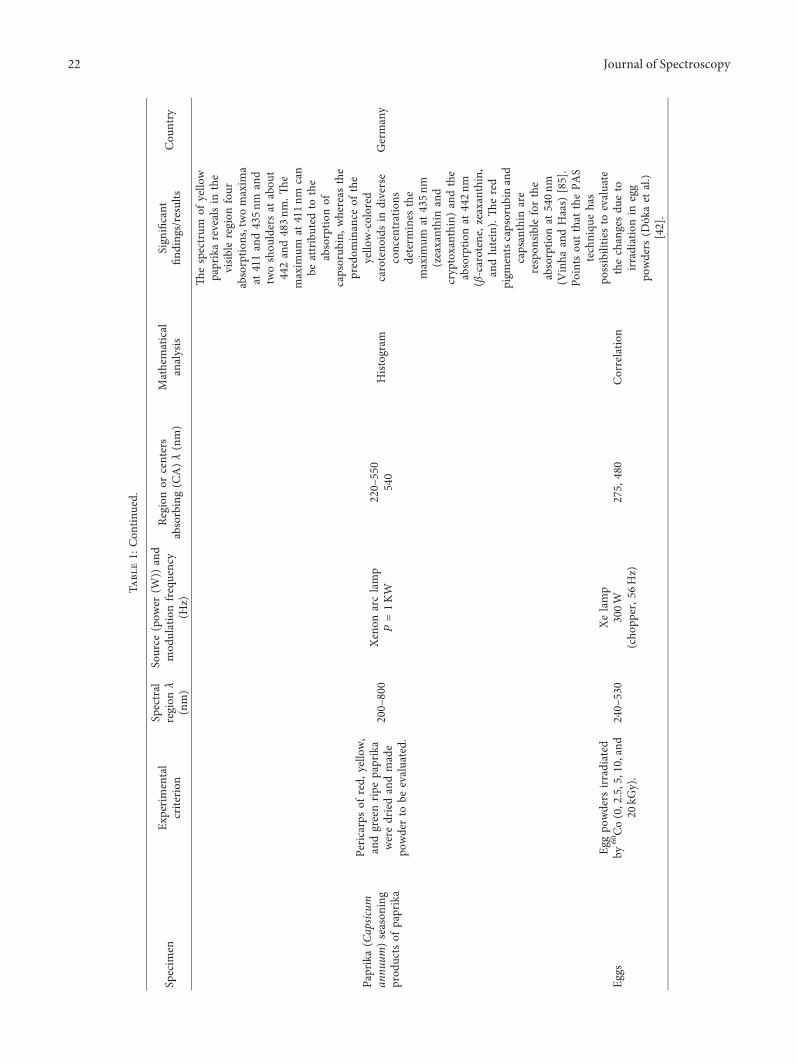
Another use of PAS in the milk industry has been thepossibility to measure different powdered milk proteinconcentrates, enriched with Fe in the form of ferrogluconateat different concentrations. Doka et al. [39] obtained PAspectra, in these powdered samples, as a function of fer-rogluconate concentration, obtaining an increase in thephotoacoustic signal in the UV spectral region. .e peaks, at348, 380, and 552 nm, varied depending on the Fe con-centration, resulting in a nonlinear relationship between theferrogluconate content and the PA signal. In this way, theauthors demonstrated that PAS measurements (in the UV-visible range) on milk protein concentrates are capable ofdetermining the Fe content in ferrogluconate form. .isdemonstrates another possible application of PAS. As withthe other applications to detect adulterated milk, it has beenproven useful, for example, to detect skimmed milk adul-terated with whey powder, when analyzing PA spectra at370 nm wavelength [40].
PAS application in milk analysis was also reported inother studies, for example, milk (fresh and oxidized) wasevaluated by using PAS. In these investigations, Doka et al.[41] used fresh whole milk exposed to UV-C radiation andheat. .e PA spectra, obtained by PAS, encompassed thespectral region from 200 to 500 nm. It was reported,
absorption peaks at 290 nm (for all evaluated cases), which isassociated with the presence of aromatic amino acids in themilk powders. Spectral changes, induced by the acceleratedoxidative treatment, were detectable in the 320–360 nmabsorbance band (absorbance changes in this range are dueto the reaction of aldehydes with a variety of amino com-pounds). .e oxidation of whole milk powder and browningprocesses were mutually interrelated (i.e., if the oxidationtook place, then the color of the powder would turn brown)..e authors recommended PAS as a method for routine andrapid assessment of peroxide values in oxidized whole milkpowder.
Another PAS application, useful in foodstuff area, is inthe assessing of induced radiation effects. For example, ir-radiated egg powders were evaluated by PAS, finding twopeaks, corresponding to the absorbance maxima, in theoptical spectrum. One centered at 275 nm, which is relatedwith the aromatic amino acids content in the sample. Whilethe other peak, centered at 480 nm, is related to the presenceof carotenoids. It is interesting that PA signal at 480 nmsuggests a carotenoid decomposition due to the irradiation[42]. In summary, the foodstuff irradiation processes isanother potential area for PAS applications.
On the other hand, the usefulness of PAS has beendemonstrated to identify adulterated samples with leadtetraoxide (also called minium or red lead). Doka et al. [43]obtained the PA spectra of pure paprika, red lead, and alladulterated samples, in the wavelength range from 320 to700 nm. .e normalised PA signal in a wavelength rangefrom 600 to 700 nm was generally lower; a weak signal wasobserved at 670 nm. .e PA signal from pure red lead wassubstantially larger than those obtained from adulteratedsamples. .e PA spectra of the four adulterated samplesshow a peak at 545 nm. In this case, the potential of PAS, as acandidate method for rapid detection of gross amounts ofred lead (Pb304) adulterant, in a ground sweet red paprika,was demonstrated. Although the authors recognize that theperformance of this method was undoubtedly inferior to thatof advanced methods, the PAS method is very practical andrapid in routine situations.
Other food sample types studied by PAS have beenreported by Bicanic et al. [44], who mentioned that PAStechnique could be used to detect red beet, added as acolorant to tomato ketchup. .e associated changes ofcolour, resulting in changes of optical absorbance, weremonitored in the 500 nm region, corresponding to the ab-sorbance maxima of lycopene. Also, Bicanic [14] indicatesthat the argon laser line at 514 nm has been used for lycopenemeasurements because there is a high absorbance of lyco-pene and low interference of betacarotene. It is noteworthythat Bicanic (1943–2018) made a notable contribution tophotoacoustic and photothermal science with numerousapplications in agriculture, environmental science, and foodquality, among other issues [45].
1.5. Grains and Legumes. PA spectra, as a function ofwavelength, allow to obtain information about the sample.Also, it is possible to characterize samples regarding its
4 Journal of Spectroscopy
atomic or molecular composition according to De Oliveiraet al. [17]. In the case of corn grains, Dominguez et al. [46]obtained the PA spectrum of maize, in the 300–800 nmwavelength range. .ey found absorbance bands associatedwith different natural pigments. .is group used white,yellow, and blue maize; in the case of white maize seed, abroad absorbance band was observed in the UV region, from300 to 400 nm, with a signal peak around 360 nm. While forthe yellow and blue maize seeds, the band of PA signaldecays around 435 nm. .is band could be due to thepresence of flavonoids and flavonols. In the case of yellowand blue maize seeds, they have an absorbance band rangingfrom 470 to 540 nm, being this band associated with thepresence of carotenoids. Specifically, for blue maize seed, anabsorbance spectrum ranging from 500–690 nm was ob-served, which is due to the presence of anthocyanins.
Another characteristic of corn seed is its structure type,crystalline or floury. From the photoacoustic signal,Hernandez-Aguilar et al. [47] found the optical absorptioncoefficient (β) and optical penetration length (lβ), as afunction of wavelength. .e floury seed variety had a higherβ value at 650 nm. In this sense, the authors showed that bymeans of the optical absorption coefficient, differences be-tween maize varieties of different structures are observed..e PA signal amplitude is higher for floury seeds. Similarly,significant statistical differences were found in the opticalabsorption coefficient spectra of white maize seeds (of dif-ferent white), with an absorbance band ranging from 325 to425 nm wavelength. Also, other authors found differencesbetween the spectra of the first derivative obtained from theβ values [48]. Other researches, such as De Oliveira et al.[17], have indicated that the PA signal amplitude is directlyproportional to the concentration of absorbing analytes,where analyte is a component (element, compound, or ion)of analytical interest on a sample. According to Doka et al.[49], PAS could be an analytic technique and also a fast andrelatively cheap technique.
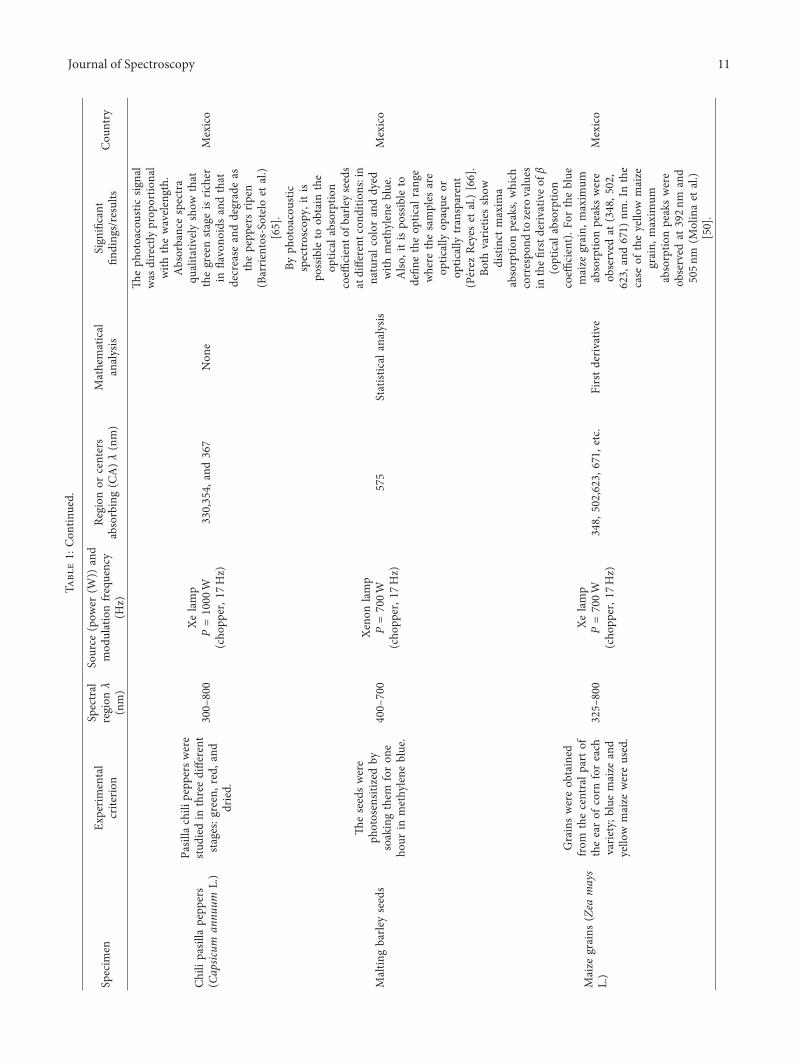
Other authors have used mathematical analysis on thePA signals, such as the first and second derivatives or mobilestandard deviation..is has allowed to distinguish better themaximum peaks of maize grains with different pigmenta-tions, identifying differences of the corn seeds [50]. .e useof derivatives in spectra enhances the identification of dif-ferences among spectra, resolves overlapping bands, andespecially improves the detectability of weaker spectralshoulders. In this sense, PAS could be used in quantitativeanalyses of compounds [16]. Also, photoacoustic spectros-copy is useful to study dyed samples, not only with naturalpigments.
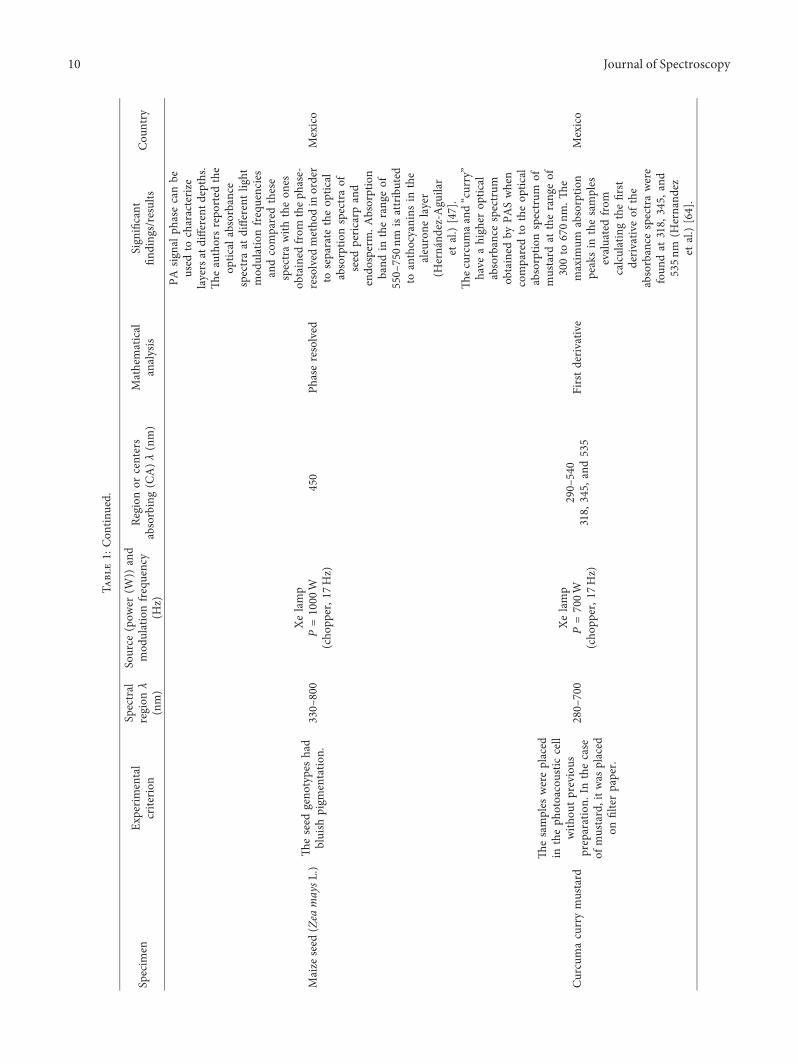
Other studies have pointed out the role of PAS: by usingdifferent light modulation frequencies, it is possible to ex-plore different seed depths, e.g., Hernandez-Aguilar et al.[47] obtained the PA spectra of maize seeds (Zea mays L.) atdifferent frequencies (17, 30, and 50Hz). .ey comparedthese spectra with the ones obtained from the phase-resolvedmethod, used to separate the spectra of the seed pericarp andendosperm. Also, photoacoustic spectra, of separate struc-tural components of the seed, were obtained (pericarp,aleuronal layer, and endosperm) and compared with those
obtained by the phase-resolved method. .e authors in-dicated that the absorbance band from 550 to 750 nm is dueto the anthocyanins in the aleurone layer. So, the PAStechnique has a potential for depth profile analysis oncomplex specimens with different structural componentsand also, through the absorbance bands, to determine theassociated components.
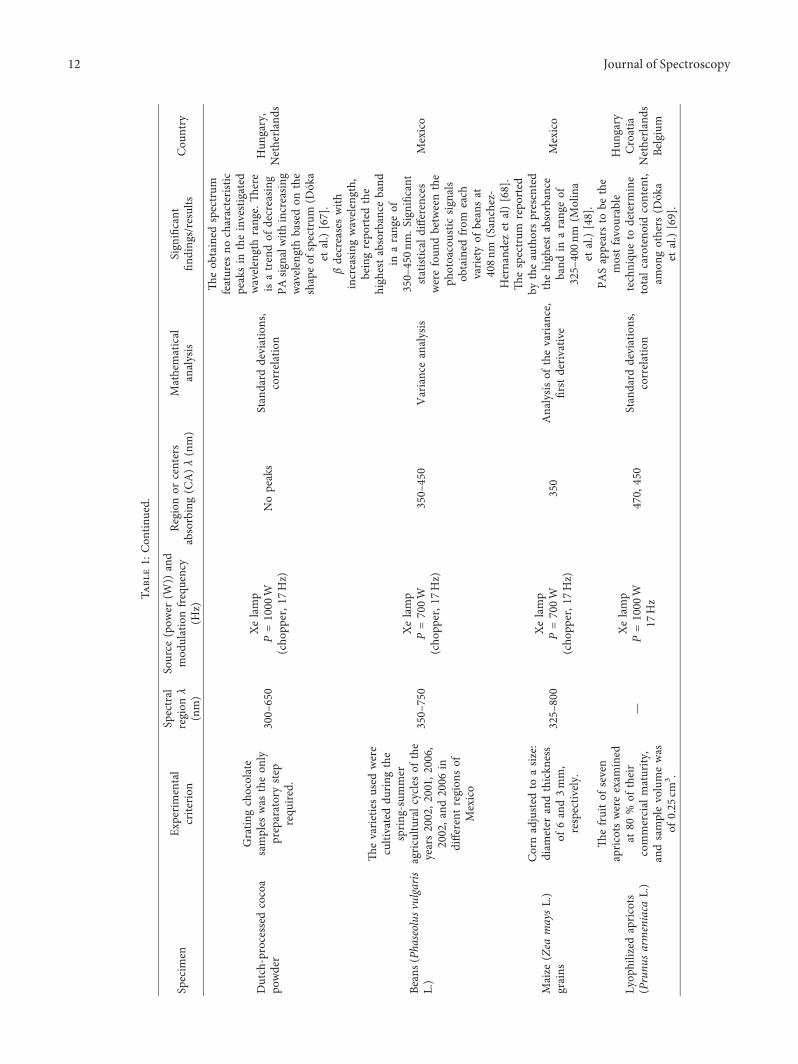
Moreover, PAS has been applied to study wheat, barley,and beans among other grains and legumes, where from PAspectra, it is possible to analyse the differences of thecharacteristic spectra obtained among the evaluated mate-rials. For example, Doka et al. [49] by using PAS in buck-wheat found PA spectra, as a function of wavelength andobserved two absorbance peaks, at 275 and 378 nm, relatedto the protein content and rutin, respectively. PA signalappears to be proportional to the rutin content of thesamples across the entire wavelength range. .us, the au-thors reported that UV-PAS could be an analytical tool forrapid and simple quantification of rutin in buckwheat, andthey found a decrease of the time required for the analysis ofbuckwheat samples when a calibrated curve, of known rutincontent, is used.
Photoacoustic spectrum decreases as a function of thefrequency, and differences are obtained in the spectra of thedeteriorated and nondeteriorated grains. .e authors re-ported lower PA signal in the young seeds when comparedwith the older ones, due to deterioration in the older seedsbecause of the presence of fungi or bacteria during storage..is fact produces dark regions and, as a consequence, ahigher signal, pointing out another possibility of PAS use, toevaluate sanitary quality of grains [51].
1.6. Flours and “Tortilla”. Other potential applications thatsome authors have proposed for PAS are for quality controlin the food processing industry. For example, Favier et al.[52] determined the PA spectra (350–700 nm) of white breadflours, dried pea flour, rye flour, and bread flour. PAStechnique appears to be capable of producing reproduciblespectra of powdered food samples. .e PA spectra of whitebread flours have absorbance bands around 370, 385, and410 nm. For wavelengths above 410 nm, the PA signal de-creases rapidly and drops to a nearly zero amplitude at700 nm. Unlike this, the dried pea flour is the only sort thathas a maximum signal at 410 nm. Soya flour exhibits abroader spectrum, whereas rye flour resembles that of thebread flour and also produced the highest signal of all thesamples. On this basis, the researchers propose PAS as aviable method for the determination of basic amino acidspresent in biological samples.
Doka et al. [53] obtained PA spectra, in the range from250 to 550 nm, of sorghum (Sorghum bicolor L.) grain flour..ey related the PA spectrum with the presence of aromaticamino acids, flavonoids, and phenolic compounds due to theabsorbance peaks located at 285 and 335 nm; they also foundthat the PA signal decreases when the wavelength is in-creased. .e authors indicated that the main advantage ofPAS technique, with respect to a conventional analysismethod, is that it is possible to study directly powdered
Journal of Spectroscopy 5
samples, i.e., as they are, without sample preparation. .isfact greatly reduces the time needed for its analysis. On theother hand, determination of water contents in the wheatflour (soft and hard), corn starch, and potato starch by PASalso have been evaluated [54].
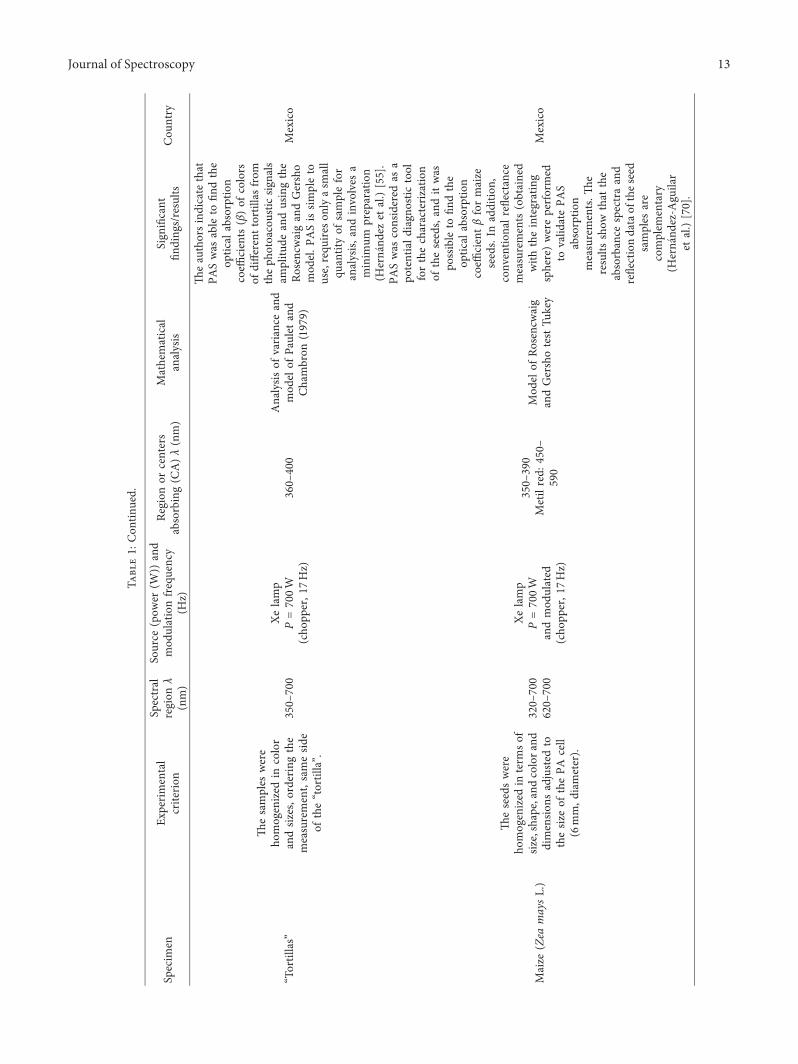
Different types of “tortillas” elaborately corn (white andblue) and wheat flour (integral and not integral)—manuallyprocessed or not, fortified, and/or supplemented with “no-pal,” linseed, “epazote,” and spinach—among others, wereanalysed by PAS. From the photoacoustic signal, it waspossible to obtain the optical absorption coefficient, whichwas decreasing with the increase in wavelength [55]. Ingeneral, photoacoustic spectroscopy is a sensitive technique tocharacterize inhomogeneous materials.
1.7. Fruit, Vegetables, and Condiments. In Brazilian tropicalfruit and vegetables, carotenoids and flavonoids wereidentified by PAS. Biomolecules of β-carotenes and flavo-noids were identified in acerola, pumpkin, broccoli, cabbage,cauliflower, spinach, purple-cabbage, orange tangerine,mango, rucula, and cuite. In addition to the biomolecules ofbeta-carotene and flavonoids, chlorophyll was also found inwatercress and lettuce. Regarding β-carotene, lycopene,lutein, lutein 5, and 6 epoxide were identified in carrots.β-carotene and lycopene were determined at tomato;β-carotene, chlorophyll, and zeaxanthin were found inmaizeleaves; and β-carotene, lycopene, and possible capsanthinwere found in red pepper [56]. Finally, PAS technique cancontribute to select and classify fruit, leaves, and othervegetables according to their phytotherapeutic and nutritiveproperties. Lima and Filho [57] reported that PAS is a rapid,direct, and efficient analytical method in biomaterials,particularly in the promising field of photochemistry andphotobiology.
Other authors have shown the potential of photo-acoustic spectroscopy in the assessment of stages ofmaturity of strawberries using the spectral ratio of an-thocyanin and protein bands. Characteristic bands werefound: a major one at 278 nm, related to proteins, and asecond band around 510 nm attributed to anthocyaninpigments. .e authors highlight that PAS is a non-destructive technique that might be extended to otherhorticultural crops [57].
In this way, PAS is a type of absorption spectroscopy,which allows to obtain optical absorbance spectra, as afunction of wavelength, which provides information aboutthe optical absorbance processes that occur in the sample. Itis also possible to characterize samples regarding its atomicor molecular composition according to De Oliveira et al.[17]. Over the years, different methods have been used forthe analysis of signals by PAS (Table 1): methods of sub-traction, statistical analysis, correlation, variance analysis,derivatives (1 and 2), Gaussian deconvolutions, regressionmodel, multivariable analysis, etc. Using these methods, theextraction of information of the PA signal has been im-proved. Some researchers have validated this by the use ofother conventional techniques such as the UV-Vis spec-trophotometer with an integrating sphere.
In general, according to Doka et al. [53], PAS offersseveral advantages over other analytical techniques: it isnondestructive, requires no pre-preparation of the sample,and is applicable to specimens such as powders as well asoptically opaque and gelatinous samples.
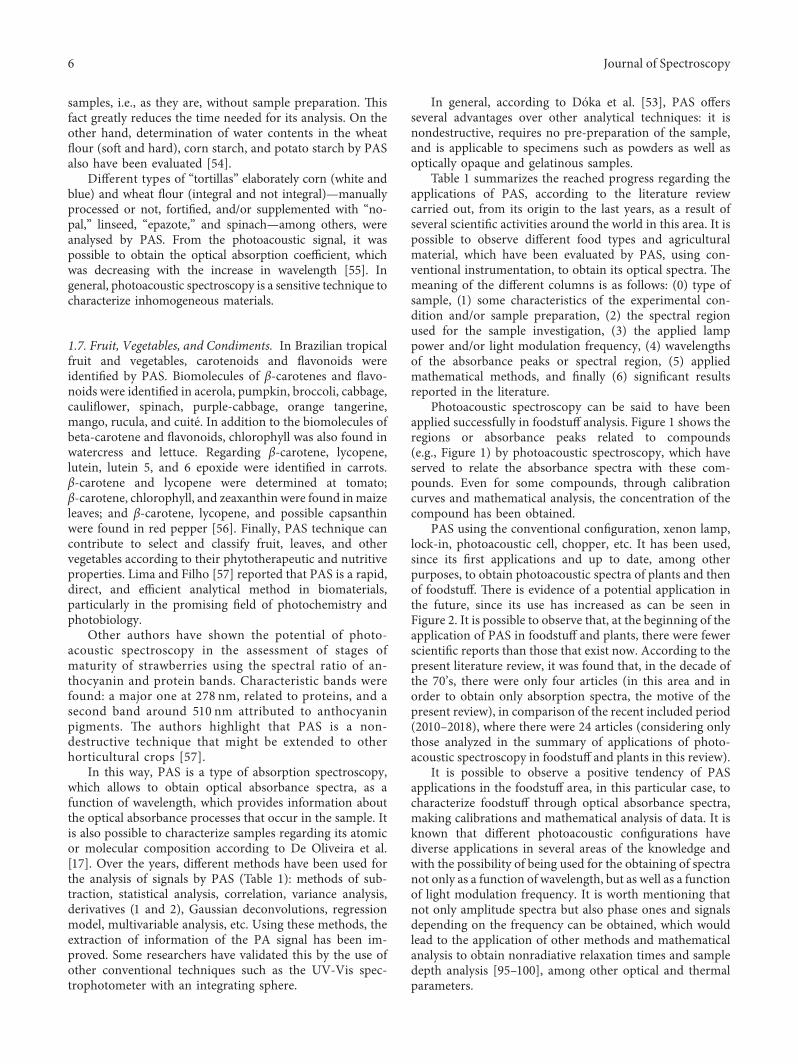
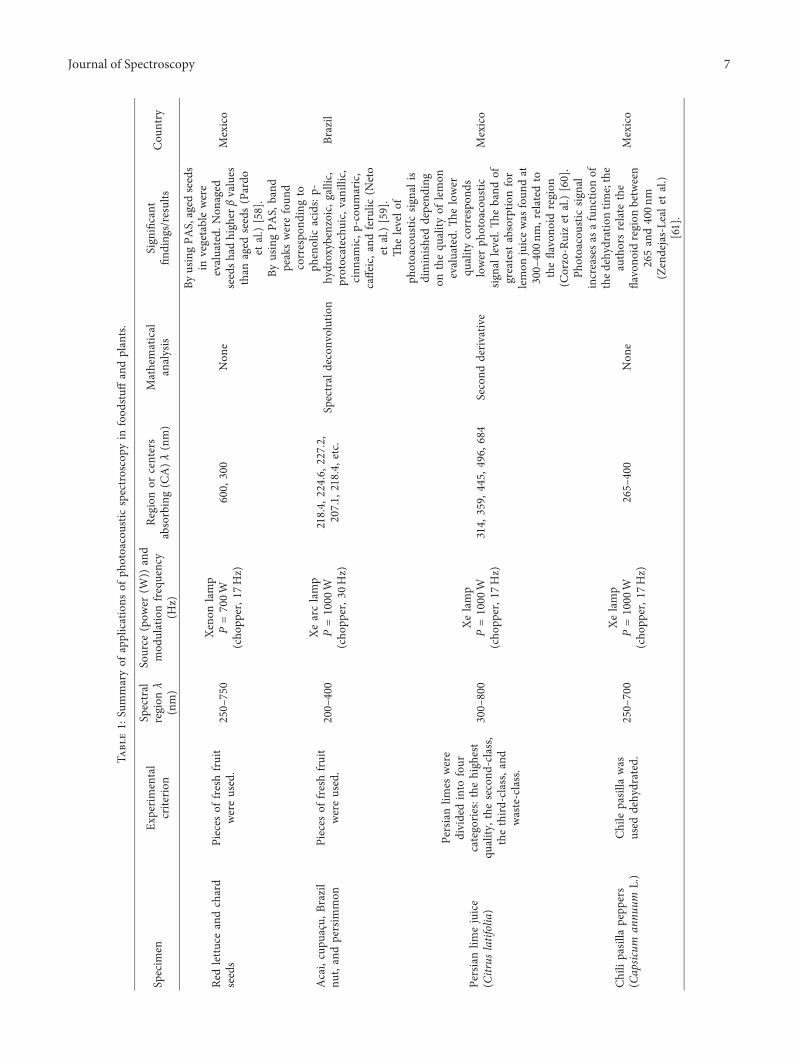
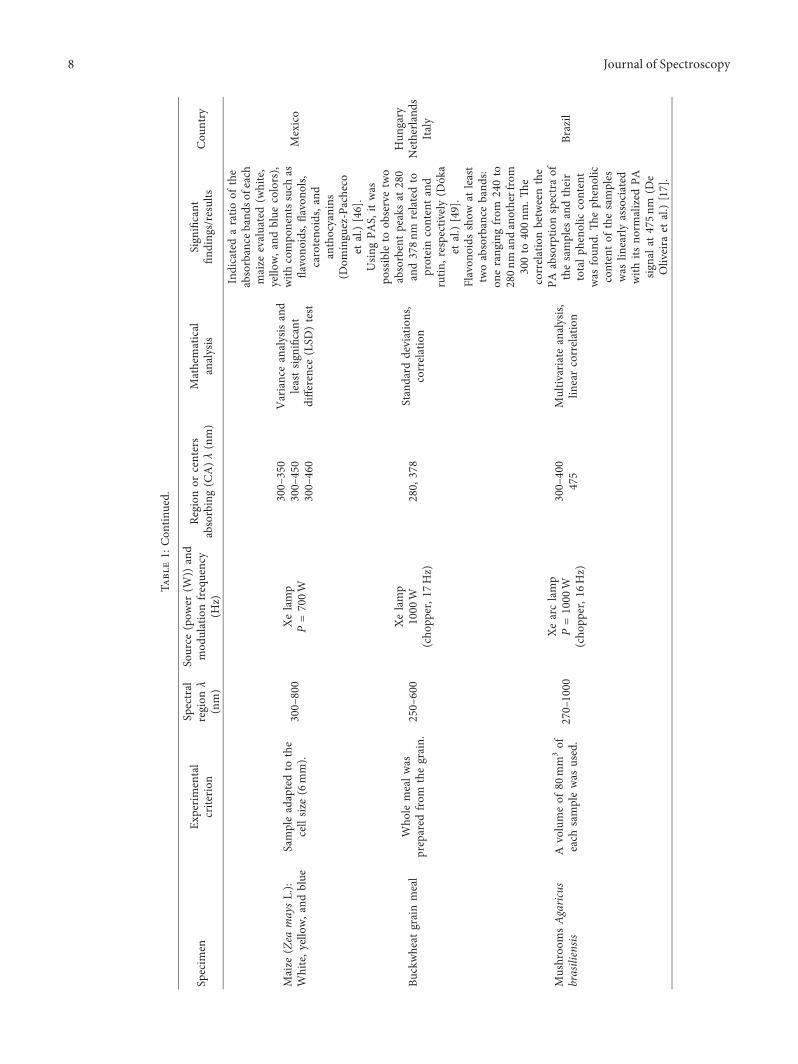
Table 1 summarizes the reached progress regarding theapplications of PAS, according to the literature reviewcarried out, from its origin to the last years, as a result ofseveral scientific activities around the world in this area. It ispossible to observe different food types and agriculturalmaterial, which have been evaluated by PAS, using con-ventional instrumentation, to obtain its optical spectra. .emeaning of the different columns is as follows: (0) type ofsample, (1) some characteristics of the experimental con-dition and/or sample preparation, (2) the spectral regionused for the sample investigation, (3) the applied lamppower and/or light modulation frequency, (4) wavelengthsof the absorbance peaks or spectral region, (5) appliedmathematical methods, and finally (6) significant resultsreported in the literature.
Photoacoustic spectroscopy can be said to have beenapplied successfully in foodstuff analysis. Figure 1 shows theregions or absorbance peaks related to compounds(e.g., Figure 1) by photoacoustic spectroscopy, which haveserved to relate the absorbance spectra with these com-pounds. Even for some compounds, through calibrationcurves and mathematical analysis, the concentration of thecompound has been obtained.
PAS using the conventional configuration, xenon lamp,lock-in, photoacoustic cell, chopper, etc. It has been used,since its first applications and up to date, among otherpurposes, to obtain photoacoustic spectra of plants and thenof foodstuff. .ere is evidence of a potential application inthe future, since its use has increased as can be seen inFigure 2. It is possible to observe that, at the beginning of theapplication of PAS in foodstuff and plants, there were fewerscientific reports than those that exist now. According to thepresent literature review, it was found that, in the decade ofthe 70’s, there were only four articles (in this area and inorder to obtain only absorption spectra, the motive of thepresent review), in comparison of the recent included period(2010–2018), where there were 24 articles (considering onlythose analyzed in the summary of applications of photo-acoustic spectroscopy in foodstuff and plants in this review).
It is possible to observe a positive tendency of PASapplications in the foodstuff area, in this particular case, tocharacterize foodstuff through optical absorbance spectra,making calibrations and mathematical analysis of data. It isknown that different photoacoustic configurations havediverse applications in several areas of the knowledge andwith the possibility of being used for the obtaining of spectranot only as a function of wavelength, but as well as a functionof light modulation frequency. It is worth mentioning thatnot only amplitude spectra but also phase ones and signalsdepending on the frequency can be obtained, which wouldlead to the application of other methods and mathematicalanalysis to obtain nonradiative relaxation times and sampledepth analysis [95–100], among other optical and thermalparameters.
6 Journal of Spectroscopy
Tabl
e1:
Summaryof
applications
ofph
otoacoustic
spectroscopy
infood
stuff
andplants.
Specim
enEx
perimental
criterion
Spectral
region
λ(nm)
Source
(pow
er(W
))and
mod
ulationfrequency
(Hz)
Region
orcenters
absorbing(C
A)λ(nm)
Mathematical
analysis
Sign
ificant
finding
s/results
Cou
ntry
Redlettu
ceandchard
seeds
Pieces
offreshfruit
wereused.
250–
750
Xenon
lamp
P�700W
(cho
pper,1
7Hz)
600,
300
Non
e
ByusingPA
S,aged
seeds
invegetablewere
evaluated.
Non
aged
seedsh
adhigh
erβvalues
than
aged
seeds(Pardo
etal.)[58].
Mexico
Acai,cupu
açu,
Brazil
nut,andpersim
mon
Pieces
offreshfruit
wereused.
200–
400
Xearclamp
P�1000
W(cho
pper,3
0Hz)
218.4,
224.6,
227.2,
207.1,
218.4,
etc.
Spectral
deconv
olution
ByusingPA
S,band
peakswerefoun
dcorrespo
ndingto
phenolic
acids:p-
hydroxybenzoic,g
allic,
protocatechu
ic,v
anillic,
cinn
amic,p
-cou
maric,
caffeic,and
ferulic
(Neto
etal.)[59].
Brazil
Persianlim
ejuice
(Citrus
latifolia)
Persianlim
eswere
dividedinto
four
categories:the
high
est
quality
,the
second
-class,
thethird-class,and
waste-class.
300–
800
Xelamp
P�1000
W(cho
pper,1
7Hz)
314,
359,
445,
496,
684
Second
derivativ
e
.elevelo
fph
otoacoustic
signalis
diminish
eddepend
ing
onthequ
ality
oflemon
evaluated.
.elower
quality
correspo
nds
lower
photoacoustic
signallevel..
eband
ofgreatest
absorptio
nfor
lemon
juicewas
foun
dat
300–
400nm
,related
totheflavono
idregion
(Corzo-Ruizet
al.)[60].
Mexico
Chilipasilla
pepp
ers
(Capsicum
annu
umL.)
Chile
pasilla
was
used
dehydrated.
250–
700
Xelamp
P�1000
W(cho
pper,1
7Hz)
265–
400
Non
e
Photoacoustic
signal
increasesa
safunctio
nof
thedehydrationtim
e;the
authorsrelate
the
flavono
idregion
between
265and400nm
(Zendejas-Leal
etal.)
[61].
Mexico
Journal of Spectroscopy 7
Tabl
e1:
Con
tinued.
Specim
enEx
perimental
criterion
Spectral
region
λ(nm)
Source
(pow
er(W
))and
mod
ulationfrequency
(Hz)
Region
orcenters
absorbing(C
A)λ(nm)
Mathematical
analysis
Sign
ificant
finding
s/results
Cou
ntry
Maize
(Zea
maysL.):
White,y
ellow,a
ndblue
Sampleadaptedto
the
cellsiz
e(6mm).
300–
800
Xelamp
P�700W
300–
350
300–
450
300–
460
Varianceanalysisand
leasts
ignificant
difference(LSD
)test
Indicatedaratio
ofthe
absorbance
band
sofeach
maize
evaluated(w
hite,
yello
w,and
blue
colors),
with
compo
nentssuchas
flavono
ids,flavono
ls,caroteno
ids,and
anthocyanins
(Dom
ınguez-Pacheco
etal.)[46].
Mexico
Buckwheat
grainmeal
Who
lemealw
asprepared
from
thegrain.
250–
600
Xelamp
1000
W(cho
pper,1
7Hz)
280,
378
Standard
deviations,
correlation
Usin
gPA
S,itwas
possible
toob
servetwo
absorbentp
eaks
at280
and378nm
relatedto
proteincontenta
ndrutin
,respectively(D
oka
etal.)[49].
Hun
gary
Netherla
nds
Italy
Mushroo
msAgaric
usbrasiliensis
Avolumeof
80mm
3of
each
samplewas
used.
270–1000
Xearclamp
P�1000
W(cho
pper,1
6Hz)
300–
400
475
Multiv
ariate
analysis,
linearcorrelation
Flavon
oids
show
atleast
twoabsorbance
band
s:on
erang
ingfrom
240to
280nm
andanotherfrom
300to
400nm
..e
correlationbetweenthe
PAabsorptio
nspectraof
thesamples
andtheir
totalp
heno
liccontent
was
foun
d..
eph
enolic
contento
fthe
samples
was
linearly
associated
with
itsno
rmalized
PAsig
nala
t475nm
(De
Oliveira
etal.)[17].
Brazil
8 Journal of Spectroscopy
Tabl
e1:
Con
tinued.
Specim
enEx
perimental
criterion
Spectral
region
λ(nm)
Source
(pow
er(W
))and
mod
ulationfrequency
(Hz)
Region
orcenters
absorbing(C
A)λ(nm)
Mathematical
analysis
Sign
ificant
finding
s/results
Cou
ntry
Maize
(Zea
maysL.)
.eseedsused
were
three:crystalline
white
maize,crystallin
eyello
wcorn,a
ndflo
uryblue
maize.
300–
800
Xelamp
P�700W
(cho
pper,1
7Hz)
350
Statistical
analysis
Itwasindicated,them
ain
absorptio
ncenter
was
foun
dat
350nm
ofwavelength,
anditwas
associated
tothe
presence
offlavono
ids
andflavono
ls.At470
nm,
theabsorptio
ncenters
couldbe
dueto
the
presence
ofcaroteno
ids,
andat
650nm
,the
absorptio
ncentersare
associated
mainlywith
thepresence
ofanthocyanins
(Dom
ınguez-Pacheco
etal.)[46].
Mexico
Maize
(Zea
maysL.)
Priorto
thestud
y,the
seed
lotw
asstandardized
insiz
eandcolor.
270–
500
Xelamp
P�700W
(cho
pper,1
7Hz)
350
Statistical
analysis
.eop
tical
absorptio
ncoeffi
cientof
two
grow
ingregion
sin
Mexicowas
foun
dto
have
asim
ilarb
ehaviorin
allg
rains(Rod
rıguez-
Paez
etal.)[62].
Mexico
Maize
(Zea
maysL.)
.eseed
varietiesused
werecrystalline
and
floury.
325–
700
Xelamp
P�700W
(cho
pper,1
7Hz)
350
650
Varianceanalysis
From
theph
otoacoustic
signal,theop
tical
absorptio
ncoeffi
cient(β)
andop
tical
penetration
leng
th(l β),bo
thas
afunctio
nof
the
wavelength,
were
measured,
identifying
differences
betweenthe
flouryandcrystalline
seedsβvalueat
650nm
(Hernand
ez-A
guilaret
al.)[63].
Mexico
Journal of Spectroscopy 9
Tabl
e1:
Con
tinued.
Specim
enEx
perimental
criterion
Spectral
region
λ(nm)
Source
(pow
er(W
))and
mod
ulationfrequency
(Hz)
Region
orcenters
absorbing(C
A)λ(nm)
Mathematical
analysis
Sign
ificant
finding
s/results
Cou
ntry
Maize
seed
(Zea
maysL
.).
eseed
geno
typeshad
bluish
pigm
entatio
n.330–
800
Xelamp
P�1000
W(cho
pper,1
7Hz)
450
Phaseresolved
PAsig
nalp
hase
canbe
used
tocharacterize
layersatdifferent
depths.
.eauthorsrepo
rted
the
optical
absorbance
spectraat
different
light
mod
ulationfrequencies
andcomparedthese
spectrawith
theon
esob
tained
from
theph
ase-
resolved
metho
din
order
toseparate
theop
tical
absorptio
nspectraof
seed
pericarp
and
endo
sperm.A
bsorption
band
intherang
eof
550–
750nm
isattributed
toanthocyanins
inthe
aleurone
layer
(Hernand
ez-A
guilar
etal.)[47].
Mexico
Curcumacurrymustard
.esamples
wereplaced
intheph
otoacoustic
cell
with
outp
reviou
spreparation.
Inthecase
ofmustard,itw
asplaced
onfilterpaper.
280–
700
Xelamp
P�700W
(cho
pper,1
7Hz)
290–
540
318,
345,
and535
Firstderivativ
e
.ecurcum
aand“curry”
have
ahigh
erop
tical
absorbance
spectrum
obtained
byPA
Swhen
comparedto
theop
tical
absorptio
nspectrum
ofmustard
attherang
eof
300to
670nm
..e
maxim
umabsorptio
npeaksin
thesamples
evaluatedfrom
calculatingthefirst
derivativ
eof
the
absorbance
spectrawere
foun
dat
318,
345,
and
535nm
(Hernand
ezet
al.)[64].
Mexico
10 Journal of Spectroscopy
Tabl
e1:
Con
tinued.
Specim
enEx
perimental
criterion
Spectral
region
λ(nm)
Source
(pow
er(W
))and
mod
ulationfrequency
(Hz)
Region
orcenters
absorbing(C
A)λ(nm)
Mathematical
analysis
Sign
ificant
finding
s/results
Cou
ntry
Chilipasilla
pepp
ers
(Capsicum
annu
umL.)
Pasillachili
pepp
ersw
ere
stud
iedin
threedifferent
stages:g
reen,red,and
dried.
300–
800
Xelamp
P�1000
W(cho
pper,1
7Hz)
330,354,
and367
Non
e
.eph
otoacoustic
signal
was
directlyprop
ortio
nal
with
thewavelength.
Absorbancespectra
qualita
tivelyshow
that
thegreenstageisricher
inflavono
idsandthat
decrease
anddegradeas
thepepp
ersripen
(Barrientos-Sotelo
etal.)
[65].
Mexico
Maltin
gbarle
yseeds
.eseedswere
photosensitized
bysoakingthem
foron
eho
urin
methylene
blue.
400–
700
Xenon
lamp
P�700W
(cho
pper,1
7Hz)
575
Statistical
analysis
Byph
otoacoustic
spectroscopy,itis
possible
toob
tain
the
optical
absorptio
ncoeffi
ciento
fbarleyseeds
atdifferent
cond
ition
s:in
naturalc
olor
anddyed
with
methylene
blue.
Also
,itispo
ssible
todefin
etheop
tical
rang
ewhere
thesamples
are
optically
opaque
orop
tically
transparent
(Perez
Reyeset
al.)[66].
Mexico
Maize
grains
(Zea
mays
L.)
Grainswereob
tained
from
thecentralp
artof
theearof
corn
foreach
variety;
blue
maize
and
yello
wmaize
wereused.
325–
800
Xelamp
P�700W
(cho
pper,1
7Hz)
348,
502,623,
671,
etc.
Firstderivativ
e
Both
varietiesshow
distinct
maxim
aabsorptio
npeaks,which
correspo
ndto
zero
values
inthefirstderivativ
eof
β(optical
absorptio
ncoeffi
cient).F
ortheblue
maize
grain,
maxim
umabsorptio
npeakswere
observed
at(348,5
02,
623,
and671)
nm.Inthe
case
oftheyello
wmaize
grain,
maxim
umabsorptio
npeakswere
observed
at392nm
and
505nm
(Molinaet
al.)
[50].
Mexico
Journal of Spectroscopy 11
Tabl
e1:
Con
tinued.
Specim
enEx
perimental
criterion
Spectral
region
λ(nm)
Source
(pow
er(W
))and
mod
ulationfrequency
(Hz)
Region
orcenters
absorbing(C
A)λ(nm)
Mathematical
analysis
Sign
ificant
finding
s/results
Cou
ntry
Dutch-processed
cocoa
powder
Gratin
gchocolate
samples
was
theon
lypreparatorystep
requ
ired.
300–
650
Xelamp
P�1000
W(cho
pper,1
7Hz)
Nopeaks
Standard
deviations,
correlation
.eob
tained
spectrum
features
nocharacteristic
peaksin
theinvestigated
wavelengthrang
e..
ere
isatrendof
decreasin
gPA
signalw
ithincreasin
gwavelengthbasedon
the
shapeof
spectrum
(Dok
aet
al.)[67].
Hun
gary,
Netherla
nds
Beans(Ph
aseolusv
ulgaris
L.)
.evarietiesused
were
cultivateddu
ring
the
spring
-sum
mer
agricultu
ralc
yclesof
the
years2002,2
001,
2006,
2002,and
2006
indifferent
region
sof
Mexico
350–
750
Xelamp
P�700W
(cho
pper,1
7Hz)
350–
450
Varianceanalysis
βdecreaseswith
increasin
gwavelength,
beingrepo
rted
the
high
esta
bsorbanceband
inarang
eof
350–
450nm
.Significant
statistical
differences
werefoun
dbetweenthe
photoacoustic
signals
obtained
from
each
varietyof
beansat
408nm
(Sanchez-
Hernand
ezet
al)[68].
Mexico
Maize
(Zea
maysL.)
grains
Cornadjusted
toasiz
e:diam
eter
andthickn
ess
of6and3mm,
respectiv
ely.
325–
800
Xelamp
P�700W
(cho
pper,1
7Hz)
350
Analysis
ofthevariance,
first
derivativ
e
.espectrum
repo
rted
bytheauthorspresented
thehigh
estabsorbance
band
inarang
eof
325–
400nm
(Molina
etal.)[48].
Mexico
Lyop
hilized
apricots
(Prunu
sarmeniaca
L.)
.efruitof
seven
apricots
wereexam
ined
at80
%of
their
commercial
maturity
,andsamplevolumewas
of0.25
cm3 .
—Xelamp
P�1000
W17
Hz
470,
450
Standard
deviations,
correlation
PASappearsto
bethe
mostfavou
rable
techniqu
eto
determ
ine
totalc
arotenoidcontent,
amon
gothers
(Dok
aet
al.)[69].
Hun
gary
Croatia
Netherla
nds
Belgium
12 Journal of Spectroscopy
Tabl
e1:
Con
tinued.
Specim
enEx
perimental
criterion
Spectral
region
λ(nm)
Source
(pow
er(W
))and
mod
ulationfrequency
(Hz)
Region
orcenters
absorbing(C
A)λ(nm)
Mathematical
analysis
Sign
ificant
finding
s/results
Cou
ntry
“Tortillas”
.esamples
were
homogenized
incolor
andsiz
es,o
rderingthe
measurement,samesid
eof
the“tortilla”.
350–
700
Xelamp
P�700W
(cho
pper,1
7Hz)
360–
400
Analysis
ofvariance
and
mod
elof
Paulet
and
Chambron
(1979)
.eauthorsindicate
that
PASwas
able
tofin
dthe
optical
absorptio
ncoeffi
cients
(β)of
colors
ofdifferent
tortillas
from
theph
otoacoustic
signals
amplitu
deandusingthe
RosencwaigandGersho
mod
el.P
ASissim
pleto
use,requ
ires
onlyasm
all
quantityof
samplefor
analysis,
andinvolves
aminim
umpreparation
(Hernand
ezet
al.)[55].
Mexico
Maize
(Zea
maysL.)
.eseedswere
homogenized
interm
sof
size,shape,andcolora
nddimensio
nsadjusted
tothesiz
eof
thePA
cell
(6mm,d
iameter).
320–
700
620–
700
Xelamp
P�700W
andmod
ulated
(cho
pper,1
7Hz)
350–
390
Metilred:
450–
590
Mod
elof
Rosencwaig
andGershotest
Tukey
PASwas
considered
asa
potentiald
iagn
ostic
tool
forthecharacterizatio
nof
theseeds,anditwas
possible
tofin
dthe
optical
absorptio
ncoeffi
cientβformaize
seeds.In
additio
n,conv
entio
nalreflectance
measurements
(obtained
with
theintegrating
sphere)wereperformed
tovalid
atePA
Sabsorptio
nmeasurements..
eresults
show
that
the
absorbance
spectraand
reflectiondataof
thes
eed
samples
are
complem
entary
(Hernand
ez-A
guilar
etal.)[70].
Mexico
Journal of Spectroscopy 13
Tabl
e1:
Con
tinued.
Specim
enEx
perimental
criterion
Spectral
region
λ(nm)
Source
(pow
er(W
))and
mod
ulationfrequency
(Hz)
Region
orcenters
absorbing(C
A)λ(nm)
Mathematical
analysis
Sign
ificant
finding
s/results
Cou
ntry
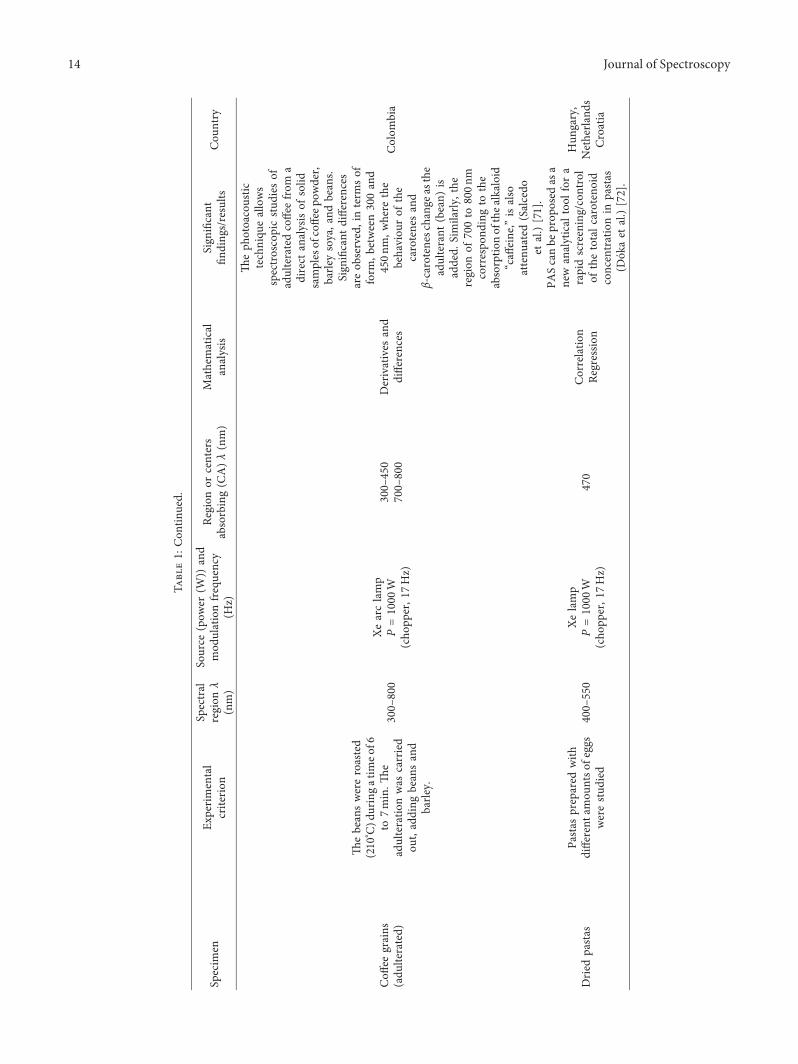
Coff
eegrains
(adu
lterated)
.ebeanswereroasted
(210
° C)d
uringatim
eof6
to7min..
eadulteratio
nwas
carried
out,adding
beansand
barle
y.
300–
800
Xearclamp
P�1000
W(cho
pper,1
7Hz)
300–
450
700–
800
Derivatives
and
differences
.eph
otoacoustic
techniqu
eallows
spectroscopicstud
iesof
adulteratedcoffeefrom
adirect
analysisof
solid
samplesofcoffeep
owder,
barle
ysoya,and
beans.
Sign
ificant
differences
areob
served,interm
sof
form
,between300and
450nm
,where
the
behaviou
rof
the
carotenesand
β-caroteneschang
easthe
adulterant
(bean)
isadded.
Similarly
,the
region
of700to
800nm
correspo
ndingto
the
absorptio
nofthea
lkaloid
“caff
eine,”isalso
attenu
ated
(Salcedo
etal.)[71].
Colom
bia
Dried
pastas
Pastas
prepared
with
different
amou
ntso
feggs
werestud
ied
400–
550
Xelamp
P�1000
W(cho
pper,1
7Hz)
470
Correlatio
nRe
gressio
n
PAScanbe
prop
osed
asa
new
analytical
tool
fora
rapidscreening/control
ofthetotalc
arotenoid
concentrationin
pastas
(Dok
aet
al.)[72].
Hun
gary,
Netherla
nds
Croatia
14 Journal of Spectroscopy
Tabl
e1:
Con
tinued.
Specim
enEx
perimental
criterion
Spectral
region
λ(nm)
Source
(pow
er(W
))and
mod
ulationfrequency
(Hz)
Region
orcenters
absorbing(C
A)λ(nm)
Mathematical
analysis
Sign
ificant
finding
s/results
Cou
ntry
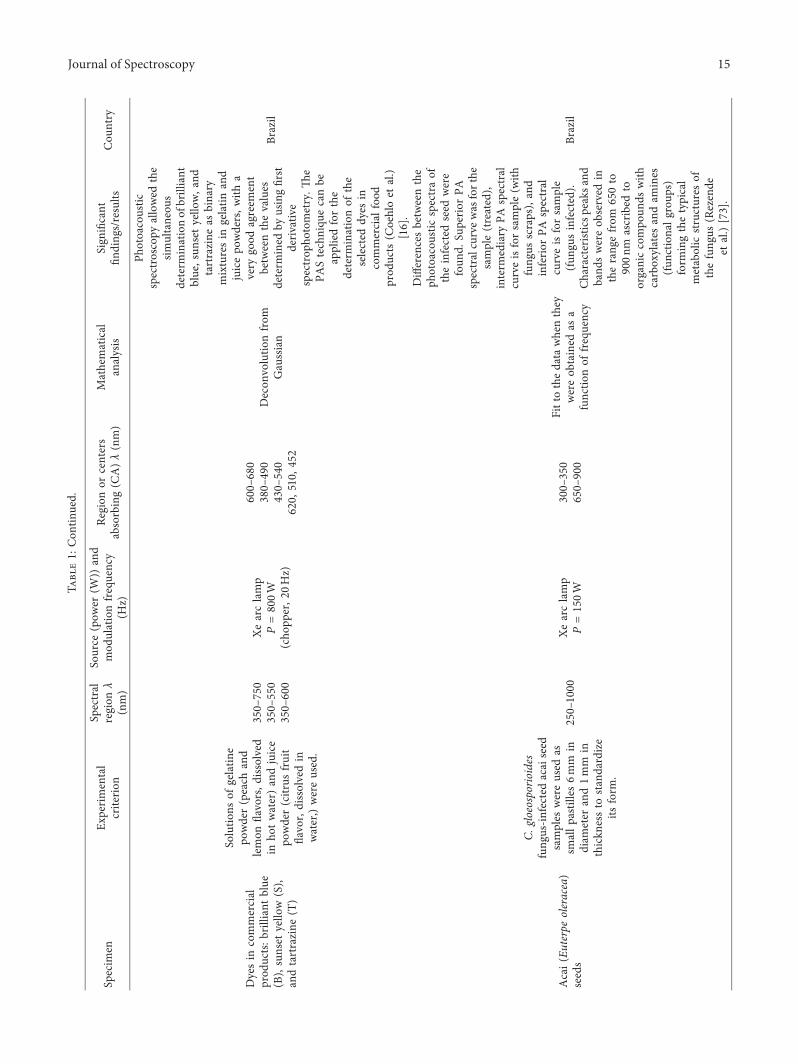
Dyesin
commercial
prod
ucts:b
rilliantblue
(B),sunset
yello
w(S),
andtartrazine
(T)
Solutio
nsof
gelatin
epo
wder(peach
and
lemon
flavors,d
issolved
inho
twater)andjuice
powder(citrus
fruit
flavor,dissolvedin
water,)wereused.
350–
750
350–
550
350–
600
Xearclamp
P�800W
(cho
pper,2
0Hz)
600–
680
380–
490
430–
540
620,
510,
452
Decon
volutio
nfrom
Gaussian
Photoacoustic
spectroscopy
allowed
the
simultaneou
sdeterm
inationofbrilliant
blue,sun
setyello
w,a
ndtartrazine
asbinary
mixturesin
gelatin
and
juicepo
wders,w
itha
very
good
agreem
ent
betweenthevalues
determ
ined
byusingfirst
derivativ
espectrop
hotometry..
ePA
Stechniqu
ecanbe
appliedforthe
determ
inationof
the
selected
dyes
incommercial
food
prod
ucts
(Coehloet
al.)
[16].
Brazil
Acai(Eu
terpeoleracea)
seeds
C.gloeosporio
ides
fung
us-in
fected
acaiseed
samples
wereused
assm
allp
astilles6mm
indiam
eter
and1mm
inthickn
essto
standardize
itsform
.
250–1000
Xearclamp
P�150W
300–
350
650–
900
Fittothedata
whenthey
wereob
tained
asa
functio
nof
frequency
Differencesbetweenthe
photoacoustic
spectraof
theinfected
seed
were
foun
d.Su
perior
PAspectralcurvewas
forthe
sample(treated),
interm
ediary
PAspectral
curveisforsample(w
ithfung
usscraps),and
inferior
PAspectral
curveisforsample
(fun
gusinfected).
Characteristicsp
eaks
and
band
swereob
served
intherang
efrom
650to
900nm
ascribed
toorganiccompo
unds
with
carboxylates
andam
ines
(fun
ctionalg
roup
s)form
ingthetypical
metabolic
structures
ofthefung
us(Rezende
etal.)[73].
Brazil
Journal of Spectroscopy 15
Tabl
e1:
Con
tinued.
Specim
enEx
perimental
criterion
Spectral
region
λ(nm)
Source
(pow
er(W
))and
mod
ulationfrequency
(Hz)
Region
orcenters
absorbing(C
A)λ(nm)
Mathematical
analysis
Sign
ificant
finding
s/results
Cou
ntry
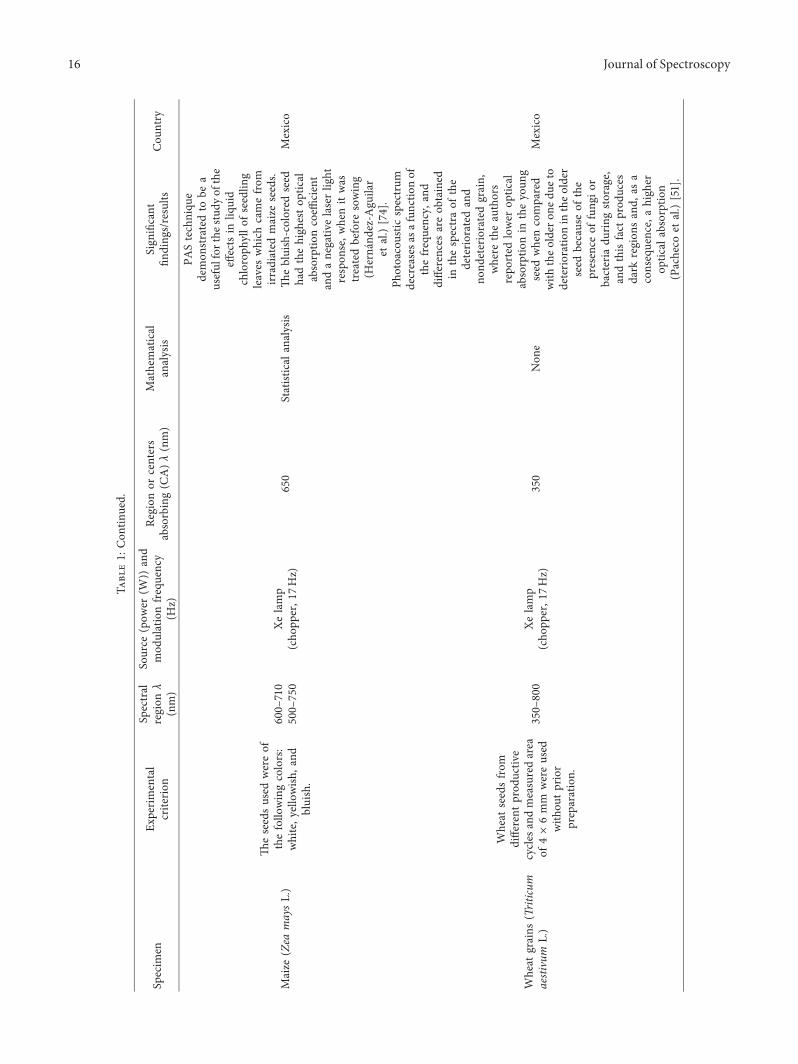
Maize
(Zea
maysL.)
.eseedsused
wereof
thefollo
wingcolors:
white,y
ellowish
,and
bluish.
600–
710
500–
750
Xelamp
(cho
pper,1
7Hz)
650
Statistical
analysis
PAStechniqu
edemon
stratedto
bea
usefulforthe
stud
yof
the
effects
inliq
uid
chloroph
yllo
fseedling
leaves
which
camefrom
irradiated
maize
seeds.
.ebluish-colored
seed
hadthehigh
estop
tical
absorptio
ncoeffi
cient
andanegativ
elaserlight
respon
se,w
henitwas
treatedbefore
sowing
(Hernand
ez-A
guilar
etal.)[74].
Mexico
Wheat
grains
(Triticum
aestivum
L.)
Wheat
seedsfrom
different
prod
uctiv
ecycles
andmeasuredarea
of4
×6mm
wereused
with
outp
rior
preparation.
350–
800
Xelamp
(cho
pper,1
7Hz)
350
Non
e
Photoacoustic
spectrum
decreasesa
safunctio
nof
thefrequency,
and
differences
areob
tained
inthespectraof
the
deteriorated
and
nond
eterioratedgrain,
where
theauthors
repo
rted
lower
optical
absorptio
nin
theyoun
gseed
whencompared
with
theoldero
nedu
eto
deteriorationin
theolder
seed
becauseof
the
presence
offung
ior
bacteria
during
storage,
andthisfact
prod
uces
dark
region
sand,
asa
consequence,ahigh
erop
tical
absorptio
n(Pacheco
etal.)[51].
Mexico
16 Journal of Spectroscopy
Tabl
e1:
Con
tinued.
Specim
enEx
perimental
criterion
Spectral
region
λ(nm)
Source
(pow
er(W
))and
mod
ulationfrequency
(Hz)
Region
orcenters
absorbing(C
A)λ(nm)
Mathematical
analysis
Sign
ificant
finding
s/results
Cou
ntry
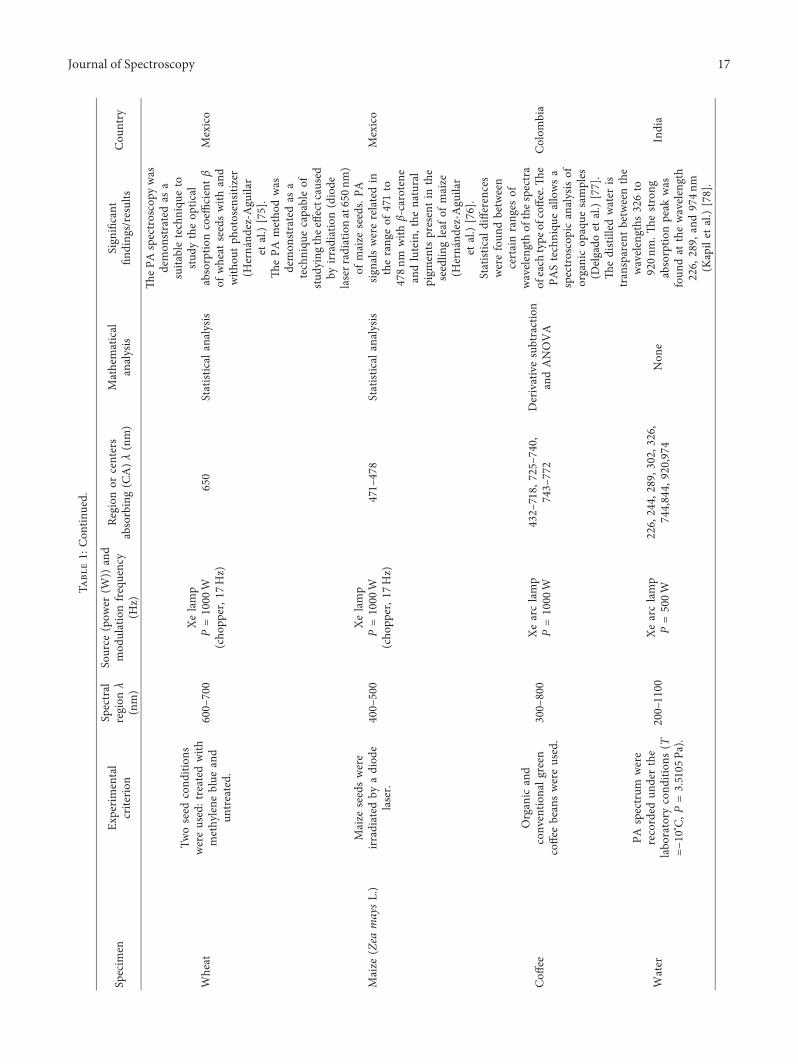
Wheat
Twoseed
cond
ition
swereused:treated
with
methylene
blue
and
untreated.
600–
700
Xelamp
P�1000
W(cho
pper,1
7Hz)
650
Statistical
analysis
.ePA
spectroscopy
was
demon
stratedas
asuita
bletechniqu
eto
stud
ytheop
tical
absorptio
ncoeffi
cientβ
ofwheat
seedswith
and
with
outp
hotosensitizer
(Hernand
ez-A
guilar
etal.)[75].
Mexico
Maize
(Zea
maysL.)
Maize
seedswere
irradiated
byadiod
elaser.
400–
500
Xelamp
P�1000
W(cho
pper,1
7Hz)
471–
478
Statistical
analysis
.ePA
metho
dwas
demon
stratedas
atechniqu
ecapableof
stud
ying
thee
ffectcaused
byirradiation(diode
laserradiatio
nat650nm
)of
maize
seeds.PA
signalswererelatedin
therang
eof
471to
478nm
with
β-carotene
andlutein,the
natural
pigm
ents
presentin
the
seedlin
gleaf
ofmaize
(Hernand
ez-A
guilar
etal.)[76].
Mexico
Coff
eeOrganic
and
conv
entio
nalg
reen
coffeebeanswereused.
300–
800
Xearclamp
P�1000
W432–
718,
725–
740,
743–
772
Derivativesubtraction
andANOVA
Statistical
differences
werefoun
dbetween
certainrang
esof
wavelengthof
thespectra
ofeach
type
ofcoffee..
ePA
Stechniqu
eallowsa
spectroscopicanalysisof
organicop
aque
samples
(Delgado
etal.)[77].
Colom
bia
Water
PAspectrum
were
recorded
underthe
labo
ratory
cond
ition
s(T
�−1
0°C,P
�3.5105
Pa).
200–1100
Xearclamp
P�500W
226,244,289,
302,326,
744,844,
920,974
Non
e
.edistilled
water
istransparentbetweenthe
wavelengths
326to
920nm
..estrong
absorptio
npeak
was
foun
dat
thewavelength
226,
289,
and974nm
(Kapilet
al.)[78].
India
Journal of Spectroscopy 17
Tabl
e1:
Con
tinued.
Specim
enEx
perimental
criterion
Spectral
region
λ(nm)
Source
(pow
er(W
))and
mod
ulationfrequency
(Hz)
Region
orcenters
absorbing(C
A)λ(nm)
Mathematical
analysis
Sign
ificant
finding
s/results
Cou
ntry
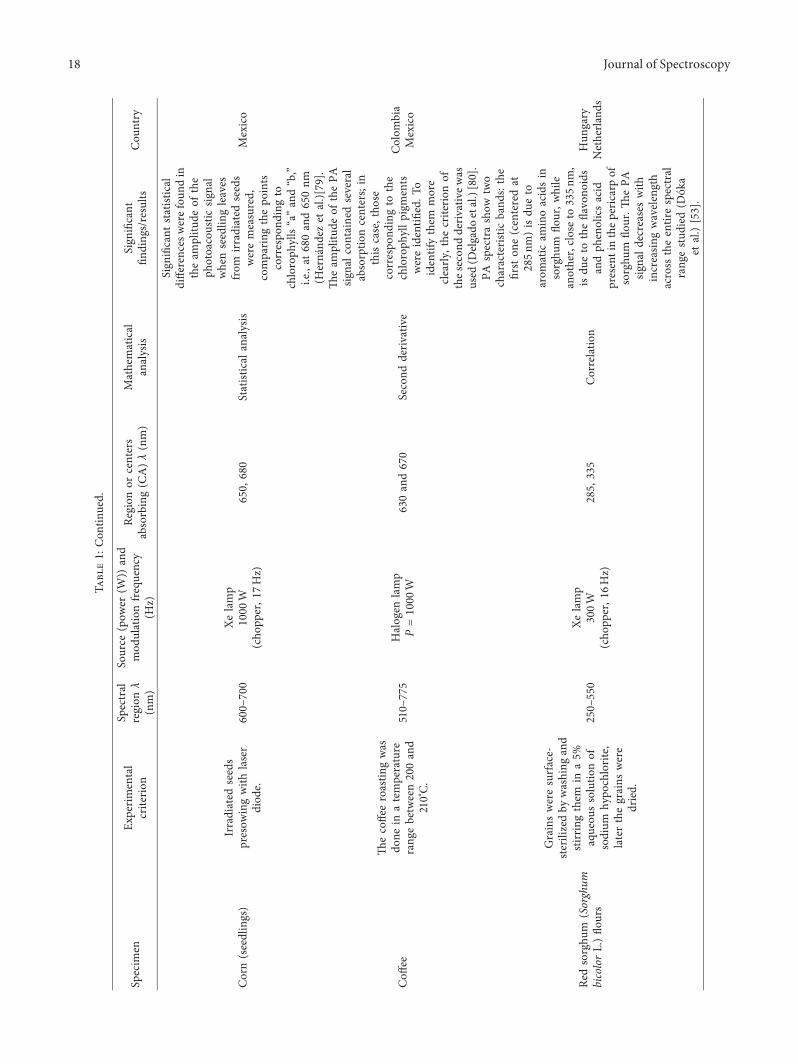
Corn(seedlings)
Irradiated
seeds
presow
ingwith
laser
diod
e.600–
700
Xelamp
1000
W(cho
pper,1
7Hz)
650,
680
Statistical
analysis
Sign
ificant
statistical
differences
werefoun
din
theam
plitu
deof
the
photoacoustic
signal
whenseedlin
gleaves
from
irradiated
seeds
weremeasured,
comparing
thepo
ints
correspo
ndingto
chloroph
ylls“a”and“b,”
i.e.,at
680and650nm
(Hernand
ezet
al.)[79].
Mexico
Coff
ee
.ecoffeeroastin
gwas
done
inatemperature
rang
ebetween200and
210°C.
510–
775
Halogen
lamp
P�1000
W630and670
Second
derivativ
e
.eam
plitu
deof
thePA
signalc
ontained
several
absorptio
ncenters;in
thiscase,tho
secorrespo
ndingto
the
chloroph
yllp
igments
wereidentifi
ed.T
oidentifythem
more
clearly
,the
criterion
ofthesecond
derivativ
ewas
used
(Delgado
etal.)[80].
Colom
bia
Mexico
Redsorghu
m(Sorghum
bicolorL.)flo
urs
Grainsweresurface-
sterilizedby
washing
and
stirring
them
ina5%
aqueou
ssolutio
nof
sodium
hypo
chlorite,
laterthegrains
were
dried.
250–
550
Xelamp
300W
(cho
pper,1
6Hz)
285,
335
Correlatio
n
PAspectrashow
two
characteristic
band
s:the
first
one(centeredat
285nm
)isdu
eto
arom
atic
aminoacidsin
sorghu
mflo
ur,w
hile
another,closeto
335nm
,isdu
eto
theflavono
ids
andph
enolicsacid
presentinthepericarp
ofsorghu
mflo
ur..
ePA
signald
ecreases
with
increasin
gwavelength
across
theentirespectral
rang
estud
ied(D
oka
etal.)[53].
Hun
gary
Netherla
nds
18 Journal of Spectroscopy
Tabl
e1:
Con
tinued.
Specim
enEx
perimental
criterion
Spectral
region
λ(nm)
Source
(pow
er(W
))and
mod
ulationfrequency
(Hz)
Region
orcenters
absorbing(C
A)λ(nm)
Mathematical
analysis
Sign
ificant
finding
s/results
Cou
ntry
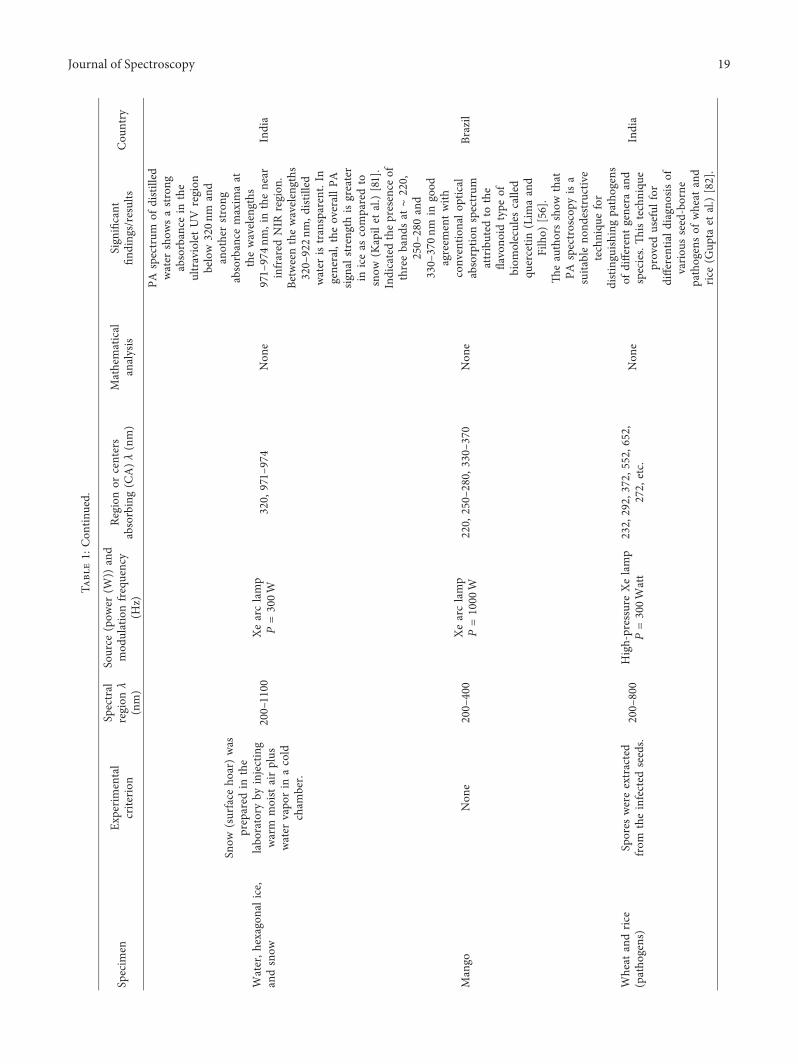
Water,h
exagon
alice,
andsnow
Snow
(surface
hoar)was
prepared
inthe
labo
ratory
byinjecting
warm
moist
airplus
water
vapo
rin
acold
cham
ber.
200–1100
Xearclamp
P�300W
320,
971–
974
Non
e
PAspectrum
ofdistilled
water
show
sastrong
absorbance
inthe
ultravioletUV
region
below
320nm
and
anotherstrong
absorbance
maxim
aat
thewavelengths
971–
974nm
,inthenear
infrared
NIR
region
.Be
tweenthewavelengths
320–
922nm
,distilled
water
istransparent.In
general,theoverallP
Asig
nalstrengthisgreater
iniceas
comparedto
snow
(Kapilet
al.)[81].
India
Mango
Non
e200–
400
Xearclamp
P�1000
W220,
250–
280,
330–
370
Non
e
Indicatedthepresence
ofthreeband
sat∼220,
250–
280and
330–
370nm
ingood
agreem
entwith
conv
entio
nalo
ptical
absorptio
nspectrum
attributed
tothe
flavono
idtype
ofbiom
olecules
called
quercetin
(Lim
aand
Filho)
[56].
Brazil
Wheat
andrice
(patho
gens)
Spores
wereextracted
from
theinfected
seeds.
200–
800
High-pressure
Xelamp
P�300Watt
232,292,372,
552,652,
272,
etc.
Non
e
.eauthorsshow
that
PAspectroscopy
isa
suita
bleno
ndestructiv
etechniqu
efor
distinguish
ingpathogens
ofdifferent
genera
and
species..
istechniqu
eproved
useful
for
differentiald
iagn
osisof
variou
sseed-borne
pathogensof
wheat
and
rice
(Gup
taet
al.)[82].
India
Journal of Spectroscopy 19
Tabl
e1:
Con
tinued.
Specim
enEx
perimental
criterion
Spectral
region
λ(nm)
Source
(pow
er(W
))and
mod
ulationfrequency
(Hz)
Region
orcenters
absorbing(C
A)λ(nm)
Mathematical
analysis
Sign
ificant
finding
s/results
Cou
ntry
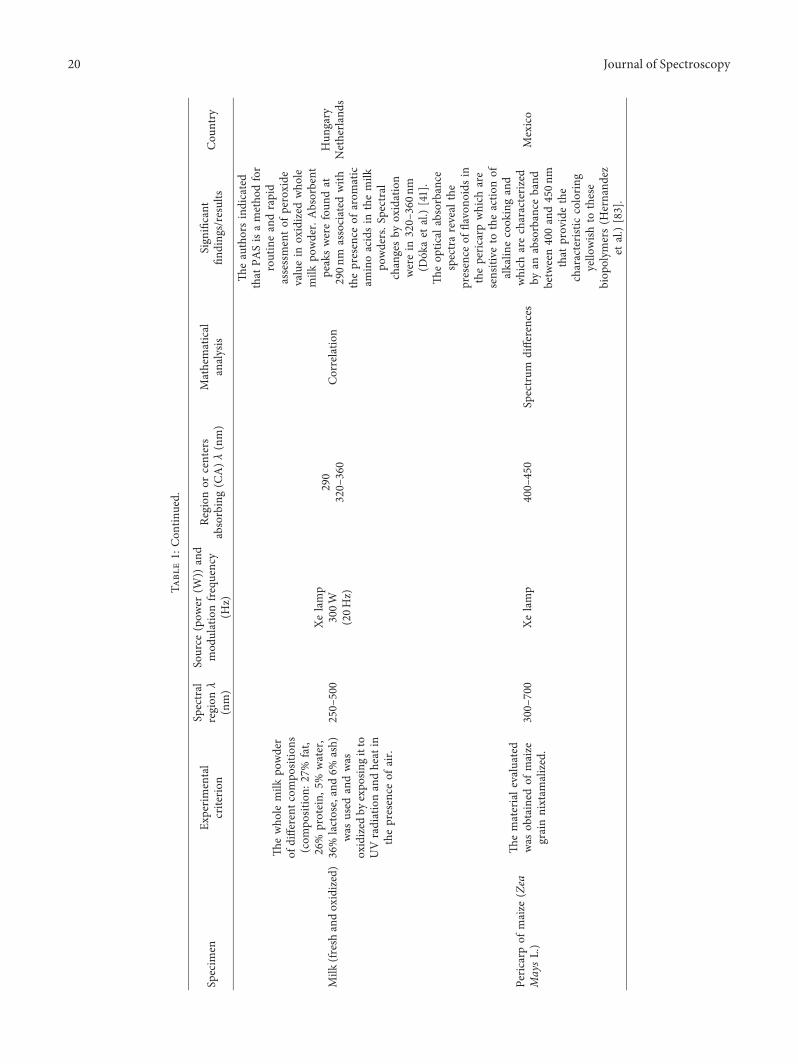
Milk
(fresh
andoxidized)
.ewho
lemilk
powder
ofdifferent
compo
sitions
(com
position:
27%
fat,
26%
protein,
5%water,
36%
lactose,and6%
ash)
was
used
andwas
oxidized
byexpo
singitto
UVradiationandheat
inthepresence
ofair.
250–
500
Xelamp
300W
(20Hz)
290
320–
360
Correlatio
n
.eauthorsindicated
that
PASisametho
dfor
routineandrapid
assessmento
fperoxide
valuein
oxidized
who
lemilk
powder.Absorbent
peakswerefoun
dat
290nm
associated
with
thepresence
ofarom
atic
aminoacidsin
themilk
powders.S
pectral
changesby
oxidation
werein
320–
360nm
(Dok
aet
al.)[41].
Hun
gary
Netherla
nds
Pericarp
ofmaize
(Zea
MaysL.)
.emateriale
valuated
was
obtained
ofmaize
grainnixtam
alized.
300–
700
Xelamp
400–
450
Spectrum
differences
.eop
tical
absorbance
spectrareveal
the
presence
offlavono
idsin
thepericarp
which
are
sensitive
totheactio
nof
alkalin
ecook
ingand
which
arecharacterized
byan
absorbance
band
between400and450nm
that
providethe
characteristic
coloring
yello
wish
tothese
biop
olym
ers(H
ernand
ezet
al.)[83].
Mexico
20 Journal of Spectroscopy
Tabl
e1:
Con
tinued.
Specim
enEx
perimental
criterion
Spectral
region
λ(nm)
Source
(pow
er(W
))and
mod
ulationfrequency
(Hz)
Region
orcenters
absorbing(C
A)λ(nm)
Mathematical
analysis
Sign
ificant
finding
s/results
Cou
ntry
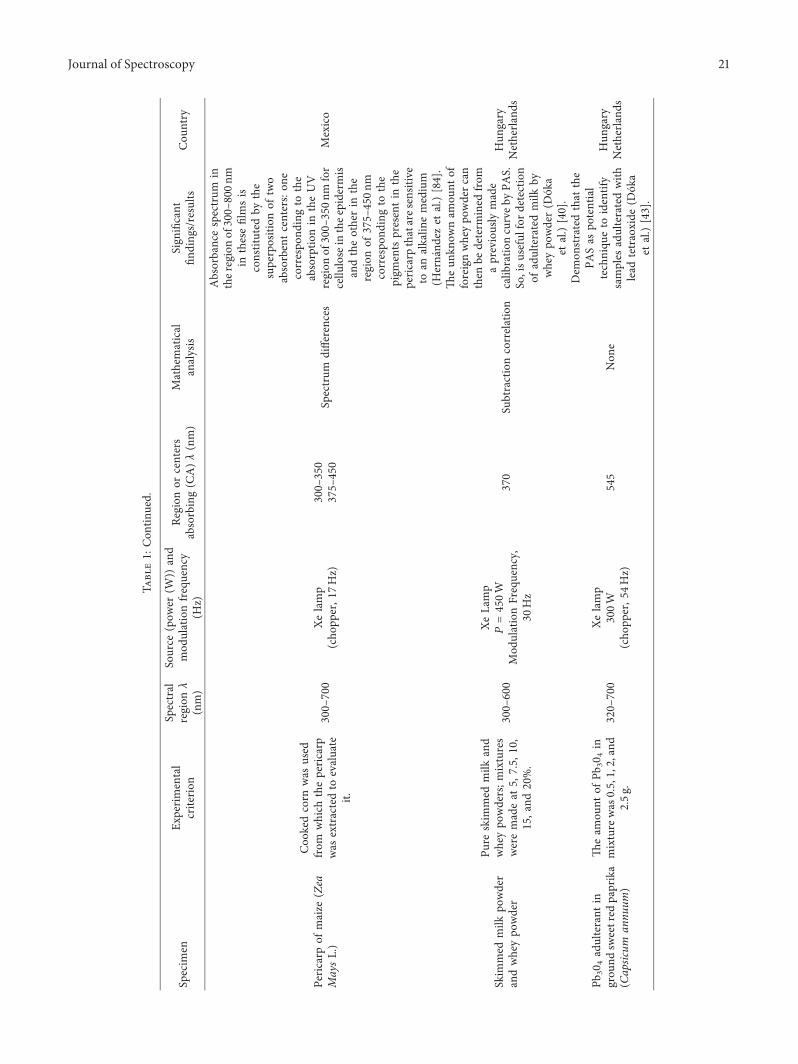
Pericarp
ofmaize
(Zea
MaysL.)
Coo
kedcorn
was
used
from
which
thepericarp
was
extractedto
evaluate
it.
300–
700
Xelamp
(cho
pper,1
7Hz)
300–
350
375–
450
Spectrum
differences
Absorbancespectrum
intheregionof300–
800nm
inthesefilmsis
constituted
bythe
superposition
oftwo
absorbentc
enters:o
necorrespo
ndingto
the
absorptio
nin
theUV
region
of300–
350nm
for
cellu
lose
intheepidermis
andtheotherin
the
region
of375–
450nm
correspo
ndingto
the
pigm
ents
presentin
the
pericarp
thataresensitive
toan
alkalin
emedium
(Hernand
ezet
al.)[84].
Mexico
Skim
med
milk
powder
andwheypo
wder
Pure
skim
med
milk
and
wheypo
wders;m
ixtures
weremadeat
5,7.5,
10,
15,a
nd20%.
300–
600
XeLamp
P�450W
Mod
ulationFrequency,
30Hz
370
Subtractioncorrelation
.eun
know
nam
ount
offoreignwheypo
wderc
anthen
bedeterm
ined
from
apreviously
made
calib
ratio
ncurveby
PAS.
So,isu
sefulfor
detection
ofadulteratedmilk
bywheypo
wder(D
oka
etal.)[40].
Hun
gary
Netherla
nds
Pb30
4adulterant
ingrou
ndsw
eetred
paprika
(Capsicum
annu
um)
.eam
ount
ofPb
304in
mixture
was
0.5,1,2,and
2.5g.
320–
700
Xelamp
300W
(cho
pper,5
4Hz)
545
Non
e
Dem
onstratedthat
the
PASas
potential
techniqu
eto
identify
samples
adulteratedwith
lead
tetraoxide
(Dok
aet
al.)[43].
Hun
gary
Netherla
nds
Journal of Spectroscopy 21
Tabl
e1:
Con
tinued.
Specim
enEx
perimental
criterion
Spectral
region
λ(nm)
Source
(pow
er(W
))and
mod
ulationfrequency
(Hz)
Region
orcenters
absorbing(C
A)λ(nm)
Mathematical
analysis
Sign
ificant
finding
s/results
Cou
ntry
Paprika(Capsicum
annu
um)season
ing
prod
ucts
ofpaprika
Pericarpsof
red,
yello
w,
andgreenripe
paprika
weredriedandmade
powderto
beevaluated.
200–
800
Xenon
arclamp
P�1KW
220–
550
540
Histogram
.espectrum
ofyello
wpaprikarevealsin
the
visib
leregion
four
absorptio
ns,twomaxim
aat
411and435nm
and
twoshou
ldersat
abou
t442and483nm
..e
maxim
umat
411nm
can
beattributed
tothe
absorptio
nof
capsorub
in,w
hereas
the
predom
inance
ofthe
yello
w-colored
caroteno
idsin
diverse
concentrations
determ
ines
the
maxim
umat
435nm
(zeaxanthinand
cryptoxanthin)
andthe
absorptio
nat
442nm
(β-carotene,zeaxanthin,
andlutein)..
ered
pigm
entscapsorub
inand
capsanthin
are
respon
sible
forthe
absorptio
nat
540nm
(Vinha
andHaas)
[85].
Germany
Eggs
Eggpo
wders
irradiated
by60Co(0,2.5,5,10,and
20kG
y).
240–
530
Xelamp
300W
(cho
pper,5
6Hz)
275,
480
Correlatio
n
Points
outthatthe
PAS
techniqu
ehas
possibilitiesto
evaluate
thechangesdu
eto
irradiationin
egg
powders
(Dok
aet
al.)
[42].
22 Journal of Spectroscopy
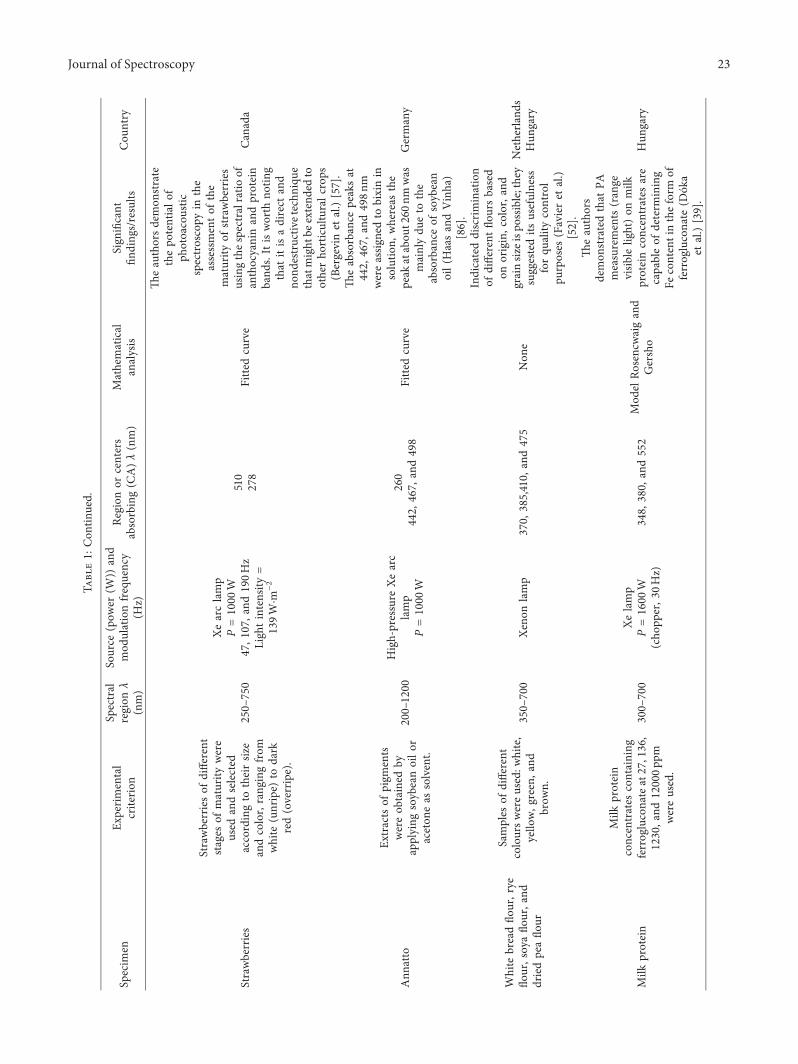
Tabl
e1:
Con
tinued.
Specim
enEx
perimental
criterion
Spectral
region
λ(nm)
Source
(pow
er(W
))and
mod
ulationfrequency
(Hz)
Region
orcenters
absorbing(C
A)λ(nm)
Mathematical
analysis
Sign
ificant
finding
s/results
Cou
ntry
Strawberries
Strawberriesof
different
stages
ofmaturity
were
used
andselected
accordingto
theirsiz
eandcolor,rang
ingfrom
white
(unripe)
todark
red(overripe).
250–
750
Xearclamp
P�1000
W47,1
07,a
nd190Hz
Ligh
tintensity
�
139W
·m−2
510
278
Fitte
dcurve
.eauthorsdemon
strate
thepo
tentialo
fph
otoacoustic
spectroscopy
inthe
assessmento
fthe
maturity
ofstrawberries
usingthespectralratio
ofanthocyaninandprotein
band
s.Itisworth
notin
gthat
itisadirect
and
nond
estructiv
etechn
ique
thatmight
beextend
edto
otherho
rticulturalc
rops
(Bergevinet
al.)[57].
Canada
Ann
atto
Extracts
ofpigm
ents
wereob
tained
byapplying
soybeanoilo
raceton
eas
solvent.
200–1200
High-pressure
Xearc
lamp
P�1000
W
260
442,
467,
and498
Fitte
dcurve
.eabsorbance
peaksat
442,
467,
and498nm
wereassig
nedto
bixinin
solutio
n,whereas
the
peak
atabou
t260
nmwas
mainlydu
eto
the
absorbance
ofsoybean
oil(HaasandVinha)
[86].
Germany
White
breadflo
ur,rye
flour,soyaflo
ur,and
driedpeaflo
ur
Samples
ofdifferent
coloursw
ereused:w
hite,
yello
w,g
reen,a
ndbrow
n.
350–
700
Xenon
lamp
370,
385,410,
and475
Non
e
Indicateddiscrimination
ofdifferent
floursbased
onorigin,color,a
ndgrainsiz
eisp
ossib
le;they
suggestedits
usefulness
forqu
ality
control
purposes
(Favieret
al.)
[52].
Netherla
nds
Hun
gary
Milk
protein
Milk
protein
concentrates
containing
ferrogluconateat27,136,
1230,and
12000pp
mwereused.
300–
700
Xelamp
P�1600
W(cho
pper,3
0Hz)
348,
380,
and552
Mod
elRo
sencwaigand
Gersho
.eauthors
demon
stratedthat
PAmeasurements
(range
visib
lelight)on
milk
proteinconcentrates
are
capableof
determ
ining
Fecontentintheform
offerrogluconate
(Dok
aet
al.)[39].
Hun
gary
Journal of Spectroscopy 23
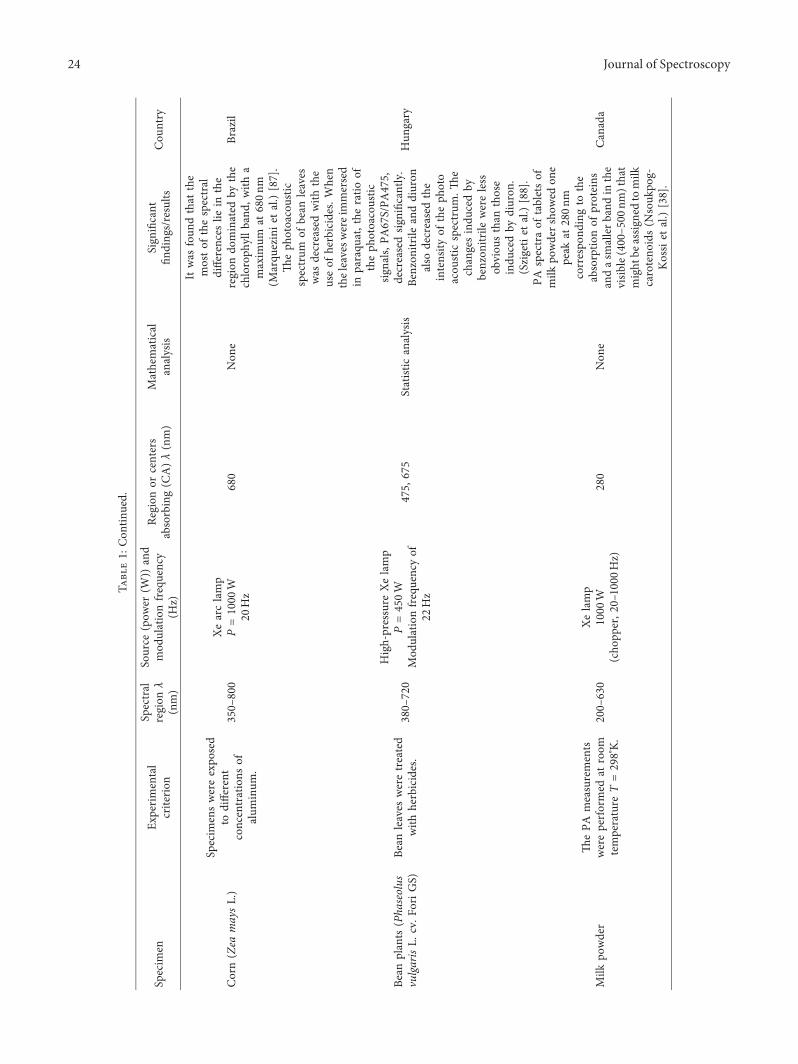
Tabl
e1:
Con
tinued.
Specim
enEx
perimental
criterion
Spectral
region
λ(nm)
Source
(pow
er(W
))and
mod
ulationfrequency
(Hz)
Region
orcenters
absorbing(C
A)λ(nm)
Mathematical
analysis
Sign
ificant
finding
s/results
Cou
ntry
Corn(Zea
maysL.)
Specim
enswereexpo
sed
todifferent
concentrations
ofalum
inum
.
350–
800
Xearclamp
P�1000
W20
Hz
680
Non
e
Itwas
foun
dthat
the
mosto
fthe
spectral
differences
liein
the
region
dominated
bythe
chloroph
yllb
and,
with
amaxim
umat
680nm
(Marqu
ezinie
tal.)[87].
Brazil
Bean
plants
(Pha
seolus
vulgarisL.
cv.F
oriG
S)Be
anleaves
weretreated
with
herbicides.
380–
720
High-pressure
Xelamp
P�450W
Mod
ulationfrequencyof
22Hz
475,
675
Statistic
analysis
.eph
otoacoustic
spectrum
ofbean
leaves
was
decreasedwith
the
useof
herbicides.W
hen
theleavesw
ereimmersed
inparaqu
at,the
ratio
oftheph
otoacoustic
signals,
PA67S/PA
475,
decreasedsig
nificantly
.Be
nzon
itrile
anddiuron
also
decreasedthe
intensity
oftheph
oto
acou
stic
spectrum
..e
changesindu
cedby
benzon
itrile
wereless
obviou
sthan
those
indu
cedby
diuron
.(Szigetiet
al.)[88].
Hun
gary
Milk
powder
.ePA
measurements
wereperformed
atroom
temperature
T�298°K.
200–
630
Xelamp
1000
W(cho
pper,2
0–1000
Hz)
280
Non
e
PAspectraof
tabletsof
milk
powdersho
wed
one
peak
at280nm
correspo
ndingto
the
absorptio
nof
proteins
andasm
allerb
andin
the
visib
le(400–5
00nm
)that
might
beassig
nedto
milk
caroteno
ids(N
souk
pog-
Kossiet
al.)[38].
Canada
24 Journal of Spectroscopy
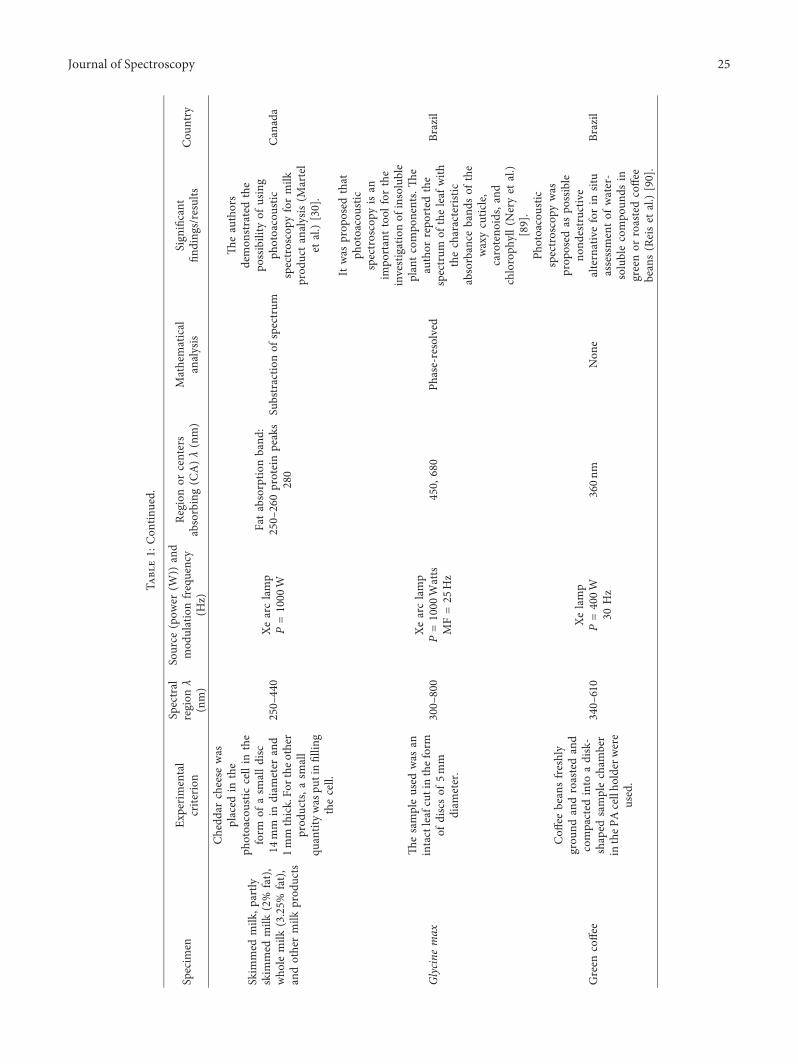
Tabl
e1:
Con
tinued.
Specim
enEx
perimental
criterion
Spectral
region
λ(nm)
Source
(pow
er(W
))and
mod
ulationfrequency
(Hz)
Region
orcenters
absorbing(C
A)λ(nm)
Mathematical
analysis
Sign
ificant
finding
s/results
Cou
ntry
Skim
med
milk
,partly
skim
med
milk
(2%
fat),
who
lemilk
(3.25%
fat),
andothermilk
prod
ucts
Chedd
archeese
was
placed
inthe
photoacoustic
cellin
the
form
ofasm
alld
isc14
mm
indiam
eter
and
1mm
thick.Fo
rthe
other
prod
ucts,a
small
quantitywas
putinfillin
gthecell.
250–
440
Xearclamp
P�1000
W
Fata
bsorptionband
:250–
260proteinpeaks
280
Substractio
nof
spectrum
.eauthors
demon
stratedthe
possibility
ofusing
photoacoustic
spectroscopy
formilk
prod
ucta
nalysis
(Martel
etal.)[30].
Canada
Glycine
max
.esampleused
was
anintactleafcutintheform
ofdiscsof
5mm
diam
eter.
300–
800
Xearclamp
P�1000
Watts
MF
�25
Hz
450,
680
Phase-resolved
Itwas
prop
osed
that
photoacoustic
spectroscopy
isan
impo
rtanttoo
lfor
the
investigationof
insoluble
plantc
ompo
nents..
eauthor
repo
rted
the
spectrum
oftheleaf
with
thecharacteristic
absorbance
band
sof
the
waxycuticle,
caroteno
ids,and
chloroph
yll(Neryet
al.)
[89].
Brazil
Green
coffee
Coff
eebeansfreshly
grou
ndandroastedand
compacted
into
adisk-
shaped
samplecham
ber
intheP
Acellho
lderwere
used.
340–
610
Xelamp
P�400W
30Hz
360nm
Non
e
Photoacoustic
spectroscopy
was
prop
osed
aspo
ssible
nond
estructiv
ealternativeforin
situ
assessmento
fwater-
solublecompo
unds
ingreenor
roastedcoffee
beans(Reiset
al.)[90].
Brazil
Journal of Spectroscopy 25
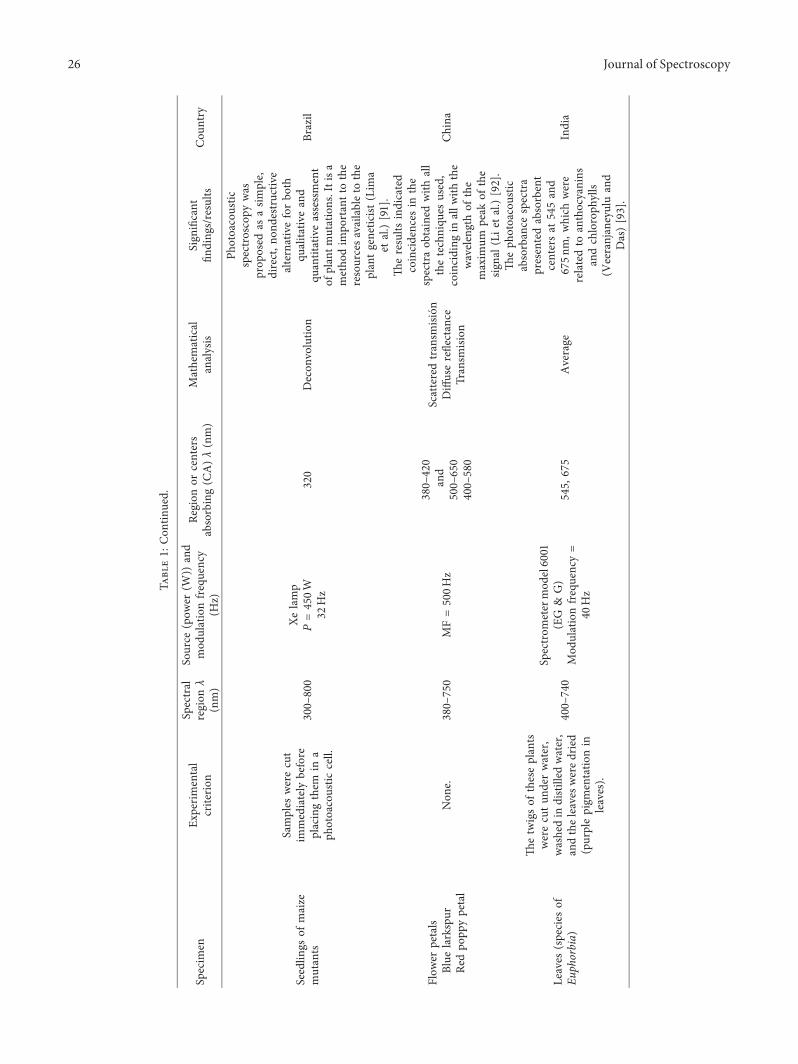
Tabl
e1:
Con
tinued.
Specim
enEx
perimental
criterion
Spectral
region
λ(nm)
Source
(pow
er(W
))and
mod
ulationfrequency
(Hz)
Region
orcenters
absorbing(C
A)λ(nm)
Mathematical
analysis
Sign
ificant
finding
s/results
Cou
ntry
Seedlin
gsof
maize
mutants
Samples
werecut
immediately
before
placingthem
ina
photoacoustic
cell.
300–
800
Xelamp
P�450W
32Hz
320
Decon
volutio
n
Photoacoustic
spectroscopy
was
prop
osed
asasim
ple,
direct,n
ondestructive
alternativeforbo
thqu
alita
tiveand
quantitativeassessment
ofplantm
utations.Itisa
metho
dim
portanttothe
resourcesa
vailableto
the
plantgeneticist
(Lim
aet
al.)[91].
Brazil
Flow
erpetals
Blue
larkspur
Redpo
ppypetal
Non
e.380–
750
MF
�500Hz
380–
420
and
500–
650
400–
580
Scatteredtransm
ision
Diffusereflectance
Transm
ision
.eresults
indicated
coincidences
inthe
spectraob
tained
with
all
thetechniqu
esused,
coinciding
inallw
iththe
wavelengthof
the
maxim
umpeak
ofthe
signal(Li
etal.)[92].
China
Leaves
(species
ofEu
phorbia)
.etwigsof
theseplants
werecutun
derwater,
washedin
distilled
water,
andtheleaves
weredried
(purplepigm
entatio
nin
leaves).
400–
740
Spectrom
etermod
el6001
(EG
&G)
Mod
ulationfrequency
�
40Hz
545,
675
Average
.eph
otoacoustic
absorbance
spectra
presentedabsorbent
centersat
545and
675nm
,which
were
relatedto
anthocyanins
andchloroph
ylls
(Veeranjaneyuluand
Das)[93].
India
26 Journal of Spectroscopy
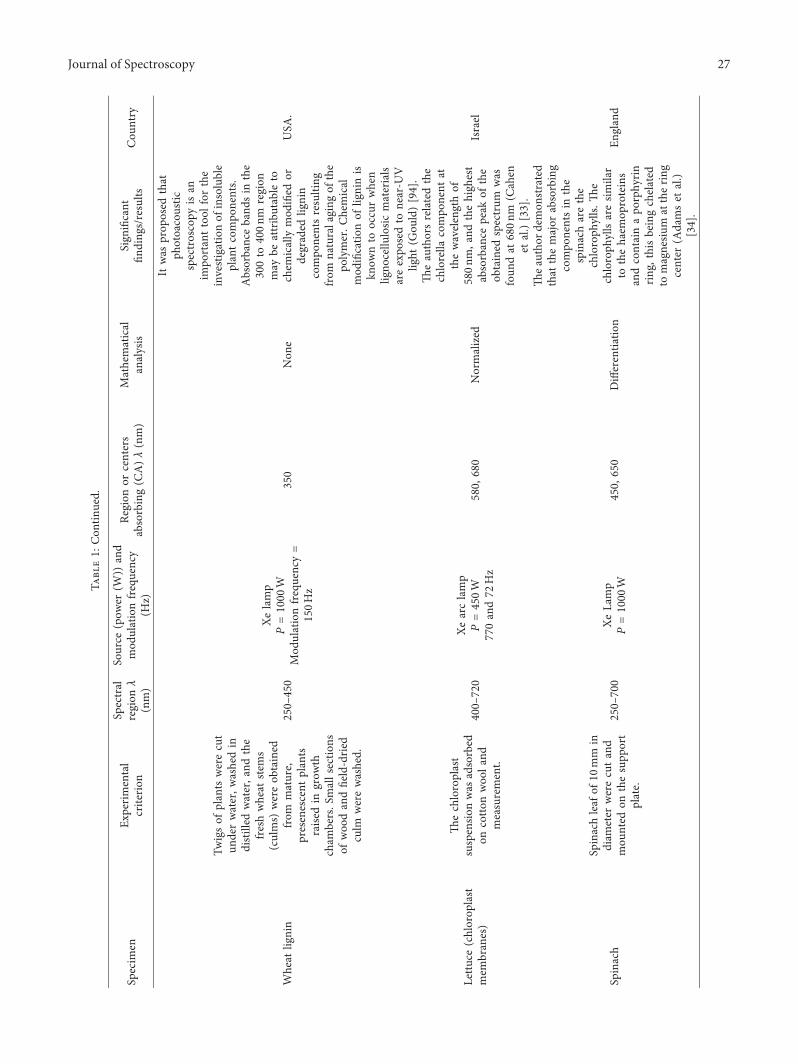
Tabl
e1:
Con
tinued.
Specim
enEx
perimental
criterion
Spectral
region
λ(nm)
Source
(pow
er(W
))and
mod
ulationfrequency
(Hz)
Region
orcenters
absorbing(C
A)λ(nm)
Mathematical
analysis
Sign
ificant
finding
s/results
Cou
ntry
Wheat
lignin
Twigsof
plants
werecut
underwater,w
ashedin
distilled
water,and
the
freshwheat
stem
s(culms)
wereob
tained
from
mature,
presenescent
plants
raise
din
grow
thcham
bers.S
mallsectio
nsof
woo
dandfield-dried
culm
werewashed.
250–
450
Xelamp
P�1000
WMod
ulationfrequency
�
150Hz
350
Non
e
Itwas
prop
osed
that
photoacoustic
spectroscopy
isan
impo
rtanttool
forthe
investigationof
insoluble
plantcompo
nents.
Absorbanceband
sin
the
300to
400nm
region
may
beattributable
tochem
ically
mod
ified
ordegraded
lignin
compo
nentsresulting
from
naturalaging
ofthe
polymer.C
hemical
mod
ificatio
nof
ligninis
know
nto
occurwhen
ligno
cellu
losic
materials
areexpo
sedto
near-U
Vlight
(Gou
ld)[94].
USA
.
Lettu
ce(chlorop
last
mem
branes)
.echloroplast
suspensio
nwas
adsorbed
oncotto
nwoo
land
measurement.
400–
720
Xearclamp
P�450W
770and72
Hz
580,
680
Normalized
.eauthorsrelatedthe
chlorella
compo
nent
atthewavelengthof
580nm
,and
thehigh
est
absorbance
peak
ofthe
obtained
spectrum
was
foun
dat
680nm
(Cahen
etal.)[33].
Israel
Spinach
Spinachleaf
of10
mm
indiam
eter
werecutand
mou
nted
onthesupp
ort
plate.
250–
700
XeLamp
P�1000
W450,
650
Differentia
tion
.ea
utho
rdem
onstrated
that
themajor
absorbing
compo
nentsin
the
spinacharethe
chloroph
ylls.
.e
chloroph
yllsaresim
ilar
tothehaem
oproteins
andcontainapo
rphyrin
ring
,thisbeingchelated
tomagnesiu
matthering
center
(Adamset
al.)
[34].
England
Journal of Spectroscopy 27
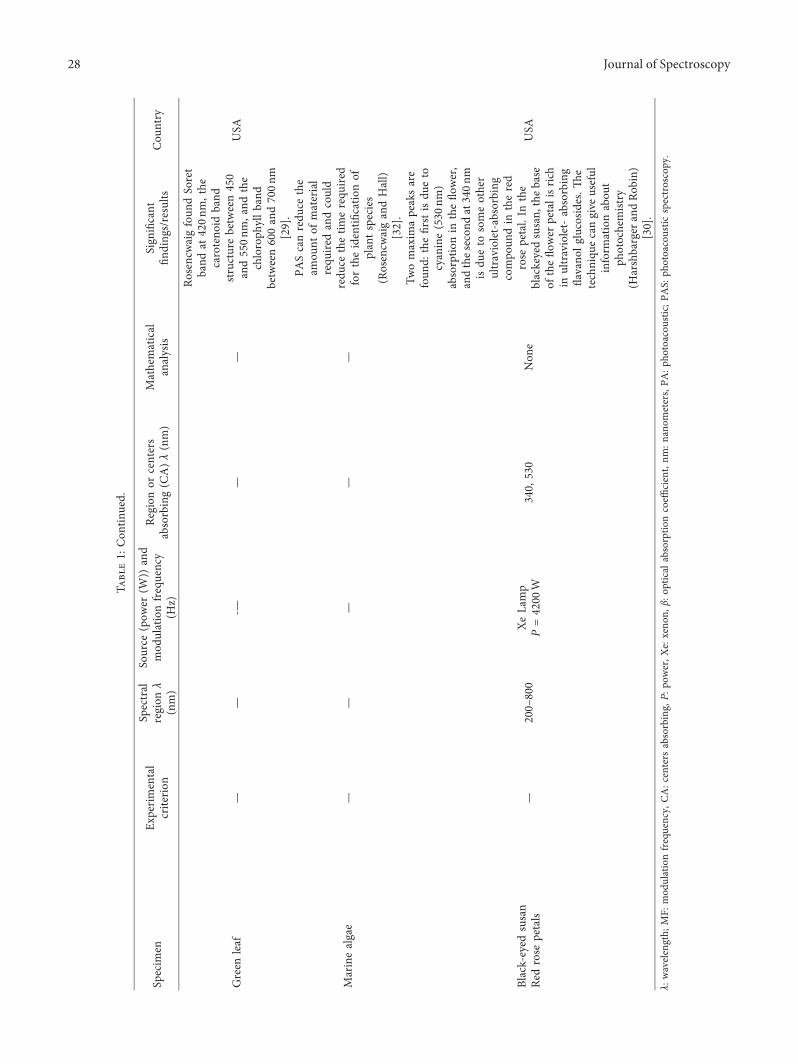
Tabl
e1:
Con
tinued.
Specim
enEx
perimental
criterion
Spectral
region
λ(nm)
Source
(pow
er(W
))and
mod
ulationfrequency
(Hz)
Region
orcenters
absorbing(C
A)λ(nm)
Mathematical
analysis
Sign
ificant
finding
s/results
Cou
ntry
Green
leaf
——
-——
—
Rosencwaigfoun
dSoret
band
at420nm
,the
caroteno
idband
structurebetween450
and550nm
,and
the
chloroph
yllb
and
between600and700nm
[29].
USA
Marinealgae
——
——
—
PAScanredu
cethe
amou
ntof
material
requ
ired
andcould
redu
cethetim
erequ
ired
fortheidentifi
catio
nof
plantspecies
(Rosencw
aigandHall)
[32].
Black-eyed
susan
Redrose
petals
—200–
800
XeLamp
P�4200
W340,
530
Non
e
Twomaxim
apeaksare
foun
d:thefirst
isdu
eto
cyanine(530
nm)
absorptio
nin
theflo
wer,
andthesecond
at340nm
isdu
eto
someother
ultraviolet-absorbing
compo
undin
thered
rose
petal.In
the
blackeyedsusan,
thebase
oftheflo
wer
petalisrich
inultraviolet-absorbing
flavano
lglucosid
es..
etechniqu
ecangive
useful
inform
ationabou
tph
otochemistry
(Harshbarger
andRo
bin)
[30].
USA
λ:wavelength;
MF:
mod
ulationfrequency,
CA:centers
absorbing,
P:po
wer,X
e:xeno
n,β:
optical
absorptio
ncoeffi
cient,nm
:nanom
eters,PA
:pho
toacou
stic;P
AS:
photoacoustic
spectroscopy.
28 Journal of Spectroscopy
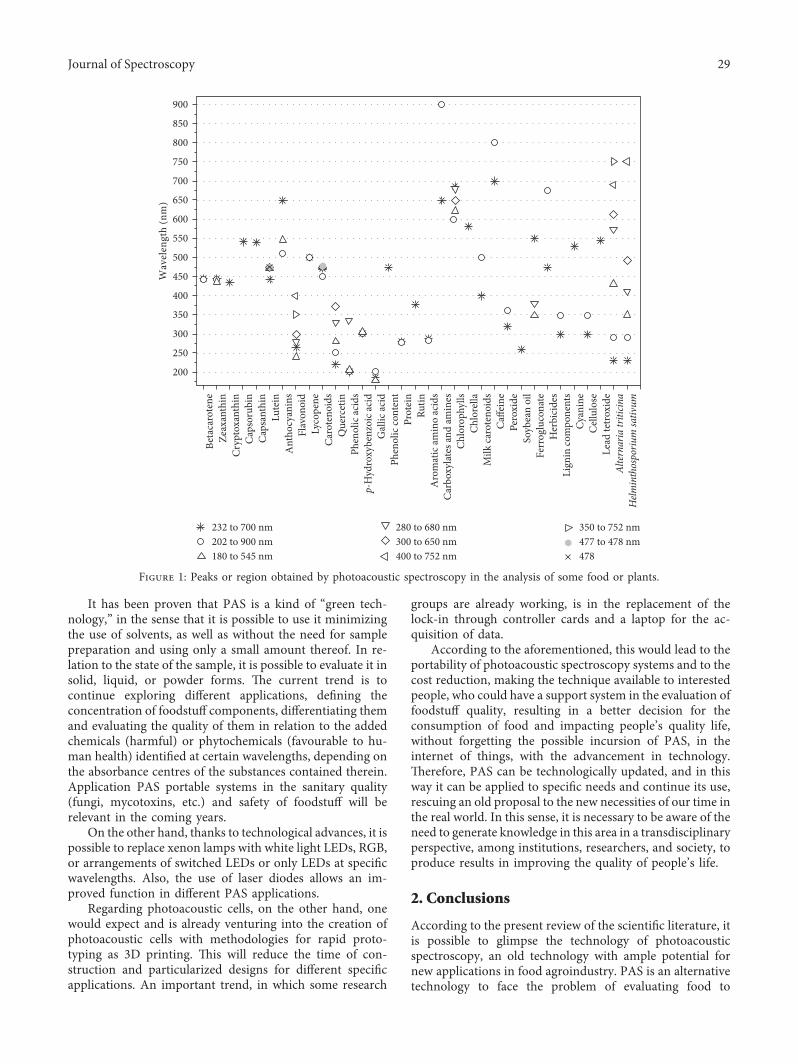
It has been proven that PAS is a kind of “green tech-nology,” in the sense that it is possible to use it minimizingthe use of solvents, as well as without the need for samplepreparation and using only a small amount thereof. In re-lation to the state of the sample, it is possible to evaluate it insolid, liquid, or powder forms. �e current trend is tocontinue exploring di�erent applications, de�ning theconcentration of foodstu� components, di�erentiating themand evaluating the quality of them in relation to the addedchemicals (harmful) or phytochemicals (favourable to hu-man health) identi�ed at certain wavelengths, depending onthe absorbance centres of the substances contained therein.Application PAS portable systems in the sanitary quality(fungi, mycotoxins, etc.) and safety of foodstu� will berelevant in the coming years.
On the other hand, thanks to technological advances, it ispossible to replace xenon lamps with white light LEDs, RGB,or arrangements of switched LEDs or only LEDs at speci�cwavelengths. Also, the use of laser diodes allows an im-proved function in di�erent PAS applications.
Regarding photoacoustic cells, on the other hand, onewould expect and is already venturing into the creation ofphotoacoustic cells with methodologies for rapid proto-typing as 3D printing. �is will reduce the time of con-struction and particularized designs for di�erent speci�capplications. An important trend, in which some research
groups are already working, is in the replacement of thelock-in through controller cards and a laptop for the ac-quisition of data.
According to the aforementioned, this would lead to theportability of photoacoustic spectroscopy systems and to thecost reduction, making the technique available to interestedpeople, who could have a support system in the evaluation offoodstu� quality, resulting in a better decision for theconsumption of food and impacting people’s quality life,without forgetting the possible incursion of PAS, in theinternet of things, with the advancement in technology.�erefore, PAS can be technologically updated, and in thisway it can be applied to speci�c needs and continue its use,rescuing an old proposal to the new necessities of our time inthe real world. In this sense, it is necessary to be aware of theneed to generate knowledge in this area in a transdisciplinaryperspective, among institutions, researchers, and society, toproduce results in improving the quality of people’s life.
2. Conclusions
According to the present review of the scienti�c literature, itis possible to glimpse the technology of photoacousticspectroscopy, an old technology with ample potential fornew applications in food agroindustry. PAS is an alternativetechnology to face the problem of evaluating food to
900
850
800
750
700
650
600
550
500
450
400
350
300
250
200
Wav
elen
gth
(nm
)
Beta
caro
tene
Zeax
anth
inCr
ypto
xant
hin
Caps
orub
inCa
psan
thin
Ant
hocy
anin
sFl
avon
oid
Lyco
pene
Que
rcet
inPh
enol
ic ac
ids
p-H
ydro
xybe
nzoi
c aci
dG
allic
acid
Prot
ein
Chlo
roph
ylls
Chlo
rella
Caffe
ine
Pero
xide
Soyb
ean
oil
Ferr
oglu
cona
teH
erbi
cide
sLi
gnin
com
pone
nts
Cyan
ine
Cel
lulo
seLe
ad te
troxi
deAl
tern
aria
triti
cina
Helm
inth
ospo
rium
sativ
um
Milk
caro
teno
ids
Rutin
Carb
oxyl
ates
and
amin
esA
rom
atic
amin
o ac
ids
Phen
olic
cont
ent
Caro
teno
ids
Lute
in
232 to 700 nm202 to 900 nm180 to 545 nm
280 to 680 nm300 to 650 nm400 to 752 nm
350 to 752 nm477 to 478 nm478
Figure 1: Peaks or region obtained by photoacoustic spectroscopy in the analysis of some food or plants.
Journal of Spectroscopy 29
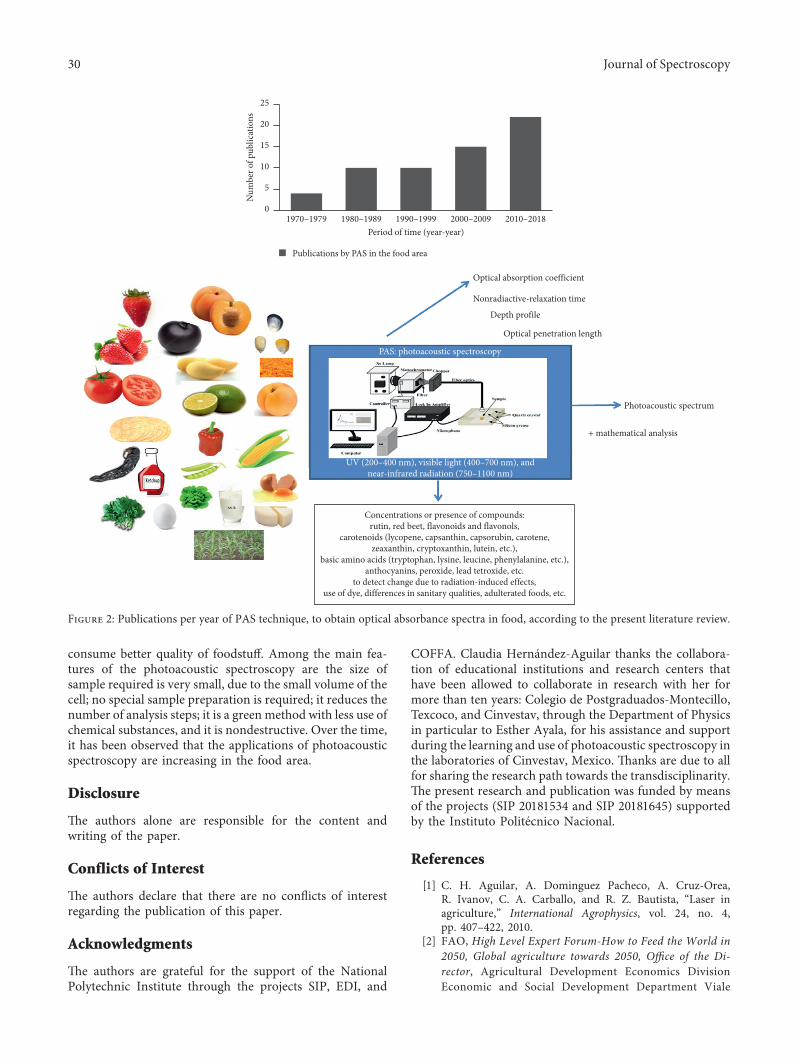
consume better quality of foodstu�. Among the main fea-tures of the photoacoustic spectroscopy are the size ofsample required is very small, due to the small volume of thecell; no special sample preparation is required; it reduces thenumber of analysis steps; it is a green method with less use ofchemical substances, and it is nondestructive. Over the time,it has been observed that the applications of photoacousticspectroscopy are increasing in the food area.
Disclosure
�e authors alone are responsible for the content andwriting of the paper.
Conflicts of Interest
�e authors declare that there are no con�icts of interestregarding the publication of this paper.
Acknowledgments
�e authors are grateful for the support of the NationalPolytechnic Institute through the projects SIP, EDI, and
COFFA. Claudia Hernandez-Aguilar thanks the collabora-tion of educational institutions and research centers thathave been allowed to collaborate in research with her formore than ten years: Colegio de Postgraduados-Montecillo,Texcoco, and Cinvestav, through the Department of Physicsin particular to Esther Ayala, for his assistance and supportduring the learning and use of photoacoustic spectroscopy inthe laboratories of Cinvestav, Mexico. �anks are due to allfor sharing the research path towards the transdisciplinarity.�e present research and publication was funded by meansof the projects (SIP 20181534 and SIP 20181645) supportedby the Instituto Politecnico Nacional.
References
[1] C. H. Aguilar, A. Dominguez Pacheco, A. Cruz-Orea,R. Ivanov, C. A. Carballo, and R. Z. Bautista, “Laser inagriculture,” International Agrophysics, vol. 24, no. 4,pp. 407–422, 2010.
[2] FAO, High Level Expert Forum-How to Feed the World in2050, Global agriculture towards 2050, O�ce of the Di-rector, Agricultural Development Economics DivisionEconomic and Social Development Department Viale
Optical absorption coefficient
Optical penetration length
Nonradiactive-relaxation time
Depth profile
Photoacoustic spectrum
+ mathematical analysis
Concentrations or presence of compounds:rutin, red beet, flavonoids and flavonols,
carotenoids (lycopene, capsanthin, capsorubin, carotene,zeaxanthin, cryptoxanthin, lutein, etc.),
basic amino acids (tryptophan, lysine, leucine, phenylalanine, etc.),anthocyanins, peroxide, lead tetroxide, etc.
to detect change due to radiation-induced effects,use of dye, differences in sanitary qualities, adulterated foods, etc.
PAS: photoacoustic spectroscopy
UV (200–400 nm), visible light (400–700 nm), andnear-infrared radiation (750–1100 nm)
Publications by PAS in the food area
1980–1989 1990–1999 2000–2009 2010–20181970–1979Period of time (year-year)
0
5
10
15
20
25
Num
ber o
f pub
licat
ions
Figure 2: Publications per year of PAS technique, to obtain optical absorbance spectra in food, according to the present literature review.
30 Journal of Spectroscopy
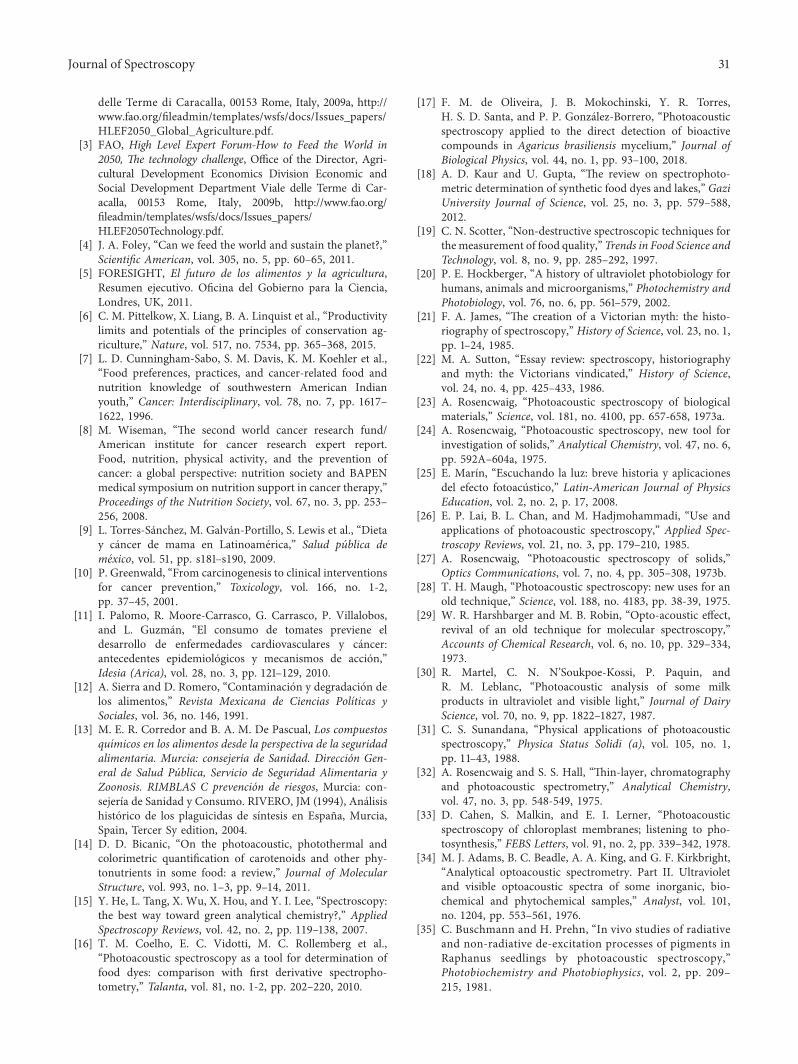
delle Terme di Caracalla, 00153 Rome, Italy, 2009a, http://www.fao.org/fileadmin/templates/wsfs/docs/Issues_papers/HLEF2050_Global_Agriculture.pdf.
[3] FAO, High Level Expert Forum-How to Feed the World in2050, @e technology challenge, Office of the Director, Agri-cultural Development Economics Division Economic andSocial Development Department Viale delle Terme di Car-acalla, 00153 Rome, Italy, 2009b, http://www.fao.org/fileadmin/templates/wsfs/docs/Issues_papers/HLEF2050Technology.pdf.
[4] J. A. Foley, “Can we feed the world and sustain the planet?,”Scientific American, vol. 305, no. 5, pp. 60–65, 2011.
[5] FORESIGHT, El futuro de los alimentos y la agricultura,Resumen ejecutivo. Oficina del Gobierno para la Ciencia,Londres, UK, 2011.
[6] C. M. Pittelkow, X. Liang, B. A. Linquist et al., “Productivitylimits and potentials of the principles of conservation ag-riculture,” Nature, vol. 517, no. 7534, pp. 365–368, 2015.
[7] L. D. Cunningham-Sabo, S. M. Davis, K. M. Koehler et al.,“Food preferences, practices, and cancer-related food andnutrition knowledge of southwestern American Indianyouth,” Cancer: Interdisciplinary, vol. 78, no. 7, pp. 1617–1622, 1996.
[8] M. Wiseman, “.e second world cancer research fund/American institute for cancer research expert report.Food, nutrition, physical activity, and the prevention ofcancer: a global perspective: nutrition society and BAPENmedical symposium on nutrition support in cancer therapy,”Proceedings of the Nutrition Society, vol. 67, no. 3, pp. 253–256, 2008.
[9] L. Torres-Sanchez, M. Galvan-Portillo, S. Lewis et al., “Dietay cancer de mama en Latinoamerica,” Salud publica demexico, vol. 51, pp. s181–s190, 2009.
[10] P. Greenwald, “From carcinogenesis to clinical interventionsfor cancer prevention,” Toxicology, vol. 166, no. 1-2,pp. 37–45, 2001.
[11] I. Palomo, R. Moore-Carrasco, G. Carrasco, P. Villalobos,and L. Guzman, “El consumo de tomates previene eldesarrollo de enfermedades cardiovasculares y cancer:antecedentes epidemiologicos y mecanismos de accion,”Idesia (Arica), vol. 28, no. 3, pp. 121–129, 2010.
[12] A. Sierra and D. Romero, “Contaminacion y degradacion delos alimentos,” Revista Mexicana de Ciencias Polıticas ySociales, vol. 36, no. 146, 1991.
[13] M. E. R. Corredor and B. A. M. De Pascual, Los compuestosquımicos en los alimentos desde la perspectiva de la seguridadalimentaria. Murcia: consejerıa de Sanidad. Direccion Gen-eral de Salud Publica, Servicio de Seguridad Alimentaria yZoonosis. RIMBLAS C prevencion de riesgos, Murcia: con-sejerıa de Sanidad y Consumo. RIVERO, JM (1994), Analisishistorico de los plaguicidas de sıntesis en España, Murcia,Spain, Tercer Sy edition, 2004.
[14] D. D. Bicanic, “On the photoacoustic, photothermal andcolorimetric quantification of carotenoids and other phy-tonutrients in some food: a review,” Journal of MolecularStructure, vol. 993, no. 1–3, pp. 9–14, 2011.
[15] Y. He, L. Tang, X. Wu, X. Hou, and Y. I. Lee, “Spectroscopy:the best way toward green analytical chemistry?,” AppliedSpectroscopy Reviews, vol. 42, no. 2, pp. 119–138, 2007.
[16] T. M. Coelho, E. C. Vidotti, M. C. Rollemberg et al.,“Photoacoustic spectroscopy as a tool for determination offood dyes: comparison with first derivative spectropho-tometry,” Talanta, vol. 81, no. 1-2, pp. 202–220, 2010.
[17] F. M. de Oliveira, J. B. Mokochinski, Y. R. Torres,H. S. D. Santa, and P. P. Gonzalez-Borrero, “Photoacousticspectroscopy applied to the direct detection of bioactivecompounds in Agaricus brasiliensis mycelium,” Journal ofBiological Physics, vol. 44, no. 1, pp. 93–100, 2018.
[18] A. D. Kaur and U. Gupta, “.e review on spectrophoto-metric determination of synthetic food dyes and lakes,” GaziUniversity Journal of Science, vol. 25, no. 3, pp. 579–588,2012.
[19] C. N. Scotter, “Non-destructive spectroscopic techniques forthemeasurement of food quality,” Trends in Food Science andTechnology, vol. 8, no. 9, pp. 285–292, 1997.
[20] P. E. Hockberger, “A history of ultraviolet photobiology forhumans, animals and microorganisms,” Photochemistry andPhotobiology, vol. 76, no. 6, pp. 561–579, 2002.
[21] F. A. James, “.e creation of a Victorian myth: the histo-riography of spectroscopy,” History of Science, vol. 23, no. 1,pp. 1–24, 1985.
[22] M. A. Sutton, “Essay review: spectroscopy, historiographyand myth: the Victorians vindicated,” History of Science,vol. 24, no. 4, pp. 425–433, 1986.
[23] A. Rosencwaig, “Photoacoustic spectroscopy of biologicalmaterials,” Science, vol. 181, no. 4100, pp. 657-658, 1973a.
[24] A. Rosencwaig, “Photoacoustic spectroscopy, new tool forinvestigation of solids,” Analytical Chemistry, vol. 47, no. 6,pp. 592A–604a, 1975.
[25] E. Marın, “Escuchando la luz: breve historia y aplicacionesdel efecto fotoacustico,” Latin-American Journal of PhysicsEducation, vol. 2, no. 2, p. 17, 2008.
[26] E. P. Lai, B. L. Chan, and M. Hadjmohammadi, “Use andapplications of photoacoustic spectroscopy,” Applied Spec-troscopy Reviews, vol. 21, no. 3, pp. 179–210, 1985.
[27] A. Rosencwaig, “Photoacoustic spectroscopy of solids,”Optics Communications, vol. 7, no. 4, pp. 305–308, 1973b.
[28] T. H. Maugh, “Photoacoustic spectroscopy: new uses for anold technique,” Science, vol. 188, no. 4183, pp. 38-39, 1975.
[29] W. R. Harshbarger and M. B. Robin, “Opto-acoustic effect,revival of an old technique for molecular spectroscopy,”Accounts of Chemical Research, vol. 6, no. 10, pp. 329–334,1973.
[30] R. Martel, C. N. N’Soukpoe-Kossi, P. Paquin, andR. M. Leblanc, “Photoacoustic analysis of some milkproducts in ultraviolet and visible light,” Journal of DairyScience, vol. 70, no. 9, pp. 1822–1827, 1987.
[31] C. S. Sunandana, “Physical applications of photoacousticspectroscopy,” Physica Status Solidi (a), vol. 105, no. 1,pp. 11–43, 1988.
[32] A. Rosencwaig and S. S. Hall, “.in-layer, chromatographyand photoacoustic spectrometry,” Analytical Chemistry,vol. 47, no. 3, pp. 548-549, 1975.
[33] D. Cahen, S. Malkin, and E. I. Lerner, “Photoacousticspectroscopy of chloroplast membranes; listening to pho-tosynthesis,” FEBS Letters, vol. 91, no. 2, pp. 339–342, 1978.
[34] M. J. Adams, B. C. Beadle, A. A. King, and G. F. Kirkbright,“Analytical optoacoustic spectrometry. Part II. Ultravioletand visible optoacoustic spectra of some inorganic, bio-chemical and phytochemical samples,” Analyst, vol. 101,no. 1204, pp. 553–561, 1976.
[35] C. Buschmann and H. Prehn, “In vivo studies of radiativeand non-radiative de-excitation processes of pigments inRaphanus seedlings by photoacoustic spectroscopy,”Photobiochemistry and Photobiophysics, vol. 2, pp. 209–215, 1981.
Journal of Spectroscopy 31
[36] C. Buschmann and H. Prehn, “In vivo photoacoustic spectraof raphanus and tradescantia leaves taken at differentchopping frequencies of the excitation light,” Photo-biochemistry and Photobiophysics, vol. 5, pp. 63–69, 1983.
[37] E. P. O’Hara, R. D. Tom, and T. A. Moore, “Determination ofthe in vivo absorption and photosynthetic properties of thelichen acarospora schleicheri using photo acoustic spec-troscopy,” Photochemistry and Photobiology, vol. 38, no. 6,pp. 709–715, 1983.
[38] C. N. N’Soukpoe-Kossi, R. Martel, R. M. Leblanc, andP. Paquin, “Kinetic study of Maillard reactions in milkpowder by photoacoustic spectroscopy,” Journal of Agri-cultural and Food Chemistry, vol. 36, no. 3, pp. 497–501,1988.
[39] O. Doka, J. Kispeter, and A. Lorincz, “Potential value ofphotoacoustic spectroscopy for determining iron content ofmilk protein concentrates,” Journal of Dairy Research,vol. 58, no. 4, pp. 453–460, 1991.
[40] O. Doka, D. Bicanic, and R. Frankhuizen, “Photoacousticstudy of heated binary mixtures containing whey andskimmed-milk powders,” Zeitschrift fur Leb-ensmitteluntersuchung und-Forschung A, vol. 208, no. 1,pp. 1–5, 1999.
[41] O. Doka, Z. Ajtony, D. Bicanic, and R. Koehorst, “Assessingthe extent of degradation in the UV radiation and heat-catalyzed oxidized whole milk powder: the UV photo-acoustic and diffuse reflectance spectroscopies versus theperoxide value,” Applied Spectroscopy, vol. 54, no. 9,pp. 1405–1408, 2000.
[42] O. Doka, J. Kispeter, and D. Bicanic, “.e photoacousticassessment of 60Co irradiation induced effects in eggpowders: results in the uv and visible,” InstrumentationScience and Technology, vol. 25, no. 4, pp. 297–306, 1997.
[43] O. Doka, D. Bicanic, and L. Szollosy, “Rapid and grossscreening for Pb3O4 adulterant in ground sweet red paprikaby means of photoacoustic spectroscopy,” Instrumentationscience and technology, vol. 26, no. 2-3, pp. 203–208, 1998.
[44] D. Bicanic, J. Swarts, S. Luterotti, P. Helander, V. Fogliano,and M. Anese, “Optothermistor as a breakthrough in thequantification of lycopene content of thermally processedtomato-based food: verification versus absorption spectro-photometry and high-performance liquid chromatography,”Journal of Agricultural and Food Chemistry, vol. 53, no. 9,pp. 3295–3299, 2005.
[45] D. Bicanic, inInstrumental Laser Techniques Based on thePhotothermal Phenomena and their Applications for theCharacterization of Food Melanoidins in Food and Health,Vol. 85, Laboratory of Biophysics, Wageningen, Nether-lands, 2003.
[46] A. Domınguez-Pacheco, C. Hernandez-Aguilar, andA. Cruz-Orea, “Photoacoustic determination of non-radiative relaxation time of absorbing centers in maizeseeds,” International Journal of @ermophysics, vol. 38, no. 7,p. 111, 2017.
[47] C. H. Aguilar, A. Domınguez-Pacheco, A. Cruz-Orea, andR. Zepeda-Bautista, “Depth profiles in maize (Zea mays L.)seeds studied by photoacoustic spectroscopy,” InternationalJournal of @ermophysics, vol. 36, no. 5-6, pp. 891–899, 2015.
[48] R. R. Molina, C. H. Aguilar, A. D. Pacheco, A. Cruz-Orea,andM. A. Canseco, “Alternative method to characterize corngrain by means of photoacoustic spectroscopy,” In-ternational Journal of @ermophysics, vol. 34, no. 8-9,pp. 1540–1548, 2013.
[49] O. Doka, A. Brunori, R. Schmidt, D. Bicanic, and G. Vegvari,“Rutin in buckwheat grain meal determined by UV pho-toacoustic spectroscopy and HPLC,”Nova Biotechnologica etChimica, vol. 16, no. 1, pp. 61–67, 2017.
[50] R. R. Molina, C. H. Aguilar, A. D. Pacheco, A. Cruz-Orea,and J. L. Bonilla, “Characterization of maize grains withdifferent pigmentation investigated by photoacoustic spec-troscopy,” International Journal of @ermophysics, vol. 35,no. 9-10, pp. 1933–1939, 2014.
[51] A. D. Pacheco, C. H. Aguilar, A. C. Orea et al., “Evaluation ofwheat and maize seeds by photoacoustic microscopy,” In-ternational Journal of @ermophysics, vol. 30, no. 6,pp. 2036–2043, 2009.
[52] J. P. Favier, J. Buijs, A. Miklos, A. Lorincz, and D. Bicanic,“Photoacoustic characterization of different food samplesPhotoakustische Charakterisierung von verschiedenenLebensmitteln,” Zeitschrift fur Lebensmittel-Untersuchungund Forschung, vol. 199, no. 1, pp. 59–63, 1994.
[53] O. Doka, D. D. Bicanic, M. H. Dicko, and M. A. Slingerland,“Photoacoustic approach to direct determination of the totalphenolic content in red sorghum flours,” Journal of Agri-cultural and Food Chemistry, vol. 52, no. 8, pp. 2133–2136,2004.
[54] R. Takai, K. Kanazawa, K. Murai et al., “.e determination ofwater contents in various powdered food by photoacousticspectroscopy (PAS),” Nippon Shokuhin Kogyo Gakkaishi,vol. 36, no. 3, pp. 189–194, 1989.
[55] C. H. Aguilar, F. A. Dominguez-Pacheco, A. Cruz-Orea et al.,“Optical absorption coefficient of different tortillas byphotoacoustic spectroscopy,” African Journal of Bio-technology, vol. 11, no. 92, pp. 15916–15922, 2012.
[56] R. J. D. S. Lima and J. S. Filho, “Carotenoids and flavonoidsidentification in brazilian tropical fruit and vegetables usingphotoacoustic technique,” Journal de Physique IV (Pro-ceedings), vol. 125, pp. 51–53, 2003.
[57] M. Bergevin, C. N. N’Soukpoe-Kossi, D. Charlebois,R. M. Leblanc, and C. Willemot, “Assessment of strawberrymaturity by photoacoustic spectroscopy,” Applied Spectros-copy, vol. 49, no. 3, pp. 397–399, 1995.
[58] G. P. Pardo, A. D. Pacheco, S. A. Tomas, A. Cruz Orea, andC. H. Aguilar, “Characterization of aged lettuce and chardseeds by photothermal techniques,” International Journal of@ermophysics, vol. 39, no. 10, p. 110, 2018.
[59] M. L. Neto, K. L. Agra, J. S. Filho, and F. E. Jorge, “TDDFTcalculations and photoacoustic spectroscopy experimentsused to identify phenolic acid functional biomolecules inBrazilian tropical fruit in natura,” Spectrochimica Acta PartA: Molecular and Biomolecular Spectroscopy, vol. 193,pp. 249–257, 2018.
[60] S. C. Corzo-Ruiz, F. Hernandez-Rosas, M. L. Alvarado-Noguez, J. Hernandez-Rosas, and A. Cruz-Orea, “Photo-acoustic Spectroscopy applied to the juice and rind char-acterization of Citrus latifolia with different quality ofsamples,” Superficies y Vacıo, vol. 31, no. 1, pp. 1–5, 2018.
[61] B. E. Zendejas-Leal, V. R. Barrientos-Sotelo, R. Cano-Casas,M. L. Alvarado-Noguez, J. Hernandez-Rosas, and A. Cruz-Orea, “Photoacoustic monitoring of absorption spectrumduring the dehydration process of pasilla chili pepper,”International Journal of @ermophysics, vol. 39, no. 7, p. 80,2018.
[62] C. L. Rodrıguez-Paez, A. Carballo-Carballo, R. Rico-Molinaet al., “.e optical absorption coefficient of maize grainsinvestigated by photoacoustic spectroscopy,” InternationalJournal of @ermophysics, vol. 38, no. 1, p. 11, 2017.
32 Journal of Spectroscopy
[63] C. H. Aguilar, F. A. D. Pacheco, A. C. Orea, andR. I. Tsonchev, “.ermal effects of laser irradiation on maizeseeds,” International Agrophysics, vol. 29, no. 2, pp. 147–156,2015.
[64] C. H. Aguilar, A. Domınguez-Pacheco, A. Cruz-Orea et al.,“Anticancer food: photoacoustic spectroscopy, the SciTech,”Journal of Science and Technology, vol. 4, no. 1, pp. 40–45,2015.
[65] V. R. Barrientos-Sotelo, R. Cano-Casas, A. Cruz-Orea,F. Hernandez-Rosas, and J. Hernandez-Rosas, “Photo-acoustic characterization of green, red and dehydratedCapsicum annuum l. variety pasilla,” Food Biophysics, vol. 10,no. 4, pp. 481–486, 2015.
[66] M. C. Perez Reyes, C. Hernandez-Aguilar, A. Dominguez-Pacheco, A. Cruz-Orea, and E. Moreno Martınez, “.eoptical absorption coefficient of barley seeds investigated byphotoacoustic spectroscopy and their effects by laser Bio-stimulation,” International Journal of @ermophysics, vol. 36,no. 9, pp. 2389–2400, 2015.
[67] O. Doka, D. Bicanic, and R. Kulcsar, “Direct estimate ofcocoa powder content in cakes by colorimetry and photo-acoustic spectroscopy,” International Journal of @ermo-physics, vol. 35, no. 12, pp. 2206–2214, 2014.
[68] G. Sanchez-Hernandez, C. Hernandez-Aguilar,A. Dominguez-Pacheco, A. Cruz-Orea, M. C. J. Perez-Reyes,and E.M.Martinez, “.e optical absorption coefficient of beanseeds investigated using photoacoustic spectroscopy,” In-ternational Journal of @ermophysics, vol. 36, no. 5-6,pp. 835–843, 2015.
[69] O. Doka, E. Pragai, D. Bicanic, R. Kulcsar, and Z. Ajtony,“Colorimetry and photoacoustic spectroscopy as a suitabletool for determination of fat-free cocoa solids in darkchocolates,” European Food Research and Technology,vol. 236, no. 6, pp. 963–968, 2013.
[70] C. H. Aguilar, A. Cruz-Orea, R. Ivanov et al., “.e opticalabsorption coefficient of maize seeds investigated by pho-toacoustic spectroscopy,” Food Biophysics, vol. 6, no. 4,pp. 481–486, 2011.
[71] A. J. G. Salcedo, F. G. Delgado, and F. Z. Rincon, “De-termination of adulterants in ground roasted coffee usingphotoacoustic technique,” Revista Colombiana de Fısica,vol. 44, no. 3, 2012.
[72] O. Doka, D. Bicanic, J. G. Buijnsters, R. Spruijt, S. Luterotti,and G. Vegvari, “Exploiting direct and indirect methods forthe estimation of the total carotenoid concentration in driedpastas,” European Food Research and Technology, vol. 230,no. 6, pp. 813–819, 2010.
[73] D. V. Rezende, O. A. C. Nunes, and A. C. Oliveira, “Pho-toacoustic study of fungal disease of acai (Euterpe oleracea)seeds,” International Journal of @ermophysics, vol. 30, no. 5,pp. 1616–1625, 2009.
[74] C. H. Aguilar, A. Dominguez-Pacheco, A. Cruz-Orea et al.,“Laser irradiation effects on field performance of maize seedgenotypes,” International Agrophysics, vol. 23, pp. 327–332,2009.
[75] C. H. Aguilar, M. Mezzalama, N. Lozano et al., “Opticalabsorption coefficient of laser irradiated wheat seeds de-termined by photoacoustic spectroscopy,” @e EuropeanPhysical Journal Special Topics, vol. 153, no. 1, pp. 519–522,2008.
[76] C. H. Aguilar, A. C. Carballo, A. Cruz-Orea, R. Ivanov, andA. Domınguez-Pacheco, “.e carotenoid content in seed-lings of maize seeds irradiated by a 650 nm diode laser:
qualitative photoacoustic study,” @e European PhysicalJournal Special Topics, vol. 153, no. 1, pp. 515–518, 2008.
[77] F. G. Delgado, F. Z. Rincon, and J. A. O. Vela, “Coffeecertification criterion using the photoacoustic technique,”Microelectronics Journal, vol. 39, no. 11, pp. 1331-1332, 2008.
[78] J. C. Kapil, P. K. Satyawali, and D. N. Sethi, “VIS–NIRovertone bands of snow: photoacoustic spectroscopy,” ColdRegions Science and Technology, vol. 43, no. 3, pp. 164–176,2005.
[79] C. H. Aguilar, A. Cruz-Orea, R. Ivanov, E. S. M. Martınez,and A.Michtchenko, “Photoacoustic spectroscopy applied tothe study of the influence of laser irradiation on corn seeds,”In Journal de Physique IV, (Proceedings), vol. 125, pp. 853–855, 2005.
[80] F. G. Delgado, J. A. Herrera-Cuartas, J. D. Duque-Ocampo,and H. Ariza-Calderon, “Estudio de la pigmentacion de cafeorganico con diferentes grados de humedad usandoespectroscopıa fotoacustica,” Revista Colombiana de Fısica,vol. 37, no. 1, p. 114, 2005.
[81] J. C. Kapil, S. K. Joshi, and A. K. Rai, “In situ photoacousticinvestigations of some optically transparent samples like iceand snow,” Review of Scientific Instruments, vol. 74, no. 7,pp. 3536–3543, 2003.
[82] V. Gupta, A. Kumar, G. K. Garg, and A. K. Rai, “Photo-acoustic spectroscopy for identification and differential di-agnosis of T. indica with other seed-borne pathogens ofwheat and rice,” Instrumentation Science and Technology,vol. 29, no. 4, pp. 283–293, 2001.
[83] R. A. M. Hernandez, A. Calderon, A. Cruz-Orea,F. S. Sinencio, S. A. Tomas, and G. Gonzalez de la Cruz,“Estudio de la influencia del Ca (OH) 2 en las pelıculas depericarpio de maız nixtamalizado mediante tecnicasfototermicas,” Superficies y Vacıo, vol. 8, pp. 80–85, 1999a.
[84] R. A. M. Hernandez, A. Calderon, A. Cruz-Orea,S. A. Tomas, F. S. Sinencio, and G. P. Rodriguez,“Caracterizacion optica de centros absorbentes en pelıculasbiopolimericas obtenidas de pericarpio de maız,” Superficiesy Vacıo, vol. 8, pp. 89–93, 1999b.
[85] C. A. Vinha and U. Haas, “Qualitative and semiquantitativeanalysis of dried fruit and seasoning products of paprikausing photoacoustic spectroscopy,” Journal of Agriculturaland Food Chemistry, vol. 45, no. 4, pp. 1273–1277, 1997.
[86] U. Haas and C. A. Vinha, “Qualitative and semiquantitativeanalysis of annatto and its content in food additives byphotoacoustic spectrometry,” Analyst, vol. 120, no. 2,pp. 351–354, 1995.
[87] M. V. Marquezini, N. Cella, E. C. Silva et al., “Photoacousticassessment of the in vivo genotypical response of corn totoxic Aluminium,”Analyst, vol. 115, no. 3, pp. 341–343, 1990.
[88] Z. Szigeti, E. M. Nagel, C. Buschmann, andH. K. Lichtenthaler, “In vivo photoacoustic spectra ofherbicide-treated bean leaves,” Journal of Plant Physiology,vol. 134, no. 1, pp. 104–109, 1989.
[89] J. W. Nery, O. Pessoa, H. Vargas et al., “Photoacousticspectroscopy for depth-profile analysis and herbicidemonitoring in leaves,” Analyst, vol. 112, no. 11, pp. 1487–1490, 1987.
[90] F. D. A. M. Reis, C. A. S. Lima, O. Pessoa, H. Vargas,J. G. Cortez, and A. M. G. Azevedo, “Water soluble com-ponents in coffee beans: photoacoustic assessment,”,”Journal of Food Science, vol. 51, no. 3, p. 849, 1986.
[91] C. A. Lima, H. Vargas, C. L. Cesar, M. B. Lima, L. M. Prioli,and W. J. Da Silva, “Non-destructive assessment ofchlorophyll-deficient mutants of maize (Zea mays L.) by
Journal of Spectroscopy 33
photoacoustic spectroscopy,” Plant Science, vol. 38, no. 1,pp. 47–51, 1985.
[92] X. Li, K. H. Brucher, W. Gortz, and H. H. Perkampus, “PA-spectroscopic investigation on flower petals,” Le Journal dePhysique Colloques, vol. 44, no. C6, p. 137, 1983.
[93] K. Veeranjaneyulu and V. S. R. Das, ““Photoacousticspectroscopy—leaf absorption spectra,” Journal of Experi-mental Botany, vol. 33, no. 3, pp. 515–519, 1982.
[94] J. M. Gould, “Characterization of lignin in situ by photo-acoustic spectroscopy,” Plant Physiology, vol. 70, no. 5,pp. 1521–1525, 1982.
[95] C. S. Mangolim, C. Moriwaki, A. C. Nogueira et al.,“Curcumin–β-cyclodextrin inclusion complex: stability,solubility, characterisation by FT-IR, FT-Raman, X-raydiffraction and photoacoustic spectroscopy and food ap-plication,” Food Chemistry, vol. 153, pp. 361–370, 2014.
[96] C. Haisch, “Photoacoustic spectroscopy for analyticalmeasurements,” Measurement Science and Technology,vol. 23, no. 1, article 012001, 2011.
[97] T. Schmid, “Photoacoustic spectroscopy for process analy-sis,” Analytical and Bioanalytical Chemistry, vol. 384, no. 5,pp. 1071–1086, 2006.
[98] A. K. Rai and J. P. Singh, “Perspective of photoacousticspectroscopy in disease diagnosis of plants: a review,” In-strumentation Science and Technology, vol. 31, no. 4,pp. 323–342, 2003.
[99] H. Singh, S. K. Joshi, S. Rathore, T. Joshi, M. G. H. Zaidi, andA. K. Rai, “Optical and thermal properties of Poly bis–phenol-A carbonate: photoacoustic study,” InstrumentationScience and Technology, vol. 31, no. 4, pp. 377–383, 2003.
[100] H. Singh, E. Rojas-Lima, F. A. Dominguez-Pacheco,C. Hernandez-Aguilar, L. M. Hernandez-Simon, and A. Cruz-Orea, “Kolmogorov-Smirnov test for statistical characteriza-tion of photopyroelectric signals obtained from maize seeds,”International Journal of @ermophysics, vol. 40, no. 1, p. 4,2018.
34 Journal of Spectroscopy

TribologyAdvances in
Hindawiwww.hindawi.com Volume 2018
Hindawiwww.hindawi.com Volume 2018
International Journal ofInternational Journal ofPhotoenergy
Hindawiwww.hindawi.com Volume 2018
Journal of
Chemistry
Hindawiwww.hindawi.com Volume 2018
Advances inPhysical Chemistry
Hindawiwww.hindawi.com
Analytical Methods in Chemistry
Journal of
Volume 2018
Bioinorganic Chemistry and ApplicationsHindawiwww.hindawi.com Volume 2018
SpectroscopyInternational Journal of
Hindawiwww.hindawi.com Volume 2018
Hindawi Publishing Corporation http://www.hindawi.com Volume 2013Hindawiwww.hindawi.com
The Scientific World Journal
Volume 2018
Medicinal ChemistryInternational Journal of
Hindawiwww.hindawi.com Volume 2018
NanotechnologyHindawiwww.hindawi.com Volume 2018
Journal of
Applied ChemistryJournal of
Hindawiwww.hindawi.com Volume 2018
Hindawiwww.hindawi.com Volume 2018
Biochemistry Research International
Hindawiwww.hindawi.com Volume 2018
Enzyme Research
Hindawiwww.hindawi.com Volume 2018
Journal of
SpectroscopyAnalytical ChemistryInternational Journal of
Hindawiwww.hindawi.com Volume 2018
MaterialsJournal of
Hindawiwww.hindawi.com Volume 2018
Hindawiwww.hindawi.com Volume 2018
BioMed Research International Electrochemistry
International Journal of
Hindawiwww.hindawi.com Volume 2018
Na
nom
ate
ria
ls
Hindawiwww.hindawi.com Volume 2018
Journal ofNanomaterials
Submit your manuscripts atwww.hindawi.com
Recommended