Embed Size (px)
Citation preview
D&B’s U.S. Economic Health TrackerMarch 2014
Paul Ballew, Chief Data & Analytics Officer, D&B
Tuesday, March 4, 2014 – 8:30 a.m.
Follow us on Twitter #DnBEconBrief
#DnBEconBrief
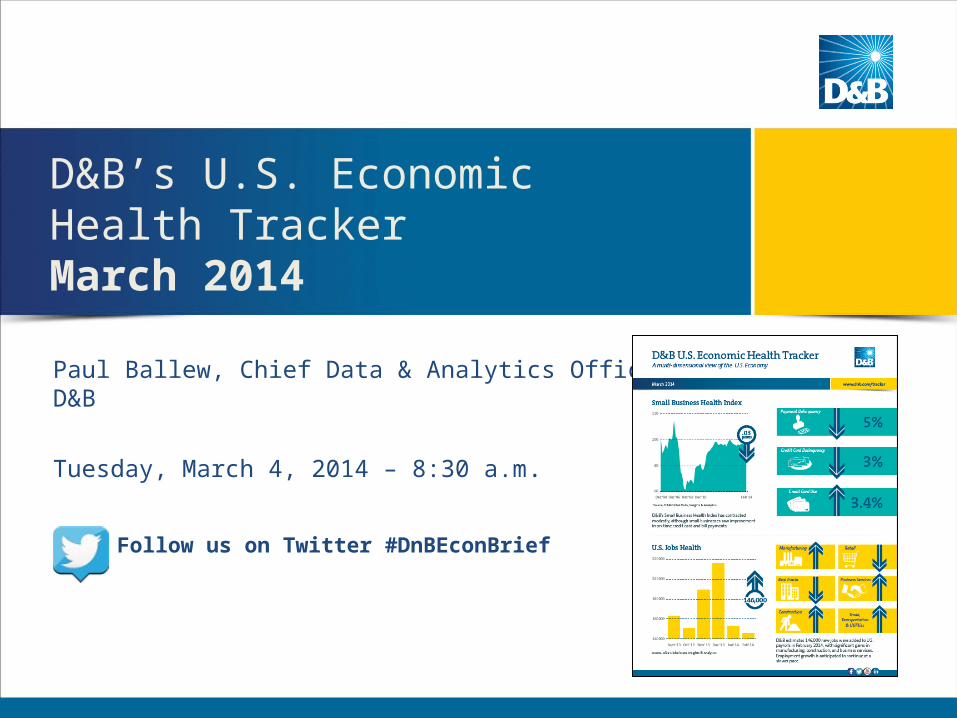
Small Business Health Index
• In February, Small Business Health Index (SBHI) showed additional softness in the small business sector, signaling some erosion in economic growth
• Wintry weather had a significant impact on small business performance• On a positive note the private sector healing process continues with
growing bright spots in the overall health of the small business community
2
#DnBEconBrief
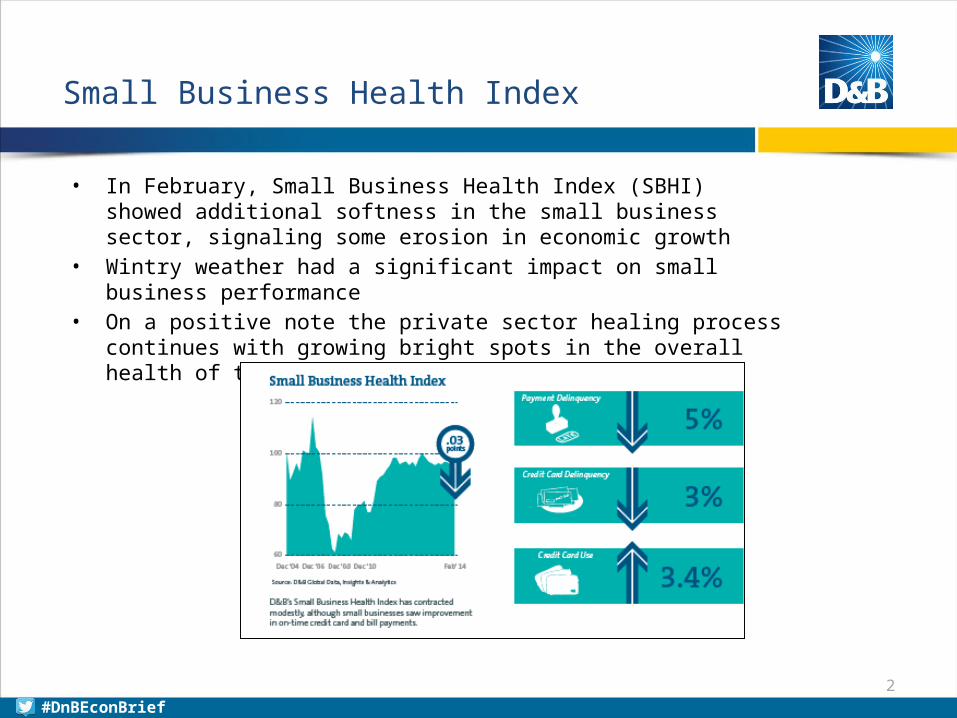
Economic slowdown is apparent…
• Key indicators including employment growth have signaled slowing economic activity in the recent months
• D&B’s SBHI, which remained fairly stable through the second half of 2013, has also declined
Jul 2012
Sep 2012
Nov 2012
Jan 2013
Mar 2013
May 2013
Jul 2013
Sep 2013
Nov 2013
Jan 20141.7%
1.8%
1.9%
2.0%
2.1%
2.2%
2.3%
90.0
92.0
94.0
96.0
98.0
100.0
102.0
Slowdown in SBHI and Employment Growth
Small Business Health Index: Overall (6 months prior, right)Nonfarm Private Payroll Employment, %YOY Change (left)
3
#DnBEconBrief
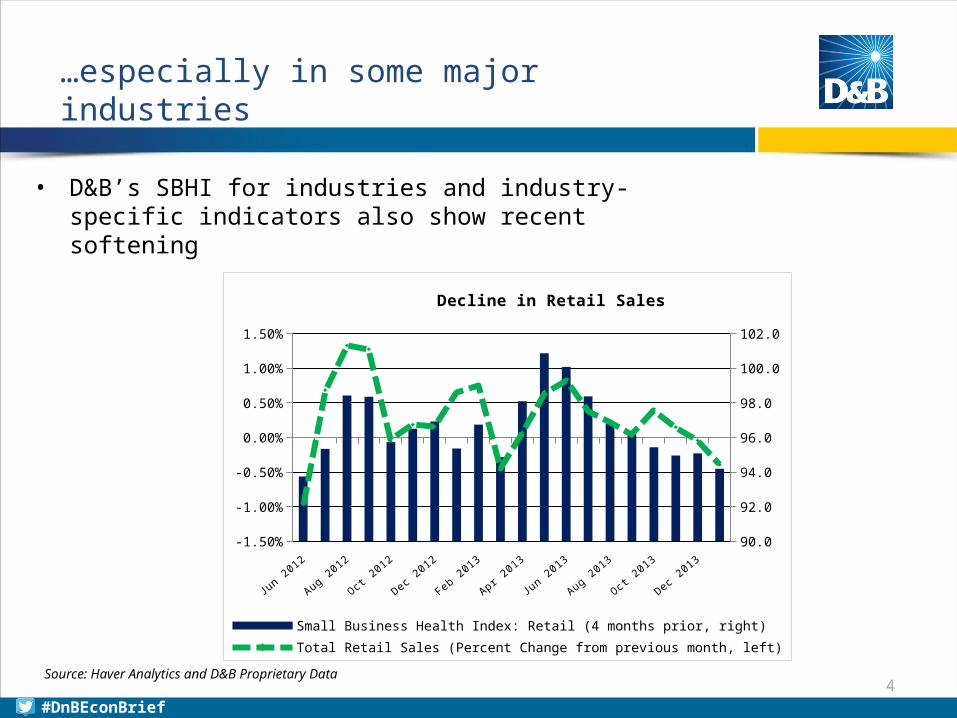
…especially in some major industries
• D&B’s SBHI for industries and industry-specific indicators also show recent softening
Source: Haver Analytics and D&B Proprietary Data
Jun 2012
Jul 2012
Aug 2012
Sep 2012
Oct 2012
Nov 2012
Dec 2012
Jan 2013
Feb 2013
Mar 2013
Apr 2013
May 2013
Jun 2013
Jul 2013
Aug 2013
Sep 2013
Oct 2013
Nov 2013
Dec 2013
Jan 2014-1.50%
-1.00%
-0.50%
0.00%
0.50%
1.00%
1.50%
90.0
92.0
94.0
96.0
98.0
100.0
102.0
Decline in Retail Sales
Small Business Health Index: Retail (4 months prior, right)Total Retail Sales (Percent Change from previous month, left)
4
#DnBEconBrief
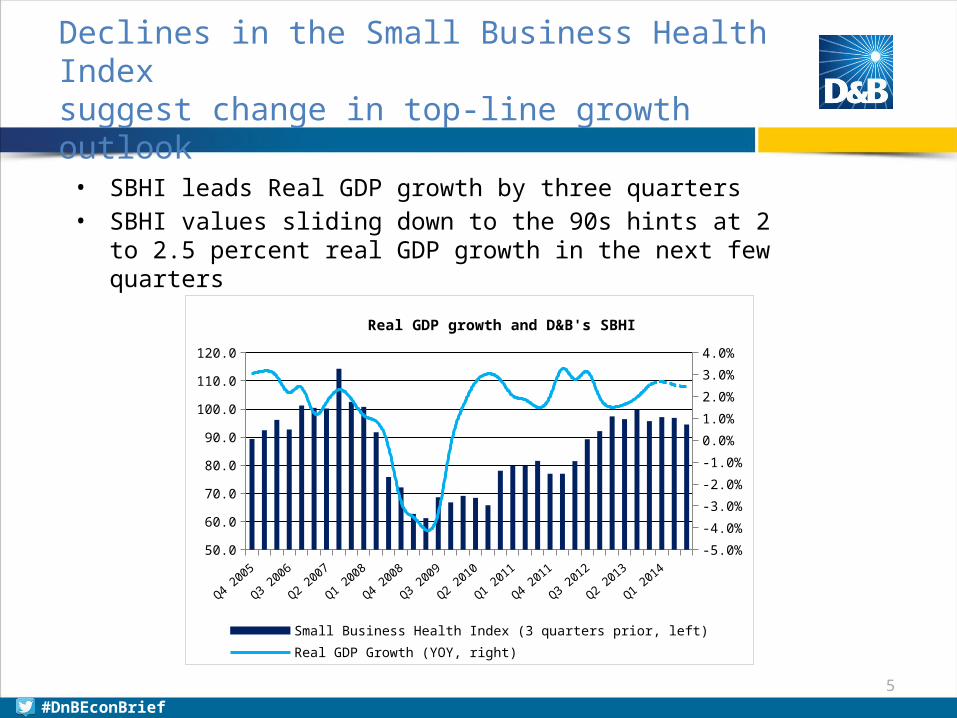
• SBHI leads Real GDP growth by three quarters • SBHI values sliding down to the 90s hints at 2 to 2.5 percent
real GDP growth in the next few quarters
Declines in the Small Business Health Index suggest change in top-line growth outlook
Q4 2005
Q2 2006
Q4 2006
Q2 2007
Q4 2007
Q2 2008
Q4 2008
Q2 2009
Q4 2009
Q2 2010
Q4 2010
Q2 2011
Q4 2011
Q2 2012
Q4 2012
Q2 2013
Q4 2013
Q2 201450.0
60.0
70.0
80.0
90.0
100.0
110.0
120.0
-5.0%
-4.0%
-3.0%
-2.0%
-1.0%
0.0%
1.0%
2.0%
3.0%
4.0%
Real GDP growth and D&B's SBHI
Small Business Health Index (3 quarters prior, left)Real GDP Growth (YOY, right)
5
#DnBEconBrief
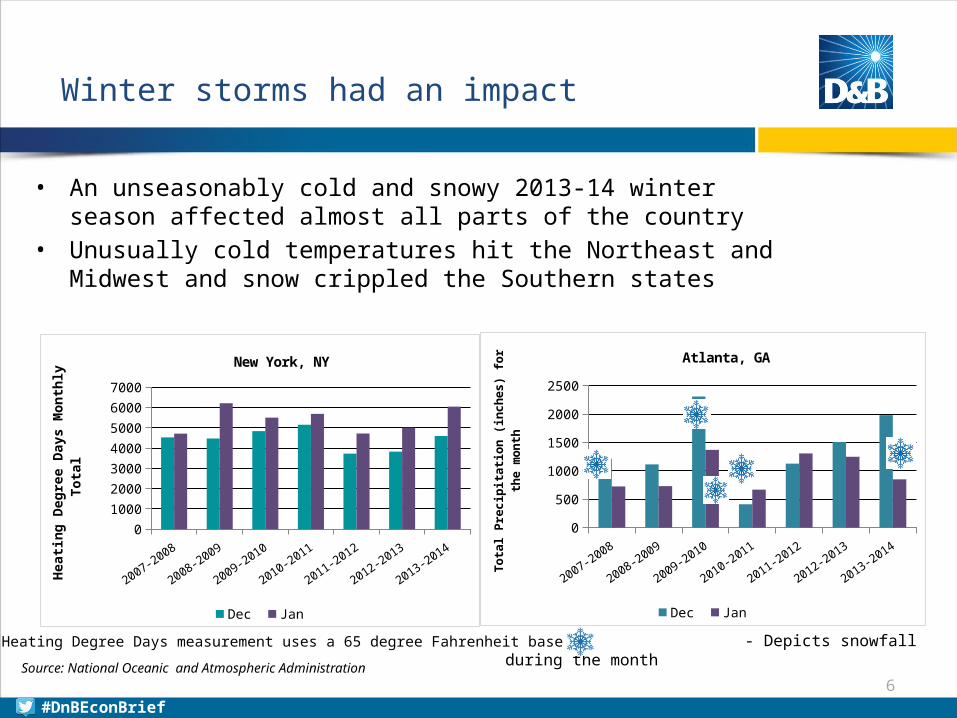
Winter storms had an impact
• An unseasonably cold and snowy 2013-14 winter season affected almost all parts of the country
• Unusually cold temperatures hit the Northeast and Midwest and snow crippled the Southern states
2007-2008
2008-2009
2009-2010
2010-2011
2011-2012
2012-2013
2013-20140
500
1000
1500
2000
2500
Atlanta, GA
Dec Jan
Tota
l Pre
cipi
tatio
n (in
ches
) for
the
mon
th
- Depicts snowfall during the month
2007-2008
2008-2009
2009-2010
2010-2011
2011-2012
2012-2013
2013-20140
1000
2000
3000
4000
5000
6000
7000
New York, NY
Dec Jan
Heati
ng D
egre
e Da
ys M
onth
ly T
otal
Heating Degree Days measurement uses a 65 degree Fahrenheit base
Source: National Oceanic and Atmospheric Administration6
#DnBEconBrief
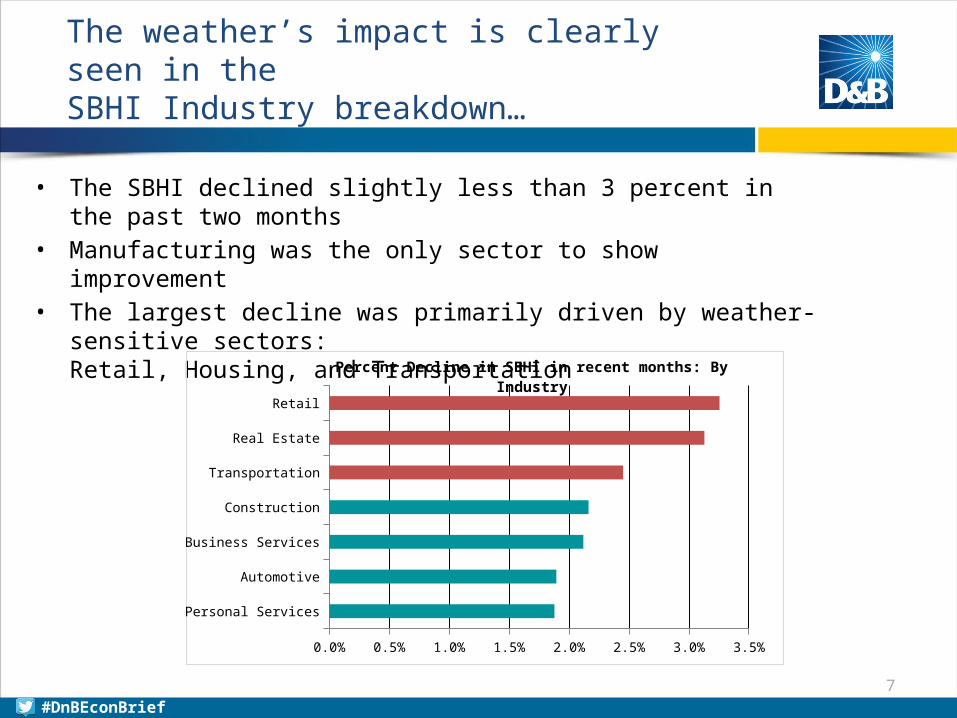
The weather’s impact is clearly seen in theSBHI Industry breakdown…
• The SBHI declined slightly less than 3 percent in the past two months• Manufacturing was the only sector to show improvement• The largest decline was primarily driven by weather-sensitive sectors:
Retail, Housing, and Transportation
Personal Services
Automotive
Business Services
Construction
Transportation
Real Estate
Retail
0.0% 0.5% 1.0% 1.5% 2.0% 2.5% 3.0% 3.5%
Percent Decline in SBHI in recent months: By Industry
7
#DnBEconBrief
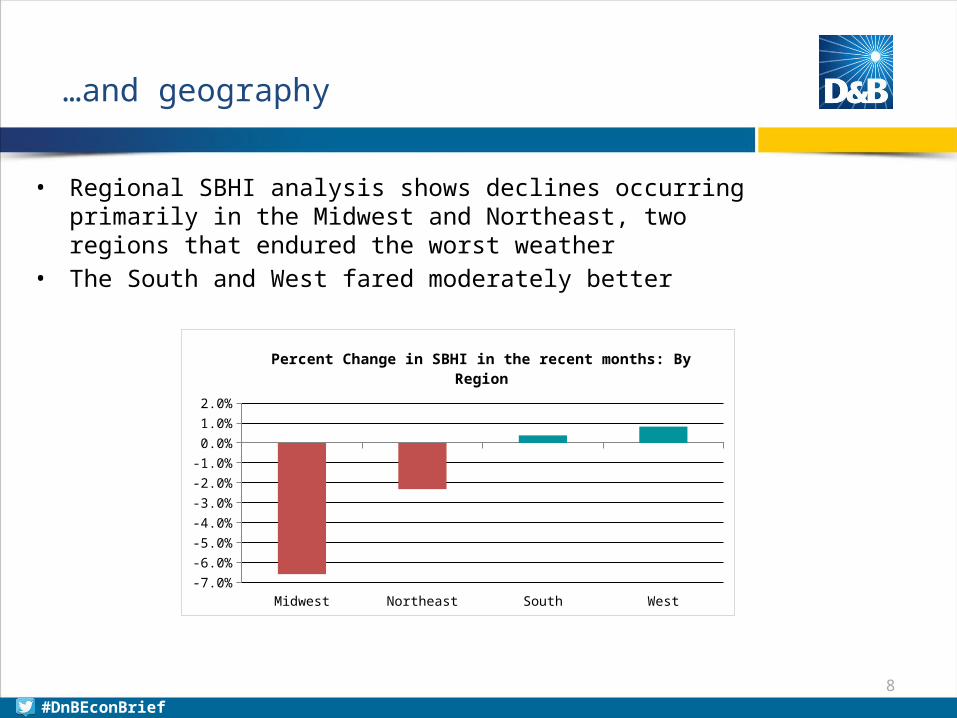
…and geography
• Regional SBHI analysis shows declines occurring primarily in the Midwest and Northeast, two regions that endured the worst weather
• The South and West fared moderately better
Midwest Northeast South West-7.0%
-6.0%
-5.0%
-4.0%
-3.0%
-2.0%
-1.0%
0.0%
1.0%
2.0%Percent Change in SBHI in the recent months: By Region
8
#DnBEconBrief
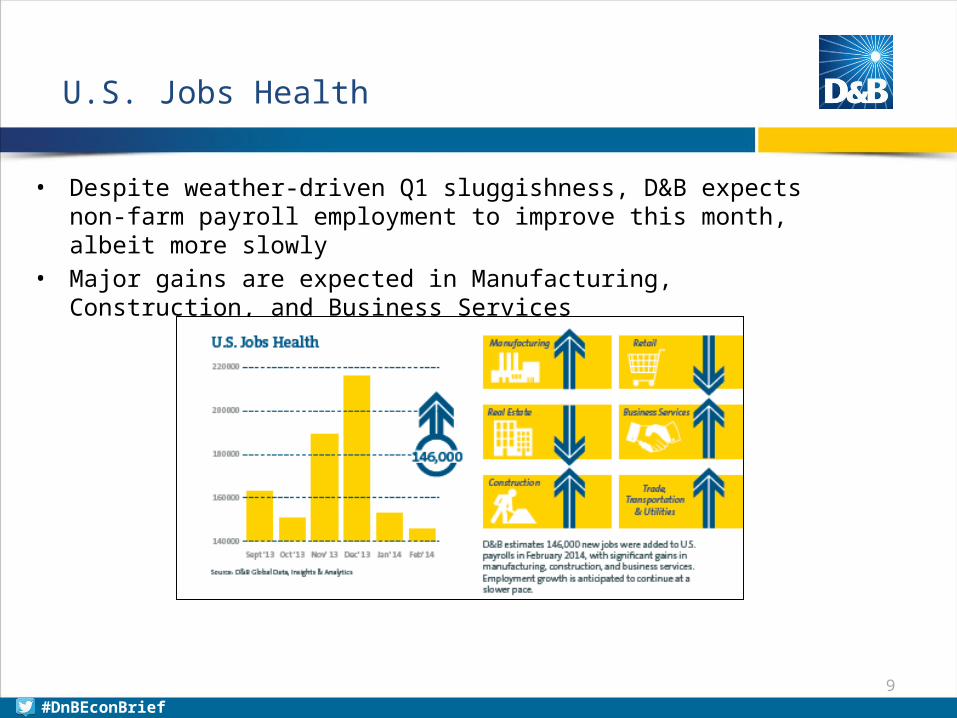
U.S. Jobs Health
• Despite weather-driven Q1 sluggishness, D&B expects non-farm payroll employment to improve this month, albeit more slowly
• Major gains are expected in Manufacturing, Construction, and Business Services
9
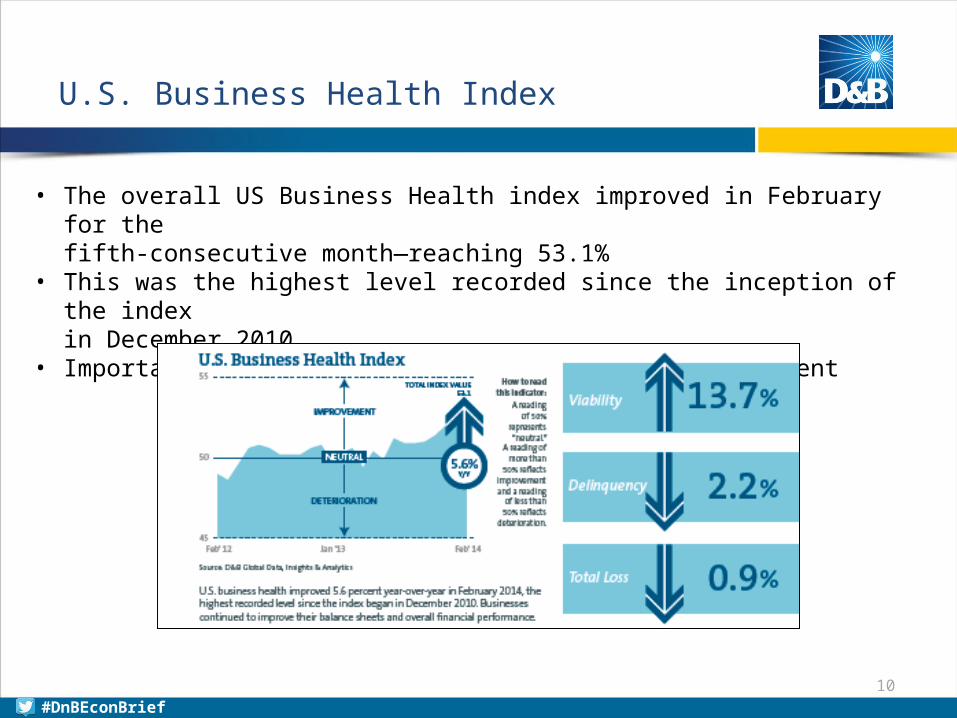
U.S. Business Health Index
• The overall US Business Health index improved in February for the fifth-consecutive month—reaching 53.1%
• This was the highest level recorded since the inception of the index in December 2010
• Importantly, small business is driving the improvement
#DnBEconBrief10
11
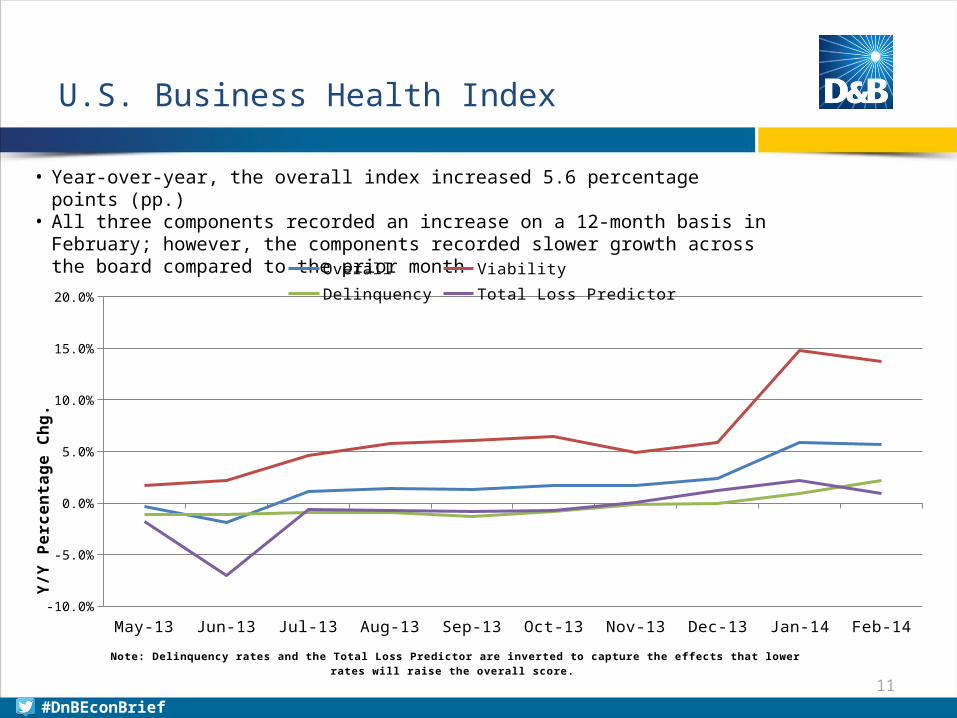
U.S. Business Health Index
• Year-over-year, the overall index increased 5.6 percentage points (pp.)• All three components recorded an increase on a 12-month basis in February; however,
the components recorded slower growth across the board compared to the prior month
May-13 Jun-13 Jul-13 Aug-13 Sep-13 Oct-13 Nov-13 Dec-13 Jan-14 Feb-14-10.0%
-5.0%
0.0%
5.0%
10.0%
15.0%
20.0%
Overall Viability Delinquency Total Loss Predictor
Note: Delinquency rates and the Total Loss Predictor are inverted to capture the effects that lower rates will raise the overall score.
Y/Y
Perc
enta
ge C
hg.
#DnBEconBrief
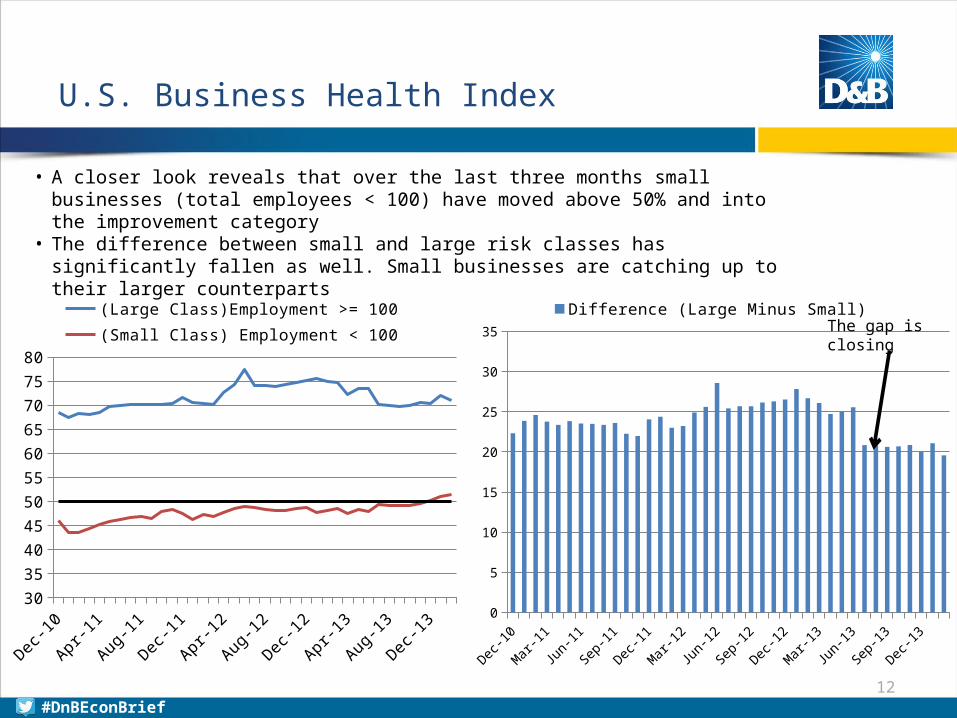
12
U.S. Business Health Index
• A closer look reveals that over the last three months small businesses (total employees < 100) have moved above 50% and into the improvement category
• The difference between small and large risk classes has significantly fallen as well. Small businesses are catching up to their larger counterparts
Dec-10
Mar-1
1Jun-11
Sep-11
Dec-11
Mar-1
2Jun-12
Sep-12
Dec-12
Mar-1
3Jun-13
Sep-13
Dec-13
30
35
40
45
50
55
60
65
70
75
80
(Large Class)Employment >= 100(Small Class) Employment < 100
Dec-10
Feb-11
Apr-11
Jun-11
Aug-11
Oct-11
Dec-11
Feb-12
Apr-12
Jun-12
Aug-12
Oct-12
Dec-12
Feb-13
Apr-13
Jun-13
Aug-13
Oct-13
Dec-13
Feb-14
0
5
10
15
20
25
30
35
Difference (Large Minus Small)The gap is closing
#DnBEconBrief
13
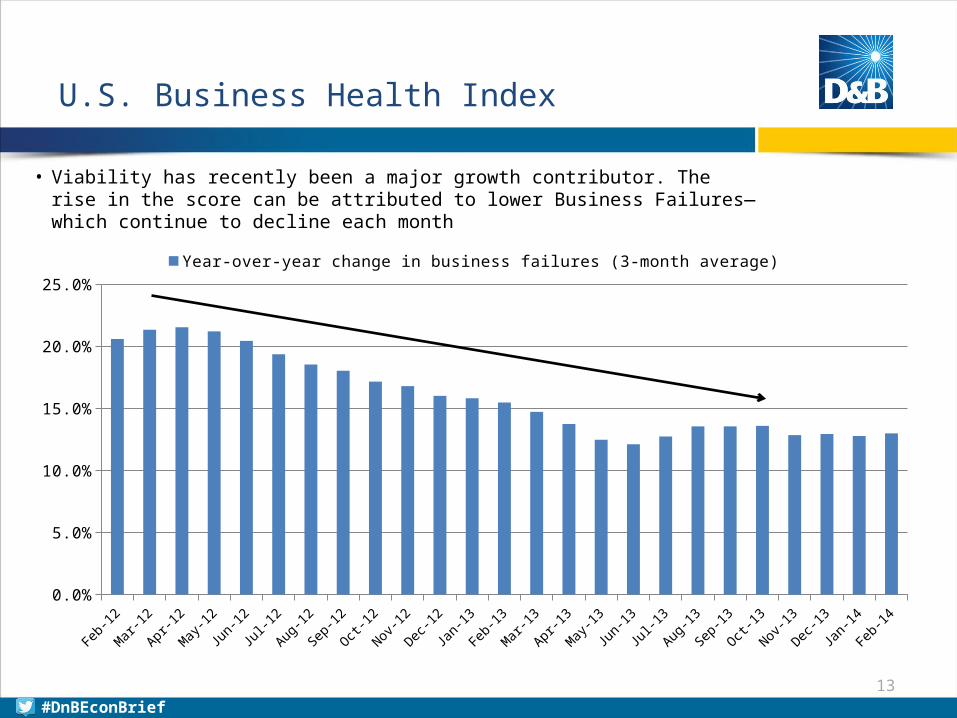
U.S. Business Health Index
• Viability has recently been a major growth contributor. The rise in the score can be attributed to lower Business Failures—which continue to decline each month
Feb-12
Mar-12
Apr-12
May-12
Jun-12Jul-1
2
Aug-12
Sep-12
Oct-12
Nov-12
Dec-12
Jan-13
Feb-13
Mar-13
Apr-13
May-13
Jun-13Jul-1
3
Aug-13
Sep-13
Oct-13
Nov-13
Dec-13
Jan-14
Feb-14
0.0%
5.0%
10.0%
15.0%
20.0%
25.0%
Year-over-year change in business failures (3-month average)
#DnBEconBrief
14
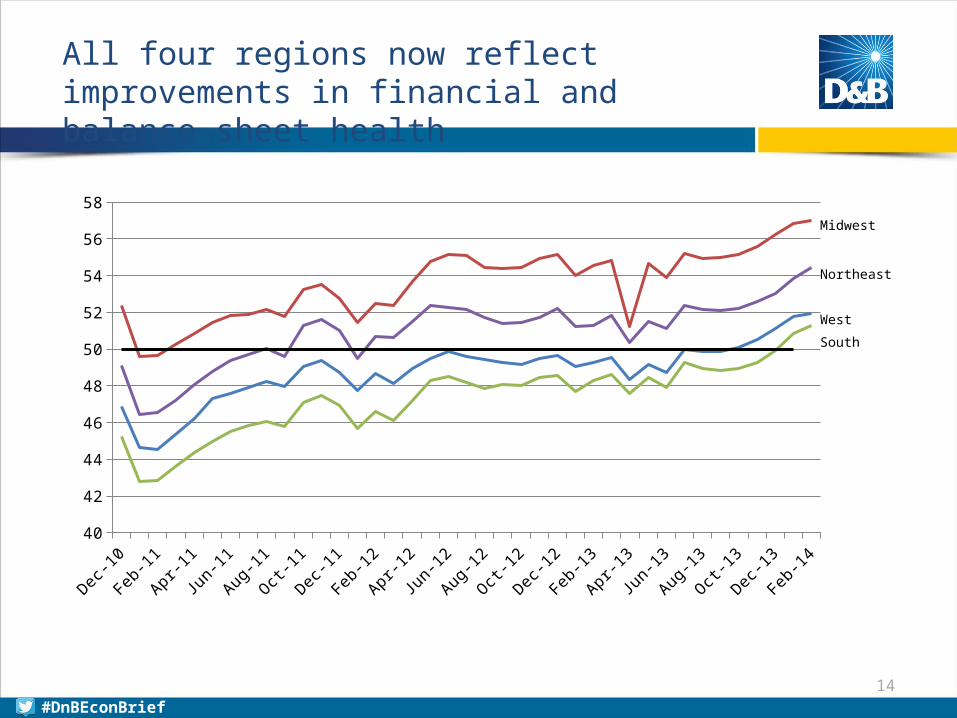
All four regions now reflect improvements in financial and balance sheet health
Dec-10
Feb-11
Apr-11
Jun-11
Aug-11
Oct-11
Dec-11
Feb-12
Apr-12
Jun-12
Aug-12
Oct-12
Dec-12
Feb-13
Apr-13
Jun-13
Aug-13
Oct-13
Dec-13
Feb-14
40
42
44
46
48
50
52
54
56
58
#DnBEconBrief
Midwest
Northeast
West
South
15
Summary
• D&B’s Small Business Health Index demonstrated additional erosion this month. However, it is clear that weather has played a factor and D&B will be tracking closely in the months ahead
• D&B expects non-farm payroll employment to edge up in February, although the impact of the slowdown (weather or otherwise) will dominate the numbers
• Despite tepid performance in the categories above, U.S. Business Health continued its upward climb in February. The financial and balance sheet health of the private sector remains a positive for the U.S. economy
#DnBEconBrief