Embed Size (px)
DESCRIPTION
Bangham, charles
Citation preview
Lymphocyte kinetics in HTLV-1 infection
Charles Bangham
Department of Immunology
Wright-Fleming Institute
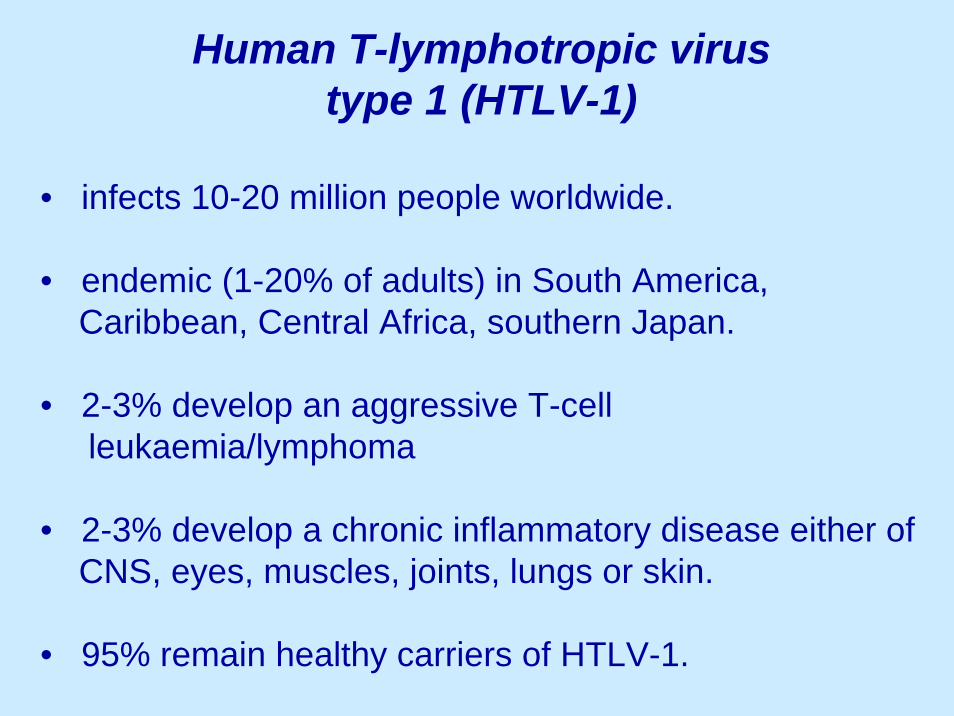
Human T-lymphotropic virustype 1 (HTLV-1)
• infects 10-20 million people worldwide.
• endemic (1-20% of adults) in South America, Caribbean, Central Africa, southern Japan.
• 2-3% develop an aggressive T-cell leukaemia/lymphoma
• 2-3% develop a chronic inflammatory disease either of CNS, eyes, muscles, joints, lungs or skin.
• 95% remain healthy carriers of HTLV-1.
HTLV-1 persistence and inflammatory disease
Three main questions:
1. How does HTLV-1 persist?
2. How does it spread?
3. Why do some develop HAM/TSP, whereas most remain healthy carriers?
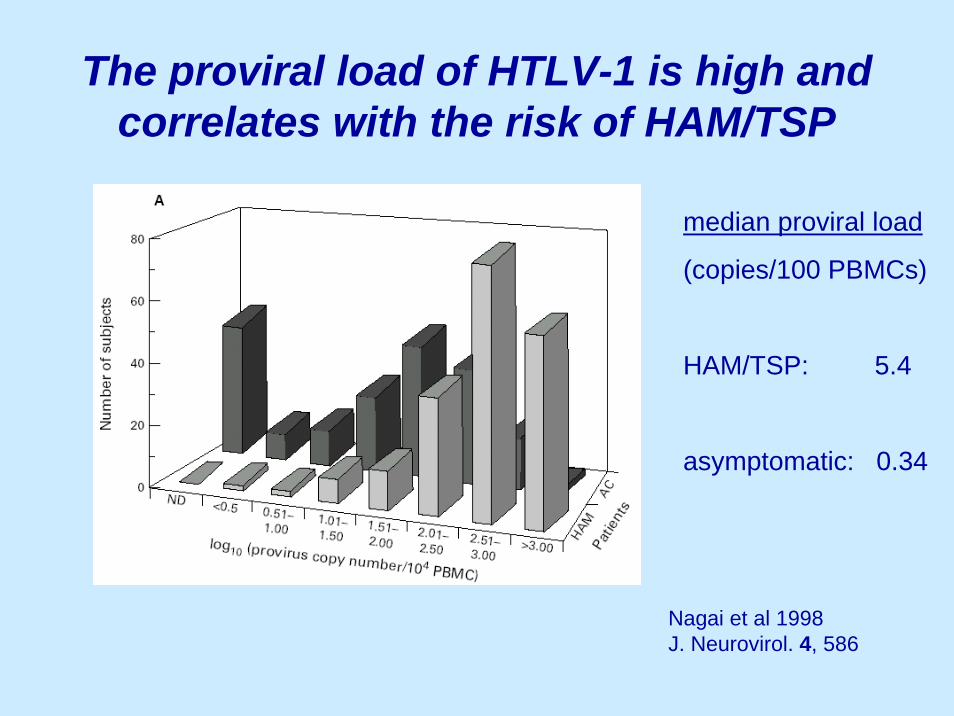
The proviral load of HTLV-1 is high and correlates with the risk of HAM/TSP
Nagai et al 1998 J. Neurovirol. 4, 586
median proviral load
(copies/100 PBMCs)
HAM/TSP: 5.4
asymptomatic: 0.34
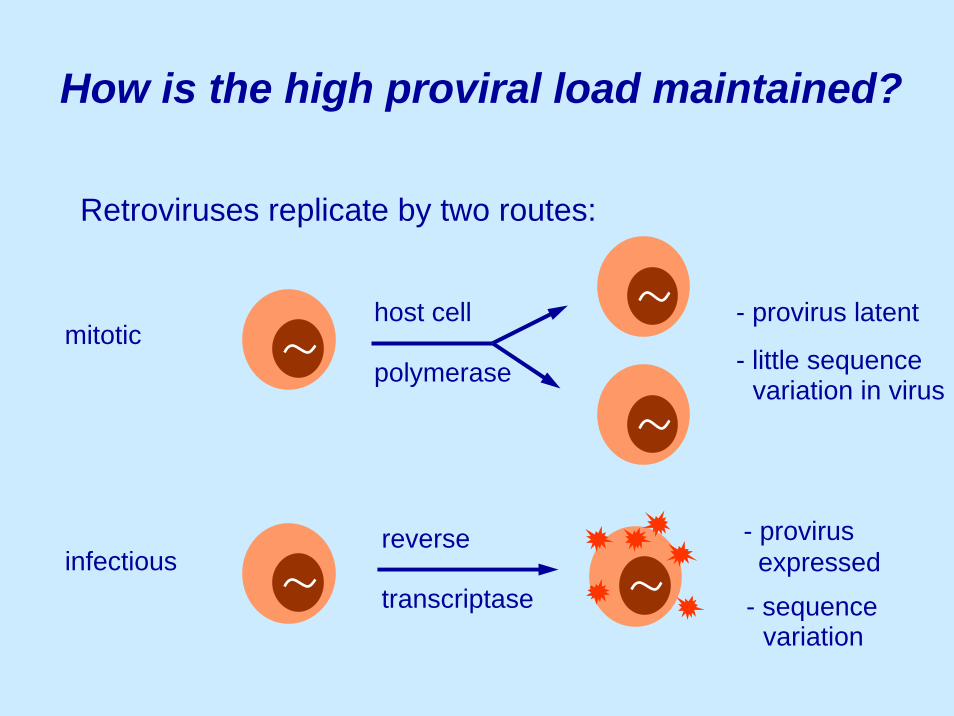
How is the high proviral load maintained?
Retroviruses replicate by two routes:
mitotic
infectious
host cell
polymerase
- provirus latent
- little sequencevariation in virus
reverse
transcriptase
- provirus
- sequence
expressed
variation

Evidence for latency of HTLV-1
amino acid position
variability (Kabat-Wu)
HIV-1
HTLV-1
Env
1. HTLV-1 varies little in sequence:
2. HTLV-1 mRNA and proteins are usually undetectable in PBMCs.
3. Virions are absent and plasma is non-infectious.
Daenke et al. 1990: J. Virol. 64, 1278
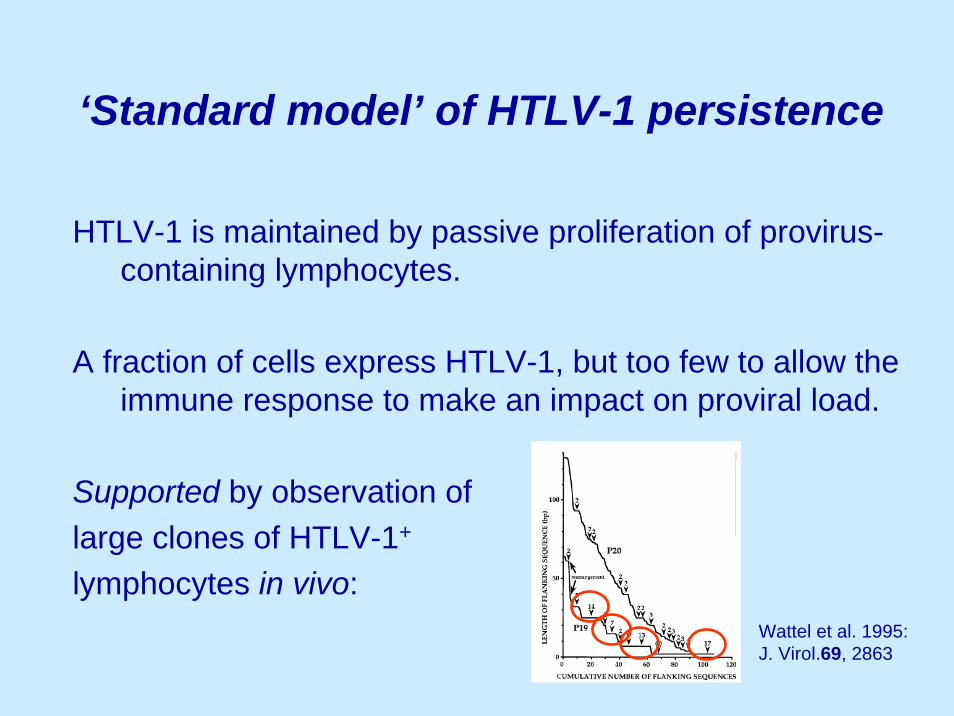
‘Standard model’ of HTLV-1 persistence
HTLV-1 is maintained by passive proliferation of provirus-containing lymphocytes.
A fraction of cells express HTLV-1, but too few to allow the immune response to make an impact on proviral load.
Supported by observation of large clones of HTLV-1+
lymphocytes in vivo:Wattel et al. 1995: J. Virol.69, 2863
What is wrong with the ‘standard model’?
There is a strong T-cell and antibody response to HTLV-1.
Anti-HTLV-1 cytotoxic T lymphocytes (CTLs) are chronically activated; virus-specific IgM is produced.
Passively proliferating HTLV-1+ cells would be outgrown if any start to express HTLV-1: 1%/day 40-fold drop in load over 1 year.
- does the CTL response make any impact?
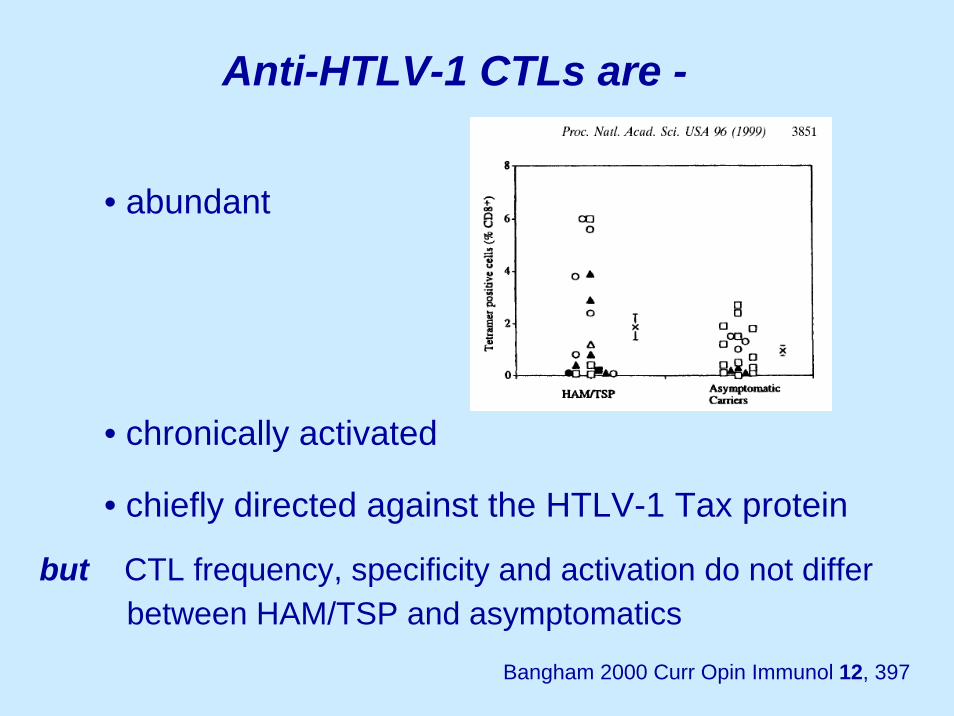
• abundant
• chronically activated
Anti-HTLV-1 CTLs are -
• chiefly directed against the HTLV-1 Tax protein
Bangham 2000 Curr Opin Immunol 12, 397
but CTL frequency, specificity and activation do not differbetween HAM/TSP and asymptomatics
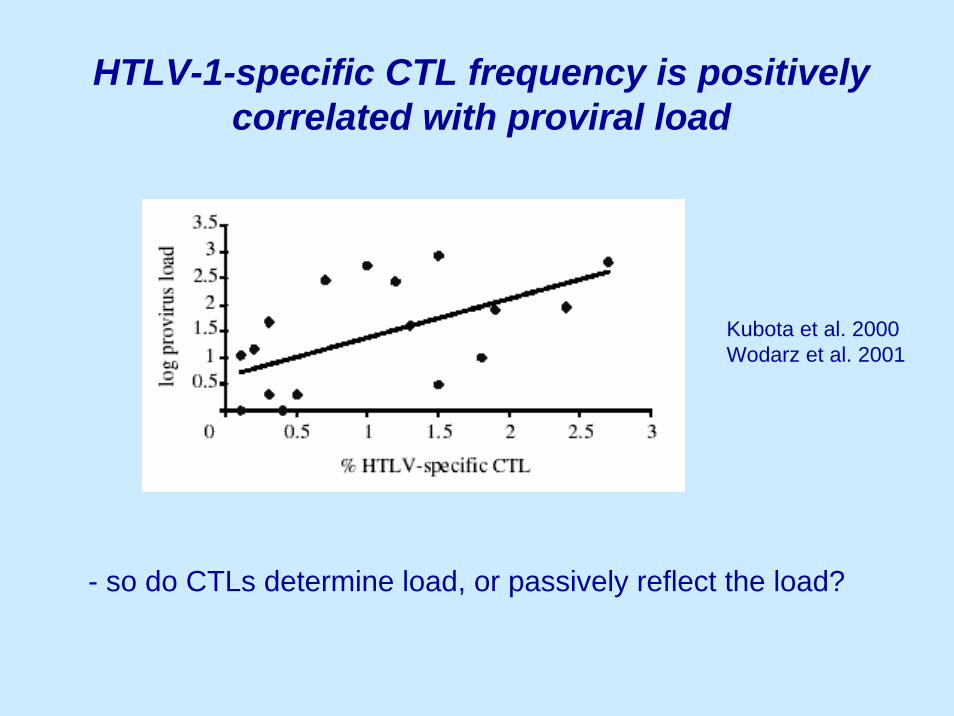
HTLV-1-specific CTL frequency is positively correlated with proviral load
Kubota et al. 2000 Wodarz et al. 2001
- so do CTLs determine load, or passively reflect the load?
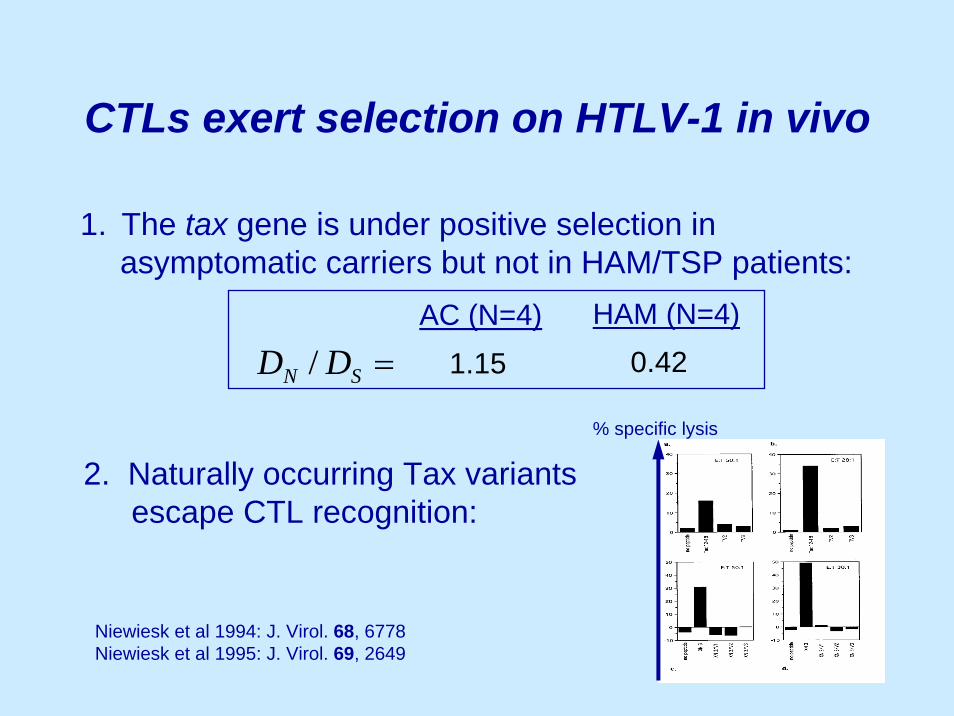
CTLs exert selection on HTLV-1 in vivo
1. The tax gene is under positive selection in asymptomatic carriers but not in HAM/TSP patients:
=SN DD / 1.15AC (N=4) HAM (N=4)
0.42
2. Naturally occurring Tax variants escape CTL recognition:
Niewiesk et al 1994: J. Virol. 68, 6778Niewiesk et al 1995: J. Virol. 69, 2649
% specific lysis
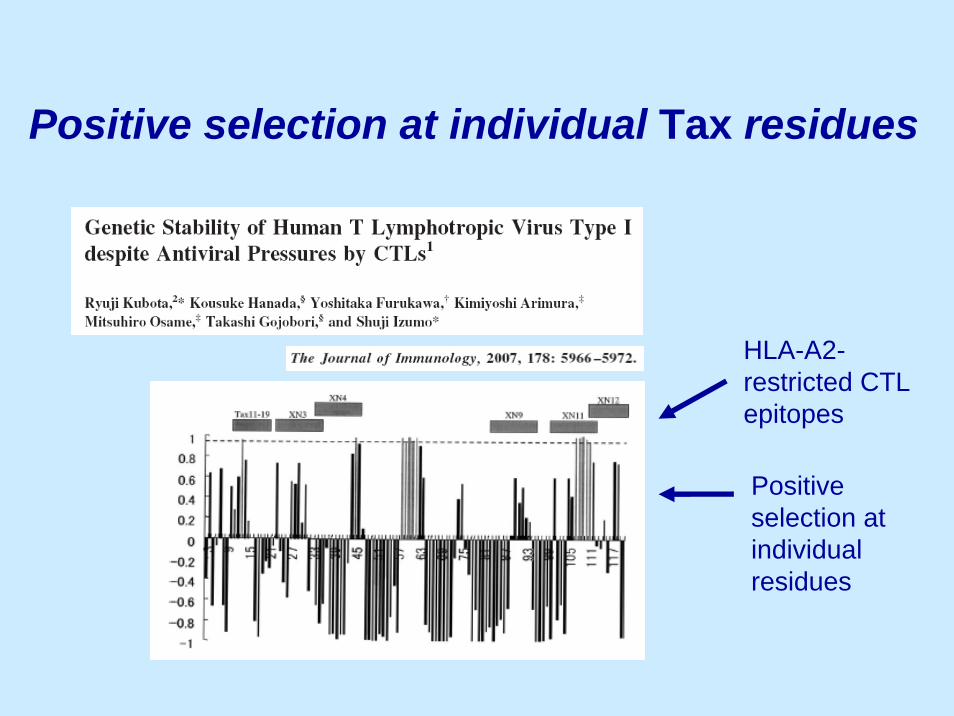
Positive selection at individual Tax residues
HLA-A2-restricted CTL epitopes
Positive selection at individual residues
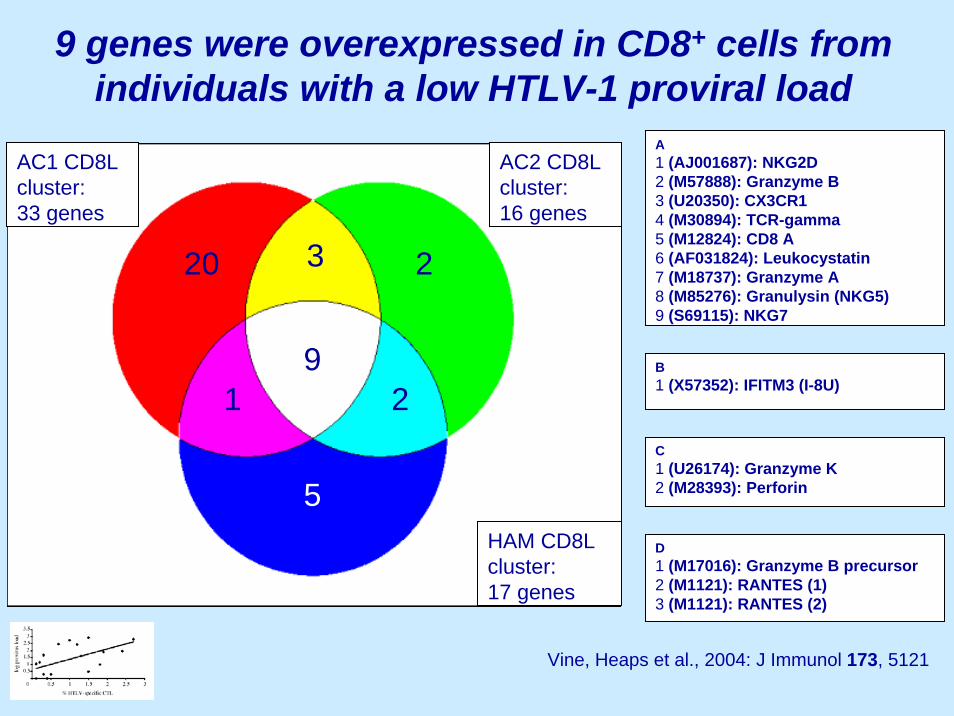
AC1 CD8L cluster: 33 genes
HAM CD8Lcluster: 17 genes
A1 (AJ001687): NKG2D2 (M57888): Granzyme B3 (U20350): CX3CR14 (M30894): TCR-gamma5 (M12824): CD8 A6 (AF031824): Leukocystatin7 (M18737): Granzyme A8 (M85276): Granulysin (NKG5)9 (S69115): NKG7
D1 (M17016): Granzyme B precursor2 (M1121): RANTES (1)3 (M1121): RANTES (2)
B1 (X57352): IFITM3 (I-8U)
C1 (U26174): Granzyme K2 (M28393): Perforin
AC2 CD8L cluster: 16 genes
9 genes were overexpressed in CD8+ cells from individuals with a low HTLV-1 proviral load
Vine, Heaps et al., 2004: J Immunol 173, 5121
5
91 2
3 220
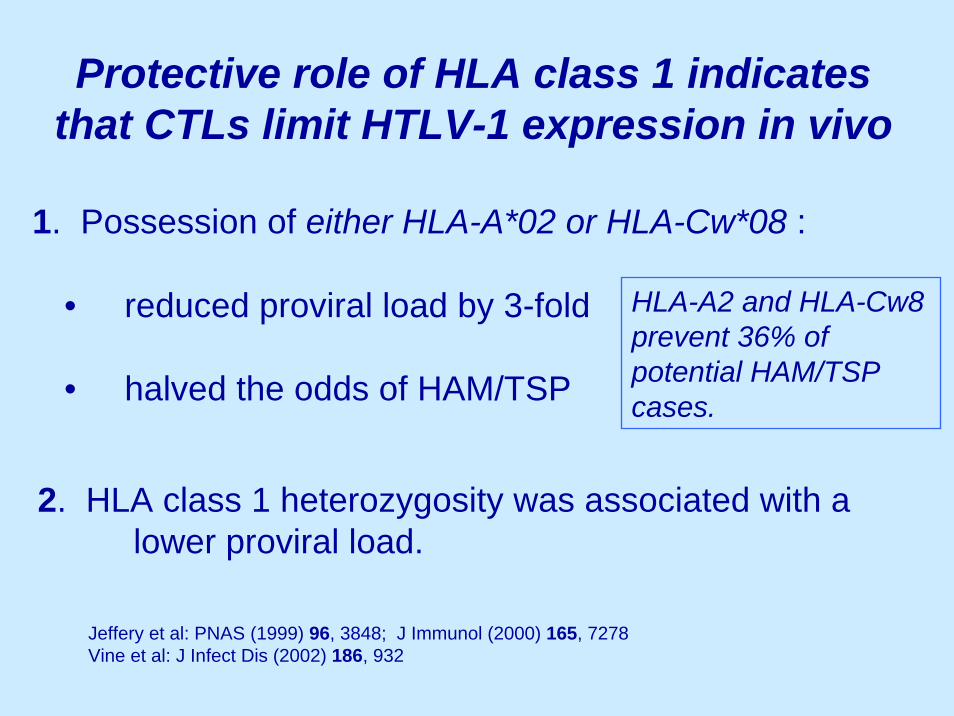
Protective role of HLA class 1 indicates that CTLs limit HTLV-1 expression in vivo
1. Possession of either HLA-A*02 or HLA-Cw*08 :
• reduced proviral load by 3-fold
• halved the odds of HAM/TSP
Jeffery et al: PNAS (1999) 96, 3848; J Immunol (2000) 165, 7278Vine et al: J Infect Dis (2002) 186, 932
2. HLA class 1 heterozygosity was associated with a lower proviral load.
HLA-A2 and HLA-Cw8 prevent 36% of potential HAM/TSP cases.
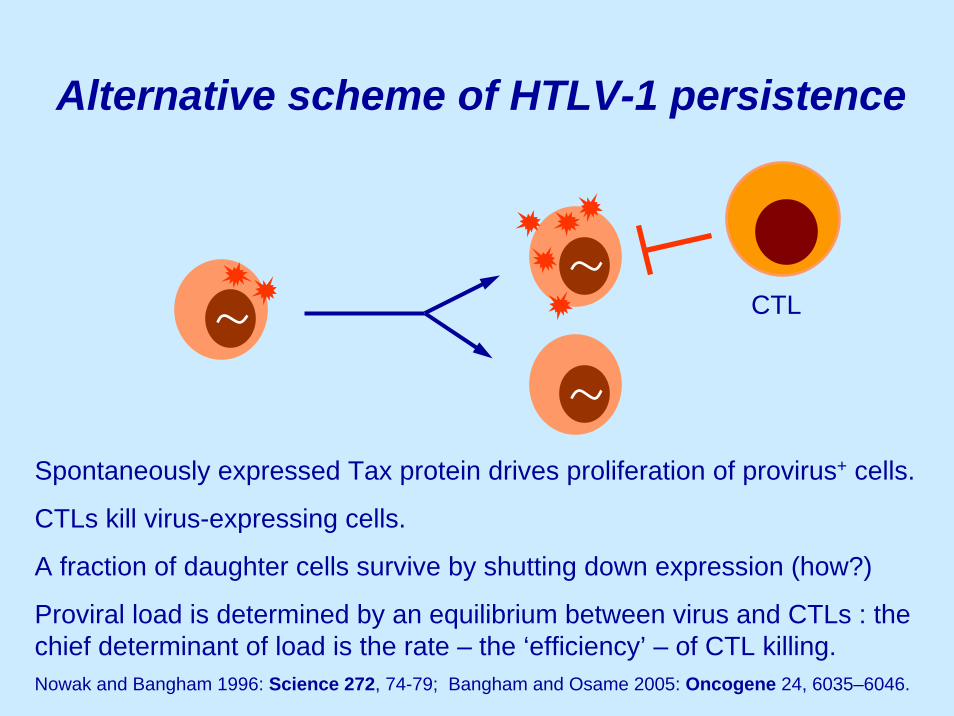
Alternative scheme of HTLV-1 persistence
CTL
Spontaneously expressed Tax protein drives proliferation of provirus+ cells.
CTLs kill virus-expressing cells.
A fraction of daughter cells survive by shutting down expression (how?)
Proviral load is determined by an equilibrium between virus and CTLs : the chief determinant of load is the rate – the ‘efficiency’ – of CTL killing. Nowak and Bangham 1996: Science 272, 74-79; Bangham and Osame 2005: Oncogene 24, 6035–6046.
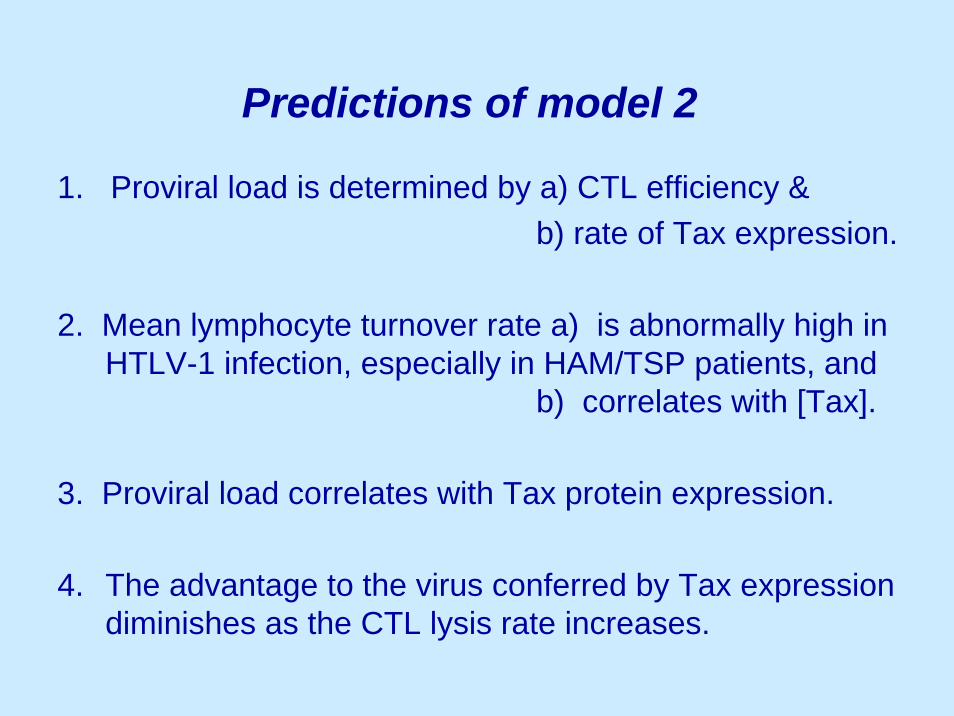
Predictions of model 2
1. Proviral load is determined by a) CTL efficiency &b) rate of Tax expression.
2. Mean lymphocyte turnover rate a) is abnormally high in HTLV-1 infection, especially in HAM/TSP patients, and
b) correlates with [Tax].
3. Proviral load correlates with Tax protein expression.
4. The advantage to the virus conferred by Tax expression diminishes as the CTL lysis rate increases.
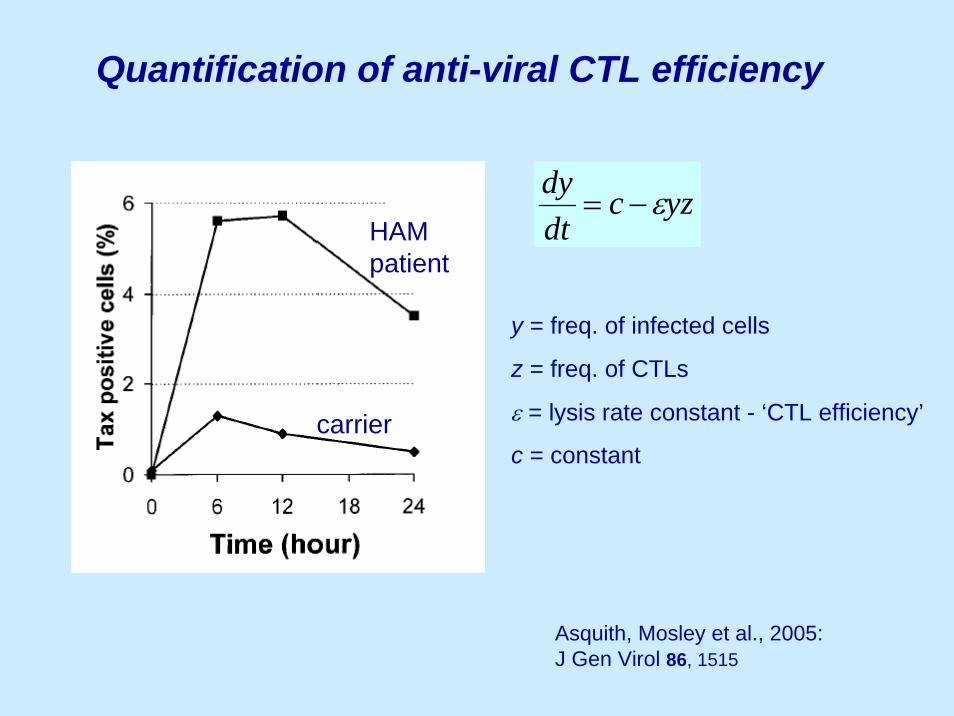
yzcdtdy ε−=
y = freq. of infected cells
z = freq. of CTLs
ε = lysis rate constant - ‘CTL efficiency’
c = constant
Quantification of anti-viral CTL efficiency
HAM patient
carrier
Asquith, Mosley et al., 2005: J Gen Virol 86, 1515
0
1
2
3
4
5
6
0 10 20 30 40 50 60 70
% CD8+ cells
% T
ax+
CD
4+ c
ells
a
fter 1
8hrs
repeat 1: observed data
repeat 1: best theoretical fit
repeat 2: observed data
repeat 2: best theoretical fit
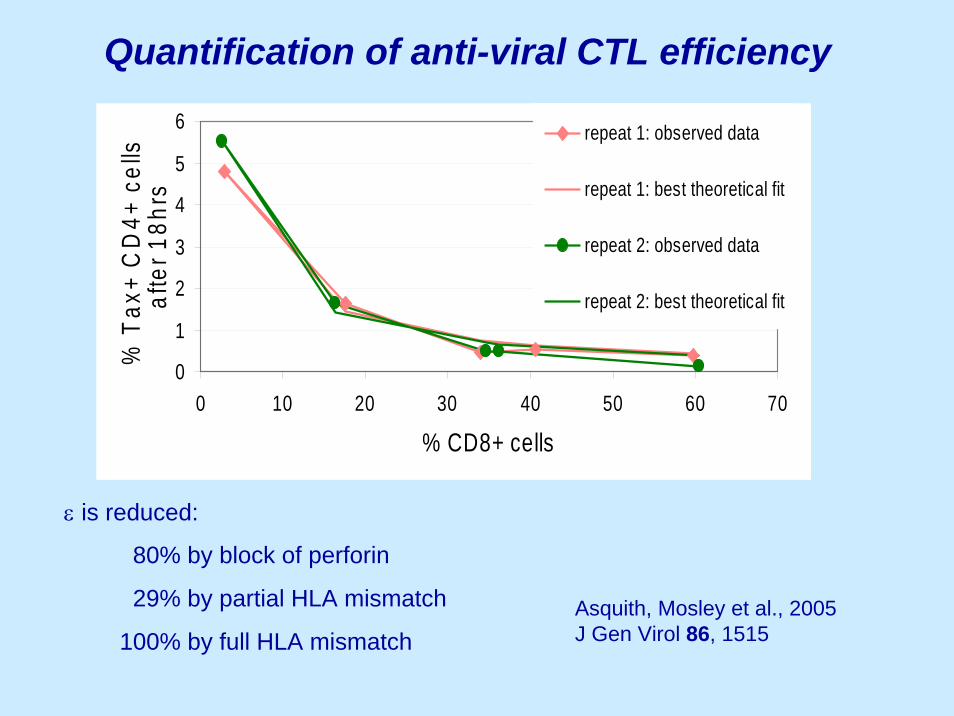
80% by block of perforin
29% by partial HLA mismatch
100% by full HLA mismatch
ε is reduced:
Quantification of anti-viral CTL efficiency
Asquith, Mosley et al., 2005 J Gen Virol 86, 1515
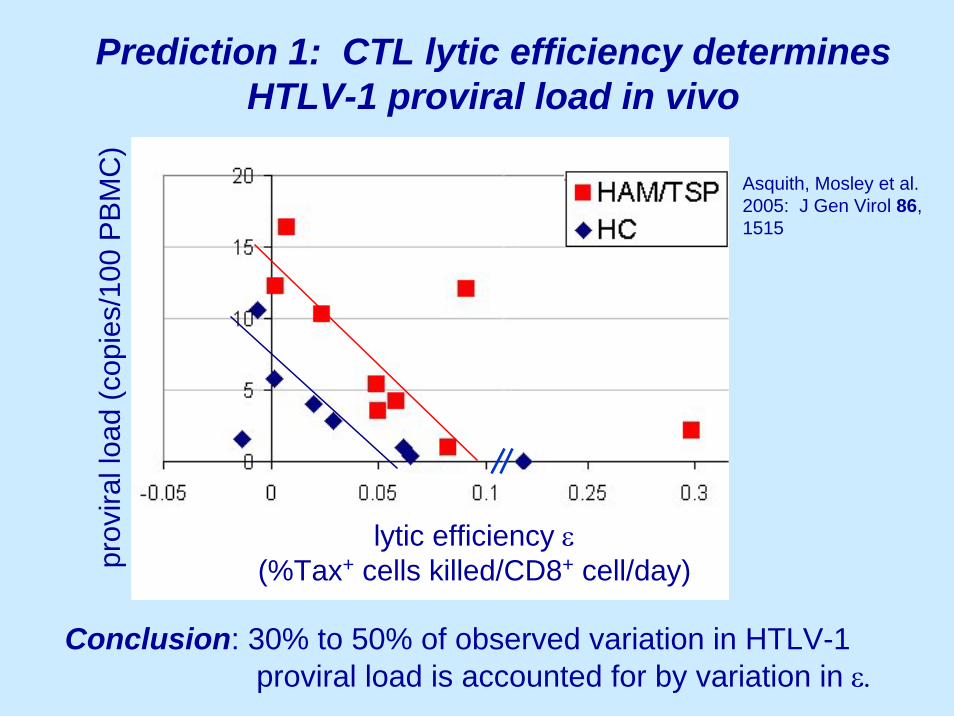
Prediction 1: CTL lytic efficiency determines HTLV-1 proviral load in vivo
prov
iral l
oad
(cop
ies/
100
PB
MC
)
lytic efficiency ε(%Tax+ cells killed/CD8+ cell/day)
Conclusion: 30% to 50% of observed variation in HTLV-1 proviral load is accounted for by variation in ε.
Asquith, Mosley et al.2005: J Gen Virol 86, 1515
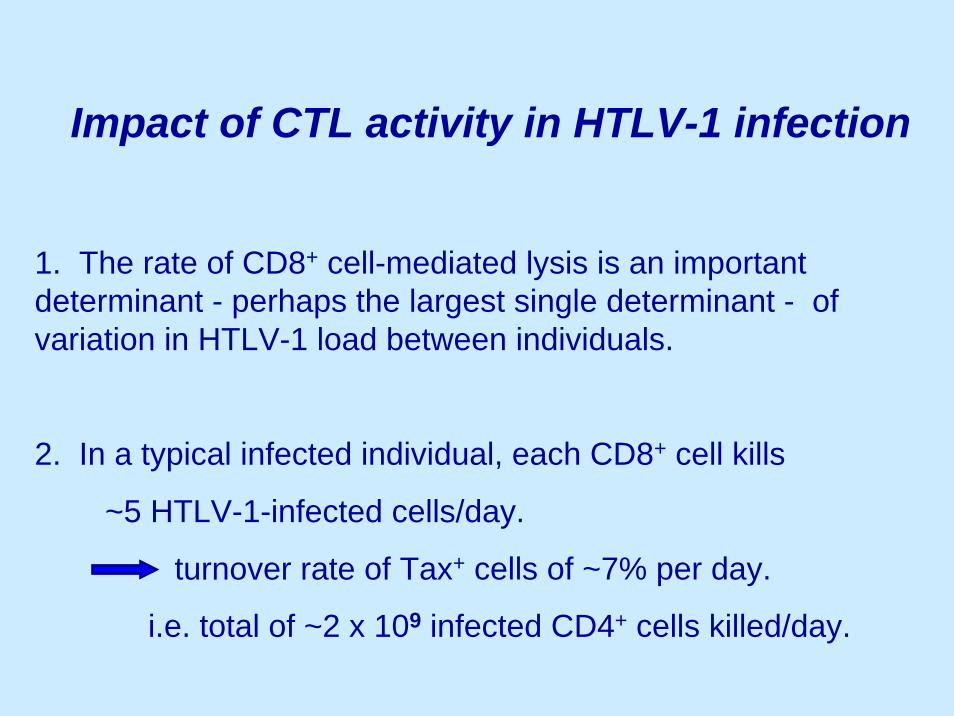
Impact of CTL activity in HTLV-1 infection
1. The rate of CD8+ cell-mediated lysis is an important determinant - perhaps the largest single determinant - of variation in HTLV-1 load between individuals.
2. In a typical infected individual, each CD8+ cell kills
~5 HTLV-1-infected cells/day.
turnover rate of Tax+ cells of ~7% per day.
i.e. total of ~2 x 10⁹ infected CD4+ cells killed/day.
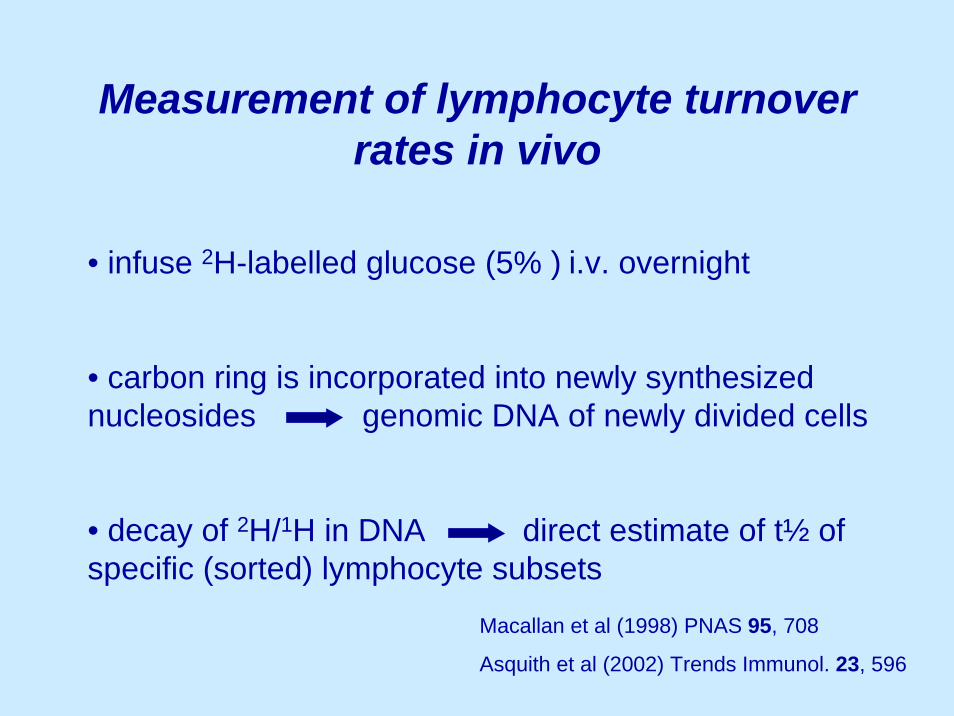
Measurement of lymphocyte turnover rates in vivo
• infuse 2H-labelled glucose (5% ) i.v. overnight
• carbon ring is incorporated into newly synthesized nucleosides genomic DNA of newly divided cells
• decay of 2H/1H in DNA direct estimate of t½ of specific (sorted) lymphocyte subsets
Macallan et al (1998) PNAS 95, 708
Asquith et al (2002) Trends Immunol. 23, 596
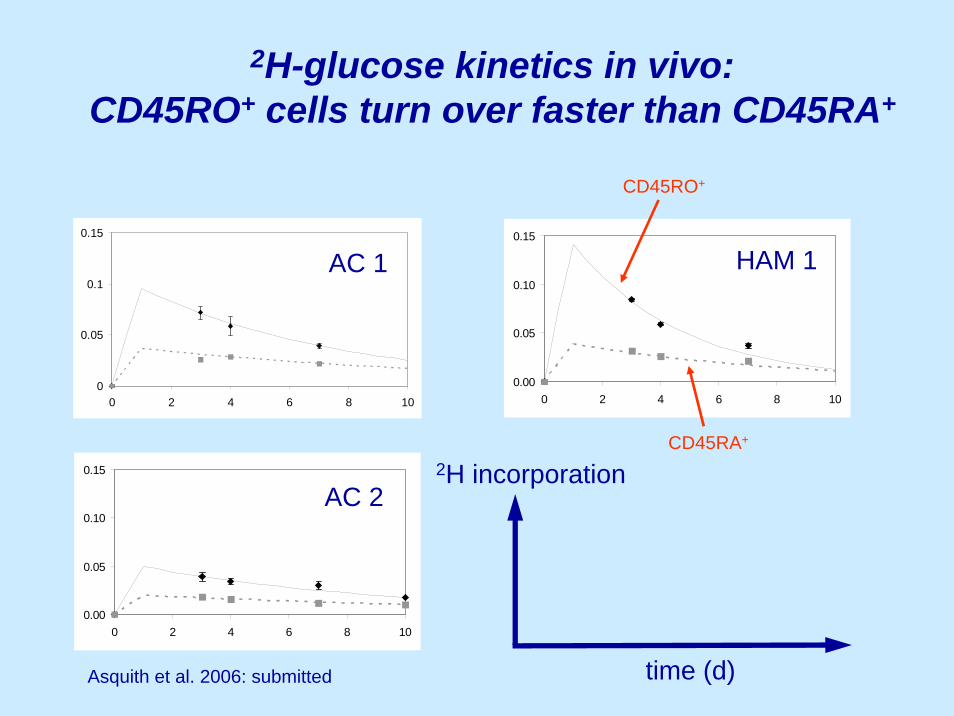
2H-glucose kinetics in vivo: CD45RO+ cells turn over faster than CD45RA+
0
0.05
0.1
0.15
0 2 4 6 8 10
L01-HS
0.00
0.05
0.10
0.15
0 2 4 6 8 10
L07-TBI
0.00
0.05
0.10
0.15
0 2 4 6 8 10
L10-HBO
time (d)
2H incorporation
AC 1
AC 2
HAM 1
CD45RO+
CD45RA+
Asquith et al. 2006: submitted
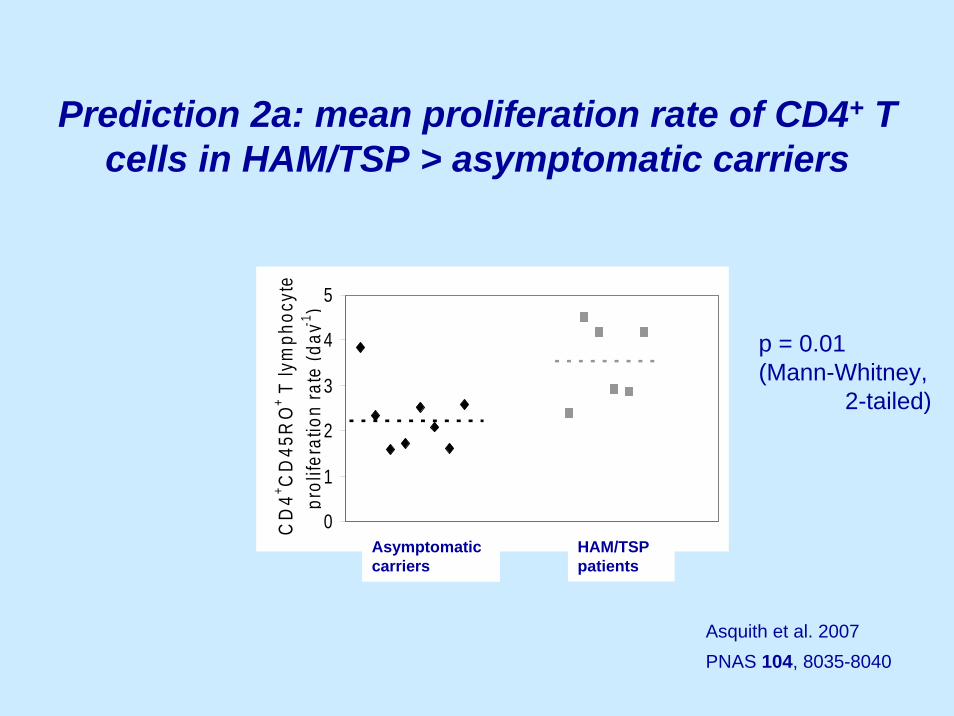
Prediction 2a: mean proliferation rate of CD4+ T cells in HAM/TSP > asymptomatic carriers
0
1
2
3
4
5C
D4+ C
D45
RO
+ T ly
mph
ocyt
epr
olife
ratio
n ra
te (d
ay-1
)
Asymptomatic carriers
HAM/TSP patients
Asquith et al. 2007 PNAS 104, 8035-8040
p = 0.01 (Mann-Whitney,
2-tailed)
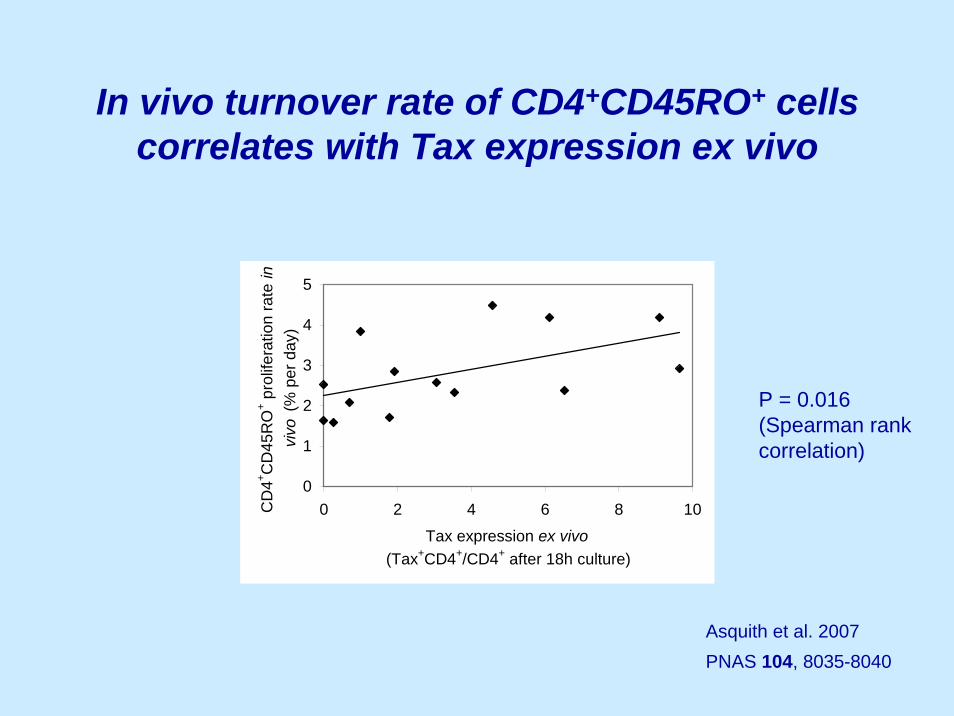
In vivo turnover rate of CD4+CD45RO+ cells correlates with Tax expression ex vivo
0
1
2
3
4
5
0 2 4 6 8 10
Tax expression ex vivo(Tax+CD4+/CD4+ after 18h culture)
CD
4+ CD
45R
O+ p
rolif
erat
ion
rate
in
vivo
(% p
er d
ay)
P = 0.016 (Spearman rank correlation)
Asquith et al. 2007 PNAS 104, 8035-8040
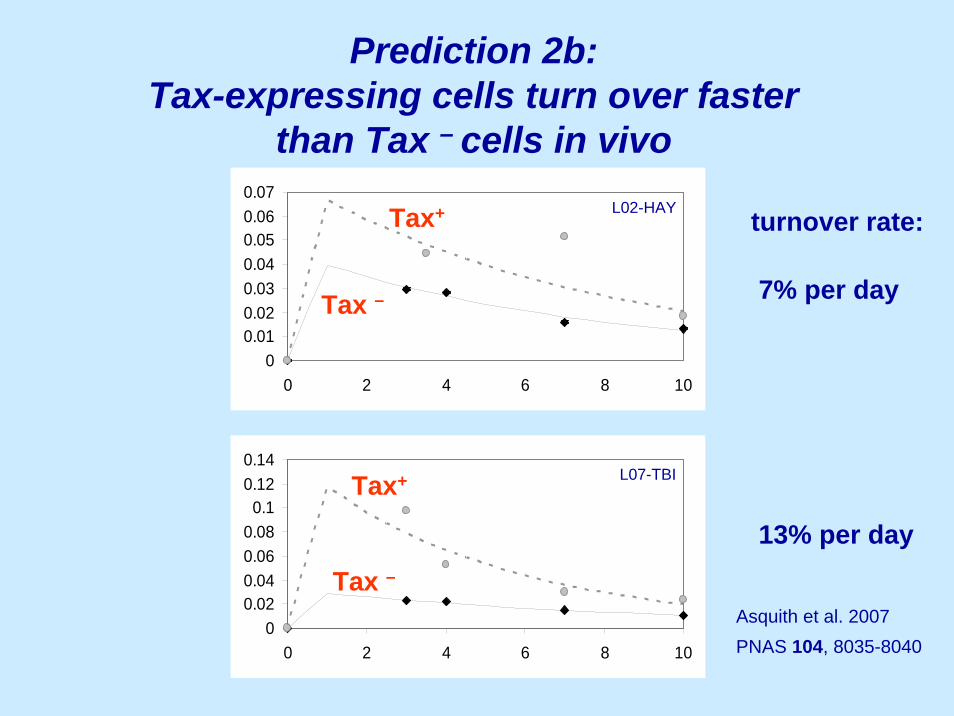
Prediction 2b:Tax-expressing cells turn over faster
than Tax – cells in vivo
00.010.020.030.040.050.060.07
0 2 4 6 8 10
00.020.040.060.08
0.10.120.14
0 2 4 6 8 10
L02-HAY
L07-TBI
Tax+
Tax+
Tax –
Tax –
turnover rate:
7% per day
13% per day
Asquith et al. 2007 PNAS 104, 8035-8040
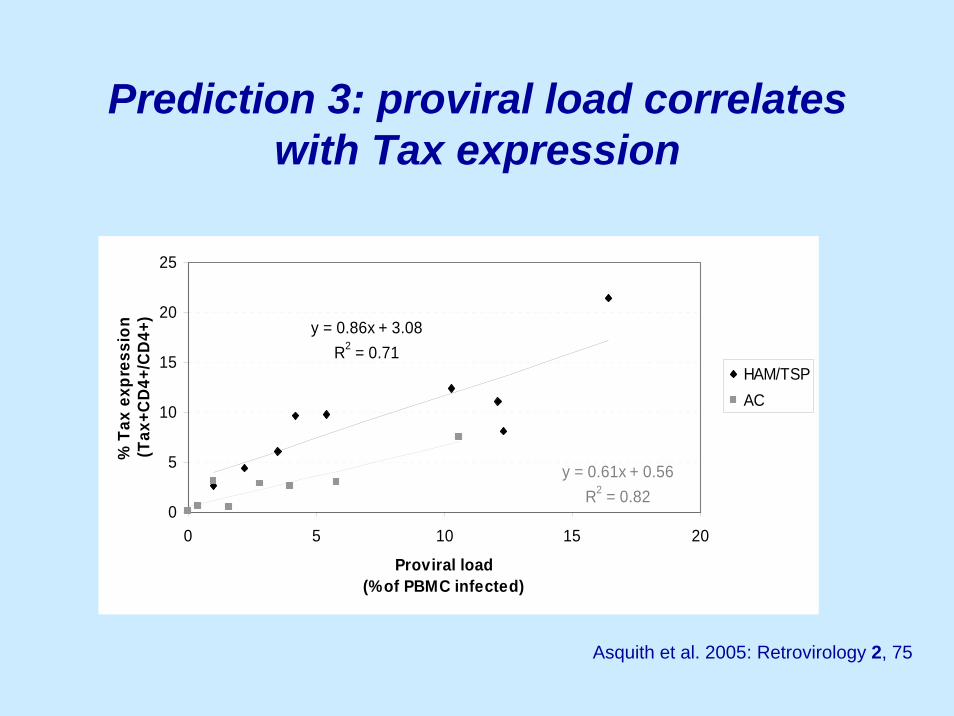
Prediction 3: proviral load correlates with Tax expression
y = 0.86x + 3.08R2 = 0.71
y = 0.61x + 0.56R2 = 0.82
0
5
10
15
20
25
0 5 10 15 20
Proviral load (% of PBMC infected)
% T
ax e
xpre
ssio
n (T
ax+C
D4+
/CD
4+)
HAM/TSPAC
Asquith et al. 2005: Retrovirology 2, 75
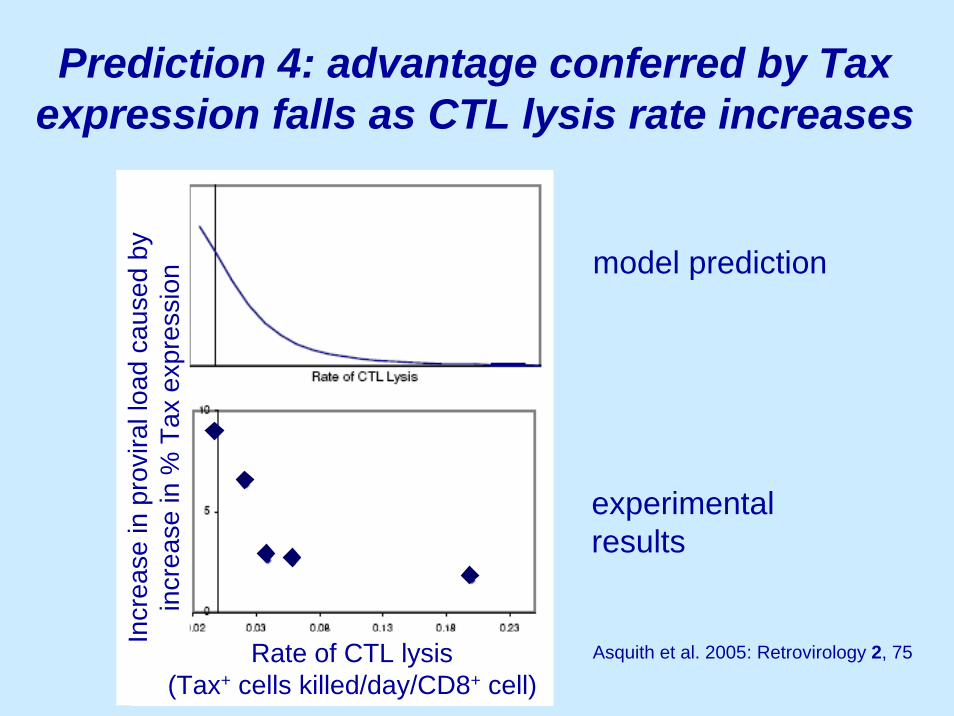
Prediction 4: advantage conferred by Tax expression falls as CTL lysis rate increases
model prediction
experimental results
Asquith et al. 2005: Retrovirology 2, 75
Incr
ease
in p
rovi
ral l
oad
caus
ed b
y in
crea
se in
% T
ax e
xpre
ssio
n
Rate of CTL lysis (Tax+ cells killed/day/CD8+ cell)
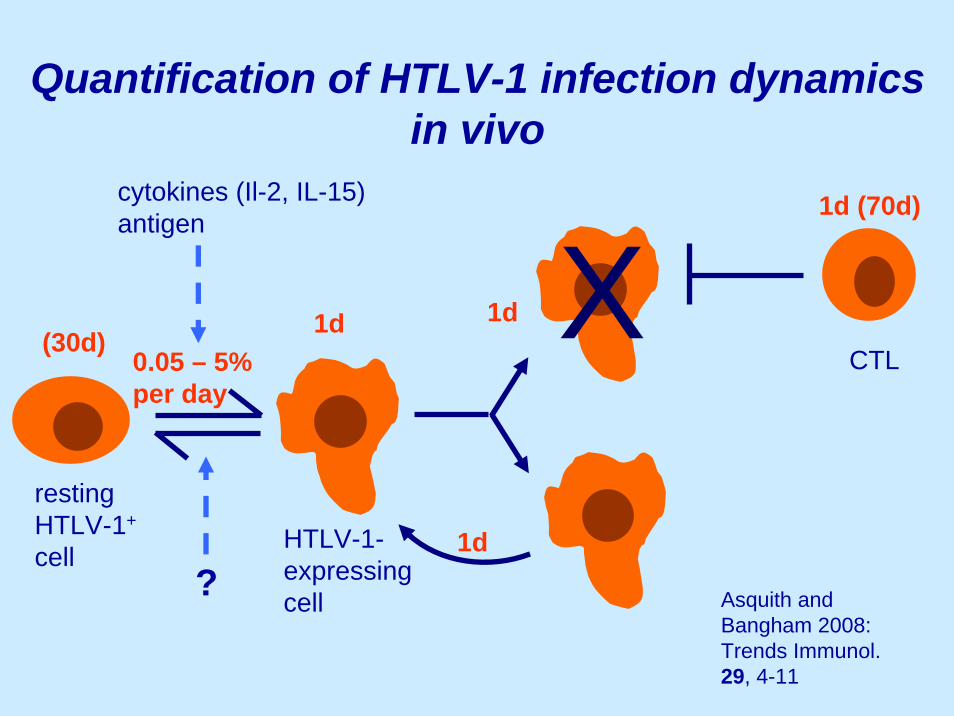
Quantification of HTLV-1 infection dynamics in vivo
resting HTLV-1+
cellHTLV-1-expressing cell
0.05 – 5% per day
1d
(30d) XCTL
1d
1d (70d)
1d
cytokines (Il-2, IL-15) antigen
? Asquith and Bangham 2008: Trends Immunol. 29, 4-11
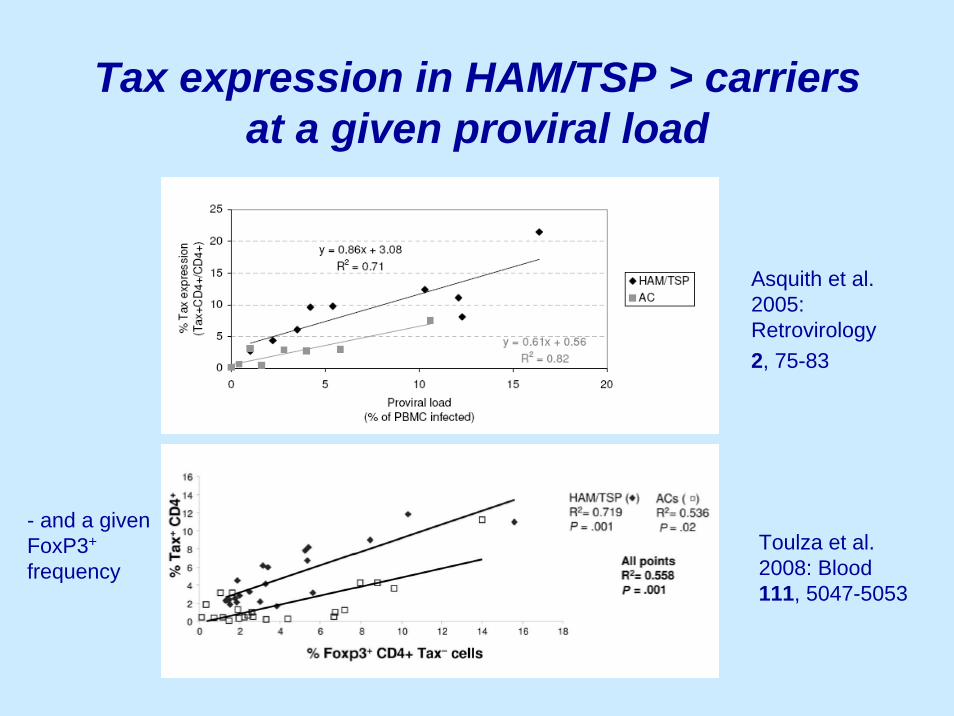
Tax expression in HAM/TSP > carriers at a given proviral load
Asquith et al. 2005: Retrovirology 2, 75-83
Toulza et al. 2008: Blood 111, 5047-5053
- and a given FoxP3+
frequency
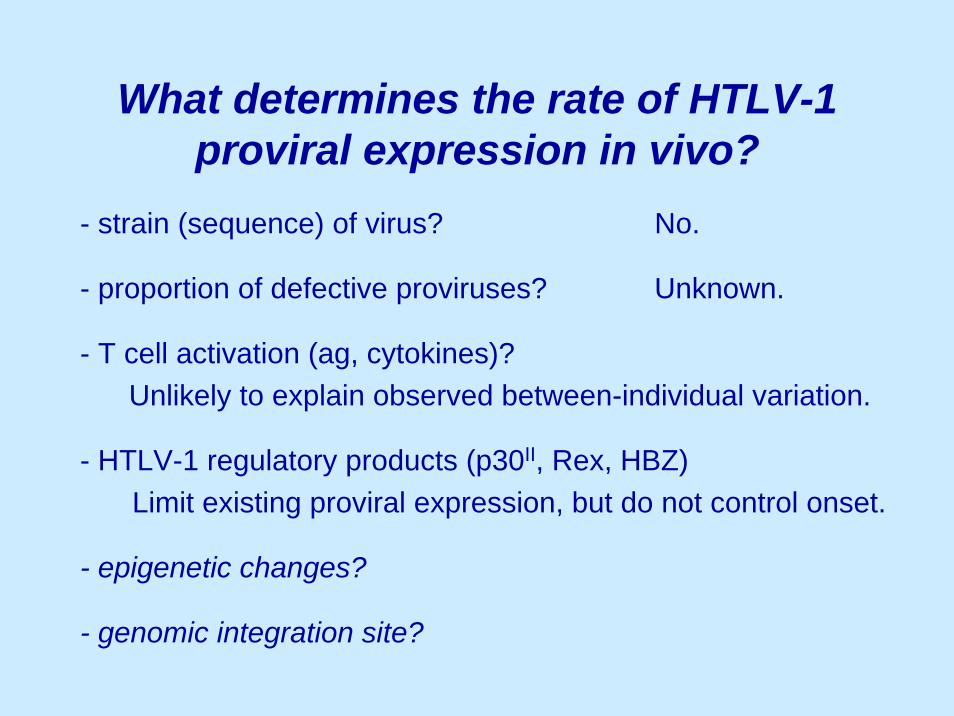
What determines the rate of HTLV-1 proviral expression in vivo?
- strain (sequence) of virus? No.
- proportion of defective proviruses? Unknown.
- T cell activation (ag, cytokines)? Unlikely to explain observed between-individual variation.
- HTLV-1 regulatory products (p30II, Rex, HBZ)Limit existing proviral expression, but do not control onset.
- epigenetic changes?
- genomic integration site?
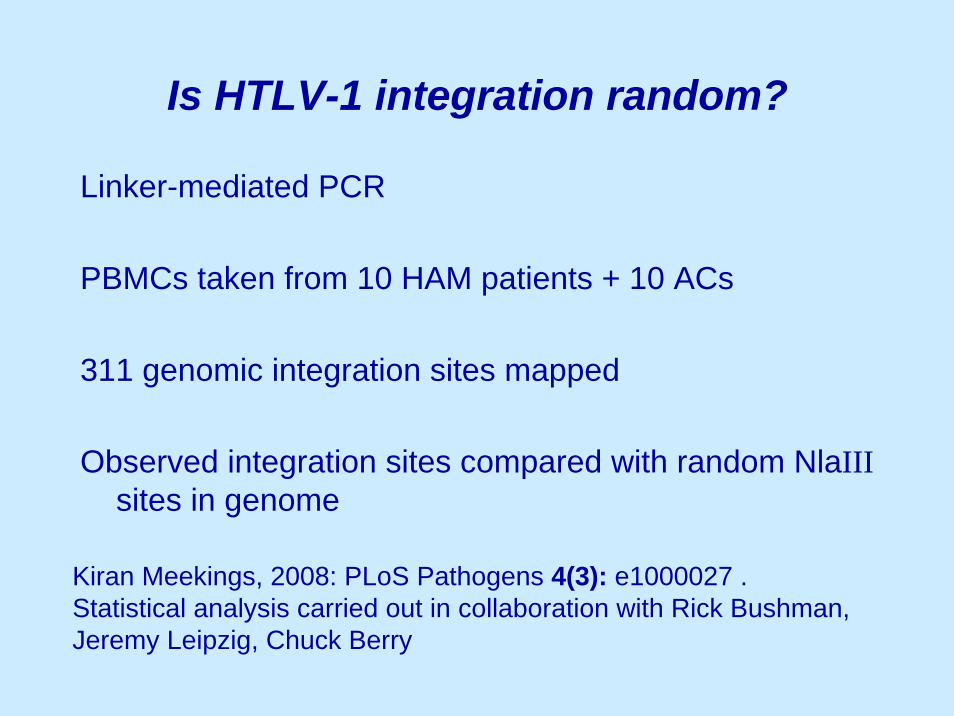
Is HTLV-1 integration random?
Linker-mediated PCR
PBMCs taken from 10 HAM patients + 10 ACs
311 genomic integration sites mapped
Observed integration sites compared with random NlaIIIsites in genome
Kiran Meekings, 2008: PLoS Pathogens 4(3): e1000027 .Statistical analysis carried out in collaboration with Rick Bushman, Jeremy Leipzig, Chuck Berry
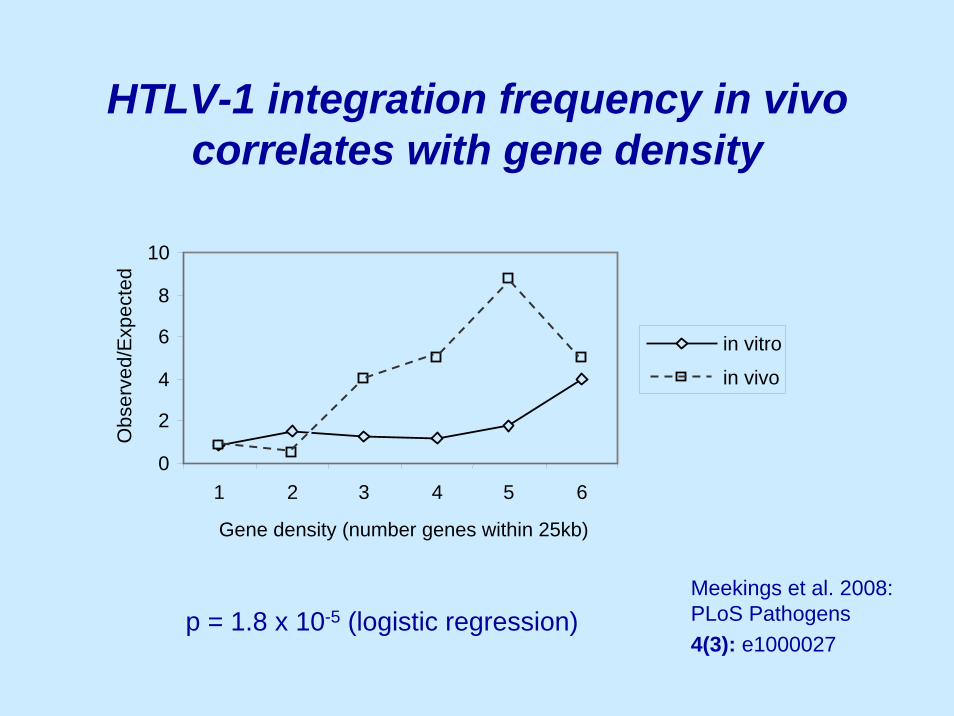
HTLV-1 integration frequency in vivo correlates with gene density
p = 1.8 x 10⁻⁵ (logistic regression)Meekings et al. 2008: PLoS Pathogens 4(3): e1000027
0
2
4
6
8
10
1 2 3 4 5 6
Gene density (number genes within 25kb)
Obs
erve
d/E
xpec
ted
in vitro
in vivo
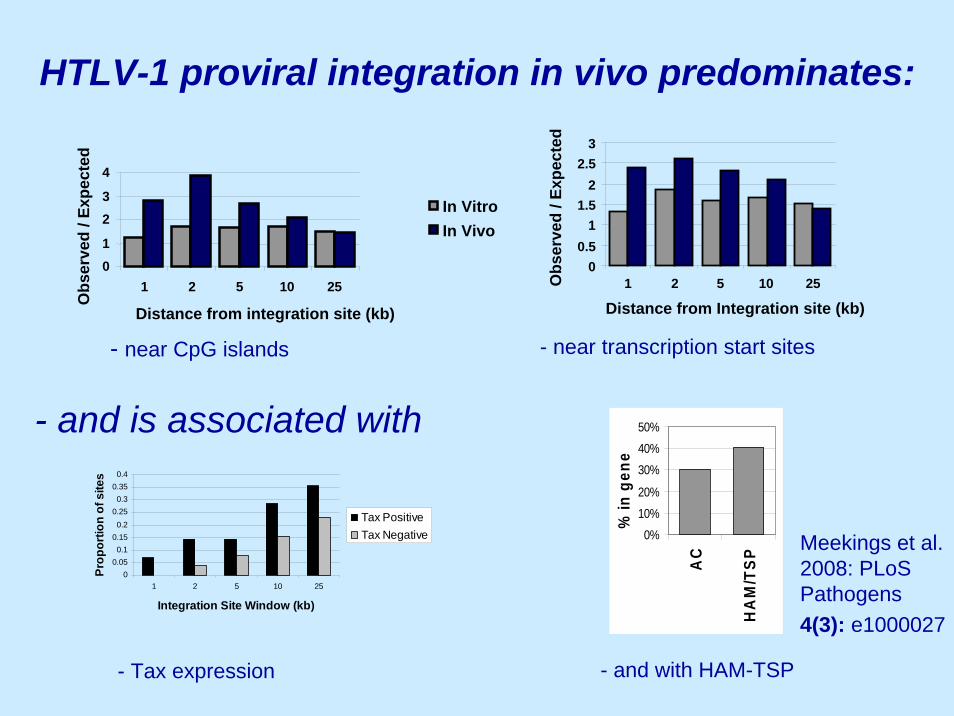
HTLV-1 proviral integration in vivo predominates:
01
23
4
1 2 5 10 25
Distance from integration site (kb)
Obs
erve
d / E
xpec
ted
In VitroIn Vivo
00.5
11.5
22.5
3
1 2 5 10 25
Distance from Integration site (kb)
Obs
erve
d / E
xpec
ted
00.050.1
0.150.2
0.250.3
0.350.4
1 2 5 10 25
Integration Site Window (kb)
Prop
ortio
n of
site
s
Tax PositiveTax Negative 0%
10%
20%
30%
40%
50%
AC
HA
M/T
SP
% in
gen
e
- near CpG islands - near transcription start sites
- Tax expression
- and is associated with
- and with HAM-TSP
Meekings et al. 2008: PLoS Pathogens 4(3): e1000027
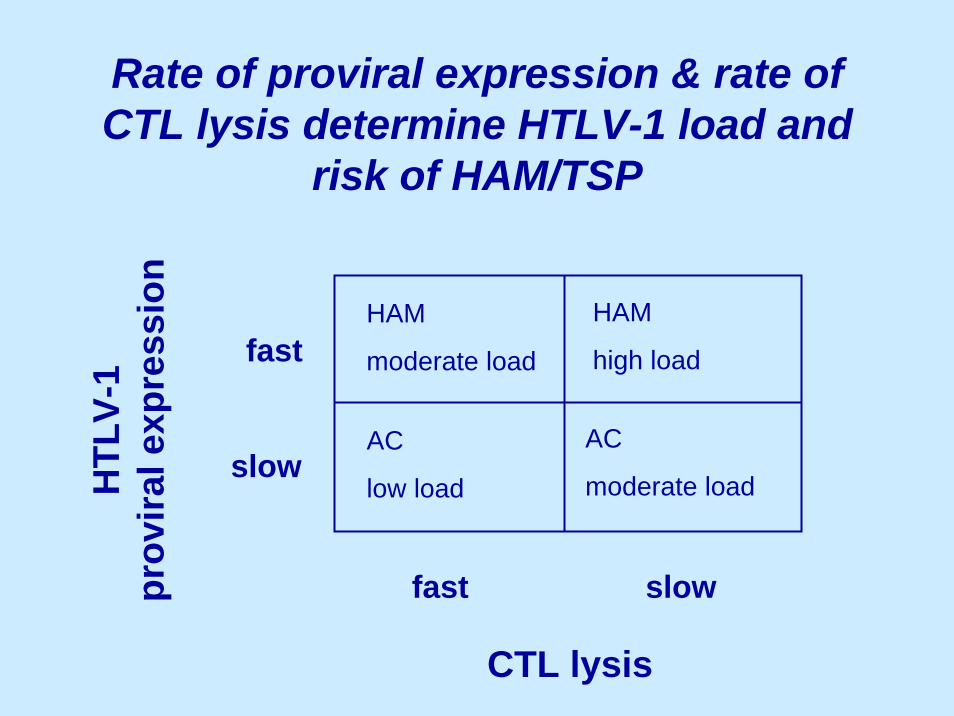
Rate of proviral expression & rate of CTL lysis determine HTLV-1 load and
risk of HAM/TSP
fast
slow
fast
slow
HAM
moderate load
HAM
high load
AC
low load
AC
moderate load
CTL lysis
HTL
V-1
prov
iral e
xpre
ssio
n
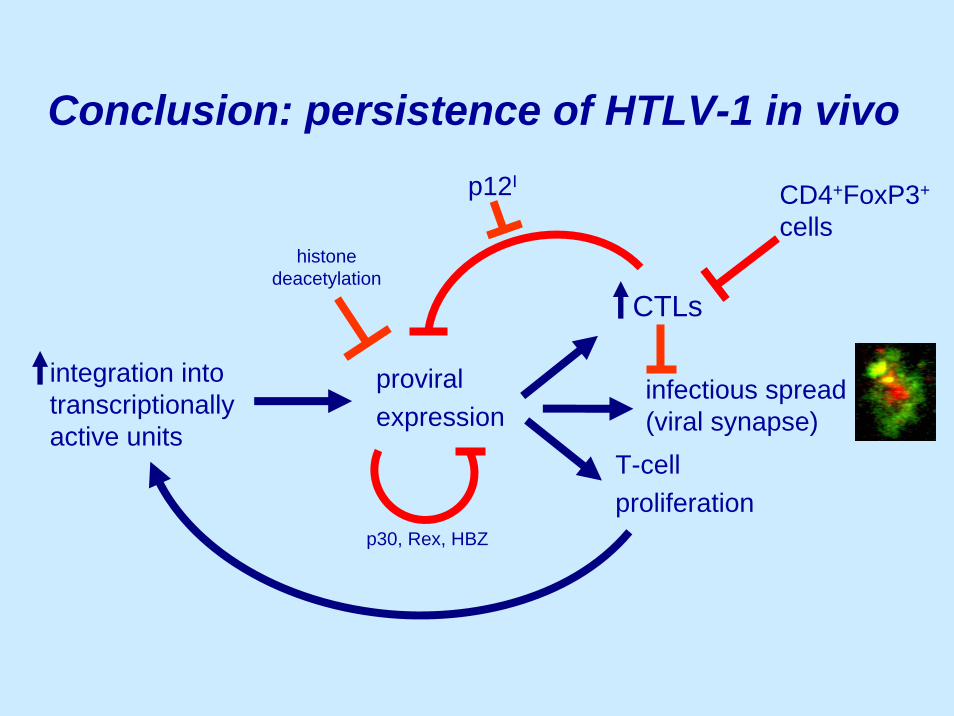
Conclusion: persistence of HTLV-1 in vivo
proviralexpression
CTLs
T-cellproliferation
integration into transcriptionally active units
histone deacetylation
CD4+FoxP3+
cells
p30, Rex, HBZ
infectious spread (viral synapse)
p12I