Embed Size (px)
Citation preview
Eric VIBERTCentre Hépato-Biliaire, INSERM U1193, DHU HepatinnovHopital Paul Brousse, APHP, Villejuif
Les alternatives à la Transplantation Hépatique Cadavérique
Slides disponibles sur SlideShare
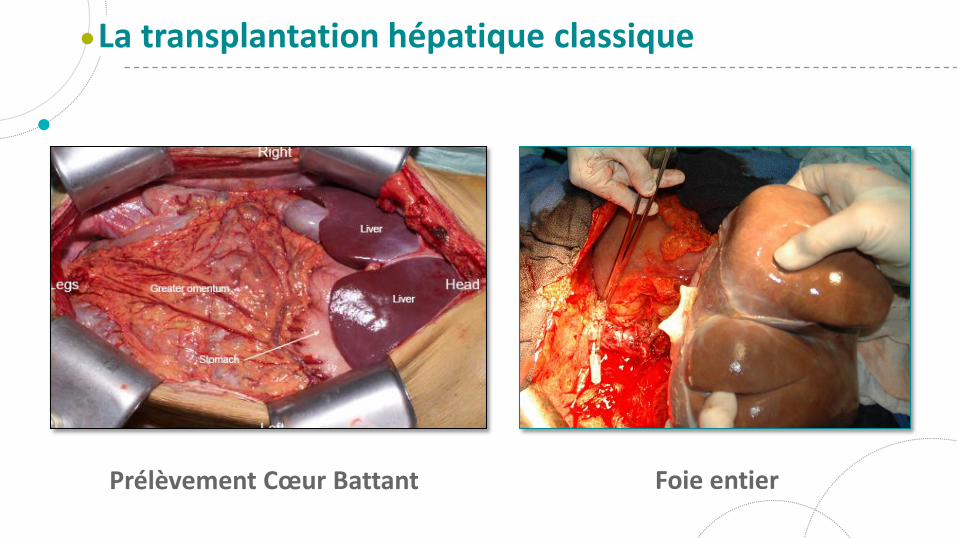
La transplantation hépatique classique
Prélèvement Cœur Battant Foie entier
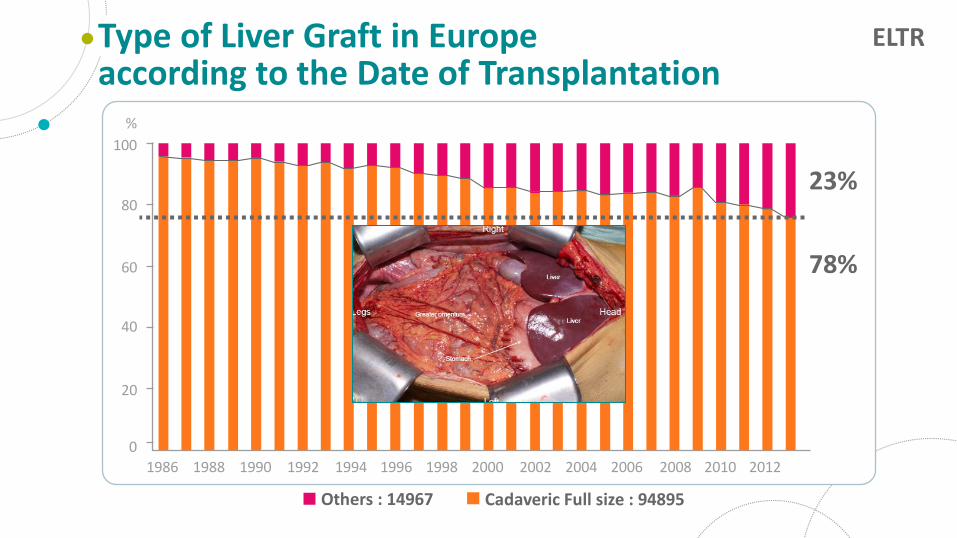
23%
78%
Type of Liver Graft in Europe according to the Date of Transplantation
100
80
60
40
20
0
%
1986 1988 1990 1992 1994 1996 1998 2000 2002 2004 2006 2008 2010 2012
Others : 14967 Cadaveric Full size : 94895
ELTR
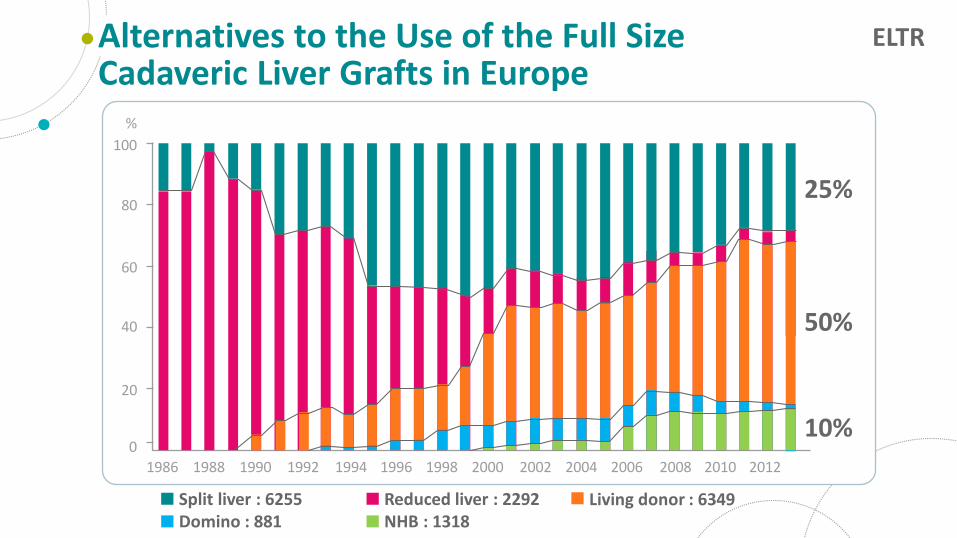
Alternatives to the Use of the Full SizeCadaveric Liver Grafts in Europe
100
80
60
40
20
0
%
1986 1988 1990 1992 1994 1996 1998 2000 2002 2004 2006 2008 2010 2012
Reduced liver : 2292NHB : 1318
Living donor : 6349
25%
50%
10%
Split liver : 6255Domino : 881
ELTR
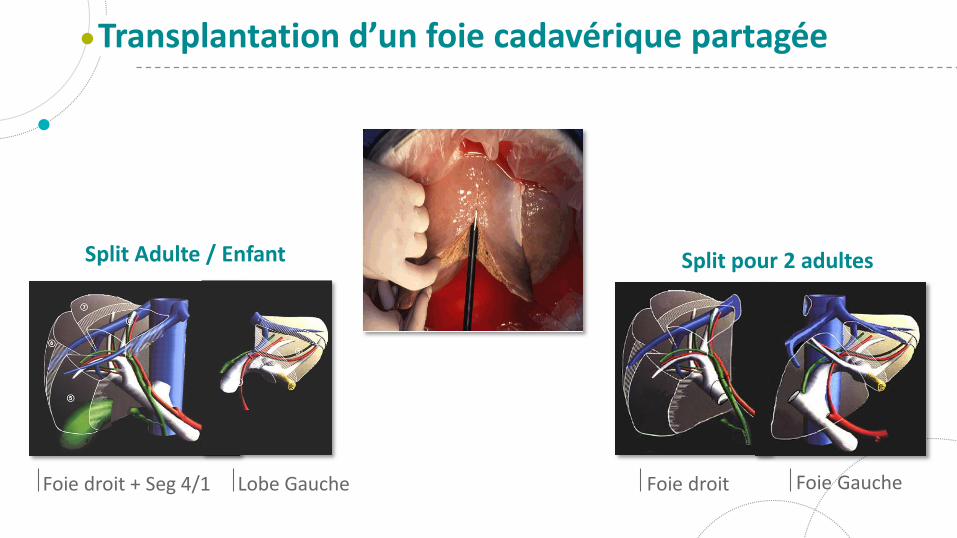
Transplantation d’un foie cadavérique partagée
Foie droit + Seg 4/1 Lobe Gauche Foie droit Foie Gauche
Split Adulte / Enfant Split pour 2 adultes
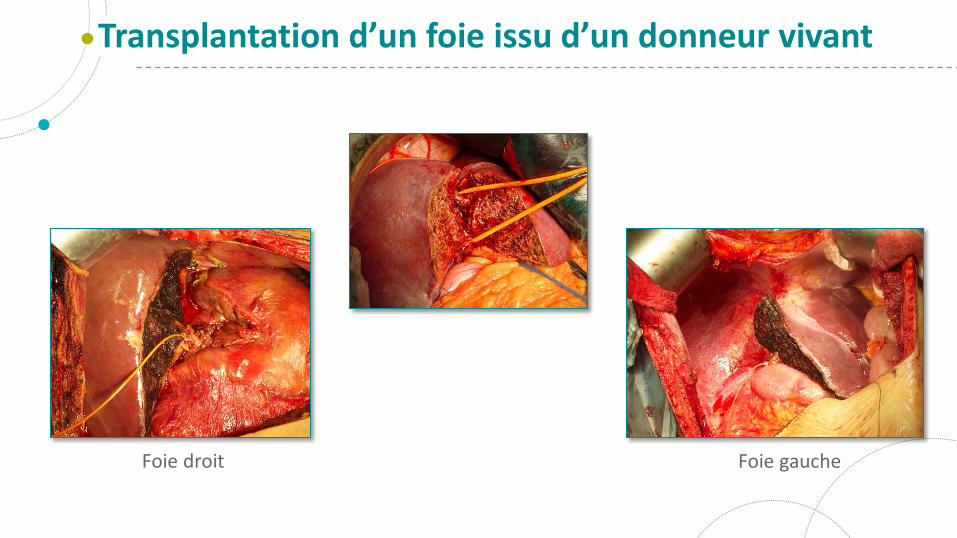
Transplantation d’un foie issu d’un donneur vivant
Foie droit Foie gauche
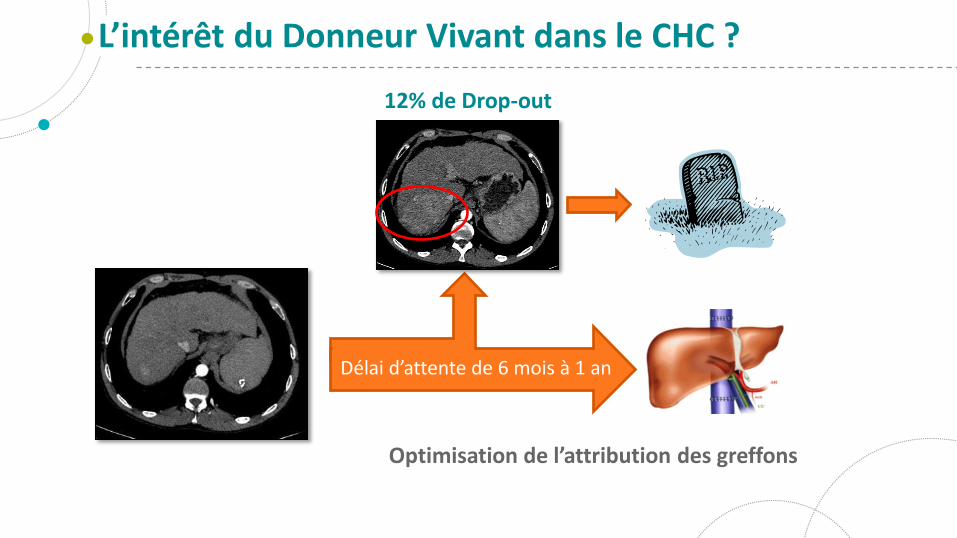
L’intérêt du Donneur Vivant dans le CHC ?
12% de Drop-out
Optimisation de l’attribution des greffons
Délai d’attente de 6 mois à 1 an
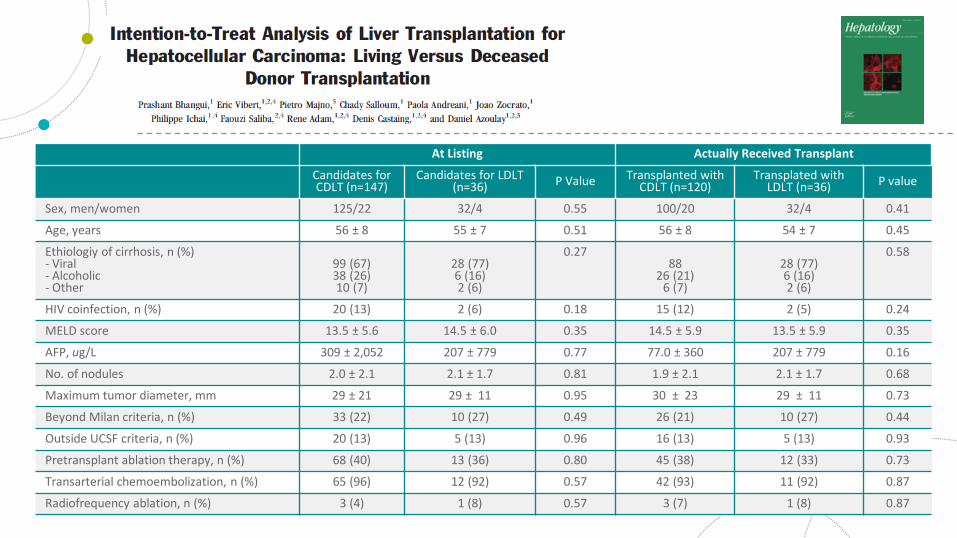
At Listing Actually Received Transplant
Candidates forCDLT (n=147)
Candidates for LDLT (n=36) P Value Transplanted with
CDLT (n=120)Transplated with
LDLT (n=36) P value
Sex, men/women 125/22 32/4 0.55 100/20 32/4 0.41
Age, years 56 ± 8 55 ± 7 0.51 56 ± 8 54 ± 7 0.45
Ethiologiy of cirrhosis, n (%)- Viral- Alcoholic- Other
99 (67)38 (26)10 (7)
28 (77)6 (16)2 (6)
0.2788
26 (21)6 (7)
28 (77)6 (16)2 (6)
0.58
HIV coinfection, n (%) 20 (13) 2 (6) 0.18 15 (12) 2 (5) 0.24
MELD score 13.5 ± 5.6 14.5 ± 6.0 0.35 14.5 ± 5.9 13.5 ± 5.9 0.35
AFP, ug/L 309 ± 2,052 207 ± 779 0.77 77.0 ± 360 207 ± 779 0.16
No. of nodules 2.0 ± 2.1 2.1 ± 1.7 0.81 1.9 ± 2.1 2.1 ± 1.7 0.68
Maximum tumor diameter, mm 29 ± 21 29 ± 11 0.95 30 ± 23 29 ± 11 0.73
Beyond Milan criteria, n (%) 33 (22) 10 (27) 0.49 26 (21) 10 (27) 0.44
Outside UCSF criteria, n (%) 20 (13) 5 (13) 0.96 16 (13) 5 (13) 0.93
Pretransplant ablation therapy, n (%) 68 (40) 13 (36) 0.80 45 (38) 12 (33) 0.73
Transarterial chemoembolization, n (%) 65 (96) 12 (92) 0.57 42 (93) 11 (92) 0.87
Radiofrequency ablation, n (%) 3 (4) 1 (8) 0.57 3 (7) 1 (8) 0.87
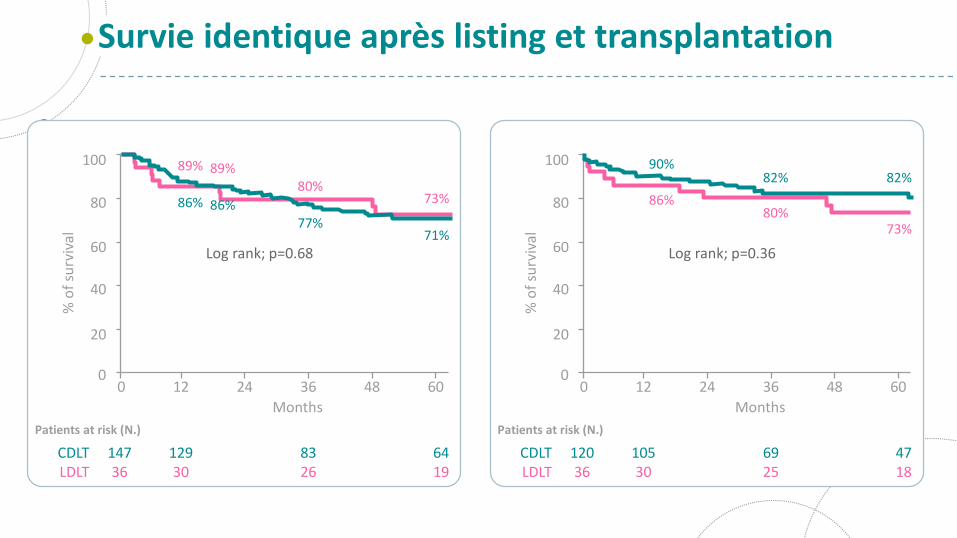
Survie identique après listing et transplantation
100
80
60
40
20
00 12 24 36 48 60
% o
f su
rviv
al
Patients at risk (N.)
CDLTLDLT
14736
12930
8326
6419
Months
Log rank; p=0.68
73%
71%
80%
77%
89%
86%
89%
86%
100
80
60
40
20
00 12 24 36 48 60
% o
f su
rviv
al
Patients at risk (N.)
CDLTLDLT
12036
10530
6925
4718
Months
Log rank; p=0.36
73%
82%
80%
82%
86%
90%
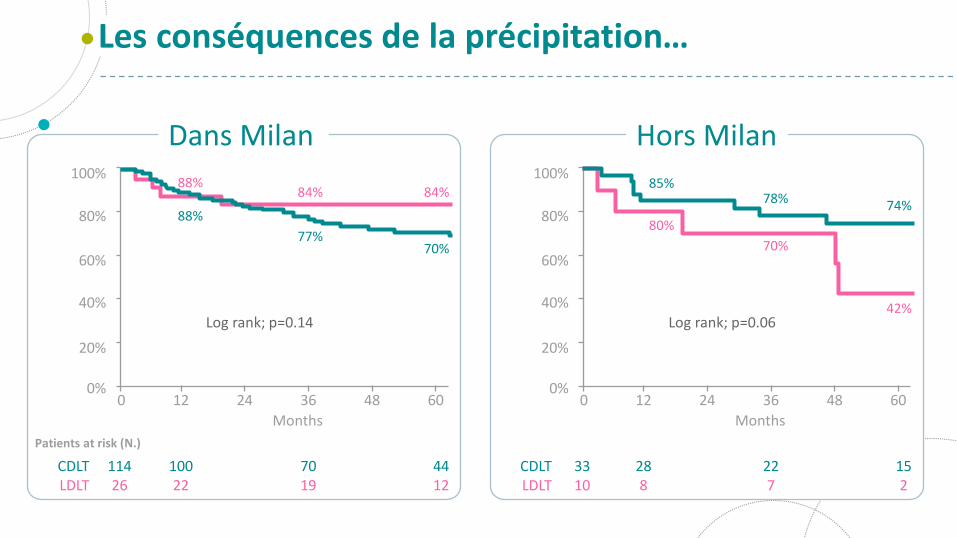
Les conséquences de la précipitation…
100%
80%
60%
40%
20%
0%0 12 24 36 48 60
Patients at risk (N.)
CDLTLDLT
11426
10022
7019
4412
Months
Log rank; p=0.14
84%
70%
84%
77%
88%
88%
100%
80%
60%
40%
20%
0%0 12 24 36 48 60
CDLTLDLT
3310
288
227
152
Months
Log rank; p=0.0642%
74%
70%
78%
80%
85%
Dans Milan Hors Milan
At the End of Year
1 2 3 4 5 6
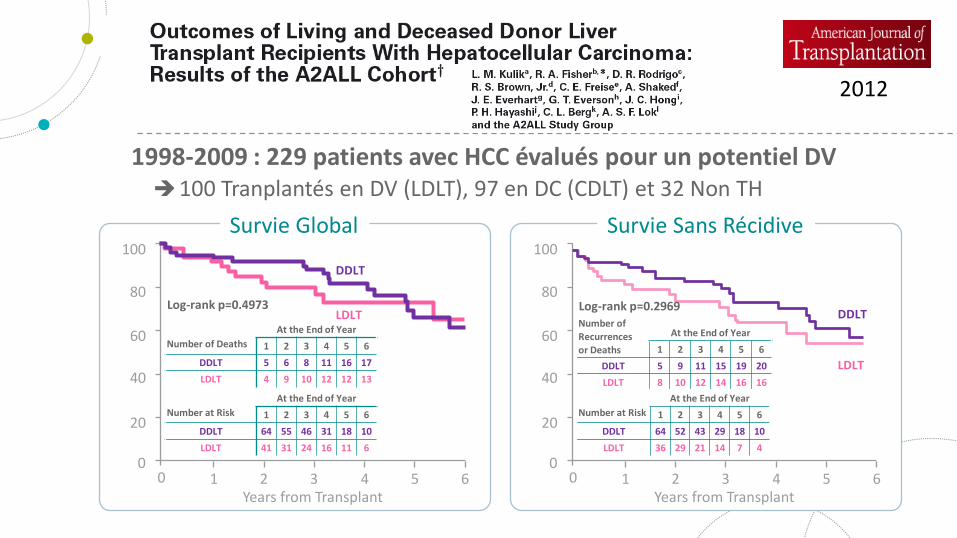
DDLT 5 9 11 15 19 20
LDLT 8 10 12 14 16 16
100
80
60
40
20
00 65
Years from Transplant4321
Survie Sans Récidive
Number of Recurrencesor Deaths
At the End of Year
1 2 3 4 5 6
DDLT 64 52 43 29 18 10
LDLT 36 29 21 14 7 4
Number at Risk
DDLT
LDLT
2012
1998-2009 : 229 patients avec HCC évalués pour un potentiel DV100 Tranplantés en DV (LDLT), 97 en DC (CDLT) et 32 Non TH
Log-rank p=0.4973
100
80
60
40
20
00 65
Years from Transplant4321
Survie Global
At the End of Year
1 2 3 4 5 6
DDLT 5 6 8 11 16 17
LDLT 4 9 10 12 12 13
Number of Deaths
At the End of Year
1 2 3 4 5 6
DDLT 64 55 46 31 18 10
LDLT 41 31 24 16 11 6
Number at Risk
DDLT
LDLTLog-rank p=0.2969
At the End of Year
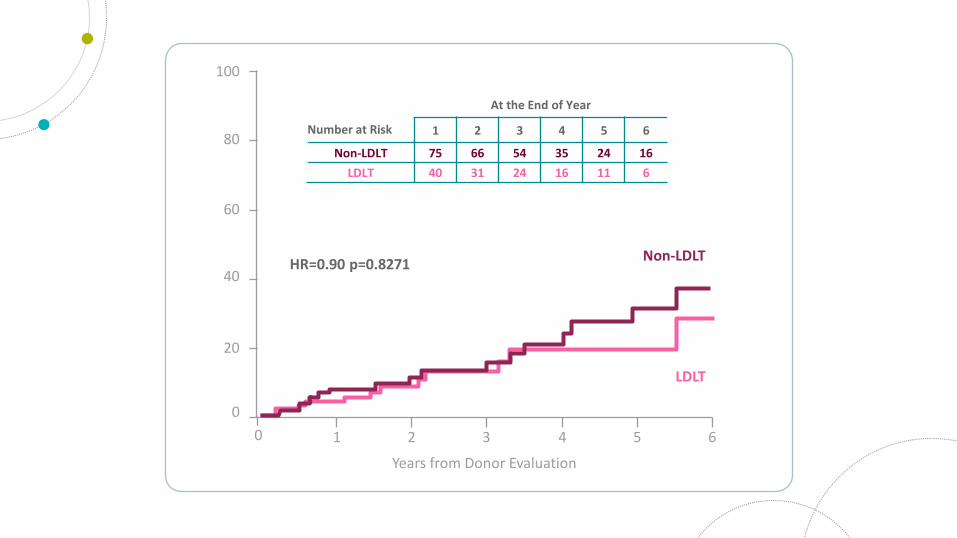
1 2 3 4 5 6
Non-LDLT 75 66 54 35 24 16
LDLT 40 31 24 16 11 6
Number at Risk
100
80
60
40
20
0
0 65
Years from Donor Evaluation
HR=0.90 p=0.8271
4321
Non-LDLT
LDLT
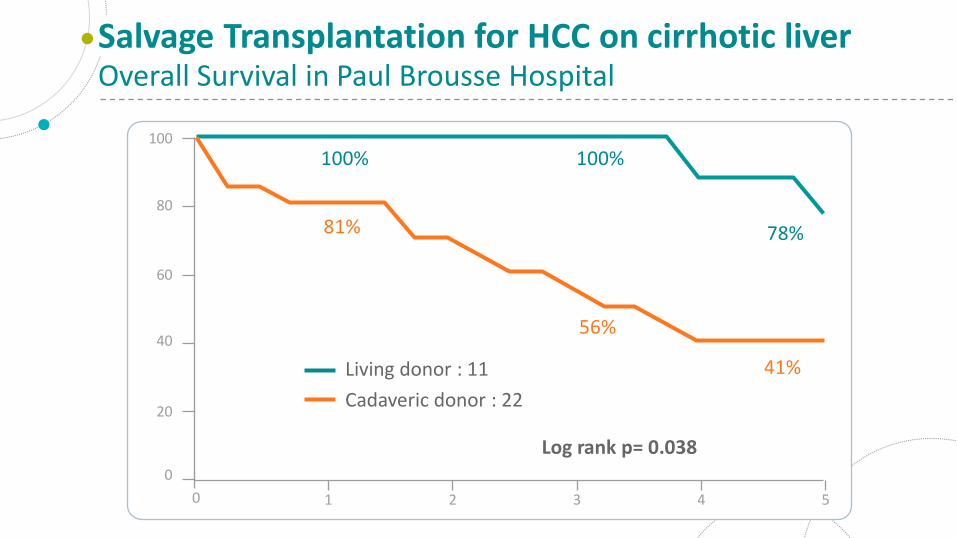
Salvage Transplantation for HCC on cirrhotic liverOverall Survival in Paul Brousse Hospital
100
Log rank p= 0.038
100%
81%
Living donor : 11
Cadaveric donor : 22
80
60
40
20
0
50 4321
100%
56%
78%
41%
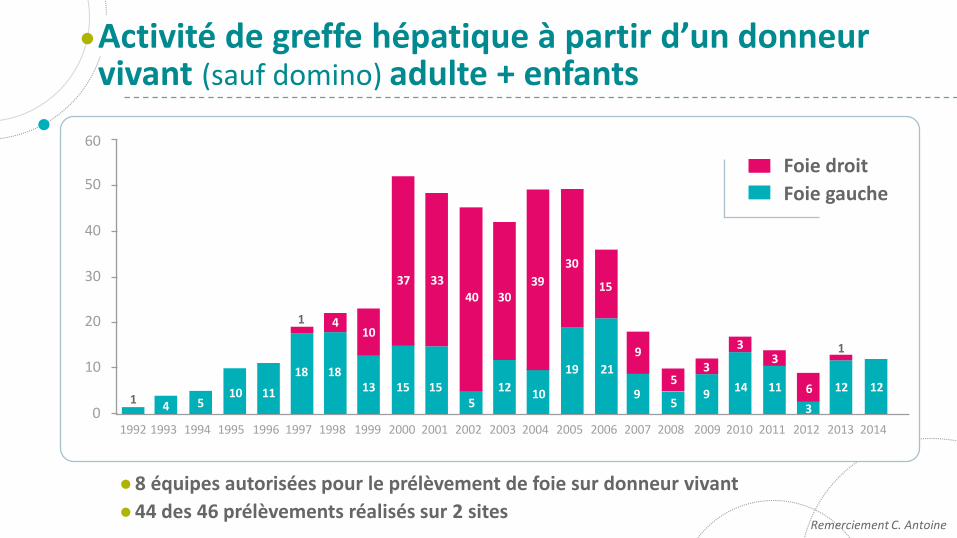
Activité de greffe hépatique à partir d’un donneur vivant (sauf domino) adulte + enfants
Remerciement C. Antoine
60
50
40
30
20
10
01992 1993 1994 1995 1996 1997 1998 1999 2000 2001 2002 2003 2004 2005 2006 2007 2008 2009 2010 2011 2012 2013 2014
8 équipes autorisées pour le prélèvement de foie sur donneur vivant
44 des 46 prélèvements réalisés sur 2 sites
Foie droit
Foie gauche
14 5
10 11
18 1813 15 15
512
10
19 21
95
914 11
3
12 12
1 410
37 33
40 3039
30
15
9
53
33
6
1
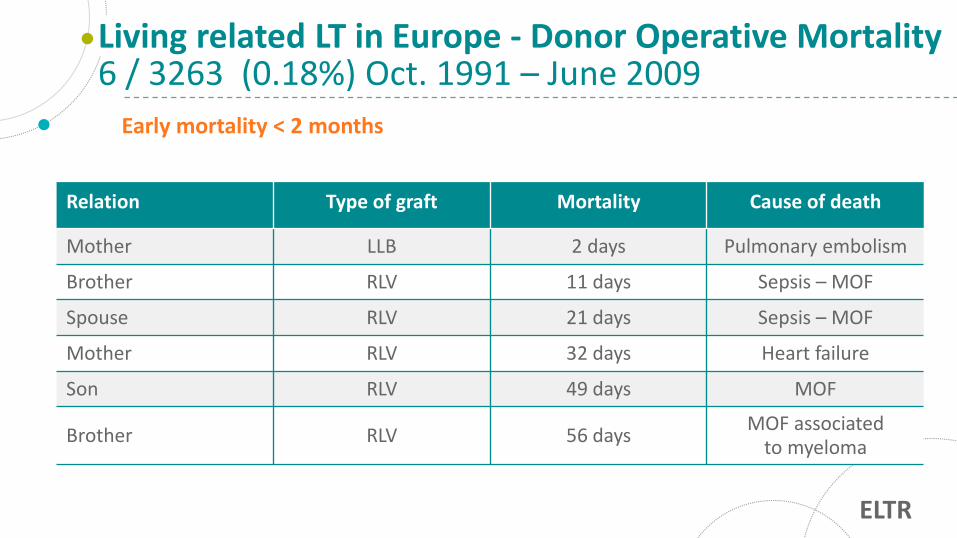
Living related LT in Europe - Donor Operative Mortality6 / 3263 (0.18%) Oct. 1991 – June 2009
Early mortality < 2 months
Relation Type of graft Mortality Cause of death
Mother LLB 2 days Pulmonary embolism
Brother RLV 11 days Sepsis – MOF
Spouse RLV 21 days Sepsis – MOF
Mother RLV 32 days Heart failure
Son RLV 49 days MOF
Brother RLV 56 daysMOF associated
to myeloma
ELTR
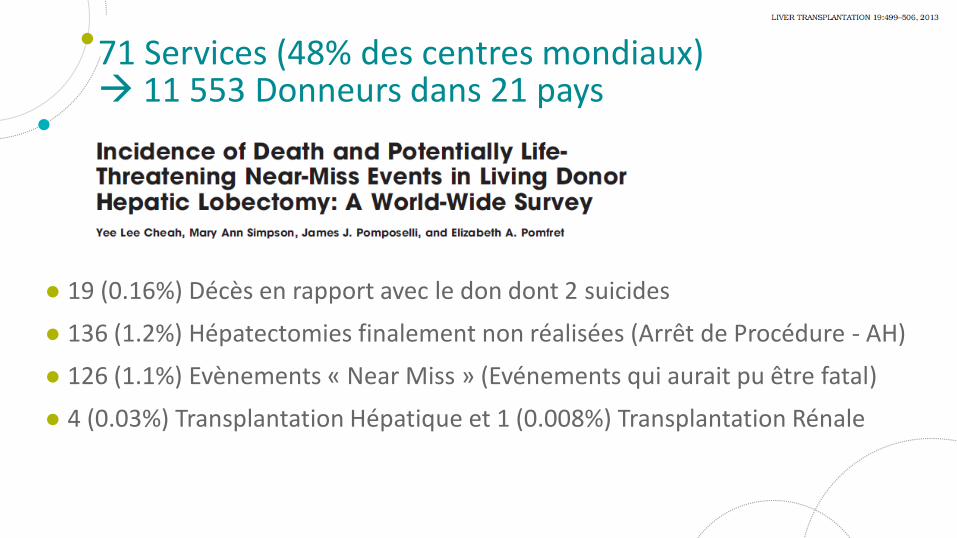
19 (0.16%) Décès en rapport avec le don dont 2 suicides
136 (1.2%) Hépatectomies finalement non réalisées (Arrêt de Procédure - AH)
126 (1.1%) Evènements « Near Miss » (Evénements qui aurait pu être fatal)
4 (0.03%) Transplantation Hépatique et 1 (0.008%) Transplantation Rénale
71 Services (48% des centres mondiaux) 11 553 Donneurs dans 21 pays
2000-2009n=90
DV1 - DV45n=45
DV45 - DV90n=45
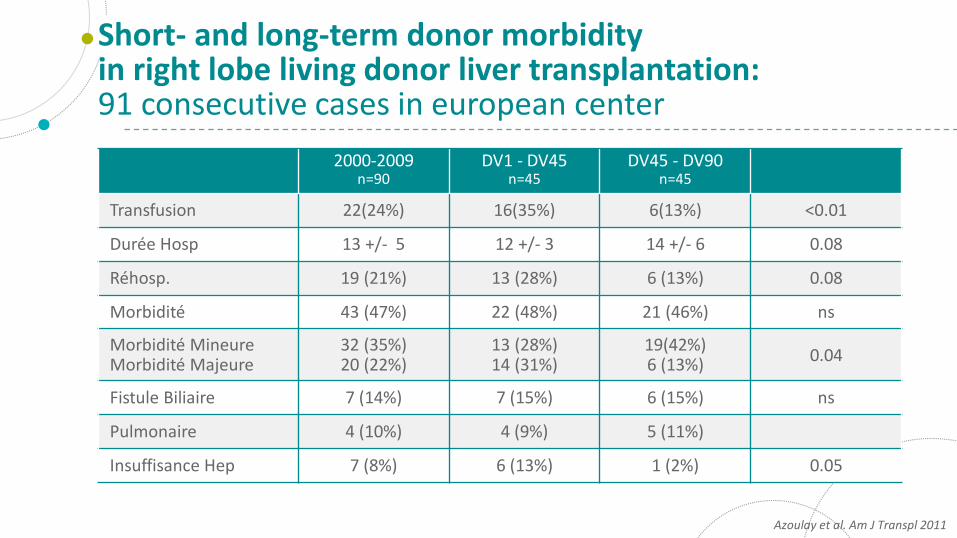
Transfusion 22(24%) 16(35%) 6(13%) <0.01
Durée Hosp 13 +/- 5 12 +/- 3 14 +/- 6 0.08
Réhosp. 19 (21%) 13 (28%) 6 (13%) 0.08
Morbidité 43 (47%) 22 (48%) 21 (46%) ns
Morbidité MineureMorbidité Majeure
32 (35%)20 (22%)
13 (28%)14 (31%)
19(42%)6 (13%)
0.04
Fistule Biliaire 7 (14%) 7 (15%) 6 (15%) ns
Pulmonaire 4 (10%) 4 (9%) 5 (11%)
Insuffisance Hep 7 (8%) 6 (13%) 1 (2%) 0.05
Short- and long-term donor morbidityin right lobe living donor liver transplantation:91 consecutive cases in european center
Azoulay et al. Am J Transpl 2011
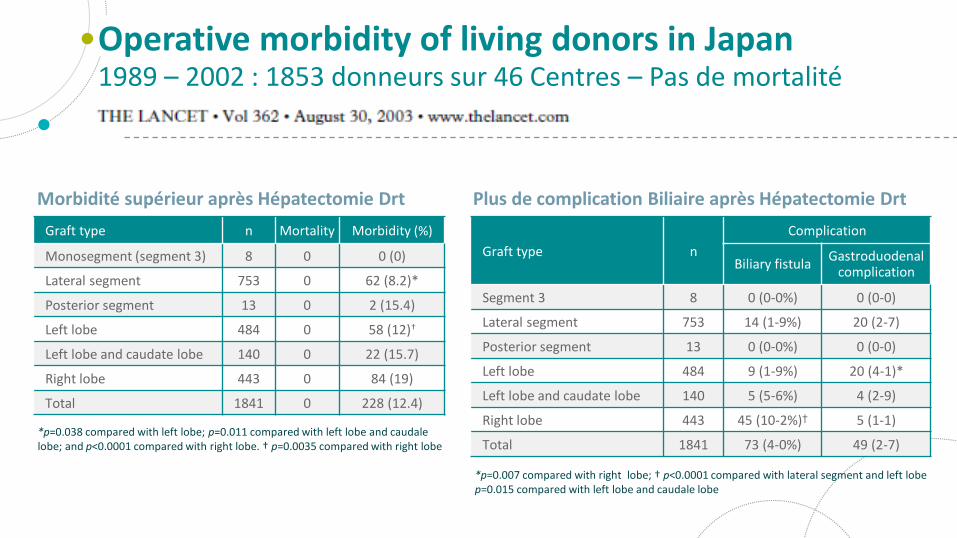
Operative morbidity of living donors in Japan1989 – 2002 : 1853 donneurs sur 46 Centres – Pas de mortalité
Graft type n Mortality Morbidity (%)
Monosegment (segment 3) 8 0 0 (0)
Lateral segment 753 0 62 (8.2)*
Posterior segment 13 0 2 (15.4)
Left lobe 484 0 58 (12)†
Left lobe and caudate lobe 140 0 22 (15.7)
Right lobe 443 0 84 (19)
Total 1841 0 228 (12.4)
*p=0.038 compared with left lobe; p=0.011 compared with left lobe and caudale lobe; and p<0.0001 compared with right lobe. † p=0.0035 compared with right lobe
Graft type n
Complication
Biliary fistulaGastroduodenal
complication
Segment 3 8 0 (0-0%) 0 (0-0)
Lateral segment 753 14 (1-9%) 20 (2-7)
Posterior segment 13 0 (0-0%) 0 (0-0)
Left lobe 484 9 (1-9%) 20 (4-1)*
Left lobe and caudate lobe 140 5 (5-6%) 4 (2-9)
Right lobe 443 45 (10-2%)† 5 (1-1)
Total 1841 73 (4-0%) 49 (2-7)
*p=0.007 compared with right lobe; † p<0.0001 compared with lateral segment and left lobe p=0.015 compared with left lobe and caudale lobe
Plus de complication Biliaire après Hépatectomie DrtMorbidité supérieur après Hépatectomie Drt
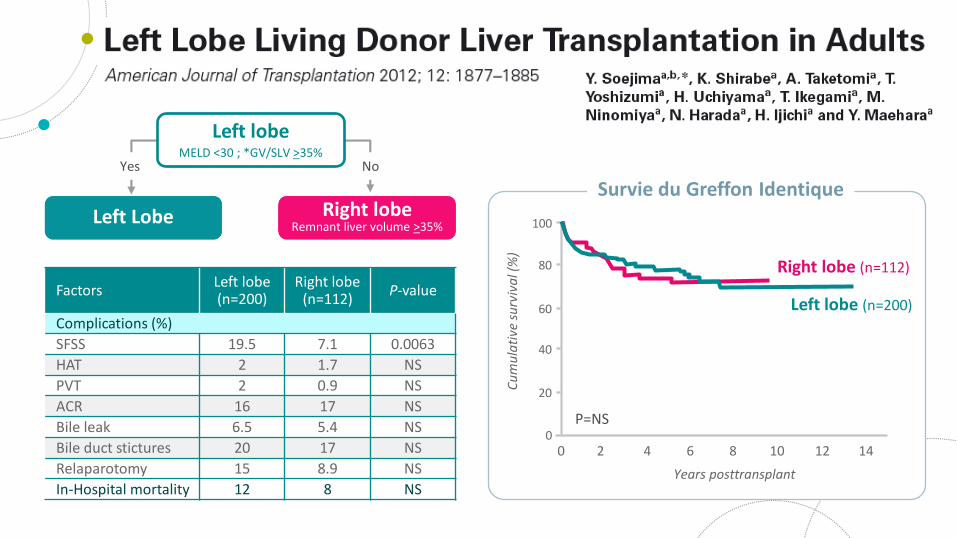
FactorsLeft lobe(n=200)
Right lobe(n=112)
P-value
Complications (%)
SFSS 19.5 7.1 0.0063
HAT 2 1.7 NS
PVT 2 0.9 NS
ACR 16 17 NS
Bile leak 6.5 5.4 NS
Bile duct stictures 20 17 NS
Relaparotomy 15 8.9 NS
In-Hospital mortality 12 8 NSYears posttransplant
0
20
40
60
80
100
2 4 6 10 12 14
Survie du Greffon Identique
0 8
Right lobe (n=112)
Left lobe (n=200)
P=NS
Cu
mu
lati
ve s
urv
iva
l (%
)
Left Lobe
Left lobeMELD <30 ; *GV/SLV >35%
Right lobeRemnant liver volume >35%
Yes No
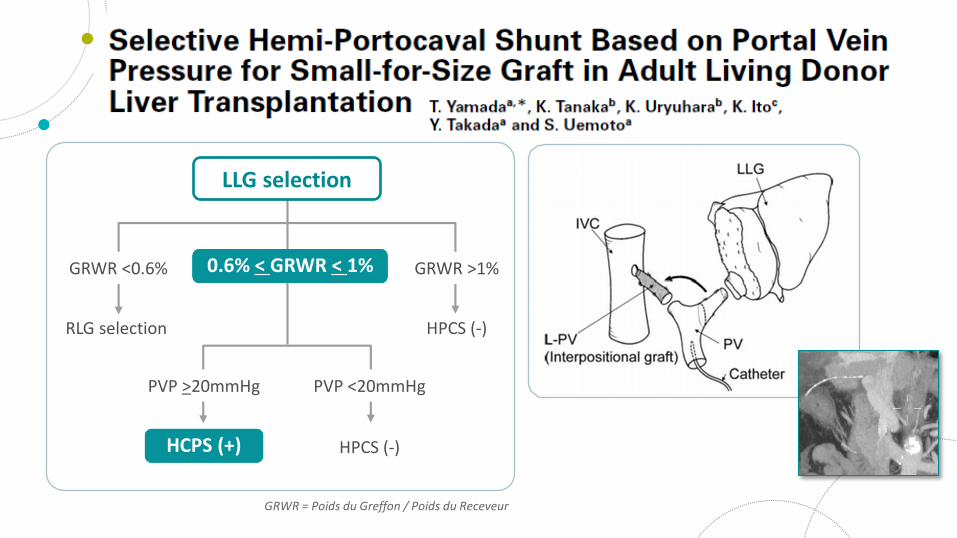
RLG selection HPCS (-)
GRWR = Poids du Greffon / Poids du Receveur
LLG selection
GRWR <0.6% GRWR >1%0.6% < GRWR < 1%
PVP >20mmHg PVP <20mmHg
HPCS (-)HCPS (+)
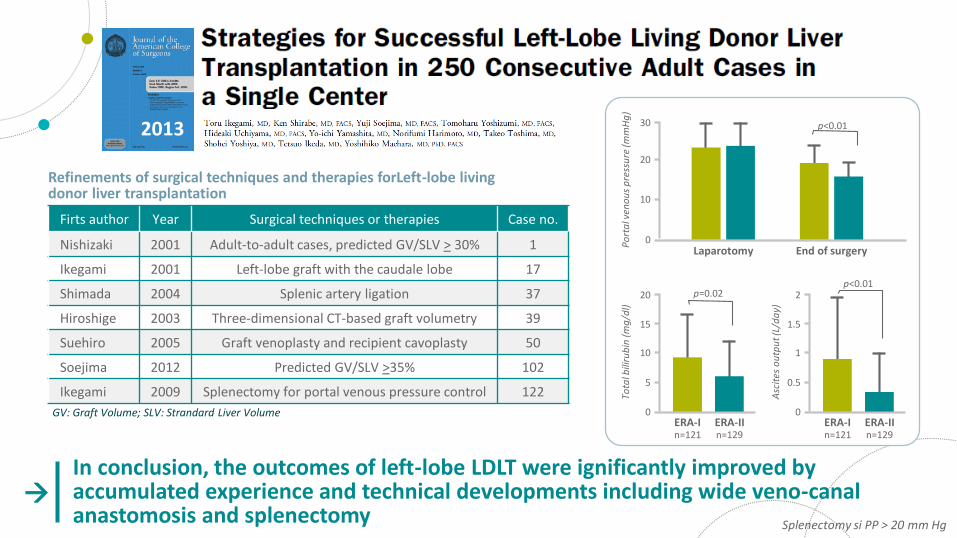
2013
Splenectomy si PP > 20 mm Hg
Firts author Year Surgical techniques or therapies Case no.
Nishizaki 2001 Adult-to-adult cases, predicted GV/SLV > 30% 1
Ikegami 2001 Left-lobe graft with the caudale lobe 17
Shimada 2004 Splenic artery ligation 37
Hiroshige 2003 Three-dimensional CT-based graft volumetry 39
Suehiro 2005 Graft venoplasty and recipient cavoplasty 50
Soejima 2012 Predicted GV/SLV >35% 102
Ikegami 2009 Splenectomy for portal venous pressure control 122
Refinements of surgical techniques and therapies forLeft-lobe living donor liver transplantation
GV: Graft Volume; SLV: Strandard Liver Volume
0
10
20
30
Laparotomy
Po
rta
l ven
ou
s p
ress
ure
(mm
Hg
)
End of surgery
p<0.01
0
10
15
20
ERA-In=121
Tota
l bili
rub
in (
mg
/dl)
p=0.02
5
ERA-IIn=129
0
1
1.5
2
ERA-In=121
Asc
ites
ou
tpu
t (L/
da
y)
p<0.01
0.5
ERA-IIn=129
In conclusion, the outcomes of left-lobe LDLT were ignificantly improved by accumulated experience and technical developments including wide veno-canal anastomosis and splenectomy
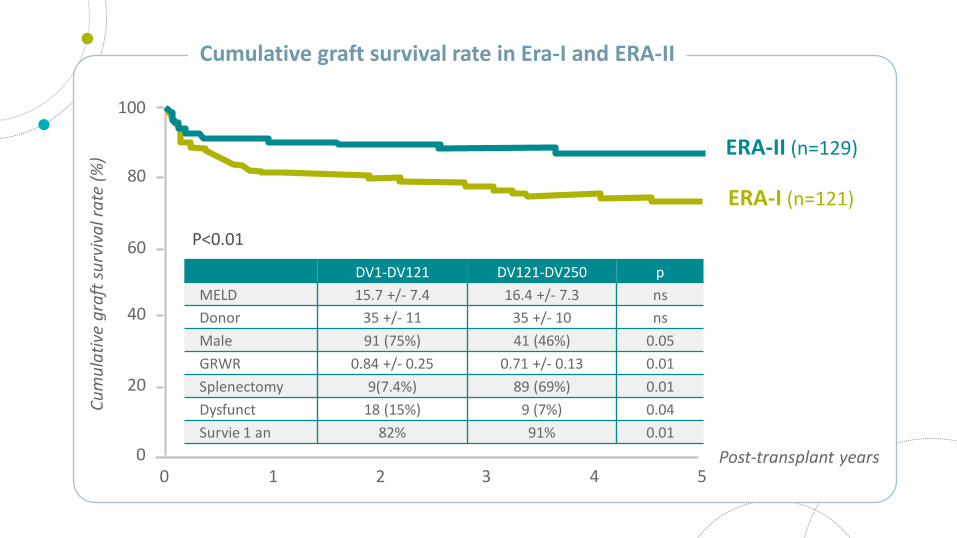
Post-transplant years0
20
40
60
80
100
1 2 3 5
Cumulative graft survival rate in Era-I and ERA-II
0 4
ERA-I (n=121)
ERA-II (n=129)
P<0.01
Cu
mu
lati
ve g
raft
su
rviv
al r
ate
(%
)
DV1-DV121 DV121-DV250 p
MELD 15.7 +/- 7.4 16.4 +/- 7.3 ns
Donor 35 +/- 11 35 +/- 10 ns
Male 91 (75%) 41 (46%) 0.05
GRWR 0.84 +/- 0.25 0.71 +/- 0.13 0.01
Splenectomy 9(7.4%) 89 (69%) 0.01
Dysfunct 18 (15%) 9 (7%) 0.04
Survie 1 an 82% 91% 0.01
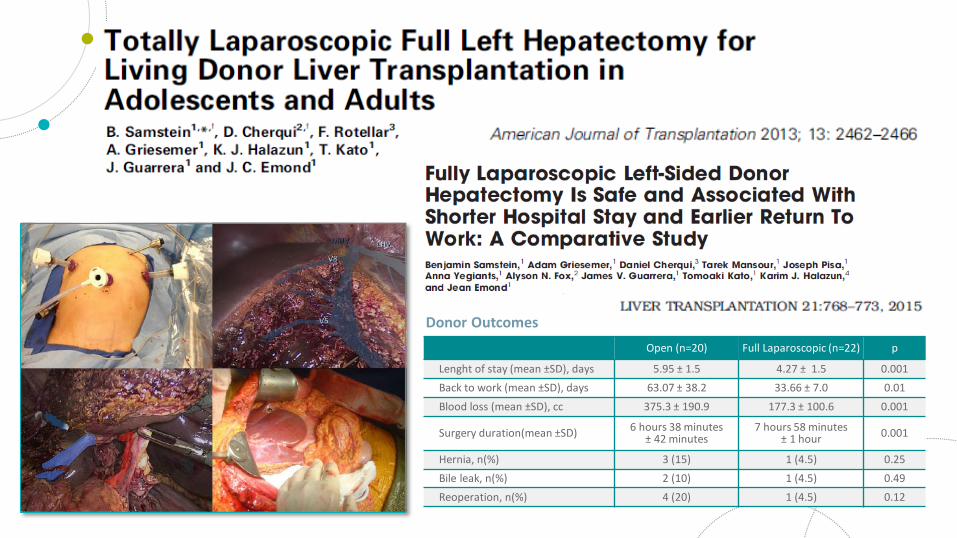
Open (n=20) Full Laparoscopic (n=22) p
Lenght of stay (mean ±SD), days 5.95 ± 1.5 4.27 ± 1.5 0.001
Back to work (mean ±SD), days 63.07 ± 38.2 33.66 ± 7.0 0.01
Blood loss (mean ±SD), cc 375.3 ± 190.9 177.3 ± 100.6 0.001
Surgery duration(mean ±SD) 6 hours 38 minutes± 42 minutes
7 hours 58 minutes± 1 hour 0.001
Hernia, n(%) 3 (15) 1 (4.5) 0.25
Bile leak, n(%) 2 (10) 1 (4.5) 0.49
Reoperation, n(%) 4 (20) 1 (4.5) 0.12
Donor Outcomes
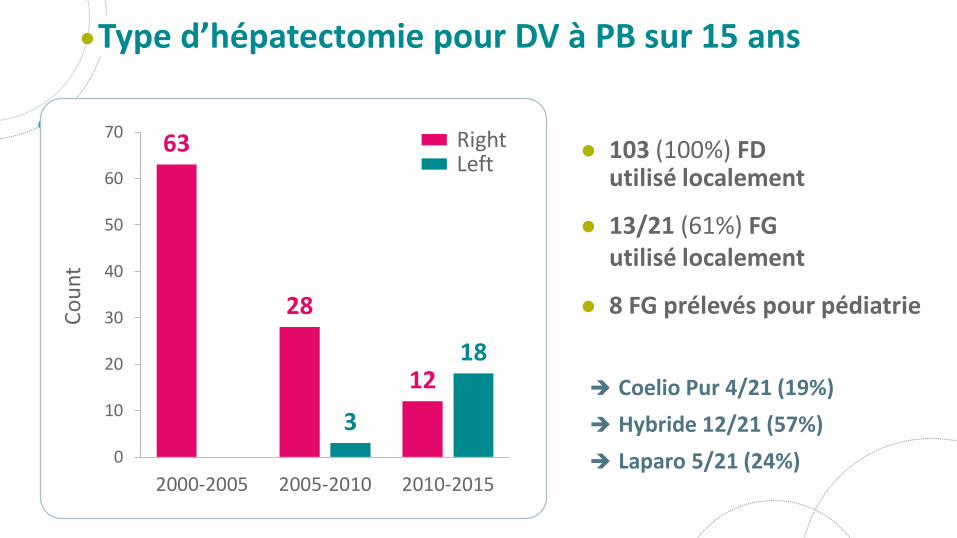
103 (100%) FDutilisé localement
13/21 (61%) FGutilisé localement
8 FG prélevés pour pédiatrie
Type d’hépatectomie pour DV à PB sur 15 ans
Coelio Pur 4/21 (19%)
Hybride 12/21 (57%)
Laparo 5/21 (24%)
63
28
12
3
18
0
10
20
30
40
50
60
70
2000-2005 2005-2010 2010-2015
Co
un
t
RightLeft
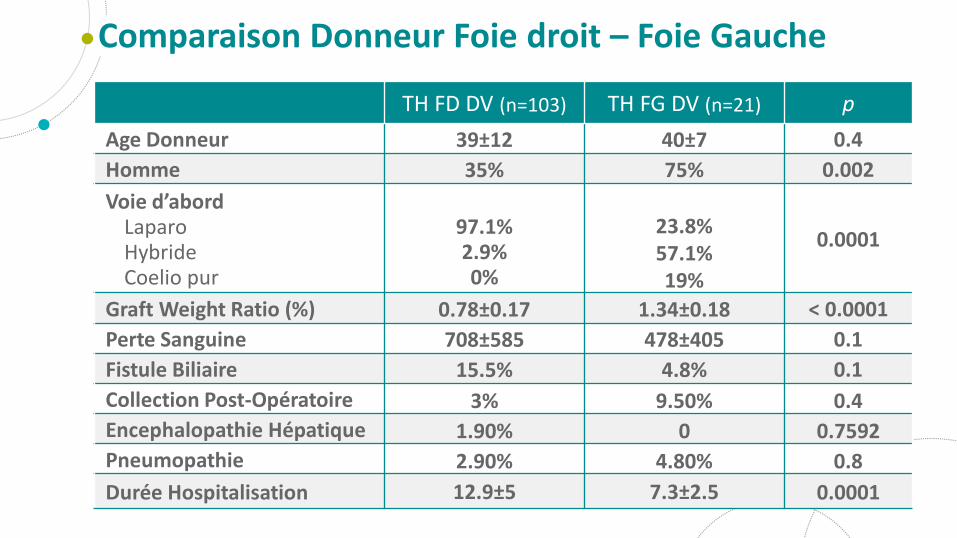
Comparaison Donneur Foie droit – Foie Gauche
TH FD DV (n=103) TH FG DV (n=21) p
Age Donneur 39±12 40±7 0.4
Homme 35% 75% 0.002
Voie d’abordLaparoHybrideCoelio pur
97.1%2.9%0%
23.8%57.1%19%
0.0001
Graft Weight Ratio (%) 0.78±0.17 1.34±0.18 < 0.0001
Perte Sanguine 708±585 478±405 0.1
Fistule Biliaire 15.5% 4.8% 0.1
Collection Post-Opératoire 3% 9.50% 0.4
Encephalopathie Hépatique 1.90% 0 0.7592
Pneumopathie 2.90% 4.80% 0.8
Durée Hospitalisation 12.9±5 7.3±2.5 0.0001
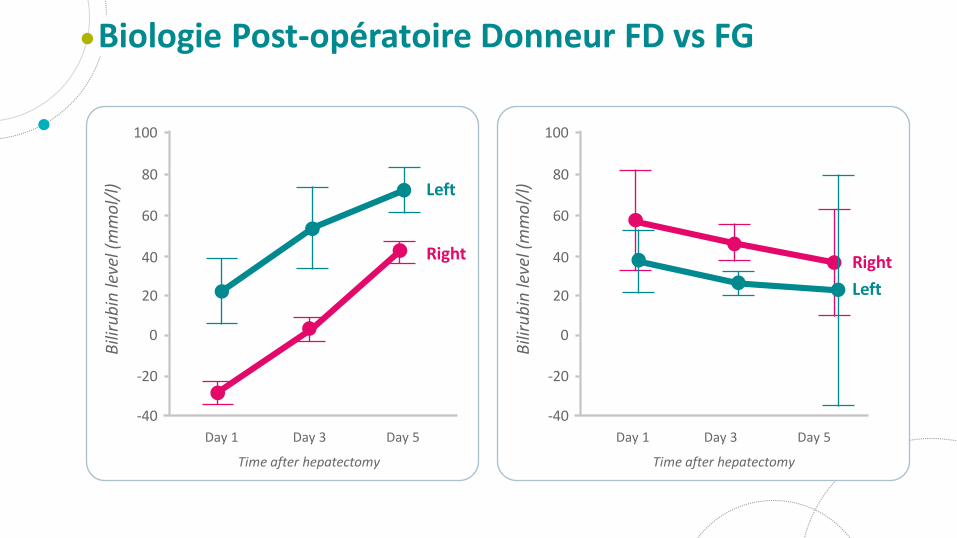
Biologie Post-opératoire Donneur FD vs FG
Time after hepatectomy
-40
20
40
60
80
100
Day 1 Day 5Day 3
Right
Left
Bili
rub
in le
vel (
mm
ol/
l)
0
-20
Time after hepatectomy
-40
20
40
60
80
100
Day 1 Day 5Day 3
Right
Left
Bili
rub
in le
vel (
mm
ol/
l)
0
-20
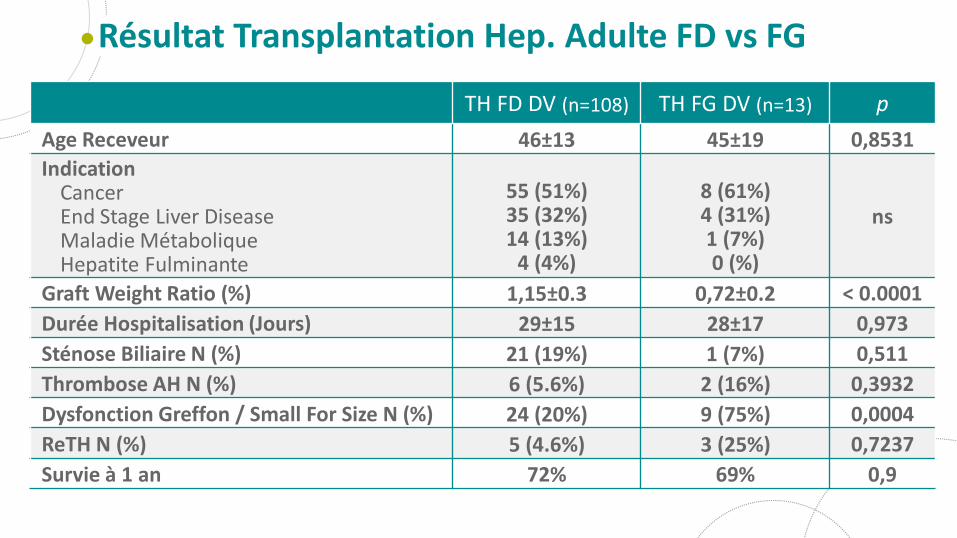
Résultat Transplantation Hep. Adulte FD vs FG
TH FD DV (n=108) TH FG DV (n=13) p
Age Receveur 46±13 45±19 0,8531
IndicationCancerEnd Stage Liver DiseaseMaladie MétaboliqueHepatite Fulminante
55 (51%)35 (32%)14 (13%)
4 (4%)
8 (61%)4 (31%)1 (7%)0 (%)
ns
Graft Weight Ratio (%) 1,15±0.3 0,72±0.2 < 0.0001
Durée Hospitalisation (Jours) 29±15 28±17 0,973
Sténose Biliaire N (%) 21 (19%) 1 (7%) 0,511
Thrombose AH N (%) 6 (5.6%) 2 (16%) 0,3932
Dysfonction Greffon / Small For Size N (%) 24 (20%) 9 (75%) 0,0004
ReTH N (%) 5 (4.6%) 3 (25%) 0,7237
Survie à 1 an 72% 69% 0,9
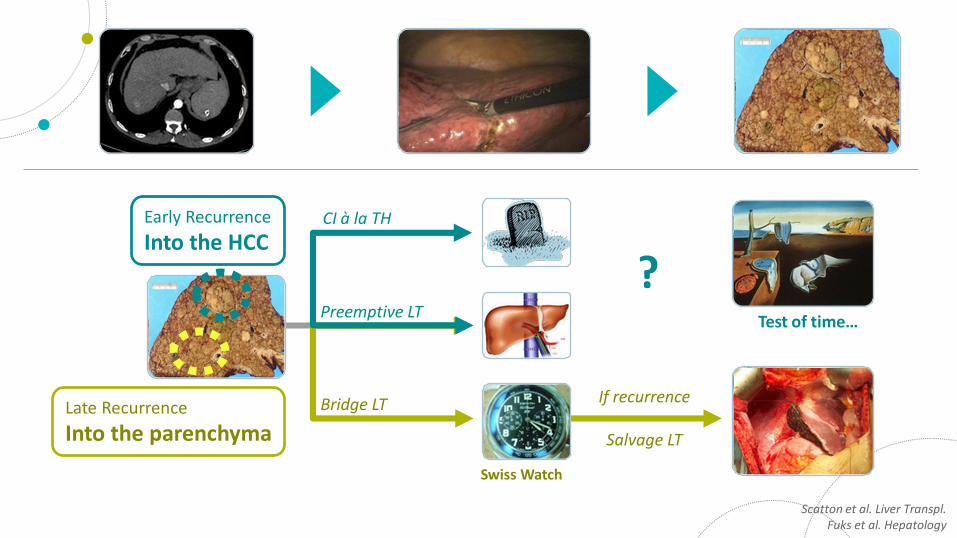
Early Recurrence
Into the HCC
Preemptive LT
CI à la TH
?Test of time…
Swiss Watch
Late Recurrence
Into the parenchyma
Scatton et al. Liver Transpl. Fuks et al. Hepatology
Bridge LT If recurrence
Salvage LT
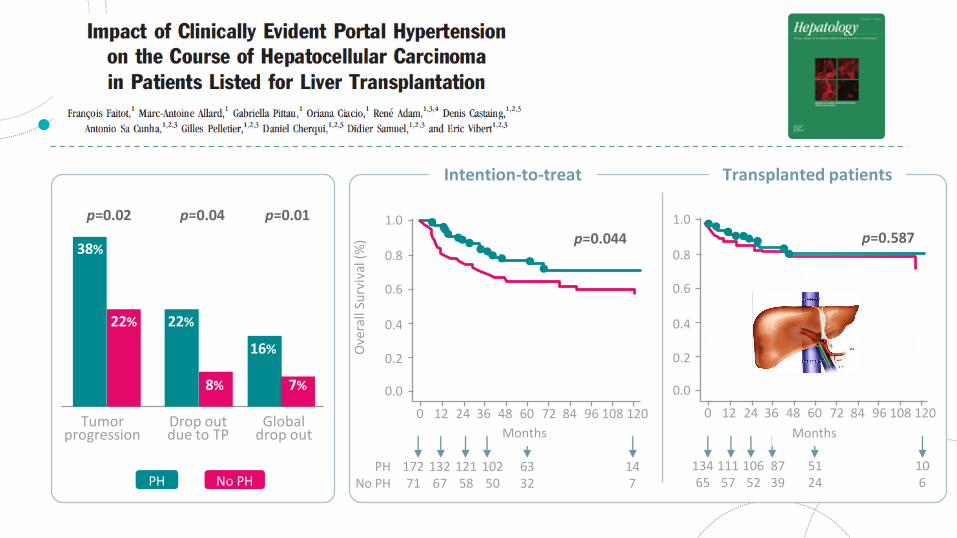
2015
0.6
0.4
0.0
0
p=0.587
0.2
0.8
9624 48 72 12012 36 60 84 108
1.0
13465
11157
10652
5124
8739
106
Intention-to-treat Transplanted patients
6332
0.6
0.4
0.0
0
p=0.044
0.2O
vera
llSu
rviv
al(%
)
0.8
9624 48 72 12012 36 60 84 108
1.0
17271
13267
12158
10250
147
PHNo PH
Months
p=0.01
Months
p=0.04p=0.02
38%
22% 22%
16%
7%8%
Globaldrop out
Tumorprogression
Drop outdue to TP
No PHPH
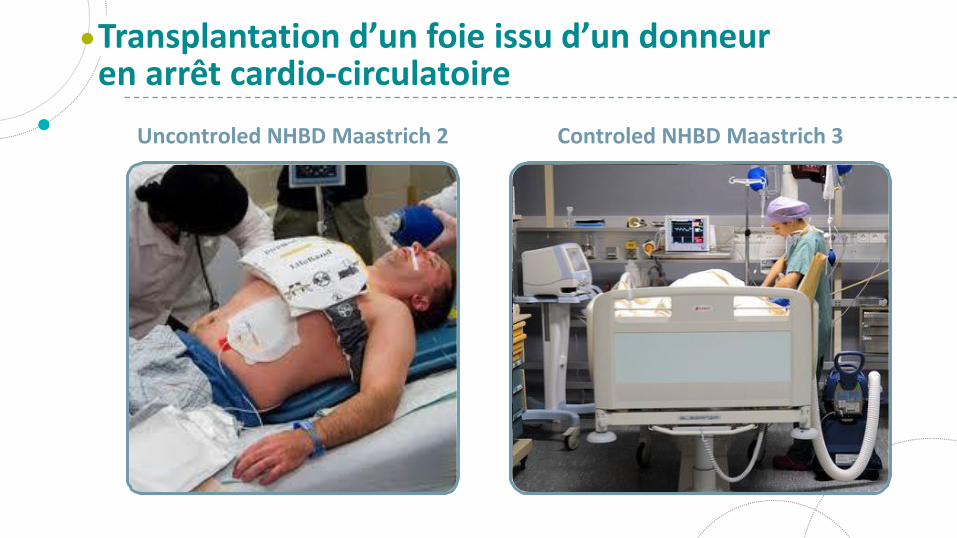
Uncontroled NHBD Maastrich 2 Controled NHBD Maastrich 3
Transplantation d’un foie issu d’un donneur en arrêt cardio-circulatoire
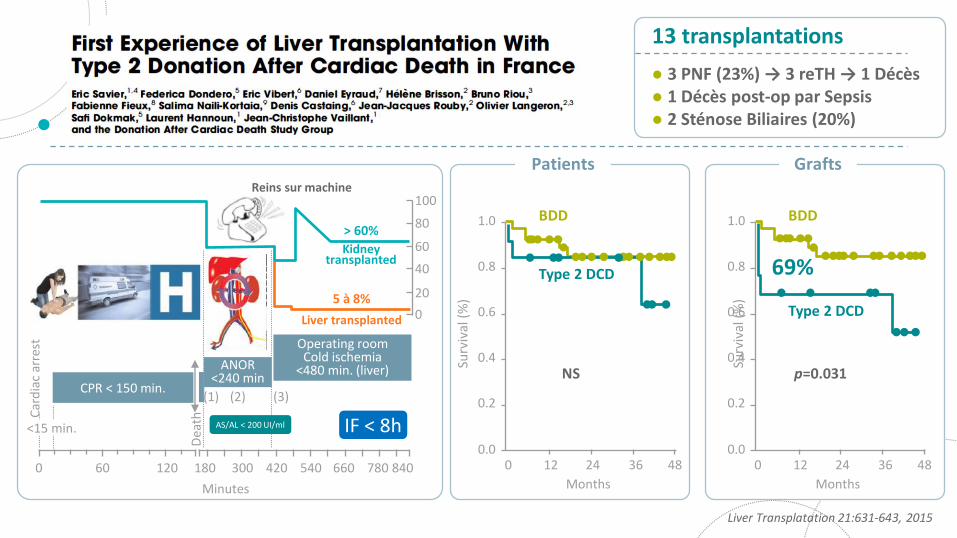
5 à 8%
> 60%
IF < 8h
0 60 120 840660540420300180 780
Minutes
<15 min.
Car
dia
car
rest
CPR < 150 min.
Dea
th
Operating roomCold ischemia
<480 min. (liver)ANOR<240 min
(1) (2) (3)
AS/AL < 200 UI/ml
0
20
40
60
80
100
Kidneytransplanted
Liver transplanted
Reins sur machine
NS
BDD
Type 2 DCD
0.2
Surv
ival
(%)
0.4
0.6
0.8
1.0
0.0480 12 24 36
Months
69%
p=0.031
0.0
0.2
Surv
ival
(%)
0.4
0.6
0.8
1.0 BDD
Type 2 DCD
480 12 24 36
Months
Patients Grafts
Liver Transplatation 21:631-643, 2015
13 transplantations
3 PNF (23%) → 3 reTH → 1 Décès 1 Décès post-op par Sepsis 2 Sténose Biliaires (20%)

2010200920082007200620052004
80
90
70
60
50
40
30
20
10
020032002*
132
26
11
29
18
41429
21025
71631
41735
42045
81659
Transplants (n=34)
Organ Donors (n=111)
Potential Donors (N=255)
-110 excluded during CRS
-145 excluded during NECMO
-111 excluded at organ recovery
400 protocol activations
290 canulations
145 organ donors
34 OLT 8,5%
< 15 min asystolie ≤150 min de planche à masser ≤240 min de NECMO
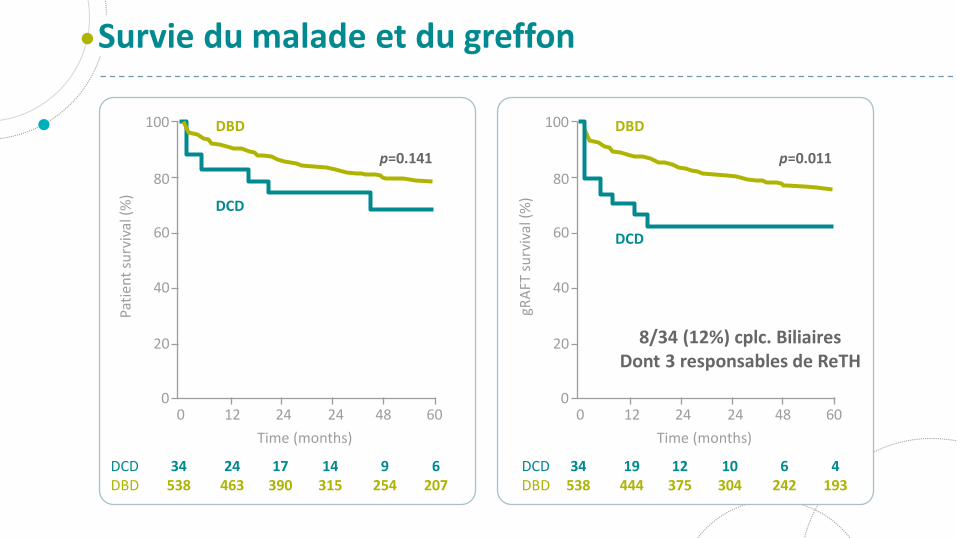
8/34 (12%) cplc. BiliairesDont 3 responsables de ReTH
Survie du malade et du greffon
DCDDBD
6207
9254
14315
17390
24463
34538
0
20
Pati
ent
surv
ival
(%)
40
60
80
100 DBD
p=0.141
DCD
60480 12 24 24
Time (months)
DCDDBD
4193
6242
10304
12375
19444
34538
DBD
p=0.011
DCD
20
gRA
FTsu
rviv
al(%
)
40
60
80
100
060480 12 24 24
Time (months)
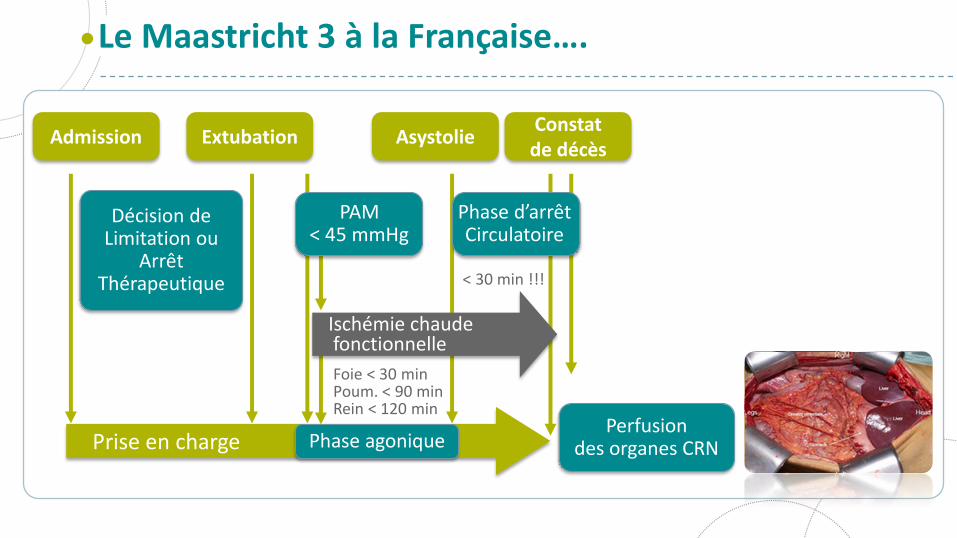
Phase d’arrêt Circulatoire
Prise en charge
Décision de Limitation ou
Arrêt Thérapeutique
Foie < 30 minPoum. < 90 minRein < 120 min
Le Maastricht 3 à la Française….
Perfusion des organes CRN
Admission ExtubationConstat de décès
Asystolie
PAM < 45 mmHg
Phase agonique
< 30 min !!!
Ischémie chaudefonctionnelle
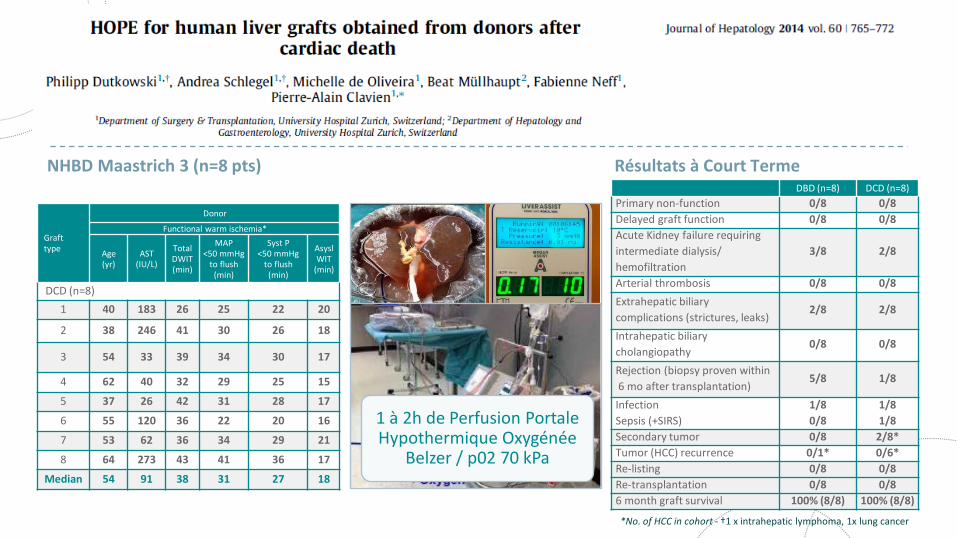
NHBD Maastrich 3 (n=8 pts) Résultats à Court Terme
Grafttype
Donor
Functional warm ischemia*
Age(yr)
AST(IU/L)
Total DWIT (min)
MAP<50 mmHg
to flush (min)
Syst P<50 mmHg
to flush (min)
AsyslWIT
(min)
DCD (n=8)
1 40 183 26 25 22 20
2 38 246 41 30 26 18
3 54 33 39 34 30 17
4 62 40 32 29 25 15
5 37 26 42 31 28 17
6 55 120 36 22 20 16
7 53 62 36 34 29 21
8 64 273 43 41 36 17
Median 54 91 38 31 27 18
*No. of HCC in cohort - †1 x intrahepatic lymphoma, 1x lung cancer
DBD (n=8) DCD (n=8)
Primary non-function 0/8 0/8
Delayed graft function 0/8 0/8
Acute Kidney failure requiring
intermediate dialysis/
hemofiltration
3/8 2/8
Arterial thrombosis 0/8 0/8
Extrahepatic biliary
complications (strictures, leaks)2/8 2/8
Intrahepatic biliary
cholangiopathy0/8 0/8
Rejection (biopsy proven within
6 mo after transplantation)5/8 1/8
Infection
Sepsis (+SIRS)
1/8
0/8
1/8
1/8
Secondary tumor 0/8 2/8*
Tumor (HCC) recurrence 0/1* 0/6*
Re-listing 0/8 0/8
Re-transplantation 0/8 0/8
6 month graft survival 100% (8/8) 100% (8/8)
1 à 2h de Perfusion Portale Hypothermique Oxygénée
Belzer / p02 70 kPa
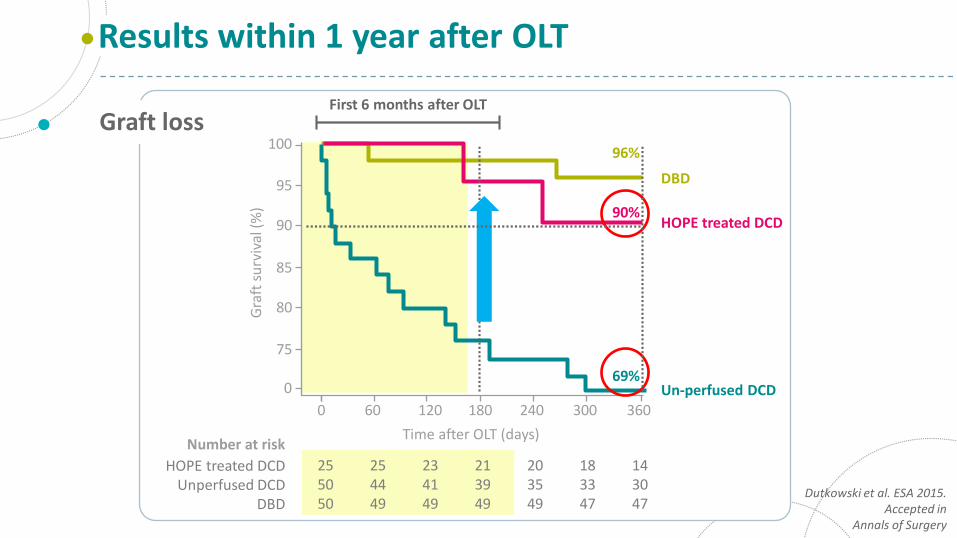
Graft loss
Results within 1 year after OLT
Dutkowski et al. ESA 2015.Accepted in
Annals of Surgery
0
75
0
Time after OLT (days)
Gra
ftsu
rviv
al(%
)
DBD
255050
Number at risk
HOPE treated DCDUnperfused DCD
DBD
80
85
90
95
100
60 120 180 240 300 360
254449
234149
213949
183347
203549
143047
HOPE treated DCD
Un-perfused DCD69%
96%
90%
First 6 months after OLT
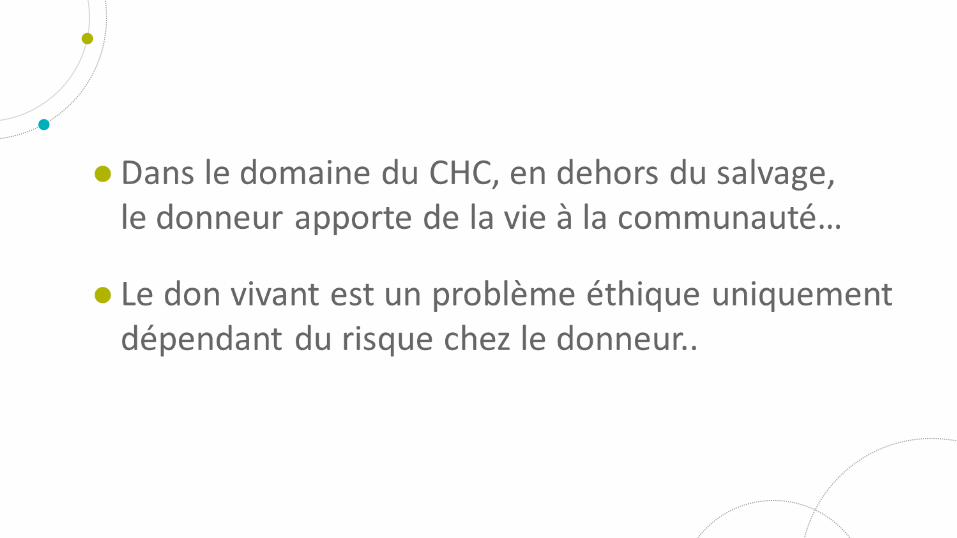
Dans le domaine du CHC, la TH DV ne modifie pas la survie des patients. C’est un greffon supplémentaire pour l’ensemble des malades sur liste
L’utilisation du foie gauche de donneur vivant chez des malades avec peu ou pas d’hypertension portale (en absence de modulation de flux portale) est raisonnable
Les résultats de la TH à cœur arrêté Maastricht 3 « à la Française » seront liés aux machines des perfusions
Conclusions
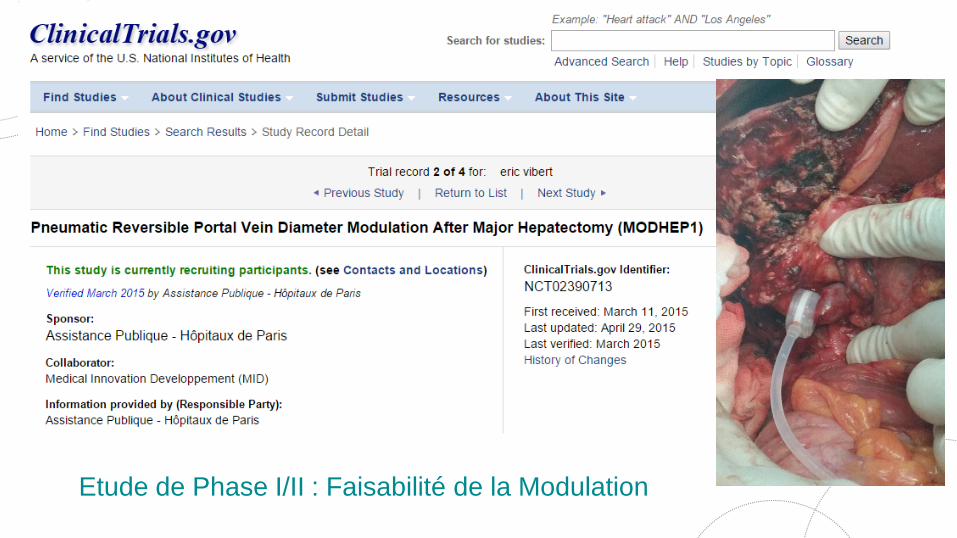
Etude de Phase I/II : Faisabilité de la Modulation