Embed Size (px)
Citation preview
1
Year-end Report, January–December 2014 Erik Ljungberg, Corporate Relations
2
Business overview Martin Lundstedt, President and CEO
Summary of 2014
Order bookings in line with 2013
Higher truck market share in Europe and Russia
Record levels in Services and Engines
Record earnings in Financial Services
3
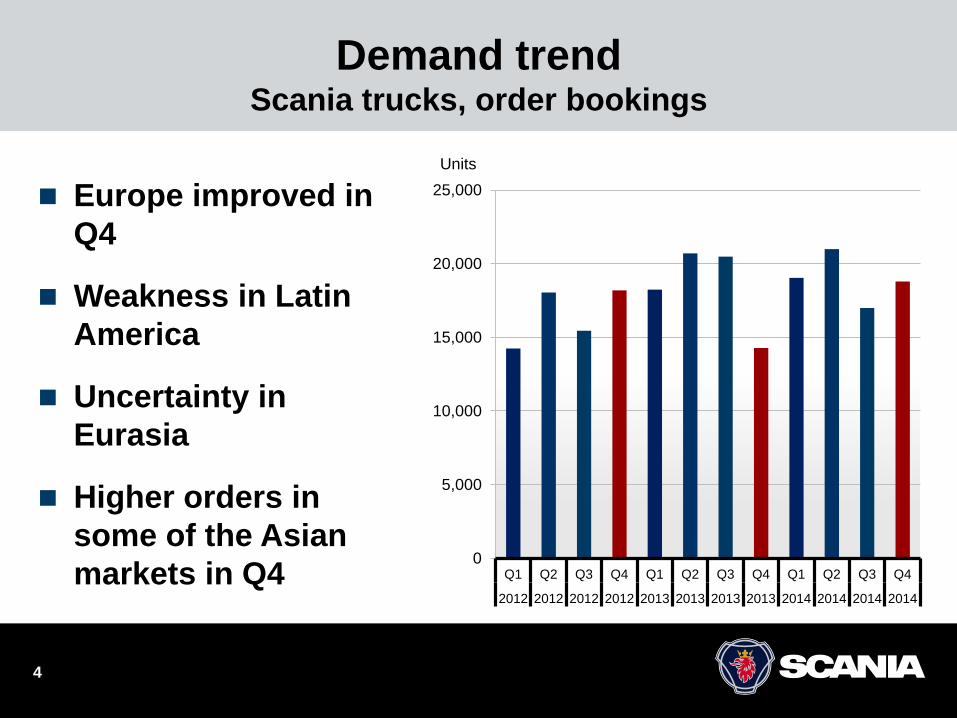
Demand trend Scania trucks, order bookings
4
Europe improved in Q4
Weakness in Latin America
Uncertainty in Eurasia
Higher orders in some of the Asian markets in Q4
0
5,000
10,000
15,000
20,000
25,000
Q1 Q2 Q3 Q4 Q1 Q2 Q3 Q4 Q1 Q2 Q3 Q4
2012 2012 2012 2012 2013 2013 2013 2013 2014 2014 2014 2014
Units
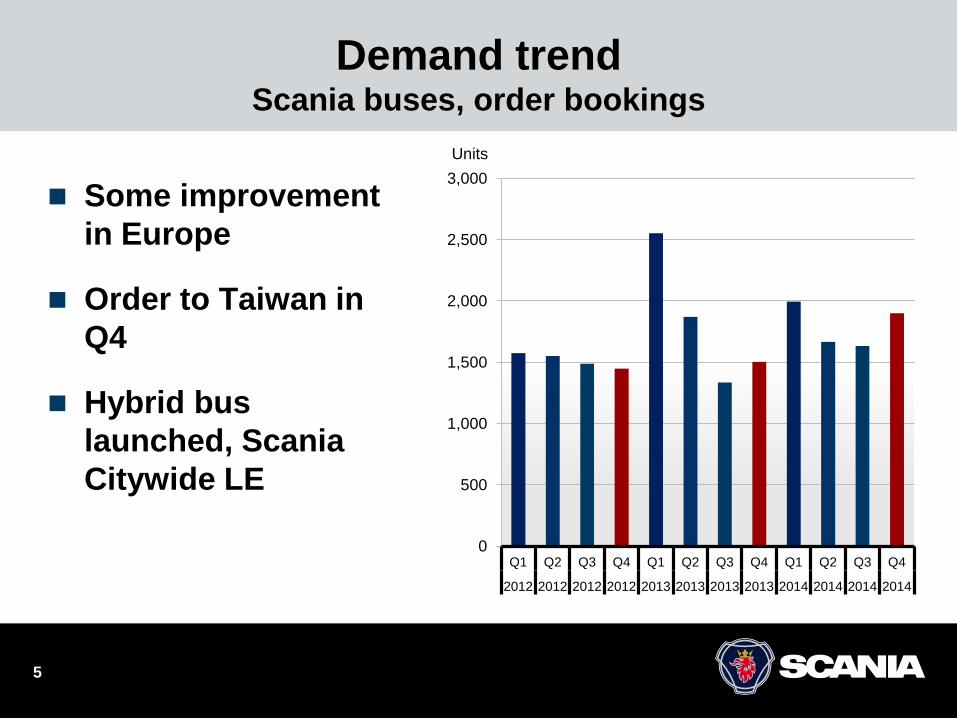
Demand trend Scania buses, order bookings
Some improvement in Europe
Order to Taiwan in Q4
Hybrid bus launched, Scania Citywide LE
5
0
500
1,000
1,500
2,000
2,500
3,000
Q1 Q2 Q3 Q4 Q1 Q2 Q3 Q4 Q1 Q2 Q3 Q4
2012 2012 2012 2012 2013 2013 2013 2013 2014 2014 2014 2014
Units
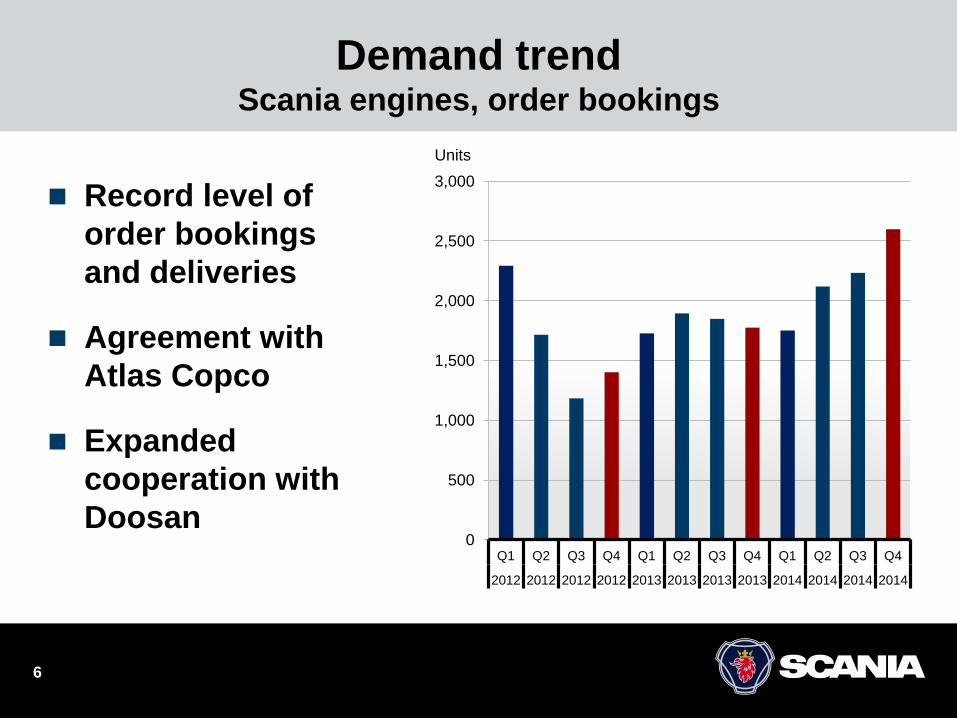
Demand trend Scania engines, order bookings
Record level of order bookings and deliveries
Agreement with Atlas Copco
Expanded cooperation with Doosan
6
0
500
1,000
1,500
2,000
2,500
3,000
Q1 Q2 Q3 Q4 Q1 Q2 Q3 Q4 Q1 Q2 Q3 Q4
2012 2012 2012 2012 2013 2013 2013 2013 2014 2014 2014 2014
Units
7
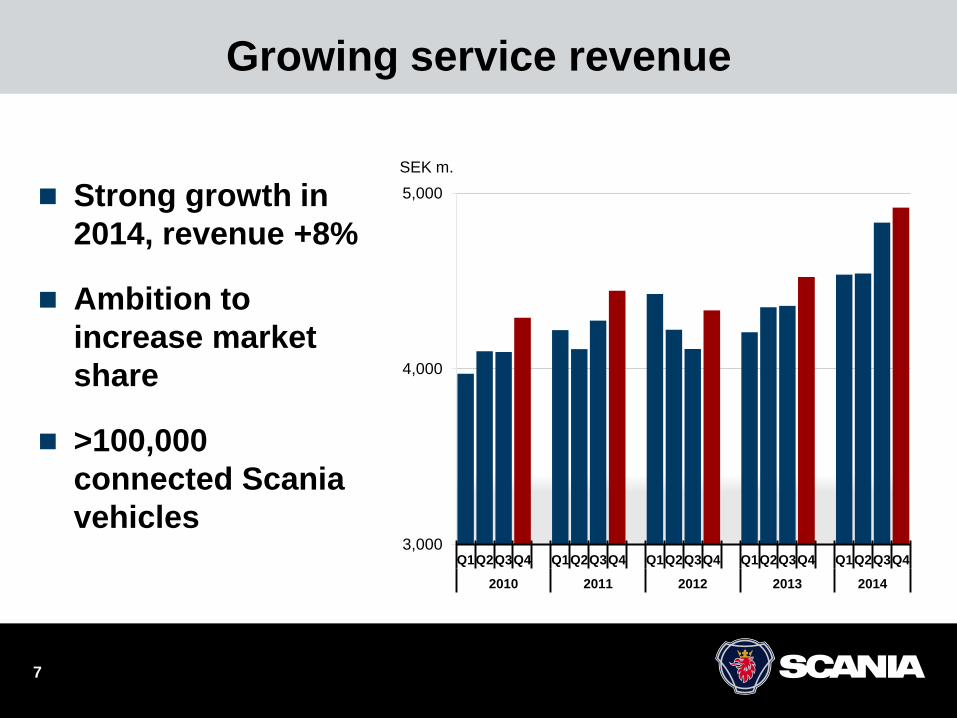
Strong growth in 2014, revenue +8%
Ambition to increase market share
>100,000 connected Scania vehicles
Growing service revenue
3,000
4,000
5,000
Q1 Q2 Q3 Q4 Q1 Q2 Q3 Q4 Q1 Q2 Q3 Q4 Q1 Q2 Q3 Q4 Q1 Q2 Q3 Q4
2010 2011 2012 2013 2014
SEK m.
8
Year-end Report, January–December 2014 Jan Ytterberg, CFO
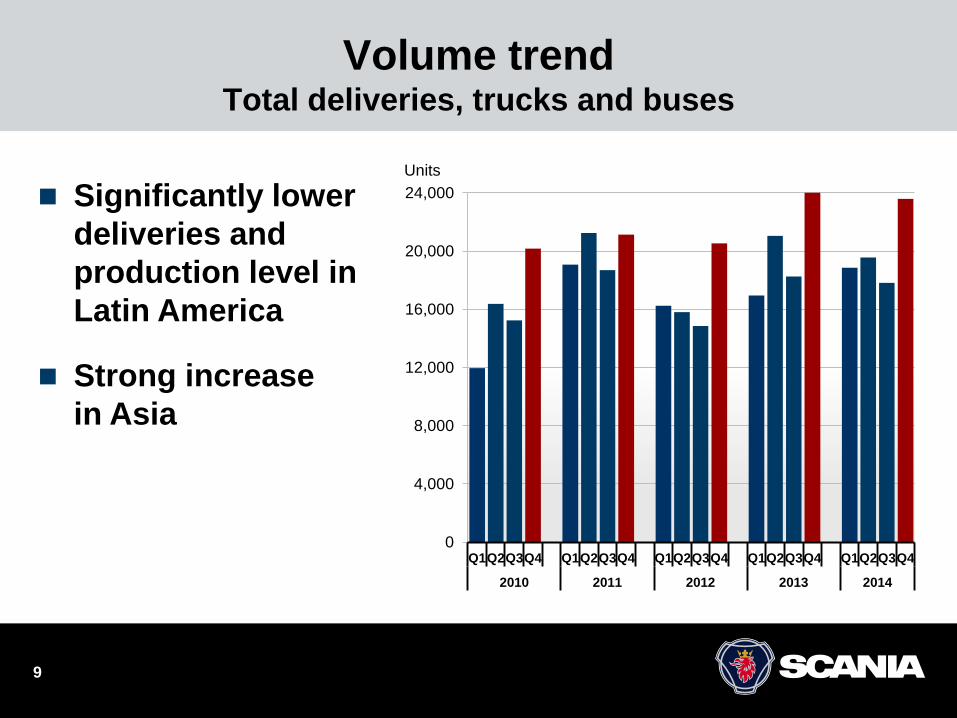
Volume trend Total deliveries, trucks and buses
9
Significantly lower deliveries and production level in Latin America
Strong increase in Asia
0
4,000
8,000
12,000
16,000
20,000
24,000
Q1 Q2 Q3 Q4 Q1 Q2 Q3 Q4 Q1 Q2 Q3 Q4 Q1 Q2 Q3 Q4 Q1 Q2 Q3 Q4
2010 2011 2012 2013 2014
Units
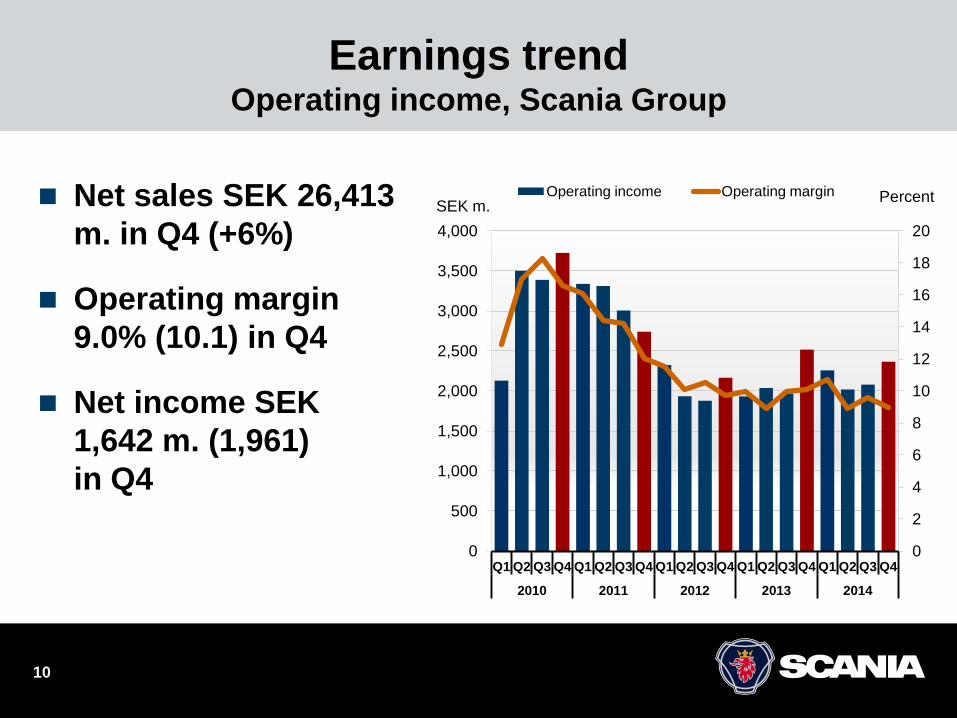
Earnings trend Operating income, Scania Group
10
Net sales SEK 26,413 m. in Q4 (+6%)
Operating margin 9.0% (10.1) in Q4
Net income SEK 1,642 m. (1,961) in Q4
0
2
4
6
8
10
12
14
16
18
20
0
500
1,000
1,500
2,000
2,500
3,000
3,500
4,000
Q1 Q2 Q3 Q4 Q1 Q2 Q3 Q4 Q1 Q2 Q3 Q4 Q1 Q2 Q3 Q4 Q1 Q2 Q3 Q4
2010 2011 2012 2013 2014
Percent SEK m.
Operating income Operating margin
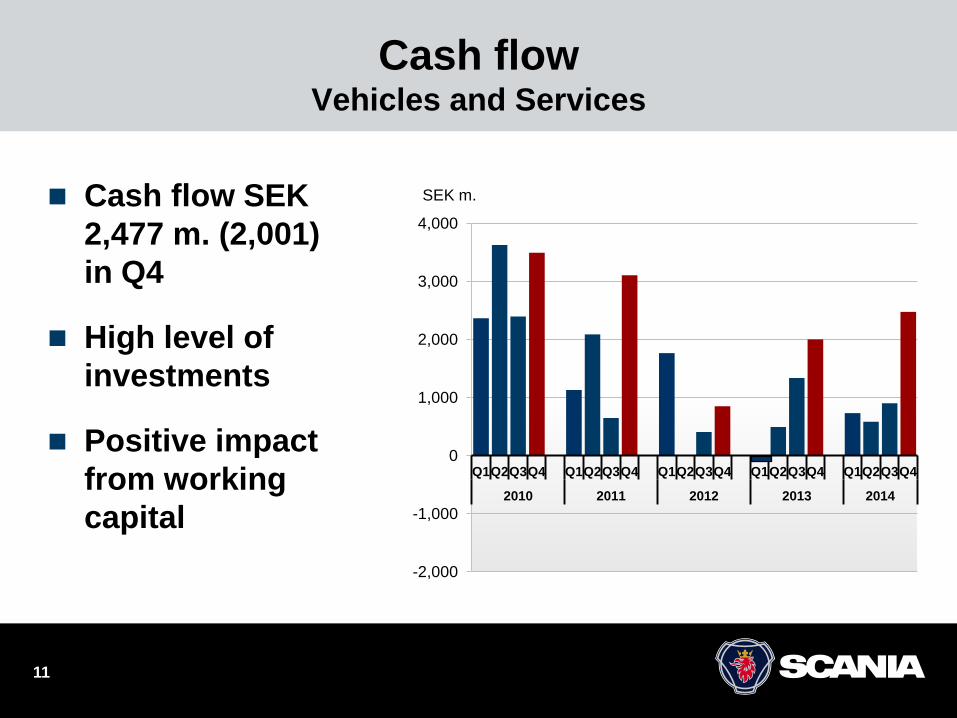
Cash flow Vehicles and Services
Cash flow SEK 2,477 m. (2,001) in Q4
High level of investments
Positive impact from working capital
11
-2,000
-1,000
0
1,000
2,000
3,000
4,000
Q1 Q2 Q3 Q4 Q1 Q2 Q3 Q4 Q1 Q2 Q3 Q4 Q1 Q2 Q3 Q4 Q1 Q2 Q3 Q4
2010 2011 2012 2013 2014
SEK m.
12