Embed Size (px)
Citation preview

Use of GIS in CSO Environment Statistics
Irish Organisation for Geographic Information17th October 2016
Nova Sharkey [email protected] Linh Trieu Nolan [email protected]
www.cso.ie 1

CSO and GIS
• Historically, GIS was used by the Census of Population area for fieldwork and results visualisation
• For Census 2011 and 2016, each enumerated household (including vacant dwellings) has been linked to the GeoDirectory, and so has X/Y coordinates that can be used to compile environment-related statistics
www.cso.ie 2

Environment Statistics and Accounts Division
• Set up as a standalone CSO Division in early 2015
• Initial focus was on producing statistics for legal and voluntary environmental accounts modules for Eurostat
• Use of GIS within the Division began in 2016
www.cso.ie 3

Land Cover and Land Use Project
• First GIS-related project was a Eurostat land cover and land use questionnaire at NUTS 2 level – this was the first time CSO has completed this questionnaire
• This work was completed using:– 2012 CORINE land cover data from EPA– OSi Prime2 data– DAFM forest inventory data
www.cso.ie 4

Land Cover (Corine 2012)
www.cso.ie 5Data: EPA

Land Cover (Corine 2012)
www.cso.ie 6
CODE TITLENUTS
IE0 NUTS
IE01NUTS
IE02
C1 Artificial land 2% 1% 3%
C2 Cropland 6% 2% 9%
C3 Woodland 5% 5% 6%
C4 Shrubland 5% 6% 5%
C5 Grassland 62% 58% 66%
C6Bare land, lichens, glaciers and permanent snow 1% 1% 2%
C7 Water 4% 5% 2%
H Wetland 15% 21% 9%
Data: EPA

Example Land Use Categories
www.cso.ie 7
CODE 1 TITLE NUTS IE0NUTS
IE01NUTS
IE02
U1 Primary Production 14.4% 10.4% 19.7%
U1_1 Agriculture 5.0% 2.0% 8.8%
U1_2 Forestry 9.1% 8.3% 10.8%
U1_3 Mining and Quarrying 0.1% 0.1% 0.2%
U1_4_1 Aquaculture 0.2%
U3 Tertiary Production 0.3% 0.2% 0.5%U3_4
Cultural Entertainment and Recreational Services 0.2% 0.1% 0.3%
U4_1_1 Road Transport 1.8% 1.5% 2.3%
U5 Residential Use (includes other compatible use) 3.8% 3.0% 5.1%
U6_3 Natural areas not in other economic use 0.8% 0.8% 0.9%
Data: OSI

Land Use Overview
• Land Use change over time– Potential to analyse Land Parcel Information
System data to examine changes at field level, crop location level, farm level, habitat level etc.
– EPA and other institutions have already carried out work in this area
– CSO could add to this through combining Census and other data, e.g. location of new dwellings
www.cso.ie 8

Continuing our GIS Work
• Land cover and land use is a good starting point for compiling ecosystem accounts
• Need for CSO to identify and obtain access to a time series of geocoded microdata
• National Parks and Wildlife Service (NPWS) have the lead role for Ireland on ecosystem accounts
www.cso.ie 9

Geocoded Microdata• Useful datasets for CSO archive include:
– Crop areas at parcel level and livestock numbers at farm level– Census of Population data at household level– Forestry data at land parcel level– Utilities data at meter level– Administrative data from government departments and
agencies– CSO Business Register data at local unit and enterprise level– Public expenditure on water supply and waste water
management at county level– EPA water quality data– EPA air quality data
www.cso.ie 10

Microdata Validation and Geocoding
• Validation and completion of geocoding of datasets
• Eircodes– Common identifier to match datasets– Most important public sector registers were
pre-coded– Government departments and agencies need
to complete coding by collecting Eircodes of non-unique addresses (around 35% of total)
www.cso.ie 11

Using the Microdata
• The datasets can be associated with digitised areas such as water catchments, habitats, special areas of conservation, etc.
• By relating the geocoded microdata to specific areas, work on assessing the pressures on them can begin
• Work with other data holders and users to efficiently meet data needs
www.cso.ie 12

Water Catchments• Water Framework Directive requirement• DECLG and EPA have lead roles• Inter-departmental Water Statistics Working Group • EPA provided CSO with digitised water catchment areas• CSO Environment is analysing microdata to assist with
catchment characterisation:– Crop areas– Livestock numbers– Numbers of households– Enterprise locations by NACE sector and associated
employment data etc.
www.cso.ie 13

2011 Census of Population – Dwellings by Water Catchment
• 46 water catchments• % of national total
number of dwellings in each catchment
• 28% in Liffey andDublin Bay Catchment
Data: CSO

Mains Water & Waste Water% of Households in Catchment
Public mains water supply (2011)
Public sewerage scheme (2011)
Data: CSOData: CSO

Private Wells & Septic Tanks% of Households in Catchment
Septic tanks (2011)
Private wells (2011)
Data: CSO Data: CSO

LPIS Land Use Data% of Catchment Area
Grass, pasture & rough grazing (2016)
Cereals (2016)
Data: DAFMData: DAFM

National Parks and Wildlife Service Protected and Conservation Areas
18
SPA & SAC - locations
SPA & SAC - % of catchment area
Data: NPWSData: NPWS
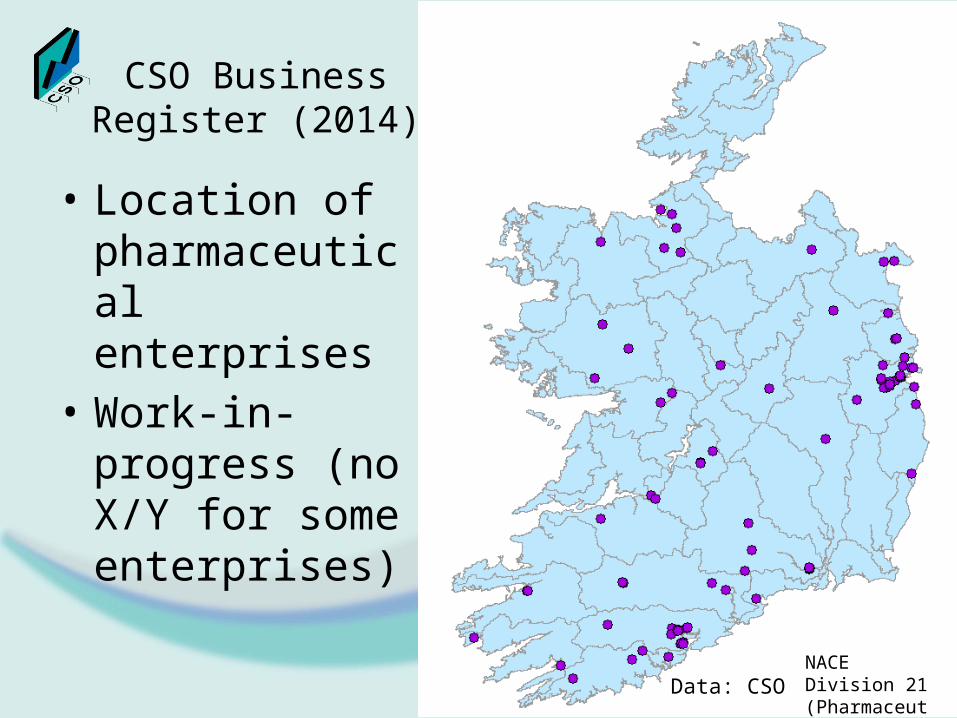
CSO Business Register (2014)
• Location of pharmaceutical enterprises
• Work-in-progress (no X/Y for some enterprises)
NACE Division 21 (Pharmaceutical)Data: CSO

Sample Catchment CharacterisationRiver Basin District Eastern South Western Western South Eastern
Catchment Liffey and Dublin Bay
Lee Cork Harbour and Youghal Bay
Galway Bay North
Suir
Area (km2) 1,623km2 2,181km2 1,017km2 3,553km2
Number of dwellings 467,103 121,144 16,145 69,381
% national total dwellings 28% 7% 1% 4%
% households in catchment with - public mains water supply 91% 83% 82% 75%
- private wells 1% 10% 2% 10%
- public sewerage scheme 92% 77% 57% 61%
- septic tank 3% 17% 35% 32%
% catchment under grass, pasture, rough grazing
34% 59% 26% 62%
% catchment under cereals 7% 6% 0% 5%
% catchment designated as SPA/SAC
17% 3% 73% 4%
www.cso.ie 20

Definition of Natural Capital
… biodiversity, including ecosystems that provide essential goods and services, from fertile soil and multi-functional forests to productive land and seas, from good quality fresh water and clean air to pollination and climate regulation and protection against natural disasters
www.cso.ie 21

EU MAES Project
• EU Mapping and Assessment of Ecosystem Services project (MAES)
• National Parks and Wildlife Service (NPWS) has lead role - CSO asked to assist
• NPWS has established group to map Ireland’s terrestrial and marine systems (National Land Cover and Habitat Mapping project)
www.cso.ie 22

Ecosystem Accounts
• Measures depletion and degradation of our natural assets from economic activity
• Concepts and methodologies are still being developed
• MAES project is a step towards compiling ecosystem accounts
www.cso.ie 23

Ecosystem Accounts
• Assets– extent account (changes in areas)– condition account by ecosystem type (biodiversity,
carbon, soils, vegetation, water)– monetary account (net present value)
• Services - physical and monetary supply and use tables
• Compiling ecosystem accounts requires use of very high resolution imagery e.g. 2.5 metres
www.cso.ie 24

Compiling Ecosystem Accounts
• MAES work will develop with bottom-up approach using local area studies
• National level work may require more top-down approach using imagery, aerial photos, and geocoded data
• Need for both approaches during development of methodology
www.cso.ie 25
Conclusions
• CSO needs staff with GIS skills• Many potential uses for geocoded data in
environment-related statistics• Needs inter-departmental, inter-agency, and
subject-matter experts collaboration• Needs broad range of geocoded microdata• Need to archive geocoded microdata for long
time-series analyses of land cover and land use changes, and pressures from economic and social activity
www.cso.ie 26

Thanks
• Thanks to all data providers• Thank you for listening
www.cso.ie 27