Embed Size (px)
Citation preview
D
Cdi
MJa
b
c
a
A
R
R
A
A
K
D
D
S
T
C
1
Ttibw
0h
ARTICLE IN PRESSENTAL-2037; No. of Pages 10
d e n t a l m a t e r i a l s x x x ( 2 0 1 2 ) xxx.e1–xxx.e10
Available online at www.sciencedirect.com
jo u rn al hom epa ge : www.int l .e lsev ierhea l th .com/ journa ls /dema
omparative mechanical behavior of dentin enamel andentin ceramic junctions assessed by speckle
nterferometry (SI)
ichel Fagesa,∗, Pierre Slangenb, Jacques Raynala, Stephane Cornb, Kinga Turzoc,acques Margerita, Frédéric J. Cuisiniera
EA4203, Department of Biologic Sciences, University of Montpellier I, Montpellier, FranceEcole des Mines d’Alès, I.L.O.A., Alès, FranceDepartment of Prosthodontic and Oral Biology, University of Szeged Dental School, Szeged, Hungary
r t i c l e i n f o
rticle history:
eceived 23 October 2011
eceived in revised form 3 May 2012
ccepted 18 May 2012
vailable online xxx
eywords:
entin enamel junction (DEJ)
entin ceramic junction (DCJ)
peckle interferometry (SI)
ooth crown
eramic crown
a b s t r a c t
Objective. The dentin–enamel junction (DEJ) plays a crucial role in dental biomechanics; how-
ever, little is known about its structure and mechanical behavior. Nevertheless, natural teeth
are a necessary model for prosthetic crowns. The mechanical behavior of the natural DEJ
and the dentin ceramic junction (DCJ) manufactured with a CAD-CAM system are compared.
Methods. The reference samples undergo no modification, while the experimental samples
were drilled to receive a cemented feldspathic ceramic crown. Longitudinally cut samples
were used to achieve a planar object observation and to look “inside” the tooth. A com-
plete apparatus enabling the study of the compressive mechanical behavior of the involved
tooth by a non-contact laser speckle interferometry (SI) was developed to allow nanometric
displacements to be tracked during the compression test.
Results. It is observed that the DEJ acted as a critical zone accommodating the movement
between dentin and enamel. A smooth transition occurs between dentin and enamel. In
the modeled prosthetic, the same kind of accommodation effects also occurs, but with a
steeper transition slope between dentin and ceramic.
Significance. On the natural tooth, the stress accommodation arises from a differential
behavior between enamel and dentin from the DEJ. In the ceramic crown, the cemented
dentin–ceramic junction should play this role. This study demonstrates the possible real-
crow
emy
cessfully transfer applied loads (e.g., masticatory or impact)
ization of prosthetic
© 2012 Acad
. Introduction
he dentin–enamel junction (DEJ) in teeth is the zone between
Please cite this article in press as: Fages M, et al. Comparative mechanical
speckle interferometry (SI). Dent Mater (2012), http://dx.doi.org/10.1016/j.d
wo distinct calcified tissues with very different biomechan-cal properties: enamel and dentin [1]. Enamel is hard andrittle and envelops the softer dentin. The enamel and dentinork together during the many load cycles experienced by the
∗ Corresponding author at: 11 Avenue Celestin Arnaud, 34110 La PeyradE-mail address: [email protected] (M. Fages).
109-5641/$ – see front matter © 2012 Academy of Dental Materials. Puttp://dx.doi.org/10.1016/j.dental.2012.05.006
n reconstructions approaching biomechanical behaviors.
of Dental Materials. Published by Elsevier Ltd. All rights reserved.
tooth over its lifetime. Generally, interfaces between materialswith dissimilar elastic and mechanical properties represent“weak links” in a structure; however, the DEJ acts to suc-
behavior of dentin enamel and dentin ceramic junctions assessed byental.2012.05.006
e, France. Tel.: +33 6 84 85 57 15; fax: +33 4 67 48 60 92.
from the enamel to the dentin and inhibits enamel cracksfrom propagating into the dentin and causing tooth fracture[2,3].
blished by Elsevier Ltd. All rights reserved.
ARTICLE IN PRESSDENTAL-2037; No. of Pages 10
x x
xxx.e2 d e n t a l m a t e r i a l s xThe DEJ appears as a discrete line when visualizedmicroscopically and is thought to represent the original posi-tion of the basement membrane of the ameloblasts andodontoblasts where they coincide in the embryological toothbud [4]. In human enamel and dentin, fatigue damage is theend result of extreme loads and is frequently associated withpathology or extensive wear. The fracture-resistant propertiesof the DEJ are believed to originate from a gradual change inmicrostructure and in the properties of dentin and enamelrather than from the abrupt transition between the two dis-similar materials [5,6]. Wang and Weiner suggested that theDEJ is one of the working sites of the tooth during mastication[7]. Imbeni et al. [1] believe that collagen fibrils perpendicu-lar to the interface constitute the key reinforcing mechanismat the DEJ, thus explaining why so few cracking events causedelamination when they impinge on the DEJ. Zaslansky et al.[8,9] highlighted the importance of the DEJ as the bindinginterface between enamel and dentin. They have shown thatadjacent to the DEJ is a 200–300 mm-thick zone of dentin of amuch lower stiffness (compression elastic modulus) than thebulk of the dentin in the tooth.
Restorations that are all ceramic require proper adhe-sive bonding on the dentin to achieve their required lifeexpectancy. All-ceramic restorations are made with felds-pathic or zirconia ceramics. The strongest ceramics have afracture toughness of at least 3.0 MPa m1/2 [10], which is rel-atively close to the enamel fracture toughness of 1.3 MPa m1/2,in a direction perpendicular to the enamel rods [8]. Neverthe-less, fractures of the ceramic part of all-ceramic crowns aredifficult to prevent, and crack growth is a significant prob-lem [11]. This phenomenon can be explained by the absenceof a stress accommodation zone. The natural stress accom-modation zone of 200–300 �m-thick dentin has a much lowerstiffness than the bulk of the dentin core [8].
Bonding agents must be selected very carefully becausethey determine not only the adhesion but also the ultimatestrength of full-ceramic crowns [12–14]; therefore, it is impor-tant to compare the mechanical behavior of natural teethand of the all-ceramic crown cemented on dentin. Instead of“cement joint”, we will use the term “dentin–ceramic junction”(DCJ).
We applied compressive forces representative of thoseoccurring in the oral cavity on natural teeth and all-ceramiccrowns, and we determine the relative movement of enameland dentin, or ceramic crown and dentin, respectively.
2. Materials and methods
2.1. Natural teeth
Intact lower first premolars free of caries were stored in phys-iological serum after having been extracted as part of theroutine orthodontic treatment of young healthy adolescentpatients (aged < 18). Five sets of two samples each (one nat-
Please cite this article in press as: Fages M, et al. Comparative mechanical
speckle interferometry (SI). Dent Mater (2012), http://dx.doi.org/10.1016/j.d
ural tooth and one prosthetic tooth) were amassed. Right andleft premolars from the same patient were used. One was keptintact, and the other was prepared to receive the prostheticcrown.
( 2 0 1 2 ) xxx.e1–xxx.e10
2.2. Prosthetic crowns
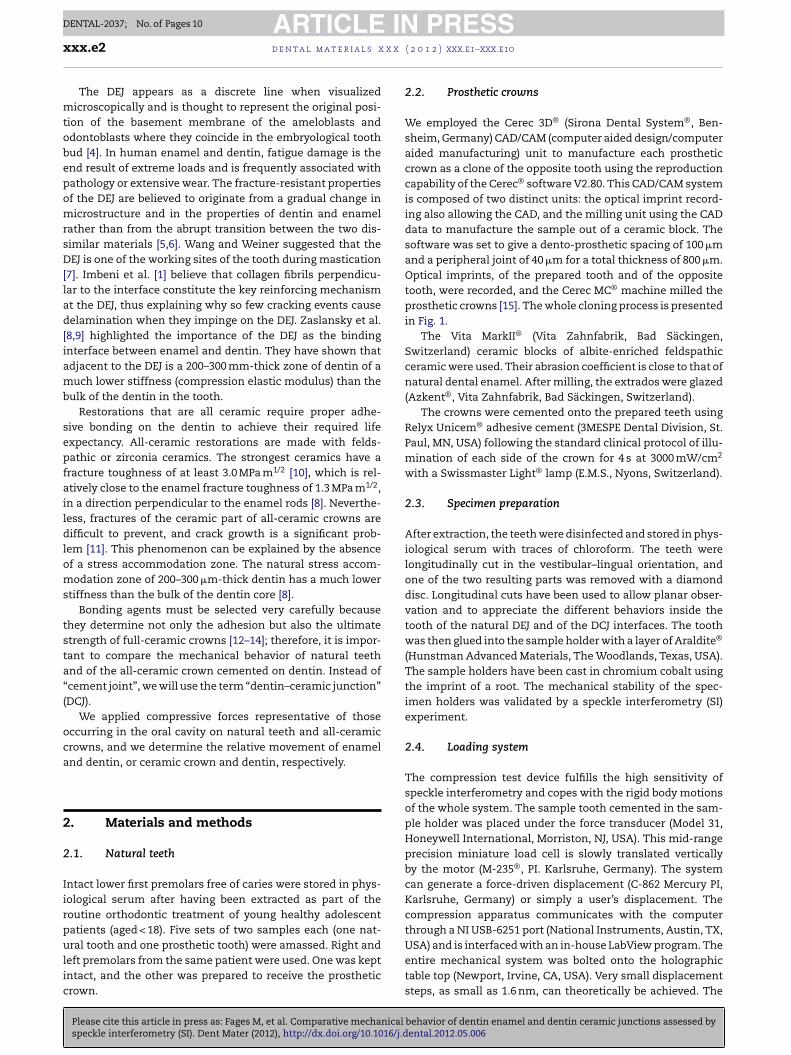
We employed the Cerec 3D® (Sirona Dental System®, Ben-sheim, Germany) CAD/CAM (computer aided design/computeraided manufacturing) unit to manufacture each prostheticcrown as a clone of the opposite tooth using the reproductioncapability of the Cerec® software V2.80. This CAD/CAM systemis composed of two distinct units: the optical imprint record-ing also allowing the CAD, and the milling unit using the CADdata to manufacture the sample out of a ceramic block. Thesoftware was set to give a dento-prosthetic spacing of 100 �mand a peripheral joint of 40 �m for a total thickness of 800 �m.Optical imprints, of the prepared tooth and of the oppositetooth, were recorded, and the Cerec MC® machine milled theprosthetic crowns [15]. The whole cloning process is presentedin Fig. 1.
The Vita MarkII® (Vita Zahnfabrik, Bad Säckingen,Switzerland) ceramic blocks of albite-enriched feldspathicceramic were used. Their abrasion coefficient is close to that ofnatural dental enamel. After milling, the extrados were glazed(Azkent®, Vita Zahnfabrik, Bad Säckingen, Switzerland).
The crowns were cemented onto the prepared teeth usingRelyx Unicem® adhesive cement (3MESPE Dental Division, St.Paul, MN, USA) following the standard clinical protocol of illu-mination of each side of the crown for 4 s at 3000 mW/cm2
with a Swissmaster Light® lamp (E.M.S., Nyons, Switzerland).
2.3. Specimen preparation
After extraction, the teeth were disinfected and stored in phys-iological serum with traces of chloroform. The teeth werelongitudinally cut in the vestibular–lingual orientation, andone of the two resulting parts was removed with a diamonddisc. Longitudinal cuts have been used to allow planar obser-vation and to appreciate the different behaviors inside thetooth of the natural DEJ and of the DCJ interfaces. The toothwas then glued into the sample holder with a layer of Araldite®
(Hunstman Advanced Materials, The Woodlands, Texas, USA).The sample holders have been cast in chromium cobalt usingthe imprint of a root. The mechanical stability of the spec-imen holders was validated by a speckle interferometry (SI)experiment.
2.4. Loading system
The compression test device fulfills the high sensitivity ofspeckle interferometry and copes with the rigid body motionsof the whole system. The sample tooth cemented in the sam-ple holder was placed under the force transducer (Model 31,Honeywell International, Morriston, NJ, USA). This mid-rangeprecision miniature load cell is slowly translated verticallyby the motor (M-235®, PI. Karlsruhe, Germany). The systemcan generate a force-driven displacement (C-862 Mercury PI,Karlsruhe, Germany) or simply a user’s displacement. Thecompression apparatus communicates with the computerthrough a NI USB-6251 port (National Instruments, Austin, TX,
behavior of dentin enamel and dentin ceramic junctions assessed byental.2012.05.006
USA) and is interfaced with an in-house LabView program. Theentire mechanical system was bolted onto the holographictable top (Newport, Irvine, CA, USA). Very small displacementsteps, as small as 1.6 nm, can theoretically be achieved. The
ARTICLE IN PRESSDENTAL-2037; No. of Pages 10
d e n t a l m a t e r i a l s x x x ( 2 0 1 2 ) xxx.e1–xxx.e10 xxx.e3
Fig. 1 – Cloning process: the intact natural crown sample (A), optical print (B), shaping (C), optical print of the second toothprepared to receive the prosthetic clone (D), adaptation of the shaping on the tooth prepared (E), CAD finished, CAM ready(F), ceramic block in the milling unit (G), the prosthetic clone milled (H), the prosthetic clone cemented on the tooth prepared( atur
fdtss
2
Tflamc
dPebaibu
dasTXfm
avbT1i5i
I), the natural tooth (J), vertical cuts (K), prosthetic clone (L) n
orce can be applied to the tooth directly with the force trans-ucer or through a relay rod. Force has always been appliedo the same part of the lingual cusp. Preliminary testing by SIhowed good performances of the mechanical set-up and nopurious displacements.
.5. SI apparatus
he optical set-up was previously presented in detail [16]. Therequency-doubled YAG laser emits 50 mW at 532 nm wave-ength in the green range. The laser beam is then injected in
COTS (commercially off-the-shelf) system (Canadian Instru-ents, Nottingham, UK) offering injection, variable intensity
oupling in the output fibers, and phase shifting.There are two input fibers: one for injection and one for
etection of the reflected signal at the output fiber interfaces.arts of the output fibers are bared and wrapped around piezo-lectric transducers. The phase shift is applied on either oroth of the two output fibers by applying a voltage at the PZTnd thus generating a tiny extension of the fiber. The systems protected from thermal and mechanical effects by a plasticox and is easily breadboardable. Phase shifts were calibratedsing common procedures [16].
A sensitive optical fiber in-plane interferometer has beenesigned with sensitivity vector Sv. Horizontal sensitivity ischieved. Two symmetrical beams produce an interferenceignal on the whole object and then illuminate the samples.he objects are optically rough-rendered by white powder. AnC70 CCD camera (Sony, Tokyo, Japan) records the sample sur-
ace under loading forces. The images are then stored in liveemory or on the computer’s hard disk.The image processing was performed using the appropri-
te software in LabView, and the results are presented asector maps or false color maps. Isodisplacement maps cane visualized in real time during the loading of the sample.he system can handle areas ranging from 5 mm × 5 mm to
Please cite this article in press as: Fages M, et al. Comparative mechanical
speckle interferometry (SI). Dent Mater (2012), http://dx.doi.org/10.1016/j.d
m × 1 m when using the appropriate type of laser and load-ng system. The measurement uncertainty is approximately0 nm, which is common for interferometric measurementn a controlled environment. The displacement resolution is
al tooth.
approximately 10 nm, while the spatial resolution is directlylinked to the magnification of the object scene on the imagesensor (1280 × 900 pixels).
A “4-buckets” phase shifting algorithm leads to phasevariations during the compression test [17]. During the test,the initial phase state was memory-resident and real-timesubtracted from the current state. Sometimes the referencestate was also refreshed because for some loading steps, thenumber of fringes can be too high, and the resulting noisewould interfere with the interpretation of the resulting fringes.Interferograms show the in-plane displacements from phaseshifting speckle interferometry. Highest quality images werestored on the hard disk and overlaid with upper jaw positionand load value (N).
2.6. Typical experiments
Specimens were white powdered using Eutest 3 DeveloperCastolin Eutectic powder (Castolin, Lausanne, Switzerland)to generate a uniform diffusing surface and to avoid differ-ent modulations between dentin and enamel or ceramic anddentin. The same loads were applied to the natural tooth andthe prosthetic crown samples to allow comparisons of theirrespective compressive behaviors.
The starting load was approximately 0 N. The compressionwas increased stepwise, performing discrete displacementsof the transducer tip (one step is approximately 1.6 nm ofY-displacement). Therefore, a greater number of steps corre-sponds to a higher compression. The sample can be loadedor unloaded. The loading range applied to the different sam-ples was between 5 N and 120 N. The CCD camera records atthe sample surface the interferences of the two illuminationbeams coming from the two output optical fibers. Live fringesare displayed between a reference state and the current loadstate. Between minimal and maximal loading, different phasemaps are recorded and stored in the memory.
behavior of dentin enamel and dentin ceramic junctions assessed byental.2012.05.006
The mechanical deformations are computed from the dis-placement maps generated from the phase difference maps.
Speckle interferometry is a relative displacement mea-surement. The maximum range between two successive
ARTICLE IN PRESSDENTAL-2037; No. of Pages 10
xxx.e4 d e n t a l m a t e r i a l s x x x ( 2 0 1 2 ) xxx.e1–xxx.e10
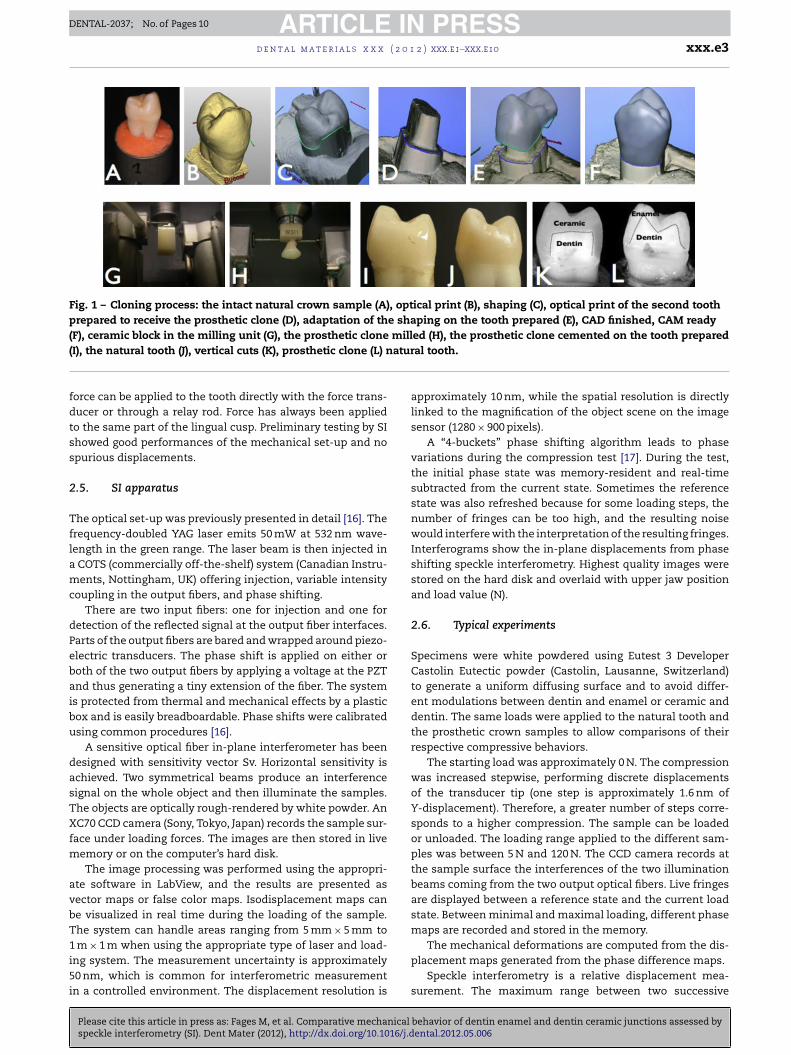
Fig. 2 – Natural tooth sample under different loads. (A) White light images. (B) Screenshot no. 04: force: 35.5 N, �F: 35.5 N(new ref: 0). (C) Screenshot no. 13: force: 40.23 N, �F: 0.16 N (new ref: 40.39). (D) Screenshot no. 24: force: 82.54 N, �F: 13.96 N
(new ref: 96.5).measurements is approximately 20 �m. In our experiments,we need to record smaller steps as some mechanical noiseappears. Therefore, new displacement references (zero dis-placement reset) are recorded during the test.
2.7. Displacement calculations
Different operation modes of SI are commonly used, e.g.,subtraction-mode, time-averaged SI, and double-pulsed SI[16]. In this work, we focus on subtraction-mode SI, or morespecifically, on phase-shifting SI, which is mainly used forstatic deformation measurements.
Combining the primary interference pattern phasechanges between the recordings yields new secondaryinterference fringes (also called correlation fringes).
The variable ϕs denotes the start phase (also called specklephase) at the initial state of the object. The variable �ϕ repre-sents the phase change between two states.
These speckle interferograms can be subtracted and leadto the following equation for the secondary interference fringepattern, assuming perfect spatial correlation between the twoprimary speckle patterns:
I1 − I2 = 2√
IrIo(cos(ϕs + �ϕ) − cos(ϕs))
Currently, noise limits the accuracy of intensity subtraction
Please cite this article in press as: Fages M, et al. Comparative mechanical
speckle interferometry (SI). Dent Mater (2012), http://dx.doi.org/10.1016/j.d
SI to approximately 15 nm. Regarding the in-plane sensitivityof the setup, the angle of the impinging beam � is approxi-mately 30◦ and determines the correspondence between thephase gray level variation and the in-plane displacement ux.
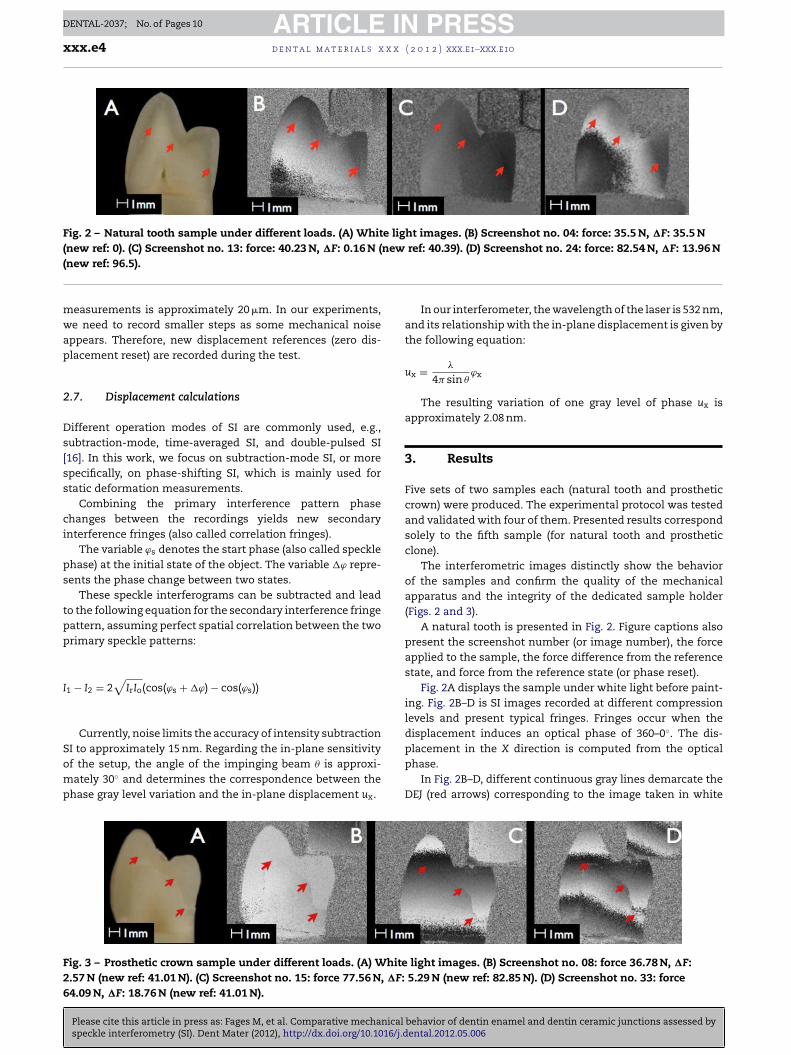
Fig. 3 – Prosthetic crown sample under different loads. (A) White2.57 N (new ref: 41.01 N). (C) Screenshot no. 15: force 77.56 N, �F:64.09 N, �F: 18.76 N (new ref: 41.01 N).
In our interferometer, the wavelength of the laser is 532 nm,and its relationship with the in-plane displacement is given bythe following equation:
ux = �
4� sin �ϕx
The resulting variation of one gray level of phase ux isapproximately 2.08 nm.
3. Results
Five sets of two samples each (natural tooth and prostheticcrown) were produced. The experimental protocol was testedand validated with four of them. Presented results correspondsolely to the fifth sample (for natural tooth and prostheticclone).
The interferometric images distinctly show the behaviorof the samples and confirm the quality of the mechanicalapparatus and the integrity of the dedicated sample holder(Figs. 2 and 3).
A natural tooth is presented in Fig. 2. Figure captions alsopresent the screenshot number (or image number), the forceapplied to the sample, the force difference from the referencestate, and force from the reference state (or phase reset).
Fig. 2A displays the sample under white light before paint-ing. Fig. 2B–D is SI images recorded at different compressionlevels and present typical fringes. Fringes occur when thedisplacement induces an optical phase of 360–0◦. The dis-
behavior of dentin enamel and dentin ceramic junctions assessed byental.2012.05.006
placement in the X direction is computed from the opticalphase.
In Fig. 2B–D, different continuous gray lines demarcate theDEJ (red arrows) corresponding to the image taken in white
light images. (B) Screenshot no. 08: force 36.78 N, �F: 5.29 N (new ref: 82.85 N). (D) Screenshot no. 33: force
ARTICLE IN PRESSDENTAL-2037; No. of Pages 10
d e n t a l m a t e r i a l s x x x ( 2 0 1 2 ) xxx.e1–xxx.e10 xxx.e5
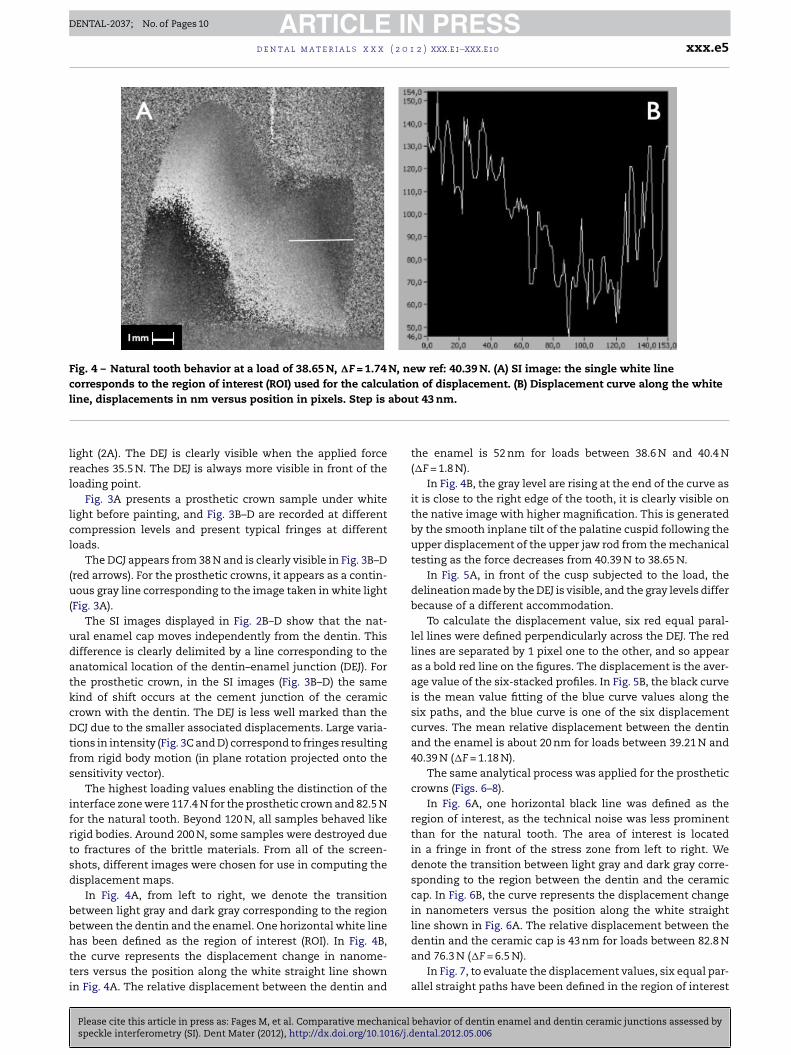
Fig. 4 – Natural tooth behavior at a load of 38.65 N, �F = 1.74 N, new ref: 40.39 N. (A) SI image: the single white linecorresponds to the region of interest (ROI) used for the calculation of displacement. (B) Displacement curve along the whitel abou
lrl
lcl
(u(
udatkcDtfs
ifrtsd
bbhtti
ine, displacements in nm versus position in pixels. Step is
ight (2A). The DEJ is clearly visible when the applied forceeaches 35.5 N. The DEJ is always more visible in front of theoading point.
Fig. 3A presents a prosthetic crown sample under whiteight before painting, and Fig. 3B–D are recorded at differentompression levels and present typical fringes at differentoads.
The DCJ appears from 38 N and is clearly visible in Fig. 3B–Dred arrows). For the prosthetic crowns, it appears as a contin-ous gray line corresponding to the image taken in white light
Fig. 3A).The SI images displayed in Fig. 2B–D show that the nat-
ral enamel cap moves independently from the dentin. Thisifference is clearly delimited by a line corresponding to thenatomical location of the dentin–enamel junction (DEJ). Forhe prosthetic crown, in the SI images (Fig. 3B–D) the sameind of shift occurs at the cement junction of the ceramicrown with the dentin. The DEJ is less well marked than theCJ due to the smaller associated displacements. Large varia-
ions in intensity (Fig. 3C and D) correspond to fringes resultingrom rigid body motion (in plane rotation projected onto theensitivity vector).
The highest loading values enabling the distinction of thenterface zone were 117.4 N for the prosthetic crown and 82.5 Nor the natural tooth. Beyond 120 N, all samples behaved likeigid bodies. Around 200 N, some samples were destroyed dueo fractures of the brittle materials. From all of the screen-hots, different images were chosen for use in computing theisplacement maps.
In Fig. 4A, from left to right, we denote the transitionetween light gray and dark gray corresponding to the regionetween the dentin and the enamel. One horizontal white lineas been defined as the region of interest (ROI). In Fig. 4B,
Please cite this article in press as: Fages M, et al. Comparative mechanical
speckle interferometry (SI). Dent Mater (2012), http://dx.doi.org/10.1016/j.d
he curve represents the displacement change in nanome-ers versus the position along the white straight line shownn Fig. 4A. The relative displacement between the dentin and
t 43 nm.
the enamel is 52 nm for loads between 38.6 N and 40.4 N(�F = 1.8 N).
In Fig. 4B, the gray level are rising at the end of the curve asit is close to the right edge of the tooth, it is clearly visible onthe native image with higher magnification. This is generatedby the smooth inplane tilt of the palatine cuspid following theupper displacement of the upper jaw rod from the mechanicaltesting as the force decreases from 40.39 N to 38.65 N.
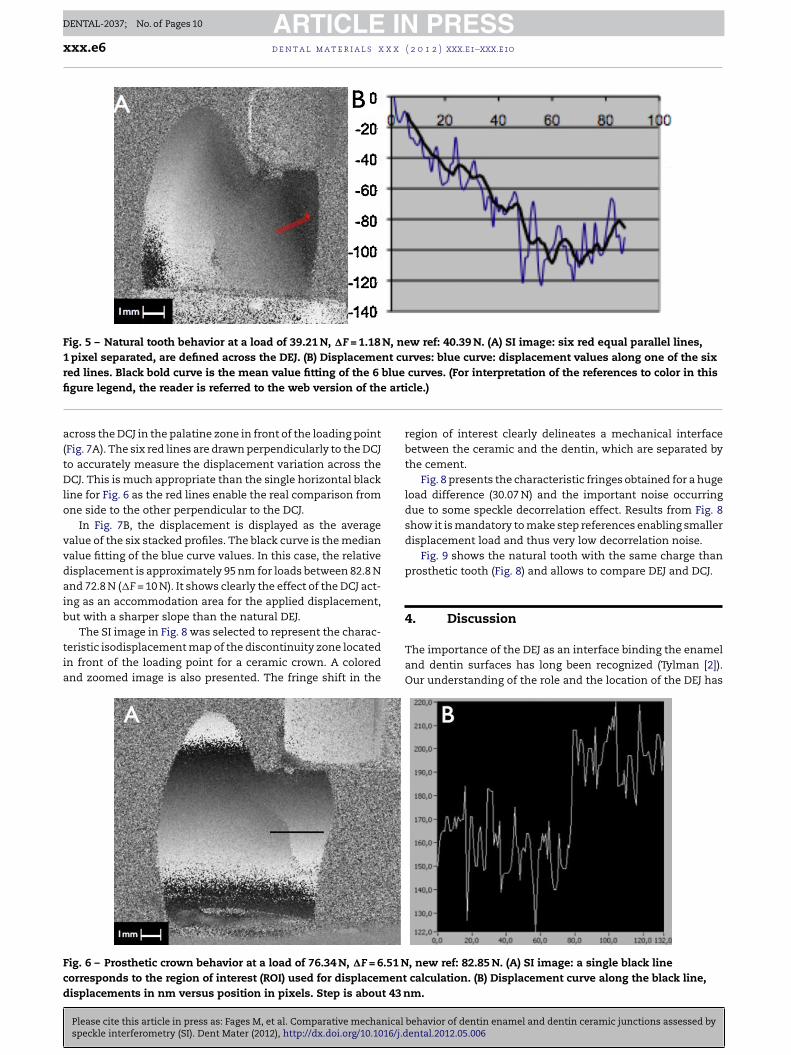
In Fig. 5A, in front of the cusp subjected to the load, thedelineation made by the DEJ is visible, and the gray levels differbecause of a different accommodation.
To calculate the displacement value, six red equal paral-lel lines were defined perpendicularly across the DEJ. The redlines are separated by 1 pixel one to the other, and so appearas a bold red line on the figures. The displacement is the aver-age value of the six-stacked profiles. In Fig. 5B, the black curveis the mean value fitting of the blue curve values along thesix paths, and the blue curve is one of the six displacementcurves. The mean relative displacement between the dentinand the enamel is about 20 nm for loads between 39.21 N and40.39 N (�F = 1.18 N).
The same analytical process was applied for the prostheticcrowns (Figs. 6–8).
In Fig. 6A, one horizontal black line was defined as theregion of interest, as the technical noise was less prominentthan for the natural tooth. The area of interest is locatedin a fringe in front of the stress zone from left to right. Wedenote the transition between light gray and dark gray corre-sponding to the region between the dentin and the ceramiccap. In Fig. 6B, the curve represents the displacement changein nanometers versus the position along the white straightline shown in Fig. 6A. The relative displacement between thedentin and the ceramic cap is 43 nm for loads between 82.8 N
behavior of dentin enamel and dentin ceramic junctions assessed byental.2012.05.006
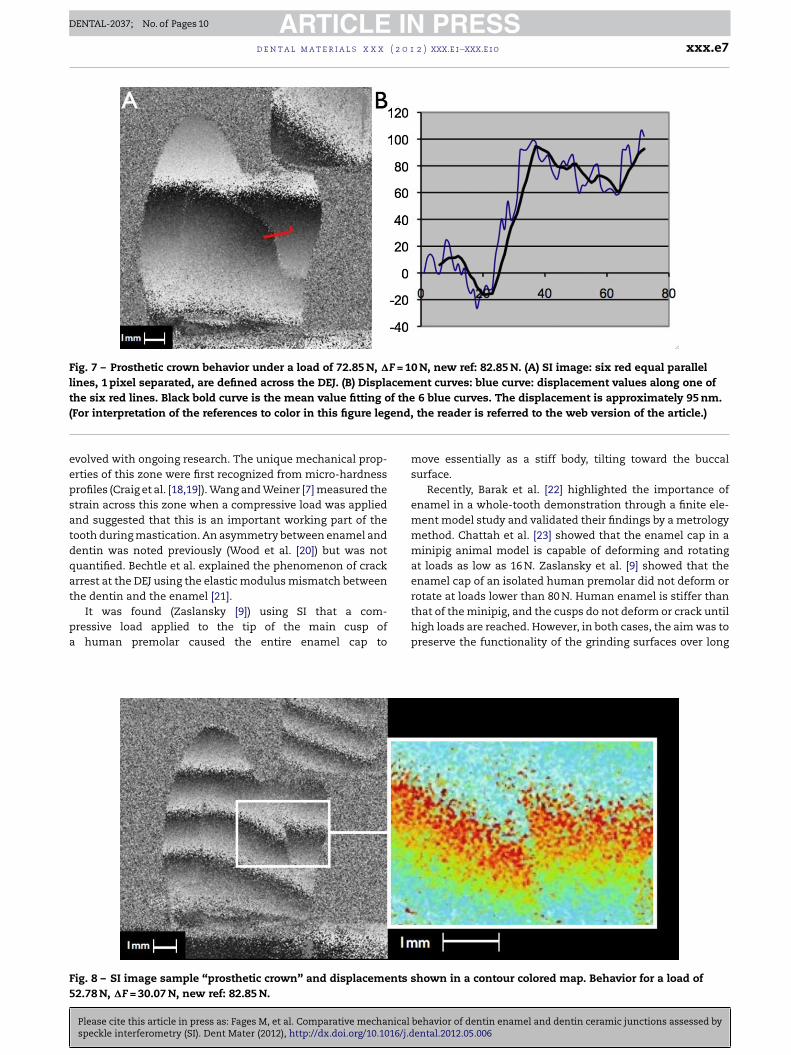
and 76.3 N (�F = 6.5 N).In Fig. 7, to evaluate the displacement values, six equal par-
allel straight paths have been defined in the region of interest
ARTICLE IN PRESSDENTAL-2037; No. of Pages 10
xxx.e6 d e n t a l m a t e r i a l s x x x ( 2 0 1 2 ) xxx.e1–xxx.e10
Fig. 5 – Natural tooth behavior at a load of 39.21 N, �F = 1.18 N, new ref: 40.39 N. (A) SI image: six red equal parallel lines,1 pixel separated, are defined across the DEJ. (B) Displacement curves: blue curve: displacement values along one of the sixred lines. Black bold curve is the mean value fitting of the 6 blue curves. (For interpretation of the references to color in this
e art
figure legend, the reader is referred to the web version of thacross the DCJ in the palatine zone in front of the loading point(Fig. 7A). The six red lines are drawn perpendicularly to the DCJto accurately measure the displacement variation across theDCJ. This is much appropriate than the single horizontal blackline for Fig. 6 as the red lines enable the real comparison fromone side to the other perpendicular to the DCJ.
In Fig. 7B, the displacement is displayed as the averagevalue of the six stacked profiles. The black curve is the medianvalue fitting of the blue curve values. In this case, the relativedisplacement is approximately 95 nm for loads between 82.8 Nand 72.8 N (�F = 10 N). It shows clearly the effect of the DCJ act-ing as an accommodation area for the applied displacement,but with a sharper slope than the natural DEJ.
Please cite this article in press as: Fages M, et al. Comparative mechanical
speckle interferometry (SI). Dent Mater (2012), http://dx.doi.org/10.1016/j.d
The SI image in Fig. 8 was selected to represent the charac-teristic isodisplacement map of the discontinuity zone locatedin front of the loading point for a ceramic crown. A coloredand zoomed image is also presented. The fringe shift in the
Fig. 6 – Prosthetic crown behavior at a load of 76.34 N, �F = 6.51 Ncorresponds to the region of interest (ROI) used for displacementdisplacements in nm versus position in pixels. Step is about 43 n
icle.)
region of interest clearly delineates a mechanical interfacebetween the ceramic and the dentin, which are separated bythe cement.
Fig. 8 presents the characteristic fringes obtained for a hugeload difference (30.07 N) and the important noise occurringdue to some speckle decorrelation effect. Results from Fig. 8show it is mandatory to make step references enabling smallerdisplacement load and thus very low decorrelation noise.
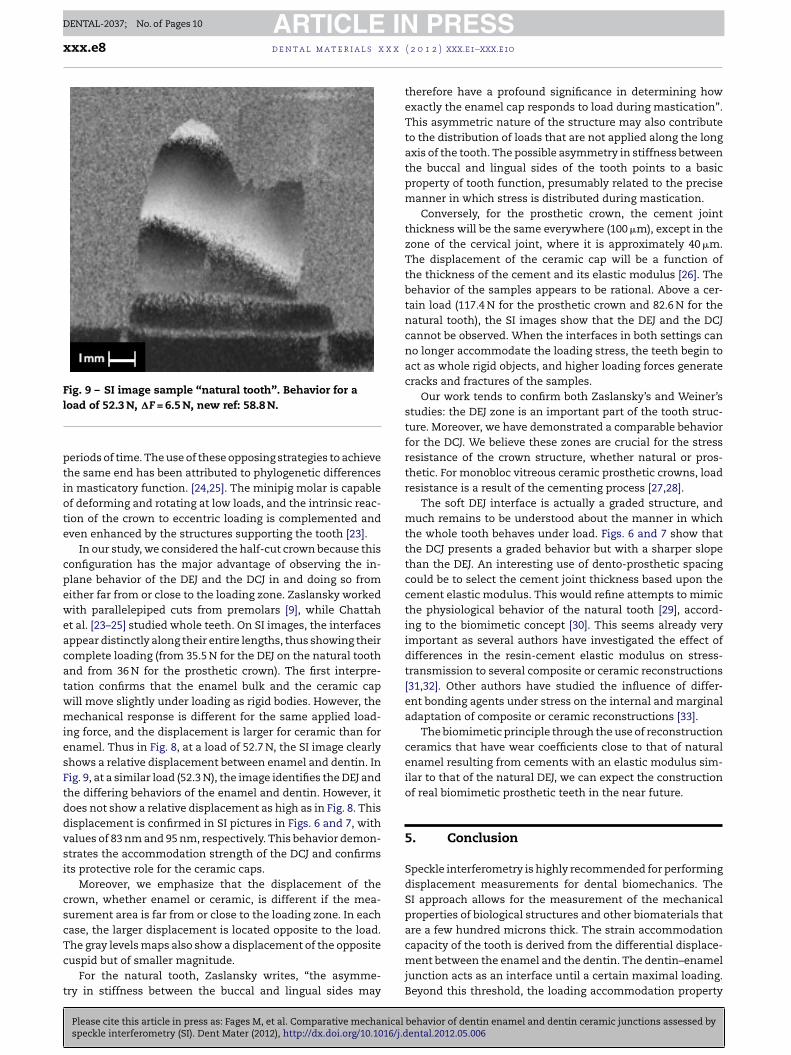
Fig. 9 shows the natural tooth with the same charge thanprosthetic tooth (Fig. 8) and allows to compare DEJ and DCJ.
4. Discussion
behavior of dentin enamel and dentin ceramic junctions assessed byental.2012.05.006
The importance of the DEJ as an interface binding the enameland dentin surfaces has long been recognized (Tylman [2]).Our understanding of the role and the location of the DEJ has
, new ref: 82.85 N. (A) SI image: a single black line calculation. (B) Displacement curve along the black line,m.
ARTICLE IN PRESSDENTAL-2037; No. of Pages 10
d e n t a l m a t e r i a l s x x x ( 2 0 1 2 ) xxx.e1–xxx.e10 xxx.e7
Fig. 7 – Prosthetic crown behavior under a load of 72.85 N, �F = 10 N, new ref: 82.85 N. (A) SI image: six red equal parallellines, 1 pixel separated, are defined across the DEJ. (B) Displacement curves: blue curve: displacement values along one ofthe six red lines. Black bold curve is the mean value fitting of the 6 blue curves. The displacement is approximately 95 nm.( end,
eepsatdqat
pa
F5
For interpretation of the references to color in this figure leg
volved with ongoing research. The unique mechanical prop-rties of this zone were first recognized from micro-hardnessrofiles (Craig et al. [18,19]). Wang and Weiner [7] measured thetrain across this zone when a compressive load was appliednd suggested that this is an important working part of theooth during mastication. An asymmetry between enamel andentin was noted previously (Wood et al. [20]) but was notuantified. Bechtle et al. explained the phenomenon of crackrrest at the DEJ using the elastic modulus mismatch betweenhe dentin and the enamel [21].
Please cite this article in press as: Fages M, et al. Comparative mechanical
speckle interferometry (SI). Dent Mater (2012), http://dx.doi.org/10.1016/j.d
It was found (Zaslansky [9]) using SI that a com-ressive load applied to the tip of the main cusp of
human premolar caused the entire enamel cap to
ig. 8 – SI image sample “prosthetic crown” and displacements s2.78 N, �F = 30.07 N, new ref: 82.85 N.
the reader is referred to the web version of the article.)
move essentially as a stiff body, tilting toward the buccalsurface.
Recently, Barak et al. [22] highlighted the importance ofenamel in a whole-tooth demonstration through a finite ele-ment model study and validated their findings by a metrologymethod. Chattah et al. [23] showed that the enamel cap in aminipig animal model is capable of deforming and rotatingat loads as low as 16 N. Zaslansky et al. [9] showed that theenamel cap of an isolated human premolar did not deform orrotate at loads lower than 80 N. Human enamel is stiffer than
behavior of dentin enamel and dentin ceramic junctions assessed byental.2012.05.006
that of the minipig, and the cusps do not deform or crack untilhigh loads are reached. However, in both cases, the aim was topreserve the functionality of the grinding surfaces over long
hown in a contour colored map. Behavior for a load of
ARTICLE IN PRESSDENTAL-2037; No. of Pages 10
xxx.e8 d e n t a l m a t e r i a l s x x x
Fig. 9 – SI image sample “natural tooth”. Behavior for a
capacity of the tooth is derived from the differential displace-
load of 52.3 N, �F = 6.5 N, new ref: 58.8 N.
periods of time. The use of these opposing strategies to achievethe same end has been attributed to phylogenetic differencesin masticatory function. [24,25]. The minipig molar is capableof deforming and rotating at low loads, and the intrinsic reac-tion of the crown to eccentric loading is complemented andeven enhanced by the structures supporting the tooth [23].
In our study, we considered the half-cut crown because thisconfiguration has the major advantage of observing the in-plane behavior of the DEJ and the DCJ in and doing so fromeither far from or close to the loading zone. Zaslansky workedwith parallelepiped cuts from premolars [9], while Chattahet al. [23–25] studied whole teeth. On SI images, the interfacesappear distinctly along their entire lengths, thus showing theircomplete loading (from 35.5 N for the DEJ on the natural toothand from 36 N for the prosthetic crown). The first interpre-tation confirms that the enamel bulk and the ceramic capwill move slightly under loading as rigid bodies. However, themechanical response is different for the same applied load-ing force, and the displacement is larger for ceramic than forenamel. Thus in Fig. 8, at a load of 52.7 N, the SI image clearlyshows a relative displacement between enamel and dentin. InFig. 9, at a similar load (52.3 N), the image identifies the DEJ andthe differing behaviors of the enamel and dentin. However, itdoes not show a relative displacement as high as in Fig. 8. Thisdisplacement is confirmed in SI pictures in Figs. 6 and 7, withvalues of 83 nm and 95 nm, respectively. This behavior demon-strates the accommodation strength of the DCJ and confirmsits protective role for the ceramic caps.
Moreover, we emphasize that the displacement of thecrown, whether enamel or ceramic, is different if the mea-surement area is far from or close to the loading zone. In eachcase, the larger displacement is located opposite to the load.The gray levels maps also show a displacement of the opposite
Please cite this article in press as: Fages M, et al. Comparative mechanical
speckle interferometry (SI). Dent Mater (2012), http://dx.doi.org/10.1016/j.d
cuspid but of smaller magnitude.For the natural tooth, Zaslansky writes, “the asymme-
try in stiffness between the buccal and lingual sides may
( 2 0 1 2 ) xxx.e1–xxx.e10
therefore have a profound significance in determining howexactly the enamel cap responds to load during mastication”.This asymmetric nature of the structure may also contributeto the distribution of loads that are not applied along the longaxis of the tooth. The possible asymmetry in stiffness betweenthe buccal and lingual sides of the tooth points to a basicproperty of tooth function, presumably related to the precisemanner in which stress is distributed during mastication.
Conversely, for the prosthetic crown, the cement jointthickness will be the same everywhere (100 �m), except in thezone of the cervical joint, where it is approximately 40 �m.The displacement of the ceramic cap will be a function ofthe thickness of the cement and its elastic modulus [26]. Thebehavior of the samples appears to be rational. Above a cer-tain load (117.4 N for the prosthetic crown and 82.6 N for thenatural tooth), the SI images show that the DEJ and the DCJcannot be observed. When the interfaces in both settings canno longer accommodate the loading stress, the teeth begin toact as whole rigid objects, and higher loading forces generatecracks and fractures of the samples.
Our work tends to confirm both Zaslansky’s and Weiner’sstudies: the DEJ zone is an important part of the tooth struc-ture. Moreover, we have demonstrated a comparable behaviorfor the DCJ. We believe these zones are crucial for the stressresistance of the crown structure, whether natural or pros-thetic. For monobloc vitreous ceramic prosthetic crowns, loadresistance is a result of the cementing process [27,28].
The soft DEJ interface is actually a graded structure, andmuch remains to be understood about the manner in whichthe whole tooth behaves under load. Figs. 6 and 7 show thatthe DCJ presents a graded behavior but with a sharper slopethan the DEJ. An interesting use of dento-prosthetic spacingcould be to select the cement joint thickness based upon thecement elastic modulus. This would refine attempts to mimicthe physiological behavior of the natural tooth [29], accord-ing to the biomimetic concept [30]. This seems already veryimportant as several authors have investigated the effect ofdifferences in the resin-cement elastic modulus on stress-transmission to several composite or ceramic reconstructions[31,32]. Other authors have studied the influence of differ-ent bonding agents under stress on the internal and marginaladaptation of composite or ceramic reconstructions [33].
The biomimetic principle through the use of reconstructionceramics that have wear coefficients close to that of naturalenamel resulting from cements with an elastic modulus sim-ilar to that of the natural DEJ, we can expect the constructionof real biomimetic prosthetic teeth in the near future.
5. Conclusion
Speckle interferometry is highly recommended for performingdisplacement measurements for dental biomechanics. TheSI approach allows for the measurement of the mechanicalproperties of biological structures and other biomaterials thatare a few hundred microns thick. The strain accommodation
behavior of dentin enamel and dentin ceramic junctions assessed byental.2012.05.006
ment between the enamel and the dentin. The dentin–enameljunction acts as an interface until a certain maximal loading.Beyond this threshold, the loading accommodation property
ARTICLE IN PRESSDENTAL-2037; No. of Pages 10
( 2 0 1
ddItTDtFimebeTmth
r
d e n t a l m a t e r i a l s x x x
isappears, and the tooth then behaves as a rigid body. Weemonstrate a similar behavior for the prosthetic crown tooth.
n this case, the enamel is replaced by the ceramic crown andhe dentin–enamel junction by the dentin–cement junction.hese behaviors indicate the interface role of the DEJ and theCJ in the capacity of teeth to accommodate the stresses of
heir physiological functions or even of their parafunctions.or the cement characteristics and the cement thickness usedn this paper, the accommodation effect of the DCJ is less
arked than that of the DEJ. Future study will deal with theffect of the cement characteristics and the cement thicknessy applying SI for samples having different cements and differ-nt thickness of cement joint, thanks to the CAD/CAM system.he limits of SI measurement are the sensitivity to rigid bodyotion and decorrelation noise affecting the spatial resolu-
ion. This can be enhanced by using smaller pixel sensors withigher photographic magnification.
e f e r e n c e s
[1] Imbeni V, Kruzic JJ, Marshall GW, Marshall SJ, Ritchie RO. Thedentin–enamel junction and the fracture of human teeth.Nature Materials 2005;4:229–32.
[2] Tylman SD. The dentino-enamel junction. Journal of DentalResearch 1928;8:615–22.
[3] Habelitz S, Marshall SJ, Marshall GW, Balooch M. Thefunctional width of the dentino-enamel junctiondetermined by AFM-based nanoscratching. Journal ofStructural Biology 2001;135:244–301.
[4] Lin CP, Douglas WH. Structure-property relations and crackresistance at the bovine dentin–enamel junction. Journal ofDental Research 1994;73:1072–8.
[5] Meyer JM, Bodier-Houlle P, Cuisinier FJG, Lesot H, Ruch JV.Initial aspects of mineralization at the dentino-enameljunction in embryonic mouse incisor in vivo and in vitro: aTEM comparative study. In Vitro Cellular and DevelopmentalBiology-Animal 1999;35(March (3)):159–68.
[6] Marshall GW, Balooch M, Gallagher RR, Gansky SA, MarshallSJ. Mechanical properties of the dentin–enamel junction:AFM studies of nano hardness, elastic modulus and fracture.Journal of Biomedical Materials Research 2001;54:87–95.
[7] Wang R, Weiner S. Strain–structure relations in human teethusing Moiré fringes. Journal of Biomechanics 1998;31:135–41.
[8] Zaslansky P, Shahar R, Barak MM, Friesem A, Weiner S.Tooth and bone deformation: structure and materialproperties by ESPI. Proceedings of SPIE 2006;6341.
[9] Zaslansky P, Friesem AA, Weiner S. Structure andmechanical properties of the soft zone separating bulkdentin and enamel in crowns of human teeth: insight intotooth function. Journal of Structural Biology2006;153(February (2)):188–99 [Epub. 2005 December 9].
[10] Bieniek KW, Marx R. The mechanical loading capacity ofnew all-ceramic crown and bridge materials. SchweizerMonatsschrift fur Zahnmedizin 1994;104(3):284–9.
[11] Gonzaga CC, Cesar PF, Miranda Jr WG, Yoshimura HN. Slowcrack growth and reliability of dental ceramics. DentalMaterials 2011;27(April (4)):394–406 [Epub. 2010 December24].
Please cite this article in press as: Fages M, et al. Comparative mechanical
speckle interferometry (SI). Dent Mater (2012), http://dx.doi.org/10.1016/j.d
[12] Addison O, Sodhi A, Fleming GJ. Seating load parametersimpact on dental ceramic reinforcement conferred bycementation with resin-cements. Dental Materials2010;26(September (9)):915–21.
2 ) xxx.e1–xxx.e10 xxx.e9
[13] Attia A, Kern M. Influence of cyclic loading and luting agentson the fracture load of two all-ceramic crown systems. TheJournal of Prosthetic Dentistry 2004;92(December (6)):551–6.
[14] Guarda GB, Goncalves LS, Correr AB, Moraes RR, SinhoretiMA, Correr-Sobrinho L. Luting glass ceramic restorationsusing a self-adhesive resin cement under different dentinconditions. Journal of Applied Oral Science 2010;18(June(3)):244–8.
[15] Fasbinder DJ. The Cerec system: 25 years of chairsideCAD/CAM dentistry. Journal of the American DieteticAssociation 2010;141(June (Suppl. 2)):3S–4S.
[16] Slangen P, De Veuster C, Renotte Y, Berwart L, Lion Y.Computer-aided interferometric measurements of drift andphase shifter calibration for DSPI (digital speckle patterninterferometry). Optical Engineering 1995;34(12):3526–30.
[17] Creath K. Phase-measurement interferometry techniques.In: Progress in optics XXVI. Elsevier Science Publisher B.V.;1988 [Chapter 5] p. 349–393.
[18] Craig R, Peyton FA. The micro-hardness of enamel anddentin. Journal of Dental Research 1958;37:661–8.
[19] Craig R, Gehring P, et al. Relation of structure to themicrohardness of human dentin. Journal of Dental Research1959;38:624–30.
[20] Wood JD, Wang RZ, et al. Mapping of tooth deformationcaused by moisture change using Moiré interferometry.Dental Materials 2003;19:159–66.
[21] Bechtle S, Fett T, Rizzi G, Habelitz S, Klocke A, Schneider GA.Crack arrest within teeth at the dentinoenamel junctioncaused by elastic modulus mismatch. Biomaterials2010;31(May (14)):4238–47 [Epub. 2010 February 18].
[22] Barak MM, Geiger S, Chattah NLT, Shahar R, Weiner S.Enamel dictates whole tooth deformation: a finite elementmodel study validated by a metrology method. Journal ofStructural Biology 2009;168:511–20.
[23] Chattah LT, Shahar R, Weiner S. Design strategy of minipigmolars using electronic speckle interferometry: comparisonof deformation under load between the tooth mandiblecomplex and isolated tooth. Advanced Materials2009;21:413–8.
[24] Strait DS, Richmond BG, Spencer MA, Ross CF, Dechow PC,Wood BA. Masticatory biomechanics and its relevance toearly hominid phylogeny: an examination of palatalthickness using finité-elements analysis. Journal of HumanEvolution 2007;52(May (5)):585–99.
[25] Chattah NL, Kupcik K, Shahar R, Hublin JJ, Weiner S.Structure-function relation of primate lower incisor: a studyof the déformation of Macaca dentition using electronicspeckle pattern interferometry (ESPI). Journal of Anatomy2011;218(1):87–95.
[26] Nakamura T, Wakabayashi K, Kinuta S, Nishida H, MiyamaeM, Yatani H. Mechanical properties of new self-adhesiveresin-based cement. Journal of Prosthodontic Research2010;54(April (2)):59–64 [Epub. 2009 October 30].
[27] Attia A, Abdelaziz KM, Freitag S, Kern M. Fracture load ofcomposite and feldspathic all ceramic CAD/CAM crowns.Journal of Prosthetic Dentistry 2006;95(February (2)):117–23.
[28] Attia A, Kern M. Fracture strength of all ceramic crownsluted using two bonding methods. Journal of ProstheticDentistry 2004;91(March (3)):247–52.
[29] Urabe I, Nakajima S, Sano H, Tagami J. Physical properties ofthe dentin–enamel junction region. American Journal ofDentistry 2000;13(June (3)):129–35.
[30] Magne P, Belser U. Understanding the intact tooth and thebiomimetic principle. In: Magne, Belser, editors. Bonded
behavior of dentin enamel and dentin ceramic junctions assessed byental.2012.05.006
porcelain restorations in the anterior dentition: abiomimetic approach. Chicago: Quintessence Publishing Co.;2002. p. 23–55.

ARTICLE IN PRESSDENTAL-2037; No. of Pages 10
x x
xxx.e10 d e n t a l m a t e r i a l s x[31] Ausiello P, Rengo S, Davidson CL, Watts DC. Stressdistributions in adhesively cemented ceramic and
Please cite this article in press as: Fages M, et al. Comparative mechanical
speckle interferometry (SI). Dent Mater (2012), http://dx.doi.org/10.1016/j.d
resin-composite class II inlay restorations: a 3D-FEA study.Dental Materials 2004;20(November (9)):862–72.
[32] Burke FJ, Watts DC. Effect of differing resin luting systemson fracture resistance of teeth restored with dentin-bonded
( 2 0 1 2 ) xxx.e1–xxx.e10
crowns. Quintessence International 1998;29(January(1)):21–7.
behavior of dentin enamel and dentin ceramic junctions assessed byental.2012.05.006
[33] Dietschi D, Moor L. Evaluation of the marginal and internaladaptation of different ceramic and composite inlaysystems after an in vitro fatigue test. Journal of AdhesiveDentistry 1999;1(1):41–56.