Embed Size (px)
Citation preview
39
LAMPIRAN
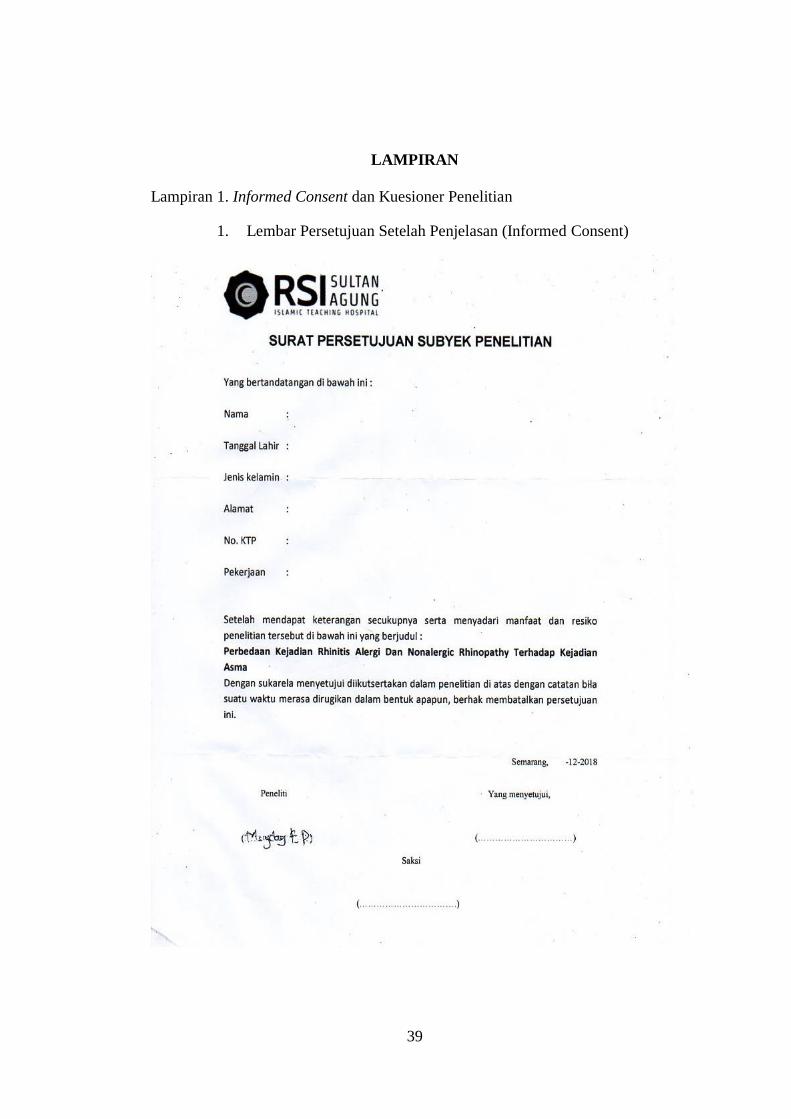
Lampiran 1. Informed Consent dan Kuesioner Penelitian
1. Lembar Persetujuan Setelah Penjelasan (Informed Consent)
40
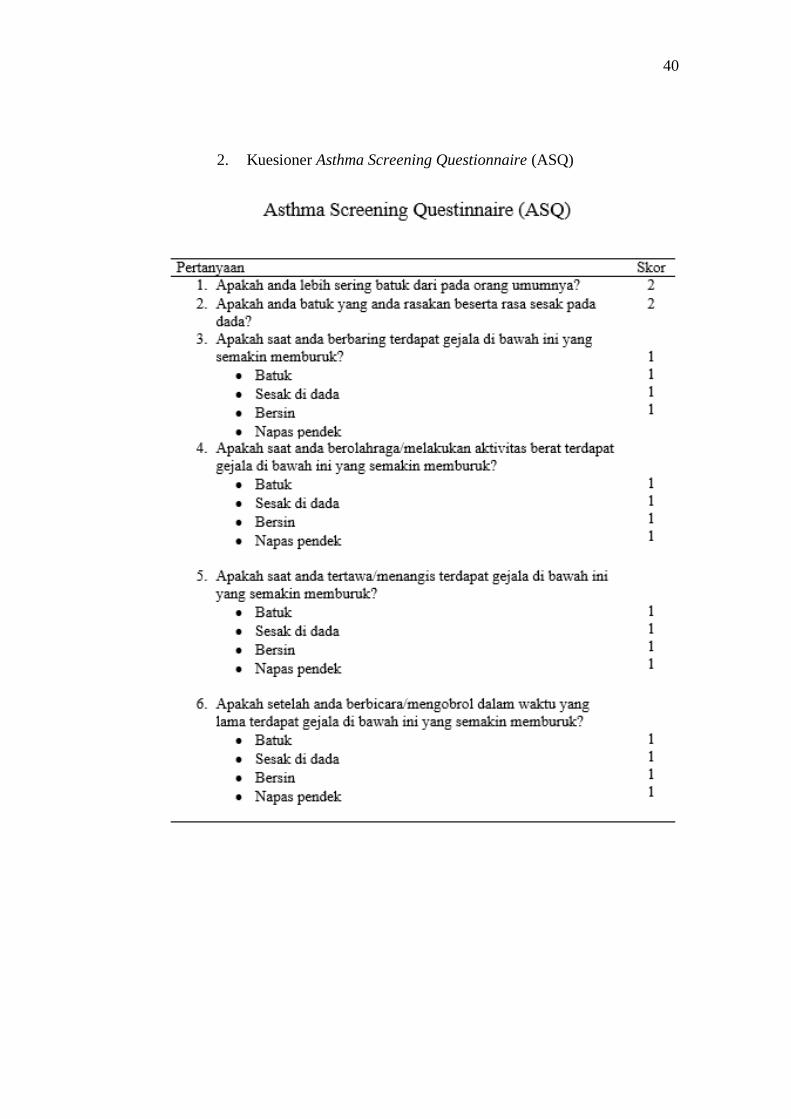
2. Kuesioner Asthma Screening Questionnaire (ASQ)
41
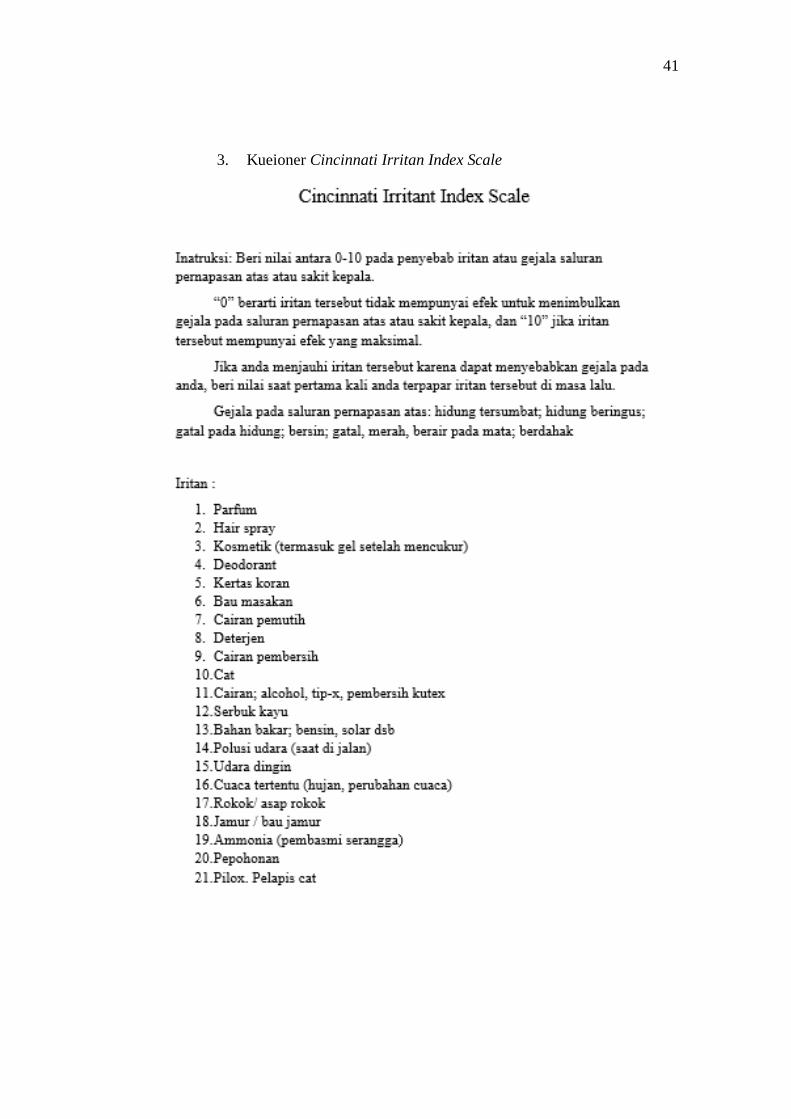
3. Kueioner Cincinnati Irritan Index Scale
42
Lampiran 2. Surat Keterangan Penelitian
43
Lampiran 3. Ethical Clearance
44
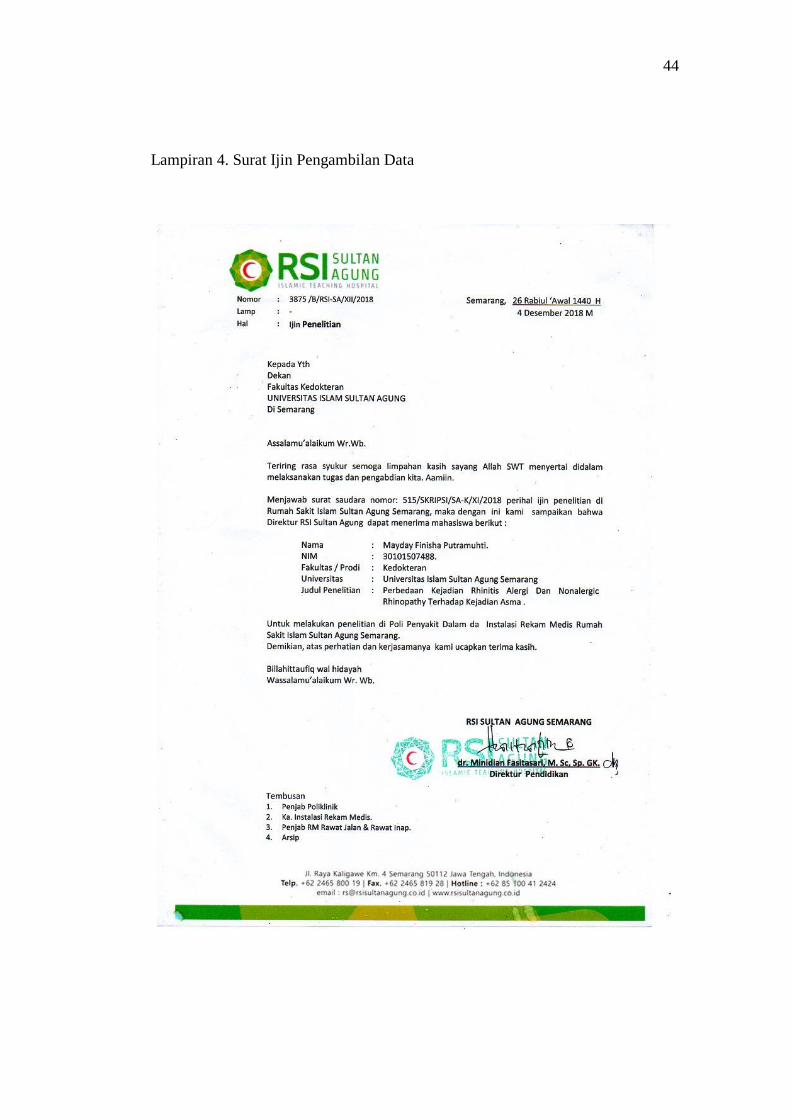
Lampiran 4. Surat Ijin Pengambilan Data
45
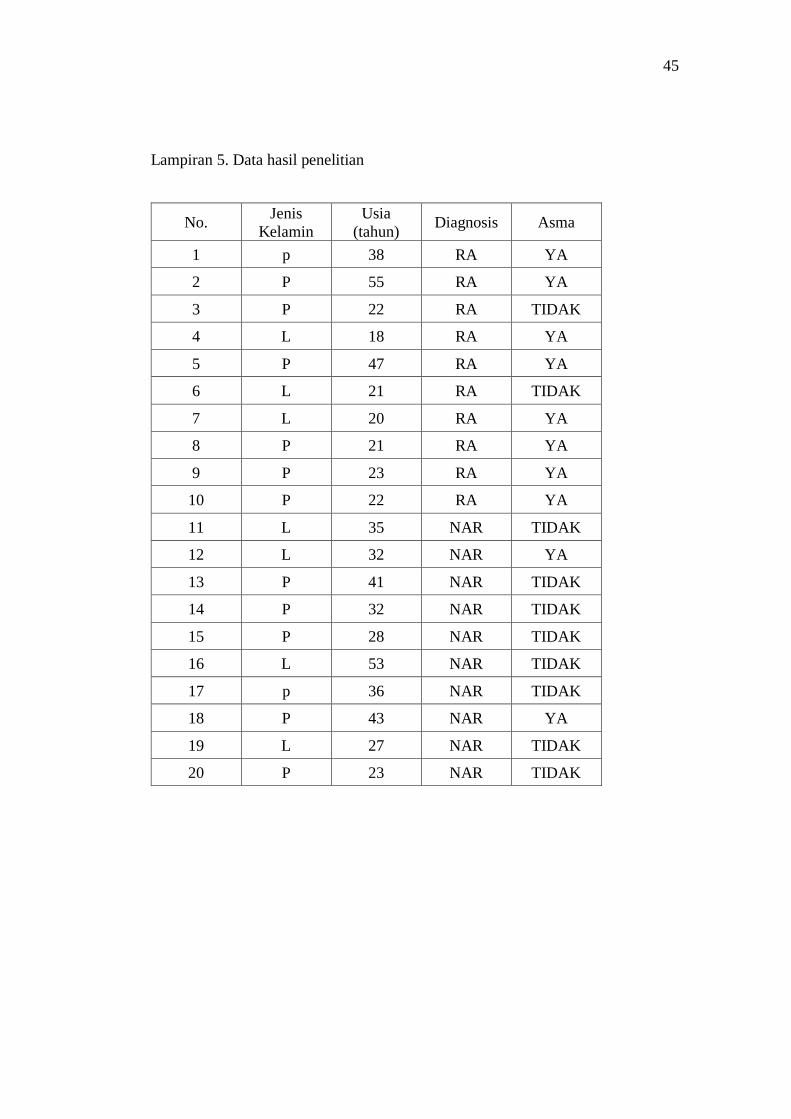
Lampiran 5. Data hasil penelitian
No. Jenis
Kelamin
Usia
(tahun) Diagnosis Asma
1 p 38 RA YA
2 P 55 RA YA
3 P 22 RA TIDAK
4 L 18 RA YA
5 P 47 RA YA
6 L 21 RA TIDAK
7 L 20 RA YA
8 P 21 RA YA
9 P 23 RA YA
10 P 22 RA YA
11 L 35 NAR TIDAK
12 L 32 NAR YA
13 P 41 NAR TIDAK
14 P 32 NAR TIDAK
15 P 28 NAR TIDAK
16 L 53 NAR TIDAK
17 p 36 NAR TIDAK
18 P 43 NAR YA
19 L 27 NAR TIDAK
20 P 23 NAR TIDAK
46
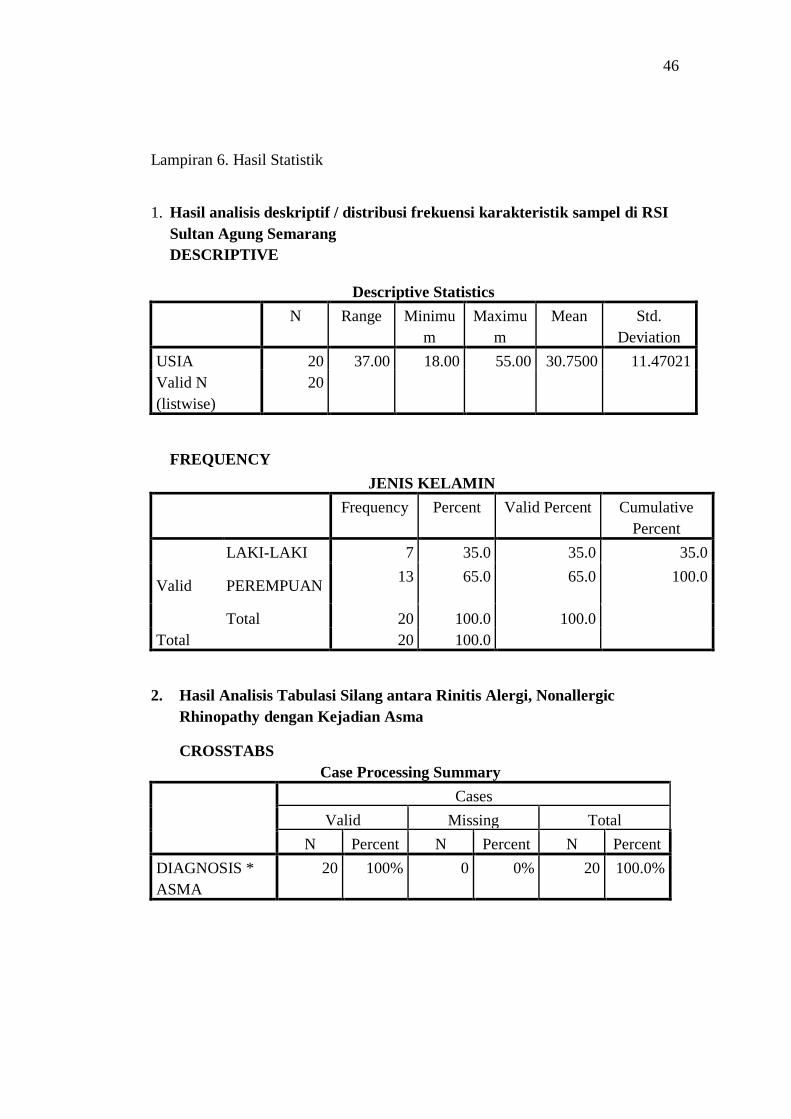
Lampiran 6. Hasil Statistik
1. Hasil analisis deskriptif / distribusi frekuensi karakteristik sampel di RSI
Sultan Agung Semarang
DESCRIPTIVE
Descriptive Statistics
N Range Minimu
m
Maximu
m
Mean Std.
Deviation
USIA 20 37.00 18.00 55.00 30.7500 11.47021
Valid N
(listwise)
20
FREQUENCY
JENIS KELAMIN
Frequency Percent Valid Percent Cumulative
Percent
Valid
LAKI-LAKI 7 35.0 35.0 35.0
PEREMPUAN 13 65.0 65.0 100.0
Total 20 100.0 100.0
Total 20 100.0
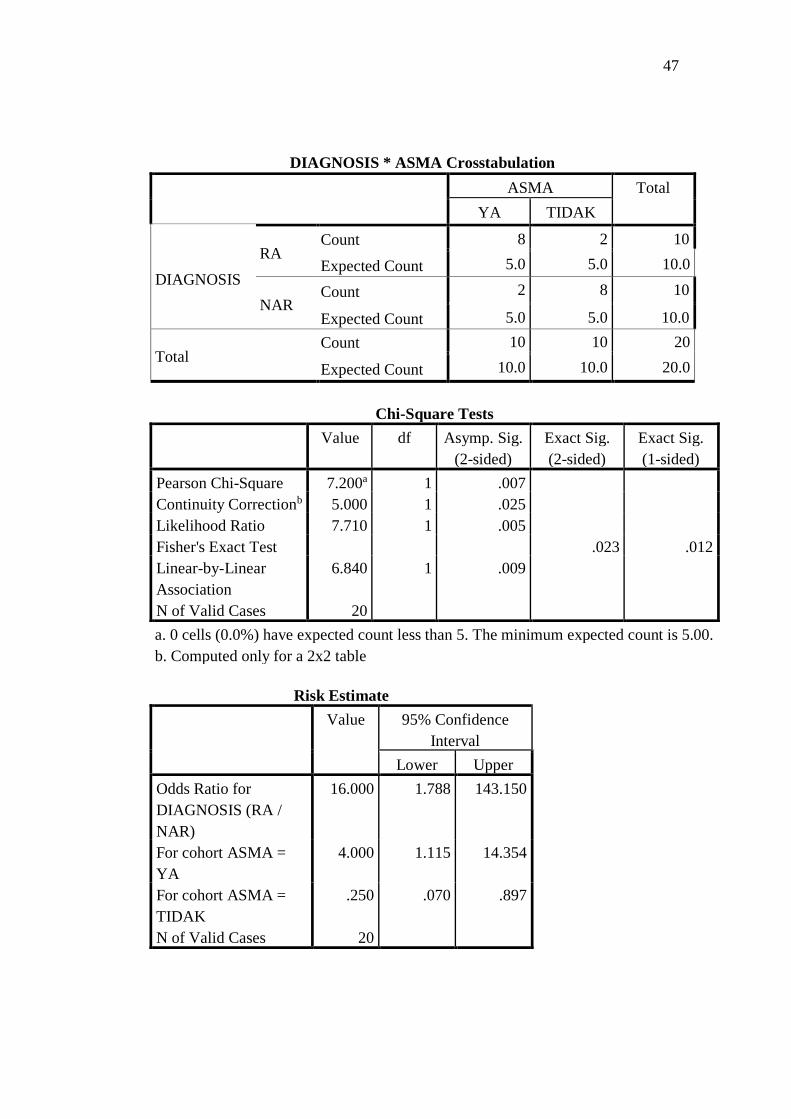
2. Hasil Analisis Tabulasi Silang antara Rinitis Alergi, Nonallergic
Rhinopathy dengan Kejadian Asma
CROSSTABS
Case Processing Summary
Cases
Valid Missing Total
N Percent N Percent N Percent
DIAGNOSIS *
ASMA
20 100% 0 0% 20 100.0%
47
DIAGNOSIS * ASMA Crosstabulation
ASMA Total
YA TIDAK
DIAGNOSIS
RA Count 8 2 10
Expected Count 5.0 5.0 10.0
NAR Count 2 8 10
Expected Count 5.0 5.0 10.0
Total Count 10 10 20
Expected Count 10.0 10.0 20.0
Chi-Square Tests
Value df Asymp. Sig.
(2-sided)
Exact Sig.
(2-sided)
Exact Sig.
(1-sided)
Pearson Chi-Square 7.200a 1 .007
Continuity Correctionb 5.000 1 .025
Likelihood Ratio 7.710 1 .005
Fisher's Exact Test .023 .012
Linear-by-Linear
Association
6.840 1 .009
N of Valid Cases 20
a. 0 cells (0.0%) have expected count less than 5. The minimum expected count is 5.00.
b. Computed only for a 2x2 table
Risk Estimate
Value 95% Confidence
Interval
Lower Upper
Odds Ratio for
DIAGNOSIS (RA /
NAR)
16.000 1.788 143.150
For cohort ASMA =
YA
4.000 1.115 14.354
For cohort ASMA =
TIDAK
.250 .070 .897
N of Valid Cases 20
48
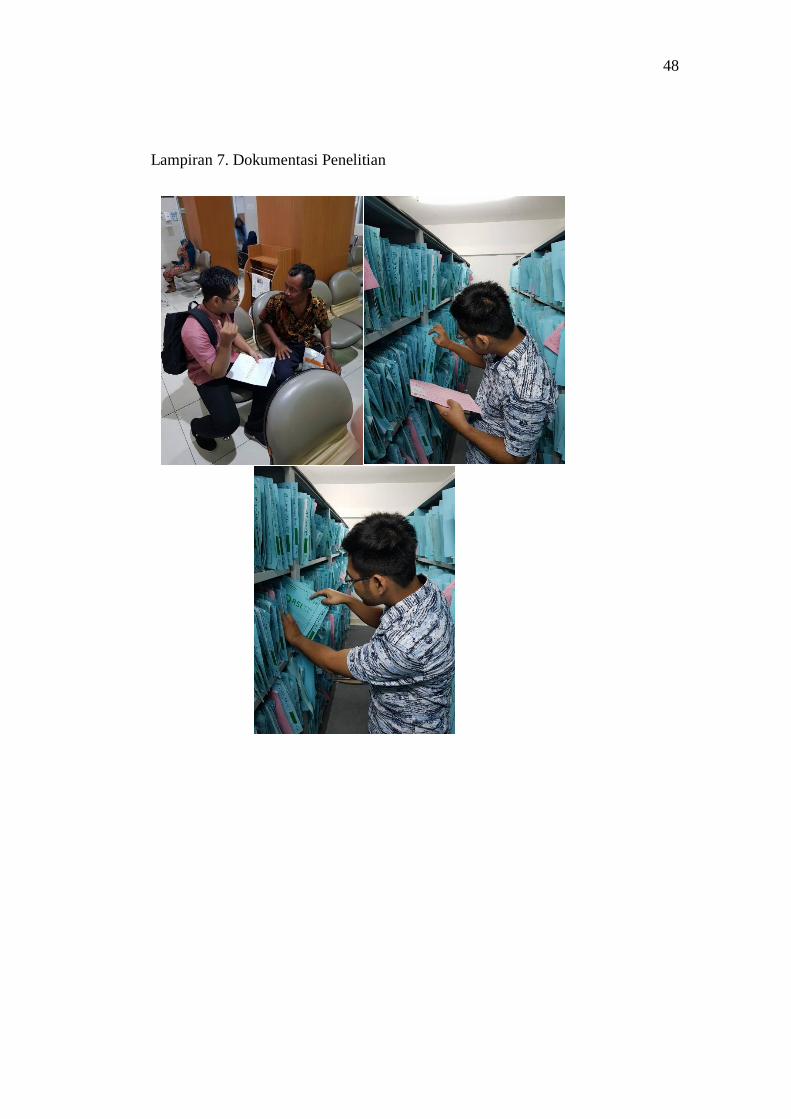
Lampiran 7. Dokumentasi Penelitian