Embed Size (px)
Citation preview
2560 IEEE TRANSACTIONS ON GEOSCIENCE AND REMOTE SENSING, VOL. 45, NO. 8, AUGUST 2007
A Large-Scale Systematic Evaluation of AlgorithmsUsing Ground-Penetrating Radar for Landmine
Detection and DiscriminationJoseph N. Wilson, Member, IEEE, Paul Gader, Senior Member, IEEE, Wen-Hsiung Lee,
Hichem Frigui, and K. C. Ho, Senior Member, IEEE
Abstract—A variety of algorithms for the detection of landminesand discrimination between landmines and clutter objects havebeen presented. We discuss four quite different approaches in us-ing data collected by a vehicle-mounted ground-penetrating radarsensor to detect landmines and distinguish them from clutterobjects. One uses edge features in a hidden Markov model; thesecond uses geometric features in a feed-forward order-weightedaverage network; the third employs spectral features as its basis;and the fourth clusters edge histograms. We present the results ofa large-scale cross-validation evaluation that uses a diverse set ofdata collected over 41 807.57 m2 of ground, including 1593 mineencounters. Finally, we discuss the results of that ranking andwhat one can conclude concerning the performance of these fouralgorithms in various settings.
Index Terms—Discrimination, ground-penetrating radar(GPR), landmine detection.
I. INTRODUCTION
G ROUND-PENETRATING radar (GPR) sensors havebeen used in a variety of landmine detection systems
for quite some time [1], and various computer algorithms inprocessing GPR data to detect landmines and discriminatebetween landmines and nonmine clutter objects have beenemployed [2]–[15]. Systematic evaluations and comparisonsof these algorithms are rare, however. Our purpose here is topresent the results of an evaluation of four different landminediscrimination algorithms that are applied to data collected witha vehicle-mounted radar system over 41 807.57 m2 of ground.
Manuscript received September 1, 2006; revised May 10, 2007. This workwas supported in part by the Army Research Office under Grant W911NF-05-1-0067. The views and conclusions contained in this document are those ofthe authors and should not be interpreted as representing the official policies,either expressed or implied, of the Army Research Office, Army ResearchLaboratory, or the U.S. Government. The U.S. Government is authorized toreproduce and distribute reprints for Government purposes notwithstanding anycopyright notation hereon.
J. N. Wilson and P. Gader are with the Computer and Information Scienceand Engineering Department, University of Florida, Gainesville, FL 32611USA (e-mail: [email protected]; [email protected]).
W.-H. Lee is with NIITEK, Inc., Sterling, VA 20166 USA (e-mail: [email protected]).
H. Frigui is with the Multimedia Research Laboratory, University ofLouisville, Louisville, KY 40202 USA (e-mail: [email protected]).
K. C. Ho is with the Electrical and Computer Engineering Department, Uni-versity of Missouri, Columbia, MO 65211 USA (e-mail: [email protected]).
Color versions of one or more of the figures in this paper are available onlineat http://ieeexplore.ieee.org.
Digital Object Identifier 10.1109/TGRS.2007.900993
A NIITEK, Inc., landmine detection system comprising avehicle-mounted 24-channel GPR array [16], [17] was usedto collect data from a variety of test sites. The sites includedirt and gravel roads and lanes and contain both landminesand clutter objects. The data collected by the NIITEK systemare used as input to each of the detection algorithms. TheNIITEK GPR collects 24 channels of data. Adjacent channelsare spaced approximately 5 cm apart in the crosstrack direction.The downtrack interval between samples in each channel isapproximately 5 cm. The system uses a V-dipole antenna thatgenerates a wideband pulse ranging from 200 MHz to 7 GHz.Each A-scan, that is, the measured waveform that is collectedin one channel at one downtrack position, contains 416 timesamples at which the GPR signal return is recorded. Eachsample corresponds to roughly 8 ps. Although we often referto the time index as depth, since the radar wave is travelingthrough different media, this index does not represent a uniformsampling of depth. Thus, we model an entire collection of inputdata as a 3-D matrix of sample values S(x, y, z), where theindices x, y, and z represent downtrack position, crosstrackposition, and depth, respectively.
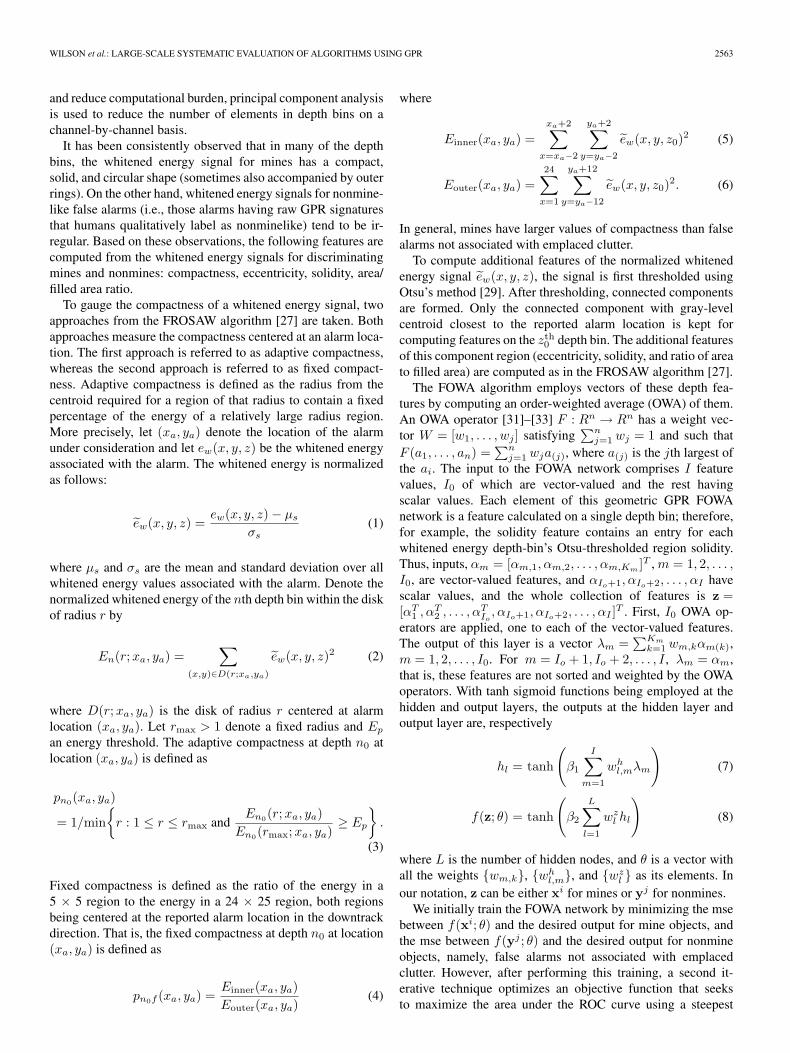
Fig. 1 shows several B-scans (sequences of A-scans) of bothdowntrack (formed from a time sequence of A-scans froma single sensor channel) and crosstrack (formed from eachchannel’s response in a single sample). The surveyed objectposition is highlighted in each figure. The objects scanned arethe following: 1) a high-metal content antitank mine; 2) a low-metal antitank mine; 3) a soft-drink can; and 4) a wood block.
II. DISCRIMINATION ALGORITHMS
Landmine detection algorithms, like many other target de-tection algorithms, typically consist of a number of discretephases. Often, a prescreener is applied to reduce the volume ofdata to be inspected by later phases. The prescreener identifiesdistinct alarms (points of interest) in the data. Features arethen extracted from the data corresponding to the alarms. Then,these features are presented to an algorithm that discriminatesbetween landmines and nonmine objects (false alarms). Weare concerned here in evaluating the utility of discriminationalgorithms.
Various algorithms have been applied to the problem of dis-crimination between landmines and false alarms. In this paper,we consider four specific algorithms of distinct character. The
0196-2892/$25.00 © 2007 IEEE
WILSON et al.: LARGE-SCALE SYSTEMATIC EVALUATION OF ALGORITHMS USING GPR 2561
Fig. 1. NIITEK Radar downtrack and crosstrack B-scans pairs. (a) Metal mine. (b) Low-metal mine. (c) Soft-drink can. (d) Wood block.
first employs a hidden Markov model (HMM) that models thetime-varying behavior of GPR signals encoded using edge di-rection information to compute the likelihood that a sequence ofmeasurements is consistent with a buried landmine. The secondextracts geometric features of the GPR data associated with aground location and applies a feed-forward order-weighted av-erage (FOWA) network to discriminate between landmines andclutter. The third algorithm extracts features from the frequencyspectrum of the GPR data associated with a ground locationand formulates a confidence value based on similarity to acollection of features that characterize mine objects. The finalalgorithm extracts edge histograms capturing the frequency ofoccurrence of edge orientations in the data associated witha ground position and then uses a fuzzy K-nearest neighbor(K-NN) algorithm to generate a mine confidence level.
Rather than processing each of the many discrete locationssampled by the GPR array, our algorithms restrict their process-ing to alarm locations identified by a prescreener algorithm.The prescreener can be thought of as a conservative detectionalgorithm, that is, one designed to provide a high probabilityof landmine detection at the expense of inclusion of manyfalse alarms. False alarms arise as a result of radar signals thatpresent a minelike character. Such signals are generally saidto be a result of clutter. In this evaluation, clutter arises fromtwo different processes. One type of clutter is emplaced andsurveyed in an effort to test the robustness of the algorithms.Other clutter is a result of either human activity unrelated tothe data collection or natural processes. We refer to this secondkind of clutter as nonemplaced. Nonemplaced clutter includesobjects discarded or lost by humans, soil inconsistencies andvoids (due to formation processes, erosion, or excavation),stones, roots, and other vegetation, as well as remnants ofanimal activity. It is the job of the subsequent algorithms todiscriminate between those prescreener alarms correspondingto landmines and those corresponding to clutter. All algorithmsconsidered here were applied to data that were prescreened
using the Duke University NUKEv6 prescreener, a variant ofthe least mean square prescreener [18], [19]. A version ofthis algorithm (F1) has been implemented in real time in auniprocessor system. The prescreener detected 1560 of 1593mines encountered in the data, yielding a 97.9% probabilityof detection. It rejected 161 of 211 emplaced clutter objectsencountered. It yielded a total of 3435 false alarms that areassociated with nonemplaced clutter objects.
A. HMM Algorithm
The NIITEK GPR system produces sequences of observationvectors that can be considered as functions of uniform time (andspace if the vehicle velocity is constant). Signals arising fromthe presence of buried landmines can be used to develop anHMM that captures the probabilities that sequences of thesesignals were produced by landmines and to infer the locationof possible landmines. We modified the work of Frigui et al.[25] to give us an HMM suitable for use with the NIITEKGPR data.
HMMs are stochastic models for complex processes thatproduce time sequences of random observations as a functionof states. They have been successfully applied to the problemsof speech and handwriting recognition [20]–[22]. An HMMproduces a sequence of random observation vectors at discretetimes according to an underlying Markov chain. At each obser-vation time, the Markov chain may be in one of N states, andgiven that the chain is in a certain state, there are probabilitiesof moving to other states. These probabilities are called thetransition probabilities.
The model is said to be hidden because the states are notdirectly observable. Given an observation vector at time t, anda state S, there is a probability that the chain is in state S. Theactual state is described by a probability density function, whichcan either be continuous or discrete. The probability densityfunctions describing the states define the probabilities of the
2562 IEEE TRANSACTIONS ON GEOSCIENCE AND REMOTE SENSING, VOL. 45, NO. 8, AUGUST 2007
observations conditioned upon the chain being in the associatedstate. Thus, the HMM is characterized by three sets of prob-ability density functions: the transition probabilities, the stateprobability density functions, and the initial probabilities. In thecase of the discrete HMM, the observation vectors are typicallyquantized into a finite set of symbols, called the codebook. Eachstate is represented by a discrete probability density functionthat assigns each symbol a probability of occurring given thatthe system is in a given state.
We use Rabiner’s notation [21], [22] in the brief discussionhere. The compact notation λ = (A,B, π) is used to indi-cate the parameter set of an HMM, where A = {ai,j}, ai,j =P (qt+1 = Sj |qt = Si) are the state transition probability dis-tributions, B = {bj(k)}, bj(k) = P (νk at t|qt = Sj) are theobservation symbol probabilities (of encountering observationk in state j), and π = {πi}, πi = P (q1 = Si) are the initialstate probabilities.
The three problems of interest that must be solved to employthe model are as follows: 1) classification; 2) identifying anoptimal state sequence; and 3) estimating the model parameters.
Classification involves computing the probability of an ob-servation sequence O = O1, O2, . . . , OT given a model λ,P (O|λ). In the landmine detection problem, this corresponds tofinding the probability of observing a sequence of GPR signalswhen the sequence is associated with a mine and λ is a landminemodel; or when the sequence is a result of clutter and λ is aclutter model.
In applications, it often turns out that computing an optimalstate sequence is more useful than P (O|λ). There are severalpossible ways of finding an optimal state sequence associatedwith the given observation sequence, depending on the def-inition of the optimal state sequence, i.e., there are severalpossible optimality criteria. One that is particularly useful is tomaximize P (O,Q|λ) over all possible state sequences Q. TheViterbi algorithm is an efficient formal technique in finding thismaximum state sequence and associated probability.
The Baum–Welch algorithm [23], [24], which is an iterativeapproach to parameter estimation, was used to identify theparameters of the model employed in this paper. The parametersfor the model employed in this paper were created using adifferent radar system [25].
Our goal is to produce a scalar value indicating our confi-dence that a buried landmine is present at any of the variousspatial positions (x, y) encountered by the vehicle-mountedsensor. To fit into the HMM context, a sequence of observationvectors must be produced for each point. These observationvectors are features that encode important information aboutthe landmine signatures in a compact form. The downtrackobservation sequence at the point (x, y) will be the sequence ofobservation vectors O(x, y − k), O(x, y − k + 1), . . . , O(x,y − 1), O(x, y), O(x, y + 1), . . . , O(x, y + k), and the cross-track sequence is the set of vectors O(x− k, y), O(x− k +1, y), . . . , O(x− 1, y), O(x, y), O(x+ 1, y), . . . , O(x+ k, y).To generate these observations, we preprocess the data toaccentuate edges in the diagonal and antidiagonal directions.Let S(x, y, z) denote the raw 3-D GPR data. The downtrackand crosstrack second derivatives are first estimated on the rawdata. The reason for differentiating is that it removes stationary
effects that remain relatively constant from scan to scan such asthe return from the ground and the standing pattern caused bythe interaction of the GPR with the surrounding components.Although differentiation is sensitive to noise, the NIITEK dataare not very noisy; thus, clutter objects rather than systemnoise will be more likely to yield false alarms. The featurescalculated from this second-derivative images are the strengthsof diagonal and antidiagonal edges calculated from downtrackor crosstrack B-scans.
The discrete mine model has three states as does the back-ground model. The discrete mine model is a left-to-right model,in that, states are ordered, and the transition probabilities inmoving to a lower numbered state are zero. The three minestates correspond to the leading edge, center, and trailing edgeof a mine. Two optimal state sequences are computed for themine model. One assuming the model is in the third mine stateat the final time, and the other assuming the model is in thebackground state at the final time. The state sequence with thehighest probability produces the model output x (the downtrackresponse) and y (the crosstrack response). These are combinedto form the HMM score h = (αx+ (1 − α)y) +
√xy, where
α is chosen to be 0.5 for alarms in channels 6–19, and 0.75for channels 1–5 and 20–24. This assigns equal weight to theindividual crosstrack and downtrack responses in those chan-nels in which most of the mine signature is expected to befully present in the crosstrack scans, and a higher weight to thedowntrack response in those channels near the edges of the datavolume where only a portion of the crosstrack sequence is ex-pected to appear. Finally, the geometric mean of the combineddowntrack, crosstrack HMM response, and the prescreener con-fidence p is used as the resulting mine confidence Conf =
√hp.
We can summarize the HMM algorithm processing stepsas follows.
1) Estimate downtrack and crosstrack second derivativeB-scans.
2) Form observation sequences from diagonal and antidiag-onal edge features in second derivative B-scans.
3) Find mine model probabilities x and y using downtrackand crosstrack observation sequences, respectively.
4) Form HMM score h = (αx+ (1 − α)y) +√xy and
confidence Conf =√hp.
B. Geometric Feature FOWA ROCA Algorithm (GEOM)
The GEOM is based on a single hidden-layer FOWA network[30], which is essentially a perceptron with a combination ofscalar and order-weighted average vector input features. Thefeatures presented to this network are the geometric features ofthe FROSAW landmine detection algorithm [27]. To improvethe algorithm’s accuracy, we employ an iterative technique thatmaximizes the area under the receiver operating characteristics(ROC) curve, which we refer to as ROCA [28].
The features employed by this algorithm are geometric fea-tures of the GPR data. These features are captured in a depth-bin whitened version of the GPR data. The GPR data aresegmented into a sequence of subimages that overlap in thedepth dimension. To reduce noise, decorrelate time samples,
WILSON et al.: LARGE-SCALE SYSTEMATIC EVALUATION OF ALGORITHMS USING GPR 2563
and reduce computational burden, principal component analysisis used to reduce the number of elements in depth bins on achannel-by-channel basis.
It has been consistently observed that in many of the depthbins, the whitened energy signal for mines has a compact,solid, and circular shape (sometimes also accompanied by outerrings). On the other hand, whitened energy signals for nonmine-like false alarms (i.e., those alarms having raw GPR signaturesthat humans qualitatively label as nonminelike) tend to be ir-regular. Based on these observations, the following features arecomputed from the whitened energy signals for discriminatingmines and nonmines: compactness, eccentricity, solidity, area/filled area ratio.
To gauge the compactness of a whitened energy signal, twoapproaches from the FROSAW algorithm [27] are taken. Bothapproaches measure the compactness centered at an alarm loca-tion. The first approach is referred to as adaptive compactness,whereas the second approach is referred to as fixed compact-ness. Adaptive compactness is defined as the radius from thecentroid required for a region of that radius to contain a fixedpercentage of the energy of a relatively large radius region.More precisely, let (xa, ya) denote the location of the alarmunder consideration and let ew(x, y, z) be the whitened energyassociated with the alarm. The whitened energy is normalizedas follows:
ew(x, y, z) =ew(x, y, z) − µs
σs(1)
where µs and σs are the mean and standard deviation over allwhitened energy values associated with the alarm. Denote thenormalized whitened energy of the nth depth bin within the diskof radius r by
En(r;xa, ya) =∑
(x,y)∈D(r;xa,ya)
ew(x, y, z)2 (2)
where D(r;xa, ya) is the disk of radius r centered at alarmlocation (xa, ya). Let rmax > 1 denote a fixed radius and Ep
an energy threshold. The adaptive compactness at depth n0 atlocation (xa, ya) is defined as
pn0(xa, ya)
= 1/min{r : 1 ≤ r ≤ rmax and
En0(r;xa, ya)En0(rmax;xa, ya)
≥ Ep
}.
(3)
Fixed compactness is defined as the ratio of the energy in a5 × 5 region to the energy in a 24 × 25 region, both regionsbeing centered at the reported alarm location in the downtrackdirection. That is, the fixed compactness at depth n0 at location(xa, ya) is defined as
pn0f (xa, ya) =Einner(xa, ya)Eouter(xa, ya)
(4)
where
Einner(xa, ya) =xa+2∑
x=xa−2
ya+2∑y=ya−2
ew(x, y, z0)2 (5)
Eouter(xa, ya) =24∑
x=1
ya+12∑y=ya−12
ew(x, y, z0)2. (6)
In general, mines have larger values of compactness than falsealarms not associated with emplaced clutter.
To compute additional features of the normalized whitenedenergy signal ew(x, y, z), the signal is first thresholded usingOtsu’s method [29]. After thresholding, connected componentsare formed. Only the connected component with gray-levelcentroid closest to the reported alarm location is kept forcomputing features on the zth0 depth bin. The additional featuresof this component region (eccentricity, solidity, and ratio of areato filled area) are computed as in the FROSAW algorithm [27].
The FOWA algorithm employs vectors of these depth fea-tures by computing an order-weighted average (OWA) of them.An OWA operator [31]–[33] F : Rn → Rn has a weight vec-tor W = [w1, . . . , wj ] satisfying
∑nj=1 wj = 1 and such that
F (a1, . . . , an) =∑n
j=1 wja(j), where a(j) is the jth largest ofthe ai. The input to the FOWA network comprises I featurevalues, I0 of which are vector-valued and the rest havingscalar values. Each element of this geometric GPR FOWAnetwork is a feature calculated on a single depth bin; therefore,for example, the solidity feature contains an entry for eachwhitened energy depth-bin’s Otsu-thresholded region solidity.Thus, inputs, αm = [αm,1, αm,2, . . . , αm,Km
]T ,m = 1, 2, . . . ,I0, are vector-valued features, and αIo+1, αIo+2, . . . , αI havescalar values, and the whole collection of features is z =[αT
1 , αT2 , . . . , α
TIo, αIo+1, αIo+2, . . . , αI ]T . First, I0 OWA op-
erators are applied, one to each of the vector-valued features.The output of this layer is a vector λm =
∑Km
k=1 wm,kαm(k),m = 1, 2, . . . , I0. For m = Io + 1, Io + 2, . . . , I , λm = αm,that is, these features are not sorted and weighted by the OWAoperators. With tanh sigmoid functions being employed at thehidden and output layers, the outputs at the hidden layer andoutput layer are, respectively
hl = tanh
(β1
I∑m=1
whl,mλm
)(7)
f(z; θ) = tanh
(β2
L∑l=1
wzl hl
)(8)
where L is the number of hidden nodes, and θ is a vector withall the weights {wm,k}, {wh
l,m}, and {wzl } as its elements. In
our notation, z can be either xi for mines or yj for nonmines.We initially train the FOWA network by minimizing the mse
between f(xi; θ) and the desired output for mine objects, andthe mse between f(yj ; θ) and the desired output for nonmineobjects, namely, false alarms not associated with emplacedclutter. However, after performing this training, a second it-erative technique optimizes an objective function that seeksto maximize the area under the ROC curve using a steepest
2564 IEEE TRANSACTIONS ON GEOSCIENCE AND REMOTE SENSING, VOL. 45, NO. 8, AUGUST 2007
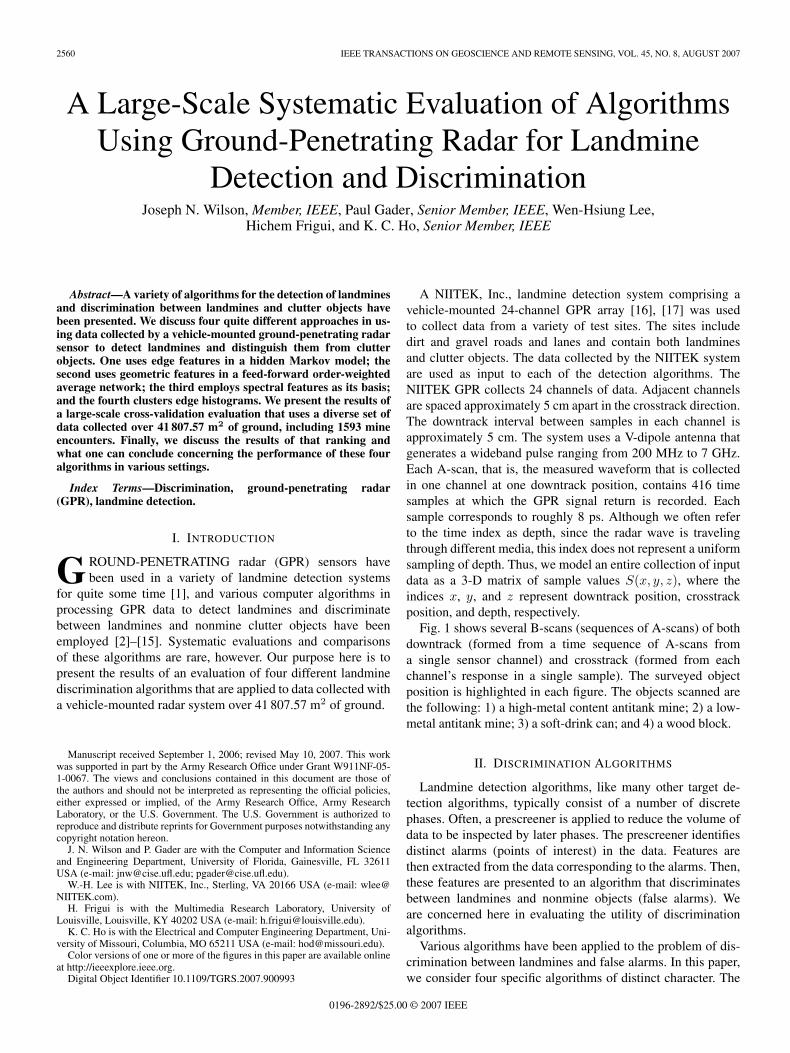
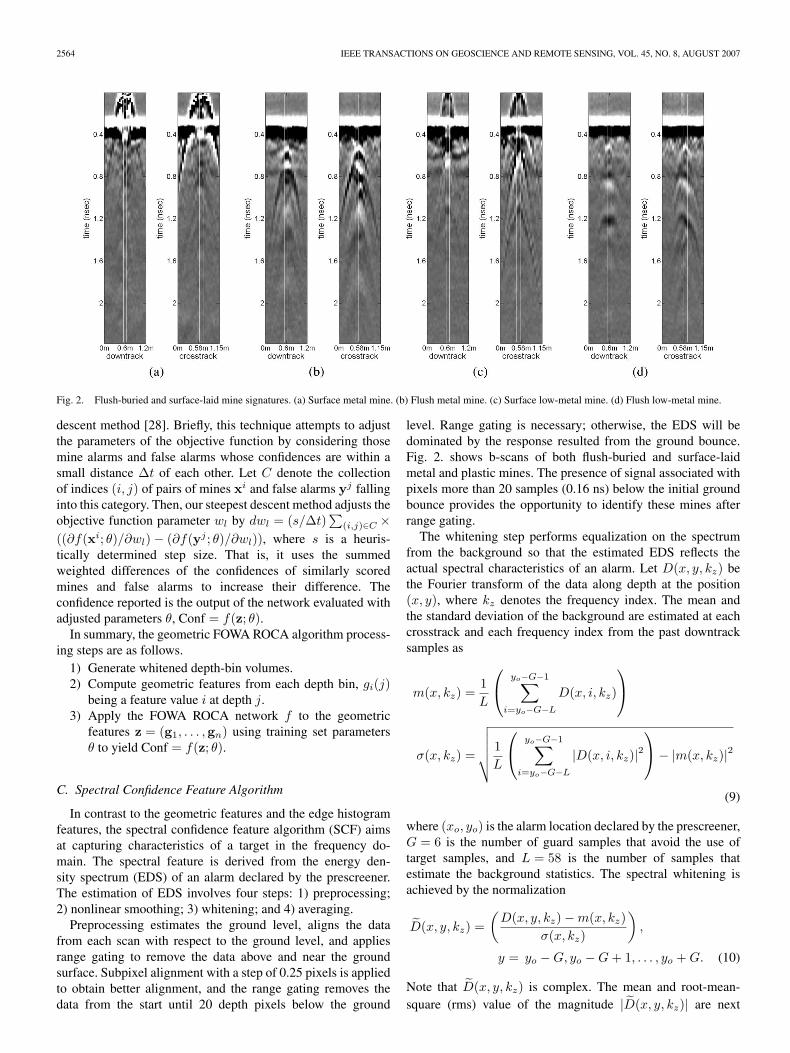
Fig. 2. Flush-buried and surface-laid mine signatures. (a) Surface metal mine. (b) Flush metal mine. (c) Surface low-metal mine. (d) Flush low-metal mine.
descent method [28]. Briefly, this technique attempts to adjustthe parameters of the objective function by considering thosemine alarms and false alarms whose confidences are within asmall distance ∆t of each other. Let C denote the collectionof indices (i, j) of pairs of mines xi and false alarms yj fallinginto this category. Then, our steepest descent method adjusts theobjective function parameter wl by dwl = (s/∆t)
∑(i,j)∈C ×
((∂f(xi; θ)/∂wl) − (∂f(yj ; θ)/∂wl)), where s is a heuris-tically determined step size. That is, it uses the summedweighted differences of the confidences of similarly scoredmines and false alarms to increase their difference. Theconfidence reported is the output of the network evaluated withadjusted parameters θ, Conf = f(z; θ).
In summary, the geometric FOWA ROCA algorithm process-ing steps are as follows.
1) Generate whitened depth-bin volumes.2) Compute geometric features from each depth bin, gi(j)
being a feature value i at depth j.3) Apply the FOWA ROCA network f to the geometric
features z = (g1, . . . ,gn) using training set parametersθ to yield Conf = f(z; θ).
C. Spectral Confidence Feature Algorithm
In contrast to the geometric features and the edge histogramfeatures, the spectral confidence feature algorithm (SCF) aimsat capturing characteristics of a target in the frequency do-main. The spectral feature is derived from the energy den-sity spectrum (EDS) of an alarm declared by the prescreener.The estimation of EDS involves four steps: 1) preprocessing;2) nonlinear smoothing; 3) whitening; and 4) averaging.
Preprocessing estimates the ground level, aligns the datafrom each scan with respect to the ground level, and appliesrange gating to remove the data above and near the groundsurface. Subpixel alignment with a step of 0.25 pixels is appliedto obtain better alignment, and the range gating removes thedata from the start until 20 depth pixels below the ground
level. Range gating is necessary; otherwise, the EDS will bedominated by the response resulted from the ground bounce.Fig. 2. shows b-scans of both flush-buried and surface-laidmetal and plastic mines. The presence of signal associated withpixels more than 20 samples (0.16 ns) below the initial groundbounce provides the opportunity to identify these mines afterrange gating.
The whitening step performs equalization on the spectrumfrom the background so that the estimated EDS reflects theactual spectral characteristics of an alarm. Let D(x, y, kz) bethe Fourier transform of the data along depth at the position(x, y), where kz denotes the frequency index. The mean andthe standard deviation of the background are estimated at eachcrosstrack and each frequency index from the past downtracksamples as
m(x, kz) =1L
yo−G−1∑i=yo−G−L
D(x, i, kz)
σ(x, kz) =
√√√√√ 1L
yo−G−1∑i=yo−G−L
|D(x, i, kz)|2− |m(x, kz)|2
(9)
where (xo, yo) is the alarm location declared by the prescreener,G = 6 is the number of guard samples that avoid the use oftarget samples, and L = 58 is the number of samples thatestimate the background statistics. The spectral whitening isachieved by the normalization
D(x, y, kz) =(D(x, y, kz) −m(x, kz)
σ(x, kz)
),
y = yo −G, yo −G+ 1, . . . , yo +G. (10)
Note that D(x, y, kz) is complex. The mean and root-mean-square (rms) value of the magnitude |D(x, y, kz)| are next
WILSON et al.: LARGE-SCALE SYSTEMATIC EVALUATION OF ALGORITHMS USING GPR 2565
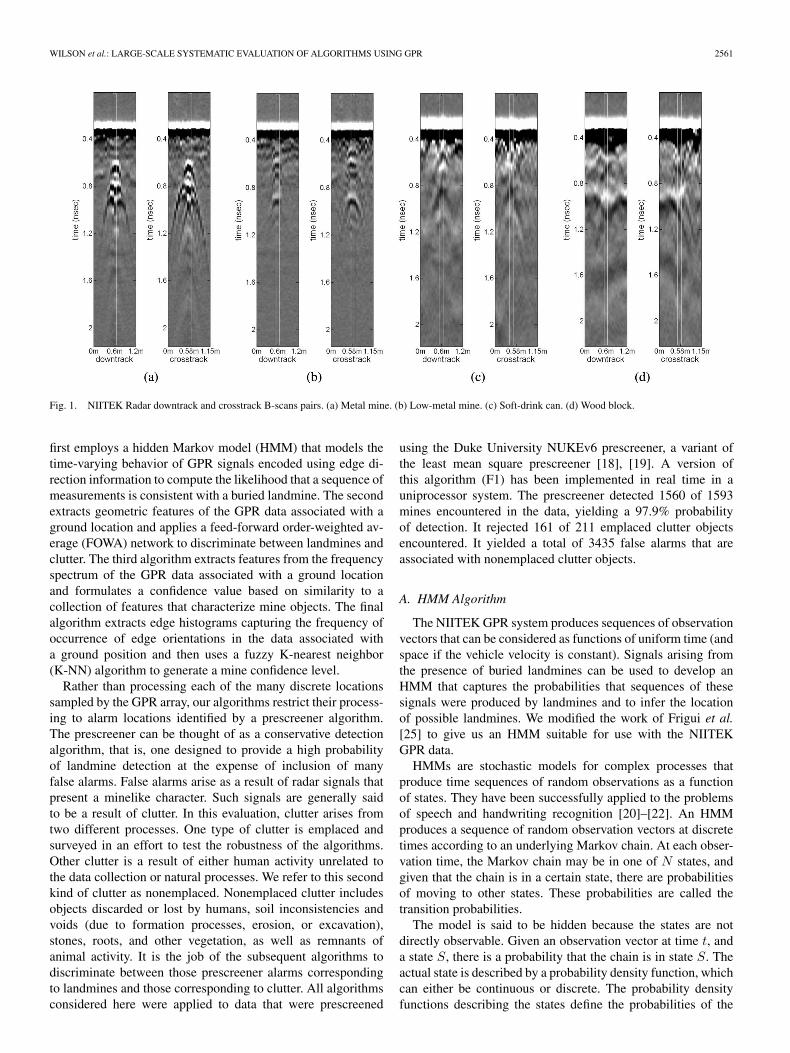
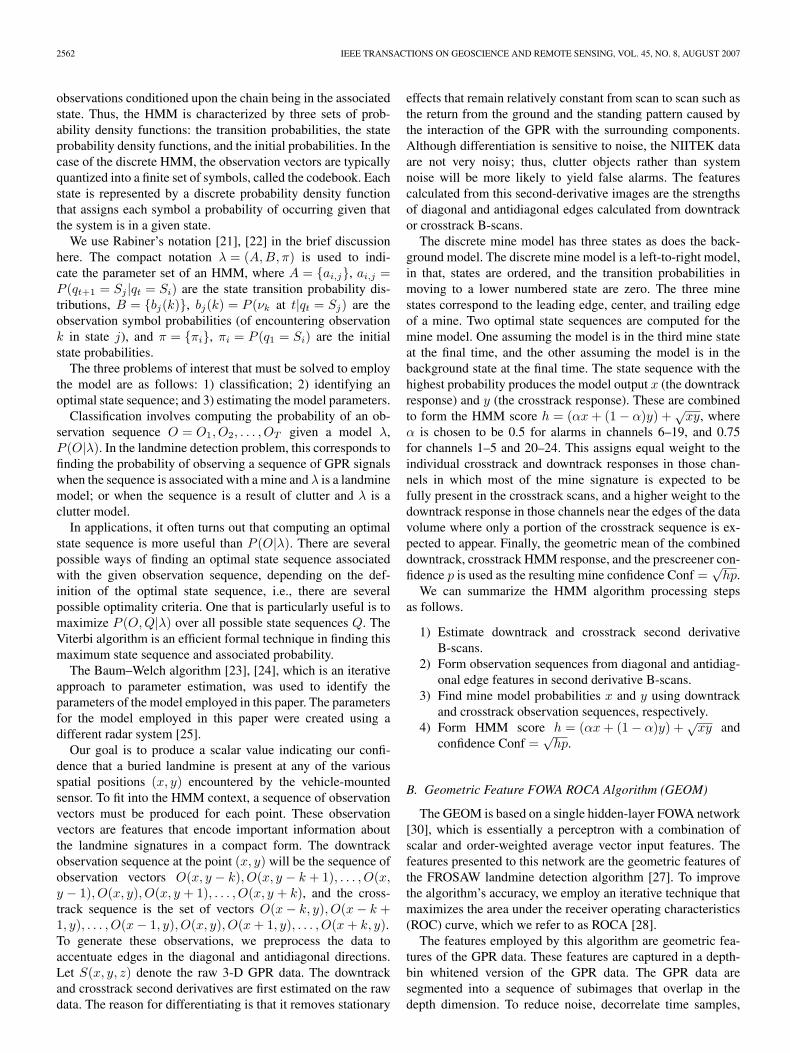
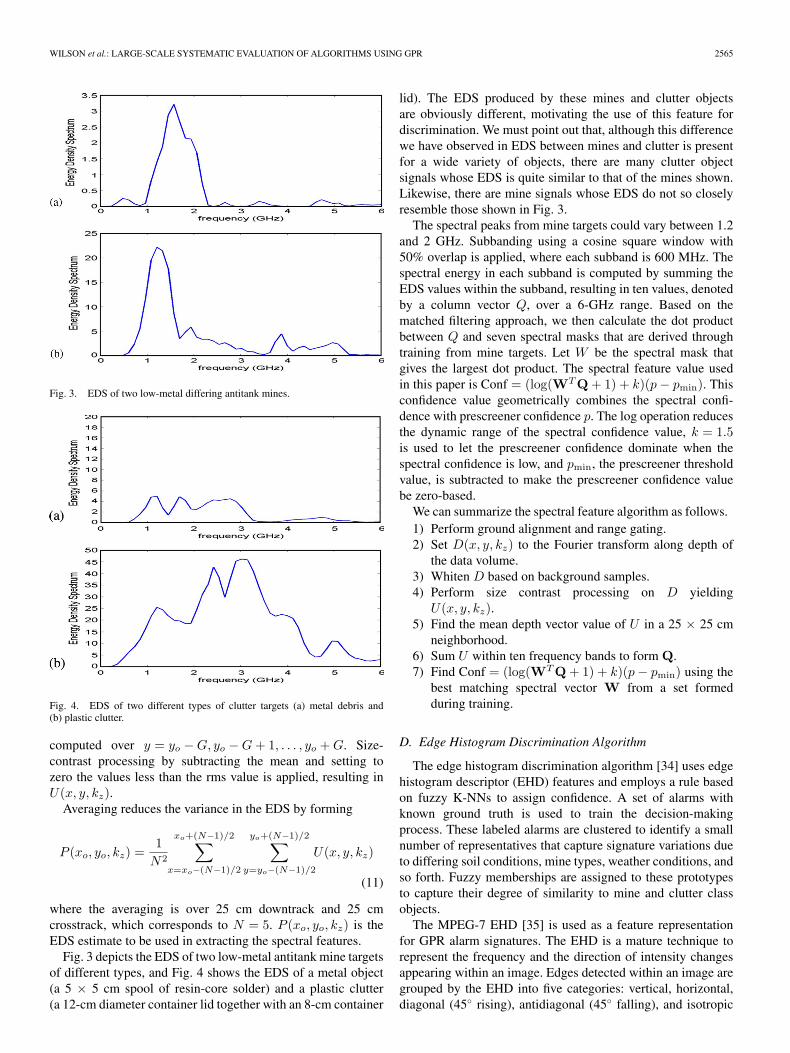
Fig. 3. EDS of two low-metal differing antitank mines.
Fig. 4. EDS of two different types of clutter targets (a) metal debris and(b) plastic clutter.
computed over y = yo −G, yo −G+ 1, . . . , yo +G. Size-contrast processing by subtracting the mean and setting tozero the values less than the rms value is applied, resulting inU(x, y, kz).
Averaging reduces the variance in the EDS by forming
P (xo, yo, kz) =1N2
xo+(N−1)/2∑x=xo−(N−1)/2
yo+(N−1)/2∑y=yo−(N−1)/2
U(x, y, kz)
(11)
where the averaging is over 25 cm downtrack and 25 cmcrosstrack, which corresponds to N = 5. P (xo, yo, kz) is theEDS estimate to be used in extracting the spectral features.
Fig. 3 depicts the EDS of two low-metal antitank mine targetsof different types, and Fig. 4 shows the EDS of a metal object(a 5 × 5 cm spool of resin-core solder) and a plastic clutter(a 12-cm diameter container lid together with an 8-cm container
lid). The EDS produced by these mines and clutter objectsare obviously different, motivating the use of this feature fordiscrimination. We must point out that, although this differencewe have observed in EDS between mines and clutter is presentfor a wide variety of objects, there are many clutter objectsignals whose EDS is quite similar to that of the mines shown.Likewise, there are mine signals whose EDS do not so closelyresemble those shown in Fig. 3.
The spectral peaks from mine targets could vary between 1.2and 2 GHz. Subbanding using a cosine square window with50% overlap is applied, where each subband is 600 MHz. Thespectral energy in each subband is computed by summing theEDS values within the subband, resulting in ten values, denotedby a column vector Q, over a 6-GHz range. Based on thematched filtering approach, we then calculate the dot productbetween Q and seven spectral masks that are derived throughtraining from mine targets. Let W be the spectral mask thatgives the largest dot product. The spectral feature value usedin this paper is Conf = (log(WT Q + 1) + k)(p− pmin). Thisconfidence value geometrically combines the spectral confi-dence with prescreener confidence p. The log operation reducesthe dynamic range of the spectral confidence value, k = 1.5is used to let the prescreener confidence dominate when thespectral confidence is low, and pmin, the prescreener thresholdvalue, is subtracted to make the prescreener confidence valuebe zero-based.
We can summarize the spectral feature algorithm as follows.1) Perform ground alignment and range gating.2) Set D(x, y, kz) to the Fourier transform along depth of
the data volume.3) Whiten D based on background samples.4) Perform size contrast processing on D yieldingU(x, y, kz).
5) Find the mean depth vector value of U in a 25 × 25 cmneighborhood.
6) Sum U within ten frequency bands to form Q.7) Find Conf = (log(WT Q + 1) + k)(p− pmin) using the
best matching spectral vector W from a set formedduring training.
D. Edge Histogram Discrimination Algorithm
The edge histogram discrimination algorithm [34] uses edgehistogram descriptor (EHD) features and employs a rule basedon fuzzy K-NNs to assign confidence. A set of alarms withknown ground truth is used to train the decision-makingprocess. These labeled alarms are clustered to identify a smallnumber of representatives that capture signature variations dueto differing soil conditions, mine types, weather conditions, andso forth. Fuzzy memberships are assigned to these prototypesto capture their degree of similarity to mine and clutter classobjects.
The MPEG-7 EHD [35] is used as a feature representationfor GPR alarm signatures. The EHD is a mature technique torepresent the frequency and the direction of intensity changesappearing within an image. Edges detected within an image aregrouped by the EHD into five categories: vertical, horizontal,diagonal (45◦ rising), antidiagonal (45◦ falling), and isotropic
2566 IEEE TRANSACTIONS ON GEOSCIENCE AND REMOTE SENSING, VOL. 45, NO. 8, AUGUST 2007
(unoriented). The EHD contains five histogram bins countingthe number of locations at which each of these edge characteri-zations dominates the others.
To apply EHD to 3-D GPR data, it is modified to com-pute two distinct types of 2-D edges, namely, those edges inboth downtrack and crosstrack B-scans of the radar data. LetS
(x)z,y denote the xth plane of the 3-D signature S(x, y, z).
For each S(x)z,y , we compute four categories of edge strengths:
vertical, horizontal, diagonal, and antidiagonal. If the edgestrength in a given direction exceeds threshold θG, then thecorresponding pixel is considered to be an edge pixel in thatdirection. Otherwise, it is considered to be an isotropic pixel.We consider images of fixed size at each alarm location (x, y),spanning S(x′)
z,yi for x′ ∈ {x− δ, x+ δ} and divide these sub-
images into four horizontally overlapping subimages S(x′)z,y for
i = {1, . . . , 4}. We compute a five-bin edge histogram Hxzyi
with bins corresponding to the number of occurrences of eachof the assignments of edge to the pixels in subimage S(x′)
z,yi .Finally, we construct the downtrack component of the EHD,EHDd, which is defined to be the concatenation of the sevenfive-bin histograms
EHDd(Sxyz) = [Hzy1Hzy2Hzy3Hzy4Hzy6Hzy6Hzy7 ] (12)
where Hzyi= (1/NC)
∑NC
x=1H(x)zyi .
To compute the crosstrack EHD component EHDx, we com-pute four edge strengths on the S(y)
zx , y = 1, . . . , NS planes.Since there are typically fewer crosstrack samples than down-track samples, we do not divide the crosstrack into subimages.Thus, only one global histogram Hy
zx is computed. Otherwise,EHDx is computed similarly to EHDd
EHDx =1NS
NS∑x=1
H(y)zx . (13)
Finally, the composite EHD feature vector is computed as a40-D histogram that concatenates the downtrack and crosstrackEHD components
EHD(Sxyz) =[EHDx(Sxyz)EHDd(Sxyz)
]. (14)
A set of labeled alarms with known x, y positions is usedas training data. Alarm depths are visually estimated, since theactual depth of a mine or the phenomenon yielding a falsealarm cannot be determined by an automated prescreener. Eachsignature S is a volume cube containing 30 depths, 4 scans, and7 channels centered at Sx,y,z , where z is the estimated alarmdepth. The training data include signatures of mine alarms andsignatures of false alarms not associated with emplaced clutter.
One expects signatures of objects within any given class toexhibit significant variation. Clutter signatures, in particular,may arise from a large number of different types of objects.Mine signatures, as well, may have multiple subclasses corre-sponding to mines of different types and sizes, buried at differ-ent depths, appearing in varying soil and weather conditions,and so forth. Two self-organizing feature maps (one for minesand one for clutter) are used to cluster the alarms. We referto cluster representatives as prototypes and denote the mine
signature prototypes as RMi and the clutter signature proto-
types as RCi .
Each prototype Ri is assigned a fuzzy membership in eachof the class of mines uM (Ri) and the class of clutter uC(Ri).We use minimum distance and the Fuzzy C-Means membershipfunction [36] to label new alarms. In particular, for each Ri,we find the closest mine prototype RM
i and the closet clutterprototype RC
i , and assign a label using
uM (Ri) =1/dist
(Ri, R
Mi
)1/dist
(Ri, RM
i
)+ 1/dist
(Ri, RC
i
) . (15)
Each prescreener alarm is tested at multiple depths by slidingthe 30 × 4 × 7 EHD window along the depth axis with50% overlap. At most, ten signatures are extracted for eachalarm. The EHD is extracted, and a fuzzy K-NN-based ruleis used to assign a confidence value. First, given a test signa-ture ST , we compute its distance to all representative proto-types. We then sort these distances and identify the K nearestneighbors S1
T , . . . , SKT . Letting p represent the prescreener
confidence value, the EHD confidence value is computedas follows:
Conf(ST ) =
pΣKk=1u
M(Sk
T
)× 1
dist(ST ,SkT )
ΣKk=11/dist
(ST , Sk
T
)1/2
. (16)
In summary, one can find the EHD confidence as follows.
1) Calculate edge strengths within the downtrack andcrosstrack B-scans.
2) Form edge histogram features in crosstrack and overlap-ping downtrack subimages.
3) Find theK nearest prototype features.4) Calculate confidence Conf(ST ) from the test signature’s
features and theK nearest prototype features as describedabove.
III. DATASET STATISTICS
The dataset contains data collected between November 2002and July 2006 from four geographically distinct test sites. SitesA, B, and D are temperate climate test facilities with preparedsoil and gravel lanes. Site C is an arid climate test facilitywith prepared soil lanes. The statistics of the data are shownin Table I. Site B has the largest number of collections and thelargest number of alarms. The data collected from Sites B and Dhave emplaced buried clutter. Although the lanes at Sites A, B,and C were prepared in an attempt to eliminate the presence ofminelike objects, they still contain nonemplaced clutter objects.Both metal and nonmetal nonemplaced clutter objects thatyielded high mine confidence values such as ploughshares, shellcasings, and large rocks were excavated from these sites todetermine their nature after the data were collected and theirlocations had been identified. The emplaced clutter objectsinclude steel scraps, bolts, sort-drink cans, concrete blocks,plastic bottles, wood blocks, and rocks. In all, there are 12collections having 19 distinct mine types. Many of these mine
WILSON et al.: LARGE-SCALE SYSTEMATIC EVALUATION OF ALGORITHMS USING GPR 2567
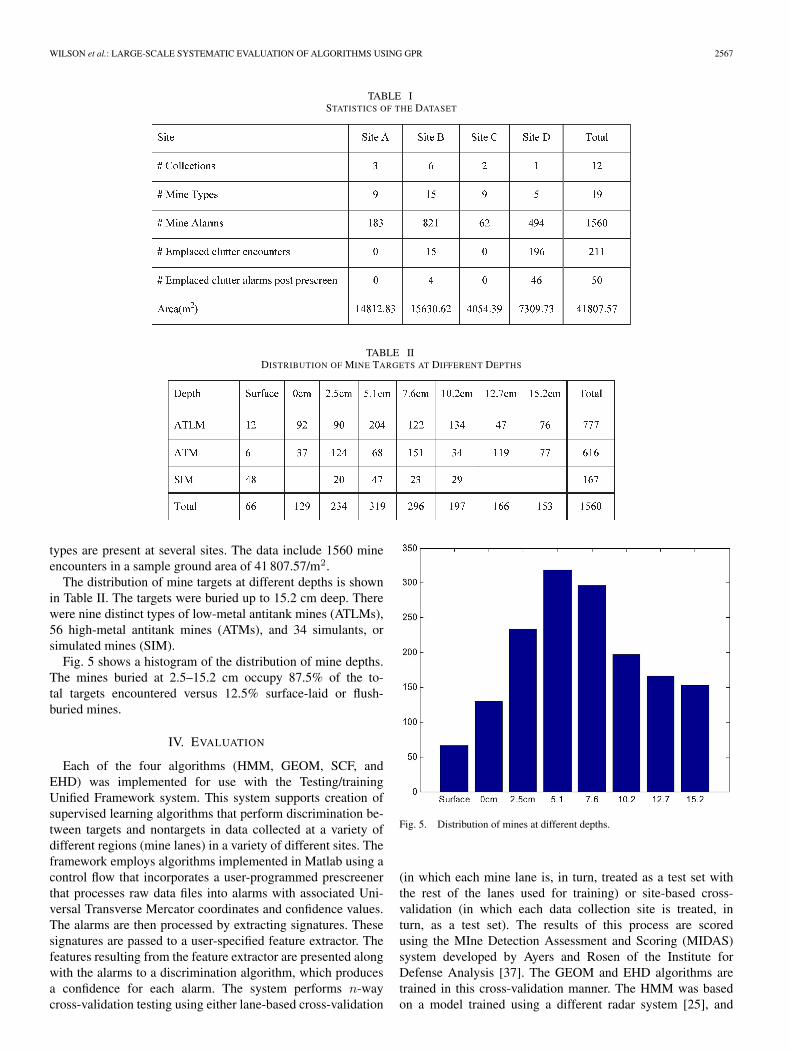
TABLE ISTATISTICS OF THE DATASET
TABLE IIDISTRIBUTION OF MINE TARGETS AT DIFFERENT DEPTHS
types are present at several sites. The data include 1560 mineencounters in a sample ground area of 41 807.57/m2.
The distribution of mine targets at different depths is shownin Table II. The targets were buried up to 15.2 cm deep. Therewere nine distinct types of low-metal antitank mines (ATLMs),56 high-metal antitank mines (ATMs), and 34 simulants, orsimulated mines (SIM).
Fig. 5 shows a histogram of the distribution of mine depths.The mines buried at 2.5–15.2 cm occupy 87.5% of the to-tal targets encountered versus 12.5% surface-laid or flush-buried mines.
IV. EVALUATION
Each of the four algorithms (HMM, GEOM, SCF, andEHD) was implemented for use with the Testing/trainingUnified Framework system. This system supports creation ofsupervised learning algorithms that perform discrimination be-tween targets and nontargets in data collected at a variety ofdifferent regions (mine lanes) in a variety of different sites. Theframework employs algorithms implemented in Matlab using acontrol flow that incorporates a user-programmed prescreenerthat processes raw data files into alarms with associated Uni-versal Transverse Mercator coordinates and confidence values.The alarms are then processed by extracting signatures. Thesesignatures are passed to a user-specified feature extractor. Thefeatures resulting from the feature extractor are presented alongwith the alarms to a discrimination algorithm, which producesa confidence for each alarm. The system performs n-waycross-validation testing using either lane-based cross-validation
Fig. 5. Distribution of mines at different depths.
(in which each mine lane is, in turn, treated as a test set withthe rest of the lanes used for training) or site-based cross-validation (in which each data collection site is treated, inturn, as a test set). The results of this process are scoredusing the MIne Detection Assessment and Scoring (MIDAS)system developed by Ayers and Rosen of the Institute forDefense Analysis [37]. The GEOM and EHD algorithms aretrained in this cross-validation manner. The HMM was basedon a model trained using a different radar system [25], and
2568 IEEE TRANSACTIONS ON GEOSCIENCE AND REMOTE SENSING, VOL. 45, NO. 8, AUGUST 2007
the SCF employs a single static mine model and is nottrained.
Straightforward Matlab implementation of the HMM algo-rithm requires about five times as much processing time peralarm as does EHD. SCF and FOWA run about eight times aslong as the HMM. An efficient C-language implementation ofEHD processes a single alarm in 12 ms. Thus, all the algorithmsare potentially suited to real-time use.
Various authors have attempted to develop criteria in usingROC curves to compare the performance of algorithms [38],[39]. The work of Ling and Zhang [40] shows that givena constrained environment (in which the number of targetsand nontargets is equal) and for a narrowly defined accuracycriterion (best discrimination at median threshold), that maxi-mizing the area under the ROC curve corresponds to increasingaccuracy. Provost et al. [41], however, argue convincingly thataccuracy is not necessarily the best single metric to rank al-gorithm performance, particularly when comparing ROCs. It isoften the case that a single dominating classifier [one producingstatistically lower false alarm rate (FAR) at every probabilityof detection (PD) value] does not exist. Furthermore, in manypractical cases such as humanitarian demining, the best algo-rithm may be the one at which 100% detection is achieved withthe lowest false alarm rate, no matter what other propertiesthe ROC may display. For other time-critical demining appli-cations where some level of missed mines is not consideredas great a cost, the best ROC may be the one at which theprobability of detection is highest at a given constant falsealarm rate.
Our algorithm development efforts have been geared towarddeveloping algorithms suitable for an autonomous vehicle-based mine detection system. In any such system, false alarmswill delay the progress of the system. To achieve a reasonablerate of progress, we have set an initial goal of reporting fewerthan 0.0007 false alarms per square meter at a detection rate of90%. Our long-term goal is to achieve a false alarm rate below0.00007/m2 at a detection rate of 95%. Knowing, however,that any single property of the ROC may be inappropriate inevaluating the algorithms, we have chosen to consider a numberof measurable properties of these ROCs. The metrics chosen foralgorithm evaluation are the following:
1) PD85: FAR at the threshold yielding PD.85;2) PD90: FAR at PD.90 threshold;3) PD95: FAR at PD.95 threshold;4) FAR0: PD at FAR 0 threshold;5) FAR0.007: PD at FAR 0.0007 threshold;6) FAR0.00007: PAD at FAR 0.00007 threshold;7) SEPAR: Separation of the mine and nonmine confidence
distributions, (µ1 − µ2)2/(σ21 − σ2
2), where (µ1, σ1) arethe mean and standard deviation of the mine distribution,and (µ2, σ2) are the mean and standard deviation of thenonmine distribution.
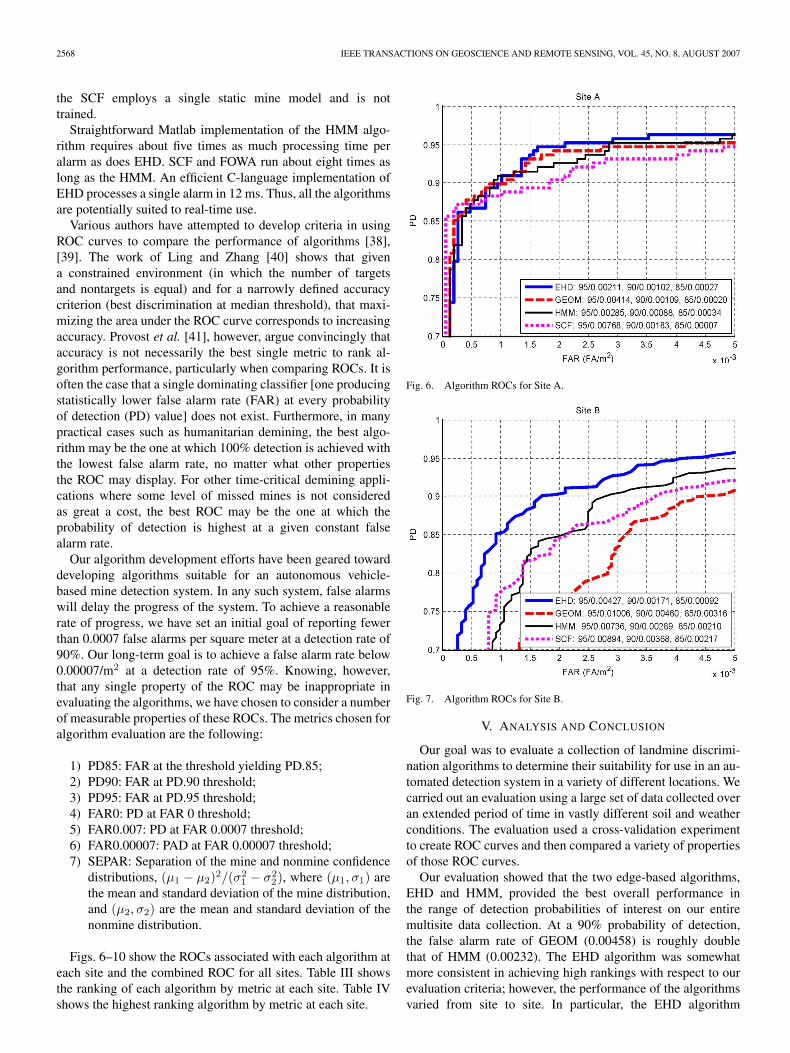
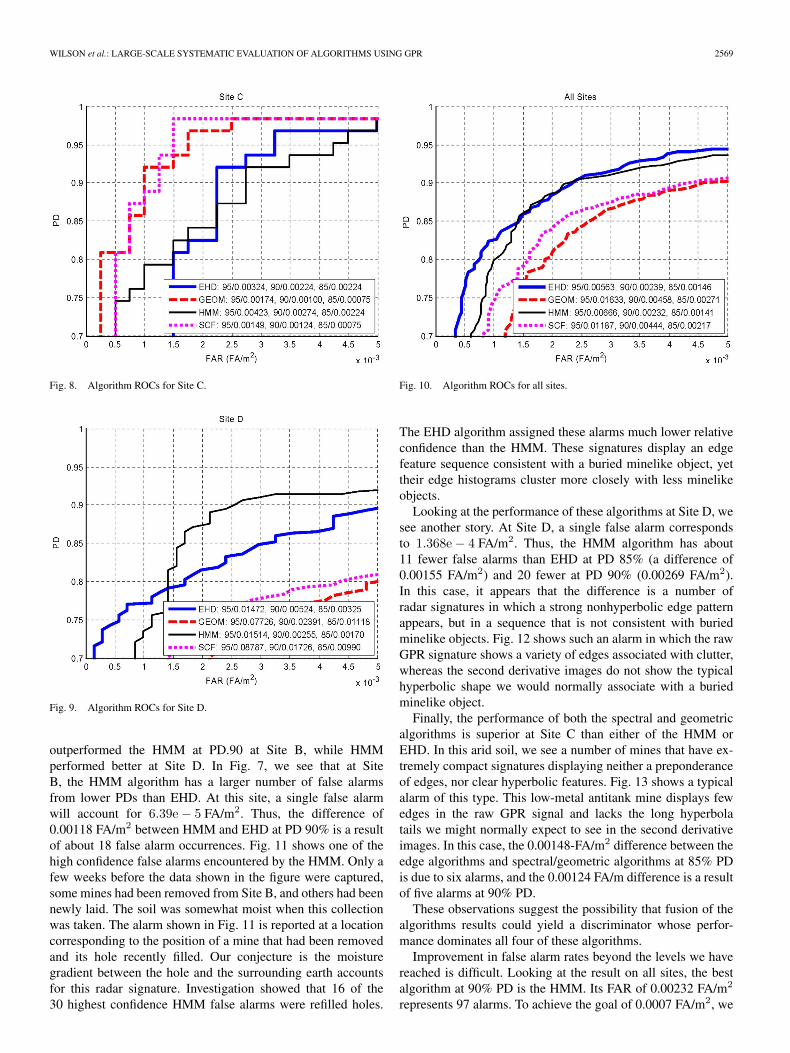
Figs. 6–10 show the ROCs associated with each algorithm ateach site and the combined ROC for all sites. Table III showsthe ranking of each algorithm by metric at each site. Table IVshows the highest ranking algorithm by metric at each site.
Fig. 6. Algorithm ROCs for Site A.
Fig. 7. Algorithm ROCs for Site B.
V. ANALYSIS AND CONCLUSION
Our goal was to evaluate a collection of landmine discrimi-nation algorithms to determine their suitability for use in an au-tomated detection system in a variety of different locations. Wecarried out an evaluation using a large set of data collected overan extended period of time in vastly different soil and weatherconditions. The evaluation used a cross-validation experimentto create ROC curves and then compared a variety of propertiesof those ROC curves.
Our evaluation showed that the two edge-based algorithms,EHD and HMM, provided the best overall performance inthe range of detection probabilities of interest on our entiremultisite data collection. At a 90% probability of detection,the false alarm rate of GEOM (0.00458) is roughly doublethat of HMM (0.00232). The EHD algorithm was somewhatmore consistent in achieving high rankings with respect to ourevaluation criteria; however, the performance of the algorithmsvaried from site to site. In particular, the EHD algorithm
WILSON et al.: LARGE-SCALE SYSTEMATIC EVALUATION OF ALGORITHMS USING GPR 2569
Fig. 8. Algorithm ROCs for Site C.
Fig. 9. Algorithm ROCs for Site D.
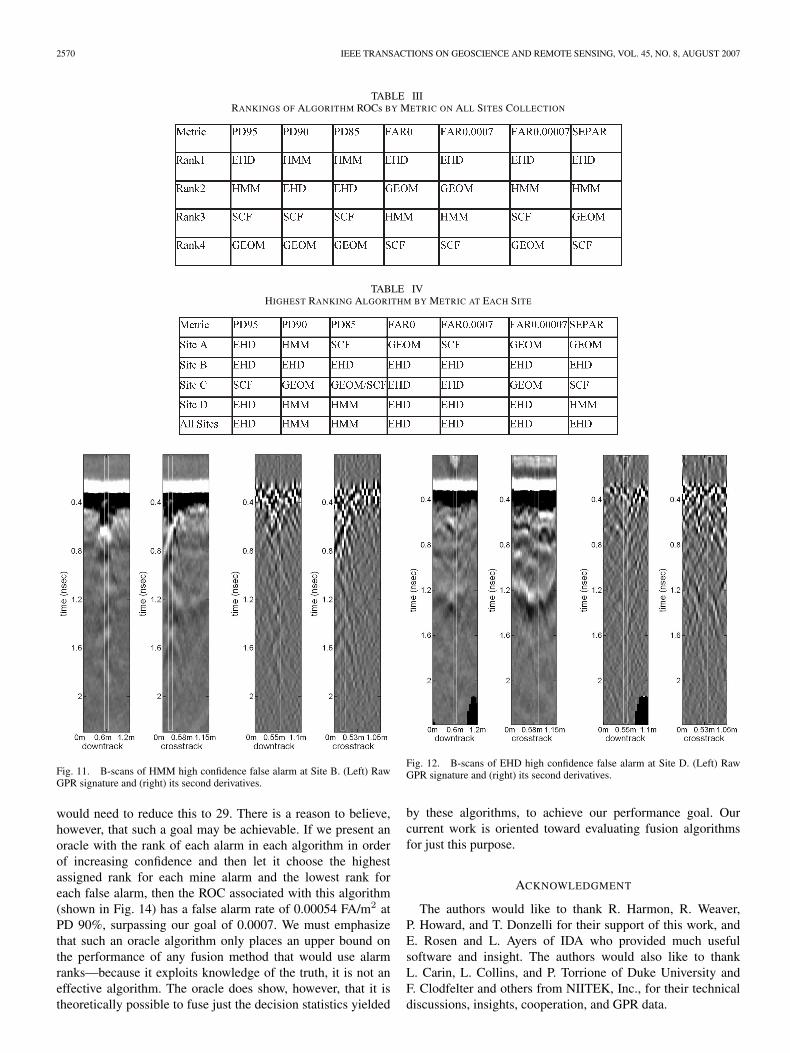
outperformed the HMM at PD.90 at Site B, while HMMperformed better at Site D. In Fig. 7, we see that at SiteB, the HMM algorithm has a larger number of false alarmsfrom lower PDs than EHD. At this site, a single false alarmwill account for 6.39e − 5 FA/m2. Thus, the difference of0.00118 FA/m2 between HMM and EHD at PD 90% is a resultof about 18 false alarm occurrences. Fig. 11 shows one of thehigh confidence false alarms encountered by the HMM. Only afew weeks before the data shown in the figure were captured,some mines had been removed from Site B, and others had beennewly laid. The soil was somewhat moist when this collectionwas taken. The alarm shown in Fig. 11 is reported at a locationcorresponding to the position of a mine that had been removedand its hole recently filled. Our conjecture is the moisturegradient between the hole and the surrounding earth accountsfor this radar signature. Investigation showed that 16 of the30 highest confidence HMM false alarms were refilled holes.
Fig. 10. Algorithm ROCs for all sites.
The EHD algorithm assigned these alarms much lower relativeconfidence than the HMM. These signatures display an edgefeature sequence consistent with a buried minelike object, yettheir edge histograms cluster more closely with less minelikeobjects.
Looking at the performance of these algorithms at Site D, wesee another story. At Site D, a single false alarm correspondsto 1.368e − 4 FA/m2. Thus, the HMM algorithm has about11 fewer false alarms than EHD at PD 85% (a difference of0.00155 FA/m2) and 20 fewer at PD 90% (0.00269 FA/m2).In this case, it appears that the difference is a number ofradar signatures in which a strong nonhyperbolic edge patternappears, but in a sequence that is not consistent with buriedminelike objects. Fig. 12 shows such an alarm in which the rawGPR signature shows a variety of edges associated with clutter,whereas the second derivative images do not show the typicalhyperbolic shape we would normally associate with a buriedminelike object.
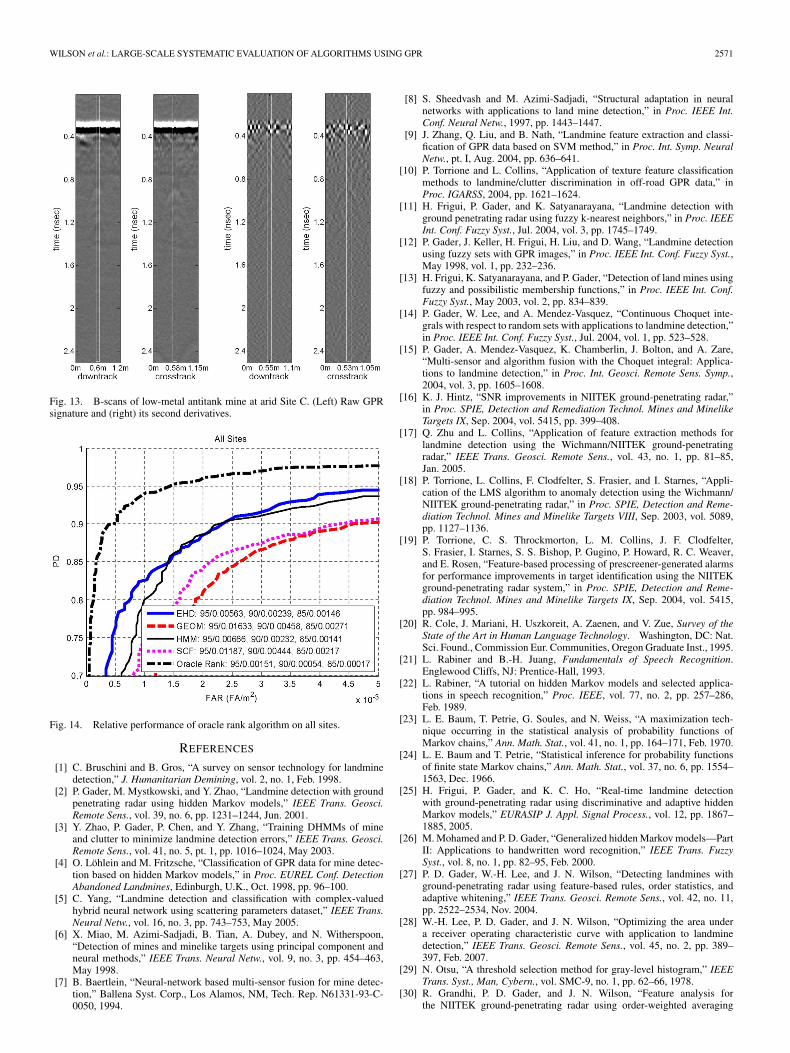
Finally, the performance of both the spectral and geometricalgorithms is superior at Site C than either of the HMM orEHD. In this arid soil, we see a number of mines that have ex-tremely compact signatures displaying neither a preponderanceof edges, nor clear hyperbolic features. Fig. 13 shows a typicalalarm of this type. This low-metal antitank mine displays fewedges in the raw GPR signal and lacks the long hyperbolatails we might normally expect to see in the second derivativeimages. In this case, the 0.00148-FA/m2 difference between theedge algorithms and spectral/geometric algorithms at 85% PDis due to six alarms, and the 0.00124 FA/m difference is a resultof five alarms at 90% PD.
These observations suggest the possibility that fusion of thealgorithms results could yield a discriminator whose perfor-mance dominates all four of these algorithms.
Improvement in false alarm rates beyond the levels we havereached is difficult. Looking at the result on all sites, the bestalgorithm at 90% PD is the HMM. Its FAR of 0.00232 FA/m2
represents 97 alarms. To achieve the goal of 0.0007 FA/m2, we
2570 IEEE TRANSACTIONS ON GEOSCIENCE AND REMOTE SENSING, VOL. 45, NO. 8, AUGUST 2007
TABLE IIIRANKINGS OF ALGORITHM ROCs BY METRIC ON ALL SITES COLLECTION
TABLE IVHIGHEST RANKING ALGORITHM BY METRIC AT EACH SITE
Fig. 11. B-scans of HMM high confidence false alarm at Site B. (Left) RawGPR signature and (right) its second derivatives.
would need to reduce this to 29. There is a reason to believe,however, that such a goal may be achievable. If we present anoracle with the rank of each alarm in each algorithm in orderof increasing confidence and then let it choose the highestassigned rank for each mine alarm and the lowest rank foreach false alarm, then the ROC associated with this algorithm(shown in Fig. 14) has a false alarm rate of 0.00054 FA/m2 atPD 90%, surpassing our goal of 0.0007. We must emphasizethat such an oracle algorithm only places an upper bound onthe performance of any fusion method that would use alarmranks—because it exploits knowledge of the truth, it is not aneffective algorithm. The oracle does show, however, that it istheoretically possible to fuse just the decision statistics yielded
Fig. 12. B-scans of EHD high confidence false alarm at Site D. (Left) RawGPR signature and (right) its second derivatives.
by these algorithms, to achieve our performance goal. Ourcurrent work is oriented toward evaluating fusion algorithmsfor just this purpose.
ACKNOWLEDGMENT
The authors would like to thank R. Harmon, R. Weaver,P. Howard, and T. Donzelli for their support of this work, andE. Rosen and L. Ayers of IDA who provided much usefulsoftware and insight. The authors would also like to thankL. Carin, L. Collins, and P. Torrione of Duke University andF. Clodfelter and others from NIITEK, Inc., for their technicaldiscussions, insights, cooperation, and GPR data.
WILSON et al.: LARGE-SCALE SYSTEMATIC EVALUATION OF ALGORITHMS USING GPR 2571
Fig. 13. B-scans of low-metal antitank mine at arid Site C. (Left) Raw GPRsignature and (right) its second derivatives.
Fig. 14. Relative performance of oracle rank algorithm on all sites.
REFERENCES
[1] C. Bruschini and B. Gros, “A survey on sensor technology for landminedetection,” J. Humanitarian Demining, vol. 2, no. 1, Feb. 1998.
[2] P. Gader, M. Mystkowski, and Y. Zhao, “Landmine detection with groundpenetrating radar using hidden Markov models,” IEEE Trans. Geosci.Remote Sens., vol. 39, no. 6, pp. 1231–1244, Jun. 2001.
[3] Y. Zhao, P. Gader, P. Chen, and Y. Zhang, “Training DHMMs of mineand clutter to minimize landmine detection errors,” IEEE Trans. Geosci.Remote Sens., vol. 41, no. 5, pt. 1, pp. 1016–1024, May 2003.
[4] O. Löhlein and M. Fritzsche, “Classification of GPR data for mine detec-tion based on hidden Markov models,” in Proc. EUREL Conf. DetectionAbandoned Landmines, Edinburgh, U.K., Oct. 1998, pp. 96–100.
[5] C. Yang, “Landmine detection and classification with complex-valuedhybrid neural network using scattering parameters dataset,” IEEE Trans.Neural Netw., vol. 16, no. 3, pp. 743–753, May 2005.
[6] X. Miao, M. Azimi-Sadjadi, B. Tian, A. Dubey, and N. Witherspoon,“Detection of mines and minelike targets using principal component andneural methods,” IEEE Trans. Neural Netw., vol. 9, no. 3, pp. 454–463,May 1998.
[7] B. Baertlein, “Neural-network based multi-sensor fusion for mine detec-tion,” Ballena Syst. Corp., Los Alamos, NM, Tech. Rep. N61331-93-C-0050, 1994.
[8] S. Sheedvash and M. Azimi-Sadjadi, “Structural adaptation in neuralnetworks with applications to land mine detection,” in Proc. IEEE Int.Conf. Neural Netw., 1997, pp. 1443–1447.
[9] J. Zhang, Q. Liu, and B. Nath, “Landmine feature extraction and classi-fication of GPR data based on SVM method,” in Proc. Int. Symp. NeuralNetw., pt. I, Aug. 2004, pp. 636–641.
[10] P. Torrione and L. Collins, “Application of texture feature classificationmethods to landmine/clutter discrimination in off-road GPR data,” inProc. IGARSS, 2004, pp. 1621–1624.
[11] H. Frigui, P. Gader, and K. Satyanarayana, “Landmine detection withground penetrating radar using fuzzy k-nearest neighbors,” in Proc. IEEEInt. Conf. Fuzzy Syst., Jul. 2004, vol. 3, pp. 1745–1749.
[12] P. Gader, J. Keller, H. Frigui, H. Liu, and D. Wang, “Landmine detectionusing fuzzy sets with GPR images,” in Proc. IEEE Int. Conf. Fuzzy Syst.,May 1998, vol. 1, pp. 232–236.
[13] H. Frigui, K. Satyanarayana, and P. Gader, “Detection of land mines usingfuzzy and possibilistic membership functions,” in Proc. IEEE Int. Conf.Fuzzy Syst., May 2003, vol. 2, pp. 834–839.
[14] P. Gader, W. Lee, and A. Mendez-Vasquez, “Continuous Choquet inte-grals with respect to random sets with applications to landmine detection,”in Proc. IEEE Int. Conf. Fuzzy Syst., Jul. 2004, vol. 1, pp. 523–528.
[15] P. Gader, A. Mendez-Vasquez, K. Chamberlin, J. Bolton, and A. Zare,“Multi-sensor and algorithm fusion with the Choquet integral: Applica-tions to landmine detection,” in Proc. Int. Geosci. Remote Sens. Symp.,2004, vol. 3, pp. 1605–1608.
[16] K. J. Hintz, “SNR improvements in NIITEK ground-penetrating radar,”in Proc. SPIE, Detection and Remediation Technol. Mines and MinelikeTargets IX, Sep. 2004, vol. 5415, pp. 399–408.
[17] Q. Zhu and L. Collins, “Application of feature extraction methods forlandmine detection using the Wichmann/NIITEK ground-penetratingradar,” IEEE Trans. Geosci. Remote Sens., vol. 43, no. 1, pp. 81–85,Jan. 2005.
[18] P. Torrione, L. Collins, F. Clodfelter, S. Frasier, and I. Starnes, “Appli-cation of the LMS algorithm to anomaly detection using the Wichmann/NIITEK ground-penetrating radar,” in Proc. SPIE, Detection and Reme-diation Technol. Mines and Minelike Targets VIII, Sep. 2003, vol. 5089,pp. 1127–1136.
[19] P. Torrione, C. S. Throckmorton, L. M. Collins, J. F. Clodfelter,S. Frasier, I. Starnes, S. S. Bishop, P. Gugino, P. Howard, R. C. Weaver,and E. Rosen, “Feature-based processing of prescreener-generated alarmsfor performance improvements in target identification using the NIITEKground-penetrating radar system,” in Proc. SPIE, Detection and Reme-diation Technol. Mines and Minelike Targets IX, Sep. 2004, vol. 5415,pp. 984–995.
[20] R. Cole, J. Mariani, H. Uszkoreit, A. Zaenen, and V. Zue, Survey of theState of the Art in Human Language Technology. Washington, DC: Nat.Sci. Found., Commission Eur. Communities, Oregon Graduate Inst., 1995.
[21] L. Rabiner and B.-H. Juang, Fundamentals of Speech Recognition.Englewood Cliffs, NJ: Prentice-Hall, 1993.
[22] L. Rabiner, “A tutorial on hidden Markov models and selected applica-tions in speech recognition,” Proc. IEEE, vol. 77, no. 2, pp. 257–286,Feb. 1989.
[23] L. E. Baum, T. Petrie, G. Soules, and N. Weiss, “A maximization tech-nique occurring in the statistical analysis of probability functions ofMarkov chains,” Ann. Math. Stat., vol. 41, no. 1, pp. 164–171, Feb. 1970.
[24] L. E. Baum and T. Petrie, “Statistical inference for probability functionsof finite state Markov chains,” Ann. Math. Stat., vol. 37, no. 6, pp. 1554–1563, Dec. 1966.
[25] H. Frigui, P. Gader, and K. C. Ho, “Real-time landmine detectionwith ground-penetrating radar using discriminative and adaptive hiddenMarkov models,” EURASIP J. Appl. Signal Process., vol. 12, pp. 1867–1885, 2005.
[26] M. Mohamed and P. D. Gader, “Generalized hidden Markov models—PartII: Applications to handwritten word recognition,” IEEE Trans. FuzzySyst., vol. 8, no. 1, pp. 82–95, Feb. 2000.
[27] P. D. Gader, W.-H. Lee, and J. N. Wilson, “Detecting landmines withground-penetrating radar using feature-based rules, order statistics, andadaptive whitening,” IEEE Trans. Geosci. Remote Sens., vol. 42, no. 11,pp. 2522–2534, Nov. 2004.
[28] W.-H. Lee, P. D. Gader, and J. N. Wilson, “Optimizing the area undera receiver operating characteristic curve with application to landminedetection,” IEEE Trans. Geosci. Remote Sens., vol. 45, no. 2, pp. 389–397, Feb. 2007.
[29] N. Otsu, “A threshold selection method for gray-level histogram,” IEEETrans. Syst., Man, Cybern., vol. SMC-9, no. 1, pp. 62–66, 1978.
[30] R. Grandhi, P. D. Gader, and J. N. Wilson, “Feature analysis forthe NIITEK ground-penetrating radar using order-weighted averaging
2572 IEEE TRANSACTIONS ON GEOSCIENCE AND REMOTE SENSING, VOL. 45, NO. 8, AUGUST 2007
operators for landmine detection,” in Proc. SPIE, Detection and Reme-diation Technol. Mines and Minelike Targets IX, Sep. 2004, vol. 5415,pp. 953–962.
[31] R. Yager, “On order weighted averaging aggregation operators in multi-criteria decision making,” IEEE Trans. Syst., Man, Cybern., vol. 18, no. 1,pp. 183–190, Jan./Feb. 1988.
[32] J. Fodor, J. Marichal, and M. Roubens, “Characterization of the orderedweighted averaging operators,” IEEE Trans. Fuzzy Syst., vol. 3, no. 2,pp. 236–240, May 1995.
[33] R. Yager and J. Kacprzyk, The Ordered Weighted Averaging Operators,Theory, and Applications. Boston, MA: Kluwer, 1997.
[34] H. Frigui and P. D. Gader, “Detection and discrimination of landmines inground-penetrating radar based on edge histogram descriptors,” in Proc.SPIE, Detection and Remediation Technol. Mines and Minelike Targets X,May 2006, vol. 6217, p. 621 733.
[35] B. S. Manjunath, P. Salembier, and T. Sikora, Introduction to MPEG7:Multimedia Content Descriptions Language. Hoboken, NJ: Wiley,2002.
[36] J. C. Bezdek, Pattern Recognition With Fuzzy Objective Function Algo-rithms. Norwell, MA: Kluwer, 1981.
[37] L. Ayers and E. Rosen, “MIDAS: Mine detection assessment and scoringuser’s manual V1.1,” Inst. Defense Anal., Arlington, VA, Tech. Rep.,2004
[38] F. Provost and T. Fawcett, “Analysis and visualization of classi-fier performance: Comparison under imprecise class and cost distri-butions,” in Proc. 3rd Int. Conf. Knowl. Discovery and DataMining, 1997,pp. 43–48.
[39] A. P. Bradley, “The use of the area under the ROC curve in the evalua-tion of machine learning algorithms,” Pattern Recognit., vol. 30, no. 7,pp. 1145–1159, 1997.
[40] C. X. Ling, J. Huang, and H. Zhang, “AUC: A statistically consistent andmore discriminating measure than accuracy,” in Proc. 18th IJCAI, 2003,pp. 329–341.
[41] F. Provost, T. Fawcett, and R. Kohavi, “The case against accuracy estima-tion for comparing induction algorithms,” in Proc. 15th Int. Conf. Mach.Learn., San Francisco, CA, 1998, pp. 445–453.
Joseph N. Wilson (M’05) received the B.S. de-gree in applied mathematics with the emphasis oncomputer science from Florida State University,Tallahassee, in 1977, and the M.S. degree in ap-plied mathematics and computer science and thePh.D. degree in computer science from the Univer-sity of Virginia, Charlottesville, in 1980 and 1985,respectively.
Since 1984, he has been a member of the fac-ulty of the Computer and Information Scienceand Engineering Department, University of Florida,
Gainesville, where he served as an Associate Chair from 1994 to 2001. Hisresearch interests include machine intelligence, image and signal processing,programming languages, and file systems.
Paul Gader (M’87–SM’99) received the Ph.D. de-gree in mathematics from the University of Florida,Gainesville, in 1986.
He worked as a Senior Research Scientist withHoneywell’s Systems and Research Center, as aResearch Engineer and Manager with the Environ-mental Research Institute of Michigan, and as afaculty member with the Universities of Wisconsin-Oshkosh, Missouri-Columbia, and Florida, where heis currently a Professor of computer and informationscience and engineering. He has led teams involved
in real-time handwritten address recognition systems for the U.S. Postal Servicedeveloping algorithms for handwritten digit recognition and segmentation,numeric field recognition, word recognition, and line segmentation and teamsthat devised and field-tested several real-time mine detection algorithms. He hasworked on landmine detection problems involving ground-penetrating radar,electromagnetic induction, acoustic/seismic, EO/IR, and hyperspectral imagingsensors. He has over 165 technical publications in the areas of image and signalprocessing, applied mathematics, and pattern recognition, including over 55refereed journal articles.
Wen-Hsiung Lee received the B.S. degree in elec-tronics engineering from the National Chiao-TungUniversity, Hsinchu, Taiwan, R.O.C., in 1990, andthe Master and Ph.D. degrees from the University ofFlorida, Gainesville, in 1994 and 2001, respectively.
From 2002 to 2006, he was a Postdoctoral Re-searcher with the Department of Computer and Infor-mation and Engineering, University of Florida. SinceAugust 2006, he has been a Senior Scientist withNIITEK, Inc., Sterling, VA.
Hichem Frigui received the Ph.D. degree in com-puter engineering and computer science from theUniversity of Missouri, Columbia, in 1997.
From 1998 to 2004, he was an Assistant Professorat the University of Memphis, TN. He is currently anAssociate Professor and the Director of the Multime-dia Research Laboratory, University of Louisville,Louisville, KY. He is currently an Associate Editorof Fuzzy Sets and Systems. He has published over 80journal articles and refereed conference proceedings.His research interests include pattern recognition,
data mining, and image processing, with applications to landmine detectionand content-based multimedia retrieval.
Dr. Frigui is a member of the IEEE Computer Society and ACM. Heis currently an Associate Editor of the IEEE TRANSACTIONS ON FUZZY
SYSTEMS. He is a recipient of the U.S. National Science Foundation FacultyEarly Career Development Award for outstanding young scientists.
K. C. Ho (S’89–M’91–SM’00) was born inHong Kong. He received the B.Sc. (with First-ClassHonors) degree in electronics and the Ph.D. de-gree in electronic engineering in 1988 and 1991,respectively.
From 1991 to 1994, he was a Research Associateat the Royal Military College of Canada, Kingston,ON, Canada. He joined the Bell-Northern Research,Montreal, QC, Canada, in 1995 as a member of Sci-entific Staff. From September 1996 to August 1997,he was a member of the faculty of the Department of
Electrical Engineering, University of Saskatchewan, Saskatoon, SK, Canada.Since September 1997, he has been with the University of Missouri, Columbia,where he is currently an Associate Professor with the Electrical and ComputerEngineering Department. He is also an Adjunct Associate Professor with theRoyal Military College of Canada. Since 1995, he has been active in thedevelopment of the International Telecommunication Union (ITU) StandardRecommendation G.168. He is the Editor of the ITU Standard Recommenda-tions G.168: Digital Network Echo Cancellers and G.160: Voice EnhancementDevice for Mobile Applications. He is the holder or coholder of three U.S.patents, three Canadian patents, two patents in Europe, and four patents in Asiaon mobile communications and signal processing. His research interests arestatistical signal processing, source localization, subsurface object detection,wavelet transform, wireless communications, and the development of efficientadaptive signal processing algorithms for various applications, including land-mine detection, echo cancellation, and time delay estimation.
Dr. Ho was an Associate Editor of the IEEE TRANSACTIONS ON SIGNAL
PROCESSING from 2003 to 2006 and is currently an Associate Editor ofthe IEEE SIGNAL PROCESSING LETTERS. He received the Junior FacultyResearch Award from the College of Engineering, University of Missouri,in 2003.