Embed Size (px)
Citation preview
arX
iv:0
807.
1125
v3 [
hep-
ex]
16
Jul 2
008
A Precision Measurement of the Muon Decay Parameters ρ and δ
R.P. MacDonald,1 R. Bayes,7, ∗ J. Bueno,2 Yu.I. Davydov,7, † P. Depommier,4 W. Faszer,7 M.C. Fujiwara,7
C.A. Gagliardi,6 A. Gaponenko,1, ‡ D.R. Gill,7 A. Grossheim,7 P. Gumplinger,7 M.D. Hasinoff,2 R.S. Henderson,7
A. Hillairet,7, ∗ J. Hu,7 B. Jamieson,2 P. Kitching,7 D.D. Koetke,8 G.M. Marshall,7 E.L. Mathie,5 R.E. Mischke,7
J.R. Musser,6, § M. Nozar,7 K. Olchanski,7 A. Olin,7, ∗ R. Openshaw,7 J.-M. Poutissou,7 R. Poutissou,7
M.A. Quraan,1, ¶ V. Selivanov,3 G. Sheffer,7 B. Shin,7, ∗∗ T.D.S. Stanislaus,8 R. Tacik,5 and R.E. Tribble6
(TWIST Collaboration)1University of Alberta, Edmonton, AB, T6G 2J1, Canada
2University of British Columbia, Vancouver, BC, V6T 1Z1, Canada3Kurchatov Institute, Moscow, 123182, Russia
4University of Montreal, Montreal, QC, H3C 3J7, Canada5University of Regina, Regina, SK, S4S 0A2, Canada
6Texas A&M University, College Station, TX 77843, U.S.A.7TRIUMF, Vancouver, BC, V6T 2A3, Canada
8Valparaiso University, Valparaiso, IN 46383, U.S.A.
(Dated: July 16, 2008)
The TWIST collaboration has performed new measurements of two of the parameters that describemuon decay: ρ, which governs the shape of the overall momentum spectrum, and δ, which governsthe momentum dependence of the parity-violating decay asymmetry. This analysis gives the resultsρ = 0.75014± 0.00017(stat)± 0.00044(syst)± 0.00011(η), where the last uncertainty arises from thecorrelation between ρ and the decay parameter η, and δ = 0.75067 ± 0.00030(stat) ± 0.00067(syst).These are consistent with the value of 3/4 given for both parameters in the Standard Model ofparticle physics, and are a factor of two more precise than the measurements previously publishedby TWIST. A new global analysis of all available muon decay data incorporating these results ispresented. Improved lower and upper limits on the decay parameter P π
µ ξ of 0.99524 < P πµ ξ ≤
ξ < 1.00091 at 90% confidence are determined, where P πµ is the polarization of the muon when
it is created during pion decay, and ξ governs the muon decay asymmetry. These results set newmodel-independent constraints on the possible weak interactions of right-handed particles. Specificimplications for left-right symmetric models are discussed.
PACS numbers: 13.35.Bv, 14.60.Ef, 12.60.Cn
I. INTRODUCTION
In the Standard Model (SM) of particle physics,the charged-current weak interaction violates paritymaximally—only left-handed particles (or right-handedantiparticles) are affected. The TWIST experiment isa high-precision search for contributions from non-SMforms of the charged-current weak interaction, includingparity-conserving currents.
The decay of the positive muon into a positron and twoneutrinos, µ+ → e+νeν̄µ, is a purely leptonic process,making it an excellent system for high-precision studiesof the weak interaction. It proceeds through the chargedweak current—mediated by the W boson—and can bedescribed to a good approximation as a four-fermionpoint interaction. The matrix element for the most gen-eral Lorentz-invariant, local, four-fermion description of
∗Affiliated with: Univ. of Victoria, Victoria, BC.†Present address: JINR, Dubna, Russia‡Present address: LBNL, Berkeley, CA.§Present address: Arkansas Tech University, Russellville, AR.¶Present address: VSM Medtech Ltd., Coquitlam, BC.∗∗Affiliated with: Univ. of Saskatchewan, Saskatoon, SK.
muon decay can then be written as
M =4GF√
2
∑
γ=S,V,Tǫ,µ=L,R
gγǫµ
⟨
ψ̄eǫ
∣
∣Γγ∣
∣ψνe
⟩⟨
ψ̄νµ
∣
∣Γγ
∣
∣ψµµ
⟩
, (1)
where the gγǫµ specify the scalar, vector, and ten-
sor couplings between µ-handed muons and ǫ-handedpositrons [1], and satisfy certain normalizations and con-straints. In the Standard Model, gV
LL = 1 and allother coupling constants are zero. The probability Qǫµ
(ǫ, µ = L,R) for the decay of a µ-handed muon into anǫ-handed positron is given by
Qǫµ =1
4
∣
∣gSǫµ
∣
∣
2+
∣
∣gVǫµ
∣
∣
2+ 3(1 − δǫµ)
∣
∣gTǫµ
∣
∣
2, (2)
where δǫµ = 1 for ǫ = µ and δǫµ = 0 for ǫ 6= µ. Theprobability:
QµR =
1
4
∣
∣gSLR
∣
∣
2+
1
4
∣
∣gSRR
∣
∣
2+
∣
∣gVLR
∣
∣
2+
∣
∣gVRR
∣
∣
2+ 3
∣
∣gTLR
∣
∣
2
(3)
sets a model independent limit on any muon right-handedcouplings [1, 2].
2
The differential muon decay spectrum [3, 4, 5] can bedescribed following the notation of Fetscher and Ger-ber [6] as
d2Γ
dx d(cos θs)=mµ
4π3E4
maxG2F
√
x2 − x20
× (FIS(x) + Pµξ cos θsFAS(x))
(4)
where GF is the Fermi coupling constant, θs is the an-gle between the muon spin and the positron momentum,Emax ≈ 52.8 MeV is the kinematic maximum positronenergy, x = Ee/Emax is the positron’s reduced energy,x0 = me/Emax is the minimum possible value of x, cor-responding to a positron at rest, and Pµ is the degreeof muon polarization at the time of decay. Pµ can beused to determine P π
µ , the degree of muon polarizationat its creation from pion decay, when the amount of de-polarization undergone by the muon is known. The twocomponents of the decay spectrum in Eqn. (4) are theisotropic component:
FIS(x) = x(1 − x) + ρ2
9(4x2 − 3x− x2
0)
+ η x0(1 − x) + R.C.(5)
and the anisotropic component:
FAS(x) =1
3
√
x2 − x20
{
1 − x
+2
3δ
[
4x− 3 +
(
√
1 − x20 − 1
)]}
+ R.C.
(6)
R.C. represents the electromagnetic radiative corrections,which have been calculated to O(α2). Corrections due tothe strong interaction in loops give a fractional contri-bution on the order of 4 × 10⁻⁷ [7], which is more thantwo orders of magnitude smaller than the ultimate pre-cision goals of TWIST. The quantities ρ, δ, η, and ξ,often called the Michel parameters, are bilinear combi-nations of the weak coupling constants and describe theshape of the decay spectrum. These decay parameterscan be used in combination with other muon decay mea-surements, such as inverse muon decay (e−νµ → µ−νe)and the polarization of the decay positron, to determinelimits on the weak coupling constants.
Left-Right Symmetric (LRS) models [8] comprise aninteresting class of extensions to the SM. These mod-els include a right-handed weak coupling, which is sup-pressed by the mass of the associated gauge boson. LRSmodels contain four charged gauge bosons (W±
1 , W±2 )
with masses m1 and m2, and two additional massive neu-tral gauge bosons. The mass eigenstates W1 and W2 arerelated to the weak eigenstates WL and WR through amixing angle ζ. gL and gR are the coupling strengthsof the LRS weak interaction to left- and right-handedparticles. LRS models affect the muon decay spectrum,
including a modification to the decay parameter ρ:
ρ ≃ 3
4
[
1 − 2
(
gR
gL
ζ
)2]
, (7)
therefore requiring ρ ≤ 0.75. To a good approximation,the value of δ is unaffected by LRS models.
Many other proposed SM extensions also lead to mod-ifications of the Michel parameters. For example, super-symmetric models can lead to a non-zero value for gS
RR
[9]. The values of ξ and δ can be combined to providea model-independent limit on right-handed couplings inmuon decay:
QµR =
1
2
[
1 +1
3ξ − 16
9ξδ
]
. (8)
Previous measurements by TWIST had set new lim-its, of ρ = 0.75080 ± 0.00032(stat.) ± 0.00097(syst.) ±0.00023(η) [10] and δ = 0.74964 ± 0.00066(stat.) ±0.00112(syst.) [11]. This paper presents new resultsfrom a refined analysis of newer data, providing detailsabout the TWIST experiment and analysis (Sects. IIand IV) including improvements over the previous stud-ies (Sect. V), discusses the validation of the Monte Carlosimulations (Sect. VI), describes the current state of thesystematic uncertainties in the experiment (Sect. VII),and presents new measurements of ρ and δ (Sect. VIII).These new results are then incorporated into a globalanalysis of all muon decay data (Sect. IX).
II. EXPERIMENTAL PROCEDURES
A. Experimental Setup
Highly polarized muons resulted from the decay of pi-ons stopping at the surface of a carbon production targetbombarded by 500 MeV protons at TRIUMF. The M13beamline [12] selected positive muons with a momentumof 29.6 MeV/c, with a momentum bite of ∆p/p ≈ 1%FWHM, and delivered these in vacuum to the TWISTspectrometer [13] at a typical rate of 2.5×10³ per sec-ond. The beam had a contamination of positrons, at thesame momentum, with a typical rate of 22 kHz, as wellas a small fraction of pions.
The muon beam was characterized and tuned using alow pressure (8 kPa dimethylether (DME) gas) remov-able beam monitoring chamber located upstream of theTWIST spectrometer [14]. The beam monitor was in-serted for measurement of the beam properties, and re-moved during data-taking.
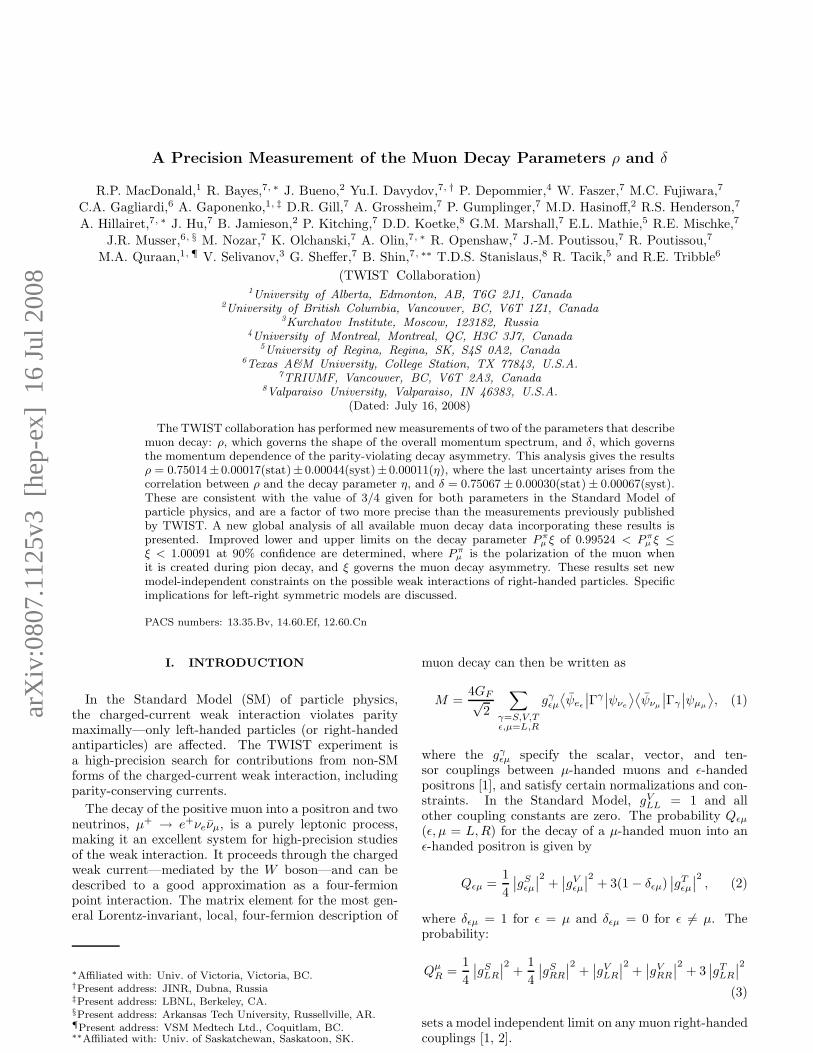
The TWIST spectrometer [13] was designed to mea-sure a broad range of the muon decay spectrum, allowingthe simultaneous determination of the decay parameters.The detector consisted of 44 drift chambers (DCs) and12 multiwire proportional chambers (PCs) in a planargeometry, symmetric about a muon stopping target foil
3
at the centre. Figure 1 shows the upstream half of thedetector and the four PCs surrounding the stopping tar-get. The chambers were placed in a highly uniform 2 Tsolenoidal magnetic field. The z axis was defined to bethe detector axis.
FIG. 1: (Color online.) Side view of the upstream half ofthe TWIST spectrometer planar chambers and support struc-tures. Muons stopped in the target foil, which also served asa chamber cathode. The use of precision spacers and tensioncontrol ensured that the chamber wire positions were knownto 30 µm in z. The spectrometer is symmetric about thetarget foil.
To reduce scattering and to allow the muons to reachthe central target foil, the detector was designed to bevery thin; there was approximately 140 mg/cm2 of ma-terial from the vacuum of the M13 beamline through tothe centre of the stopping target.
The muon stopping target was a 71 ± 1 µm foil of99.999% pure aluminum, which also served as a cathodefoil for the adjacent two PCs (see below). The muonstopping distribution, as determined from the last DCor PC plane in which the muon left a signal, was usedin a feedback loop to control the fractions of He andCO2 in a gas degrader at the end of the beamline, inorder to maintain the average stopping position of theselected muons at the centre of the target. Muons wererequired to be recorded by the PC immediately before thestopping target (PC 6) and not by the PC immediatelyafter the target (PC 7); simulations showed that 97.0 ±1.5% of selected muons stopped in the target, with therest stopping in the CF4/isobutane, the cathode foils, orthe wires in the vicinity of the target. The experimentwatched for muons decaying at rest into positrons; decaysof muons in flight were identified and discarded.
Each PC and DC consisted of a wire plane and twocathode foil planes, all oriented perpendicular to the de-tector axis. Chambers were grouped together in modules
as described below, and the cathode foils interior to eachmodule were shared between adjacent chambers. Eachwire plane was in either U or V orientation, and thesewere at right angles to each other and 45◦ to the vertical.
Four PCs were located at each end of the detector,and two on either side of the stopping target. Each PCincluded 160 sense wires at 2 mm pitch. A fast drift gas(CF4/isobutane) was used in these chambers. The PCsmainly provided particle timing information; in additionthe widths of the timing signals from the PCs were usedto discriminate muons from positrons.
Each half of the detector included 22 DCs, with a slowdrift gas (DME), which had a small Lorentz angle; theseprovided precise measurements of the e+ position as itcrossed the chamber. Each DC plane [15] included 80sense wires at 4 mm pitch. The DC planes were veryslightly asymmetric in the direction along the detectoraxis, in that the wires were located 150 µm off of thecentre of the cell. 28 of the DCs were paired together in14 modules, with U and V wire planes in each pair. Ad-ditional “dense” stacks of eight planes each were locatednear either end of the detector.
The space between the chambers was filled with a3% N2 and 97% He gas, minimizing the material thick-ness of the detector. The chamber gas and the heliummixture were maintained at atmospheric pressure. Thedifferential pressure between the chambers and the sur-rounding volumes was controlled to stabilize the positionsof the chamber foils.
Chamber alignments perpendicular to the detector axiswere measured using 120 MeV/c pion tracks with themagnetic field off. Alignment measurements were takenat the beginning and end of the data-taking period.These data were also used to measure wire time offsetsintroduced by the electronics and cabling. The planepositions and rotations about the beam direction weredetermined to an accuracy of 10 µm and 0.4 mrad. Rel-ative wire positions were known to 3 µm. The alignmentof the chambers to the magnetic field was measured usingpositron tracks in the 2 T field, and had an uncertaintyof 0.03 mrad.
The chambers were positioned within the 1 m boreof a liquid-helium-cooled superconducting solenoid. Themagnet was placed inside a cube-shaped steel yoke, ap-proximately 3 m per side, designed to increase the unifor-mity of the field within the detector region. The shapeof the z component of the magnetic field was mappedusing an array of Hall probes mounted on a radial arm,aligned along the solenoid axis and calibrated using anNMR probe. The probes’ positions at each field samplewere known to ±1 mm, and the field was mapped to aprecision of ±1×10⁻⁴ T. The standard operating settingfor TWIST is 2 T at the centre of the solenoid; at thissetting the field is uniform to within 8×10⁻³ T within thetracking region. A finite-element simulation of the mag-netic field was performed using Opera3d [16], provid-ing the full three-dimensional magnetic field throughoutthe detector volume and well outside the measured re-
4
gion. Within the tracking region the simulated field mapagreed with the measurements to within ±2 × 10⁻⁴ T.
Event acquisition was triggered by a thin scintilla-tor upstream of the spectrometer. Only 1.8% of eventswere triggered by a beam positron, in spite of the muchhigher rate of beam positrons compared to muons; mostbeam positrons were discriminated against by the trig-ger threshold. Remaining beam positrons were identifiedwith high efficiency in the data since they left signals inthe full length of the detector.
Preamplifier chips were mounted directly on the cham-bers and drove custom postamplifier and discriminatormodules placed 2 m away. The chamber behavior wasexceptionally stable, with less than one high voltage tripper month. All output channels were functional.
Data acquisition from scintillators and tracking cham-bers [17] was performed using LeCroy Model 1877 TDCs.The trigger and TDC read-out recorded signals in 0.5 nstime bins from 6 µs before to 10 µs after a muon passedthrough the trigger scintillator. The start and stop ofeach pulse was recorded so that the pulse width could bedetermined; these widths can be related to the amountof energy deposited in the cell. In this configuration upto eight wire signals could be recorded for each wire inany triggered event. A fixed blanking time of 80 µs wasimposed after each accepted trigger, to allow each TDCto finish conversion before the next event was recorded.
The data considered for this analysis were more than1.5×109 muon decays, taken during 2004. The data sets,summarized in Table I, were taken under a variety of con-ditions (low polarization from beam steering, rate, muonstopping position, etc.). Provided the simulation repro-duced these conditions correctly, the decay parametersextracted from the data should be independent of therun conditions.
TABLE I: Description of data sets, in chronological order.
Description Events Accepted
(×106) (×106)
Low Polarization, Centred 209 8
Low Polarization, PC5 Stops 94 2
Centred Stops 287 11
3/4 Stops A 323 12
High Rate 198 7
Aperture 263 9
3/4 Stops B 157 6
Total 1531 55
III. SIMULATION
The decay parameters were extracted from the data bycomparing the data to a simulated spectrum, as discussedin Sect. IVD. Monte Carlo (MC) simulations were run tomatch the conditions of each of the seven main data sets,
in addition to simulations run for studying systematic un-certainties. Each simulation included 2–3 times as manymuon decays as the corresponding data set. The simu-lations were implemented using Geant 3.21. The outputwas in exactly the same format as the files produced bythe data acquisition system, and were processed in thesame way as real data. Space-time relationships (STR)determined with garfield [18] were used to model driftchamber response.
The theoretical decay spectrum included full radia-tive corrections at O(α) [19], as well as O(α2L2) andO(α2L) [20, 21], where L = log(m2
µ/m2e) ≈ 10.66.
O(α2L0) terms have also been calculated [22]; the ef-fect of neglecting these last terms has been evaluated andshown to be negligible (see Sect. VII F). All radiative cor-rections are calculated within the Standard Model. Thevalues of the muon decay parameters assumed by thesimulation in its theoretical decay spectrum were kepthidden until the end of the study; see Sect. IVD belowfor details.
The simulation included all known depolarization ef-fects, including interactions with the magnetic field asthe muon enters the solenoid and depolarization in thestopping target.
IV. DATA ANALYSIS
The full analysis procedure was applied in the sameway to both data and simulation. To the level that thesimulation accurately represented the data, this canceledspectrum distortions due to detector response, positronenergy loss and scattering, reconstruction biases, andother effects, which would otherwise lead to systematicerrors in the measurement.
Due to the large amount of simulation and analysisrequired, the Western Canada Research Grid (WestGrid)was used. TWIST used approximately 10,000 CPU-daysfor this simulation and analysis.
A. Event Reconstruction
To reconstruct an event, the hits—signal times on in-dividual wires—were first grouped based on timing infor-mation from the PCs. Tracks within these groups werethen identified using the distribution of DC hits in spaceand time, as well as the hit widths. DC hits associatedwith decay positrons were then used to reconstruct theenergy and angle of each positron.
Pattern recognition was performed on the decaypositrons using the spatial hit distributions, to determinean initial estimate of the positron track. The track fit pa-rameters were the position and momentum three-vectorsat the DC closest to the target; the main parameters ofinterest were the positron’s total momentum p, and theangle θ between the positron momentum vector and the
5
detector axis. Multiple overlapping tracks could be dis-tinguished at this stage. The initial track estimate wasthen refined in a χ2 fit using the hits’ drift times, in com-bination with maps of the STRs of the drift chamber cellas provided by the garfield chamber simulation soft-ware [18]. The positron track was assumed to deviatefrom a helix by continuous energy loss through the gasvolumes and discrete energy loss through each foil en-countered, using mean energy loss formulas [6]. Trackswere allowed discrete deflections at each DC module andin the dense stacks. The deflection angles were fit pa-rameters, with associated penalties to the fit χ2, basedon the method described by Lutz [23].
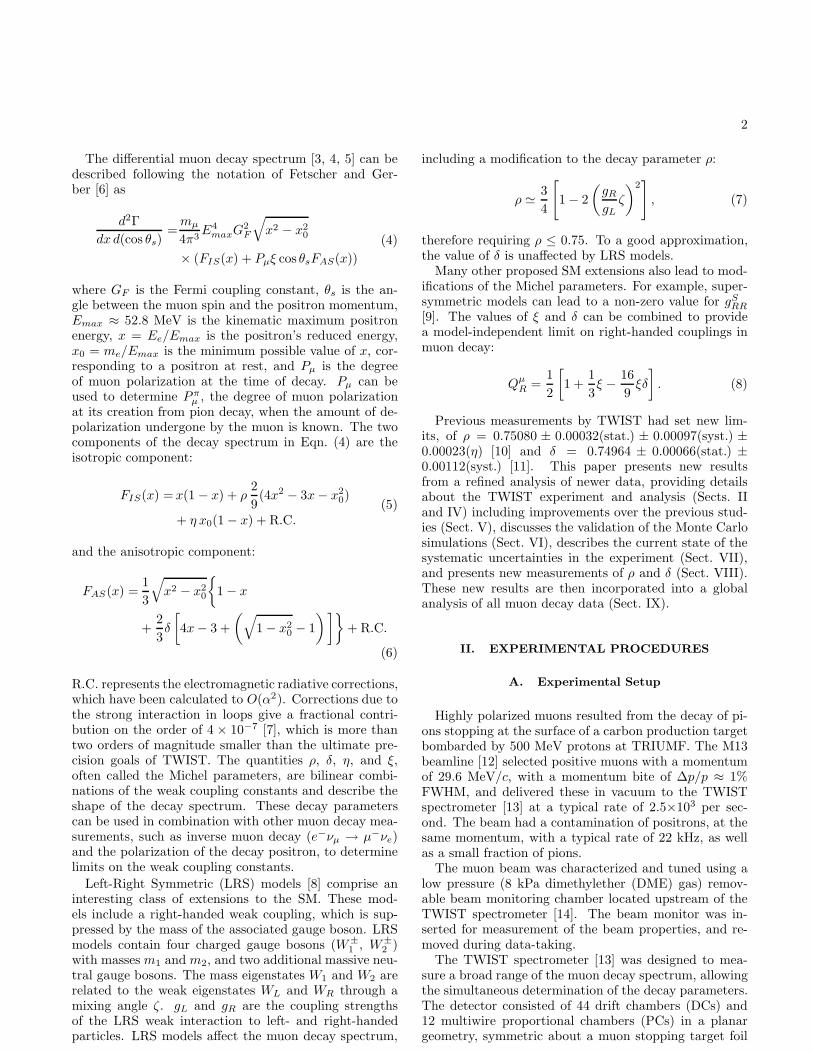
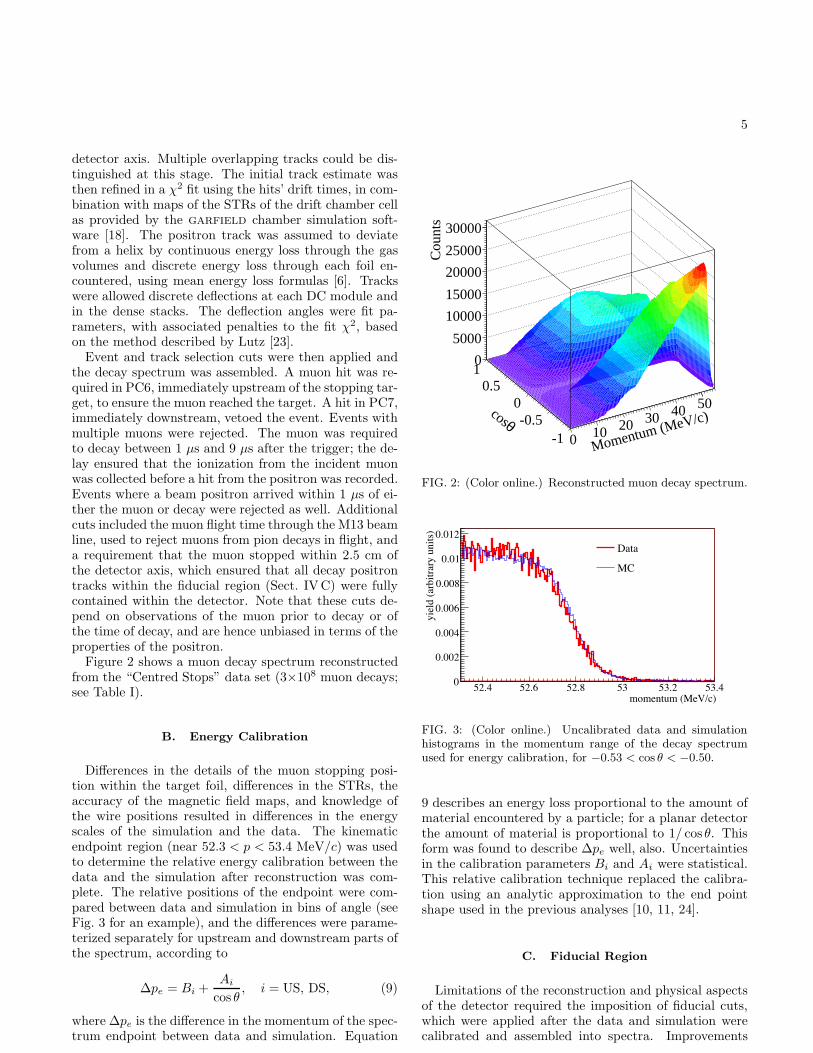
Event and track selection cuts were then applied andthe decay spectrum was assembled. A muon hit was re-quired in PC6, immediately upstream of the stopping tar-get, to ensure the muon reached the target. A hit in PC7,immediately downstream, vetoed the event. Events withmultiple muons were rejected. The muon was requiredto decay between 1 µs and 9 µs after the trigger; the de-lay ensured that the ionization from the incident muonwas collected before a hit from the positron was recorded.Events where a beam positron arrived within 1 µs of ei-ther the muon or decay were rejected as well. Additionalcuts included the muon flight time through the M13 beamline, used to reject muons from pion decays in flight, anda requirement that the muon stopped within 2.5 cm ofthe detector axis, which ensured that all decay positrontracks within the fiducial region (Sect. IVC) were fullycontained within the detector. Note that these cuts de-pend on observations of the muon prior to decay or ofthe time of decay, and are hence unbiased in terms of theproperties of the positron.
Figure 2 shows a muon decay spectrum reconstructedfrom the “Centred Stops” data set (3×10⁸ muon decays;see Table I).
B. Energy Calibration
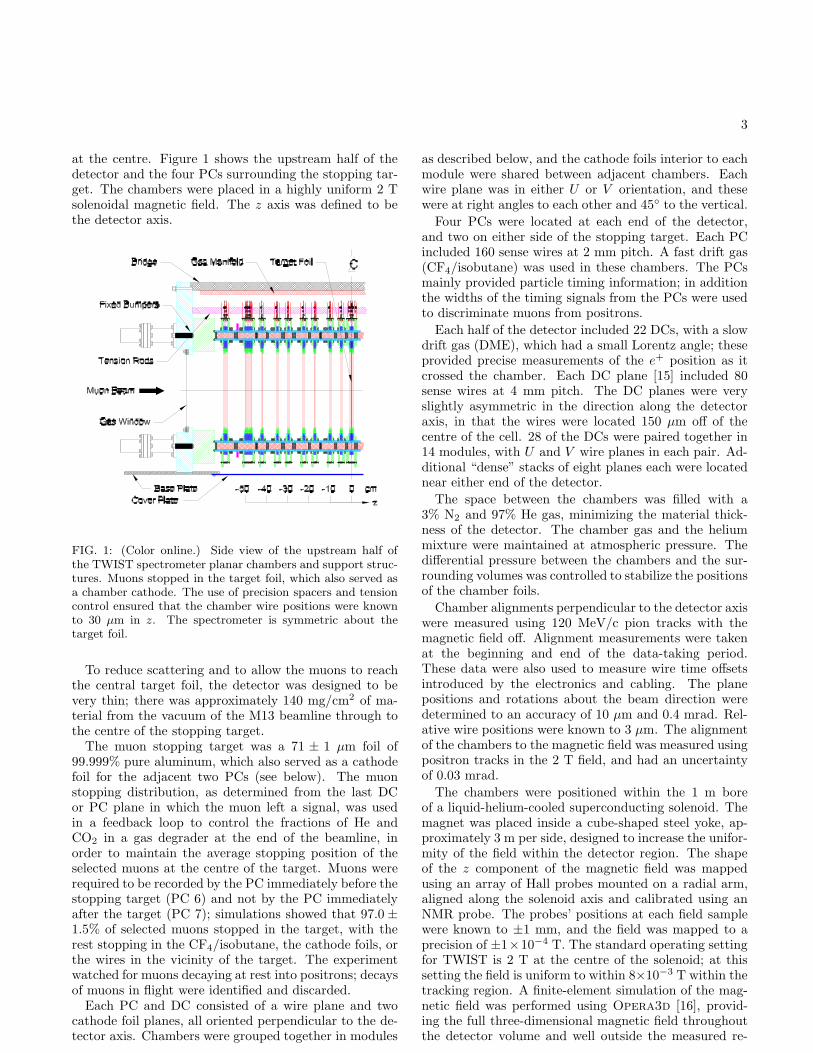
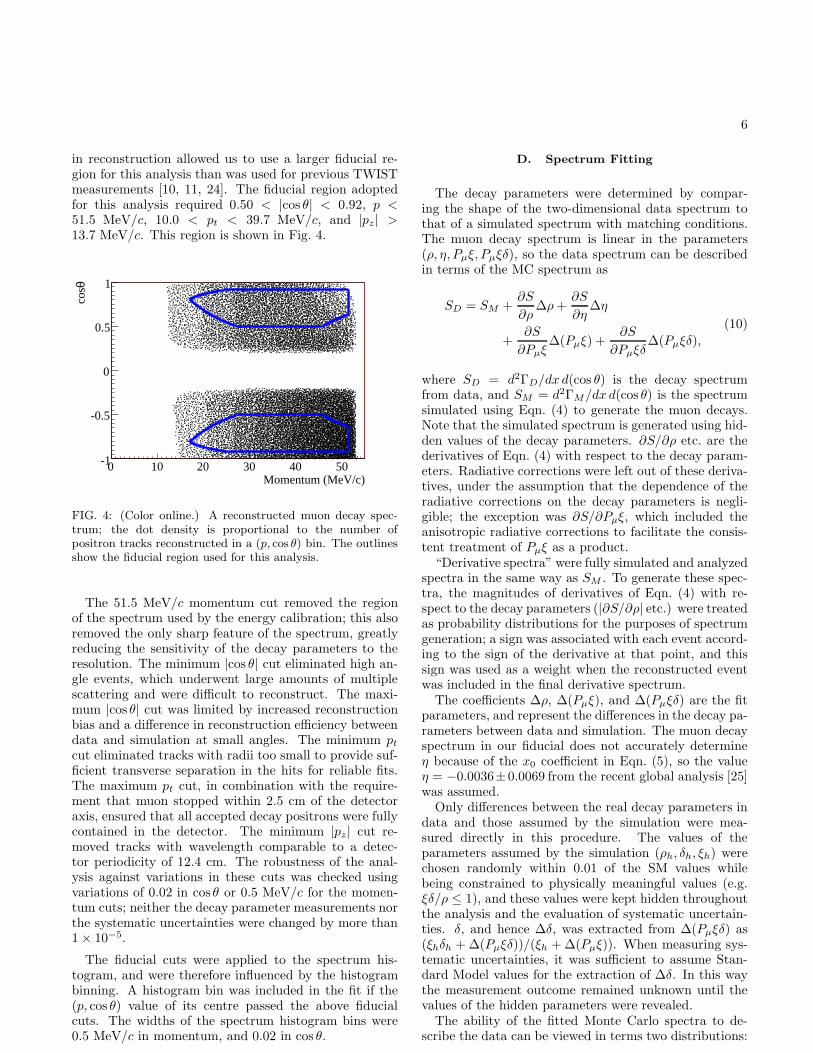
Differences in the details of the muon stopping posi-tion within the target foil, differences in the STRs, theaccuracy of the magnetic field maps, and knowledge ofthe wire positions resulted in differences in the energyscales of the simulation and the data. The kinematicendpoint region (near 52.3 < p < 53.4 MeV/c) was usedto determine the relative energy calibration between thedata and the simulation after reconstruction was com-plete. The relative positions of the endpoint were com-pared between data and simulation in bins of angle (seeFig. 3 for an example), and the differences were parame-terized separately for upstream and downstream parts ofthe spectrum, according to
∆pe = Bi +Ai
cos θ, i = US, DS, (9)
where ∆pe is the difference in the momentum of the spec-trum endpoint between data and simulation. Equation
Momentum (MeV/c)
0 10 20 30 40 50θ
cos-1
-0.50
0.51
Cou
nts
0
5000
10000
15000
20000
25000
30000
FIG. 2: (Color online.) Reconstructed muon decay spectrum.
52.4 52.6 52.8 53 53.2 53.4
yie
ld (
arbit
rary
unit
s)
0
0.002
0.004
0.006
0.008
0.01
0.012
Data
MC
momentum (MeV/c)
FIG. 3: (Color online.) Uncalibrated data and simulationhistograms in the momentum range of the decay spectrumused for energy calibration, for −0.53 < cos θ < −0.50.
9 describes an energy loss proportional to the amount ofmaterial encountered by a particle; for a planar detectorthe amount of material is proportional to 1/ cos θ. Thisform was found to describe ∆pe well, also. Uncertaintiesin the calibration parameters Bi and Ai were statistical.This relative calibration technique replaced the calibra-tion using an analytic approximation to the end pointshape used in the previous analyses [10, 11, 24].
C. Fiducial Region
Limitations of the reconstruction and physical aspectsof the detector required the imposition of fiducial cuts,which were applied after the data and simulation werecalibrated and assembled into spectra. Improvements
6
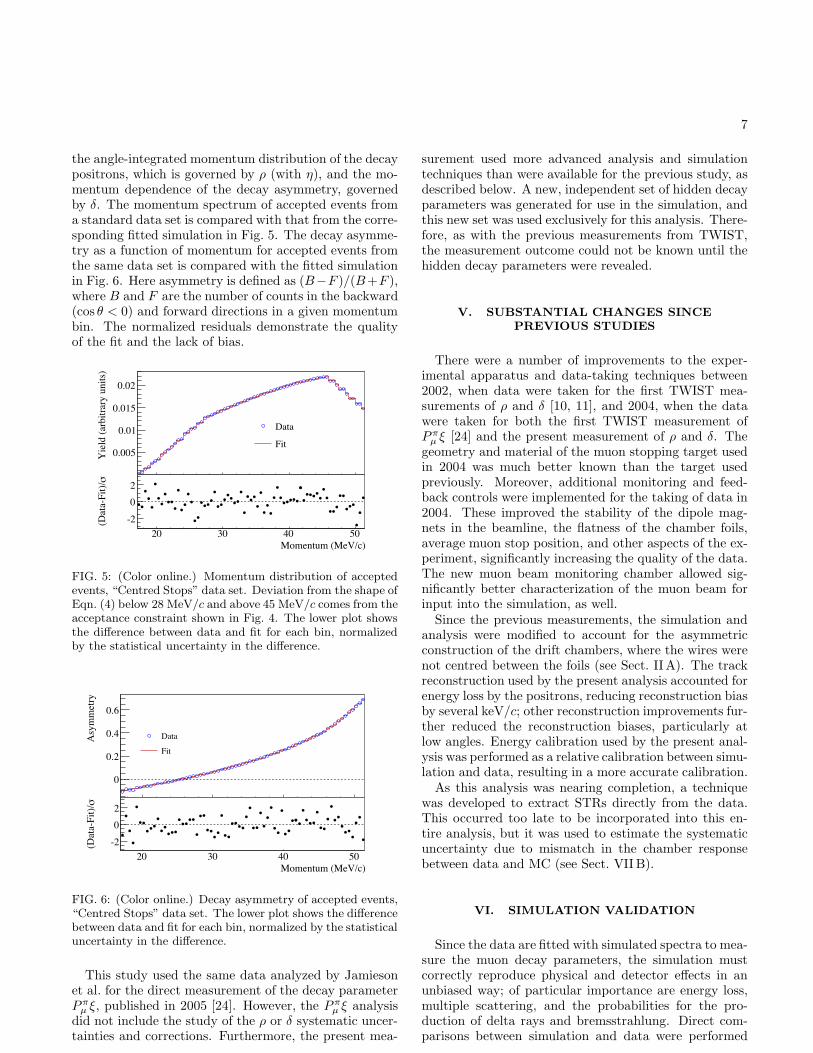
in reconstruction allowed us to use a larger fiducial re-gion for this analysis than was used for previous TWISTmeasurements [10, 11, 24]. The fiducial region adoptedfor this analysis required 0.50 < |cos θ| < 0.92, p <51.5 MeV/c, 10.0 < pt < 39.7 MeV/c, and |pz| >13.7 MeV/c. This region is shown in Fig. 4.
Momentum (MeV/c)0 10 20 30 40 50
θco
s
-1
-0.5
0
0.5
1
FIG. 4: (Color online.) A reconstructed muon decay spec-trum; the dot density is proportional to the number ofpositron tracks reconstructed in a (p, cos θ) bin. The outlinesshow the fiducial region used for this analysis.
The 51.5 MeV/c momentum cut removed the regionof the spectrum used by the energy calibration; this alsoremoved the only sharp feature of the spectrum, greatlyreducing the sensitivity of the decay parameters to theresolution. The minimum |cos θ| cut eliminated high an-gle events, which underwent large amounts of multiplescattering and were difficult to reconstruct. The maxi-mum |cos θ| cut was limited by increased reconstructionbias and a difference in reconstruction efficiency betweendata and simulation at small angles. The minimum pt
cut eliminated tracks with radii too small to provide suf-ficient transverse separation in the hits for reliable fits.The maximum pt cut, in combination with the require-ment that muon stopped within 2.5 cm of the detectoraxis, ensured that all accepted decay positrons were fullycontained in the detector. The minimum |pz| cut re-moved tracks with wavelength comparable to a detec-tor periodicity of 12.4 cm. The robustness of the anal-ysis against variations in these cuts was checked usingvariations of 0.02 in cos θ or 0.5 MeV/c for the momen-tum cuts; neither the decay parameter measurements northe systematic uncertainties were changed by more than1 × 10−5.
The fiducial cuts were applied to the spectrum his-togram, and were therefore influenced by the histogrambinning. A histogram bin was included in the fit if the(p, cos θ) value of its centre passed the above fiducialcuts. The widths of the spectrum histogram bins were0.5 MeV/c in momentum, and 0.02 in cos θ.
D. Spectrum Fitting
The decay parameters were determined by compar-ing the shape of the two-dimensional data spectrum tothat of a simulated spectrum with matching conditions.The muon decay spectrum is linear in the parameters(ρ, η, Pµξ, Pµξδ), so the data spectrum can be describedin terms of the MC spectrum as
SD = SM +∂S
∂ρ∆ρ+
∂S
∂η∆η
+∂S
∂Pµξ∆(Pµξ) +
∂S
∂Pµξδ∆(Pµξδ),
(10)
where SD = d2ΓD/dx d(cos θ) is the decay spectrumfrom data, and SM = d2ΓM/dx d(cos θ) is the spectrumsimulated using Eqn. (4) to generate the muon decays.Note that the simulated spectrum is generated using hid-den values of the decay parameters. ∂S/∂ρ etc. are thederivatives of Eqn. (4) with respect to the decay param-eters. Radiative corrections were left out of these deriva-tives, under the assumption that the dependence of theradiative corrections on the decay parameters is negli-gible; the exception was ∂S/∂Pµξ, which included theanisotropic radiative corrections to facilitate the consis-tent treatment of Pµξ as a product.
“Derivative spectra” were fully simulated and analyzedspectra in the same way as SM . To generate these spec-tra, the magnitudes of derivatives of Eqn. (4) with re-spect to the decay parameters (|∂S/∂ρ| etc.) were treatedas probability distributions for the purposes of spectrumgeneration; a sign was associated with each event accord-ing to the sign of the derivative at that point, and thissign was used as a weight when the reconstructed eventwas included in the final derivative spectrum.
The coefficients ∆ρ, ∆(Pµξ), and ∆(Pµξδ) are the fitparameters, and represent the differences in the decay pa-rameters between data and simulation. The muon decayspectrum in our fiducial does not accurately determineη because of the x0 coefficient in Eqn. (5), so the valueη = −0.0036±0.0069 from the recent global analysis [25]was assumed.
Only differences between the real decay parameters indata and those assumed by the simulation were mea-sured directly in this procedure. The values of theparameters assumed by the simulation (ρh, δh, ξh) werechosen randomly within 0.01 of the SM values whilebeing constrained to physically meaningful values (e.g.ξδ/ρ ≤ 1), and these values were kept hidden throughoutthe analysis and the evaluation of systematic uncertain-ties. δ, and hence ∆δ, was extracted from ∆(Pµξδ) as(ξhδh + ∆(Pµξδ))/(ξh + ∆(Pµξ)). When measuring sys-tematic uncertainties, it was sufficient to assume Stan-dard Model values for the extraction of ∆δ. In this waythe measurement outcome remained unknown until thevalues of the hidden parameters were revealed.
The ability of the fitted Monte Carlo spectra to de-scribe the data can be viewed in terms two distributions:
7
the angle-integrated momentum distribution of the decaypositrons, which is governed by ρ (with η), and the mo-mentum dependence of the decay asymmetry, governedby δ. The momentum spectrum of accepted events froma standard data set is compared with that from the corre-sponding fitted simulation in Fig. 5. The decay asymme-try as a function of momentum for accepted events fromthe same data set is compared with the fitted simulationin Fig. 6. Here asymmetry is defined as (B−F )/(B+F ),where B and F are the number of counts in the backward(cos θ < 0) and forward directions in a given momentumbin. The normalized residuals demonstrate the qualityof the fit and the lack of bias.
Yie
ld (
arb
itra
ry u
nit
s)
0.005
0.01
0.015
0.02
Data
Fit
Momentum (MeV/c)
20 30 40 50
σ(D
ata-
Fit
)/
-2
0
2
FIG. 5: (Color online.) Momentum distribution of acceptedevents, “Centred Stops” data set. Deviation from the shape ofEqn. (4) below 28 MeV/c and above 45 MeV/c comes from theacceptance constraint shown in Fig. 4. The lower plot showsthe difference between data and fit for each bin, normalizedby the statistical uncertainty in the difference.
Asy
mm
etry
0
0.2
0.4
0.6
Data
Fit
Momentum (MeV/c)
20 30 40 50
σ(D
ata-
Fit
)/
-2
0
2
FIG. 6: (Color online.) Decay asymmetry of accepted events,“Centred Stops” data set. The lower plot shows the differencebetween data and fit for each bin, normalized by the statisticaluncertainty in the difference.
This study used the same data analyzed by Jamiesonet al. for the direct measurement of the decay parameterP π
µ ξ, published in 2005 [24]. However, the P πµ ξ analysis
did not include the study of the ρ or δ systematic uncer-tainties and corrections. Furthermore, the present mea-
surement used more advanced analysis and simulationtechniques than were available for the previous study, asdescribed below. A new, independent set of hidden decayparameters was generated for use in the simulation, andthis new set was used exclusively for this analysis. There-fore, as with the previous measurements from TWIST,the measurement outcome could not be known until thehidden decay parameters were revealed.
V. SUBSTANTIAL CHANGES SINCE
PREVIOUS STUDIES
There were a number of improvements to the exper-imental apparatus and data-taking techniques between2002, when data were taken for the first TWIST mea-surements of ρ and δ [10, 11], and 2004, when the datawere taken for both the first TWIST measurement ofP π
µ ξ [24] and the present measurement of ρ and δ. Thegeometry and material of the muon stopping target usedin 2004 was much better known than the target usedpreviously. Moreover, additional monitoring and feed-back controls were implemented for the taking of data in2004. These improved the stability of the dipole mag-nets in the beamline, the flatness of the chamber foils,average muon stop position, and other aspects of the ex-periment, significantly increasing the quality of the data.The new muon beam monitoring chamber allowed sig-nificantly better characterization of the muon beam forinput into the simulation, as well.
Since the previous measurements, the simulation andanalysis were modified to account for the asymmetricconstruction of the drift chambers, where the wires werenot centred between the foils (see Sect. II A). The trackreconstruction used by the present analysis accounted forenergy loss by the positrons, reducing reconstruction biasby several keV/c; other reconstruction improvements fur-ther reduced the reconstruction biases, particularly atlow angles. Energy calibration used by the present anal-ysis was performed as a relative calibration between simu-lation and data, resulting in a more accurate calibration.
As this analysis was nearing completion, a techniquewas developed to extract STRs directly from the data.This occurred too late to be incorporated into this en-tire analysis, but it was used to estimate the systematicuncertainty due to mismatch in the chamber responsebetween data and MC (see Sect. VII B).
VI. SIMULATION VALIDATION
Since the data are fitted with simulated spectra to mea-sure the muon decay parameters, the simulation mustcorrectly reproduce physical and detector effects in anunbiased way; of particular importance are energy loss,multiple scattering, and the probabilities for the pro-duction of delta rays and bremsstrahlung. Direct com-parisons between simulation and data were performed
8
with specialized data not used for decay parameter mea-surements. In this mode, labeled “upstream stops”, themomentum of the muon beam was reduced so that themuons stopped upstream of the DCs. Downstream-goingdecays then passed through the entire detector, and werereconstructed twice, first using only the upstream half ofthe detector, then using only the downstream half. En-ergy loss, scattering, helix fitter biases, and reconstruc-tion resolution all resulted in differences in the proper-ties of the two tracks. Distributions of ∆p = pDS − pUS ,∆θ = θDS − θUS , and other differences were used to ex-amine reconstruction and physical effects, independentof the shape of the decay spectrum, and to compare thesimulation directly to the data.
About 8 × 10⁷ upstream stop events were consideredfor this analysis, with 1.5×10⁶ events accepted after cuts.About ten times that amount of simulated decays weregenerated.
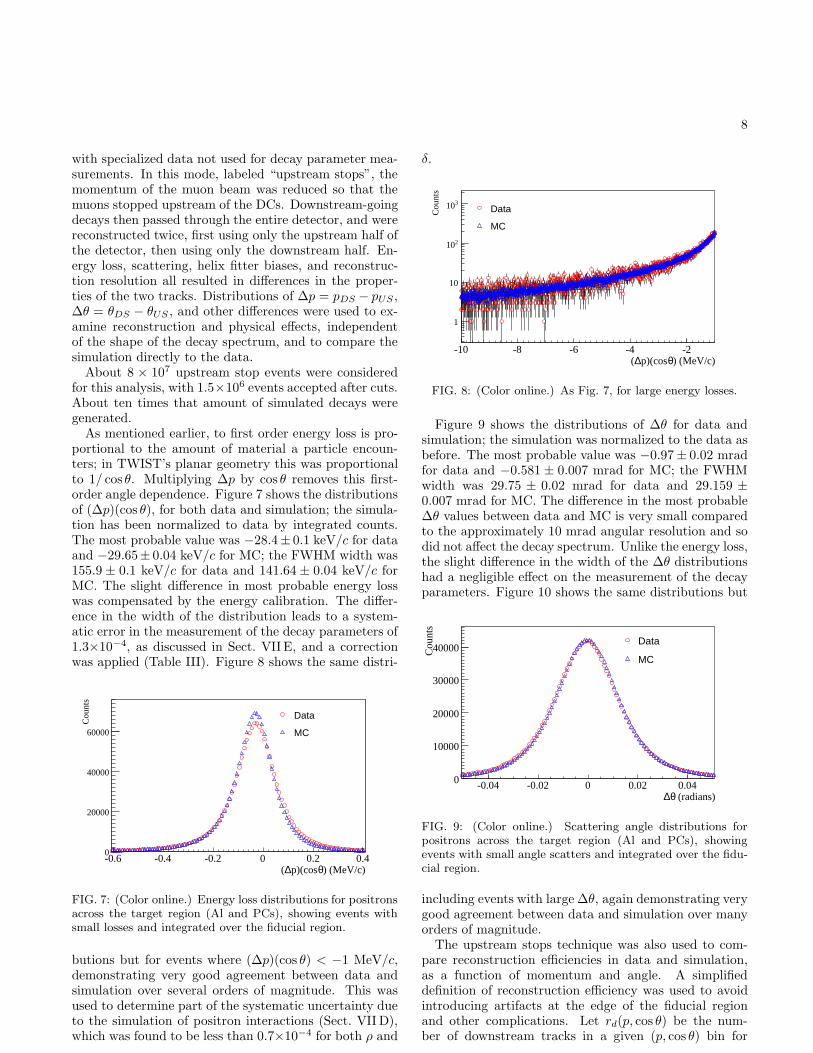
As mentioned earlier, to first order energy loss is pro-portional to the amount of material a particle encoun-ters; in TWIST’s planar geometry this was proportionalto 1/ cos θ. Multiplying ∆p by cos θ removes this first-order angle dependence. Figure 7 shows the distributionsof (∆p)(cos θ), for both data and simulation; the simula-tion has been normalized to data by integrated counts.The most probable value was −28.4± 0.1 keV/c for dataand −29.65± 0.04 keV/c for MC; the FWHM width was155.9 ± 0.1 keV/c for data and 141.64 ± 0.04 keV/c forMC. The slight difference in most probable energy losswas compensated by the energy calibration. The differ-ence in the width of the distribution leads to a system-atic error in the measurement of the decay parameters of1.3×10−4, as discussed in Sect. VII E, and a correctionwas applied (Table III). Figure 8 shows the same distri-
) (MeV/c)θp)(cos∆(-0.6 -0.4 -0.2 0 0.2 0.4
Cou
nts
0
20000
40000
60000
Data
MC
FIG. 7: (Color online.) Energy loss distributions for positronsacross the target region (Al and PCs), showing events withsmall losses and integrated over the fiducial region.
butions but for events where (∆p)(cos θ) < −1 MeV/c,demonstrating very good agreement between data andsimulation over several orders of magnitude. This wasused to determine part of the systematic uncertainty dueto the simulation of positron interactions (Sect. VII D),which was found to be less than 0.7×10⁻⁴ for both ρ and
δ.
) (MeV/c)θp)(cos∆(-10 -8 -6 -4 -2
Cou
nts
1
10
210
310 Data
MC
FIG. 8: (Color online.) As Fig. 7, for large energy losses.
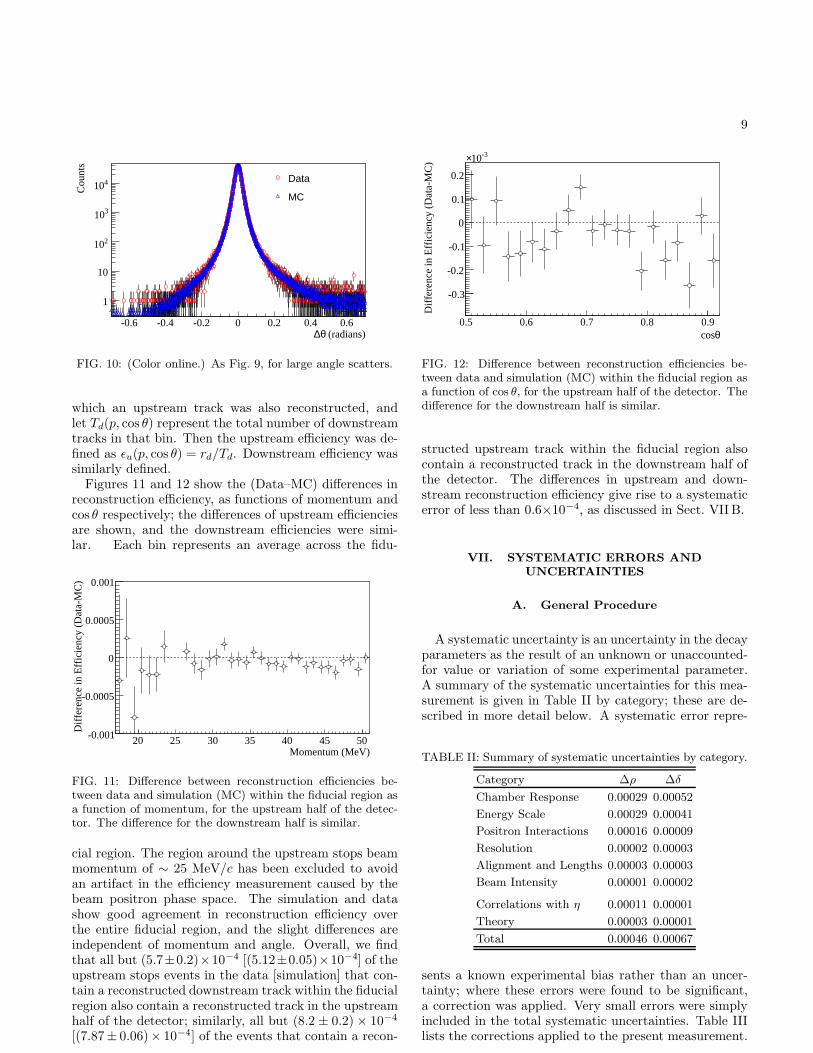
Figure 9 shows the distributions of ∆θ for data andsimulation; the simulation was normalized to the data asbefore. The most probable value was −0.97± 0.02 mradfor data and −0.581 ± 0.007 mrad for MC; the FWHMwidth was 29.75 ± 0.02 mrad for data and 29.159 ±0.007 mrad for MC. The difference in the most probable∆θ values between data and MC is very small comparedto the approximately 10 mrad angular resolution and sodid not affect the decay spectrum. Unlike the energy loss,the slight difference in the width of the ∆θ distributionshad a negligible effect on the measurement of the decayparameters. Figure 10 shows the same distributions but
(radians)θ∆-0.04 -0.02 0 0.02 0.04
Cou
nts
0
10000
20000
30000
40000Data
MC
FIG. 9: (Color online.) Scattering angle distributions forpositrons across the target region (Al and PCs), showingevents with small angle scatters and integrated over the fidu-cial region.
including events with large ∆θ, again demonstrating verygood agreement between data and simulation over manyorders of magnitude.
The upstream stops technique was also used to com-pare reconstruction efficiencies in data and simulation,as a function of momentum and angle. A simplifieddefinition of reconstruction efficiency was used to avoidintroducing artifacts at the edge of the fiducial regionand other complications. Let rd(p, cos θ) be the num-ber of downstream tracks in a given (p, cos θ) bin for
9
(radians)θ∆-0.6 -0.4 -0.2 0 0.2 0.4 0.6
Cou
nts
1
10
210
310
410Data
MC
FIG. 10: (Color online.) As Fig. 9, for large angle scatters.
which an upstream track was also reconstructed, andlet Td(p, cos θ) represent the total number of downstreamtracks in that bin. Then the upstream efficiency was de-fined as ǫu(p, cos θ) = rd/Td. Downstream efficiency wassimilarly defined.
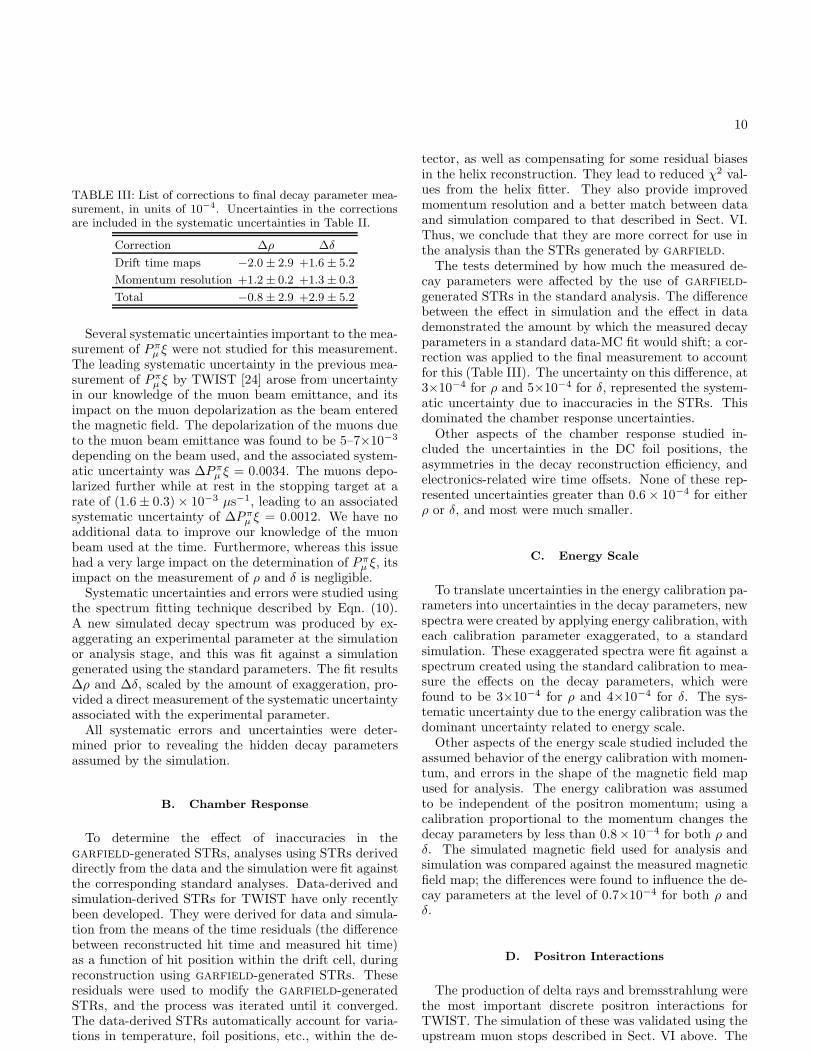
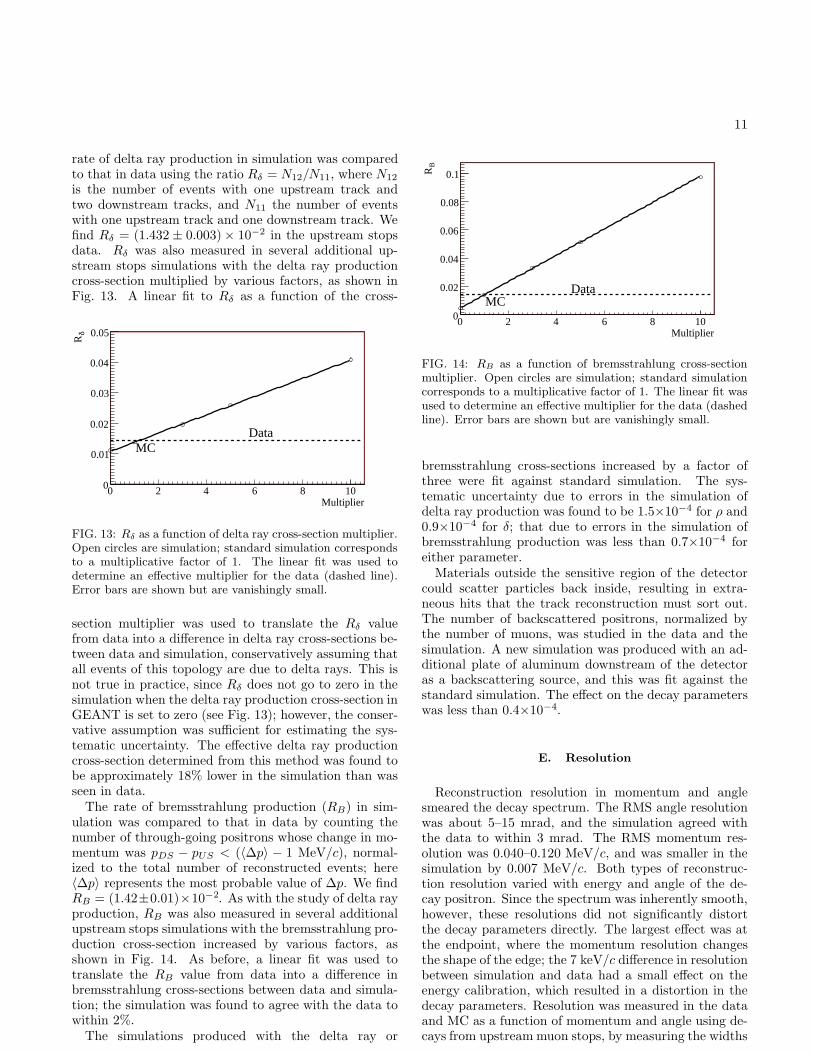
Figures 11 and 12 show the (Data–MC) differences inreconstruction efficiency, as functions of momentum andcos θ respectively; the differences of upstream efficienciesare shown, and the downstream efficiencies were simi-lar. Each bin represents an average across the fidu-
Momentum (MeV)20 25 30 35 40 45 50
Dif
fere
nce
in E
ffic
ienc
y (D
ata-
MC
)
-0.001
-0.0005
0
0.0005
0.001
FIG. 11: Difference between reconstruction efficiencies be-tween data and simulation (MC) within the fiducial region asa function of momentum, for the upstream half of the detec-tor. The difference for the downstream half is similar.
cial region. The region around the upstream stops beammomentum of ∼ 25 MeV/c has been excluded to avoidan artifact in the efficiency measurement caused by thebeam positron phase space. The simulation and datashow good agreement in reconstruction efficiency overthe entire fiducial region, and the slight differences areindependent of momentum and angle. Overall, we findthat all but (5.7±0.2)×10−4 [(5.12±0.05)×10−4] of theupstream stops events in the data [simulation] that con-tain a reconstructed downstream track within the fiducialregion also contain a reconstructed track in the upstreamhalf of the detector; similarly, all but (8.2 ± 0.2) × 10−4
[(7.87± 0.06)× 10−4] of the events that contain a recon-
θcos0.5 0.6 0.7 0.8 0.9
Dif
fere
nce
in E
ffic
ienc
y (D
ata-
MC
)
-0.3
-0.2
-0.1
0
0.1
0.2
-310×
FIG. 12: Difference between reconstruction efficiencies be-tween data and simulation (MC) within the fiducial region asa function of cos θ, for the upstream half of the detector. Thedifference for the downstream half is similar.
structed upstream track within the fiducial region alsocontain a reconstructed track in the downstream half ofthe detector. The differences in upstream and down-stream reconstruction efficiency give rise to a systematicerror of less than 0.6×10⁻⁴, as discussed in Sect. VII B.
VII. SYSTEMATIC ERRORS AND
UNCERTAINTIES
A. General Procedure
A systematic uncertainty is an uncertainty in the decayparameters as the result of an unknown or unaccounted-for value or variation of some experimental parameter.A summary of the systematic uncertainties for this mea-surement is given in Table II by category; these are de-scribed in more detail below. A systematic error repre-
TABLE II: Summary of systematic uncertainties by category.
Category ∆ρ ∆δ
Chamber Response 0.00029 0.00052
Energy Scale 0.00029 0.00041
Positron Interactions 0.00016 0.00009
Resolution 0.00002 0.00003
Alignment and Lengths 0.00003 0.00003
Beam Intensity 0.00001 0.00002
Correlations with η 0.00011 0.00001
Theory 0.00003 0.00001
Total 0.00046 0.00067
sents a known experimental bias rather than an uncer-tainty; where these errors were found to be significant,a correction was applied. Very small errors were simplyincluded in the total systematic uncertainties. Table IIIlists the corrections applied to the present measurement.
10
TABLE III: List of corrections to final decay parameter mea-surement, in units of 10−4. Uncertainties in the correctionsare included in the systematic uncertainties in Table II.
Correction ∆ρ ∆δ
Drift time maps −2.0 ± 2.9 +1.6 ± 5.2
Momentum resolution +1.2 ± 0.2 +1.3 ± 0.3
Total −0.8 ± 2.9 +2.9 ± 5.2
Several systematic uncertainties important to the mea-surement of P π
µ ξ were not studied for this measurement.The leading systematic uncertainty in the previous mea-surement of P π
µ ξ by TWIST [24] arose from uncertaintyin our knowledge of the muon beam emittance, and itsimpact on the muon depolarization as the beam enteredthe magnetic field. The depolarization of the muons dueto the muon beam emittance was found to be 5–7×10⁻³
depending on the beam used, and the associated system-atic uncertainty was ∆P π
µ ξ = 0.0034. The muons depo-larized further while at rest in the stopping target at arate of (1.6 ± 0.3) × 10−3 µs−1, leading to an associatedsystematic uncertainty of ∆P π
µ ξ = 0.0012. We have noadditional data to improve our knowledge of the muonbeam used at the time. Furthermore, whereas this issuehad a very large impact on the determination of P π
µ ξ, itsimpact on the measurement of ρ and δ is negligible.
Systematic uncertainties and errors were studied usingthe spectrum fitting technique described by Eqn. (10).A new simulated decay spectrum was produced by ex-aggerating an experimental parameter at the simulationor analysis stage, and this was fit against a simulationgenerated using the standard parameters. The fit results∆ρ and ∆δ, scaled by the amount of exaggeration, pro-vided a direct measurement of the systematic uncertaintyassociated with the experimental parameter.
All systematic errors and uncertainties were deter-mined prior to revealing the hidden decay parametersassumed by the simulation.
B. Chamber Response
To determine the effect of inaccuracies in thegarfield-generated STRs, analyses using STRs deriveddirectly from the data and the simulation were fit againstthe corresponding standard analyses. Data-derived andsimulation-derived STRs for TWIST have only recentlybeen developed. They were derived for data and simula-tion from the means of the time residuals (the differencebetween reconstructed hit time and measured hit time)as a function of hit position within the drift cell, duringreconstruction using garfield-generated STRs. Theseresiduals were used to modify the garfield-generatedSTRs, and the process was iterated until it converged.The data-derived STRs automatically account for varia-tions in temperature, foil positions, etc., within the de-
tector, as well as compensating for some residual biasesin the helix reconstruction. They lead to reduced χ2 val-ues from the helix fitter. They also provide improvedmomentum resolution and a better match between dataand simulation compared to that described in Sect. VI.Thus, we conclude that they are more correct for use inthe analysis than the STRs generated by garfield.
The tests determined by how much the measured de-cay parameters were affected by the use of garfield-generated STRs in the standard analysis. The differencebetween the effect in simulation and the effect in datademonstrated the amount by which the measured decayparameters in a standard data-MC fit would shift; a cor-rection was applied to the final measurement to accountfor this (Table III). The uncertainty on this difference, at3×10−4 for ρ and 5×10⁻⁴ for δ, represented the system-atic uncertainty due to inaccuracies in the STRs. Thisdominated the chamber response uncertainties.
Other aspects of the chamber response studied in-cluded the uncertainties in the DC foil positions, theasymmetries in the decay reconstruction efficiency, andelectronics-related wire time offsets. None of these rep-resented uncertainties greater than 0.6 × 10⁻⁴ for eitherρ or δ, and most were much smaller.
C. Energy Scale
To translate uncertainties in the energy calibration pa-rameters into uncertainties in the decay parameters, newspectra were created by applying energy calibration, witheach calibration parameter exaggerated, to a standardsimulation. These exaggerated spectra were fit against aspectrum created using the standard calibration to mea-sure the effects on the decay parameters, which werefound to be 3×10⁻⁴ for ρ and 4×10⁻⁴ for δ. The sys-tematic uncertainty due to the energy calibration was thedominant uncertainty related to energy scale.
Other aspects of the energy scale studied included theassumed behavior of the energy calibration with momen-tum, and errors in the shape of the magnetic field mapused for analysis. The energy calibration was assumedto be independent of the positron momentum; using acalibration proportional to the momentum changes thedecay parameters by less than 0.8× 10⁻⁴ for both ρ andδ. The simulated magnetic field used for analysis andsimulation was compared against the measured magneticfield map; the differences were found to influence the de-cay parameters at the level of 0.7×10⁻⁴ for both ρ andδ.
D. Positron Interactions
The production of delta rays and bremsstrahlung werethe most important discrete positron interactions forTWIST. The simulation of these was validated using theupstream muon stops described in Sect. VI above. The
11
rate of delta ray production in simulation was comparedto that in data using the ratio Rδ = N12/N11, where N12
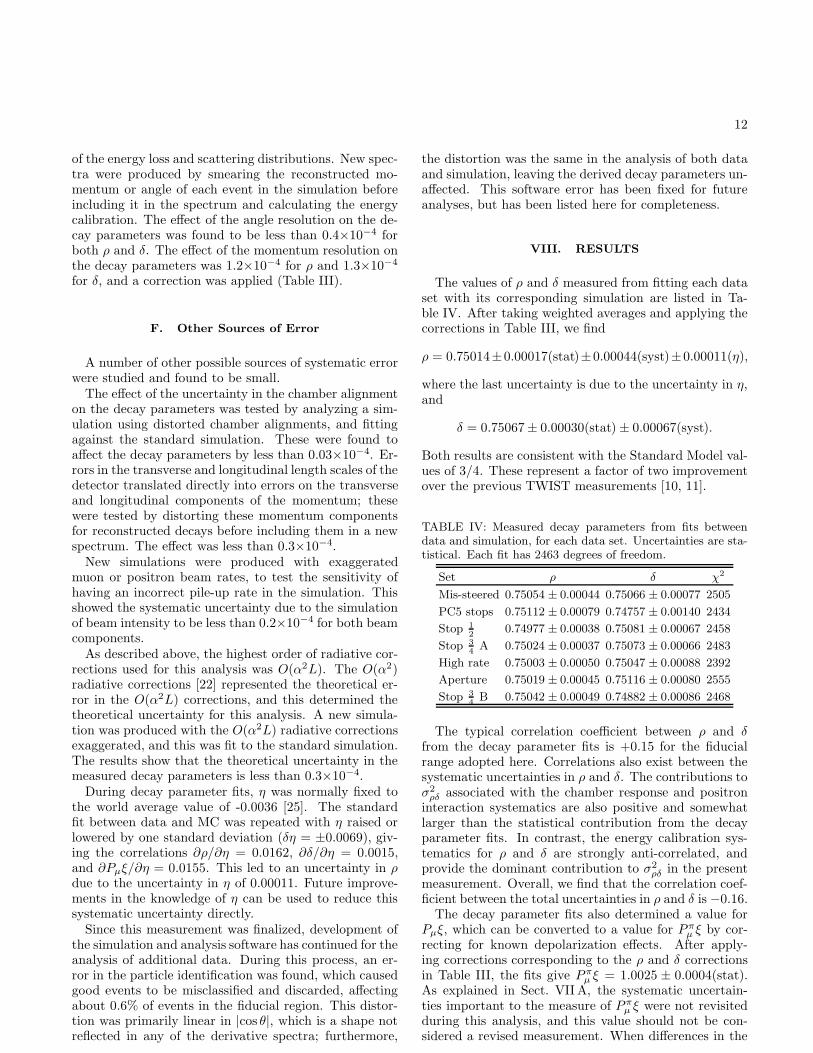
is the number of events with one upstream track andtwo downstream tracks, and N11 the number of eventswith one upstream track and one downstream track. Wefind Rδ = (1.432 ± 0.003) × 10−2 in the upstream stopsdata. Rδ was also measured in several additional up-stream stops simulations with the delta ray productioncross-section multiplied by various factors, as shown inFig. 13. A linear fit to Rδ as a function of the cross-
Multiplier0 2 4 6 8 10
δR
0
0.01
0.02
0.03
0.04
0.05
DataMC
FIG. 13: Rδ as a function of delta ray cross-section multiplier.Open circles are simulation; standard simulation correspondsto a multiplicative factor of 1. The linear fit was used todetermine an effective multiplier for the data (dashed line).Error bars are shown but are vanishingly small.
section multiplier was used to translate the Rδ valuefrom data into a difference in delta ray cross-sections be-tween data and simulation, conservatively assuming thatall events of this topology are due to delta rays. This isnot true in practice, since Rδ does not go to zero in thesimulation when the delta ray production cross-section inGEANT is set to zero (see Fig. 13); however, the conser-vative assumption was sufficient for estimating the sys-tematic uncertainty. The effective delta ray productioncross-section determined from this method was found tobe approximately 18% lower in the simulation than wasseen in data.
The rate of bremsstrahlung production (RB) in sim-ulation was compared to that in data by counting thenumber of through-going positrons whose change in mo-mentum was pDS − pUS < (〈∆p〉 − 1 MeV/c), normal-ized to the total number of reconstructed events; here〈∆p〉 represents the most probable value of ∆p. We findRB = (1.42±0.01)×10−2. As with the study of delta rayproduction, RB was also measured in several additionalupstream stops simulations with the bremsstrahlung pro-duction cross-section increased by various factors, asshown in Fig. 14. As before, a linear fit was used totranslate the RB value from data into a difference inbremsstrahlung cross-sections between data and simula-tion; the simulation was found to agree with the data towithin 2%.
The simulations produced with the delta ray or
Multiplier0 2 4 6 8 10
BR
0
0.02
0.04
0.06
0.08
0.1
DataMC
FIG. 14: RB as a function of bremsstrahlung cross-sectionmultiplier. Open circles are simulation; standard simulationcorresponds to a multiplicative factor of 1. The linear fit wasused to determine an effective multiplier for the data (dashedline). Error bars are shown but are vanishingly small.
bremsstrahlung cross-sections increased by a factor ofthree were fit against standard simulation. The sys-tematic uncertainty due to errors in the simulation ofdelta ray production was found to be 1.5×10⁻⁴ for ρ and0.9×10−4 for δ; that due to errors in the simulation ofbremsstrahlung production was less than 0.7×10⁻⁴ foreither parameter.
Materials outside the sensitive region of the detectorcould scatter particles back inside, resulting in extra-neous hits that the track reconstruction must sort out.The number of backscattered positrons, normalized bythe number of muons, was studied in the data and thesimulation. A new simulation was produced with an ad-ditional plate of aluminum downstream of the detectoras a backscattering source, and this was fit against thestandard simulation. The effect on the decay parameterswas less than 0.4×10⁻⁴.
E. Resolution
Reconstruction resolution in momentum and anglesmeared the decay spectrum. The RMS angle resolutionwas about 5–15 mrad, and the simulation agreed withthe data to within 3 mrad. The RMS momentum res-olution was 0.040–0.120 MeV/c, and was smaller in thesimulation by 0.007 MeV/c. Both types of reconstruc-tion resolution varied with energy and angle of the de-cay positron. Since the spectrum was inherently smooth,however, these resolutions did not significantly distortthe decay parameters directly. The largest effect was atthe endpoint, where the momentum resolution changesthe shape of the edge; the 7 keV/c difference in resolutionbetween simulation and data had a small effect on theenergy calibration, which resulted in a distortion in thedecay parameters. Resolution was measured in the dataand MC as a function of momentum and angle using de-cays from upstream muon stops, by measuring the widths
12
of the energy loss and scattering distributions. New spec-tra were produced by smearing the reconstructed mo-mentum or angle of each event in the simulation beforeincluding it in the spectrum and calculating the energycalibration. The effect of the angle resolution on the de-cay parameters was found to be less than 0.4×10⁻⁴ forboth ρ and δ. The effect of the momentum resolution onthe decay parameters was 1.2×10⁻⁴ for ρ and 1.3×10⁻⁴
for δ, and a correction was applied (Table III).
F. Other Sources of Error
A number of other possible sources of systematic errorwere studied and found to be small.
The effect of the uncertainty in the chamber alignmenton the decay parameters was tested by analyzing a sim-ulation using distorted chamber alignments, and fittingagainst the standard simulation. These were found toaffect the decay parameters by less than 0.03×10⁻⁴. Er-rors in the transverse and longitudinal length scales of thedetector translated directly into errors on the transverseand longitudinal components of the momentum; thesewere tested by distorting these momentum componentsfor reconstructed decays before including them in a newspectrum. The effect was less than 0.3×10⁻⁴.
New simulations were produced with exaggeratedmuon or positron beam rates, to test the sensitivity ofhaving an incorrect pile-up rate in the simulation. Thisshowed the systematic uncertainty due to the simulationof beam intensity to be less than 0.2×10⁻⁴ for both beamcomponents.
As described above, the highest order of radiative cor-rections used for this analysis was O(α2L). The O(α2)radiative corrections [22] represented the theoretical er-ror in the O(α2L) corrections, and this determined thetheoretical uncertainty for this analysis. A new simula-tion was produced with the O(α2L) radiative correctionsexaggerated, and this was fit to the standard simulation.The results show that the theoretical uncertainty in themeasured decay parameters is less than 0.3×10⁻⁴.
During decay parameter fits, η was normally fixed tothe world average value of -0.0036 [25]. The standardfit between data and MC was repeated with η raised orlowered by one standard deviation (δη = ±0.0069), giv-ing the correlations ∂ρ/∂η = 0.0162, ∂δ/∂η = 0.0015,and ∂Pµξ/∂η = 0.0155. This led to an uncertainty in ρdue to the uncertainty in η of 0.00011. Future improve-ments in the knowledge of η can be used to reduce thissystematic uncertainty directly.
Since this measurement was finalized, development ofthe simulation and analysis software has continued for theanalysis of additional data. During this process, an er-ror in the particle identification was found, which causedgood events to be misclassified and discarded, affectingabout 0.6% of events in the fiducial region. This distor-tion was primarily linear in |cos θ|, which is a shape notreflected in any of the derivative spectra; furthermore,
the distortion was the same in the analysis of both dataand simulation, leaving the derived decay parameters un-affected. This software error has been fixed for futureanalyses, but has been listed here for completeness.
VIII. RESULTS
The values of ρ and δ measured from fitting each dataset with its corresponding simulation are listed in Ta-ble IV. After taking weighted averages and applying thecorrections in Table III, we find
ρ = 0.75014±0.00017(stat)±0.00044(syst)±0.00011(η),
where the last uncertainty is due to the uncertainty in η,and
δ = 0.75067± 0.00030(stat) ± 0.00067(syst).
Both results are consistent with the Standard Model val-ues of 3/4. These represent a factor of two improvementover the previous TWIST measurements [10, 11].
TABLE IV: Measured decay parameters from fits betweendata and simulation, for each data set. Uncertainties are sta-tistical. Each fit has 2463 degrees of freedom.
Set ρ δ χ2
Mis-steered 0.75054 ± 0.00044 0.75066 ± 0.00077 2505
PC5 stops 0.75112 ± 0.00079 0.74757 ± 0.00140 2434
Stop 1
20.74977 ± 0.00038 0.75081 ± 0.00067 2458
Stop 3
4A 0.75024 ± 0.00037 0.75073 ± 0.00066 2483
High rate 0.75003 ± 0.00050 0.75047 ± 0.00088 2392
Aperture 0.75019 ± 0.00045 0.75116 ± 0.00080 2555
Stop 3
4B 0.75042 ± 0.00049 0.74882 ± 0.00086 2468
The typical correlation coefficient between ρ and δfrom the decay parameter fits is +0.15 for the fiducialrange adopted here. Correlations also exist between thesystematic uncertainties in ρ and δ. The contributions toσ2
ρδ associated with the chamber response and positroninteraction systematics are also positive and somewhatlarger than the statistical contribution from the decayparameter fits. In contrast, the energy calibration sys-tematics for ρ and δ are strongly anti-correlated, andprovide the dominant contribution to σ2
ρδ in the presentmeasurement. Overall, we find that the correlation coef-ficient between the total uncertainties in ρ and δ is −0.16.
The decay parameter fits also determined a value forPµξ, which can be converted to a value for P π
µ ξ by cor-recting for known depolarization effects. After apply-ing corrections corresponding to the ρ and δ correctionsin Table III, the fits give P π
µ ξ = 1.0025 ± 0.0004(stat).As explained in Sect. VII A, the systematic uncertain-ties important to the measure of P π
µ ξ were not revisitedduring this analysis, and this value should not be con-sidered a revised measurement. When differences in the
13
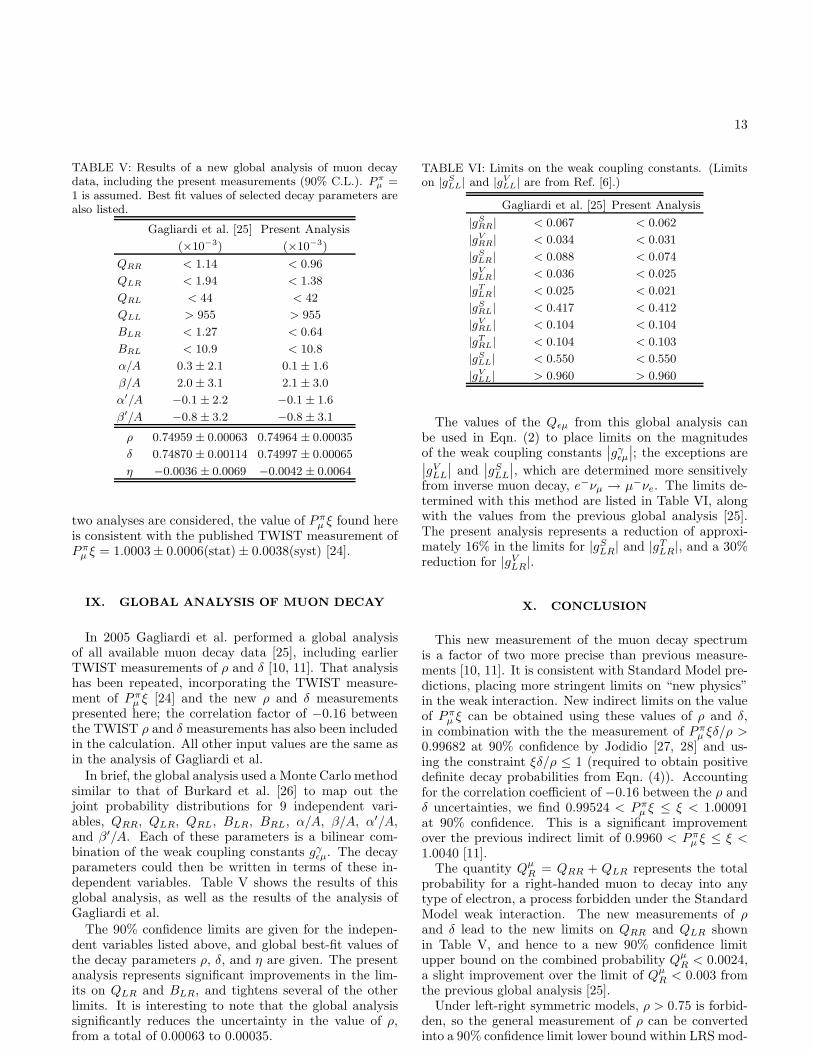
TABLE V: Results of a new global analysis of muon decaydata, including the present measurements (90% C.L.). P π
µ =1 is assumed. Best fit values of selected decay parameters arealso listed.
Gagliardi et al. [25] Present Analysis
(×10−3) (×10−3)
QRR < 1.14 < 0.96
QLR < 1.94 < 1.38
QRL < 44 < 42
QLL > 955 > 955
BLR < 1.27 < 0.64
BRL < 10.9 < 10.8
α/A 0.3 ± 2.1 0.1 ± 1.6
β/A 2.0 ± 3.1 2.1 ± 3.0
α′/A −0.1 ± 2.2 −0.1 ± 1.6
β′/A −0.8 ± 3.2 −0.8 ± 3.1
ρ 0.74959 ± 0.00063 0.74964 ± 0.00035
δ 0.74870 ± 0.00114 0.74997 ± 0.00065
η −0.0036 ± 0.0069 −0.0042 ± 0.0064
two analyses are considered, the value of P πµ ξ found here
is consistent with the published TWIST measurement ofP π
µ ξ = 1.0003± 0.0006(stat) ± 0.0038(syst) [24].
IX. GLOBAL ANALYSIS OF MUON DECAY
In 2005 Gagliardi et al. performed a global analysisof all available muon decay data [25], including earlierTWIST measurements of ρ and δ [10, 11]. That analysishas been repeated, incorporating the TWIST measure-ment of P π
µ ξ [24] and the new ρ and δ measurementspresented here; the correlation factor of −0.16 betweenthe TWIST ρ and δ measurements has also been includedin the calculation. All other input values are the same asin the analysis of Gagliardi et al.
In brief, the global analysis used a Monte Carlo methodsimilar to that of Burkard et al. [26] to map out thejoint probability distributions for 9 independent vari-ables, QRR, QLR, QRL, BLR, BRL, α/A, β/A, α′/A,and β′/A. Each of these parameters is a bilinear com-bination of the weak coupling constants gγ
ǫµ. The decayparameters could then be written in terms of these in-dependent variables. Table V shows the results of thisglobal analysis, as well as the results of the analysis ofGagliardi et al.
The 90% confidence limits are given for the indepen-dent variables listed above, and global best-fit values ofthe decay parameters ρ, δ, and η are given. The presentanalysis represents significant improvements in the lim-its on QLR and BLR, and tightens several of the otherlimits. It is interesting to note that the global analysissignificantly reduces the uncertainty in the value of ρ,from a total of 0.00063 to 0.00035.
TABLE VI: Limits on the weak coupling constants. (Limitson |gS
LL| and |gVLL| are from Ref. [6].)
Gagliardi et al. [25] Present Analysis
|gSRR| < 0.067 < 0.062
|gVRR| < 0.034 < 0.031
|gSLR| < 0.088 < 0.074
|gVLR| < 0.036 < 0.025
|gTLR| < 0.025 < 0.021
|gSRL| < 0.417 < 0.412
|gVRL| < 0.104 < 0.104
|gTRL| < 0.104 < 0.103
|gSLL| < 0.550 < 0.550
|gVLL| > 0.960 > 0.960
The values of the Qǫµ from this global analysis canbe used in Eqn. (2) to place limits on the magnitudesof the weak coupling constants
∣
∣gγǫµ
∣
∣; the exceptions are∣
∣gVLL
∣
∣ and∣
∣gSLL
∣
∣, which are determined more sensitivelyfrom inverse muon decay, e−νµ → µ−νe. The limits de-termined with this method are listed in Table VI, alongwith the values from the previous global analysis [25].The present analysis represents a reduction of approxi-mately 16% in the limits for |gS
LR| and |gTLR|, and a 30%
reduction for |gVLR|.
X. CONCLUSION
This new measurement of the muon decay spectrumis a factor of two more precise than previous measure-ments [10, 11]. It is consistent with Standard Model pre-dictions, placing more stringent limits on “new physics”in the weak interaction. New indirect limits on the valueof P π
µ ξ can be obtained using these values of ρ and δ,in combination with the the measurement of P π
µ ξδ/ρ >0.99682 at 90% confidence by Jodidio [27, 28] and us-ing the constraint ξδ/ρ ≤ 1 (required to obtain positivedefinite decay probabilities from Eqn. (4)). Accountingfor the correlation coefficient of −0.16 between the ρ andδ uncertainties, we find 0.99524 < P π
µ ξ ≤ ξ < 1.00091at 90% confidence. This is a significant improvementover the previous indirect limit of 0.9960 < P π
µ ξ ≤ ξ <1.0040 [11].
The quantity QµR = QRR + QLR represents the total
probability for a right-handed muon to decay into anytype of electron, a process forbidden under the StandardModel weak interaction. The new measurements of ρand δ lead to the new limits on QRR and QLR shownin Table V, and hence to a new 90% confidence limitupper bound on the combined probability Qµ
R < 0.0024,a slight improvement over the limit of Qµ
R < 0.003 fromthe previous global analysis [25].
Under left-right symmetric models, ρ > 0.75 is forbid-den, so the general measurement of ρ can be convertedinto a 90% confidence limit lower bound within LRS mod-
14
els: ρ > 0.7493 (compared with ρ > 0.7487 from the ρmeasurement previously published by TWIST). The re-lation ρ ≃ 3
4(1 − 2ζ2
g ) then gives a 90% confidence limitof |ζg| < 0.022, a significant improvement over the limitof |ζg| < 0.030 for the previously published TWIST valueof ρ.
The final phase of TWIST is in progress. Additionaldata are in hand, taken in 2006 and 2007, and new anal-ysis is underway. Further improvements to the simula-tion and analysis are being implemented, including theuse of measured drift time tables and improved track re-construction algorithms, and the resulting better agree-ment in the momentum resolution between simulationand data. These improvements are expected to lead toadditional factor-of-two reductions in the uncertaintieson ρ and δ, providing another incremental improvement
to searches for new physics.
We would like to thank C.A. Ballard, S. Chan,J. Doornbos, B. Evans, M. Goyette, D. Maas, J.A. Mac-donald (deceased), T.A. Porcelli, N.L. Rodning (de-ceased), J. Schaapman, G. Stinson, V.D. Torokhov,M.A. Vasiliev, and the many undergraduate studentswho contributed to the construction and operation ofTWIST. We also acknowledge many contributions byother professional and technical staff members from TRI-UMF and collaborating institutions. This work was sup-ported in part by the Natural Science and EngineeringResearch Council of Canada and the National ResearchCouncil of Canada, the Russian Ministry of Science, andthe U.S. Department of Energy. Computing resources forthe analysis were provided by WestGrid.
[1] W. Fetscher, H.-J. Gerber, and K. Johnson, Phys. Lett.B 173, 102 (1986).
[2] W. Fetscher and H.-J. Gerber, in [6].[3] L. Michel, Proc. Phys. Soc. A 63, 514, 1371 (1950).[4] C. Bouchiat and L. Michel, Phys. Rev. 106, 170 (1957).[5] T. Kinoshita and A. Sirlin, Phys. Rev. 108, 844 (1957).[6] W.-M. Yao et al., J. Phys. G 33 (2006).[7] A. Davydychev, K. Schilcher, and H. Spiesberger, Eur.
Phys. J. C 19, 99 (2001).[8] P. Herczeg, Phys. Rev. D 34, 3449 (1986).[9] S. Profumo, M. Ramsey-Musolf, and S. Tulin, Phys. Rev.
D 75, 075017 (2007).[10] J. Musser et al. (TWIST Collaboration), Phys. Rev. Lett.
94, 101805 (2005).[11] A. Gaponenko et al. (TWIST Collaboration), Phys. Rev.
D 71, 071101(R) (2005).[12] C. Oram, J. Warren, G. Marshall, and J. Doornbos, Nucl.
Instrum. Methods 179, 99 (1981).[13] R. Henderson et al., Nucl. Instrum. Methods A 548, 306
(2005).[14] J. Hu et al., Nucl. Instrum. Methods A 566, 563 (2006).[15] Y. Davydov et al., Nucl. Instrum. Methods A 461, 68
(2001).[16] Vector Fields Ltd., Computer code OPERA-3d (2002).
[17] The TWIST Data Acquisition System at TRIUMF (Mon-treal, QC, 2003), TRIUMF preprint TRI-PP-04-16 (un-published).
[18] R. Veenhof, GARFIELD: Simulation of gaseous detec-
tors, CERN (2003), version 7.10, CERN program Librarylong writeup W5050 (unpublished).
[19] A. Arbuzov, Phys. Lett. B 524, 99 (2002).[20] A. Arbuzov, A. Czarnecki, and A. Gaponenko, Phys.
Rev. D 65, 113006 (2002).[21] A. Arbuzov and K. Melnikov, Phys. Rev. D 66, 093003
(2002).[22] C. Anastasiou, K. Melnikov, and F. Petriello, J. High
Energy Phys. 09, 014 (2007).[23] G. Lutz, Nucl. Instrum. Methods A 273, 349 (1988).[24] B. Jamieson et al. (TWIST Collaboration), Phys. Rev.
D 74, 072007 (2006).[25] C. Gagliardi, R. Tribble, and N. Williams, Phys. Rev. D
72, 073002 (2005).[26] H. Burkard et al., Physics Letters B 160, 343 (1985).[27] A. Jodidio et al., Phys. Rev. D 34, 1967 (1986).[28] A. Jodidio et al., Phys. Rev. D 37, 237 (1988), erratum
to [27].


