Embed Size (px)
Citation preview

Technical Report #43
November 2020ISSN: 2653-3235

1
TABLE OF CONTENTS
1 EXECUTIVE SUMMARY .............................................................................................. 6
2 INTRODUCTION ........................................................................................................... 9
3 CONDUCT OF SURVEYS .......................................................................................... 11
3.1 1989-95 cohort............................................................................................................ 11
3.1.1 Pilot Survey 6 ............................................................................................... 11
3.1.2 Survey 6 ........................................................................................................ 12
3.2 1946-51 cohort............................................................................................................ 15
3.2.1 Main Survey 9 ............................................................................................... 15
3.3 1973-78 cohort............................................................................................................ 18
3.3.1 Pilot Survey 9 ............................................................................................... 18
3.4 1921-26 cohort............................................................................................................ 19
3.4.1 Six-Month Follow-up Survey 17 .................................................................. 19
3.4.2 Six Month Follow-up Survey 18 .................................................................. 20
3.5 COVID-19 Mini Surveys ............................................................................................. 25
4 MAINTENANCE OF COHORTS ................................................................................ 26
4.1 Introduction ................................................................................................................ 26
4.2 Update of sample and response rates ..................................................................... 26
4.2.1 First survey of the 1973-78, 1946-51 and 1921-26 cohorts in 1996. ........ 26
4.2.2 1973-78 cohort .............................................................................................. 27
4.2.3 1946-51 cohort .............................................................................................. 28
4.2.4 1921-26 cohort .............................................................................................. 29
4.2.5 Six-month follow-up surveys of the 1921-26 cohort ................................ 30
4.2.6 1989-95 cohort .............................................................................................. 31
4.3 Maintenance strategies ............................................................................................. 31
4.4 National Death Index ................................................................................................. 32
4.5 Cause of Death Codes ............................................................................................... 42
5 DATA LINKAGE ......................................................................................................... 44
5.1 ALSWH linked data holdings .................................................................................... 44
5.1.1 National collections ..................................................................................... 44
5.1.2 State and Territory collections ................................................................... 46
5.1.3 Derived datasets: Chronic conditions from multiple sources ................ 50

2
5.2 Data access procedures ........................................................................................... 50
5.2.1 Data user approvals ..................................................................................... 50
5.2.2 Access options ............................................................................................. 50
5.2.3 Data access conditions ............................................................................... 51
5.3 Use of linked data ...................................................................................................... 53
5.4 Legal and ethical considerations for health record linkage .................................. 53
5.4.1 Applicable legislation and guidelines ........................................................ 53
5.4.2 Consent status of ALSWH participants ..................................................... 55
5.4.3 Communicating with ALSWH participants about health record linkage .................................................................................................... 56
5.4.4 Current HREC approvals for health record linkage .................................. 56
6 ARCHIVING ................................................................................................................ 59
6.1 Archiving Notes ......................................................................................................... 59
7 METHODOLOGICAL ISSUES ................................................................................... 60
7.1 Creation of ADA-Accessed (Core) data ................................................................... 60
7.1.1 Differences between the ALSWH data and the ADA-Accessed (Core) data ......................................................................................................... 60
7.1.2 Items not included in the Core Dataset ..................................................... 60
7.1.3 Participant Status File ................................................................................. 62
7.1.4 Recoded variables ....................................................................................... 62
7.2 Validation of the ALSWH income management survey question ......................... 65
7.2.1 Income within the context of socioeconomic status ............................... 65
7.2.2 Ability to manage on available income ...................................................... 65
7.2.3 Financial resource questions under consideration ................................. 66
7.2.4 Surveys that measure financial resources and education ...................... 67
7.2.5 A note on the household income variable ................................................ 70
7.2.6 Missing data for financial resource and education variables ................. 71
7.2.7 Income management according to household income and stress about money .......................................................................................... 73
7.2.8 Spearman’s rank-order correlation coefficient ......................................... 75
7.2.9 Cronbach’s alpha and Zumbo’s ordinal alpha .......................................... 76
7.2.10 Conclusion .................................................................................................... 77
7.2.11 References .................................................................................................... 78

3
7.3 Comparison of the DASS-21 and GADS anxiety subscales in the 1973-78 cohort .......................................................................................................................... 79
7.3.1 Introduction .................................................................................................. 79
7.3.2 Internal validity of the DASS and GADS .................................................... 80
7.3.3 Correlation between DASS-21 anxiety and GADS anxiety subscales .... 81
7.3.4 Score thresholds .......................................................................................... 83
7.3.5 DASS-21 and GADS anxiety subscales as predictors/correlates of anxiety/mental health ............................................................................ 83
7.3.6 Summary ....................................................................................................... 84
7.3.7 References .................................................................................................... 85
7.4 Assessing agreement between the K10 and MHI-5 measures of psychological wellbeing ..................................................................................................................... 86
8 MAJOR REPORT: THE EFFECT OF MULTIPLE CHRONIC CONDITIONS – FINDINGS FROM THE AUSTRALIAN LONGITUDINAL STUDY ON WOMEN’S HEALTH .................................................................................... 87
8.1 Main findings and recommendations ...................................................................... 87
8.2 Conclusion ................................................................................................................. 92
9 DISSEMINATION OF STUDY FINDINGS .................................................................. 93
9.1 Publications ................................................................................................................ 93
9.2 Conference Presentations ...................................................................................... 105
9.3 Media ........................................................................................................................ 107
9.4 Social media ............................................................................................................. 114
9.5 Website ..................................................................................................................... 114
9.6 Newsletters ............................................................................................................... 114
10 COLLABORATIVE RESEARCH ACTIVITIES ......................................................... 116
10.1 Scientific meetings and teleconferences among the research team ................. 116
10.1.1 Management Committees ......................................................................... 116
10.1.2 Data Management Group .......................................................................... 119
Data Access Committee ......................................................................................... 120
10.2 Research projects .................................................................................................... 121
10.3 Substudies ................................................................................................................ 121
10.4 Student projects ...................................................................................................... 122
11 PROJECT STAFF ..................................................................................................... 123

4
LIST OF TABLES Table 3-1 Final response rates for the 1989-95 pilot cohort Survey 6 (N=493) ................... 11
Table 3-2 Actual distribution timetable for Survey 6 of the 1989-95 cohort .......................... 14
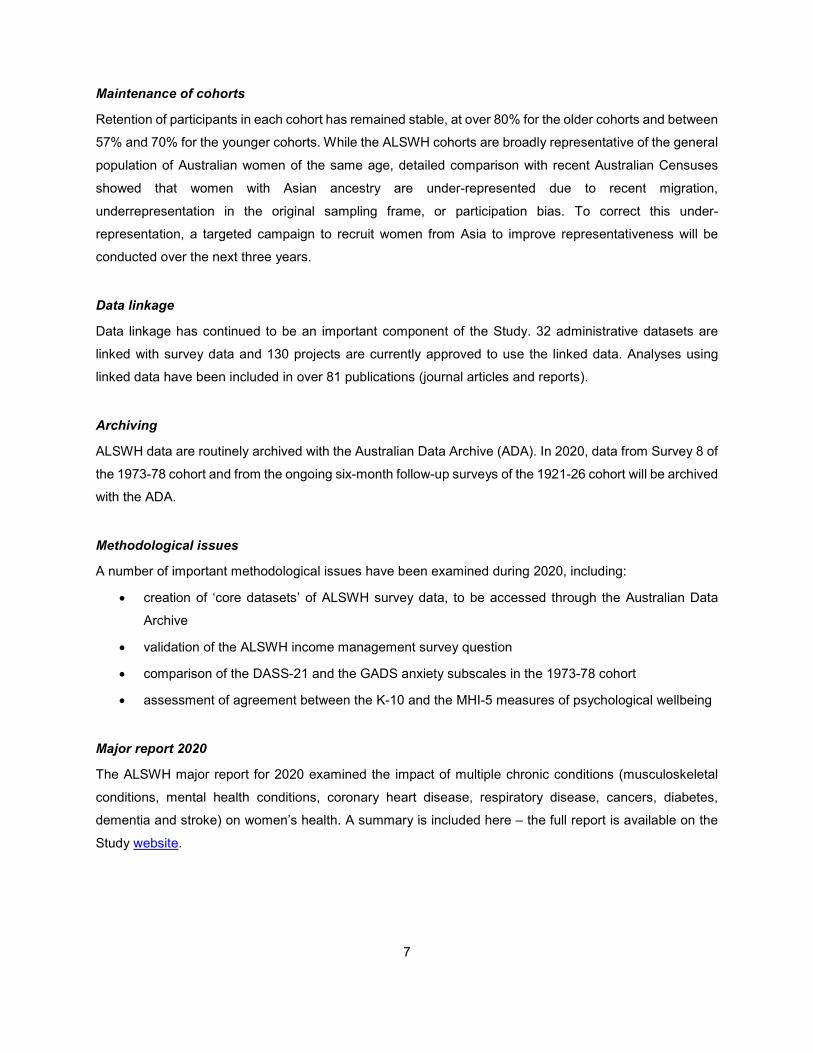
Table 3-3 Final response rates for the 1989-95 cohort Survey 6 (N=17,010) ...................... 15
Table 3-4 Timetable of activity for the 1946-51 cohort Survey 9 .......................................... 17
Table 3-5 Final response rates for the 1946-51 cohort Survey 9 (N=10,438) ...................... 18
Table 3-6 Timetable for Six Month Follow-Up Survey 17 ..................................................... 19
Table 3-7 Timetable for Six Month Follow-Up Survey 18 at 4 November 2020 ................... 20
Table 3-8 Response rates for six-monthly follow-up surveys at 4 November 2020 ............. 21
Table 4-1 Participation and retention of 14,247 women in the 1973-78 cohort of women
who were 18-23 years old at the first survey in 1996*.......................................... 27
Table 4-2 Participation and retention of 13,714 women in the 1946-51 cohort of women
who were 45-50 years old at the first survey in 1996*.......................................... 28
Table 4-3 Participation and retention of 12,432 women in the 1921-26 cohort of women
who were aged 70-75 years at Survey 1 in 1996* ................................................ 29
Table 4-4 Participation in 6-month follow up surveys of the 12,432 women in the 1921-
26 cohort (from November 2011 onwards)* ......................................................... 30
Table 4-5 Participation and retention of 17,010 women in the 1989-95 cohort of women
who were aged 18-23 years at Survey 1 in 2013* ................................................ 31
Table 4-6 Criteria for the clerical review passes ................................................................... 37
Table 4-7 Summary of National Death Index matching results ............................................ 37
Table 4-8 Summary of National Death Index matching results ............................................ 38
Table 4-9 Confirmed deaths with and without cause of death (COD) codes by year of
matching ............................................................................................................... 42
Table 5-1 ALSWH linked data holdings: National (at 31 October 2020) .............................. 44
Table 5-2 ALSWH linked data coverage: National (at 31 October 2020) ............................. 45
Table 5-3 ALSWH linked data coverage: Aged Care Programs (at 31 October 2020) ........ 45
Table 5-4 ALSWH linked data holdings: State/Territory (at 31 October 2020) ..................... 47
Table 5-5 ALSWH linked data coverage: State/Territory (at 31 October 2020) ................... 48
Table 5-6 Approval procedures for researchers and projects using linked health records .. 51
Table 5-7 Linked data use in approved ALSWH EoIs (at 25 August 2020) ......................... 53
Table 5-8 Health record linkage consent categories ............................................................ 55
Table 5-9 Health record linkage: Consent status of ALSWH participants (July 2020) ......... 56
Table 5-10 Health record linkage: Current HREC approvals .................................................. 57

5
Table 7-1 Summary of financial resource and education questions under consideration .... 67
Table 7-2 Inclusion of financial resource and education questions across cohorts and
surveys ................................................................................................................. 70
Table 7-3 Missing data (%) for financial resource and education questions ........................ 71
Table 7-4 Spearman’s correlation coefficients for income management and highest
qualification, household income and stress about money .................................... 76
Table 7-5 Cronbach's alpha and Zumbo’s ordinal alpha for conceptual financial
resources scale..................................................................................................... 77
Table 7-6 DASS-21 anxiety subscale as presented in the ALSWH ..................................... 79
Table 7-7 GADS anxiety subscale as presented in the ALSWH .......................................... 80
Table 7-8 Internal validity of the DASS-21 and GADS anxiety subscales in the ALSWH .... 81
Table 7-9 Percentage of DASS and GADs categorisations at each survey ......................... 83
Table 7-10 Comparisons of the DASS-21 and GADS anxiety subscales to other mental
health measures in the ALSWH ........................................................................... 84
Table 8-1 Most common pairings of chronic conditions for women in each ALSWH
cohort, at the time of their most recent survey. .................................................... 89
Table 9-1 ALSWH publications from November 2019 to November 2020 by research
theme. ................................................................................................................... 93
Table 9-2 ALSWH media from October 2019 – November 2020 ....................................... 108

6
1 EXECUTIVE SUMMARY
This report covers the period from December 2019 to November 2020. The purpose of the Australian
Longitudinal Study on Women’s Health (ALSWH) technical report is to document the annual operational
aspects of the ALSWH, as well as the progress and outcomes of the preceding year. Content includes data
collection procedures and materials; the outcomes of data collection procedures in terms of retention and
attrition (including that due to deaths) and cohort maintenance strategies used to mitigate attrition; reports
on data linkage and archiving activities; reports on methodological issues that have arisen and the
resolutions that were applied; the executive summary of the annual major report; summaries of
dissemination activities including publications, conference presentations and media; and information about
collaborations and staffing. This executive summary includes the main findings of each section of the report.
Introduction
This section introduces the ALSWH by briefly describing the four cohorts (born 1989-95, 1973-78,
1946-51, and 1921-26) and the aims of the study. The women who comprise the cohorts regularly complete
mailed or online surveys that ask about diverse aspects of health, wellbeing, life experiences and
demographics. The ALSWH has met all of the obligations and deliverables for the period December 2019
– November 2020 contained in the relevant contracts with the Department of Health.
Conduct of surveys
During this period, surveys have been conducted as follows:
• 1989-95 cohort: Survey 6 closed in August 2020. 14,939 women were emailed invitations to
participate and 8,349 women completed or partially completed the survey.
• 1973-78 cohort: Planning for Pilot Survey 9 began in July 2020, and deployment is expected before
the end of the year.
• 1946-51 cohort: Survey 9, which began in 2019, closed on 11 August 2020. 10,438 women were
invited to participate, and 7,958 women completed or partially completed the survey.
• 1921-26 cohort: Women in this cohort receive a survey every six months. The six-monthly follow-
up (6MF) surveys are conducted on a rolling basis, so that women receive a survey six months
after they have completed their previous survey. Thus, both the numerator and denominator of the
response rate are dynamic. The eighteenth round of survey distribution started in May 2020.
• COVID-19 mini-surveys: A series of short on-line surveys were sent to women in the 1989-95,
1973-78 and 1946-51 cohorts to track their health during the pandemic.
7
Maintenance of cohorts
Retention of participants in each cohort has remained stable, at over 80% for the older cohorts and between
57% and 70% for the younger cohorts. While the ALSWH cohorts are broadly representative of the general
population of Australian women of the same age, detailed comparison with recent Australian Censuses
showed that women with Asian ancestry are under-represented due to recent migration,
underrepresentation in the original sampling frame, or participation bias. To correct this under-
representation, a targeted campaign to recruit women from Asia to improve representativeness will be
conducted over the next three years.
Data linkage
Data linkage has continued to be an important component of the Study. 32 administrative datasets are
linked with survey data and 130 projects are currently approved to use the linked data. Analyses using
linked data have been included in over 81 publications (journal articles and reports).
Archiving
ALSWH data are routinely archived with the Australian Data Archive (ADA). In 2020, data from Survey 8 of
the 1973-78 cohort and from the ongoing six-month follow-up surveys of the 1921-26 cohort will be archived
with the ADA.
Methodological issues
A number of important methodological issues have been examined during 2020, including:
• creation of ‘core datasets’ of ALSWH survey data, to be accessed through the Australian Data
Archive
• validation of the ALSWH income management survey question
• comparison of the DASS-21 and the GADS anxiety subscales in the 1973-78 cohort
• assessment of agreement between the K-10 and the MHI-5 measures of psychological wellbeing
Major report 2020
The ALSWH major report for 2020 examined the impact of multiple chronic conditions (musculoskeletal
conditions, mental health conditions, coronary heart disease, respiratory disease, cancers, diabetes,
dementia and stroke) on women’s health. A summary is included here – the full report is available on the
Study website.

8
Dissemination of study findings
Since December 2019, 55 papers have been published in national and international scientific journals, and
28 presentations have been made to scientific and professional audiences both in Australia and
internationally. (Conference attendance in 2020 has been affected by COVID-19 restrictions). During the
year, the Study website has been updated regularly with new reports and published journal articles, and
new factsheets have been made available on the resources page. Social media continued to be used as a
communication tool. In addition to ongoing posts on Study outcomes, women’s health events and initiatives,
social media was used to inform participants and the general public of ALSWH activity during the COVID-
19 pandemic.
Collaborative research activities
Since December 2019, data access has been approved for 50 new research projects conducted by
researchers at institutions across Australia and overseas. Progress reports have been provided for existing
projects investigating the following topics:
- Chronic conditions (such as arthritis, cardiovascular conditions, cancer and diabetes)
- Health service use and systems
- Mental health
- Ageing and aged care
- Reproductive health
- Methodological issues
- Tobacco, alcohol and other drugs
- Medications
- Weight, nutrition and physical activity
- Social factors in health and well-being
- Caregiving
- Abuse
56 postgraduate students are currently working on aspects of the project.
Staff
ALSWH staff are located at the University of Newcastle and the University of Queensland. During 2020
over 30 individuals have been employed by ALSWH in casual, part-time, and full-time positions. All staff
are employed on fixed-term contracts with their respective universities and none are in tenured (ongoing)
positions. Positions are directly tied to the funding provided by the Department of Health.
9
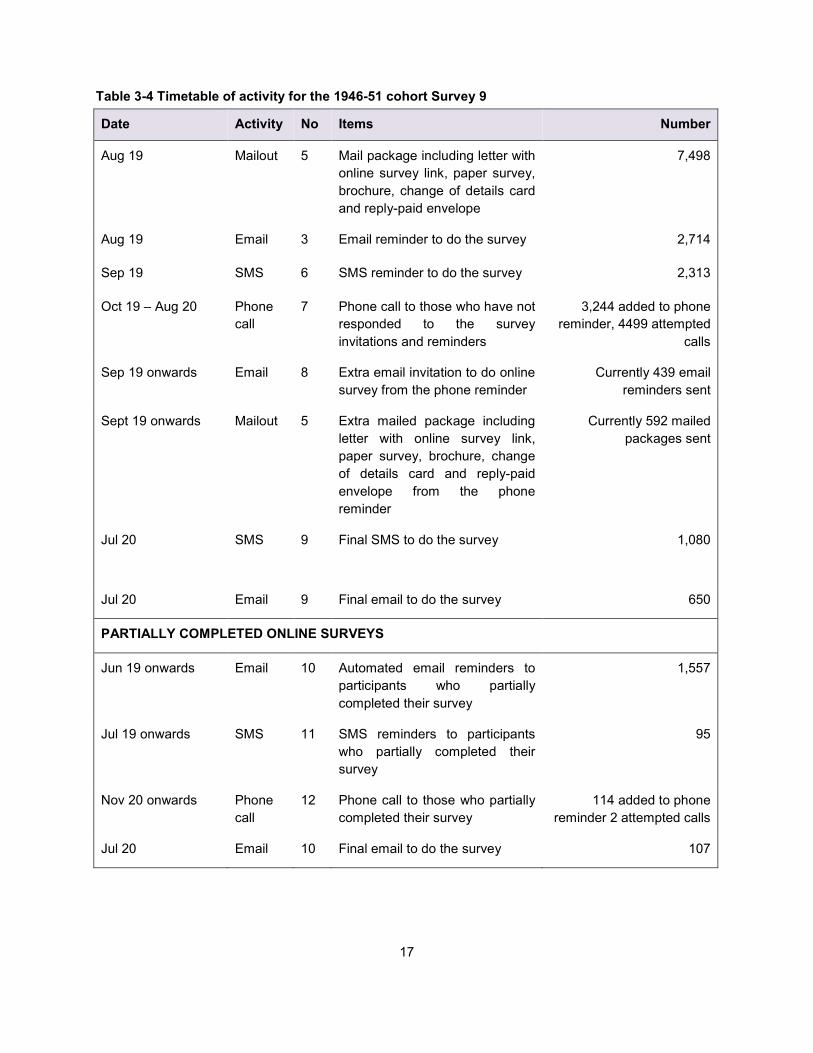
2 INTRODUCTION
The Australian Longitudinal Study on Women’s Health (ALSWH) is a longitudinal population-based survey
funded by the Australian Government Department of Health. The project began in 1996 and involves four
large, nationally representative cohorts of Australian women representing four generations:
• The 1989-95 cohort, aged 18 to 23 when first recruited in 2012/2013 (N = 17,015) and aged 25 to
31 in 2020
• The 1973-78 cohort, aged 18 to 23 years when first recruited in 1996 (N = 14,247) and aged 42 to
47 years in 2020
• The 1946-51 cohort, aged 45 to 50 years in 1996 (N = 13,716), aged 69 to 74 years in 2020
• The 1921-26 cohort, aged 70 to 75 years in 1996 (N = 12,432), aged 94 to 99 years in 2020
ALSWH takes a comprehensive view of all aspects of women’s health and aims to provide scientifically
valid information based on current, accurate data that are relevant to the development of health policy and
practice in women’s health. The surveys cover social and demographic variables, health behaviours,
diagnoses, symptoms, general measures of health, such as the Health Survey 36 Short Form (SF-36), and
access to, and use of, a range of health services. Survey data can be linked to administrative data on doctor
visits, pharmaceutical prescriptions, hospital admissions, aged care services, cancer registries and death
records.
Women participating in the Study have now been surveyed repeatedly over the past 24 years, providing a
large amount of data on their lifestyles, use of health services, and health outcomes. Continuing
participation is encouraged through regular newsletters, the Study website and social media, and
opportunities to participate in focused sub-studies and other activities.
This technical report (#43) has been provided by the University of Queensland and the University of
Newcastle as agreed in contracts between the Australian Government Department of Health and the two
universities. The report is presented in sections, with information on data collection and related activities
provided first, followed by details of how ALSWH data have been used during the year.
This report includes the following items, as required in contractual agreements with the Department of
Health:
• Sources and development of instruments used for data collection are included in Section 3:
Conduct of Surveys.
• Response rates are provided in Section 4: Maintenance of cohorts.

10
• Methodological issues relating to the surveys and data collection, as well as work relating to
reliability, validity, and statistical issues for all cohorts are included in Section 7: Methodological
Issues.
• Key new research findings for 2020 and details of dissemination activities, such as publications in
scientific journals and presentations at conferences during the year are found in Section 8: Major
Reports, and Section 9: Dissemination of Study Findings.
• Project materials and related items produced during 2020 are provided in a separate appendix.
All objectives, outcomes, and timeframes were met as required:
• Main Survey 6 of the 1989-95 cohort was completed.
• Planning for Pilot Survey 9 of the 1973-78 cohort began.
• Survey 9 of the 1946-51 cohort closed.
• The seventeenth wave of the six-monthly follow-up surveys of the 1921-26 cohort continued and
the eighteenth wave commenced in May.
• A total of 50 new research projects have been given approval to use ALSWH data. Results from
previously approved projects have been published in 55 peer reviewed scientific journal articles
and used in 28 conference presentations. Projects include analyses that:
o clarify the cause and effect relationship between women’s health and a range of biological,
psychological, social and lifestyle factors,
o assess the effects of changes in policy and practice,
o explore the factors that influence health among women who are broadly representative of
the entire Australian population,
o investigate all aspects of health throughout women’s lifespan,
o provide an evidence base of the development and evaluation of health policy and practice.
• An Annual Report for 2019 and a Major Report (examining the impact of multiple chronic conditions
on women’s’ health) were prepared for the Department of Health.
• The Data Access Committee oversaw access to linked data for: Medicare Benefits Schedule
(MBS)/Pharmaceutical Benefits Scheme (PBS) data, hospital admissions data, aged care data,
cancer data, perinatal data and emergency services data.
Note: Percentages used in this report may not add up to 100 due to rounding.

11
3 Conduct of surveys
In late 2019 and during 2020, survey activity was recorded for every ALSWH cohort. The 1989-95 cohort
main Survey 6 was conducted and finalised and details are included in Section 3.1. The 1946-51 cohort
main Survey 9 was conducted and finalised, and details are described in Section 3.2. The pilot survey for
the 1973-78 cohort was planned, and details of these activities are in Section 3.3. For the 1921-26 cohort,
the seventeenth and eighteenth six-monthly surveys were distributed (described in Section 3.4), and the
nineteenth six-monthly survey will be distributed in November 2020. In early 2020, in response to the
COVID-19 pandemic, fortnightly short online surveys were administered to women in the 1989-95, 1973-
78 and 1946-51 cohorts who had email addresses. A brief outline of the COVID-19 mini surveys is included
in Section 3.5.
3.1 1989-95 cohort
3.1.1 Pilot Survey 6
Planning and development of the 1989-95 cohort Pilot Survey 6 is described in Technical Report 42. Data
collection for this survey closed at 5pm 6th December 2019.
Table 3-1 Final response rates for the 1989-95 pilot cohort Survey 6 (N=493)
Outcome N (%)
Completed online survey 260 53
Complete online survey – after cut-off 2 0 Partially completed online survey 29 6
Withdrawn 2 0
Not this time 7 2 No response
146 30
Withdrawn or Deceased prior to survey launch 47 9
Total 493 100

12
3.1.2 Survey 6
Planning and development of 1989-95 cohort Survey 6 are described in Technical Report 42. Data
collection for Survey 6 closed at the end of August 2020.
• Incentives
The major prize draw as detailed in Technical Report 42 was drawn on 13 December 2019. In 2020, an
additional incentive was offered to participants who had not responded by June. For completion of the
survey between 15 June 2020 and 16 August 2020, participants were eligible to win one $1,000 PrezeeTM
gift card. The prize was drawn and awarded on 19 August 2020.
• Distribution
The reminder protocol for this survey is shown in Figure 3-1. The actual distribution of correspondence with
participants is shown in Figure 3-1 1989-95 main cohort Survey 6 reminder protocol.
Table 3-2.

13
Figure 3-1 1989-95 main cohort Survey 6 reminder protocol.

14
Table 3-2 Actual distribution timetable for Survey 6 of the 1989-95 cohort
Date Activity No Items Number Sent
30 May 2019 Email 1 Email invitation 14,574
3 Jun 2019 Mail 2 Invitation letter to those without email 361
14 Jun 2019 SMS 3 SMS reminder 9,286
25 Jun 2019 Mail 4 Reminder letter 10,162
10 Jul 2019 Email 5 Reminder email to support mail 10,275
31 Jul 2019 SMS 6 SMS reminder 7,357
Sep 2019 to Aug 2020 Phone 7 Phone reminder 12,184
attempted calls
Aug 2019 to Aug 2020 Email 8 Email follow-up after phone call 2,006
20 Nov 2019 Email 10 Email reminder - upcoming prize draw 8,521
29 Nov 2019 Email 10 Email reminder - upcoming prize draw 6,273
15 Jun 2020 Email 10 Email notifying participants of 2nd major prize draw 6,765
22 Jun 2020 SMS 9 SMS - 2nd major prize draw 4,292
7 Aug 2020 Email 10 Email reminder - upcoming prize draw 5,965
14 Aug 2020 SMS 9 Final SMS - 2nd major prize draw 4,158
May 2019 to Aug 2020 Email 11 Email reminder to complete survey 3,687
June 2019 to Aug 2020 SMS 12 SMS reminder to complete survey 650
July 2020 to Aug 2020 Phone call 13 Phone reminder to complete survey
713 attempted
calls
12 Aug 2020 Email 15 Email reminder to those who haven’t completed the survey regarding upcoming prize draw
371
15
Table 3-3 Final response rates for the 1989-95 cohort Survey 6 (N=17,010)
Outcome N (%) Completed online survey 7,926 53
Partially completed online survey 423 3
Deceased 2 0
Withdrawn 236 1
Not this time 316 2 No response
6,036
41
Survey Total 14,939 100 Withdrawn or Deceased prior to survey launch 2,071
Cohort Total 17,010
3.2 1946-51 cohort
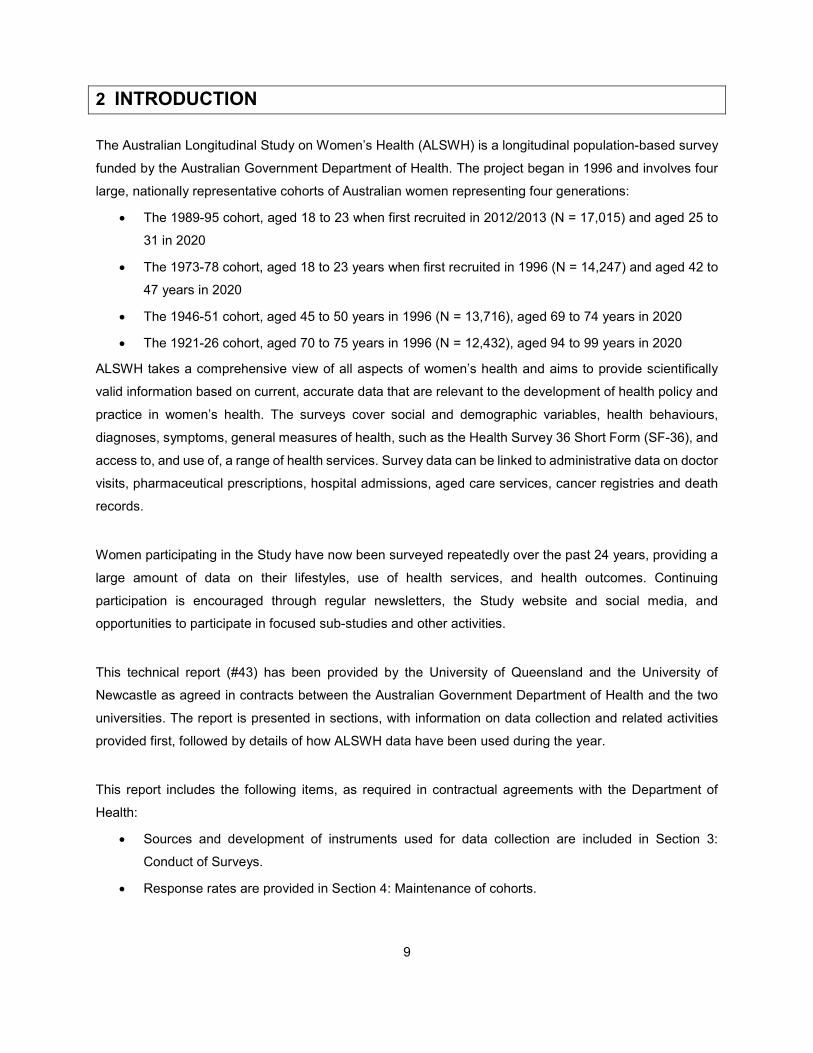
3.2.1 Main Survey 9
• Finalisation
Planning, development, mailout and data collection of the 1946-51 cohort Survey 9 was previously
described in Technical Report 42 (2019).
The online survey closed on 5 August 2020, but paper surveys continued to be received until 11 August
2020. The reminder protocol for this survey is shown in Figure 3-2. The numbers and dates of reminders
and other activity for this survey which occurred in the period August 2019 to July 2020 are detailed in Table
3-4.

16
Figure 3-2 1946-51 main cohort Survey 9 reminder protocol.
.
17
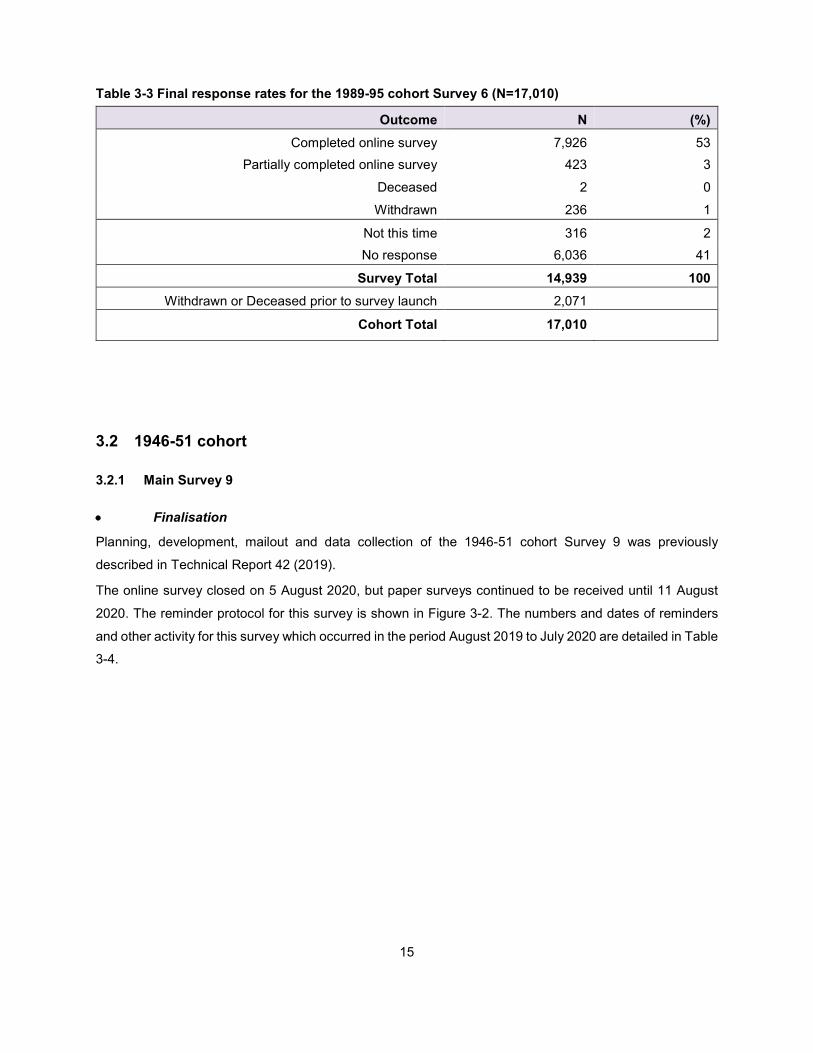
Table 3-4 Timetable of activity for the 1946-51 cohort Survey 9
Date Activity No Items Number
Aug 19 Mailout 5 Mail package including letter with online survey link, paper survey, brochure, change of details card and reply-paid envelope
7,498
Aug 19 Email 3 Email reminder to do the survey 2,714
Sep 19 SMS 6 SMS reminder to do the survey 2,313
Oct 19 – Aug 20 Phone call
7 Phone call to those who have not responded to the survey invitations and reminders
3,244 added to phone reminder, 4499 attempted
calls
Sep 19 onwards Email 8 Extra email invitation to do online survey from the phone reminder
Currently 439 email reminders sent
Sept 19 onwards Mailout 5 Extra mailed package including letter with online survey link, paper survey, brochure, change of details card and reply-paid envelope from the phone reminder
Currently 592 mailed packages sent
Jul 20 SMS 9 Final SMS to do the survey 1,080
Jul 20 Email 9 Final email to do the survey 650
PARTIALLY COMPLETED ONLINE SURVEYS
Jun 19 onwards Email 10 Automated email reminders to participants who partially completed their survey
1,557
Jul 19 onwards SMS 11 SMS reminders to participants who partially completed their survey
95
Nov 20 onwards Phone call
12 Phone call to those who partially completed their survey
114 added to phone reminder 2 attempted calls
Jul 20 Email 10 Final email to do the survey 107

18
Email and SMS reminders were sent to participants, who had not started the survey and to those who had
started the survey but had not completed it, before the phone reminder commenced.
3,244 participants were included in the telephone reminder. Project assistants attempted to call each
participant. 4,499 attempted calls were made. From these, 1,101 participants were spoken to, 148 (13%)
withdrew, 113 (10%) did not want to do the survey this time, one said that they would not do the survey but
partially completed it, and 839 (76%) said that they would do the survey - but only 412 (49%) of these
completed the survey, 18 (2%) started the survey, and 409 (49%) did not start the survey.
439 extra email invitations and 592 mailed survey packages were sent to those requesting these through
the telephone reminders.
A final SMS and a final email reminder were sent to all participants who had not started or completed their
survey advising them that the survey was about to close.
Overall, 10,438 participants were invited to complete Survey 9 online or on paper. Completed surveys were
received from 7,844 women (75% of those invited), while another 114 (1%) partially completed their online
survey. Of the 7,958 who attempted the survey, 3,459 (43%) returned an online survey, and 4,498 (57%)
completed a paper survey. Table 3-5 details the final response rates.
Table 3-5 Final response rates for the 1946-51 cohort Survey 9 (N=10,438)
N (%) Completed online survey 3,347 32 Partially completed online survey 112 1
Completed paper survey 4,496 43 Partially completed paper survey 2 0
Completed telephone survey 1 0
Deceased 61 1 Withdrawn 240 2
Not this time 145
1
No response
2,034
20
Total 10,438 100
3.3 1973-78 cohort
3.3.1 Pilot Survey 9
• Planning and Development
Preparation for Pilot Survey 9 of the 1973-78 cohort began in July 2020. Frequencies, evaluation question
responses and comments from 1973-78 cohort Survey 8 were reviewed, and recommendations for
changes, additions and deletions to the survey were proposed. A discussion board was set up on
19
SharePoint and items for discussion, change, additional items, and items for deletion were reviewed. A
second discussion board was set up and further items for addition, change and deletion were reviewed.
Final decisions on survey items were approved by the ALSWH Study Management Committee in August
2020. Approval from the Department of Health and the University of Newcastle Human Research Ethics
Committee will be applied for once the survey design is finalised, and will be ratified by the University of
Queensland Human Research Ethics Committee thereafter. Once ethics approvals are received, the online
survey will be launched, to be followed six weeks later by the mailing of the paper survey.
3.4 1921-26 cohort
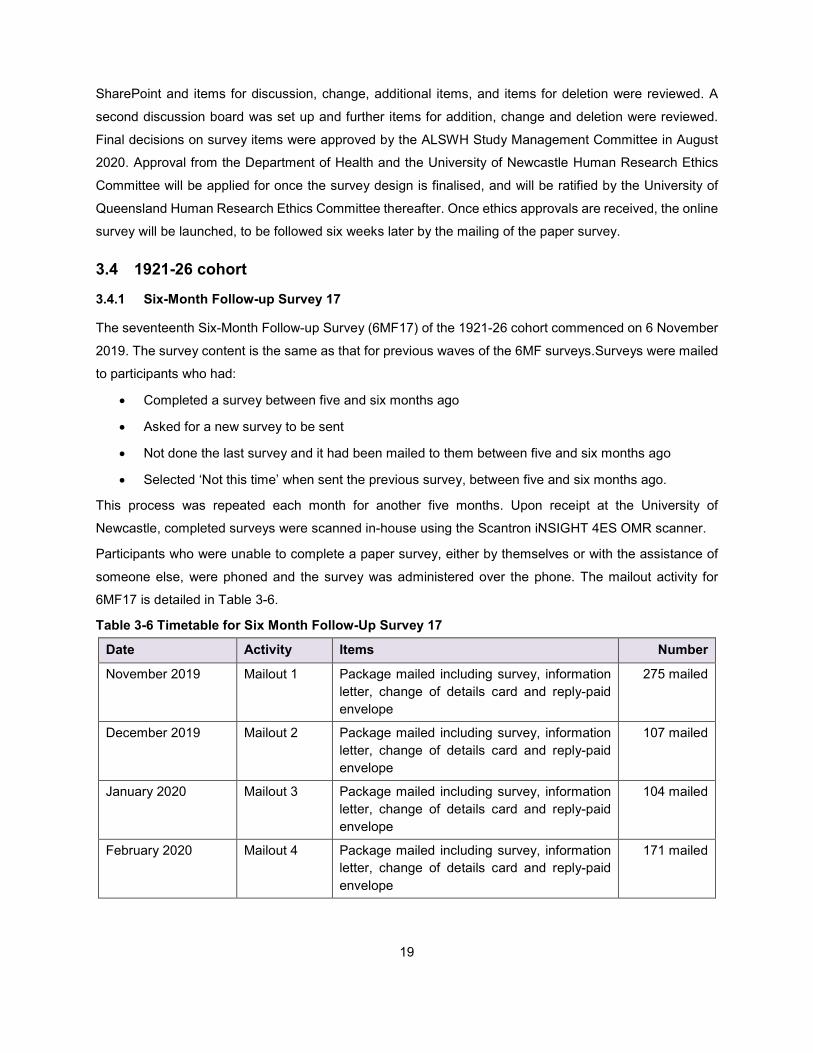
3.4.1 Six-Month Follow-up Survey 17
The seventeenth Six-Month Follow-up Survey (6MF17) of the 1921-26 cohort commenced on 6 November
2019. The survey content is the same as that for previous waves of the 6MF surveys.Surveys were mailed
to participants who had:
• Completed a survey between five and six months ago
• Asked for a new survey to be sent
• Not done the last survey and it had been mailed to them between five and six months ago
• Selected ‘Not this time’ when sent the previous survey, between five and six months ago.
This process was repeated each month for another five months. Upon receipt at the University of
Newcastle, completed surveys were scanned in-house using the Scantron iNSIGHT 4ES OMR scanner.
Participants who were unable to complete a paper survey, either by themselves or with the assistance of
someone else, were phoned and the survey was administered over the phone. The mailout activity for
6MF17 is detailed in Table 3-6.
Table 3-6 Timetable for Six Month Follow-Up Survey 17
Date Activity Items Number
November 2019 Mailout 1 Package mailed including survey, information letter, change of details card and reply-paid envelope
275 mailed
December 2019 Mailout 2 Package mailed including survey, information letter, change of details card and reply-paid envelope
107 mailed
January 2020 Mailout 3 Package mailed including survey, information letter, change of details card and reply-paid envelope
104 mailed
February 2020 Mailout 4 Package mailed including survey, information letter, change of details card and reply-paid envelope
171 mailed

20
Date Activity Items Number
March 2020 Mailout 5 Package mailed including survey, information letter, change of details card and reply-paid envelope
128 mailed
April 2020 Mailout 6 Package mailed including survey, information letter, change of details card and reply-paid envelope
83 mailed
November 2019 to April 2020
Phone call Telephone interview 24 completed
3.4.2 Six Month Follow-up Survey 18
The eighteenth Six-Month Follow-up Survey (6MF18) commenced on 5 May 2020. The survey content
remained the same as for previous 6MF surveys. Surveys were mailed in the same manner as for previous
6MF surveys, and the process will be repeated each month for six months, until the next round of follow-up
survey begins. Those unable to complete the survey on paper will be offered a telephone survey. The
mailout activity is detailed in Table 3-7.
Table 3-7 Timetable for Six Month Follow-Up Survey 18 at 4 November 2020
Date Activity Items Number
May 2020 Mailout 1 Package mailed including survey, information letter, change of details card and reply-paid envelope
219 mailed
June 2020 Mailout 2 Package mailed including survey, information letter, change of details card and reply-paid envelope
88 mailed
July 2020 Mailout 3 Package mailed including survey, information letter, change of details card and reply-paid envelope
104 mailed
August 2020 Mailout 4 Package mailed including survey, information letter, change of details card and reply-paid envelope
139 mailed
September 2020 Mailout 5 Package mailed including survey, information letter, change of details card and reply-paid envelope
163 mailed
October 2020 Mailout 6 Package mailed including survey, information letter, change of details card and reply-paid envelope
45 mailed
May to October Phone call Telephone interview to those unable to complete the survey by themselves
16 completed

21
Table 3-8 Response rates for six-monthly follow-up surveys at 4 November 2020 First Survey N %
Total Completed 3,855 82
Total Mailed 4,707 100
Second Survey N %
Total Completed 3,394 90
Total Mailed 3,781 100
Third Survey N %
Total Completed 2,993 90
Total Mailed 3,332 100
Fourth Survey N %
Total Completed 2,621 90
Total Mailed 2,915 100
Fifth Survey N %
Total Completed 2,306 90
Total Mailed 2,548 100
Sixth Survey N %
Total Completed 2,024 90
Total Mailed 2,259 100
Seventh Survey N %
Total Completed 1,770 89
Total Mailed 1,982 100

22
Eighth Survey N %
Total Completed 1,544 90
Total Mailed 1,715 100
Ninth Survey N %
Total Completed 1,364 91
Total Mailed 1,502 100
Tenth Survey N %
Total Completed 1,202 91
Total Mailed 1,328 100
Eleventh Survey N %
Total Completed 1,054 91
Total Mailed 1,163 100
Twelfth Survey N %
Total Completed 895 88
Total Mailed 1015 100
Thirteenth Survey N %
Total Completed 757 89
Total Mailed 852 100
Fourteenth Survey N %
Total Completed 643 93
Total Mailed 695 100
Fifteenth Survey N %
Total Completed 515 89
Total Mailed 578 100
Sixteenth Survey N %
Total Completed 406 91
Total Mailed 444 100
Seventeenth Survey N %
Total Completed 286 86
Total Mailed 331 100
Eighteenth Survey N %
Total Completed 150 75
Total Mailed 199 100

23
The responses for the 6MF surveys can also be shown graphically (Figure 3-3). The graph also shows
when the surveys have been returned – for example, the first survey (6MF Survey 1) began in Nov 2011
and some were still being returned in 2018, the second survey (6MF Survey 2) began in May 2012 and
similarly, some were still being returned in 2020, and so on. We would therefore expect numbers to continue
to increase for some of the more recent survey rounds. It should also be noted that mail outs for Survey 18
have not been completed at this time.

24
Figure 3-3 Number of completions for 1921-26 cohort six-month follow-up surveys 1 to 18, at 4 November 2020.
0
500
1000
1500
2000
2500
3000
3500
4000
4500
6MF1 6MF2 6MF3 6MF4 6MF5 6MF6 6MF7 6MF8 6MF9 6MF10 6MF11 6MF12 6MF13 6MF14 6MF15 6MF16 6MF17 6MF18
Num
ber o
f com
plet
ed s
urve
ys
Year survey was returned
Response rates for 6MF surveys
2011 2012 2013 2014 2015 2016 2017 2018 2019 2020

25
3.5 COVID-19 Mini Surveys
The advent of the COVID-19 pandemic has resulted in changes to every aspect of life, including
massive loss of employment, closure of schools, the movement of employment and education into the
home, cancellation of all public gatherings, and limitations on personal movement. The level of stress
experienced by the public has been demonstrated by panic purchasing and hoarding, and anti-social
behaviour. This impact has been counterbalanced by neighbours reaching out to one another,
innovative techniques used for social support, and the overall willingness of the community to
dramatically change the way life is lived in a short term. The impact on the individual and how this will
evolve over the course of 2020 is unknown. The long-term impact of COVID-19 and resultant life
changes is also unknown.
The COVID-19 mini surveys offer a very brief regular survey to women in the three youngest ALSWH
cohorts throughout the pandemic. The purpose of the mini surveys is to ascertain who has experienced
COVID-19, who has been tested (or not), their general health, stress level, and the impact of COVID-
19 on their lives. Each mini survey will also focus on an additional topic of interest. The purpose of
collecting these data is to ascertain changes in wellbeing as the pandemic, and responses to it, evolve.
The collected data will permit tracking of wellbeing over the short-term, and will also allow for in depth
analyses in the years that follow the pandemic. By collecting minimal data now, recall bias regarding
the pandemic is avoided in the future.
Over the period 29 April 2020 to mid-October 2020, 14 COVID-19 mini surveys have been administered
to participants in the 1946-51 main, 1973-78 main, and 1989-95 main and pilot cohorts who had a valid
email address. Detailed activity for the COVID-19 mini surveys will be reported in the 2021 Technical
Report.
The COVID-19 mini surveys were funded independently of core ALSWH activities.
26
4 Maintenance of cohorts
4.1 Introduction
This section provides updates on retention of participants in each of the ALSWH cohorts. Maintenance
strategies, including updating of the National Death Index, are also outlined.
4.2 Update of sample and response rates
4.2.1 First survey of the 1973-78, 1946-51 and 1921-26 cohorts in 1996.
More than 40,000 women responded to the first survey of the original ALSWH cohorts in 1996. Due to
uncertainties about the accuracy of the Medicare database (which was used as the sampling frame for
the stratified random samples), response rates for this first survey cannot be exactly specified. However,
it is estimated that 41-42% of the 1973-78 cohort, 53-56% of the 1946-51 cohort and 37-40% of the
1921-26 cohort responded to the initial invitation to participate. (Brown WJ, Dobson AJ, Bryson L, &
Byles JE, Women's Health Australia: On the progress of the main cohort studies. Journal of Women's
Health & Gender-Based Medicine, 1999; 8(5): 681-688). Confidentiality restrictions meant that the
names of the selected women were unknown to researchers and usual methods of encouraging
participation (e.g., by telephone) could not be used.
Some participants completed Survey 1 in 1996 and did not provide any contact details (532 women
from the 1973-78 cohort, 383 women from the 1946-52 cohort, and 508 women from the 1921-26
cohort). Also, a very small number of women have since alerted the study that they were not eligible by
their birth date, and they have been removed. Hence the numbers of women actually enrolled in the
study were 14,247 women in the 1973-78 cohort, 13,714 women in the 1946-51 cohort and 12,432
women in the 1921-26 cohort (Lee C, Dobson AJ, Brown WJ, Bryson L, Byles J, Warner-Smith P &
Young AF. (2005). Cohort Profile: the Australian Longitudinal Study on Women's Health. International
Journal of Epidemiology, 34(5), 987-991).

27
4.2.2 1973-78 cohort
Among the 1973-78 cohort, 69% responded to Survey 2 in 2000, 66% to Survey 3 in 2003, 68%
responded to Survey 4 in 2006, 62% to Survey 5 in 2009, 62% to Survey 6 in 2012, 57% responded to
Survey 7 in 2015, and 57% responded to Survey 8 in 2018 (See Table 4-1). This retention compares
well with other surveys of this highly mobile age group. The major reason for non-response among the
1973-78 cohort is that that the research team has been unable to contact the women (between 21%
and 33% of the cohort at subsequent surveys), despite using all possible methods of maintaining
contact. Women in their twenties and thirties are characterised by high levels of mobility, change of
surnames on marriage, often not having telephone listings, not being registered to vote, and making
extended trips outside Australia for work, education, or recreation. Despite these losses, modelling has
shown that there is no serious bias in estimates of associations between risk factors and health
outcomes in longitudinal models (Powers J & Loxton D. 2010, The impact of attrition in an 11-year
prospective longitudinal study of younger women. Annals of Epidemiology, 20(4), 318-321). The next
survey for this cohort will be deployed in 2021.
Table 4-1 Participation and retention of 14,247 women in the 1973-78 cohort of women who were 18-23 years old at the first survey in 1996*
Year Survey
(age range)
2000 Survey 2 (22-27)
2003 Survey 3 (25-30)
2006 Survey 4 (28-33)
2009 Survey 5 (31-36)
2012 Survey 6 (34-39)
2015 Survey 7 (37-42)
2018 Survey 8 (40-45)
Deceased 22 33 51 59 79 104 125
Frail 3 9 12 15 16 16 16
Withdrawn 230 518 800 951 1,157 1,436 1,671
TOTAL INELIGIBLE 255 560 863 1,025 1,252 1,556 1,812
Did not do survey 1,332 653 1,371 1,994 1,455 1,399 1,268
No contact 2,972 3,953 2,868 3,029 3,531 4,106 4,046
Respondent 9,688 9,081 9,145 8,199 8,009 7,186 7,121
TOTAL ELIGIBLE 13,992 13,687 13,384 13,222 12,995 12,691 12,435
RESPONSE RATE (%) 69.2% 66.3% 68.3% 62.0% 61.6% 56.6% 57.3%
*as at 23 November 2020

28
4.2.3 1946-51 cohort
Retention has been much higher among the 1946-51 cohort of women: 92% responded to Survey 2 in 1998, 85% responded to Survey 3 in 2001, Survey 4 in
2004 and Survey 5 in 2007, 83% responded to Survey 6 in 2010, 81% responded to Survey 7 in 2013, and 80% responded to Survey 8 in 2016 (See
Table 4-2). The major reason for non-response among the 1946-51 cohort has been that the research team has been unable to contact the women (6% to 13%
of eligible women between Survey 2 and Survey 8). The 9th survey was released to participants in 2019, and the survey closed at the end of August 2020.
Table 4-2 Participation and retention of 13,714 women in the 1946-51 cohort of women who were 45-50 years old at the first survey in 1996*
Year Survey
(age range)
1998 Survey 2 (47-52)
2001 Survey 3 (50-55)
2004 Survey 4 (53-58)
2007 Survey 5 (56-61)
2010 Survey 6 (59-64)
2013 Survey 7 (62-67)
2016 Survey 8 (65-70)
2019 Survey 9 (68-73)
Deceased 50 119 216 328 474 673 875 1,168
Frail 7 23 34 51 70 100 120 129
Withdrawn 209 424 622 870 1,108 1,651 2,003 2,084
TOTAL INELIGIBLE 266 566 872 1,249 1,652 2,424 2,998 3,381
Did not do survey 254 997 886 995 1,148 1,051 714 718
No contact 856 925 1,051 832 903 1,088 1,380 1,659
Respondent 12,338 11,226 10,905 10,638 10,011 9,151 8,622 7,956
TOTAL ELIGIBLE 13,448 13,148 12,842 12,465 12,062 11,290 10,716 10,333
RESPONSE RATE (%) 91.7% 85.4% 84.9% 85.3% 83.0% 81.1% 80.5% 77.0%
*as at 23 November 2020

29
4.2.4 1921-26 cohort
Of women from the 1921-26 cohort, 93% responded to Survey 2 in 1999, 88% to Survey 3 in 2002,
87% to Survey 4 in 2005, 81% to Survey 5 in 2008, and 81% to Survey 6 in 2011 (See Table 4-3). The
major reason for non-response among the 1921-26 cohort was the non-return of the questionnaire,
rising from 4% at Survey 2 to 17% at Survey 6, although up to 9% of participants could not be contacted.
Non-respondent women tended to report poorer self-rated health at Survey 1 than respondents. The
effects of these losses were evaluated in terms of losses due to death and non-death1. Brilleman and
colleagues concluded that non-death losses were potentially a greater source of bias than effects of
death.
Table 4-3 Participation and retention of 12,432 women in the 1921-26 cohort of women who were aged 70-75 years at Survey 1 in 1996*
Year Survey
(age range)
1999 Survey 2 (73-78)
2002 Survey 3 (76-81)
2005 Survey 4 (79-84)
2008 Survey 5 (82-87)
2011 Survey 6 (85-90)
Deceased 549 1,237 2,289 3,630 5,292
Frail 95 303 525 594 789
Withdrawn 563 1,090 1,359 1,368 1,338
TOTAL INELIGIBLE 1,207 2,630 4,173 5,592 7,419
Did not do survey 481 861 592 640 862
No contact 310 295 509 640 96
Respondent 10,434 8,646 7,158 5,560 4,055
TOTAL ELIGIBLE 11,225 9,802 8,259 6,840 5,013
RESPONSE RATE (%) 93.0% 88.2% 86.7% 81.3% 80.9%
*as at 7th August 2020
1Brilleman SL, Pachana NA & Dobson AJ. (2010). The impact of attrition on the representativeness of cohort
studies of older people. BMC Medical Research Methodology, 10. doi: 7110.1186/1471-2288-10-71).

30
4.2.5 Six-month follow-up surveys of the 1921-26 cohort
From November 2011, shorter surveys containing a set of core questions were mailed to the 1921-26
cohort every six months after the return of the previous survey. Table 4-4 shows the numbers of eligible
participants and respondents at the end of each six month period.
Table 4-4 Participation in 6-month follow up surveys of the 12,432 women in the 1921-26 cohort (from November 2011 onwards)
Wave #
6-Month follow-up
wave ending Deceased Withdrawn
Total ineligible
Non-
Respondent Respondent
Total eligible
Response rate (%)
1 30APR2012 5,543 2,324 7,867 1,182 3,430 4,612 74.4%
2 31OCT2012 5,938 2,353 8,291 885 3,303 4,188 78.9%
3 30APR2013 6,239 2,398 8,637 962 2,880 3,842 75.0%
4 31OCT2013 6,633 2,335 8,968 1,004 2,507 3,511 71.4%
5 30APR2014 6,960 2,282 9,242 1,089 2,148 3,237 66.4%
6 31OCT2014 7,301 2,169 9,470 1,016 1,993 3,009 66.3%
7 30APR2015 7,631 2,089 9,720 1,006 1,753 2,759 63.6%
8 31OCT2015 7,978 1,953 9,931 1,004 1,544 2,548 60.6%
9 30APR2016 8,279 1,859 10,138 956 1,385 2,341 59.2%
10 31OCT2016 8,609 1,724 10,333 879 1,267 2,146 59.1%
11 30APR2017 8,893 1,660 10,553 847 1,079 1,926 56.1%
12 31OCT2017 9,228 1,513 10,741 741 997 1,738 57.4%
13 30APR2018 9,472 1,430 10,902 682 895 1,577 56.8%
14 31OCT2018 9,769 1,291 11,060 636 783 1,419 55.2%
15 30APR2019 10,005 1,188 11,193 634 652 1,286 50.8%
16 31OCT2019 10,264 1,057 11,321 567 591 1,158 51.0%
17 30APR2020 10,342 1,072 11,414 566 499 1,065 46.8%
18* 31OCT2020* 10,377 1,104 11,481 586 412 998 41.3%
NOTE: 6MF questionnaires logged by 18 November 2020.
*this 6MF collection period is still open for respondents.

31
4.2.6 1989-95 cohort
In 2012 and 2013, 17,010 women aged 18-23 years old were enrolled in the 1989-95 cohort. Women
were mainly recruited using the internet and social media platforms. Consistent with the other cohorts,
women were required to have a Medicare card. Women completed the online survey and provided
consent to linkage of survey data with administrative databases such as Medicare.
Unlike the original cohorts, the 1989-95 cohort were surveyed annually through to 2017. There was a
steep decline in response at the cohort’s second survey in 2014 (down to 70% of respondents from the
baseline survey), but the response rate appears to have plateaued at around 55%-60% for subsequent
surveys (Table 4-5). The 6th survey was deployed in 2019, with survey closure planned for the end of
August 2020.
Table 4-5 Participation and retention of 17,010 women in the 1989-95 cohort of women who were aged 18-23 years at Survey 1 in 2013*
Year Survey
(age range)
2014 Survey 2 (19-24)
2015 Survey 3 (20-25)
2016 Survey 4 (21-26)
2017 Survey 5 (22-27)
Deceased 1 6 8 13
Frail 1 1 1 1
Withdrawn 681 694 1,744 1,943
TOTAL INELIGIBLE 683 701 1,753 1,957
Did not do survey 2,362 3,879 1,850 1,813
No contact 2,621 3,469 4,400 4,745
Respondent 11,344 8,961 9,007 8,495
TOTAL ELIGIBLE 16,327 16,309 15,257 15,053
RESPONSE RATE (%) 69.5% 54.9% 59.0% 56.4%
*as at 7th August 2020
4.3 Maintenance strategies
Cohort maintenance and tracking of ‘return to sender’ mail is ongoing. The office team continues to
track all women from the original three cohorts who responded to Survey 1 in 1996 and from the new
cohort of young women who responded to Survey 1 in 2012/13 and who are not known to have died or
withdrawn from the survey since then. This includes women who did not respond to Survey 2, through
to the latest survey for all cohorts. Participants for whom we have no current contact details remain in

32
the tracking system unless they are positively identified as found, deceased, withdrawn, permanently
emigrated or otherwise ineligible, or are unwilling to participate.
Before 2011 the Australian Electoral Commission (AEC) supplied the study with age range extracts of
women on the Electoral Roll. These were used to look up a participant’s residential and postal
addresses. The AEC stopped allowing this in 2011, although an electronic copy of the current Electoral
Roll is available for public inspection at any AEC office. This has resulted in a more time-consuming
tracking process. Despite this, the Electoral Roll has been found to be effective in tracking participants
who have become lost to contact. Participants found in this way are sent a survey or reminder for their
current or next survey by mail.
Secondary contacts, mobile phone numbers, and email addresses continue to be important in
reconnecting with participants who become lost to contact. Publicly available information, published on
various websites including White Pages, Facebook, Reverse Australia phone number listings, and
obituary notices assist in the process.
4.4 National Death Index
Participants in the study have been linked to the National Death Index (NDI) on an annual and,
sometimes, on a bi-annual basis to identify women who are recorded as being deceased. This not only
adds to information provided by family members, but also provides data on causes of death.
A list of 47,653 participants’ details, including unconfirmed deceased participants and participants who
have withdrawn from the project, was sent to AIHW in November 2019 for matching against the National
Death Index. Additional records with maiden names were not included on this occasion. A list of 1,871
unique record pairs were returned by AIHW in February 2020 for clerical review.
Each record pair comparison received a weight, ranging between 88.6 and 15.0, that reflects the quality
of the link: the higher the weight, the higher the quality (as determined by the linking algorithm).
In general, the main contribution to the weight is made by the names. There are two factors that
influence the weight that a name-pair contributes. The first is the frequency of the name in the portion
of the NDI selected. For example, a link of Jane to Jane receives far less weight (about 6.5) than a link
of Zipporah to itself (about 20) because the former is much more likely to occur by chance. The second
factor comes into play when the names are not the same. An algorithm is used to determine how ‘close’
the two names are. Names that are very similar receive almost the same weight as names that are
exactly the same. As the difference grows, the weight diminishes until it reaches a maximum
disagreement of about –10.
Day, month and year of birth also contribute to the weight. The agreement and disagreement weights
are not based on frequency and consider only exact agreement or disagreement on each field. In
passes where the DOB is used and an error is allowed to occur in the year value, a weight penalty of -

33
1 applies for each year that the pair’s DOBs disagree by. The last and smallest contribution to the weight
is for agreement or disagreement of sex1.
1. Australian Government, Australian Institute of Health and Welfare (AIHW), 2013. User-guide to
the NDI results file.

34
The record pairs can be divided into three regions – non-links (reject), possible links (review) and links
(accept). The majority of the clerical review will be done in the ‘possible links’ region. These three
regions are illustrated in Figure 4-1.
Figure 4-1 Idealised distribution of record pair comparison weights from a hypothetical linkage.
Quite often record pairs can be accepted or rejected from a certain weight onwards without having to
clerically review the records beyond a certain cut-off weight. For example, if all links below a weight cut-
off of 10 are to be rejected, a ‘lower weight bound’ of 10 can be applied to automatically reject any
record pairs below that weight. The same applies for records that can be accepted above a weight cut-
off of for example 25. An ‘upper weight bound’ of 25 can be applied to automatically accept all the record
pairs above a weight of 25.
Figure 4-2 shows a graph of the distribution of weights of record pairs in the clerical review file. In the
clerical review of the ALSWH record pairs an upper weight bound of 35 was used in the past to
automatically accept record pairs greater than or equal to this value, however it has been found
necessary to check those matches with a weight greater than or equal to 35 where the names, sex or
date of birth do not agree or if the date of death is before the date of last contact.
Record pair comparison weights
Matches
Non - Matches
LinksNon-LinksPossible
links

35
Figure 4-2 Distribution of weights of record pairs in the clerical review file.
The ALSWH record pairs were coded according to the closeness of the match of the ALSWH project
date of birth with the NDI date of birth and the closeness of the match of the project surname, first name
and middle name with those recorded on the NDI. Those with exactly matching date of birth and
surname, first name and middle name, and with a weight greater than or equal to 35 (Pass 1) were
taken as deceased (393 records). There were 3 records with exactly matching date of death and
surname, first name and middle name, and weight greater than or equal to 35 (Pass 2): these records
were taken as deceased. The 143 remaining records with a weight greater than or equal to 35 (Pass 3)
were checked and 135 were found to be deceased. The remainder were doubtful matches and were
not accepted. The one record with matching date of birth and date of death (Pass 4) were checked and
was confirmed as deceased. Records with the weight greater than 25 were checked (Pass 5) and 56
matches were confirmed as deceased. Further records where the first name, middle name and date of
birth matched with the weight greater than or equal to 20 (Pass 6) were checked and all 3 deceased
matches were rejected as doubtful matches. Records where the participant was known to be deceased
with a weight greater than or equal to 10 (Pass 7) were checked and one extra deceased match was
0
100
200
300
400
500
600
700
800
Freq
uenc
y
Weight
Distribution of record pair comparison weights

36
found. Records where the surname and the date of birth matched with a weight greater than or equal
to 15 (Pass 8) were checked and one matches was confirmed. Records where the last known participant
address matched the NDI record with a weight greater than 10 (Pass 9) were checked and one extra
match was identified. In cases where there was any doubt whether the deceased person was one of
the ALSWH participants the review pair was rejected. Each match accepted was checked to see if they
were an ALSWH known deceased participant or a new deceased participant. A table showing the
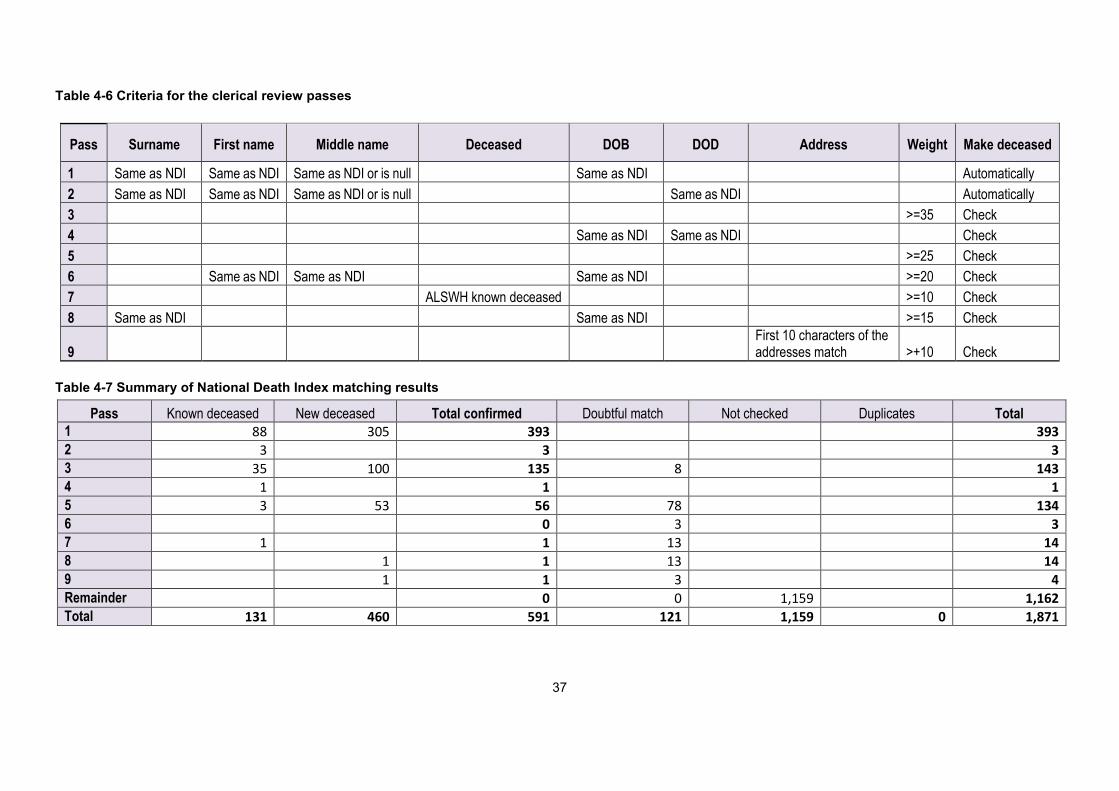
characteristics of each successive pass is shown in Table 4-6 and the results of each pass is shown in
Table 4-7.
37
Table 4-6 Criteria for the clerical review passes
Table 4-7 Summary of National Death Index matching results
Pass Known deceased New deceased Total confirmed Doubtful match Not checked Duplicates Total 1 88 305 393 393 2 3 3 3 3 35 100 135 8 143 4 1 1 1 5 3 53 56 78 134 6 0 3 3 7 1 1 13 14 8 1 1 13 14 9 1 1 3 4 Remainder 0 0 1,159 1,162 Total 131 460 591 121 1,159 0 1,871
Pass Surname First name Middle name Deceased DOB DOD Address Weight Make deceased
1 Same as NDI Same as NDI Same as NDI or is null Same as NDI Automatically 2 Same as NDI Same as NDI Same as NDI or is null Same as NDI Automatically 3 >=35 Check 4 Same as NDI Same as NDI Check 5 >=25 Check 6 Same as NDI Same as NDI Same as NDI >=20 Check 7 ALSWH known deceased >=10 Check 8 Same as NDI Same as NDI >=15 Check
9 First 10 characters of the addresses match >+10 Check

38
Of the 591 matches identified, 131 deaths ALSWH knew about, 145 were new notifications and 315
were notification of deaths of participants who had withdrawn (Table 4-8).
Table 4-8 Summary of National Death Index matching results
Confirmed deceased 131
New deceased 145
Withdrawn deceased 315
Doubtful match 121
Duplicate deceased record 0
Not checked 1,159
TOTAL 1,871
A total of 11,947 participant deaths had been identified at the time of the clerical review, this number
includes participants who have withdrawn (4,917). Four deaths occurred overseas and 67 other deaths
(0.6%) have never been confirmed with the NDI. Figure 4-3 shows the confirmed deaths by cohort –
the majority of the confirmed deaths occur in the 1921-26 cohort, with a few in the 1946-51 cohort, very
few in the 1973-78 cohort and even less in the 1989-95 cohort.

39
Figure 4-3 Number of confirmed deaths of ALSWH participants for each year by main cohort.
0
100
200
300
400
500
600
70019
9619
9719
9819
9920
0020
0120
0220
0320
0420
0520
0620
0720
0820
0920
1020
1120
1220
1320
1420
1520
1620
1720
1820
19
1921-26 cohort
1946-51 cohort
1973-78 cohort
1989-95 cohort

40
Figure 4-4 Number of matched deaths at each time matching has been conducted.
0
100
200
300
400
500
600
700
800
900
1000
2002 2004 2005 Nov2005
2006 2007 2008 2009 2010 2011 2012 2013 Mar2014
Nov2014
May2015
Dec2015
Feb2017
Feb2018
May2019
Mar2020
Year
ALSWHknowndeceasedparticipants
NDIidentifieddeceasedparticipants
NDIconfirmeddeceasedwithdrawnparticipants

41
Figure 4-5 Percentage of ALSWH known and unknown deaths confirmed by NDI at each time of matching.
0%
10%
20%
30%
40%
50%
60%
70%
80%
90%
100%
2002 2004 2005 Nov2005
2006 2007 2008 2009 2010 2011 2012 2013 Mar2014
Nov2014
May2015
Dec2015
Feb2017
Feb2018
May2019
Mar2020
Year
NDIidentifieddeceasedparticipantsALSWHknowndeceasedparticipants

42
Figure 4-6 Percentage of withdrawn participants who are known to be deceased at each time of matching.
4.5 Cause of Death Codes
Of the 11,876 deaths confirmed with NDI (including participants who have withdrawn) cause of death
(COD) codes are available for 10,611. There are 1,265 deaths for which there is currently no COD
information.
Table 4-9 Confirmed deaths with and without cause of death (COD) codes by year of matching Year of matching
Before 2013
2013 2014 2015 2016 2017 2018 2019 Total
No COD Code 18
1
7
5
2
670
562
1,265
COD Codes 6,688 592 1,015 722 813 731 21 29 10,611
Deceased 6,706 593 1,022 722 818 733 691 691 11,876
0%
10%
20%
30%
40%
50%
60%
70%
80%
90%
100%
Nov2005
2006 2007 2008 2009 2010 2011 2012 2013 Mar2014
Nov2014
May2015
Dec2015
Feb2017
Feb2018
May2019
Mar2020
Year
Withdrawnparticipants -statusunknown orunconfirmedWithdrawnparticipants -confirmeddeceased

43
There can be up to 19 causes of death. The first cause of death is the underlying cause of death. All
others are additional causes of death. Multiple cause of death coding was used from 1997 onwards.
The classification system used for causes of death depends on when the person died and when their
record was placed on the NDI. Those deaths that were registered in or before 1996 are recorded in
ICD-9, those registered in 1997 and 1998 are a combination of ICD-9 and ICD-10 and those registered
in 1999 and onwards are recorded in ICD-10.

44
5 Data linkage
ALSWH arranges and manages linkages with major national and state datasets. Each external dataset
has its own Data Custodian, and there is also one or more specific Human Research Ethics Committee
(HREC) in each jurisdiction. ALSWH submits applications at both levels, requesting approval to link
ALSWH data. If approval is granted, the linkage is conducted, data is extracted and the linked dataset
is stored with ALSWH, for integration with other datasets for approved analysis projects.
5.1 ALSWH linked data holdings
5.1.1 National collections
Current national linked data collections are listed in Table 5-1. The Australian Institute of Health and
Welfare (AIHW) performs data linkage for all national collections. MBS/PBS linkage is deterministic,
with AIHW holding the concordance file between ALSWH Participant IDs and Medicare PINS (Personal
Identification Numbers from the Medicare Consumer Directory, formerly the Medicare Enrolment File).
Due to AIHW’s recent development of the master linkage file for the National Integrated Health Services
Information (NIHSI) Analysis Asset, wherever possible, linkage for other national collections is now also
based on Medicare PINS. AIHW also perform the data extraction for all the collections listed below
(from 2029 this will include DVA). ALSWH aims to update national collections annually, except for aged
care data (due to the more complex nature of these data).
Table 5-1 ALSWH linked data holdings: National (at 31 October 2020)
Data linkage unit
Data custodian Collection name Abbreviation used in this Chapter
Australian Institute of Health and Welfare (AIHW)
Australian Government Department of Health
• Medicare Benefits Schedule MBS • Pharmaceutical Benefits Scheme1 PBS
Department of Veterans’ Affairs (DVA)
• Repatriation-MBS R-MBS • DVA Aged Care Programs DVA-AC
AIHW • National Aged Care Data Collection NACDC AIHW / State and Territory Death Registries
• National Death Index NDI • Cause of Death COD
AIHW / State and Territory Cancer Registries
• Australian Cancer Database Cancer
1 Includes DVA PBS records

45
Table 5-2 shows metadata for national collections, with aged care collections also detailed in Table 5-3. When considering data linkage results, it is important
to note that participants who decline health record linkage are excluded from linkage (with the exception of NDI). The total number of declined participants is
currently 1,871 (details of consent are reported in Section 5.4.2 and Table 5.9).
Table 5-2 ALSWH linked data coverage: National (at 31 October 2020)
Collection Update MM/YY
Coverage Records
N Women Total N
N by cohort from
MM/YY to
MM/YY 1921-26 1946-51 1973-78 1989-95
MBS 10/20 01/96 06/120 24,492,541 55,311 16,989 13,500 12,944 11,878
R-MBS 09/19 05/95 06/19 1,895,575 2,820 2,709 111 - -
PBS 10/20 05/02 06/20 13,589,883 53,581 16,915 13,086 12,700 10,880
CoD 04/20 05/96 12/17 10,324 10,324 9,238 958 116 12
Cancer 08/20 01/82 12/16 6,777 6,085 3,609 2,112 302 62
NACDC 05/17 * * 77,602 11,657 9,941 1,716 - -
DVA-AC 02/17 * * 26,484 2,321 2,289 32 - -
* Dates vary among component datasets, see next table for details
Table 5-3 ALSWH linked data coverage: Aged Care Programs (at 31 October 2020)
Program and content Coverage
Records N
Women Total N
N by cohort from
MM/YY to
MM/YY 1921-26 1946-51
ACAP (Aged Care Assessment Program) - assessments 07/03 06/14 19,158 6,806 6,598 208
ACFI (Aged Care Funding Instrument) - appraisals 08/03 12/14 7,829 3,615 3,552 63

46
Program and content Coverage
Records N
Women Total N
N by cohort from
MM/YY to
MM/YY 1921-26 1946-51
RCS (Resident Classification Scale) - appraisals 10/97 07/09 6,435 2,026 2,000 26
RAC (Residential Aged Care) – admission / discharge 10/97 08/15 14,125 6,035 5,909 126
RAC - Periods of leave 10/97 08/15 20,420 4,560 4,469 91
TCP (Transition Care Program) - Admission / discharge 04/06 07/14 850 690 661 29
HCP (Home Care Packages) - care level changes 08/13 06/15 385 383 364 19
HACC(Home and Community Care) - service provision 07/01 06/14 176,258 10,525 8,751 1,774
All events file (all NACDC programs) 05/97 09/15 77,602 11,657 9,941 1,716
DVA Veterans’ Home Care - assessments 01/01 01/17 23,671 2,075 2,046 29
DVA Veterans’ Home Care - service plans 01/01 01/17 26,484 2,021 1,992 29
DVA Community Nursing - treatment accounts 05/98 08/17 40,609 1,662 1,651 11
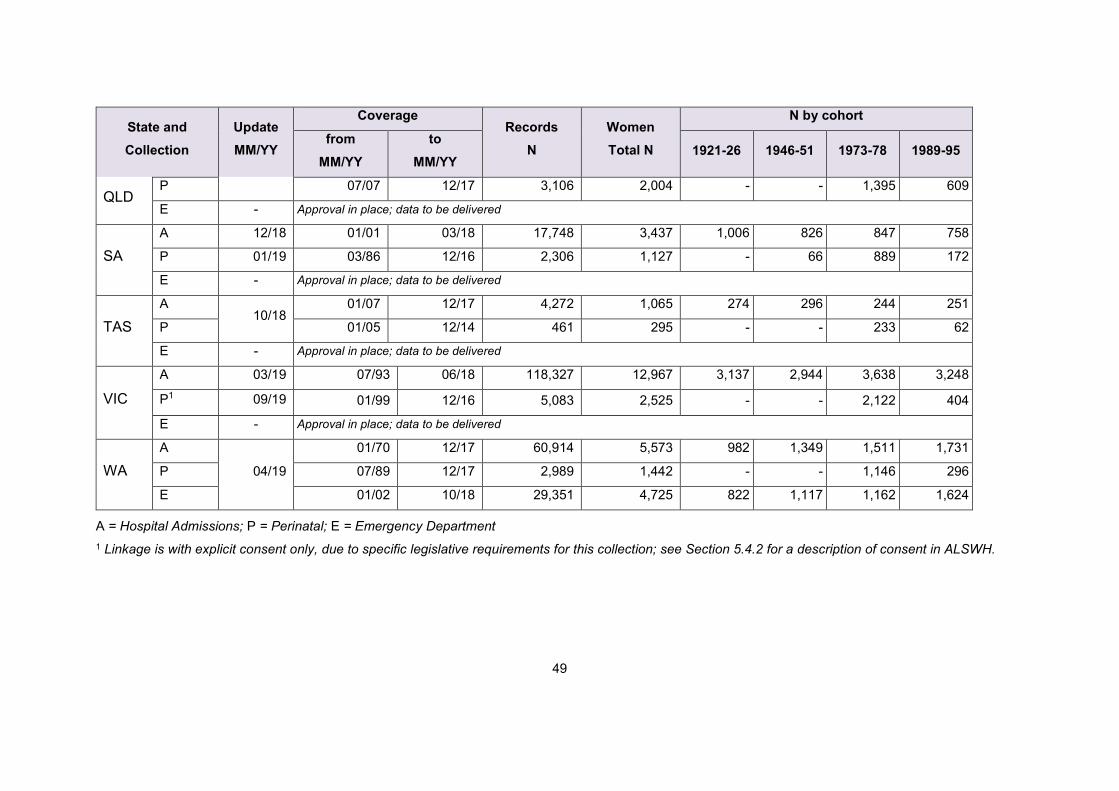
5.1.2 State and Territory collections
Current national linked data collections are listed in Table 5-4; coverage is shown in Table 5-5. State-based collections are be updated approximately every
two years. Probabilistic linkage is performed by designated Data Linkage Units for each jurisdiction, with data extracted by the relevant Department. Access to
South Australian, Northern Territory, Tasmanian and Victorian collections is facilitated by the Population Health Research Network (approvals for other
collections pre-date this facility). HREC and Data Custodian COVID-19 priorities have impacted timelines for some collections in 2020.

47
Table 5-4 ALSWH linked data holdings: State/Territory (at 31 October 2020) Data custodian Data linkage unit Collection Name
ACT Health Centre for Health Record Linkage (CHeReL) • ACT Admitted Patient Care
• ACT Emergency Department Data Collection
• ACT Perinatal Data Collection
NSW Ministry of Health CHeReL • NSW Admitted Patients Data Collection
• NSW Emergency Department Data Collection
• NSW Perinatal Data Collection
Queensland Health Statistical Services Branch • Queensland Hospital Admitted Patient Data Collection
• Queensland Emergency Department Collection
• Queensland Perinatal Data Collection
SA Department for Health
and Wellbeing
SA NT Datalink • SA Public Hospital Separations
• SA Public Hospital Emergency Department Data Collection
• SA Perinatal Statistics Data Collection
Northern Territory
Department of Health
SA NT Datalink • NT Public Hospital Inpatient Activity
• NT Public Hospital Emergency Department Data Collection
• NT Perinatal Trends Data Collection
Department of Health
Tasmania
Tasmanian Data Linkage Unit (TDLU) • Tasmanian Public Hospital Admitted Patient Episodes
• Tasmanian Emergency Department Presentations
• Tasmanian Perinatal Data Collection
Department of Health and
Human Services Victoria
Centre for Data Linkage Victoria (CVDL) • Victorian Admitted Episodes Dataset
• Victorian Emergency Minimum Dataset

48
Data custodian Data linkage unit Collection Name
Victorian Agency for Health
Information (VAHI)1
CVDL • Victorian Perinatal Data Collection
Department of Health
Western Australia
Data Linkage Branch • WA Hospital Morbidity Data Collection
• WA Emergency Department Data Collection
• WA Midwives Notification System
1 on behalf of the Victorian Consultative Council on Obstetric and Paediatric Mortality and Morbidity
Table 5-5 ALSWH linked data coverage: State/Territory (at 31 October 2020)
State and Collection
Update MM/YY
Coverage Records
N Women Total N
N by cohort from
MM/YY to
MM/YY 1921-26 1946-51 1973-78 1989-95
ACT
A
01/20
07/04 06/17 2,197 741 179 116 177 269
P 05/97 12/16 373 228 - - 175 53
E 05/05 06/17 4,197 1,229 170 162 263 634
NSW
A
09/19
03/01 03/19 109,294 14,956 3,936 3,577 3,612 3,831
P 01/94 12/17 7,326 3,474 - - 2,917 557
E 01/05 03/19 67,134 13,452 3,185 2,974 2,812 4,481
NT
A 02/19
07/00 07/18 2,414 496 29 160 170 137
P 01/86 12/15 271 167 - - 146 21
E - Approval in place; data to be delivered
A 04/18 07/07 12/17 64,234 10,326 1,789 2,888 2,665 2,984
49
State and Collection
Update MM/YY
Coverage Records
N Women Total N
N by cohort from
MM/YY to
MM/YY 1921-26 1946-51 1973-78 1989-95
QLD P 07/07 12/17 3,106 2,004 - - 1,395 609
E - Approval in place; data to be delivered
SA
A 12/18 01/01 03/18 17,748 3,437 1,006 826 847 758
P 01/19 03/86 12/16 2,306 1,127 - 66 889 172
E - Approval in place; data to be delivered
TAS A
10/18 01/07 12/17 4,272 1,065 274 296 244 251
P 01/05 12/14 461 295 - - 233 62
E - Approval in place; data to be delivered
VIC
A 03/19 07/93 06/18 118,327 12,967 3,137 2,944 3,638 3,248
P1 09/19 01/99 12/16 5,083 2,525 - - 2,122 404
E - Approval in place; data to be delivered
WA
A
04/19
01/70 12/17 60,914 5,573 982 1,349 1,511 1,731
P 07/89 12/17 2,989 1,442 - - 1,146 296
E 01/02 10/18 29,351 4,725 822 1,117 1,162 1,624
A = Hospital Admissions; P = Perinatal; E = Emergency Department 1 Linkage is with explicit consent only, due to specific legislative requirements for this collection; see Section 5.4.2 for a description of consent in ALSWH.

50
5.1.3 Derived datasets: Chronic conditions from multiple sources
Work is currently underway to make key indicator variables, derived from linked health record data,
available to research collaborators. Harmonising and analysing linked data from multiple sources is a
time-consuming task, especially as data sources may differ on coverage (type of hospital, time periods),
linkage procedures (matching sensitivity), context of collection (funding and policy changes), and the
variables supplied. There are frequently other important caveats around the use of the data.
Considerable time and expertise is therefore required to produce valid and reliable results, with
sufficient power to detect the effects in question. To streamline analysis, ALSWH is now offering derived
variables to research collaborators, for example, fact of diagnosis for certain conditions, such as
dementia (which may have been identified from ALSWH surveys or from one or more available linked
data sources). Current ethical requirements for linked data still apply to derived data – collaborators
require HREC approval for all contributing datasets before they can access the derived data.
5.2 Data access procedures
5.2.1 Data user approvals
Collaborating researchers from other Centres/Institutions can access the ALSWH linked datasets,
subject to the approval of the relevant Data Custodians and HRECs. This means that instead of an
individual researcher having to make their own separate applications to Data Custodians and HRECs
to use linked data held by ALSWH, they apply instead to the ALSWH Data Access Committee by
submitting an Expression of Interest (EoI). Upon approval of the EoI, ALSWH submits amendments and
data user agreements to the relevant HRECs and Data Custodians. In some cases HRECs and/or Data
Custodians must also review and approve new EoIs. These arrangements are subject to change at the
direction of the agencies involved. Please note that substudies (projects which collect new survey data),
or analysis projects which link with collections not covered by ALSWH, require individual approval of
the HREC/s and the Data Custodian.
Table 5-4 shows the current external approval processes required to add new researchers and projects
(subsequent to approval by the ALSWH Data Access Committee). For ease of administration, ALSWH
batches the new applications for submission to external agencies at the close of each EoI round. The
approval process is largely outside of our control - researchers are advised that for certain collections,
gaining all the necessary approvals may take several months over and above ALSWH’s internal EoI
processing time. Table 5-10, at the end of this chapter, gives details of current ALSWH HREC record
linkage protocols.
5.2.2 Access options
Research datasets containing linked health records cannot be passed on to third parties. They can only
be accessed:

51
• At ALSWH sites (School of Public Health, University of Queensland; or the Research Centre for
Generational Health and Ageing, University of Newcastle). Visits must be booked; access depends
on the facilities and resources available.
• Remotely through the SURE facility, at the researcher’s expense.
5.2.3 Data access conditions
Information about data access conditions, including acknowledgements and review requirements for
research outputs, is available on the ALSWH web site.
Table 5-6 Approval procedures for researchers and projects using linked health records Data Source Approving body Documents
AIHW
Collections
AIHW HREC • ‘AIHW s.29’ signed by all researchers
• HREC amendment
DVA DVA HREC • Researcher CVs
• HREC amendment
• Project specific application*
• Evidence of DVA sponsor*
NSW CHeReL • Draft HREC amendment and ALSWH EoIs
(where use of SURE is involved)
NSW, QLD NSW Population & Health
Services Research Ethics
Committee (PHSREC)
• Copy of Data Custodian approval (where use of
SURE is involved)
• Change in personnel form
• Updated Study Protocol (where use of SURE is
involved)
• Copies of ALSWH EoIs
• HREC amendment
QLD Qld Health Information,
Investment and Research Office • Copy of NSW PHSREC approval letter
• Updated Public Health Act (PHA) form
Qld Health Statistical Services
Branch • Conditions of Disclosure document signed by
all researchers
WA Dept of Health WA HREC • Researcher online registration
• HREC amendment
ACT, VIC, SA ACT Health HREC • HREC amendment
VIC (except
Perinatal)
CVDL • Copy of ACT Health HREC approval letter
• ‘CVDL Schedule 2’ signed by all researchers

52
Data Source Approving body Documents
• Copies of ALSWH EoIs
VIC Perinatal Austin Health HREC • HREC amendment
• Researcher CVs
VAHI • Data request signed by all researchers
• Amended Data Request
• Copy of Austin HREC approval letter
• Copies of ALSWH EoIs
SA/NT SA NT Datalink • ‘Annexure B’ signed by all researchers
• Copy of SA and NT HREC approval letters
SA SA Health • Confidentiality Deed
• Copy of SA HREC approval letter
NT NT Health & Menzies HREC • HREC Amendment
NT Health • ‘NT Appendix B Deed 2’ signed by all
researchers
• Copies of ‘Annexure B’ signed by all
researchers
• Copy of NT HREC approval letter
TAS Tas Health & Medical HREC • HREC Amendment
• Copy of NSW PHSREC approval letter
TDLU • Copies of TAS & NSW HREC approval letters
• TDLU ‘Deed of Confidentiality and Compliance’
signed by all researchers
• TDLU Security Checklist for Researchers
completed by all researchers
*for analyses which distinguish DVA clients and/or services

53
5.3 Use of linked data
A total of 213 projects have requested linked health record data to date. Of these, 130 are current
projects. 81 ALSWH publications have used linked data. Table 5-7 shows the numbers of approved
ALSWH projects, and researchers who have requested linked data for their analyses.
Table 5-7 Linked data use in approved ALSWH EoIs (at 25 August 2020)
Collection type Projects Users
Publications
Total Since last report Total Since last
report Total Since last report
MBS 75 8 87 18 29 4 PBS 81 20 110 20 33 4 CoD 27 11 48 4 7 3 Cancer 13 7 28 5 2 0 Aged Care 26 8 42 10 10 3 Hospital Admissions 56 14 83 21 26 8 Perinatal Collections 28 9 50 8 3 0 Emergency Department 17 7 41 6 0 0
TOTAL 130 28 130 26 81 11
5.4 Legal and ethical considerations for health record linkage
This section outlines ALSWH compliance with legal and ethical requirements for health record linkage.
Data security measures are as described in the 2019 Technical Report.
5.4.1 Applicable legislation and guidelines
ALSWH is bound by the Australian Privacy Act 1988 under its contractual obligations to the
Commonwealth Department of Health, which funds the Study. The Universities of Queensland and
Newcastle are also subject to privacy legislation in their respective States (which is substantially similar
to the national legislation). Further, to ensure best practice on our own behalf, and to maintain the
compliance of organisations from which ALSWH accesses linked health records, ALSWH must adhere
to the following national regulations, as well as to State and Territory privacy and health privacy
legislation.
• NHMRC Guidelines approved under Section 95 of the Privacy Act 1988 (November 2014)
• Australian Privacy Principles (APP) guidelines (Version 1.2 July 2019) as well as Privacy principles
operating in Australian States and Territories.
• Australian Government Best Practice Guide to Applying Data Sharing Principles (15 March 2019)
The universities and researchers conducting ALSWH are also ethically bound by:

54
• NHMRC National Statement on Ethical Conduct in Human Research 2007 (Updated 2018;
Chapters 2.2-3 and 3.2 are particularly relevant)
• The Australian Code for the Responsible Conduct of Research 2018 – Management of Data and
Information in Research (2019)
The following also apply to Commonwealth agencies disclosing health records to ALSWH:
• Privacy public interest determination guide V1.0, June 2014.
• Health Insurance Act 1973 (for MBS data).
• Public Interest Disclosure Act 1973
• High Level Principles for Data Integration Involving Commonwealth Data for Statistical and
Research Purposes (February 2010)
• A Guide for Data Integration Projects involving Commonwealth Data for Statistical and Research
purposes (National Statistical Service).
ALSWH’s Participant Privacy Policy is available on the web site and is regularly updated. All
researchers and collaborators accessing linked data are also subject to ALSWH Data Access Protocols
in addition to the Codes of Conduct and Privacy Policies of their home institutions. The University of
Queensland and University of Newcastle Privacy Codes are:
• The University of Queensland Policy and Procedures library (http://ppl.app.uq.edu.au/), including:
1.60.01 Right to Information, 1.60.02 Privacy Management, 1.60.04 Records Management, 4.20
Research Conduct and Integrity, and 4.20.06 Research Data Management.
• The University of Newcastle Responsible Conduct of Research Policy
(https://www.newcastle.edu.au/research-and-innovation/resources/policies-procedures-and-
codes/overview) and Privacy Management Plan (https://www.newcastle.edu.au/privacy)

55
ALSWH compliance with national guidelines was described in the 2019 Technical Report. The history
of consent procedures is also detailed in that report, and is summarised Figure 5-1
Figure 5-1 History of data linkage consent for ALSWH participants 1996-2018.
5.4.2 Consent status of ALSWH participants
Consent for health record linkage applies to all collections, apart from the National Death Index, which
is conducted for all participants as an integral part of longitudinal tracking. ALSWH operates bundled
opt-out consent due to the number and complexity of the record collections involved. Participants are
informed of details of the collections accessed via the Study web site. Table 5-8 shows the definitive
health record linkage consent categories. Participants who were active in the Study from 2005 are
covered by the opt-out consent provisions which were introduced from that time, while participants who
have never explicitly responded to health record consent communications,and have not been active in
the study since 2005, are covered by waived consent.
Table 5-8 Health record linkage consent categories
Consent status
Relevant participants Linkage
a) Declined • Latest answer to the data linkage questions is ‘No’ • Explicitly declined data linkage by contacting
ALSWH • Withdrawn from the Study because of privacy,
confidentiality or Medicare data linkage concerns.
NDI only; deterministic only (no personal information is to be transferred to/from AIHW)
b) Express consent
Latest answer to the data linkage questions is ‘Yes’. All
c) Implicit consent
Not in category a) or b), who have completed ALSWH surveys since the introduction of opt-out consent (2005).
All except VIC P
d) Waived consent
Not in category a) or b), who have not completed a survey since the introduction of opt-out consent (2005).
All except VIC P; the Data Custodian for SA Cancer does not supply sensitive variables for this group

56
Table 5-9 shows the health record linkage consent status of the cohorts.
Table 5-9 Health record linkage: Consent status of ALSWH participants (July 2020)
Cohort Total
N a) Declined
Consent type
b) Express c) Implicit d) Waived
1921-26 12,432 353 2.8% 9,131 73.4% 381 3.1% 2,567 20.6%
1946-51 13,713 757 5.5% 11,236 81.9% 395 2.9% 1,325 9.7%
1973-78 14,247 744 5.2% 9,897 69.5% 873 6.1% 2,733 19.2%
1989-951 17,007 17 0.1% 16,990 99.9% N/A N/A N/A N/A
TOTAL 57,399 1,871 3.3% 47,254 82.3% 1,649 2.9% 6,625 11.5%
1 Note that the 1989-95 cohort expressly consented on enrolment in 2012/13, therefore, qualified consent is not
applicable.
5.4.3 Communicating with ALSWH participants about health record linkage
ALSWH participants have been informed about health record linkage and opt-out consent in annual
newsletters since 2005. In 2020, the Department approved the updating of this content, to improve the
currency and readability of this important information. Updated information was provided in the 2019
ALSWH participant newsletter.
5.4.4 Current HREC approvals for health record linkage
Table 5-10 shows current Human Research Ethics Committee (HREC) approvals for the ALSWH Data
Linkage Project. In 2020, our three separate AIHW HREC protocols covering national data collections
were updated and subsumed into a single protocol. The National Mutual Acceptance Scheme (NMA)
aims to reduce duplication of coverage for cross-jurisdictional and/or multi-site projects. In May 2020
the scheme was revised to better support the requirements of researchers undertaking multi-jurisdiction
data linkage studies, however, WA and NT are not party to this scheme, which also only covers locally-
held Tasmanian data collections. ALSWH continues to pursue opportunities to streamline HREC
monitoring, where feasible. From 2018, the NSW Population Health Services Research Ethics
Committee (PHRSEC) covers data linkage in both NSW and Queensland; while Victorian (Hospital and
Cancer) collections were added to our ACT Health HREC protocol. (Data custodians for the Victorian
Perinatal Data Collection require approval of a Victorian Hospital HREC, therefore, this collection has
its own protocol). In 2020, SA collections were also added under the ACT HREC.

57
Table 5-10 Health record linkage: Current HREC approvals Ethics Committee Reference Approved Expiry Coverage University of Newcastle HREC
(EC00144);
ratified by University of Queensland
Human Research Ethics Committees
(EC00456/7)
H-2011-0371;
2012000132
31/01/12;
9/02/12
31/12/25 ALSWH Data linkage Project (subject to jurisdictional
approvals)
H-2014-0246;
2014001213
07/08/14;
10/09/14
31/12/25 MatCH Phase 1 Substudy (survey and record linkage)
H-076-0795;
2004000224
26/07/95;
2/04/04
31/12/30 ALSWH Survey program, original cohorts
H-2012-0256;
2012000950
08/08/12;
31/12/23
31/12/32 ALSWH Survey program, 1989-95 cohort
Australian Institute of Health and
Welfare HREC (EC00103)
EC2020/3/1115
Replaces:
17/08/20 31/12/30 All national collections
EC 2012/1/12 12/04/12 Closed
MBS (non-DVA), PBS
EO2013/1/7
7/01/13
NACDC, DVA-AC,
R-MBS, Cancer
EO2014/3/110 31/10/14 NDI
EO2017/1/342 7/03/17 31/12/25 MatCH Phase 1 Substudy (child record linkage)
Defence/DVA HREC (EC00460) EO14/022 19/12/14 31/12/21 DVA-AC, R-MBS
ACT Health HREC (EC00100) ETH.6.13.148 01/07/13 31/07/21 ACT A, P, E, Cancer
Amendment – VIC
collections
22/08/18 VIC A, E, Cancer

58
Ethics Committee Reference Approved Expiry Coverage
Amendment – SA
collections
19/09/20 SA A, P, E, Cancer
Austin Health HREC (EC00204) HREC/18/
Austin/163
17/07/18 none VIC P
NSW Population and Health Services
Research Ethics Committee
(EC00410)
2011/11/357 03/01/12 31/12/20
(extension
requested)
NSW A, P, E, Cancer
Amendment –
QLD collections
13/04/18 QLD A, P, E, Cancer
HREC for the NT Dept of Health and
Menzies School of Health Research
(EC00153)
2018-0371 16/04/18 31/12/21 NT A, P, E, Cancer
SA Health HREC (EC00304) HREC/12/
SAH/91
14/06/16 Closed
24/09/20
Tasmanian Health & Medical HREC
(EC00337)
H0017192 19/04/18 19/04/22 TAS A, P, E, Cancer
Dept of Health WA HREC (EC00422) 2015/47 15/12/25 31/12/21 WA A, P, E, Cancer
Shaded cells show coverage of the ALSWH survey program, rather than the data linkage component.

59
6 Archiving
ALSWH data are annually archived at the Australian Data Archive (ADA) at the Australian National
University. To date, data have been archived for Surveys 1 to 8 of the 1946-1951 cohort, Surveys 1 to
7 of the 1973-1978 cohort, Surveys 1 to 5 of the 1989-1995 cohort, Surveys 1 to 6 of the 1921-1926
cohort, and the incomplete data from the six-month follow up survey of the 1921-1926 cohort. This year,
2020, the eighth wave of the 1973-78 cohort was archived along with recent data from the six-month
follow up survey of the 1921-1926 cohort.
6.1 Archiving Notes
In 2020, the following were deposited with ADA:
• Completed ADA licence form.
• The ALSWH Data Dictionary in MS Access format.
The data archived for the 1973-1978 cohort consisted of:
• 1973-1978 cohort survey level ‘A’ and ‘B’ analysis datasets in SAS format.
• 1973-1978 cohort survey CHILD dataset updated with wave 8 data in SAS format.
• 1973-1978 cohort participant status file in SAS format.
The data archived for the 1921-1926 cohort consisted of:
• 1921–1926 cohort 6-month follow up survey level ‘A’ and ‘B’ analysis datasets in SAS format.
1921–1926 cohort participant status file in SAS format.

60
7 Methodological issues
7.1 Creation of ADA-Accessed (Core) data
Author: David Fitzgerald
During the year, a core version of the ALSWH survey data was prepared and made available for release
via the Australian Data Archive (ADA). These datasets are known as the ADA-Accessed (Core) data,
and can be accessed from the ADA through a simplified procedure, usually within a week of application
(provided applicants meet specific criteria). Full details of how to access the core datasets, and all
supplementary information, are provided on both the ADA and ALSWH websites. The following is a
description of how these core datasets were produced, and what was and was not included.
7.1.1 Differences between the ALSWH data and the ADA-Accessed (Core) data
Some items have been removed from the Core datasets. Survey questions and derived variables/scales
were removed if they were considered to be sensitive (e.g., questions involving criminality), not relevant
for analysis, or if their release requires oversight of the ALSWH Data Access Committee. Some minor
recoding of variables to avoid small cell sizes was also conducted. All the removed and recoded
variables are outlined below.
The ALSWH Data Dictionary (available on the ALSWH website), has been updated to include all the
ALSWH variables with an indicator showing whether they are in the Core datasets or not.
7.1.2 Items not included in the Core Dataset
• Age
Most age related variables were not included in the Core datasets. There is an AGE variable which is
age in integer years at time the survey was returned. Other age variables, such as ‘age first starting
smoking’, ‘came to Australia’, were not included.
• Date variables
There are no exact dates in the Core datasets, although the respondents’ year of birth and year of
response are available. All other dates, such as ‘date first came to Australia’, have been removed.
• Geographic variables
The only geographic and geo-coded variables in the Core data are state of residence and ARIA+
grouped (ARIAPGP). For ARIAPGP, the ‘very remote’ and ‘remote’ categories were collapsed into a
single category. The geo-coded variables ARIAPLUS and MMM were not included.

61
• States / Territories
There were some small frequencies in the Australian Capital Territory (ACT) and Northern Territory
(NT). To assist with de-identification, New South Wales and ACT have been collapsed together and so
have South Australia and NT.
• Exercise variables
The exercise status variable, EXSTAT, was removed from Survey 1 because this version was different
from subsequent surveys. The exercise variables begin from Survey 2.
• Short Surveys
The Short Surveys records are kept within the main datasets in the Core data, as they are with the main
ALSWH datasets. The SURVEY variable, such as M2SURVEY, has value 1 for a full survey and value
2 for short survey. The Short Surveys were not continued after Survey 3.
• Cell size greater than 10
The core data does not include any categorical variables with fewer than 10 responses in any category.
Variables which had fewer than 10 responses in a category were either collapsed into fewer categories
(to ensure at least 10 values in every category) or removed from the Core data. For example, in the
1989-95 cohort there were very few widowed women, so the Marital Status variable has a combined
category of widowed and divorced.
• Time use / Labour Force participation
The individual survey items for time use and labour force participation were removed from the Core
datasets where they were used to derive other variables. The derived Labour Force Status variables
are LABF, HRS, HRSWORK, and these are included in the Core datasets.
• Child dataset
Child datasets items are not included in the Core data. The only child variable is the ‘children’ variable,
which is number of children (0, 1, 2, 3 or more). All variables counting reproductive variables such as
number of miscarriages were also removed.
• Others
Other items not included are:
• The Complete Food Frequency datasets
• All text variables
• All qualitative data
• All Aboriginal and Torres Strait Islander questions
• Domestic and child abuse questions
• Illicit drug questions
• Medications free text data

62
• Cause of death
• Linked data
• Six-month follow-up data from the 1921-26 cohort
7.1.3 Participant Status File
There is a participant status file for each cohort for the Core data. These files have year of response for
each survey. This year of response variable has a value of 1 for did not respond, and a value of 2 where
the respondent had died by the time of the survey.
7.1.4 Recoded variables
There are a few variables in the Core dataset that have been recoded from the main ALSWH variables.
These differences are described below.
• Recodes common to all cohorts:
ID Core - each woman in the Core datasets has an identifier ‘IDcore’. This identifier is different
from the ‘IDalias’ identifier used in the full ALSWH datasets.
As noted previously, ‘State of residence’, ‘ARIA+ grouped’, and ‘Age’ were recoded similarly for
all cohorts.
• Recodes by cohort:
Some items were recoded only for specific Surveys of each cohort. In particular, the 1946-51 cohort
data had a number of recodes. All are described below.
• 1946-51 Cohort
Survey(s) Question/variables Recode details
Survey 2 m2q71: Number people dependent on
income
Capped at 7 (i.e., any value above 7 was
recoded to 7).
Survey 3 M3q49 a – j: How often drink cola, etc. Category ‘3 or more times a day’ was
collapsed with ‘2 times a day’.
M3q88: How many dependent on
household income
Capped at 7

63
Survey(s) Question/variables Recode details
Surveys 3 - 8 How many times have you consulted
GP/hospital doctor/ specialist in the
last 12 months
The category ‘25+ times’ was collapsed with
‘13-24 times’
Number of people living with you Category ‘3 or more’ combined with ‘2’
Survey 6 m6q70: How many slices of bread eat
per day
Category ‘8+ slices per day’ was collapsed
with ‘5-7 slices per day’
Survey 7 M7q77 a – l: Number of drinks Category ‘3 or more’ was collapsed with ‘2
times per day’
Survey 8 M8q57 a – l: Number of drinks Category ‘3 or more’ was collapsed with ‘2
times per day’
M8q82: Which best describes your
housing situation’
Category ‘Nursing home / residential aged
care’ was collapsed with ‘Retirement village
/ self-care unit’, and ‘Hostel / boarding
house’ was collapsed with ‘Other’.
M8q83: How many bedrooms Capped at 8
M8q85: Years lived in current home Capped at 50
M8q87: Where living in 10 years Category ‘Hostel/ boarding house’ collapsed
with ‘Have no idea’
M8q76 a/b: Retirement of self/partner
Category ‘Never been in paid work’ was
collapsed with ‘Other’

64
• 1921 – 1926 cohort
Survey(s) Question/variables Recode details
All Marital status ‘De facto’ was collapsed with ‘Married’
Alcohol status (NHMRC) variables ‘High risk drinker’ was collapsed with ‘Risky
drinker’
• 1973 – 1978 cohort
Survey(s) Question/variables Recode details
All Number of children Capped at 3 for all surveys
Survey 1 y1q76: Age left school ‘Never attended school’ recoded to missing
y1q83: Speak English Speak English ‘not at all’ was collapsed with ‘Not well’
• 1989 – 1995 cohort
Survey(s) Question/variables Recode details
All Marital status ‘Divorced’ and ‘Widowed’ were collapsed with ‘Separated’

65
7.2 Validation of the ALSWH income management survey question
Authors: Nicholas Egan, Peta Forder, Annette Dobson, Richard Hockey
7.2.1 Income within the context of socioeconomic status
Socioeconomic status (SES) refers to ‘the social and economic position of a given individual, or group
of individuals, within the larger society’ (ABS, 2011). Socioeconomic status is viewed as a relative state
(individual advantage/disadvantage compared to others) and is often difficult to quantify. SES is most
commonly operationalised as education, social class or income, but other elements such as
employment, wealth, location, health, consumption and household structure also contribute towards
measurements of SES (ABS, 2011).
Income is often considered to be a clear indicator of material resources, and is strongly associated with
higher/better SES (Darin-Mattson et al, 2017). Income is associated with better health outcomes (higher
income increases the ability to access more services and resources to aid health) as well as indirectly
influencing social participation and opportunities to improve life circumstances, which influence long-
term health (Marmot, 2002). As such, income resources are often measured within the context of health
surveys, such as ALSWH.
7.2.2 Ability to manage on available income
Many ALSWH surveys include an income management question, which is phrased as ‘How do you
manage on the income you have available?’ with the following response options: ‘It is impossible’, ‘It is
difficult all of the time’, ‘It is difficult some of the time’, ‘It is not too bad’ and ‘It is easy’ (Figure 7-1). This
question has been used in many published papers based on ALSWH data, but its provenance is
unclear, and it has never been validated within ALSWH. This investigation seeks to address these
concerns.
Figure 7-1 Example of ALSWH questionnaire item on the ability to manage on available income, (Survey 8 of the 1973-78 cohort, 2018).

66
A search of the literature for use of this income management question predominantly returned results
from studies based on ALSWH data. We found three papers that used other surveys where the income
management question was used with the same wording (Ashman et al., 2017, Gregorevic et al., 2018,
Gregorevic et al., 2020), but these did not provide references that might indicate the origin of the
question.
A similar question which asks respondents about their ease in meeting health care costs was included
in the Australian Living Standards Study Berwick Report published in 1993 (McDonald, 1993). The
Australian Living Standards Study (ALSS) was conducted by the Australian Institute of Family Studies
(AIFS), with the relevant question included in Part 2 of the questionnaire on page 35. The question is
phrased as ‘How easy or difficult is it for you to meet the total health care costs of your family?’.
Respondents could select one of the following options: ’Easy or very easy’, ‘Moderate/OK’ or ‘Difficult
or very difficult’ (Figure 7-2).
Figure 7-2 Ease of meeting health care costs question from the Australian Living Standards Study (part 2, question 103, page 35).
This question is similar in content and structure to the ALSWH income management question, and
predates the first ALSWH survey in 1996. It has been suggested that this question may have been
modified for use in ALSWH, although this has not been confirmed.
Another similar question was included in the Poverty in the United Kingdom survey conducted in 1968
and 1969 in each of fifty-one constituencies in the United Kingdom (Townsend, 1979). The question
was posed as ‘Do you find it especially difficult to manage on your income?’ with dichotomous response
options yes and no. An AIFS report (Brownlee, 1990) on the development of the ALSS extensively
references and analyses the Townsend study, suggesting that the Townsend study may have been
used to inform the development of the income questions used in the ALSS.
7.2.3 Financial resource questions under consideration
This investigation considers four questions that seek to measure financial resources within ALSWH,
although there is a primary focus on the income management question that is regularly used across
surveys in all four ALSWH cohorts. Table 7-1 outlines the phrasing of the questions under consideration.
The Question column contains shorthand names for the questions that will be used throughout this

67
document for brevity (e.g. ‘Income management’ refers to the question that asks about participant’s
ability to manage on the income that they have available to them).
Table 7-1 Summary of financial resource and education questions under consideration Question Phrasing of question
Income management How do you manage on the income you have available?
Household income What is the average gross (before tax) income of your household (e.g. you and your partner, or you and your parents sharing a house)?
Highest qualification What is the highest qualification you have completed?
What is the highest level of education you have completed?
Stress about money Over the last 12 months, how stressed have you felt about the following areas of your life: Money
ALSWH survey data also includes the Socioeconomic Indices for Area (SEIFA) Economic Resources
score, but this was not included in this analysis as it is an ecological variable that did not exhibit strong
correlation with individual-level measures of financial resources.
7.2.4 Surveys that measure financial resources and education

68
Table 7-2 shows that the income management question has been regularly included in surveys in all
cohorts. Although not shown in

69
Table 7-2, the income management question is also included in each of the six-monthly follow-up
surveys of the 1921-26 cohort. The highest qualification question has been sparingly included in the
1921-26 and 1946-51 cohorts, but has been regularly included in the 1973-78 and 1989-95 cohorts.
The household income question has only been included in two surveys of the 1946-51 cohort and three
surveys for the 1973-78 cohort. The stress about money question has been regularly included in all
cohorts except the 1921-26 cohort, where it was only included at Survey 1.

70
Table 7-2 Inclusion of financial resource and education questions across cohorts and surveys Survey Wave Cohort Question 1 2 3 4 5 6 7 8
1921-26 Income management Yes Yes Yes Yes Yes Yes
Household income
Highest qualification Yes
Stress about money Yes
1946-51 Income management Yes Yes Yes Yes Yes Yes Yes Yes Household income Yes Yes
Highest qualification Yes Yes
Stress about money Yes Yes Yes Yes Yes Yes
1973-78 Income management Yes Yes Yes Yes Yes Yes Yes Household income Yes Yes Yes
Highest qualification Yes Yes Yes Yes Yes Yes Yes Yes Stress about money Yes Yes Yes Yes Yes Yes Yes Yes
1989-95 Income management Yes Yes Yes Yes Yes
Household income
Highest qualification Yes Yes Yes Yes Yes
Stress about money Yes Yes Yes Yes Yes
Yes Question available
Question not available
Survey does not exist
7.2.5 A note on the household income variable
The household income questions for the 1946-51 and 1973-78 cohorts are split into two parts: personal
income and household income. The exception is Survey 2 in the 1946-51 cohort where the question
was split into personal income and partner’s income. We generated a derived household income
variable that was the sum of the personal income and partner’s income for this investigation to allow
comparison with the other surveys. The mid-points of each category were used as estimates in the
summation. For example, if the personal income was reported as being in the $120 to $300 per week
category and the partner’s income was in the $700 to $999 per week category, then the total was $210
+ $850 = $1,060, and the resulting category for household income was the $1,000 to $1,500 per week
category.

71
7.2.6 Missing data for financial resource and education variables
Responses to the household income question of don’t know and don’t want to answer were treated as
missing, in addition to any actual missing responses. Missing data for all questions, excluding the
household income question, ranges from 0.36% to 5.37%. Missing data for household income ranges
from 16.77% to 36.07% (Table 7-3 and Figure 7-3).
With respect to the income management question, very low rates of missing were observed, with
• 0.7-2.1% missing observed across six surveys for the 1921-26 cohort;
• 0.6-1.4% missing observed across eight surveys for the 1946-51 cohort;
• 0.3-5.1% missing observed across seven surveys for the 1973-78 cohort; and
• 1.1-3.7% missing observed across five surveys for the 1989-95 cohort.
There was a noticeable increase in the proportion of missing observed for the income management
question for the 1973-78 cohort at Survey 6 (1.27%), Survey 7 (5.13%) and Survey 8 (4.93%). We
hypothesise that this increase may have been due to the ordering of the questions in the survey. In
Survey 6, the income management question was included alongside other SES questions, but in
Surveys 7 and 8, the income management question was included following a series of dietary questions.
There have been four ALSWH surveys where a small number of women were offered a short survey
instead of the complete survey. These shortened surveys were offered at Survey 2 for the 1921-26,
1946-51 and 1973-78 cohorts, and Survey 3 for the 1946-51 cohort. The short surveys were restricted
to the questions deemed most important and not all financial resource questions were included. Cells
shaded yellow in Table 7-3 indicate that the question was not included in these short surveys, and so
women who completed the short survey have been excluded from the denominator in the missingness
calculation (as they did not have the opportunity to respond to that particular question). The values in
Table 7-3 are presented graphically in Figure 7-3.
Table 7-3 Missing data (%) for financial resource and education questions Survey Wave Cohort Question 1 2 3 4 5 6 7 8
1921-26 Income management 2.14 1.21 0.74 1.29 1.08 1.09
Household income
Highest qualification 5.34
Stress about money 3.47
1946-51 Income management 0.63 1.28 1.21 0.75 0.63 0.90 1.37 1.25 Household income 36.07 27.55
Highest qualification 1.01 5.37
Stress about money 0.89 1.51 2.47 3.41 0.75 0.74

72
Survey Wave Cohort Question 1 2 3 4 5 6 7 8
1973-78 Income management 0.36 0.52 0.45 0.43 1.27 5.13 4.93 Household income 24.65 21.17 16.77
Highest qualification 0.57 3.61 2.36 0.37 2.17 1.87 5.37 4.84 Stress about money 0.53 1.23 0.67 0.37 0.32 1.29 2.05 2.33
1989-95 Income management 1.11 1.80 3.25 3.69 2.61
Household income
Highest qualification 1.08 1.75 3.20 2.82 2.54
Stress about money 1.08 1.75 3.11 3.69 2.01
XX.XX Percent missing data Question not available
Short survey respondents excluded Survey does not exist
Figure 7-3 Missing data for financial resources and education questions for each cohort.

73
7.2.7 Income management according to household income and stress about money
As expected, a higher proportion of women respond that they find it easier to manage on their available
income when their household income is higher. Figure 7-4 shows an increasing proportion of women in
the 1946-51 cohort describe their ability to manage on available income as ‘Easy’ as their household
income increases from ‘$1 to $119 per week’ (3.1%) through to ‘$1,500 or more per week’ (48.7%). The
opposite trend holds true for the ‘Difficult all of the time’ and the ‘Impossible’ categories. Figure 7-5
shows similar trends for the 1973-78 cohort, with an increasing proportion of women who describe their
ability to manage on available income as ‘Easy’ with household incomes of ‘$1 to $119 per week’ (0%)
through to ‘$1,500 or more per week’ (35.4%).
Figure 7-4 Responses for income management among women from the 1946-51 cohort (Survey 3, 2001), according to household income.

74
Figure 7-5 Responses for income management among women from the 1973-78 cohort (Survey 4, 2009), according to household income.

75
Figure 7-6 presents an increasing proportion of women in the 1989-95 cohort who describe their ability
to manage on available income as ‘Easy’ as stress levels concerning money move from ‘Extremely
stressed’ (1.0%) to ‘Not at all stressed’ (54.1%).
Figure 7-6 Responses for income management among women from the 1989-95 cohort (Survey 5, 2017), according to household income.
7.2.8 Spearman’s rank-order correlation coefficient
Spearman’s rank-order correlation coefficient, also known as Spearman’s rho, measures the strength
and direction of association between two ordinal categorical or continuous variables. Here, we present
the strength and direction of association between the income management question and the other
measures of financial resources. Like Pearson’s correlation coefficient, Spearman’s rho is measured
on a scale of minus one to one, with values nearer plus or minus one indicating greater correlation.
Table 7-4 present Spearman’s rho for income management and each of the other financial resources
and education questions. These coefficients were computed for both the first and last survey where
each combination of questions was included. For example, income management and highest

76
qualification were both included at Survey 1 and Survey 6 for the 1946-51 cohort, so the Spearman’s
rho was computed separately for Survey 1 and Survey 6.
These coefficients show that the income management question exhibits greater correlation with the
household income and stress about money questions, and less correlation with the highest qualification
question.
Table 7-4 Spearman’s correlation coefficients for income management and highest qualification, household income and stress about money
Cohort Survey Highest qualification
Household income
Stress about money
1921-26 1 0.09 - 0.40
1946-51 1 0.11 - 0.59
2 - 0.47 -
3 - 0.50 -
6 0.18 - -
8 - - 0.59
1973-78 1 0.12 - 0.53
3 - 0.47 -
4 - 0.46 -
8 0.23 - 0.66
1989-95 1 0.06 - 0.57
5 0.26 - 0.64
7.2.9 Cronbach’s alpha and Zumbo’s ordinal alpha
Cronbach’s alpha is a numerical measure of internal consistency, or reliability, of a set items on a scale.
Conceptually, and mathematically, we can think of the income management question, the stress about
money question and, where available, the household income question as items that make up a two-
item or three-item scale that seeks to measure the underlying latent construct of financial resources.
The financial resources construct is latent because it cannot be directly measured. The highest
qualification question was excluded from these conceptual constructs as it was not as strongly related
to financial resources as the other two questions either conceptually or statistically (using Spearman’s
rank-order correlation coefficients).

77
We can then use Cronbach’s alpha to measure the internal consistency between the income
management question and the other questions that seek to measure the financial resources construct.
Cronbach’s alpha is measured on a scale of zero to one. A higher value for Cronbach’s alpha suggests
the items have more shared covariance and are more likely to be measuring the same underlying
construct (Hinton, 2004). Additional tests are required to test for unidimensionality.
We also present Zumbo’s ordinal alpha as an alternative measure of internal consistency. Zumbo’s
ordinal alpha is a modified form of Cronbach’s alpha that relies on a polychoric correlation matrix, rather
than Pearson’s correlation matrix, and is preferred over Cronbach’s alpha when handling ordinal item
response data that is skewed or contains few item response levels (Gadermann, Guhn & Zumbo, 2012).
We performed each Cronbach’s alpha and Zumbo’s ordinal alpha calculation for the first survey where
the two or three items were all included.
There is good internal consistency across all four cohorts for the combinations of questions used to
measure financial resources. Cronbach’s alpha and Zumbo’s ordinal alpha estimates ranged from 0.61
to 0.80, with higher values observed when using Zumbo’s ordinal alpha (Table 7-5). The high degree
of shared covariance suggests that the two or three questions intended to measure financial resources
in each cohort are likely to be measuring the same underlying construct.
Table 7-5 Cronbach's alpha and Zumbo’s ordinal alpha for conceptual financial resources scale
Items included in conceptual financial resources scale
Cohort Survey Item 1 Item 2 Item 3 Cronbach’s
alpha
Zumbo’s ordinal alpha
1921-26 1 Income
management
Stress about
money - 0.61 0.80
1946-51 2 Income
management
Stress about
money
Household
income 0.68 0.74
1973-78 3 Income
management
Stress about
money
Household
income 0.67 0.73
1989-95 1 Income
management
Stress about
money - 0.70 0.76
7.2.10 Conclusion
The observed internal consistency between the items for income management, stress about money
and household income indicate that these items are measuring the same latent construct of individual’s
financial resources. Given that the household income question has not been asked at many surveys

78
and when it has been included, it has high rates of missing data, it is reasonable to include the items of
income management and stress about money as alternative measures of available financial resources.
This is preferable as participants seem more willing to respond to these questions, resulting in less
missing data while still adequately measuring their financial resources. We believe that the income
management item is a consistent and valid measure.
7.2.11 References
• Australian Bureau of Statistics (ABS), 2011, Measures of Socioeconomic Status, Canberra, Commonwealth of Australia, ABS Catalogue No. 1244.0.55.001, https://www.ausstats.abs.gov.au/Ausstats/subscriber.nsf/0/367D3800605DB064CA2578B60013445C/$File/1244055001_2011.pdf
• Ashman AM, Collins CE, Brown LJ, Rae KM, Rollo ME. Validation of a smartphone image-based dietary assessment method for pregnant women. Nutrients. 2017;9(1):73. doi:10.3390/nu9010073
• Brownlee, H. Measuring living standards: AIFS Australian Living Standards Study Paper No 1, Australian Institute of Family Studies, December 1990, ISSN: 1036-9902, ISBN: 0-642-16359-6
• Darin-Mattsson A, Fors S, Kåreholt I. Different indicators of socioeconomic status and their relative importance as determinants of health in old age. International Journal for Equity in Health. 2017;16(1):173. DOI: 10.1186/s12939-017-0670-3
• Gadermann, Anne & Guhn, Martin & Zumbo, Bruno. Estimating ordinal reliability for Likert-type and ordinal item response data: A conceptual, empirical, and practical guide. Practical Assessment, Research & Evaluation. 2017; 17: 1-13.
• Gregorevic K, Hubbard RE, Peel NM, et al. Do the positives through life decrease later-life frailty?: Positive psychosocial resources and health status in older adults, a prospective cohort study. Research Square; 2020. DOI: 10.21203/rs.2.15969/v4.
• Gregorevic, Katherine & Hubbard, Ruth & Peel, Nancye & Lim, Wen. Validation of the health assets index in the Australian inpatient setting: A multicentre prospective cohort protocol study. BMJ Open. 2018; 8. e021135. 10.1136/bmjopen-2017-021135.
• Hinton PR. (2004). Statistics Explained, 2nd edn. London: Routledge.
• Marmot M. The influence of income on health: Views of an epidemiologist. Health Affairs, 2002; 21(2): 31-46.
• McDonald P. Australian Living Standards Study Berwick Report Part 1: The Household Survey, 1993, Australian Institute of Family Studies, Melbourne, Australia.
• Townsend P. Poverty in the United Kingdom: A Survey of Household Resources and Standards of Living, 1979, Great Britain.

79
7.3 Comparison of the DASS-21 and GADS anxiety subscales in the 1973-78 cohort
Authors: Dominic Cavenagh, Amy Anderson, Richard Hockey
7.3.1 Introduction
The Depression Anxiety and Stress Scale (DASS) is a 42-item questionnaire that contains three
subscales that measure depression, anxiety, and stress1,2. There is also a short 21-item version of the
scale which has been found to give similar results to the longer form of the scale3. The anxiety subscale
of the DASS-21 contains seven questions and was administered in Surveys 6-8 of the 1973-78 cohort.
Table 7-6 DASS-21 anxiety subscale as presented in the ALSWH
Please read each statement below and indicate how much the statement applied to you over the past week
a I was aware of dryness in my mouth
b I experienced breathing difficulty (e.g. excessively rapid breathing, breathlessness in the absence of physical exertion)
c I experienced trembling (e.g. in the hands)
d I was worried about situations in which I might panic and make a fool of myself
e I felt I was close to panic
f I was aware of the action of my heart in the absence of physical exertion (e.g. sense of heart rate increase, heart missing a beat)
g I felt scared without any good reason
With possible response options ‘Did not apply to me at all’ (0 points), ‘Applied to me to some degree,
or some of the time’ (1 point), ‘Applied to me to a considerable degree, or a good part of the time’ (2
points) and ‘Applied to me very much, or most of the time’ (3 points). The scale is scored by summing
the points for each question and multiplying by 2.
The Goldberg Anxiety and Depression Scale (GADS) is an 18-item self-report questionnaire that was
developed from items in the Psychiatric Assessment Schedule4. The GADS contains two subscales
(depression and anxiety) each with 9 items. The GADS anxiety subscale has nine questions and has
been administered across cohorts and in multiple surveys in the ALSWH.

80
Table 7-7 GADS anxiety subscale as presented in the ALSWH
Next are some specific questions about your health and how you have been feeling in the past month
a Have you felt keyed up or on edge?
b Have you been worrying a lot?
c Have you been irritable?
d Have you had difficulty relaxing?
e Have you been sleeping poorly?
f Have you had headaches or neck aches?
g Have you had any of the following: trembling, tingling, dizzy spells, sweating, diarrhoea or needing to pass urine more often than usual?
h Have you been worried about your health?
i Have you had difficulty falling asleep?
With either a Yes or No response. The scale is scored by counting the number of positive (‘Yes’)
responses (max score = 9, min score = 0). Note that in the original paper, Goldberg proposed that if a
participant does not score 2 or more on the first 4 questions then the next five do not have to be
administered. This seems mainly to be relevant in a situation where someone is administering the scale
to a patient (i.e., it is not self-administered as in the ALSWH). Using this alternative scoring results in
more people with scores of 1 or 2 but does not significantly change the numbers of people with a score
of five or more (the proposed cut-off score). For the rest of this document the continuous GADS anxiety
score is considered based on scoring all 9 questions.
As both scales measure anxiety levels, a comparison of them in Surveys 6, 7 and 8 of the 1973-78
cohort was undertaken to see if one of them was preferred, with a view to only include one of the scales
in future surveys.
7.3.2 Internal validity of the DASS and GADS
Internal consistency of the scales was calculated using Cronbach’s alpha at each survey (1973-78
cohort Surveys 6-8) where both scales were administered.

81
Table 7-8. Internal validity of the DASS-21 and GADS anxiety subscales in the ALSWH
Survey
6 7 8
Cronbach’s alpha DASS-21 anxiety 0.78 0.79 0.79
Goldberg’s Anxiety 0.78 0.80 0.80
There was little change in the internal validity of either scale across time points, and little difference
between scales.
7.3.3 Correlation between DASS-21 anxiety and GADS anxiety subscales
DASS-21 anxiety and GADS anxiety scores were compared using scatter plots and Spearman
correlation coefficients at each survey (1973-78 cohort Surveys 6-8) where both scales were
administered (Figure 7-7). Note that points are slightly jittered to prevent overlap in the plots.
Survey Plot DASS-21 anxiety vs GADS anxiety Spearman correlation coefficient
6
(2012)
0.47963

82
Survey Plot DASS-21 anxiety vs GADS anxiety Spearman correlation coefficient
7
(2015)
0.50311
8
(2018)
0.52892
Figure 7-7 Correlation between DASS-21 and GADS anxiety subscales in the ALSWH.
In all three surveys, there was only a medium level of correlation between the scores. On inspection of
the graphs, it can be noted that it seems possible to score low on the DASS-21 anxiety scale while
scoring middle to high on the GADS anxiety scale - however the opposite does not seem to be true.
This may be due to the difference in time scales of the two subscales (DASS-21: past week, GADS:
past month).

83
7.3.4 Score thresholds
Five threshold values have been proposed for the DASS-21 anxiety subscale1 (0-6, 7-9, 10-14, 15-19,
20-42) to signify ‘normal’, ‘mild’, ‘moderate’, ‘severe’ and ‘extremely severe’ anxiety, although it is
recommended by the scale authors to use the score value rather that these threshold values if possible.
A single threshold of 5 was proposed for the GADs anxiety subscale – a score of 5 or more indicating
a 50% chance of having a clinically significant disturbance4.
Table 7-9. Percentage of DASS and GADs categorisations at each survey
Item Survey 6 Survey 7 Survey 8
DASS-21 anxiety
Normal 88.59 83.82 81.45
Mild 3.88 5.12 5.85
Moderate 5.02 7.36 8.46
Severe 1.11 1.84 1.99
Extremely Severe 1.4 1.86 2.25
GADs Anxiety
<5 59.16 56.43 53.55
≥5 40.84 43.57 46.45
Table 7-10 paints a very different picture depending on which scale is used based on the original scale
authors threshold values. Use of the DASS-21 as a continuous measurement (as is recommended) is
slightly problematic in a general setting (such as the ALSWH), as there is a very high percentage of 0
values (50.5%, 60.9% and 64% for surveys 6, 7 and 8 respectively). It is also unclear whether Goldberg
intended his anxiety score to be used as a continuous measure, or whether it should only be used as a
dichotomous score based on the 5 point cut level.
7.3.5 DASS-21 and GADS anxiety subscales as predictors/correlates of anxiety/mental health
Three other anxiety related measures are administered through the ALSWH: self-report of
diagnosed/treated for anxiety in the last 3 years (Yes/No); frequency of episodes of intense anxiety
(Never, rarely, sometimes, often); and SF-36 mental health subscale score. Each of these were
compared with both the GADS and DASS-21 anxiety subscale scores at Surveys 6-8 for the 1973-78

84
cohort. The Area Under the Curve was computed using both measures as predictors of anxiety
diagnosed/treated, and Spearman correlation coefficients were calculated between the measures and
the anxiety symptom and SF-36 measure.
Table 7-10 Comparisons of the DASS-21 and GADS anxiety subscales to other mental health measures in the ALSWH
Comparison method/measure Anxiety measure Survey 6 Survey 7 Survey 8
ROC AUC for predicting diagnosed/treated for anxiety (Yes/No diagnosed/treated for anxiety in last 3 years)
DASS-21 anxiety score
0.745 0.753 0.753
GADS anxiety score 0.733 0.716 0.730
Correlation with anxiety symptom (Spearman) (frequency of episodes of intense anxiety in last year)
DASS-21 anxiety score
0.422 0.490 0.514
GADS anxiety score 0.390 0.411 0.449
Correlation with SF36 mental health subscale score (Spearman) (How have you been feeling in the last 4 weeks)
DASS-21 anxiety score
-0.440 -0.482 -0.491
GADS anxiety score -0.649 -0.637 -0.634
Interestingly the DASS-21 anxiety score has higher predictive ability/correlation with self-reported
diagnosis/treatment and anxiety symptoms, while the GADS anxiety score correlates higher with the
SF-36 mental health subscale score. It should be noted that the SF-36 mental health score does not
measure only anxiety, but a more general mental health aspect. Again, note the difference in time scales
of the comparison items - specifically that the SF-36 mental health score has a similar time frame to the
GADS anxiety subscale.
7.3.6 Summary
Both the DASS-21 and GADs anxiety subscales have reasonable internal validity in the ALSWH, with
the DASS-21 performing better against measures of diagnosed anxiety and anxiety symptoms, and the
GADs correlating better with the general SF-36 mental health subscale score. Comparisons between
the scales are difficult due to the different time frames of the questions. Difficulty is also present due to
the lack of a ‘gold standard’ measure for anxiety amongst the ALSWH cohorts. Use of threshold scores
produces vastly different categorisations between scales. There is evidence that the DASS-21 (and
DASS-42) is in more common usage in the literature (Lovibond & Lovibond (1995) has 7,066 citations
in Google Scholar and 3,573 in Web of Science, compared to Goldberg et al. (1988) being cited 1,217

85
times in Google Scholar and 681 times in Web of Science). This may be in part due to the entire DASS
scale being in the public domain.
In summary, it seems that these scales are quite different, and have very different interpretations (based
on time frame, use of cut-points, severity of measure etc.) and thus it is not possible to definitively
choose between them in the current context. In deciding which scale to use, the authors recommend
careful consideration of the research question in which the scales will be used, how they will be
employed in any analysis, the fact that the scales are self-administered and if there is any previous
research to indicate which of the scales would suit the research question/domain better.
7.3.7 References
1. Lovibond SH & Lovibond PF. (1995). Manual for the Depression Anxiety Stress Scales. (2nd.
Ed.) Sydney: Psychology Foundation. ISBN 7334-1423-0.
2. Lovibond PF &Lovibond SH. (1995). The structure of negative emotional states: Comparison of
the Depression Anxiety Stress Scales (DASS) with the Beck Depression and Anxiety Inventories. Behaviour Research and Therapy; 33(3):335-343. doi:10.1016/0005-7967(94)00075-u
3. Antony MM, Bieling PJ, Cox BJ, Enns MW & Swinson RP. (1998). Psychometric properties of the
42-item and 21-item versions of the Depression Anxiety Stress Scales (DASS) in clinical groups
and a community sample. Psychological Assessment, 10, 176-181.
4. Goldberg D, Bridges K, Duncan-Jones P & Grayson D. (1988). Detecting anxiety and depression
in general medical settings. British Medical Journal, 297(6653), 897-899.

86
7.4 Assessing agreement between the K10 and MHI-5 measures of psychological wellbeing
Authors: Ingrid Aulike, Annette Dobson, Jacob Egwunye, David Fitzgerald & Gita Mishra.
During the year, agreement between the K10 and MHI-5 as measures of psychological wellbeing was
examined. A paper has been published in Applied Research in Quality of Life and the abstract is
included below - the full paper is available online.
Responses to the Kessler Psychological Distress Scale (K10) and the Mental Health Index-5 (MHI-5)
mental health subscale of the Medical Outcomes Study Short Form (SF-36) survey cover broadly similar
constructs. The aim of this paper is to use the equipercentile method to produce a concordance between
K10 and MHI-5 across the whole score distribution.
Comparisons were made using survey data from the ALSWH and the Household, Income and Labour
Dynamics in Australia (HILDA) survey, which used both the K10 and the MHI-5 measures at the same
time for the same participants. Agreement was assessed with Bland-Altman plots. The differences
between MHI-5 scores and transformed K10 scores were assessed with paired t-tests. For the ALSWH
data there is good agreement between MHI-5 scores and scores equated from the K10. The mean of
the differences ranged from 0.43 to 3.38 with corresponding standard deviations of 11.1 to 9.9. The
concordance table was very similar to one obtained by the more complicated item response theory
method.
These results suggest that longitudinal surveys of the same respondents that previously used MHI-5
could adopt the K10 (or vice versa) without loss of compatibility.

87
8 Major Report: The effect of multiple chronic conditions – Findings from the Australian Longitudinal Study on Women’s Health
The 2020 Major Report examined the development of multi-morbidity (two or more chronic conditions)
across the four ALSWH cohorts. The impact of multimorbidity on women’s quality of life, and the use of
health services were also examine, and qualitative data available from the women’s comments on their
surveys were also included to give voice to the experience of women with multimorbidity. A summary
is included here – the full report is available on the Study website.
8.1 Main findings and recommendations
In order to examine multimorbidity, we focussed on identifying eight groups of common conditions
affecting different body systems. These are:
• Musculoskeletal conditions – including osteoarthritis, rheumatoid arthritis, back pain,
osteoporosis and joint replacements
• Mental health conditions – mostly anxiety and depression
• Coronary heart disease – including heart failure
• Respiratory disease – asthma and chronic obstructive pulmonary disease
• Cancers – all types except non-melanotic skin cancer
• Diabetes – types 1 and 2
• Dementia – all types
• Stroke – excluding transient ischaemic attack
Women who had conditions in two or more of these groups were considered to have multimorbidity,
with morbidity counts representing the number of groups involved. Consequently, a woman with arthritis
and asthma would be counted as having conditions in two groups (musculoskeletal and respiratory),
whereas a woman with arthritis and back pain would be considered to have morbidity in only one group
(musculoskeletal). It should also be noted that we did not identify all conditions that may affect women,
but instead concentrated on conditions that are common and which are known to contribute strongly to
women’s morbidity and mortality burden.
The prevalence of most conditions increased with age, and across the cohorts. Consequently, most
conditions were most common in the 1921-26 cohort, increasing from when these women were in their
70s until surviving women were in their 90s. However, the prevalence of many conditions was higher
among the 1946-51 cohort when they were in their 70s, compared to when the 1921-26 cohort were
the same age. This disconnect may represent an increased prevalence of chronic conditions across the
88
different cohorts. Alternatively, there may be a healthy survivor effect whereby women who joined the
1921-26 cohort at the start of the study had less chronic conditions than those who did not join the
study. Another possible explanation is that there are better methods for diagnosis, and more treatments
for women in the younger cohorts and so we are more aware of their conditions. Earlier diagnosis and
survival with chronic disease will also affect prevalence. Another factor is availability of data; for
example, where the identification of cases relied heavily on Medicare items such as the Better Access
Scheme prevalence would be underestimated before the items were introduced. On the other hand,
there are potentially more opportunities to identify chronic conditions in the oldest cohort, as more have
been admitted to hospital and many have records from aged care and cause of death data.
• The prevalence of musculoskeletal conditions increases with age, but is higher in the 1946-51
cohort in their 70s than in the 1921-26 cohort when in their 80s; and higher in the 1989-95
cohort than in the 1973-78 cohort when they were of comparable ages. These data suggest
musculoskeletal diseases are increasing with successive cohorts, though they could also be
affected by data availability.
• Mental health conditions are markedly more common among women in the younger cohorts
than in the older cohorts.
• Heart disease shows a steady increase across the cohorts, with a marked increase in
prevalence from age 55 in the 1946-51 cohort to age 90 in the 1921-26 cohort.
• Respiratory conditions increase with age in all cohorts but the type of condition differs. Asthma
is more common among the younger cohorts and chronic obstructive pulmonary disease is
more common among the older cohorts. Some of the increase may be due to temporal changes
in health services or prescribing for women with asthma, and with most of the cases identified
from prescription medicines.
• Cancer increases with age in all cohorts, but is much more common among women in the 1946-
51 cohort when aged 70 than in the 1921-26 cohort when they were aged 70. This may reflect
earlier detection, better diagnosis, better survival, or increased incidence.
• Diabetes increases with age in all cohorts, but is much more common among women in the
1946-51 cohort when aged 70 than in the 1921-26 cohort when they were aged 70. This may
reflect earlier and better diagnosis, better survival, or increased incidence.
• Dementia was only ascertained for the 1921-26 cohort. There is a rapid increase with age,
partially representing onset of these conditions at older ages, and also partially representing
the greater use of hospital and aged care services which were a major source of information
on dementia.

89
• Stroke also increases rapidly with age. There is no evidence that women in the 1946-51 cohort
have more stroke than women in the 1921-26 cohort, and some suggestion of lower prevalence
of stroke among the younger cohort (which is consistent with national trends).
Multimorbidity was assessed by counting whether women had conditions across two or more of these
disease groups. Taking a snap shot at the time of the most recent full survey for each cohort, the most
common pairs of condition groups are shown in Table 8-1.
Table 8-1 Most common pairings of chronic conditions for women in each ALSWH cohort, at the time of their most recent survey.
Cohort Most recent full survey Pairs of conditions groups
1989-95
Survey 6, 2018
(age 23-28)
Musculoskeletal and mental health conditions
Mental health and respiratory conditions
Musculoskeletal and respiratory conditions
1973-78 Survey 7, 2016
(age 38-43)
Musculoskeletal and mental health conditions
Mental health and respiratory conditions
Musculoskeletal and respiratory conditions
1946-51 Survey 8, 2017
(age 66-71)
Musculoskeletal and mental health conditions
Musculoskeletal conditions and heart disease
Musculoskeletal conditions and diabetes
1921-26 Six-monthly follow-up surveys (2015)
(age 89-94)
Musculoskeletal conditions and heart disease
Musculoskeletal and mental health conditions
Mental health conditions and heart disease
The progression of multimorbidity was reviewed over time for each cohort. Most of the women in the
1921-26 cohort had conditions from two or more of the groups of conditions, with more than 75% having
two or more, and 50% having three or more by the time women were in their mid 80s. For the 1946-51
cohort, 25% of the women had two or more groups of conditions when they were in their 50s, and 50%
had two or more when they were in their 60s. In the 1973-78 cohort, 20% had two or more groups of
conditions when they were in their 40s. In comparison, in the 1989-95 cohort, 20% of the women had
two or more groups of conditions when they were in their mid 20s. The higher incidence of multimorbidity
at earlier ages in the 1989-95 cohort, compared to the 1973-78 cohort is largely due to mental health
conditions.
The more multimorbidity a woman has the greater the impact on her physical and mental health related
quality of life. In the 1921-26 cohort, women in their 90s with none of the conditions considered in this
report had median physical functioning scores indicating they have few difficulties with most of the

90
physical activities assessed by this scale. However, there was great variation in the range of scores
even for women with none of the conditions. Women with more conditions had markedly lower mean
scores, and while there was still great variability across the range of scores, most women with conditions
in two or more of the groups had scores that suggest they would have difficulty on most of the physical
activities assessed by the SF-36 physical functioning scale.
While the median scores tended to be higher overall, the relationship between multimorbidity and
physical functioning was also strongly apparent in the 1946-51 cohort. The effect was less strong for
the younger cohorts - however women with conditions in two or more groups had lower median physical
functioning scores than women with no conditions or a condition(s) in only one group. The association
between more multimorbidity and worse mental health was apparent in all cohorts. Higher levels of
multimorbidity are also associated with much higher levels of health service and aged care use in the
most recent periods considered in this report.
For the 1921-26 cohort (from ages 86-91 to 89-94):
• The one-year prevalence of admission to hospital increased from 40% for women with no
conditions, to 80% or higher for those with conditions across four or more of the groups.
• The median number of general practitioner visits increased from 6 per year for women with no
chronic conditions to 17 per year for women with conditions across seven or more of the
condition groups.
• The median number of specialist visits increased from just over 1 per year for women with no
chronic conditions to 3 or 4 per year for women with conditions across seven or more of the
condition groups.
• The median number of prescriptions increased from 22 per year for women who had none of
the groups of conditions assessed in this report, to over 70 per year if they had conditions
across four or more groups.
• The percentage of women in permanent residential aged care was close to zero for women
with none of the conditions assessed in this report, and increased to over 20% for women with
conditions across four or more of the condition groups.
• The percentage of women using home and community care nursing and allied health services
almost doubled from around 10% for women with no conditions, to over 20% for women with
one or more of the conditions. However, the increase in the percentage was not consistent
across the range of multimorbidities, potentially due to higher percentages in permanent
residential aged care in the group with multiple morbidities. Likewise, the use of other home

91
and community care services increased from no conditions up to conditions across two or three
groups, but did not increase further with more complex multimorbidity.
For the 1946-51 cohort (from ages 62-67 to 65-70):
• The one-year prevalence of admission to hospital increased from less than 30% for women
who had none of the conditions considered in this report, to over 70% for women who had
conditions across four or more of the groups.
• The median number of general practitioner visits increased from 4 per year for women with no
chronic conditions to 12 per year for women who had conditions across five or more of the
groups.
• The median number of specialist visits increased from just over 1 per year for women with no
chronic conditions to 3 or 4 per year for women who had conditions across five or more of the
groups.
• The median number of prescriptions increased from 6 per year for women who had no
conditions assessed in this report, to over 50 per year if they had conditions across four or more
of the groups.
For the 1973-78 cohort (from ages 35-40 to 38-43):
• The one-year prevalence of admission to hospital increased from around 30% for women who
had none of the conditions, to around 70% for women who had conditions across three or more
of the groups (noting that some of these women may have been admitted for obstetrics care).
• The median number of general practitioner visits increased from 4 per year for women with no
chronic conditions to 6 per year for women who had conditions across three or more of the
groups.
• The median number of specialist visits increased from 0 per year for women with no chronic
conditions to 1-2 per year for women who had conditions across three or more groups.
• The median number of prescriptions increased from 2 per year for women who had none of the
conditions assessed in this report, to around 11 per year for women who had conditions across
three or more of the groups.
For the 1989-95 cohort (from ages 18-24 to 21-27):
• The one-year prevalence of admission to hospital increased from less than 30% for women
who had none of the conditions considered, to over 60% for women who had conditions across
three or more of the groups.

92
• The median number of general practitioner visits increased from 4 per year for women with
none of the chronic conditions to 8 per year for women who had conditions across three or
more of the groups.
• The median number of specialist visits increased from 0 per year for women with none of the
chronic conditions to 1-2 per year for women who had conditions across four or more of the
groups.
• The median number of prescriptions increased from 2 per year for women who had none of the
conditions assessed in this report, to around 12 per year if they had conditions across four or
more of the groups.
The women’s written comments on the ALSWH surveys illustrate the effects of multiple conditions on
their lives. They underscore the importance of having access to good health professionals they can
trust, a lack of financial barriers to accessing health care, the importance of self-management, and the
need for strong social support systems.
8.2 Conclusion
Overall, this report shows that multimorbidity is common with most women having more than one
chronic condition across more than one group. Moreover, many women had conditions across three or
more groups, representing complex multimorbidity. While levels of morbidity increase with age,
multimorbidity is also common among younger women, and may increase across successive cohorts.
Regardless of whether this increase is due to better diagnosis, better survival, or increased disease
risk, the presence and prevalence of multimorbidity poses particular challenges to the health system.
The first challenge is meeting the demand for health care, with associated costs, infrastructure and
skilled personnel in the health care system. The second challenge is the complexity of effectively
managing multiple conditions where treatments may interact, and where the progress of one condition
may affect the onset or progress of another. However, this challenge must also be considered from the
perspective of the individual woman, and in the context of her life. A person-centred approach to health
and wellbeing is needed to enable women to access health services in a timely and cost-efficient way.
The system needs to provide consistent and coordinated care across the range of physical and mental
health needs. Additionally, there is a need for instrumental and social supports for people with chronic
conditions and ongoing needs for care.

93
9 DISSEMINATION OF STUDY FINDINGS
9.1 Publications
Since the last Technical Report (15 November 2019) there have been 55 publications recorded using
ALSWH data. The most frequently published research themes were chronic conditions, reproductive
health, mental health, and weight, nutrition and physical activity (Table 9-1 ).
Table 9-1 ALSWH publications from November 2019 to November 2020 by research theme.
Theme No. publications
Chronic conditions 21
Reproductive health 20
Weight, nutrition and physical activity 16
Mental Health 13
Social factors in health and wellbeing 10
Health service use 9
Ageing and Aged Care 7
Methodology 5
Formal and informal work patterns and work life balance 3
Abuse 3
Tobacco, alcohol and other drugs 2
Medications 2
Publications in each theme are listed below – please note, publications often encompass more than
one theme, so may be appear in more than one category. A list of all ALSWH publications is available
on the Study website.

94
CHRONIC CONDITIONS
• Abbas SS, Majeed T, Nair BR, Forder P, Weaver N & Byles J. (2020). Patterns of medications for atrial fibrillation among older women: Results from the Australian Longitudinal Study on Women’s Health. Journal of Cardiovascular Pharmacology and Therapeutics; https://doi.org/10.1177/1074248420947278
• Abbas SS, Majeed T, Nair BR, Forder P, Weaver N & Byles J. (2020). Burden of atrial fibrillation and stroke risk among octagenarian and nonagenarian women in Australia. Annals of Epidemiology; 44: 31-37. https://doi.org/10.1016/j.annepidem.2020.02.004
• Cations M, Keage HAD, Laver KE, Byles J & Loxton D. (2020). Intimate partner violence and risk for mortality and incident dementia in older women. Journal of Interpersonal Violence; https://doi.org/10.1177/0886260520943712
• Dam V, Dobson AJ, Onland-Moret NC, van der Schouw YT & Mishra GD. (2020). Vasomotor menopausal symptoms and cardiovascular disease risk in midlife: A longitudinal study. Maturitas; 133: 32-41. https://doi.org/10.1016/j.maturitas.2019.12.011
• Dobson A, Hockey R, Chan HW & Mishra G. (2020). Flexible age-period-cohort modelling illustrated using obesity prevalence data. BMC Medical Research Methodology; 20(16). https://doi.org/10.1186/s12874-020-0904-8
• Dobson AJ, Waller MJ, Hockey R, Dolja-Gore X, Forder PM & Byles JE. (2020). Impact of dementia on health service use in the last 2 years of life for women with other chronic conditions. Journal of the American Medical Directors Association; https://doi.org/10.1016/j.jamda.2020.02.018
• Gao N, Ryan M, Krucien N, Robinson S & Norman R. (2020). Paid work, household work, or leisure? Time allocation pathways among women following a cancer diagnosis. Social Science & Medicine; 246. https://doi.org/10.1016/j.socscimed.2019.112776
• Grieger JA, Hodge A, Mkishra G, Hoham AE & Moran LJ. (2020). The association between dietary intake, asthma, and PCOS in women from the Australian Longitudinal Study on Women’s Health. Journal of Clinical Medicine; 9(1): 233. https://doi.org/10.3390/jcm9010233
• Lamerton TJ, Mielke GI & Brown WJ. (2020). Urinary incontinence in young women: Risk factors, management strategies, help‐seeking behaviour, and perceptions about bladder. Neurourology and Urodynamics; https://doi.org/10.1002/nau.24483
• Luo J, Hodge A, Hendryx M & Byles J. (2020). Age of obesity onset, cumulative obesity exposure over early adulthood and risk of type 2 diabetes. Diabetologica; 63: 519-552. https://doi.org/10.1007/s00125-019-05058-7
• Rayner J, D'Arcy E, Ross LJ, Hodge A & Schoenaker DAJM.(2020). Carbohydrate restriction in midlife is associated with higher risk of type 2 diabetes among Australian women: A cohort study. Metabolism and Cardiovascular Diseases; 30(3): 400-440. https://doi.org/10.1016/j.numecd.2019.11.001

95
• Tay CT, Moran LJ, Harrison CL, Brown WJ & Joham AE. (2020). Physical activity and sedentary behaviour in women with and without polycystic ovary syndrome: An Australian population-based cross- sectional study. Clinical Endocrinology; 93(2):154-162. https://doi.org/10.1111/cen.14205
• Tay CT, Teede HJ, Loxton D, Kulkarni j & Joham AE. (2020). Psychiatric comorbidities and adverse childhood experiences in women with self-reported polycystic ovary syndrome: An Australian population-based study. Psychoneuroendocrinology; 116: 104678. https://doi.org/10.1016/j.psyneuen.2020.104678
• Thapaliya K, Harris ML & Byles JB. Use of medication reviews among older women with dementia, 2003-2015: A longitudinal cohort study. Australasian Journal on Ageing; https://doi.org/10.1111/ajag.12836
• Thong EP, Milat F, Joham AE, Mishra GD & Teede H. (2020). Obesity, menstrual irregularity and polycystic ovary syndrome in young women with type 1 diabetes: A population‐based study. Clinical Endocrinology; https://doi.org/10.1111/cen.14281
• Tollosa DN, Holliday E, Hure A, Tavener M & James EL. (2020). A 15-year follow-up study on long-term adherence to health behaviour recommendations in women diagnosed with breast cancer. Breast Cancer Research and Treatment; 182: 727-738. https://doi.org/10.1007/s10549-020-05704-4
• Tollosa DN, Holliday E, Hure A, Tavener M, James EL. (2020). Multiple health behaviours before and after a cancer diagnosis among women: A repeated cross-sectional analysis over 15 years. Cancer Medicine; 9(9): 3224-3233. https://doi.org/10.1002/cam4.2924
• Wubishet BL, Byles JE, Harris ML & Jagger C. Impact of diabetes on life and healthy life expectancy among older women. The Journals of Gerontology: Series A; https://doi.org/10.1093/gerona/glaa172
• Wubishet BL, Harris ML, Forder PM & Byles JE. (2020). Age and cohort rise in diabetes prevalence among older Australian women: Case ascertainment using survey and healthcare administrative data. PLOS One; 15. https://doi.org/10.1371/journal.pone.0234812
• Xu X, Jones M & Mishra GD. (2020). Age at natural menopause and development of chronic conditions and multimorbidity: results from an Australian prospective cohort. Human Reproduction; 35(1): 203-211. https://doi.org/10.1093/humrep/dez259
Accepted for publication
Rowlands IJ, Abbott JA, Montgomery GW, Hockey R, Rogers P & Misrha GD. Prevalence and incidence of endometriosis in Australian women: A data linkage cohort study. Journal of Obstetrics and Gynaecology

96
REPRODUCTIVE HEALTH
• Cao S, Jones M, Tooth L & Mishra GD. (2020). History of premenstrual syndrome and development of postpartum depression: A systematic review and meta-analysis. Journal of Psychiatric Research; 121:82-90. https://doi.org/10.1016/j.jpsychires.2019.11.010
• Cao S, Jones M, Tooth L & Mishra G. (2020). Does premenstrual syndrome before pregnancy increase the riskof postpartum depression? Findings from the Australian Longitudinal Study on Women’s Health. Journal of Affective Disorders; https://doi.org/10.1016/j.jad.2020.09.130
• Copp T, Cvejic E, McCaffery K, Hersch J, Doust J, Mol BW, Dokras A, Mishra G & Jansen J. (2020). Human Reproduction; 35(2): 394-403. https://doi.org/ 10.1093/humrep/dez274
• Dam V, Dobson AJ, Onland-Moret NC, van der Schouw YT & Mishra GD. (2020). Vasomotor menopausal symptoms and cardiovascular disease risk in midlife: A longitudinal study. Maturitas; 133: 32-41. https://doi.org/10.1016/j.maturitas.2019.12.011
• Gete DG, Waller M & Mishra GD. (2020). Pre-pregnancy diet quality and its association with offspring behavioural problems. European Journal of Nutrition. https://doi.org/10.1007/s00394-020-02264-7
• Gete DG, Waller M, Mishra GD. (2020). Pre pregnancy dietary patterns and risk of preterm birth and low birth weight: Findings from the Australian Longitudinal Study on Women's Health. American Journal of Clinical Nutrition; 111(5):1048-1058. https://doi.org/10.1093/ajcn/nqaa057
• Grieger JA, Hodge A, Mkishra G, Hoham AE & Moran LJ. (2020). The association between dietary intake, asthma, and PCOS in women from the Australian Longitudinal Study on Women’s Health; Journal of Clinical Medicine; 9(1): 233. https://doi.org/10.3390/jcm9010233
• Hendryx M, Chojenta C & Byles JE. (2020). Latent class analysis of low birth weight and preterm delivery among Australian women. The Journal of Pediatrics; 218. https://doi.org/10.1016/j.jpeds.2019.11.007
• Martin JC, Joham AE, Mishra GD, Hodge AM, Moran LJ & Harrison CL. (2020). Postpartum diet quality: A cross-sectional analysis from the Australian Longitudinal Study on Women’s Health. Journal of Clinical Medicine; 9(2); 446. https://doi.org/10.3390/jcm9020446
• Mena GP, Mielke GI & Brown WJ. (2020). Do physical activity, sitting time and body mass index affect fertility over a 15-year period in women? Data from a large population-based cohort study. Human Reproduction; 35(3): 676–683. https://doi.org/10.1093/humrep/dez300
• Moss KM, Dobson AJ, Tooth L & Mishra GD. (2020). Associations between feeding practices in infancy and fruit and vegetable consumption in childhood. British Journal of Nutrition. https://doi.org/10.1017/S000711452000238X
• Moss KM, Dobson AJ & Mishra GD. (2020). Testing the role of the timing and chronicity of maternal depressive symptoms in the associations with child behaviour and development. Pediatric and Perinatal Epidemiology. https://doi.org/10.1111/ppe.12681

97
• Moss KM, Reilly N, Dobson AJ, Loxton D, Tooth L & Mishra GD. (2020). How rates of perinatal mental health screening in Australia have changed over time and which women are missing out. Australian and New Zealand Journal of Public Health; 44(4):301-306. https://doi.org/10.1111/1753-6405.12999
• Moss KM, Dobson AJ, Tooth L & Mishra GD. (2020). Which Australian women do not exclusively breastfeed to 6 months, and why? Journal of Human Lactation. https://doi.org/10.1177/0890334420929993
• Rowlands IJ, Mishra GD & Lucke JC. (2020). Association between young women’s physical and mental health and their method of contraception in a longitudinal, population-based study. BMJ Sexual & Reproductive Health. http://dx.doi.org/10.1136/bmjsrh-2019-200479
• Tay CT, Moran LJ, Harrison CL, Brown WJ & Joham AE. (2020). Physical activity and sedentary behaviour in women with and without polycystic ovary syndrome: An Australian population-based cross- sectional study. Clinical Endocrinology; 93(2):154-162. https://doi.org/10.1111/cen.14205
• Tay CT, Teede HJ, Loxton D, Kulkarni j & Joham AE. (2020). Psychiatric comorbidities and adverse childhood experiences in women with self-reported polycystic ovary syndrome: An Australian population-based study. Psychoneuroendocrinology; 116: 104678. https://doi.org/10.1016/j.psyneuen.2020.104678
• Thong EP, Milat F, Joham AE, Mishra GD & Teede H. (2020). Obesity, menstrual irregularity and polycystic ovary syndrome in young women with type 1 diabetes: A population‐based study. Clinical Endocrinology. https://doi.org/10.1111/cen.14281
• Xu X, Jones M & Mishra GD. (2020). Age at natural menopause and development of chronic conditions and multimorbidity: Results from an Australian prospective cohort. Human Reproduction; 35(1): 203-211. https://doi.org/10.1093/humrep/dez259
Accepted for publication
Rowlands IJ, Abbott JA, Montgomery GW, Hockey R, Rogers P & Misrha GD. Prevalence and incidence of endometriosis in Australian women: A data linkage cohort study. Journal of Obstetrics and Gynaecology
WEIGHT, NUTRITION AND PHYSICAL ACTIVITY
• Aljadani HM, Patterson A, Sibbritt D, Taylor RM & Collins CE. (2019). Frequency and variety of usual intakes of healthy foods, fruit, and vegetables predicts lower 6-year weight gain in young women. European Journal of Clinical Nutrition, 74: 945-952. https://doi.org/10.1038/s41430-019-0532-8
• Aljadani HM, Patterson A, Sibbritt D, Taylor RM & Collins CE.(2020). Improving diet quality over nine-years is associated with less weight gain in mid-age Australian women: A cohort study.

98
Nutrition, Metabolism and Cardiovascular Diseases; 30(2): 223-232. https://doi.org/10.1016/j.numecd.2019.10.003
• Baldwin JN, Forder PM, Haslam RL, Hure AJ, Loxton DJ, Patterson AJ & Collins CE. (2020). Change in diet quality over 12 years in the 1946–1951 cohort of the Australian Longitudinal Study on Women’s Health. Nutrients, 12(1): 147. https://doi.org/10.3390/nu12010147
• Dobson A, Hockey R, Chan HW & Mishra G. (2020). Flexible age-period-cohort modelling illustrated using obesity prevalence data. BMC Medical Research Methodology; 20(16). https://doi.org/10.1186/s12874-020-0904-8
• Gete DG, Waller M & Mishra GD. (2020). Pre-pregnancy diet quality and its association with offspring behavioural problems. European Journal of Nutrition; https://doi.org/10.1007/s00394-020-02264-7
• Gomes GAO, Brown WJ, Codogno JS & Mielke GI. (2020). Twelve year trajectories of physical activity and health costs in mid-age Australian women. International Journal of Behavioural Nutrition and Physical Activity; 17: Art. No. 101. https://doi.org/10.1186/s12966-020-01006-6
• Grieger JA, Hodge A, Mkishra G, Hoham AE & Moran LJ. (2020). The association between dietary intake, asthma, and PCOS in women from the Australian Longitudinal Study on Women’s Health; Journal of Clinical Medicine; 9(1): 233. https://doi.org/10.3390/jcm9010233
• Lamerton TJ, Mielke GI & Brown WJ. (2020). Urinary incontinence in young women: Risk factors, management strategies, help‐seeking behaviour, and perceptions about bladder. Neurourology and Urodynamics; https://doi.org/ 10.1002/nau.24483
• Luo J, Hodge A, Hendryx M & Byles J. (2020). Age of obesity onset, cumulative obesity exposure over early adulthood and risk of type 2 diabetes. Diabetologica; 63: 519-552. https://doi.org/10.1007/s00125-019-05058-7
• Martin JC, Joham AE, Mishra GD, Hodge AM, Moran LJ & Harrison CL. (2020). Postpartum diet quality: A cross-sectional analysis from the Australian Longitudinal Study on Women’s Health. Journal of Clinical Medicine; 9(2); 446. https://doi.org/10.3390/jcm9020446
• Mena GP, Mielke GI & Brown WJ. (2020). Do physical activity, sitting time and body mass index affect fertility over a 15-year period in women? Data from a large population-based cohort study. Human Reproduction; 35(3): 676–683. https://doi.org/10.1093/humrep/dez300
• Moss KM, Dobson AJ, Tooth L & Mishra GD. (2020). Associations between feeding practices in infancy and fruit and vegetable consumption in childhood. British Journal of Nutrition. https://doi.org/10.1017/S000711452000238X
• Rayner J, D'Arcy E, Ross LJ, Hodge A & Schoenaker DAJM.(2020). Carbohydrate restriction in midlife is associated with higher risk of type 2 diabetes among Australian women: A cohort study. Metabolism and Cardiovascular Diseases; 30(3): 400-440. https://doi.org/10.1016/j.numecd.2019.11.001

99
• Ribeiro LW, Moss KM & Mishra GD. (2020). Dietary patterns and allergy in children aged 5-12 years in Australia: Findings from the Mothers and their Children’s Health study. Allergology International; https://doi.org/10.1016/j.alit.2020.04.012
• Tay CT, Moran LJ, Harrison CL, Brown WJ & Joham AE. (2020). Physical activity and sedentary behaviour in women with and without polycystic ovary syndrome: An Australian population-based cross- sectional study. Clinical Endocrinology; 93(2):154-162. https://doi.org/10.1111/cen.14205
• Thong EP, Milat F, Joham AE, Mishra GD & Teede H. (2020). Obesity, menstrual irregularity and polycystic ovary syndrome in young women with type 1 diabetes: A population‐based study. Clinical Endocrinology. https://doi.org/10.1111/cen.14281
MENTAL HEALTH
• Aulike IA, Dobson AJ, Egwunye J, Fitzgerald DM & Mishra GD. (2020). Assessing agreement between the K10 and MHI-5 measures of psychological wellbeing. Applied Research in Quality of Life; https://rdcu.be/b6y4h
• Baldwin J, Forder PM, Haslam RL, Hure AJ, Loxton DJ, Patterson AJ & Collins CE. (2020). Change in diet quality over 12 years in the 1946-51 cohort of the Australian Longitudinal Study on Women’s Health. Nutrients; 12(1): 147. https://doi.org/10.3390/nu12010147
• Cao S, Jones M, Tooth L & Mishra GD. (2020). History of premenstrual syndrome and development of postpartum depression: A systematic review and meta-analysis. Journal of Psychiatric Research; 121:82-90. https://doi.org/10.1016/j.jpsychires.2019.11.010
• Cao S, Jones M, Tooth L & Mishra G. (2020). Does premenstrual syndrome before pregnancy increase the riskof postpartum depression? Findings from the Australian Longitudinal Study on Women’s Health. Journal of Affective Disorders; https://doi.org/10.1016/j.jad.2020.09.130
• Dobson AJ, Waller MJ, Hockey R, Dolja-Gore X, Forder PM & Byles JE. (2020). Impact of dementia on health service use in the last 2 years of life for women with other chronic conditions. Journal of the American Medical Directors Association; https://doi.org/10.1016/j.jamda.2020.02.018
• Lucke J & Johnstone M. (2020). “It’s been a bit of a rollercoaster”: Australian women’s difficulties and coping strategies. Issues in Mental Health Nursing; https://doi.org/10.1080/01612840.2020.1770386
• Moss KM, Dobson AJ & Mishra GD. (2020). Testing the role of the timing and chronicity of maternal depressive symptoms in the associations with child behaviour and development. Paediatric and Perinatal Epidemiology. https://doi.org/10.1111/ppe.12681

100
• Moss KM, Loxton D, Dobson A, Slaughter V & Mishra GD. (2020). Testing competing mediators of the association between pre-conception maternal depression and child-health related quality of life: The MatCH study. Archives of Women’s Mental Health, 25:53-62. https://doi.org/10.1007/s00737-019-01014-x
• Moss KM, Reilly N, Dobson AJ, Loxton D, Tooth L & Mishra GD. (2020). How rates of perinatal mental health screening in Australia have changed over time and which women are missing out. Australian and New Zealand Journal of Public Health; 44(4):301-306. https://doi.org/10.1111/1753-6405.12999
• Rowlands IJ, Mishra GD & Lucke JC. (2020). Association between young women’s physical and mental health and their method of contraception in a longitudinal, population-based study. BMJ Sexual & Reproductive Health. http://dx.doi.org/10.1136/bmjsrh-2019-200479
• Tay CT, Teede HJ, Loxton D, Kulkarni j & Joham AE. (2020). Psychiatric comorbidities and adverse childhood experiences in women with self-reported polycystic ovary syndrome: An Australian population-based study. Psychoneuroendocrinology; 116: 104678. https://doi.org/10.1016/j.psyneuen.2020.104678
• Thapaliya K, Harris ML & Byles JB. Use of medication reviews among older women with dementia, 2003-2015: A longitudinal cohort study. Australasian Journal on Ageing; https://doi.org/10.1111/ajag.12836
Accepted publication
Hendryx M, Luo J, Chojenta C & Byles JE. Air pollution increases depression risk among young women:
Possible natural world resiliencies. Ecopsychology
SOCIAL FACTORS IN HEALTH AND WELLBEING
• Callender D, Mooney-Somers J, Keen P, Guy R, Duck T, Bavinton BR, Grulich AE, Holt M & Prestage G. (2020). Australian 'gayborhoods' and 'lesborhoods': A new method for estimating the number of adult gay men and lesbian women living in each. International Journal of Geographical Information Science, https://doi.org/10.1080/13658816.2019.1709973
• Campbell A, Perales F & Baxter J. (2020). Sexual minority women in longitudinal survey research: Is attrition a problem? Archives of Sexual Behaviour; 49(5): 1443-1461. https://doi.org/10.1007/s10508-020-01669-z
• Campbell A, Perales F & Baxter J. Changes in sexual identity labels in a contemporary cohort of emerging adult women: Patterns, prevalence and a typology. The Journal of Sex Research; https://doi.org/10.1080/00224499.2020.1814092
• Doiron D & Kettlewell N. (2020). Family formation and the demand for health insurance. Health Economics; 29(4): 523-533. https://doi.org/10.1002/hec.4000

101
• Johnstone M, Lucke J & Hewitt B. (2020). Life transitions and women’s desired number of children: The impact of motherhood, relationships and employment. Community, Work and Family; https://doi.org/10.1080/13668803.2020.1744526
• Lucke J & Johnstone M. (2020). “It’s been a bit of a rollercoaster”: Australian women’s difficulties and coping strategies. Issues in Mental Health Nursing; https://doi.org/10.1080/01612840.2020.1770386
• Moss K, Dobson A, Edwards KL, Hesketh KD, Chang Y-T & Mishra GD. (2020). Not all play equipment is created equal: Associations between equipment at home and children’s physical activity.Journal of Physical Activity and Health; 16(11):945-951. https://doi.org/10.1123/jpah.2019-0075
• Moss KM, Dobson AJ & Mishra GD. (2020). Testing the role of the timing and chronicity of maternal depressive symptoms in the associations with child behaviour and development. Pediatric and Perinatal Epidemiology. https://doi.org/10.1111/ppe.12681
• Moss KM, Loxton D, Dobson A, Slaughter V & Mishra GD. (2020). Testing competing mediators of the association between pre-conception maternal depression and child-health related quality of life: The MatCH study. Archives of Women’s Mental Health, 25:53-62. https://doi.org/10.1007/s00737-019-01014-x
Accepted publication
Hendryx M, Luo J, Chojenta C & Byles JE. Air pollution increases depression risk among young women: possible natural world resiliencies. Ecopsychology
HEALTH SERVICE USE
• Abbas SS, Majeed T, Nair BR, Forder P, Weaver N & Byles J. (2020). Patterns of medications for atrial fibrillation among older women: Results from the Australian Longitudinal Study on Women’s Health. Journal of Cardiovascular Pharmacology and Therapeutics; https://doi.org/10.1177/1074248420947278
• Dobson AJ, Waller MJ, Hockey R, Dolja-Gore X, Forder PM & Byles JE. (2020). Impact of dementia on health service use in the last 2 years of life for women with other chronic conditions. Journal of the American Medical Directors Association; https://doi.org/10.1016/j.jamda.2020.02.018
• Gomes GAO, Brown WJ, Codogno JS & Mielke GI. (2020). Twelve year trajectories of physical activity and health costs in mid-age Australian women. International Journal of Behavioural Nutrition and Physical Activity; 17: Art. No. 101. https://doi.org/10.1186/s12966-020-01006-6
• Hendryx M, Chojenta C & Byles JE. (2020). Latent class analysis of low birth weight and preterm delivery among Australian women. The Journal of Pediatrics; 218. https://doi.org/10.1016/j.jpeds.2019.11.007

102
• Moss KM, Reilly N, Dobson AJ, Loxton D, Tooth L & Mishra GD. (2020). How rates of perinatal mental health screening in Australia have changed over time and which women are missing out. Australian and New Zealand Journal of Public Health; 44(4):301-306. https://doi.org/10.1111/1753-6405.12999
• Rahman M & Byles J. (2020). Older women’s patterns of home and community care use and residential transition: An Australian cohort study. Maturitas; 131:28-33. https://doi.org/10.1016/j.maturitas.2019.10.004
• Shebeshi DS, Dolja-Gore X & Byles J. (2020). Estimating unplanned and planned hospitalization incidents among older Australian women aged 75 years and over: The presence of death as a completing risk. Health Planning and Management; https://doi.org/10.1002/hpm.3030
• Wilson L, Xu Z, Mishra G, Dobson AJ & Doust J. Did changes to recommended testing criteria affect the rate of vitamin D testing among Australian women? Archives of Osteoporosis, 15(1): 162. https://doi.org/10.1007/s11657-020-00840-2
• Wubishet BL, Harris ML, Forder PM & Byles JE. (2020). Age and cohort rise in diabetes prevalence among older Australian women: case ascertainment using survey and healthcare. PLOS One; https://doi.org/10.1371/journal.pone.0234812
AGEING AND AGED CARE
• Abbas SS, Majeed T, Nair BR, Forder P, Weaver N & Byles J. (2020). Patterns of medications for atrial fibrillation among older women: Results from the Australian Longitudinal Study on Women’s Health. Journal of Cardiovascular Pharmacology and Therapeutics; https://doi.org/10.1177/1074248420947278
• Abbas SS, Majeed T, Nair BR, Forder P, Weaver N & Byles J. (2020). Burden of atrial fibrillation and stroke risk among octagenarian and nonagenarian women in Australia. Annals of Epidemiology; 44: 31-37. https://doi.org/10.1016/j.annepidem.2020.02.004
• Dobson AJ, Waller MJ, Hockey R, Dolja-Gore X, Forder PM & Byles JE. (2020). Impact of dementia on health service use in the last 2 years of life for women with other chronic conditions. Journal of the American Medical Directors Association; https://doi.org/10.1016/j.jamda.2020.02.018
• Rahman M & Byles J. (2020). Older women’s patterns of home and community care use and residential transition: An Australian cohort study. Maturitas; 131:28-33. https://doi.org/10.1016/j.maturitas.2019.10.004
• Shebeshi DS, Dolja-Gore X & Byles J. (2020). Estimating unplanned and planned hospitalization incidents among older Australian women aged 75 years and over: The presence of death as a completing risk. Health Planning and Management; https://doi.org/10.1002/hpm.3030

103
• Thapaliya K, Harris ML & Byles JB. Use of medication reviews among older women with dementia, 2003-2015: A longitudinal cohort study. Australasian Journal on Ageing; https://doi.org/10.1111/ajag.12836
• Wubishet BL, Byles JE, Harris ML & Jagger C. Impact of diabetes on life and healthy life expectancy among older women. The Journals of Gerontology: Series A; https://doi.org/10.1093/gerona/glaa172
METHODOLOGY
• Aulike IA, Dobson AJ, Egwunye J, Fitzgerald DM & Mishra GD. (2020). Assessing agreement between the K10 and MHI-5 measures of psychological wellbeing. Applied Research in Quality of Life; https://rdcu.be/b6y4h
• Campbell A, Perales F & Baxter J. (2020). Sexual minority women in longitudinal survey research: Is attrition a problem? Archives of Sexual Behaviour; 49(5): 1443-1461. https://doi.org/10.1007/s10508-020-01669-z
• Dobson A, Hockey R, Chan HW & Mishra G. (2020). Flexible age-period-cohort modelling illustrated using obesity prevalence data. BMC Medical Research Methodology, 20:16. https://doi.org/10.1186/s12874-020-0904-8
• Liverani S, Leigh L, Hudson IL & Byles JE. (2020). Clustering method for censored and collinear survival data. Computational Statistics; https://doi.org/10.1007/s00180-020-01000-3
• Shebeshi DS, Dolja-Gore X & Byles J. (2020). Estimating unplanned and planned hospitalization incidents among older Australian women aged 75 years and over: The presence of death as a completing risk. Health Planning and Management; https://doi.org/10.1002/hpm.3030
FORMAL AND INFORMAL WORK PATTERNS AND WORK/LIFE BALANCE
• Doiron D & Kettlewell N. (2020). Family formation and the demand for health insurance. Health Economics; 29(4): 523-533. https://doi.org/10.1002/hec.4000
• Gao N, Ryan M, Krucien N, Robinson S & Norman R. (2020). Paid work, household work, or leisure? Time allocation pathways among women following a cancer diagnosis. Social Science & Medicine; 246. https://doi.org/10.1016/j.socscimed.2019.112776
• Johnstone M, Lucke J & Hewitt B. (2020). Life transitions and women’s desired number of children: The impact of motherhood, relationships and employment. Community, Work and Family; https://doi.org/10.1080/13668803.2020.1744526

104
ABUSE
• Cations M, Keage HAD, Laver KE, Byles J & Loxton D. (2020). Intimate partner violence and risk for mortality and incident dementia in older women. Journal of Interpersonal Violence. https://doi.org/10.1177/0886260520943712
• Consistency and inconsistency of young women’s reporting of intimate partner violence in a population-based study. Rowlands IJ, Holder C, Forder P, Hegarty K, Dobson AJ & Loxton D. Violence Against Women, 2020. https://doi.org/10.1177/1077801220908324
• Tay CT, Teede HJ, Loxton D, Kulkarni j & Joham AE. (2020). Psychiatric comorbidities and adverse childhood experiences in women with self-reported polycystic ovary syndrome: An Australian population-based study. Psychoneuroendocrinology; 116: 104678. https://doi.org/10.1016/j.psyneuen.2020.104678
TOBACCO, ALCOHOL AND OTHER DRUGS
• Anderson AE, Cavenagh D, Forder P, Loxton D & Byles J. (2020). Alcohol-related risk from pre-loading and heavy episodic drinking (HED) among a cohort of young Australian women: A cross-sectional analysis. Australian and New Zealand Journal of Public Health; https://doi.org/10.1111/1753-6405.13018
• Melka AS, Chojenta CL, Holliday EG & Loxton DJ. (2020). E-cigarette use and cigarette smoking initiation among Australian women who have never smoked. Drug and Alcohol Review; https://doi.org/10.1111/dar.13131
MEDICATIONS
• Abbas SS, Majeed T, Nair BR, Forder P, Weaver N & Byles J. (2020). Patterns of medications for atrial fibrillation among older women: Results from the Australian Longitudinal Study on Women’s Health. Journal of Cardiovascular Pharmacology and Therapeutics; https://doi.org/10.1177/1074248420947278
• Thapaliya K, Harris ML & Byles JB. Use of medication reviews among older women with dementia, 2003-2015: A longitudinal cohort study. Australasian Journal on Ageing; https://doi.org/10.1111/ajag.12836

105
9.2 Conference Presentations
Due to COVID-19 restrictions some conferences in 2020 have been cancelled, and others offered
online. 28 presentations using ALSWH data had been recorded in our database since the last Technical
Report.
• Baldwin JN, Forder P, Haslam R, Hure A, Loxton DJ, Patterson AJ & Collins CE. Change in diet quality and 15-year healthcare costs in the mid-age cohort of the Australian Longitudinal Study on Women’s Health. 2020 International Society of Behavioural Nutrition and Physical Activity (ISBNPA), XChange, Auckland, New Zealand (online), 17 - 20 June 2020.
• Bennet CJ, Mansfield D, Mo L, Hodge A, Joham J Cain S, Blumfield M, Teede H & Moran L. Sleeping behaviour in women with and without polycystic ovary syndrome (PCOS) and their association with lifestyle factors (diet, physical activity and sitting time). Poster presentation. ENDO 2020, San Francisco, USA 28-31 March 2020.
• Byles J. A decade of healthy ageing? What good looks like and how we get there? International Longevity Centre UK Webinar. 23 July 2020.
• Byles J. Promoting prevention across the life course: The role of policymakers and civil society. Prevention in an ageing world – G20 side event. (Invited speaker). ANA Crowne Plaza Hotel, Okayama, Japan, 18 October 2019.
• Byles J. Six essential aspects for LTC: An evidence-based evaluation of the Australian LTC system. 2019 Asia-Pacific Policy Forum for Long-term Care in Aging: Facing the Aged Society and Future of Long-term Care. (Invited speaker). Kaoshiung Medical University, Kaoshiung, Taiwan, 21 October 2019.
• Byles J. Health and wellbeing: Golden assets in a silver world. IAGG 11th IAGG Asia/Oceania Regional Congress 2019. (Keynote speaker). Taipei, Taiwan, 23-27 October 2019.
• Byles J. Integrating prevention in policy (Australian perspective). IAGG 11th IAGG Asia/Oceania Regional Congress 2019. Taipei, Taiwan, 23-27 October 2019,
• Byles J, Rahman M, Princehorn E, Holliday E, Leigh L, Loxton D, Beard J, Kowal P, Jagger C. Successful ageing from old to very old: Findings from a longitudinal study of 12,432 women from Australia. 52nd AAG conference, ICC Darling Harbour, Sydney, Australia. 5-8 November 2019.
• Byles J. Six essential aspects for LTC: An evidence-based evaluation of the Australian LTC system. International Longevity Centre Global Alliance long-term care and care giving symposium. The Benevolent Society, Glebe, NSW, Australia, 5 November 2019.
• Byles J. Healthy Ageing: A multi-dimensional perspective contrasting measures of older people’s abilities against their own experiences. Centre for Excellence in Population Ageing Research (CEPAR). (Invited Speaker)University of New South Wales Business School. Sydney, 28 January 2020.

106
• Byles J. 6th Annual MARC Symposium: From Cells to Society – The most recent trends in Research and Ageing. Virtual symposium. 15 and 17 July, 2020.
• Campbell A, Perales F & Baxter J. Patterns and prevalence of sexual identity change: Evidence from two cohorts of Australian women. International Academy of Sex Researchers 2020 Virtual Meeting, 29 July 2020.
• Gete DG, Waller M & Mishra GD. Pre-pregnancy diet quality and its association with offspring behavioural problems. Nutrition 2020 Live Online, 30 May - 2 June 2020.
• Melka A, Chojenta C, Holliday E & Loxton D. Adverse childhood experiences and electronic cigarette use among young Australian women (Poster presentation). Australian Society of Behavioural Health and Medicine (ASBHM) Annual Scientific Meeting, Sydney, NSW 5 - 7 February 2020.
• Mishra GD. A life course approach to preconception health and pregnancy planning. 9th International Conference on Birth Defects and Disabilities in the Developing World, Colombo, Sri Lanka, 23 - 26 February 2020.
• Mishra G. Causes and consequences of premature and early menopause: Results from the InterLACE consortium. European Menopause and Andropause Society, Berlin, Germany,15 May 2019.
• Mishra G. Epidemiology of endometriosis. Australasian Gynaecological Endoscopy & Surgery Society (AGES) and The World Endometriosis Society (WES) meeting, Melbourne, 2-3 August 2019.
• Mishra G. Epidemiology of endometriosis. Society for Reproductive Biology Meeting, Sydney, 17 August 2019.
• Mishra G. Long term health outcomes after hysterectomy. Royal Australian and New Zealand College of Obstetricians and Gynaecologists (RANZCOG) Annual Scientific Meeting, Melbourne,13 -16 October 2019.
• Mishra G. Jean Hailes Women’s Health symposium (keynote speaker), Canberra, 22-23 October 2019.
• Mishra G. Norwegian Epidemiological Association. Oslo, Norway,13 -14 November 2019.
• Mishra G. Seminar. The Centre for Fertility and Health at the Norwegian Institute of Public Health, Oslo, Norway, 15 November 2019.
• Mishra G. 2019 International Conference for Intelligence and Big Health (Plenary speaker), Zhejiang University & the Second Affiliated Hospital of Zhejiang University School of Medicine, Hangzhou, China, 5-8 December 2019.

107
• Rahman M, Byles JE, Holliday E. Association between patterns of community care use and RAC admission. 52nd AAG conference, ICC Darling Harbour, Sydney, Australia, 5-8 November 2019.
• Shehzad S, Byles JE, Nair K, Majeed T, Weaver N. Atrial fibrillation – Medication patterns in older women in Australia. 52nd AAG conference, ICC Darling Harbour, Sydney, Australia, 5-8 November 2019.
• Thapaliya K, Byles JE, Harris M. Prevalence of drugs use before and after dementia diagnosis. 52nd AAG conference, ICC Darling Harbour, Sydney, Australia, 5-8 November 2019.
• Thiruchelvam K, Hasan SS, Wong PS, Byles J, Kairuz T. Uptake of medication reviews among older women in the Australian Longitudinal Study of Women’s Health. 52nd AAG conference, ICC Darling Harbour, Sydney, Australia, 5-8 November 2019.
• Tollosa D. A 15-year follow-up study on long-term adherence to health behaviour recommendations in women diagnosed with breast cancer (poster presentation). 2020 International Society of Behavioural Nutrition and Physical Activity (ISBNPA), XChange, Auckland, New Zealand (online), 17 - 20 June 2020.
• Wubishet B, Byles J, Harris M, Jagger C. Impact of diabetes on life expectancy and healthy life expectancy among older Australian women. 18th National Conference of Emerging Researchers in Ageing, Sydney, Australia, 4-7 November 2019.
9.3 Media
Research from the Study has been reported in a range of mainstream media throughout the year.
Details are shown in Table 9-2.

108
Table 9-2 ALSWH media from October 2019 – November 2020
Date Media Media Source Topic Investigator Details
2019
28 October
31 October
Online Mercola (USA) Fermented dairy lowers heart disease
Amée Buziau
Prof Gita Mishra
26 November Online 137 local online news sites around the US including: Northwest Georgia News, Pittswburge Post-Gazette, The Punxsutawney Spirit
Vifor Pharma raises awareness on Iron Deficiency Day 2019 for people around the world to take iron seriously (ALSWH cited)
21-26 December
Online Malaysia News
NewKerala.com (India)
Malay Mail
The International Business Times Singapore
The Shillong Times (India)
Yahoo Malaysia
Yahoo Singapore
Longer exposure to obesity linked to high diabetes risk
A/Prof Juhua Luo
Prof Julie Byles

109
Date Media Media Source Topic Investigator Details
2020
08 January
30 January
Gulf News (UAE)
Healio (USA)
Bariatric News
Pharmacy Times
A/Prof Juhua Luo
Prof Julie Byles
20 – 25 January Online Yahoo News UK
Medical Xpress
Medindia
Aged Care Insite (Australia)
Health Medicine Network (USA)
Yahoo News Singapore
MSN Health UK
Medical News Bulletin (India)
MD Alert (USA)
Australian Doctor
Medscape (USA)
Premature menopause increases the risk of chronic disease
Dr Xaolin Xu
Prof Gita Mishra
25 January Online Midwives (UK) Honesty in perinatal screening Peta Forder

110
Date Media Media Source Topic Investigator Details
8 April Online Medscape (USA) PCOS impacts on diet, physical activity and Contraceptive use
Tessa Copp
16 April Online Medical Express
Xinhua News (China)
The Courier Mail (QLD)
The Medical News (Australia)
Physician Briefings (USA)
Physicians Weekly (USA)
MSN India news
Healio USA
Traditional vegetable diet lowers the risk of preterm birth
Dereje Gete
Prof Gita Mishra
17 April Online /Podcast
The Conversation
Player FM (USA)
Daily Bulletin (Australia)
Childhood, adolescence, pregnancy, menopause, 75+: how your diet should change with each stage of life
Prof Clare Collins
28 May
29 May
Online
Radio
The Age
The Sydney Morning Herald
Brisbane Times
WA Today
936 ABC Hobart
COVID-19 Reports – Young women affected worst by stress in the COVID era
Prof Deborah Loxton

111
Date Media Media Source Topic Investigator Details
4 – 14 June Online The Sun (UK)
National Tribune (Australia)
Mirage News (Australia)
Brisbane Times
The Age
WA Today
The Sydney Morning Herald
Daily Mail Online (UK)
MSN (Ireland)
Yahoo Singapore
Yahoo UK
MSN UK
Australian Doctor
Breast is best push out of touch Dr Katrina Moss
9-12 June
Online
Medical Xpress (UK)
Medindia
Daily Bulletin
The Conversation
1 in 5 new mums do not receive mental health screening
Dr Katrina Moss
Dr Nicole Reilly

112
Date Media Media Source Topic Investigator Details
9 June
10 June
11 June
12 June
Radio
Online
Radio
Baby Gaga (Canada)
Eveningreport.NZ
ABC Capricornia FM
ABC Northwest Queensland
ABC Tropical North FM
ABC Far North Qld
Essential Baby (Australia)
Babyology
Australian Doctor
1233 ABC Newcastle
ABC Upper Hunter AM
15 – 24 June
Online
67 articles including:
Hindustan Times (India)
Punjab Tribune (India)
Medical Express (UK)
The Medical News (Australia)
Health Medicine Network (USA)
Yahoo India
Maternal Depression – seeking help sooner is best for mums and kids
Dr Katrina Moss

113
Date Media Media Source Topic Investigator Details
23 July Online Parent Herald (USA) Early menstruation linked to hot flashes during menopause
Prof Gita Mishra
11 August Online
Radio
Mirage News
National Tribute
1233 ABC Newcastle
ABC Upper Hunter AM
Recognising the hazardous effects of pre-loading with alcohol
Dr Amy Anderson
11 November Online Hunerheadline.com.au
National Tribune
Mirage News
$8.5 million secured to continue longest women’s health study
Prof Julie Byles
Prof Deborah Loxton

114
9.4 Social media
During the year, details of Study outcomes and activities have been posted on the Study’s social media
accounts on Facebook, Twitter and Instagram. In the early period of the COVID-19 pandemic the Study
used these social media channels to provide information about changes in the Study’s activity and to
support distribution of official messaging developed through the Australian Government’s
HealthDirect.gov.au website.
As in previous years, content posted to Facebook continued to be aimed at a lay audience - particularly
participants. The Study’s Facebook has around 9, 812 followers. Roughly 95% of the audience is female
and is most likely to be participants from the 1989-95 cohort, with some from the 1973-78 cohort, and
a few from the 1946-51cohort. We share lay summaries, news releases, media and important updates
from the study on Facebook, with each post reaching between 400 and 2000 people.
The Twitter account promotes engagement with collaborators, other researchers, media professionals,
policy makers, and non-government organisations (NGOs) as well as the general public. Tweets
highlight study news, data releases, journal papers, lay summaries and attendance at conferences. The
account currently has 1,663 followers.
This year, the Study took advantage of recent changes to Instagram, and restarted its Instagram
account to share infographics and brief lay summaries. This account is aimed at a lay audience and is
promoted to participants. It also acquires new followers and post views from people following specific
hashtags. The Instagram account currently has 337 followers.
9.5 Website
The ALSWH website (www.alswh.org.au) continues to be an important portal for communication of
ALSWH activities to the wider community. During this year, the website has been redeveloped to
incorporate a new design, improved site navigation, and the introduction of a portal for data users to
monitor their projects online. The website is the main gateway for applications for data, and regular
update on Study news, events, publications and similar items.
9.6 Newsletters
Every year a newsletter is produced for Study participants. The participant newsletter describes current
events at ALSWH and features results on prominent issues arising from information about themselves
that the participants have provided to ALSWH. The 2019 ALSWH participant newsletter was distributed
in April 2020. It was provided online to all participants in the 1989-95 cohort, as well as to those
participants in the 1973-78 and 1946-51 cohorts who have provided email addresses. Participants in
the 1973-78 and 1946-51 cohorts who have not provided email addresses, or who prefer to receive

115
hard copies, and all members of the 1921-26 cohort were provided with printed copies of the newsletter.
Copies of all participant newsletters are available here.
The Study also prepares two electronic newsletters - ‘Study News’ which is for all stakeholders with an
interest in women’s health policy and practice, and ‘Data Updates’ which is for data users. The Study
News includes:
• links to lay summaries or media coverage of noteworthy publications and reports
• updates on upcoming noteworthy seminars, presentations and conferences that will make
use of ALSWH data
• other related items of interest.
The Data Update includes:
• details of recent data releases
• details of current and forthcoming surveys
• updates on recent publications, presentations and seminars and upcoming conferences
This year, Data Updates have been distributed in March, September and November, and the Study
News was delivered in September.

116
10 Collaborative Research Activities
10.1 Scientific meetings and teleconferences among the research team
10.1.1 Management Committees
The Study Management Committee (SMC) oversees all aspects of ALSWH, ensuring that all contractual
obligations are fulfilled and leading strategic planning for the Study (beyond contractual obligations).
Membership of the SMC comprises the ALSWH Directors and Deputy-Directors. During 2020, SMC
meetings have been conducted as videoconferences (Zoom). Due to COVID-19 restrictions, all face-
to-face meetings were cancelled.
The Strategic Advisory and Stakeholder Committee (SASC) advises and supports the SMC on strategic
and scientific issues and promotes ALSWH and the use of its research and data. Membership of the
committee comprises the four members of the ALSWH SMC, four ALSWH collaborators and up to six
stakeholders including people with expertise in research translation, policy implementation. Members
are:
Chair:
Professor Sally Redman
Chief Executive Officer
Sax Institute, Sydney, New South Wales
ALSWH Directors and Deputy Directors:
Professor Gita Mishra
Director, ALSWH (The University of Queensland)
Professor of Life Course Epidemiology & NHMRC Principal Research Fellow
School of Public Health, Faculty of Medicine, The University of Queensland
Professor Julie Byles
Director, ALSWH (The University of Newcastle)
Director, Priority Research Centre for Generational Health and Ageing
Global Innovation Chair in Responsive Transitions in Health and Ageing
School of Medicine and Public Health, The University of Newcastle

117
A/ Professor Leigh Tooth
Principal Research Fellow and Deputy Director, ALSWH (The University of Queensland)
School of Public Health, Faculty of Medicine, The University of Queensland
Professor Deb Loxton
Deputy Director ALSWH (The University of Newcastle)
Director, Priority Research Centre for Generational Health and Ageing
School of Medicine and Public Health, The University of Newcastle
ALSWH collaborators:
Professor Wendy Brown
Director, Centre for Research on Exercise, Physical Activity and Health
School of Human Movement and Nutrition Sciences
Faculty of Health and Behavioral Sciences, The University of Queensland
Professor Jayne Lucke
Director, Australian Research Centre in Sex, Health and Society
College of Science, Health and Engineering, School of Psychology and Public Health
La Trobe University
Stakeholders:
Professor Louisa Jorm
Director, Centre for Big Data Research in Health
University of New South Wales, Sydney
Janet Michelmore
Executive Director, Jean Hailes
Professor Marie-Paul Austin
Director, St John of God Burwood Hospital

118
Chair, Perinatal and Women’s Mental Health Research Unit
University of New South Wales Sydney
Professor Catherine D’Este
Chair in Biostatistics, National Centre for Epidemiology and Population Health
Australian National University
Professor Leon Flicker
Professor of Geriatrics & Director, Western Australia Centre for Health and Ageing
University of Western Australia
Professor John Attia
Academic Director, School of Medicine and Public Health
The University of Newcastle
Professor Helena Teede
Director, Monash Centre for Health Research and Implementation (MCHRI)
Monash University
Kelly Bannister
Deputy Chair, Australian Women’s Health Network
Representative from the Department of Health:
Assistant Director, Preventive Policy Section, Preventive Health Policy Branch
Population Health & Sport Division, Department of Health

119
10.1.2 Data Management Group
The Data Management Group (DMG) is responsible for all technical issues involving ALSWH data. The
group’s primary tasks include:
• Providing a forum for discussion of all aspects of data management within ALSWH
• Disseminating summaries of current data management activities to the research team and
collaborators
• Assessing the validity, reliability and responsiveness of new survey items
• Maintaining scale evaluation procedures
• Evaluating and documenting the validity and reliability of new scales included on surveys
• Developing and documenting definitions for derived variables in survey and other data sets
• Documenting datasets through the preparation of variable labels and formats, and the
maintenance of the Data Dictionary and its Supplement
• Maintaining archival procedures for all datasets
This year, the DMG has reviewed all items for Pilot Survey 9 of the 1973-78 cohort and has provided
advice on preparation of the ‘core datasets’ (accessible through the Australian Data Archive). The DMG
meets monthly by teleconference or videoconference, and is chaired by David Fitzgerald (Data Manager
– The University of Queensland) and Anna Graves (Operations Manager - The University of Newcastle).
Members in 2020 have included:
• Anna Graves
• David Fitzgerald
• Professor Gita Mishra
• Professor Julie Byles
• Professor Deborah Loxton
• Associate Professor Leigh Tooth
• Richard Hockey
• Dominic Cavenagh
• Professor Annette Dobson
• Ryan Tuckerman
• Peta Forder
• Dr Michael Waller
• Colleen Loos
• Nick Egan

120
Data Access Committee
The Data Access Committee assesses and monitors all applications to use ALSWH data and linked
data. The committee’s primary tasks are to:
• Assess each application for use of ALSWH data (and where required, linked data from
external datasets) on merit for whether:
o It is a reasonable and appropriate use of ALSWH data (and linked data where
applicable)
o It is a feasible project which will lead to scientifically valid findings
o The research team have the necessary skills and resources to conduct the research.
o The research team members who require access to the linked data have the
necessary ethical permissions.
• Assess each application to conduct an ALSWH substudy on merit for whether:
o The relevant ALSWH cohort/s is/are an appropriate target population for the research
o The substudy will be an acceptable burden on ALSWH participants
o It is a feasible project which will lead to scientifically valid findings
o The research team have the necessary skills, resources and funding to conduct the
research.
• If requested by an ALSWH liaison person, review outcomes (publications, conference
abstracts, reports) from research using ALSWH data.
The Data Access Committee is chaired by Associate Professor Leigh Tooth, and members in 2020
included:
• Associate Professor Leigh Tooth
• Professor Gita Mishra
• Professor Julie Byles
• Professor Wendy Brown
• Professor Annette Dobson
• Professor Jayne Lucke
• Professor Deborah Loxton
• Peta Forder
• Dr Melissa Harris
• Dr Amy Anderson

121
Data linkage projects were also reviewed by the ALSWH Data Manager, David Fitzgerald and the
ALSWH Data Linkage Coordinator, Colleen Loos.
10.2 Research projects
ALSWH data has now been provided to collaborators for use in over 850 research projects. 50 projects
have been approved since the last Technical Report (November 2019), and five more are currently
under review. 50 per cent of projects approved this year also requested access to the linked
administrative datasets. Researchers who receive ALSWH data are required to provide regular reports
on progress of their projects - reports for 2020 are included in Appendix A. Topics under investigation
include:
• Chronic conditions such as musculoskeletal problems, cardiovascular conditions, diabetes.
• Health service use and systems
• Mental health
• Ageing
• Reproductive health
• Methodological issues
• Tobacco, alcohol and other drugs
• Medications
• Weight, nutrition and physical activity
• Health in rural and remote areas
• Social factors in health and well-being
• Abuse
10.3 Substudies
During 2020, data collection has been conducted for three substudies:
• M-PreM study (EoI W103), which is examining reproductive factors from menarche to
premenopause, and the risk of cardiometabolic and respiratory conditions
• Living beyond expectations study (EoI W102), which is looking at successful and healthy
ageing in older women
• Tracking the short-term impacts of COVID-19 on the health and wellbeing of Australian
women (EoI A840)
Human Ethics Research Committees at the University of Newcastle and the University of Queensland
have oversight of all ALSWH substudies, and those involving additional institutions/facilities (e.g.,
hospital clinics) may also require ethical oversight from relevant associated HRECs. The M-preM study
involves collection of biosamples, either through the mail or during a participant visit to a hospital clinic.

122
In March, consistent with HREC guidelines, all data collection for this substudy was suspended due to
COVID-19. HREC approval has since been given for resumption (in mid-September) of collection of
biosamples by mail.
Reports on the the M-preM substudy, and the Living beyond expectations substudy, as well as research
being conducted using data from other substudies, are included in Appendix B.
10.4 Student projects
56 postgraduate students are currently working on aspects of the project, investigating a wide range of
topics, including mental health, arthritis, cancer, nutrition, pregnancy, menopause, and ageing. Detailed
reports on student projects are available in Appendix C.
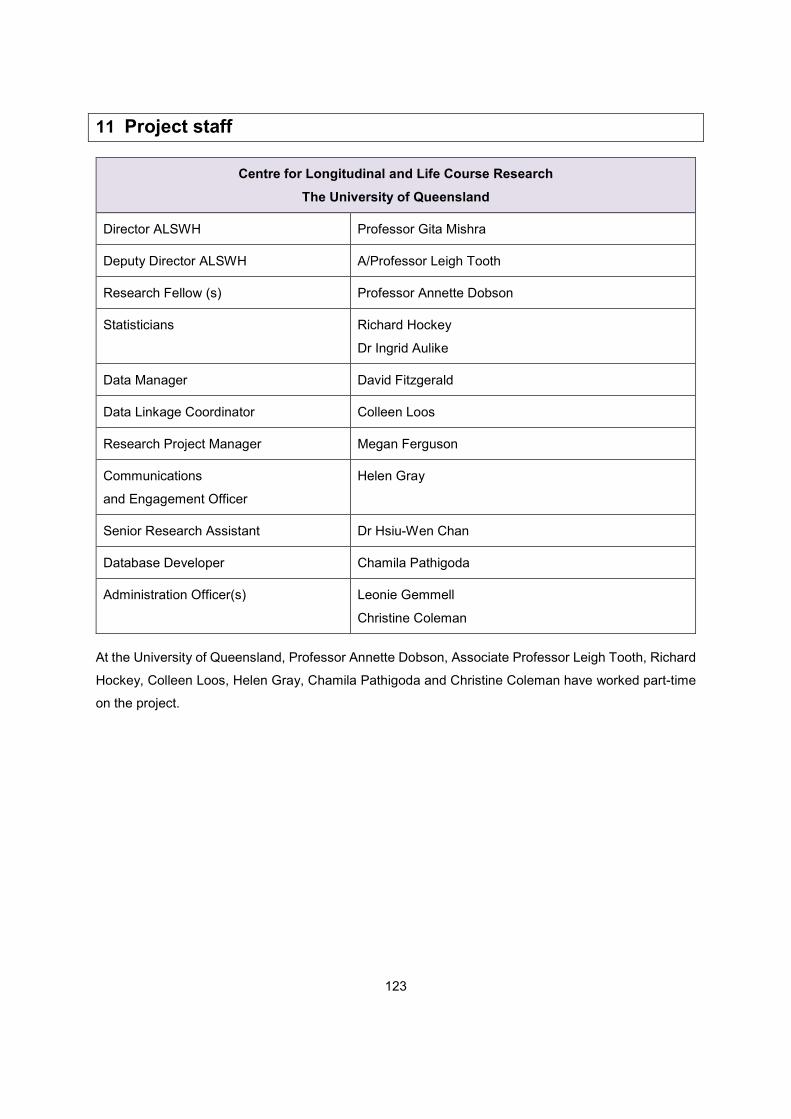
123
11 Project staff
Centre for Longitudinal and Life Course Research The University of Queensland
Director ALSWH Professor Gita Mishra
Deputy Director ALSWH A/Professor Leigh Tooth
Research Fellow (s) Professor Annette Dobson
Statisticians Richard Hockey
Dr Ingrid Aulike
Data Manager David Fitzgerald
Data Linkage Coordinator Colleen Loos
Research Project Manager Megan Ferguson
Communications
and Engagement Officer
Helen Gray
Senior Research Assistant Dr Hsiu-Wen Chan
Database Developer Chamila Pathigoda
Administration Officer(s) Leonie Gemmell
Christine Coleman
At the University of Queensland, Professor Annette Dobson, Associate Professor Leigh Tooth, Richard
Hockey, Colleen Loos, Helen Gray, Chamila Pathigoda and Christine Coleman have worked part-time
on the project.

124
Research Centre for Generational Health and Ageing The University of Newcastle
Director ALSWH Professor Julie Byles
Deputy Director ALSWH Professor Deborah Loxton
Research Managers Dr Amy Anderson
Natalie Townsend
Senior Statistician Peta Forder
Statistics Team Dominic Cavenagh
Nick Egan
Research Assistants Isabelle Barnes
Emma Byrnes
Operations Manager Anna Graves
Database Developer Ryan Tuckerman
Research Assistance Manager Natalie Townsend
Administration Officers Clare Thomson
Katherine Tuckerman
Project Assistants Cathy Seberry
Alyse Berrigan
Belinda Jackson
Brianna Barclay
Jenny Helman
Megan Son Hing
Sarah Morris
Ursula Horton

www.alswh.org.au
November 2020