Embed Size (px)
Citation preview
lable at ScienceDirect
ARTICLE IN PRESS
Journal of Structural Geology xxx (2008) 1–15
Contents lists avai
Journal of Structural Geology
journal homepage: www.elsevier .com/locate/ jsg
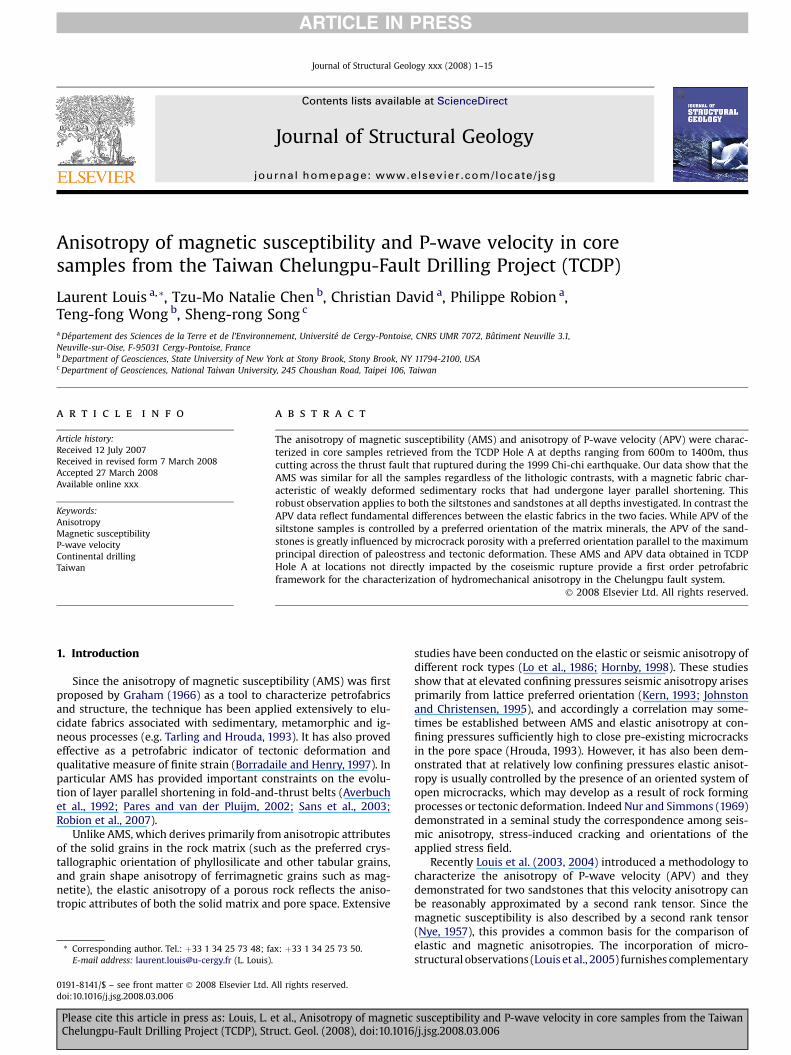
Anisotropy of magnetic susceptibility and P-wave velocity in coresamples from the Taiwan Chelungpu-Fault Drilling Project (TCDP)
Laurent Louis a,*, Tzu-Mo Natalie Chen b, Christian David a, Philippe Robion a,Teng-fong Wong b, Sheng-rong Song c
a Departement des Sciences de la Terre et de l’Environnement, Universite de Cergy-Pontoise, CNRS UMR 7072, Batiment Neuville 3.1,Neuville-sur-Oise, F-95031 Cergy-Pontoise, Franceb Department of Geosciences, State University of New York at Stony Brook, Stony Brook, NY 11794-2100, USAc Department of Geosciences, National Taiwan University, 245 Choushan Road, Taipei 106, Taiwan
a r t i c l e i n f o
Article history:Received 12 July 2007Received in revised form 7 March 2008Accepted 27 March 2008Available online xxx
Keywords:AnisotropyMagnetic susceptibilityP-wave velocityContinental drillingTaiwan
* Corresponding author. Tel.: þ33 1 34 25 73 48; faE-mail address: [email protected] (L. Louis).
0191-8141/$ – see front matter � 2008 Elsevier Ltd. Adoi:10.1016/j.jsg.2008.03.006
Please cite this article in press as: Louis, L. eChelungpu-Fault Drilling Project (TCDP), Str
a b s t r a c t
The anisotropy of magnetic susceptibility (AMS) and anisotropy of P-wave velocity (APV) were charac-terized in core samples retrieved from the TCDP Hole A at depths ranging from 600m to 1400m, thuscutting across the thrust fault that ruptured during the 1999 Chi-chi earthquake. Our data show that theAMS was similar for all the samples regardless of the lithologic contrasts, with a magnetic fabric char-acteristic of weakly deformed sedimentary rocks that had undergone layer parallel shortening. Thisrobust observation applies to both the siltstones and sandstones at all depths investigated. In contrast theAPV data reflect fundamental differences between the elastic fabrics in the two facies. While APV of thesiltstone samples is controlled by a preferred orientation of the matrix minerals, the APV of the sand-stones is greatly influenced by microcrack porosity with a preferred orientation parallel to the maximumprincipal direction of paleostress and tectonic deformation. These AMS and APV data obtained in TCDPHole A at locations not directly impacted by the coseismic rupture provide a first order petrofabricframework for the characterization of hydromechanical anisotropy in the Chelungpu fault system.
� 2008 Elsevier Ltd. All rights reserved.
1. Introduction
Since the anisotropy of magnetic susceptibility (AMS) was firstproposed by Graham (1966) as a tool to characterize petrofabricsand structure, the technique has been applied extensively to elu-cidate fabrics associated with sedimentary, metamorphic and ig-neous processes (e.g. Tarling and Hrouda, 1993). It has also provedeffective as a petrofabric indicator of tectonic deformation andqualitative measure of finite strain (Borradaile and Henry, 1997). Inparticular AMS has provided important constraints on the evolu-tion of layer parallel shortening in fold-and-thrust belts (Averbuchet al., 1992; Pares and van der Pluijm, 2002; Sans et al., 2003;Robion et al., 2007).
Unlike AMS, which derives primarily from anisotropic attributesof the solid grains in the rock matrix (such as the preferred crys-tallographic orientation of phyllosilicate and other tabular grains,and grain shape anisotropy of ferrimagnetic grains such as mag-netite), the elastic anisotropy of a porous rock reflects the aniso-tropic attributes of both the solid matrix and pore space. Extensive
x: þ33 1 34 25 73 50.
ll rights reserved.
t al., Anisotropy of magneticuct. Geol. (2008), doi:10.1016
studies have been conducted on the elastic or seismic anisotropy ofdifferent rock types (Lo et al., 1986; Hornby, 1998). These studiesshow that at elevated confining pressures seismic anisotropy arisesprimarily from lattice preferred orientation (Kern, 1993; Johnstonand Christensen, 1995), and accordingly a correlation may some-times be established between AMS and elastic anisotropy at con-fining pressures sufficiently high to close pre-existing microcracksin the pore space (Hrouda, 1993). However, it has also been dem-onstrated that at relatively low confining pressures elastic anisot-ropy is usually controlled by the presence of an oriented system ofopen microcracks, which may develop as a result of rock formingprocesses or tectonic deformation. Indeed Nur and Simmons (1969)demonstrated in a seminal study the correspondence among seis-mic anisotropy, stress-induced cracking and orientations of theapplied stress field.
Recently Louis et al. (2003, 2004) introduced a methodology tocharacterize the anisotropy of P-wave velocity (APV) and theydemonstrated for two sandstones that this velocity anisotropy canbe reasonably approximated by a second rank tensor. Since themagnetic susceptibility is also described by a second rank tensor(Nye, 1957), this provides a common basis for the comparison ofelastic and magnetic anisotropies. The incorporation of micro-structural observations (Louis et al., 2005) furnishes complementary
susceptibility and P-wave velocity in core samples from the Taiwan/j.jsg.2008.03.006
L. Louis et al. / Journal of Structural Geology xxx (2008) 1–152
ARTICLE IN PRESS
information on pore space anisotropy, grain arrangement and theirinfluences on elastic anisotropy. This integrated methodology wasadopted in the present study to investigate the AMS and APV asfunctions of depth and lithology in a suite of core samples from anactive thrust fault system in Taiwan.
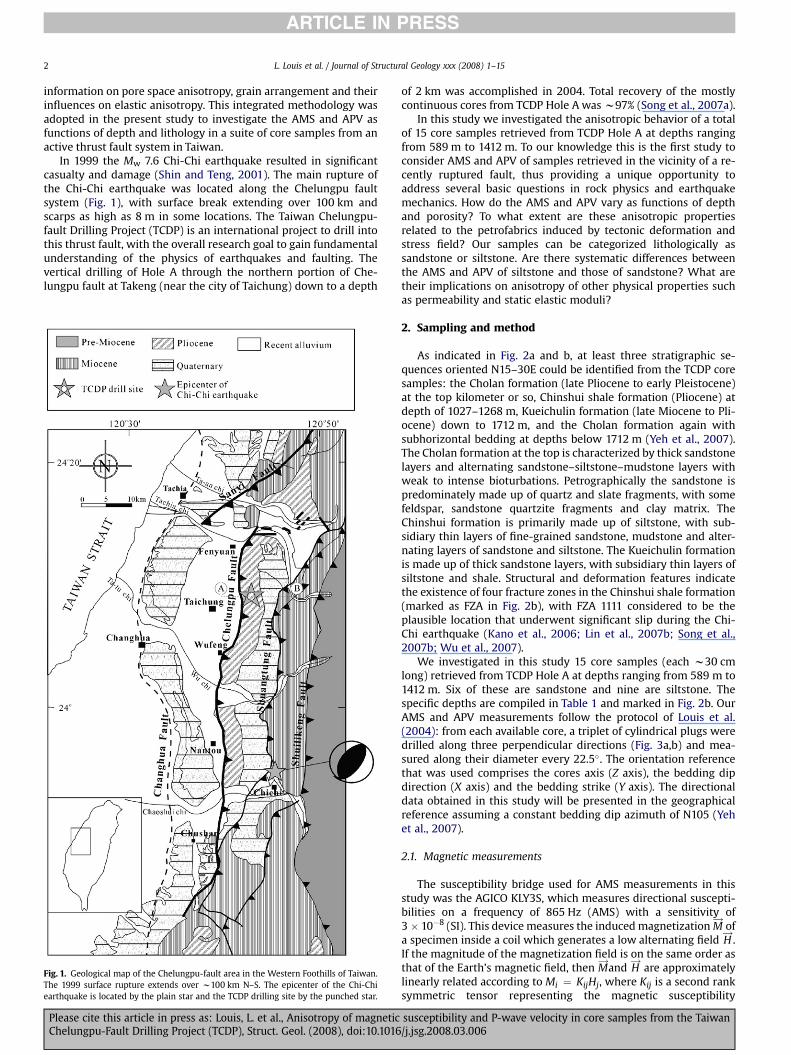
In 1999 the Mw 7.6 Chi-Chi earthquake resulted in significantcasualty and damage (Shin and Teng, 2001). The main rupture ofthe Chi-Chi earthquake was located along the Chelungpu faultsystem (Fig. 1), with surface break extending over 100 km andscarps as high as 8 m in some locations. The Taiwan Chelungpu-fault Drilling Project (TCDP) is an international project to drill intothis thrust fault, with the overall research goal to gain fundamentalunderstanding of the physics of earthquakes and faulting. Thevertical drilling of Hole A through the northern portion of Che-lungpu fault at Takeng (near the city of Taichung) down to a depth
Fig. 1. Geological map of the Chelungpu-fault area in the Western Foothills of Taiwan.The 1999 surface rupture extends over w100 km N–S. The epicenter of the Chi-Chiearthquake is located by the plain star and the TCDP drilling site by the punched star.
Please cite this article in press as: Louis, L. et al., Anisotropy of magneticChelungpu-Fault Drilling Project (TCDP), Struct. Geol. (2008), doi:10.1016
of 2 km was accomplished in 2004. Total recovery of the mostlycontinuous cores from TCDP Hole A was w97% (Song et al., 2007a).
In this study we investigated the anisotropic behavior of a totalof 15 core samples retrieved from TCDP Hole A at depths rangingfrom 589 m to 1412 m. To our knowledge this is the first study toconsider AMS and APV of samples retrieved in the vicinity of a re-cently ruptured fault, thus providing a unique opportunity toaddress several basic questions in rock physics and earthquakemechanics. How do the AMS and APV vary as functions of depthand porosity? To what extent are these anisotropic propertiesrelated to the petrofabrics induced by tectonic deformation andstress field? Our samples can be categorized lithologically assandstone or siltstone. Are there systematic differences betweenthe AMS and APV of siltstone and those of sandstone? What aretheir implications on anisotropy of other physical properties suchas permeability and static elastic moduli?
2. Sampling and method
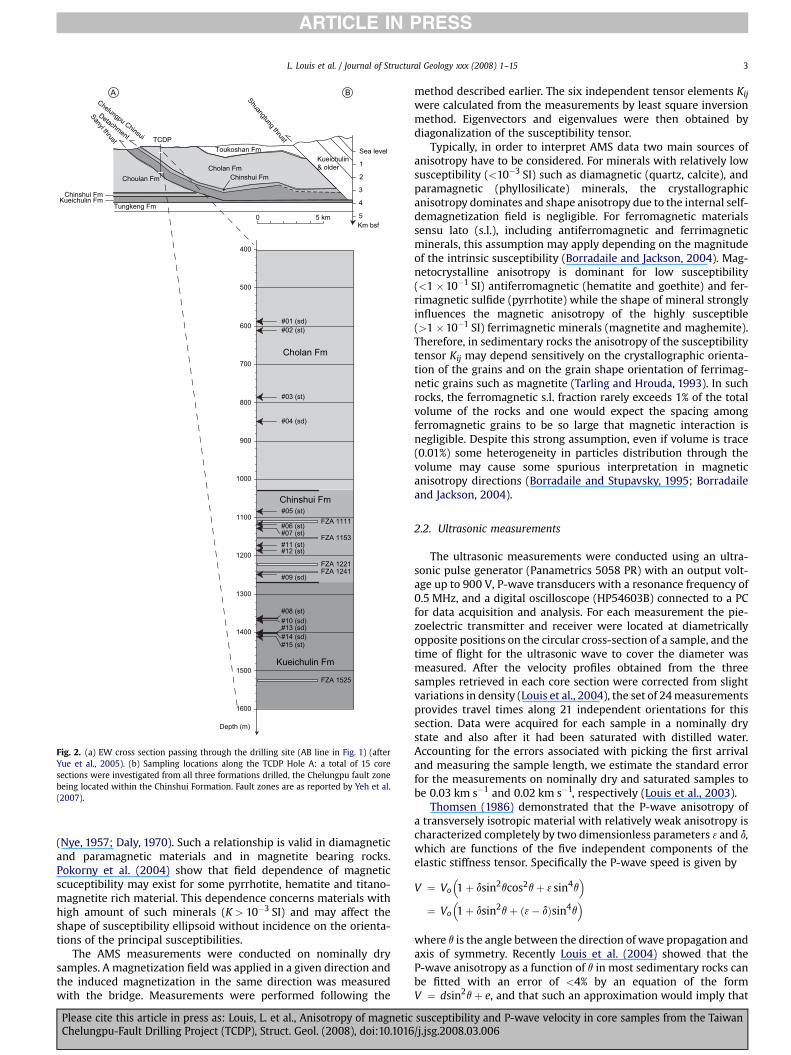
As indicated in Fig. 2a and b, at least three stratigraphic se-quences oriented N15–30E could be identified from the TCDP coresamples: the Cholan formation (late Pliocene to early Pleistocene)at the top kilometer or so, Chinshui shale formation (Pliocene) atdepth of 1027–1268 m, Kueichulin formation (late Miocene to Pli-ocene) down to 1712 m, and the Cholan formation again withsubhorizontal bedding at depths below 1712 m (Yeh et al., 2007).The Cholan formation at the top is characterized by thick sandstonelayers and alternating sandstone–siltstone–mudstone layers withweak to intense bioturbations. Petrographically the sandstone ispredominately made up of quartz and slate fragments, with somefeldspar, sandstone quartzite fragments and clay matrix. TheChinshui formation is primarily made up of siltstone, with sub-sidiary thin layers of fine-grained sandstone, mudstone and alter-nating layers of sandstone and siltstone. The Kueichulin formationis made up of thick sandstone layers, with subsidiary thin layers ofsiltstone and shale. Structural and deformation features indicatethe existence of four fracture zones in the Chinshui shale formation(marked as FZA in Fig. 2b), with FZA 1111 considered to be theplausible location that underwent significant slip during the Chi-Chi earthquake (Kano et al., 2006; Lin et al., 2007b; Song et al.,2007b; Wu et al., 2007).
We investigated in this study 15 core samples (each w30 cmlong) retrieved from TCDP Hole A at depths ranging from 589 m to1412 m. Six of these are sandstone and nine are siltstone. Thespecific depths are compiled in Table 1 and marked in Fig. 2b. OurAMS and APV measurements follow the protocol of Louis et al.(2004): from each available core, a triplet of cylindrical plugs weredrilled along three perpendicular directions (Fig. 3a,b) and mea-sured along their diameter every 22.5�. The orientation referencethat was used comprises the cores axis (Z axis), the bedding dipdirection (X axis) and the bedding strike (Y axis). The directionaldata obtained in this study will be presented in the geographicalreference assuming a constant bedding dip azimuth of N105 (Yehet al., 2007).
2.1. Magnetic measurements
The susceptibility bridge used for AMS measurements in thisstudy was the AGICO KLY3S, which measures directional suscepti-bilities on a frequency of 865 Hz (AMS) with a sensitivity of3 � 10�8 (SI). This device measures the induced magnetization M
!of
a specimen inside a coil which generates a low alternating field H!
.If the magnitude of the magnetization field is on the same order asthat of the Earth’s magnetic field, then M
!and H!
are approximatelylinearly related according to Mi ¼ KijHj, where Kij is a second ranksymmetric tensor representing the magnetic susceptibility
susceptibility and P-wave velocity in core samples from the Taiwan/j.jsg.2008.03.006
400
500
600
700
800
900
1000
1100
1200
1300
1500
1400
1600
Cholan Fm
Chinshui Fm
Kueichulin Fm
FZA 1153
FZA 1111
FZA 1221FZA 1241
FZA 1525
#01 (sd)#02 (st)
#03 (st)
#04 (sd)
#05 (st)
#06 (st)#07 (st)#11 (st)#12 (st)
#08 (st)
#09 (sd)
#13 (sd)#14 (sd)#15 (st)
#10 (sd)
Depth (m)
0 5 km
Sea level
1
2
3
4
5
TCDP
Sanyi thrust
Shuangtung thrust
Chelungpu Chinsui
Detachment
Choulan Fm
Chinshui FmKueichulin Fm
Tungkeng Fm
Cholan Fm
Toukoshan Fm
Chinshui Fm
Kueichulin& older
Km bsf
A B
Fig. 2. (a) EW cross section passing through the drilling site (AB line in Fig. 1) (afterYue et al., 2005). (b) Sampling locations along the TCDP Hole A: a total of 15 coresections were investigated from all three formations drilled, the Chelungpu fault zonebeing located within the Chinshui Formation. Fault zones are as reported by Yeh et al.(2007).
L. Louis et al. / Journal of Structural Geology xxx (2008) 1–15 3
ARTICLE IN PRESS
(Nye, 1957; Daly, 1970). Such a relationship is valid in diamagneticand paramagnetic materials and in magnetite bearing rocks.Pokorny et al. (2004) show that field dependence of magneticscuceptibility may exist for some pyrrhotite, hematite and titano-magnetite rich material. This dependence concerns materials withhigh amount of such minerals (K > 10�3 SI) and may affect theshape of susceptibility ellipsoid without incidence on the orienta-tions of the principal susceptibilities.
The AMS measurements were conducted on nominally drysamples. A magnetization field was applied in a given direction andthe induced magnetization in the same direction was measuredwith the bridge. Measurements were performed following the
Please cite this article in press as: Louis, L. et al., Anisotropy of magneticChelungpu-Fault Drilling Project (TCDP), Struct. Geol. (2008), doi:10.1016
method described earlier. The six independent tensor elements Kij
were calculated from the measurements by least square inversionmethod. Eigenvectors and eigenvalues were then obtained bydiagonalization of the susceptibility tensor.
Typically, in order to interpret AMS data two main sources ofanisotropy have to be considered. For minerals with relatively lowsusceptibility (<10�3 SI) such as diamagnetic (quartz, calcite), andparamagnetic (phyllosilicate) minerals, the crystallographicanisotropy dominates and shape anisotropy due to the internal self-demagnetization field is negligible. For ferromagnetic materialssensu lato (s.l.), including antiferromagnetic and ferrimagneticminerals, this assumption may apply depending on the magnitudeof the intrinsic susceptibility (Borradaile and Jackson, 2004). Mag-netocrystalline anisotropy is dominant for low susceptibility(<1 �10�1 SI) antiferromagnetic (hematite and goethite) and fer-rimagnetic sulfide (pyrrhotite) while the shape of mineral stronglyinfluences the magnetic anisotropy of the highly susceptible(>1 �10�1 SI) ferrimagnetic minerals (magnetite and maghemite).Therefore, in sedimentary rocks the anisotropy of the susceptibilitytensor Kij may depend sensitively on the crystallographic orienta-tion of the grains and on the grain shape orientation of ferrimag-netic grains such as magnetite (Tarling and Hrouda, 1993). In suchrocks, the ferromagnetic s.l. fraction rarely exceeds 1% of the totalvolume of the rocks and one would expect the spacing amongferromagnetic grains to be so large that magnetic interaction isnegligible. Despite this strong assumption, even if volume is trace(0.01%) some heterogeneity in particles distribution through thevolume may cause some spurious interpretation in magneticanisotropy directions (Borradaile and Stupavsky, 1995; Borradaileand Jackson, 2004).
2.2. Ultrasonic measurements
The ultrasonic measurements were conducted using an ultra-sonic pulse generator (Panametrics 5058 PR) with an output volt-age up to 900 V, P-wave transducers with a resonance frequency of0.5 MHz, and a digital oscilloscope (HP54603B) connected to a PCfor data acquisition and analysis. For each measurement the pie-zoelectric transmitter and receiver were located at diametricallyopposite positions on the circular cross-section of a sample, and thetime of flight for the ultrasonic wave to cover the diameter wasmeasured. After the velocity profiles obtained from the threesamples retrieved in each core section were corrected from slightvariations in density (Louis et al., 2004), the set of 24 measurementsprovides travel times along 21 independent orientations for thissection. Data were acquired for each sample in a nominally drystate and also after it had been saturated with distilled water.Accounting for the errors associated with picking the first arrivaland measuring the sample length, we estimate the standard errorfor the measurements on nominally dry and saturated samples tobe 0.03 km s�1 and 0.02 km s�1, respectively (Louis et al., 2003).
Thomsen (1986) demonstrated that the P-wave anisotropy ofa transversely isotropic material with relatively weak anisotropy ischaracterized completely by two dimensionless parameters 3 and d,which are functions of the five independent components of theelastic stiffness tensor. Specifically the P-wave speed is given by
V ¼ Vo 1þ dsin2qcos2qþ 3 sin4q� �
¼ Vo 1þ dsin2qþ 3� dð Þsin4q� �
where q is the angle between the direction of wave propagation andaxis of symmetry. Recently Louis et al. (2004) showed that theP-wave anisotropy as a function of q in most sedimentary rocks canbe fitted with an error of <4% by an equation of the formV ¼ dsin2qþ e, and that such an approximation would imply that
susceptibility and P-wave velocity in core samples from the Taiwan/j.jsg.2008.03.006
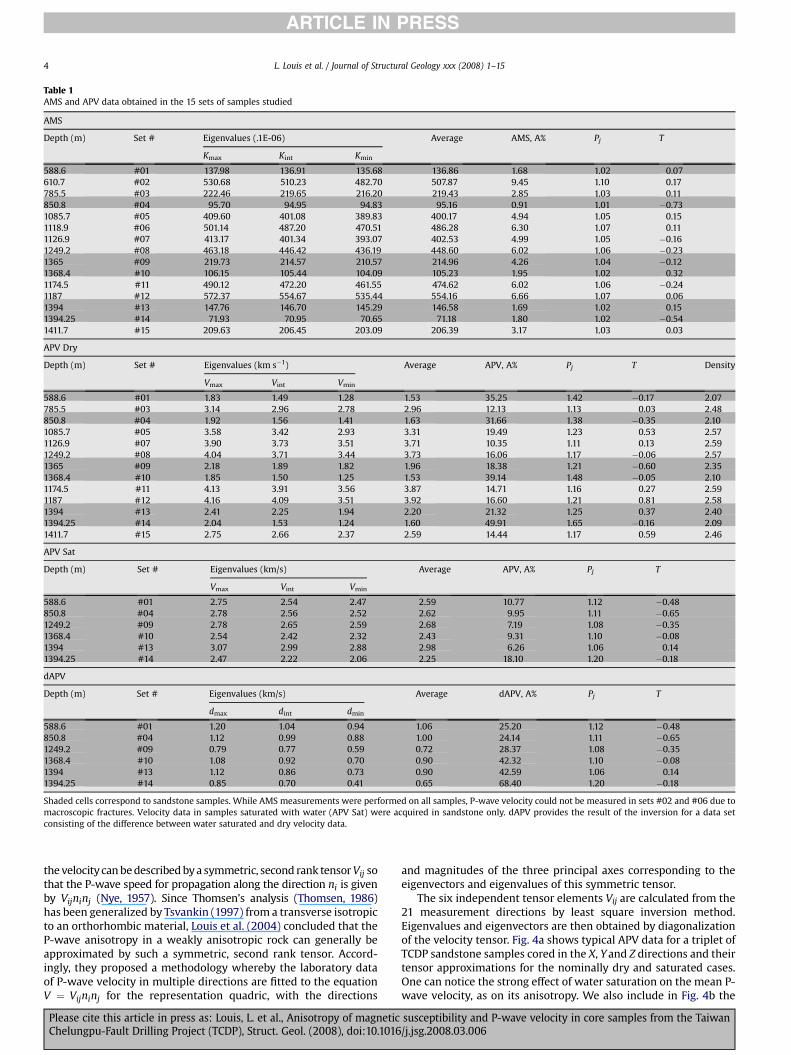
Table 1AMS and APV data obtained in the 15 sets of samples studied
AMS
Depth (m) Set # Eigenvalues (.1E-06) Average AMS, A% Pj T
Kmax Kint Kmin
588.6 #01 137.98 136.91 135.68 136.86 1.68 1.02 0.07610.7 #02 530.68 510.23 482.70 507.87 9.45 1.10 0.17785.5 #03 222.46 219.65 216.20 219.43 2.85 1.03 0.11850.8 #04 95.70 94.95 94.83 95.16 0.91 1.01 �0.731085.7 #05 409.60 401.08 389.83 400.17 4.94 1.05 0.151118.9 #06 501.14 487.20 470.51 486.28 6.30 1.07 0.111126.9 #07 413.17 401.34 393.07 402.53 4.99 1.05 �0.161249.2 #08 463.18 446.42 436.19 448.60 6.02 1.06 �0.231365 #09 219.73 214.57 210.57 214.96 4.26 1.04 �0.121368.4 #10 106.15 105.44 104.09 105.23 1.95 1.02 0.321174.5 #11 490.12 472.20 461.55 474.62 6.02 1.06 �0.241187 #12 572.37 554.67 535.44 554.16 6.66 1.07 0.061394 #13 147.76 146.70 145.29 146.58 1.69 1.02 0.151394.25 #14 71.93 70.95 70.65 71.18 1.80 1.02 �0.541411.7 #15 209.63 206.45 203.09 206.39 3.17 1.03 0.03
APV Dry
Depth (m) Set # Eigenvalues (km s�1) Average APV, A% Pj T Density
Vmax Vint Vmin
588.6 #01 1.83 1.49 1.28 1.53 35.25 1.42 �0.17 2.07785.5 #03 3.14 2.96 2.78 2.96 12.13 1.13 0.03 2.48850.8 #04 1.92 1.56 1.41 1.63 31.66 1.38 �0.35 2.101085.7 #05 3.58 3.42 2.93 3.31 19.49 1.23 0.53 2.571126.9 #07 3.90 3.73 3.51 3.71 10.35 1.11 0.13 2.591249.2 #08 4.04 3.71 3.44 3.73 16.06 1.17 �0.06 2.571365 #09 2.18 1.89 1.82 1.96 18.38 1.21 �0.60 2.351368.4 #10 1.85 1.50 1.25 1.53 39.14 1.48 �0.05 2.101174.5 #11 4.13 3.91 3.56 3.87 14.71 1.16 0.27 2.591187 #12 4.16 4.09 3.51 3.92 16.60 1.21 0.81 2.581394 #13 2.41 2.25 1.94 2.20 21.32 1.25 0.37 2.401394.25 #14 2.04 1.53 1.24 1.60 49.91 1.65 �0.16 2.091411.7 #15 2.75 2.66 2.37 2.59 14.44 1.17 0.59 2.46
APV Sat
Depth (m) Set # Eigenvalues (km/s) Average APV, A% Pj T
Vmax Vint Vmin
588.6 #01 2.75 2.54 2.47 2.59 10.77 1.12 �0.48850.8 #04 2.78 2.56 2.52 2.62 9.95 1.11 �0.651249.2 #09 2.78 2.65 2.59 2.68 7.19 1.08 �0.351368.4 #10 2.54 2.42 2.32 2.43 9.31 1.10 �0.081394 #13 3.07 2.99 2.88 2.98 6.26 1.06 0.141394.25 #14 2.47 2.22 2.06 2.25 18.10 1.20 �0.18
dAPV
Depth (m) Set # Eigenvalues (km/s) Average dAPV, A% Pj T
dmax dint dmin
588.6 #01 1.20 1.04 0.94 1.06 25.20 1.12 �0.48850.8 #04 1.12 0.99 0.88 1.00 24.14 1.11 �0.651249.2 #09 0.79 0.77 0.59 0.72 28.37 1.08 �0.351368.4 #10 1.08 0.92 0.70 0.90 42.32 1.10 �0.081394 #13 1.12 0.86 0.73 0.90 42.59 1.06 0.141394.25 #14 0.85 0.70 0.41 0.65 68.40 1.20 �0.18
Shaded cells correspond to sandstone samples. While AMS measurements were performed on all samples, P-wave velocity could not be measured in sets #02 and #06 due tomacroscopic fractures. Velocity data in samples saturated with water (APV Sat) were acquired in sandstone only. dAPV provides the result of the inversion for a data setconsisting of the difference between water saturated and dry velocity data.
L. Louis et al. / Journal of Structural Geology xxx (2008) 1–154
ARTICLE IN PRESS
the velocity can be described by a symmetric, second rank tensor Vij sothat the P-wave speed for propagation along the direction ni is givenby Vijninj (Nye, 1957). Since Thomsen’s analysis (Thomsen, 1986)has been generalized by Tsvankin (1997) from a transverse isotropicto an orthorhombic material, Louis et al. (2004) concluded that theP-wave anisotropy in a weakly anisotropic rock can generally beapproximated by such a symmetric, second rank tensor. Accord-ingly, they proposed a methodology whereby the laboratory dataof P-wave velocity in multiple directions are fitted to the equationV ¼ Vijninj for the representation quadric, with the directions
Please cite this article in press as: Louis, L. et al., Anisotropy of magneticChelungpu-Fault Drilling Project (TCDP), Struct. Geol. (2008), doi:10.1016
and magnitudes of the three principal axes corresponding to theeigenvectors and eigenvalues of this symmetric tensor.
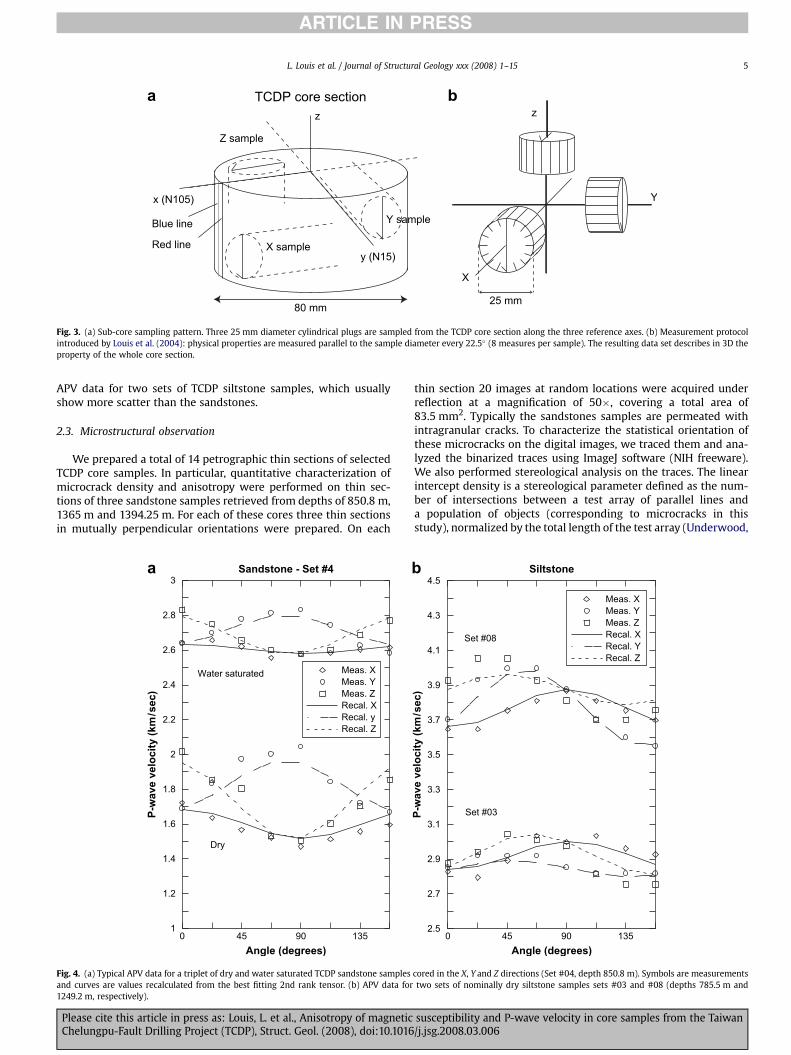
The six independent tensor elements Vij are calculated from the21 measurement directions by least square inversion method.Eigenvalues and eigenvectors are then obtained by diagonalizationof the velocity tensor. Fig. 4a shows typical APV data for a triplet ofTCDP sandstone samples cored in the X, Y and Z directions and theirtensor approximations for the nominally dry and saturated cases.One can notice the strong effect of water saturation on the mean P-wave velocity, as on its anisotropy. We also include in Fig. 4b the
susceptibility and P-wave velocity in core samples from the Taiwan/j.jsg.2008.03.006
X sample
Y sample
Z sample
x (N105)
y (N15)
z
TCDP core section
80 mm
Blue line
Red line
25 mm
X
Y
za b
Fig. 3. (a) Sub-core sampling pattern. Three 25 mm diameter cylindrical plugs are sampled from the TCDP core section along the three reference axes. (b) Measurement protocolintroduced by Louis et al. (2004): physical properties are measured parallel to the sample diameter every 22.5� (8 measures per sample). The resulting data set describes in 3D theproperty of the whole core section.
L. Louis et al. / Journal of Structural Geology xxx (2008) 1–15 5
ARTICLE IN PRESS
APV data for two sets of TCDP siltstone samples, which usuallyshow more scatter than the sandstones.
2.3. Microstructural observation
We prepared a total of 14 petrographic thin sections of selectedTCDP core samples. In particular, quantitative characterization ofmicrocrack density and anisotropy were performed on thin sec-tions of three sandstone samples retrieved from depths of 850.8 m,1365 m and 1394.25 m. For each of these cores three thin sectionsin mutually perpendicular orientations were prepared. On each
a
1
1.2
1.4
1.6
1.8
2
2.2
2.4
2.6
2.8
3
0 45 90 135
Sandstone - Set #4
P-w
ave velo
city (km
/sec)
Angle (degrees)
Water saturated
Dry
Meas. XMeas. YMeas. ZRecal. XRecal. yRecal. Z
Fig. 4. (a) Typical APV data for a triplet of dry and water saturated TCDP sandstone samplesand curves are values recalculated from the best fitting 2nd rank tensor. (b) APV data for1249.2 m, respectively).
Please cite this article in press as: Louis, L. et al., Anisotropy of magneticChelungpu-Fault Drilling Project (TCDP), Struct. Geol. (2008), doi:10.1016
thin section 20 images at random locations were acquired underreflection at a magnification of 50�, covering a total area of83.5 mm2. Typically the sandstones samples are permeated withintragranular cracks. To characterize the statistical orientation ofthese microcracks on the digital images, we traced them and ana-lyzed the binarized traces using ImageJ software (NIH freeware).We also performed stereological analysis on the traces. The linearintercept density is a stereological parameter defined as the num-ber of intersections between a test array of parallel lines anda population of objects (corresponding to microcracks in thisstudy), normalized by the total length of the test array (Underwood,
b
2.5
2.7
2.9
3.1
3.3
3.5
3.7
3.9
4.1
4.3
4.5
0 45 90 135
Siltstone
P-w
ave velo
city (km
/sec)
Angle (degrees)
Set #08
Set #03
Meas. XMeas. YMeas. ZRecal. XRecal. YRecal. Z
cored in the X, Y and Z directions (Set #04, depth 850.8 m). Symbols are measurementstwo sets of nominally dry siltstone samples sets #03 and #08 (depths 785.5 m and
susceptibility and P-wave velocity in core samples from the Taiwan/j.jsg.2008.03.006
L. Louis et al. / Journal of Structural Geology xxx (2008) 1–156
ARTICLE IN PRESS
1970). To characterize the anisotropy of the linear intercept density,stereological measurements were conducted using arrays in dif-ferent orientations (see Wu et al., 2000 for method). In this studya program was written with Scilab (Inria freeware) to automaticallycount the number of crack intercepts with 180 test arrays at anglesvarying from 0 to 180� with respect to the original images.
5
50
3. Magnetic susceptibility and P-wave velocity data
3.1. Bulk analysis
We will denote the eigenvalues of the magnetic susceptibilitytensor by Kmax, Kint and Kmin, with Kmax � Kint � Kmin. Similarly theeigenvalues of the symmetric matrix fitting best the P-wave ve-locities are denoted by Vmax, Vint and Vmin, with Vmax � Vint � Vmin.These values are compiled in Table 1, which also includes the drydensity. The average porosity (inferred from dry density assuminga solid grain density of 2600 kg m�3) of the sandstones is about 20%and that of the siltstones close to 4%.
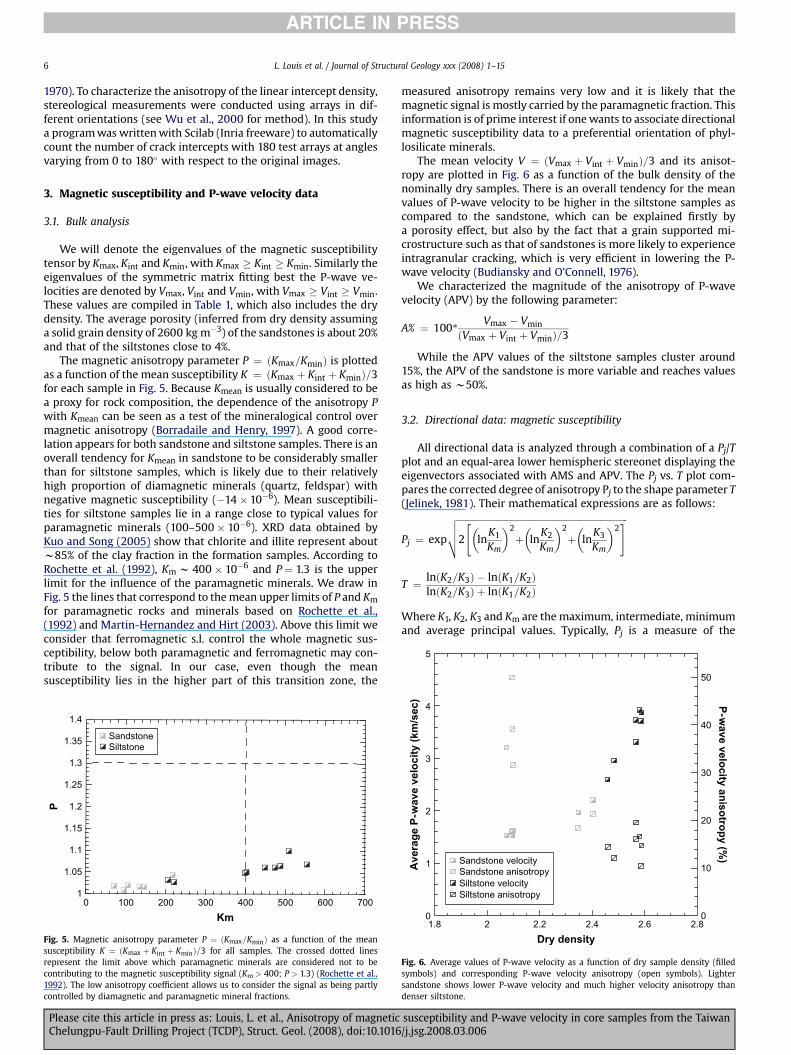
The magnetic anisotropy parameter P ¼ ðKmax=KminÞ is plottedas a function of the mean susceptibility K ¼ ðKmax þ Kint þ KminÞ=3for each sample in Fig. 5. Because Kmean is usually considered to bea proxy for rock composition, the dependence of the anisotropy Pwith Kmean can be seen as a test of the mineralogical control overmagnetic anisotropy (Borradaile and Henry, 1997). A good corre-lation appears for both sandstone and siltstone samples. There is anoverall tendency for Kmean in sandstone to be considerably smallerthan for siltstone samples, which is likely due to their relativelyhigh proportion of diamagnetic minerals (quartz, feldspar) withnegative magnetic susceptibility (�14 � 10�6). Mean susceptibili-ties for siltstone samples lie in a range close to typical values forparamagnetic minerals (100–500 � 10�6). XRD data obtained byKuo and Song (2005) show that chlorite and illite represent aboutw85% of the clay fraction in the formation samples. According toRochette et al. (1992), Km w 400 � 10�6 and P ¼ 1.3 is the upperlimit for the influence of the paramagnetic minerals. We draw inFig. 5 the lines that correspond to the mean upper limits of P and Km
for paramagnetic rocks and minerals based on Rochette et al.,(1992) and Martin-Hernandez and Hirt (2003). Above this limit weconsider that ferromagnetic s.l. control the whole magnetic sus-ceptibility, below both paramagnetic and ferromagnetic may con-tribute to the signal. In our case, even though the meansusceptibility lies in the higher part of this transition zone, the
1
1.05
1.1
1.15
1.2
1.25
1.3
1.35
1.4
0 100 200 300 400 500 600 700
P
Km
SandstoneSiltstone
Fig. 5. Magnetic anisotropy parameter P ¼ ðKmax=KminÞ as a function of the meansusceptibility K ¼ ðKmax þ Kint þ KminÞ=3 for all samples. The crossed dotted linesrepresent the limit above which paramagnetic minerals are considered not to becontributing to the magnetic susceptibility signal (Km > 400; P > 1.3) (Rochette et al.,1992). The low anisotropy coefficient allows us to consider the signal as being partlycontrolled by diamagnetic and paramagnetic mineral fractions.
Please cite this article in press as: Louis, L. et al., Anisotropy of magneticChelungpu-Fault Drilling Project (TCDP), Struct. Geol. (2008), doi:10.1016
measured anisotropy remains very low and it is likely that themagnetic signal is mostly carried by the paramagnetic fraction. Thisinformation is of prime interest if one wants to associate directionalmagnetic susceptibility data to a preferential orientation of phyl-losilicate minerals.
The mean velocity V ¼ ðVmax þ Vint þ VminÞ=3 and its anisot-ropy are plotted in Fig. 6 as a function of the bulk density of thenominally dry samples. There is an overall tendency for the meanvalues of P-wave velocity to be higher in the siltstone samples ascompared to the sandstone, which can be explained firstly bya porosity effect, but also by the fact that a grain supported mi-crostructure such as that of sandstones is more likely to experienceintragranular cracking, which is very efficient in lowering the P-wave velocity (Budiansky and O’Connell, 1976).
We characterized the magnitude of the anisotropy of P-wavevelocity (APV) by the following parameter:
A% ¼ 100*Vmax � Vmin
Vmax þ Vint þ Vminð Þ=3
While the APV values of the siltstone samples cluster around15%, the APV of the sandstone is more variable and reaches valuesas high as w50%.
3.2. Directional data: magnetic susceptibility
All directional data is analyzed through a combination of a Pj/Tplot and an equal-area lower hemispheric stereonet displaying theeigenvectors associated with AMS and APV. The Pj vs. T plot com-pares the corrected degree of anisotropy Pj to the shape parameter T(Jelinek, 1981). Their mathematical expressions are as follows:
Pj ¼ exp
ffiffiffiffiffiffiffiffiffiffiffiffiffiffiffiffiffiffiffiffiffiffiffiffiffiffiffiffiffiffiffiffiffiffiffiffiffiffiffiffiffiffiffiffiffiffiffiffiffiffiffiffiffiffiffiffiffiffiffiffiffiffiffiffiffiffiffiffiffiffiffiffiffiffi2 ln
K1
Km
� �2
þ lnK2
Km
� �2
þ lnK3
Km
� �2" #vuut
ln K2=K3ð Þ � ln K1=K2ð Þ
T ¼ln K2=K3ð Þ þ ln K1=K2ð Þ
Where K1, K2, K3 and Km are the maximum, intermediate, minimumand average principal values. Typically, Pj is a measure of the
0
1
2
3
4
0
10
20
30
40
1.8 2 2.2 2.4 2.6 2.8
Averag
e P
-w
ave velo
city (km
/se
c)
P-w
ave velo
city an
iso
tro
py (%
)
Dry density
Sandstone velocitySandstone anisotropySiltstone velocitySiltstone anisotropy
Fig. 6. Average values of P-wave velocity as a function of dry sample density (filledsymbols) and corresponding P-wave velocity anisotropy (open symbols). Lightersandstone shows lower P-wave velocity and much higher velocity anisotropy thandenser siltstone.
susceptibility and P-wave velocity in core samples from the Taiwan/j.jsg.2008.03.006
L. Louis et al. / Journal of Structural Geology xxx (2008) 1–15 7
ARTICLE IN PRESS
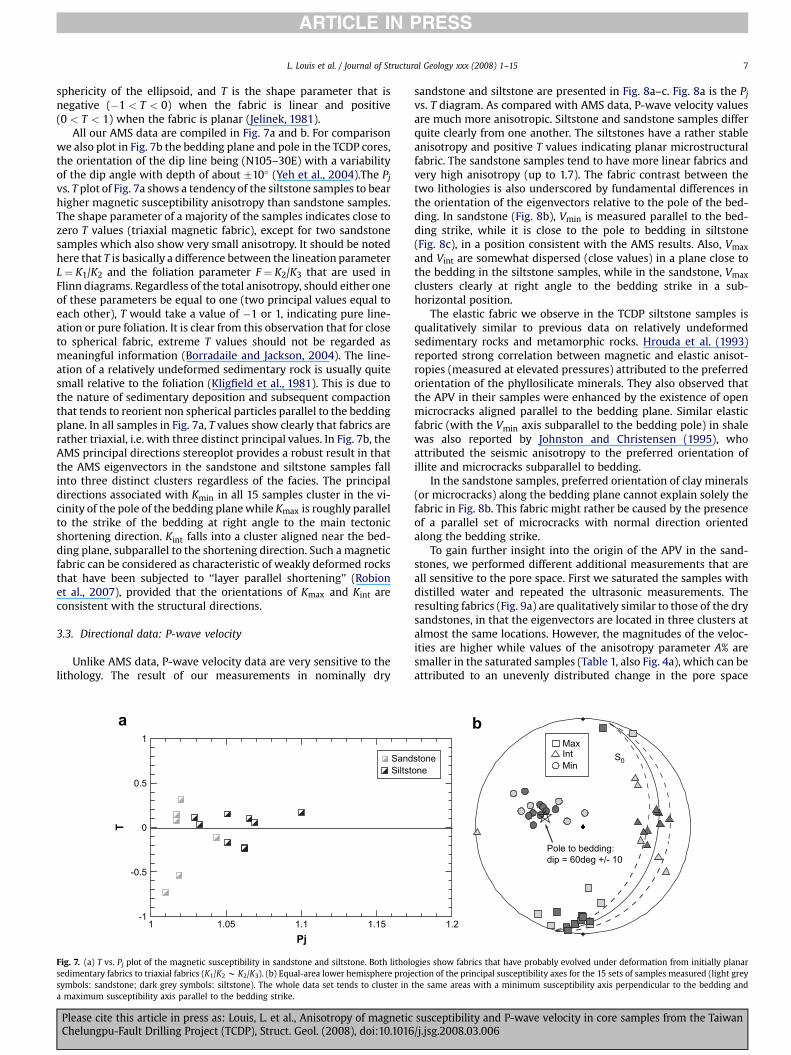
sphericity of the ellipsoid, and T is the shape parameter that isnegative (�1 < T < 0) when the fabric is linear and positive(0 < T < 1) when the fabric is planar (Jelinek, 1981).
All our AMS data are compiled in Fig. 7a and b. For comparisonwe also plot in Fig. 7b the bedding plane and pole in the TCDP cores,the orientation of the dip line being (N105–30E) with a variabilityof the dip angle with depth of about �10� (Yeh et al., 2004).The Pj
vs. T plot of Fig. 7a shows a tendency of the siltstone samples to bearhigher magnetic susceptibility anisotropy than sandstone samples.The shape parameter of a majority of the samples indicates close tozero T values (triaxial magnetic fabric), except for two sandstonesamples which also show very small anisotropy. It should be notedhere that T is basically a difference between the lineation parameterL ¼ K1/K2 and the foliation parameter F ¼ K2/K3 that are used inFlinn diagrams. Regardless of the total anisotropy, should either oneof these parameters be equal to one (two principal values equal toeach other), T would take a value of �1 or 1, indicating pure line-ation or pure foliation. It is clear from this observation that for closeto spherical fabric, extreme T values should not be regarded asmeaningful information (Borradaile and Jackson, 2004). The line-ation of a relatively undeformed sedimentary rock is usually quitesmall relative to the foliation (Kligfield et al., 1981). This is due tothe nature of sedimentary deposition and subsequent compactionthat tends to reorient non spherical particles parallel to the beddingplane. In all samples in Fig. 7a, T values show clearly that fabrics arerather triaxial, i.e. with three distinct principal values. In Fig. 7b, theAMS principal directions stereoplot provides a robust result in thatthe AMS eigenvectors in the sandstone and siltstone samples fallinto three distinct clusters regardless of the facies. The principaldirections associated with Kmin in all 15 samples cluster in the vi-cinity of the pole of the bedding plane while Kmax is roughly parallelto the strike of the bedding at right angle to the main tectonicshortening direction. Kint falls into a cluster aligned near the bed-ding plane, subparallel to the shortening direction. Such a magneticfabric can be considered as characteristic of weakly deformed rocksthat have been subjected to ‘‘layer parallel shortening’’ (Robionet al., 2007), provided that the orientations of Kmax and Kint areconsistent with the structural directions.
3.3. Directional data: P-wave velocity
Unlike AMS data, P-wave velocity data are very sensitive to thelithology. The result of our measurements in nominally dry
-1
-0.5
0
0.5
1
1 1.05 1.1 1.15
T
Pj
a
SandSiltst
Fig. 7. (a) T vs. Pj plot of the magnetic susceptibility in sandstone and siltstone. Both litholosedimentary fabrics to triaxial fabrics (K1/K2 w K2/K3). (b) Equal-area lower hemisphere projesymbols: sandstone; dark grey symbols: siltstone). The whole data set tends to cluster ina maximum susceptibility axis parallel to the bedding strike.
Please cite this article in press as: Louis, L. et al., Anisotropy of magneticChelungpu-Fault Drilling Project (TCDP), Struct. Geol. (2008), doi:10.1016
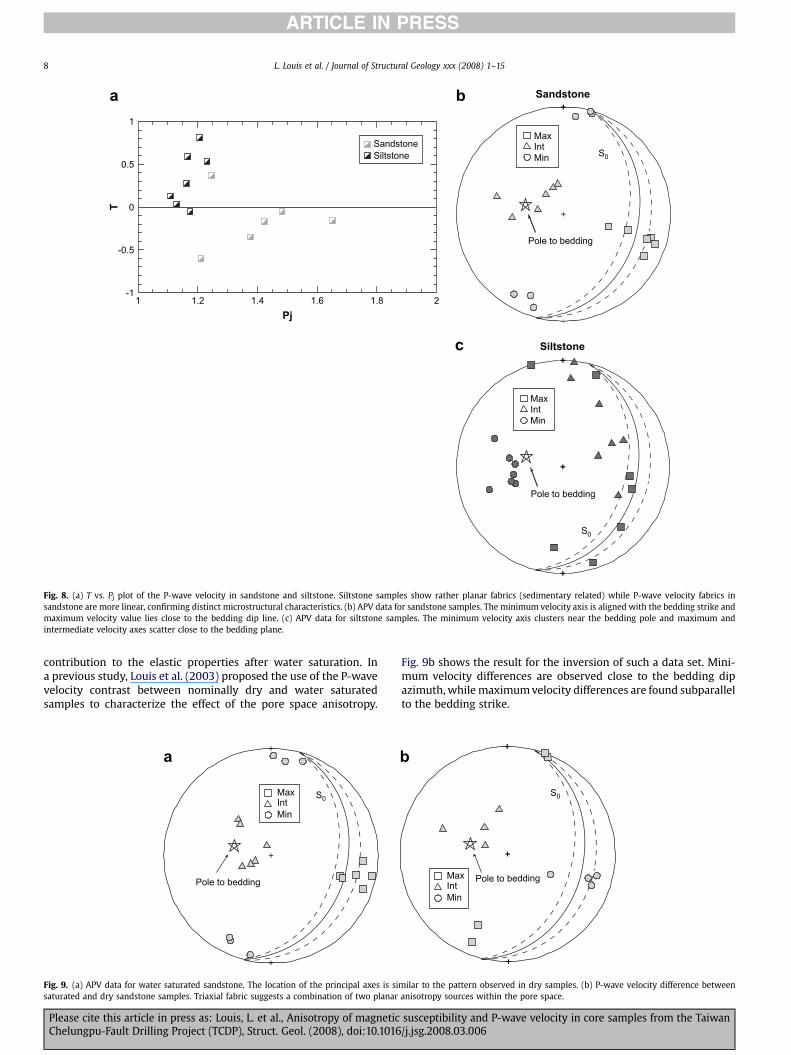
sandstone and siltstone are presented in Fig. 8a–c. Fig. 8a is the Pj
vs. T diagram. As compared with AMS data, P-wave velocity valuesare much more anisotropic. Siltstone and sandstone samples differquite clearly from one another. The siltstones have a rather stableanisotropy and positive T values indicating planar microstructuralfabric. The sandstone samples tend to have more linear fabrics andvery high anisotropy (up to 1.7). The fabric contrast between thetwo lithologies is also underscored by fundamental differences inthe orientation of the eigenvectors relative to the pole of the bed-ding. In sandstone (Fig. 8b), Vmin is measured parallel to the bed-ding strike, while it is close to the pole to bedding in siltstone(Fig. 8c), in a position consistent with the AMS results. Also, Vmax
and Vint are somewhat dispersed (close values) in a plane close tothe bedding in the siltstone samples, while in the sandstone, Vmax
clusters clearly at right angle to the bedding strike in a sub-horizontal position.
The elastic fabric we observe in the TCDP siltstone samples isqualitatively similar to previous data on relatively undeformedsedimentary rocks and metamorphic rocks. Hrouda et al. (1993)reported strong correlation between magnetic and elastic anisot-ropies (measured at elevated pressures) attributed to the preferredorientation of the phyllosilicate minerals. They also observed thatthe APV in their samples were enhanced by the existence of openmicrocracks aligned parallel to the bedding plane. Similar elasticfabric (with the Vmin axis subparallel to the bedding pole) in shalewas also reported by Johnston and Christensen (1995), whoattributed the seismic anisotropy to the preferred orientation ofillite and microcracks subparallel to bedding.
In the sandstone samples, preferred orientation of clay minerals(or microcracks) along the bedding plane cannot explain solely thefabric in Fig. 8b. This fabric might rather be caused by the presenceof a parallel set of microcracks with normal direction orientedalong the bedding strike.
To gain further insight into the origin of the APV in the sand-stones, we performed different additional measurements that areall sensitive to the pore space. First we saturated the samples withdistilled water and repeated the ultrasonic measurements. Theresulting fabrics (Fig. 9a) are qualitatively similar to those of the drysandstones, in that the eigenvectors are located in three clusters atalmost the same locations. However, the magnitudes of the veloc-ities are higher while values of the anisotropy parameter A% aresmaller in the saturated samples (Table 1, also Fig. 4a), which can beattributed to an unevenly distributed change in the pore space
1.2
b
stoneone
S0
Pole to bedding:dip = 60deg +/- 10
MaxIntMin
+++++++++++++++
+
+
+
+
+
gies show fabrics that have probably evolved under deformation from initially planarction of the principal susceptibility axes for the 15 sets of samples measured (light grey
the same areas with a minimum susceptibility axis perpendicular to the bedding and
susceptibility and P-wave velocity in core samples from the Taiwan/j.jsg.2008.03.006
a b
c
MaxIntMin
MaxIntMin
S0
Sandstone
Siltstone
-1
-0.5
0
0.5
1
1 1.2 1.4 1.6 1.8 2
T
Pj
+
+
+
Pole to bedding
+
+
+
Pole to bedding
S0
SandstoneSiltstone
Fig. 8. (a) T vs. Pj plot of the P-wave velocity in sandstone and siltstone. Siltstone samples show rather planar fabrics (sedimentary related) while P-wave velocity fabrics insandstone are more linear, confirming distinct microstructural characteristics. (b) APV data for sandstone samples. The minimum velocity axis is aligned with the bedding strike andmaximum velocity value lies close to the bedding dip line. (c) APV data for siltstone samples. The minimum velocity axis clusters near the bedding pole and maximum andintermediate velocity axes scatter close to the bedding plane.
L. Louis et al. / Journal of Structural Geology xxx (2008) 1–158
ARTICLE IN PRESS
contribution to the elastic properties after water saturation. Ina previous study, Louis et al. (2003) proposed the use of the P-wavevelocity contrast between nominally dry and water saturatedsamples to characterize the effect of the pore space anisotropy.
MaxIntMin
S0
a
+
+
+
Pole to bedding
Fig. 9. (a) APV data for water saturated sandstone. The location of the principal axes is sisaturated and dry sandstone samples. Triaxial fabric suggests a combination of two planar
Please cite this article in press as: Louis, L. et al., Anisotropy of magneticChelungpu-Fault Drilling Project (TCDP), Struct. Geol. (2008), doi:10.1016
Fig. 9b shows the result for the inversion of such a data set. Mini-mum velocity differences are observed close to the bedding dipazimuth, while maximum velocity differences are found subparallelto the bedding strike.
MaxIntMin
S0
b
+
+
+
+
+
+
+
+
+
+
+
+
Pole to bedding
milar to the pattern observed in dry samples. (b) P-wave velocity difference betweenanisotropy sources within the pore space.
susceptibility and P-wave velocity in core samples from the Taiwan/j.jsg.2008.03.006
L. Louis et al. / Journal of Structural Geology xxx (2008) 1–15 9
ARTICLE IN PRESS
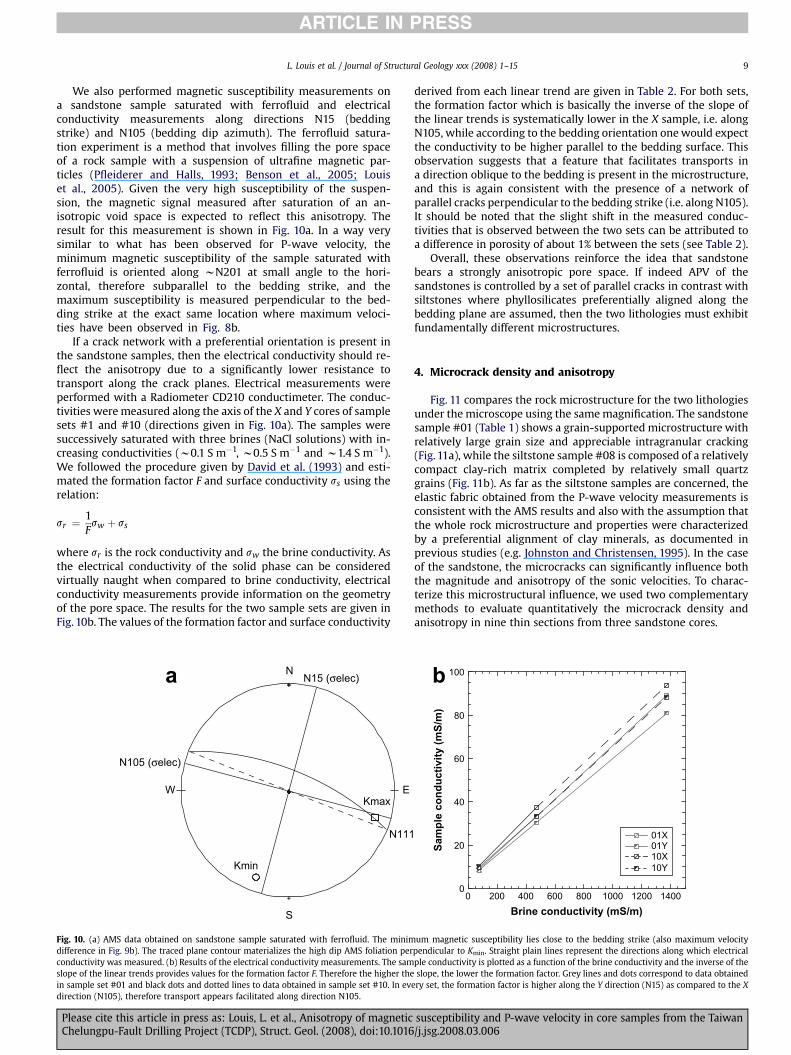
We also performed magnetic susceptibility measurements ona sandstone sample saturated with ferrofluid and electricalconductivity measurements along directions N15 (beddingstrike) and N105 (bedding dip azimuth). The ferrofluid satura-tion experiment is a method that involves filling the pore spaceof a rock sample with a suspension of ultrafine magnetic par-ticles (Pfleiderer and Halls, 1993; Benson et al., 2005; Louiset al., 2005). Given the very high susceptibility of the suspen-sion, the magnetic signal measured after saturation of an an-isotropic void space is expected to reflect this anisotropy. Theresult for this measurement is shown in Fig. 10a. In a way verysimilar to what has been observed for P-wave velocity, theminimum magnetic susceptibility of the sample saturated withferrofluid is oriented along wN201 at small angle to the hori-zontal, therefore subparallel to the bedding strike, and themaximum susceptibility is measured perpendicular to the bed-ding strike at the exact same location where maximum veloci-ties have been observed in Fig. 8b.
If a crack network with a preferential orientation is present inthe sandstone samples, then the electrical conductivity should re-flect the anisotropy due to a significantly lower resistance totransport along the crack planes. Electrical measurements wereperformed with a Radiometer CD210 conductimeter. The conduc-tivities were measured along the axis of the X and Y cores of samplesets #1 and #10 (directions given in Fig. 10a). The samples weresuccessively saturated with three brines (NaCl solutions) with in-creasing conductivities (w0.1 S m�1, w0.5 S m�1 and w1.4 S m�1).We followed the procedure given by David et al. (1993) and esti-mated the formation factor F and surface conductivity ss using therelation:
sr ¼1F
sw þ ss
where sr is the rock conductivity and sw the brine conductivity. Asthe electrical conductivity of the solid phase can be consideredvirtually naught when compared to brine conductivity, electricalconductivity measurements provide information on the geometryof the pore space. The results for the two sample sets are given inFig. 10b. The values of the formation factor and surface conductivity
+++++++++++++++
+
+
+
+
N
S
W EKmax
N15 (σelec)
N105 (σelec)
N111
Kmin
a
Fig. 10. (a) AMS data obtained on sandstone sample saturated with ferrofluid. The minimdifference in Fig. 9b). The traced plane contour materializes the high dip AMS foliation perconductivity was measured. (b) Results of the electrical conductivity measurements. The samslope of the linear trends provides values for the formation factor F. Therefore the higher thein sample set #01 and black dots and dotted lines to data obtained in sample set #10. In evdirection (N105), therefore transport appears facilitated along direction N105.
Please cite this article in press as: Louis, L. et al., Anisotropy of magneticChelungpu-Fault Drilling Project (TCDP), Struct. Geol. (2008), doi:10.1016
derived from each linear trend are given in Table 2. For both sets,the formation factor which is basically the inverse of the slope ofthe linear trends is systematically lower in the X sample, i.e. alongN105, while according to the bedding orientation one would expectthe conductivity to be higher parallel to the bedding surface. Thisobservation suggests that a feature that facilitates transports ina direction oblique to the bedding is present in the microstructure,and this is again consistent with the presence of a network ofparallel cracks perpendicular to the bedding strike (i.e. along N105).It should be noted that the slight shift in the measured conduc-tivities that is observed between the two sets can be attributed toa difference in porosity of about 1% between the sets (see Table 2).
Overall, these observations reinforce the idea that sandstonebears a strongly anisotropic pore space. If indeed APV of thesandstones is controlled by a set of parallel cracks in contrast withsiltstones where phyllosilicates preferentially aligned along thebedding plane are assumed, then the two lithologies must exhibitfundamentally different microstructures.
4. Microcrack density and anisotropy
Fig. 11 compares the rock microstructure for the two lithologiesunder the microscope using the same magnification. The sandstonesample #01 (Table 1) shows a grain-supported microstructure withrelatively large grain size and appreciable intragranular cracking(Fig. 11a), while the siltstone sample #08 is composed of a relativelycompact clay-rich matrix completed by relatively small quartzgrains (Fig. 11b). As far as the siltstone samples are concerned, theelastic fabric obtained from the P-wave velocity measurements isconsistent with the AMS results and also with the assumption thatthe whole rock microstructure and properties were characterizedby a preferential alignment of clay minerals, as documented inprevious studies (e.g. Johnston and Christensen, 1995). In the caseof the sandstone, the microcracks can significantly influence boththe magnitude and anisotropy of the sonic velocities. To charac-terize this microstructural influence, we used two complementarymethods to evaluate quantitatively the microcrack density andanisotropy in nine thin sections from three sandstone cores.
b
0
20
40
60
80
100
0 200 400 600 800 1000 1200 1400
01X01Y10X10Y
Sam
ple co
nd
uctivity (m
S/m
)
Brine conductivity (mS/m)
um magnetic susceptibility lies close to the bedding strike (also maximum velocitypendicular to Kmin. Straight plain lines represent the directions along which electricalple conductivity is plotted as a function of the brine conductivity and the inverse of theslope, the lower the formation factor. Grey lines and dots correspond to data obtained
ery set, the formation factor is higher along the Y direction (N15) as compared to the X
susceptibility and P-wave velocity in core samples from the Taiwan/j.jsg.2008.03.006
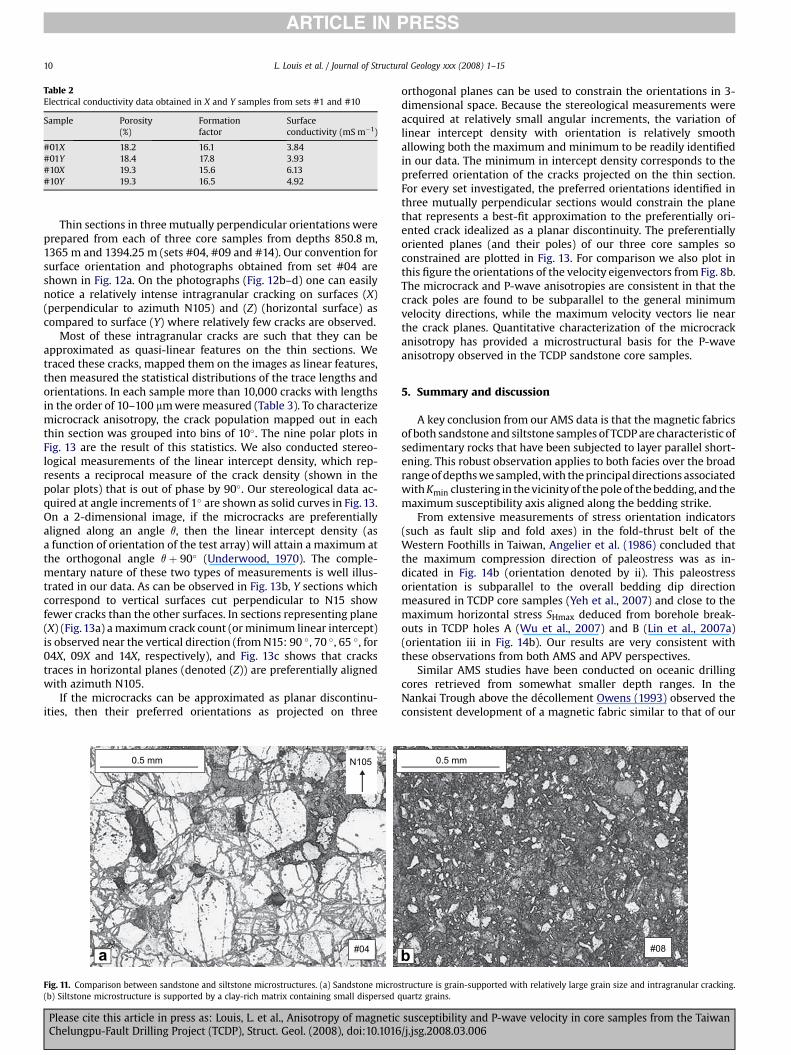
Table 2Electrical conductivity data obtained in X and Y samples from sets #1 and #10
Sample Porosity(%)
Formationfactor
Surfaceconductivity (mS m�1)
#01X 18.2 16.1 3.84#01Y 18.4 17.8 3.93#10X 19.3 15.6 6.13#10Y 19.3 16.5 4.92
L. Louis et al. / Journal of Structural Geology xxx (2008) 1–1510
ARTICLE IN PRESS
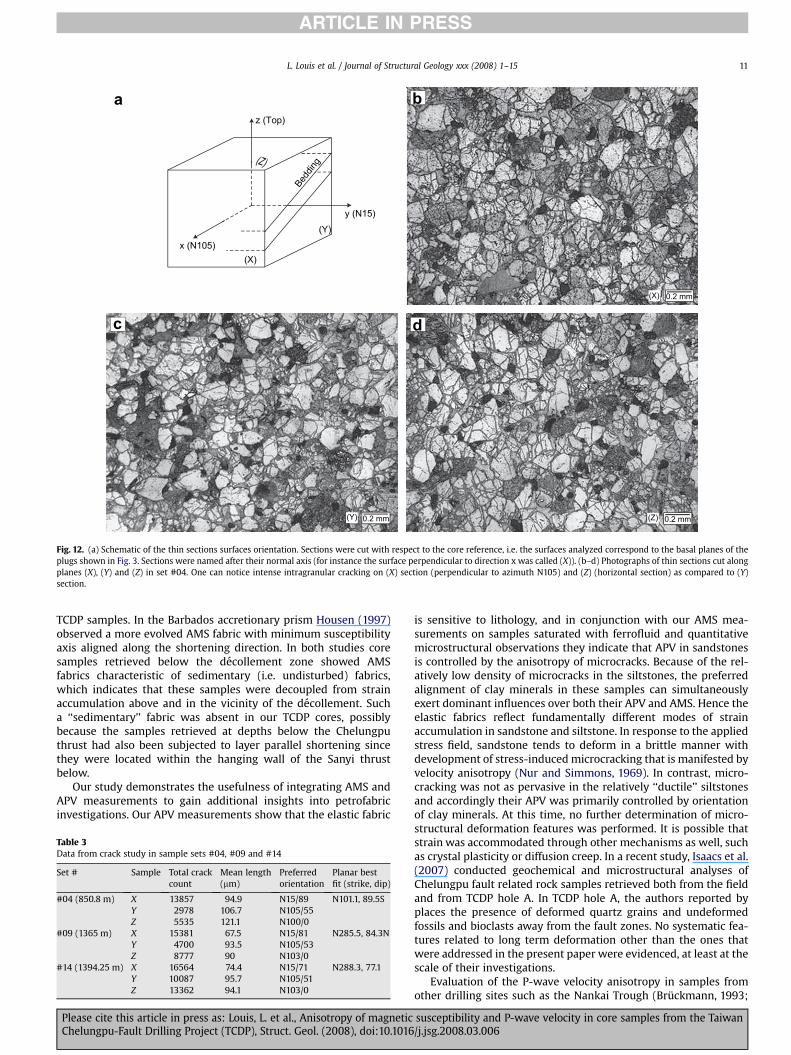
Thin sections in three mutually perpendicular orientations wereprepared from each of three core samples from depths 850.8 m,1365 m and 1394.25 m (sets #04, #09 and #14). Our convention forsurface orientation and photographs obtained from set #04 areshown in Fig. 12a. On the photographs (Fig. 12b–d) one can easilynotice a relatively intense intragranular cracking on surfaces (X)(perpendicular to azimuth N105) and (Z) (horizontal surface) ascompared to surface (Y) where relatively few cracks are observed.
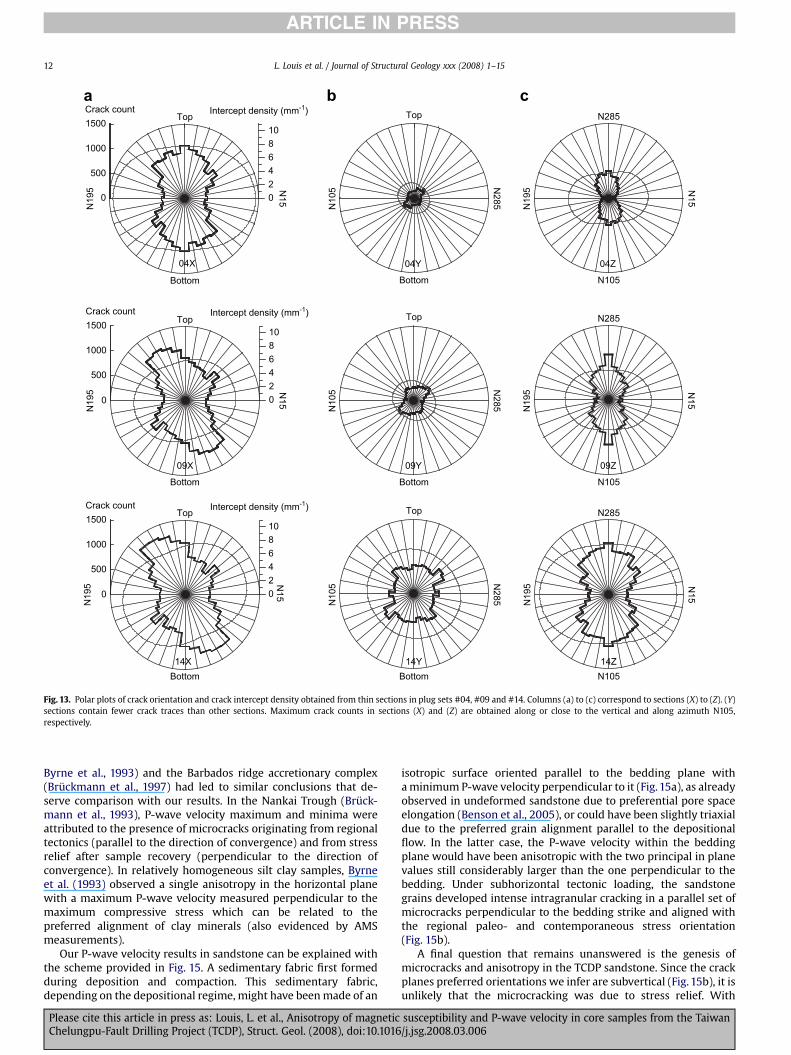
Most of these intragranular cracks are such that they can beapproximated as quasi-linear features on the thin sections. Wetraced these cracks, mapped them on the images as linear features,then measured the statistical distributions of the trace lengths andorientations. In each sample more than 10,000 cracks with lengthsin the order of 10–100 mm were measured (Table 3). To characterizemicrocrack anisotropy, the crack population mapped out in eachthin section was grouped into bins of 10�. The nine polar plots inFig. 13 are the result of this statistics. We also conducted stereo-logical measurements of the linear intercept density, which rep-resents a reciprocal measure of the crack density (shown in thepolar plots) that is out of phase by 90�. Our stereological data ac-quired at angle increments of 1� are shown as solid curves in Fig. 13.On a 2-dimensional image, if the microcracks are preferentiallyaligned along an angle q, then the linear intercept density (asa function of orientation of the test array) will attain a maximum atthe orthogonal angle q þ 90� (Underwood, 1970). The comple-mentary nature of these two types of measurements is well illus-trated in our data. As can be observed in Fig. 13b, Y sections whichcorrespond to vertical surfaces cut perpendicular to N15 showfewer cracks than the other surfaces. In sections representing plane(X) (Fig. 13a) a maximum crack count (or minimum linear intercept)is observed near the vertical direction (from N15: 90 �, 70 �, 65 �, for04X, 09X and 14X, respectively), and Fig. 13c shows that crackstraces in horizontal planes (denoted (Z)) are preferentially alignedwith azimuth N105.
If the microcracks can be approximated as planar discontinu-ities, then their preferred orientations as projected on three
#04
0.5 mm N105
a
Fig. 11. Comparison between sandstone and siltstone microstructures. (a) Sandstone micro(b) Siltstone microstructure is supported by a clay-rich matrix containing small dispersed q
Please cite this article in press as: Louis, L. et al., Anisotropy of magneticChelungpu-Fault Drilling Project (TCDP), Struct. Geol. (2008), doi:10.1016
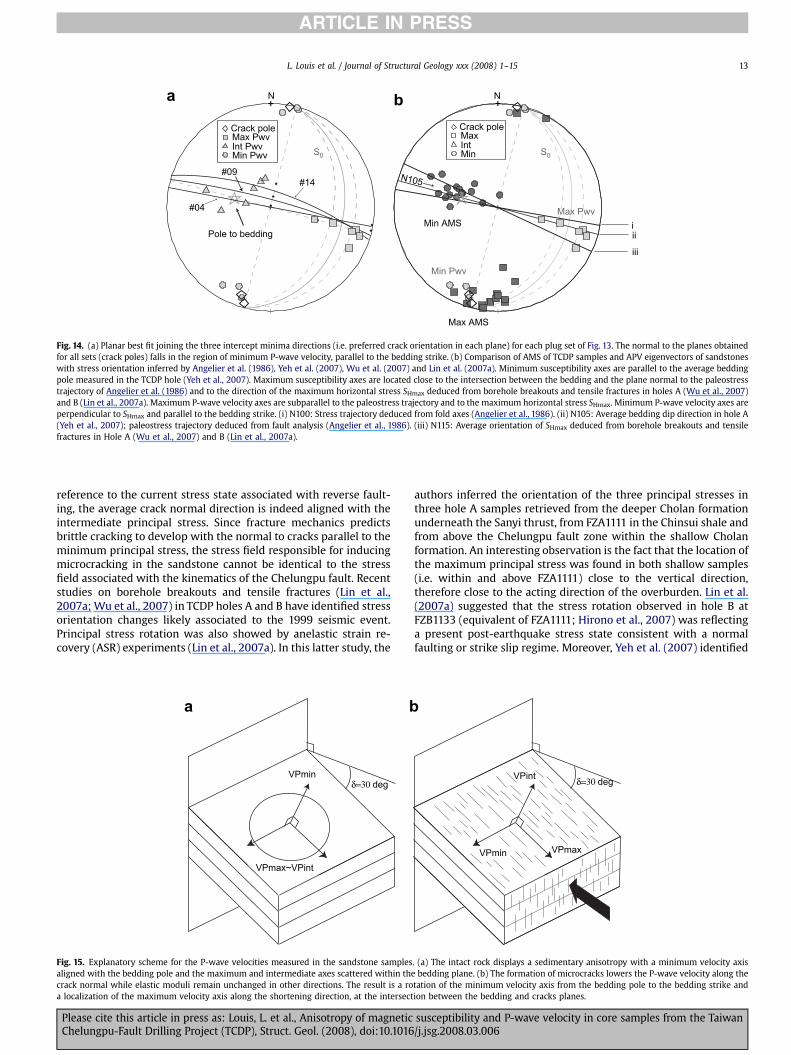
orthogonal planes can be used to constrain the orientations in 3-dimensional space. Because the stereological measurements wereacquired at relatively small angular increments, the variation oflinear intercept density with orientation is relatively smoothallowing both the maximum and minimum to be readily identifiedin our data. The minimum in intercept density corresponds to thepreferred orientation of the cracks projected on the thin section.For every set investigated, the preferred orientations identified inthree mutually perpendicular sections would constrain the planethat represents a best-fit approximation to the preferentially ori-ented crack idealized as a planar discontinuity. The preferentiallyoriented planes (and their poles) of our three core samples soconstrained are plotted in Fig. 13. For comparison we also plot inthis figure the orientations of the velocity eigenvectors from Fig. 8b.The microcrack and P-wave anisotropies are consistent in that thecrack poles are found to be subparallel to the general minimumvelocity directions, while the maximum velocity vectors lie nearthe crack planes. Quantitative characterization of the microcrackanisotropy has provided a microstructural basis for the P-waveanisotropy observed in the TCDP sandstone core samples.
5. Summary and discussion
A key conclusion from our AMS data is that the magnetic fabricsof both sandstone and siltstone samples of TCDP are characteristic ofsedimentary rocks that have been subjected to layer parallel short-ening. This robust observation applies to both facies over the broadrange of depths we sampled, with the principal directions associatedwith Kmin clustering in the vicinity of the pole of the bedding, and themaximum susceptibility axis aligned along the bedding strike.
From extensive measurements of stress orientation indicators(such as fault slip and fold axes) in the fold-thrust belt of theWestern Foothills in Taiwan, Angelier et al. (1986) concluded thatthe maximum compression direction of paleostress was as in-dicated in Fig. 14b (orientation denoted by ii). This paleostressorientation is subparallel to the overall bedding dip directionmeasured in TCDP core samples (Yeh et al., 2007) and close to themaximum horizontal stress SHmax deduced from borehole break-outs in TCDP holes A (Wu et al., 2007) and B (Lin et al., 2007a)(orientation iii in Fig. 14b). Our results are very consistent withthese observations from both AMS and APV perspectives.
Similar AMS studies have been conducted on oceanic drillingcores retrieved from somewhat smaller depth ranges. In theNankai Trough above the decollement Owens (1993) observed theconsistent development of a magnetic fabric similar to that of our
#08
0.5 mm
b
structure is grain-supported with relatively large grain size and intragranular cracking.uartz grains.
susceptibility and P-wave velocity in core samples from the Taiwan/j.jsg.2008.03.006
0.2 mm
0.2 mm0.2 mm
(X)
(Z)(Y)
(X)
(Y)
z (Top)
Bedd
ing
x (N105)
y (N15)
a b
dc
(Z)
Fig. 12. (a) Schematic of the thin sections surfaces orientation. Sections were cut with respect to the core reference, i.e. the surfaces analyzed correspond to the basal planes of theplugs shown in Fig. 3. Sections were named after their normal axis (for instance the surface perpendicular to direction x was called (X)). (b–d) Photographs of thin sections cut alongplanes (X), (Y) and (Z) in set #04. One can notice intense intragranular cracking on (X) section (perpendicular to azimuth N105) and (Z) (horizontal section) as compared to (Y)section.
L. Louis et al. / Journal of Structural Geology xxx (2008) 1–15 11
ARTICLE IN PRESS
TCDP samples. In the Barbados accretionary prism Housen (1997)observed a more evolved AMS fabric with minimum susceptibilityaxis aligned along the shortening direction. In both studies coresamples retrieved below the decollement zone showed AMSfabrics characteristic of sedimentary (i.e. undisturbed) fabrics,which indicates that these samples were decoupled from strainaccumulation above and in the vicinity of the decollement. Sucha ‘‘sedimentary’’ fabric was absent in our TCDP cores, possiblybecause the samples retrieved at depths below the Chelungputhrust had also been subjected to layer parallel shortening sincethey were located within the hanging wall of the Sanyi thrustbelow.
Our study demonstrates the usefulness of integrating AMS andAPV measurements to gain additional insights into petrofabricinvestigations. Our APV measurements show that the elastic fabric
Table 3Data from crack study in sample sets #04, #09 and #14
Set # Sample Total crackcount
Mean length(mm)
Preferredorientation
Planar bestfit (strike, dip)
#04 (850.8 m) X 13857 94.9 N15/89 N101.1, 89.5SY 2978 106.7 N105/55Z 5535 121.1 N100/0
#09 (1365 m) X 15381 67.5 N15/81 N285.5, 84.3NY 4700 93.5 N105/53Z 8777 90 N103/0
#14 (1394.25 m) X 16564 74.4 N15/71 N288.3, 77.1Y 10087 95.7 N105/51Z 13362 94.1 N103/0
Please cite this article in press as: Louis, L. et al., Anisotropy of magneticChelungpu-Fault Drilling Project (TCDP), Struct. Geol. (2008), doi:10.1016
is sensitive to lithology, and in conjunction with our AMS mea-surements on samples saturated with ferrofluid and quantitativemicrostructural observations they indicate that APV in sandstonesis controlled by the anisotropy of microcracks. Because of the rel-atively low density of microcracks in the siltstones, the preferredalignment of clay minerals in these samples can simultaneouslyexert dominant influences over both their APV and AMS. Hence theelastic fabrics reflect fundamentally different modes of strainaccumulation in sandstone and siltstone. In response to the appliedstress field, sandstone tends to deform in a brittle manner withdevelopment of stress-induced microcracking that is manifested byvelocity anisotropy (Nur and Simmons, 1969). In contrast, micro-cracking was not as pervasive in the relatively ‘‘ductile’’ siltstonesand accordingly their APV was primarily controlled by orientationof clay minerals. At this time, no further determination of micro-structural deformation features was performed. It is possible thatstrain was accommodated through other mechanisms as well, suchas crystal plasticity or diffusion creep. In a recent study, Isaacs et al.(2007) conducted geochemical and microstructural analyses ofChelungpu fault related rock samples retrieved both from the fieldand from TCDP hole A. In TCDP hole A, the authors reported byplaces the presence of deformed quartz grains and undeformedfossils and bioclasts away from the fault zones. No systematic fea-tures related to long term deformation other than the ones thatwere addressed in the present paper were evidenced, at least at thescale of their investigations.
Evaluation of the P-wave velocity anisotropy in samples fromother drilling sites such as the Nankai Trough (Bruckmann, 1993;
susceptibility and P-wave velocity in core samples from the Taiwan/j.jsg.2008.03.006
04X
0
500
1000
1500Crack count
0246810
Intercept density (mm-1)
0
500
1000
1500Crack count
0246810
Intercept density (mm-1)
0
500
1000
1500Crack count
0246810
Intercept density (mm-1)
Top
Bottom
N15
N19
5
Top
Bottom
N15
N19
5
Top
Bottom
N15
N19
5
04Y
Top
BottomN
285N10
5Top
Bottom
N285N
105
Top
Bottom
N285N
105
04Z
09X 09Y 09Z
14X 14Y 14Z
N285
N105
N15
N19
5
N285
N105
N15
N19
5N285
N105
N15
N19
5
a b c
Fig. 13. Polar plots of crack orientation and crack intercept density obtained from thin sections in plug sets #04, #09 and #14. Columns (a) to (c) correspond to sections (X) to (Z). (Y)sections contain fewer crack traces than other sections. Maximum crack counts in sections (X) and (Z) are obtained along or close to the vertical and along azimuth N105,respectively.
L. Louis et al. / Journal of Structural Geology xxx (2008) 1–1512
ARTICLE IN PRESS
Byrne et al., 1993) and the Barbados ridge accretionary complex(Bruckmann et al., 1997) had led to similar conclusions that de-serve comparison with our results. In the Nankai Trough (Bruck-mann et al., 1993), P-wave velocity maximum and minima wereattributed to the presence of microcracks originating from regionaltectonics (parallel to the direction of convergence) and from stressrelief after sample recovery (perpendicular to the direction ofconvergence). In relatively homogeneous silt clay samples, Byrneet al. (1993) observed a single anisotropy in the horizontal planewith a maximum P-wave velocity measured perpendicular to themaximum compressive stress which can be related to thepreferred alignment of clay minerals (also evidenced by AMSmeasurements).
Our P-wave velocity results in sandstone can be explained withthe scheme provided in Fig. 15. A sedimentary fabric first formedduring deposition and compaction. This sedimentary fabric,depending on the depositional regime, might have been made of an
Please cite this article in press as: Louis, L. et al., Anisotropy of magneticChelungpu-Fault Drilling Project (TCDP), Struct. Geol. (2008), doi:10.1016
isotropic surface oriented parallel to the bedding plane witha minimum P-wave velocity perpendicular to it (Fig. 15a), as alreadyobserved in undeformed sandstone due to preferential pore spaceelongation (Benson et al., 2005), or could have been slightly triaxialdue to the preferred grain alignment parallel to the depositionalflow. In the latter case, the P-wave velocity within the beddingplane would have been anisotropic with the two principal in planevalues still considerably larger than the one perpendicular to thebedding. Under subhorizontal tectonic loading, the sandstonegrains developed intense intragranular cracking in a parallel set ofmicrocracks perpendicular to the bedding strike and aligned withthe regional paleo- and contemporaneous stress orientation(Fig. 15b).
A final question that remains unanswered is the genesis ofmicrocracks and anisotropy in the TCDP sandstone. Since the crackplanes preferred orientations we infer are subvertical (Fig. 15b), it isunlikely that the microcracking was due to stress relief. With
susceptibility and P-wave velocity in core samples from the Taiwan/j.jsg.2008.03.006
Max PwvInt PwvMin Pwv
Crack pole
+
+
+
S0
Pole to bedding
#14#09
N
#04
MaxIntMin
Crack pole
+
+
+
S0
N
Min Pwv
Max Pwv
Max AMS
Min AMS
N105
iii
iii
ab
Fig. 14. (a) Planar best fit joining the three intercept minima directions (i.e. preferred crack orientation in each plane) for each plug set of Fig. 13. The normal to the planes obtainedfor all sets (crack poles) falls in the region of minimum P-wave velocity, parallel to the bedding strike. (b) Comparison of AMS of TCDP samples and APV eigenvectors of sandstoneswith stress orientation inferred by Angelier et al. (1986), Yeh et al. (2007), Wu et al. (2007) and Lin et al. (2007a). Minimum susceptibility axes are parallel to the average beddingpole measured in the TCDP hole (Yeh et al., 2007). Maximum susceptibility axes are located close to the intersection between the bedding and the plane normal to the paleostresstrajectory of Angelier et al. (1986) and to the direction of the maximum horizontal stress SHmax deduced from borehole breakouts and tensile fractures in holes A (Wu et al., 2007)and B (Lin et al., 2007a). Maximum P-wave velocity axes are subparallel to the paleostress trajectory and to the maximum horizontal stress SHmax. Minimum P-wave velocity axes areperpendicular to SHmax and parallel to the bedding strike. (i) N100: Stress trajectory deduced from fold axes (Angelier et al., 1986). (ii) N105: Average bedding dip direction in hole A(Yeh et al., 2007); paleostress trajectory deduced from fault analysis (Angelier et al., 1986). (iii) N115: Average orientation of SHmax deduced from borehole breakouts and tensilefractures in Hole A (Wu et al., 2007) and B (Lin et al., 2007a).
L. Louis et al. / Journal of Structural Geology xxx (2008) 1–15 13
ARTICLE IN PRESS
reference to the current stress state associated with reverse fault-ing, the average crack normal direction is indeed aligned with theintermediate principal stress. Since fracture mechanics predictsbrittle cracking to develop with the normal to cracks parallel to theminimum principal stress, the stress field responsible for inducingmicrocracking in the sandstone cannot be identical to the stressfield associated with the kinematics of the Chelungpu fault. Recentstudies on borehole breakouts and tensile fractures (Lin et al.,2007a; Wu et al., 2007) in TCDP holes A and B have identified stressorientation changes likely associated to the 1999 seismic event.Principal stress rotation was also showed by anelastic strain re-covery (ASR) experiments (Lin et al., 2007a). In this latter study, the
δ=30 degVPmin
VPmax~VPint
a b
Fig. 15. Explanatory scheme for the P-wave velocities measured in the sandstone samplesaligned with the bedding pole and the maximum and intermediate axes scattered within thecrack normal while elastic moduli remain unchanged in other directions. The result is a roa localization of the maximum velocity axis along the shortening direction, at the intersect
Please cite this article in press as: Louis, L. et al., Anisotropy of magneticChelungpu-Fault Drilling Project (TCDP), Struct. Geol. (2008), doi:10.1016
authors inferred the orientation of the three principal stresses inthree hole A samples retrieved from the deeper Cholan formationunderneath the Sanyi thrust, from FZA1111 in the Chinsui shale andfrom above the Chelungpu fault zone within the shallow Cholanformation. An interesting observation is the fact that the location ofthe maximum principal stress was found in both shallow samples(i.e. within and above FZA1111) close to the vertical direction,therefore close to the acting direction of the overburden. Lin et al.(2007a) suggested that the stress rotation observed in hole B atFZB1133 (equivalent of FZA1111; Hirono et al., 2007) was reflectinga present post-earthquake stress state consistent with a normalfaulting or strike slip regime. Moreover, Yeh et al. (2007) identified
δ=30 degVPint
VPmin VPmax
. (a) The intact rock displays a sedimentary anisotropy with a minimum velocity axisbedding plane. (b) The formation of microcracks lowers the P-wave velocity along the
tation of the minimum velocity axis from the bedding pole to the bedding strike andion between the bedding and cracks planes.
susceptibility and P-wave velocity in core samples from the Taiwan/j.jsg.2008.03.006
L. Louis et al. / Journal of Structural Geology xxx (2008) 1–1514
ARTICLE IN PRESS
among fault zones numerous strike slip structures dipping wN15–60/75, sometimes with a normal slip component and in one case(FZA1221) overprinting bedding slip thrusts. These observationsare consistent with a transitory minimum principal stress thatwould be oriented parallel to the bedding strike. In Fig. 13, cracksorientation in X samples at depths 1365 m and 1394.25 m (sets #09and #14) are somewhat offset from the originally inferred verticaldirection (maximum at 65–70�), which might be an indication ofa genetic relationship with the strike slip faults identified by Yehet al. (2007). The actual mechanics responsible for this transitorystress state remain uncertain and necessitate more investigationsincluding continuous in situ monitoring of stress changes associ-ated to fault rupturing. Some possible contributors that may be putforth are (1) contrasting elastic properties between siltstone andsandstone layers, (2) post rupturing viscous response generatinga transient tensile stress parallel to the bedding strike, or (3)mechanical anisotropy favoring N15 extension under actingoverburden.
Our investigations underscored the relatively strong anisotropyof two physical properties in relation to bedding foliation andtectonic loading. This implies that anisotropy in the mechanical andtransport properties of the TCDP cores could be significant. Sys-tematic studies of mechanical properties, frictional strength andpermeability of TCDP cores are currently underway in a number oflaboratories. While our study provides a petrofabric framework, weexpect that these ongoing studies will provide useful insight into themechanics of earthquake rupture in the Chelungpu fault system.
Acknowledgments
The research at Stony Brook was partially supported by the U.S.Geological Survey under grants 05HQGR0065 and 06HQGR0030.The research at Cergy-Pontoise was supported by the CNRS. Theresearch at NTU was supported by the National Science Council ofTaiwan under grant NSC 92-2119-M-002-006. We thank Jean-Christian Colombier for helping with the measurements and thetwo reviewers J.P. Gratier and G.J. Borradaile for their thorough andhelpful reviews.
References
Angelier, J., Barrier, E., Chu, H.T., 1986. Plate collision and paleostress trajectories ina fold thrust beltdthe foothills of Taiwan. Tectonophysics 125 (1-3), 161–178.
Averbuch, O., Frizon de Lamotte, D., Kissel, C., 1992. Magnetic fabric as a structuralindicator of the deformation path within a fold-thrust structure: a test casefrom the Corbieres (NE Pyrenees, France). Journal of Structural Geology 14 (4),461–474.
Benson, P.M., Meredith, P.G., Platzman, E.S., White, R.E., 2005. Pore fabric shapeanisotropy in porous sandstones and its relation to elastic wave velocity andpermeability anisotropy under hydrostatic pressure. International Journal ofRock Mechanics and Mining Sciences 42 (7-8), 890–899.
Borradaile, G.J., Henry, B., 1997. Tectonic applications of magnetic susceptibility andits anisotropy. Earth-Science Reviews 42, 49–93.
Borradaile, G.J., Jackson, M., 2004. Anisotropy of magnetic susceptibility (AMS):magnetic petrofabrics of deformed rocks. Geological Society of London SpecialPublications 238, 299–360.
Borradaile, G.J., Stupavsky, M., 1995. Anisotropy of magnetic susceptibility:measurement schemes. Geophysical Research Letters 22, 1957–1960.
Bruckmann, W., Moran, K., Housen, B., 1997. Acoustic anisotropy and microfabricdevelopment in accreted sediment from the Nankai trough. Proceedings of theOcean Drilling Program. Scientific Results 131, 221–233.
Bruckmann, W., Moran, K., Taylor, E., 1993. Acoustic anisotropy and microfabricdevelopment in accreted sediment from the Nankai trough. Proceedings of theOcean Drilling Program. Scientific Results 131, 221–233.
Budiansky, B., O’Connell, R.J., 1976. Elastic-moduli of a cracked solid. InternationalJournal of Solids and Structures 12 (2), 81–97.
Byrne, T., Maltman, A., Stephenson, E., Soh, W., Knipe, R., 1993. Deformationstructures and fluid flow in the tow region of the Nankai accretionary prism.Proceedings of the Ocean Drilling Program. Scientific Results 131, 83–101.
Daly, L., 1970. Etude des proprietes magnetiques des roches metamorphiques ousimplement tectonisees. Nature de leur aimantation naturelle. Determinationde leur anisotropie magnetique et application a l’analyse structurale, PhDthesis, Universite Paris VI.
Please cite this article in press as: Louis, L. et al., Anisotropy of magneticChelungpu-Fault Drilling Project (TCDP), Struct. Geol. (2008), doi:10.1016
David, C., Datot, M., Jeannette, D., 1993. Pore structures and transport properties ofsandstone. Transport Porous Media 11, 161–177.
Graham, J.W., 1966. Significance of magnetic anisotropy in appalachian sedimentaryrocks. In: Steinhart, J.S., Smith, T.J. (Eds.), The Earth Beneath theContinentsAmerican Geophysical Union Geophysical Monograph Series 10, pp.627–648.
Hirono, T., Yeh, E.-C., Lin, W., Sone, H., Mishima, T., Soh, W., Hashimoto, Y.,Matsubayashi, O., Aoike, K., Ito, H., Kinoshita, M., Murayama, M., Song, S.-R.,Ma, K.-F., Hung, J.-H., Wang, C.-Y., Tsai, Y.-B., Kondo, T., Nishimura, M., Moriya, S.,Tanaka, T., Fujiki, T., Maeda, L., Muraki, H., Kuramoto, T., Sugiyama, K.,Sugarawa, T., 2007. Nondestructive continuous physical property measure-ments of core samples recovered from Hole B, Taiwan Chelungpu-Fault DrillingProject. Journal of Geophysical Research 112 B07404.
Hornby, B.E., 1998. Experimental laboratory determination of the dynamic elasticproperties of wet, drained shales. Journal of Geophysical Research-Solid Earth103 (B12), 29945–29964.
Housen, B.A., 1997. Magnetic anisotropy of Barbados prism sediments. Proceedingsof the Ocean Drilling Program. Scientific Results 156, 97–105.
Hrouda, F., Zdenek, P., Wohlgemuth, J., 1993. Development of magnetic and elasticanisotropies in slates during progressive deformation. Physics of the Earth andPlanetary Interiors 77, 251–265.
Isaacs, A.J., Evans, J.P., Song, S.-R., Kolesar, P.T., 2007. Structural, mineralogical, andgeochemical characterization of the Chelungpu thrust fault, Taiwan. Terrestrial.Atmospheric and Oceanic Sciences 18 (2), 183–221.
Jelinek, V., 1981. Characterization of the magnetic fabrics of rocks. Tectonophysics79, T63–T67.
Johnston, J.E., Christensen, N.I., 1995. Seismic anisotropy of shales. Journal ofGeophysical Research 100 (B4), 5991–6003.
Kano, Y., Mori, J., Fujio, R., Ito, H., Yanagidani, T., Nakao, S., Ma, K.F., 2006. Heatsignature on the Chelungpu fault associated with the 1999 Chi-Chi, Taiwanearthquake. Geophysical Research Letters 33 (14).
Kern, H., 1993. P- and S-wave anisotropy and shear-wave splitting at pressure andtemperature in possible mantle rocks and their relation to the rock fabric.Physics of the Earth and Planetary Interiors 78 (3-4), 245–256.
Kligfield, R., Owens, W.H., Lowrie, W., 1981. Magnetic-susceptibility anisotropy,strain, and progressive deformation in Permian sediments from the MaritimeAlps (France). Earth and Planetary Science Letters 55 (1), 181–189.
Kuo, L.W.S., Song, S.R., 2005. Characteristics of clay mineralogy in the fault zone ofthe TCDP and its implication. Abstract of the Annual Meeting of the GeologicalSociety located in Taipei, 45.
Lin, W.R., Yeh, E.-C., Ito, H., Hirono, T., Soh, W., Wang, C.-Y., Ma, K.-F., Hung, J.-H.,Song, S.-R., 2007a. Preliminary results of stress measurement using drill cores ofTCDP Hole-A: an application of anelastic strain recovery method to three-dimensional in-situ stress determination. Terrestrial. Atmospheric and OceanicSciences 18 (2), 379–393.
Lin, W.R., Yeh, E.-C., Ito, H., Hirono, T., Soh, W., Ma, K.-F., Kinoshita, M.W., Wang, C.-Y.,Hung, J.-H., Song, S.-R., 2007b. Current stress state and principal stress rotationsin the vicinity of the Chelungpu fault induced by the 1999 Chi-Chi, Taiwan,earthquake. Geophysical Research Letters 34, L16307.
Lo, T.-W., Coyner, K.B., Toksoz, M.N., 1986. Experimental determination of elasticanisotropy of Berea Sandstone, Chicopee shale, and Chelmsford granite. Geo-physics 51, 164–171.
Louis, L., David, C., Metz, V., Robion, P., Menendez, B., Kissel, C., 2005. Micro-structural control on the anisotropy of elastic and transport properties inundeformed sandstones. International Journal of Rock Mechanics 42 (7-8),911–923.
Louis, L., David, C., Robion, P., 2003. Comparison of the anisotropic behaviour ofundeformed sandstones under dry and saturated conditions. Tectonophysics370 (1-4), 193–212.
Louis, L., Robion, P., David, C., 2004. A single method for the inversion of anisotropicdata sets with application to structural studies. Journal of Structural Geology 26,2065–2072.
Martin-Hernandez, F., Hirt, A.M., 2003. The anisotropy of magnetic susceptibility inbiotite, muscovite and chlorite single crystals. Tectonophysics 367, 13–28.
Nur, A., Simmons, G., 1969. The effect of saturation on velocity in low porosity rocks.Earth and Planetary Science Letters 7, 183–193.
Nye, J.F., 1957. Physical Properties of Crystals: Their Representation by Tensors andMatrices. Oxford Science Publications.
Owens, W.H., 1993. Magnetic fabric studies of samples from Hole 808C, NankaiTrough. Proceedings of the Ocean Drilling Program. Scientific Results 131,301–310.
Pares, J.M., van der Pluijm, B.A., 2002. Evaluating magnetic lineations (AMS) indeformed rocks. Tectonophysics 350 (4), 283–298.
Pfleiderer, S., Halls, H.C., 1993. Magnetic fabric analysis: verification throughautocorrelation. Journal of Geophysical Research 98, 4311–4316.
Pokorny, J., Suza, P., Hrouda, F., 2004. Anisotropy of magnetic susceptibility of rocksmeasured in variable weak magnetic fields using the KLY-4S Kappabridge.Geological Society of London Special Publications 238 (1), 69–76.
Robion, P., Grelaud, S., de Lamotte, D.F., 2007. Pre-folding magnetic fabrics in fold-and-thrust belts: Why the apparent internal deformation of the sedimentaryrocks from the Minervois basin (NE-Pyrenees, France) is so high compared tothe Potwar basin (SW-Himalaya, Pakistan)? Sedimentary Geology 196 (1-4),181–200.
Rochette, P., Jackson, M.J., Aubourg, C., 1992. Rock magnetism and the in-terpretation of anisotropy of magnetic susceptibility. Reviews of Geophysics30, 209–226.
susceptibility and P-wave velocity in core samples from the Taiwan/j.jsg.2008.03.006
L. Louis et al. / Journal of Structural Geology xxx (2008) 1–15 15
ARTICLE IN PRESS
Sans, M., Verges, J., Gomis, E., Pares, J.M., Schiattarella, M., Trave, A., Calvet, F.,Santanach, P., Doulcet, A., 2003. Layer parallel shortening in salt-detached folds:constraint on cross-section restoration. Tectonophysics 372, 85–103.
Shin, T.C., Teng, T.L., 2001. An overview of the 1999 Chi-Chi, Taiwan, earthquake.Bulletin of the Seismological Society of America 91 (5), 895–913.
Song, S.R., Wang, C.Y., Hung, J.H., Ma, K.F., 2007a. Preface to the special issue onTaiwan Chelungpu-fault Drilling Project (TCDP): Site characteristics and on-sitemeasurements. Terrestrial Atmospheric and Oceanic Sciences 18 (2), I–V.
Song, S.R., Kuo, L.W., Yeh, E.C., Wang, C.Y., Hung, J.H., Ma, K.F., 2007b. Characteristicsof the lithology, fault-related rocks and fault zone structures in TCDP Hole-A.Terrestrial Atmospheric and Oceanic Sciences 18 (2), 243–269.
Tarling, D.H., Hrouda, F., 1993. The Magnetic Anisotropy of Rocks. Chapman andHall, London.
Thomsen, L., 1986. Weak elastic anisotropy. Geophysics 51 (10), 1954–1966.Tsvankin, I., 1997. Anisotropic parameters and P-wave velocity for orthorhombic
media. Geophysics 62 (4), 1292–1309.Underwood, E.E., 1970. Quantitative Stereology. Addison-Wesley, Boston, MA.
Please cite this article in press as: Louis, L. et al., Anisotropy of magneticChelungpu-Fault Drilling Project (TCDP), Struct. Geol. (2008), doi:10.1016
Wu, H.Y., Ma, K.F., Zoback, M., Boness, N., Ito, H., Hung, J.H., Hickman, S., 2007. Stressorientations of Taiwan Chelungpu-Fault Drilling Project (TCDP) hole-A asobserved from geophysical logs. Geophysical Research Letters 34 (1).
Wu, X.Y., Baud, P., Wong, T.F., 2000. Micromechanics of compressive failure andspatial evolution of anisotropic damage in Darley Dale sandstone. InternationalJournal of Rock Mechanics and Mining Sciences 37 (1-2), 143–160.
Yeh, E., Sone, H., Nakaya, T., Ian, K., Song, S., Hung, J., 2004. Preliminary summary ofcurrent fault zones in the Hole-A of TCDP. Eos Transactions AGU, Fall Meeting,Supplement 85 (47).
Yeh, E.C., Sone, H., Nakaya, T., Ian, K.-H., Song, S.-R., Hung, J.-H., Lin, W.,Hirono, T., Wang, C.-Y., Ma, K.-F., Soh, W., Kinoshita, M., 2007. Core de-scription and characteristics of fault zones from Hole-A of the Taiwan Che-lungpu-Fault drilling project. Terrestrial, Atmospheric and Oceanic Sciences18 (2), 327–357.
Yue, L.F., Suppe, J., Hung, J.H., 2005. Structural geology of a classic thrust beltearthquake: the 1999 Chi-Chi earthquake Taiwan (M-w¼7.6). Journal ofStructural Geology 27 (11), 2058–2083.
susceptibility and P-wave velocity in core samples from the Taiwan/j.jsg.2008.03.006