Embed Size (px)
Citation preview
Clean Water SRF Program Information
for the State of Delaware
CWSRF Agency Information
1 Lead State Agency Name: Department of Natural Resources and Environmental Control 18 Secondary Agency Name:
2 Type of Agency: Environmental Finance 19 Type of Agency:
3 Mailing Address: 97 Commerce Way, Suite 106 20 Mailing Address:
4 City: Dover 21 City:
5 Zip Code: 19904 22 Zip Code:
6 Street Address: 97 Commerce Way, Suite 106 23 Street Address:
7 City: Dover 24 City:
8 Zip Code: 19904 25 Zip Code:
9 Director: Greg Pope 26 Director:
10 Director's Title: Acting Chief of Environmental Finance 27 Director's Title:
11 Phone Number: (302)-739-9941 28 Phone Number:
12 Fax Number: (302) 739-2137 29 Fax Number:
13 E-mail Address: [email protected] 30 E-mail Address:
14 Contact Person: Greg Pope 31 Contact Person:
15 Phone Number: (302)-739-9941 32 Phone Number:
16 Fax Number: (302) 739-2137 33 Fax Number:
17 E-mail Address: [email protected] 34 E-mail Address:
Other Agency:
35 Other Agency Name:
36 Type of Agency:
37 Mailing Address:
38 City:
39 Zip Code:
40 Street Address:
41 City:
42 Zip Code:
43 Director:
44 Director's Title:
45 Phone Number:
46 Fax Number:
47 E-mail Address:
48 Contact Person:
49 Phone Number:
50 Fax Number:
51 E-mail Address:
Page 1 of 67 10/31/2019

Clean Water SRF Program Information
for the State of Delaware
For Federal Fiscal Year Ending September 30 of:
1988 1989 1990 1991 1992 1993 1994 1995
Federal Grants (Dollars)
52 Date of Last Award in the Year - - 09/28/90 09/25/91 09/30/92 09/23/93 09/26/94 04/28/95
53 Title II Funds 0 0 206,154 211,833 0 0 0 0
54 Title VI - Current Year's Appropriation 0 0 4,738,000 0 0 9,431,000 5,813,800 6,007,800
55 Title VI - Prior Year's Appropriation 0 0 4,577,200 0 10,075,032 9,534,900 0 0
55a ARRA Grant 0 0 0 0 0 0 0 0
56 *Total Annual Federal Grants 0 0 9,521,354 211,833 10,075,032 18,965,900 5,813,800 6,007,800
57 *Cumulative Federal Grants 0 0 9,521,354 9,733,187 19,808,219 38,774,119 44,587,919 50,595,719
Transfer of Federal Funds Between CWSRF and DWSRF
58 Amount of Federal Funds Transferred into CWSRF
59 Amount of Federal Funds Transferred out of CWSRF
60 *Net Transfer into/(out of) CWSRF
61 *Cumulative Net Transfer into/(out of) CWSRF
Quarterly Outlays (Dollars)
62 First Quarter Outlays 0 0 0 0 58,000 36,500 516,997 1,465,232
63 Second Quarter Outlays 0 0 0 0 20,000 32,400 165,207 1,383,643
64 Third Quarter Outlays 0 0 0 0 25,000 78,500 3,361,719 1,371,532
65 Fourth Quarter Outlays 0 0 0 0 15,000 17,000 3,147,749 1,413,447
66 *Total Annual Outlays 0 0 0 0 118,000 164,400 7,191,672 5,633,854
67 *Cumulative Outlays 0 0 0 0 118,000 282,400 7,474,072 13,107,926
For the Reporting Year Ending June 30 of:
1988 1989 1990 1991 1992 1993 1994 1995
Outlays (Dollars)
68 *Annual 0 0 0 0 103,000 162,400 4,060,923 7,368,156
69 *Cumulative 0 0 0 0 103,000 265,400 4,326,323 11,694,479
* Calculated values.
Page 2 of 67 10/31/2019

Federal Grants (Dollars)
52 Date of Last Award in the Year
53 Title II Funds
54 Title VI - Current Year's Appropriation
55 Title VI - Prior Year's Appropriation
55a ARRA Grant
56 *Total Annual Federal Grants
57 *Cumulative Federal Grants
Transfer of Federal Funds Between CWSRF and DWSRF
58 Amount of Federal Funds Transferred into CWSRF
59 Amount of Federal Funds Transferred out of CWSRF
60 *Net Transfer into/(out of) CWSRF
61 *Cumulative Net Transfer into/(out of) CWSRF
Quarterly Outlays (Dollars)
62 First Quarter Outlays
63 Second Quarter Outlays
64 Third Quarter Outlays
65 Fourth Quarter Outlays
66 *Total Annual Outlays
67 *Cumulative Outlays
Outlays (Dollars)
68 *Annual
69 *Cumulative
* Calculated values.
Clean Water SRF Program Informationfor the State of Delaware
For Federal Fiscal Year Ending September 30 of:
1996 1997 1998 1999 2000 2001 2002 2003
09/30/96 09/26/97 - 09/21/99 09/28/00 09/19/01 09/05/02 -
0 0 0 0 4,513,208 0 0 0
9,904,653 2,990,500 0 0 6,555,200 6,496,100 6,510,800 0
0 0 0 6,577,300 6,577,900 0 0 0
0 0 0 0 0 0 0 0
9,904,653 2,990,500 0 6,577,300 17,646,308 6,496,100 6,510,800 0
60,500,372 63,490,872 63,490,872 70,068,172 87,714,480 94,210,580 100,721,380 100,721,380
0 0 0 0 0 0 0
0 0 0 0 0 0 0
0 0 0 0 0 0 0
0 0 0 0 0 0 0
3,674,200 4,346,292 2,184,394 428,684 3,090,153 4,259,293 3,617,484 911,785
2,649,197 2,761,209 1,660,218 1,110,903 2,796,958 679,057 755,061 125,232
2,360,226 3,412,243 1,197,490 1,473,885 556,102 440,149 1,327,405 725,675
1,068,036 2,998,488 689,918 1,394,765 540,748 3,041,869 156,828 1,823,664
9,751,659 13,518,232 5,732,020 4,408,237 6,983,961 8,420,368 5,856,778 3,586,356
22,859,585 36,377,817 42,109,837 46,518,074 53,502,035 61,922,403 67,779,181 71,365,537
For the Reporting Year Ending June 30 of:
1996 1997 1998 1999 2000 2001 2002 2003
10,097,070 11,587,780 8,040,590 3,703,390 7,837,978 5,919,247 8,741,819 1,919,520
21,791,549 33,379,329 41,419,919 45,123,309 52,961,287 58,880,534 67,622,353 69,541,873
Page 3 of 67 10/31/2019

Federal Grants (Dollars)
52 Date of Last Award in the Year
53 Title II Funds
54 Title VI - Current Year's Appropriation
55 Title VI - Prior Year's Appropriation
55a ARRA Grant
56 *Total Annual Federal Grants
57 *Cumulative Federal Grants
Transfer of Federal Funds Between CWSRF and DWSRF
58 Amount of Federal Funds Transferred into CWSRF
59 Amount of Federal Funds Transferred out of CWSRF
60 *Net Transfer into/(out of) CWSRF
61 *Cumulative Net Transfer into/(out of) CWSRF
Quarterly Outlays (Dollars)
62 First Quarter Outlays
63 Second Quarter Outlays
64 Third Quarter Outlays
65 Fourth Quarter Outlays
66 *Total Annual Outlays
67 *Cumulative Outlays
Outlays (Dollars)
68 *Annual
69 *Cumulative
* Calculated values.
Clean Water SRF Program Informationfor the State of Delaware
For Federal Fiscal Year Ending September 30 of:
2004 2005 2006 2007 2008 2009 2010 2011
09/10/04 09/14/05 09/20/06 09/26/07 09/24/08 06/12/09 09/15/10 09/13/11
0 0 0 0 660,555 0 0 0
0 0 3,116,000 5,207,300 3,274,300 0 10,002,000 7,222,000
6,467,800 6,471,800 5,243,500 1,126,300 0 0 3,274,300 0
0 0 0 0 0 19,239,100 0 0
6,467,800 6,471,800 8,359,500 6,333,600 3,934,855 19,239,100 13,276,300 7,222,000
107,189,180 113,660,980 122,020,480 128,354,080 132,288,935 151,528,035 164,804,335 172,026,335
0 0 0 0 0 0 0 0
0 0 0 0 0 0 0 0
0 0 0 0 0 0 0 0
0 0 0 0 0 0 0 0
2,006,149 3,264,253 1,660,275 1,865,822 7,152,888 2,088,921 382,137 11,881,512
1,235,981 375,938 1,667,950 3,265,200 2,420,249 38,974 2,316,241 5,566,036
9,313,938 3,099,326 6,087,952 2,742,914 66,799 2,384,990 3,039,038 4,673,763
153,173 285,570 2,216,316 1,603,876 3,962,090 304,838 3,500,852 120,115
12,709,241 7,025,087 11,632,493 9,477,812 13,602,026 4,817,723 9,238,268 22,241,425
84,074,778 91,099,865 102,732,358 112,210,170 125,812,196 130,629,919 139,868,187 162,109,612
For the Reporting Year Ending June 30 of:
2004 2005 2006 2007 2008 2009 2010 2011
14,379,732 6,892,690 9,701,747 10,090,252 11,243,812 8,474,975 6,042,254 25,622,163
83,921,605 90,814,295 100,516,042 110,606,294 121,850,106 130,325,081 136,367,335 161,989,497
Page 4 of 67 10/31/2019

Federal Grants (Dollars)
52 Date of Last Award in the Year
53 Title II Funds
54 Title VI - Current Year's Appropriation
55 Title VI - Prior Year's Appropriation
55a ARRA Grant
56 *Total Annual Federal Grants
57 *Cumulative Federal Grants
Transfer of Federal Funds Between CWSRF and DWSRF
58 Amount of Federal Funds Transferred into CWSRF
59 Amount of Federal Funds Transferred out of CWSRF
60 *Net Transfer into/(out of) CWSRF
61 *Cumulative Net Transfer into/(out of) CWSRF
Quarterly Outlays (Dollars)
62 First Quarter Outlays
63 Second Quarter Outlays
64 Third Quarter Outlays
65 Fourth Quarter Outlays
66 *Total Annual Outlays
67 *Cumulative Outlays
Outlays (Dollars)
68 *Annual
69 *Cumulative
* Calculated values.
Clean Water SRF Program Informationfor the State of Delaware
For Federal Fiscal Year Ending September 30 of:
2012 2013 2014 2015 2016 2017 2018 2019
08/28/12 09/09/13 08/18/14 08/03/15 06/27/16 08/21/17 08/08/18 09/06/19
0 0 0 0 0 0 0 0
6,908,000 6,520,000 6,853,000 6,817,000 6,525,000 6,474,000 7,859,000 7,779,000
0 0 0 0 0 0 0 0
0 0 0 0 0 0 0 0
6,908,000 6,520,000 6,853,000 6,817,000 6,525,000 6,474,000 7,859,000 7,779,000
178,934,335 185,454,335 192,307,335 199,124,335 205,649,335 212,123,335 219,982,335 227,761,335
27,050,176 0 0 0 0 0 0 0
0 0 0 0 0 0 0 0
27,050,176 0 0 0 0 0 0 0
27,050,176 27,050,176 27,050,176 27,050,176 27,050,176 27,050,176 27,050,176 27,050,176
27,796 3,405,932 1,033,601 1,003,024 404,624 3,217,991 3,090,089 5,493,300
774,857 2,686,418 359,365 2,663,040 3,685,100 1,977,955 3,384,172 2,227,119
3,139,066 1,218,156 24,813,642 1,948,846 5,204,360 4,612,951 0 138,581
1,148,248 466,101 1,678,839 1,077,159 2,773,328 0 0 0
5,089,967 7,776,608 27,885,447 6,692,068 12,067,412 9,808,897 6,474,261 7,859,000
167,199,579 174,976,187 202,861,634 209,553,702 221,621,114 231,430,011 237,904,272 245,763,272
2012 2013 2014 2015 2016 2017 2018 2019
4,061,834 8,458,754 26,672,709 7,293,748 10,371,243 12,582,225 6,474,261 7,859,000
166,051,331 174,510,086 201,182,795 208,476,543 218,847,786 231,430,011 237,904,272 245,763,272
Page 5 of 67 10/31/2019

Clean Water SRF Program Informationfor the State of Delaware
Federal and State Investment For the Reporting Year Ending June 30 of:
1988 1989 1990 1991 1992 1993 1994 1995
Investment Summary
Total Federal CWSRF Capitalization Grants (Dollars)
70 *Annual 0 0 0 9,521,354 211,833 10,075,032 18,965,900 11,821,600
71 *Cumulative 0 0 0 9,521,354 9,733,187 19,808,219 38,774,119 50,595,719
72 *Annual
73 *Cumulative
Federal CWSRF Contributions Adjusted for Transfers
74 *Annual 0 0 0 9,521,354 211,833 10,075,032 18,965,900 11,821,600
75 *Cumulative 0 0 0 9,521,354 9,733,187 19,808,219 38,774,119 50,595,719
Total State Contributions (Dollars)
76 *Annual 0 0 0 1,904,271 42,367 2,015,006 3,793,180 2,364,320
77 *Cumulative 0 0 0 1,904,271 1,946,638 3,961,644 7,754,824 10,119,144
78 *Annual - - - 20% 20% 20% 20% 20%
79 *Cumulative - - - 20% 20% 20% 20% 20%
78a *Annual - - - - 41% 1241% 93% 32%
79a *Cumulative - - - - 1890% 1493% 179% 87%
80 *Annual Net Federal Funds Transferred
81 Annual Net Non-Federal Funds Transferred
82 *Annual Net Federal and Non-Federal Funds Transferred
83 *Cumulative Net Federal and Non-Federal Funds Transferred
* Calculated values.
State Contributions as a % of Federal CWSRF Capitalization Outlays
(excludes ARRA and Net Federal Transfers)
Total State Contributions as a % of Federal CWSRF Capitalization Grants
(excludes ARRA)
Net Transfer of Funds with DWSRF into/(out of) the
CWSRF
Net Transfer of Federal Funds with DWSRF into/(out of)
CWSRF
Page 6 of 67 10/31/2019

Federal and State Investment
Investment Summary
Total Federal CWSRF Capitalization Grants (Dollars)
70 *Annual
71 *Cumulative
72 *Annual
73 *Cumulative
Federal CWSRF Contributions Adjusted for Transfers
74 *Annual
75 *Cumulative
Total State Contributions (Dollars)
76 *Annual
77 *Cumulative
78 *Annual
79 *Cumulative
78a *Annual
79a *Cumulative
80 *Annual Net Federal Funds Transferred
81 Annual Net Non-Federal Funds Transferred
82 *Annual Net Federal and Non-Federal Funds Transferred
83 *Cumulative Net Federal and Non-Federal Funds Transferred
* Calculated values.
State Contributions as a % of Federal CWSRF Capitalization Outlays
(excludes ARRA and Net Federal Transfers)
Total State Contributions as a % of Federal CWSRF Capitalization Grants
(excludes ARRA)
Net Transfer of Funds with DWSRF into/(out of) the
CWSRF
Net Transfer of Federal Funds with DWSRF into/(out of)
CWSRF
Clean Water SRF Program Informationfor the State of Delaware
For the Reporting Year Ending June 30 of:
1996 1997 1998 1999 2000 2001 2002 2003
0 9,904,653 2,990,500 0 6,577,300 17,646,308 6,496,100 6,510,800
50,595,719 60,500,372 63,490,872 63,490,872 70,068,172 87,714,480 94,210,580 100,721,380
0 0 0 0 0 0 0
0 0 0 0 0 0 0
0 9,904,653 2,990,500 0 6,577,300 17,646,308 6,496,100 6,510,800
50,595,719 60,500,372 63,490,872 63,490,872 70,068,172 87,714,480 94,210,580 100,721,380
0 1,980,931 598,100 0 1,315,460 3,529,261 1,299,220 1,297,663
10,119,144 12,100,075 12,698,175 12,698,175 14,013,635 17,542,896 18,842,116 20,139,779
- 20% 20% - 20% 20% 20% 20%
20% 20% 20% 20% 20% 20% 20% 20%
0% 17% 7% 0% 17% 60% 15% 68%
46% 36% 31% 28% 26% 30% 28% 29%
0 0 0 0 0 0 0
0 0 0 0 0 0 0
0 0 0 0 0 0 0
0 0 0 0 0 0 0
Page 7 of 67 10/31/2019

Federal and State Investment
Investment Summary
Total Federal CWSRF Capitalization Grants (Dollars)
70 *Annual
71 *Cumulative
72 *Annual
73 *Cumulative
Federal CWSRF Contributions Adjusted for Transfers
74 *Annual
75 *Cumulative
Total State Contributions (Dollars)
76 *Annual
77 *Cumulative
78 *Annual
79 *Cumulative
78a *Annual
79a *Cumulative
80 *Annual Net Federal Funds Transferred
81 Annual Net Non-Federal Funds Transferred
82 *Annual Net Federal and Non-Federal Funds Transferred
83 *Cumulative Net Federal and Non-Federal Funds Transferred
* Calculated values.
State Contributions as a % of Federal CWSRF Capitalization Outlays
(excludes ARRA and Net Federal Transfers)
Total State Contributions as a % of Federal CWSRF Capitalization Grants
(excludes ARRA)
Net Transfer of Funds with DWSRF into/(out of) the
CWSRF
Net Transfer of Federal Funds with DWSRF into/(out of)
CWSRF
Clean Water SRF Program Informationfor the State of Delaware
For the Reporting Year Ending June 30 of:
2004 2005 2006 2007 2008 2009 2010 2011
0 6,467,800 6,471,800 8,359,500 6,333,600 23,173,955 3,274,300 10,002,000
100,721,380 107,189,180 113,660,980 122,020,480 128,354,080 151,528,035 154,802,335 164,804,335
0 0 0 0 0 0 0 0
0 0 0 0 0 0 0 0
0 6,467,800 6,471,800 8,359,500 6,333,600 23,173,955 3,274,300 10,002,000
100,721,380 107,189,180 113,660,980 122,020,480 128,354,080 151,528,035 154,802,335 164,804,335
0 1,293,560 1,294,360 1,671,900 1,270,435 786,971 654,860 2,001,182
20,139,779 21,433,339 22,727,699 24,399,599 25,670,034 26,457,005 27,111,865 29,113,047
- 20% 20% 20% 20% 20% 20% 20%
20% 20% 20% 20% 20% 20% 20% 20%
0% 19% 13% 17% 11% 9% 31% 17%
24% 24% 23% 22% 21% 20% 20% 20%
0 0 0 0 0 0 0 0
0 0 0 0 0 0 0 0
0 0 0 0 0 0 0 0
0 0 0 0 0 0 0 0
Page 8 of 67 10/31/2019

Federal and State Investment
Investment Summary
Total Federal CWSRF Capitalization Grants (Dollars)
70 *Annual
71 *Cumulative
72 *Annual
73 *Cumulative
Federal CWSRF Contributions Adjusted for Transfers
74 *Annual
75 *Cumulative
Total State Contributions (Dollars)
76 *Annual
77 *Cumulative
78 *Annual
79 *Cumulative
78a *Annual
79a *Cumulative
80 *Annual Net Federal Funds Transferred
81 Annual Net Non-Federal Funds Transferred
82 *Annual Net Federal and Non-Federal Funds Transferred
83 *Cumulative Net Federal and Non-Federal Funds Transferred
* Calculated values.
State Contributions as a % of Federal CWSRF Capitalization Outlays
(excludes ARRA and Net Federal Transfers)
Total State Contributions as a % of Federal CWSRF Capitalization Grants
(excludes ARRA)
Net Transfer of Funds with DWSRF into/(out of) the
CWSRF
Net Transfer of Federal Funds with DWSRF into/(out of)
CWSRF
Clean Water SRF Program Informationfor the State of Delaware
For the Reporting Year Ending June 30 of:
2012 2013 2014 2015 2016 2017 2018 2019
7,222,000 6,908,000 6,520,000 6,853,000 13,342,000 0 6,474,000 7,859,000
172,026,335 178,934,335 185,454,335 192,307,335 205,649,335 205,649,335 212,123,335 219,982,335
27,050,176 0 0 0 0 0 0 0
27,050,176 27,050,176 27,050,176 27,050,176 27,050,176 27,050,176 27,050,176 27,050,176
34,272,176 6,908,000 6,520,000 6,853,000 13,342,000 0 6,474,000 7,859,000
199,076,511 205,984,511 212,504,511 219,357,511 232,699,511 232,699,511 239,173,511 247,032,511
1,444,400 6,791,637 1,304,000 1,370,600 1,363,400 1,305,000 1,294,800 1,571,800
30,557,447 37,349,084 38,653,084 40,023,684 41,387,084 42,692,084 43,986,884 45,558,684
20% 98% 20% 20% 10% - 20% 20%
20% 23% 23% 23% 22% 23% 23% 23%
-6% 80% 5% 19% 13% 10% 20% 20%
26% 29% 25% 25% 24% 23% 23% 23%
27,050,176 0 0 0 0 0 0 0
5,410,035 0 0 0 0 0 0 0
32,460,211 0 0 0 0 0 0 0
32,460,211 32,460,211 32,460,211 32,460,211 32,460,211 32,460,211 32,460,211 32,460,211
Page 9 of 67 10/31/2019

Clean Water SRF Program Informationfor the State of Delaware
Federal and State Investment For the Reporting Year Ending June 30 of:
1988 1989 1990 1991 1992 1993 1994 1995
State Match Contributions (Dollars)
84 Cash or Appropriations 0 0 0 0 0 0 0 0
85 GO Bonds Retired Outside the CWSRF 0 0 0 1,904,271 42,367 2,015,006 3,793,180 2,364,320
86 GO Bonds Retired From the CWSRF 0 0 0 0 0 0 0 0
87 Revenue Bonds 0 0 0 0 0 0 0 0
88 Pre-existing Loans 0 0 0 0 0 0 0 0
89 Other Sources 0 0 0 0 0 0 0 0
90 *Total Annual Match Contribution 0 0 0 1,904,271 42,367 2,015,006 3,793,180 2,364,320
91 *Cumulative Match Contribution 0 0 0 1,904,271 1,946,638 3,961,644 7,754,824 10,119,144
Additional State Contributions in Excess of
Match (Dollars)
92 Cash or Appropriations 0 0 0 0 0 0 0 0
93 GO Bonds Retired Outside the CWSRF 0 0 0 0 0 0 0 0
94 GO Bonds Retired From the CWSRF 0 0 0 0 0 0 0 0
95 Revenue Bonds 0 0 0 0 0 0 0 0
96 Pre-existing Loans 0 0 0 0 0 0 0 0
97 Other Sources 0 0 0 0 0 0 0 0
98 *Total Annual Additional Contribution 0 0 0 0 0 0 0 0
99 *Cumulative Additional Contribution 0 0 0 0 0 0 0 0
* Calculated values.
Page 10 of 67 10/31/2019

Federal and State Investment
State Match Contributions (Dollars)
84 Cash or Appropriations
85 GO Bonds Retired Outside the CWSRF
86 GO Bonds Retired From the CWSRF
87 Revenue Bonds
88 Pre-existing Loans
89 Other Sources
90 *Total Annual Match Contribution
91 *Cumulative Match Contribution
Additional State Contributions in Excess of
Match (Dollars)
92 Cash or Appropriations
93 GO Bonds Retired Outside the CWSRF
94 GO Bonds Retired From the CWSRF
95 Revenue Bonds
96 Pre-existing Loans
97 Other Sources
98 *Total Annual Additional Contribution
99 *Cumulative Additional Contribution
* Calculated values.
Clean Water SRF Program Informationfor the State of Delaware
For the Reporting Year Ending June 30 of:
1996 1997 1998 1999 2000 2001 2002 2003
0 1,980,931 598,100 0 1,315,460 3,529,261 1,299,220 1,297,663
0 0 0 0 0 0 0 0
0 0 0 0 0 0 0 0
0 0 0 0 0 0 0 0
0 0 0 0 0 0 0 0
0 0 0 0 0 0 0 0
0 1,980,931 598,100 0 1,315,460 3,529,261 1,299,220 1,297,663
10,119,144 12,100,075 12,698,175 12,698,175 14,013,635 17,542,896 18,842,116 20,139,779
0 0 0 0 0 0 0 0
0 0 0 0 0 0 0 0
0 0 0 0 0 0 0 0
0 0 0 0 0 0 0 0
0 0 0 0 0 0 0 0
0 0 0 0 0 0 0 0
0 0 0 0 0 0 0 0
0 0 0 0 0 0 0 0
Page 11 of 67 10/31/2019

Federal and State Investment
State Match Contributions (Dollars)
84 Cash or Appropriations
85 GO Bonds Retired Outside the CWSRF
86 GO Bonds Retired From the CWSRF
87 Revenue Bonds
88 Pre-existing Loans
89 Other Sources
90 *Total Annual Match Contribution
91 *Cumulative Match Contribution
Additional State Contributions in Excess of
Match (Dollars)
92 Cash or Appropriations
93 GO Bonds Retired Outside the CWSRF
94 GO Bonds Retired From the CWSRF
95 Revenue Bonds
96 Pre-existing Loans
97 Other Sources
98 *Total Annual Additional Contribution
99 *Cumulative Additional Contribution
* Calculated values.
Clean Water SRF Program Informationfor the State of Delaware
For the Reporting Year Ending June 30 of:
2004 2005 2006 2007 2008 2009 2010 2011
0 1,293,560 1,294,360 1,671,900 1,270,435 786,971 654,860 2,001,182
0 0 0 0 0 0 0 0
0 0 0 0 0 0 0 0
0 0 0 0 0 0 0 0
0 0 0 0 0 0 0 0
0 0 0 0 0 0 0 0
0 1,293,560 1,294,360 1,671,900 1,270,435 786,971 654,860 2,001,182
20,139,779 21,433,339 22,727,699 24,399,599 25,670,034 26,457,005 27,111,865 29,113,047
0 0 0 0 0 0 0 0
0 0 0 0 0 0 0 0
0 0 0 0 0 0 0 0
0 0 0 0 0 0 0 0
0 0 0 0 0 0 0 0
0 0 0 0 0 0 0 0
0 0 0 0 0 0 0 0
0 0 0 0 0 0 0 0
Page 12 of 67 10/31/2019

Federal and State Investment
State Match Contributions (Dollars)
84 Cash or Appropriations
85 GO Bonds Retired Outside the CWSRF
86 GO Bonds Retired From the CWSRF
87 Revenue Bonds
88 Pre-existing Loans
89 Other Sources
90 *Total Annual Match Contribution
91 *Cumulative Match Contribution
Additional State Contributions in Excess of
Match (Dollars)
92 Cash or Appropriations
93 GO Bonds Retired Outside the CWSRF
94 GO Bonds Retired From the CWSRF
95 Revenue Bonds
96 Pre-existing Loans
97 Other Sources
98 *Total Annual Additional Contribution
99 *Cumulative Additional Contribution
* Calculated values.
Clean Water SRF Program Informationfor the State of Delaware
For the Reporting Year Ending June 30 of:
2012 2013 2014 2015 2016 2017 2018 2019
1,444,400 6,791,637 1,304,000 1,370,600 1,363,400 1,305,000 700,000 1,571,800
0 0 0 0 0 0 0 0
0 0 0 0 0 0 0 0
0 0 0 0 0 0 0 0
0 0 0 0 0 0 0 0
0 0 0 0 0 0 594,800 0
1,444,400 6,791,637 1,304,000 1,370,600 1,363,400 1,305,000 1,294,800 1,571,800
30,557,447 37,349,084 38,653,084 40,023,684 41,387,084 42,692,084 43,986,884 45,558,684
0 0 0 0 0 0 0 0
0 0 0 0 0 0 0 0
0 0 0 0 0 0 0 0
0 0 0 0 0 0 0 0
0 0 0 0 0 0 0 0
0 0 0 0 0 0 0 0
0 0 0 0 0 0 0 0
0 0 0 0 0 0 0 0
Page 13 of 67 10/31/2019

Clean Water SRF Program Informationfor the State of Delaware
CWSRF Assistance For the Reporting Year Ending June 30 of:
1988 1989 1990 1991 1992 1993 1994 1995
Binding Commitments
100 Annual Dollar Amount 0 0 0 0 20,000,000 16,219,082 407,578 493,150
101 *Cumulative Dollar Amount 0 0 0 0 20,000,000 36,219,082 36,626,660 37,119,810
102 Annual Number 0 0 0 0 1 2 49 65
103 *Cumulative Number 0 0 0 0 1 3 52 117
Type of CWSRF Assistance Provided (Dollars)
104 Assistance (includes pass-through and linked-deposit loans) 0 0 0 0 0 0 36,626,660 493,150
105 Refinance Short-term Debt 0 0 0 0 0 0 0 0
106 Refinance Long-term Debt 0 0 0 0 0 0 0 0
107 Guarantee/Purchase Insurance 0 0 0 0 0 0 0 0
108 Sub-state Revolving Funds 0 0 0 0 0 0 0 0
109 *Total Annual Assistance 0 0 0 0 0 0 36,626,660 493,150
110 *Cumulative Assistance 0 0 0 0 0 0 36,626,660 37,119,810
Type of CWSRF Assistance Provided
(Number of Assistance Agreements)
111 Assistance (includes linked-deposit and pass-through loans) 0 0 0 0 0 0 52 65
112 Refinance Short-term Debt 0 0 0 0 0 0 0 0
113 Refinance Long-term Debt 0 0 0 0 0 0 0 0
114 Guarantee/Purchase Insurance 0 0 0 0 0 0 0 0
115 Sub-state Revolving Funds 0 0 0 0 0 0 0 0
116 *Total Annual Number of Agreements 0 0 0 0 0 0 52 65
117 *Cumulative Number of Agreements 0 0 0 0 0 0 52 117
* Calculated values.
Page 14 of 67 10/31/2019

CWSRF Assistance
Binding Commitments
100 Annual Dollar Amount
101 *Cumulative Dollar Amount
102 Annual Number
103 *Cumulative Number
Type of CWSRF Assistance Provided (Dollars)
104 Assistance (includes pass-through and linked-deposit loans)
105 Refinance Short-term Debt
106 Refinance Long-term Debt
107 Guarantee/Purchase Insurance
108 Sub-state Revolving Funds
109 *Total Annual Assistance
110 *Cumulative Assistance
Type of CWSRF Assistance Provided
(Number of Assistance Agreements)
111 Assistance (includes linked-deposit and pass-through loans)
112 Refinance Short-term Debt
113 Refinance Long-term Debt
114 Guarantee/Purchase Insurance
115 Sub-state Revolving Funds
116 *Total Annual Number of Agreements
117 *Cumulative Number of Agreements
* Calculated values.
Clean Water SRF Program Informationfor the State of Delaware
For the Reporting Year Ending June 30 of:
1996 1997 1998 1999 2000 2001 2002 2003
4,588,210 8,732,369 12,096,849 778,101 17,438,317 8,694,692 14,518,675 10,855,485
41,708,020 50,440,389 62,537,238 63,315,339 80,753,656 89,448,348 103,967,023 114,822,508
68 90 45 107 97 121 106 82
185 275 320 427 524 645 751 833
4,588,210 8,732,369 12,096,849 778,101 17,438,317 8,694,692 14,518,675 10,855,485
0 0 0 0 0 0 0 0
0 0 0 0 0 0 0 0
0 0 0 0 0 0 0 0
0 0 0 0 0 0 0 0
4,588,210 8,732,369 12,096,849 778,101 17,438,317 8,694,692 14,518,675 10,855,485
41,708,020 50,440,389 62,537,238 63,315,339 80,753,656 89,448,348 103,967,023 114,822,508
68 90 45 107 97 121 106 82
0 0 0 0 0 0 0 0
0 0 0 0 0 0 0 0
0 0 0 0 0 0 0 0
0 0 0 0 0 0 0 0
68 90 45 107 97 121 106 82
185 275 320 427 524 645 751 833
Page 15 of 67 10/31/2019

CWSRF Assistance
Binding Commitments
100 Annual Dollar Amount
101 *Cumulative Dollar Amount
102 Annual Number
103 *Cumulative Number
Type of CWSRF Assistance Provided (Dollars)
104 Assistance (includes pass-through and linked-deposit loans)
105 Refinance Short-term Debt
106 Refinance Long-term Debt
107 Guarantee/Purchase Insurance
108 Sub-state Revolving Funds
109 *Total Annual Assistance
110 *Cumulative Assistance
Type of CWSRF Assistance Provided
(Number of Assistance Agreements)
111 Assistance (includes linked-deposit and pass-through loans)
112 Refinance Short-term Debt
113 Refinance Long-term Debt
114 Guarantee/Purchase Insurance
115 Sub-state Revolving Funds
116 *Total Annual Number of Agreements
117 *Cumulative Number of Agreements
* Calculated values.
Clean Water SRF Program Informationfor the State of Delaware
For the Reporting Year Ending June 30 of:
2004 2005 2006 2007 2008 2009 2010 2011
16,999,503 25,501,544 15,545,660 1,997,169 5,899,852 15,042,456 49,630,158 13,333,335
131,822,011 157,323,555 172,869,215 174,866,384 180,766,236 195,808,692 245,438,850 258,772,185
53 88 87 66 55 36 38 22
886 974 1,061 1,127 1,182 1,218 1,256 1,278
16,999,503 25,501,544 15,545,660 1,997,169 5,899,852 15,042,456 49,630,158 13,333,335
0 0 0 0 0 0 0 0
0 0 0 0 0 0 0 0
0 0 0 0 0 0 0 0
0 0 0 0 0 0 0 0
16,999,503 25,501,544 15,545,660 1,997,169 5,899,852 15,042,456 49,630,158 13,333,335
131,822,011 157,323,555 172,869,215 174,866,384 180,766,236 195,808,692 245,438,850 258,772,185
53 88 87 66 55 36 38 22
0 0 0 0 0 0 0 0
0 0 0 0 0 0 0 0
0 0 0 0 0 0 0 0
0 0 0 0 0 0 0 0
53 88 87 66 55 36 38 22
886 974 1,061 1,127 1,182 1,218 1,256 1,278
Page 16 of 67 10/31/2019

CWSRF Assistance
Binding Commitments
100 Annual Dollar Amount
101 *Cumulative Dollar Amount
102 Annual Number
103 *Cumulative Number
Type of CWSRF Assistance Provided (Dollars)
104 Assistance (includes pass-through and linked-deposit loans)
105 Refinance Short-term Debt
106 Refinance Long-term Debt
107 Guarantee/Purchase Insurance
108 Sub-state Revolving Funds
109 *Total Annual Assistance
110 *Cumulative Assistance
Type of CWSRF Assistance Provided
(Number of Assistance Agreements)
111 Assistance (includes linked-deposit and pass-through loans)
112 Refinance Short-term Debt
113 Refinance Long-term Debt
114 Guarantee/Purchase Insurance
115 Sub-state Revolving Funds
116 *Total Annual Number of Agreements
117 *Cumulative Number of Agreements
* Calculated values.
Clean Water SRF Program Informationfor the State of Delaware
For the Reporting Year Ending June 30 of:
2012 2013 2014 2015 2016 2017 2018 2019
3,114,280 45,132,714 1,405,492 7,883,389 25,794,600 15,545,148 65,138,116 66,939,244
261,886,465 307,019,179 308,424,671 316,308,060 342,102,660 357,647,808 422,785,924 489,725,168
25 18 28 26 23 26 22 39
1,303 1,321 1,349 1,375 1,398 1,424 1,446 1,485
3,114,280 45,132,714 1,405,492 7,883,389 25,794,600 8,328,578 65,138,116 66,939,244
0 0 0 0 0 0 0 0
0 0 0 0 0 7,216,570 0 0
0 0 0 0 0 0 0 0
0 0 0 0 0 0 0 0
3,114,280 45,132,714 1,405,492 7,883,389 25,794,600 15,545,148 65,138,116 66,939,244
261,886,465 307,019,179 308,424,671 316,308,060 342,102,660 357,647,808 422,785,924 489,725,168
25 18 28 26 23 23 22 39
0 0 0 0 0 0 0 0
0 0 0 0 0 3 0 0
0 0 0 0 0 0 0 0
0 0 0 0 0 0 0 0
25 18 28 26 23 26 22 39
1,303 1,321 1,349 1,375 1,398 1,424 1,446 1,485
Page 17 of 67 10/31/2019

Clean Water SRF Program Informationfor the State of Delaware
CWSRF Assistance For the Reporting Year Ending June 30 of:
1988 1989 1990 1991 1992 1993 1994 1995
Assistance by Population Size (Dollars)
118 Less than 3,500 0 0 0 0 0 0 399,069 493,150
119 3,500 to 9,999 0 0 0 0 0 0 16,645,110 0
120 10,000 to 99,999 0 0 0 0 0 0 0 0
121 100,000 and Above 0 0 0 0 0 0 19,582,481 0
122 *Total Annual Assistance 0 0 0 0 0 0 36,626,660 493,150
123 *Cumulative Assistance 0 0 0 0 0 0 36,626,660 37,119,810
Assistance by Population Size
(Number of Assistance Agreements)
124 Less than 3,500 0 0 0 0 0 0 49 65
125 3,500 to 9,999 0 0 0 0 0 0 2 0
126 10,000 to 99,999 0 0 0 0 0 0 0 0
127 100,000 and Above 0 0 0 0 0 0 1 0
128 *Total Annual Number of Agreements 0 0 0 0 0 0 52 65
129 *Cumulative Number of Agreements 0 0 0 0 0 0 52 117
Assistance to Hardship Communities
(Excludes EPA's Rural Community Hardship Grants)
130 Annual Dollar Amount 0 0 0 0 0 0 0 0
131 *Cumulative Dollar Amount 0 0 0 0 0 0 0 0
132 Annual Number of Assistance Agreements 0 0 0 0 0 0 0 0
133 *Cumulative Number of Agreements 0 0 0 0 0 0 0 0
Assistance to Indian Tribes
134 Annual Dollar Amount 0 0 0 0 0 0 0 0
135 Annual Number of Assistance Agreements 0 0 0 0 0 0 0 0
* Calculated values.
Page 18 of 67 10/31/2019

CWSRF Assistance
Assistance by Population Size (Dollars)
118 Less than 3,500
119 3,500 to 9,999
120 10,000 to 99,999
121 100,000 and Above
122 *Total Annual Assistance
123 *Cumulative Assistance
Assistance by Population Size
(Number of Assistance Agreements)
124 Less than 3,500
125 3,500 to 9,999
126 10,000 to 99,999
127 100,000 and Above
128 *Total Annual Number of Agreements
129 *Cumulative Number of Agreements
Assistance to Hardship Communities
(Excludes EPA's Rural Community Hardship Grants)
130 Annual Dollar Amount
131 *Cumulative Dollar Amount
132 Annual Number of Assistance Agreements
133 *Cumulative Number of Agreements
Assistance to Indian Tribes
134 Annual Dollar Amount
135 Annual Number of Assistance Agreements
* Calculated values.
Clean Water SRF Program Informationfor the State of Delaware
For the Reporting Year Ending June 30 of:
1996 1997 1998 1999 2000 2001 2002 2003
564,010 605,639 347,360 778,101 1,280,714 1,291,192 938,925 3,865,518
0 8,126,730 11,749,489 0 15,423,260 7,403,500 13,579,750 5,812,081
4,024,200 0 0 0 734,343 0 0 1,177,886
0 0 0 0 0 0 0 0
4,588,210 8,732,369 12,096,849 778,101 17,438,317 8,694,692 14,518,675 10,855,485
41,708,020 50,440,389 62,537,238 63,315,339 80,753,656 89,448,348 103,967,023 114,822,508
67 88 44 107 93 116 104 79
0 2 1 0 3 3 1 2
1 0 0 0 1 2 1 1
0 0 0 0 0 0 0 0
68 90 45 107 97 121 106 82
185 275 320 427 524 645 751 833
0 0 0 0 13,752,100 7,561,350 0 7,139,000
0 0 0 0 13,752,100 21,313,450 21,313,450 28,452,450
0 0 0 0 0 0 0 3
0 0 0 0 0 0 0 3
0 0 0 0 0 0 0 0
0 0 0 0 0 0 0 0
Page 19 of 67 10/31/2019

CWSRF Assistance
Assistance by Population Size (Dollars)
118 Less than 3,500
119 3,500 to 9,999
120 10,000 to 99,999
121 100,000 and Above
122 *Total Annual Assistance
123 *Cumulative Assistance
Assistance by Population Size
(Number of Assistance Agreements)
124 Less than 3,500
125 3,500 to 9,999
126 10,000 to 99,999
127 100,000 and Above
128 *Total Annual Number of Agreements
129 *Cumulative Number of Agreements
Assistance to Hardship Communities
(Excludes EPA's Rural Community Hardship Grants)
130 Annual Dollar Amount
131 *Cumulative Dollar Amount
132 Annual Number of Assistance Agreements
133 *Cumulative Number of Agreements
Assistance to Indian Tribes
134 Annual Dollar Amount
135 Annual Number of Assistance Agreements
* Calculated values.
Clean Water SRF Program Informationfor the State of Delaware
For the Reporting Year Ending June 30 of:
2004 2005 2006 2007 2008 2009 2010 2011
7,208,262 10,382,223 834,321 1,997,169 4,313,671 15,042,456 12,026,040 2,695,847
9,791,241 15,119,321 2,178,551 0 1,586,181 0 11,142,307 2,762,628
0 0 12,532,788 0 0 0 23,720,264 7,874,860
0 0 0 0 0 0 2,741,547 0
16,999,503 25,501,544 15,545,660 1,997,169 5,899,852 15,042,456 49,630,158 13,333,335
131,822,011 157,323,555 172,869,215 174,866,384 180,766,236 195,808,692 245,438,850 258,772,185
52 86 84 66 54 36 27 18
1 2 1 0 1 0 6 1
0 0 2 0 0 0 4 3
0 0 0 0 0 0 1 0
53 88 87 66 55 36 38 22
886 974 1,061 1,127 1,182 1,218 1,256 1,278
12,902,970 3,096,462 12,800,000 0 0 0 0 0
41,355,420 44,451,882 57,251,882 57,251,882 57,251,882 57,251,882 57,251,882 57,251,882
23 19 2 0 0 0 0 0
26 45 47 47 47 47 47 47
0 0 0 0 0 0 0 0
0 0 0 0 0 0 0 0
Page 20 of 67 10/31/2019

CWSRF Assistance
Assistance by Population Size (Dollars)
118 Less than 3,500
119 3,500 to 9,999
120 10,000 to 99,999
121 100,000 and Above
122 *Total Annual Assistance
123 *Cumulative Assistance
Assistance by Population Size
(Number of Assistance Agreements)
124 Less than 3,500
125 3,500 to 9,999
126 10,000 to 99,999
127 100,000 and Above
128 *Total Annual Number of Agreements
129 *Cumulative Number of Agreements
Assistance to Hardship Communities
(Excludes EPA's Rural Community Hardship Grants)
130 Annual Dollar Amount
131 *Cumulative Dollar Amount
132 Annual Number of Assistance Agreements
133 *Cumulative Number of Agreements
Assistance to Indian Tribes
134 Annual Dollar Amount
135 Annual Number of Assistance Agreements
* Calculated values.
Clean Water SRF Program Informationfor the State of Delaware
For the Reporting Year Ending June 30 of:
2012 2013 2014 2015 2016 2017 2018 2019
1,130,795 1,826,252 1,405,492 7,115,192 13,527,188 3,539,152 51,698,839 7,007,219
-306,272 6,204,513 0 0 5,550,288 7,968,047 230,156 18,760,099
2,289,757 35,307,215 0 0 6,717,124 0 3,417,880 24,876,997
0 1,794,734 0 768,197 0 4,037,949 9,791,241 16,294,929
3,114,280 45,132,714 1,405,492 7,883,389 25,794,600 15,545,148 65,138,116 66,939,244
261,886,465 307,019,179 308,424,671 316,308,060 342,102,660 357,647,808 422,785,924 489,725,168
21 14 28 25 18 19 20 32
0 1 0 0 4 5 0 2
2 1 0 0 1 0 1 3
2 2 0 1 0 2 1 2
25 18 28 26 23 26 22 39
1,303 1,321 1,349 1,375 1,398 1,424 1,446 1,485
0 0 0 0 4,449,848 2,048,682 460,988 1,117,154
57,251,882 57,251,882 57,251,882 57,251,882 61,701,730 63,750,412 64,211,400 65,328,554
0 0 0 0 3 1 1 1
47 47 47 47 50 51 52 53
0 0 0 0 0 0 0 0
0 0 0 0 0 0 0 0
Page 21 of 67 10/31/2019

Clean Water SRF Program Informationfor the State of Delaware
CWSRF Assistance For the Reporting Year Ending June 30 of:
1988 1989 1990 1991 1992 1993 1994 1995
Total Assistance Provided (all categories)
136 *Annual Dollar Amount 0 0 0 0 0 0 36,626,660 493,150
137 *Cumulative Dollar Amount 0 0 0 0 0 0 36,626,660 37,119,810
Centralized Wastewater Treatment
(Dollars in each category)
138 Secondary Treatment 0 0 0 0 0 0 0 0
139 Advanced Treatment 0 0 0 0 0 0 19,582,480 0
140 Infiltration/Inflow 0 0 0 0 0 0 0 0
141 Sewer System Rehabilitation 0 0 0 0 0 0 0 0
142 New Collector Sewers 0 0 0 0 0 0 16,645,110 0
143 New Interceptors 0 0 0 0 0 0 0 0
144 CSO Correction 0 0 0 0 0 0 0 0
144.1 *Total Annual Dollar Amount 0 0 0 0 0 0 36,227,590 0
144.2 *Cumulative Dollar Amount 0 0 0 0 0 0 36,227,590 36,227,590
Stormwater
(Dollars in each category)
145.1 Grey Infrastructure 0 0 0 0 0 0 0 0
145.2 Green Infrastructure 0 0 0 0 0 0 0 0
145.3 *Total Annual Dollar Amount 0 0 0 0 0 0 0 0
145.4 *Cumulative Dollar Amount 0 0 0 0 0 0 0 0
Energy Conservation
(Dollars in each category)
146.1 Energy Efficiency 0 0 0 0 0 0 0 0
146.2 Renewable Energy 0 0 0 0 0 0 0 0
146.3 *Total Annual Dollar Amount 0 0 0 0 0 0 0 0
146.4 *Cumulative Dollar Amount 0 0 0 0 0 0 0 0
Water Conservation
(Dollars in each category)
147.1 Water Efficiency 0 0 0 0 0 0 0 0
147.2 Water Reuse 0 0 0 0 0 0 0 0
148 *Total Annual Dollar Amount 0 0 0 0 0 0 0 0
149 *Cumulative Dollar Amount 0 0 0 0 0 0 0 0
* Calculated values.
Page 22 of 67 10/31/2019

CWSRF Assistance
Total Assistance Provided (all categories)
136 *Annual Dollar Amount
137 *Cumulative Dollar Amount
Centralized Wastewater Treatment
(Dollars in each category)
138 Secondary Treatment
139 Advanced Treatment
140 Infiltration/Inflow
141 Sewer System Rehabilitation
142 New Collector Sewers
143 New Interceptors
144 CSO Correction
144.1 *Total Annual Dollar Amount
144.2 *Cumulative Dollar Amount
Stormwater
(Dollars in each category)
145.1 Grey Infrastructure
145.2 Green Infrastructure
145.3 *Total Annual Dollar Amount
145.4 *Cumulative Dollar Amount
Energy Conservation
(Dollars in each category)
146.1 Energy Efficiency
146.2 Renewable Energy
146.3 *Total Annual Dollar Amount
146.4 *Cumulative Dollar Amount
Water Conservation
(Dollars in each category)
147.1 Water Efficiency
147.2 Water Reuse
148 *Total Annual Dollar Amount
149 *Cumulative Dollar Amount
* Calculated values.
Clean Water SRF Program Informationfor the State of Delaware
For the Reporting Year Ending June 30 of:
1996 1997 1998 1999 2000 2001 2002 2003
4,588,210 8,732,369 12,096,849 778,101 17,438,317 8,694,692 14,518,675 10,855,485
41,708,020 50,440,389 62,537,238 63,315,339 80,753,656 89,448,348 103,967,023 114,822,508
0 0 0 0 0 0 0 0
0 8,126,730 0 0 486,279 1,731,043 12,728,613 3,035,285
0 0 0 0 0 0 0 0
0 0 0 0 0 384,208 0 0
0 0 11,749,489 0 14,199,443 5,288,249 851,137 6,989,967
4,024,200 0 0 0 1,814,663 0 0 0
0 0 0 0 0 0 0 0
4,024,200 8,126,730 11,749,489 0 16,500,385 7,403,500 13,579,750 10,025,252
40,251,790 48,378,520 60,128,009 60,128,009 76,628,394 84,031,894 97,611,644 107,636,896
0 0 0 0 0 0 0 0
0 0 0 0 0 0 0 0
0 0 0 0 0 0 0 0
0 0 0 0 0 0 0 0
0 0 0 0 0 0 0 0
0 0 0 0 0 0 0 0
0 0 0 0 0 0 0 0
0 0 0 0 0 0 0 0
0 0 0 0 0 0 0 0
0 0 0 0 0 0 0 0
0 0 0 0 0 0 0 0
0 0 0 0 0 0 0 0
Page 23 of 67 10/31/2019
CWSRF Assistance
Total Assistance Provided (all categories)
136 *Annual Dollar Amount
137 *Cumulative Dollar Amount
Centralized Wastewater Treatment
(Dollars in each category)
138 Secondary Treatment
139 Advanced Treatment
140 Infiltration/Inflow
141 Sewer System Rehabilitation
142 New Collector Sewers
143 New Interceptors
144 CSO Correction
144.1 *Total Annual Dollar Amount
144.2 *Cumulative Dollar Amount
Stormwater
(Dollars in each category)
145.1 Grey Infrastructure
145.2 Green Infrastructure
145.3 *Total Annual Dollar Amount
145.4 *Cumulative Dollar Amount
Energy Conservation
(Dollars in each category)
146.1 Energy Efficiency
146.2 Renewable Energy
146.3 *Total Annual Dollar Amount
146.4 *Cumulative Dollar Amount
Water Conservation
(Dollars in each category)
147.1 Water Efficiency
147.2 Water Reuse
148 *Total Annual Dollar Amount
149 *Cumulative Dollar Amount
* Calculated values.
Clean Water SRF Program Informationfor the State of Delaware
For the Reporting Year Ending June 30 of:
2004 2005 2006 2007 2008 2009 2010 2011
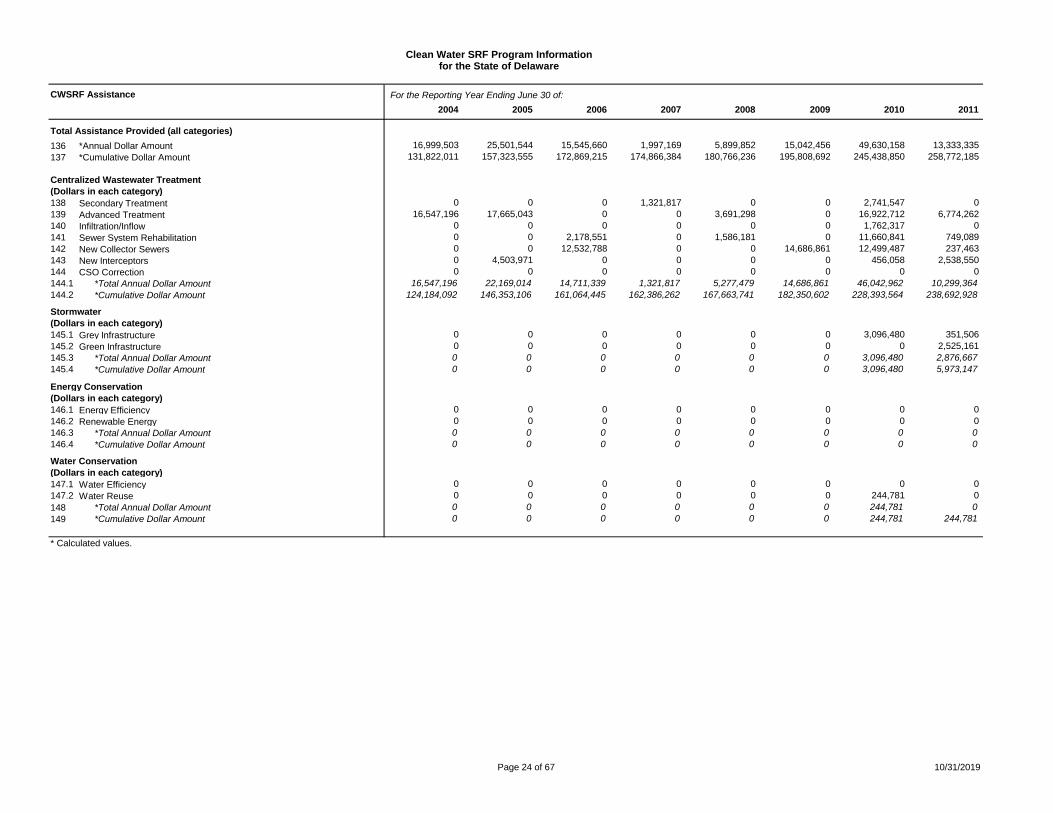
16,999,503 25,501,544 15,545,660 1,997,169 5,899,852 15,042,456 49,630,158 13,333,335
131,822,011 157,323,555 172,869,215 174,866,384 180,766,236 195,808,692 245,438,850 258,772,185
0 0 0 1,321,817 0 0 2,741,547 0
16,547,196 17,665,043 0 0 3,691,298 0 16,922,712 6,774,262
0 0 0 0 0 0 1,762,317 0
0 0 2,178,551 0 1,586,181 0 11,660,841 749,089
0 0 12,532,788 0 0 14,686,861 12,499,487 237,463
0 4,503,971 0 0 0 0 456,058 2,538,550
0 0 0 0 0 0 0 0
16,547,196 22,169,014 14,711,339 1,321,817 5,277,479 14,686,861 46,042,962 10,299,364
124,184,092 146,353,106 161,064,445 162,386,262 167,663,741 182,350,602 228,393,564 238,692,928
0 0 0 0 0 0 3,096,480 351,506
0 0 0 0 0 0 0 2,525,161
0 0 0 0 0 0 3,096,480 2,876,667
0 0 0 0 0 0 3,096,480 5,973,147
0 0 0 0 0 0 0 0
0 0 0 0 0 0 0 0
0 0 0 0 0 0 0 0
0 0 0 0 0 0 0 0
0 0 0 0 0 0 0 0
0 0 0 0 0 0 244,781 0
0 0 0 0 0 0 244,781 0
0 0 0 0 0 0 244,781 244,781
Page 24 of 67 10/31/2019

CWSRF Assistance
Total Assistance Provided (all categories)
136 *Annual Dollar Amount
137 *Cumulative Dollar Amount
Centralized Wastewater Treatment
(Dollars in each category)
138 Secondary Treatment
139 Advanced Treatment
140 Infiltration/Inflow
141 Sewer System Rehabilitation
142 New Collector Sewers
143 New Interceptors
144 CSO Correction
144.1 *Total Annual Dollar Amount
144.2 *Cumulative Dollar Amount
Stormwater
(Dollars in each category)
145.1 Grey Infrastructure
145.2 Green Infrastructure
145.3 *Total Annual Dollar Amount
145.4 *Cumulative Dollar Amount
Energy Conservation
(Dollars in each category)
146.1 Energy Efficiency
146.2 Renewable Energy
146.3 *Total Annual Dollar Amount
146.4 *Cumulative Dollar Amount
Water Conservation
(Dollars in each category)
147.1 Water Efficiency
147.2 Water Reuse
148 *Total Annual Dollar Amount
149 *Cumulative Dollar Amount
* Calculated values.
Clean Water SRF Program Informationfor the State of Delaware
For the Reporting Year Ending June 30 of:
2012 2013 2014 2015 2016 2017 2018 2019
3,114,280 45,132,714 1,405,492 7,883,389 25,794,600 15,545,148 65,138,116 66,939,244
261,886,465 307,019,179 308,424,671 316,308,060 342,102,660 357,647,808 422,785,924 489,725,168
0 0 0 0 6,180,369 1,903,886 0 0
0 6,204,511 0 0 8,218,767 5,312,685 51,385,503 0
0 0 0 0 0 0 0 0
-709,512 440,606 0 768,197 8,149,509 751,478 9,791,241 21,339,850
0 1,234,983 709,864 6,557,952 1,332,460 3,205,091 0 19,323,753
0 0 0 0 578,398 0 0 0
2,643,634 0 0 0 1,070,731 0 230,156 -207,054
1,934,122 7,880,100 709,864 7,326,149 25,530,234 11,173,140 61,406,900 40,456,549
240,627,050 248,507,150 249,217,014 256,543,163 282,073,397 293,246,537 354,653,437 395,109,986
440,606 0 0 0 0 0 0 2,374,376
0 619,786 332,902 0 0 0 0 23,604,131
440,606 619,786 332,902 0 0 0 0 25,978,507
6,413,753 7,033,539 7,366,441 7,366,441 7,366,441 7,366,441 7,366,441 33,344,948
0 0 0 0 0 0 0 0
0 35,307,215 0 0 0 0 0 0
0 35,307,215 0 0 0 0 0 0
0 35,307,215 35,307,215 35,307,215 35,307,215 35,307,215 35,307,215 35,307,215
0 0 0 0 0 0 0 0
0 0 0 0 0 806,839 0 0
0 0 0 0 0 806,839 0 0
244,781 244,781 244,781 244,781 244,781 1,051,620 1,051,620 1,051,620
Page 25 of 67 10/31/2019

Clean Water SRF Program Informationfor the State of Delaware
CWSRF Assistance For the Reporting Year Ending June 30 of:
1988 1989 1990 1991 1992 1993 1994 1995
Nonpoint Source
(Dollars in each category)
151 Agricultural Best Management Practices - Cropland 0 0 0 0 0 0 0 0
152 Agricultural Best Management Practices - Animals 0 0 0 0 0 0 275,572 293,276
153 Silviculture 0 0 0 0 0 0 0 0
154 Urban (Category VII-D, excludes decentralized systems)
0 0 0 0 0 0 0 0
155 Ground Water (Unknown Source) 0 0 0 0 0 0 0 0
156 Marinas 0 0 0 0 0 0 0 0
157 Resource Extraction 0 0 0 0 0 0 0 0
158 Brownfields 0 0 0 0 0 0 0 0
159 Storage Tanks 0 0 0 0 0 0 0 0
160 Sanitary Landfills 0 0 0 0 0 0 0 0
161 Hydromodification/Habitat Restoration 0 0 0 0 0 0 0 0
162 Individual/Decentralized Sewage Treatment 0 0 0 0 0 0 123,498 199,874
163.1 Land Conservation 0 0 0 0 0 0 0 0
164 *Total Annual Dollar Amount 0 0 0 0 0 0 399,070 493,150
165 *Cumulative Dollar Amount 0 0 0 0 0 0 399,070 892,220
Other
(Dollars in each category)
166 Estuary (§320) Assistance 0 0 0 0 0 0 0 0
166.1 Planning and Assessments 0 0 0 0 0 0 0 0
166.2 Desalination 0 0 0 0 0 0 0 0
166.3 *Total Annual Dollar Amount 0 0 0 0 0 0 0 0
167 *Cumulative Dollar Amount 0 0 0 0 0 0 0 0
Amount of CWSRF assistance that impacts estuaries
168 Annual Dollar Amount 0 0 0 0 0 0 37,000,000 0
171 *Cumulative Dollar Amount 0 0 0 0 0 0 37,416,780 37,911,242
* Calculated values.
Page 26 of 67 10/31/2019

CWSRF Assistance
Nonpoint Source
(Dollars in each category)
151 Agricultural Best Management Practices - Cropland
152 Agricultural Best Management Practices - Animals
153 Silviculture
154 Urban (Category VII-D, excludes decentralized systems)155 Ground Water (Unknown Source)
156 Marinas
157 Resource Extraction
158 Brownfields
159 Storage Tanks
160 Sanitary Landfills
161 Hydromodification/Habitat Restoration
162 Individual/Decentralized Sewage Treatment
163.1 Land Conservation
164 *Total Annual Dollar Amount
165 *Cumulative Dollar Amount
Other
(Dollars in each category)
166 Estuary (§320) Assistance166.1 Planning and Assessments166.2 Desalination166.3 *Total Annual Dollar Amount
167 *Cumulative Dollar Amount
Amount of CWSRF assistance that impacts estuaries
168 Annual Dollar Amount
171 *Cumulative Dollar Amount
* Calculated values.
Clean Water SRF Program Informationfor the State of Delaware
For the Reporting Year Ending June 30 of:
1996 1997 1998 1999 2000 2001 2002 2003
0 0 0 0 0 0 0 0
377,538 447,899 313,851 609,528 514,075 691,561 537,167 361,707
0 0 0 0 0 0 0 00 0 0 0 0 0 0 0
0 0 0 0 0 0 0 0
0 0 0 0 0 0 0 0
0 0 0 0 0 0 0 0
0 0 0 0 0 0 0 0
0 0 0 0 0 244,781 0 97,912
0 0 0 4,896 0 0 0 0
0 0 0 0 0 0 0 0
186,472 157,740 33,509 163,677 423,857 354,850 401,758 370,614
0 0 0 0 0 0 0 0
564,010 605,639 347,360 778,101 937,932 1,291,192 938,925 830,233
1,456,230 2,061,869 2,409,229 3,187,330 4,125,262 5,416,454 6,355,379 7,185,612
0 0 0 0 0 0 0 00 0 0 0 0 0 0 00 0 0 0 0 0 0 0
0 0 0 0 0 0 0 0
0 0 0 0 0 0 0 0
4,110,000 0 12,000,000 0 14,852,100 6,268,100 13,869,284 10,239,000
42,597,166 43,215,384 55,560,203 56,354,894 72,164,925 79,753,776 94,581,829 105,663,953
Page 27 of 67 10/31/2019

CWSRF Assistance
Nonpoint Source
(Dollars in each category)
151 Agricultural Best Management Practices - Cropland
152 Agricultural Best Management Practices - Animals
153 Silviculture
154 Urban (Category VII-D, excludes decentralized systems)155 Ground Water (Unknown Source)
156 Marinas
157 Resource Extraction
158 Brownfields
159 Storage Tanks
160 Sanitary Landfills
161 Hydromodification/Habitat Restoration
162 Individual/Decentralized Sewage Treatment
163.1 Land Conservation
164 *Total Annual Dollar Amount
165 *Cumulative Dollar Amount
Other
(Dollars in each category)
166 Estuary (§320) Assistance166.1 Planning and Assessments166.2 Desalination166.3 *Total Annual Dollar Amount
167 *Cumulative Dollar Amount
Amount of CWSRF assistance that impacts estuaries
168 Annual Dollar Amount
171 *Cumulative Dollar Amount
* Calculated values.
Clean Water SRF Program Informationfor the State of Delaware
For the Reporting Year Ending June 30 of:
2004 2005 2006 2007 2008 2009 2010 2011
0 0 0 0 0 0 0 0
243,717 567,779 612,302 524,989 473,204 230,928 69,194 59,719
0 0 0 0 0 0 0 00 0 0 0 0 0 0 0
0 0 0 0 0 0 0 0
0 0 0 0 0 0 0 0
0 0 0 0 0 0 0 0
0 0 0 0 0 0 0 0
0 116,434 0 0 58,747 0 0 0
0 0 0 0 0 0 0 0
0 0 0 0 0 0 0 0
208,590 2,648,317 222,019 150,363 90,422 124,667 176,741 97,585
0 0 0 0 0 0 0 0
452,307 3,332,530 834,321 675,352 622,373 355,595 245,935 157,304
7,637,919 10,970,449 11,804,770 12,480,122 13,102,495 13,458,090 13,704,025 13,861,329
0 0 0 0 0 0 0 00 0 0 0 0 0 0 00 0 0 0 0 0 0 0
0 0 0 0 0 0 0 0
0 0 0 0 0 0 0 0
10,000,000 19,800,000 15,025,000 600,000 3,770,000 15,000,000 50,437,147 10,635,435
116,107,681 139,311,264 155,188,364 156,478,115 160,883,758 176,246,935 226,935,261 238,183,565
Page 28 of 67 10/31/2019

CWSRF Assistance
Nonpoint Source
(Dollars in each category)
151 Agricultural Best Management Practices - Cropland
152 Agricultural Best Management Practices - Animals
153 Silviculture
154 Urban (Category VII-D, excludes decentralized systems)155 Ground Water (Unknown Source)
156 Marinas
157 Resource Extraction
158 Brownfields
159 Storage Tanks
160 Sanitary Landfills
161 Hydromodification/Habitat Restoration
162 Individual/Decentralized Sewage Treatment
163.1 Land Conservation
164 *Total Annual Dollar Amount
165 *Cumulative Dollar Amount
Other
(Dollars in each category)
166 Estuary (§320) Assistance166.1 Planning and Assessments166.2 Desalination166.3 *Total Annual Dollar Amount
167 *Cumulative Dollar Amount
Amount of CWSRF assistance that impacts estuaries
168 Annual Dollar Amount
171 *Cumulative Dollar Amount
* Calculated values.
Clean Water SRF Program Information
for the State of Delaware
For the Reporting Year Ending June 30 of:
2012 2013 2014 2015 2016 2017 2018 2019
0 0 0 0 0 0 0 0
93,457 48,683 70,739 0 0 0 12,337 21,950
0 0 0 0 0 0 0 00 0 0 0 0 0 0 0
0 0 0 0 0 0 0 0
0 0 0 0 0 0 0 0
0 0 0 0 0 0 0 0
0 0 0 0 0 3,231,109 0 0
0 0 0 0 0 0 0 0
0 0 0 0 0 0 0 0
0 0 0 0 0 0 0 0
646,095 101,981 291,987 557,240 264,366 334,060 300,999 482,238
0 1,174,949 0 0 0 0 3,417,880 0
739,552 1,325,613 362,726 557,240 264,366 3,565,169 3,731,216 504,188
14,600,881 15,926,494 16,289,220 16,846,460 17,110,826 20,675,995 24,407,211 24,911,399
0 0 0 0 0 0 0 00 0 0 0 0 0 0 00 0 0 0 0 0 0 0
0 0 0 0 0 0 0 0
0 0 0 0 0 0 0 0
3,429,012 46,102,907 1,065,000 7,766,895 23,689,125 13,936,819 66,291,865 51,229,435
241,870,139 287,973,046 289,038,046 296,804,941 320,494,066 334,430,885 400,722,750 451,952,185
Page 29 of 67 10/31/2019

Clean Water SRF Program Information
for the State of Delaware
CWSRF Assistance For the Reporting Year Ending June 30 of:
1988 1989 1990 1991 1992 1993 1994 1995
Centralized Wastewater Treatment
(Number in each category)**
172 Secondary Treatment 0 0 0 0 0 0 0 0
173 Advanced Treatment 0 0 0 0 0 0 1 0
174 Infiltration/Inflow 0 0 0 0 0 0 0 0
175 Sewer System Rehabilitation 0 0 0 0 0 0 0 0
176 New Collector Sewers 0 0 0 0 0 0 2 0
177 New Interceptors 0 0 0 0 0 0 0 0
178 CSO Correction 0 0 0 0 0 0 0 0
178.1 *Total Annual Number 0 0 0 0 0 0 3 0
178.2 *Cumulative Number 0 0 0 0 0 0 3 3
Stormwater
(Number in each category)**
179.1 Grey Infrastructure 0 0 0 0 0 0 0 0
179.2 Green Infrastructure 0 0 0 0 0 0 0 0
179.3 *Total Annual Number 0 0 0 0 0 0 0 0
179.4 *Cumulative Number 0 0 0 0 0 0 0 0
Energy Conservation
(Number in each category)**
180.1 Energy Efficiency 0 0 0 0 0 0 0 0
180.2 Renewable Energy 0 0 0 0 0 0 0 0
180.3 *Total Annual Number 0 0 0 0 0 0 0 0
180.4 *Cumulative Number 0 0 0 0 0 0 0 0
Water Conservation
(Number in each category)**
181.1 Water Efficiency 0 0 0 0 0 0 0 0
181.2 Water Reuse 0 0 0 0 0 0 0 0
181 *Total Annual Number 0 0 0 0 0 0 0 0
182 *Cumulative Number 0 0 0 0 0 0 0 0
* Calculated values.
** Assistance Agreements may be counted in more than
one category when they fund more than one category.
Page 30 of 67 10/31/2019

CWSRF Assistance
Centralized Wastewater Treatment
(Number in each category)**
172 Secondary Treatment
173 Advanced Treatment
174 Infiltration/Inflow
175 Sewer System Rehabilitation
176 New Collector Sewers
177 New Interceptors
178 CSO Correction
178.1 *Total Annual Number
178.2 *Cumulative Number
Stormwater
(Number in each category)**
179.1 Grey Infrastructure
179.2 Green Infrastructure
179.3 *Total Annual Number
179.4 *Cumulative Number
Energy Conservation
(Number in each category)**
180.1 Energy Efficiency
180.2 Renewable Energy
180.3 *Total Annual Number
180.4 *Cumulative Number
Water Conservation
(Number in each category)**
181.1 Water Efficiency
181.2 Water Reuse
181 *Total Annual Number
182 *Cumulative Number
* Calculated values.
** Assistance Agreements may be counted in more than
one category when they fund more than one category.
Clean Water SRF Program Information
for the State of Delaware
For the Reporting Year Ending June 30 of:
1996 1997 1998 1999 2000 2001 2002 2003
0 0 0 0 0 0 0 0
0 2 0 0 1 2 1 1
0 0 0 0 0 0 0 0
0 0 0 0 0 1 0 0
0 0 1 0 0 4 1 3
1 0 0 0 2 0 0 0
0 0 0 0 2 0 0 0
1 2 1 0 5 7 2 4
4 6 7 7 12 19 21 25
0 0 0 0 0 0 0 0
0 0 0 0 0 0 0 0
0 0 0 0 0 0 0 0
0 0 0 0 0 0 0 0
0 0 0 0 0 0 0 0
0 0 0 0 0 0 0 0
0 0 0 0 0 0 0 0
0 0 0 0 0 0 0 0
0 0 0 0 0 0 0 0
0 0 0 0 0 0 0 0
0 0 0 0 0 0 0 0
0 0 0 0 0 0 0 0
Page 31 of 67 10/31/2019

CWSRF Assistance
Centralized Wastewater Treatment
(Number in each category)**
172 Secondary Treatment
173 Advanced Treatment
174 Infiltration/Inflow
175 Sewer System Rehabilitation
176 New Collector Sewers
177 New Interceptors
178 CSO Correction
178.1 *Total Annual Number
178.2 *Cumulative Number
Stormwater
(Number in each category)**
179.1 Grey Infrastructure
179.2 Green Infrastructure
179.3 *Total Annual Number
179.4 *Cumulative Number
Energy Conservation
(Number in each category)**
180.1 Energy Efficiency
180.2 Renewable Energy
180.3 *Total Annual Number
180.4 *Cumulative Number
Water Conservation
(Number in each category)**
181.1 Water Efficiency
181.2 Water Reuse
181 *Total Annual Number
182 *Cumulative Number
* Calculated values.
** Assistance Agreements may be counted in more than
one category when they fund more than one category.
Clean Water SRF Program Information
for the State of Delaware
For the Reporting Year Ending June 30 of:
2004 2005 2006 2007 2008 2009 2010 2011
0 0 0 2 0 0 1 0
3 3 0 0 1 0 3 1
0 0 0 0 0 0 0 0
0 0 1 0 1 0 2 1
0 0 2 0 0 1 5 0
0 1 0 0 0 0 0 1
0 0 0 0 0 0 0 0
3 4 3 2 2 1 11 3
28 32 35 37 39 40 51 54
0 0 0 0 0 0 4 2
0 0 0 0 0 0 0 1
0 0 0 0 0 0 4 3
0 0 0 0 0 0 4 7
0 0 0 0 0 0 0 0
0 0 0 0 0 0 0 0
0 0 0 0 0 0 0 0
0 0 0 0 0 0 0 0
0 0 0 0 0 0 0 0
0 0 0 0 0 0 1 0
0 0 0 0 0 0 1 0
0 0 0 0 0 0 1 1
Page 32 of 67 10/31/2019

CWSRF Assistance
Centralized Wastewater Treatment
(Number in each category)**
172 Secondary Treatment
173 Advanced Treatment
174 Infiltration/Inflow
175 Sewer System Rehabilitation
176 New Collector Sewers
177 New Interceptors
178 CSO Correction
178.1 *Total Annual Number
178.2 *Cumulative Number
Stormwater
(Number in each category)**
179.1 Grey Infrastructure
179.2 Green Infrastructure
179.3 *Total Annual Number
179.4 *Cumulative Number
Energy Conservation
(Number in each category)**
180.1 Energy Efficiency
180.2 Renewable Energy
180.3 *Total Annual Number
180.4 *Cumulative Number
Water Conservation
(Number in each category)**
181.1 Water Efficiency
181.2 Water Reuse
181 *Total Annual Number
182 *Cumulative Number
* Calculated values.
** Assistance Agreements may be counted in more than
one category when they fund more than one category.
Clean Water SRF Program Information
for the State of Delaware
For the Reporting Year Ending June 30 of:
2012 2013 2014 2015 2016 2017 2018 2019
0 0 0 0 3 2 0 0
0 1 0 0 1 1 2 0
0 0 0 0 0 0 0 0
0 1 1 1 2 2 1 8
0 1 0 1 1 1 0 2
0 0 0 0 1 0 0 0
2 0 0 0 1 0 0 0
2 3 1 2 9 6 3 10
56 59 60 62 71 77 80 90
1 0 0 0 0 0 0 3
0 1 1 0 0 1 0 2
1 1 1 0 0 1 0 5
8 9 10 10 10 11 11 16
0 0 0 0 0 0 0 0
0 1 0 0 0 0 0 0
0 1 0 0 0 0 0 0
0 1 1 1 1 1 1 1
0 0 0 0 0 0 0 0
0 0 0 0 0 0 0 0
0 0 0 0 0 0 0 0
1 1 1 1 1 1 1 1
Page 33 of 67 10/31/2019

Clean Water SRF Program Information
for the State of Delaware
CWSRF Assistance For the Reporting Year Ending June 30 of:
1988 1989 1990 1991 1992 1993 1994 1995
Nonpoint Source
(Number in each category)**
183 Agricultural Best Management Practices - Cropland 0 0 0 0 0 0 0 0
184 Agricultural Best Management Practices - Animals 0 0 0 0 0 0 29 34
185 Silviculture 0 0 0 0 0 0 0 0
187 Ground Water (Unknown Source) 0 0 0 0 0 0 0 0
188 Marinas 0 0 0 0 0 0 0 0
189 Resource Extraction 0 0 0 0 0 0 0 0
190 Brownfields 0 0 0 0 0 0 0 0
191 Storage Tanks 0 0 0 0 0 0 0 0
192 Sanitary Landfills 0 0 0 0 0 0 0 0
193 Hydromodification/Habitat Restoration 0 0 0 0 0 0 0 0
194 Individual/Decentralized Sewage Treatment 0 0 0 0 0 0 20 31
195.1 Land Conservation 0 0 0 0 0 0 0 0
196 *Total Annual Number 0 0 0 0 0 0 49 65
197 *Cumulative Number 0 0 0 0 0 0 49 114
Other(Number in each category)**
198 Estuary (§320) Assistance 0 0 0 0 0 0 0 0
198.1 Planning and Assessments 0 0 0 0 0 0 0 0
198.2 Desalination 0 0 0 0 0 0 0 0
198.3 *Total Annual Number 0 0 0 0 0 0 0 0
199 *Cumulative Number 0 0 0 0 0 0 0 0
* Calculated values.
** Assistance Agreements may be counted in more than
one category when they fund more than one category.
Page 34 of 67 10/31/2019

CWSRF Assistance
Nonpoint Source
(Number in each category)**
183 Agricultural Best Management Practices - Cropland
184 Agricultural Best Management Practices - Animals
185 Silviculture
187 Ground Water (Unknown Source)
188 Marinas
189 Resource Extraction
190 Brownfields
191 Storage Tanks
192 Sanitary Landfills
193 Hydromodification/Habitat Restoration
194 Individual/Decentralized Sewage Treatment
195.1 Land Conservation
196 *Total Annual Number
197 *Cumulative Number
Other(Number in each category)**
198 Estuary (§320) Assistance
198.1 Planning and Assessments198.2 Desalination198.3 *Total Annual Number
199 *Cumulative Number
* Calculated values.
** Assistance Agreements may be counted in more than
one category when they fund more than one category.
Clean Water SRF Program Information
for the State of Delaware
For the Reporting Year Ending June 30 of:
1996 1997 1998 1999 2000 2001 2002 2003
0 0 0 0 0 0 0 0
36 64 40 85 52 88 64 39
0 0 0 0 0 0 0 0
0 0 0 0 0 0 0 0
0 0 0 0 0 0 0 0
0 0 0 0 0 0 0 0
0 0 0 0 0 0 0 0
0 0 0 1 0 1 0 1
0 0 0 0 0 0 0 0
0 0 0 0 0 0 0 0
31 24 4 21 40 25 40 38
0 0 0 0 0 0 0 0
67 88 44 107 92 114 104 78
181 269 313 420 512 626 730 808
0 0 0 0 0 0 0 0
0 0 0 0 0 0 0 00 0 0 0 0 0 0 0
0 0 0 0 0 0 0 0
0 0 0 0 0 0 0 0
Page 35 of 67 10/31/2019

CWSRF Assistance
Nonpoint Source
(Number in each category)**
183 Agricultural Best Management Practices - Cropland
184 Agricultural Best Management Practices - Animals
185 Silviculture
187 Ground Water (Unknown Source)
188 Marinas
189 Resource Extraction
190 Brownfields
191 Storage Tanks
192 Sanitary Landfills
193 Hydromodification/Habitat Restoration
194 Individual/Decentralized Sewage Treatment
195.1 Land Conservation
196 *Total Annual Number
197 *Cumulative Number
Other(Number in each category)**
198 Estuary (§320) Assistance
198.1 Planning and Assessments198.2 Desalination198.3 *Total Annual Number
199 *Cumulative Number
* Calculated values.
** Assistance Agreements may be counted in more than
one category when they fund more than one category.
Clean Water SRF Program Information
for the State of Delaware
For the Reporting Year Ending June 30 of:
2004 2005 2006 2007 2008 2009 2010 2011
0 0 0 0 0 0 0 0
30 63 66 52 46 22 6 7
0 0 0 0 0 0 0 0
0 0 0 0 0 0 0 0
0 0 0 0 0 0 0 0
0 0 0 0 0 0 0 0
0 0 0 0 0 0 0 0
0 1 0 0 1 0 0 0
0 0 0 0 0 0 0 0
0 0 0 0 0 0 0 0
20 20 18 12 6 13 16 9
0 0 0 0 0 0 0 0
50 84 84 64 53 35 22 16
858 942 1,026 1,090 1,143 1,178 1,200 1,216
0 0 0 0 0 0 0 0
0 0 0 0 0 0 0 00 0 0 0 0 0 0 0
0 0 0 0 0 0 0 0
0 0 0 0 0 0 0 0
Page 36 of 67 10/31/2019

CWSRF Assistance
Nonpoint Source
(Number in each category)**
183 Agricultural Best Management Practices - Cropland
184 Agricultural Best Management Practices - Animals
185 Silviculture
187 Ground Water (Unknown Source)
188 Marinas
189 Resource Extraction
190 Brownfields
191 Storage Tanks
192 Sanitary Landfills
193 Hydromodification/Habitat Restoration
194 Individual/Decentralized Sewage Treatment
195.1 Land Conservation
196 *Total Annual Number
197 *Cumulative Number
Other(Number in each category)**
198 Estuary (§320) Assistance
198.1 Planning and Assessments198.2 Desalination198.3 *Total Annual Number
199 *Cumulative Number
* Calculated values.
** Assistance Agreements may be counted in more than
one category when they fund more than one category.
Clean Water SRF Program Information
for the State of Delaware
For the Reporting Year Ending June 30 of:
2012 2013 2014 2015 2016 2017 2018 2019
0 0 0 0 0 0 0 0
11 4 3 0 0 0 1 2
0 0 0 0 0 0 0 0
0 0 0 0 0 0 0 0
0 0 0 0 0 0 0 0
0 0 0 0 0 0 0 0
0 0 0 0 0 1 0 0
0 0 0 0 0 0 0 0
0 0 0 0 0 0 0 0
0 0 0 0 0 0 0 0
11 8 23 24 14 18 17 26
0 1 0 0 0 0 1 0
22 13 26 24 14 19 19 28
1,238 1,251 1,277 1,301 1,315 1,334 1,353 1,381
0 0 0 0 0 0 0 0
0 0 0 0 0 0 0 00 0 0 0 0 0 0 0
0 0 0 0 0 0 0 0
0 0 0 0 0 0 0 0
Page 37 of 67 10/31/2019

Clean Water SRF Program Informationfor the State of Delaware
CWSRF Assistance For the Reporting Year Ending June 30 of:
1988 1989 1990 1991 1992 1993 1994 1995
Construction Starts (includes pass-through and linked deposit)
200 Annual Dollar Amount 0 0 0 0 0 0 36,626,660 493,150
201 *Cumulative Dollar Amount 0 0 0 0 0 0 36,626,660 37,119,810
202 Annual Number of Assistance Agreements 0 0 0 0 0 0 52 65
203 *Cumulative Number of Agreements 0 0 0 0 0 0 52 117
Initiation of Operations (includes pass-through and linked deposit)
204 Annual Dollar Amount 0 0 0 0 0 0 20,510,896 496,741
205 *Cumulative Dollar Amount 0 0 0 0 0 0 20,510,896 21,007,637
206 Annual Number of Assistance Agreements 0 0 0 0 0 0 50 65
207 *Cumulative Number of Agreements 0 0 0 0 0 0 50 115
* Calculated values.
Page 38 of 67 10/31/2019

CWSRF Assistance
Construction Starts (includes pass-through and linked deposit)
200 Annual Dollar Amount
201 *Cumulative Dollar Amount
202 Annual Number of Assistance Agreements
203 *Cumulative Number of Agreements
Initiation of Operations (includes pass-through and linked deposit)
204 Annual Dollar Amount
205 *Cumulative Dollar Amount
206 Annual Number of Assistance Agreements
207 *Cumulative Number of Agreements
* Calculated values.
Clean Water SRF Program Informationfor the State of Delaware
For the Reporting Year Ending June 30 of:
1996 1997 1998 1999 2000 2001 2002 2003
4,588,210 8,732,369 12,096,849 778,101 17,438,317 8,694,692 14,518,675 10,855,485
41,708,020 50,440,389 62,537,238 63,315,339 80,753,656 89,448,348 103,967,023 114,822,508
68 90 45 107 97 121 106 82
185 275 320 427 524 645 751 833
13,638,506 4,639,507 5,670,840 798,354 1,460,880 19,635,570 3,027,313 1,704,076
34,646,143 39,285,650 44,956,490 45,754,844 47,215,724 66,851,294 69,878,607 71,582,683
70 89 44 105 93 121 114 82
185 274 318 423 516 637 751 833
Page 39 of 67 10/31/2019

CWSRF Assistance
Construction Starts (includes pass-through and linked deposit)
200 Annual Dollar Amount
201 *Cumulative Dollar Amount
202 Annual Number of Assistance Agreements
203 *Cumulative Number of Agreements
Initiation of Operations (includes pass-through and linked deposit)
204 Annual Dollar Amount
205 *Cumulative Dollar Amount
206 Annual Number of Assistance Agreements
207 *Cumulative Number of Agreements
* Calculated values.
Clean Water SRF Program Informationfor the State of Delaware
For the Reporting Year Ending June 30 of:
2004 2005 2006 2007 2008 2009 2010 2011
16,999,503 25,501,544 15,545,660 1,997,169 5,899,852 15,042,456 49,630,158 13,333,335
131,822,011 157,323,555 172,869,215 174,866,384 180,766,236 195,808,692 245,438,850 258,772,185
53 88 87 66 55 36 38 22
886 974 1,061 1,127 1,182 1,218 1,256 1,278
12,328,126 3,419,273 6,984,244 37,829,222 8,948,504 24,876,149 9,916,682 15,827,210
83,910,809 87,330,082 94,314,326 132,143,548 141,092,052 165,968,201 175,884,883 191,712,093
53 88 87 66 55 36 30 27
886 974 1,061 1,127 1,182 1,218 1,248 1,275
Page 40 of 67 10/31/2019

CWSRF Assistance
Construction Starts (includes pass-through and linked deposit)
200 Annual Dollar Amount
201 *Cumulative Dollar Amount
202 Annual Number of Assistance Agreements
203 *Cumulative Number of Agreements
Initiation of Operations (includes pass-through and linked deposit)
204 Annual Dollar Amount
205 *Cumulative Dollar Amount
206 Annual Number of Assistance Agreements
207 *Cumulative Number of Agreements
* Calculated values.
Clean Water SRF Program Informationfor the State of Delaware
For the Reporting Year Ending June 30 of:
2012 2013 2014 2015 2016 2017 2018 2019
3,114,280 45,132,714 1,405,492 7,883,389 25,794,600 15,545,148 65,138,116 66,939,244
261,886,465 307,019,179 308,424,671 316,308,060 342,102,660 357,647,808 422,785,924 489,725,168
25 18 28 26 23 26 22 39
1,303 1,321 1,349 1,375 1,398 1,424 1,446 1,485
37,866,896 2,486,884 4,095,455 452,074 1,878,975 47,346,581 37,580,600 10,543,425
229,578,989 232,065,873 236,161,328 236,613,402 238,492,377 285,838,958 323,419,558 333,962,983
25 12 32 25 28 25 23 17
1,300 1,312 1,344 1,369 1,397 1,422 1,445 1,462
Page 41 of 67 10/31/2019

Clean Water SRF Program Informationfor the State of Delaware
Fund Information For the Reporting Year Ending June 30 of:
1988 1989 1990 1991 1992 1993 1994 1995
Leveraged Bonds (Excludes State Match)
208 Gross Leveraged Bonds Issued - Annual 0 0 0 0 0 0 0 0
209 Net Leveraged Bonds Issued - Annual 0 0 0 0 0 0 0 0
210 0 0 0 0 0 0 0 0
211 Leveraged Bond Principal Repaid - Annual 0 0 0 0 0 0 0 0
Debt Service Reserve for Leveraged Bonds
212 *Annual Change 0 0 0 0 0 0 0 0
213 Balance at End of Reporting Period 0 0 0 0 0 0 0 0
214 0 0 0 0 0 0 0 0
215 0 0 0 0 0 0 0 0
216 0 0 0 0 0 0 0 0
217 0 0 0 0 0 0 0 0
218 0 0 0 0 0 0 0 0
219 0 0 0 0 0 0 0 0
220 0 0 0 0 0 0 0 0
221 0 0 0 0 0 0 0 0
222 0 0 0 0 0 0 0 0
State Match Bonds to be Repaid by CWSRF
223 *Match Bonds Issued - Annual 0 0 0 0 0 0 0 0
224 Match Bond Principal Repaid - Annual 0 0 0 0 0 0 0 0
225 *Match Bonds Issued - Cumulative 0 0 0 0 0 0 0 0
226 *Match Bond Principal Repaid - Cumulative 0 0 0 0 0 0 0 0
2270 0 0 0 0 0 0 0
Interest Paid on Leveraged and Match Bonds
2280 0 0 0 0 0 0 0
229 Interest Paid from Capitalized Interest Account - Annual 0 0 0 0 0 0 0 0
Interest Paid from CWSRF Funds, Excluding
Capitalized Interest Account Funds
230 *Annual 0 0 0 0 0 0 0 0
231 *Cumulative 0 0 0 0 0 0 0 0
*Calculated Values
Interest Paid from Capitalized Interest Account and Other CWSRF Funds-
Annual
Cost of Leveraged Bond Issuance - Annual
*Net Change in Gross Bonds Resulting from Refunding - Cumulative
*Leveraged Bond Principal Repaid - Cumulative
*Cost of Leveraged Bond Issuance - Cumulative
*Match Bonds Outstanding - Balance at End of Reporting
Period
Net Change in Gross Bonds Resulting from Refunding - Annual
CWSRF Funds Used for Refunding (Excludes Bonds) - Annual
*Gross Leveraged Bonds Issued - Cumulative
*Net Leveraged Bonds Issued - Cumulative
*Leveraged Bonds Outstanding - Balance at End of Reporting Period
*CWSRF Funds Used for Refunding (Excludes Bonds) - Cumulative
Page 42 of 67 10/31/2019

Fund Information
Leveraged Bonds (Excludes State Match)
208 Gross Leveraged Bonds Issued - Annual
209 Net Leveraged Bonds Issued - Annual
210
211 Leveraged Bond Principal Repaid - Annual
Debt Service Reserve for Leveraged Bonds
212 *Annual Change
213 Balance at End of Reporting Period
214
215
216
217
218
219
220
221
222
State Match Bonds to be Repaid by CWSRF
223 *Match Bonds Issued - Annual
224 Match Bond Principal Repaid - Annual
225 *Match Bonds Issued - Cumulative
226 *Match Bond Principal Repaid - Cumulative
227
Interest Paid on Leveraged and Match Bonds
228
229 Interest Paid from Capitalized Interest Account - Annual
Interest Paid from CWSRF Funds, Excluding
Capitalized Interest Account Funds
230 *Annual
231 *Cumulative
*Calculated Values
Interest Paid from Capitalized Interest Account and Other CWSRF Funds-
Annual
Cost of Leveraged Bond Issuance - Annual
*Net Change in Gross Bonds Resulting from Refunding - Cumulative
*Leveraged Bond Principal Repaid - Cumulative
*Cost of Leveraged Bond Issuance - Cumulative
*Match Bonds Outstanding - Balance at End of Reporting
Period
Net Change in Gross Bonds Resulting from Refunding - Annual
CWSRF Funds Used for Refunding (Excludes Bonds) - Annual
*Gross Leveraged Bonds Issued - Cumulative
*Net Leveraged Bonds Issued - Cumulative
*Leveraged Bonds Outstanding - Balance at End of Reporting Period
*CWSRF Funds Used for Refunding (Excludes Bonds) - Cumulative
Clean Water SRF Program Informationfor the State of Delaware
For the Reporting Year Ending June 30 of:
1996 1997 1998 1999 2000 2001 2002 2003
0 0 0 0 0 0 0 0
0 0 0 0 0 0 0 0
0 0 0 0 0 0 0 0
0 0 0 0 0 0 0 0
0 0 0 0 0 0 0 0
0 0 0 0 0 0 0 0
0 0 0 0 0 0 0 0
0 0 0 0 0 0 0 0
0 0 0 0 0 0 0 0
0 0 0 0 0 0 0 0
0 0 0 0 0 0 0 0
0 0 0 0 0 0 0 0
0 0 0 0 0 0 0 0
0 0 0 0 0 0 0 0
0 0 0 0 0 0 0 0
0 0 0 0 0 0 0 0
0 0 0 0 0 0 0 0
0 0 0 0 0 0 0 0
0 0 0 0 0 0 0 0
0 0 0 0 0 0 0 0
0 0 0 0 0 0 0 0
0 0 0 0 0 0 0 0
0 0 0 0 0 0 0 0
0 0 0 0 0 0 0 0
Page 43 of 67 10/31/2019

Fund Information
Leveraged Bonds (Excludes State Match)
208 Gross Leveraged Bonds Issued - Annual
209 Net Leveraged Bonds Issued - Annual
210
211 Leveraged Bond Principal Repaid - Annual
Debt Service Reserve for Leveraged Bonds
212 *Annual Change
213 Balance at End of Reporting Period
214
215
216
217
218
219
220
221
222
State Match Bonds to be Repaid by CWSRF
223 *Match Bonds Issued - Annual
224 Match Bond Principal Repaid - Annual
225 *Match Bonds Issued - Cumulative
226 *Match Bond Principal Repaid - Cumulative
227
Interest Paid on Leveraged and Match Bonds
228
229 Interest Paid from Capitalized Interest Account - Annual
Interest Paid from CWSRF Funds, Excluding
Capitalized Interest Account Funds
230 *Annual
231 *Cumulative
*Calculated Values
Interest Paid from Capitalized Interest Account and Other CWSRF Funds-
Annual
Cost of Leveraged Bond Issuance - Annual
*Net Change in Gross Bonds Resulting from Refunding - Cumulative
*Leveraged Bond Principal Repaid - Cumulative
*Cost of Leveraged Bond Issuance - Cumulative
*Match Bonds Outstanding - Balance at End of Reporting
Period
Net Change in Gross Bonds Resulting from Refunding - Annual
CWSRF Funds Used for Refunding (Excludes Bonds) - Annual
*Gross Leveraged Bonds Issued - Cumulative
*Net Leveraged Bonds Issued - Cumulative
*Leveraged Bonds Outstanding - Balance at End of Reporting Period
*CWSRF Funds Used for Refunding (Excludes Bonds) - Cumulative
Clean Water SRF Program Informationfor the State of Delaware
For the Reporting Year Ending June 30 of:
2004 2005 2006 2007 2008 2009 2010 2011
0 0 0 0 0 0 0 0
0 0 0 0 0 0 0 0
0 0 0 0 0 0 0 0
0 0 0 0 0 0 0 0
0 0 0 0 0 0 0 0
0 0 0 0 0 0 0 0
0 0 0 0 0 0 0 0
0 0 0 0 0 0 0 0
0 0 0 0 0 0 0 0
0 0 0 0 0 0 0 0
0 0 0 0 0 0 0 0
0 0 0 0 0 0 0 0
0 0 0 0 0 0 0 0
0 0 0 0 0 0 0 0
0 0 0 0 0 0 0 0
0 0 0 0 0 0 0 0
0 0 0 0 0 0 0 0
0 0 0 0 0 0 0 0
0 0 0 0 0 0 0 0
0 0 0 0 0 0 0 0
0 0 0 0 0 0 0 0
0 0 0 0 0 0 0 0
0 0 0 0 0 0 0 0
0 0 0 0 0 0 0 0
Page 44 of 67 10/31/2019

Fund Information
Leveraged Bonds (Excludes State Match)
208 Gross Leveraged Bonds Issued - Annual
209 Net Leveraged Bonds Issued - Annual
210
211 Leveraged Bond Principal Repaid - Annual
Debt Service Reserve for Leveraged Bonds
212 *Annual Change
213 Balance at End of Reporting Period
214
215
216
217
218
219
220
221
222
State Match Bonds to be Repaid by CWSRF
223 *Match Bonds Issued - Annual
224 Match Bond Principal Repaid - Annual
225 *Match Bonds Issued - Cumulative
226 *Match Bond Principal Repaid - Cumulative
227
Interest Paid on Leveraged and Match Bonds
228
229 Interest Paid from Capitalized Interest Account - Annual
Interest Paid from CWSRF Funds, Excluding
Capitalized Interest Account Funds
230 *Annual
231 *Cumulative
*Calculated Values
Interest Paid from Capitalized Interest Account and Other CWSRF Funds-
Annual
Cost of Leveraged Bond Issuance - Annual
*Net Change in Gross Bonds Resulting from Refunding - Cumulative
*Leveraged Bond Principal Repaid - Cumulative
*Cost of Leveraged Bond Issuance - Cumulative
*Match Bonds Outstanding - Balance at End of Reporting
Period
Net Change in Gross Bonds Resulting from Refunding - Annual
CWSRF Funds Used for Refunding (Excludes Bonds) - Annual
*Gross Leveraged Bonds Issued - Cumulative
*Net Leveraged Bonds Issued - Cumulative
*Leveraged Bonds Outstanding - Balance at End of Reporting Period
*CWSRF Funds Used for Refunding (Excludes Bonds) - Cumulative
Clean Water SRF Program Informationfor the State of Delaware
For the Reporting Year Ending June 30 of:
2012 2013 2014 2015 2016 2017 2018 2019
0 0 0 0 0 0 0 0
0 0 0 0 0 0 0 0
0 0 0 0 0 0 0 0
0 0 0 0 0 0 0 0
0 0 0 0 0 0 0 0
0 0 0 0 0 0 0 0
0 0 0 0 0 0 0 0
0 0 0 0 0 0 0 0
0 0 0 0 0 0 0 0
0 0 0 0 0 0 0 0
0 0 0 0 0 0 0 0
0 0 0 0 0 0 0 0
0 0 0 0 0 0 0 0
0 0 0 0 0 0 0 0
0 0 0 0 0 0 0 0
0 0 0 0 0 0 0 0
0 0 0 0 0 0 0 0
0 0 0 0 0 0 0 0
0 0 0 0 0 0 0 0
0 0 0 0 0 0 0 0
0 0 0 0 0 0 0 0
0 0 0 0 0 0 0 0
0 0 0 0 0 0 0 0
0 0 0 0 0 0 0 0
Page 45 of 67 10/31/2019

Clean Water SRF Program Information
for the State of Delaware
Fund Information For the Reporting Year Ending June 30 of:
1988 1989 1990 1991 1992 1993 1994 1995
CWSRF Project Assistance Disbursed
232 Annual 0 0 0 0 0 0 4,564,843 8,458,108
233 *Cumulative 0 0 0 0 0 0 4,564,843 13,022,951
CWSRF Loan Repayments
234 Principal Repayments - Annual 0 0 0 0 0 0 20,713 98,343
235 Interest Payments - Annual 0 0 0 0 0 0 7,626 24,706
236 *Principal and Interest - Annual 0 0 0 0 0 0 28,339 123,049
237 *Principal Repayments - Cumulative 0 0 0 0 0 0 20,713 119,056
238 *Interest Payments - Cumulative 0 0 0 0 0 0 7,626 32,332
239 *Principal and Interest - Cumulative 0 0 0 0 0 0 28,339 151,388
240 Weighted Average Interest Rate on Loans 0.000 0.000 0.000 0.000 0.000 0.000 0.902 3.000
Interest Earnings on Investments
241 Annual 0 0 0 0 0 0 1,461 7,418
242 *Cumulative 0 0 0 0 0 0 1,461 8,879
CWSRF Administrative Expenses Paid from the CWSRF
243 Annual 0 0 0 0 102,411 163,240 216,278 295,234
244 *Cumulative 0 0 0 0 102,411 265,651 481,929 777,163
Expenses as a % of Capitalization Grants
245 *Annual - - - 0.0% 48.3% 1.6% 1.1% 2.5%
246 *Cumulative - - - 0.0% 1.1% 1.3% 1.2% 1.5%
CWSRF Administrative Expenses Paid Outside the CWSRF
247 Annual 0 0 0 0 0 0 0 0
248 *Cumulative 0 0 0 0 0 0 0 0
* Calculated values.
Page 46 of 67 10/31/2019

Fund Information
CWSRF Project Assistance Disbursed
232 Annual
233 *Cumulative
CWSRF Loan Repayments
234 Principal Repayments - Annual
235 Interest Payments - Annual
236 *Principal and Interest - Annual
237 *Principal Repayments - Cumulative
238 *Interest Payments - Cumulative
239 *Principal and Interest - Cumulative
240 Weighted Average Interest Rate on Loans
Interest Earnings on Investments
241 Annual
242 *Cumulative
CWSRF Administrative Expenses Paid from the CWSRF
243 Annual
244 *Cumulative
Expenses as a % of Capitalization Grants
245 *Annual
246 *Cumulative
CWSRF Administrative Expenses Paid Outside the CWSRF
247 Annual
248 *Cumulative
* Calculated values.
Clean Water SRF Program Information
for the State of Delaware
For the Reporting Year Ending June 30 of:
1996 1997 1998 1999 2000 2001 2002 2003
11,769,599 13,807,720 8,592,231 4,391,003 9,938,147 6,817,443 10,401,582 2,518,797
24,792,550 38,600,270 47,192,501 51,583,504 61,521,651 68,339,094 78,740,676 81,259,473
155,856 890,931 1,853,148 2,149,376 2,973,195 2,727,334 4,590,413 3,541,555
155,927 387,500 606,385 371,927 796,090 699,763 947,549 553,394
311,783 1,278,431 2,459,533 2,521,303 3,769,285 3,427,097 5,537,962 4,094,949
274,912 1,165,843 3,018,991 5,168,367 8,141,562 10,868,896 15,459,309 19,000,864
188,259 575,759 1,182,144 1,554,071 2,350,161 3,049,924 3,997,473 4,550,867
463,171 1,741,602 4,201,135 6,722,438 10,491,723 13,918,820 19,456,782 23,551,731
0.369 2.065 0.084 3.000 0.446 1.053 1.586 1.131
22,643 46,967 87,766 -5 952,888 773,249 711,063 544,690
31,522 78,489 166,255 166,250 1,119,138 1,892,387 2,603,450 3,148,140
298,169 465,581 533,892 53,692 205,966 249,303 301,003 158,050
1,075,332 1,540,913 2,074,805 2,128,497 2,334,463 2,583,766 2,884,769 3,042,819
- 4.7% 17.9% - 3.1% 1.4% 4.6% 2.4%
2.1% 2.5% 3.3% 3.4% 3.3% 2.9% 3.1% 3.0%
0 0 0 403,660 264,390 257,600 218,713 287,383
0 0 0 403,660 668,050 925,650 1,144,363 1,431,746
Page 47 of 67 10/31/2019

Fund Information
CWSRF Project Assistance Disbursed
232 Annual
233 *Cumulative
CWSRF Loan Repayments
234 Principal Repayments - Annual
235 Interest Payments - Annual
236 *Principal and Interest - Annual
237 *Principal Repayments - Cumulative
238 *Interest Payments - Cumulative
239 *Principal and Interest - Cumulative
240 Weighted Average Interest Rate on Loans
Interest Earnings on Investments
241 Annual
242 *Cumulative
CWSRF Administrative Expenses Paid from the CWSRF
243 Annual
244 *Cumulative
Expenses as a % of Capitalization Grants
245 *Annual
246 *Cumulative
CWSRF Administrative Expenses Paid Outside the CWSRF
247 Annual
248 *Cumulative
* Calculated values.
Clean Water SRF Program Information
for the State of Delaware
For the Reporting Year Ending June 30 of:
2004 2005 2006 2007 2008 2009 2010 2011
17,077,864 8,911,123 23,172,917 19,159,408 12,942,683 11,149,027 5,551,552 48,437,863
98,337,337 107,248,460 130,421,377 149,580,785 162,523,468 173,672,495 179,224,047 227,661,910
3,611,457 3,708,451 3,698,591 4,733,805 5,916,917 8,069,328 8,182,317 7,934,224
556,152 647,157 769,314 1,076,750 1,227,820 1,354,764 1,310,396 1,461,481
4,167,609 4,355,608 4,467,905 5,810,555 7,144,737 9,424,092 9,492,713 9,395,705
22,612,321 26,320,772 30,019,363 34,753,168 40,670,085 48,739,413 56,921,730 64,855,954
5,107,019 5,754,176 6,523,490 7,600,240 8,828,060 10,182,824 11,493,220 12,954,701
27,719,340 32,074,948 36,542,853 42,353,408 49,498,145 58,922,237 68,414,950 77,810,655
1.070 1.487 0.961 1.249 1.424 0.559 0.984 0.924
381,634 600,929 1,183,161 1,324,191 1,387,428 780,403 491,038 311,859
3,529,774 4,130,703 5,313,864 6,638,055 8,025,483 8,805,886 9,296,924 9,608,783
194,577 116,455 165,205 26,287 172,131 223,769 750,926 526,351
3,237,396 3,353,851 3,519,056 3,545,343 3,717,474 3,941,243 4,692,169 5,218,520
- 1.8% 2.6% 0.3% 2.7% 1.0% 22.9% 5.3%
3.2% 3.1% 3.1% 2.9% 2.9% 2.6% 3.0% 3.2%
286,686 419,188 585,838 632,748 621,220 553,192 129,729 1,242,119
1,718,432 2,137,620 2,723,458 3,356,206 3,977,426 4,530,618 4,660,347 5,902,466
Page 48 of 67 10/31/2019

Fund Information
CWSRF Project Assistance Disbursed
232 Annual
233 *Cumulative
CWSRF Loan Repayments
234 Principal Repayments - Annual
235 Interest Payments - Annual
236 *Principal and Interest - Annual
237 *Principal Repayments - Cumulative
238 *Interest Payments - Cumulative
239 *Principal and Interest - Cumulative
240 Weighted Average Interest Rate on Loans
Interest Earnings on Investments
241 Annual
242 *Cumulative
CWSRF Administrative Expenses Paid from the CWSRF
243 Annual
244 *Cumulative
Expenses as a % of Capitalization Grants
245 *Annual
246 *Cumulative
CWSRF Administrative Expenses Paid Outside the CWSRF
247 Annual
248 *Cumulative
* Calculated values.
Clean Water SRF Program Information
for the State of Delaware
For the Reporting Year Ending June 30 of:
2012 2013 2014 2015 2016 2017 2018 2019
23,048,333 13,960,312 27,117,969 8,648,904 9,189,415 26,825,093 48,718,602 18,407,381
250,710,243 264,670,555 291,788,524 300,437,428 309,626,843 336,451,936 385,170,538 403,577,919
18,813,385 10,780,172 12,707,864 11,865,138 11,189,996 12,179,986 13,013,558 12,958,683
1,835,559 1,507,625 1,446,336 1,848,451 1,940,281 1,970,921 1,770,527 2,071,804
20,648,944 12,287,797 14,154,200 13,713,589 13,130,277 14,150,907 14,784,085 15,030,487
83,669,339 94,449,511 107,157,375 119,022,513 130,212,509 142,392,495 155,406,053 168,364,736
14,790,260 16,297,885 17,744,221 19,592,672 21,532,953 23,503,874 25,274,401 27,346,205
98,459,599 110,747,396 124,901,596 138,615,185 151,745,462 165,896,369 180,680,454 195,710,941
0.774 0.962 0.875 0.874 0.654 0.947 0.957 1.130
218,933 258,935 235,729 347,134 598,803 1,104,777 524,256 1,335,037
9,827,716 10,086,651 10,322,380 10,669,514 11,268,317 12,373,094 12,897,350 14,232,387
341,997 609,820 729,092 75,113 342,482 559,582 583,644 597,007
5,560,517 6,170,337 6,899,429 6,974,542 7,317,024 7,876,606 8,460,250 9,057,257
4.7% 8.8% 11.2% 1.1% 2.6% - 9.0% 7.6%
3.2% 3.4% 3.7% 3.6% 3.6% 3.8% 4.0% 4.1%
1,263,923 250,594 903,350 729,600 1,305,567 1,078,686 1,008,959 1,153,031
7,166,389 7,416,983 8,320,333 9,049,933 10,355,500 11,434,186 12,443,145 13,596,176
Page 49 of 67 10/31/2019

Other Clean Water Programs (Separate from CWSRF)
EPA's Rural Community Hardship Grants Program
249 EPA's Grants to State
250 State Match Amount
251 *Cumulative Total
252 Technical Assistance from Hardship Funds - Annual Dollars
253 Project Assistance from Hardship Funds - Annual Dollars
254 *Total Annual EPA Rural Hardship Assistance
255 *Cumulative EPA Rural Hardship Assistance
256 Number of Projects Receiving Hardship Assistance - Annual
257 *Cumulative
258 Number of Projects Receiving Hardship Assistance and CWSRF
Loans - Annual
259 *Cumulative
260 Hardship Portion of Combined Assistance - Annual Dollars
261 *Cumulative
262 CWSRF Loan Portion of Combined Assistance - Annual Dollars
263 *Cumulative
264 *Total Annual Combined Assistance
265 *Cumulative Combined Assistance
* Calculated values.
Projects Receiving Hardship Assistance in Combination with CWSRF
Loan Assistance
Clean Water SRF Program Information
for the State of Delaware
For the Reporting Year Ending June 30 of:
1998 1999 2000 2001 2002 2003
0 155,900 0 0 0 0
0 7,795 0 0 0 0
0 163,695 163,695 163,695 163,695 163,695
0 0 0 0 0 0
0 0 119,435 44,260 0 0
0 0 119,435 44,260 0 0
0 0 119,435 163,695 163,695 163,695
0 0 1 0 0 0
0 0 1 1 1 1
0 0 1 0 0 0
0 0 1 1 1 1
0 0 119,435 44,260 0 0
0 0 119,435 163,695 163,695 163,695
0 0 21,077 0 0 0
0 0 21,077 21,077 21,077 21,077
0 0 140,512 44,260 0 0
0 0 140,512 184,772 184,772 184,772
Page 50 of 67 10/31/2019

Other Clean Water Programs (Separate from CWSRF)
EPA's Rural Community Hardship Grants Program
249 EPA's Grants to State
250 State Match Amount
251 *Cumulative Total
252 Technical Assistance from Hardship Funds - Annual Dollars
253 Project Assistance from Hardship Funds - Annual Dollars
254 *Total Annual EPA Rural Hardship Assistance
255 *Cumulative EPA Rural Hardship Assistance
256 Number of Projects Receiving Hardship Assistance - Annual
257 *Cumulative
258 Number of Projects Receiving Hardship Assistance and CWSRF
Loans - Annual
259 *Cumulative
260 Hardship Portion of Combined Assistance - Annual Dollars
261 *Cumulative
262 CWSRF Loan Portion of Combined Assistance - Annual Dollars
263 *Cumulative
264 *Total Annual Combined Assistance
265 *Cumulative Combined Assistance
* Calculated values.
Projects Receiving Hardship Assistance in Combination with CWSRF
Loan Assistance
Clean Water SRF Program Information
for the State of Delaware
For the Reporting Year Ending June 30 of:
2004 2005 2006 2007 2008 2009 2010 2011
0 0 0 0 0 0 0 0
0 0 0 0 0 0 0 0
163,695 163,695 163,695 163,695 163,695 163,695 163,695 163,695
0 0 0 0 0 0 0 0
0 0 0 0 0 0 0 0
0 0 0 0 0 0 0 0
163,695 163,695 163,695 163,695 163,695 163,695 163,695 163,695
0 0 0 0 0 0 0 0
1 1 1 1 1 1 1 1
0 0 0 0 0 0 0 0
1 1 1 1 1 1 1 1
0 0 0 0 0 0 0 0
163,695 163,695 163,695 163,695 163,695 163,695 163,695 163,695
0 0 0 0 0 0 0 0
21,077 21,077 21,077 21,077 21,077 21,077 21,077 21,077
0 0 0 0 0 0 0 0
184,772 184,772 184,772 184,772 184,772 184,772 184,772 184,772
Page 51 of 67 10/31/2019

Other Clean Water Programs (Separate from CWSRF)
EPA's Rural Community Hardship Grants Program
249 EPA's Grants to State
250 State Match Amount
251 *Cumulative Total
252 Technical Assistance from Hardship Funds - Annual Dollars
253 Project Assistance from Hardship Funds - Annual Dollars
254 *Total Annual EPA Rural Hardship Assistance
255 *Cumulative EPA Rural Hardship Assistance
256 Number of Projects Receiving Hardship Assistance - Annual
257 *Cumulative
258 Number of Projects Receiving Hardship Assistance and CWSRF
Loans - Annual
259 *Cumulative
260 Hardship Portion of Combined Assistance - Annual Dollars
261 *Cumulative
262 CWSRF Loan Portion of Combined Assistance - Annual Dollars
263 *Cumulative
264 *Total Annual Combined Assistance
265 *Cumulative Combined Assistance
* Calculated values.
Projects Receiving Hardship Assistance in Combination with CWSRF
Loan Assistance
Clean Water SRF Program Information
for the State of Delaware
For the Reporting Year Ending June 30 of:
2012 2013 2014 2015 2016 2017 2018 2019
0 0 0 0 0 0 0 0
0 0 0 0 0 0 0 0
163,695 163,695 163,695 163,695 163,695 163,695 163,695 163,695
0 0 0 0 0 0 0 0
0 0 0 0 0 0 0 0
0 0 0 0 0 0 0 0
163,695 163,695 163,695 163,695 163,695 163,695 163,695 163,695
0 0 0 0 0 0 0 0
1 1 1 1 1 1 1 1
0 0 0 0 0 0 0 0
1 1 1 1 1 1 1 1
0 0 0 0 0 0 0 0
163,695 163,695 163,695 163,695 163,695 163,695 163,695 163,695
0 0 0 0 0 0 0 0
21,077 21,077 21,077 21,077 21,077 21,077 21,077 21,077
0 0 0 0 0 0 0 0
184,772 184,772 184,772 184,772 184,772 184,772 184,772 184,772
Page 52 of 67 10/31/2019

Other Clean Water Programs (Separate from CWSRF)
State Funded Clean Water Loan Programs
(Separate from CWSRF)
266 Cumulative Dollar Amount from 7/1/87 to 6/30/98
267 Annual Dollar Amount
268 *Cumulative Dollar Amount
269 Cumulative Number of Loans from 7/1/87 to 6/30/98
270 Annual Number of Loans
271 *Cumulative Number of Loans
State Funded Clean Water Grant Programs
(Separate from CWSRF)
272 Cumulative Dollar Amount from 7/1/87 to 6/30/98
273 Annual Dollar Amount
274 *Cumulative Dollar Amount
275 Cumulative Number of Grants from 7/1/87 to 6/30/98
276 Annual Number of Grants
277 *Cumulative Number of Grants
Total State Funded Clean Water Programs
(Separate from CWSRF)
278 *Dollar Amount of Loans and Grants - Annual
279 *Dollar Amount of Loans and Grants - Cumulative
280 *Number of Loans and Grants - Annual
281 *Number of Loans and Grants - Cumulative
* Calculated values.
Clean Water SRF Program Information
for the State of Delaware
For the Reporting Year Ending June 30 of:
1998 1999 2000 2001 2002 2003
0
0 0 0 1,869,284 0
0 0 0 0 1,869,284 1,869,284
0
0 0 0 2 0
0 0 0 0 2 2
0
3,547,000 15,694,302 4,226,579 4,310,000 3,950,000
0 3,547,000 19,241,302 23,467,881 27,777,881 31,727,881
0
2 8 3 3 2
0 2 10 13 16 18
3,547,000 15,694,302 4,226,579 6,179,284 3,950,000
0 3,547,000 19,241,302 23,467,881 29,647,165 33,597,165
2 8 3 5 2
0 2 10 13 18 20
Page 53 of 67 10/31/2019

Other Clean Water Programs (Separate from CWSRF)
State Funded Clean Water Loan Programs
(Separate from CWSRF)
266 Cumulative Dollar Amount from 7/1/87 to 6/30/98
267 Annual Dollar Amount
268 *Cumulative Dollar Amount
269 Cumulative Number of Loans from 7/1/87 to 6/30/98
270 Annual Number of Loans
271 *Cumulative Number of Loans
State Funded Clean Water Grant Programs
(Separate from CWSRF)
272 Cumulative Dollar Amount from 7/1/87 to 6/30/98
273 Annual Dollar Amount
274 *Cumulative Dollar Amount
275 Cumulative Number of Grants from 7/1/87 to 6/30/98
276 Annual Number of Grants
277 *Cumulative Number of Grants
Total State Funded Clean Water Programs
(Separate from CWSRF)
278 *Dollar Amount of Loans and Grants - Annual
279 *Dollar Amount of Loans and Grants - Cumulative
280 *Number of Loans and Grants - Annual
281 *Number of Loans and Grants - Cumulative
* Calculated values.
Clean Water SRF Program Information
for the State of Delaware
For the Reporting Year Ending June 30 of:
2004 2005 2006 2007 2008 2009 2010 2011
0 2,630,716 0 0 0 0 0 0
1,869,284 4,500,000 4,500,000 4,500,000 4,500,000 4,500,000 4,500,000 4,500,000
0 0 0 0 0 0 0 0
2 2 2 2 2 2 2 2
3,710,000 0 0 0 0 1,500,000 2,500,000 150,000
35,437,881 35,437,881 35,437,881 35,437,881 35,437,881 36,937,881 39,437,881 39,587,881
2 0 0 0 0 1 1 1
20 20 20 20 20 21 22 23
3,710,000 2,630,716 0 0 0 1,500,000 2,500,000 150,000
37,307,165 39,937,881 39,937,881 39,937,881 39,937,881 41,437,881 43,937,881 44,087,881
2 0 0 0 0 1 1 1
22 22 22 22 22 23 24 25
Page 54 of 67 10/31/2019

Other Clean Water Programs (Separate from CWSRF)
State Funded Clean Water Loan Programs
(Separate from CWSRF)
266 Cumulative Dollar Amount from 7/1/87 to 6/30/98
267 Annual Dollar Amount
268 *Cumulative Dollar Amount
269 Cumulative Number of Loans from 7/1/87 to 6/30/98
270 Annual Number of Loans
271 *Cumulative Number of Loans
State Funded Clean Water Grant Programs
(Separate from CWSRF)
272 Cumulative Dollar Amount from 7/1/87 to 6/30/98
273 Annual Dollar Amount
274 *Cumulative Dollar Amount
275 Cumulative Number of Grants from 7/1/87 to 6/30/98
276 Annual Number of Grants
277 *Cumulative Number of Grants
Total State Funded Clean Water Programs
(Separate from CWSRF)
278 *Dollar Amount of Loans and Grants - Annual
279 *Dollar Amount of Loans and Grants - Cumulative
280 *Number of Loans and Grants - Annual
281 *Number of Loans and Grants - Cumulative
* Calculated values.
Clean Water SRF Program Information
for the State of Delaware
For the Reporting Year Ending June 30 of:
2012 2013 2014 2015 2016 2017 2018 2019
0 0 0 0 0 0 0 0
4,500,000 4,500,000 4,500,000 4,500,000 4,500,000 4,500,000 4,500,000 4,500,000
0 0 0 0 0 0 0 0
2 2 2 2 2 2 2 2
0 0 0 1,468,000 1,593,560 621,650 235,063 518,728
39,587,881 39,587,881 39,587,881 41,055,881 42,649,441 43,271,091 43,506,154 44,024,882
0 0 0 1 2 1 0 13
23 23 23 24 26 27 27 40
0 0 0 1,468,000 1,593,560 621,650 235,063 518,728
44,087,881 44,087,881 44,087,881 45,555,881 47,149,441 47,771,091 48,006,154 48,524,882
0 0 0 1 2 1 0 13
25 25 25 26 28 29 29 42
Page 55 of 67 10/31/2019

Clean Water SRF Program Information
for the State of Delaware
Fund Analysis For the Reporting Year Ending June 30 of:
1988 1989 1990 1991 1992 1993 1994 1995
CWSRF Funds Available for Projects
282 *Annual (New Funds) 0 0 0 11,044,771 245,727 11,687,037 22,030,244 13,843,523
283 *Cumulative 0 0 0 11,044,771 11,290,498 22,977,534 45,007,778 58,851,301
CWSRF Assistance as a % of Funds Available
284 *Annual - - - 0% 0% 0% 166% 4%
285 *Cumulative - - - 0% 0% 0% 81% 63%
Outlays as a % of Capitalization Grants
286 *Annual - - - 0% 49% 2% 21% 62%
287 *Cumulative - - - 0% 1% 1% 11% 23%
Disbursements as a % of Funds Available
288 *Annual - - - 0% 0% 0% 21% 61%
289 *Cumulative - - - 0% 0% 0% 10% 22%
Construction Starts as a % of Funds Available
290 *Annual - - - 0% 0% 0% 166% 4%
291 *Cumulative - - - 0% 0% 0% 81% 63%
Initiation of Operations as a % of Funds Available
292 *Annual - - - 0% 0% 0% 93% 4%
293 *Cumulative - - - 0% 0% 0% 46% 36%
Loan Principal Repayments as a % of Funds Available
294 *Annual - - - 0% 0% 0% 0% 1%
295 *Cumulative - - - 0% 0% 0% 0% 0%
* Calculated values.
Page 56 of 67 10/31/2019

Fund Analysis
CWSRF Funds Available for Projects
282 *Annual (New Funds)
283 *Cumulative
CWSRF Assistance as a % of Funds Available
284 *Annual
285 *Cumulative
Outlays as a % of Capitalization Grants
286 *Annual
287 *Cumulative
Disbursements as a % of Funds Available
288 *Annual
289 *Cumulative
Construction Starts as a % of Funds Available
290 *Annual
291 *Cumulative
Initiation of Operations as a % of Funds Available
292 *Annual
293 *Cumulative
Loan Principal Repayments as a % of Funds Available
294 *Annual
295 *Cumulative
* Calculated values.
Clean Water SRF Program Information
for the State of Delaware
For the Reporting Year Ending June 30 of:
1996 1997 1998 1999 2000 2001 2002 2003
334,426 12,814,796 6,016,279 2,521,298 12,351,841 24,670,063 13,784,501 12,187,670
59,185,727 72,000,523 78,016,802 80,538,100 92,889,941 117,560,004 131,344,505 143,532,175
1372% 68% 201% 31% 141% 35% 105% 89%
70% 70% 80% 79% 87% 76% 79% 80%
- 117% 269% - 119% 34% 135% 29%
43% 55% 65% 71% 76% 67% 72% 69%
3519% 108% 143% 174% 80% 28% 75% 21%
42% 54% 60% 64% 66% 58% 60% 57%
1372% 68% 201% 31% 141% 35% 105% 89%
70% 70% 80% 79% 87% 76% 79% 80%
4078% 36% 94% 32% 12% 80% 22% 14%
59% 55% 58% 57% 51% 57% 53% 50%
47% 7% 31% 85% 24% 11% 33% 29%
0% 2% 4% 6% 9% 9% 12% 13%
Page 57 of 67 10/31/2019

Fund Analysis
CWSRF Funds Available for Projects
282 *Annual (New Funds)
283 *Cumulative
CWSRF Assistance as a % of Funds Available
284 *Annual
285 *Cumulative
Outlays as a % of Capitalization Grants
286 *Annual
287 *Cumulative
Disbursements as a % of Funds Available
288 *Annual
289 *Cumulative
Construction Starts as a % of Funds Available
290 *Annual
291 *Cumulative
Initiation of Operations as a % of Funds Available
292 *Annual
293 *Cumulative
Loan Principal Repayments as a % of Funds Available
294 *Annual
295 *Cumulative
* Calculated values.
Clean Water SRF Program Information
for the State of Delaware
For the Reporting Year Ending June 30 of:
2004 2005 2006 2007 2008 2009 2010 2011
4,549,243 12,459,185 13,158,354 16,831,766 15,882,856 33,238,463 13,781,939 21,310,666
148,081,418 160,540,603 173,698,957 190,530,723 206,413,579 239,652,042 253,433,981 274,744,647
374% 205% 118% 12% 37% 45% 360% 63%
89% 98% 100% 92% 88% 82% 97% 94%
- 107% 150% 121% 178% 37% 185% 256%
83% 85% 88% 91% 95% 86% 88% 98%
375% 72% 176% 114% 81% 34% 40% 227%
66% 67% 75% 79% 79% 72% 71% 83%
374% 205% 118% 12% 37% 45% 360% 63%
89% 98% 100% 92% 88% 82% 97% 94%
271% 27% 53% 225% 56% 75% 72% 74%
57% 54% 54% 69% 68% 69% 69% 70%
79% 30% 28% 28% 37% 24% 59% 37%
15% 16% 17% 18% 20% 20% 22% 24%
Page 58 of 67 10/31/2019

Fund Analysis
CWSRF Funds Available for Projects
282 *Annual (New Funds)
283 *Cumulative
CWSRF Assistance as a % of Funds Available
284 *Annual
285 *Cumulative
Outlays as a % of Capitalization Grants
286 *Annual
287 *Cumulative
Disbursements as a % of Funds Available
288 *Annual
289 *Cumulative
Construction Starts as a % of Funds Available
290 *Annual
291 *Cumulative
Initiation of Operations as a % of Funds Available
292 *Annual
293 *Cumulative
Loan Principal Repayments as a % of Funds Available
294 *Annual
295 *Cumulative
* Calculated values.
Clean Water SRF Program Information
for the State of Delaware
For the Reporting Year Ending June 30 of:
2012 2013 2014 2015 2016 2017 2018 2019
61,705,608 25,970,049 21,953,129 22,010,203 27,900,800 16,560,684 22,818,181 25,481,964
336,450,255 362,420,304 384,373,433 406,383,636 434,284,436 450,845,120 473,663,301 499,145,265
5% 174% 6% 36% 92% 94% 285% 263%
78% 85% 80% 78% 79% 79% 89% 98%
56% 122% 409% 106% 78% - 100% 100%
97% 98% 108% 108% 106% 113% 112% 112%
37% 54% 124% 39% 33% 162% 214% 72%
75% 73% 76% 74% 71% 75% 81% 81%
5% 174% 6% 36% 92% 94% 285% 263%
78% 85% 80% 78% 79% 79% 89% 98%
61% 10% 19% 2% 7% 286% 165% 41%
68% 64% 61% 58% 55% 63% 68% 67%
30% 42% 58% 54% 40% 74% 57% 51%
25% 26% 28% 29% 30% 32% 33% 34%
Page 59 of 67 10/31/2019

Clean Water SRF Program Information
for the State of Delaware
Fund Analysis For the Reporting Year Ending June 30 of:
1988 1989 1990 1991 1992 1993 1994 1995
Disbursements as a % of CWSRF Assistance
296 *Annual - - - - - - 12% 1715%
297 *Cumulative - - - - - - 12% 35%
Construction Starts as a % of CWSRF Assistance
298 *Annual - - - - - - 100% 100%
299 *Cumulative - - - - - - 100% 100%
Initiation of Operations as a % of CWSRF Assistance
300 *Annual - - - - - - 56% 101%
301 *Cumulative - - - - - - 56% 57%
Loan Principal Repayments as a % of CWSRF Assistance
302 *Annual - - - - - - 0% 20%
303 *Cumulative - - - - - - 0% 0%
Initiation of Operations as a % of Construction Starts
304 *Annual - - - - - - 56% 101%
305 *Cumulative - - - - - - 56% 57%
* Calculated values.
Page 60 of 67 10/31/2019

Fund Analysis
Disbursements as a % of CWSRF Assistance
296 *Annual
297 *Cumulative
Construction Starts as a % of CWSRF Assistance
298 *Annual
299 *Cumulative
Initiation of Operations as a % of CWSRF Assistance
300 *Annual
301 *Cumulative
Loan Principal Repayments as a % of CWSRF Assistance
302 *Annual
303 *Cumulative
Initiation of Operations as a % of Construction Starts
304 *Annual
305 *Cumulative
* Calculated values.
Clean Water SRF Program Information
for the State of Delaware
For the Reporting Year Ending June 30 of:
1996 1997 1998 1999 2000 2001 2002 2003
257% 158% 71% 564% 57% 78% 72% 23%
59% 77% 75% 81% 76% 76% 76% 71%
100% 100% 100% 100% 100% 100% 100% 100%
100% 100% 100% 100% 100% 100% 100% 100%
297% 53% 47% 103% 8% 226% 21% 16%
83% 78% 72% 72% 58% 75% 67% 62%
3% 10% 15% 276% 17% 31% 32% 33%
1% 2% 5% 8% 10% 12% 15% 17%
297% 53% 47% 103% 8% 226% 21% 16%
83% 78% 72% 72% 58% 75% 67% 62%
Page 61 of 67 10/31/2019

Fund Analysis
Disbursements as a % of CWSRF Assistance
296 *Annual
297 *Cumulative
Construction Starts as a % of CWSRF Assistance
298 *Annual
299 *Cumulative
Initiation of Operations as a % of CWSRF Assistance
300 *Annual
301 *Cumulative
Loan Principal Repayments as a % of CWSRF Assistance
302 *Annual
303 *Cumulative
Initiation of Operations as a % of Construction Starts
304 *Annual
305 *Cumulative
* Calculated values.
Clean Water SRF Program Information
for the State of Delaware
For the Reporting Year Ending June 30 of:
2004 2005 2006 2007 2008 2009 2010 2011
100% 35% 149% 959% 219% 74% 11% 363%
75% 68% 75% 86% 90% 89% 73% 88%
100% 100% 100% 100% 100% 100% 100% 100%
100% 100% 100% 100% 100% 100% 100% 100%
73% 13% 45% 1894% 152% 165% 20% 119%
64% 56% 55% 76% 78% 85% 72% 74%
21% 15% 24% 237% 100% 54% 16% 60%
17% 17% 17% 20% 22% 25% 23% 25%
73% 13% 45% 1894% 152% 165% 20% 119%
64% 56% 55% 76% 78% 85% 72% 74%
Page 62 of 67 10/31/2019
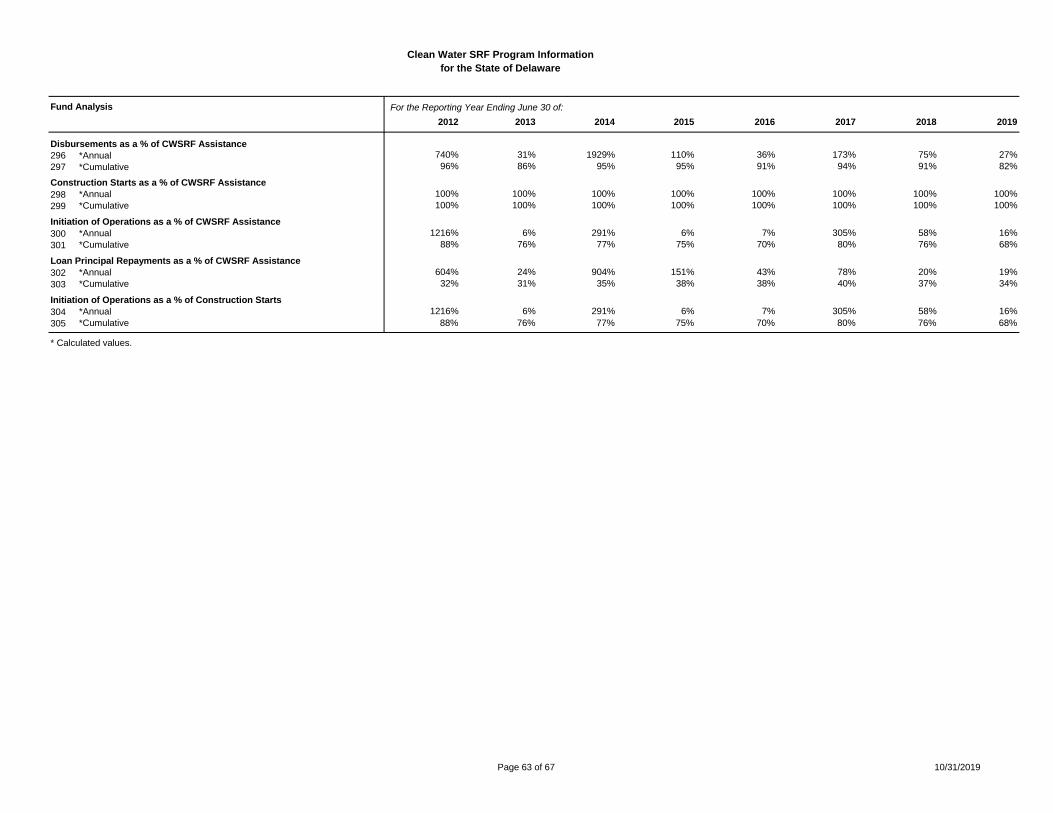
Fund Analysis
Disbursements as a % of CWSRF Assistance
296 *Annual
297 *Cumulative
Construction Starts as a % of CWSRF Assistance
298 *Annual
299 *Cumulative
Initiation of Operations as a % of CWSRF Assistance
300 *Annual
301 *Cumulative
Loan Principal Repayments as a % of CWSRF Assistance
302 *Annual
303 *Cumulative
Initiation of Operations as a % of Construction Starts
304 *Annual
305 *Cumulative
* Calculated values.
Clean Water SRF Program Information
for the State of Delaware
For the Reporting Year Ending June 30 of:
2012 2013 2014 2015 2016 2017 2018 2019
740% 31% 1929% 110% 36% 173% 75% 27%
96% 86% 95% 95% 91% 94% 91% 82%
100% 100% 100% 100% 100% 100% 100% 100%
100% 100% 100% 100% 100% 100% 100% 100%
1216% 6% 291% 6% 7% 305% 58% 16%
88% 76% 77% 75% 70% 80% 76% 68%
604% 24% 904% 151% 43% 78% 20% 19%
32% 31% 35% 38% 38% 40% 37% 34%
1216% 6% 291% 6% 7% 305% 58% 16%
88% 76% 77% 75% 70% 80% 76% 68%
Page 63 of 67 10/31/2019

Clean Water SRF Program Information
for the State of Delaware
Fund Analysis For the Reporting Year Ending June 30 of:
1988 1989 1990 1991 1992 1993 1994 1995
Financial Indicators
Federal Return on Investment
306 *Annual - - - - 0% 0% 112% 115%
307 *Cumulative - - - - 0% 0% 106% 111%
Executed Loans as a % of Funds Available
308 *Annual - - - 0% 0% 0% 166% 4%
309 *Cumulative - - - 0% 0% 0% 81% 63%
Disbursements as a % of Executed Loans
310 *Annual - - - - - - 12% 1715%
311 *Cumulative - - - - - - 12% 35%
Additional Loans Made Due to Leveraging
312 *Annual - - - - - - - -
313 *Cumulative - - - - - - - -
314 *Cumulative Additional Loans as a % of Contributed Capital - - - - - - - -
Sustainability (Retained Earnings) Excludes Subsidy
318 *Annual 0 0 0 0 0 0 9,087 32,124
319 *Cumulative 0 0 0 0 0 0 9,087 41,211
320 *Cumulative Retained Earnings as a % of Contributed Capital - - - 0.0% 0.0% 0.0% 0.0% 0.1%
Subsidy Information from CBR as of Report Date
321 Grant Amount
322 Negative Interest
323 Principal Forgiven
324 * Total Annual Subsidy
325 * Total Cumulative Subsidy
Green Project Reserve (GPR) from CBR as of Report Date
326 Green Infrastructure
327 Energy Efficiency
328 Water Conservation
329 Green Innovative
330 * Total Annual GPR
331 * Cumulative GPR
* Calculated values.
Page 64 of 67 10/31/2019

Fund Analysis
Financial Indicators
Federal Return on Investment
306 *Annual
307 *Cumulative
Executed Loans as a % of Funds Available
308 *Annual
309 *Cumulative
Disbursements as a % of Executed Loans
310 *Annual
311 *Cumulative
Additional Loans Made Due to Leveraging
312 *Annual
313 *Cumulative
314 *Cumulative Additional Loans as a % of Contributed Capital
Sustainability (Retained Earnings) Excludes Subsidy
318 *Annual
319 *Cumulative
320 *Cumulative Retained Earnings as a % of Contributed Capital
Subsidy Information from CBR as of Report Date
321 Grant Amount
322 Negative Interest
323 Principal Forgiven
324 * Total Annual Subsidy
325 * Total Cumulative Subsidy
Green Project Reserve (GPR) from CBR as of Report Date
326 Green Infrastructure
327 Energy Efficiency
328 Water Conservation
329 Green Innovative
330 * Total Annual GPR
331 * Cumulative GPR
* Calculated values.
Clean Water SRF Program Information
for the State of Delaware
For the Reporting Year Ending June 30 of:
1996 1997 1998 1999 2000 2001 2002 2003
117% 119% 107% 119% 127% 115% 119% 131%
114% 116% 114% 114% 116% 116% 116% 117%
1372% 68% 201% 31% 141% 35% 105% 89%
70% 70% 80% 79% 87% 76% 79% 80%
257% 158% 71% 564% 57% 78% 72% 23%
59% 77% 75% 81% 76% 76% 76% 71%
- - - - - - - -
- - - - - - - -
- - - - - - - -
178,570 434,467 694,151 371,922 1,748,978 1,473,012 1,658,612 1,098,084
219,781 654,248 1,348,399 1,720,321 3,469,299 4,942,311 6,600,923 7,699,007
0.4% 0.9% 1.8% 2.3% 4.1% 4.7% 5.8% 6.4%
Page 65 of 67 10/31/2019

Fund Analysis
Financial Indicators
Federal Return on Investment
306 *Annual
307 *Cumulative
Executed Loans as a % of Funds Available
308 *Annual
309 *Cumulative
Disbursements as a % of Executed Loans
310 *Annual
311 *Cumulative
Additional Loans Made Due to Leveraging
312 *Annual
313 *Cumulative
314 *Cumulative Additional Loans as a % of Contributed Capital
Sustainability (Retained Earnings) Excludes Subsidy
318 *Annual
319 *Cumulative
320 *Cumulative Retained Earnings as a % of Contributed Capital
Subsidy Information from CBR as of Report Date
321 Grant Amount
322 Negative Interest
323 Principal Forgiven
324 * Total Annual Subsidy
325 * Total Cumulative Subsidy
Green Project Reserve (GPR) from CBR as of Report Date
326 Green Infrastructure
327 Energy Efficiency
328 Water Conservation
329 Green Innovative
330 * Total Annual GPR
331 * Cumulative GPR
* Calculated values.
Clean Water SRF Program Information
for the State of Delaware
For the Reporting Year Ending June 30 of:
2004 2005 2006 2007 2008 2009 2010 2011
119% 129% 239% 190% 115% 132% 92% 189%
117% 118% 130% 135% 133% 133% 131% 141%
374% 205% 118% 12% 37% 45% 360% 63%
89% 98% 100% 92% 88% 82% 97% 94%
100% 35% 149% 959% 219% 74% 11% 363%
75% 68% 75% 86% 90% 89% 73% 88%
- - - - - - - -
- - - - - - - -
- - - - - - - -
937,786 1,248,086 1,952,475 2,400,941 2,615,248 2,135,167 1,801,434 1,773,340
8,636,793 9,884,879 11,837,354 14,238,295 16,853,543 18,988,710 20,790,144 22,563,484
7.1% 7.7% 8.7% 9.7% 10.9% 10.8% 12.1% 12.3%
0 0 0
0 0 0
1,500,000 8,434,550 0
1,500,000 8,434,550 0
1,500,000 9,934,550 9,934,550
0 3,622,500 2,938,004
0 15,527,296 0
0 250,000 0
0 190,000 0
0 19,589,796 2,938,004
0 19,589,796 22,527,800
Page 66 of 67 10/31/2019

Fund Analysis
Financial Indicators
Federal Return on Investment
306 *Annual
307 *Cumulative
Executed Loans as a % of Funds Available
308 *Annual
309 *Cumulative
Disbursements as a % of Executed Loans
310 *Annual
311 *Cumulative
Additional Loans Made Due to Leveraging
312 *Annual
313 *Cumulative
314 *Cumulative Additional Loans as a % of Contributed Capital
Sustainability (Retained Earnings) Excludes Subsidy
318 *Annual
319 *Cumulative
320 *Cumulative Retained Earnings as a % of Contributed Capital
Subsidy Information from CBR as of Report Date
321 Grant Amount
322 Negative Interest
323 Principal Forgiven
324 * Total Annual Subsidy
325 * Total Cumulative Subsidy
Green Project Reserve (GPR) from CBR as of Report Date
326 Green Infrastructure
327 Energy Efficiency
328 Water Conservation
329 Green Innovative
330 * Total Annual GPR
331 * Cumulative GPR
* Calculated values.
Clean Water SRF Program Information
for the State of Delaware
For the Reporting Year Ending June 30 of:
2012 2013 2014 2015 2016 2017 2018 2019
567% 165% 102% 119% 89% 213% 752% 234%
151% 152% 145% 144% 141% 145% 162% 164%
5% 174% 6% 36% 92% 94% 285% 263%
78% 85% 80% 78% 79% 79% 89% 98%
740% 31% 1929% 110% 36% 173% 75% 27%
96% 86% 95% 95% 91% 94% 91% 82%
- - - - - - - -
- - - - - - - -
- - - - - - - -
2,054,492 1,766,560 1,682,065 2,195,585 2,539,084 3,075,698 2,294,783 3,406,841
24,617,976 26,384,536 28,066,601 30,262,186 32,801,270 35,876,968 38,171,751 41,578,592
11.2% 11.4% 11.8% 12.3% 12.6% 13.7% 14.1% 15.1%
0 0 0 0 0 0 0 0
0 0 0 0 0 0 0 0
278,940 1,677,650 590,000 0 306,120 0 0 3,538,805
278,940 1,677,650 590,000 0 306,120 0 0 3,538,805
10,213,490 11,891,140 12,481,140 12,481,140 12,787,260 12,787,260 12,787,260 16,326,065
450,000 1,593,000 340,000 0 2,751,860 4,124,042 -204,990 23,895,930
0 36,060,000 0 0 0 0 0 0
0 6,336,800 0 0 0 0 0 0
0 0 0 0 0 341,182 307,417 492,520
450,000 43,989,800 340,000 0 2,751,860 4,465,224 102,427 24,388,450
22,977,800 66,967,600 67,307,600 67,307,600 70,059,460 74,524,684 74,627,111 99,015,561
Page 67 of 67 10/31/2019