Embed Size (px)
Citation preview

1
DIFFERENCES IN PRC AND INDIAN TEXTILE AND APPAREL INDUSTRY RESPONSES TO THE
ELIMINATION OF THE MFA: DO CULTURAL DIFFERENCES MATTER?
By
Joseph Pelzman Department of Economics
George Washington University Washington, DC 20052
and
Amir Shoham Department of Business Administration
College of Management Rishon L’tzion, ISRAEL
September 1, 2010
JEL Code: F13; F14. JEL Keywords: Trade Policy; Country and Industry Studies of Trade.

2
ABSTRACT
The intent of this paper is to compare PRC and Indian responses to the elimination
of textile and apparel (T&A) quotas by the US. On the demand side, the paper estimate
whether or not PRC and Indian T&A items, formally under quota control, are substitutes or
complements in the US market. On the supply side, the paper focuses on institutional
differences between each country’s T&A sectors, the different domestic government policies
that have contributed to their growth and the unique cultural differences which will
determine the future progress in each country’s T&A sectors.
This paper’s findings are as follows. On the demand side there is very little
competition between PRC and Indian T&A items formerly under quota control. The
primary reason is that the Indian T&A sector is still under the illusion that low cost
producers will continue to dominate the market. The PRC in contrast has moved away from
this model to a model where they embrace a the complete value chain including developing
their own design and marketing links. While both India and the PRC have strong State
interventions the bias of the Indian policy makers has been to assure the employment
interests of their farmers and small scale textile industry at the expense of efficiency. The
PRC, on the other hand are far more interested in export led growth and thus have adopted
policies that do not have to satisfy short term constituencies. The end result from these very
different cultural perspectives is that India is no match for the PRC in this industry.

3
I. INTRODUCTION
International trade in textiles and apparel has, as of January 1, 2005, been set free
from the very intricate Multi-Fiber textile and apparel quota Arrangement (MFA). This
event has raised many uncertainties about the new international trade climate and has placed
enormous pressure on the Peoples Republic of China (PRC) as the expected clear cut
beneficiary of this liberalization.1 Other countries considered to be major contenders
include India which also has a large population employed in the textile and apparel (T&A)
sector. Since the old quota system had provided a certain degree of market certainty to
competing T&A producers, will the new free trade environment lead to a shake out where
mass producers with large economies of scale dominate the new reality?
The removal of T&A quotas will create opportunities for India and the PRC along
with other developing countries, but it will also expose them to additional competition from
each other. The outcome of this competition will depend on the demand in the US, the
ability of the exporting countries to differentiate their exports and on their ability to transfer
1 The PRC is currently the major exporter of apparel products. In 2000, it accounted for roughly 18% of total
world trade in apparel, double its 1990 performance; garments in 2000, up from 9% in 1990. The PRC is the
largest supplier of apparel products to the EU and Japan, and the second largest to the US market.
Expectations are that with the demise of the MFA, the PRC’s market share of the EU and US markets will rise
substantially above its current rate of 14 and 11 percent, respectively. The PRC’s export potential is seen by
other developing countries as a source of crowding out. This concern may be overstated because the PRC’s
apparel products have increased in quality far more than its competitors, its export prices are much higher than
its competitors, and its labor costs are rising far more than its competitors.

4
additional resources to expand domestic output in the direction of the new ‘free market
signals’ and away from rent seeking objectives. Obviously, exporting countries that adjust
to this new environment quickly will improve their competitiveness, and will be the new
beneficiaries of a quota free international trade in textiles and apparel.
The intent of this paper is to compare PRC and Indian responses to the elimination
of T&A quotas by the US. On the demand side, the paper estimate whether or not PRC and
Indian T&A items, formally under quota control, are substitutes or complements in the US
market. On the supply side, the paper focuses on institutional differences between each
country’s T&A sectors, the different domestic government policies that have contributed to
their growth and the unique cultural differences which will determine the future progress in
each country’s T&A sectors.
The specific textile and apparel items to be compared are based on the pre-2005
quota limits where both India and the PRC were constrained. The full list of the PRC
products under quota control includes 77 three digit T&A categories divided by fiber
between fabric, textiles and apparel. The full set of Indian products under quota control
which intersects with the PRC product list includes 57 three-digit categories. The full list is
presented in Table 1. For this paper the review of Indian and PRC product competition is
restricted to this list of 57 categories.
The paper is divided into the following sections. A brief description of the post
1995 agreement on T&A is presented in Section II. Section III presents the methodology we
adopt in order to estimate the demand side competition between the PRC and India. The
results presented in that section include own- and cross- price elasticities across the
subgroup of products where there is competition on the demand side. Section IV focuses
on a comparison in the supply side responses between the PRC and Indian T&A sectors. It

5
is in this section that we try to isolate the cultural elements ingrained in the economic data.
Concluding remarks are presented in Section V. The appendix describes the data sources.
II. THE AGREEMENT ON TEXTILES AND CLOTHING AND THEREAFTER
The Agreement on Textiles and Clothing (ATC) was designed to eliminate the MFA
quotas system by the year 2005 and to integrate textiles and apparel trade into the WTO
regime. The governing paradigm has been that immediately after the removal of the MFA
quota system PRC T&A exports would grow exponentially. However, what analysts ignored
was that in the case of the PRC, the shift to a quota free world did not make it free and clear
in the case of the US. When the PRC acceded to the WTO they had to sign a separate
bilateral Memorandum of Understanding which assured the U.S. of a unique bilateral
consultation mechanism to remain in effect for four additional years beyond the end of
quotas for the rest of the WTO countries (through December 31, 2008).2 These more
2 The Memorandum of Understanding regarding PRC’s accession to the WTO was signed on February 1, 1997.
Listed under paragraph 242 of the Report of the Working Party on the Accession of China to the World Trade
Organization (Accession Agreement), the United States (and any other WTO member country) is offered the
right to institute a safeguard measure on textiles and apparel of Chinese origin that, due to a market
disruptions, are threatening to impede the orderly development of trade. Procedures for Considering Requests from
the Public for Textile and Apparel Safeguard Actions on Imports from China, The Committee for the Implementation of
Textile Agreements, Federal Register Vol. 68, No. 98, pg 27787. Upon receipt if the request, China has agreed
to hold its shipments to a level no greater than 7.5 percent (6 percent for wool categories) above the amount
entered during the first 12 months of the most recent 14 months preceding the request for consultations.
6
extensive “safeguard” measures between the US and the PRC provides the US with rights to
re-impose quotas under specified circumstances.3
This measure has been used, since 2003, four times by the United States. In 2003,
three categories4 had one-year restraints placed on them. In 2004, one category underwent
the same procedure and twelve categories were petitioned.5 In the first 6 months of 2005,
ten categories have been petitioned and now are open to public comment. The first category
in 2003 to have restraints returned to it was Category 222: Knit Fabric. The United States
established at 12 month limit on PRC origin knit fabric not to exceed 9,664,477 kilograms.
The reasons cited in this case became the benchmark for all subsequent cases that came to
the Court of International Trade (CIT). In this case, it was shown that U.S. imports from
the PRC were increasing in absolute terms, U.S. imports from the PRC were increasing
rapidly relative to other imports, the PRC average unit values were well below values from
other countries, U.S. imports from the PRC were likely to increase greatly, and that the U.S. 3 This safeguard mechanism allows the U.S. to seek to extend quotas with the PRC for specific goods where
the elimination of such restrictions would result in “…market disruption, threatening to impede the orderly
development of trade between the two countries.” See United States International Trade Commission. 1999.
Assessment of the Economic Effects of China’s Accession to the WTO. Investigation No. 332-403, Publication 3229.
Washington, DC: USITC.
4 Textiles and apparel are grouped into categories based on what product they are (i.e. wool socks, knit fabric,
etc). These are given a three digit identification number that relates directly to the 10 digit harmonized tariff
schedule of the United States.
5 The 12 cases had an injunction placed on them in the Court of International Trade that was lifted May 5,
2005.

7
knit fabric industry was vulnerable to any increase in imports. Like knit fabric, the other
categories in front of the CIT have been petitioned for harm to domestic industries or threat
thereof. In 2004, Category 222 was petitioned again, but was grouped into the twelve cases
under injunction. Like knit fabric, the other categories in front of the CIT have been
petitioned for harm to domestic industries or threat thereof. Cross Category 350/650, man-
made fiber dressing gowns and robes, announced bilateral negotiations with the PRC in 2003
for similar reasons to Category 222. U.S. imports from the PRC were increasing rapidly in
absolute terms, U.S. imports from the PRC were increasing rapidly relative to other imports,
PRC average unit values were well below average of other countries, U.S. imports from the
PRC were likely to increase in the near future, and the industry was very vulnerable to any
increase in imports.
In 2005, the ten cases open for public comment, plus the twelve that were under
injunction, were being petitioned for the same reasons. The CIT is now confronted with the
option of potentially granting 22 safeguards on PRC imports, or none at all. The court will
review data presented to it in the same manner as before, along with the public comments
that are submitted, and make a decision based off of that information. However, the Office
of Textiles and Apparel (OTEXA), CITA, and the Department of Commerce as a whole,
now must decide how they will guide the future of PRC T&A imports. The cases have taken
on a broader role as indicators of trade measures and protectionist policy for the United
States in regard to textile and apparel imports. It is important to note that the CIT has and
will act, for as long as deemed necessary, as a mechanism to prevent rapid surges in T&A
imports from the PRC. It is also likely that these cases and negotiations with the PRC will

8
eventually result in a broader agreement, such as a voluntary export restraint, export taxes6,
and more, that will be satisfactory for both the United States and the PRC.
III. ESTIMATING THE IMPACT OF QUOTA REMOVAL: METHODOLOGICAL CONSIDERATIONS
How will the volume and composition of Chinese and Indian exports to the United
States change as a result of increased market access? To date what we have are projections
unanimously expecting PRC domination and US litigation under the guise of market
disruption. A recent WTO study (August 2004) predicted that the PRC would increase its
share of the U.S. textile market from 11 percent to 18 percent after quotas were eliminated,
and would boost its apparel market share from 16 percent to 50 percent. A similar
projection for India is not as upbeat. The major difference is accounted for by the
institutional differences between the two countries.
Methodological Issues:
The most important characteristic of textile and apparel quota system was that it was
an ex-post set of trade restrictions imposed on a subset of developing countries on a subset
of three-digit T & A categories which are fiber based with room to borrow across categories
and time. These restrictions, while binding in most cases, created a rent seeking cycle for
exporting producers who took advantage of the restrictions and the accompanying quota
6 Export taxes are already utilized by the Chinese government. They were implemented on January 1, 2005 in
order to set a price floor on textiles and apparel. Duties range from 0.2 to 0.5 yuan per piece and have been
applied 148 tariff lines, including the most sensitive categories such as coats, shirts, pajamas, etc.

9
licenses. It also encourages upgrading and a shift of domestic resources to a set of products
whose sales are pre-determined. In many cases both the domestic competition in importing
countries and the exporters in developing countries shared the benefits of higher prices.
The controlled markets for a specific T & A category can be seen in Figure 1. The
introduction of a quota limit turns the supply curve to a perfectly inelastic portion.
The quota free equilibrium occurs at point A, where the import price is tariff inclusive.
Equilibrium at point B is after the imposition of the quota. The price gap is the effective
quota rent that will be removed with the demise of the MFA. Tariffs are unaffected by the
new trading regime.
With all other things held constant, an elimination of the quotas on T & A imported
from the PRC and India will cause US imports to increase as US buyers substitute the now
lower-priced uncontrolled foreign goods for US substitutes (trade creation) or US imports
from other countries (trade diversion). The total expansion of US imports from either the
PRC or India would be the sum of the trade creation and trade diversion effects. Since our
B
A
SC
DC
PW (1+t)
Figure 1: Controlled Market
PW (1+t) (1+q)
SC
Quantity Q1 Q2

10
concern, on the demand side, lies in determining changes in Indian or PRC dollar earnings
resulting from expanded exports to the United States, total trade expansion (or gross trade
creation) will be measured.
The partial equilibrium approach mentioned above can be described by a system of
demand and supply equations for the two beneficiary countries and the United States. Let
the United States be denoted as country i and are two beneficiary countries as j, where j =
1,2. Then a series of equations for trade in k three-digit categories (k = 1,….,K) can be
described as follows:
( );Dik ikM f P (1)
;D Wik ik ik jkP t P (2)
( );Wjk jkX g P (3)
;ik jkM X (4)
,Wjk jk jkR P X (5)
where M is the quantity of US imports, X is the quantity of beneficiary country exports, DikP
is the domestic US price for commodity k, WjkP is the world market price assumed to be the
price at which India and PRC export to the United States, t is one plus the ad-valorem MFN
duty rate (T) applied by the United States, δ is one plus the ad-valorem tariff equivalent of
the quota estimated by the price gap in figure 1, and R is the beneficiary country’s export
revenue on products exported into the United States.
Totally differentiating equations (1) through (5) and solving for the proportional
changes in imports, export prices, and revenues yields:

11
;(1 /
ikik ik
ik ik
Me
(6)
;( )
Wik
jk ik
ik jk
Pe
(7)
(1 ),
( )jk
jk ikikjk ik
eR
e
(8)
where η is the relative price elasticity of import demand, e is the export supply elasticity, and
ˆ denotes percent change.
Within this partial equilibrium framework, export flows, import flows, and export
revenues are each a function of the percentage change in relative prices due to the
elimination of quotas and the elasticities of import demand and export supply. From the
perspective of India and the PRC, as long as the US import demand is elastic, each country
will gain if their products are sufficiently differentiated and their export supply elasticity is
infinite. In the event that their supply elasticity was zero, each exporting country suppliers
would simply receive the amount of the quota rent as added profit.
In order to derive empirical estimates of the effects of MFA elimination on these
two beneficiary country exporters using the model described above, several things would be
needed. To determine the responsiveness of U.S. buyers and Indian and PRC sellers to
removal of the quota premiums on goods imported from these countries, reliable estimates
of U.S. import demand and Indian and PRC export supply elasticities would be required. In
addition, it would be necessary to make assumptions about the potential price response by
Indian and PRC exporters to a change in U.S. import quota equivalent duties. If the
individual country suppliers perceive the market as being less than competitive, then they
may pass through all, some, or none of the duty equivalent reduction to U.S. buyers by

12
maintaining export prices unchanged, raising them by a fraction of the tariff equivalent of
the quota elimination, or raising them by the full amount of the quota rent. In sum, an
estimate of the total trade expansion will depend on the U.S. import demand elasticity, the
export supply elasticity and pricing strategy of the two beneficiaries, the magnitude of the
change in U.S. tariffs equivalents of the quota, and the current volume of U.S. imports from
the region.
Using the detailed three-digit textile category data covering the 1995-2004 period for
57 categories where the PRC and India compete we first proceed to estimate the import
demand equations for the PRC and India. In this way we estimate the own price elasticities
of demand, the cross price elasticities for India’s competition with the PRC, and that of the
aggregate uncontrolled market. Estimates of PRC and Indian supply elasticities are not
estimated but are relegated to a discussion of each country’s T&A sectors and the applicable
institutional and cultural factors.
The relative sensitivity of equation (8) to the elasticities used can be seen from the
following scenarios of changes in exporters’ revenues that might occur for different
magnitudes of the demand and supply elasticities:
Demand Elasticity
(η)
Supply Elasticities (e)
0 0.5 1 2
-.5 34 2
3 35 1
2
-1
-2 65 4
3 32 2

13
It should be clear, therefore, that a slight modification in the elasticities will bring about a
major change in the estimated results.
Empirical estimation:
In order to address the question of competition between the PRC and India we first
have to establish that on the demand side their T & A products are either compliments or
substitutes. In order to accomplish this we estimate an import demand equation for each of the
57 three-digit T & A categories for the PRC and for India. Each of the demand equations is
specified as a function of its specific market price, the price of an identical three digital category
from the alternative market, the world uncontrolled market price, the domestic price of a
competing good, and a real activity variable, or
0 1 2 3 4 5C j I j W j D j
DM = + + + + + P P P P E
i j (9)
where M = quantity of import demand for commodity j from i (PRC or India); PCj = import
price from the PRC; PIj = import price from India; PWj, = average uncontrolled world market
price of imports; PDj = domestic price of the competing product; E = real activity variable; and
μ = random error term. Since there are two differentiated regions, there are two import
demand equations that depend on all three prices over time.
This Armington (1969) specification of the import demand equations requires the
following set of assumptions. First, it is necessary for these import demand equations to be
weakly separable between textile and apparel products and other products which enter the
consumer's utility function. In effect, each of our products is treated as a distinct good with
imperfect substitutes differentiated by country of origin. Second, Armington's two step process
assumes that the marginal rate of substitution for any two products (differentiated by source) is

14
independent of the quantities demanded of third goods entering the consumer's utility function.
This assumption of a zero income compensated cross price effect between textile and apparel
goods and third goods. It means that a change in the price of this third good will have an
impact on the demand for textile and apparel imports, but only when it has an impact on real
expenditures. The restrictive nature of this assumption, if violated, may result in a
misspecification bias in our estimated import demand equations.7
While Armington's assumptions may be reasonable for textile and apparel end
products, they may present a problem for some of the intermediate textile products. In the case
of intermediate imports, such as yarn and fabric, the import demand equations noted by
equation (5) are, in fact, derived demand functions. The assumption of independence between
the marginal rates of substitution of different classes of intermediate inputs, such as man-made
fibers for cotton or vegetable fibers for both may represent a problem. In these latter cases the
import demand equations will include the prices of all possible substitutes. Omission of these
prices clearly will cause the import demand equations for the intermediate textile imports to be
misspecified.
Table 2 presents the OLS estimates for US import demand of T&A products from the
PRC, and Table 3 presents the results for India. The overall conclusion that one can draw from
these results is that out of a total of 57 three digit categories where competition is possible,
there are only five categories where the cross price elasticity of a change in India’s prices on US
imports from the PRC is significantly different from zero. In category 237, playsuits, sunsuits,
etc, for every 1 percent increase in India’s price US imports from the PRC would rise by .86
percent, a substitute product; in category 300, carded cotton yarn, for every 1 percent increase
7 For a discussion of the theoretical implications of the weak separability assumption, see Winters (1984).

15
in India’s price US imports from the PRC would fall by .63 percent, suggesting
complementarity; in category 336, cotton dresses, for every 1 percent increase in India’s price
US imports from the PRC would fall by .95 percent, suggesting complementarity; in category
345, cotton sweaters, for every 1 percent increase in India’s price US imports from the PRC
would fall by 1.30 percent, suggesting complementarity; and in category 642, MMF skirts, for
every 1 percent increase in India’s price US imports from the PRC would fall by .61 percent,
suggesting complementarity. In the other 52 product categories there was no statistically
significant cross price elasticity between a movement in India’s prices and US import demand
from the PRC.
When we estimate US import demand from India and ask what would be the partial
equilibrium impact of an increase in PRC prices we get almost the same results. Out of the 57
total possible cases where there can be some competition on the demand side, there are only
three cases where the cross-price elasticity is significantly different from zero. In category 218,
fabrics of yarns of different colors, for every 1 percent increase in PRC’s price US imports from
India would fall by 1.41 percent, suggesting complimentarity; in category 348, W/G Cotton
trousers/slacks/shorts, for every 1 percent increase in PRC’s price US imports from India
would rise by 2.12 percent, suggesting a substitute product; and in category 642, MMF Skirts,
for every 1 percent increase in PRC’s price US imports from India would rise by 1.22 percent,
suggesting a substitute product.
Overall, these results confirm the hypothesis found in the industry that the PRC and
India compete in apples and oranges. When one digs deeper into the trade and price data, one
observes that US imports from the PRC tend to be more expensive than comparable three-digit
T&A categories from India. Given that there is no head to head competition between these
two suppliers what is the probable outcome on the supply side?
16
IV. THE SUPPLY SIDE RESPONSE IN TEXTILES AND APPAREL: ECONOMICS & CULTURE
During the long history of the MFA, the search for low wage producers was a key
explanatory variable for the world’s distribution of quotas. In the past decade, this has
changed drastically. The primary ingredient for a successful T & A sector is quick
turnaround time for apparel and economies of scale for textiles. In the apparel segment of
the industry, which is considered by many to be fashion-oriented, time sensitivity is even
more crucial. While the low-wage sewing provides some competitive advantages to
developing countries, it is only applicable to the assembly process of low end garments and
does not necessarily lead to the development of a sophisticated T&A sector. The PRC,
which represents the higher end T&A industry, has managed to combine its export-led
strategy in T&A with the development of higher value-added segments of the supply chain.
This was achieved by integrating scale economies with diversification of its labor pool,
upgrading domestic skills in local design, material sourcing, quality control, logistics and
retail distribution.
The industries in each country are affected by the culture of that country because
culture impacts how people think and react. House et al, (2004, p1) writes "As economic
borders come down, cultural barriers will most likely go up and present new challenges and
opportunities in business. When cultures come into contact, they may converge on some
aspects, but their idiosyncrasies will likely amplify". There are numerous studies that support
the hypothesis that national culture has impact on the economy and business. For example
cultural differences between subsidiaries and HQ in MNC's impact the probability for
sending expatriates to manage subsidiaries (Richards, 2001; Boyacigiller, 1990). There is also
evidence that culture influences foreign trade (Guo, 2004). The T&A industries in the PRC

17
and India are no different, so we see culture as one more factor that can explain part of the
differences between the Indian and PRC industry structure.
One of the major research studies on national cultural differences in the
International Business field that was published by Hofstede (1980; 1983). It is based on
research conducted on individuals from 50 countries, using 116,000 questionnaires. The
questions demonstrated the differences among countries in four cultural dimensions: Power
Distance Index (PDI), Individualism (IDV), Masculinity (MAS) and Uncertainty Avoidance
(UAI). Hofstede and Bond (1984; 1988) discovered a fifth dimension, named Long-Term
Orientation (LTO). Hofstede's culture dimension are still a key layer in culture evaluations
and empirical tests (Crotts and Erdmann 2000; Downey et al. 2005; Dwyer et al. 2005).
Hofstede measures continue to enjoy strong support among researchers (Sivakumar and
Nakata, 2001) and serve as a de facto set of benchmark measures. Figure 2 shows the scores
of the five culture dimensions for the PRC and India.

18
Figure 2:
Hofstedes Five Cultural Dimensions for the PRC and India
As can be seen from Figure 2 the PRC and India have a significant difference in the
LTO and the IDV dimensions.
Long-Term Orientation (LTO) focuses on the degree the society embraces, or does not embrace
long-term devotion to traditional, forward thinking values. High Long-Term Orientation
ranking indicates the country prescribes to the values of long-term commitments and respect
for tradition. This is thought to support a strong work ethic where long-term rewards are
expected as a result of today's hard work. Business people in long-term oriented cultures are
accustomed to working toward building strong positions in their markets and do not expect
immediate results.

19
Individualism (IDV) focuses on the degree to which society reinforces individual or collective,
achievement and interpersonal relationships. IDV has to do with the extent to which the self
or, alternatively, the group, is the prime social identifier (Hofstede, 1997). In individualist
cultures, job specialization, personal achievement, personal accountability, and performance
based evaluation are pronounced, with people considering themselves as independent and
autonomous; A Low Individualism ranking typifies societies of a more collectivist nature
with close ties between individuals. These cultures reinforce extended collectives where
everyone takes responsibility for fellow members of their group. there emphasis is placed on
group coordination (Very, Lubatkin, and Calori, 1996), non-monetary rewards, and stable
group membership (Hofstede, 1997), coupled with group decision-making and job design
maximizing the social aspects of the job (Gelfand, et al., 2004).
The information reported in Figure 2 shows that the PRC with a much higher value
on the LTO dimensions then India; the PRC score is 118 and India's score is just 61. The
PRC score in the LTO dimensions is the highest in the world. Other culture researches that
are less quantitative also emphasize the long term behavior characteristic of the PRC. (Chen,
2001). We expect to see the PRC’s supply chain in the T&A industry to possess a more
long term strategy of development, organization and growth then the supply chain of the
T&A industry in India.
The culture data also supports the notion that the PRC is a more collective culture
then India. The PRC ranks lower than any other Asian country in the Individualism (IDV)
dimension. As can be seen in Figure 2 the PRC scored 20 on the Individualism dimension as
compared to India which scored 48, meaning that the PRC is substantially a more collective
society as compared to India. Other researches have found similar results of high collective

20
culture in the PRC. [Pye (1992)] This finding could be partly attributable to the Maoist
ideology which praises the group interest above self-interest [Yeh, (1989); Weldon and Jehn,
(1992)].
From the culture perspective this is the factor that can partly explain the variance
between the two countries. We expect to find a more organized, long term strategic planed,
concentrated and monopolistic market in the T&A supply chain industries in the PRC as
compared to that in India.
In describing the supply side responses of India and the PRC resulting from the
elimination of quotas, one needs to appreciate the fact that what is called the T&A sector is
composed of a chain of separable activities. This linear chain of production functions starts
with agriculture where we have the initial fiber stage.
Cotton Fiber
Textiles are produced by both natural and man-made fibers. In the natural fiber side,
a country’s potential comparative advantage is affected by the traditional factor endowment
availabilities, e.g. land, climate, and by domestic internal subsidy programs, e.g. cotton. In
the synthetic fiber area, the industry is a derivate of chemical producers. Economies of scale
in this sector have traditionally benefited the developed countries.
In the case of the PRC, cotton is regarded as a “strategic” commodity.8
Consequently, every aspect of cotton from production, internal and external sales, and firm
consumption are part of a complex set of State interventions. Despite the PRC’s openness
with respect to international trade, the central government had until 1998, determined
cotton’s procurement prices and resale prices and established a State monopsony/monopoly
8 For a detailed discussion of the PRC’s domestic and international policies with respect to Cotton, See OECD
(2005).

21
(the Supply and Marketing Cooperatives (SMCs)) as the sole agent for purchasing cotton
from the rural sector. From 1985 to 1998, cotton farmers where obligated under a
production “contract” to supply the SMC with a certain quantity of cotton at the planned
procurement price; they could also sell any above-quota quantity of cotton to the SMC. The
introduction of market reform, decentralized purchases and direct links between producers
and consumers of cotton did not begin in earnest till the late 1990s.
Beginning in 1996, SMCs were allowed to trade cotton directly with local textile
mills. This decentralized linkage system still had a local constraint in that the tradable
quantities were still bound by assigned quotas for importing and exporting regions.
Furthermore, the definition of a market price actually meant that the two parties to a trade
were allowed to decide the terms of trade within a very limited price band of ±4% of the
state-set cotton allocation price.
As of September 1999, cotton prices in the PRC are to be determined by market
forces, while the government issued a minimum price at the end of the year. These
minimum prices serve as purchase prices for the SMCs, who as of 1999 no longer have
exclusive rights to purchase cotton from producers, but do purchase stocks of cotton for
special reserve holdings by the State. These reserves along with rules for international
purchases of cotton are designed to stabilize local cotton prices, the major input into the
textile industry.
The role of the State is very much part of the PRC’s external arrangement with
respect to cotton, as well. Trade in cotton, despite the PRC’s accession to the WTO is still
dominated by a State Owned Enterprise (SOE) - China National Textiles Import and Export
Company (Chinatex.). As part of the WTO accession process the PRC introduced a tariff
rate quota system where there was an in-quota tariff of 3% and an over-quota tariff of 90%.

22
This distortion combined with the role of SOEs as purchasing agents guarantees a limited
role for international market prices to affect the local cotton industry. This may change as
the PRC begins to reduce the role of SOEs to a third of the volume of trade.
In contrast to the PRC’s use of price and trade controls to encourage the
development of a large scale cotton industry in regions as far away as Xinjiang, India’s
government policy affecting cotton and textiles was designed to promote small scale
production and fragmentation.9 The Government of India, in order to assure employment
at the smallest locality put in place policies and regulations to ensure that mechanization did
not occur and that labor-intensive textile production was the predominant industrial
structure in the cotton textile area. These inefficient producers were primarily supported by
a subsidized price for cotton supplies.
Unlike the situation in the PRC, cotton is the predominating fabric used in the
Indian textile industry – nearly 60% of all overall consumption in textiles and more than
75% in spinning mills is cotton. Despite the heavy reliance on cotton, Indian cotton
production has been falling due to inefficiencies in the many of the growing areas.10 The
Indian cotton sector is controlled by the Government through the maintenance of low
9 One should not lose sight of the fact that as a result of the partition of India and Pakistan, India lost its major
cotton belt while retaining the country's major textile centers.
10 Despite India’s reliance on Cotton as its major textile fiber, India’s cotton productivity is very low by
international standards. The average yield of irrigated cotton in the Northern Region during 1991-92 to 1993-94
was less than or close to half of the other major irrigated cotton producers in the world, including China, Egypt,
the United States, and Uzbekistan. Rainfed cotton yields in Maharashtra and the Central and Southern regions are
likewise considerably lower than the mostly rainfed cotton yields in Brazil. See World Bank, 1999.

23
government procurement pricing, control of seed pricing, assured the development of a low
quality cotton production.
One of the problems facing India early in its development was the trade off of
exporting cotton versus upstream products like yarn or textiles.11 With expanded output of
cotton, India found itself to be an exporter of cotton. Since more than half of the
production cost of cotton yam is cotton, Indian planners thought that providing inexpensive
cotton to the domestic spinning industry and by restricting its exports this would eventually
allow cotton yarn to develop. Along the same logic path, it was thought that restricting
cotton yarn exports would develop the downstream cotton weaving industry in the long-run.
Because of its intention to control the market directly, the government chose to use quotas
rather than taxation to increase the supply of inexpensive cotton to domestic spinning mills,
and, hence cotton yarn to weavers. At the same time that the Government of India
suppressed cotton prices by restricting exports, the government attempted to negate the
impact on farm income through a series of ameliorating measures including income tax
exemption, subsidized electric power rates, fertilizer and herbicides. Despite the fact that
India has by far the largest acreage of cotton cultivation in the world and is the only country
11 The number of households who cultivate cotton is around 5 million, the total number of the cotton farmers
is estimated to be around 10 million. This is a substantial voting block. It is not surprising that Indian cotton
policy has been so skewed. Cotton farmers are politically even more influential in the states where the
economies are more dependent on cotton. In particular, politics in the states of Maharashtra and Gujarat are
very sensitive to cotton interests. The now defunct cotton procurement price scheme was born in this region.

24
to produce a full range of varieties of nearly all staple lengths, its cotton production remains
among the least productive in the world.12
This set of distortions has created a perfect price wedge assuring continued exports
of Indian cotton. In the past few years, the difference between nominal domestic Indian
cotton prices and export prices has been around 15 per cent (Pursell and Gupta, 1996).
Compared to this, the margin left for traders after deducting sales tax and transportation
costs is only about 0.5 per cent in the domestic cotton market. A further incentive to export
cotton is the uncertainty of receiving payment from local spinning mills. Due to the poor
financial situation of many domestic cotton spinning mills, sales based on a line of credit is
considered to be fairly risky in India. Exporting cotton is far less risky since payment is
guaranteed by a letter of credit on the importing side upon delivery of loading at an Indian
port. When you add to this price certainty a further Indian government incentive of
exemption from income tax the returns to exporting cotton are far larger than continued
sales.
The possibility of an expanded demand for textiles in a quota free world will most
likely mean that India’s cotton producers would have to fight against these incentives to
export unprocessed cotton and/or import, a growing share of its cotton from the
12
Production and Average Yield of Cotton in the WorldCountry Production
(million ton) Area
(thousand ha) Yield
(kg/ha) Israel 27 16 1,697 Australia 329 260 1,266 Turkey 580 559 1,039 China 3.739 4,985 750 USA 3.515 5,173 679 Egypt 411 371 538 Pakistan 1,312 2,804 468 India 2,085 7,315 286 World Total 16,673 30,527 546 Source: ICAC (1994).

25
international market, thus imposing higher costs to the inefficient and small scale textile
producers. Add to this the failure of Indian farmers to adequately treat their cotton products
from infestation and you have a recipe for cotton price inflation.
Despite the appearance of similarity in the general use of government intervention in
both the PRC and India, whose index of Individualism is low, (20 and 40, respectively) the
objective function of the two governments is very different. While in India, the emphasis
was on an attempted poverty reduction based on supporting small scale household
production which proved to be inefficient, the PRC’s policy was designed to support export
led growth and thus use its intervention to assure the domestic availability of cotton in
sufficient quality and availability. While the PRC’s intervention has created a great disparity
between the incomes of rural and urban areas, India’s policy has not lowered the enormous
rural poverty by maintaining small scale inefficient cotton farming. Consequently, India’s
cotton sector will not be able to respond positively to increased demand from a quota free
international market.
Textiles
The textile mill products sector of the textile industry includes all operations that are
involved in converting fiber to finished fabric and the production of many non-apparel
consumer products. Technological innovations have greatly increased the speed of
operations and resulted in huge productivity gains. Traditionally the developed countries
have innovated more in this segment of the industry. The PRC has not lagged far behind.
However, non-clothing applications of textiles – the so-called “technical textiles” – are now
more important than clothing applications and account for the fastest-growing segment of
total textile production in developed countries.

26
It is generally understood that in markets like the United States, the textiles sector
makes fabric in three steps that are often made by different factories. The first step is
spinning fibers into thread or yarn, the second is weaving or knitting thread or yarn into
fabrics and the third is chemical processing to finish the fabric. In addition, there are non-
woven fabrics that are produced by mechanically, thermally or chemically bonding or
interlocking fibers, filaments or yarns. These processes in the United States are highly
capital-intensive and are subject to economies of scale.13 Having said that, we still have in
many developing countries, textile industries that are utilizing very simple technology within
the household or in micro-enterprises. In the new quota free world, these latter small-scale
producers are destined to expire.
After the PRC received MFN status in the US in 1979 a whole set of domestic
reforms were initiated to induce domestic PRC producers to enter the global market. These
incentives were not only important for the success of the PRC in the textile industry it also
introduced new forms of corporate governance which has enabled the PRC to compete in
the Textile sector with developed countries like the United States. The primary institutional
shift was a set of reforms that allowed the rural companies to form alliances with the State-
owned enterprises (SOEs), enabling the new corporate form to take advantage of a merger
of cheap rural labor with high investments in new technology in the textile industry SOEs.
According to the OECD, the PRC textile and apparel sector continues to receive a
sizeable share of total state subsidies from the central government. It is estimated that the
percentage of the total subsidies that the central government granted to textile SOEs rose
from 1.61 % in 1990 to 20.57 % in 1998. The PRC’s central government intervention in the
Textile industry does not depend only on price incentives. It also involves setting
13 See Pelzman and Martin (1981) where estimates of textile and apparel production functions are presented.

27
performance targets. In order to appreciate the importance of Central Planning to the
development of this industry one need only review the goals established for textiles in the
Tenth Five-Year Plan (2000-05) seeking to upgrade the value added of textiles.
The following goals were contained in the Tenth Five-Year Plan for 2000-2005:14
1. Increasing the value added of the sector from 267.8 billion Yuan in 2000 to 430
billion Yuan in 2005, or an increase of 60.6 %.
2. Increasing the production volume of textile fiber from 12.1 million tons in 2000 to
14.25 million tons in 2005, and increasing the apparent consumption per person
from 6.6 kgs. to 7.4 kgs. for the same period.
3. Increasing exports from 52 billion dollars in 2000 to between 70 and 75 billion
dollars in 2005.
4. Increasing labor productivity from 25,000 Yuan per worker in 2000 to 35,000 Yuan
in 2005.
5. Reducing energy consumption for every 10,000 Yuan of production by 15 %.
6. Using recycled water in production for 30 % of current consumption by 2005; in the
prints sector, reducing water consumption for every 100 meters from 3.6 tons to 3.0
tons.
In order to reach the goals that have been set, the PRC government provided a
stable area for growing cotton. It guaranteed the textile industry that it would supply 4.5
million tons of cotton annually. It provided incentives for technological progress by
fomenting alliances between companies and research centers and establishing development
centers for the large SOEs.
According to the USITC, the PRC Textile industry in 2000, had 18,900 SOEs with a
sales volume higher than 5 million yuan; with total assets of 977,300 million yuan, which
generated tax revenue of 267,800 million yuan in value added taxes and which represented
14 See USITC. 2004..

28
11.9 %, 8.3 % and 11.3 %, respectively, of the entire manufacturing industry. Employment
in Textiles was around 13 million.15
Since the mid 1990's the PRC accounted for more than 25 % of the global spinning
machines (USITC 1999).16 This share has increased substantially in the past ten years.
Furthermore, the industry created both forward and backward linkages integrating a large
number of production segments namely, cotton and other fibers; accessories; thread, yam,
and textile manufacturing; and the processing of these products into garments, rugs, and
industrial textiles (USITC 2004). The PRC now has the national and global supply and input
companies necessary to make almost all products. This is not the case for India.
The current textile market requires rapid turnaround. The differences between the
PRC and India are even more apparent here as well. During the past two decades the PRC
developed a highly competitive maritime transportation system, ensuring that its products
arrive on the East Coast of the United States between 12 and 18 days from boarding, while
its competitors in India may take three times as long to arrive. (USITC 2004).
The Indian textile industry which is domestically oriented is composed of the
organized mill sector (traditional weaving and spinning), the powerloom sector (mechanized
looms) and the handloom sector which remains the beneficiary of years of inconsistent
15 Ibid., The total workers in Textiles and apparel has been estimated by the ILO to be 19 million or
approximately 22 percent of all manufacturing sector employment. According to the ILO another 80 million
people are directly linked to this combined sector. The number of Apparel companies are estimated to be
40,000 of which only 6 percent are SOEs. We do not have current estimates of apparel sector employment.
16 Ibid., In 2002 China had around 22.8 % of all spinning machines and had acquired more than 50 percent of
them during 2000-2002.

29
government policy, bias against mechanization and aversion to the introduction of
economies of scale and export led growth. If one were to set up a cultural variable to
explain the difference between the PRC’s government and that of India in this area it would
be the degree of democratization and constituency politics. India which could be considered
a “socialist democracy” has had to deal with various competing constituencies and has had
to appease the most vocal - including farmers, organized labor and business representatives.
The PRC on the other hand, has a centralized government with market orientation. It can
transfer long-term views to its public without having to meet short-term demands from
competing constituencies. The latter can therefore focus better on export-led growth
policies with an expectation that welfare improvements will eventually confirm this
economic direction. In the case of the PRC the end result has justified the 20 year
investment in export led growth.
A major defining characteristic of the Indian Textile industry is its great similarity to
the socialist variety that one used to find in the former Soviet Union and East Europe in the
1980s. The industry is composed of both outdated and inefficient vertically integrated
Soviet style SOEs that are always in the process of privatization, and a variety of small and
medium sized (SMEs) that are struggling to find niche markets. In addition, the Indian
government, until the early 1990s, insisted on following a bankrupt model of import
substitution and an emphasis of protecting local textile workers. Exports were consequently
treated as in the FSU, an outlet for surplus merchandise. The enormous domestic labor pool
demanded policies which assured full employment. This produced a series of domestic
measures and regulation favoring labor employed by handlooms but discriminating against

30
composite mills.17 Restrictions on mechanization and on expansion of loom capacity in the
1950s, price controls and lower tax rates for handlooms in the 1960s and 1970s created a
long-term distortion in the mindset of textile entrepreneurs. This bias when added to the
Indian Government concern for adequate access by the poor to their cotton clothing
translated into a heavy tax burden on manmade fiber, licensing to restrict entry of more
competitive producers.
The last decade has seen a progressive relaxation of distortionary policies imposed on
the textile industry and a greater emphasis on improving efficiency and competition. The three
domestic policies adopted by the Indian government to reduce domestic restrictions on the
industry were the Textile Policy of 198518 and The Statement of Industrial Policy of 199119 and
the Textile (Development and Regulation) Order of 1992.20
17 This discrimination was found in Factories Act of 1948 which enforced employment rigidities and increased
labor costs on non-handloom textile producers.
18 The 1985 Textile Policy (i) dismantled the sector approach to the industry, while retaining a special role for
handlooms; (ii) adopted a multi-fiber orientation and fiber flexibility; (iii) provided adequate raw materials at
reasonable and stable prices; (iv) reduced the level of duties on synthetic raw materials; (v) easing entry and exit
barriers; (vi) emphasized modernization and technology and machinery imports at international prices; and (vii)
attempted to make Indian textiles more competitive in the world market. See World Bank (1999).
19 The Industrial Policy of 1991 eliminated the need for mills to obtain licenses for new capacity, removed the
restrictions that had kept large companies coming under the Monopolies and Restrictive Prevention Act from
making new investments, and provided for some automatic clearances for foreign investment proposals. See
World Bank (1999).
20 The 1992 Order made certification of powerlooms automatic, except in very special cases. See World Bank
(1999).

31
All these yet-to-be-liberalized policies and regulations have had little impact on the
fundamental competitive weakness of the Indian textile industry, its dualistic and highly
fragmented structure as shaped by the prior policy of replacing imports and preserving jobs.
That legacy includes a predominant concentration on markets for low-quality textile
products and tremendous variation in levels of efficiency and competitiveness in spinning,
weaving, and apparel. Containing only a small proportion of internationally competitive
enterprises, the industry as a whole is performing below potential. It is no match for the
PRC textile industry.
32
Apparel
The global apparel industry has evolved substantially from its earliest form where the
industry in the developing countries acted like subcontractors, where garment were sewn
from imported inputs ready for assembly. In the current market these operations are still
found in simple non-competitive producers of homogenous apparel items. Slightly more
sophisticated is a subcontracting process most commonly as original equipment
manufacturing (OEM). The characteristics of this outsourcing operation include the
supplying firm making a product according to a design specified by the buyer; the product is
sold under the buyer’s brand name; the supplier and buyer are separate firms; and the buyer
lacks control over distribution. The most sophisticated upgrading of this outsourcing
process is commonly referred to as Original brand name manufacturing (OBM) where the
developing country apparel manufacturer begins to design their own end product and then
sell it under their own brand name.
The critical element in the apparel chain is therefore the retailer. In the United States
at the beginning of the 1990s, the five largest retail chains represented 45 percent of the
apparel market. By 1995, these five largest retailers–Wal-Mart, Sears, Kmart, Dayton Hudson
Corporation and JC Penney – accounted for 68 per cent of all apparel sales. The next top 24
retailers represented an additional 30 per cent of these sales. The two top discount giants,
Wal-Mart and Kmart, control one quarter of all apparel (in terms of unit sold) in the United
States. By 2000, only 10 percent of the apparel sold by these chains was of US origin. These
retailers’ overseas operations are not primarily handling a middle-man function of just
facilitating the transfer of apparel to the US market, they are actively engaged in product
design, fabric selection and procurement, and monitoring contracted sewing as well as other

33
production functions handled by offshore manufacturers. Another new development is the
growth of private-label goods, which have been estimated to cover up to 25 per cent of the
United States apparel market in 2000.
As a result of these linkages and the new practice in the US of reducing inventory
costs, time factors play a far more crucial role in determining international competitiveness.
With the removal of the quota system, low-wage countries like India that had depended on
being an offshore assembly center relying on their quota allocations will find itself vulnerable
because of the inherent cost disadvantage of their business model based on production
fragmentation. Time factors can be an important trade barrier for intermediary inputs
involved in an internationally fragmented production process.
The emergence of more competitive and integrated suppliers in the PRC, who will
now increase their sales in a quota free world, will exert considerable pressure on fragmented
suppliers like India.21 The comparative advantage of India in the assembly process, i.e. in
low-wage sewing, does not necessarily translate into a comparative advantage in the
management of the entire supply chain when all services-related dimensions are taken into
consideration. Efficiency in managing the entire supply chain is required, including in design,
21 As wages in the PRC keep rising they are taking advantage of their upscale production and marketing skills
and have implemented a number of preferential policies in order to encourage its T & A manufacturers to
invest more in other developing countries. These measures include preferential loans, simplified administrative
procedures, and enhanced information and intelligence support. The PRC appears to be entering this new
market in order to subcontract its apparel production. The PRC’s current focus is on Africa where they have
started discussions with Morocco and in Asia with Bangladesh.

34
fabric procurement, and logistical skills in transport, quality control, export financing and
clearing of trade formalities. The latter has become more of the PRC model.22
The Indian textile and apparel industries are based on a system of decentralized and
fragmented production which was designed as the optimal way of assuring full employment
because of its focus on small-scale labor-intensive firms.23 Combine that with the usual high
tariff protection throughout the supply chain, from natural and man-made fibers to textile
and clothing products and you have a recipe for an economic nightmare. The Indian textile
and apparel structure and government policy has continuously discouraged entrepreneurs
from investing in large scale production plants. Consequently, India is ill prepared to take
advantage of the opportunities created by the elimination of quantitative restrictions.
V. CONCLUDING REMARKS
With the unprecedented act of removing T&A quotas the developing countries of
Asia have been thrown into of an uncomfortable position of having to compete for market
shares. Even more disturbing is the fact that low wages will not guarantee these countries a
22 The PRC has made great strides in the Apparel sector. Output in the sector rose by 37 percent from 1995 to
1999, while industry employment fell by 27 percent. See UN (2002). The PRC’s increase in its apparel quality
and productivity comes at the same time that it has accepted the necessity to import its better quality textiles
from abroad. Eighty percent of Japan’s import apparel is currently of PRC country of origin. Achieving such a
high penetration rate is proof that PRC Apparel can compete at the highest quality end. The PRC is the
benchmark that India will have to measure itself to.
23 One contributing factor to the small size of apparel facilities is the disincentive of having additional labor
market regulation on all firms employing more than 100 workers. Consequently Indian firms have chosen to set
up a whole set of small apparel firms rather than one or two large establishments.

35
market in the United States. The two big players that have been identified as major potential
winners of this uncontrolled trade environment are the PRC and India. This paper resolves
part of the puzzle by analyzing the question via a partial equilibrium review of each
beneficiaries’ potential demand side competitiveness with respect to each other, the supply
side responses and the differing objective functions of the state and business community
which are taken as representative of cultural differences.
On the demand side, we find no strong competition between the items that were
bound by quota across both countries. In the majority of three-digit categories there was no
significant cross-price elasticity of demand. The reality behind the regression results was that
the quality of PRC T&A products drastically improved while that India declined. On the
supply side, it was apparent that the single most important systemic difference which can be
attributed to cultural differences was the reliance in the PRC on the central planning to
organize the development path of the entire T&A industry. It was the State that encouraged
major technological changes, a search for economies of scale and a shift from merely
producing as sub-contractors to developing a unique fashion and downstream linkages
mechanism.
India, because of it low wages, has also been projected by most international agencies
as a potential beneficiary. Our results do not point to the same optimistic outlook for India’s
success in the T&A sector. The Indian T&A sector, while a major employer has suffered
from a legacy of industrial fragmentation, an aversion to mechanization and the avoidance of
economies of scale. Rather than focusing on export led growth, India focused on assuring
its T&A sector employees of full employment at very low wages and consequently very little
prospects of competing with the PRC.

36
DATA APPENDIX
Trade Data: The textile trade data, in terms of value and quantity, are based on the three digit
textile category system. This data was for the time period 1995-2004 and was provided by the
U.S. Dept. of Commerce. Office of Textiles and Apparel. (OTEXA).
Prices: Domestic producer prices were matched to the textile category level when possible. In
cases where a clear concordance was not possible, the more aggregate WPI for the aggregate
Textiles and/or Apparel was used. Import prices both for the PRC, India and the uncontrolled
country suppliers were based on unit values.
Tariffs: Ad-valorem tariff equivalents were calculated at the three digit textile category level for
the entire 1995-2004 period and was provided by the U.S. Dept. of Commerce. Office of
Textiles and Apparel. (OTEXA).
Activity Variables: Based on the nature of the commodity in question a number of activity
variables were used. In all cases an effort was made to make a distinction between end products
and intermediate goods. The list of activity variables includes:
(1) Retail sales of apparel and accessory stores;
(2) Total personal consumption expenditures;
(3) Personal consumption expenditure for non-durables;
(4) Personal consumption expenditure for clothing and shoes;
(5) Personal consumption expenditure for clothing;
37
Output: Domestic output measured at the three digit textile category level was provided by the
U.S. Dept. of Commerce. Office of Textiles and Apparel. (OTEXA).
Quota Levels: Quota levels by Country/Product were provided by the U.S. Dept. of
Commerce. Office of Textiles and Apparel. (OTEXA). These limits have been corrected for
the periodic borrowing and lending over categories and time. The restrictions used, therefore,
present a true upper limit as exercised by the U.S. Government.

38
REFERENCES
Andriamananjara, Soamiely, Balistreri, Edward J., and Ross, Martin T. (2004) “State Level
Equity and the Demise of the Agreement on Textiles and Clothing,” June. Mimeo.
Armington, Paul (1969) “A Theory of Demand for Products Distinguished by Place of
Production,” IMF Staff Papers, 16, 159-178.
Boyacigiller, N., 1990 “The role of expatriates in the management of interdependence,
complexity and risk in multinational corporations,” Journal of International Business
Studies 21(3):357–381.
Chen, Ming-Jer. (2001) Inside Chinese Business. Cambridge: MA. Harvard University, Business
School Press.
Crotts, J.C. and R, Erdmann. (2000) “Does National Culture Influence Consumers'
Evaluation of Travel Services? A test of Hofstede's Model of Cross-Cultural
Differences” Managing Service Quality 10(6): 410-419.
“Dashan, Xu (2005) “China’s Economy to Grow 8% annually from 2006 to 2010,” China
Daily, March 21.
Diao, Xinshen and Agapi Somwaru (2001) “Impact of the MFA Phase-Out on the World
Economy: An Intertemporal, Global, General Equilibrium Analysis,” Trade and

39
Macroeconomics Division, International Food Policy Research Institute, Discussion
Paper 79, October.
Downey, S. Wentling, R.M Wentling, T. and Wadsworth. A. (2005) “The Relationship
between National Culture and The Usability of an E-learning System,” Human
Resource Development International. 8(1): 47–64.
Dwyer, S. Mesak, H. and Maxwell Hsu. H. (2005) “An Exploratory Examination of the
Influence of National Culture on Cross-National Product Diffusion,” Journal of
International Marketing. 13(2): 1-27.
Francois, J.F. and D. Spinanger (2000) Hong Kong's Textile and Clothing Industry: The Impact of
Quotas, the UR and China's WTO Accession. Kiel Institute of World Economics.
Gelfand, M., Bhawuk, D., Nishii, L., and Bechtold, D. (2004). “Individualism and
Collectivism,” In House, R. J., Hanges, P. J., Javidan, M., Dorfman, P. W., and
Gupta. V. (Eds). Leadership, culture, and organizations: The GLOBE study of 62 societies,
pp. 437-512. Thousand Oaks, CA: Sage Publications.
Gereffi, Gary and Olga Memedovic (2003) The Global Apparel Value Chain: What Prospects for
Upgrading by Developing Countries, UNIDO.
Guo, R. (2004) “How Culture Influences Foreign Trade: Evidence From the U.S. and
China” Journal of Socio - Economics. 33(6):785-812.

40
Hofstede, G. (1980) Culture's Consequences: International Differences In Work-Related Values,
Newbury Park, CA: Sage.
_______. (1983) “The Cultural Relativity Of Organizational Practices And Theories,” Journal
of International Business Studies Fall:75–89.
Hofstede, G. and Bond. M.H. (1984) “Hofstede's Cultural Dimensions: An Independent
Validation Using Rokeach's Value Survey,” Journal of Cross-Cultural Psychology 15: 417-
433.
Hofstede, G. and Bond. M.H. (1988) “The Confucian Connection: From Cultural Roots to
Economic Growth,” Organizational Dynamics 16(4): 4-21.
Hofstede, G. (1997). Culture and Organization: Software of the Mind. New York: McGraw Hill.
House, R. J., Hanges, P. J., Javidan, M., Dorfman, P. W., and Gupta. V. (2004). Leadership,
Culture, and Organizations: the GLOBE Study of 62 Societies. Thousand Oaks, CA: Sage
Publications.
ILO, 2005a. Promoting Fair Globalization in Textiles and Clothing In A Post-MFA Environment.
Geneva.

41
ILO, 2005b. “Labor Implications Of The Textiles And Clothing Quota Phase-Out,”
Working Paper. WP224. Geneva.
Minor, Peter (2002) Changes in Global Trade Rules for Textiles and Apparel: Implication for Developing
Countries, November 20, submitted to USAID
OECD (2005) Review of Agricultural Policies, China. Paris.
______ (2004) A New World Map in Textiles and Clothing Adjusting To Change, Paris.
Pelzman, Joseph. 2004. “Implications for the Vietnamese Textile and Apparel Industry in
Light of Abolishing the Multifiber Arrangement and the US – Vietnam Bilateral
Investment Treaty,” in Khosrow Fatemi (ed) Globalization and Structural Change in the
World Economy. 2004
Pelzman, Joseph and Kathleen Rees. (1998) “The Control of Textile and Apparel Trade
under the WTO: What is the Track Record?” in Gulser Meric & Susan E.W. Nichols
(eds.) The Global Economy at the Turn of the Century, Vol. III. pp. 811-830.
Pelzman, Joseph. (1988) “The Tariff Equivalents of the Existing Quotas Under the Multifiber
Arrangement,” U.S. Department of Labor, reprinted in “The Textile Industry.” in
United States International Trade Commission. The Economic Effects of Significant U.S.
Import Restraints Phase 1, Pub. No. 2222, October 1989.

42
________. (1983) “Economic Costs of Tariffs and Quotas on Textile and Apparel Products
Imported into the United States: A Survey of the Literature and Implications for
Policies,” Weltwirtschafliches Archiv. 119: 523-542.
Pelzman, J. and R.C. Martin, (1981) “Direct Employment Effects of Increased Imports: A
Case Study of the Textile Industry,” Southern Economic Journal, 412-426.
Pye, L. W. (1992) The Spirit of Chinese Politics, Harvard University Press, Cambridge MA.
Richards, M., 2001 “U.S. Multinational Staffing Practices and Implications For Subsidiary
Performance In The U.K and Thailand,” Thunderbird International Business Review
43(2):225–242.
Sims, Thomas and Schiff, Jonathan (2000) “The Great Western Development Strategy,”
China Business Review, November-December, 2000.
Sivakumar, K. and Nakata. C. (2001) “The Stampede Toward Hofstede's Framework:
Avoiding the Sample Design Pit in Cross-Cultural Research,” Journal of International
Business Studies 32(3): 555-574.
Spinanger, Dean (1998) “Textiles Beyond the MFA Phase-Out,” GSGR Working Paper
13/98, July.

43
The Committee for the Implementation of Textile Agreements. 1997. Procedures for Considering
Requests from the Public for Textile and Apparel Safeguard Actions on Imports from China, ,
Federal Register Vol. 68, No. 98, pg 27787.
U.S. International Trade Commission (2004) “Textiles and Apparel: Assessment of the
Competitiveness of Certain Foreign Suppliers to the U.S. Market,” Investigation No.
332-448, January, Volumes I and II.
_______. 1999. Assessment of the Economic Effects of China’s Accession to the WTO. Investigation
No. 332-403, Publication 3229. Washington, DC: USITC.
U.N. (2002) Trade and Development Report.
Very, P., Lubatkin, M., and Calori, R. (1996). “A Cross-National Assessment of
Acculturative Stress in Recent European Mergers,” International Studies of Management
and Organization, 26(1): 59-86.
Weldon, E. and Jehn, K.A. (1992) “Work Goals and Work Related Beliefs among Managers
and Professionals in the United States and the People's Republic of China,” Asia
Pacific Journal of Human Resources 31(1):57-70.
Winters L. Alan (1984) “Separability and the Specification of Foreign Trade Functions,” Journal
of International Economics, 17: 239-263.

44
World Bank (1999) India Cotton and Textile Industries: Reforming to Compete, Volume I and II.
Washington DC.
World Trade Organization, 1996. Hearing before the House Ways and Means Committee, 104th
Cong., 2nd Session. Washington DC.
Yeh, Ryh-Song (1989) “On Hofstede's Treatment of Chinese and Japanese Values,” Asia
Pacific Journal of Management 6(1):149-160.

45
Table 1
Textile Category Description
CAT DESCRIPTION UNIT
218 FABRICS OF YARNS OF DIFF. COLORS M2 219 DUCK FABRIC M2 220 FABRIC OF SPECIAL WEAVE M2 222 KNIT FABRIC KG 224 PILE / TUFTED FABRICS M2 225 BLUE DENIM FABRIC M2 226 CHEESECLOTH, BATISTES, LAWNS/VOILE M2 227 OXFORD CLOTH M2 237 PLAYSUITS, SUNSUITS, ETC Doz 300 CARDED COTTON YARN KG 301 COMBED COTTON YARN KG 313 COTTON SHEETING FABRIC M2 314 COTTON POPLIN / BROADCLOTH FAB. M2 315 COTTON PRINTCLOTH FABRIC M2 317 COTTON TWILL FABRIC M2 326 COTTON SATEEN FABRIC M2 331 COTTON GLOVES AND MITTENS DPR 333 M/B SUIT-TYPE COATS, COTTON Doz 334 OTHER M/B COATS, COTTON Doz 335 W/G COTTON COATS Doz 336 COTTON DRESSES Doz 340 M/B COTTON SHIRTS, NOT KNIT Doz 341 W/G COT. SHIRTS/BLOUSES,N-KNIT Doz 342 COTTON SKIRTS Doz 345 COTTON SWEATERS Doz 347 M/B COT. TROUSERS/BREECHES/SHORTS Doz 348 W/G COTTON TROUSERS/SLACKS/SHORTS Doz 351 COTTON NIGHTWEAR/PAJAMAS Doz 352 COTTON UNDERWEAR Doz 360 COTTON PILLOWCASES Doz 361 COTTON SHEETS Doz 363 COTTON TERRY / OTHER PILE TOWELS No 613 MMF SHEETING FABRIC M2 614 MMF POPLIN / BROADCLOTH FABRIC M2 615 MMF PRINTCLOTH FABRIC M2 617 MMF TWILL AND SATEEN FABRIC M2 619 POLYESTER FILAMENT FABRIC, LIGHT-WEIGHT M2 620 OTHER SYNTHETIC FILAMENT FABRIC M2 625 MMF POPLIN/BROADCLTH STAP/FIL M2 628 MMF TWILLS/SATEENS STAP/FIL M2 629 OTHER MMF FABRICS OF STAP/FIL M2 634 OTHER M/B MMF COATS Doz

46
635 W/G MMF COATS Doz 636 MMF DRESSES Doz 638 M/B MMF KNIT SHIRTS Doz 639 W/G MMF KNIT SHIRTS / BLOUSES Doz 640 M/B NOT-KNIT MMF SHIRTS Doz 641 W/G NOT-KNIT MMF SHIRTS / BLOUSES Doz 642 MMF SKIRTS Doz 643 M/B MMF SUITS Doz 644 W/G MMF SUITS Doz 645 M/B MMF SWEATERS Doz 646 W/G MMF SWEATERS Doz 647 M/B MMF TROUSERS/BREECHES/SHORTS Doz 648 W/G MMF SLACKS/BREECHES/SHORTS Doz 651 MMF NIGHTWEAR / PAJAMAS Doz 652 MMF UNDERWEAR Doz
Source: US Department of Commerce, Office of Textiles and Apparel.

47
Table 2 OLS Estimates of China's Import Demand Equations
(By T & A Category, 1995-2004)
CAT Description lprcuvt linduvt luwmpt lusppi lpce _cons
222 KNIT FABRIC -3.87588 -1.2414 -5.37405 41.28253 13.96397 -248.631 Adj R-squared = 0.7050 -2.69 -0.72 -0.75 1.61 1.27 -1.53 F( 5, 4) = 5.30 0.055 0.514 0.495 0.182 0.273 0.201
224 PILE / TUFTED FABRICS -3.02592 0.197784 -1.67588 18.8556 3.394249 -95.0017 Adj R-squared = 0.7433 1.34 0.56 2.27 6.36 3.22 40.71 F( 5, 4) = 6.21
0.087 0.742 0.502 0.041 0.351 0.08
225 BLUE DENIM FABRIC 7.243525 8.156986 -6.37753 -20.8623 -3.32514 123.6565 Adj R-squared = 0.7538 3.15 4.76 3.71 13.19 6.39 76.47 F( 5, 4) = 6.51
0.083 0.162 0.161 0.189 0.63 0.181
237 PLAYSUITS, SUNSUITS, ETC -2.12257 0.863459 2.91586 12.23223 1.830328 -67.5535 Adj R-squared = 0.9086 0.28 0.34 0.79 1.81 0.46 12.51 F( 5, 4) = 18.90
0.002 0.064 0.021 0.003 0.017 0.006
300 CARDED COTTON YARN -4.35269 -0.63879 0.566983 27.87685 3.289778 -140.487 Adj R-squared = 0.9211 0.73 0.18 1.54 6.72 1.95 38.44 F( 5, 4) = 22.03
0.004 0.024 0.731 0.014 0.166 0.022
301 COMBED COTTON YARN 0.667958 0.022305 0.219467 -28.9923 3.980976 120.0916 Adj R-squared = 0.8976 0.17 0.52 3.89 18.77 5.09 102.78 F( 5, 4) = 16.78
0.016 0.968 0.958 0.197 0.478 0.308
326 COTTON SATEEN FABRIC -2.33183 -10.1155 -15.9849 40.74594 1.467583 -187.83 Adj R-squared = 0.8504 1.31 8.65 7.46 24.45 11.39 138.86 F( 5, 4) = 11.23

48
0.15 0.307 0.099 0.171 0.904 0.248
331 COTTON GLOVES AND MITTENS -2.13675 -0.22429 0.35866 6.39402 -0.64194 -15.0171 Adj R-squared = 0.9774 0.34 0.19 0.93 1.99 1.59 15.94 F( 5, 4) = 79.01
0.003 0.306 0.72 0.032 0.708 0.4
333 M/B SUIT-TYPE COATS, COTTON -1.8922 0.23681 0.41331 -33.5585 2.396019 158.377 Adj R-squared = 0.8625 0.78 0.21 0.82 12.79 0.89 63.15 F( 5, 4) = 12.29
0.073 0.332 0.642 0.059 0.055 0.066
336 COTTON DRESSES -1.68011 -0.95696 2.591622 9.307612 1.801064 -48.3892 Adj R-squared = 0.9379 0.31 0.34 0.73 4.16 1.06 18.68 F( 5, 4) = 28.17
0.006 0.049 0.023 0.089 0.165 0.061
342 COTTON SKIRTS -2.32055 0.516507 -2.92472 4.792254 2.298493 -9.29989 Adj R-squared = 0.6502 0.54 0.85 1.85 10.21 0.79 40.91 F( 5, 4) = 4.35
0.012 0.576 0.19 0.663 0.044 0.831
345 COTTON SWEATERS -0.86575 -1.3048 -0.96275 21.85527 -3.22212 -66.8578 Adj R-squared = 0.8537 0.24 0.59 1.07 4.40 1.93 14.27 F( 5, 4) = 11.50
0.023 0.091 0.418 0.008 0.17 0.009
347 M/B COT. TROUSERS/BREECHES/SHORTS -3.23364 0.85251 2.338036 26.23118 -0.09996 -118.032 Adj R-squared = 0.7412 1.70 0.62 3.00 12.53 1.27 61.41 F( 5, 4) = 6.16
0.131 0.244 0.479 0.104 0.941 0.127
360 COTTON PILLOWCASES -0.66769 -0.05367 0.299528 2.830358 2.403012 -18.3886 Adj R-squared = 0.7668 0.35 0.21 0.40 7.56 0.69 37.17 F( 5, 4) = 6.92
0.127 0.809 0.496 0.727 0.025 0.647
361 COTTON SHEETS -1.54801 0.562919 -2.34639 29.78556 2.465495 -142.632 Adj R-squared = 0.6090

49
0.55 0.56 1.26 13.45 0.86 63.43 F( 5, 4) = 3.80 0.049 0.371 0.135 0.091 0.046 0.088
363 COTTON TERRY / OTHER PILE TOWELS -1.4344 0.075421 1.231656 -1.3907 2.841576 0.844209 Adj R-squared = 0.6268 0.49 0.46 1.39 9.61 1.48 49.21 F( 5, 4) = 4.02
0.043 0.878 0.424 0.892 0.127 0.987
613 MMF SHEETING FABRIC -1.44362 -0.14496 0.112949 -39.4616 6.038473 164.9838 Adj R-squared = 0.6617 1.07 0.63 0.45 24.91 2.29 120.24 F( 5, 4) = 4.52
0.249 0.828 0.814 0.188 0.058 0.242
620 OTHER SYNTHETIC FILAMENT FABRIC -1.12421 -1.84381 2.856102 40.10514 7.265769 -225.311 Adj R-squared = 0.8718 0.99 1.37 2.91 22.18 1.89 104.76 F( 5, 4) = 13.25
0.318 0.249 0.381 0.145 0.018 0.098
625 MMF POPLIN/BROADCLTH STAP/FIL 3.481294 -0.59627 2.195255 -130.634 15.39821 553.4632 Adj R-squared = 0.8040 1.23 0.30 0.71 52.14 3.04 238.37 F( 5, 4) = 8.38
0.047 0.114 0.036 0.066 0.007 0.081
628 MMF TWILLS/SATEENS STAP/FIL 1.17888 0.636764 -2.09718 66.47859 0.395294 -315.799 Adj R-squared = 0.7305 2.28 0.61 1.16 34.26 3.54 155.24 F( 5, 4) = 5.88
0.632 0.356 0.145 0.124 0.916 0.112
629 OTHER MMF FABRICS OF STAP/FIL 0.298414 -0.35904 -0.74275 28.21403 13.03563 -202.602 Adj R-squared = 0.9530 0.83 0.61 2.86 31.60 2.26 157.96 F( 5, 4) = 37.51
0.738 0.589 0.808 0.422 0.004 0.269
634 OTHER M/B MMF COATS -1.43561 -0.14073 1.534907 14.13656 1.218662 -67.3693 Adj R-squared = 0.6642 0.85 0.50 0.96 8.42 0.65 42.84 F( 5, 4) = 4.56
0.167 0.793 0.184 0.168 0.134 0.191
636 MMF DRESSES -1.62126 -0.00035 0.975329 6.318372 1.818864 -29.2043 Adj R-squared = 0.9532

50
0.20 0.29 0.69 2.70 0.57 12.59 F( 5, 4) = 37.62 0.001 0.999 0.23 0.08 0.033 0.081
638 M/B MMF KNIT SHIRTS -0.13185 0.095111 0.417981 -3.1535 -2.11598 32.33153 Adj R-squared = 0.6600 0.96 1.51 1.50 17.09 1.62 79.19 F( 5, 4) = 4.49
0.897 0.953 0.794 0.863 0.261 0.704
639 W/G MMF KNIT SHIRTS / BLOUSES 3.153522 -0.33212 -1.70618 -31.8609 0.94648 149.9112 Adj R-squared = 0.6138 1.49 0.44 1.00 18.89 0.56 90.75 F( 5, 4) = 3.86
0.102 0.491 0.163 0.167 0.166 0.174
642 MMF SKIRTS -1.29768 -0.60594 -1.56465 -3.29889 0.670228 33.56944 Adj R-squared = 0.8713 0.27 0.28 1.18 4.65 1.28 19.50 F( 5, 4) = 13.19
0.008 0.097 0.255 0.517 0.629 0.16
645 M/B MMF SWEATERS 1.547335 0.090994 -1.84222 -55.5579 0.123791 273.0552 Adj R-squared = 0.8164 0.59 0.18 0.48 18.08 0.64 81.89 F( 5, 4) = 9.00 0.06 0.64 0.019 0.037 0.855 0.029
647 M/B MMF TROUSERS/BREECHES/SHORTS -2.61861 0.398971 1.936152 17.60475 2.611639 -90.1522 Adj R-squared = 0.6091 0.70 0.29 1.09 8.91 0.76 43.15 F( 5, 4) = 3.80 0.02 0.235 0.149 0.119 0.026 0.105
The results are listed on the first line, followed by the standard errors, followed by the probability that that the coefficient is greater than zero. All parameters are estimated in logs.
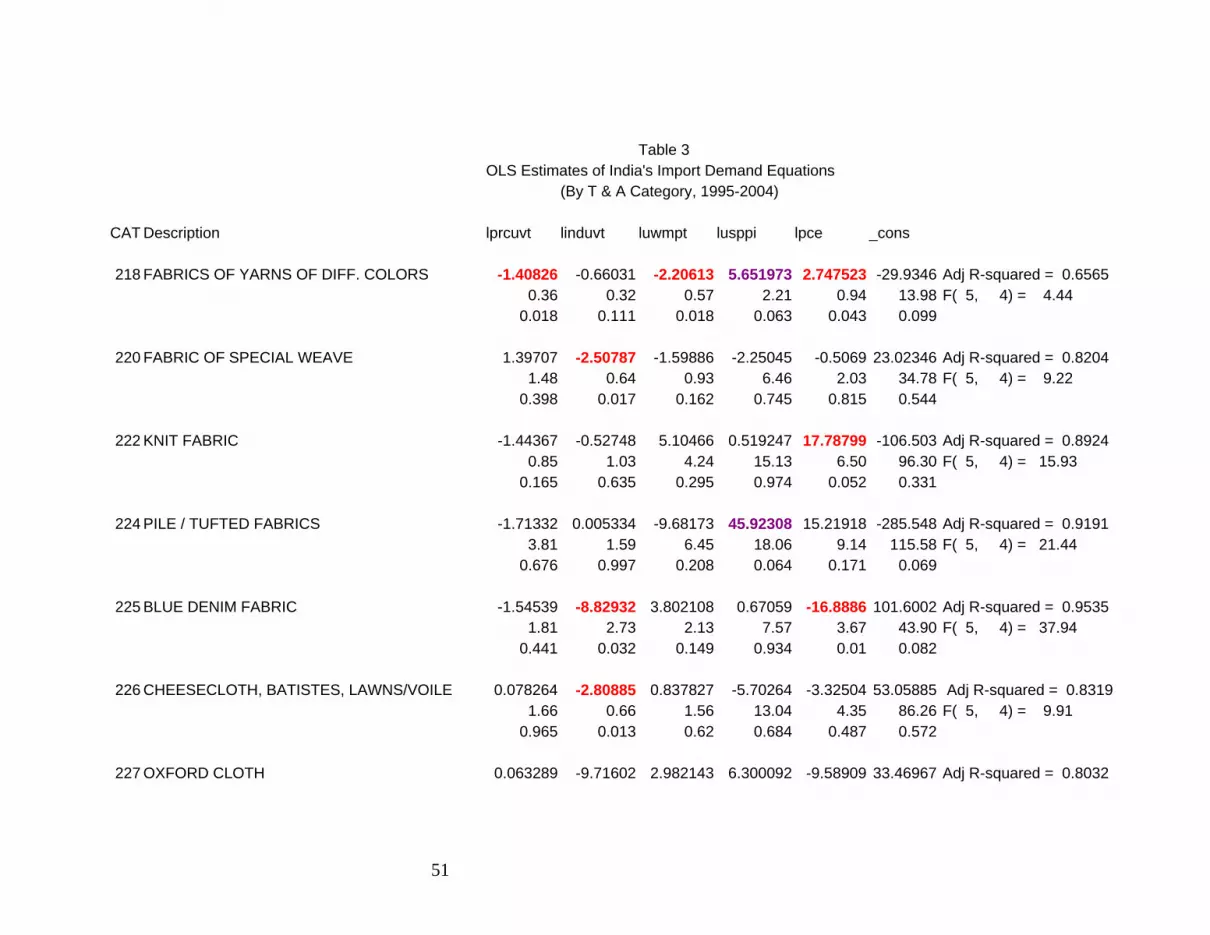
51
Table 3 OLS Estimates of India's Import Demand Equations
(By T & A Category, 1995-2004)
CAT Description lprcuvt linduvt luwmpt lusppi lpce _cons
218 FABRICS OF YARNS OF DIFF. COLORS -1.40826 -0.66031 -2.20613 5.651973 2.747523 -29.9346 Adj R-squared = 0.6565 0.36 0.32 0.57 2.21 0.94 13.98 F( 5, 4) = 4.44
0.018 0.111 0.018 0.063 0.043 0.099
220 FABRIC OF SPECIAL WEAVE 1.39707 -2.50787 -1.59886 -2.25045 -0.5069 23.02346 Adj R-squared = 0.8204 1.48 0.64 0.93 6.46 2.03 34.78 F( 5, 4) = 9.22
0.398 0.017 0.162 0.745 0.815 0.544
222 KNIT FABRIC -1.44367 -0.52748 5.10466 0.519247 17.78799 -106.503 Adj R-squared = 0.8924 0.85 1.03 4.24 15.13 6.50 96.30 F( 5, 4) = 15.93
0.165 0.635 0.295 0.974 0.052 0.331
224 PILE / TUFTED FABRICS -1.71332 0.005334 -9.68173 45.92308 15.21918 -285.548 Adj R-squared = 0.9191 3.81 1.59 6.45 18.06 9.14 115.58 F( 5, 4) = 21.44
0.676 0.997 0.208 0.064 0.171 0.069
225 BLUE DENIM FABRIC -1.54539 -8.82932 3.802108 0.67059 -16.8886 101.6002 Adj R-squared = 0.9535 1.81 2.73 2.13 7.57 3.67 43.90 F( 5, 4) = 37.94
0.441 0.032 0.149 0.934 0.01 0.082
226 CHEESECLOTH, BATISTES, LAWNS/VOILE 0.078264 -2.80885 0.837827 -5.70264 -3.32504 53.05885 Adj R-squared = 0.8319 1.66 0.66 1.56 13.04 4.35 86.26 F( 5, 4) = 9.91
0.965 0.013 0.62 0.684 0.487 0.572
227 OXFORD CLOTH 0.063289 -9.71602 2.982143 6.300092 -9.58909 33.46967 Adj R-squared = 0.8032

52
0.19 5.17 2.44 17.01 6.21 108.85 F( 5, 4) = 8.35 0.755 0.133 0.289 0.73 0.197 0.774
237 PLAYSUITS, SUNSUITS, ETC 0.579379 -0.84704 -0.13994 -5.66745 -4.59886 59.27044 Adj R-squared = 0.8454 0.83 1.02 2.38 5.45 1.40 37.64 F( 5, 4) = 10.84
0.525 0.454 0.956 0.357 0.03 0.19
301 COMBED COTTON YARN 0.046219 -2.13407 2.933361 -10.7583 -9.40406 107.7222 Adj R-squared = 0.9440 0.09 0.42 2.43 9.70 2.84 52.44 F( 5, 3) = 27.97
0.631 0.015 0.314 0.348 0.046 0.132
313 COTTON SHEETING FABRIC 1.035812 1.936859 3.505628 -6.64386 -3.76463 63.92302 Adj R-squared = 0.7390 0.93 1.31 0.93 5.75 1.14 31.74 F( 5, 4) = 6.10
0.328 0.213 0.02 0.312 0.03 0.114
334 OTHER M/B COATS, COTTON 2.428064 -1.84291 2.614513 -41.5685 5.165002 159.0756 Adj R-squared = 0.8081 1.29 1.09 1.98 13.23 1.70 57.00 F( 5, 4) = 8.58
0.133 0.166 0.256 0.035 0.038 0.049
335 W/G COTTON COATS 1.279299 -0.86272 0.809301 6.384972 4.096595 -55.1926 Adj R-squared = 0.8459 0.86 1.04 0.73 11.49 1.33 54.45 F( 5, 4) = 10.88 0.21 0.452 0.329 0.608 0.037 0.368
336 COTTON DRESSES 0.132451 -0.96548 1.141825 -0.01072 2.139325 -7.12796 Adj R-squared = 0.9148 0.56 0.62 1.31 7.50 1.91 33.64 F( 5, 4) = 20.32
0.825 0.194 0.432 0.999 0.326 0.843
340 M/B COTTON SHIRTS, NOT KNIT 1.067907 -0.63065 0.550339 -12.2057 1.362609 54.46825 Adj R-squared = 0.8078 0.95 0.50 1.78 7.85 0.60 36.91 F( 5, 4) = 8.57
0.322 0.276 0.773 0.195 0.087 0.214

53
341 W/G COT. SHIRTS/BLOUSES,N-KNIT 0.723 -0.96974 -0.31496 -1.05141 0.819979 10.9076 Adj R-squared = 0.7616 0.57 0.67 0.91 7.65 0.41 32.16 F( 5, 4) = 6.75 0.27 0.219 0.748 0.897 0.117 0.752
342 COTTON SKIRTS 0.08177 0.825949 -2.39468 -12.8657 1.665868 65.7025 Adj R-squared = 0.9323 0.41 0.66 1.43 7.88 0.61 31.59 F( 5, 4) = 25.78
0.853 0.276 0.17 0.178 0.053 0.106
345 COTTON SWEATERS -0.02691 -3.8002 -7.5752 43.536 -12.8666 -77.1669 Adj R-squared = 0.7913 0.66 1.61 2.91 12.01 5.26 38.94 F( 5, 4) = 7.83 0.97 0.077 0.06 0.022 0.071 0.119
347 M/B COT. TROUSERS/BREECHES/SHORTS 1.000544 -0.94292 -1.58892 -7.55146 2.784272 33.55144 Adj R-squared = 0.7700 2.93 1.07 5.15 21.53 2.19 105.54 F( 5, 4) = 7.02 0.75 0.429 0.773 0.744 0.273 0.766
348 W/G COTTON TROUSERS/SLACKS/SHORTS 2.121549 -0.98666 -2.23655 -17.1667 1.41613 85.22404 Adj R-squared = 0.9591 0.76 0.49 1.27 7.09 0.88 32.29 F( 5, 4) = 43.26
0.049 0.112 0.153 0.073 0.184 0.058
351 COTTON NIGHTWEAR/PAJAMAS 0.064725 -0.86328 0.142651 -0.07759 1.759351 -0.78477 Adj R-squared = 0.8930 0.70 0.59 1.35 15.22 1.70 57.56 F( 5, 4) = 16.02
0.931 0.219 0.921 0.996 0.36 0.99
352 COTTON UNDERWEAR 2.020725 -2.75113 -2.05653 50.50225 1.236705 -237.631 Adj R-squared = 0.8850 1.74 0.62 3.99 37.19 3.66 173.48 F( 5, 4) = 14.86
0.309 0.012 0.633 0.246 0.752 0.243
360 COTTON PILLOWCASES 0.009237 -1.763 -1.45795 8.320271 9.005541 -81.033 Adj R-squared = 0.9869 0.92 0.55 1.06 20.00 1.82 98.31 F( 5, 4) = 136.40
0.992 0.032 0.241 0.699 0.008 0.456

54
361 COTTON SHEETS -0.79432 -2.36781 0.138133 -5.5373 12.98116 -32.5239 Adj R-squared = 0.9776 1.26 1.28 2.87 30.69 1.97 144.77 F( 5, 4) = 79.48
0.562 0.137 0.964 0.866 0.003 0.833
363 COTTON TERRY / OTHER PILE TOWELS -0.44324 -0.59213 -1.26532 -11.4163 3.992891 45.22948 Adj R-squared = 0.9578 0.42 0.40 1.20 8.32 1.28 42.59 F( 5, 4) = 41.83
0.355 0.212 0.351 0.242 0.036 0.348
629 OTHER MMF FABRICS OF STAP/FIL 0.314283 -2.16372 8.024332 69.47248 18.7998 -442.183 Adj R-squared = 0.8816 1.40 1.03 4.81 53.15 3.80 265.73 F( 5, 4) = 14.40
0.834 0.103 0.171 0.261 0.008 0.171
635 W/G MMF COATS 1.289963 0.061293 -1.03102 -3.70176 1.067721 14.93464 Adj R-squared = 0.8992 0.63 1.13 1.11 10.85 1.49 52.44 F( 5, 4) = 17.06
0.112 0.959 0.406 0.75 0.512 0.79
638 M/B MMF KNIT SHIRTS 1.219204 1.822266 -5.22605 16.62531 9.77842 -123.257 Adj R-squared = 0.9361 1.73 2.73 2.71 30.94 2.93 143.37 F( 5, 4) = 27.38 0.52 0.542 0.126 0.619 0.029 0.438
639 W/G MMF KNIT SHIRTS / BLOUSES -1.34876 -1.93094 1.614132 25.43102 5.227401 -139.835 Adj R-squared = 0.9389 1.85 0.55 1.24 23.47 0.69 112.74 F( 5, 4) = 28.66
0.507 0.024 0.263 0.339 0.002 0.283
640 M/B NOT-KNIT MMF SHIRTS 11.32782 -1.65718 -20.3796 118.9179 -2.3547 -510.677 Adj R-squared = 0.9352 4.94 0.81 6.03 32.79 2.45 131.34 F( 5, 4) = 26.99
0.083 0.11 0.028 0.022 0.39 0.018
642 MMF SKIRTS 1.218348 -0.0512 1.320319 7.483947 -1.62809 -31.0923 Adj R-squared = 0.8483 0.31 0.32 1.36 5.37 1.48 22.50 F( 5, 4) = 11.06

55
0.017 0.882 0.387 0.236 0.334 0.239
645 M/B MMF SWEATERS 0.296408 -3.59761 0.360916 79.80903 -0.95437 -365.309 Adj R-squared = 0.9318 0.90 0.67 0.78 33.02 1.37 146.30 F( 5, 3) = 22.85
0.762 0.013 0.677 0.094 0.537 0.088
647 M/B MMF TROUSERS/BREECHES/SHORTS 3.3145 0.745722 -9.29399 -4.48221 5.365626 16.58102 Adj R-squared = 0.9519 2.69 1.11 4.20 34.47 2.94 166.89 F( 5, 4) = 36.60
0.286 0.537 0.092 0.903 0.142 0.926
652 MMF UNDERWEAR 2.685645 -0.38384 -1.58167 14.60846 5.01552 -97.7833 Adj R-squared = 0.8356 2.33 0.71 8.20 169.35 2.65 807.86 F( 5, 3) = 9.13
0.332 0.628 0.859 0.937 0.154 0.911
The results are listed on the first line, followed by the standard errors, followed by the probability that that the coefficient is greater than zero. All parameters are estimated in logs.