Embed Size (px)
Citation preview

COPYRIGHT AND CITATION CONSIDERATIONS FOR THIS THESIS/ DISSERTATION
o Attribution — You must give appropriate credit, provide a link to the license, and indicate ifchanges were made. You may do so in any reasonable manner, but not in any way thatsuggests the licensor endorses you or your use.
o NonCommercial — You may not use the material for commercial purposes.
o ShareAlike — If you remix, transform, or build upon the material, you must distribute yourcontributions under the same license as the original.
How to cite this thesis
Surname, Initial(s). (2012) Title of the thesis or dissertation. PhD. (Chemistry)/ M.Sc. (Physics)/ M.A. (Philosophy)/M.Com. (Finance) etc. [Unpublished]: University of Johannesburg. Retrieved from: https://ujcontent.uj.ac.za/vital/access/manager/Index?site_name=Research%20Output (Accessed: Date).
The Effect of Sodium Shale Oil Sulphonate 1% Shampoo on Dandruff
A Research Dissertation presented to the
Faculty of Health Sciences, University of Johannesburg,
as partial fulfilment for the
Masters Degree in Technology: Homoeopathy
By:
Zeenat Mia
(Student Number: 201001496)
Supervisor: __________________ Date: _________________
Dr Neil Gower MTechHom (UJ) CML (UNISA)
Co-supervisor: ________________ Date: _________________
Dr Marelize Caminsky MTechHom (UJ)

ii
DECLARATION
I declare that this dissertation is my own, unaided work. It is being submitted for the Degree of
Master of Technology at the University of Johannesburg, Johannesburg. It has not been submitted
before for any degree or examination in any other Technikon or University.
(Signature of Candidate)
day of
iv
ABSTRACT
Dandruff, also known as seborrhea sicca, pityriasis capitis or sicca capitis, can be defined as
chronic non-inflammatory scaling of the scalp, or an abnormality in the desquamation process
which occurs on the scalp (Willet, 2010). It is said that dandruff affects at least 50% of the world’s
adult population and about 15 – 20% of the world’s total population (Prambhamanju et al., 2009).
Dandruff is usually marked by flaking as well as itching and irritation of the scalp which can also
lead to greasiness. Dandruff can lead to physiological and psychological issues and can be very
distressing and embarrassing for sufferers, causing low self-esteem and social problems (Nowicki,
2006).
According to the literature, pale sulphonated shale oil has widespread dermatological uses as it is
believed to have anti-inflammatory, anti-microbial and anti-seborrheic properties (Lunar
Pharmaceutics, 2014).
The aim of the study was to ascertain the effect of sodium shale oil sulphonate 1% shampoo on
the appearance of dandruff. Forty participants completed the study and participants were of both
genders between the ages of 18 and 45. The study compromised of 16 days with 3 visits each 8
days apart.
The study design consisted of double-blind, placebo-controlled study where participants were
grouped into matching pairs based on the severity of the condition. Participants were then
randomly assigned to the treatment or placebo group. At each visit, participants were assessed
using the following assessment measures: a Visual Analogue Scale for the participant comprising
of scaling, irritation, itching, greasiness and global impression; a Visual Analogue Scale for the
researcher comprising of scaling, irritation, greasiness and global impression as well as an
Adherent Scalp Flake Score grading completed by the researcher.
Parametric and non-parametric analyses were used and the results of the study demonstrated
overall statistically significant improvement in all parameters for the treatment and placebo groups
but the extent of improvement was greater in the treatment group. However, at individual visits,
only certain parameters expressed statistically significant changes when compared to the placebo
group.
It was found that both Sodium Shale Oil Sulphonate 1% shampoo and the control shampoo may
contribute significantly to the improvement of the appearance of dandruff with respect to all of the
v
aforementioned parameters. No significant difference was found between the sodium shale oil
sulphonate 1% shampoo and the control shampoo relevant to irritation, itching, greasiness or
researcher global impression.
The Sodium Shale Oil Sulphonate 1% shampoo was shown to yield a higher percentage
improvement for each measured parameter than the control substance and showed a significant
improvement over and above the control shampoo with respect to only the following parameters:
scaling (participant rated p=0.012; researcher rated p=0.020) and the global impression
(participant rated p=0.048). Higher numbers of participants and longer study periods are however
required to verify these results.
The conclusion or results of this study may not be quoted for use or proof of efficacy nor
substantiation of any effect in any context without the express permission of the Department of
Homoeopathy, University of Johannesburg.
vi
DEDICATION
I dedicate this research dissertation to the following people:
My mother, Zuleikha Munshi. Thank you for your endless support, love and encouragement
throughout the tears and smiles during my studies.
My husband, Mohammed Adam, for forcing me to work on my research almost every single day
and for your continuous concern about my progress. For giving up our weekends for me to study.
My sister, Yumna Mia, for sharing a study with me.
My In Laws, for your concern and prayers.
My father, Abdul Mia, for the financial support.

vii
ACKNOWLEDGEMENTS
I would like to extend my utmost gratitude to the following people:
Dr N. Gower (Supervisor): For the expert advice, guidance, time and patience throughout
the entire process and for never getting mad at me for continuously hassling.
Dr M. Caminsky (Co-Supervisor): For your time, guidance and constructive input
especially with grammar.
Ms Juliana Van Staden (STATKON)
Mr Trevor Baillie (Medicine manufacturer)
All the participants who volunteered to take part in the study.
viii
TABLE OF CONTENTS
Page
DECLARATION ii
AFFIDAVIT iii
ABSTRACT iv
DEDICATION vi
ACKNOWLEDGEMENTS vii
TABLE OF CONTENTS viii
LIST OF FIGURES xiii
LIST OF TABLES xiv
LIST OF APPENDICES xv
CHAPTER 1: INTRODUCTION 1
1.1 Problem Statement 1
1.2 Aim 1
1.3 Hypothesis 1
1.4 Null Hypothesis 2
1.5 Importance of the Study 2
CHAPTER 2: LITERATURE REVIEW 3
2.1 Anatomy and Physiology of the Skin 3
2.1.1 Structure of the Skin 3
2.1.1.1 The Epidermis 3
2.1.1.2 The Dermis 5
2.1.1.3 Subcutaneous Layer 5
2.1.1.4 Vascular Supply 6
2.1.1.5 Nerve Supply 6
2.1.1.6 Accessory Structures (Epidermal Appendages) 7
2.2 Functions of the Skin 8
2.3 Dandruff 9
2.3.1 Epidemiology 9
ix
2.3.2 Aetiology and Pathogenesis 10
2.3.2.1 Malassezia 10
2.3.2.2 Lipase activity 11
2.3.2.3 Sebum 12
2.3.2.4 Lipid levels 13
2.3.2.5 Other Factors 13
2.3.3 Pathophysiology 13
2.3.4 Signs and Symptoms 14
2.3.5 Differential Diagnosis 14
2.4 Dandruff Severity Measures 16
2.4.1 Visual Analogue Scale (VAS) 16
2.4.2 Adherent Scalp Flake Score Grading (ASFS) 17
2.5 Treatment of Dandruff 17
2.5.1 Conventional Treatment 18
2.5.1.1 Fungicidal Substances 19
2.5.1.2 Cytostatic Substances 19
2.5.1.3 Keratolytic Substances 20
2.5.1.4 Anti Inflammatory Substances 20
2.5.2 Complementary and Alternative Treatments 21
2.6 Sodium Shale Oil Sulphonate/Pale Sulfonated Shale Oil Shampoo 22
2.6.1 Shale Oil 23
2.7 Related Research 24
CHAPTER 3: METHODOLOGY 25
3.1 Research Sample 25
3.1.1 Inclusion Criteria 25
3.1.2 Exclusion Criteria 25
3.2 Research Procedure and Design 25
x
3.3 Medication administration 26
3.4 Sodium Shale Oil Sulphonate 1% 26
3.5 Data Collection and Analysis 27
3.6 Reliability and validity measures 27
3.7 Ethics 27
CHAPTER 4: RESULTS 29
4.1 Introduction 29
4.2 Participant Recruitment 30
4.3 Demographic Data 32
4.3.1 Gender Distribution 32
4.3.2 Age Distribution 33
4.3.3 Race Distribution 33
4.3.4. ASFS Scores at Primary Visit 34
4.4 Outcomes and Estimations 34
4.4.1 Scaling 35
4.4.1.1 Participant VAS Evaluation 35
Comparable Scaling 35
Intragroup Analysis 35
Intergroup Analysis 37
4.4.1.2 Researcher VAS Evaluation 38
Comparable Scaling 38
Intragroup Analysis 38
Intergroup Analysis 40
4.4.2 Irritation 40
4.4.2.1 Participant VAS Evaluation 40
Comparable Irritation 40
xi
Intragroup Analysis 41
Intergroup Analysis 43
4.4.2.2 Researcher VAS Evaluation 43
Comparable Irritation 43
Intragroup Analysis 44
Intergroup Analysis 45
4.4.3 Itching 46
4.4.3.1 Participant VAS Evaluation 46
Comparable Itching 46
Intragroup Analysis 46
Intergroup Analysis 48
4.4.4 Greasiness 48
4.4.4.1 Participant VAS Evaluation 48
Comparable Greasiness 48
Intragroup Analysis 49
Intergroup Analysis 51
4.4.4.2 Researcher VAS Evaluation 51
Comparable Greasiness 51
Intragroup Analysis 52
Intergroup Analysis 54
4.4.5 Global Impression 54
4.4.5.1 Participant VAS Evaluation 54
Comparable Global Impression 54
Intragroup Analysis 55
Intergroup Analysis 57
4.4.5.2 Researcher VAS Evaluation 57
Comparable Global Impression 57
Intragroup Analysis 58
Intergroup Analysis 60
4.4.6 Adherent Scalp Flake Score Grading (ASFS) 60
Comparable ASFS 60
Intragroup Analysis 60
Intergroup Analysis 62
xii
CHAPTER 5: DISCUSSION 63
5.1 Introduction 63
5.2 Demographic Data 63
5.2.1 Gender Distribution 63
5.2.2 Age Distribution 63
5.2.3 Race Distribution 63
5.3 Primary Visit Scores 64
5.4 Scaling 64
5.5 Irritation of the scalp 65
5.6 Itching 66
5.7 Greasiness 67
5.8 Global Impression 68
5.9 ASFS 69
CHAPTER SIX: CONCLUSION AND RECOMMENDATIONS 70
6.1 Conclusion 70
6.2 Recommendations 71
REFERENCES 72
xiii
LIST OF FIGURES
Page
Figure 1.1 The Layers of the Epidermis 5
Figure 2.2 Anatomy of the Skin 7
Figure 2.3 Anatomy of the Hair Follicle 8
Figure 2.4 Metabolic Pathways Involved in Dandruff 12
Figure 2.5 Examples of Products Used in the Treatment of Dandruff 18
Figure 4.1 CONSORT Flow Chart of Participants 32
Figure 4.2 Race Distribution 34
Figure 4.3 Estimated Marginal Means for Scaling – Participant Evaluations 36
Figure 4.4 Estimated Marginal Means for Scaling – Researcher Evaluations 39
Figure 4.5 Estimated Marginal Means for Irritation – Participant Evaluations 42
Figure 4.6 Estimated Marginal Means for Irritation – Researcher Evaluations 44
Figure 4.7 Estimated Marginal Means for Itching 47
Figure 4.8 Estimated Marginal Means for Greasiness – Participant Evaluations 49
Figure 4.9 Estimated Marginal Means for Greasiness – Researcher Evaluation 52
Figure 4.10 Estimated Marginal means for Global Impression – Participant Evaluations 55
Figure 4.11 Estimated Marginal Means for Global Impression – Researcher Evaluation 58
Figure 4.12 Estimated Marginal Means for the ASFS 61
xiv
LIST OF TABLES
Page
Table 4.1 Gender Distribution 33
Table 4.2 Group Statistics ASFS Visit 1 34
Table 4.3 Group Statistics Scaling – Participant Evaluations 35
Table 4.4 Friedman Test for Scaling – Participant Evaluations 37
Table 4.5 Wilcoxin Signed Ranks Test for Scaling Participant Evaluations 37
Table 4.6 Group Statistics Scaling – Researcher Evaluations 38
Table 4.7 Friedman Test for Scaling – Researcher Evaluations 39
Table 4.8 Wilcoxin Signed Ranks Test for Scaling – Researcher Evaluations 40
Table 4.9 Group Statistics for Irritation – Participant Evaluations 41
Table 4.10 Friedman Test for Irritation – Participant Evaluations 42
Table 4.11 Wilcoxin Signed Ranks Test for Irritation – Participant Evaluations 43
Table 4.12 Group Statistics for Irritation – Researcher Evaluations 44
Table 4.13 Friedman Test for Irritation – Researcher Evaluations 45
Table 4.14 Wilcoxin Signed Ranks Test for Irritation – Researcher Evaluations 45
Table 4.15 Group Statistics for Itching 46
Table 4.16 Friedman Test for Itching 47
Table 4.17 Wilcoxin Signed Ranks Test for Itching 48
Table 4.18 Group Statistics for Greasiness – Participant Evaluations 49
Table 4.19 Friedman Test for Greasiness – Participant Evaluations 50
Table 4.20 Wilcoxin Signed Ranks Test for Greasiness – Participant Evaluations 50
Table 4.21 Group Statistics for Greasiness – Researcher Evaluations 51
Table 4.22 Friedman Test for Greasiness – Researcher Evaluations 53
Table 4.23 Wilcoxin Signed Ranks Test for Greasiness – Researcher Evaluations 53
Table 4.24 Group statistics for Global Impression – Participant Evaluations 54
Table 4.25 Friedman Test for Global Impression – Participant Evaluations 56
Table 4.26 Wilcoxin Signed Ranks Test for Global Impression – Participant Evaluations 56
Table 4.27 Group Statistics for Global Impression – Researcher Evaluation 57
Table 4.28 Friedman Test for Global Impression – Researcher Evaluation 59
Table 4.29 Wilcoxin Signed Ranks Test for Global Impression – Researcher Evaluation 59
Table 4.30 Friedman Test for the ASFS 61
Table 4.31 Wilcoxin Signed Ranks Test for the ASFS 62
xv
LIST OF APPENDICES
Page
APPENDIX A: Advertisement 81
APPENDIX B: Participant Information Form 82
APPENDIX C: Participant Consent Form 85
APPENDIX D: Physical Examination 86
APPENDIX E: Modified Visual Analogue Scale for Participant 87
APPENDIX F: Modified Visual Analogue Scale for Researcher 88
APPENDIX G: Adherent Scalp Flaking Score Grading 89
APPENDIX H: Matching Procedure 90
APPENDIX I: Collected Data for Statistical Analysis 91
APPENDIX J: Statistical Analysis 93
1
CHAPTER 1: INTRODUCTION
1.1 Problem Statement
Dandruff, also known as Pityriasis capitis, is a common condition affecting the scalp. It is
estimated that dandruff affects at least 50% of the world’s adult population and about 15 – 20% of
the world’s total population (Nowicki, 2006). Dandruff is caused by increased desquamation and
cell growth leading to irritation, marked by flaking and itching of the scalp with associated
greasiness (Roger, 2010). Although dandruff is not a cause of major morbidity, as it only affects
the scalp, it may be embarrassing and distressing to sufferers leading to low self-esteem and social
problems (Nowicki, 2006). The psychological effects of dandruff warrants research into ways in
which the problem can be addressed.
Current treatment options for dandruff include many over-the-counter preparations, anti-dandruff
shampoos and topical steroid medications. These treatments may be accompanied by side effects
and possible aggravation of the condition. Some commonly used ingredients have carcinogenic
properties, while others cause increased irritability, dryness and itching of the scalp, allergic
reactions (contact dermatitis), endocrine and epithelial cell disruptions, and headaches (Pierard–
Franchimont et al., 2001).
Ichthyol® Pale shampoo is a sodium salt of pale sulphonated shale oil in aqueous solution. It has
anti-microbial, anti-inflammatory, anti-seborrheic and anti-fungal properties. It combats dandruff
by means of slowing down the desquamation process and regulating cell growth, thus addressing
both the cause and symptoms of dandruff (Lunar Pharmaceuticals, 2014). Research on Ichthyol®
Pale needs to be conducted in order to evaluate its effect on the treatment of dandruff, as no
external research has been done to date.
1.2 Aim
The aim of the study was to determine the effect of Sodium Shale Oil Sulphonate 1% shampoo in
the treatment of dandruff (Pityriasis capitis). This was evaluated by means of the Adherent Scalp
Flaking Score (ASFS) grading and a Visual Analogue Scale (VAS).
1.3 Hypothesis
It is hypothesized that Sodium Shale Oil Sulphonate 1% shampoo would decrease and ameliorate
the signs and symptoms of dandruff measured using a VAS and ASFS grading when compared to
the placebo over a 16 day period.
2
1.4 Null Hypothesis
The null hypothesis states that Sodium Shale Oil Sulphonate 1% shampoo would not decrease and
ameliorate the signs and symptoms of dandruff measured using a VAS and ASFS grading when
compared to the placebo over a 16 day period.
1.5 Importance of the Study
Current treatment options available for the treatment of dandruff are not always effective and can
pose the risk of higher recurrence rates. Some only provide symptomatic relief for the condition
and include numerous harmful side effects. The use of Sodium Shale Oil Sulphonate 1% shampoo
may provide a long term, safer and more effective treatment option for dandruff. Should the study
produce positive results, further research on the treatment of dandruff, and other similar conditions,
using Shale Oil Sulphonate 1% shampoo can be conducted.
3
CHAPTER 2: LITERATURE REVIEW
2.1 Anatomy and Physiology of the Skin
2.1.1 Structure of the Skin
The skin is the largest organ of the entire human body. Tissues that make up the skin constantly
grow, differentiate and renew themselves. The skin acts as a major protection barrier between the
internal and external environment (Hull, 2011).
The skin is made up of 3 layers – the epidermis (external layer), the dermis (internal layer), and
the subcutaneous tissue – together with blood vessels, nerves and accessory structures (hair, nails
and sweat glands) (Hall and Hall, 2010). The skin itself, together with accessory structures, makes
up the integumentary system. As with other systems of the body, the integumentary system does
not function in isolation. It depends largely on an extensive network of blood vessels as well as
sensory receptors in order to complete its functions (Martini and Nath, 2009).
2.1.1.1 The Epidermis
The epidermis consists of stratified squamous epithelial cells that offer mechanical protection as
well as protection from external microorganisms. It is the most superficial layer of the skin and
has an average thickness of less than 1mm. It contains many different cells including keratinocytes,
melanocytes, Langerhans cells and Merkel cells. It is also important to note that the epidermis is
free from blood vessels and lacks any nerves. The keratinocytes are the most abundant cells found
in the epidermis. The keratinocytes are arranged in 4 layers. From the deepest to the most
superficial these layers are as follows:
1. Stratum germinativum
2. Stratum spinosum
3. Stratum granulosum
4. Stratum corneum (Martini and Nath, 2009).
The stratum germinativum, stratum basale or the basal layer (Hall and Hall, 2010) is the innermost
stem cell layer whose divisions restore the keratinocytes that are shed and lost on the surface of
the epithelium (Martini and Nath, 2009). Cells present in this layer include melanocytes
(responsible for skin and hair colour), Merkel cells (acting as slowly adapting sensory receptors)
and Langerhans cells (responsible for delayed hypersensitivity reactions) (Hall and Hall, 2010).
4
The stratum spinosum or the spinous layer consists mainly of keratin filaments (Martini and Nath,
2009). Cells entering this layer from the stratum germinativum further divide to increase the
thickness of the epithelium (Hall and Hall, 2010).
The stratum granulosum or the grainy layer (Hall and Hall, 2010) consists of three to five
keratinocyte layers. By the time the dividing cells reach this grainy layer they begin producing
keratin, which forms the essential structure of hair and nails, and keratohyalin, responsible for
dehydration of cells (Martini and Nath, 2009). As keratin develops, the cells become thinner and
flatter with less permeable membranes. Nuclei of the cells also disintegrate in this layer causing
cell death (Hull, 2011).
The stratum corneum or the keratin layer is the most superficial layer. It acts as a major protective
barrier for the body as it is water resistant, but not water proof as it absorbs considerable amounts
of water (Martini and Nath, 2009). Keratinization occurs in this layer - it consists of layers of
keratinized cells that continuously shed (Hall and Hall, 2010).
Its takes about 15-30 days for cells to migrate from the innermost to the outermost layer of the
epidermis. The dead cells then remain on the stratum corneum for a further two weeks, after which
they are shed or washed away. By remaining on the stratum corneum, the cells act as a protective
barrier to the underlying epidermal layers. By keeping the surface of the stratum corneum dry, the
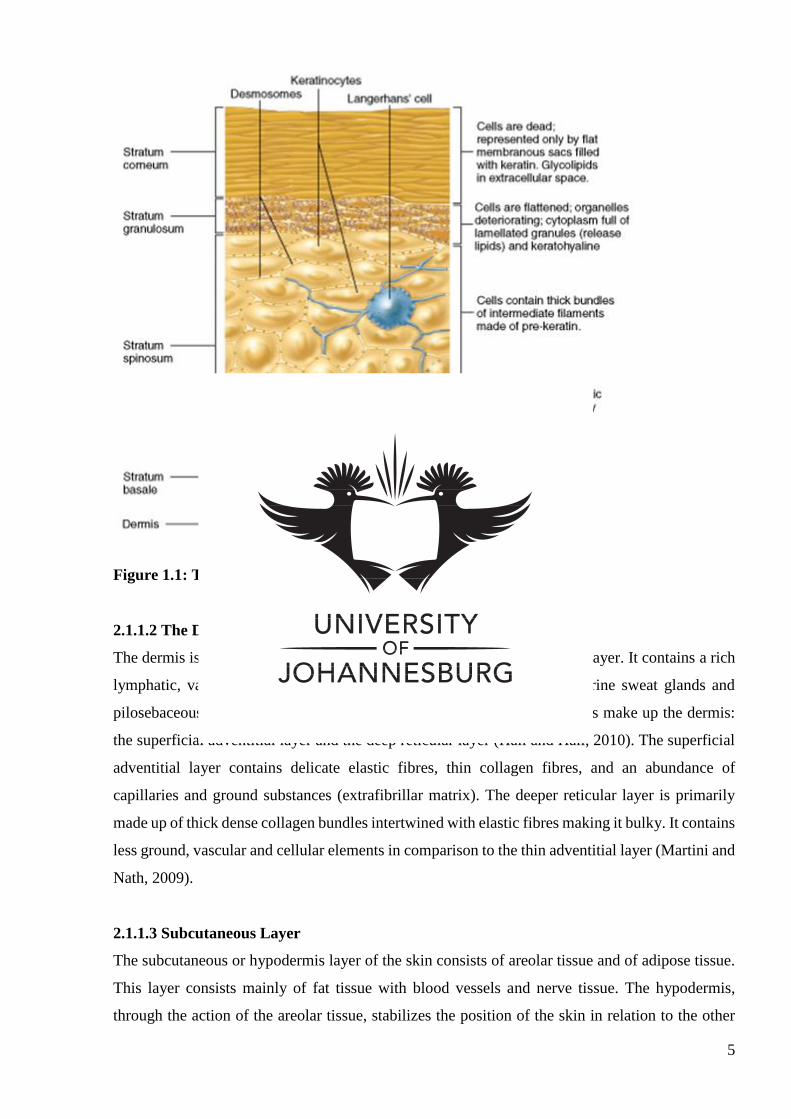
growth of microorganisms is discouraged (Martini and Nath, 2009). Figure 1.1 below illustrates
the various layers on the epidermis together with their components and functions.
5
Figure 1.1: The layers of the epidermis (Marieb and Hoehn, 2013)
2.1.1.2 The Dermis
The dermis is the layer lying between the epidermis and the subcutaneous layer. It contains a rich
lymphatic, vascular and nerve supply accompanied by eccrine and apocrine sweat glands and
pilosebaceous structures (Martini and Nath, 2009). Two major components make up the dermis:
the superficial adventitial layer and the deep reticular layer (Hall and Hall, 2010). The superficial
adventitial layer contains delicate elastic fibres, thin collagen fibres, and an abundance of
capillaries and ground substances (extrafibrillar matrix). The deeper reticular layer is primarily
made up of thick dense collagen bundles intertwined with elastic fibres making it bulky. It contains
less ground, vascular and cellular elements in comparison to the thin adventitial layer (Martini and
Nath, 2009).
2.1.1.3 Subcutaneous Layer
The subcutaneous or hypodermis layer of the skin consists of areolar tissue and of adipose tissue.
This layer consists mainly of fat tissue with blood vessels and nerve tissue. The hypodermis,
through the action of the areolar tissue, stabilizes the position of the skin in relation to the other
6
underlying structures, such as muscles, and provides nutrition and thermoinsulation to the skin
(Hull, 2011).
2.1.1.4 Vascular Supply
The skin contains a rather rich vascular supply providing the skin with blood volumes that far
exceed the necessary requirements. Due to the extensive blood supply, it had been suggested that
the primary function of the skin may in fact be heat regulation and blood pressure control instead
of nutrition to the skin (Hall and Hall, 2010). Cutaneous blood supply or the vascular plexus of the
skin arises from thick arteries residing in the subcutaneous layer. Two major vascular plexuses
running parallel to the epidermis exist: one in the deeper reticular dermis and the other in the
superficial dermis with vertical perforating divisions supplying blood to the skin appendages
(Martini and Nath, 2009).
2.1.1.5 Nerve Supply
The skin is regarded as a major sensory organ, as it contains thousands of nerve endings, constantly
receiving stimulation from the surroundings (Martini and Nath, 2009). Anything that comes into
contact with the skin causes a nerve impulse. The cutaneous blood vessels and skin appendages
receive efferent nerve supply from the sympathetic branch of the autonomic nervous system,
whereas the afferent nerve supply consists of a variety of different types of sensory receptors (Hull,
2011).
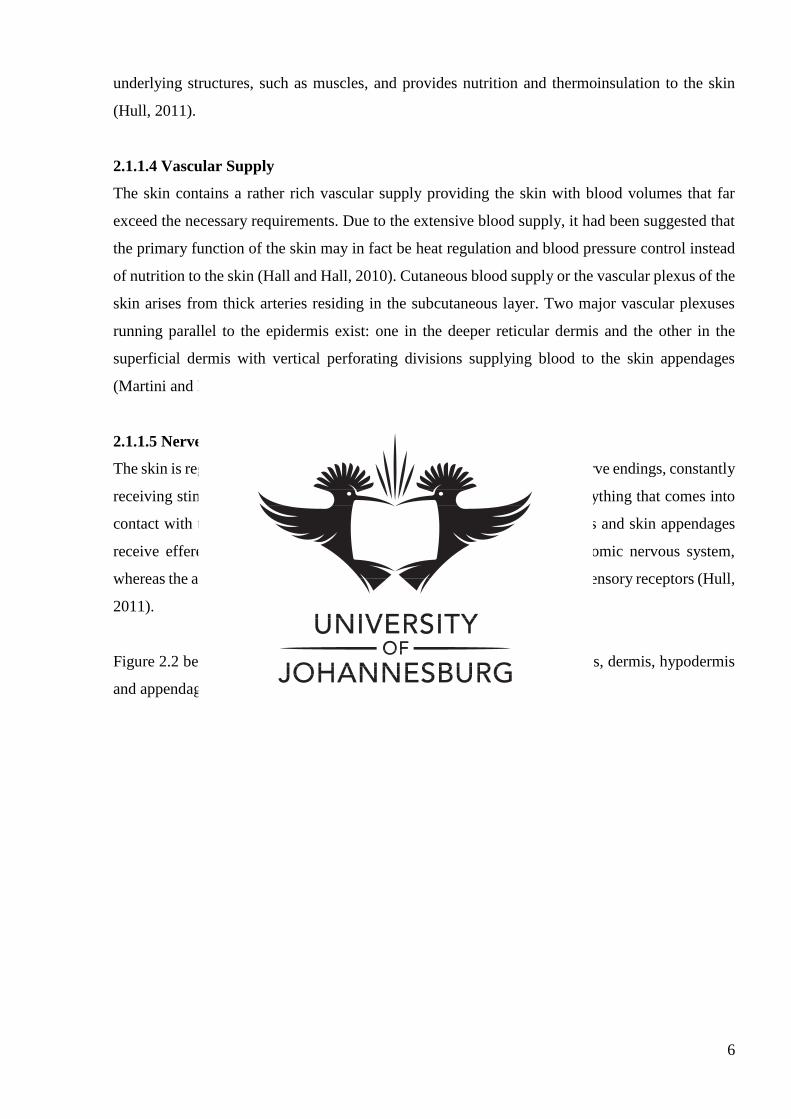
Figure 2.2 below illustrates the anatomy of the skin including the epidermis, dermis, hypodermis
and appendages.
7
Figure 2.2: Anatomy of the skin (Matthews, 2012)
2.1.1.6 Accessory Structures (Epidermal Appendages)
The appendages of the skin are made up of two types: cornified appendages, which are hair and
nails; and glandular appendages, including sebaceous glands and sweat glands (Martini and Nath,
2009).
Hair develops from almost every part of the human body covered by skin except the palms and the
soles. It is produced by a structure called the hair follicle. Hair is a keratin-containing filament that
is made up of a root and a shaft, and it is found in the hair follicle of the epidermis. Attached to
each hair follicle is a sebaceous gland which produces sebum into the follicle through the
sebaceous duct. The sebum is then discharged onto the skin’s surface where it inhibits bacterial
growth, and lubricates and protects the surrounding skin and the keratin in the hair shaft (Colledge
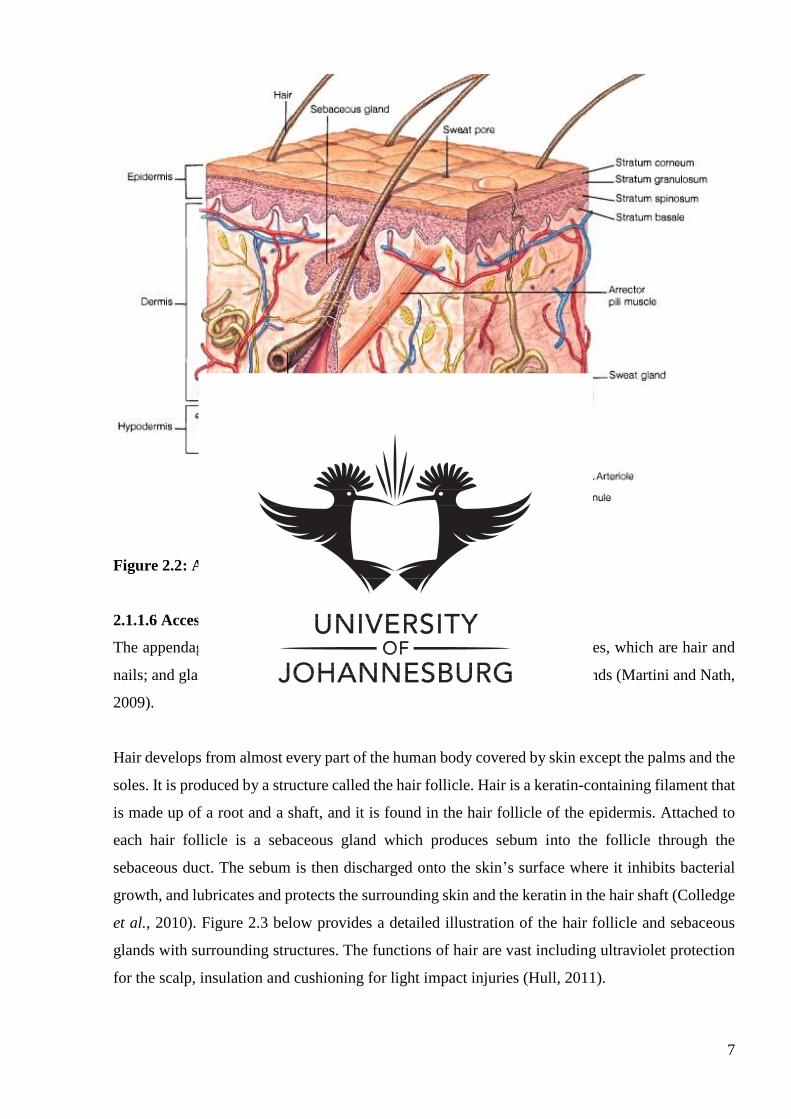
et al., 2010). Figure 2.3 below provides a detailed illustration of the hair follicle and sebaceous
glands with surrounding structures. The functions of hair are vast including ultraviolet protection
for the scalp, insulation and cushioning for light impact injuries (Hull, 2011).
8
Just like hair, the sebaceous glands are present on every part of the skin, except the palms and the
soles. They are a type of holocrine gland that secretes an oily lipid discharge into the hair follicles.
As the glands mature they produce large amounts of lipids called sebum (Hall and Hall, 2010).
Figure 2.3: Anatomy of the hair follicle (Dermweb, 2008)
2.2 Functions of the Skin
The following is a list of general functions of the skin (Martini and Nath, 2009):
1. Protection of the internal organs and tissues against impact and abrasion;
2. Water, salt and organic waste excretion;
3. Thermoregulation and insulation;
4. Ultraviolet radiation protection through the production of melanin;
5. Vitamin D synthesis which is important in calcium metabolism;
6. Lipid storage;
7. Detection of stimuli and the ability to relay information to the nervous system; and
8. Prevents the loss of essential fluids.
9
2.3 Dandruff
The word pityriasis capitis (dandruff), introduced to the world of dermatology by Galen, originates
from the Greek word ‘pityriasis’ which means bran-like (Rastegar, 2009). Dandruff, also known
as seborrhea sicca, pityriasis capitis or sicca capitis, can be defined as chronic non-inflammatory
scaling of the scalp, or an abnormality in the desquamation process which occurs on the scalp.
Scaling often occurs on the epidermal layer of the skin and can affect individuals to varying
degrees (Willet, 2010). The presenting white flakes of dandruff can be constant, recurrent or
sporadic and can vary in severity (Pierard–Franchimont et al., 2001). Two types of dandruff are
thought to exist: Common or dry dandruff and oily dandruff (Adamski, 2006).
Common or dry dandruff is characterized by the formation of tiny grey-white or pale coloured
flakes which accumulate on the scalp. Such flakes begin in the centre of the scalp and then move
towards the occipital and parietal regions of the scalp. The quality of the hair remains unchanged
and no excessive hair loss is present (Adamski, 2006).
Oily dandruff occurs in individuals who have varying degrees of sebum production on the scalp.
This type often occurs in individuals aged 18 to 24 years. Oily dandruff flakes appear more yellow
in colour and are accompanied by pruritis and hair loss in the affected areas (Adamski, 2006).
2.3.1 Epidemiology
Dandruff is an age-related condition. It is rarely seen prior to puberty, increases in occurrence in
post pubertal individuals, peaks in the early twenties, and declines in frequency in individuals over
50 years. According to American market research, at least 80-90% of people suffer from some
type of scaling disorder. Of that, 30-35% of those suffer from dandruff (Robbins, 2012). In terms
of the world adult population, at least 50% suffer from dandruff contributing to approximately 15-
25% of the total population (Prambhamanju et al., 2009). According to extrapolated statistics of
the United States, approximately 8 million South Africans suffer from dandruff (Pray, 2006).
Based on statistics from Proctor and Gamble Company (2002), 50% of Caucasians and 80% of
individuals with African lineage have suffered from dandruff at some time in their lives making it
one of the most common conditions apart from the common cold (Proctor and Gamble Company,
2002).
Some literature suggests that the greatest severity and prevalence occurs in young men of post
pubertal age due to androgenic influences (Pierard–Franchimont et al., 2001), and that the
10
condition worsens during the winter time, but this information seems to vary from source to source
(Ravichandran et al., 2004).
2.3.2 Aetiology and Pathogenesis
Since dandruff is a common problem, it has been subjected to considerable amounts of research.
Despite its common occurrence, very little is understood about the aetiology of the condition and
little progress has been made towards trying to understand dandruff (Harding et al., 2002).
Since the 19th century, many different causes for dandruff have been proposed. Through the years,
these propositions have been further studied in order to pin point a single cause of dandruff. The
aetiologic factors involved in causing dandruff can be described as multi-factorial, and includes
any combination of the Malassezia fungus, lipase activity, presence of sebum, lipid levels as well
as other factors such as stress, immune function, genetic susceptibility and humidity (Schwarts,
2003).
2.3.2.1 Malassezia
The most extensively studied cause of dandruff is the fungus Malassezia, previously called
Pityrosporum. The theory of the scalp peeling was already stated in 1874 by Malassez (Malassez,
1874).
The Malassezia genus can be divided into nine known species of lipophilic yeasts of which seven
are postulated to be the cause of dandruff (Arndt and Hsu, 2007).
The human scalp is home to many extensive colonies of microorganisms including Malassezia.
Malassezia is one of the normal scalp flora and usually comprises 46% of the total flora of a
healthy scalp. In a recent study, participants with dandruff presented with an excess of Malassezia
with amounts of up to 74%. Therefore, it is thought that a scalp flora imbalance and an overgrowth
of Malassezia plays a significant role in the condition and is considered as the most probable cause
of dandruff (Proctor and Gamble Company, 2002).
Malassezia species tend to accumulate in sebum rich areas such as the scalp. Malassezia are highly
dependent on lipids, and utilize the fatty acids present in regular sebum in order to thrive and
survive. The metabolites of Malassezia initiate many immune responses in the body resulting in
inflammation, thus contributing to dandruff (Ashbee and Bignell, 2010).
11
According to Percival and Cutting (2010), in a scalp affected by dandruff, the proportion of
Malassezia may proliferate by a factor of between 1 and 2 resulting in a total 75% occupation of
Malassezia on the scalp whereas in a healthy unaffected scalp, the total population of Malassezia
is 46%. Although Malassezia as the primary cause of dandruff is still under constant dispute, in
many reports it has been shown that patients with dandruff do in fact have increased proliferation
of Malassezia as well as an increased antibody titre of Malassezia.
A single species, Malassezia furfur, was previously seen as the primary causative factor of
dandruff. Recently, it has been discovered that these fungal species have the ability to
spontaneously change into a different fungal specie within the Malassezia genus. Thus, recent
studies have shown that the entire genus of Malassezia, together or individually, can cause
dandruff to accumulate on the scalp when they are found in excess (Arndt and Hsu, 2007).
Despite this increasing evidence to support and the strengthen the argument of Malassezia as the
single causative agent of dandruff, scientists still differ and insist on looking at the other factors as
stated previously.
2.3.2.2 Lipase activity
Lipase activity is another postulated aetiology for dandruff. As discussed above, Malassezia are
lipophilic yeasts that need lipids to survive. As the yeast absorbs the lipids or fats on the skin, they
release a specific fatty acid known as oleic acid that stays behind on the skin and in turn, due to
exposure, aggravates the skin. The oleic acid further penetrates the skin, specifically the layer
called the stratum corneum, disabling its primary function as a barrier. The skin attempts to rebuild
the destroyed barrier, but instead, it results in hyperproliferation as well as excessive sebum
production (Schwanke, 2002).
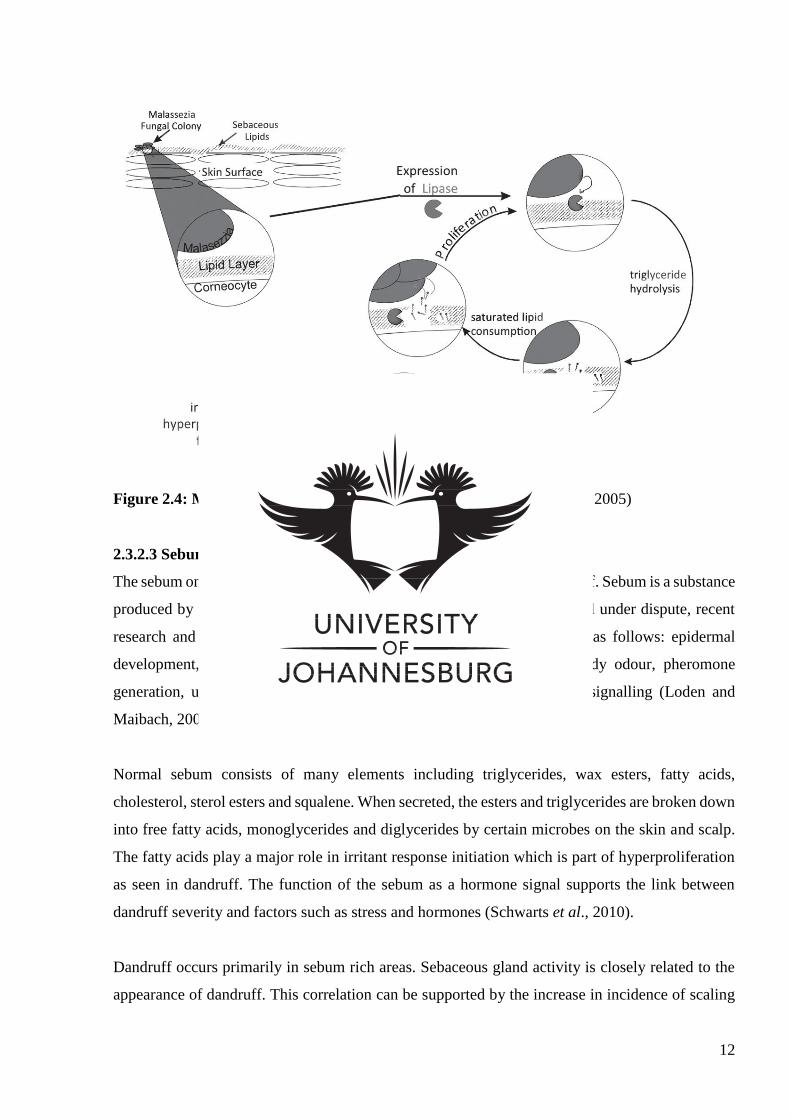
According to DeAngelis et al. (2005) a detailed model (illustrated below in Figure 2.4) describing
the metabolic pathways involved in the origination of dandruff can be proposed as follows. The
Malassezia yeast inhabits the surface of the scalp in an area called the follicular infundibulum or
the upper segment of the hair follicle. Hydrolytic enzymes such as lipase are secreted from the hair
cells into the extracellular environment. The lipase enzymes transform sebaceous triglycerides into
glycerol and fatty acids. The yeasts then consume the necessary fatty acids in order to proliferate,
leaving behind a large amount of unsaturated free fatty acids. These leftover fatty acids infiltrate
the epidermis stimulating a breach in the skins barrier and causing either direct or indirect irritation
of the skin which subsequently leads to flaking and hyperproliferation (DeAngelis et al., 2005).
12
Figure 2.4: Metabolic pathways involved in dandruff (DeAngelis et al., 2005)
2.3.2.3 Sebum
The sebum on the scalp seems to play a vital role in the formation of dandruff. Sebum is a substance
produced by the sebaceous glands. Although the function of sebum is still under dispute, recent
research and technology has supported that the functions of sebum are as follows: epidermal
development, barrier maintenance, antioxidant transport, protection, body odour, pheromone
generation, ultraviolet protection, epidermal regeneration and hormone signalling (Loden and
Maibach, 2000).
Normal sebum consists of many elements including triglycerides, wax esters, fatty acids,
cholesterol, sterol esters and squalene. When secreted, the esters and triglycerides are broken down
into free fatty acids, monoglycerides and diglycerides by certain microbes on the skin and scalp.
The fatty acids play a major role in irritant response initiation which is part of hyperproliferation
as seen in dandruff. The function of the sebum as a hormone signal supports the link between
dandruff severity and factors such as stress and hormones (Schwarts et al., 2010).
Dandruff occurs primarily in sebum rich areas. Sebaceous gland activity is closely related to the
appearance of dandruff. This correlation can be supported by the increase in incidence of scaling
13
in infants as seen with ‘cradle cap’, the decrease from infancy to adolescence, the rise during
adolescence and then the further decrease later in life (Gerson, 2004).
2.3.2.4 Lipid levels
In another research study conducted, researchers found that patients who suffer from dandruff may
have a reduced number of lipids in the scalp as well as in the body cells. The amount of lipids in
the cell is a fundamental element of the water barrier found in the epidermis (Loden and Maibach,
2000). The decreased lipid levels disturbs the capacity of the epidermis to hold water resulting in
increased attachment between the corneocytes and their respective desmasomes leading to the
typical scaling seen with dandruff (Harding et al., 2002).
2.3.2.5 Other Factors
Other contributing or exacerbating factors include high atmospheric humidity or climate. Dandruff
is usually more severe in winter and milder in summer as ultraviolet light counteracts the condition.
Genetic susceptibility, diet (poor nutrition and alcoholism), hormones (especially androgens),
physical and emotional stress, infrequent shampooing or poor hygiene and certain illnesses such
as Parkinsons disease or immune system diseases have also been implicated. Other less common
factors include excessive perspiration, inadequate rinsing of shampoo, tight head coverings and
excessive use of hair products such as hair spray and hair gel (Ravichandran et al., 2004). Although
these factors are not able to produce dandruff by themselves, they seem to contribute to the
exacerbation of the condition (Sage, 2005).
2.3.3 Pathophysiology
The shedding of the scalp is a normal physiological process and occurs in all human beings. The
skin of the scalp regenerates every 25-30 days as the basal cells mature and move to the stratum
corneum, the outermost layer of the skin, where they flatten, lose their nucleus and get shed. The
flaking on the scalp seen in dandruff is thought to be due to abnormal epidermal anatomy and
physiology. Hyperproliferation or rapid maturation of cells occurs in the stratum corneum of the
epidermis leading to flaking (Schwarts et al., 2010).
Migration takes place in 13-15 days, resulting in a disarray of cells and deregulation of
keratinization and corneocyte clumping which causes noticeable flaking (Pray, 2006). The stratum
corneum of a healthy scalp consists of 25-35 strong and closely adherent fully keratinized cell
layers. In the case of dandruff, that number of cell layers decreases to 10 irregularly arranged cells
together with hyperproliferation (Baran and Maibach, 1998). This results in shedding of dead skin
14
cells in clumps, leading to dry white-grey scaling appearing in areas of the scalp, particularly the
top of the head (Sage, 2005)
Irregularities in the stratum corneum occur throughout the scalp of individuals suffering from
dandruff (Schwarts et al., 2010).
2.3.4 Signs and Symptoms
Dandruff is characterized by loosely adherent small white-grey flakes. The flakes are generally
noticeable to the sufferer when brushing or combing the hair or on the shoulder area when dark
colour clothing is worn (Sage, 2005).
Scaling may be accompanied by itching of the scalp, irritation and also possible hair loss. In rare
cases, the skin can also become reddened with greasy patches and minute openings on the scalp
that may ooze a yellow liquid which later forms crusts (Jacoby and Moungson, 2005). Dandruff is
often referred to as a mild form of seborrheic dermatitis, but does not involve inflammation of the
skin. Dandruff also does not have an allergic origin and does not affect bald regions on the scalp
(Johnson and Nunley, 2000).
Although dandruff is not a serious or life threatening condition, even when left untreated,
occasional rare complications may arise when the cracks in the skin open. This may result in
infections or contagious skin diseases such as impetigo (Jacoby and Moungson, 2005).
The appearance of dandruff hardly ever suggests an underlying pathology and its effects are almost
completely cosmetic. It can be very distressing and embarrassing for the sufferer resulting in a
negative psychological impact. People may become very concerned and troubled by the
appearance and visibility of their dandruff, making dandruff a condition with a strong societal
stigma (Nowicki, 2006).
2.3.5 Differential Diagnosis
Many different conditions are commonly confused with dandruff as they share similar symptoms
as the condition. Conditions that are often wrongly diagnosed include psoriasis, Tinea capitis,
atopic eczema, allergic contact dermatitis, head lice and dry scalp (Thomas et al., 2001; Sage,
2005; Hall and Hall, 2010)
15
Psoriasis is typically a chronic recurring disease with characteristic scaling on well
demarcated salmon pink plaques. The plaques are thick with silvery scales and often bleed
when picked (Hall and Hall, 2010). Psoriasis lesions commonly affect the knees and
elbows, and nail involvement may lead to pitting and onycholysis. It can affect other areas
such as the scalp as well. The lesions of psoriasis are better demarcated and more easily
visible compared to the flakes found in dandruff (Thomas et al., 2001).
Tinea capitis or ringworm of the scalp is a fungal infection characterised by grey, scaly,
circular patches with broken off hair and balding (Hall and Hall, 2010). This differentiates
it from dandruff in two ways: dandruff does not involve balding or inflammation, and the
lesions found in Tinea capitis and all fungal infections leave vesicular borders with clear
margins (Sage, 2005). Two types of Tinea capitis exist: inflammatory and non-
inflammatory (Hall and Hall, 2010).
Atopic eczema also known as atopic dermatitis is a common, chronic, pruritic condition of
the skin that usually occurs in infants or adults. Infantile eczema consists of blistering,
crusting and oozing of lesions together with excoriation. Adult eczema is marked by
dryness, lichenification and scarring of the skin (Hall and Hall, 2010). Such lesions differ
significantly from the grey white flakes found in dandruff. In addition, unlike dandruff,
eczema has a strong familial link and more greasy scales (Thomas et al., 2001).
Contact dermatitis is an allergic reaction cause by exposure of the skin to an irritant
substance. This causes inflammation of the skin with lesions that appear red, edematous or
vesicular, with oozing of fluid not commonly seem in dandruff (Thomas et al., 2001, Hall
and Hall, 2010). Contact dermatitis may also cause pruritis (Sage, 2005).
Head lice, also known as Pediculus humanus capitis, affects people of all ages, particularly
those with lower socio-economic status due to lack of hygiene. It also commonly affects
kids in school. The nits of head lice are hard to remove, while the flakes of dandruff can
be easily detached from the scalp, thus differentiating the two conditions (Hall and Hall,
2010).

16
Dry scalp may also develop as a result of infrequent washing. This condition increases in
severity during the winter months. The flakes apparent on a dry scalp are smaller and less
oily than the flakes of dandruff (Thomas et al., 2001).
2.4 Dandruff Severity Measures
Many different measures can be used to measure the severity of dandruff.
One method involves brushing the hair vigorously for a certain amount of time and allowing the
scales to settle on a piece of paper. The paper is then measured in an analytical balance each time
the severity is measured. This method is not the best measure as it can be tedious and may be rather
inaccurate as scales on the paper can be from the dandruff and other scalp scaling disorders (Laden
and Finkelstein, 2000).
Another method involves brushing the hair with a particular brush in a particular direction. The
amount of strokes are also standardised. The flakes are collected on acetate plastic and weighed
once foreign materials are removed (Laden and Finkelstein, 2000).
The scales can also be measured by shampooing the hair and collecting the water in a plastic
bucket. Once the water is collected the scales remain suspended on the top or bottom of the water.
The scales are then filtered and collected for measuring (Saint-Ledger et al., 2000).
The Visual Analogue Scale (VAS) and Adherent Scalp Flake Score (ASFS) grading has also been
employed more recently for the measurement of dandruff scale as well as the accompanied
symptoms such as itching, greasiness, irritation and the social implications of the condition
perceived by the sufferer (Stubbs, 2000; Schwarts, 2012).
2.4.1 Visual Analogue Scale (VAS)
The visual analogue scale (VAS) is a measurement tool used to measure a characteristic that ranges
across a continuum of various values that cannot be measured directly with accuracy. The VAS is
used to give a subjective interpretation or self-report of a particular symptom. It was initially
formulated for the measure of pain, but has over the years been modified in order to suit individual
research requirements (Hauser and Walsh, 2008). According to Kelly (2001), the VAS is easy to
use and provides results that can be reproduced. It can also be applied to various practical
scenarios.
17
The VAS takes the form of a 10cm long line with descriptors that indicate the extremes on either
side of the line. Thus the 10cm long line is divided into 1cm units, each representing a number
from one to ten. Participants are requested to circle the unit which they feel matches the severity
of their condition at present: 10 being severe symptoms and 0 being no symptoms (Gift, 1989).
The modified VAS is a subjective measure which can be used to evaluate the symptoms of
dandruff including: scaling, irritation, greasiness and itching, as well the psychological effect of
dandruff on the participant, termed ‘global impression’ (Stubbs et al., 2000).
The VAS is the most commonly used scale of measure in terms of healthcare research (Johnson,
1997). Both self-perception and clinical assessment using VAS is regarded as a valid subjective
measure for participant’s evaluation of dandruff, as it exhibits a rational degree of reliability
(Stubbs et al., 2000)
2.4.2 Adherent Scalp Flake Score Grading (ASFS)
According to Baran and Maibach (1998), the Adherent Scalp Flake Score (ASFS) grading is the
primary measure used in many anti-dandruff trials. It is based on an 11 point scale of flaking,
ranging from 0 to 10 where 0 reveals no scaling and 10 reveals very heavy scaling. The scalp can
be divided into either 6 or 8 sections or anatomic sites on the scalp. The hair in each section is
parted in order to visualize the severity of the flaking in that particular atomic site on the scalp.
Each section is scored from 0 to 10. The scores are then added to give a total score out of 60 or 80
depending on the amount of sections examined. This evaluation method can be used effectively to
observe the condition over time (Schwarts, 2012).
The ASFS grading is one of the best methods for the assessment of seborrheic dermatitis and
dandruff as validated by various research trials and practice (Bacon, 2012). It is also used in private
practice by dermatologists to evaluate the extent of such conditions (Schwarts, 2012).
2.5 Treatment of Dandruff
The conventional approach for the treatment of dandruff does not provide a complete or a
permanent solution. Many different over-the-counter and prescription products are available, but
none with which complete cure is achieved. Symptoms generally recur as soon as the treatment is
stopped. According to Pierard (2008), treatment options available for dandruff may help, but do
not ultimately cure the condition as the recurrence rate of the condition is high. Some literature
18
describes dandruff as a lifelong condition (Reiman, 2003). Adverse effects are also commonly
found in numerous different treatment approaches making it unsafe for users (Nowicki, 2006).
There are also many alternative and complementary treatments available, including pale
suphonated shale oil.
2.5.1 Conventional Treatment
Treatment options for dandruff may be topical in the form of creams, ointment or shampoos, or
they can be taken orally (Gupta et al., 2004). The Consensus of the Expert Group of Polish
Dermatological Society Mycological Section has summarized and codified the pharmacological
treatment of dandruff. Based on the mechanism of action, anti-dandruff formulas can be classified
into three groups - fungicidal substances, cytostatic substances and keratolytic substances - each
with specific common active ingredients (Adamski, 2006). The table below illustrates the three
categories of anti-dandruff treatments as well as individual active ingredients which are
categorized into such groups. Product names are also stated together with their active anti dandruff
ingredients.
Figure 2.5: Examples of products used in the treatment of dandruff (Adamski, 2006)
2.5.1.1 Fungicidal Substances
This modern treatment approach is geared toward targeting the Malassezia yeast and decreasing
colonization of the yeast (Johnson and Nunley, 2000). Specific fungicidal substances include zinc
pyrithione and imidazole formulas (Gupta et al., 2004).
Fungicidal
substances
19
Zinc pyrithione acts by inhibiting cell wall transport in the fungal cell which leads to lysis of the
cell. It also manipulates the epidermal cells by enabling normalization of the cell layer. Zinc
pyrithione has a high lipid solubility rate and thus dissolves into the sebum allowing longer
maintenance of the substance in the epidermal layer, and subsequently increased fungicidal
activity (Pierard–Franchimont et al., 2001). Based on a study compiled by Sample et al. (2000),
zinc pyrithione was effective in treating moderate to severe dandruff with a 90% reduction in
pruritus and associated erythema of the scalp.
Unlike zinc pyrithione, imidizole formulas are hydrophilic and do not accumulate in lipid
environments making the required administration time for such formulas longer (Warner et al.,
2001). The most popular of all imidazole formulas is ketoconazole. It interferes with the synthesis
of ergosterol which is a fundamental element of the fungal cell wall structure (Nathan, 2010).
Ketoconazole can be used both topically and orally and is the most successful fungicidal agent in
the treatment of dandruff (Pierard, 2008). New formulas such as rilopirox, climbazole and lithium
succinate are at the stage of medical research as they hold promise to be successful agents for the
treatment of dandruff (Adamski, 2006).
Although fungicidal agents are effective in treating the symptoms of dandruff, side effects such as
local irritation, burning, stinging, erythema, and textural or colour changes of the hair have been
reported when used topically. Oral intake may cause side effects such as nausea, vomiting and
hepatotoxicity (Preedy, 2012).
2.5.1.2 Cytostatic Substances
Cytostatic substances act by regulating the accelerated speed of epidermal cell proliferation seen
in dandruff. This inhibits the peeling of the scalp and eliminates scaling or flaking, the signature
symptom of dandruff. The action of cytostatic substance is limited to the time of use of the
substance making it common for flakes to return after treatment cessation. Cytostatic substances
include selenium sulphide, coal tars and piroctolamine or Octopirox (Adamski, 2006).
Selenium sulphide preparations have proven efficacy in several studies as it has an antimitotic
effect on cells. Some studies suggest that selenium sulphide has an inhibitory effect on Malassezia
yeasts by changing the sulphydryl groups found in the yeast to firm polysulphide bonds, disabling
cell division (Nathan, 2010). Adverse effects of selenium sulphide include scalp irritation, dryness
20
of the scalp and hair, and possible hair loss (Preedy, 2012). Regular use of selenium sulphide can
cause excessive sebum production resulting in oily hair (Blenkinsopp et al., 2014).
Coal tars and derivatives thereof are the least effective anti-dandruff agents (Blenkinsopp et al.,
2014). The exact mechanism of action is disputable as coal tars do not appear to reduce cell
division. Instead, they prevent the appearance of flakes by hindering intracellular cement
formation. Coal tars also interfere with sebum formation, and have anti-pruritic actions (Nathan,
2010).
Side effects of coal tars car include skin sensitivity, such as allergic dermatitis or irritant dermatitis,
as well as photosensitivity. The appearance and odour of coal tars is rather unpleasant, making
suffers reluctant to use it. Coal tars can also cause an orange discolouration of the hair and scalp,
especially in far skinned individuals (Nathan, 2010). Other studies have also suggested coal tars
to have carcinogenic properties (Pierard–Franchimont et al., 2001), but this theory is still under
evaluation.
Piroctolamine is a water soluble pyrydinone derivative used in the treatment of dandruff (Adamski,
2006). Although the pharmacology of piroctolamine is not clearly understood, it has been
suggested that it disrupts the DNA repair of Malassezia yeasts (Boarder et al., 2010).
Numerous studies have also shown the efficacy of its use in dandruff but side effects such as
irritation of the skin can occur (Adamski, 2006).
2.5.1.3 Keratolytic Substances
Keratolytic agents are the oldest forms of anti-dandruff treatments and include coal tars (already
previously discussed), salicylic acid and sulphur-containing compounds (Gupta et al., 2004). Such
compounds aim to break up and loosen corneocyte bonds, resulting in the release of adherent scales
on the scalp in order to be washed away (Nathan, 2010)
Salicylic acid and other keratolytic substances may be accompanied by side effects, such as
erythema, further scaling and salicylate intoxication (Bolognia et al., 2003).
2.5.1.4 Anti-inflammatory Substances
Anti-inflammatory agents appear quite frequently in the literature regarding dandruff treatment.
Commonly topical corticosteroids are used when other topical treatments are ineffective.
Corticosteroids are employed as they hold anti-inflammatory and anti-pruritic properties. The use
21
of corticosteroids is not always advised unless the condition worsens and progresses into the more
severe form of dandruff, known as seborrheic dermatitis, where inflammation is involved (Pierard,
2008). It is also important to note that corticosteroid use can have adverse effects such as
folliculitis, acneform disorders, skin atrophy and an increased susceptibility to fungal infections
(Goodheart, 2009).
2.5.2 Complementary and Alternative Treatments
Alternative treatments are available for dandruff. Although most dermatologists do not agree with
such treatments, deeming them inadequate, many people place a lot of trust in them. These include
honey, lemon juice, apple cider vinegar, baking soda, tea tree oil, coconut oil and even mouthwash.
Supplements such as vitamin B, omega oils and zinc are recommended to help eradicate dandruff
(Colon, 2014). With regards to life style, reducing sugar, a healthy balanced diet, good hygiene
and frequent washing (to remove excess oil) are all believed to help control dandruff (Johnson and
Nunley, 2000). Many professionals in the hair care industry may also suggest reducing the use of
complementary hair products such as hair spray, gel and mousse (Sage, 2005).
According to Jacknin (2001), herbal therapies have been employed in the treatment of dandruff.
Herbs such as chamomile, calendula, thyme, rosemary and burdock root are all listed for the
treatment of dandruff as they may have astringent, anti-septic and anti-microbial properties which
can assist in the treatment of dandruff.
Other complementary therapies include probiotics such as Lactobacillus acidophilus and
Bifidobacterium bifidum which help to create a healthy internal microbial environment and assist
in fighting off the yeast infection (Jacknin, 2001)
Homeopathy can also be used to treat dandruff. Homeopathic remedies such as Arsenicum album,
Fluoric acid, Graphites, Sepia officinalis, Sulphur and Oleander are often used to treat dandruff.
However, with homeopathy, the remedy is chosen to match each individual patient respectively
(Jadhav, 2004).
According to Chhavi et al. (2011), conventional treatment options available for dandruff may have
many limitations due to either poor compliance or poor efficacy of the treatment. Conventional
treatments also have high recurrence rate making them unreliable. This warrants the need for
complementary and alternative treatment options. Chhavi et al. (2011) continues to state that the
best approach for the treatment of dandruff is to employ the use of herbal anti-dandruff shampoos,
22
in addition to a well-balanced diet. Nutritional and herbal treatments can potentially cause an
improvement in the condition within 6-8 weeks.
2.6 Sodium Shale Oil Sulphonate/Pale Sulfonated Shale Oil Shampoo
Sodium shale oil sulphonate 1% shampoo, trading as Ichthyol® Pale, is manufactured in Germany,
and distributed in South Africa by Lunar Pharmaceuticals. Ichthyol® Pale is a sodium shale oil
sulphonate which originates from keragon-containing sedimentary rock. Through the process of
distillation, the keragon rock produces a sulphur-rich shale oil which is purified, refined and
neutralized before use (Lunar Pharmaceuticals, 2014). Sodium shale oil sulphonate may be used
for the treatment of dandruff, as well as for skin complaints such as acne and blemishes (Sanders,
2008).
The following ingredients make up the base of the shampoo:
Aqua (Water)
Sodium laureth sulphate: Sodium laureth sulphate is one of the most common ingredients
used in numerous cosmetic products. It acts as a surfactant, detergent and emulsifier and
is found in many shampoos. Sodium laureth sulphate originates from coconuts and
provides foaming abilities to cosmetic products (Mercola, 2010). It aids in removing dirt
and oil from the hair but long term daily use of sodium laureth sulphate has been suggested
to cause excessive dryness of the hair and scalp as it interferes with the protective layer of
the skin and hair (SLS free, 2015).
Cocamidopropyl betaine: Cocamidopropyl betaine is also a coconut derived surfactant
which acts as a cleansing and foaming agent in many cosmetic products especially
shampoos and skin cleansing products. Although cocamidopropyl betaine is proposed as
safe by most governments, it can cause an allergic reaction in certain individuals (Case,
2013). According to Special chem (2013), cocamidopropyl betaine acts as a viscosity
controlling surfactant with conditioning, foaming, cleansing and antistatic properties.
Barel et al. (2010) claim that cocamidopropyl betaine may assist in decreasing irritation
on the scalp when added to shampoos.
Sweet almond-amphoacetate: Sweet almond is derived from the ripe seeds of the almond
tree. Sweet almond is most commonly used dermatologically as a moisturiser, anti-pruritic
agent and an anti-inflammatory agent. Sweet almond is generally used for conditions
accompanied by dryness and scaling. Topically, there are no adverse reactions to sweet
almond except if allergic tendencies are present (Wiles et al., 2011).
Sodium chloride: According to Leigh (2015), sodium chloride or table salt is used as a
thickener in many hair products. The use of sodium chloride in shampoos may cause
23
irritation to the eyes only if high salt contents are present. Excessive amounts of sodium
chloride many lead to irritation and dryness of the skin, but according to Born (2015), most
shampoos have a low sodium chloride content resulting in minimal concern.
According to Korting and Schmid (1998), sulphonated sodium shale oil, although classified as a
tar derivative, contains a different chemical composition when compared to other tar derivatives.
Sodium oil shale gives no indication of toxic or phototoxic effects, and it has good tolerance. It
also has strong anti-inflammatory effects as it blocks the formation of inflammatory mediators,
thus blocking any inflammatory reactions from taking place (Kandarova et al., 2005).
2.6.1 Shale Oil
Sodium shale oil sulphonate or pale sulfonated shale oil has a rather interesting development
history. In geological terms, the origin of sodium shale oil sulphonate goes back to the depositions
of microscopically minute phytoplankton or algae residing in a particular inlet environment found
in the Alpine region about 200-600 million years ago. Under certain climatic conditions, due to
biological degradation of the algae by sulphur rich bacteria, large amounts of naturally combined
sulphur were formed. The solid form of the biological material or biomass was formulated by the
development of the sulphur into a schist-like sedimentary rock or oil shale. In order to extract the
material from the earth, complex technical procedures are employed as the sulphuric deposits are
only found deep inside the mountains in which they develop (Lunar Pharmaceutics, 2014).
Once the mining of the rock is complete, a dry distillation process, lacking air, is performed as the
rock is gently heated. This allows the biomass to decompose only up to the extent where the rock
is converted from its solid form to a liquid form. This results in a sulphur-rich shale oil, unavailable
anywhere else worldwide (American Shale Oil Corp, 2015).
The shale oil undergoes another purification process in order to eliminate any excess solid particles
as well as high molecular elements. This allows a special low boiling shale oil fraction to be
produced. This then undergoes a gentle sulphonation reaction where the oil shale fraction reacts
with concentrated sulphuric acid and is neutralized with sodium hydroxide. The oil is then
converted into a water soluble substance that is able to act on the surface of the skin (Acton, 2013).
According to the literature, pale sulphonated shale oil has widespread dermatological uses as it is
believed to have anti-inflammatory, anti-microbial and anti-seborrheic properties (Lunar
24
Pharmaceutics, 2014). Based on its actions, pale sulphonated shale oil can be used for the
following:
1. Conditions with overproduction of the oil glands such as acne;
2. Bacterial and fungal infections;
3. Inflammatory conditions such as seborrheic dermatitis, atopic dermatitis and psoriasis;
4. Conditions of excess desquamation such as dandruff;
5. Venous leg ulcers; and
6. Wound healing (Willet, 2010).
Some of these applications will be discussed briefly in the related research section below.
2.7 Related Research
As mentioned above, pale sulphonated shale oil can be employed in many different dermatological
conditions.
According to a study performed by Gayko (2004), a 20% pale sulphonated shale oil hydrogel
formulation demonstrated tissue repairing and antimicrobial effects in wound healing. The formula
exhibited anti-bacterial effects against all the bacteria associated with impaired wound healing and
was well tolerated for long term topical use.
In a randomized, controlled multicentre study of 119 participants performed by Beckert et al
(2005), topical pale sulphonated shale oil was seen to be efficient in the treatment of leg ulcers.
The size of the ulcers in the experimental group participants was significantly smaller than the
ulcers of participants in the placebo group.
Korting et al (2010) conducted a study on 99 children suffering from mild to moderate atopic
eczema. Results of this trial showed that a topical preparation of 4% pale sulphonated shale oil
proved effective when comparing placebo and treatment groups. The formula also produced no
side effects, making it well tolerated for the treatment.
The safety of sodium shale oil sulphonate has been researched by Colcha et al. (2004). The studies
were conducted in order to deduce any acute or chronic toxicity of the substance as well as the
presence of carcinogenic, teratogenic and mutagenic properties. Sodium shale oil sulphonate was
administered both topically and internally in order to infer all the possible effects of this treatment.
It was found to be well tolerated for long or short term use, both locally and systemically, and had
no carcinogenic, teratogenic or mutagenic properties.
25
CHAPTER 3: METHODOLOGY
3.1 Research Sample
A representative sample of 40 participants, suffering from mild to moderate dandruff, were
recruited for the study via advertisements (Appendix A). The sample included both males and
females between the ages of 18 and 45 years. Advertisements were placed at the University of
Johannesburg Health Training Centre notice boards and restrooms, as well as in gyms and hair
salons in and around the South of Johannesburg. Relevant permission was given.
3.1.1 Inclusion Criteria
Participants were included if they were:
Males and females between the ages of 18 to 45 years;
Suffering from mild to moderate dandruff with itching, flaking, greasiness, irritation of the
scalp and possible hair loss (Kent, 2005);
Had a baseline Adherent Scalp Flaking Score grading ASFS score of ≥ 24; and
Had good general health.
3.1.2 Exclusion Criteria
Participants were excluded if they were:
Suffering from other conditions such as psoriasis, atopic dermatitis, contact dermatitis or tinea
capitis;
Diagnosed with systemic or chronic diseases (Appendix B);
Pregnant or lactating;
Currently on any chronic medication; and/or
Currently on treatment for dandruff.
Participants were requested to refrain from using any conventional, herbal or homeopathic
treatment for dandruff for the duration of the study. Only Sodium Shale Oil Sulfonate 1% shampoo
was used as treatment.
3.2 Research Procedure and Design
The research study was performed as a 16-day double-blind, placebo-controlled study design. The
research was conducted at the University of Johannesburg, Doornfontein Campus. The initial
consult (day zero) consisted of a full description and discussion of the research method with the
26
participant. Thereafter, the participant was requested to read a participant information form
(Appendix B) and sign a consent form (Appendix C). An evaluation based on the inclusion and
exclusion criteria, to determine whether the participant met the criteria for the research study, was
performed. A physical and general assessment was conducted to determine vital signs and health
status respectively (Appendix D). Thereafter, the participant’s dandruff was evaluated using the
Adherent Scalp Flaking Score (ASFS) grading (Appendix E), completed by the researcher, and
the Visual Analogue Scale (VAS), completed by both the participant (Appendix F) and the
researcher (Appendix G). The participants were divided into two groups by means of matched
pairing, according to the severity of dandruff of their dandruff (Appendix H). Based on the
determined group, the participants were given either the experimental (with active anti-dandruff
agents) or control (without active anti-dandruff agents) shampoo together with the directions for
the use of the shampoo. At the second consultation, which occurred on day 8, the participant’s
scalp was evaluated using the ASFS grading, completed by the researcher, and the VAS,
completed by the participant and the researcher. On day 16 (final consult), a final evaluation of the
participant’s dandruff was performed, using the same method described as with the second consult.
At each consult, all results were recorded. Participants were requested to wash the scalp once every
second day, starting from day one till day 16. Reminders to wash the scalp were sent to each
participant via SMS the night before they were due to wash their hair.
3.3 Medication administration
Each participant was given 200 ml of either Sodium Shale Oil Sulphonate 1% shampoo or placebo
shampoo for use over 16 days. Participants were requested to wash the scalp once every second
day (day 1, 3, 5, 7, 9, 11, 13, 15). Each time the scalp was washed, the participant was instructed
to use only 25ml of the shampoo which was measured out using a standard 25ml measuring cup
supplied. No other shampoo was used for the duration of the research.
3.4 Sodium Shale Oil Sulphonate 1%
Each bottle of the shampoo using the trade name Ichthyol Pale® contained 1% of Sodium Shale
Oil Sulphonate as the active anti-dandruff ingredient. The shampoo was produced by Lunar
Pharmaceutics which is a registered pharmaceutical company that maintains good manufacturing
procedures and is registered with the Pharmacy Council of South Africa. The shampoo was
produced, packaged and labelled by Lunar Pharmaceutics. The labels consisted of the numbers ‘1’
and ‘2’ to ensure that neither the participant nor the researcher was aware of which batch contained
the active ingredient and which batch contained the placebo. This was only determined at the end
of the study. The control shampoo was manufactured to look and feel the same as the experimental
27
shampoo but without the active anti-dandruff ingredient, sodium shale oil sulphonate. The
participants were given a particular bottle using matched pairing according to the severity of the
dandruff, to ensure a parametric distribution of the participants across the two groups.
3.5 Data Collection and Analysis
On completion of the study, Lunar Pharmaceutics disclosed the ingredients in the bottles labelled
‘1’ and ‘2’ for the purpose of the researcher to determine which participants were in the control
and experimental groups. All data was collated and an Exploratory Data Analysis (EDA) was
performed to determine group normality and comparability of the data. Parametric intergroup
analysis included the independent sample T- test, followed by intragroup analysis using the
repeated measures ANOVA test. Non-parametric intergroup analysis included the Mann-Whitney
U test, while intragroup analysis involved the Friedman or the Wilcoxon Signed-Ranks test (Van
Staden, 2014).
3.6 Reliability and validity measures
The Adherent Scalp Flake Score (ASFS) grading is one of the best methods for the assessment of
seborrheic dermatitis and dandruff as validated by various research trials and practice (Bacon,
2012). It is also used in private practice by dermatologists to evaluate the extent of such conditions
(Schwarts, 2012). The Visual Analogue Scale (VAS) is the most commonly used scale of measure
in terms of healthcare research (Johnson, 1997). Both self-perception and clinical assessment
using VAS is regarded as a valid subjective measure for participant’s evaluation of dandruff, as it
exhibits a rational degree of reliability (Stubbs et al., 2000)
3.7 Ethics
All information regarding procedures, duration and requirements of the study was provided and
explained to the participants as per the participant information form. In order to participate in the
study all participants were requested to sign the participant consent form. All participation in the
study was voluntary and withdrawal from the study could take place at any time. There were no
anticipated risk factors to the use of the shampoo. However, participants were advised to
discontinue the shampoo if any adverse reactions occurred and to contact the researcher. Privacy
and confidentiality of the participant was guaranteed by providing private consultations with the
researcher, and all information will be kept in a secure storage facility for five years to which only
the researcher and supervisor has access to. Anonymity was upheld by replacing the use of
participant names in the research with case numbers. Researcher and supervisor contact details
were made available to the participants should any further questions arise. In the event that results

28
were requested by the participant, they were made available. In case of any unforeseen
circumstances or outcomes, participants were referred to the relevant healthcare practitioner. In
the case of favourable data in the experimental Group as compared to the control Group, the
participants in the control Group were provided access to the shampoo at the end of the study. This
study was approved by the University of Johannesburg, Faculty of Health Sciences Higher Degrees
and Research Ethics committees (HDC01-65-2014) (AEC01-66-2014).
29
CHAPTER 4: RESULTS
4.1 Introduction
This chapter presents the results obtained from the study. The sample groups consisted of a
treatment group (Group 1) treated with Sodium Shale Oil Sulphonate 1% shampoo and a placebo
group (Group 2) treated with the shampoo without the active ingredient. Forty two participants,
suffering from mild to moderate dandruff were recruited for the study. Forty participants
completed the study and 2 participants did not complete the study due to poor compliance.
In order to statistically analyse the effect of sodium shale oil sulphonate 1% shampoo in the
treatment of dandruff, the independent and dependent variables were identified. The shampoo was
identified as the independent variable. The dependent variable was identified as the dandruff – as
a whole and represented by scaling, itching, irritation, greasiness and global impression – based
on the Visual Analogue Scale and the Adherent Scalp Flake Score grading. The interval/ratio scale
of measure was used as the scales used to measure the severity of the dandruff represent quantity
as well as equality of units. The value of zero is also absolute as no number exists below zero on
the measurement scales.
The statistical analysis includes the following:
Demographic data comprising of age and gender; and
Subjective and objective measurements collected from the Visual Analogue Scales and the
Adherent Scalp Flake Score grading discussed under intragroup and intergroup analysis.
The independent sample T-test (intergroup analysis) is a parametric statistical test used to
determine the presence or absence of statistical significance between the means of 2 different
groups. A significant difference in the means scores of the variables in the groups occurs when the
p sig (2-tailed) value is less than or equal to 0.05 (Lyman Ott and Longnecker, 2015).
The ANOVA – mixed between within subjects measures ANOVA (intragroup analysis) is a
parametric test used to compare the means of 2 groups based on 2 factors, the ‘within subject’
factor and the ‘between subject’ factor. A significant difference in the means scores of the variables
in the Groups occurs when the p (Wilks Lambda) value is less than or equal to 0.05 (Lyman Ott
and Longnecker, 2015).
30
The Friedman test (intragroup analysis) is a non-parametric statistical test used to measure
difference between sample groups. The Mann Whitney U test (intergroup analysis) is a non-
parametric test which compares the means of 2 populations and determines whether the population
means are equal or not. Both the Friedman and Mann Whitney U tests require p values of less than
0.05 for statistical significance to occur (Lyman Ott and Longnecker, 2015).
With regards to the Wilcoxin Signed Ranks test (intragroup analysis) test is a non-parametric
statistical test used to compare 2 related samples and to determine whether the means of the 2
samples differ. With respect to the Wilcoxin Signed Ranks test, the Bonferroni adjustment is
applied and statistical significance occurs if the p value is less than 0.016 (Lyman Ott and
Longnecker, 2015).
The Shapiro – Wilk test was performed for each variable in order to assess the normality of the
data. In the case of normally distributed data, parametric tests such as the independent samples T
test for intergroup analysis and the mixed between within subject ANOVA for intragroup analysis
were performed. With respect to abnormally distributed data, non-parametric tests such as the
Mann Whitney U test for intergroup analysis and the Friedman and Wilcoxin Signed Ranks tests
for intragroup analysis were used.
4.2 Participant Recruitment
As demonstrated in Figure 4.1, a total of 42 participants were assessed for eligibility from which
none were excluded as they all met the participation requirements and were included to participate
in the study. Of the 42 participants, 18 were given the active shampoo and 24 were given the
placebo shampoo randomly based on matched pairing on the basis of the severity of their dandruff.
As the result of the severity of dandruff being divided into 3 groups, unequal numbers were present
between the 2 groups.
One participant was lost from group 1 (treatment group) as the participant received a hair treatment
which did not allow the participant wash their hair every second day while using the shampoo.
One participant was also lost from group 2 (control group) due to failure to respond to contact
attempts. Therefore, 17 participants were analysed in group 1 and 23 participants were analysed
in group 2.
All the participants recruited met the participation criteria as they were all between the ages of 18
and 45 years old. All 42 participants suffered from mild to moderate dandruff with accompanied
31
symptoms such as itching, irritation, greasiness, flaking and possible hair fall and had a baseline
ASFS score of at least 24. None of the participants showed or reported any abnormalities in their
vital signs and no evidence of chronic disease was found or reported. None of the participants
suffered from any other scalp conditions and none of the female participants were pregnant or
lactating. None of the participants were on any current treatment for dandruff.
Recruitment for participants started in October 2014 and was completed in February 2015. All
participants commenced and completed the 16 day study by February 2015. Each participant was
requested to wash their hair every second day after the first wash with follow ups on days 8 and
16 of the 16 day study.
No adverse events or side effects were reported for any participants in both intervention groups.
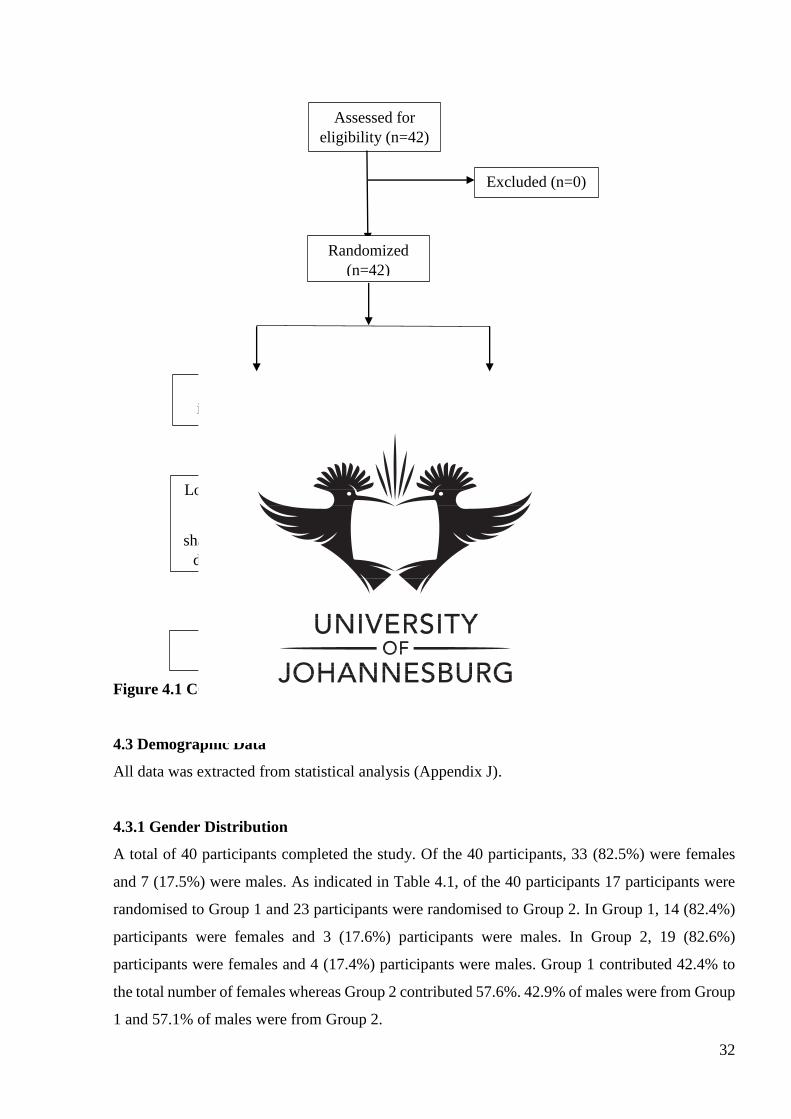
32
Figure 4.1 CONSORT Flow Chart of Participants
4.3 Demographic Data
All data was extracted from statistical analysis (Appendix J).
4.3.1 Gender Distribution
A total of 40 participants completed the study. Of the 40 participants, 33 (82.5%) were females
and 7 (17.5%) were males. As indicated in Table 4.1, of the 40 participants 17 participants were
randomised to Group 1 and 23 participants were randomised to Group 2. In Group 1, 14 (82.4%)
participants were females and 3 (17.6%) participants were males. In Group 2, 19 (82.6%)
participants were females and 4 (17.4%) participants were males. Group 1 contributed 42.4% to
the total number of females whereas Group 2 contributed 57.6%. 42.9% of males were from Group
1 and 57.1% of males were from Group 2.
Assessed for
eligibility (n=42)
Excluded (n=0)
Randomized
(n=42)
Allocated to active
intervention (n=18)
Allocated to placebo
intervention (n=24)
Lost to follow up (n=1)
Could not wash
shampoo every 2nd day
due to hair treatment
Lost to follow up (n=1)
Lack of response to
contact attempts
Analysed (n=17) Analysed (n=23)
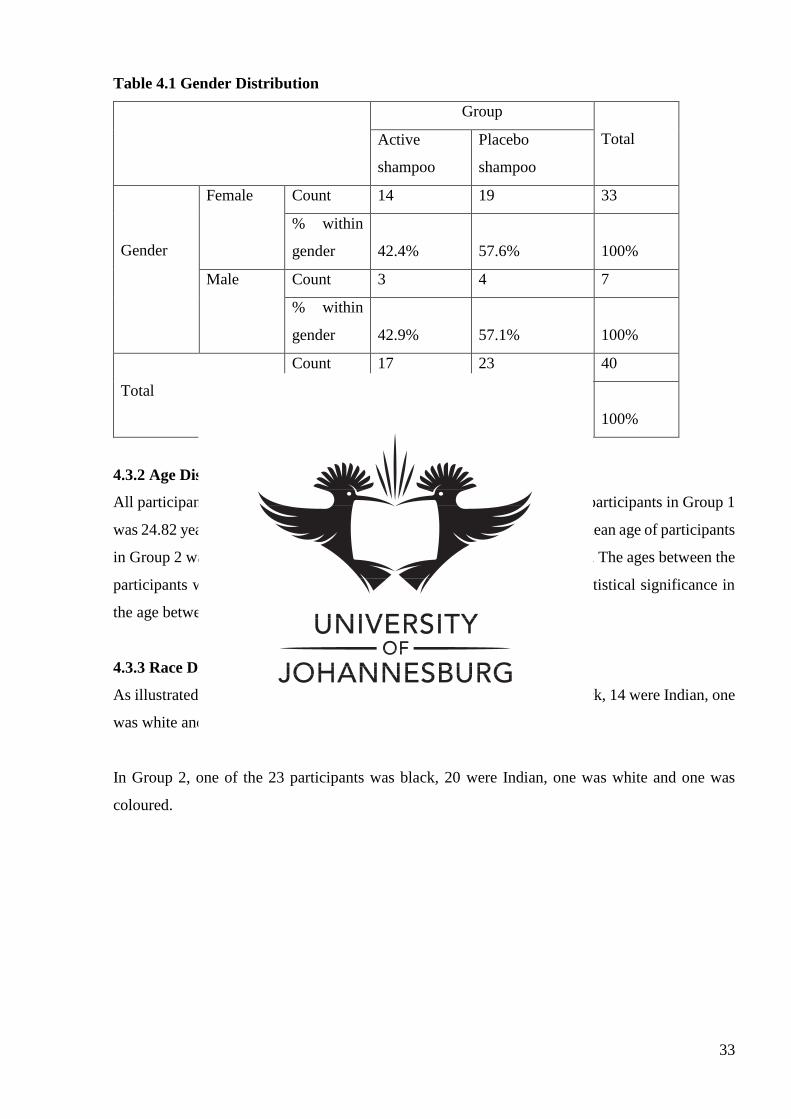
33
Table 4.1 Gender Distribution
Group
Total Active
shampoo
Placebo
shampoo
Gender
Female Count 14 19 33
% within
gender
42.4%
57.6%
100%
Male Count 3 4 7
% within
gender
42.9%
57.1%
100%
Total
Count 17 23 40
% within
gender
42.5%
57.5%
100%
4.3.2 Age Distribution
All participants were aged between 18 and 45 years. The mean age for the participants in Group 1
was 24.82 years with a minimum age of 18 and a maximum age of 38. The mean age of participants
in Group 2 was 27.78 with a minimum age of 18 and a maximum age of 45. The ages between the
participants were comparable as the p value was 0.161 and there is no statistical significance in
the age between the two groups.
4.3.3 Race Distribution
As illustrated in Figure 4.2, in Group 1, two of the 17 participants were black, 14 were Indian, one
was white and there were no coloured participants.
In Group 2, one of the 23 participants was black, 20 were Indian, one was white and one was
coloured.
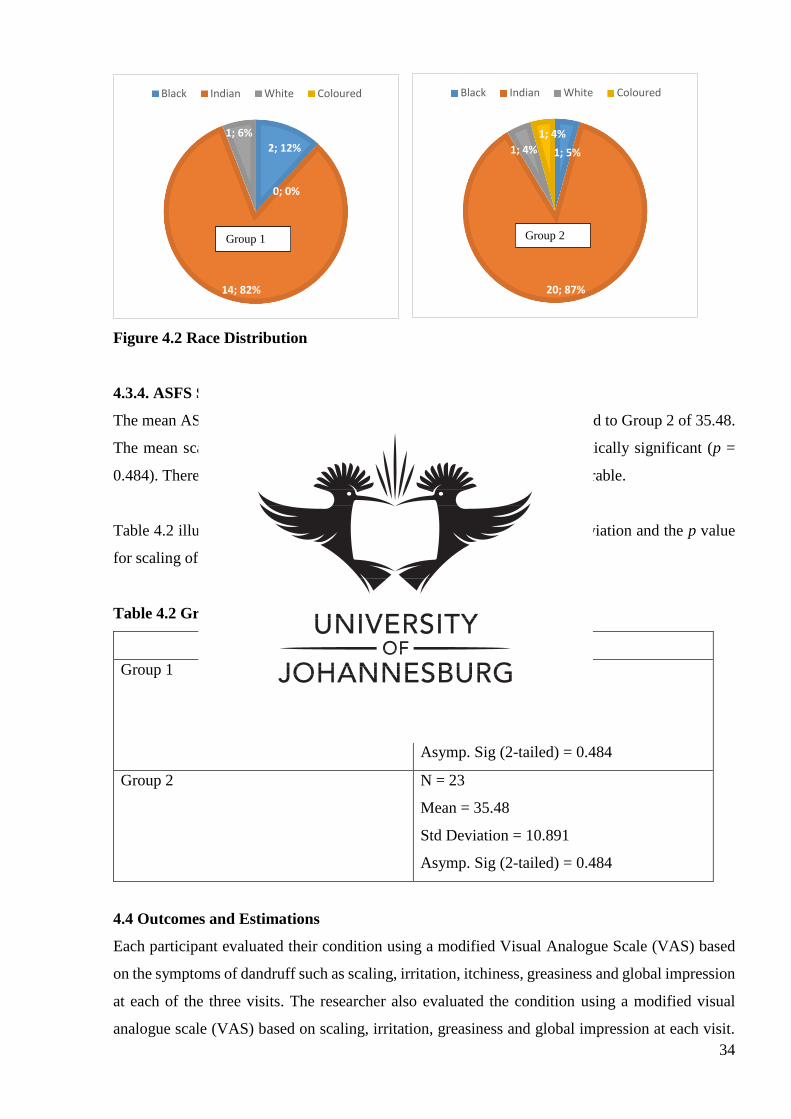
34
Figure 4.2 Race Distribution
4.3.4. ASFS Scores at Primary Visit
The mean ASFS grading score for Group 1 at visit 1 was 34 when compared to Group 2 of 35.48.
The mean scaling of the two groups at visit 1 was found not to be statistically significant (p =
0.484). Therefore, the mean scaling in the two groups at visit 1 was comparable.
Table 4.2 illustrates the number of participants, the mean, the standard deviation and the p value
for scaling of Groups 1 and 2 at visit 1.
Table 4.2 Group Statistics
Adherent Scalp Flake Score Grading (Visit 1)
Group 1 N = 17
Mean = 34
Std Deviation = 11.597
Asymp. Sig (2-tailed) = 0.484
Group 2 N = 23
Mean = 35.48
Std Deviation = 10.891
Asymp. Sig (2-tailed) = 0.484
4.4 Outcomes and Estimations
Each participant evaluated their condition using a modified Visual Analogue Scale (VAS) based
on the symptoms of dandruff such as scaling, irritation, itchiness, greasiness and global impression
at each of the three visits. The researcher also evaluated the condition using a modified visual
analogue scale (VAS) based on scaling, irritation, greasiness and global impression at each visit.
1; 5%
20; 87%
1; 4%
1; 4%
Black Indian White Coloured
2; 12%
14; 82%
1; 6%
0; 0%
Black Indian White Coloured
Group 1 Group 2
35
The scalp was also analysed and evaluated by the researcher using the ASFS grading. The
outcomes of each symptom evaluated by the participant and the researcher will be discussed
individually below followed by the ASFS grading scores.
4.4.1 Scaling
4.4.1.1 Participant VAS Evaluation
Comparable Scaling
The mean scaling for Group 1 at visit 1 was 6.35 when compared to Group 2 of 5.39. The mean
scaling of the two groups at visit 1 was found not to be statistically significant (p = 0.212).
Therefore, the mean scaling in the two groups at visit 1 was comparable.
Table 4.3 illustrates the number of participants, the mean, the standard deviation and the p value
for scaling of Groups 1 and 2 at visit 1.
Table 4.3 Group statistics
Visual Analogue Scale – Scaling (Visit 1)
Group 1 N = 17
Mean = 6.35
Std Deviation = 2.370
Sig (2-tailed) = 0.212
Group 2 N = 23
Mean = 5.39
Std Deviation = 2.369
Sig (2-tailed) = 0.212
Intragroup Analysis
Figure 4.3 demonstrates the changes in the means of scaling in the two groups between visits one
and two, visits two and three and visits one and three.
For Group 1 the mean of 6.35 for scaling at visit 1 dropped to 3.53 at visit 2. The mean then
dropped to 1.47 by visit 3. This indicates a total mean score improvement of 4.88 (76.9%).
For Group 2 the mean of 5.39 for scaling at visit 1 dropped to 3.91 at visit 2. The mean then
dropped to 2.96 by visit 3. Indicating a total mean score improvement of 2.43 (45.1%).
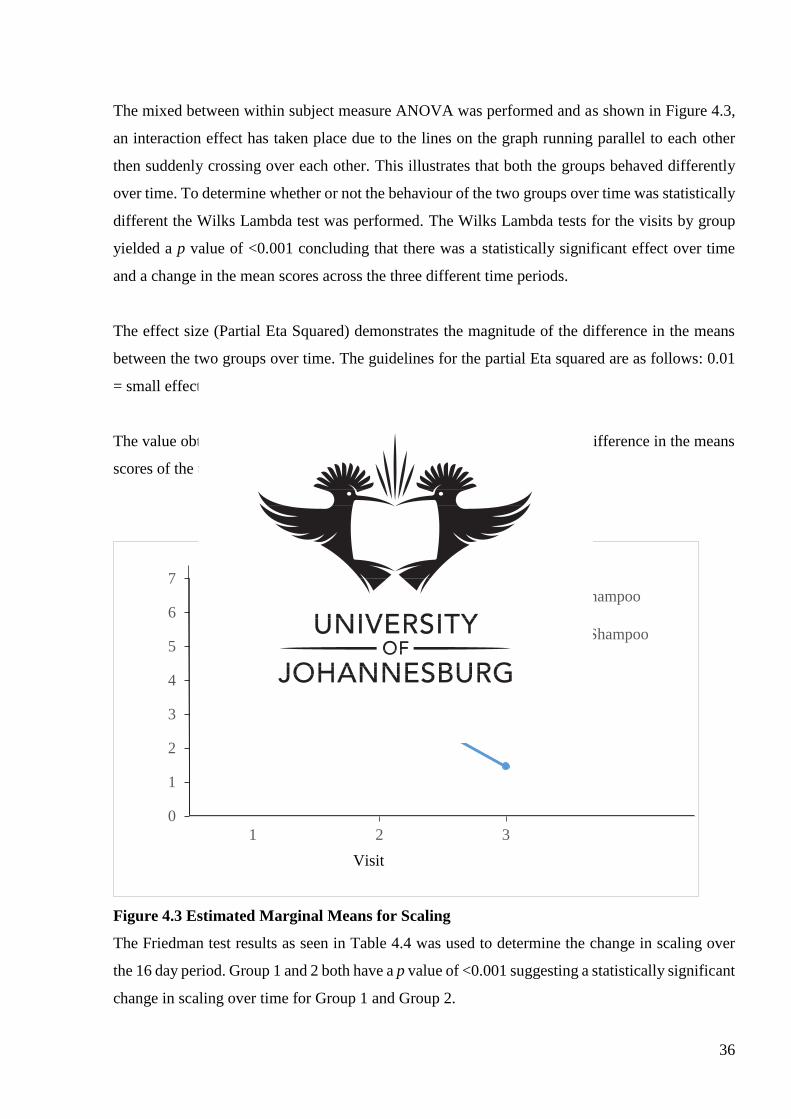
36
The mixed between within subject measure ANOVA was performed and as shown in Figure 4.3,
an interaction effect has taken place due to the lines on the graph running parallel to each other
then suddenly crossing over each other. This illustrates that both the groups behaved differently
over time. To determine whether or not the behaviour of the two groups over time was statistically
different the Wilks Lambda test was performed. The Wilks Lambda tests for the visits by group
yielded a p value of <0.001 concluding that there was a statistically significant effect over time
and a change in the mean scores across the three different time periods.
The effect size (Partial Eta Squared) demonstrates the magnitude of the difference in the means
between the two groups over time. The guidelines for the partial Eta squared are as follows: 0.01
= small effect, 0.06 = moderate effect, and 0.14 = large effect.
The value obtained for the partial Eta squared = 0.770 concluding a large difference in the means
scores of the two groups over time.
Figure 4.3 Estimated Marginal Means for Scaling
The Friedman test results as seen in Table 4.4 was used to determine the change in scaling over
the 16 day period. Group 1 and 2 both have a p value of <0.001 suggesting a statistically significant
change in scaling over time for Group 1 and Group 2.
0
1
2
3
4
5
6
7
1 2 3
Estimated Marginal Means of Scaling
Active Shampoo
Placebo Shampoo
Visit
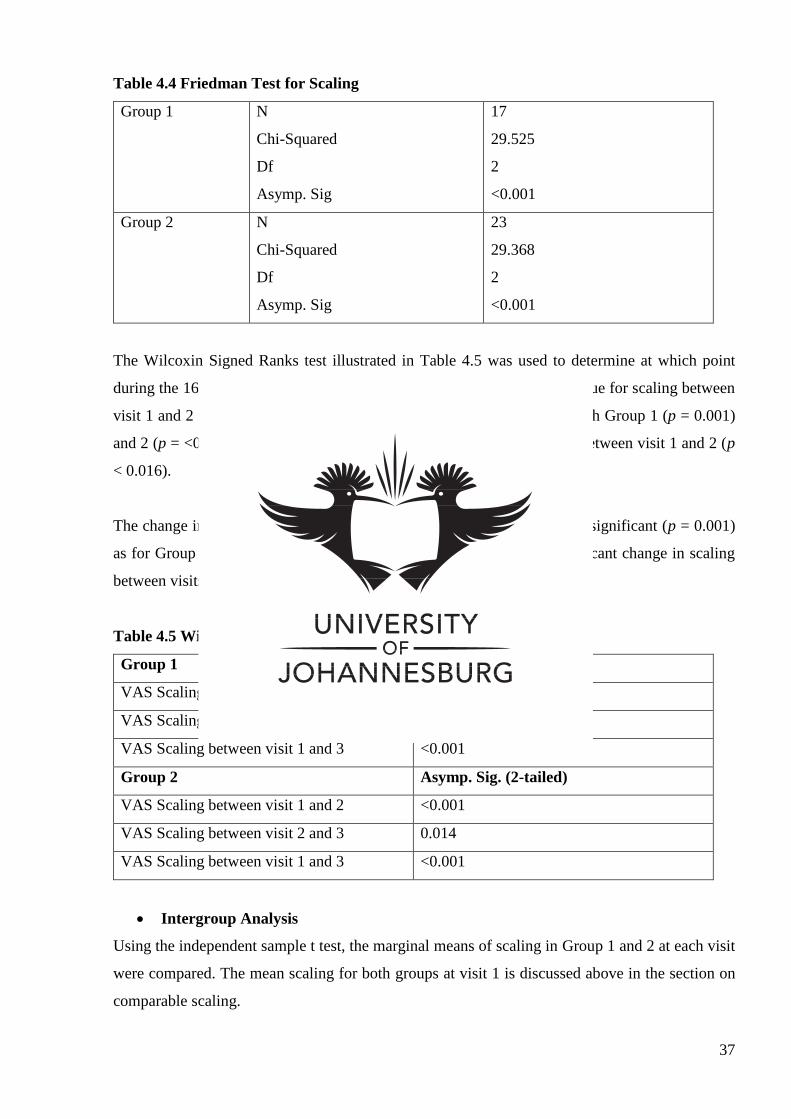
37
Table 4.4 Friedman Test for Scaling
Group 1 N
Chi-Squared
Df
Asymp. Sig
17
29.525
2
<0.001
Group 2 N
Chi-Squared
Df
Asymp. Sig
23
29.368
2
<0.001
The Wilcoxin Signed Ranks test illustrated in Table 4.5 was used to determine at which point
during the 16 day trial significant changes in scaling took place. The p value for scaling between
visit 1 and 2 for Group 1 was 0.001 compared to <0.001 for Group 2. Both Group 1 (p = 0.001)
and 2 (p = <0.001) displayed a statistically significant change in scaling between visit 1 and 2 (p
< 0.016).
The change in scaling between visit 2 and 3 for Group 1 was statistically significant (p = 0.001)
as for Group 2 (p = 0.014). Both Group 1 and 2 had a statistically significant change in scaling
between visits 1 and 3 as p = <0.001.
Table 4.5 Wilcoxin Signed Ranks Test for Scaling
Group 1 Asymp. Sig. (2-tailed)
VAS Scaling between visit 1 and 2 0.001
VAS Scaling between visit 2 and 3 0.001
VAS Scaling between visit 1 and 3 <0.001
Group 2 Asymp. Sig. (2-tailed)
VAS Scaling between visit 1 and 2 <0.001
VAS Scaling between visit 2 and 3 0.014
VAS Scaling between visit 1 and 3 <0.001
Intergroup Analysis
Using the independent sample t test, the marginal means of scaling in Group 1 and 2 at each visit
were compared. The mean scaling for both groups at visit 1 is discussed above in the section on
comparable scaling.
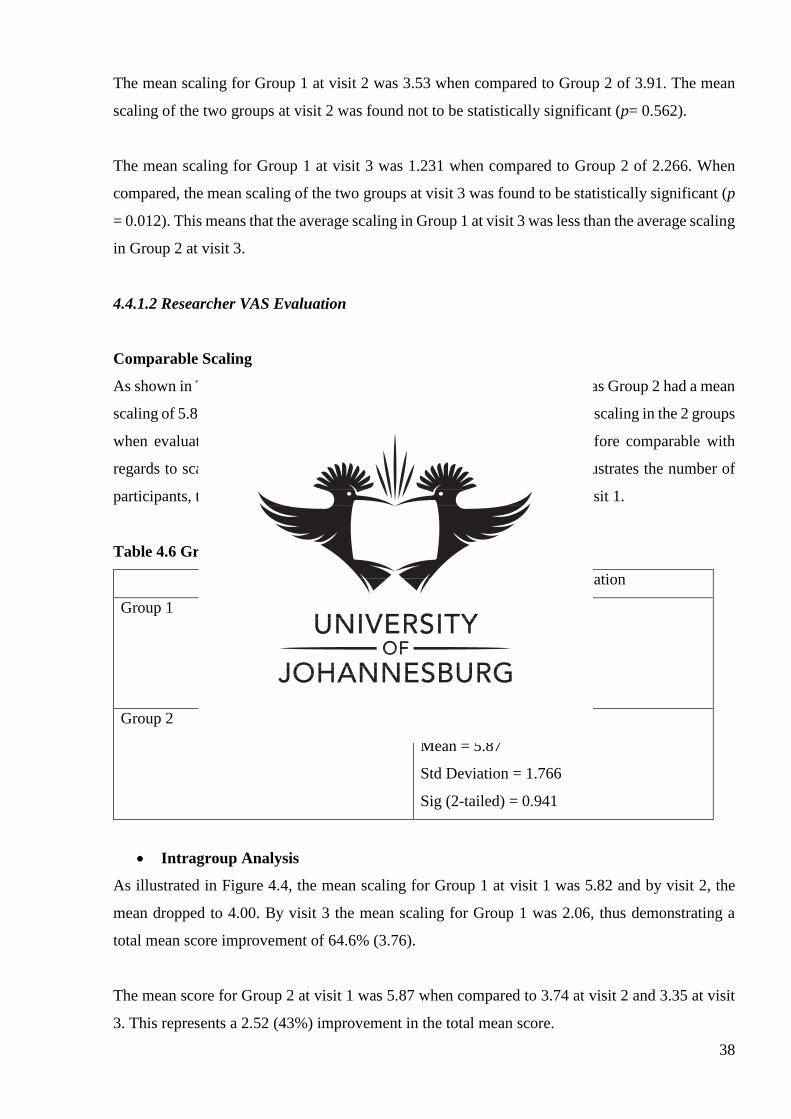
38
The mean scaling for Group 1 at visit 2 was 3.53 when compared to Group 2 of 3.91. The mean
scaling of the two groups at visit 2 was found not to be statistically significant (p= 0.562).
The mean scaling for Group 1 at visit 3 was 1.231 when compared to Group 2 of 2.266. When
compared, the mean scaling of the two groups at visit 3 was found to be statistically significant (p
= 0.012). This means that the average scaling in Group 1 at visit 3 was less than the average scaling
in Group 2 at visit 3.
4.4.1.2 Researcher VAS Evaluation
Comparable Scaling
As shown in Table 4.6, at visit 1, Group 1 had a mean scaling of 5.82 whereas Group 2 had a mean
scaling of 5.87. There was found to be no statistical significance in the mean scaling in the 2 groups
when evaluated by the researcher (p = 0.941). The 2 groups were therefore comparable with
regards to scaling evaluated by the researcher at visit 1. Table 4.6 also illustrates the number of
participants, the standard deviation and the p value for Groups 1 and 2 at visit 1.
Table 4.6 Group Statistics
Visual Analogue Scale – Scaling (Visit 1) – Researcher evaluation
Group 1 N = 17
Mean = 5.82
Std Deviation = 2.157
Sig (2-tailed) = 0.941
Group 2 N = 23
Mean = 5.87
Std Deviation = 1.766
Sig (2-tailed) = 0.941
Intragroup Analysis
As illustrated in Figure 4.4, the mean scaling for Group 1 at visit 1 was 5.82 and by visit 2, the
mean dropped to 4.00. By visit 3 the mean scaling for Group 1 was 2.06, thus demonstrating a
total mean score improvement of 64.6% (3.76).
The mean score for Group 2 at visit 1 was 5.87 when compared to 3.74 at visit 2 and 3.35 at visit
3. This represents a 2.52 (43%) improvement in the total mean score.
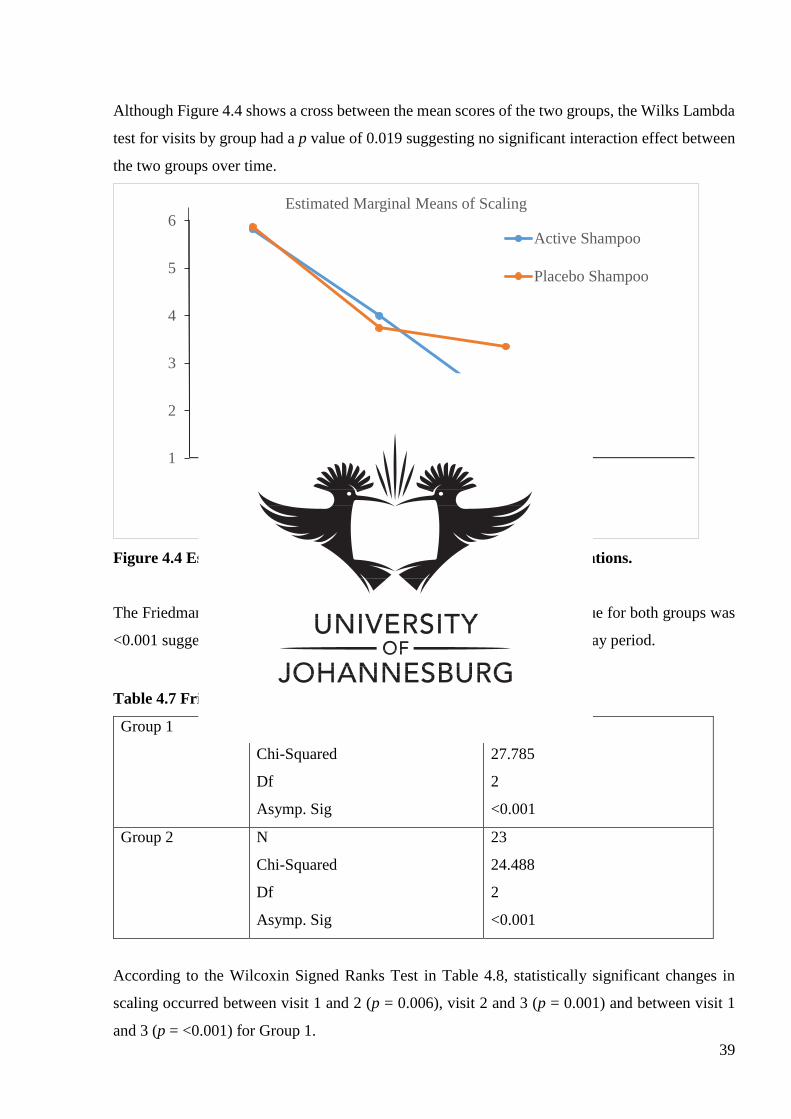
39
Although Figure 4.4 shows a cross between the mean scores of the two groups, the Wilks Lambda
test for visits by group had a p value of 0.019 suggesting no significant interaction effect between
the two groups over time.
Figure 4.4 Estimated Marginal Means for Scaling – Researcher Evaluations.
The Friedman test was performed and as illustrated in Table 4.7, the p value for both groups was
<0.001 suggesting a statistically significant change in scaling over the 16 day period.
Table 4.7 Friedman Test for Scaling – Researcher Evaluations
Group 1 N
Chi-Squared
Df
Asymp. Sig
17
27.785
2
<0.001
Group 2 N
Chi-Squared
Df
Asymp. Sig
23
24.488
2
<0.001
According to the Wilcoxin Signed Ranks Test in Table 4.8, statistically significant changes in
scaling occurred between visit 1 and 2 (p = 0.006), visit 2 and 3 (p = 0.001) and between visit 1
and 3 (p = <0.001) for Group 1.
1
2
3
4
5
6
1 2 3
Estimated Marginal Means of Scaling
Active Shampoo
Placebo Shampoo
Visit
40
For Group 2, statistically significant changes in scaling only occurred between visit 1 and 2 and
visit 1 and 3 (p = <0.001). The results showed that there was no statistically significant change in
scaling between visit 2 and 3 as p = 0.232.
Table 4.8 Wilcoxin Signed Ranks Test for Scaling – Researcher Evaluations
Group 1 Asymp. Sig. (2-tailed)
VAS Scaling between visit 1 and 2 0.006
VAS Scaling between visit 2 and 3 0.001
VAS Scaling between visit 1 and 3 <0.001
Group 2 Asymp. Sig. (2-tailed)
VAS Scaling between visit 1 and 2 <0.001
VAS Scaling between visit 2 and 3 0.232
VAS Scaling between visit 1 and 3 <0.001
Intergroup Analysis
As already stipulated, the mean scaling between the two groups was found to be comparable for
visit 1.
The mean scaling at visit 2 for Group 1 was 4.00, whereas Group 2 had a mean scaling of 3.47 at
visit 2. Since p = 0.587, there appears to be no statistically significant difference in the mean
scaling for both groups at visit 2.
At visit 3, Group 1 had a mean scaling of 2.06 when compared to Group 2 of 3.35. There seems to
be a statistically significant change in the mean scaling at visit 3 (p = 0.019) in favour of the
treatment group.
4.4.2 Irritation
4.4.2.1 Participant VAS Evaluation
Comparable Irritation
The mean scores for irritation at visit 1 were 5.12 in Group 1 and 4.43 in Group 2 respectively.
The mean scores for irritation in the 2 groups were comparable as there was no statistically
significant difference in the mean scores for irritation at visit 1 (p = 0.465).
41
Table 4.9 displays the mean, the standard deviation and the p value for irritation in Group 1 and 2
at visit 1.
Table 4.9 Group Statistics
Visual analogue scale – Irritation (Visit 1)
Group 1 N = 17
Mean = 5.12
Std Deviation = 2.547
Asymp. Sig (2-tailed) = 0.465
Group 2 N = 23
Mean = 4.43
Std Deviation = 3.174
Asymp. Sig (2-tailed) = 0.465
Intragroup Analysis
The mean changes for irritation between visits 1, 2 and 3 are illustrated in Figure 4.5.
For Group 1, the mean of 5.12 for irritation at visit 1 decreased to 2.35 at visit 2 and reached 1.29
by visit 3. The total mean score dropped by 3.83 (74.8%).
For Group 2, the mean of 4.43 for irritation at visit 1 decreased to 2.96 at visit 2 and reached 2.09
by visit 3. The total mean score decreased by 2.34 (52.8%).
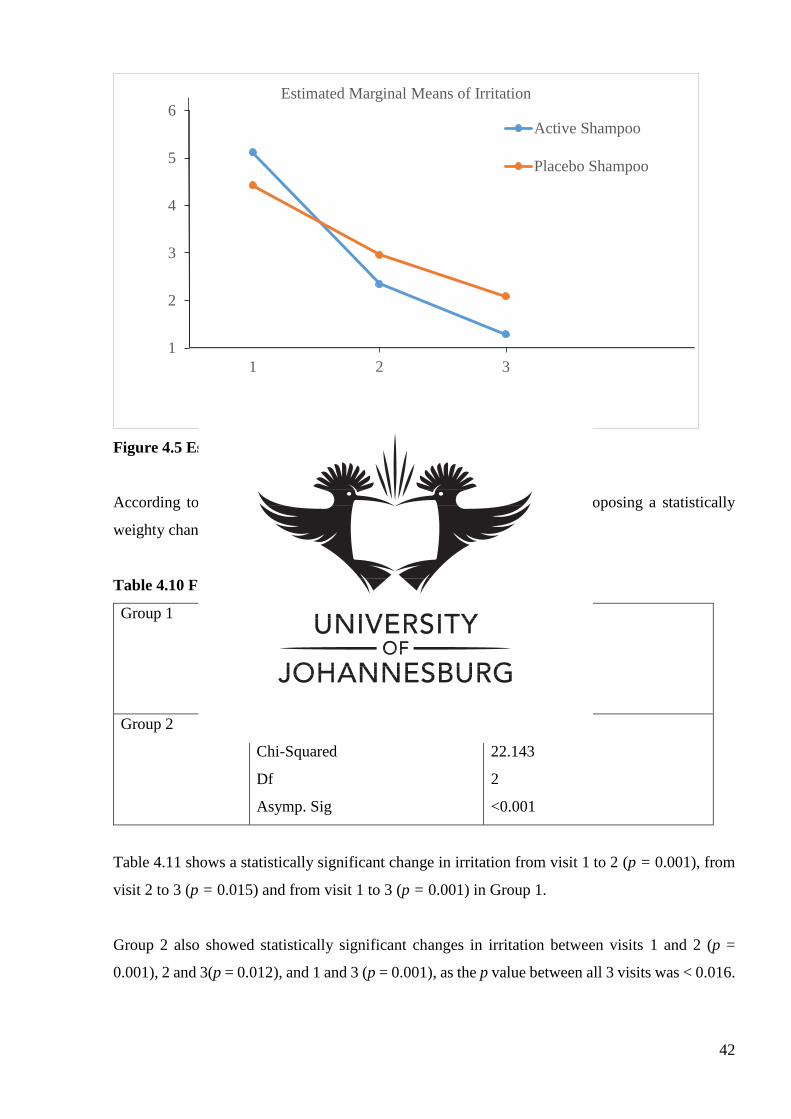
42
Figure 4.5 Estimated Marginal Means for Irritation
According to Table 4.10, the p value for Group 1 and 2 was <0.001 proposing a statistically
weighty change in irritation from visit 1 to visit 3.
Table 4.10 Friedman Test for Irritation
Group 1 N
Chi-Squared
Df
Asymp. Sig
17
21.733
2
<0.001
Group 2 N
Chi-Squared
Df
Asymp. Sig
23
22.143
2
<0.001
Table 4.11 shows a statistically significant change in irritation from visit 1 to 2 (p = 0.001), from
visit 2 to 3 (p = 0.015) and from visit 1 to 3 (p = 0.001) in Group 1.
Group 2 also showed statistically significant changes in irritation between visits 1 and 2 (p =
0.001), 2 and 3(p = 0.012), and 1 and 3 (p = 0.001), as the p value between all 3 visits was < 0.016.
1
2
3
4
5
6
1 2 3
Estimated Marginal Means of Irritation
Active Shampoo
Placebo Shampoo
Visit
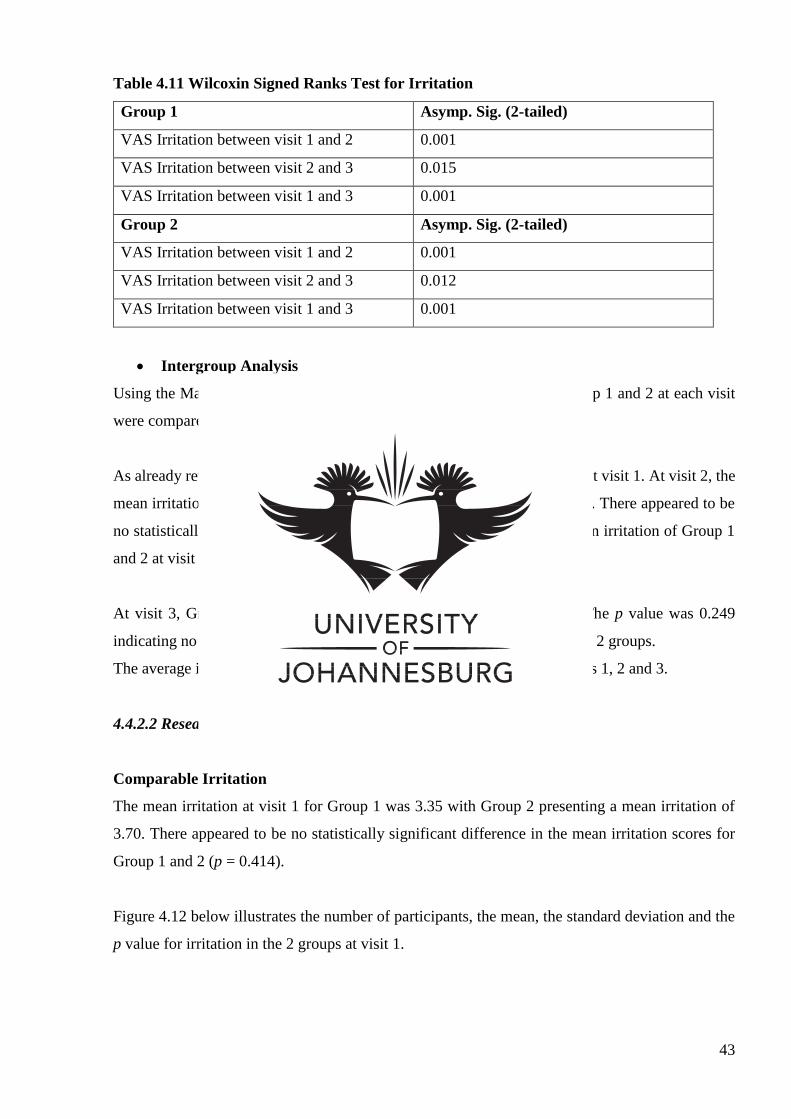
43
Table 4.11 Wilcoxin Signed Ranks Test for Irritation
Group 1 Asymp. Sig. (2-tailed)
VAS Irritation between visit 1 and 2 0.001
VAS Irritation between visit 2 and 3 0.015
VAS Irritation between visit 1 and 3 0.001
Group 2 Asymp. Sig. (2-tailed)
VAS Irritation between visit 1 and 2 0.001
VAS Irritation between visit 2 and 3 0.012
VAS Irritation between visit 1 and 3 0.001
Intergroup Analysis
Using the Mann Whitney U test, the marginal means for irritation in Group 1 and 2 at each visit
were compared.
As already revealed, the mean irritation showed no statistical significance at visit 1. At visit 2, the
mean irritation for Group 1 was 2.35 whereas Group 2 had a mean of 2.96. There appeared to be
no statistically significant difference in irritation when comparing the mean irritation of Group 1
and 2 at visit 2 (p = 0.697).
At visit 3, Group 1 had a mean of 1.29 compared to Group 2 of 2.09. The p value was 0.249
indicating no statistically significant difference in the mean irritation of the 2 groups.
The average irritation was therefore relatively equal in the 2 groups at visits 1, 2 and 3.
4.4.2.2 Researcher VAS Evaluation
Comparable Irritation
The mean irritation at visit 1 for Group 1 was 3.35 with Group 2 presenting a mean irritation of
3.70. There appeared to be no statistically significant difference in the mean irritation scores for
Group 1 and 2 (p = 0.414).
Figure 4.12 below illustrates the number of participants, the mean, the standard deviation and the
p value for irritation in the 2 groups at visit 1.
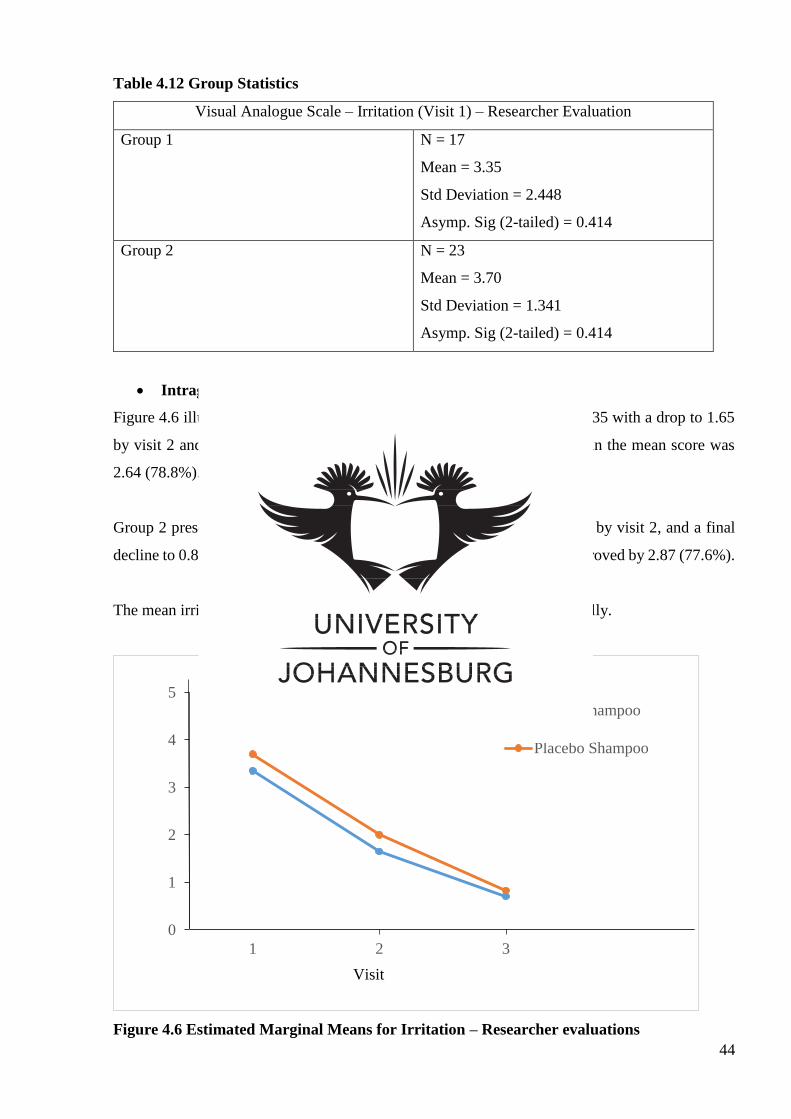
44
Table 4.12 Group Statistics
Visual Analogue Scale – Irritation (Visit 1) – Researcher Evaluation
Group 1 N = 17
Mean = 3.35
Std Deviation = 2.448
Asymp. Sig (2-tailed) = 0.414
Group 2 N = 23
Mean = 3.70
Std Deviation = 1.341
Asymp. Sig (2-tailed) = 0.414
Intragroup Analysis
Figure 4.6 illustrates a mean value for irritation for Group 1 at visit 1 of 3.35 with a drop to 1.65
by visit 2 and further decrease to 0.71 by visit 3. The total improvement in the mean score was
2.64 (78.8%).
Group 2 presented a decrease in the mean value of 3.70 at visit 1, to 2.00 by visit 2, and a final
decline to 0.83 at visit 3. The mean score for irritation for Group 2 thus improved by 2.87 (77.6%).
The mean irritation in both groups seemed to have declined relatively equally.
Figure 4.6 Estimated Marginal Means for Irritation – Researcher evaluations
0
1
2
3
4
5
1 2 3
Estimated Marginal Means of Irritation
Active Shampoo
Placebo Shampoo
Visit
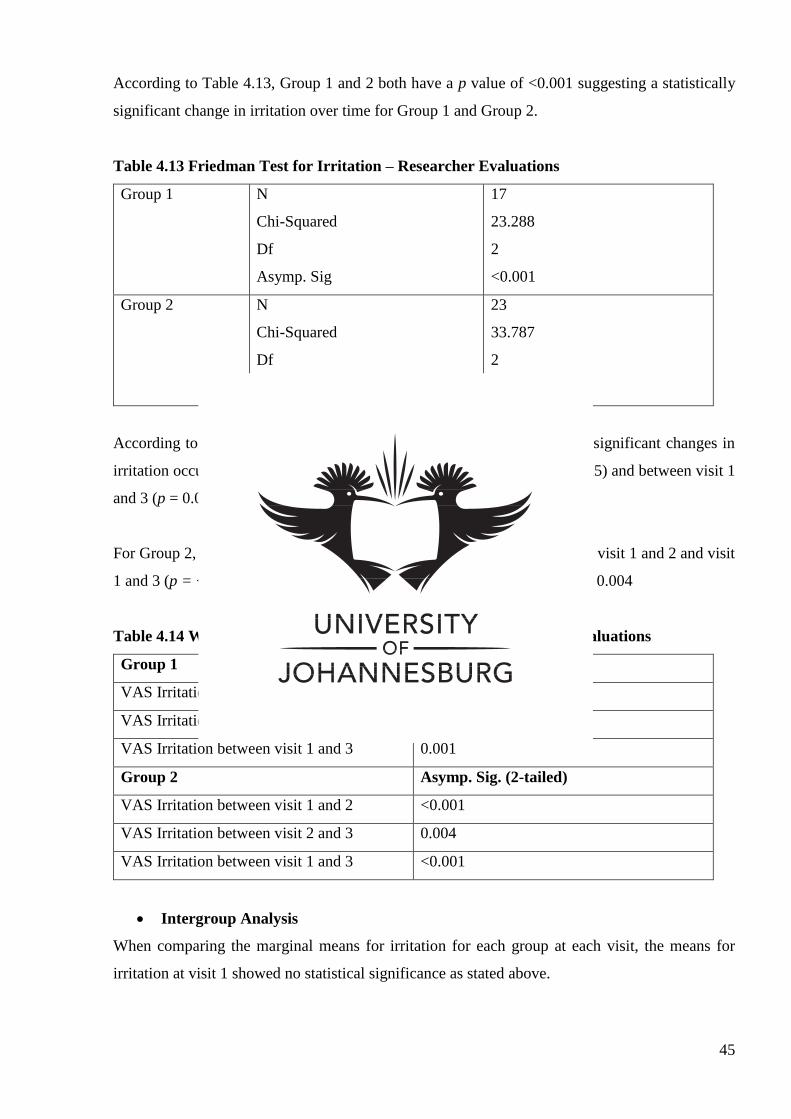
45
According to Table 4.13, Group 1 and 2 both have a p value of <0.001 suggesting a statistically
significant change in irritation over time for Group 1 and Group 2.
Table 4.13 Friedman Test for Irritation – Researcher Evaluations
Group 1 N
Chi-Squared
Df
Asymp. Sig
17
23.288
2
<0.001
Group 2 N
Chi-Squared
Df
Asymp. Sig
23
33.787
2
<0.001
According to the Wilcoxin Signed Ranks Test in Table 4.14, statistically significant changes in
irritation occurred between visit 1 and 2 (p = 0.001), visit 2 and 3 (p = 0.015) and between visit 1
and 3 (p = 0.001) for Group 1.
For Group 2, statistically significant changes in irritation occurred between visit 1 and 2 and visit
1 and 3 (p = <0.001 for both visits), as well as between visit 2 and 3 as p = 0.004
Table 4.14 Wilcoxin Signed Ranks Test for Irritation – Researcher Evaluations
Group 1 Asymp. Sig. (2-tailed)
VAS Irritation between visit 1 and 2 0.001
VAS Irritation between visit 2 and 3 0.015
VAS Irritation between visit 1 and 3 0.001
Group 2 Asymp. Sig. (2-tailed)
VAS Irritation between visit 1 and 2 <0.001
VAS Irritation between visit 2 and 3 0.004
VAS Irritation between visit 1 and 3 <0.001
Intergroup Analysis
When comparing the marginal means for irritation for each group at each visit, the means for
irritation at visit 1 showed no statistical significance as stated above.
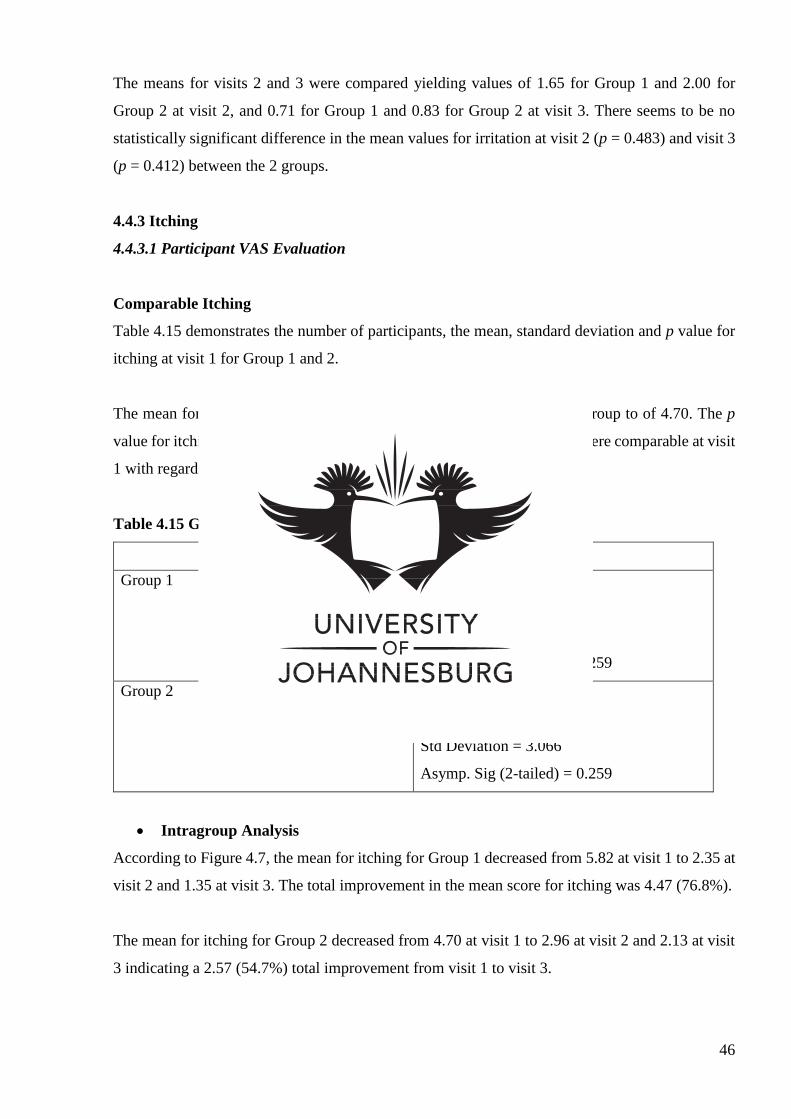
46
The means for visits 2 and 3 were compared yielding values of 1.65 for Group 1 and 2.00 for
Group 2 at visit 2, and 0.71 for Group 1 and 0.83 for Group 2 at visit 3. There seems to be no
statistically significant difference in the mean values for irritation at visit 2 (p = 0.483) and visit 3
(p = 0.412) between the 2 groups.
4.4.3 Itching
4.4.3.1 Participant VAS Evaluation
Comparable Itching
Table 4.15 demonstrates the number of participants, the mean, standard deviation and p value for
itching at visit 1 for Group 1 and 2.
The mean for itching at visit 1 for Group 1 was 5.82 when compared 2 Group to of 4.70. The p
value for itching at visit 1 was 0.259 therefore concluding that the groups were comparable at visit
1 with regards to itching.
Table 4.15 Group Statistics
Visual Analogue Scale – Itching (Visit 1)
Group 1 N = 17
Mean = 5.82
Std Deviation = 2.481
Asymp. Sig (2-tailed) = 0.259
Group 2 N = 23
Mean = 4.70
Std Deviation = 3.066
Asymp. Sig (2-tailed) = 0.259
Intragroup Analysis
According to Figure 4.7, the mean for itching for Group 1 decreased from 5.82 at visit 1 to 2.35 at
visit 2 and 1.35 at visit 3. The total improvement in the mean score for itching was 4.47 (76.8%).
The mean for itching for Group 2 decreased from 4.70 at visit 1 to 2.96 at visit 2 and 2.13 at visit
3 indicating a 2.57 (54.7%) total improvement from visit 1 to visit 3.
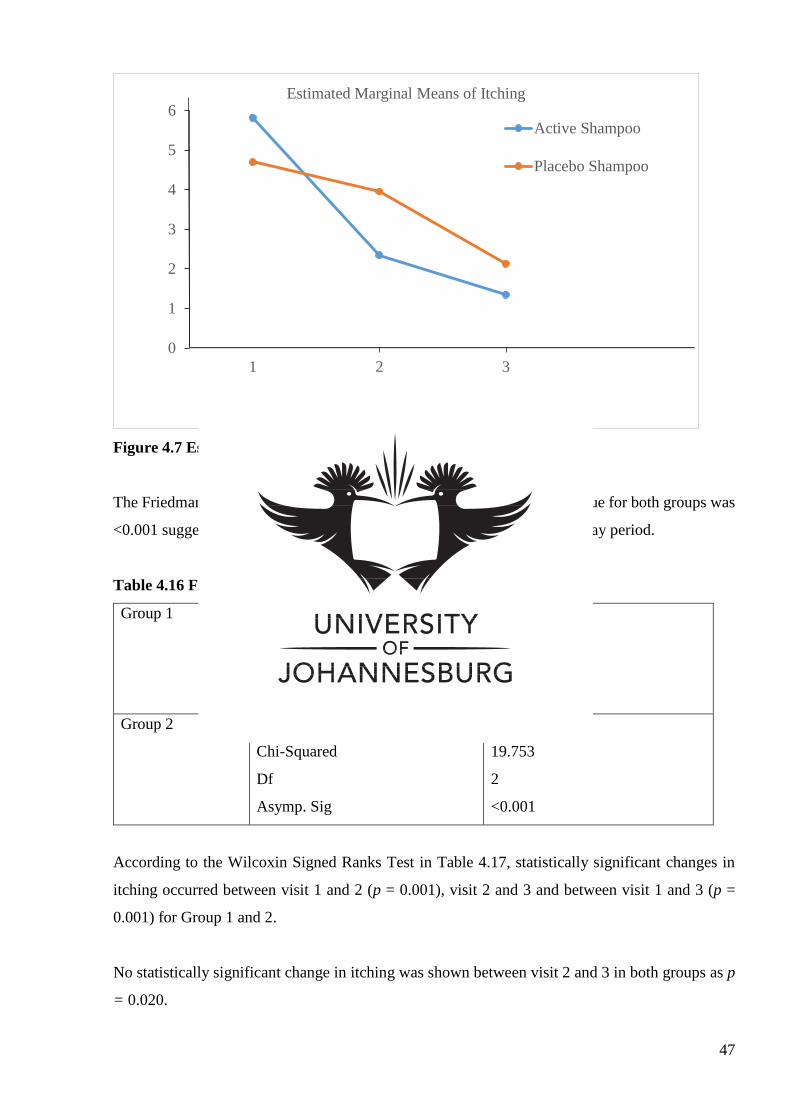
47
Figure 4.7 Estimated Marginal Means for Itching
The Friedman test was performed and as illustrated in Table 4.16, the p value for both groups was
<0.001 suggesting a statistically significant change in itching over the 16 day period.
Table 4.16 Friedman Test for Itching
Group 1 N
Chi-Squared
Df
Asymp. Sig
17
21.031
2
<0.001
Group 2 N
Chi-Squared
Df
Asymp. Sig
23
19.753
2
<0.001
According to the Wilcoxin Signed Ranks Test in Table 4.17, statistically significant changes in
itching occurred between visit 1 and 2 (p = 0.001), visit 2 and 3 and between visit 1 and 3 (p =
0.001) for Group 1 and 2.
No statistically significant change in itching was shown between visit 2 and 3 in both groups as p
= 0.020.
0
1
2
3
4
5
6
1 2 3
Estimated Marginal Means of Itching
Active Shampoo
Placebo Shampoo
Visit
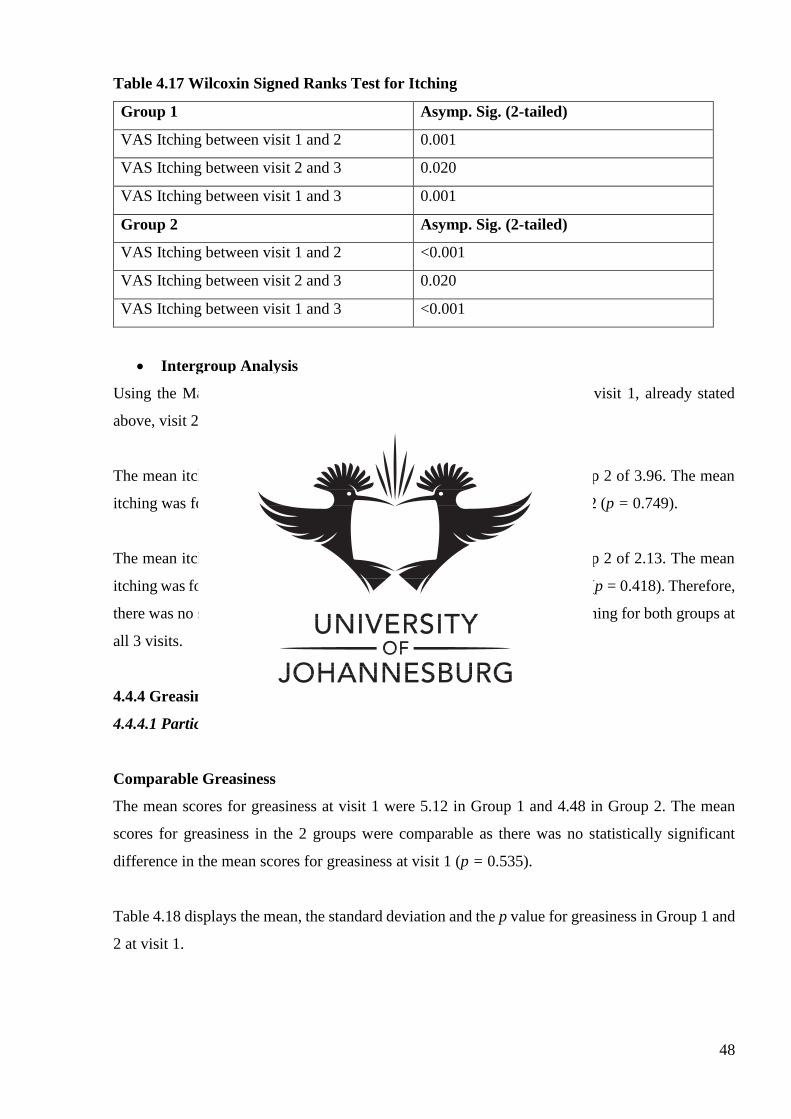
48
Table 4.17 Wilcoxin Signed Ranks Test for Itching
Group 1 Asymp. Sig. (2-tailed)
VAS Itching between visit 1 and 2 0.001
VAS Itching between visit 2 and 3 0.020
VAS Itching between visit 1 and 3 0.001
Group 2 Asymp. Sig. (2-tailed)
VAS Itching between visit 1 and 2 <0.001
VAS Itching between visit 2 and 3 0.020
VAS Itching between visit 1 and 3 <0.001
Intergroup Analysis
Using the Mann Whitney U test, the means of itching was compared at visit 1, already stated
above, visit 2 and visit 3.
The mean itching for Group 1 at visit 2 was 2.35 when compared to Group 2 of 3.96. The mean
itching was found not to be statistically significant for both groups at visit 2 (p = 0.749).
The mean itching for Group 1 at visit 3 was 1.35 when compared to Group 2 of 2.13. The mean
itching was found not to be statistically significant for both groups at visit 3 (p = 0.418). Therefore,
there was no statistically significant difference in the average scores for itching for both groups at
all 3 visits.
4.4.4 Greasiness
4.4.4.1 Participant VAS Evaluation
Comparable Greasiness
The mean scores for greasiness at visit 1 were 5.12 in Group 1 and 4.48 in Group 2. The mean
scores for greasiness in the 2 groups were comparable as there was no statistically significant
difference in the mean scores for greasiness at visit 1 (p = 0.535).
Table 4.18 displays the mean, the standard deviation and the p value for greasiness in Group 1 and
2 at visit 1.
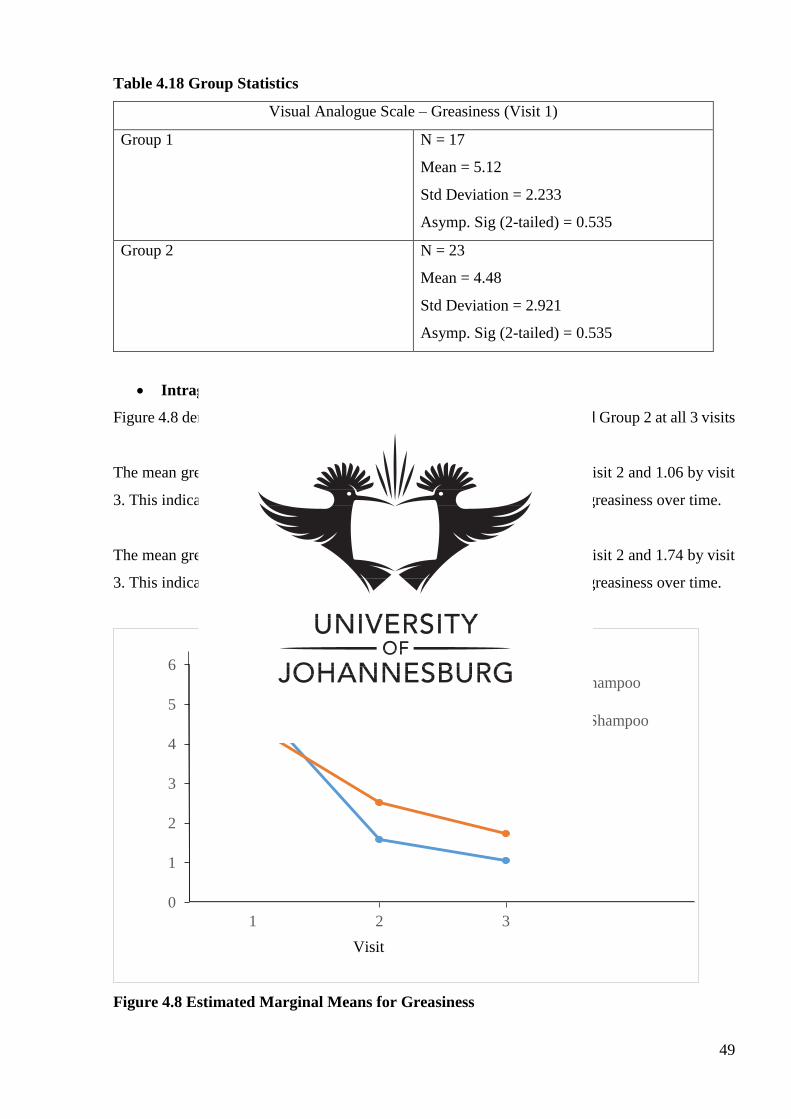
49
Table 4.18 Group Statistics
Visual Analogue Scale – Greasiness (Visit 1)
Group 1 N = 17
Mean = 5.12
Std Deviation = 2.233
Asymp. Sig (2-tailed) = 0.535
Group 2 N = 23
Mean = 4.48
Std Deviation = 2.921
Asymp. Sig (2-tailed) = 0.535
Intragroup Analysis
Figure 4.8 demonstrates the changes in the mean greasiness for Group 1 and Group 2 at all 3 visits
The mean greasiness for Group 1 was 5.12 at visit 1, dropping to 1.59 by visit 2 and 1.06 by visit
3. This indicates a total 4.06 (79.3%) improvement in the mean scores for greasiness over time.
The mean greasiness for Group 2 was 4.48 at visit 1, dropping to 2.52 by visit 2 and 1.74 by visit
3. This indicates a total 2.74 (61.2%) improvement in the mean scores for greasiness over time.
Figure 4.8 Estimated Marginal Means for Greasiness
0
1
2
3
4
5
6
1 2 3
Estimated Marginal Means of Greasiness
Active Shampoo
Placebo Shampoo
Visit
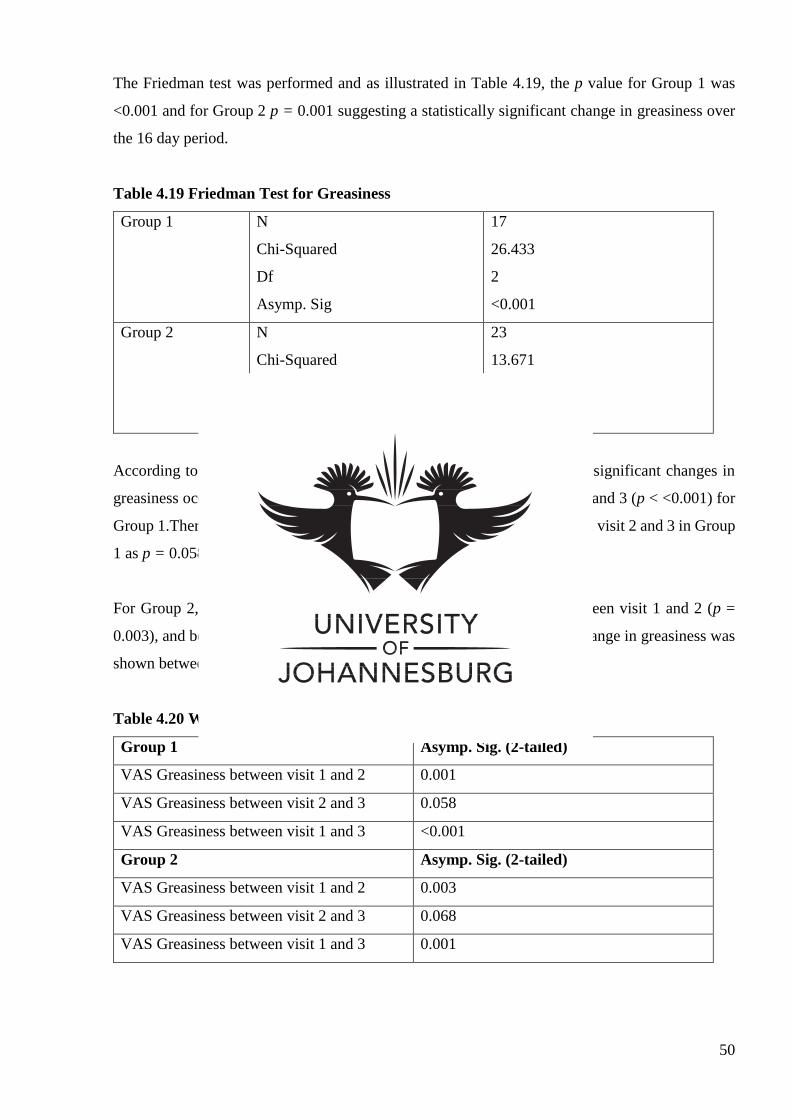
50
The Friedman test was performed and as illustrated in Table 4.19, the p value for Group 1 was
<0.001 and for Group 2 p = 0.001 suggesting a statistically significant change in greasiness over
the 16 day period.
Table 4.19 Friedman Test for Greasiness
Group 1 N
Chi-Squared
Df
Asymp. Sig
17
26.433
2
<0.001
Group 2 N
Chi-Squared
Df
Asymp. Sig
23
13.671
2
0.001
According to the Wilcoxin Signed Ranks Test in Table 4.20, statistically significant changes in
greasiness occurred between visit 1 and 2 (p = 0.001), and between visit 1 and 3 (p < <0.001) for
Group 1.There was no statistically significant change in greasiness between visit 2 and 3 in Group
1 as p = 0.058.
For Group 2, statistically significant changes in greasiness occurred between visit 1 and 2 (p =
0.003), and between visit 1 and 3 (p = 0.001).No statistically significant change in greasiness was
shown between visit 2 and 3 in Group 2 as p = 0.068.
Table 4.20 Wilcoxin Signed Ranks Test for Greasiness
Group 1 Asymp. Sig. (2-tailed)
VAS Greasiness between visit 1 and 2 0.001
VAS Greasiness between visit 2 and 3 0.058
VAS Greasiness between visit 1 and 3 <0.001
Group 2 Asymp. Sig. (2-tailed)
VAS Greasiness between visit 1 and 2 0.003
VAS Greasiness between visit 2 and 3 0.068
VAS Greasiness between visit 1 and 3 0.001
51
Intergroup Analysis
The comparison of the means scores for greasiness of Group 1 and 2 (as already discussed) was
found to be statistically insignificant with means of 5.12 for Group 1 and 4.48 for Group 2 with a
p value of 0.535.
The mean score for Group 1 at visit 2 was 1.59 when compared to Group 2 of 2.52 with a p value
of 0.468. When compared, the mean scores for greasiness at visit 2 were found to be statistically
insignificant.
The mean score for Group 1 at visit 3 was 1.06, and the mean score for Group 2 was 1.74 with a
p value of 0.115. When compared, the mean scores for greasiness at visit 3 were found to be
statistically insignificant (p = 0.115). This means that there was no significant difference in the
average greasiness between the 2 groups at visits 1, 2 and 3.
4.4.4.2 Researcher VAS Evaluation
Comparable Greasiness
Table 4.21 demonstrates the number of participants, the mean, standard deviation and p value for
greasiness at visit 1 for group 1 and 2.
The mean for greasiness at visit 1 for Group 1 was 3.647 when compared to Group 2 of 3.957. The
p value for greasiness at visit 1 was 0.558 therefore concluding that the groups were comparable
at visit 1 with regards to greasiness.
Table 4.21 Group Statistics
Visual Analogue Scale – Greasiness (Visit 1) – Researcher Evaluation
Group 1 N = 17
Mean = 3.647
Std Deviation = 1.8689
Asymp. Sig (2-tailed) = 0.558
Group 2 N = 23
Mean = 3.957
Std Deviation = 2.0775
Asymp. Sig (2-tailed) = 0.558
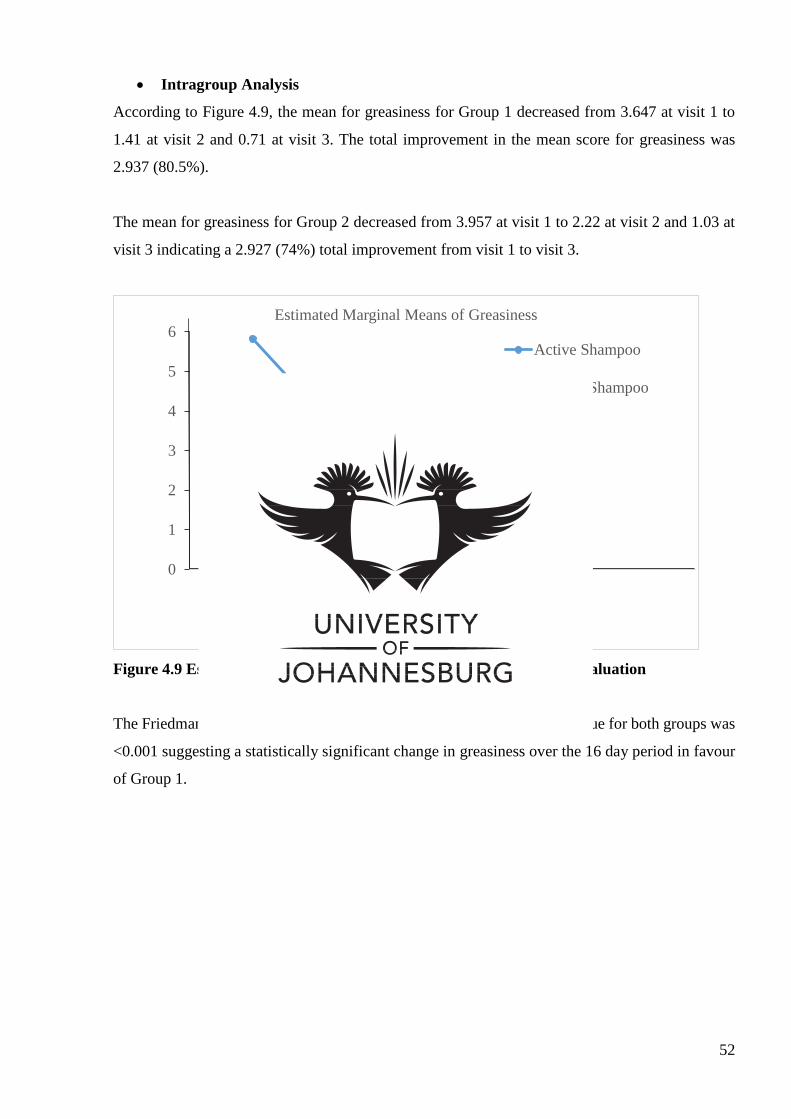
52
Intragroup Analysis
According to Figure 4.9, the mean for greasiness for Group 1 decreased from 3.647 at visit 1 to
1.41 at visit 2 and 0.71 at visit 3. The total improvement in the mean score for greasiness was
2.937 (80.5%).
The mean for greasiness for Group 2 decreased from 3.957 at visit 1 to 2.22 at visit 2 and 1.03 at
visit 3 indicating a 2.927 (74%) total improvement from visit 1 to visit 3.
Figure 4.9 Estimated Marginal Means for Greasiness – Researcher Evaluation
The Friedman test was performed and as illustrated in Table 4.22, the p value for both groups was
<0.001 suggesting a statistically significant change in greasiness over the 16 day period in favour
of Group 1.
0
1
2
3
4
5
6
1 2 3
Estimated Marginal Means of Greasiness
Active Shampoo
Placebo Shampoo
Visit
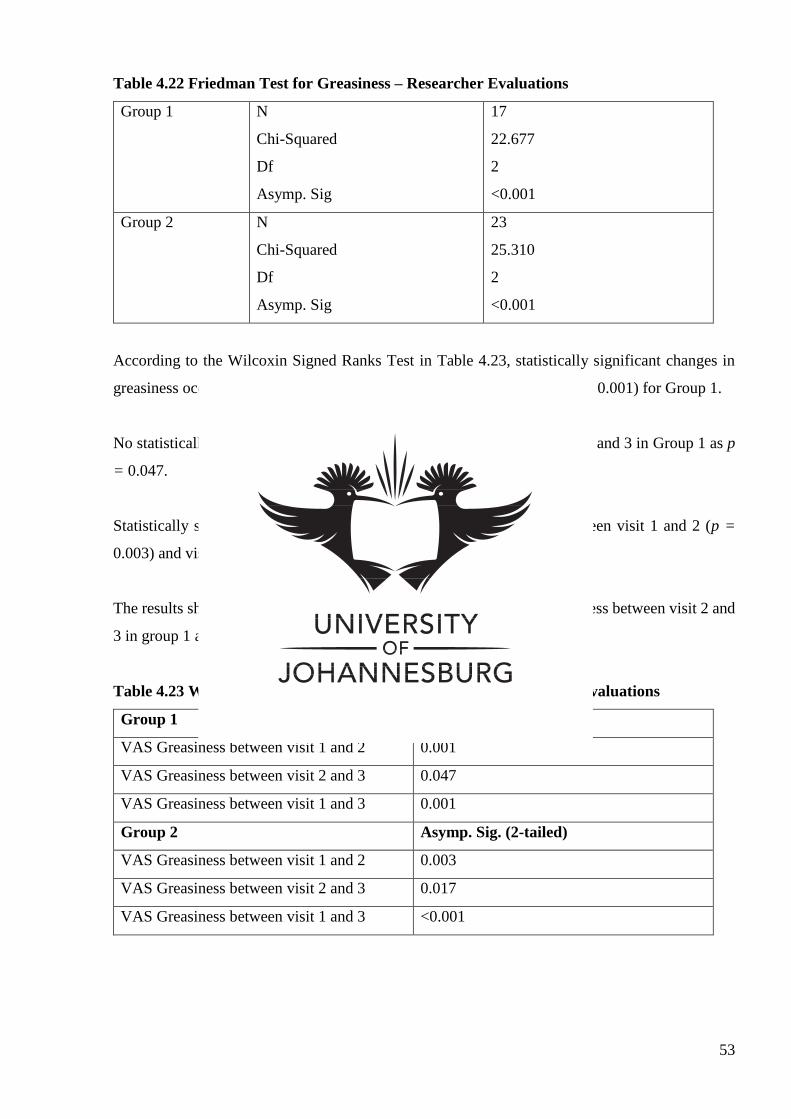
53
Table 4.22 Friedman Test for Greasiness – Researcher Evaluations
Group 1 N
Chi-Squared
Df
Asymp. Sig
17
22.677
2
<0.001
Group 2 N
Chi-Squared
Df
Asymp. Sig
23
25.310
2
<0.001
According to the Wilcoxin Signed Ranks Test in Table 4.23, statistically significant changes in
greasiness occurred between visit 1 and 2 (p = 0.001) and visit 1 and 3 (p = 0.001) for Group 1.
No statistically significant change was shown in greasiness between visit 2 and 3 in Group 1 as p
= 0.047.
Statistically significant changes in greasiness for Group 2 occurred between visit 1 and 2 (p =
0.003) and visit 1 and 3 (p = <0.001)
The results showed there to be no statistically significant change in greasiness between visit 2 and
3 in group 1 as p = 0.017.
Table 4.23 Wilcoxin Signed Ranks Test for Greasiness – Researcher Evaluations
Group 1 Asymp. Sig. (2-tailed)
VAS Greasiness between visit 1 and 2 0.001
VAS Greasiness between visit 2 and 3 0.047
VAS Greasiness between visit 1 and 3 0.001
Group 2 Asymp. Sig. (2-tailed)
VAS Greasiness between visit 1 and 2 0.003
VAS Greasiness between visit 2 and 3 0.017
VAS Greasiness between visit 1 and 3 <0.001
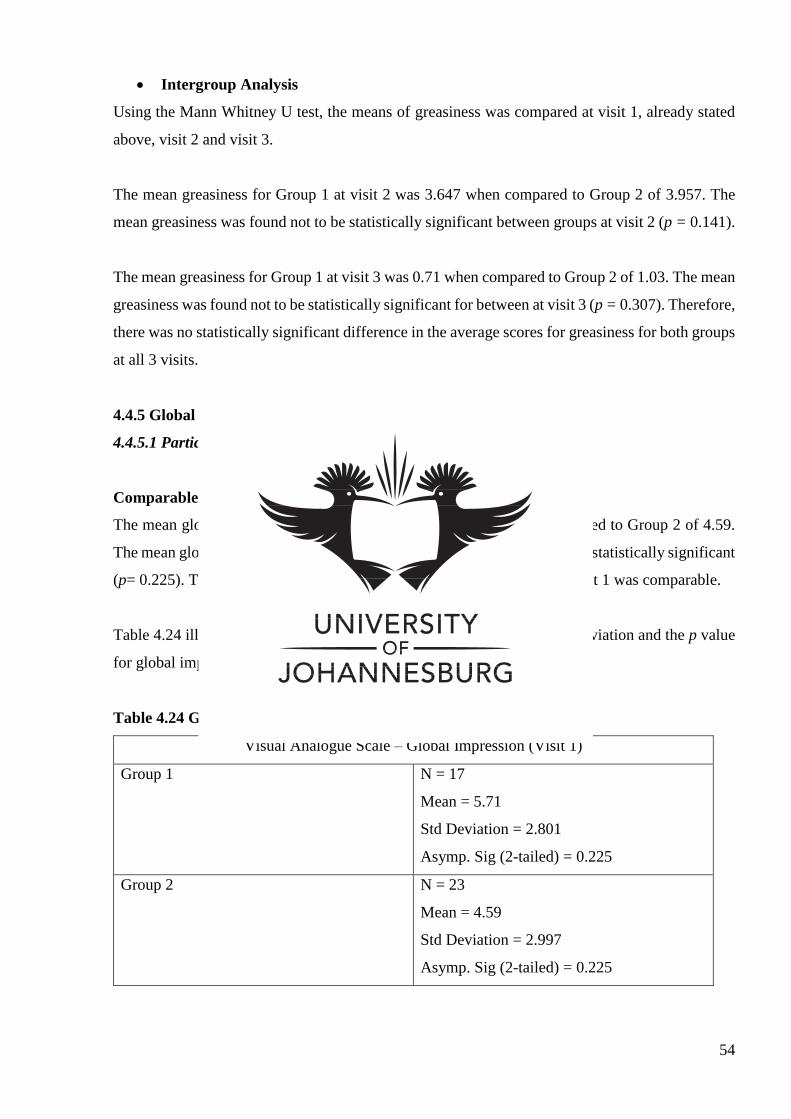
54
Intergroup Analysis
Using the Mann Whitney U test, the means of greasiness was compared at visit 1, already stated
above, visit 2 and visit 3.
The mean greasiness for Group 1 at visit 2 was 3.647 when compared to Group 2 of 3.957. The
mean greasiness was found not to be statistically significant between groups at visit 2 (p = 0.141).
The mean greasiness for Group 1 at visit 3 was 0.71 when compared to Group 2 of 1.03. The mean
greasiness was found not to be statistically significant for between at visit 3 (p = 0.307). Therefore,
there was no statistically significant difference in the average scores for greasiness for both groups
at all 3 visits.
4.4.5 Global Impression
4.4.5.1 Participant VAS Evaluation
Comparable Global Impression
The mean global impression for Group 1 at visit 1 was 5.71 when compared to Group 2 of 4.59.
The mean global impression of the two groups at visit 1 was found not to be statistically significant
(p= 0.225). Therefore, the mean global impression in the two groups at visit 1 was comparable.
Table 4.24 illustrates the number of participants, the mean, the standard deviation and the p value
for global impression of groups 1 and 2 at visit 1.
Table 4.24 Group statistics
Visual Analogue Scale – Global Impression (Visit 1)
Group 1 N = 17
Mean = 5.71
Std Deviation = 2.801
Asymp. Sig (2-tailed) = 0.225
Group 2 N = 23
Mean = 4.59
Std Deviation = 2.997
Asymp. Sig (2-tailed) = 0.225
55
Intragroup Analysis
Figure 4.10 demonstrates the changes in the means of global impression in the two groups between
visits 1 and 2, visits 2 and 3 and visits 1 and 3.
For Group 1 the mean of 5.71 for global impression at visit 1 dropped to 3.47 at visit 2. The mean
then dropped to 2.00 by visit 3, indicating a total mean score improvement of 3.71 (65%).
For Group 2 the mean of 4.57 for global impression at visit 1 dropped to 4.04 at visit 2. The mean
then dropped to 3.17 by visit 3. This indicates a total mean score improvement of 1.40 (30.6%).
Figure 4.10 Estimated Marginal means for Global Impression
The Friedman test as seen in Table 4.25 was used to determine the change in global impression
over the 16 day period. Group 1 and 2 both have a p value of <0.001 suggesting a statistically
significant change in global impression over time for Group 1 and Group 2.
1
2
3
4
5
6
1 2 3
Estimated Marginal Means of Global Impression
Active Shampoo
Placebo Shampoo
Visit
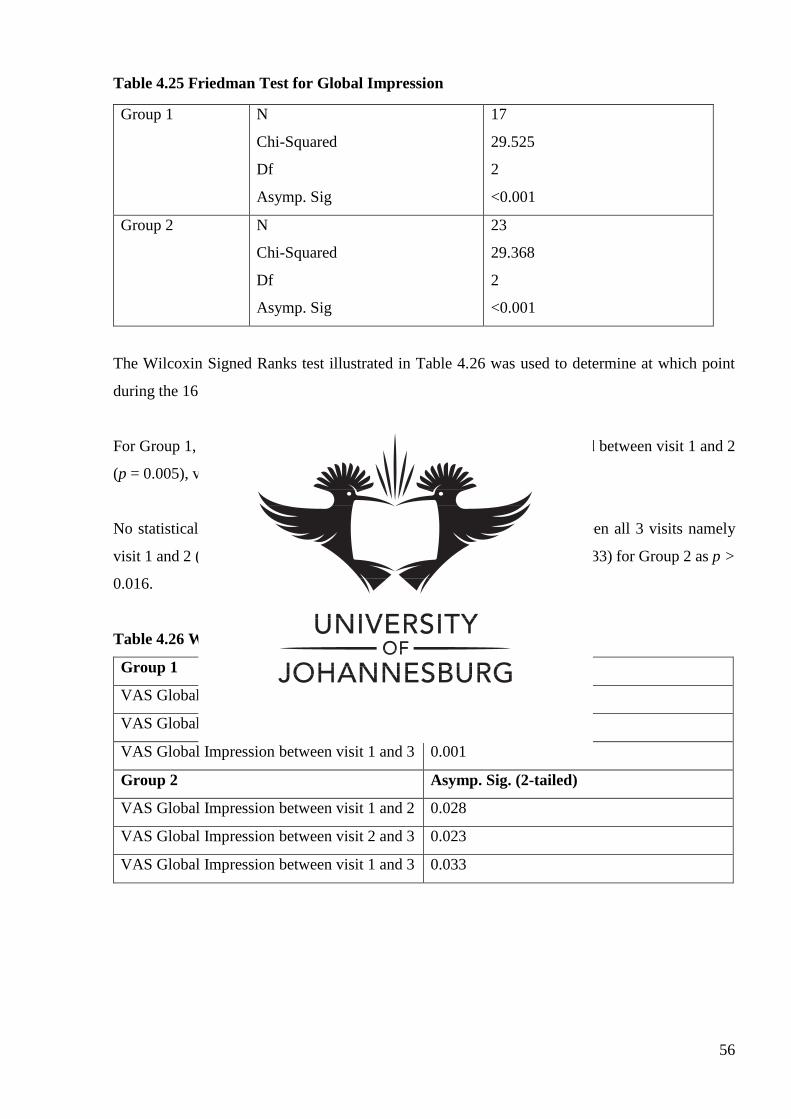
56
Table 4.25 Friedman Test for Global Impression
Group 1 N
Chi-Squared
Df
Asymp. Sig
17
29.525
2
<0.001
Group 2 N
Chi-Squared
Df
Asymp. Sig
23
29.368
2
<0.001
The Wilcoxin Signed Ranks test illustrated in Table 4.26 was used to determine at which point
during the 16 day trial significant changes in global impression took place.
For Group 1, statistically significant changes in global impression occurred between visit 1 and 2
(p = 0.005), visit 2 and 3 (p = 0.003) and between visit 1 and 3 (p = 0.001).
No statistically significant change was shown in global impression between all 3 visits namely
visit 1 and 2 (p = 0.282), visit 2 and 3 (p = 0.023) and visit 1 and 3 (p = 0.033) for Group 2 as p >
0.016.
Table 4.26 Wilcoxin Signed Ranks Test for Global Impression
Group 1 Asymp. Sig. (2-tailed)
VAS Global Impression between visit 1 and 2 0.005
VAS Global Impression between visit 2 and 3 0.003
VAS Global Impression between visit 1 and 3 0.001
Group 2 Asymp. Sig. (2-tailed)
VAS Global Impression between visit 1 and 2 0.028
VAS Global Impression between visit 2 and 3 0.023
VAS Global Impression between visit 1 and 3 0.033
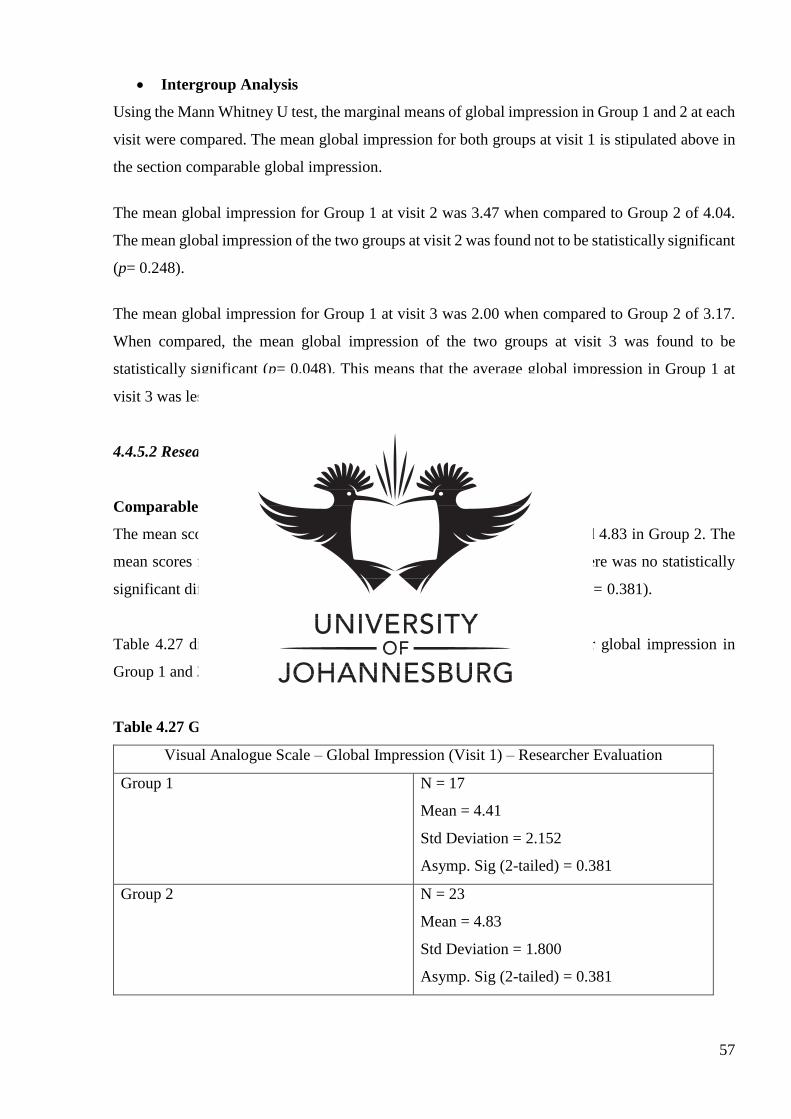
57
Intergroup Analysis
Using the Mann Whitney U test, the marginal means of global impression in Group 1 and 2 at each
visit were compared. The mean global impression for both groups at visit 1 is stipulated above in
the section comparable global impression.
The mean global impression for Group 1 at visit 2 was 3.47 when compared to Group 2 of 4.04.
The mean global impression of the two groups at visit 2 was found not to be statistically significant
(p= 0.248).
The mean global impression for Group 1 at visit 3 was 2.00 when compared to Group 2 of 3.17.
When compared, the mean global impression of the two groups at visit 3 was found to be
statistically significant (p= 0.048). This means that the average global impression in Group 1 at
visit 3 was less than the average global impression in Group 2 at visit 3.
4.4.5.2 Researcher VAS Evaluation
Comparable Global Impression
The mean scores for global impression at visit 1 were 4.41 in Group 1 and 4.83 in Group 2. The
mean scores for global impression in the 2 groups were comparable as there was no statistically
significant difference in the mean scores for global impression at visit 1 (p = 0.381).
Table 4.27 displays the mean, the standard deviation and the p value for global impression in
Group 1 and 2 at visit 1.
Table 4.27 Group Statistics
Visual Analogue Scale – Global Impression (Visit 1) – Researcher Evaluation
Group 1 N = 17
Mean = 4.41
Std Deviation = 2.152
Asymp. Sig (2-tailed) = 0.381
Group 2 N = 23
Mean = 4.83
Std Deviation = 1.800
Asymp. Sig (2-tailed) = 0.381
58
Intragroup Analysis
Figure 4.11 demonstrates the changes in the mean global impression for Group 1 and Group 2 at
all 3 visits
The mean global impression for Group 1 was 4.41 at visit 1, dropping to 3.35 by visit 2 and 1.94
by visit 3. This indicates a total 2.47 (56%) improvement in the mean scores for global impression
over time.
The mean global impression for Group 2 was 4.83 at visit 1, dropping to 3.31 by visit 2 and 2.78
by visit 3. This indicates a total 2.05 (42.4%) improvement in the mean scores for global
impression over time.
Figure 4.11 Estimated Marginal Means for Global Impression – Researcher Evaluation
The Friedman test was performed and as illustrated in Table 4.28, the p value for Group 1 and for
Group 2 was <0.001 suggesting a statistically significant change in global impression over the 16
day period favouring Group 1.
0
1
2
3
4
5
6
1 2 3
Estimated Marginal Means of Global Impression
Active Shampoo
Placebo Shampoo
Visit
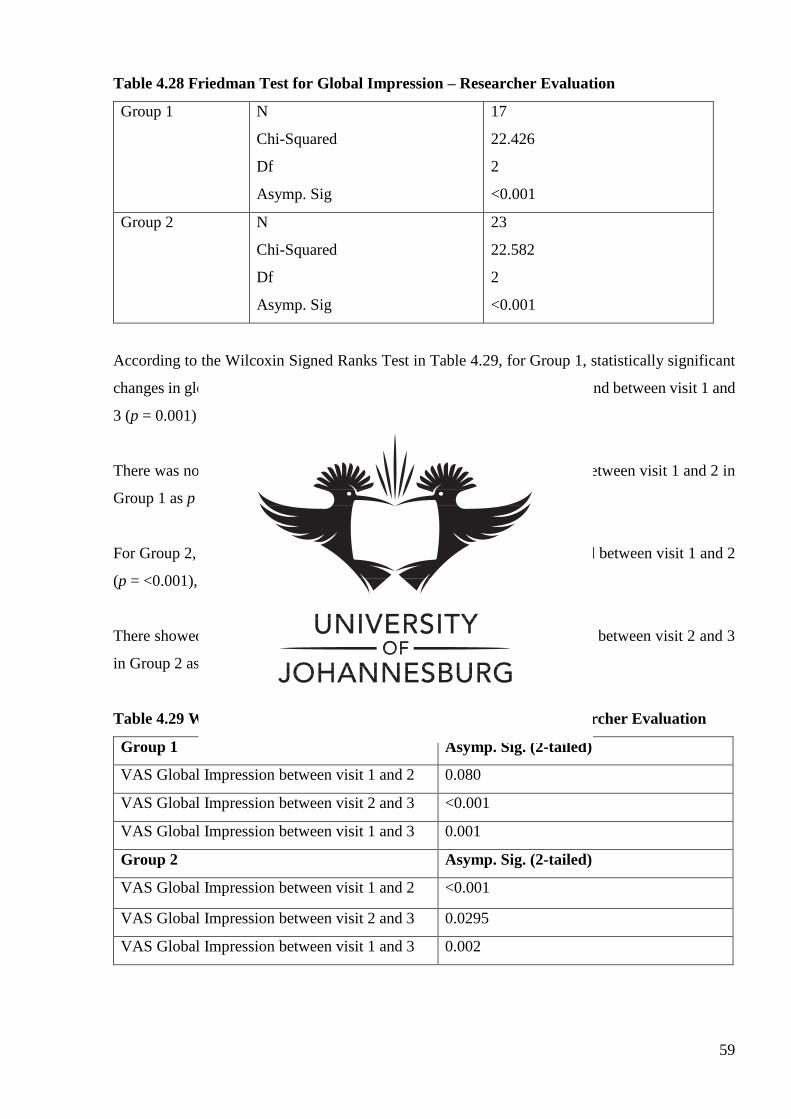
59
Table 4.28 Friedman Test for Global Impression – Researcher Evaluation
Group 1 N
Chi-Squared
Df
Asymp. Sig
17
22.426
2
<0.001
Group 2 N
Chi-Squared
Df
Asymp. Sig
23
22.582
2
<0.001
According to the Wilcoxin Signed Ranks Test in Table 4.29, for Group 1, statistically significant
changes in global impression occurred between visit 2 and 3 (p = <0.001), and between visit 1 and
3 (p = 0.001) in favour of Group 1.
There was no statistically significant change shown in global impression between visit 1 and 2 in
Group 1 as p = 0.080.
For Group 2, statistically significant changes in global impression occurred between visit 1 and 2
(p = <0.001), and between visit 1 and 3 (p = 0.002).
There showed to be no statistically significant change in global impression between visit 2 and 3
in Group 2 as p = 0.295.
Table 4.29 Wilcoxin Signed Ranks Test for Global Impression – Researcher Evaluation
Group 1 Asymp. Sig. (2-tailed)
VAS Global Impression between visit 1 and 2 0.080
VAS Global Impression between visit 2 and 3 <0.001
VAS Global Impression between visit 1 and 3 0.001
Group 2 Asymp. Sig. (2-tailed)
VAS Global Impression between visit 1 and 2 <0.001
VAS Global Impression between visit 2 and 3 0.0295
VAS Global Impression between visit 1 and 3 0.002
60
Intergroup Analysis
Using the Mann Whitney U test, the marginal means of global impression in Group 1 and 2 at each
visit were compared. The mean global impression for both groups at visit 1 is stipulated above in
the section comparable global impression.
The mean global impression for Group 1 at visit 2 was 3.35 when compared to Group 2 of 3.13.
The mean global impression of the two groups at visit 2 was found not to be statistically significant
(p = 0.943).
The mean global impression for Group 1 at visit 3 was 1.94 when compared to Group 2 of 2.78.
When compared, the mean global impression of the two groups at visit 3 was found to be
statistically insignificant (p = 0.209) in favour of Group 1.
4.4.6 Adherent Scalp Flake Score Grading (ASFS)
Comparable ASFS
The comparability of the ASFS has already been discussed under section 4.3.4 hHas ala
Intragroup Analysis
The mean changes for the ASFS between visits 1, 2 and 3 are illustrated in Figure 4.12.
For Group 1, the mean 34.00 of for the ASFS at visit 1 decreased to 18.88 at visit 2 and reached
10.93 by visit 3. The total mean score dropped by 23.07 (67.9%).
For Group 2, the mean 35.48 for the ASFS at visit 1 decreased to 18.27 at visit 2 and reached 17.48
by visit 3. The total mean score dropped by 17.97 (50.6%).
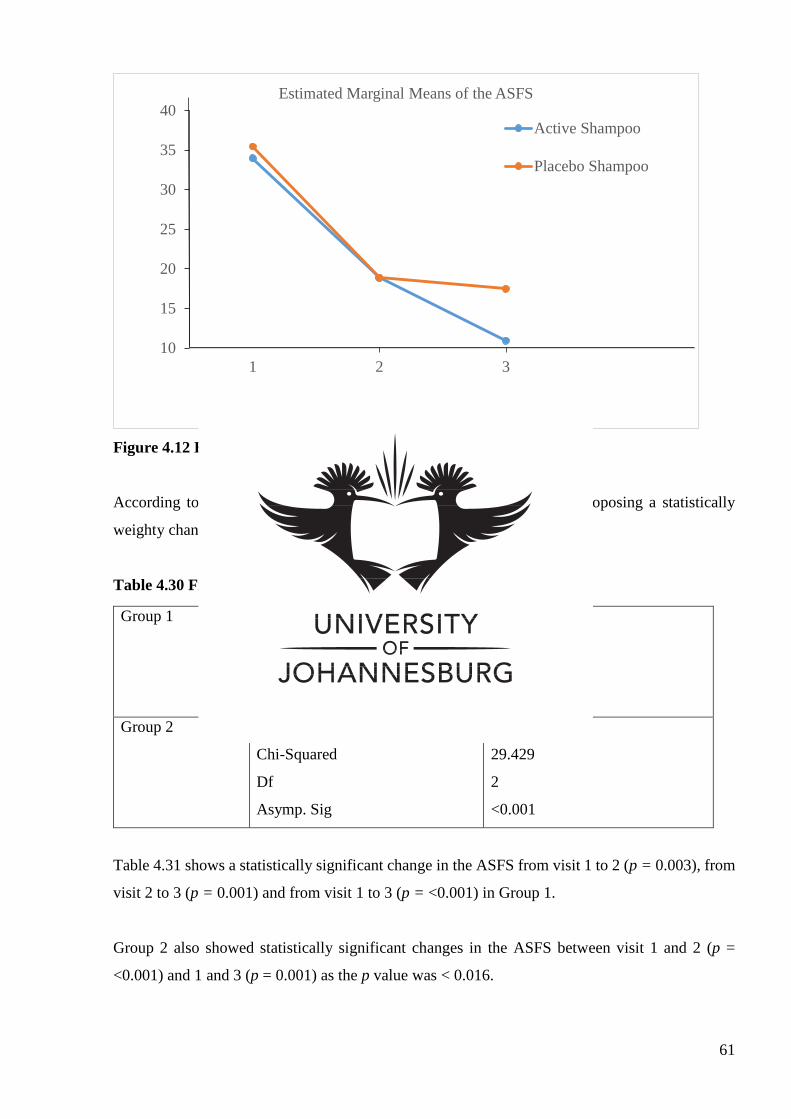
61
Figure 4.12 Estimated Marginal Means for the ASFS
According to Table 4.30, the p value for Group 1 and 2 was <0.001 proposing a statistically
weighty change in the ASFS from visit 1 to visit 3.
Table 4.30 Friedman Test for the ASFS
Group 1 N
Chi-Squared
Df
Asymp. Sig
17
26.000
2
<0.001
Group 2 N
Chi-Squared
Df
Asymp. Sig
23
29.429
2
<0.001
Table 4.31 shows a statistically significant change in the ASFS from visit 1 to 2 (p = 0.003), from
visit 2 to 3 (p = 0.001) and from visit 1 to 3 (p = <0.001) in Group 1.
Group 2 also showed statistically significant changes in the ASFS between visit 1 and 2 (p =
<0.001) and 1 and 3 (p = 0.001) as the p value was < 0.016.
10
15
20
25
30
35
40
1 2 3
Estimated Marginal Means of the ASFS
Active Shampoo
Placebo Shampoo
Visit
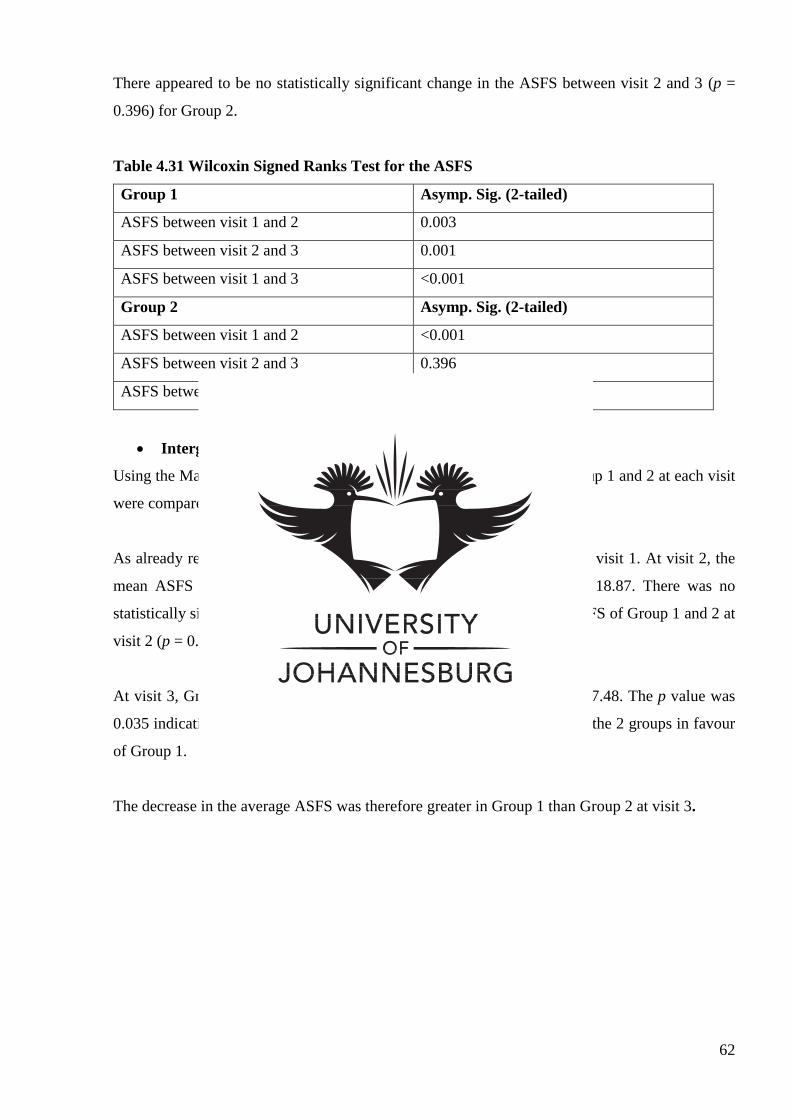
62
There appeared to be no statistically significant change in the ASFS between visit 2 and 3 (p =
0.396) for Group 2.
Table 4.31 Wilcoxin Signed Ranks Test for the ASFS
Group 1 Asymp. Sig. (2-tailed)
ASFS between visit 1 and 2 0.003
ASFS between visit 2 and 3 0.001
ASFS between visit 1 and 3 <0.001
Group 2 Asymp. Sig. (2-tailed)
ASFS between visit 1 and 2 <0.001
ASFS between visit 2 and 3 0.396
ASFS between visit 1 and 3 <0.001
Intergroup Analysis
Using the Mann Whitney U test, the marginal means for the ASFS in Group 1 and 2 at each visit
were compared.
As already revealed, the mean ASFS showed no statistical significance at visit 1. At visit 2, the
mean ASFS for Group 1 was 18.88 whereas Group 2 had a mean of 18.87. There was no
statistically significant change in the ASFS when comparing the mean ASFS of Group 1 and 2 at
visit 2 (p = 0.945).
At visit 3, Group 1 had a mean of 10.94 when compared to Group 2 of 17.48. The p value was
0.035 indicating a statistically significant difference in the mean ASFS of the 2 groups in favour
of Group 1.
The decrease in the average ASFS was therefore greater in Group 1 than Group 2 at visit 3.
63
CHAPTER 5: DISCUSSION
5.1 Introduction
This chapter discusses the various results obtained during the study and provides possible
explanations to assist in the understanding of the results and the effect of the research study.
Data collected for scaling was normally distributed according to the Shapiro Wilk test allowing
for parametric data analysis. All other variables showed an abnormal distribution of data, therefore
non-parametric tests were used in order to analyse the data.
5.2 Demographic Data
5.2.1 Gender Distribution
The results of the gender distribution disclose a balanced proportion between males and females
in the two groups. The total number of females far exceeded the number of males in the study as
Group 1 consisted of 14 females and 3 males and Group 2 consisted of 19 females and 4 males.
This contradicts the literature which states a higher prevalence rate of dandruff in post-pubertal
males (Pierard–Franchimont et al., 2001). A larger number of female participants that responded
and were recruited for the study could be due to cosmetic reasons as females are more likely to
seek help with cosmetic problems than males as well a higher tendency towards social stigma
(Frederick et al., 2007). Since gender is proposed to play a role in the aetiology of dandruff, either
only one gender or matched pairing is advised for studies of this nature in order to have an equal
number of males and females so that the results of the 2 genders can be compared.
5.2.2 Age Distribution
The demographic data pertaining to age reveals that the mean age for Group 1 (24.82) and Group
2 (27.78) was comparable. The mean ages found in the 2 groups also validates the ages (15- 50
years) at which dandruff is most commonly prevalent according to the literature (Robbins, 2012).
5.2.3 Race Distribution
The race distribution of the study is of interest as it shows that the greatest population of
participants in both groups are of Indian descent (85%). Since dandruff is most commonly found
in individuals of African descent (Proctor and Gamble Company, 2002), the recruitment areas used
for this study could account for the large proportion of Indian participants in this study. The
tendency to relate better to people of the same culture could have also played a role in obtaining
64
an Indian majority. Ideally, participants of the same race group should be used for studies such as
this as race affects the predisposition to dandruff.
5.3 Primary Visit Scores
At the commencement of the study, the primary scores for scaling, irritation, itching, greasiness,
global impression and ASFS for Groups 1 and 2 were comparable, eradicating the possibility that
the primary scores may have influenced the results of the 2 groups when compared to each other.
5.4 Scaling
Scaling was measured using a Visual Analogue Scale (VAS). The scaling was graded by
visualisation of the scalp as well as the shoulder area for flakes using two separate evaluations:
one by the participant themselves and one by the researcher.
Over the duration of the study, the scaling in the treatment group was found to improve by 76.9%
(p = <0.001), and by 45.1% in Group 2 (p = <0.001) when considering the participant evaluation.
Despite significant improvements for both groups over the course of the study, it was revealed that
there was still a significant difference (p = 0.012) between the groups at the last visit (visit 3).
Since both groups had comparable degrees of scaling at visit 1, this result suggests that both groups
experienced improvement with respect to the appearance of scaling, but that the treatment group
(Group 1) appeared to gain a more significant improvement.
With respect to the same criteria using the researcher evaluation, a similar trend was observed
where an overall improvement of 64.6% in scaling occurred in Group 1 (p = <0.001) whereas
Group 2 showed an improvement of only 43% (p = <0.001). Although both groups showed
significant improvements during the study, a statistically significant difference (p = 0.019) was
found at visit 3 between the two groups. At visit 1 both groups were comparable with regards to
scaling therefore, similar to the participant evaluations, there was a greater improvement in the
appearance of scaling for Group 1 when compared to Group 2.
Non-utilized unsaturated fatty acids generated from the sebum on the scalp are postulated as a
contributing factor to scaling on the scalp (Ashiati et al., 2013). Since the increased frequency of
washing the hair facilitates in removal of sebum from the scalp, a decrease in scaling may be
evident on the scalp (Gerson, 2004), just as a result of the frequency of washing in both groups.
While the improvement in both groups may be explained by the increased frequency of washing,
the presence of the active ingredient may provide an explanation for the greater improvement in
65
scaling seen in the treatment group (Group 1). According to Willet (2010), shale oil (the active
ingredient in the treatment shampoo) has an effect in the treatment of desquamation or scaling
disorders such as dandruff.
5.5 Irritation of the scalp
Irritation was measured using a VAS separately by the participant and the researcher. Irritation
comprised of redness or abrasions on the scalp from consistent itching.
For Group 1, irritation (scored by the participant) improved by a total of 74.8% (p = <0.001),
whereas for Group 2, a total of 52.8% improvement occurred (p = <0.001). Groups 1 and 2 both
demonstrated a statistically significant improvement, which shows that both groups improved
significantly in the scores for irritation. However, despite the improvement of both groups there
was shown to be no statistically significant difference between the two groups at visit 2 and 3 (p
= 0.697 and p = 0.249).
When scored by the researcher, the total improvement for irritation improved in Group 1 by 78.8%
(p = 0.001) and in Group 2 by 77.3% (p = <0.001). There was found to be no statistical significance
in irritation between the two groups at visit 2 and 3 (p = 0.483 and 0.412, respectively).
Since the Malassezia yeast is unable to metabolise lipids independently, it relies on the lipids
present in the sebum of the scalp. The sebum on the scalp degrades into 3 fatty acids through
oxidation. The Malassezia relies on the saturated fatty acids for consumption while the unsaturated
fatty acids remain on the scalp. The penetration of the unsaturated fatty acids into the scalp may
lead to irritation and inflammation of the scalp (Ashiati et al., 2013). A decrease in sebum on the
scalp as a result of more frequent washing may validate the decrease in irritation found in both
groups.
According to Barel et al (2010), cocamidopropyl betaine, one of the ingredients present in the base
of both shampoos used in this study, assists in the reduction of irritation on the scalp. This may
account for the reduced irritation found in both groups.
Shale oil is proposed to have anti-inflammatory actions (Willet, 2010) which may assist in the
treatment of scalp irritation. Frequent washing of the scalp may also reduce the irritation caused
by excess sebum on the scalp (Gerson, 2004). According to the literature, fungal conditions of the
66
skin often cause irritation (Pray, 2006). Thus, the anti-fungal properties (Willet, 2010) present in
shale oil may have assisted to reduce irritation found on the scalp.
According to Metcalf (2013) it may take up to several weeks to see noticeable changes in the
symptoms of dandruff especially when using natural or home remedies. Therefore, a greater length
of time for this study may be warranted to determine whether the active shampoo may outperform
the control substance.
5.6 Itching of the scalp
This symptom was also measured using an 11 point VAS. Itching was only evaluated by the
participant as it was a subjective measure.
Although both Group 1 and 2 displayed statistically significant improvements in itching, Group 1
(76.8%) had a higher overall improvement when compared to group 2 (54.7%). The p value for
Group 1 was <0.001 similar to <0.001 of Group 2 indicating that both the treatment and placebo
shampoo assisted in significantly reducing the presence of itching on the scalp.
Group 1 and 2 were comparable at visit 1 and by visit 2 and 3, there still appeared to be no statistical
significance (p = 0.418 and 0.749 respectively) in the presence of itching.
One of the common manifestations of fungal conditions is itching (Hall and Hall, 2010). By using
anti-fungal treatments, fungal conditions can be treated adequately. The anti-fungal properties
found in shale oil (Willet, 2010) may explain the reduction in itching in Group 1. Sweet almond
amphoacetate, another of the ingredients which contributes to the base of the shampoo, is proposed
to relieve itching when used on the skin – this ingredient may explain why itching also decreased
in Group 2 (Brown, 2010).
According to Jennifer (2011), dandruff makes the sufferer feel embarrassed and self-conscious due
to the visible flakes as well the itching of the scalp which often results in the need to scratch the
scalp. Due to the embarrassment associated with the condition, participants in both groups may
have been conscious about rating this symptom accurately. This may explain why both Group 1
and 2 improved significantly with regards to itching.
Itching was also the only symptom evaluated solely by the participant. Taking this into account,
social desirability or the tendency for people to display themselves in a favourable manner
67
(Craighead and Weiner 2010), may have influenced the results obtained for itching as participants
were aware that the researcher was not able to evaluate this symptom.
5.7 Greasiness
The measurement for greasiness was also done for the participant and the researcher separately
using the VAS. The scalp was visualised and the hair was also felt for greasiness.
Both Group 1 and 2 had a total improvement for greasiness according to the participant
evaluations. Group 1 improved by 79.3% (p= <0.001) compared to group 2 with a 61.2% (p =
0.001) improvement. Both groups yielded a p value of <0.05 indicating a statistically significant
change in greasiness over the period of the study. This indicates that both shampoos produced
similar results with regards to greasiness. Similar to visits 1, no statistically significant difference
occurred between Group 1 and 2 by visit 2 and 3 (p = 0.468 and 0.115 respectively).
Overall improvements for greasiness were present in the researcher results for Group 1 with an
80.5% (p = 0.001) improvement and Group 2 with a 74% (p = <0.001) improvement. Similar to
the participant evaluations, no statistically significant differences occurred between the 2 groups
at visit 2 and 3 (p = 0.141 and 0.307 respectively)
The results from the participant and researcher evaluations indicate a similar outcome. Greasiness
of the scalp can be caused by numerous factors such as hormonal fluctuations, environmental
factors, hair washing frequency and the use of styling products (Johnson, 2013). One the major
hormonal changes that may possible have influenced the results for greasiness is menstruation.
Since the majority of the participants in the study were females and of reproductive age, hormonal
fluctuations may have influenced the results for greasiness of the scalp.
During the course of the study, participants were requested to wash their every second day. This
criteria may have resulted in participants washing their hair more often that what they usually
would. Due to more frequent hair washing, sebum accumulation (Gerson, 2004) – which is the
cause of greasiness – was kept to a minimum resulting in less greasy hair.
Participants were also advised to refrain from using any other shampoo or styling products on the
scalp which usually results in product build up at the roots of the hair and consequently increased
greasiness of the hair (Ahmed et al., 2007).
68
5.8 Global Impression
The term ‘global impression’ was used to indicate the social and psychological effects of the
condition on the sufferer which was also measured independently by the participants and the
researcher using the Visual Analogue Scale.
The overall participant global impression rating for both groups showed significant improvements
for Group 1 of 65% (p = 0.001). On the other hand, Group 2 showed less than half the improvement
of Group 1 (30.6%) with no statistical significance (p = 0.033).
Both groups were comparable with respect to global impression at visit 1. On the contrary, at visit
3 significant differences (p = 0.048) in the average global impression occurred between the 2
groups.
As indicated in the researcher results, Group 1 produced an overall average improvement of 56%
(p = 0.001) whereas Group 2 produced an overall improvement of 42.2% (p = 0.002) in global
impression. Although both groups showed improvements, at visit 3 (p = 0.209), no significant
difference was found between the 2 groups contrary to the results obtained in the participant
evaluation.
When compared, the results obtained from the ratings for global impression indicate that the
participant evaluations showed a greater improvement than the researcher evaluations.
According to Sage (2005), the psychological effects of dandruff are noteworthy due to the
increased concern in society regarding appearance. A scaly scalp may look unsanitary leaving the
sufferer embarrassed and self-conscious. The most visible symptom of dandruff is the presence of
flakes or scaling either on the scalp or over the shoulders. As discussed in section 5.4 above,
differences in the scaling between Group 1 and 2 was evident supporting why global impression
may have improved more in Group 1.
Interestingly, the global impression results suggest a greater significance for the participant
evaluations in Group 1 when compared to the researcher evaluations for Group 1. This may be
explained by the greater social impact of the condition on the sufferer when compared to the view
of an outsider viz. the researcher in this case. Similarly, in a study conducted by Ahmed et al.
(2007), at least 63.3% of sufferers were embarrassed by their condition.
69
5.9 Adherent Scalp Flake Score (ASFS)
The Adherent Scalp Flake Score (ASFS) grading is an 80 point system which divides the scalp
into 8 sections and allows the researcher to visualise and grade the scaling in each section of the
scalp out of 10. The score is then added to give a total score out of 80.
According to the results, it is indicated that both groups 1 and 2 showed significant improvements
of 67.9% (p = <0.001) and 50.6% (p = <0.001) respectively in the ASFS grading over the period
of the study.
At visit 1 there appeared to be no statistically significant difference for the inter group analysis as
both groups were comparable with regards to ASFS grading. However, at visit 3, as indicated in
the results the p value was 0.035 indicating a statistically significant difference in the mean ASFS
of the 2 groups.
The ASFS grading looks at scaling on the entire scalp. Since the results for scaling as seen in
section 5.4 above showed greater improvements in Group 1 than Group 2, the results of the ASFS
grading are congruent with those of scaling. Reasons such as those explained above in section 5.4
can be employed to explain the outcomes obtained for the ASFS grading of Group 1 as the ASFS
grading and the scaling of the VAS both look at the same symptom of dandruff. According to Nina
(2013), great emphasis is placed on clean hair which is believed to activate the hair follicle, reduce
excess sebum accumulation and prevent the build-up of excess cell on the scalp. Therefore the
increased frequency for hair washing may also account for the change in ASFS grading in Group
1.
70
CHAPTER 6: CONCLUSION AND RECOMMENDATIONS
6.1 Conclusion
The study aimed to ascertain the effect of sodium shale oil sulphonate 1% shampoo in the
appearance of dandruff using the following parameters: Scaling, irritation, itching, greasiness and
global impression and ASFS grading.
It was found that both sodium shale oil sulphonate 1% shampoo and the control shampoo may
contribute significantly to the improvement of the appearance of dandruff with respect to all of the
aforementioned parameters. No significant difference was found between the sodium shale oil
sulphonate 1% shampoo and the control shampoo relevant to irritation, itching, greasiness or
researcher global impression.
The sodium shale oil sulphonate 1% shampoo was shown to yield a higher percentage
improvement for each measured parameter than the control substance and showed a significant
improvement over and above the control shampoo with respect to only the following parameters:
scaling (participant rated p = 0.012; researcher rated p = 0.020) and the global impression
(participant rated p = 0.048). Higher numbers of participants and longer study periods are however
required to verify these results.
Comparable to the results presented for scaling, significant changes in ASFS grading occurred
overall at visit 3 for the sodium shale oil sulphonate 1% (67.9%) versus the control shampoo
(50.6%) (p = 0.035). The presence of a significant difference is indicative of the possibility that
sodium shale oil sulphonate 1% may be further suggest the verification of these results in the
management of dandruff by sodium shale oil sulphonate 1% shampoos.
The improvements in scaling and significant global impression recorded by the participant could
imply that sodium shale oil sulphonate 1% shampoo may decrease the appearance of scaling in a
relatively short period of time (16 days). Wide scale research and further verification of these is
mandated prior to the finalisation of any claim of beneficial improvement. The null hypothesis
therefore cannot be accepted.
The conclusion or results of this study may not be quoted for use or proof of efficacy nor
substantiation of any effect in any context without the express permission of the Department of
Homoeopathy, University of Johannesburg.
71
6.2 Recommendations
Should further research be conducted on sodium shale oil sulphonate 1% shampoo, the following
recommendations are advised based on the experience of the study:
A greater number of participants should be used in future studies in order for the results to
be more statistically significant with respect to parametric analysis.
The duration of the study should be extended in order to evaluate whether the shampoo has
effects on certain parameters such as irritation, itching and greasiness.
One gender may be used or matched pairing for gender can be employed to ensure an equal
gender distribution between the two groups. This may also assist in comparing the results
for gender.
A greater variation in ethnic groups should be included in future studies in order to compare
the results between ethnic groups and to allow for the demographics to be studied equally,
considering the cultural diversity in South Africa
As dandruff is described as a chronic condition a follow up should be performed after the
treatment is complete in order to evaluate the long lasting effects of the shampoo.
The shampoo may also be compared with commercially available shampoos in order to
determine its performance.
72
REFERENCES
Acton, Q. A. (2013). Sulphur acids – Advances in research and application. Georgia: Scholarly
Editions. p 240.
Adamski, Z. (2006). The treatment of dandruff of the scalp. Journal of Aesthetic Dermatology,
9(2):49-55.
Ahmed, M.K., Raza, N. & Ejaz, A. (2007). Knowledge, attitude and practice regarding dandruff
among soldiers. J Coll Physicians Surgical Pakistan, 17(3):128-3.
American Shale Oil Corp. (2015). Oil shale extraction method. Available from: <www.amso.net
/about-oil-shale-extraction-method.>. [Last accessed: 2 March 2015].
Arndt, K. A., Hsu, J. T. S. (2007). Manual of dermatologic therapeutics. 7th ed. Philadelphia:
Lippincot Williams and Wilkin Publishers. p. 180-182.
Ashbee, R., Bignell, M. H. (2010). The yeast handbook: Pathogenic yeasts. Berlin: Springer-
Verlag. p. 200-210.
Ashianti, A. H., Rastegar, H., Aghaei, M., Ehsani, A., Barikbin, B., Salout, M. H. (2013). Clinical
efficacy of natural formulated shampoo in subjects with dandruff and seborrheic dermatitis.
American Journal of Research Communication. 1 (8):72-75.
Bacon, R. A. (2012). Assessing therapeutic effectiveness of scalp treatments for dandruff and
seborrheic dermatitis, Part 1: A reliable and relevant method based on the adherent scalp flaking
score (ASFS). Journal of Dermatological Treatment, 1 (5):2-4.
Baran, R., Maibach, H, I. (1998). Textbook of cosmetic dermatology. 2nd ed. London: Martin
Dunitz Ltd. p 149-152.
Barel, O. A., Paye, M., Maibach, H. I. (2010). Handbook of cosmetic science and technology. 3rd
ed. Florida: CRC Press. p 462.
73
Beckert, S, Warnecke, J., Zelenkova, H., Kovnerystyy, O., Stege, H., Colcha, W., Konigsrainer,
A., Coerper, S. (2005). Efficacy of topical pale sulfonated shale oil in the treatment of venous leg
ulcers: A randomized, controlled, multicenter study. Journal of Vascular Surgery, 43(1): 92.
Blenkinsopp, A., Paxton, P., Blenkinsopp, J. (2014). Symptoms in the pharmacy: A guide to the
management of common illnesses. West Sussex: John Wiley and Sons Ltd. p. 100-110.
Boarder, M., Newby, D., Navti, P. (2010). Pharmacology for pharmacy and health sciences: A
patient-centred approach. New York: Oxford University Press. p 588.
Bolognia, J. L., Jorizzo, J. L., Rapini, R. P. (2003). Dermatology. U.S.A: Mosby Publishers. p 200.
Born, S. (2015). Shampoo free: A DIY guide to putting down the bottle and embracing healthier
hair. New York: Skyhorse and Skyhorse Publishing. p. 52.
Brown, D. W. (2010). Change your mood with aromatherapy. London: Hodder Education. p 42.
Case, H. (2013). The dangers of cocamidopropyl betaine. Available from: <http://www.livestr
ong.com/article/226739-dangers-ofcocamidopropylbetaine/>. [Last Accessed: 2 November 2015].
Chhavi, S., Sushma, D., Mohammad, A. (2011). Potential of herbals as anti-dandruff agents.
International Research Journal of Pharmacy, 2(3):16-18.
Colcha, W., Leuschner, J., Leuschner, F. (2004). The tolerability of pale sulfonated shale oil
following local and systemic administration. Arzneimittel-Forschung, 44(2):170-177.
Colledge, N. R., Walker, B. R., Ralston, S. H. (2010). Davidson’s principles and practice of
medicine. 21st ed. New York: Churchill Livingstone. p 1237-1240.
Colon, K. (2014). Fight back against dandruff with home remedies. The Huffington Post.
Available from: <www.huffingtonpost.com/kristen-colon/dandruff-remedies>. [Last accessed: 2
March 2015].
Craighead, W. E., Weiner, B. I. (2010). The Corsini encyclopedia of psychology. New Jersey: John
Wiley and Sons Inc. p 1628.
74
DeAngelis, Y, M., Gemmer, C. M., Kaczvinsky, J. R., Kenneally, D. C., Schwartz, J. R., Dawson,
T. L. (2005). Three etiologic facets of dandruff and seborrheic dermatitis: Malassezia fungi,
sebaceous lipids, and individual sensitivity. Journal of Investigative Dermatology, 10:295-297.
Dermweb. (2008). Diagrammatic representation of hair anatomy. Available from: <http://www.d
ermweb.com/hairnailsmucousmembranes/diagram3page.htm>. [Last accessed: 15 September
2015].
Frederick, D. A., Lever, J., Peplau, A. L. (2007). Interest in cosmetic surgery and body image:
views of men and women across the lifespan. Journal of Plastic and Reconstructive Surgery,
120(5):1414.
Gayko, G. (2004). Pale sulphonated shale oil exhibits antimicrobial and tissue repairing effects in
wound healing. Veterinary Dermatology, 15(1):20-40
Gerson, J. (2004). Milady’s standard fundamentals of estheticians. 9th ed. Canada: Delmar
Learning. p. 190-192.
Gift, A. (1989). Visual analogue scales: measurement of subjective phenomena. Nursing
Research, 38(5):286-288.
Goodheart, H. P. (2009). Goodheart’s photoguide to common skin disorders: Diagnosis and
management. Philadelphia: Lippincott Williams and Wilkins. p 16.
Gupta, A., Madzia, S., Batra, R. (2004). Etiology and management of seborrheic dermatitis.
Dermatology, 208(2):89-93.
Hall, B. J., Hall, J. C. (2010). Sauer’s manual of skin disease. 10th ed. Philadelphia: Lippincot
Williams and Wilkin Publishers. p 149-152.
Harding, C., Moore A., Rogers, J., Meldrum, H., Scott, A., McGlone, F. (2002). Dandruff: a
condition characterized by decreased levels of intercellular lipids in scalp stratum corneum and
impaired barrier function. Archives of Dermatological Research, 294(5): 221-230.
75
Hauser, K., Walsh, D. (2008). Visual analogue scales and assessment of quality of life in cancer.
Journal of Supportive Oncology, 6(6):277-282.
Hull, K. L. (2011). Human form, human function: Essentials of anatomy and physiology. 1st ed.
Philadelphia: Lippincot Williams and Wilkin Publishers. p 94-104.
Jacknin, J. (2001). Smart medicine for your skin: a comprehensive guide to understanding
conventional and alternative therapies to heal common skin problems. U.S.A: Penguin Putnam
Inc. p 271-273.
Jacoby, D., Moungson, R. M. (2005). Encyclopedia of family health. 2nd ed. New York: Marshall
Cavendish Corporation. p 151.
Jadhav, B. B. (2004). Practice of homeopathy at home. 4th ed. New Delhi: B. Jain Publishers. p
268-272.
Jennifer, A. (2011). Seborrheic dermatitis: A clinical practice snapshot. The American Journal of
Primary Health Care, 36(8):32 – 37.
Johnson, J. (2013). Greasy hair. Available from: <http://www.hygieneexpert.co.uk/greasyha
ir.html>. [Last accessed: 3 September 2015].
Johnson, B., Nunley, J. (2000). Treatment of seborrheic dermatitis. American Family Physician,
61(9):2703-2710.
Johnson, J. (1997). Visual Analogue Scales: Part I and II. A quarterly publication of the
Department of Clinical Investigation. Available from: <http: //www.bamc.amedd.army.mil/ DCI/
articles>. [Last Accessed 10 March, 2015].
Kandarova H., Kejlova K., Jirova D. (2005). ECVAM Feasibility Study: Can the pre-validated in
vitro skin model phototoxicity assay be upgraded to quantify phototoxic potency of topical
phototoxins? Poster Presentation, 5th World Congress on Alternatives & Animal Use in the Life
Sciences. Germany. p 10-25.
76
Kelly, A. M. (2001). The minimum clinically significant difference in the visual analogue scale
score does not differ with severity of pain. Emergency Medicine Journal, 18:205-207.
Kent, K. (2005). The effectiveness of an oral homoeopathic preparation of Selenium Sulphide 12X
in the management of dandruff. Unpublished. M. Tech Dissertation. Supervisor: Dr M. Maharaj.
M Tech Hom (TN). Co-supervisor: Dr I Couchman. M Tech Hom (TN). Durban University of
Technology. p 70-75.
Korting, H. C., Schmid, M. H. (1998). Coal tar, pine tar and sulfonated shale oil preparations:
comparative activity, efficacy and safety. Dermatology Journal 193 (1): 1-5.
Korting, H, C., Schollman, C., Cholcha, W., Wolff, L. (2010). Efficacy and tolerability of pale
sulfonated shale oil cream 4% in the treatment of mild to moderate atopic eczema in children: a
multicentre, randomized vehicle-controlled trial. Journal of the European Academy of
Dermatology and Venereology, 24:1176-1182.
Laden, K., Finkelstein, P. (2000). An objective measure for evaluation of dandruff severity.
Journal of the Society of Cosmetic Chemists, 19:669-673.
Leigh, K. (2015). Ingredients in shampoos and conditioners. Available from: <http://www.lives
trong.com/article/73827-ingredients-shampoos-conditioners-cause-hair>. [Last Accessed: 2 Nov
ember 2015].
Loden, M., Maibach, E. (2000). Dry skin and moisturizers. U.S.A: CRC Press LLC. p 136-163.
Lunar Pharmaceuticals. (2014). Information on Ichthyol Pale®. Available from: Lunar
Pharmaceuticals. [Last accessed: 23rd April 2014].
Lyman Ott. R, Longnecker. M. T. (2015). An introduction to statistical analysis and data
collection. U.S.A: Cengage Learning. p 300-315.
Malassez, L. (1874). Note sur le champignon de pityriasis simplex. Archives of Physiology and
Pathology. p. 202.
77
Marieb, N. M., Hoehn, K. (2013). Human anatomy and physiology. 9th ed. U.S.A: Pearson
Publishers. p 246.
Martini, F., Nath, J. L. (2009). Fundamentals of anatomy and physiology. 8th ed. San Francisco:
Pearson Benjamin Cummings. p 158-174.
Matthews, L. (2012). Dermis anatomy of the skin. Available from: <http://www.naturallyhealthy
skin.org/anatomy-of-the-skin/the-dermis/dermis-anatomy-of-the-skin/>. [Last accessed: 8 April
2015].
Metcalf, E. (2013). How to handle dandruff. Available from: <http://www.webmd.com/skin-
problems-and-treatments/dandruff-13/natural-fixes?page=1>. [Last accessed: 21 September
2015].
Mercola, D. (2013). Sodium laureth sulphate: Fact vs. Fairytale. Available from: <http://articles
.mercola.com/sites/articles/archive/2010/07/13/sodium-lauryl-sulfate.aspx>. [Last Accessed: 2
November 2015].
Nathan, A. (2010). Non-prescription medicines. 4th ed. Great Britian: Pharmaceutical Press. p 77-
85.
Nina, M. (2013). 14 simple steps to deal with dandruff. Available from: < http://www.14steps.or
g/14-steps-to-deal-with-dandruff.html>. [Last accessed: 3 September 2015].
Nowicki, R. (2006). Modern management of dandruff. NCBI. Available from: <http://www.ncbi
.nlm.nih.gov/pubmed/16617752>. [Last accessed: 15th August 2014].
Percival, S., Cutting, K. (2010). Microbiology of wounds. Florida: CRC Press. p. 69-72.
Pierard–Franchimont, C., Pierard, G., Aresse, J. and De Doncker, P. (2001). Effect of ketoconazole
1% and 2% shampoo on severe dandruff and seborrheic dermatitis: clinical, squamometric and
mycological assessment. Dermatology, 202(2):171-179.
Pierard, G. (2008). Seborrheic dermatitis today, gone tomorrow? The link between Biocene and
treatment. Dermatology, 206(3):187-188.
78
Prambhamanju, M., Shankar, G. S., Babu, K., Ranjith, M. S. (2009). Herbal vs. chemical
substances as anti-dandruff agents: which are more effective in management of dandruff: An
overview. Egyptain Dermatology Journal, 5(2):1-8.
Pray, S. W. (2006). Non-prescription product therapeutics. 2nd ed. U.S.A: Lippincot Williams and
Wilkin Publishers. p. 470-486.
Preedy, V. R. (2012). Handbook of hair in health and disease. Germany: Wageningen Academic
Publishers. p 70-76.
Proctor and Gamble Company. (2002). Dermatology; P & G scientists pinpoint cause of dandruff.
Health and Medicine Weekly, 19(11):10-12.
Rastegar, H. (2009). A comparison of clinical efficacy between a basic shampoo with herbal
extracts containing Climbazole and its similar sample containing piroctone olamine in the
treatment of dandruff and seborrheic dermatitis. Iranian Journal of Dermatology, 12 (3):82-84.
Ravichandran, D., Bharadwaj, V. S., Kolhapure, S. A. (2004). Evaluation of the clinical efficacy
and safety of “Anti-Dandruff Shampoo” in the treatment of dandruff. The Antiseptic. 202(1):5-8.
Reiman, P. (2003). Fighting the flakes. Dermatology Times, 24(8):52.
Robbins, C. R. (2012). Chemical and physical behavior of human hair. 5th ed. Berlin: Springer-
Verlag. p. 419-422.
Roger, W. (2010). Dandruff. Available from: <http://www.mayoclinic.com/health /dandruff/DS0
0456>. [Last accessed: 15th Aug 2014].
Sage, S. (2005). How to overcome dandruff and other scalp disorders. U.S.A: eBook wholesaler
Publications. p. 5-10.
Saint-Ledger, A., Kligman, M., Stoudemayer, T. J. (2000). A new method to quantify scaling in
dandruff. Journal of the Society of Cosmetic Chemists, 39:179-19.
.
79
Sample, D, G., Ravichandra, G., Desni, I. (2000). Evaluation of safety and efficacy of
ketoconazole 2% and zinc pyrithione 1% shampoo in patients with moderate to severe dandruff –
post marketing study. Journal of the Indian Medical Association, 92(12):810-811.
Sanders, P. J. (2008). Healthy skin plain and simple.1st ed. Bloomington: iUniverse Publishers. p
78.
Schwanke, J. (2002). Studies get to the root of dandruff; reveal new causes, cures for ailment.
Dermatology Times, 23(7):22.
Schwarts, J. (2012). A reliable and relevant method for assessing dandruff product efficacy based
on the adherent scalp flaking score (ASFS). Journal of the American Academy of Dermatology,
68 (4):81-85.
Schwarts, J. R. (2003). Dandruff and seborrheic dermatitis. Florida: TRI Publications. p. 5-30.
Schwartz, J, R., Cardin, C, W., DeAngelis, Y, M., Dawson, T, L., (2010). Textbook of cosmetic
dermatology. U.S.A: Elsevier. p. 230-241.
SLS Free. (2015). Sodium laureth sulphate in shampoos. Available from: <http://slsfree.net/an-
sls-free-shampoo-list>. [Last Accessed: 2 November 2015].
SpecialChem. (2013). Cocamidopropyl betaine. Available from: <http://cosmetics.specialchem
.com/cocamidopropyl-betaine>. [Last Accessed: 2 November 2015].
Stubbs, R., Hughes, D., Johnstone, A., Rowley, E., Reid, C., Elia, M., Stratton, R., Delargy, H.,
King, N. and Blundell, J. (2000). The use of visual analogue scales to assess motivation to eat in
human subjects: a review of their reliability and validity with an evaluation of new hand-held
computerized systems for temporal tracking of appetite ratings. British Journal of Nutrition,
84:405-415.
Thomas, P, H., Campbell, J, L., Quitadamo, M, J., Zug, K, A. (2001). Skin disease: Diagnosis and
treatment. Missouri: Mosby Inc. p 94-96.
80
Van Staden, J. (2014). Statkon, Personal Discussion. 13 May 2014, Chiselhurst House, APK, UJ,
(+27 (011) 559-2851), (email: [email protected]).
Warner, R, R., Schwartz, J, R., Boissy, Y., Dawson, T, L. (2001). Dandruff altered stratum
corneum ultrastructure that is improved with zinc pyrithione shampoo. Journal of Americam
Academic Dermatology, 45: 897-903.
Wiles, R, M., Williams, J., Ahmad, A, K. (2011). Essentials of dermatology for chiropractors.
United Kingdom: Jones and Bartlett Publications LLC. p. 140.
Willet, J. (2010). The American beauty industry encyclopedia. U.S.A: Greenwood Press. p. 81-
85.
81
APPENDIX A
Advertisement
Are you between the ages of 18 and 45?
You may qualify to participate in a research study conducted at the Department of
Homoeopathy of the University of Johannesburg on:
The effect of the Sodium Shale Oil Sulphonate 1% Shampoo on Dandruff
This research study has been approved by the Faculty of Health Sciences Higher Degrees
and Ethics Committee
Ethical Clearance No:
If you are interested please contact:
Zeenat Mia – 0767617019
DO YOU SUFFER FROM
DANDRUFF?
82
APPENDIX B
Participant Information Form
Dear Prospective Participant
My name is Zeenat Mia and I am currently in my final year at the University of Johannesburg
studying homoeopathy. I would like to extend to you a warm invite to participate in my research
study which I am currently commencing for my master’s degree qualification.
The purpose of the study is to determine the effect of Sodium shale oil sulphonate 1% shampoo
on dandruff.
Sodium shale oil sulphonate is made from the oil found in the keragon rock. Based on internal
research done on the shampoo, the shampoo has anti-bacterial and anti-fungal properties which all
facilitate in the treatment of dandruff. Sodium shale oil sulphonate 1% shampoo is well tolerated
and safe for use in many skin disorders with no anticipated risks or known side effects to the use
of the shampoo.
The study will be performed in the form of a double-blind controlled study where participants will
be divided into two groups: an experimental and a control group. One group will receive a bottle
of shampoo containing active anti-dandruff ingredients (experimental group) whereas the other
group will receive a bottle of shampoo containing no active anti-dandruff ingredients (control
group).
You are warmly invited to participate if you:
• Are within the age group of 18-45 years;
• Have good general health;
• Are suffering from mild to moderate dandruff with itching, flaking, irritation, greasiness
and possibly hair loss;
• Have a baseline Adherent Scalp Flaking Score grading of ≥24.
Unfortunately you may not participate in the study if you:
• Suffer from severe scalp conditions such as psoriasis, atopic dermatitis, contact dermatitis
or tinea capitis;
83
• Have been diagnosed with chronic or systemic diseases including diabetes mellitus,
epilepsy, rheumatic fever, hypertension, thyroid disease, hypercholesterolemia or
autoimmune conditions;
• Are currently on chronic medication;
• Are currently on treatment for dandruff;
• Are pregnant or lactating.
The study will be conducted at the University of Johannesburg, Doornfontein Campus over a 16
day period. At your first visit, an assessment will be done of your blood pressure, temperature,
respiratory rate and pulse rate as well as a general examination to assess your overall health status.
Thereafter, the current condition of your dandruff will be assessed as follows. At each consult you
will be given a form to objectively score your dandruff. I will also fill out an amended version of
the form to rate your dandruff and observe your scalp to note the severity of your condition.
After the above has been performed, you will be given a bottle of shampoo which will be used to
wash your hair once a day, every second day starting from day one. At each wash, only 25ml of
shampoo must be used. This will be measured out using a measuring cup supplied to you. No other
shampoo should be used for the duration of the study. I will send you an SMS the night before to
remind you to wash your hair the following day.
Follow up consultations will be performed every 8 days. At each follow up consultation, your
dandruff will be assessed using the same methods performed at your initial consultation.
Participation in this study is free of charge, voluntary and there is no reimbursement. You are free
to leave or withdraw from the study at any time. All information provided to me during the study
will remain anonymous and private as none of your details will be disclosed in the write up and
all files will be kept in a secure cabinet for five years with your name being replaced by a case
number. Files will only be assessed by me (the researcher) and my supervisor.
By taking part in the study you may be provided with possible treatment to eradicate and improve
the condition of your dandruff and, there are no anticipated risks involved in the study.
If you have any questions, concerns or problems relating to this study, please feel free to contact
me or, if necessary, my supervisor on the contact details listed below. If you wish to view the
results of the research, they will be made available as per your request.
84
Your participation in this research study will be highly appreciated and will contribute to
knowledge and further effective treatment of dandruff using Sodium shale oil sulphonate 1%
shampoo.
Thank you
Zeenat Mia
Contact details
Researcher: Zeenat Mia Tel: 0767617019
Supervisor: Dr Neil. T. Gower Tel: 0115596779
85
APPENDIX C
Participant Consent Form
I,___________________________________, participant in the research, have been correctly
informed of the research procedure, risks, and potential benefits of the study. I understand what
the study is about and by signing the consent form I agree to participate in the study and agree to
the methods and treatment therein. I understand that my participation is voluntary and I can
withdraw at any point during the process. I understand that the researcher will be available to
answer any questions at any time.
Date: Signature:
I, Zeenat Mia, the researcher, have fully explained the study procedures and treatment used to
conduct this research. I agree to answer any questions that arise from the participants to the best
of my ability.
Date: Signature:
Contact details
Researcher: Zeenat Mia Tel: 0767617019
Supervisor: Dr Neil. T. Gower Tel: 0115596779
86
APPENDIX D
Physical Examination
Vital Signs
Temperature:
Blood pressure:
Respiratory rate:
Pulse rate:
Weight:
Height:
General examination: CAJCOLD
Cyanosis
Anaemia
Jaundice
Clubbing
Oedema
Lymphadenopathy
Dehydration
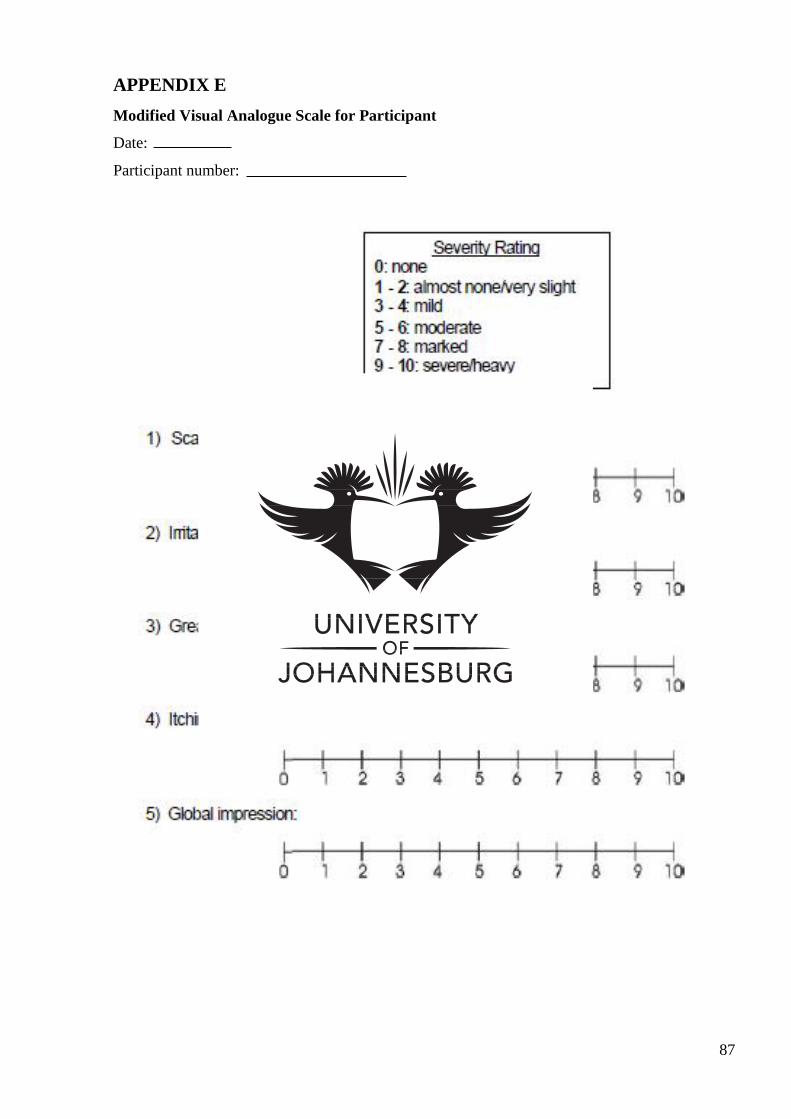
87
APPENDIX E
Modified Visual Analogue Scale for Participant
Date:
Participant number:
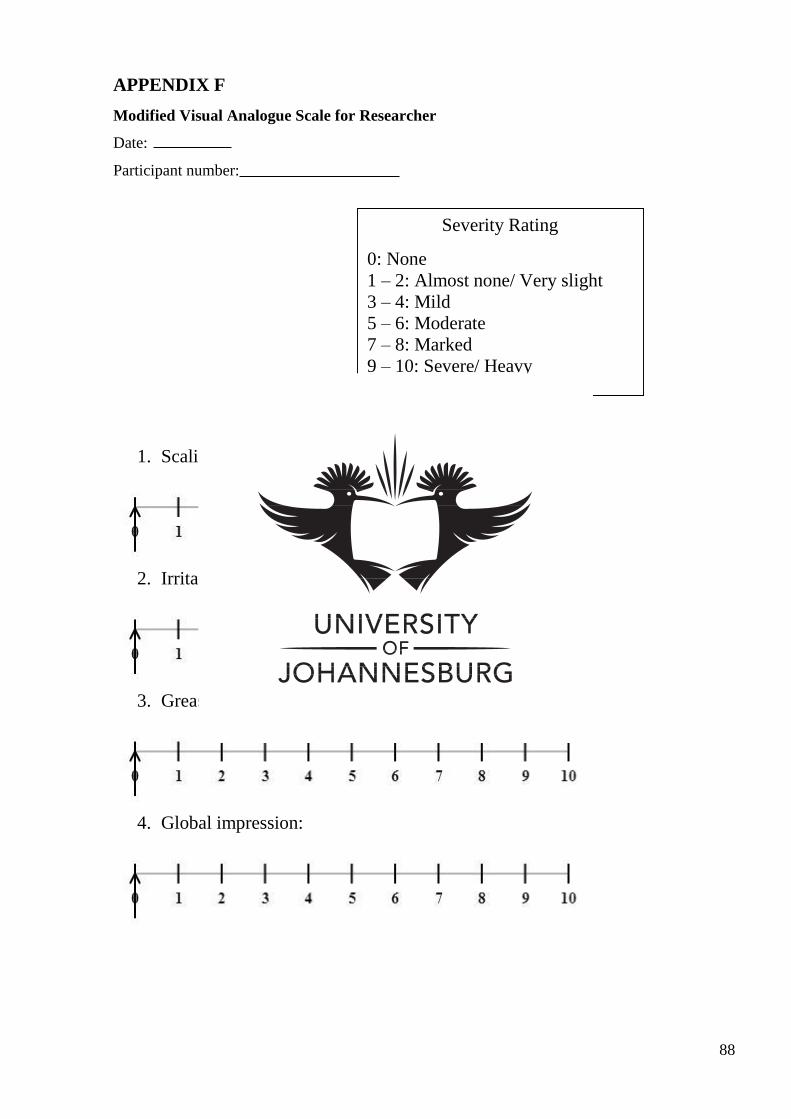
88
APPENDIX F
Modified Visual Analogue Scale for Researcher
Date:
Participant number:
1. Scaling:
2. Irritation:
3. Greasiness:
4. Global impression:
Severity Rating
0: None
1 – 2: Almost none/ Very slight
3 – 4: Mild
5 – 6: Moderate
7 – 8: Marked
9 – 10: Severe/ Heavy
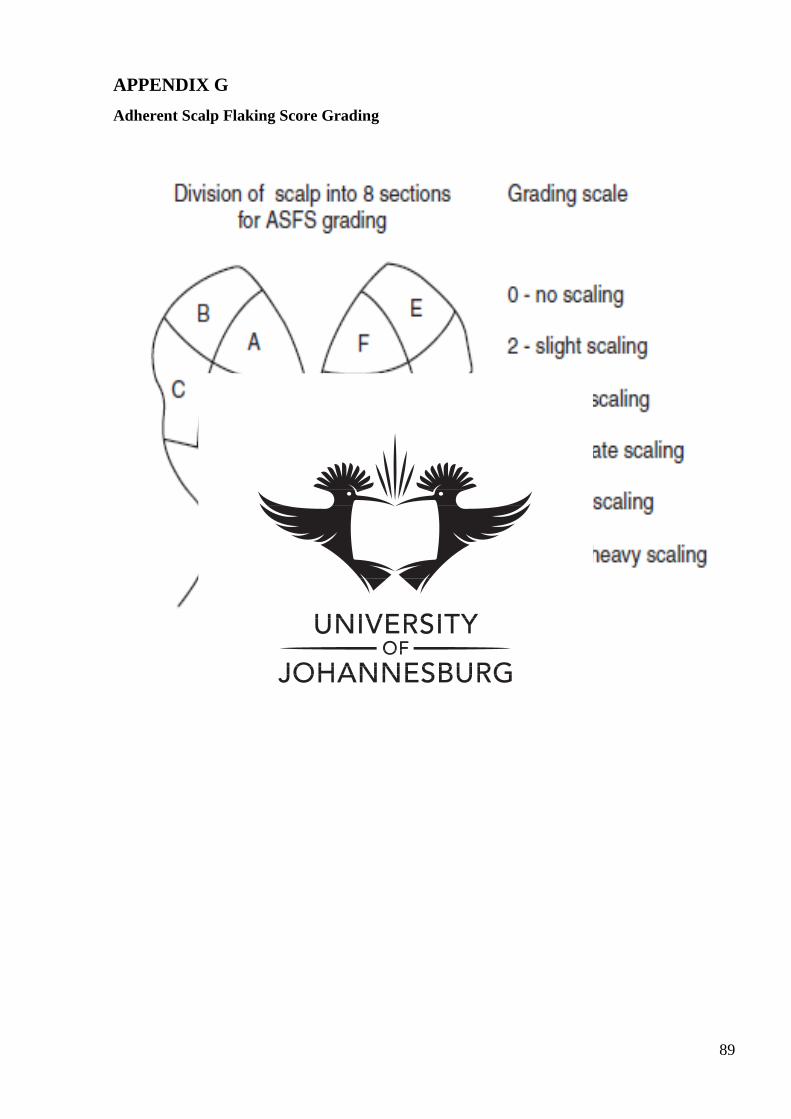
89
APPENDIX G
Adherent Scalp Flaking Score Grading

90
APPENDIX H
Matching Procedure
The medication and placebo will be classified and ascribed by Lunar Pharmaceuticals. The groups
will be labelled 1 or 2.
The motive of this process is to match each participant according severity of dandruff while
randomly allocating each to one of the two groups.
This procedure will be assisted by using 3 different envelopes with the number 1 or 2 dividing the
groups according to severity of dandruff as per scoring on ASFS grading
• 24 – 42
• 43 – 61
• 62 – 80
Each participant will be asked to withdraw a number from the applicable envelope for their severity
of dandruff. This will assign them to the treatment or control group respectively, thus ensuring an
even distribution between the two groups. Once the envelope is empty the numbers will be
restocked.

91
APPENDIX I
Data Collection for Statistical analysis

92
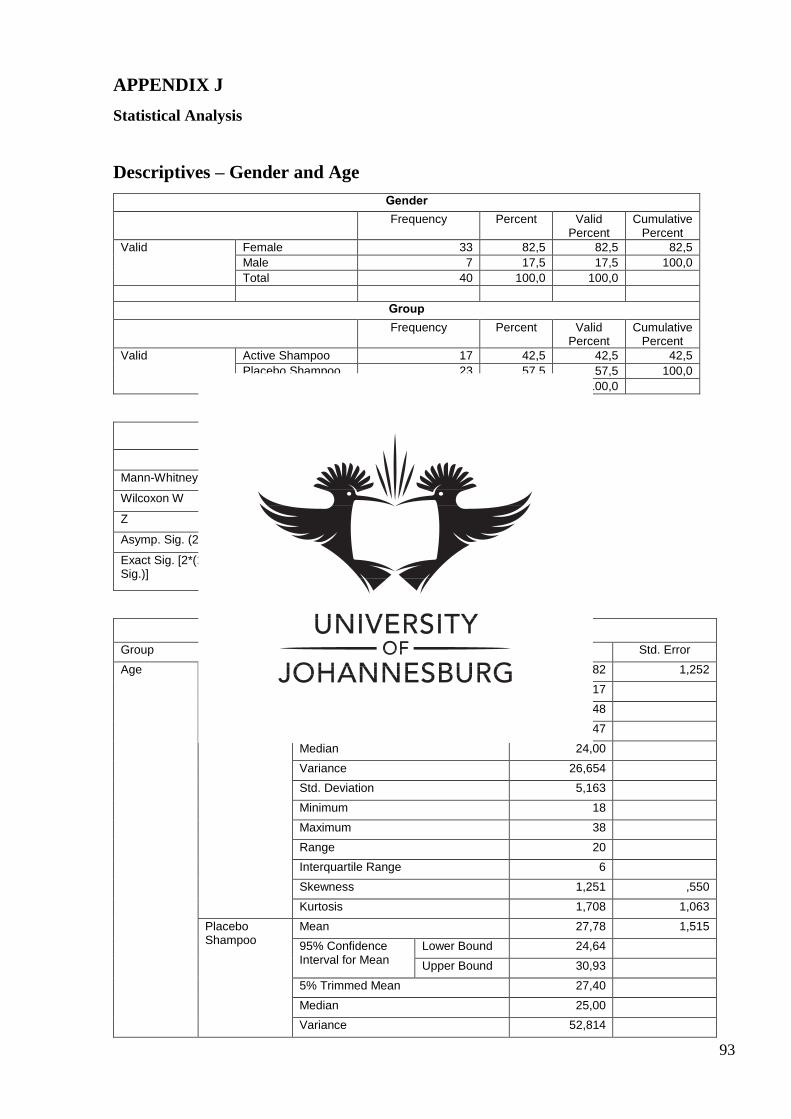
93
APPENDIX J
Statistical Analysis
Descriptives – Gender and Age
Gender
Frequency Percent Valid Percent
Cumulative Percent
Valid Female 33 82,5 82,5 82,5
Male 7 17,5 17,5 100,0
Total 40 100,0 100,0
Group
Frequency Percent Valid Percent
Cumulative Percent
Valid Active Shampoo 17 42,5 42,5 42,5
Placebo Shampoo 23 57,5 57,5 100,0
Total 40 100,0 100,0
Test Statisticsa
Age
Mann-Whitney U 147,500
Wilcoxon W 300,500
Z -1,318
Asymp. Sig. (2-tailed) ,187
Exact Sig. [2*(1-tailed Sig.)]
.191b
Descriptives
Group Statistic Std. Error
Age Active Shampoo
Mean 24,82 1,252
95% Confidence Interval for Mean
Lower Bound 22,17
Upper Bound 27,48
5% Trimmed Mean 24,47
Median 24,00
Variance 26,654
Std. Deviation 5,163
Minimum 18
Maximum 38
Range 20
Interquartile Range 6
Skewness 1,251 ,550
Kurtosis 1,708 1,063
Placebo Shampoo
Mean 27,78 1,515
95% Confidence Interval for Mean
Lower Bound 24,64
Upper Bound 30,93
5% Trimmed Mean 27,40
Median 25,00
Variance 52,814
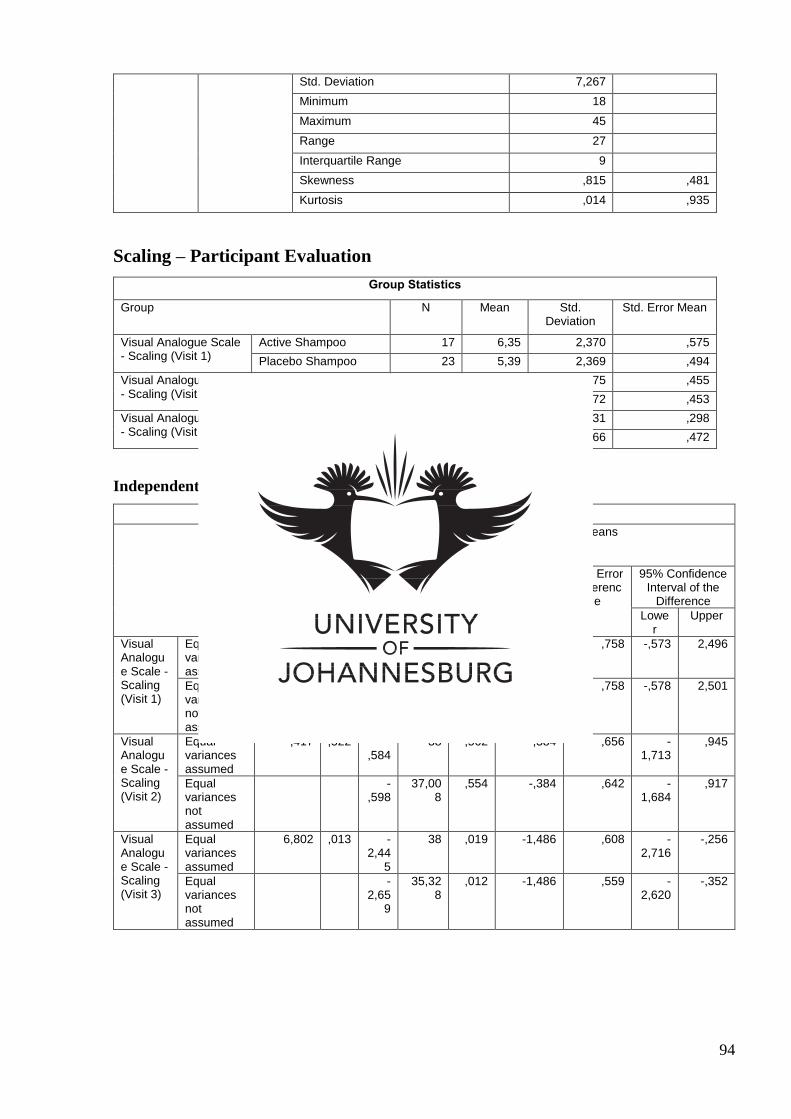
94
Std. Deviation 7,267
Minimum 18
Maximum 45
Range 27
Interquartile Range 9
Skewness ,815 ,481
Kurtosis ,014 ,935
Scaling – Participant Evaluation
Group Statistics
Group N Mean Std. Deviation
Std. Error Mean
Visual Analogue Scale - Scaling (Visit 1)
Active Shampoo 17 6,35 2,370 ,575
Placebo Shampoo 23 5,39 2,369 ,494
Visual Analogue Scale - Scaling (Visit 2)
Active Shampoo 17 3,53 1,875 ,455
Placebo Shampoo 23 3,91 2,172 ,453
Visual Analogue Scale - Scaling (Visit 3)
Active Shampoo 17 1,47 1,231 ,298
Placebo Shampoo 23 2,96 2,266 ,472
Independent Samples T Test
Independent Samples Test
Levene's Test for Equality of
Variances
t-test for Equality of Means
F Sig. t df Sig. (2-
tailed)
Mean Differenc
e
Std. Error Differenc
e
95% Confidence Interval of the
Difference
Lower
Upper
Visual Analogue Scale - Scaling (Visit 1)
Equal variances assumed
,137 ,714 1,269
38 ,212 ,962 ,758 -,573 2,496
Equal variances not assumed
1,269
34,624
,213 ,962 ,758 -,578 2,501
Visual Analogue Scale - Scaling (Visit 2)
Equal variances assumed
,417 ,522 -,584
38 ,562 -,384 ,656 -1,713
,945
Equal variances not assumed
-,598
37,008
,554 -,384 ,642 -1,684
,917
Visual Analogue Scale - Scaling (Visit 3)
Equal variances assumed
6,802 ,013 -2,44
5
38 ,019 -1,486 ,608 -2,716
-,256
Equal variances not assumed
-2,65
9
35,328
,012 -1,486 ,559 -2,620
-,352
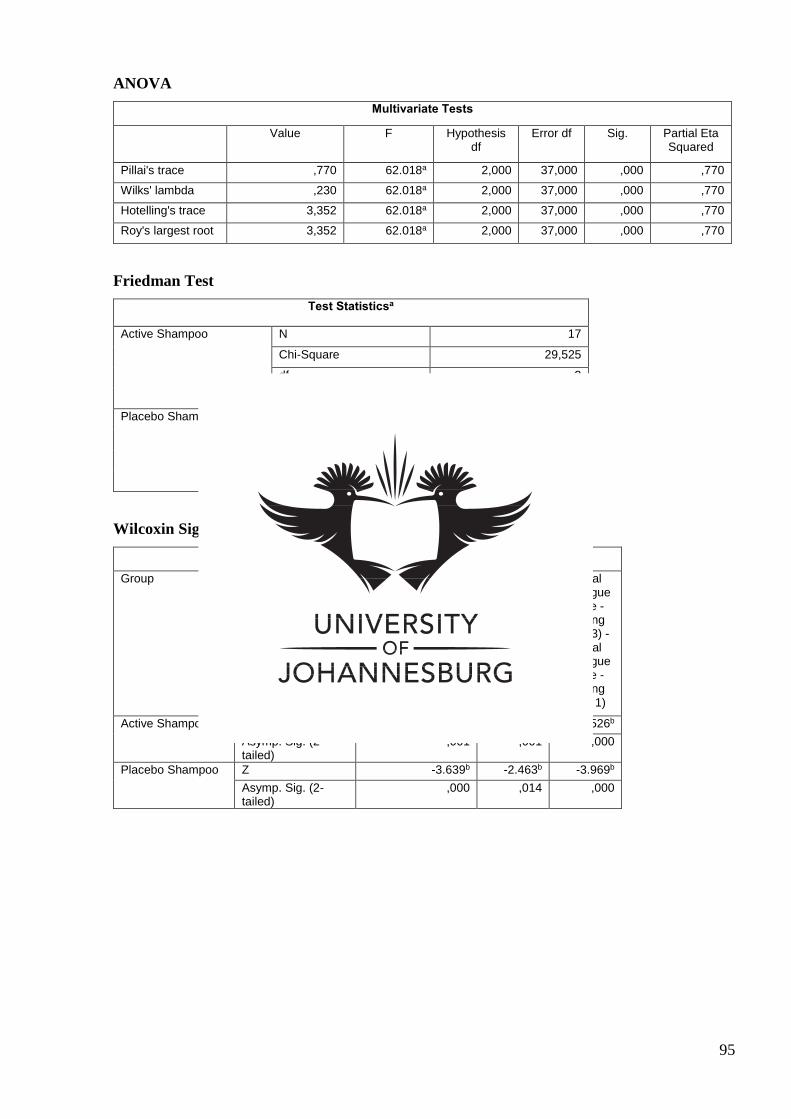
95
ANOVA
Multivariate Tests
Value F Hypothesis df
Error df Sig. Partial Eta Squared
Pillai's trace ,770 62.018a 2,000 37,000 ,000 ,770
Wilks' lambda ,230 62.018a 2,000 37,000 ,000 ,770
Hotelling's trace 3,352 62.018a 2,000 37,000 ,000 ,770
Roy's largest root 3,352 62.018a 2,000 37,000 ,000 ,770
Friedman Test
Test Statisticsa
Active Shampoo N 17
Chi-Square 29,525
df 2
Asymp. Sig. ,000
Placebo Shampoo N 23
Chi-Square 29,368
df 2
Asymp. Sig. ,000
Wilcoxin Signed Ranks Test
Test Statisticsa
Group Visual Analogue Scale - Scaling (Visit 2) - Visual
Analogue Scale - Scaling (Visit 1)
Visual Analogue
Scale - Scaling
(Visit 3) - Visual
Analogue Scale - Scaling (Visit 2)
Visual Analogue
Scale - Scaling
(Visit 3) - Visual
Analogue Scale - Scaling (Visit 1)
Active Shampoo Z -3.329b -3.219b -3.526b
Asymp. Sig. (2-tailed)
,001 ,001 ,000
Placebo Shampoo Z -3.639b -2.463b -3.969b
Asymp. Sig. (2-tailed)
,000 ,014 ,000
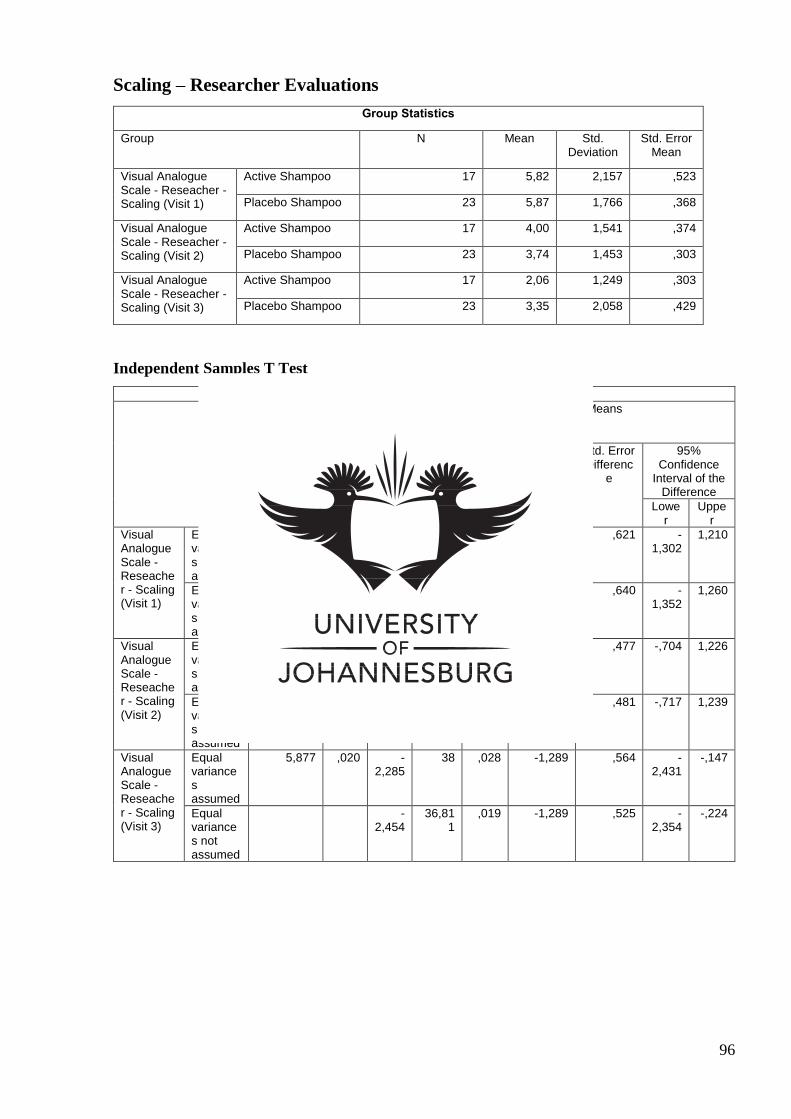
96
Scaling – Researcher Evaluations
Group Statistics
Group N Mean Std. Deviation
Std. Error Mean
Visual Analogue Scale - Reseacher - Scaling (Visit 1)
Active Shampoo 17 5,82 2,157 ,523
Placebo Shampoo 23 5,87 1,766 ,368
Visual Analogue Scale - Reseacher - Scaling (Visit 2)
Active Shampoo 17 4,00 1,541 ,374
Placebo Shampoo 23 3,74 1,453 ,303
Visual Analogue Scale - Reseacher - Scaling (Visit 3)
Active Shampoo 17 2,06 1,249 ,303
Placebo Shampoo 23 3,35 2,058 ,429
Independent Samples T Test
Independent Samples Test
Levene's Test for Equality of Variances
t-test for Equality of Means
F Sig. t df Sig. (2-
tailed)
Mean Differenc
e
Std. Error Differenc
e
95% Confidence
Interval of the Difference
Lower
Upper
Visual Analogue Scale - Reseacher - Scaling (Visit 1)
Equal variances assumed
1,048 ,313 -,074 38 ,941 -,046 ,621 -1,302
1,210
Equal variances not assumed
-,072 30,357
,943 -,046 ,640 -1,352
1,260
Visual Analogue Scale - Reseacher - Scaling (Visit 2)
Equal variances assumed
,485 ,490 ,547 38 ,587 ,261 ,477 -,704 1,226
Equal variances not assumed
,542 33,432
,591 ,261 ,481 -,717 1,239
Visual Analogue Scale - Reseacher - Scaling (Visit 3)
Equal variances assumed
5,877 ,020 -2,285
38 ,028 -1,289 ,564 -2,431
-,147
Equal variances not assumed
-2,454
36,811
,019 -1,289 ,525 -2,354
-,224
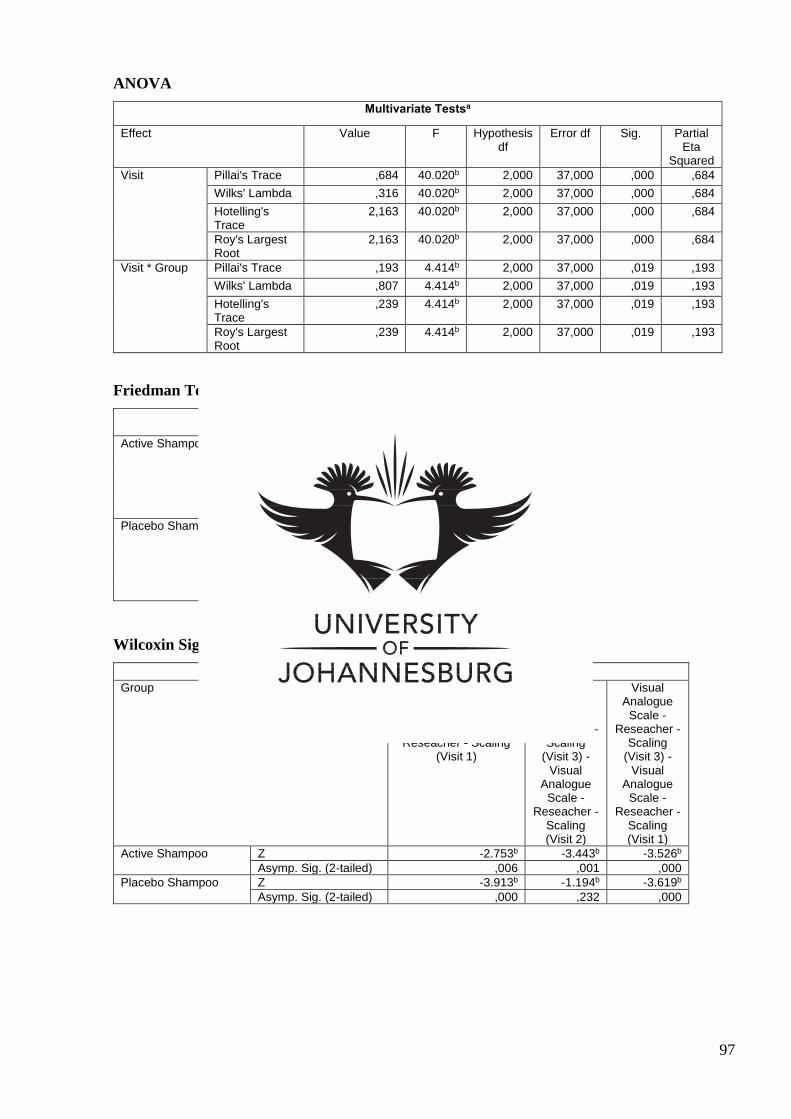
97
ANOVA
Multivariate Testsa
Effect Value F Hypothesis df
Error df Sig. Partial Eta
Squared
Visit Pillai's Trace ,684 40.020b 2,000 37,000 ,000 ,684
Wilks' Lambda ,316 40.020b 2,000 37,000 ,000 ,684
Hotelling's Trace
2,163 40.020b 2,000 37,000 ,000 ,684
Roy's Largest Root
2,163 40.020b 2,000 37,000 ,000 ,684
Visit * Group Pillai's Trace ,193 4.414b 2,000 37,000 ,019 ,193
Wilks' Lambda ,807 4.414b 2,000 37,000 ,019 ,193
Hotelling's Trace
,239 4.414b 2,000 37,000 ,019 ,193
Roy's Largest Root
,239 4.414b 2,000 37,000 ,019 ,193
Friedman Test
Test Statisticsa
Active Shampoo N 17
Chi-Square 27,785
df 2
Asymp. Sig. ,000
Placebo Shampoo N 23
Chi-Square 24,488
df 2
Asymp. Sig. ,000
Wilcoxin Signed Ranks Test
Test Statisticsa
Group Visual Analogue Scale - Reseacher - Scaling
(Visit 2) - Visual Analogue Scale -
Reseacher - Scaling (Visit 1)
Visual Analogue
Scale - Reseacher -
Scaling (Visit 3) -
Visual Analogue
Scale - Reseacher -
Scaling (Visit 2)
Visual Analogue
Scale - Reseacher -
Scaling (Visit 3) -
Visual Analogue
Scale - Reseacher -
Scaling (Visit 1)
Active Shampoo Z -2.753b -3.443b -3.526b
Asymp. Sig. (2-tailed) ,006 ,001 ,000
Placebo Shampoo Z -3.913b -1.194b -3.619b
Asymp. Sig. (2-tailed) ,000 ,232 ,000
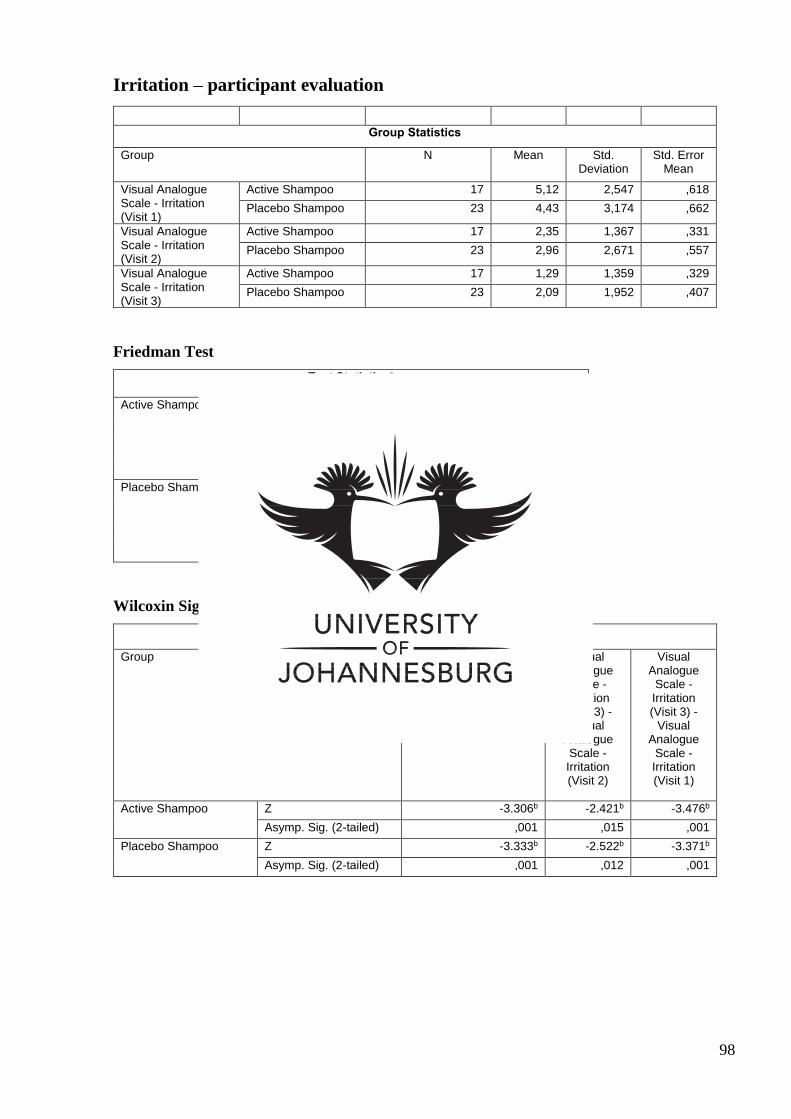
98
Irritation – participant evaluation
Group Statistics
Group N Mean Std. Deviation
Std. Error Mean
Visual Analogue Scale - Irritation (Visit 1)
Active Shampoo 17 5,12 2,547 ,618
Placebo Shampoo 23 4,43 3,174 ,662
Visual Analogue Scale - Irritation (Visit 2)
Active Shampoo 17 2,35 1,367 ,331
Placebo Shampoo 23 2,96 2,671 ,557
Visual Analogue Scale - Irritation (Visit 3)
Active Shampoo 17 1,29 1,359 ,329
Placebo Shampoo 23 2,09 1,952 ,407
Friedman Test
Test Statisticsa
Active Shampoo N 17
Chi-Square 21,733
df 2
Asymp. Sig. ,000
Placebo Shampoo N 23
Chi-Square 22,143
df 2
Asymp. Sig. ,000
Wilcoxin Signed Ranks Test
Test Statisticsa
Group Visual Analogue Scale - Irritation (Visit 2) -
Visual Analogue Scale - Irritation (Visit 1)
Visual Analogue
Scale - Irritation (Visit 3) -
Visual Analogue
Scale - Irritation (Visit 2)
Visual Analogue
Scale - Irritation (Visit 3) -
Visual Analogue
Scale - Irritation (Visit 1)
Active Shampoo Z -3.306b -2.421b -3.476b
Asymp. Sig. (2-tailed) ,001 ,015 ,001
Placebo Shampoo Z -3.333b -2.522b -3.371b
Asymp. Sig. (2-tailed) ,001 ,012 ,001
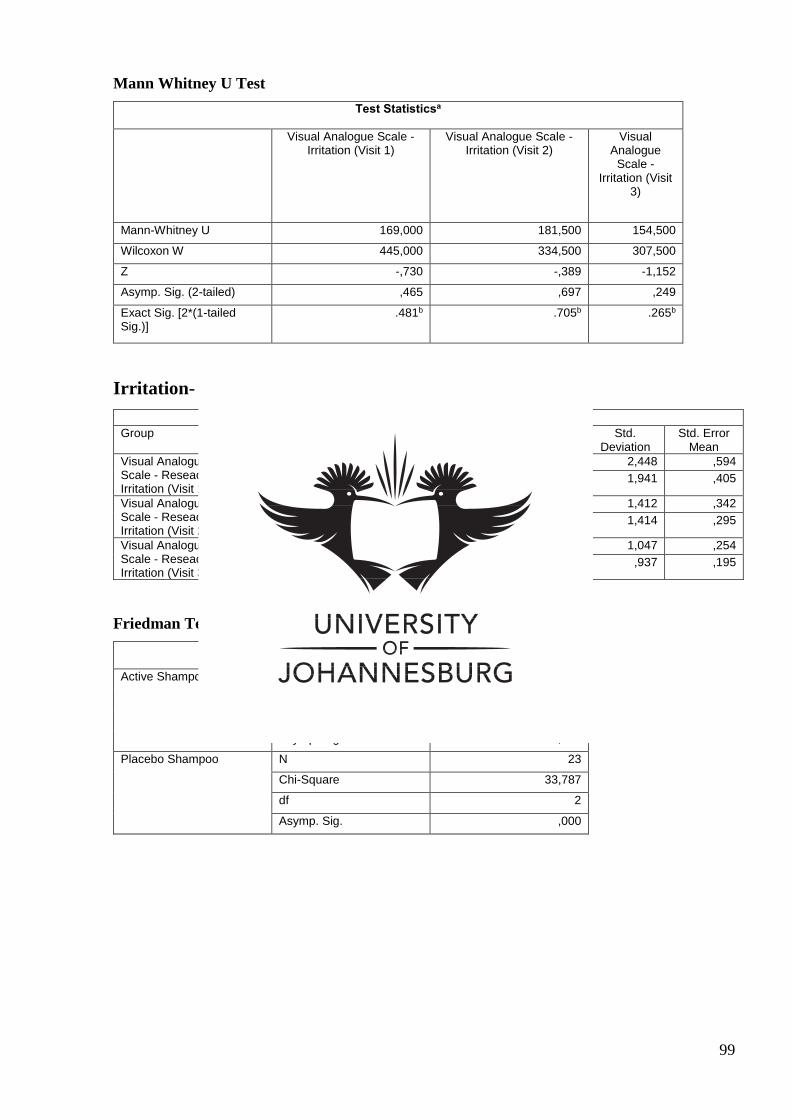
99
Mann Whitney U Test
Test Statisticsa
Visual Analogue Scale - Irritation (Visit 1)
Visual Analogue Scale - Irritation (Visit 2)
Visual Analogue
Scale - Irritation (Visit
3)
Mann-Whitney U 169,000 181,500 154,500
Wilcoxon W 445,000 334,500 307,500
Z -,730 -,389 -1,152
Asymp. Sig. (2-tailed) ,465 ,697 ,249
Exact Sig. [2*(1-tailed Sig.)]
.481b .705b .265b
Irritation- Researcher Evaluation
Group Statistics
Group N Mean Std. Deviation
Std. Error Mean
Visual Analogue Scale - Reseacher - Irritation (Visit 1)
Active Shampoo 17 3,35 2,448 ,594
Placebo Shampoo 23 3,70 1,941 ,405
Visual Analogue Scale - Reseacher - Irritation (Visit 2)
Active Shampoo 17 1,65 1,412 ,342
Placebo Shampoo 23 2,00 1,414 ,295
Visual Analogue Scale - Reseacher - Irritation (Visit 3)
Active Shampoo 17 ,71 1,047 ,254
Placebo Shampoo 23 ,83 ,937 ,195
Friedman Test
Test Statisticsa
Active Shampoo N 17
Chi-Square 23,288
df 2
Asymp. Sig. ,000
Placebo Shampoo N 23
Chi-Square 33,787
df 2
Asymp. Sig. ,000
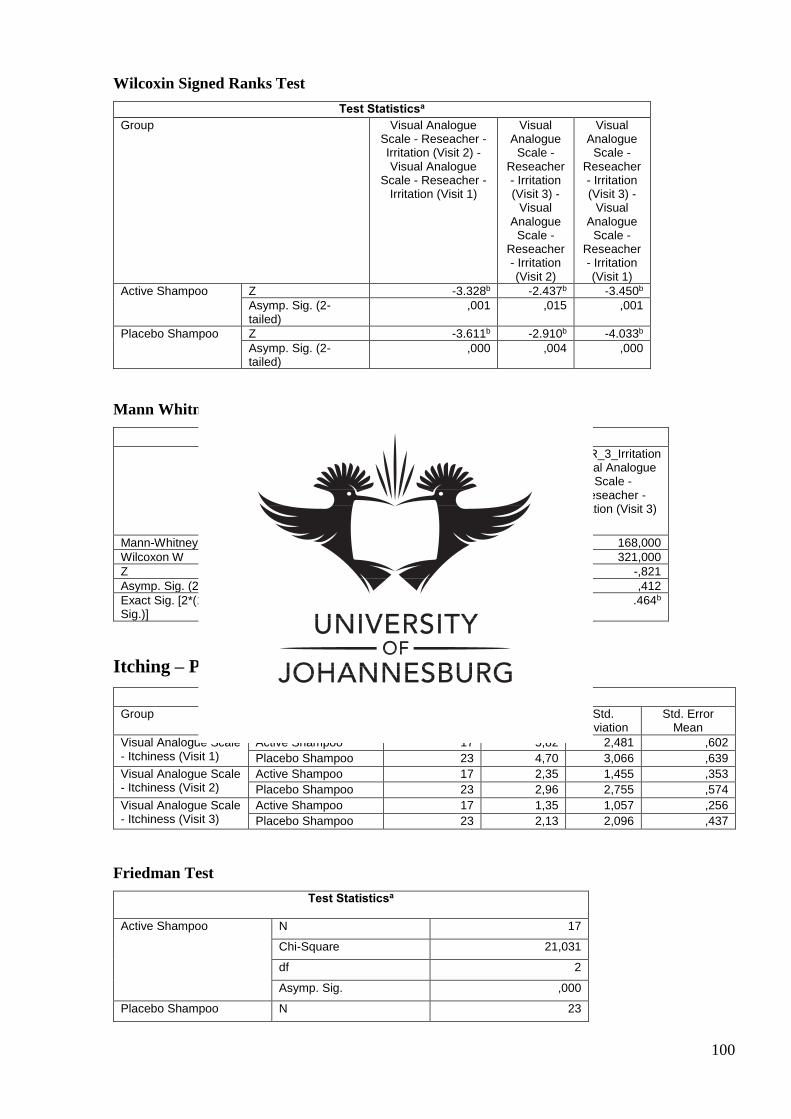
100
Wilcoxin Signed Ranks Test
Test Statisticsa
Group Visual Analogue Scale - Reseacher - Irritation (Visit 2) - Visual Analogue
Scale - Reseacher - Irritation (Visit 1)
Visual Analogue
Scale - Reseacher - Irritation (Visit 3) -
Visual Analogue
Scale - Reseacher - Irritation (Visit 2)
Visual Analogue
Scale - Reseacher - Irritation (Visit 3) -
Visual Analogue
Scale - Reseacher - Irritation (Visit 1)
Active Shampoo Z -3.328b -2.437b -3.450b
Asymp. Sig. (2-tailed)
,001 ,015 ,001
Placebo Shampoo Z -3.611b -2.910b -4.033b
Asymp. Sig. (2-tailed)
,000 ,004 ,000
Mann Whitney U Test
Test Statisticsa
VASR_1_Irritation Visual Analogue Scale -
Reseacher - Irritation (Visit 1)
VASR_2_Irritation Visual Analogue Scale -
Reseacher - Irritation (Visit 2)
VASR_3_Irritation Visual Analogue
Scale - Reseacher -
Irritation (Visit 3)
Mann-Whitney U 166,000 170,500 168,000
Wilcoxon W 319,000 323,500 321,000
Z -,816 -,702 -,821
Asymp. Sig. (2-tailed) ,414 ,483 ,412
Exact Sig. [2*(1-tailed Sig.)]
.432b .498b .464b
Itching – Participant Evaluation
Group Statistics
Group N Mean Std. Deviation
Std. Error Mean
Visual Analogue Scale - Itchiness (Visit 1)
Active Shampoo 17 5,82 2,481 ,602
Placebo Shampoo 23 4,70 3,066 ,639
Visual Analogue Scale - Itchiness (Visit 2)
Active Shampoo 17 2,35 1,455 ,353
Placebo Shampoo 23 2,96 2,755 ,574
Visual Analogue Scale - Itchiness (Visit 3)
Active Shampoo 17 1,35 1,057 ,256
Placebo Shampoo 23 2,13 2,096 ,437
Friedman Test
Test Statisticsa
Active Shampoo N 17
Chi-Square 21,031
df 2
Asymp. Sig. ,000
Placebo Shampoo N 23
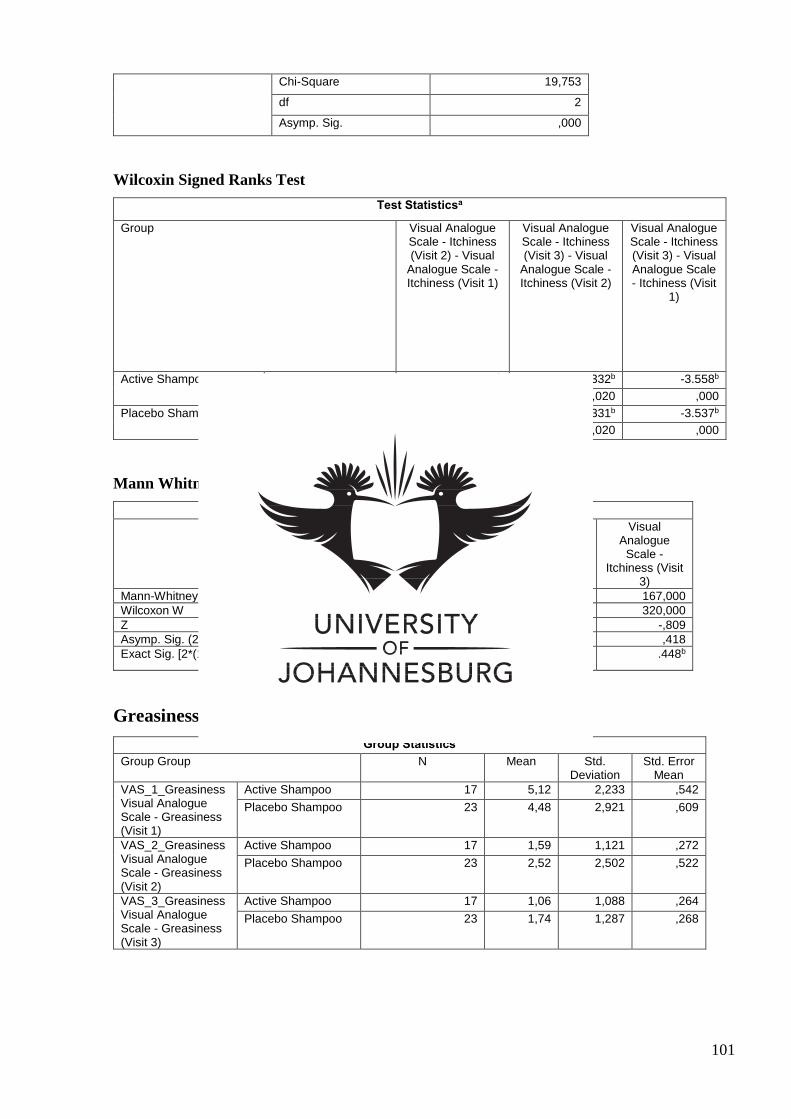
101
Chi-Square 19,753
df 2
Asymp. Sig. ,000
Wilcoxin Signed Ranks Test
Test Statisticsa
Group Visual Analogue Scale - Itchiness (Visit 2) - Visual
Analogue Scale - Itchiness (Visit 1)
Visual Analogue Scale - Itchiness (Visit 3) - Visual
Analogue Scale - Itchiness (Visit 2)
Visual Analogue Scale - Itchiness (Visit 3) - Visual Analogue Scale - Itchiness (Visit
1)
Active Shampoo Z -3.476b -2.332b -3.558b
Asymp. Sig. (2-tailed) ,001 ,020 ,000
Placebo Shampoo Z -3.228b -2.331b -3.537b
Asymp. Sig. (2-tailed) ,001 ,020 ,000
Mann Whitney U Test
Test Statisticsa
Visual Analogue Scale - Itchiness (Visit 1)
Visual Analogue Scale - Itchiness (Visit 2)
Visual Analogue
Scale - Itchiness (Visit
3)
Mann-Whitney U 154,500 184,000 167,000
Wilcoxon W 430,500 337,000 320,000
Z -1,129 -,320 -,809
Asymp. Sig. (2-tailed) ,259 ,749 ,418
Exact Sig. [2*(1-tailed Sig.)] .265b .766b .448b
Greasiness – Participant Evaluation
Group Statistics
Group Group N Mean Std. Deviation
Std. Error Mean
VAS_1_Greasiness Visual Analogue Scale - Greasiness (Visit 1)
Active Shampoo 17 5,12 2,233 ,542
Placebo Shampoo 23 4,48 2,921 ,609
VAS_2_Greasiness Visual Analogue Scale - Greasiness (Visit 2)
Active Shampoo 17 1,59 1,121 ,272
Placebo Shampoo 23 2,52 2,502 ,522
VAS_3_Greasiness Visual Analogue Scale - Greasiness (Visit 3)
Active Shampoo 17 1,06 1,088 ,264
Placebo Shampoo 23 1,74 1,287 ,268
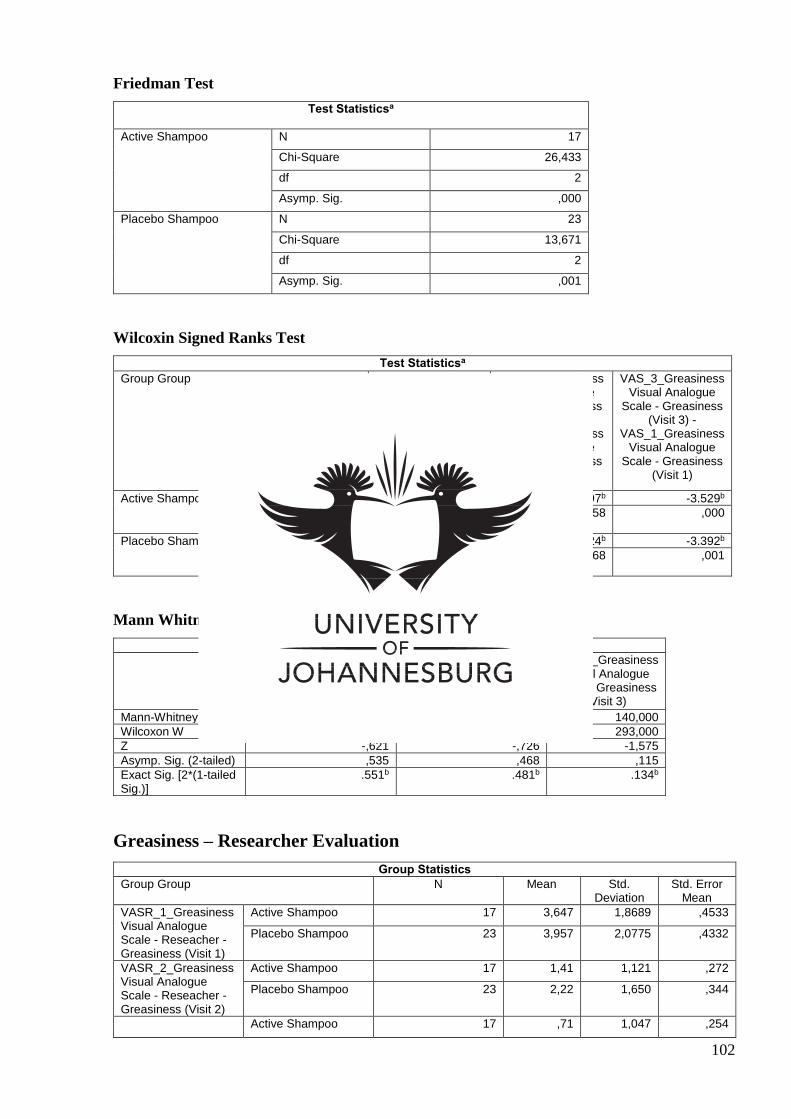
102
Friedman Test
Test Statisticsa
Active Shampoo N 17
Chi-Square 26,433
df 2
Asymp. Sig. ,000
Placebo Shampoo N 23
Chi-Square 13,671
df 2
Asymp. Sig. ,001
Wilcoxin Signed Ranks Test
Test Statisticsa
Group Group VAS_2_Greasiness Visual Analogue
Scale - Greasiness (Visit 2) -
VAS_1_Greasiness Visual Analogue
Scale - Greasiness (Visit 1)
VAS_3_Greasiness Visual Analogue
Scale - Greasiness (Visit 3) -
VAS_2_Greasiness Visual Analogue
Scale - Greasiness (Visit 2)
VAS_3_Greasiness Visual Analogue
Scale - Greasiness (Visit 3) -
VAS_1_Greasiness Visual Analogue
Scale - Greasiness (Visit 1)
Active Shampoo Z -3.416b -1.897b -3.529b
Asymp. Sig. (2-tailed)
,001 ,058 ,000
Placebo Shampoo Z -2.955b -1.824b -3.392b
Asymp. Sig. (2-tailed)
,003 ,068 ,001
Mann Whitney U Test
Test Statisticsa
VAS_1_Greasiness Visual Analogue Scale -
Greasiness (Visit 1)
VAS_2_Greasiness Visual Analogue Scale -
Greasiness (Visit 2)
VAS_3_Greasiness Visual Analogue
Scale - Greasiness (Visit 3)
Mann-Whitney U 173,000 169,500 140,000
Wilcoxon W 449,000 322,500 293,000
Z -,621 -,726 -1,575
Asymp. Sig. (2-tailed) ,535 ,468 ,115
Exact Sig. [2*(1-tailed Sig.)]
.551b .481b .134b
Greasiness – Researcher Evaluation
Group Statistics
Group Group N Mean Std. Deviation
Std. Error Mean
VASR_1_Greasiness Visual Analogue Scale - Reseacher - Greasiness (Visit 1)
Active Shampoo 17 3,647 1,8689 ,4533
Placebo Shampoo 23 3,957 2,0775 ,4332
VASR_2_Greasiness Visual Analogue Scale - Reseacher - Greasiness (Visit 2)
Active Shampoo 17 1,41 1,121 ,272
Placebo Shampoo 23 2,22 1,650 ,344
Active Shampoo 17 ,71 1,047 ,254
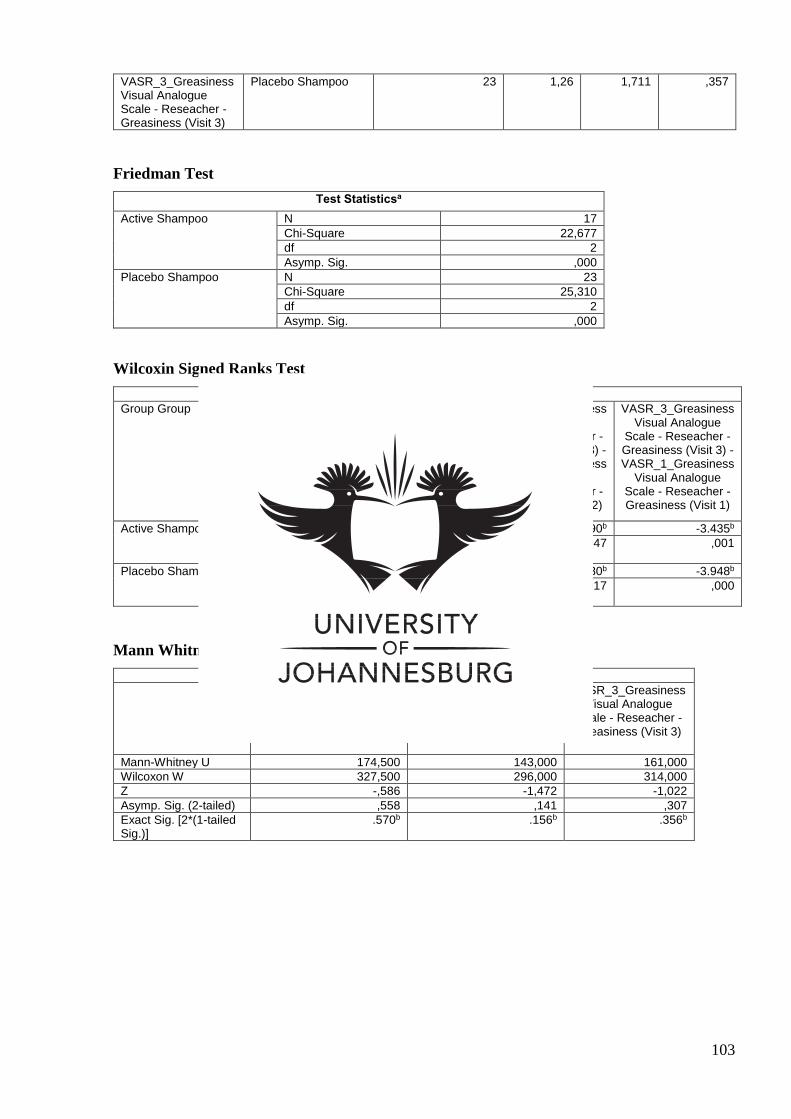
103
VASR_3_Greasiness Visual Analogue Scale - Reseacher - Greasiness (Visit 3)
Placebo Shampoo 23 1,26 1,711 ,357
Friedman Test
Test Statisticsa
Active Shampoo N 17
Chi-Square 22,677
df 2
Asymp. Sig. ,000
Placebo Shampoo N 23
Chi-Square 25,310
df 2
Asymp. Sig. ,000
Wilcoxin Signed Ranks Test
Test Statisticsa
Group Group VASR_2_Greasiness Visual Analogue Scale -
Reseacher - Greasiness (Visit 2) - VASR_1_Greasiness
Visual Analogue Scale - Reseacher -
Greasiness (Visit 1)
VASR_3_Greasiness Visual Analogue
Scale - Reseacher - Greasiness (Visit 3) - VASR_2_Greasiness
Visual Analogue Scale - Reseacher - Greasiness (Visit 2)
VASR_3_Greasiness Visual Analogue
Scale - Reseacher - Greasiness (Visit 3) - VASR_1_Greasiness
Visual Analogue Scale - Reseacher - Greasiness (Visit 1)
Active Shampoo Z -3.177b -1.990b -3.435b
Asymp. Sig. (2-tailed)
,001 ,047 ,001
Placebo Shampoo Z -2.974b -2.380b -3.948b
Asymp. Sig. (2-tailed)
,003 ,017 ,000
Mann Whitney U Test
Test Statisticsa
VASR_1_Greasiness Visual Analogue Scale - Reseacher - Greasiness
(Visit 1)
VASR_2_Greasiness Visual Analogue Scale - Reseacher - Greasiness
(Visit 2)
VASR_3_Greasiness Visual Analogue
Scale - Reseacher - Greasiness (Visit 3)
Mann-Whitney U 174,500 143,000 161,000
Wilcoxon W 327,500 296,000 314,000
Z -,586 -1,472 -1,022
Asymp. Sig. (2-tailed) ,558 ,141 ,307
Exact Sig. [2*(1-tailed Sig.)]
.570b .156b .356b
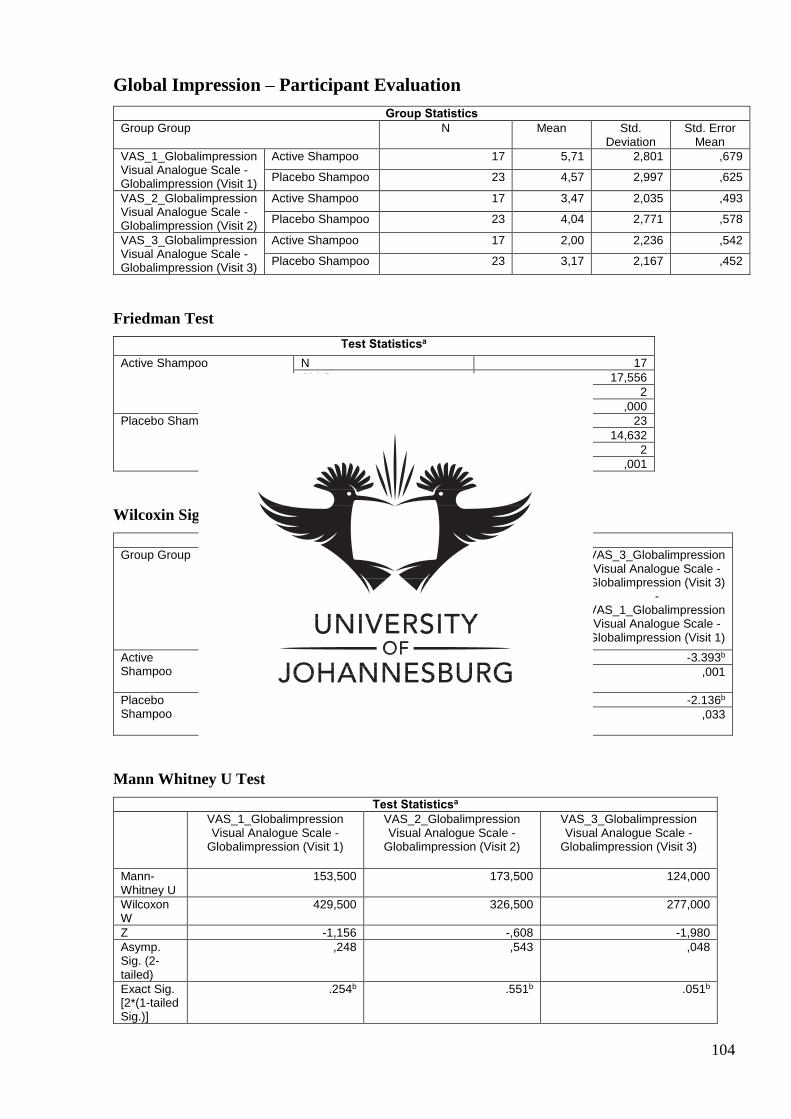
104
Global Impression – Participant Evaluation
Group Statistics
Group Group N Mean Std. Deviation
Std. Error Mean
VAS_1_Globalimpression Visual Analogue Scale - Globalimpression (Visit 1)
Active Shampoo 17 5,71 2,801 ,679
Placebo Shampoo 23 4,57 2,997 ,625
VAS_2_Globalimpression Visual Analogue Scale - Globalimpression (Visit 2)
Active Shampoo 17 3,47 2,035 ,493
Placebo Shampoo 23 4,04 2,771 ,578
VAS_3_Globalimpression Visual Analogue Scale - Globalimpression (Visit 3)
Active Shampoo 17 2,00 2,236 ,542
Placebo Shampoo 23 3,17 2,167 ,452
Friedman Test
Test Statisticsa
Active Shampoo N 17
Chi-Square 17,556
df 2
Asymp. Sig. ,000
Placebo Shampoo N 23
Chi-Square 14,632
df 2
Asymp. Sig. ,001
Wilcoxin Signed Ranks Test
Test Statisticsa
Group Group VAS_2_Globalimpression Visual Analogue Scale -
Globalimpression (Visit 2) -
VAS_1_Globalimpression Visual Analogue Scale -
Globalimpression (Visit 1)
VAS_3_Globalimpression Visual Analogue Scale -
Globalimpression (Visit 3) -
VAS_2_Globalimpression Visual Analogue Scale -
Globalimpression (Visit 2)
VAS_3_Globalimpression Visual Analogue Scale -
Globalimpression (Visit 3) -
VAS_1_Globalimpression Visual Analogue Scale -
Globalimpression (Visit 1)
Active Shampoo
Z -2.778b -3.001b -3.393b
Asymp. Sig. (2-tailed)
,005 ,003 ,001
Placebo Shampoo
Z -1.075b -2.278b -2.136b
Asymp. Sig. (2-tailed)
,282 ,023 ,033
Mann Whitney U Test
Test Statisticsa
VAS_1_Globalimpression Visual Analogue Scale -
Globalimpression (Visit 1)
VAS_2_Globalimpression Visual Analogue Scale -
Globalimpression (Visit 2)
VAS_3_Globalimpression Visual Analogue Scale -
Globalimpression (Visit 3)
Mann-Whitney U
153,500 173,500 124,000
Wilcoxon W
429,500 326,500 277,000
Z -1,156 -,608 -1,980
Asymp. Sig. (2-tailed)
,248 ,543 ,048
Exact Sig. [2*(1-tailed Sig.)]
.254b .551b .051b
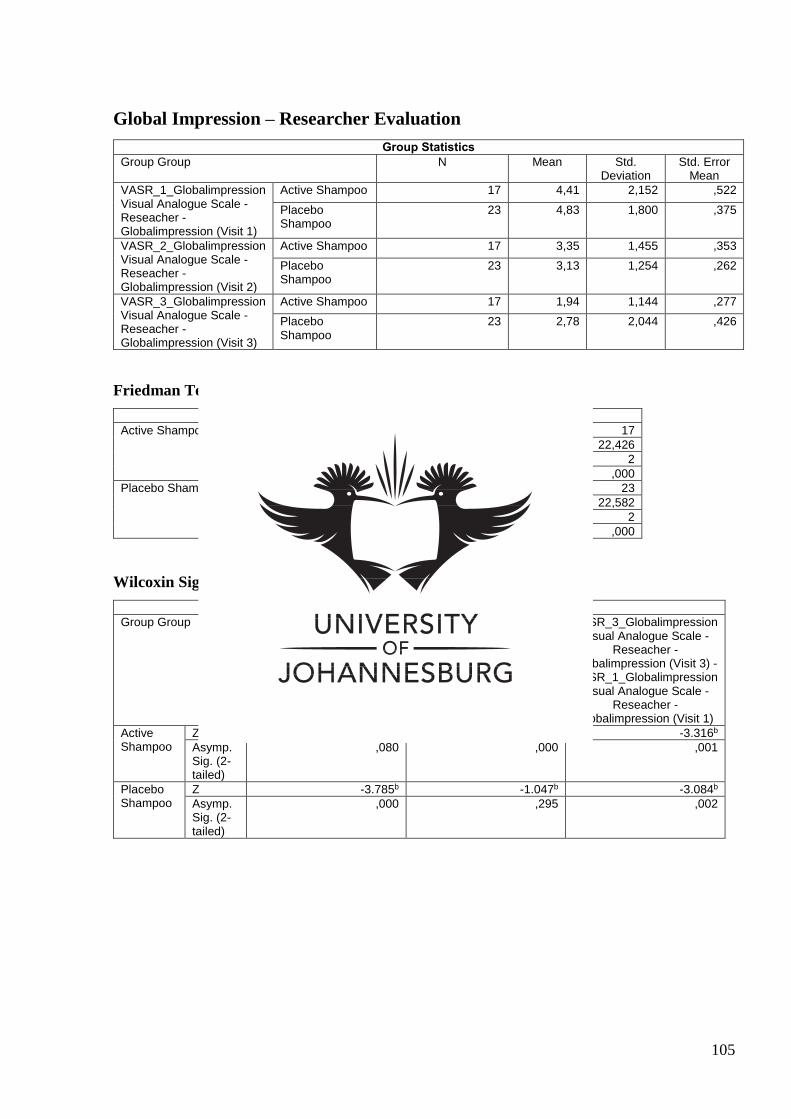
105
Global Impression – Researcher Evaluation
Group Statistics
Group Group N Mean Std. Deviation
Std. Error Mean
VASR_1_Globalimpression Visual Analogue Scale - Reseacher - Globalimpression (Visit 1)
Active Shampoo 17 4,41 2,152 ,522
Placebo Shampoo
23 4,83 1,800 ,375
VASR_2_Globalimpression Visual Analogue Scale - Reseacher - Globalimpression (Visit 2)
Active Shampoo 17 3,35 1,455 ,353
Placebo Shampoo
23 3,13 1,254 ,262
VASR_3_Globalimpression Visual Analogue Scale - Reseacher - Globalimpression (Visit 3)
Active Shampoo 17 1,94 1,144 ,277
Placebo Shampoo
23 2,78 2,044 ,426
Friedman Test
Test Statisticsa
Active Shampoo N 17
Chi-Square 22,426
df 2
Asymp. Sig. ,000
Placebo Shampoo N 23
Chi-Square 22,582
df 2
Asymp. Sig. ,000
Wilcoxin Signed Ranks Test
Test Statisticsa
Group Group VASR_2_Globalimpression Visual Analogue Scale -
Reseacher - Globalimpression (Visit 2) - VASR_1_Globalimpression
Visual Analogue Scale - Reseacher -
Globalimpression (Visit 1)
VASR_3_Globalimpression Visual Analogue Scale -
Reseacher - Globalimpression (Visit 3) - VASR_2_Globalimpression
Visual Analogue Scale - Reseacher -
Globalimpression (Visit 2)
VASR_3_Globalimpression Visual Analogue Scale -
Reseacher - Globalimpression (Visit 3) - VASR_1_Globalimpression
Visual Analogue Scale - Reseacher -
Globalimpression (Visit 1)
Active Shampoo
Z -1.753b -3.611b -3.316b
Asymp. Sig. (2-tailed)
,080 ,000 ,001
Placebo Shampoo
Z -3.785b -1.047b -3.084b
Asymp. Sig. (2-tailed)
,000 ,295 ,002
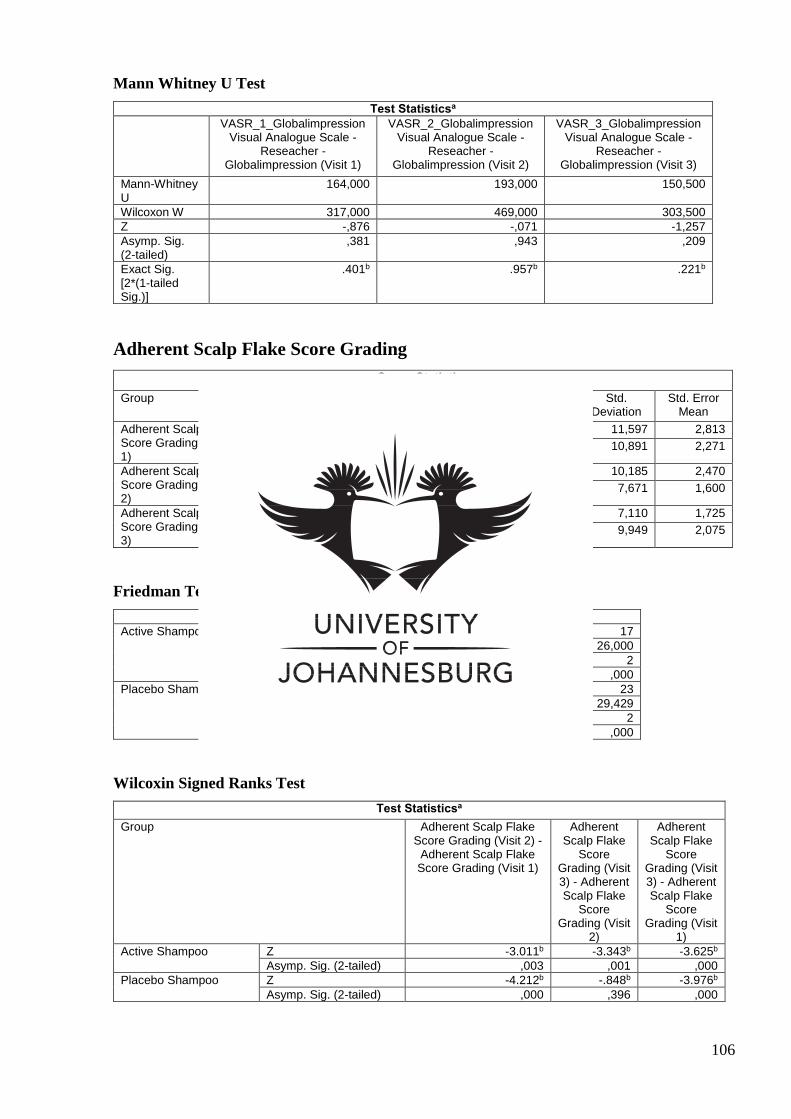
106
Mann Whitney U Test
Test Statisticsa
VASR_1_Globalimpression Visual Analogue Scale -
Reseacher - Globalimpression (Visit 1)
VASR_2_Globalimpression Visual Analogue Scale -
Reseacher - Globalimpression (Visit 2)
VASR_3_Globalimpression Visual Analogue Scale -
Reseacher - Globalimpression (Visit 3)
Mann-Whitney U
164,000 193,000 150,500
Wilcoxon W 317,000 469,000 303,500
Z -,876 -,071 -1,257
Asymp. Sig. (2-tailed)
,381 ,943 ,209
Exact Sig. [2*(1-tailed Sig.)]
.401b .957b .221b
Adherent Scalp Flake Score Grading
Group Statistics
Group N Mean Std. Deviation
Std. Error Mean
Adherent Scalp Flake Score Grading (Visit 1)
Active Shampoo 17 34,00 11,597 2,813
Placebo Shampoo 23 35,48 10,891 2,271
Adherent Scalp Flake Score Grading (Visit 2)
Active Shampoo 17 18,88 10,185 2,470
Placebo Shampoo 23 18,87 7,671 1,600
Adherent Scalp Flake Score Grading (Visit 3)
Active Shampoo 17 10,94 7,110 1,725
Placebo Shampoo 23 17,48 9,949 2,075
Friedman Test
Test Statisticsa
Active Shampoo N 17
Chi-Square 26,000
df 2
Asymp. Sig. ,000
Placebo Shampoo N 23
Chi-Square 29,429
df 2
Asymp. Sig. ,000
Wilcoxin Signed Ranks Test
Test Statisticsa
Group Adherent Scalp Flake Score Grading (Visit 2) -
Adherent Scalp Flake Score Grading (Visit 1)
Adherent Scalp Flake
Score Grading (Visit 3) - Adherent Scalp Flake
Score Grading (Visit
2)
Adherent Scalp Flake
Score Grading (Visit 3) - Adherent Scalp Flake
Score Grading (Visit
1)
Active Shampoo Z -3.011b -3.343b -3.625b
Asymp. Sig. (2-tailed) ,003 ,001 ,000
Placebo Shampoo Z -4.212b -.848b -3.976b
Asymp. Sig. (2-tailed) ,000 ,396 ,000

107
Mann Whitney U Test
Test Statisticsa
Adherent Scalp Flake Score Grading (Visit 1)
Adherent Scalp Flake Score Grading (Visit 2)
Adherent Scalp Flake Score
Grading (Visit 3)
Mann-Whitney U 170,000 193,000 119,000
Wilcoxon W 323,000 346,000 272,000
Z -,700 -,069 -2,103
Asymp. Sig. (2-tailed) ,484 ,945 ,035
Exact Sig. [2*(1-tailed Sig.)] .498b .957b .037b


