Embed Size (px)
Citation preview

Brain (1998),121,2159–2173
Dynamic cortical involvement in implicit andexplicit motor sequence learningA PET study
Manabu Honda,* Marie-Pierre Deiber, Vicente Iba´nez, Alvaro Pascual-Leone,† Ping Zhuang andMark Hallett
Human Motor Control Section, Medical Neurology Branch, Correspondence to: Mark Hallett, Building 10,National Institute of Neurological Disorders and Stroke, Room 5N226, NINDS, NIH, 10 Center Drive, MSC-1428,National Institutes of Health, Bethesda, USA Bethesda, MD 20892-1428, USA.
E-mail: [email protected]
*Present address: Department of Brain Pathophysiology,Kyoto University School of Medicine, Kyoto, Japan†Present address: Department of Neurology, Beth IsraelHospital, Harvard Medical School, Boston, Mass., USA
SummaryWe examined the dynamic involvement of different brainregions in implicit and explicit motor sequence learningusing PET. In a serial reaction time task, subjects pressedeach of four buttons with a different finger of the righthand in response to a visually presented number. Testsessions consisted of 10 cycles of the same 10-itemsequence. The effects of explicit and implicit learningwere assessed separately using a different behaviouralparameter for each type of learning: correct recall of thetest sequence for explicit learning and improvement ofreaction time before the successful recall of any componentof the test sequence for implicit learning. Regionalcerebral blood flow was measured repeatedly during thetask, and a parametric analysis was performed to identifybrain regions in which activity was significantly correlatedwith subjects’ performances: i.e. with correct recall ofthe test sequence or with reaction time. Explicit learning,shown as a positive correlation with the correct recall ofthe sequence, was associated with increased activity in
Keywords: PET; serial reaction time task; implicit learning; explicit learning; motor sequence
Abbreviations: PRE5 training block; rCBF5 regional CBF; RND5 random condition block; SEQ5 sequence conditionblock; SMA 5 supplementary motor area; SM15 primary sensorimotor cortex; SRTT5 serial reaction time task; VIS5visual control condition block
IntroductionThe acquisition of knowledge can be described as implicitlearning and explicit learning (Graf and Schacter, 1985;Schacter, 1992; Schacteret al., 1993). Implicit learning ischaracterized as an unintentional, non-conscious form of
© Oxford University Press 1998
the posterior parietal cortex, precuneus and premotorcortex bilaterally, also in the supplementary motor area(SMA) predominantly in the left anterior part, leftthalamus, and right dorsolateral prefrontal cortex. Incontrast, the reaction time showed a different pattern ofcorrelation during different learning phases. During theimplicit learning phase, when the subjects were not awareof the sequence, improvement of the reaction time wasassociated with increased activity in the contralateralprimary sensorimotor cortex (SM1). During the explicitlearning phase, the reaction time was significantlycorrelated with activity in a part of the frontoparietalnetwork. During the post-learning phase, when thesubjects achieved all components of the sequenceexplicitly, the reaction time was correlated with the activityin the ipsilateral SM1 and posterior part of the SMA.These results show that different sets of cortical regionsare dynamically involved in implicit and explicit motorsequence learning.
learning recognized by behavioural improvement. Explicitlearning involves conscious recollection of previousexperiences. Studies have shown that amnesic patients canacquire new motor (Milneret al., 1968) and cognitive (Cohen

2160 M. Hondaet al.
and Squire, 1980; Saint-Cyret al., 1988) skills, despitetheir inability to recollect the experience explicitly. Similardichotomous distinctions of memory have also been proposed(Squire, 1987; Curran and Keele, 1993). Acquisition of acomplex motor sequence can also involve implicit and explicitlearning. The serial reaction time task (SRTT), introducedby Nissen and Bullemer (1987), in which subjects are requiredto press a key corresponding to each visual cue presentedaccording to a sequence, has been widely used to studyimplicit and explicit aspects of motor sequence learning.Primarily, implicit learning can be assessed by improvementof reaction time, and explicit learning can be assessed byawareness or conscious generation of the sequence(Willingham et al., 1989), although reaction time can alsobe affected by explicit learning to some extent (Perruchetand Amorim, 1992; Curran and Keele, 1993). Studies onamnesic patients (Knopman and Nissen, 1987; Nissen andBullemer, 1987) and normal subjects (Willinghamet al.,1989) have shown that the development of knowledge ofone type seemed not to depend on knowledge of the othertype, and they suggest that the two types of learning mayhave different neuronal correlates in the brain.
Using transcranial magnetic stimulation and a variation ofthe SRTT, Pascual-Leoneet al. (1994) observed modulationof activity in the primary sensorimotor cortex (SM1) withmotor sequence learning. Zhuanget al. (1997), using EEGtechniques, made a similar observation. However, the limitedscope of these techniques makes it difficult to assess all thecortical and subcortical regions differentially involved inimplicit and explicit motor learning. There is littlecorrespondence between previous neuroimaging studies usingmodified versions of the SRTT (Graftonet al., 1995; Rauchet al., 1995; Doyonet al., 1996; Hazeltineet al., 1997).Grafton et al. (1995) and Hazeltineet al. (1997) reportedthat the contralateral SM1, supplementary motor area (SMA)and putamen were involved in implicit learning, whereas thefrontoparietal network was involved in explicit learning. Incontrast, Rauchet al. (1995) showed that the implicitcondition involved the right ventral premotor cortex, rightventral caudate, right thalamus and bilateral visual associationcortex, and that the explicit condition involved the primaryvisual cortex, perisylvian cortex and cerebellar vermis.Moreover, Doyonet al. (1996) argued that the striatum andcerebellum are involved in implicit learning, and that themid-ventrolateral frontal cortex is involved in explicitlearning. None of these studies explored the correlationbetween dynamic changes in activity and actual performanceimprovement during learning.
The objective of the present study was to identify the brainregions specifically correlated with implicit and explicitphases of motor sequence learning, with PET. Because thelearning process can be considered a dynamic phenomenonoccurring over time, it is of crucial importance to accountfor the inter-individual variability in the learning curves. Toaddress this issue, we used a parametric approach to identifybrain regions where activity was significantly correlated with
different behavioural parameters associated with individualbehavioural blocks, where reaction time and consciousgeneration of the sequence reflect implicit and explicit aspectsof motor sequence learning. We also categorized the timecourse of individual learning into different phases accordingto the subject’s performance, and employed separateparametric analyses. This method enabled us to clarifythe dynamic involvement of different neuronal circuits indifferent phases of a single learning process.
MethodsWe studied 21 healthy normal volunteers (15 men and 6women), aged 20–52 years (mean, 30.4 years). The subjectswere all right-handed according to the Oldfield handednessquestionnaire (Oldfield, 1971). The protocol was approvedby the Institutional Review Board, and subjects gave theirwritten informed consent for the study.
Behavioural taskA variation of the SRTT (Pascual-Leoneet al., 1994) wasemployed. Subjects lay supine on a PET scanner bed withtheir right hand on a response keypad with four buttons. Anumber (1, 2, 3 or 4) was presented in the centre of acomputer screen situated ~1 m in front of the subject’s eyes.Each number subtended a visual angle of 2.4°. Subjects wereinstructed to press each button with a different finger of theright hand in response to each number (index finger forbutton 1, middle finger for 2, ring finger for 3 and littlefinger for 4) as quickly and accurately as possible. Becausethe subjects kept their fingers on the buttons, which weresensitive to changes in pressure, the motor responses wereprimarily isometric. Feedback information on the responsewas given as follows. When the correct response button waspressed, the number (stimulus) disappeared from the screenimmediately. When an incorrect button was pressed, thenumber remained visible until the next number appeared onthe screen, and subjects were not required to press any otherbuttons. A total of 13 behavioural blocks was administered.Each behavioural block consisted of the presentation of 100numbers at a regular pace of 0.5 Hz, taking 3 min 40 s, sothat the number of movements per block was controlled.Three different stimulus conditions were imposed: a randomcondition, a sequence condition and a visual control condition(see Table 1). The random condition consisted of 100 numberspresented in a random order. The sequence condition consistedof 10 repetitions of a 10-number test sequence (4–3–2–1–3–4–2–3–1–2), with each block starting at a different point inthe test sequence. This test sequence can be considered an‘ambiguous sequence’ (Cohenet al., 1990) because nocomponent can be uniquely predicted by its predecessor. Thesame sequence was used for all subjects. The visual controlcondition consisted of 100 numbers presented in a randomorder, but no response was required. The duration of eachnumber’s presentation for this condition was controlled using

Implicit and explicit motor learning 2161
Table 1 Behavioural blocks and PET scans
PET scan Block name Stimulus condition
Transmission scan PRE1 RandomTransmission scan PRE2 RandomTransmission scan PRE3 RandomScan 1 RND1 RandomScan 2 SEQ1 SequenceScan 3 SEQ2 SequenceScan 4 SEQ3 SequenceScan 5 SEQ4 SequenceScan 6 SEQ5 SequenceScan 7 SEQ6 SequenceScan 8 SEQ7 Sequence
When subjects correctly reported all components of the sequenceScan 9 RND2 RandomScan 10 VIS Visual control
When subjects could not report all components of the sequenceScan 9 SEQ8 SequenceScan 10 SEQ9 Sequence
PRE5 training block; SEQ5 sequence block; RND5 randomblock; VIS 5 visual control block.
the stored reaction times from the preceding block of therandom condition to minimize the difference in visual stimuli.No attempt was made to control attention during the visualcontrol condition, because this condition was used only toconfirm the regions of the brain related to motor executionin the population studied (see Data analysis section). Duringthe transmission scan of PET, three blocks of the randomcondition, with 100 randomly presented numbers in eachblock, were used as training (PRE1, PRE2 and PRE3) tofamiliarize the subjects with the task. After the training, 10behavioural blocks were performed with PET scanning. Afterone block of the random condition (RND1) was performed,seven blocks of the sequence condition (SEQ1–SEQ7) wereperformed.
After completing each block, subjects performed ageneration task in which they were systematically questionedabout the sequence. Question 1: this was ‘Did you noticeanything about the task?’. Question 2: if the answer was yes,they were asked ‘What did you notice?’. Question 3: if theanswer was ‘a sequence,’ they were asked to ‘report thesequence, as far as you noticed, verbally’. This questionnaireis a slightly modified version of the one used by Willinghamet al. (1989). Subjects were not forced to report if they werenot aware of the sequence. Accuracy was measured, on theverbal report, as the longest continuous series of numbersthat matched the actual sequence (Willinghamet al., 1989)(report accuracy). If the subjects reported the existence of arepeating sequence in response to question 2, it was judgedthat the subject had become aware of the sequence. Iffewer than three successive components matched the actualsequence, the response was not to be recognized as accurate,although none of the subjects had such a response. If, aftera training block, the subjects incorrectly answered that they
noticed a repeating sequence they were told that the sequencewas random. Otherwise, subjects were not told whether theiranswers were correct or incorrect. When subjects correctlyreported all components of the test sequence after SEQ7, oneblock of the random condition (RND2) and one block of thevisual control condition (VIS) were performed. If subjectscould not report the whole test sequence after SEQ7, thentwo more blocks of the sequence condition (SEQ8 and SEQ9)were performed instead. The mean reaction time of thecorrect responses and the number of erroneous responses ineach block were calculated. The accuracy of the verballyreported sequence was also recorded (as a percentage); whenquestion 3 was not asked, this score was given the value 0%.
According to the performance of each subject, the blockswere categorized into three phases: (i) the implicit learningphase, defined as blocks performed before the subject becameaware of the existence of the test sequence, namely, beforethe subject reported the existence of a sequence in reply toquestion 2 of the questionnaire; (ii) the explicit learningphase, defined as blocks performed from the beginning ofthe explicit knowledge state until the first block when subjectscould correctly generate the whole test sequence; and (iii)post-learning phase, defined as blocks performed whensubjects correctly reported the whole test sequence in thegeneration task. Because of the variable learning ability ofeach subject, these phases were not necessarily identifiablein all subjects.
After completing the generation task of SEQ3, 12 out ofthe 21 subjects were instructed to find a repeating sequence,regardless of whether or not they were already aware of therepeating sequence. To obtain a longer implicit learningphase, no such instruction was given to the other 9 subjects.It is reasonable to combine the data from these two subgroupsfor the implicit learning and post-learning phases, becausethe behavioural states were essentially identical. In contrast,it is possible, and likely, that the instruction affected theexplicit learning phase. However, since we focused on thecontrast between explicit learning and implicit learning, ratherthan on the effect of the instruction on the explicit learningphase, we also analysed the combined data from bothsubgroups for the explicit learning phase.
PET procedureThe subject lay supine on a scanner bed in a dimly lit,sound-attenuated room. The head was immobilized with anindividually fitted thermoplastic face mask. A small plasticcatheter was placed in the left cubital vein for injection ofthe radioisotope. PET was performed with a ScanditronixPC 2048–15B scanner (Uppsala, Sweden), which collected15 contiguous planes with an in-plane resolution of 6.5 mmfull-width half-maximum after reconstruction, and with acentre-to-centre distance of 6.5 mm, covering 97.5 mm inthe axial direction. Field of view and pixel size of thereconstructed images were 256 mm and 2 mm, respectively.A transmission scan was obtained with a rotating68Ge /68Ga

2162 M. Hondaet al.
source. Based on the reconstructed transmission images, thesubject’s head was carefully positioned so that the scancovered the entire frontal lobe, including primary andsupplementary motor areas, and the superior half of thecerebellum, where activation associated with motor executionmost frequently occurs (e.g. Graftonet al., 1993). However,with a limited field of view in the axial direction of thescanner, the inferior half of the cerebellum was not covered.During the transmission scan, three training blocks wereperformed, as described earlier, at 2–3-min intervals. Then,10 consecutive scans were made at 10-min intervals duringthe performance of each block. A bolus of 30 mCi of15O-labelled water was injected into the subject’s left cubital vein1 min after the task was started. Reconstructed images wereobtained by summing the activity during the 60-s periodfollowing the first detection of an increase in cerebralradioactivity after the injection. No arterial blood samplingwas performed, and thus the images collected were those oftissue activity. Tissue activity recorded by this method islinearly related to regional CBF (rCBF) (Foxet al., 1984;Fox and Mintun, 1989).
Data analysisThe data were analysed with statistical parametric maps(Wellcome Department of Cognitive Neurology, London,UK) implemented in MATLAB (Mathworks, Sherborn,Mass., USA). The statistical parametric maps are spatiallyextended statistical processes that are used to characterizeregionally specific effects in imaging data (Fristonet al.,1991, 1994; Worsleyet al., 1992). The scans from eachsubject were realigned to the first image as a reference withrigid transformation and a least-squares approach (Fristonet al., 1995a). After realignment, the images were transformedinto a standard anatomical space (Talairach and Tournoux,1988; Fristonet al., 1995a). Each image was smoothed withan isotropic Gaussian kernel (full-width half-maximum5 15mm) to account for the variation in gyral anatomy. The effectof global differences in rCBF between scans was removedby scaling activity in each pixel proportional to the globalactivity so as to adjust the mean global activity of each scanto 50 ml/100 g/min.
Eigenimage analysisThe data were first subjected to eigenimage analysis (Fristonet al., 1993) to observe the general characteristic of variance–covariance structure in the data introduced by theexperimental design in both the spatial and temporal domainswithout any a priori assumption. Only data from the subjectswho completed all conditions were used for this analysis.Images recorded from each block were averaged separatelyacross subjects with respect to the time course regardless ofthe learning phases, after a systematic difference amongsubjects was removed. To extract the predominant spatialcorrelation (CUSV) patterns that account for most of the
variance–covariance structure of the time-series data, the datawere divided into two sets of (orthogonal) vectors by the useof singular value decomposition (SVD), whereCUSV 5SVD{M }, such thatM 5 U*S*VT (T denotes transposition,and * denotes a product of matrices), and whereM is theoriginal time-series data matrix with 10 rows (one for eachblock) and one column for each voxel, andU and V areunitary orthogonal matrices denoting pattern in time andspace, respectively, andS is a diagonal matrix of decreasingsingular value. Therefore, in short, these procedurescorrespond to principal component analysis. Each eigenvector(each column of matrixV) can account for the predominantinter-regional correlation introduced by the experimentaldesign, and can be shown as an image by the use of astandard grid (eigenimage). An eigenimage can be interpretedas a spatially distributed neuronal network representingfunctional connectivity. Each column ofU corresponds tothe temporal profile associated with each eigenimage. Thesescores can be interpreted as showing how the neuronalnetwork (extracted as an eigenimage) is involved over time.The correlation between temporal profiles and behaviouralscores, averaged across subjects, was also calculated. Notethat the inter-subject variability in the time-course is nottaken into account in this analysis and, therefore, the resultsrepresent only a tendency as a whole.
Statistical inferenceTo assess the statistical inference of a regionally specificeffect of the experimental design, both subtraction andparametric analyses were employed. In the followinganalyses, the condition effects (in a subtraction analysis) orcovariate effects (in a parametric analysis) were estimatedaccording to the general linear model at each and every voxel(Fristonet al., 1995b). A systematic difference across subjectswas removed as a confounding effect. To test hypothesesabout regionally specific conditions or covariate effects, theestimates were compared by the use of appropriate linearcontrasts. The resulting set of voxel values for each contrastconstituted a statistical parametric map of thet-statistic. Thet-values were transformed to the unit normal distribution (Z-scores), which was independent of the degrees of freedomof the error, and a threshold was set at 3.09. To correct formultiple, non-independent comparisons, the significance ofthe activation in each brain region detected was estimatedby the use of distributional approximations from the theoryof Gaussian fields, in terms of spatial extent and/or peakheight (Fristonet al., 1994). A correctedP-value of 0.05was used as a final threshold for significance. The resultingset ofZ-scores for the significant brain regions was mappedon a standard spatial grid (Talairach and Tournoux, 1988).
Subtraction analysis.To confirm the regions of the brainrelated to motor execution in the population studied, the datawere subjected to a conventional subtraction analysis. As inthe eigenimage analysis, only data from the subjects who

Implicit and explicit motor learning 2163
completed all conditions were used. The planned comparisonwas all blocks with movement versus the visual controlcondition.
Parametric analysis.To address the systematic effect ofbehavioural change on regional brain activity, images wereanalysed separately using different behavioural parametersas covariates. The results showed the regions where activitywas significantly correlated with changes of each covariate.Since a systematic difference across subjects was removedas a confounding factor in the general linear model, the
results can mainly reflect an intra-individual correlation witheach covariate over time, without confounding correlationsacross subjects of no interest.
Images obtained from all blocks of the sequence conditionof all subjects were analysed using the report accuracyassociated with each PET scan as a covariate. It is reasonableto include not only the explicit learning phase but also theimplicit learning and post-learning phases in this analysis,because a high correlation of rCBF with the covariate candenote activity that is stable during the latter two phases andincreases only during the explicit learning phase.
Images were also analysed using the mean reaction timeassociated with each PET scan as a covariate. Correlationwas calculated separately in each learning phase. Since onlythe blocks belonging to the individual learning phases wereused for the analysis, the number of subjects and scans variedamong analyses (see Results). To ensure the removal of asystematic difference in the reaction time across subjects, themean reaction time in each block for each subject wasnormalized to that obtained from RND1 of the same subjectand used as a covariate. In terms of the explicit learningphase, we added the last block of the implicit learning phase,if it existed, to this analysis, because we were interested inthe relative change in activity that is introduced by eachlearning phase. This enabled us to include the subjects whoachieved repetition of the whole test sequence during oneblock (e.g. a report accuracy of 0% in SEQ3 and of 100%in SEQ4).
We hypothesized that brain regions involved in explicitlearning show a positive correlation with the report accuracy(i.e. activity is greater as the accuracy increases), whereasthose involved in implicit learning show a negative correlationwith reaction time during the implicit learning phase (i.e.
Fig. 1 Behavioural data. (A) Mean normalized reaction times(RT) (bars) and error responses (open squares) with standarddeviations. Data were averaged across the 18 subjects whocompleted all of the three conditions with respect to the timeseries, regardless of different learning phases. (B) Mean reportaccuracy (percentage of correct verbal report of the test sequence)obtained after each block of the sequence condition, with standarddeviations. The data were averaged with respect to the timeseries, as inA. (C) Mean normalized reaction times (bars) anderror responses (open squares) with standard deviations, withrespect to the different learning phases, i.e. according to thereport accuracy scores of each individual. A different subgroup ofsubjects was used for each learning phase to take into account theindividual variability of the learning course.Left: the last block oftraining (PRE3), the first block of the random condition (RND1)with PET and the last block of the implicit learning phase. Datawere obtained from 14 subjects who had an implicit learningphase. The report accuracy scores during this phase were always0%. Centre: the first and last block of the explicit learning phaseobtained from 21 subjects. The report accuracy graduallyincreased during this phase.Right: the first and last block of thepost-learning phase obtained from 16 subjects. The reportaccuracy was always 100% during this phase. *P ,0.05;** P , 0.001.

2164 M. Hondaet al.
activity is greater as the reaction time decreases). In additionto a formal conservative threshold (P 5 0.05, correctedfor multiple comparisons), we also applied a more liberalthreshold ofZ 5 1.96, corresponding toP 5 0.05, uncorrectedfor multiple comparisons, to characterize the spatial extentof regions involved in the two different types of learningwithout producing too many false-positive results.
ResultsBehavioural dataFigure 1 shows the behavioural measurements correspondingto each subgroup used for the separate rCBF analyses.Regarding reaction time, both the raw reaction times andnormalized reaction times were used for the followingstatistical assessments and gave the same results. Only theresults of the normalized reaction times, which were usedfor the rCBF analyses, are presented.
Three of the 21 subjects could not correctly generate allcomponents of the test sequence after SEQ7. Therefore, twomore blocks of the sequence condition (SEQ8 and SEQ9)were performed (Table 1). None of these subjects had beeninstructed to find the repeating sequence after SEQ3. One ofthem achieved full explicit knowledge in the final block(SEQ9), but the other two subjects failed to achieve it withinthe whole experimental period. Their report accuracy scoresin the final block (SEQ9) were 30% and 40%. Their datawere excluded from the eigenimage and the subtractionanalyses, because they could not complete all of the threeconditions. However, their data were used for the parametricanalyses.
As a result, data from 18 subjects (12 with the instructionand 6 without the instruction) were subjected to theeigenimage and subtraction analyses to determine whetherthere was a general tendency for change. Figure 1 (A andB) shows temporal change in each behavioural measurementobtained from these subjects. The data were averaged acrossthe subjects with respect to block, regardless of the learningphase. As the subjects repeated the blocks in the sequencecondition, the reaction time (Fig. 1A, bars) and reportaccuracy (Fig. 1B) progressively improved. In contrast, theerror response (Fig. 1A, open squares) did not show anyconsistent tendency to change across behavioural blocks.Even with the addition of the three subjects who did notperform blocks RND2 and VIS, the behaviouralmeasurements did not tend to change. The significance ofchanges in each behavioural parameter was tested usingrepeated measures ANOVA (analysis of variance) with onewithin-subject factor, the block. The results revealedsignificant block effects on the normalized reaction time[F(17,136) 5 26.62, P , 0.0001, ε (Greenhouse–Geissercorrection)5 0.412] and on the report accuracy [F(17,102)535.41,P , 0.0001,ε 5 0.478], but not on the error response[F(17,136) 5 0.84, P 5 0.48, ε 5 0.383]. Even in thesesubjects, there was considerable inter-individual variability
in the time course of learning, which was partially reflectedas the large standard deviations in the reaction times andreport accuracy. For example, the first block when thesesubjects achieved full explicit knowledge varied betweenSEQ2 and SEQ7. Therefore, the data were significantlyinfluenced by a ‘jitter’ in the individual learning curves.
Eleven subjects showed an implicit learning phase, andtheir data, consisting of 44 blocks, were used for theparametric analysis of reaction times during the implicitlearning phase. In the group of subjects who were giveninstruction on the existence of the repeating sequence afterSEQ3, none of the blocks performed after they learned aboutthe repeating sequence was categorized as implicit learning.There was only one block from one subject in which thesubject was aware of the sequence but could not generateany components of it. By definition, this block was notincluded in this (implicit learning) phase. Behavioural datafrom these 11 subjects are presented in Fig. 1C (left). Thereport accuracy during this phase was always 0%. Thereaction time in the last block of the implicit learning phasewas shortened, with a marginally significant difference fromthat during RND1 (P 5 0.037, one-tail pairedt test).Regardless of whether or not the instruction was given,improvement of the reaction time was not significantlydifferent between the two groups (51.8 ms with theinstruction, 18.7 ms without the instruction;P 5 0.21, one-tail unpairedt test). The reaction time in the last trainingblock (PRE3) was not significantly different from that inRND1 (P 5 0.18), indicating that any non-specific practiceeffect had already occurred by the time the test sequencestarted. There were no significant differences in errorresponses among these conditions.
Data from all 21 subjects were subjected to parametricanalysis of reaction times during the explicit learning phase.As shown in Fig. 1C (centre), the reaction time decreasedsignificantly between the first and last blocks of this phase(P , 0.0001), whereas the error response showed a non-significant decrease (P 5 0.073). The normalized reactiontimes and report accuracy were highly correlated during thisphase (r 5 –0.559,P , 0.0001).
Sixteen subjects showed a post-learning phase, and theirdata were used for the parametric analysis of reaction timesduring the post-learning phase. Behavioural data are shownin Fig. 1C (right). The report accuracy during this phase wasalways 100%. The normalized reaction times showed a non-significant decrease (P 5 0.12), whereas the error responsesincreased (P 5 0.028).
Eigenimage analysisEigenimage analysis was performed on 180 blocks obtainedfrom 18 subjects. The distribution of eigenvalues (squaredsingular values) revealed that only the first two eigenimageswere associated with eigenvalues greater than unity andcould account for most of the observed variance–covariancestructure. Namely, the first eigenimage accounted for 49.1%
Implicit and explicit motor learning 2165
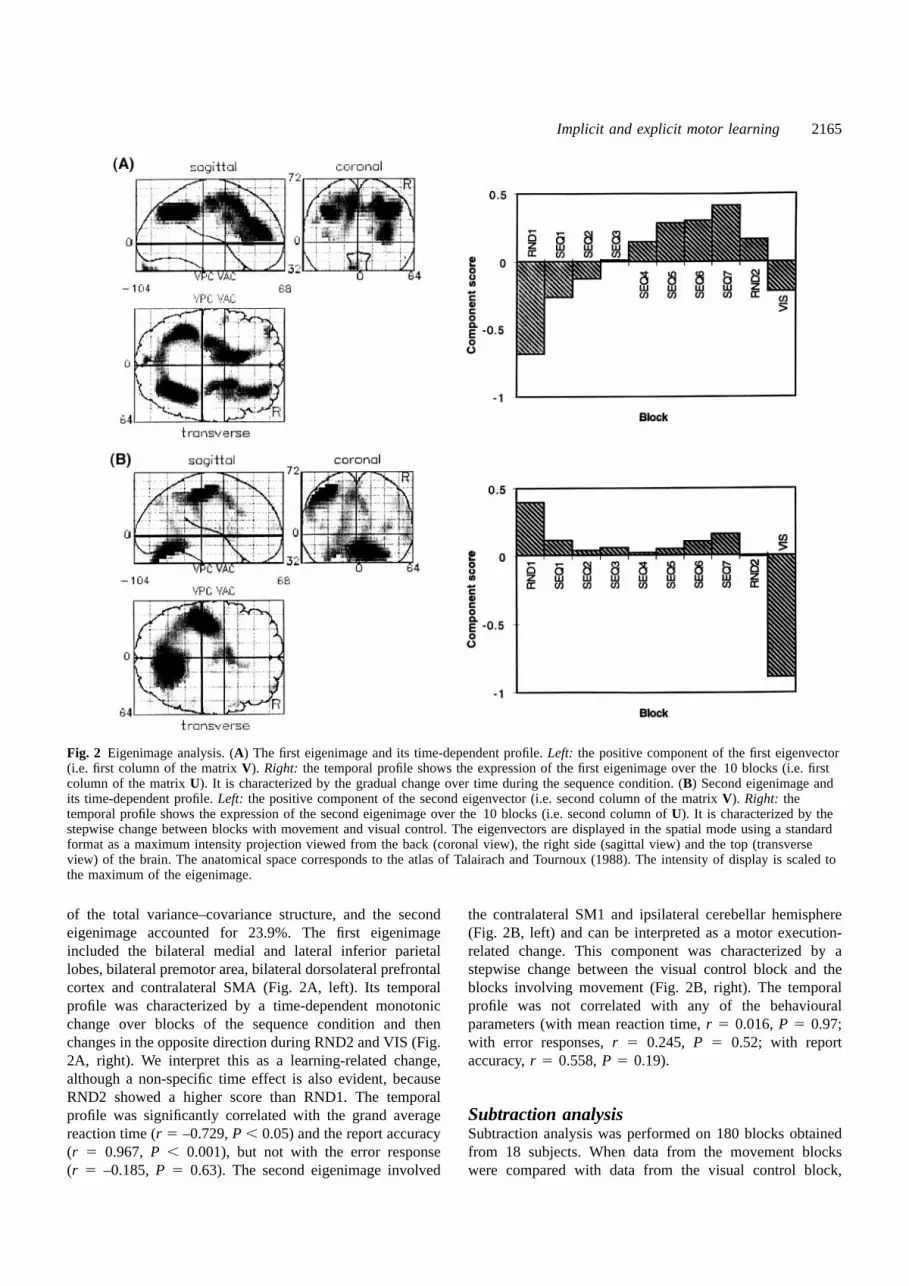
Fig. 2 Eigenimage analysis. (A) The first eigenimage and its time-dependent profile.Left: the positive component of the first eigenvector(i.e. first column of the matrixV). Right: the temporal profile shows the expression of the first eigenimage over the 10 blocks (i.e. firstcolumn of the matrixU). It is characterized by the gradual change over time during the sequence condition. (B) Second eigenimage andits time-dependent profile.Left: the positive component of the second eigenvector (i.e. second column of the matrixV). Right: thetemporal profile shows the expression of the second eigenimage over the 10 blocks (i.e. second column ofU). It is characterized by thestepwise change between blocks with movement and visual control. The eigenvectors are displayed in the spatial mode using a standardformat as a maximum intensity projection viewed from the back (coronal view), the right side (sagittal view) and the top (transverseview) of the brain. The anatomical space corresponds to the atlas of Talairach and Tournoux (1988). The intensity of display is scaled tothe maximum of the eigenimage.
of the total variance–covariance structure, and the secondeigenimage accounted for 23.9%. The first eigenimageincluded the bilateral medial and lateral inferior parietallobes, bilateral premotor area, bilateral dorsolateral prefrontalcortex and contralateral SMA (Fig. 2A, left). Its temporalprofile was characterized by a time-dependent monotonicchange over blocks of the sequence condition and thenchanges in the opposite direction during RND2 and VIS (Fig.2A, right). We interpret this as a learning-related change,although a non-specific time effect is also evident, becauseRND2 showed a higher score than RND1. The temporalprofile was significantly correlated with the grand averagereaction time (r 5 –0.729,P , 0.05) and the report accuracy(r 5 0.967, P , 0.001), but not with the error response(r 5 –0.185,P 5 0.63). The second eigenimage involved
the contralateral SM1 and ipsilateral cerebellar hemisphere(Fig. 2B, left) and can be interpreted as a motor execution-related change. This component was characterized by astepwise change between the visual control block and theblocks involving movement (Fig. 2B, right). The temporalprofile was not correlated with any of the behaviouralparameters (with mean reaction time,r 5 0.016,P 5 0.97;with error responses,r 5 0.245, P 5 0.52; with reportaccuracy,r 5 0.558,P 5 0.19).
Subtraction analysisSubtraction analysis was performed on 180 blocks obtainedfrom 18 subjects. When data from the movement blockswere compared with data from the visual control block,

2166 M. Hondaet al.
Table 2 Brain regions activated by finger movement, asdetermined by subtraction analysis
Brain region Coordinates Z-score(Brodmann area)
x y z
Left SM1 –34 –20 56 11.13Right cerebellar 22 –60 –20 8.39hemisphereSMA (6) –6 2 44 5.43
Coordinates indicate the location of maximally significant activity.
Table 3 Brain regions with significant correlations betweenreport accuracy and rCBF, as determined by parametricanalysis
Brain region (Brodmann area) Coordinates Z-score
x y z
Regions with positive correlationsRight posterior parietal cortex (40) 26 –70 32 7.56Precuneus (7) –4 –74 36 6.54Left posterior parietal cortex (40) –30 –64 40 6.14Right dorsal premotor cortex (6) 24 4 52 6.05Right dorsolateral prefrontal 36 42 16 5.47
cortex (46)SMA (6) –12 2 48 5.20Left dorsal premotor cortex (6) –24 –2 48 4.87Left thalamus –10 –18 0 4.72
Regions with negative correlationsLeft angular gyrus (39) –52 –68 12 6.10Medial prefrontal (9) –6 48 40 5.95Right superior temporal gyrus 52 –8 –8 5.49
(42, 22)Right angular gyrus (39) 46 –58 16 4.77Left transverse temporal gyrus (41) –40 –24 12 4.24
Coordinates indicate the location of maximally significantcorrelations between report accuracy and rCBF.
significant activation was observed in the contralateral SM1,SMA, and ipsilateral cerebellum (Table 2). Note that theseresults correspond well with the second eigenimage.
Parametric analysisAll 153 blocks of the sequence condition obtained from all21 subjects were used for parametric analysis of the reportaccuracy. A significant positive correlation of brain activitywith the report accuracy was observed in the posterior parietalcortex, precuneus, bilateral premotor cortex, right dorsolateralprefrontal cortex, left thalamus and SMA, predominantly thecontralateral anterior portion (Fig. 3A and Table 3). Activityin these areas increased as the report accuracy increased.This analysis corresponds well with the first eigenimage. Anegative correlation of brain activity with the report accuracywas found in the bilateral parieto-occipital region, bilateraltemporal cortex, and medial prefrontal region (Fig. 3B).
Forty-four blocks from 14 subjects were used forparametric analysis of reaction times during the implicit
learning phase. A significant negative correlation of brainactivity with reaction time was observed only in thecontralateral SM1 (Fig. 4). The location was ~15 mm posteriorto the maximum activation in the subtraction analysis (Tables2 and 4). Activity in this area increased as the reaction timeshortened. A significant positive correlation was observed inthe left anterior insula (Table 4).
Ninety-eight blocks from all 21 subjects were subjectedto parametric analysis of reaction times during the explicitlearning phase. During this phase, the reaction time showeda significant negative correlation with activity in the leftanterior SMA, right premotor cortex and right posteriorparietal cortex (Fig. 5A and Table 4). All of these areascorresponded well with the areas where activity wassignificantly correlated with the report accuracy (shown inFig. 3A).
Fifty-four blocks from 16 subjects were used for parametricanalysis of reaction times during the post-learning phase. Asignificant negative correlation of brain activity with reactiontime was observed in the posterior SMA and ipsilateral SM1(Fig. 5B and Table 4). These areas also revealed a negative,but non-significant, correlation with reaction time during theimplicit learning phase (for ipsilateral SM1,Z 5 3.26 atx 532, y 5 28, z 5 56; for SMA, Z 5 3.21 atx 5 4, y 5 28,z 5 56). It is also noteworthy that the contralateral SM1showed the same non-significant tendency during the post-learning phase (Z 5 3.23 atx 5 34, y 5 38, z 5 52).
Figure 6 shows a superimposition of the same data shownin Figs 4A and 5A, but using a lower threshold ofZ 5 1.96,without correction for multiple comparisons. The illustrationshows that activity in the frontoparietal region had a tendencytoward a positive correlation with the report accuracy(corresponding to Fig. 4A) and that activity in the centralregion had a tendency toward a negative correlation withreaction time during the implicit learning phase(corresponding to Fig. 5A). Furthermore, as shown in thetransverse view (Fig. 6, lower left), even when a lowerthreshold is employed, these two sets of regions showscant overlap.
DiscussionThe main finding of this study is that activity in anatomicallyseparate brain areas is correlated with different performancemeasurements. Activity in the frontoparietal region wascorrelated with the correct recall of the sequence, a measureof explicit learning. Activity in the central region, mostsignificantly the contralateral SM1, showed a correlation withthe reaction time during the implicit learning phase. Incontrast, during the explicit learning phase, when the subjectsdeveloped conscious knowledge about the sequence, thereaction time was significantly correlated with activity in apart of the frontoparietal network. During the post-learningphase, when the subjects already consciously knew allcomponents of the sequence, further improvement of reactiontime was correlated with activity in the central region again,

Implicit and explicit motor learning 2167
Fig. 3 Statistical parametric maps of the regional effect of report accuracy. Maps ofZ-scores for the regions where activity wassignificantly correlated with the report accuracy (P , 0.05 with a correction for multiple comparisons) are shown in a standardanatomical space (Talairach and Tournoux, 1988). Positive (A) and negative (B) correlation maps on which positive (or negative)correlation means increasing (or decreasing) activity as the report accuracy increased on an individual basis.
Fig. 4 (A) Statistical parametric maps of the regional effect of normalized reaction time during the implicit learning phase, shown in astandard format. The maps show a negative correlation of rCBF with normalized reaction time, meaning that activity increased as thereaction time decreased. (B) The same region is superimposed onto three orthogonal slices of spatially normalized MRI images from onesubject.
but this time more in the ipsilateral SM1 and posterior SMA.We interpret these results to mean that the frontoparietalnetwork is predominantly responsible for explicit learning,whereas the central area is more responsible for improvementof motor performance, including implicit learning, and thatthese distinct cortical regions are dynamically involved inlearning, although this interpretation requires caution.
Parametric approach and its limitationsBecause the learning process is a dynamic phenomenonoccurring over time, a parametric approach that identifies aregional change in activity correlated with a parameter oflearning (Graftonet al., 1995) can be a powerful tool,especially for the SRTT associated with a chronometric
measurement of performance. A direct relationship betweenneuronal activity and rCBF has been shown for the primaryvisual cortex (Fox and Raichle, 1984), primary auditorycortex (Priceet al., 1992), primary somatosensory cortex(Ibanezet al., 1995) and primary motor cortex (Sadatoet al.,1996b). However, a change in rCBF (Priceet al., 1992;Sadatoet al., 1996a, b) may not parallel the parameter ofbehaviour or stimulus in some areas. Chen and Wise (1995)reported what they termed ‘learning-selective activity’ in thecortex, which was high only during some specific period oflearning, and did not parallel the learning curve. Theparametric approach used in our study may not detect suchactivity, and the findings should be interpreted with caution,especially the negative results. Regardless of whether aparametric or subtraction approach is used, it is also difficult

2168 M. Hondaet al.
Fig. 5 (A) Statistical parametric maps of the regional effect of normalized reaction time during the explicit learning phase. (B) Statisticalparametric maps of the regional effect of normalized reaction time during the post-learning phase. Both maps show a negative correlationof rCBF with normalized reaction time using a standard format.
Table 4 Brain regions with significant correlations betweenreaction times and rCBF, as determined by parametricanalysis
Brain region (Brodmann area) Coordinates Z-score
x y z
Implicit learning phaseNegative correlation –32 –34 52 4.48
Left SM1Positive correlation –30 18 4 4.69
Left anterior insula
Explicit learning phaseNegative correlations
SMA (6) –10 4 52 4.37Right dorsal premotor cortex (6) 28 4 48 4.15Right posterior parietal cortex (40) 26 –70 32 4.11
Positive correlationsRight superior temporal gyrus 50 –8 –8 4.67
(42, 22)Left fungiform gyrus (36) –30 –40 –4 4.50Left angular gyrus (39) –52 –62 12 4.23Left inferior occipital gyrus –12 –86 –12 4.17
(18, 19)
Post-learning phaseNegative correlations
SMA (6) 0 –14 44 4.81Right SM1 30 –20 48 4.39
Positive correlationsLeft ventral premotor cortex (6) –44 4 44 5.59Left posterior parietal cortex (40) –42 –62 44 4.50Right inferior frontal gyrus (44) 50 16 16 4.30
Coordinates indicate the location of maximally significantcorrelations between reaction times and rCBF.
to distinguish whether observed changes are ‘essential for’learningper se, or simply ‘associated with’ learning, becauselearning essentially affects performance in a SRTT.
Task design and interpretationThe generation task that we used is a slightly modifiedversion of the one used by Willinghamet al. (1989); it alsocompares closely with the ‘free generation task’ used byPerruchet and Amorim (1992), in which a minimalcontribution of the implicit form of learning is expected. TheSRTT used in our study employed a number instead of thespatial position in the conventional SRTT, and a verbal reportwas used for the generation task, rather than the usualsequence production method. These procedures are expectedto require more explicit mechanisms to generate the sequencecompared with those requiring the motor response used inthe SRTT itself. On the other hand, in this study, the reactiontime task and the questionnaire measure of explicit knowledgealternated. This procedure contrasts with the standard versionof the task, in which explicit knowledge is not assessed untilseveral blocks of reaction time training have been completed,and is likely to encourage subjects to look for regularities,and to develop explicit knowledge more quickly than is usualin the standard task. We should also consider the possibilitythat the score may underestimate the explicit knowledgeactually used during the task. Explicit learning may startwhen subjects become aware of the repeating feature of thepresentation, even if the report accuracy is 0%. In the studyof Willingham et al. (1989), subjects who performed ageneration task only at chance levels were above chance ona cued recall measure of explicit knowledge. However, inthe present study, there was only one block from one subjectwhen the subject was aware of the existence of the sequencebut unable to generate it, and such an effect may be minimal.It is noteworthy that the areas explored by this analysiscorresponded well with the first eigenimage, whose temporalprofile was highly correlated with the report accuracy. Sincean eigenimage can be interpreted as a distributed neuralnetwork (Fristonet al., 1993), the finding may suggest that

Implicit and explicit motor learning 2169
Fig. 6 Statistical parametric maps of the regional effect of reportaccuracy (khaki yellow) and the normalized reaction time duringthe implicit learning phase (wine red). The data are the same asthose shown in Figs 3A and 4A except that a lower threshold ofZ 5 1.96 without correction for multiple comparisons was used.Note that two sets of areas slightly overlap (dark green), asshown best in the transverse projection (lower left).
these regions were involved in the explicit learning processas a whole network rather than as separate regions.
The different spatial pattern of the correlation with reactiontime in the different learning phases suggests that the observedchanges are not likely to be due to a general effect of ashortened reaction time (e.g. more acceleration resulting inmore outflow from the motor executive area as the reactiontime decreases), but are specific to each different phase.During implicit learning, when the subjects were not aware ofthe sequence, shortening of the reaction time was significantlycorrelated with increasing activity in the contralateral SM1.It is conceivable that the change in reaction time can reflectaspects of learning other than implicit sequence learning. Forexample, because the relationship between the stimulus andthe actual motor response was arbitrary in our version of theSRTT (i.e. there is less spatially compatible correspondencebetween the number ‘1’ and the ‘index finger’ comparedwith the situation where the spatial position of a stimulusrepresents the index finger), this arbitrary sensorimotorassociation might also be the subject of learning. This kindof learning has been termed conditional motor learning(Passingham, 1993). However, the sensorimotor associationwas so simple that subjects learned it very quickly, and errorsdid not show significant change over experimental blocks.On this basis, we argue that any conditional motor learningeffect had already occurred by the time the test sequencestarted. The finding that the reaction time in PRE3 was notsignificantly different from that in RND1 supports thisconclusion. On the other hand, both the ambiguous sequence(Cohenet al., 1990) and the relatively long inter-stimulus
interval (Frensch and Miner, 1994) that we used have beenshown to have a detrimental effect on implicit learning, andmight be responsible for a somewhat smaller than usualdecrease of reaction times during the implicit learning phase.This might partly explain an absence of significant findingsin some areas.
During the explicit learning phase, the improvement inreaction time paralleled an increase in the report accuracy,and a significant correlation was shown in a part of thefrontoparietal network. This supports neuropsychologicalevidence that explicit learning contributes to the improvementof reaction time (Perruchet and Amorim, 1992; Curran andKeele, 1993; Schmidtke and Heuer, 1998). Although theexplored frontoparietal network was distinguishable fromwhat we interpret as implicit learning-related areas, we donot think that the two sets of cortical regions ‘exclusively’contribute to implicit and explicit learning. Pascual-Leoneet al. (1994) showed that the increase of cortical excitabilityin the contralateral SM1 started during the implicit learningphase, and that it lasted until the subjects fully achievedexplicit learning. This suggests that the implicit learning-related change may continue during the explicit learningphase. The absence of a significant correlation betweenactivity in the contralateral SM1 and reaction times duringthe explicit learning phase in the present study may beexplained by normalization of global activity in PET. Thelongitudinal change in activity in a smaller area, such as theSM1, may be obscured by the net activity in the largerfrontoparietal network, once it becomes active. On this basis,we conclude that the different regions may each be ‘moreresponsible’ for different types of learning.
The change in reaction time during the post-learning phasecan be interpreted in different ways. This phase can representa consolidation phase of the sequence learning. Alternatively,since we used a fixed inter-stimulus interval, the timing ofthe response may be learned when subjects completely predictthe forthcoming movement. Moreover, since the change inreaction time was not definitive over time, the correlationwith reaction time may simply represent more efficient motorexpression, including preparing and withholding movement.
Neuroimaging studies of sequence learningThere is little correspondence between neuroimaging studiesthat have used modified versions of the SRTT (Graftonet al.,1995; Rauchet al., 1995; Doyonet al., 1996; Hazeltineet al., 1997). The present results provide strong support forthe results of Graftonet al. (1995) and Hazeltineet al.(1997). From the point of view of dichotomous distinctionof learning in the previous studies, as the authorsacknowledged, the implicit phase in the study of Rauchet al.(1995) had a ‘non-significant’ contamination of explicitlearning, and in the study of Doyonet al. (1996), all of thesubjects were aware of the sequence during both newly andhighly learned sequences. It is also conceivable that implicitcomponents persisted during explicit learning (Perruchet and

2170 M. Hondaet al.
Amorim, 1992; Curran and Keele, 1993). The contaminationand complicated interaction between two learning processesmake the interpretion of the results from the subtractionanalysis that they used somewhat problematic. In addition,the cortical areas showing the most marked findings in thepresent study, as well as in the studies of Graftonet al.(1995) and Hazeltineet al. (1997), i.e the SM1, SMA, dorsalpremotor cortex and, presumably, a part of the posteriorparietal cortex, were not covered by the PET scan in thestudy of Rauchet al. (1995).
Grafton et al. (1995) showed a longitudinal increase ofrCBF in different regions during a SRTT with, and without,a secondary task to interfere with attention. The findingswere recently supported by a study from the same group(Hazeltineet al., 1997) using a different stimulus modality(colour instead of spatial position) to present a sequence. Inboth studies, since the secondary task may confound theSRTT itself, two SRTTs (with and without the secondarytask) may not reflect dynamic aspects of the single learningcourse. In addition, five of the 12 subjects in Graftonet al.(1995) and four of the 11 subjects in Hazeltineet al. (1997)did not develop any explicit knowledge during either task,meaning that a non-negligible number of subjects remainedat the same stage of learning from the point of view of thedichotomous distinction of implicit and explicit learning.This view raises the question of whether their findingsmight reflect the distinction between attentional versus non-attentional learning (Curran and Keele, 1993), which may beonly indirectly related to implicit versus explicit learning.Nevertheless, the good agreement of our results with thoseof Graftonet al. (1995) and Hazeltineet al. (1997) suggeststhat these different dichotomous representations of motorsequence learning may share common neuroanatomicalcorrelates.
The absence of significant findings in the basal gangliaand cerebellum in the present study could be partly due to alimited amount of implicit learning, or a non-linear changein activity with the learning curve, as discussed earlier. It isnoteworthy that, despite clear evidence of a role of the basalganglia in motor control (Saint-Cyret al., 1995), the findingsof PET studies are largely controversial (Brooks, 1995).Activity in a complex ensemble of excitatory and inhibitoryneurons might result in a complicated net change in rCBFin this region. Furthermore, the site in the cerebellumresponsible for sequence learning might be different from thatwhere we observed extensive activation when all movementconditions were compared with the visual control condition,and it might not be covered by the PET scan in thisexperiment. Further studies are needed in this regard.
Neuroanatomical correlatesThere is evidence that the premotor cortex (Luria, 1966;Joseph and Barone, 1987; Halsband and Freund, 1990;Mushiakeet al., 1991; Kettneret al., 1996a, b; Sadatoet al.,1996a), the dorsolateral prefrontal cortex (Barone and Joseph,
1989; Petrides, 1991; Jenkinset al., 1994; Jueptneret al.,1997a, b) and the anterior SMA (for review, see Picard andStrick, 1996) play an important role in controlling and/orlearning sequential movement. Neuroimaging studies alsoprovide evidence of the involvement of the posterior parietalcortex (Jenkinset al., 1994; Graftonet al., 1995; Petitet al.,1996; Sadatoet al., 1996a; Jueptneret al., 1997a) andthalamus (Sadatoet al., 1996a). Jenkinset al. (1994) showedthat the dorsolateral prefrontal cortex, lateral premotor cortex,posterior parietal cortex and cerebellum were more activatedduring new sequence learning than during prelearnedsequences. Using a paradigm similar to that of Jenkinset al.(1994), Jueptneret al. (1997a) showed that, compared withthe simple execution of a prelearned sequence, the dorsolateralprefrontal cortex was activated during both new sequencelearning and the execution of a prelearned sequence withconscious attention to the performed sequence. However, thedegree of activation in the dorsolateral prefrontal cortex wasmore extensive during new sequence learning than duringexecution of a prelearned sequence with attention. Hikosakaet al. (1996) reported that the pre-supplementary motor areawas more activated during new sequence learning than duringa sensorimotor control task. Since the subjects attempted tofind the sequence by ‘trial and error’ in these studies, it isconceivable that the explicit strategy, as well as a factor of‘problem solving,’ contributed. The present study exploresa learning-dependent change in parallel with performanceimprovement in these regions. This suggests that the largefrontoparietal network may store and utilize the knowledgeabout a stimulus-motor sequence in a form accessible by aconscious, explicit strategy.
The primary motor cortex has been shown to play a rolein procedural motor learning (Graftonet al., 1992, 1994;Pascual-Leone and Torres, 1993; Pascual-Leoneet al., 1993,1995; Schlauget al., 1994; Karniet al., 1995). It is noteworthythat the maximum significant change was situated posteriorto the motor representation in a subtraction analysis, becausethe importance of the somatosensory cortex has been proposedto account for plastic changes in the motor cortex (Sakamotoet al., 1987; Iriki et al., 1989) and learning of new motorskills (Sakamotoet al., 1989; Pavlideset al., 1993). However,this interpretation requires caution because active and passivemovement of the elbow showed similar foci of activation inthe contralateral SM1 (Weilleret al., 1996). The relativecontribution to improvement in reaction times shifted fromthe contralateral SM1 during the implicit learning phase tothe ipsilateral SM1 and posterior SMA during the post-learning phase. During both phases, the contribution ofexplicit learning was minimal. Although these two stageshave significant elemental differences, it is postulated thatthe contralateral SM1 might play a critical role in the earlierstage, and the ipsilateral SM1 and posterior SMA mightbecome more important in the more advanced stage toachieve a more efficient motor response. The importance ofthe ipsilateral SM1 for controlling sequential movement

Implicit and explicit motor learning 2171
(Kitamura et al., 1993; Shibasakiet al., 1993; Chenet al.,1997) supports this view.
An open question is whether subjects learn the sequenceof presentations (sensory domain), the sequence of responses(response domain) or the sequence of stimulus–responserelationships (Keeleet al., 1995). The good agreementbetween our study and the studies of Graftonet al. (1995)and Hazeltineet al. (1997), despite the use of differentsensory information to present a sequence (number, spatialposition or colour), suggests indirectly that sequence learning,especially its implicit aspect, does not occur solely in thesensory domain. However, the findings in the motor executionarea do not necessarily mean that the implicit form ofsequence encoding occurs solely in the response domain,because neurons in the contralateral SM1 have selectiveresponsiveness to specific sensory information as well assensorimotor transformation (Zhuanget al., 1997). The roleof each region for the different domains of learning shouldbe further examined.
AcknowledgementsWe wish to thank Dr S. P. Wise, Laboratory of SystemsNeuroscience, National Institute of Mental Health, Bethesda,Md., and Dr S. W. Keele, Department of Psychology,University of Oregon, Portland, for reviewing the paper; alsoDr H. Shibasaki, Department of Brain Pathophysiology,Kyoto University School of Medicine, Japan, and Dr C. Toro,National Institute of Neurological Disorders and Stroke,Bethesda, Md., for valuable discussion; members of thePositron Emission Tomography Section, Nuclear MedicineDepartment, Clinical Center, National Institutes of Health,Bethesda, Md., for their expertise; and Ms B. J. Hessie forskillful editing.
ReferencesBarone P, Joseph JP. Prefrontal cortex and spatial sequencing inmacaque monkey. Exp Brain Res 1989; 78: 447–64.
Brooks DJ. The role of the basal ganglia in motor control:contributions from PET. J Neurol Sci 1995; 128: 1–13.
Chen LL, Wise SP. Neuronal activity in the supplementary eyefield during acquisition of conditional oculomotor associations. JNeurophysiol 1995; 73: 1101–21.
Chen R, Gerloff C, Hallett M, Cohen LG. Involvement of theipsilateral motor cortex in finger movements of differentcomplexities. Ann Neurol 1997; 41: 247–54.
Cohen NJ, Squire LR. Preserved learning and retention of pattern-analyzing skill in amnesia: dissociation of ‘knowing how’ and‘knowing that’. Science 1980; 210: 207–10.
Cohen A, Ivry RI, Keele SW. Attention and structure in sequencelearning. J Exp Psychol Learn Mem Cogn 1990; 16: 17–30.
Curran T, Keele SW. Attentional and nonattentional forms ofsequence learning. J Exp Psychol Learn Mem Cogn 1993; 19:189–202.
Doyon J, Owen AM, Petrides M, Sziklas V, Evans AC. Functionalanatomy of visuomotor skill learning in human subjects examinedwith positron emission tomography. Eur J Neurosci 1996; 8: 637–48.
Fox PT, Mintun MA. Noninvasive functional brain mapping bychange-distribution analysis of averaged PET images of H2
15Otissue activity. J Nucl Med 1989; 30: 141–9.
Fox PT, Raichle ME. Stimulus rate dependence of regional cerebralblood flow in human striate cortex, demonstrated by positronemission tomography. J Neurophysiol 1984; 51: 1109–20.
Fox PT, Mintun MA, Raichle ME, Herscovitch P. A noninvasiveapproach to quantitative functional brain mapping with H2
15O andpositron emission tomography. J Cereb Blood Flow Metab 1984;4: 329–33.
Frensch PA, Miner CS. Effects of presentation rate and individualdifferences in short-term memory capacity on an indirect measureof serial learning. Mem Cognit 1994; 22: 95–110.
Friston KJ, Frith CD, Liddle PF, Frackowiak RS. Comparingfunctional (PET) images: the assessment of significant change. JCereb Blood Flow Metab 1991; 11: 690–9.
Friston KJ, Frith CD, Liddle PF, Frackowiak RS. Functionalconnectivity: the principal-component analysis of large (PET) datasets. J Cereb Blood Flow Metab 1993; 13: 5–14.
Friston KJ, Worsley KJ, Frackowiak RSJ, Mazziotta JC, Evans AC.Assessing the significance of focal activations using their spatialextent. Hum Brain Mapp 1994; 1: 210–20.
Friston KJ, Ashburner J, Frith CD, Poline JB, Heather JD,Frackowiak RSJ. Spatial registration and normalization of images.Hum Brain Mapp 1995a; 3: 165–89.
Friston KJ, Holmes AP, Worsley KJ, Poline JB, Frith CD,Frackowiak RSJ. Statistical parametric maps in functional imaging:a general linear approach. Hum Brain Mapp 1995b; 2: 189–210.
Graf P, Schacter DL. Implicit and explicit memory for newassociations in normal and amnesic subjects. J Exp Psychol LearnMem Cogn 1985; 11: 501–18.
Grafton ST, Mazziotta JC, Presty S, Friston KJ, Frackowiak RS,Phelps ME. Functional anatomy of human procedural learningdetermined with regional cerebral blood flow and PET. J Neurosci1992; 12: 2542–8.
Grafton ST, Woods RP, Mazziotta JC. Within-arm somatotopy inhuman motor areas determined by positron emission tomographyimaging of cerebral blood flow. Exp Brain Res 1993; 95: 172–6.
Grafton ST, Woods RP, Tyszka M. Functional imaging of proceduralmotor learning: relating cerebral blood flow with individual subjectperformance. Hum Brain Mapp 1994; 1: 221–34.
Grafton ST, Hazeltine E, Ivry R. Functional mapping of sequencelearning in normal humans. J Cogn Neurosci 1995; 7: 497–510.
Halsband U, Freund HJ. Premotor cortex and conditional motorlearning in man. Brain 1990; 113: 207–22.

2172 M. Hondaet al.
Hazeltine E, Grafton ST, Ivry R. Attention and stimuluscharacteristics determine the locus of motor-sequence encoding.Brain 1997; 120: 123–40.
Hikosaka O, Sakai K, Miyauchi S, Takino R, Sasaki Y, Putz B.Activation of human presupplementary motor area in learning ofsequential procedures: a functional MRI study. J Neurophysiol 1996;76: 617–21.
Ibanez V, Deiber MP, Sadato N, Toro C, Grissom J, Woods RP,et al. Effects of stimulus rate on regional cerebral blood flow aftermedian nerve stimulation. Brain 1995; 118: 1339–51.
Iriki A, Pavlides C, Keller A, Asanuma H. Long-term potentiationin the motor cortex. Science 1989; 245: 1385–7.
Jenkins IH, Brooks DJ, Nixon PD, Frackowiak RS, PassinghamRE. Motor sequence learning: a study with positron emissiontomography. J Neurosci 1994; 14: 3775–90.
Joseph JP, Barone P. Prefrontal unit activity during a delayedoculomotor task in the monkey. Exp Brain Res 1987; 67: 460–8.
Jueptner M, Stephan KM, Frith CD, Brooks DJ, Frackowiak RS,Passingham RE. Anatomy of motor learning. I. Frontal cortex andattention to action. J Neurophysiol 1997a; 77: 1313–24.
Jueptner M, Frith CD, Brooks DJ, Frackowiak RS, Passingham RE.Anatomy of motor learning. II. Subcortical structures and learningby trial and error. J Neurophysiol 1997b; 77: 1325–37.
Karni A, Meyer G, Jezzard P, Adams MM, Turner R, UngerleiderLG. Functional MRI evidence for adult motor cortex plasticityduring motor skill learning. Nature 1995; 377: 155–8.
Keele SW, Jennings P, Jones S, Caulton D, Cohen A. On themodularity of sequence representation. J Mot Behav 1995; 27: 17–30.
Kettner RE, Marcario JK, Clark-Phelps MC. Control of rememberedreaching sequences in monkey. I. Activity during movement inmotor and premotor cortex. Exp Brain Res 1996a; 112: 335–46.
Kettner RE, Marcario JK, Port NL. Control of remembered reachingsequences in monkey. II. Storage and preparation before movementin motor and premotor cortex. Exp Brain Res 1996b; 112: 347–58.
Kitamura J, Shibasaki H, Takagi A, Nabeshima H, Yamaguchi A.Enhanced negative slope of cortical potentials before sequential ascompared with simultaneous extensions of two fingers.Electroencephalogr Clin Neurophysiol 1993; 86: 176–82.
Knopman DS, Nissen MJ. Implicit learning in patients with probableAlzheimer’s disease. Neurology 1987; 37: 784–8.
Luria AR. Higher cortical functions in man. New York: BasicBooks; 1966.
Milner B, Corkin S, Teuber HL. Further analysis of the hippocampalamnesic syndrome: 14-year follow-up study of H.M.Neuropsychologia 1968; 6: 215–34.
Mushiake H, Inase M, Tanji J. Neuronal activity in the primatepremotor, supplementary, and precentral motor cortex during visuallyguided and internally determined sequential movements. JNeurophysiol 1991; 66: 705–18.
Nissen MJ, Bullemer P. Attentional requirements of learning:evidence from performance measures. Cogn Psychol 1987; 19: 1–32.
Oldfield RC. The assessment and analysis of handedness: theEdinburgh Inventory. Neuropsychologia 1971; 9: 97–113.
Pascual-Leone A, Torres F. Plasticity of the sensorimotor cortexrepresentation of the reading finger in Braille readers. Brain 1993;116: 39–52.
Pascual-Leone A, Cammarota A, Wassermann EM, Brasil-Neto JP,Cohen LG, Hallett M. Modulation of motor cortical ouptuts to thereading hand of Braille readers. Ann Neurol 1993; 34: 33–7.
Pascual-Leone A, Grafman J, Hallett M. Modulation of corticalmotor output maps during development of implicit and explicitknowledge [see comments]. Science 1994; 263: 1287–9. Commentin: Science 1994; 265: 1600–1.
Pascual-Leone A, Dang N, Cohen LG, Brasil-Neto JP, Cammarota A,Hallett M. Modulation of muscle responses evoked by transcranialmagnetic stimulation during the acquisition of new fine motor skills.J Neurophysiol 1995; 74: 1037–45.
Passingham RE. The frontal lobes and voluntary action. Oxford:Oxford University Press; 1993.
Pavlides C, Miyashita E, Asanuma H. Projection from the sensoryto the motor cortex is important in learning motor skills in themonkey. J Neurophysiol 1993; 70: 733–41.
Perruchet P, Amorim M. Conscious knowledge and changes inperformance in sequence learning: evidence against dissociation. JExp Psychol Learn Mem Cogn 1992; 18: 785–800.
Petit L, Orssund C, Tzourio N, Crivello F, Berthoz A, Mazoyer B.Functional anatomy of a prelearned sequence of horizontal saccadesin humans. J Neurosci 1996; 16: 3714–26.
Petrides M. Functional specialization within the dorsolateral frontalcortex for serial order memory. Proc R Soc Lond B Biol Sci 1991;246: 299–306.
Picard N, Strick PL. Motor areas of the medial wall: a review oftheir location and functional activation. Cereb Cortex 1996; 6:342–53.
Price C, Wise R, Ramsay S, Friston K, Howard D, Patterson K,et al. Regional response differences within the human auditorycortex when listening to words. Neurosci Lett 1992; 146: 179–82.
Rauch SL, Savage CR, Brown HD, Curran T, Alpert NM,Kendrick A, et al. A PET investigation of implicit and explicitsequence learning. Hum Brain Mapp 1995; 3: 271–86.
Sadato N, Campbell G, Iba´nez V, Deiber M, Hallett M. Complexityaffects regional cerebral blood flow change during sequential fingermovements. J Neurosci 1996a; 16: 2691–700.
Sadato N, Iba´nez V, Deiber MP, Campbell G, Leonardo M, Hallett M.Frequency-dependent changes of regional cerebral blood flow duringfinger movements. J Cereb Blood Flow Metab 1996b; 16: 23–33.
Saint-Cyr JA, Taylor AE, Lang AE. Procedural learning andneostriatal dysfunction in man. Brain 1988; 111: 941–59.
Saint-Cyr JA, Taylor AE, Nicholson K. Behavior and the basalganglia. Adv Neurol 1995; 65: 1–28.

Implicit and explicit motor learning 2173
Sakamoto T, Porter LL, Asanuma H. Long-lasting potentiation ofsynaptic potentials in the motor cortex produced by stimulation ofthe sensory cortex in the cat: a basis of motor learning. Brain Res1987; 413: 360–4.
Sakamoto T, Arissian K, Asanuma H. Functional role of the sensorycortex in learning motor skills in cats. Brain Res 1989; 503: 258–64.
Schacter DL. Implicit knowledge: new perspectives on unconsciousprocesses. Proc Natl Acad Sci USA 1992; 89:11113–7.
Schacter DL, Chiu CY, Ochsner KN. Implicit memory: a selectivereview. Annu Rev Neurosci 1993; 16: 159–82.
Schlaug G, Knorr U, Seitz R. Inter-subject variability of cerebralactivations in acquiring a motor skill: a study with positron emissiontomography. Exp Brain Res 1994; 98: 523–34.
Schmidtke V, Heuer H. Task integration as a factor in secondary-task effects on sequence learning. Psychol Res 1997; 60: 53–71.
Shibasaki H, Sadato N, Lywhkow H, Yonekura Y, Honda M,Nagamine T, et al. Both primary motor cortex and supplementarymotor area play an important role in complex finger movement.Brain 1993; 116: 1387–98.
Squire LR. Memory and brain. New York: Oxford UniversityPress; 1987.
Talairach J, Tournoux P. Co-planar stereotaxic atlas of the humanbrain.Stuttgart: Thieme; 1988.
Weiller C, Juptner M, Fellows S, Rijntjes M, Leonhardt G, Kiebel, Set al. Brain representation of active and passive movements.Neuroimage 1996; 4: 105–10.
Willingham DB, Nissen MJ, Bullemer P. On the development ofprocedural knowledge. J Exp Psychol Learn Mem Cogn 1989; 15:1047–60.
Worsley KJ, Evans AC, Marrett S, Neelin P. A three-dimensionalstatistical analysis for CBF activation studies in human brain [seecomments]. J Cereb Blood Flow Metab 1992; 12: 900–18. Commentin: J Cereb Blood Flow Metab 1993; 13: 1040–2.
Zhang J, Riehle A, Requin J, Kornblum S. Dynamics of single neuronactivity in monkey primary motor cortex related to sensorimotortransformation. J Neurosci 1997; 17: 2227–46.
Zhuang P, Toro C, Grafman J, Manganotti P, Leocani L, Hallett M.Event-related desynchronization (ERD) in the alpha frequencyduring development of implicit and explicit learning.Electroencephalogr Clin Neurophysiol 1997; 102: 374–81.
Received April 22, 1997. Revised March 3, 1998.Accepted June 29, 1998