Embed Size (px)
Citation preview
Experimental Gerontology, Vol. 26, pp. 315-326, 1991 0531-5565/91 $3.00 + .00 Printed in the USA. All rights reserved. Copyright © 1991 Pergamon Press plc
FLOW CYTOMETRIC ANALYSIS OF HUMAN ERYTHROCYTES:
I. PROBED WITH LECTINS AND IMMUNOGLOBULINS
KAROL A. GUTOWSKI 1, JERRY L. HUDSON 2 and DAVID AMINOFF l
'Institute of Gerontology, Department of Biological Chemistry, The University of Michigan, Ann Arbor, Michigan, and 2Beckton-Dickinson, Immunocytometry System, San Jose, California 95131
Abstract - - A recent review (Aminoff, 1988) summarized the evidence for and against our hypothesis for the role of glycophorin in the senescence and clearance of mammalian red blood cells (RBC) from circulation. This hypothesis postulates the loss of sialic acid from RBC surface in two forms: (a) as vesicles containing the sialoglycoprotein glyco- phorin, and (b) as free sialic acid residues from glycophorin molecules remaining on cell surface. In this report we demonstrate the applicability of flow cytometric procedures to explore, at the cellular level, time-dependent changes on RBC surface with change in cell size, and with in vivo age. The RBC are probed with fluorescein isothiocyanate (FITC) labelled lectins and goat anti-human-IgG and -IgM. The relative intensity of fluorescence is correlated to the change in RBC size as measured by forward lightscatter. Reactivity of RBC with FITC-labelled wheat germ agglutinin can be inhibited with either 0.2M N-acetylglucosamine or by removal of sialic acid residues with neuraminidase. The prop- erties of the smallest RBC correspond to those of the oldest RBC in their: (a) decreased reactivity with FITC-labelled lectins that recognize sialic acid residues, wheat germ and Limax flavus agglutinins, and (b) increased reactivity with FITC-labelled goat anti-human- IgG and -IgM. These results are compatible with our glycophorin hypothesis. Moreover, they suggest that the initial loss of sialic acid as glycophorin containing vesicles is grad- ual, while the subsequent step involving the loss of sialic acid residues is rapid and ex- poses multiple disaccharide galactose 13(1-3)N-acetylgalacosaminyl residues. These unmasked disaccharide sites are recognized by autoimmune IgG, IgM, and lectin-like re- ceptors on macrophages resulting in the clearance of senescent RBC from circulation.
Key Words: aging erythrocytes, autoimmune antibodies, cell size, flow cytometry, human, lec- tins, sialidase treatment
INTRODUCTION
THE EVIDENCE for and against our hypothesis for the involvement of glycophorin in the se-
nescence and clearance of human RBC from circulation, at the end of their 120-day
lifespan, recently was published (Aminoff, 1988). The essence of this hypothesis is the
Correspondence to: D. Aminoff, Institute of Gerontology, The University of Michigan, 300 North Ingalls Build- ing, Ann Arbor, MI 48109-2007. (Received 19 December 1989; Accepted 17 April 1990)
315

316 K . A G U T O W S K I ~'t ,t/
time-dependent physiological desialylation of glycophorin on RBC surface with the exposure
of Gal[3(1,3)D-N-Acetylgalactosamine (GalNAc) (galactose [3(l,3)N-acetylgalactosaminyl)
residues. These are recognized by autoimmune IgG, IgM, and by the lectin-like receptors on
macrophages of the reticuloendothelial system responsible for the clearance of the senescent
RBC from circulation. Briefly, the evidence can be summarized as follows:
a. Identification of more galactose oxidase and sialyl transferase (GOST) reactive sites on senescent as compared to young RBC separated on a density gradient (Aminoff et al.,
1981). Detection of GOST sites can be attributed to the loss of covalently-bound sialic acid residues on RBC surface, resulting in exposure of the penultimate galactosyl residues in the senescent RBC. Exposed galactosyl residues are susceptible to both oxidation with galactose oxidase or to resialylation in vitro with liver sialyl transferases. b. Isolation of the GOST sites from RBC by tryptic digestion (Thomas et al., 1981) fol- lowed by adsorption and elution from immobilized peanut lectin (PNA) (Henrich et al.,
1983). Tryptic digestion releases glycopeptides from glycophorin A, but does not affect band 3, the anion exchanger (Steck, 1972). Immobilized PNA was used to isolate those glycopeptides that are free of sialic acid residues and that have the specific disaccharide structure recognized by PNA, namely, GalI3(1,3)GalNAc. More of these disaccharide- containing glycopeptides were isolated from senescent than from young RBC, and there- fore were named senescence factor glycopeptides (SFGs) (Henrich et al., 1983). c. The importance of these SFGs was further highlighted by their significant biological properties; namely, 1) the ability of spleen macrophages to recognize SFGs covalently- bound to fluorescent beads -- with a loss of that recognition upon prior treatment of SFGs with [3-galactosidase from bovine testes (Henrich et al., 1983), and 2) the ability of SFGs to inhibit the adhesion and phagocytosis of senescent RBC by autologous blood monocytes at nanomolar concentrations (Vaysse et al.. 1986).
In the above studies, differential or density gradient centrifugation was used to separate the
least dense (youngest) from the most dense (oldest) RBC (O'Connell et al., 1965; Cooper et
al., 1980). Since density methods of separating young from senescent RBC have been se-
verely criticized (Beutler, 1988), we sought alternative procedures to distinguish young from
senescent RBC. The possibility of using flow cytometry with FITC-labelled lectins and im-
munoglobulins to demonstrate differences between the smallest (oldest) and largest (young-
est) RBC was explored. Preliminary reports of these studies have already appeared (Aminoff
et al. , 1988; Gutowski et al., 1988).
MATERIALS AND METHODS
Reagents
Fluorescein isothiocyanate-labelled lectins were obtained as follows: wheat germ aggluti-
nin (WGA) and peanut agglutinin (PNA) from Sigma Company (St. Louis, MO); Limax f la-
vus agglutinin (LFA) from E.Y. Labs: Fluorescein isothiocyanate-labelled goat antihuman
(GAH)-IgG and GAH-IgM were obtained from Kallestad Diagnostics (Austin, TX). Vibrio
cholerae sialidase came from Calbiochem (San Diego, CA), and N-acetylglucosamine from
Sigma Co. (St. Louis, MO).
Buffers
Phosphate buffered saline (PBS) pH 7.4 was 20 mM phosphate and 0.85% NaCI, (280

THE AGING ERYTHROCYTE 317
mOsmol). Isotonic TRIS buffered saline (ITBS) pH 7.4 was 3 mM TRIS, and 0.875%
NaC1, (275 mOsmol). Osmolalities were measured with a Wescor vapor pressure osmo-
meter.
Equipment
RBC were analyzed on an Epics 541 flow cytometer (Coulter, Hialeah, FL) with a 4-watt
argon laser (coherent) emitting at 488 nm with 600 mW output.
Bleeding and washing procedure. All blood for these studies was drawn by venipuncture
in heparinized vacuum tubes or heparinized syringes from healthy 21- to 23-year-old volun-
teers (three males and two females), and stored at 4°C for less than 12 hours. All donors
signed an informed consent for scientific research statement. Immediately before use, 0.25
ml of the whole blood was centrifuged and the RBC washed three times with 1.25 ml of
PBS to remove plasma while leaving the buffycoat intact. Unless otherwise indicated, the
washed cells were then resuspended in ITBS.
Flow cytometric counting. The flow cytometer was aligned according to Coulter's recom-
mendations using standardized latex beads. Gates were set around the dense area of a for-
ward lightscatter (FLS) vs. 90 ° lightscatter histogram in order to exclude atypical cells.
Fluorescein isothiocyanate (FITC) fluorescence at 530 nm was collected using the MDADS
acquisition system (Coulter). For each sample, 10,000 cells were analyzed.
Osmolality. To determine effects of RBC cell shape on profiles obtained in the flow cy-
tometer, RBC were diluted in saline solutions of different tonicity. The following concen-
trations were tested: 0.87% NaCI (298 mOsmol), 0.78% (270), 0.70% (240), 0.61% (209),
and 0.52% (179). At saline concentrations less than 0.52% the RBC lysed.
Treatment of RBC with FITC-labelled lectins. Fluorescein isothiocyanate-labelled lectins,
0.5 Ixg- of FITC-WGA (2.3 moles FITC per mole protein), FITC-LFA, or FITC-PNA (2.5
moles FITC per mole protein) were added to 5 × 10 7 RBC in 0.50 ml of ITBS and incu-
bated for 45 min at room temperature in the dark and a 2 × 10⁷ RBC/ml suspension was
used for flow cytometric analysis. These lectin concentrations gave optimal RBC labelling
with minimal RBC agglutination. Washed RBC were used as controls for each experiment,
and diluted to 2 x 10⁷ cells per ml in ITBS for analysis in the flow cytometer.
Treatment of RBC with FITC-WGA in the presence of N-acetylglucosamine. 5 × 10⁷
RBC were suspended in 0.2 M N-acetylglucosamine in saline to adjust the tonicity. Cells
then were treated with FITC-WGA as described above.
Treatment of RBC with sialidase prior to addition of FITC-WGA. 1.25 × 10⁸ RBC were
washed with ITBS, then incubated in ITBS containing 1 mM CaCI 2 and 0.003 units of V.
cholerae sialidase (0.24 units/101° RBC as previously specified, Aminoff et al., 1976) at
37 ° for 30 min. Following incubation, RBC were washed with ITBS and incubated with
FITC-WGA as described above.

3 1 8
~U HUf lFtN RED CELL~ F L S v i i I L ~ F
D U E R R L L | p e a k - 4 g g total - 4 0 ~ @ ?
D I S P L R V E D I ~ e a k - 4 ~
K A GUTOWSKI et ,l/
~LS
FIG. 1. Isometric three parameter visualization of the data for RBC labelled with FITC-WGA.
under isotonic conditions relating cell size (FLS), intensity of log green fluorescence (ILGF), and
number of cells. 5 x 10 7 RBC were incubated with 0.5 ixg FITC-WGA; 2 × 10 7 RBC/ml were
analyzed.
Treatment of RBC with FITC-GAH-IgG, and -IgM. 2.5 × 10 5 RBC suspended in 0.1 ml
ITBS were incubated on ice for 1 hour with 2.0 txg FITC-GAH-IgG, or FITC-GAH-IgM,
before examination in the flow cytometer.
RESULTS
This study reports on changes in properties in cell surface with changes in cell size. It has
been well established that RBC cell size decreases with in vivo age in circulation (Canaham,
1969). Cell size is the principal component of the forward lightscatter (FLS) signal. The
relative intensity of fluorescence is an indicator of changes on the cell surface monitored
with the appropriate FITC-labelled probe: lectin or immunoglobulin. Figure 1 illustrates a
typical three parameter histogram of lightscatter, log green fluorescence, and cell numbers
for RBC probed with FITC-WGA. The scattergram with contour lines is the two-dimen-
sional presentation of the same data. Both representations give a general overview of the
flow cytometric data. However, like Dockter and Morrison (1986), we found the mean
channel of fluorescence vs. lightscatter channel plot more informative.
Distribution of red blood cells according to cell size and effect of tonicity
Simultaneous with the decrease in cell size with in vivo age of RBC in circulation, there
is a change in shape -- from a young biconcave ellipsoid cell to that of an almost symmet-

THE AGING ERYTHROCYTE
10
. Q
0 ~
0 10 20 30 40
FLS
F1G. 2. Effect of FITC-WGA on RBC cell distribution. RBC were incubated with (O) or without (O) FITC-WGA as in Figure 1.
319
rical sphere for the oldest (smallest) population of RBC. It therefore was of interest to de-
termine the effect of tonicity, more specifically hypotonicity, on the sphericity of the cell, as
detected by the flow cytometer. Previous investigators have made a great issue of this point
(Kim et al., 1983). Under isotonic conditions, we obtained a monomodal Gaussian distribu-
tion curve for RBC size (Fig. 2). There was little if any significant change in the cell size
distribution curve at tonicities of 298 mOsmol (isotonic) Figure 2, and 240 mOsmol (not
shown). However, at 170 mOsmol, the profile was distorted and the debris from the lysed
cells appeared as smaller particles. Therefore, since isotonic conditions were adequate, we
felt it unnecessary to change the tonicity in subsequent studies.
Effect of addition of FITC-WGA on the RBC cell size distribution
Wheat germ agglutinin is a very strong agglutinating agent. However, under the optimal
conditions used, it imparted a strong fluorescence to the cells without affecting cell size dis-
tribution, indicating the absence of dimers or more complex aggregates of the RBC (Figs. 1
and 2).
Reproducibility of data with FITC-WGA
Figure 3 (A) illustrates the cell size distribution for RBC from five individuals, each de-
termined in triplicate in the presence of the FITC-WGA. Figure 3 (B) shows the mean ILGF
for each of two FLS channels. It is readily apparent that the mean fluorescence channel was
320
40
30
t'-
0 • ~, 6 - I
:9
4
o 2
0
K . A . G U T O W S K I e t ~d
10
10 20 30
i i
20 ,.J
A
10
0 , I i I ,
0 10 20 30
F L S
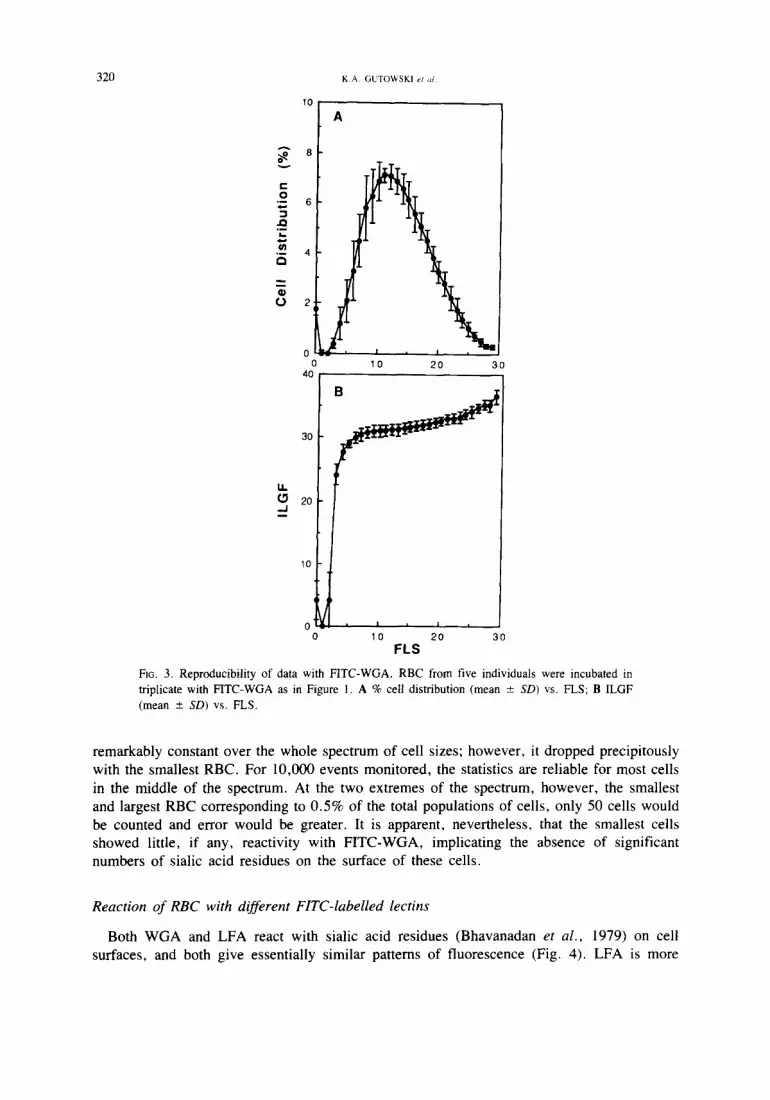
Fie. 3. Reproducibility of data with FITC-WGA. RBC from five individuals were incubated in triplicate with FITC-WGA as in Figure 1. A % cell distribution (mean _+ SD) vs. FLS; B ILGF (mean - SD) vs. FLS.
remarkably constant over the whole spectrum of cell sizes; however, it dropped precipitously
with the smallest RBC. For 10,000 events monitored, the statistics are reliable for most cells
in the middle of the spectrum. At the two extremes of the spectrum, however, the smallest
and largest RBC corresponding to 0.5% of the total populations of cells, only 50 cells would
be counted and error would be greater. It is apparent, nevertheless, that the smallest cells
showed little, if any, reactivity with F ITC-WGA, implicating the absence of significant
numbers of sialic acid residues on the surface of these cells.
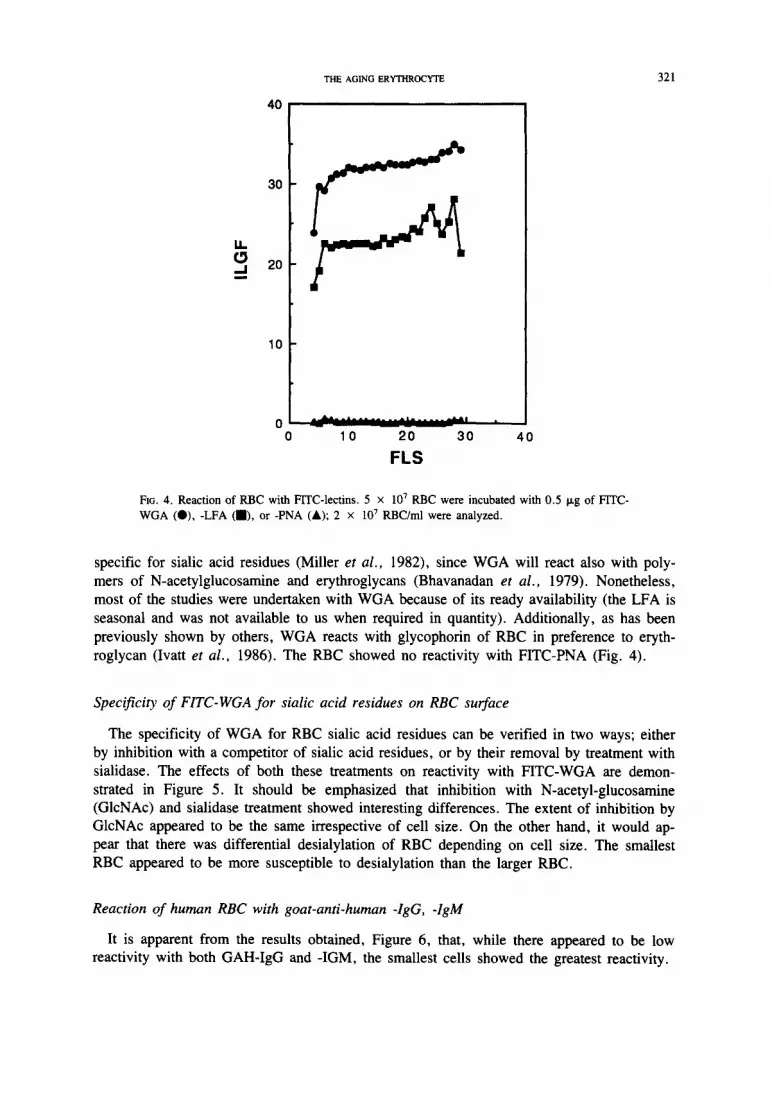
Reaction of RBC with different FITC-labelled lectins
Both W G A and LFA react with sialic acid residues (Bhavanadan et al., 1979) on cell
surfaces, and both give essentially similar patterns of fluorescence (Fig. 4). LFA is more
40
30
10
THE AGING ERYTHROCYTE 321
t ,,.~r,,.abq I 0
0 10 20 30 40
FLS
Fx~. 4. Reaction of RBC with FrrC-lectins. 5 x 10⁷ RBC were incubated with 0.5 Ixg of FITC- WGA (O), -LFA (i), or -PNA (&); 2 x 10 7 RBC/ml were analyzed.
specific for sialic acid residues (Miller et al., 1982), since WGA will react also with poly-
mers of N-acetylglucosamine and erythroglycans (Bhavanadan et al., 1979). Nonetheless,
most of the studies were undertaken with WGA because of its ready availability (the LFA is
seasonal and was not available to us when required in quantity). Additionally, as has been
previously shown by others, WGA reacts with glycophorin of RBC in preference to eryth-
roglycan (Ivatt et al., 1986). The RBC showed no reactivity with FITC-PNA (Fig. 4).
Specificity of FITC-WGA for sialic acid residues on RBC surface
The specificity of WGA for RBC sialic acid residues can be verified in two ways; either
by inhibition with a competitor of sialic acid residues, or by their removal by treatment with
sialidase. The effects of both these treatments on reactivity with FITC-WGA are demon-
strated in Figure 5. It should be emphasized that inhibition with N-acetyl-glucosamine
(GlcNAc) and sialidase treatment showed interesting differences. The extent of inhibition by
GlcNAc appeared to be the same irrespective of cell size. On the other hand, it would ap-
pear that there was differential desialylation of RBC depending on cell size. The smallest
RBC appeared to be more susceptible to desialylation than the larger RBC.
Reaction of human RBC with goat-anti-human -IgG, -IgM
It is apparent from the results obtained, Figure 6, that, while there appeared to be low
reactivity with both GAH-IgG and -IGM, the smallest cells showed the greatest reactivity.

322 K . A G U T O W S K I et a!
40
I.I.
0 ,..I i
30
20
10
0 I A I I
0 10 20 30 40
F L S
FIG. 5. Reaction of human washed RBC with FITC-WGA in the presence of N-acetylglu- cosamine, or with prior sialidase treatment. 5 x 10 7 RBC were incubated with 0.5 Ixg FITC- WGA (0). 1.25 x 10⁸ RBC were incubated in ITBS containing 1 mM CaCI 2 and 0.003 units neuraminidase at 37°C. Following parital desialylation RBC were washed with ITBS and 5 x 10 7 RBC were incubated with FITC-WGA (IS]). 5 x 10 7 RBC were suspended in 0.2M N-acetyl- glucosamine and then incubated with FITC-WGA (Lx). For all conditions 2 x 10 7 RBC/ml were analyzed.
DISCUSSION
We are interested in the cellular and molecular basis of aging. The red cell appears to be
a good model to study. Previous investigations have indicated that in vivo aging of RBC
can, as a first approximation, be correlated with increase in density or decrease in cell size.
The increase in density approach to isolate senescent RBC has had extensive use with de-
creasing confidence in the data obtained. We thought it desirable to attempt an alternative
approach utilizing the change in cell size to explore how far it could be used as a parameter
to designate cell age.
The enormous potential of flow cytometric procedures (FCP) has been demonstrated in
immunology and oncology (Shapiro, 1985; Melamed et al. , 1979). However, application of
FCP to RBC was neglected for many years because of the nonspherical shape of RBC. Early
applications restricted the analysis to the counting of fluorescently labelled cells in the pres-
ence of unlabelled cells, where cell shape could be ignored, that is, detection of fetal RBC
in maternal circulation (Greaves, 1975; Horan, 1981; Medearis et al., 1984), detection of
monoblasts in the blood of thalassemic patients (Rachmilewitz et al., 1978), separation of
malaria-infected from noninfected RBC (Howard et al., 1979; Brown et al., 1981), or de-
tection of reticulocytes in blood (Tanke et al., 1980; 1983; Jacobberger et al. , 1984).
With the demonstration that it was possible to detect differences in cell size of glutaral-
dehyde-treated RBC after isovolumetric-sphering (Kim et al., 1983), it became evident that

THE AGING ERYTHROCYTE 323
u.
0 - i m
60
50
40
30
20
lo !
o 10 20
FLS
30
Fro. 6. Reaction of RBC with FITC-GAH-IgG, and FITC-GAH-IgM. 2.5 x 10 5 RBC in 0.1 ml
were incubated on ice for one hour with 2 p,g FITC-GAH-IgG (O), or FITC-GAH-IgM (&).
FCP could be applied to detect differences between young and senescent RBC taking advan-
tage of differences in their cell size.
Some pioneers did attempt to correlate changes in cell surface parameters with change in
cell size (Jennings et al. , 1985; Dockter et al. , 1986). Fluorescently labelled lectins also had
been used to detect specific sugars on lymphocytes (Stein et al. , 1973; Wiig et al. , 1973;
Kraemer et al. , 1973; Steinkamp et al. , 1974). Since lectins can bind to RBC at low con-
centrations without causing agglutination (Reisner et al. , 1976), it became evident that FCP
could be applied to RBC.
From the results of this study it is apparent that, irrespective of this change in size and
shape as they age in vivo, RBC can be monitored readily by flow cytometry under isotonic
conditions. This makes it possible to follow changes in structural and functional properties
of RBC as a function of size as reflected by FLS.
The approach we found most useful was to plot the mean channel fluorescence vs. cell
size, as previously used (Jennings et al. , 1985; Dockter et al. , 1986). That approach dem-
onstrated the difference between the reactivity of RBC with fluorescent antibody that de-
tected acetylcholinesterase, and eosin-5-maleimide that detected band 3 (the anion exchanger
on RBC), respectively. It is interesting to note that in contrast to band 3, which remained
constant throughout the life span of RBC in circulation irrespective of cell size (Jennings et
al. , 1985), in our studies sialic acid-containing receptors showed a decrease in the smallest
RBC when probed with WGA, thus making them potentially suitable receptors for monitor-
ing RBC senescence. This is especially so, since these smallest cells showed a greater flu-
orescence when probed for the presence of autoimmune antibodies on their cell surface.
Under optimal conditions, it is possible to follow changes in both cell surface sialic acid

324 K.A. GUTOWSKI et a l
on RBC and reactivity with goat-anti-human-IgG, -IgM. It would appear that most of the
RBC, irrespective of cell size, are saturated with FITC-labelled lectins that detect sialic acid
residues (Lovrien e t a l . , 1980). In contrast, the smallest RBC show minimal reactivity with
FITC-WGA and maximal reactivity with autoimmune IgG and IgM as detected with the
FITC-labelled goat-anti-human-IgG, and -IgM. These results are compatible with our hy-
pothesis for the progressive desialylation of covalently-bound sialic acid residues on glyco-
phorin molecules of RBC surface (Aminoff, 1988). Most of the RBC, with their sialic acid
content unchanged on the cell surface, would not be expected to react with FITC-PNA (Fig.
4). The nonreactivity of the smallest RBC with PNA is attributable to the presence of the
autoimmune IgG and IgM [anti-T, the Thomsen-Friedenrich antibody present in all human
sera (Propkop e t a l . , 1969)] on the RBC cell surface, presumably with an anti-[3-galactosyl
specificity.
It is interesting to note that under conditions of partial desialylation, the smallest RBC are
the most rapidly desialylated. This is consistent with the observed apparent precipitous de-
crease in reactivity of the smallest RBC with FITC-WGA. Thus, it would appear that the
sequence of events involves first the decrease in cell size -- due to loss of cell membrane as
vesicles (Weed e t a l . , 1966) -- and only when the cell is small and spherical does it rapidly
lose its sialic acid residues. Simultaneous with this desialylation, the cells acquire autoim-
mune IgG and IgM from the serum.
Thus, it would appear that the smallest RBC could correspond to the oldest RBC by the
criteria previously established, namely a decreased sialic acid, and increased amount of au-
toimmune IgG and IgM (Aminoff, 1988). Compliance with expectations, however, is not
proof. Unfortunately, the studies with the Coulter Epics were curtailed due to circumstances
beyond our control but definitive evidence is forthcoming using Becton-Dickinson FACScan
flow cytometer. Therefore, the applicability of using either flow cytometer to study RBC
can be compared.
CONCLUSIONS
1. RBC surface changes as a function of cell size can be monitored by flow cytometry of
RBC directly and labelled with suitable fluorescent probes.
2. The properties of the smallest RBC correspond to the properties of oldest RBC with re-
spect to:
(a) their nonreactivity with sialic acid-detecting lectins, and
(b) their increased reactivity with autoimmune IgG and IgM.
These observations are compatible with our hypothesis that glycophorin is the putative mol-
ecule on RBC cell surface that shows time-dependent changes, and that it could be respon-
sible for the ultimate clearance of senescent RBC from circulation.
Acknowledgments -- The authors wish to thank Diane E. Brede for her efficient technical assistance in the use of the Coulter Epics 541 flow cytometer, and Stephen Kelley for his software program which facilitated the conversion of the raw data to provide the mean channel of fluorescence vs. FLS curves used extensively in these studies. Stephen Kelley is currently at the cytometry laboratories of Purdue University Cancer Center. We gratefully appre- ciate the many helpful discussions we have had with Drs. Curt Hanson, Robert Todd, and Geneva Ornann, and secretarial assistance of Ms. Fran A. Gruda. This research was supported by the National Institute of Health grant #AG 08018.

Tr~ ACING F~Y'rrmocrr~ 325
REFERENCES
AMINOFF, D., BELL, W.C., FULTON, I., and INGEBRIGTSEN, N. Effect of sialidase on the viability of eryth-
rocytes in circulation. Amer. J. Hemat. 1, 419--432, 1976.
AMINOFF, D., GHALAMBOR, M.A., and HENRICH, C.J. GOST, galactose oxidase and sialyl transferase sub-
strate and receptor sites in erythrocyte senescence: In: Erythrocyte Membranes 2: Recent Clinical and Experi-
mental Advances, Kruckeberg, W.C., Eaton J.W., Brewer, G.J. (Editors), pp. 269-278, Alan R. Liss, Inc.,
New York, 1981.
AMINOFF, D. The role of sialoglycoconjugates in the aging and sequestration of red cells from circulation. Blood
Cells 14, 229-257, 1988.
AMINOFF, D., GUTOWSKI, K.A., BREDE, D.E., and HUDSON, J.L. Flow cytometric analysis of human
erythrocytes prob~l v~h FITC-labelled lectins. In: Proceedings of Japanese-German Symposium on Sialic Acids,
Schauer, R., and:'¥~llaakawa, T. (Eds.), pp. 224-225. Kieler Verlag Wissenschaft Bildung, Kiel, 1988.
BEUTLER, E. The relationship of red cell enzymes to red cell life span. Blood Cells 14, 69-75, 1988.
BHAVANADAN, V.P. and KATLIC, A.W. The interaction of wheat germ agglutinin with sialoglycoproteins. The
role of sialic acid. J. Biol. Chem. 254, 4000--4008, 1979.
BROWN, G.V., BATTYE, F.L., and HOWARD, R.J. Separation of stages of Plasmodium falciparum infected
cells by means of a fluorescence-activated cell sorter. Biol, Abstr. 71, 7922, 1981.
CANHAM, P.B. Differences in geometry of young and old human erythrocytes explained by a filtration mecha-
nism. Circ. Res. 25, 39--45, 1969.
COOPER, A.J. and PERRY, S. The applicability of freeze-thaw percoll gradients to whole cell isopycnic fraction-
ations: Preliminary results. J. Immunol. Meth. 37, 353-361, 1980.
DOCKTER, M.E. and MORRISON, M. Paroxysmal nocturnal hemoglobinuria erythrocytes are of two distinct
types: Positive or negative for acetylcholinerase. Blood 67, 540-543, 1986.
GREAVES, M.F. Clinical applications of cell surface markers. Progress in Hematol. 9, 255-303, 1975.
GUTOWSKI, K.A., BREDE, D.E., HUDSON, J.L., and AMINOFF, D. Flow cytometric analysis of human
erythrocytes probed with FITC-labelled lectins and immunoglobulins. Glycoconjugate J. 5, 355, 1988.
HENRICH, C.J. and AMINOFF, D. Isolation and characterization of a glycopeptide from human senescent eryth- rocytes. Carbohydr. Res. 120, 55-66, 1983.
HORAN, P.K. Hematology: Single-cell analysis enters the space age. Diagnostic Medicine, October, 63-85, 1981.
HOWARD, R.J. and RODWELL, B.J, Babesia rodhaini, Babesia bovis, and Babesia bigemina. Analysis and sort-
ing of red cells from infected mouse or calf blood by flow fluorometry using 33258 Hoechst. Biol. Abst. 69, 5637, 1979.
IVATT, R.J., HARNET1 ~, P.B., and REEDER, J.W. Isolated erythroglycans have a high-affinity interaction with
wheat germ agglutinin, but are poorly accessible in situ. Biochim. Biophys. Acta 881, 124-134, 1986.
JACOBBERGER, J.W., HORAN, P.K., and HARE, J.D. Flow cytometric analysis of blood cells stained with the
cyanine dye DiOC~[3]: Reticulocyte quantification. Cytometry $, 589-600, 1984.
JENNINGS, L.K., BROWN, L.K., and DOCKTER, M.E. Quantitation of protein 3 content of circulating eryth- rocytes at the single cell level. Blood 65, 1256--1262, 1985.
KIM, Y.R. and ORNSTEIN, L. Isovolumetric sphering of erythrocytes for more accurate and precise cell volume measurement by flow cytometry. Cytometry 3, 419--427, 1983,
KRAEMER, P.M., TOBEY, R.A., and VAN DILLA, M.A. Flow microfluorometric studies of lectin binding to mammalian cells. I. General Features. J. Cell Physiol. 81, 305-314, 1973.
LOVRIEN, R.E. and ANDERSON, R.A. Stoichiometry of wheat germ agglutinin as a morphology controlling
agent and as a morphology protective agent for the erythrocyte. J. Cell Biol. 85~ 534-548, 1980.
MEDEARIS, A.L., HENSLEIGH, P.A., PARKS, D.R., and HERZENBERG, L.A. Detection of fetal erythrocytes
in maternal blood post parmm with the fluorescence-activated cell sorter. Am. J. Obstet. Gynecol. 145, 290- 295, 1984.
MELAMED, M.R., MULLANEY, P.F., and MENDELSOHN, M.L. (Ed.). Flow Cytometry and Sorting. John Wiley & Sons, New York, 1979.
MILLER, R.L., COLLAWN, J.F., and FISH, W.W. Purification and macro-molecular properties of a sialic acid- specific lectin from the slug Limax flavus. J. Biol. Chem. 257, 7574-7580, 1982.
NAGATA, Y. and BURGER, M.M. Wheat germ agglutinin. Isolation and crystallization. J. Biol. Chem. 246, 2248-2250, 1972.
O'CONNELL, D.J., CARUSO, C.J., and SASS, M.D. Separation of erythrocytes of different ages. Clin. Chem. 11, 771-781, 1965.

326 K.A. GUTOWSKI et a/
PROKOP, O. and UHLENBRUCK, G, (Eds.). Human Blood and Serum Groups. Translated b 3 J.[,. Raven, 2nd.
ed. pp. 103-110, Maclaren & Sons, Ltd., 1969.
RACHMILEWITZ, E.A. and THORELL, B. Characterization of the normoblast population in [3-thalassemic blood
by rapid-flow cytofluorometry. Scand. J. Haematol. 20, 440---446, 1978.
REISNER, Y., LIS, H., and SHARON, N. On the importance of the binding of lectins to cell surface receptors at
low lectin concentrations. Expt. Cell Res. 97, 445-448, 1976.
SHAPIRO, H.M. Practical Flow Cytometry. Alan R. Liss, Inc., New York, 1985.
STECK, T.L. The organization of proteins in human erythrocyte membranes. In: Membrane Research, Fox, C.F.
(Ed.), pp. 71-93, Academic Press, New York, 1972.
STEIN, G., FLAD, H.D., PABST, R., and TREPEL, F. Separation of human lymphocytes by fiee-flow electro-
phoresis. Biomedicine. 19, 388-391, 1973.
STEINKAMP, J.A. and KRAEMER, P.M. Flow microfluorometric studies of lectin binding to mammalian cells, lI
Estimation of the surface density of receptor sites by multiparameter analysis. J. Cell Physiol. 84, 197-204,
1974.
TANKE, H.J., NIEUWENHUIS, I.A.B., KOPER, G.J.M., et al. Flow cytometry of human reticulocytes based on
RNA fluorescence. Cytometry. 1, 313-320, 1980.
TANKE, H.J., ROTHBARTH, P.H., VOSSEN, J.M.J.J., et al. Flow cytometry of reticulocytes applied to clinical
hematology. Blood 61, 1091-1097, 1983.
THOMAS, D.B. and WINZLER, R.J. Structural studies on human erythrocyte glycoproteins Alkali-Labile oli-
gosaccharides. J. Biol. Chem. 244, 5943-5946, 1969.
VAYSSE, J., GATTEGNO, L., BLADIER, D., and AMINOFF, D. Adhesion and erythrophagocytosis of human
senescent erythrocytes by autologous monocytes and their inhibition by [3-galactosyl derivatives. Pro~. Natl.
Acad. Sci. U.S.A. 83, 1339-1343, 1986.
WEED, R.I. and REED, C.F. Membrane alterations leading to red cell destruction. Amer. J. Med. 41, 68t-698,
1966.
WIIG, J.N. and THUNOLD, S. Electrophoresis of lymphoid cells. Characterization of human B and T cells in
peripheral lymphoid tissues. Clin. Expt. Immunol. 15, 497-506, 1973.


