Embed Size (px)
Citation preview
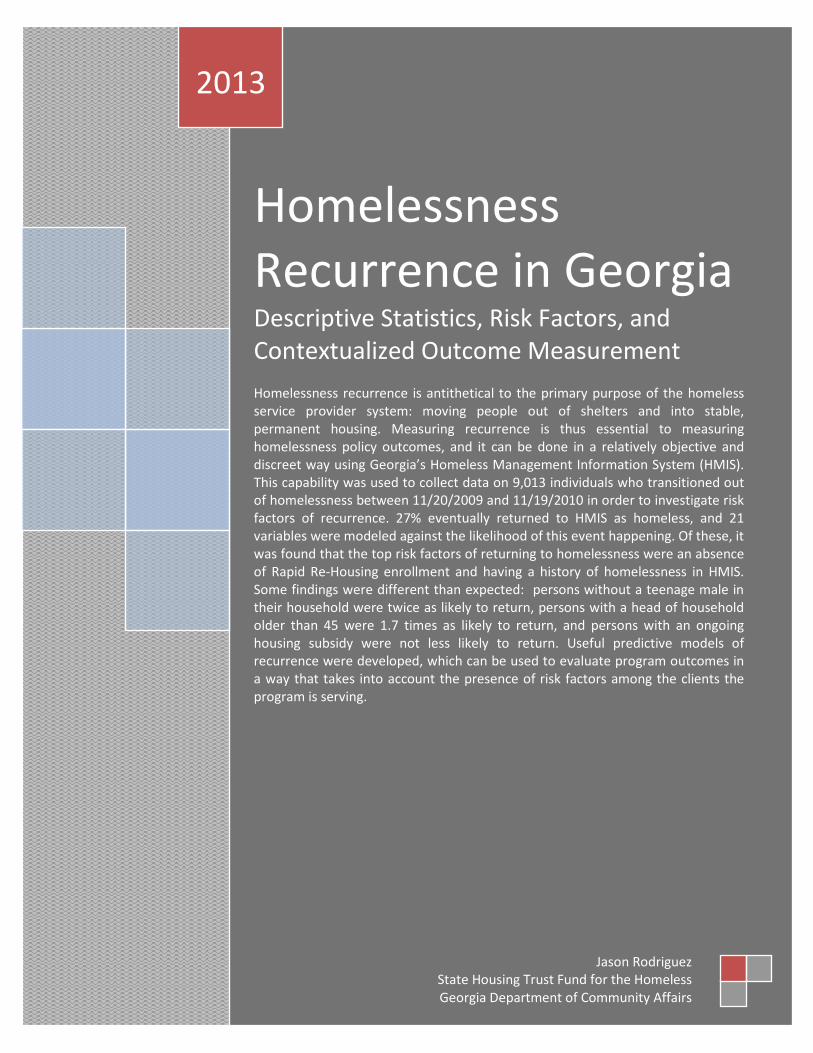
Homelessness Recurrence in Georgia Descriptive Statistics, Risk Factors, and Contextualized Outcome Measurement Homelessness recurrence is antithetical to the primary purpose of the homeless service provider system: moving people out of shelters and into stable, permanent housing. Measuring recurrence is thus essential to measuring homelessness policy outcomes, and it can be done in a relatively objective and discreet way using Georgia’s Homeless Management Information System (HMIS). This capability was used to collect data on 9,013 individuals who transitioned out of homelessness between 11/20/2009 and 11/19/2010 in order to investigate risk factors of recurrence. 27% eventually returned to HMIS as homeless, and 21 variables were modeled against the likelihood of this event happening. Of these, it was found that the top risk factors of returning to homelessness were an absence of Rapid Re-Housing enrollment and having a history of homelessness in HMIS. Some findings were different than expected: persons without a teenage male in their household were twice as likely to return, persons with a head of household older than 45 were 1.7 times as likely to return, and persons with an ongoing housing subsidy were not less likely to return. Useful predictive models of recurrence were developed, which can be used to evaluate program outcomes in a way that takes into account the presence of risk factors among the clients the program is serving.
2013
Jason Rodriguez State Housing Trust Fund for the Homeless Georgia Department of Community Affairs


Acknowledgements
There were many people who made this study on homelessness recurrence possible through their invaluable help and advice. The relative risk models and predictive models in this study were developed under the guidance of Dr. Louise Lawson as part of a course on Categorical Data Analysis. I would also specifically like to recognize Bob Lenhard, Tony Zhang, Dr. Ehren Stover-Wright, Jonathan Cox, Christy Hahn, Tina Moore, Kyle Harris, and Olabisi Omole for their contributions.
About the Author
Jason Rodriguez is a data analyst at the Georgia Department of Community Affairs, where he has been since December 2010. He holds a Bachelor’s of Science in Sociology from Kennesaw State University and is currently a graduate student in the Master of Science in Applied Statistics program at Kennesaw State University.
Contents
Introduction .................................................................................................................................................. 1
Background ............................................................................................................................................... 2
Hypotheses ............................................................................................................................................... 4
Methods ........................................................................................................................................................ 4
Data Retrieval............................................................................................................................................ 4
Variables ................................................................................................................................................... 6
Sample Characteristics .............................................................................................................................. 7
Statistical Procedures ................................................................................................................................ 8
Results ........................................................................................................................................................... 8
Relative Risks of Returning to Homelessness ........................................................................................... 8
Predictive Modeling ................................................................................................................................ 11
Application: Evaluating Programs using Context-Driven Measures .......................................................... 12
Discussion.................................................................................................................................................... 16
Limitations .................................................................................................................................................. 19
Conclusion ................................................................................................................................................... 20
Works Cited
Appendix A: Tables
Appendix B: Maps
Homelessness Recurrence in Georgia:
Descriptive Statistics, Risk Factors, and Context-Driven Outcome Measurement
Introduction What are the best ways data can be used to evaluate the success of a homelessness program?
No method is perfect, but a common one has been to count how often clients go to a permanent housing destination at the end of their stay. This permanence is anticipated rather than observed, because the information is collected at the time of client discharge from the program. Therefore, it is not surprising that many clients placed in “permanent” housing become homeless again shortly afterward. Taking this recurrence into account could lead to more accurate performance measures, which would better inform policy. Consequently, this study's first goal was to develop a credible data collection procedure for the Georgia Department of Community Affairs (DCA).
Fortunately, this is possible with Georgia’s Homeless Management Information System (HMIS). There are incidental advantages to extracting data from HMIS instead of relying on another mode of data collection, such as surveying service providers. An important one is that it reduces the potential for human error, because it allows recurrence to be recorded indirectly. Since Georgia’s HMIS has statewide coverage, a person can leave a shelter in South Georgia and walk into a shelter in Atlanta, all the while being under the umbrella of the same database – which makes it easy to recognize the connection between the two events, even if the shelters are not in contact with one another. This way of collecting data is more "blind," and thus more objective and consistent, than having service providers submit recurrence data directly.
While this study utilizes this measuring procedure to learn more about basic homelessness recurrence trends in Georgia, its primary focus is to investigate several potential risk factors of recurrence, based on findings from previous studies and suggestions from colleagues. One of these potential risk factors is the type of program the client was most-recently enrolled in – whether Emergency Shelter, Transitional Housing, or Rapid Re-Housing. The Rapid Re-Housing model is new to Georgia, but there are now enough data to assess its initial effectiveness compared to other approaches. This in particular is important information for Georgia to have as it considers how much to invest in this new approach in the years to come. Knowing other risk factors of recurrence could prove valuable as well. It could help service providers know which former clients to target for follow-up services, or it could convince policymakers to direct extra assistance to specific subpopulations that are more at risk. More fundamentally, the findings presented here could inform research into other aspects of homelessness. In some ways, returning to homelessness is analogous to becoming homeless for the first time, and the relative practicality of observing returns makes it an attractive object of study for research related to homelessness initiation. Describing the nature of homelessness recurrence could thus provide insights into causes of homelessness.
1
Although simple relative risk analysis is useful for descriptive purposes, it is inadequate for inferring causes or making predictions. A trend is not always what it seems, and variables underneath the surface could be more directly related to recurrence than the variable being analyzed is. For example, is an observed difference in outcomes among program types a reflection of the relative effectiveness of certain program types, or is it simply a reflection of the different types of clientele that the programs are serving? Multivariate modeling provides an additional layer of analysis that can control for many of these confounding factors, allowing us to better isolate the actual causal effect of a particular risk factor.
Additionally, multivariate models can be used as predictive models. Knowing the cumulative effect that several variables have on the likelihood of recurrence enables us to predict the likelihood of recurrence for an individual person. Depending on how confident we are in making this prediction, we can then use this ability to estimate expected recurrence rates for groups of people – such as a group of people coming from the same homelessness program. The result, this paper proposes, can be used to develop a “context-driven” outcome measurement that describes the comparative effectiveness of a program far better than a simple recurrence rate does.
Background There are not many scholarly studies on the subject of homelessness recurrence – alternatively
called “return,” “recidivism” or “reentry,” or alluded to sometimes in studies of “homeless careers.” The few that exist are fairly old, the most recent being from 2000. Although social and political circumstances have changed considerably over the past thirteen years, some predictors have been found to be highly significant in the past and would be good to include in a contemporary study of homelessness. In their sample of 331 individuals in Minneapolis, Piliavin et al. (1996) found that being female and having a shorter employment history were both significantly predictive of returning to homelessness. While it was not a significant predictor, their study also tested for independent versus dependent forms of exit from a homeless program – the latter referring to when a person leaves homelessness to stay in housing that is not her own, such as a family member’s or a friend’s. Other non-significant predictors they found were race, whether or not the person lived alone, and whether or not she had previously been homeless. Sosin, Piliavin, & Westerfelt (1990) conducted a six-month panel study of homeless persons in a Midwest city, in which they also tested the effect of prior homeless episodes on recurrence. They modeled two forms of this predictor – a two-level and a multilevel – using a sample of 265 individuals; neither was statistically significant.
Dworsky & Piliavin (2000) kept track of 479 formerly homeless persons from 1991 through 1993 and found in their bivariate analysis that four predictors were significantly associated with returns to homelessness: being doubled-up, living in a single room occupancy (SRO) unit, not receiving housing assistance, and having a prior history of homelessness. Most variables were not associated with returns to homelessness: gender, having children, race, age, length of time homeless, education level, health, alcohol dependence, drug dependence, mental health, being a recipient of Aid to Families with Dependent Children (AFDC), being a recipient of help from a social service worker, and being a recipient
2
of Supplemental Security Income (SSI). Of these, only gender and prior homelessness could be tested here because other data elements were not available.
A study by Wong, Culhane, & Kuhn (1997) drew data on 24,627 families from the New York City Family Shelter System database (HOMES) and analyzed predictors of household hazard rates of readmission. While here I test individuals only, it is likely that the same predictors influence homelessness recurrence at both the individual and household levels. This study was similar in that it relied on a database rather than waves of sample gathering. The researchers found that being African-American, being Hispanic, having a younger head of household, having a greater number of adults in the family, having a greater number of children in the family, being pregnant, being a public assistance recipient, and being discharged to subsidized housing were associated with a higher risk of recurrence. The household’s length of stay in the shelter program, single motherhood, and season of discharge were not associated with an increased likelihood of recurrence. Several of their variables, or related variables, are available in Georgia’s HMIS to collect and test: race, ethnicity, subsidized housing outcomes, length of stay in the program, the presence of children, the presence of adults, and age of the head of household.
At a semiannual conference hosted by the National Human Services Data Consortium, Stover-Wright (2012) presented a paper on predictors of homelessness recurrence, using data on 14,508 clients who exited Iowa’s statewide HMIS to non-homeless housing destinations in 2010. The author tested whether clients returned to homelessness the following year, and whether certain variables had any influence on the likelihood of them doing so, using phi correlation as a measure of statistical significance and effect size. The findings were inconclusive; none of the variables were found to have a statistically significant correlation with the event of homelessness recurrence. These included: having been enrolled in HMIS during 2008-2009, having no income, having improved income, having at least a high school education, having improved education, being a veteran, being a victim of domestic violence, having an addiction to drugs or alcohol, having a physical disability, having a mental health disability, being employed, having at least one other household member, being female, being a member of a racial minority, being married, being Hispanic, and having stayed in a “place not meant for habitation” prior to program entry. Likewise, program type had no significant effect on recurrence likelihood. In its mode of data collection and its sample size, the present study has more in common with Stover-Wright’s than with other studies cited, but there were key differences – namely, a different calculation of the recurrence indicator and my use of logistic regression to evaluate relationships among variables. Only six of his predictors were included this study due to a relative lack of data availability in Georgia’s HMIS.
An emerging point of interest among homeless advocates in recent years has been the comparative effectiveness of the Rapid Re-Housing program model. The amount of research is thin, but promising outcomes have been measured so far as a result of the Homelessness Prevention and Rapid Re-Housing Program (HPRP), funded under the 2009 American Recovery and Reinvestment Act. In its first year, HPRP reduced demand for transitional housing, decreased the average amount of time that families were homeless, and significantly reduced recurrence rates in a handful of communities in the United States – some of which include major urban centers, such as Cincinnati and Houston (NAEH 2012b). An analysis by Focus Strategies & Kate Bristol Consulting (2011) found that, out of 66
3
households that were placed in housing by mid-2012 through the Rapid Re-Housing component of San Jose’s HPRP program, 11% returned to homelessness. Although the number of returning households was too small to parse with much confidence, these were less likely to be households with children and, on average, had a smaller household size and shorter length of stay in the program than households that did not return. In its 2010 Annual Homelessness Assessment Report, the U.S. of Housing and Urban Development (2011) estimated that, out of 160,081 homeless persons served nationwide in Federal Fiscal Year 2010 by the Rapid Re-Housing component of HPRP, 90.5% were placed in permanent housing at the end of their program enrollment – a very high success rate that could foreshadow low recurrence rates down the road. Stover-Wright (2012) found that Iowa’s Rapid Re-Housing programs had stronger negative associations with recurrence than any other program type, although this association was not statistically significant. While patchwork, these findings are consistent in their validation of Rapid Re-Housing compared to other program paradigms. This provides reason to believe that Rapid Re-Housing programs might have produced similar results in Georgia.
Hypotheses In October 2012, staff at DCA met to discuss their research interests and assumptions about the
risk factors of homelessness recurrence. It was hypothesized that each of the following attributes make a formerly homeless person more likely to return to homelessness: having stayed for a shorter amount of time in a housing program (regardless of program type); having last stayed in a program that did not have a Rapid Re-Housing paradigm; having left the program for either unsubsidized, “temporary,” or dependent housing; having a disabling condition; having had more than one homeless occurrence in the Georgia HMIS system; being unaccompanied; being in a household with only one adult, including self; being in a household with no children; being in a household with a teenager, especially if the teenager is male; being in a household headed by someone older; being male; being Non-White, particularly African-American; being Non-Hispanic; being a veteran; and having left from a program located in Georgia’s less-urban areas. This study investigates the degree to which these were individually predictive of homelessness recurrence, and the degree to which there was a cumulative effect that could be summarized in a model. Staff anticipated that the final model would include terms more oriented around program enrollment and household characteristics than demographic or geographic characteristics.
Methods
Data Retrieval This study assumes two basic units of identification: clients and program enrollments. For the purposes of this paper, a client is a person who enters into a homeless shelter or other facility and consents for his information to be logged into the HMIS system by an employee of that facility – a process called program enrollment. If it is the client’s first-ever program enrollment in HMIS, the database generates a “client key” that will be used to identify him during current and future program enrollments. At this time, he is also assigned a “program enrollment key,” which is meant to identify his
4
current program enrollment and which will expire once he is discharged somewhere else. Consequently, one client key is often associated with multiple program enrollment keys, but not vice-versa.
For years, DCA and other governmental organizations in Georgia have been contracting with a non-profit organization called Pathways Community Network, Inc. (Pathways) to collect and manage information associated with homeless clients and program enrollments as part of one HMIS, which, at the time of this study, exists as a relational Oracle database. Analysts who have the appropriate permissions can access a day-old copy of this data remotely. Using this capability, one can easily identify a “recurrent homeless enrollment,” defined here as a two-stage event wherein a client is discharged from a program to a non-homeless destination and is then associated with a “homeless” program enrollment at some point afterward. For any given program enrollment ending in a non-homeless housing outcome, one can take note of the “exit date” and determine if the associated client key ever reappears in the system from that point onward. If it does, and if its new program enrollment is identified as homeless (some are merely seeking services but are not technically homeless), then the older enrollment is flagged as having eventually resulted in a recurrent homeless enrollment.
How soon does a housed client need to return to homelessness for it to be considered a “recurrent” enrollment? The HEARTH Act of 2009 pays special attention to people who return to homelessness within two years of leaving (§ 424), so it is consistent with national precedent to limit the analysis of this paper to recurrence within a two-year window. There is a practical reason to do this as well: Keeping track of returns to homelessness is not merely a descriptive exercise, but a way of evaluating the credibility of “permanent” housing outcomes. The further removed a recurrent episode is from the initial program outcome, the less it implies about that outcome’s efficacy. Capping the window at two years keeps the analysis relevant and retains its usefulness as an evaluation of program, agency, or CoC performance.
After settling on this definition, I obtained a sample of program enrollments that had ended with a “non-homeless” outcome. As a homeless client leaves a program, a case worker or data entry clerk is expected to record additional information into HMIS, including the destination to which the client is going. The destination is limited to a set of close-ended HUD-specified answers from which the case worker can choose via an HMIS user interface, and I grouped these answers into four categories: permanent, temporary, homeless, and other. If the answer could be categorized as permanent or temporary, then the enrollment was considered to have ended with a non-homeless outcome.
Using the “RODBC” package1 for R software (2012), I retrieved all program enrollments with non-homeless outcomes, along with various client and enrollment characteristics. The database copy is updated every night and only includes three years’ worth of data up to the present; consequently I was not able to decide beforehand the time frame which my study would analyze. Since 11/21/2012 was when I queried the final dataset, this meant that I would be testing for returns to homelessness that occurred between 11/20/2010 and 11/19/2012 among clients who exited a program between 11/20/2009 and 11/19/2010. I had already decided that the outcome event was a return to
1 http://cran.r-project.org/web/packages/RODBC/RODBC.pdf
5
homelessness within two years, so it was necessary to ensure that every client in the sample was given a full chance to experience it.
Other methods were used to add some additional variables. Geographic attributes for homeless service providers were obtained from a DCA database and attached to client enrollments associated with these service providers. To determine whether or not someone had ever appeared in HMIS as homeless before (a key variable) I needed to contact Pathways directly and obtain a list of all past client keys, going back to the launch of their HMIS user interface in 1999. Both of these datasets were then merged with my original dataset.
Variables Data were collected on 23 variables, which can be grouped into five categories: program
enrollment, client demographic, client household, geographic, and recurrence characteristics (Table A.1). “Disabling condition” is defined as “a diagnosable substance abuse disorder, serious mental illness, developmental disability, post-traumatic stress disorder, cognitive impairment resulting from a brain injury, or chronic physical illness or disability” (HEARTH Act of 2009 § 401), and service providers presumably assigned “disabling condition” statuses with this definition in mind. Some of the variables were modified from their original form to make analysis easier. Program types were reduced to three primary types that were of interest – Emergency Shelter, Transitional Housing, and HPRP programs – while the rest were consolidated into “Other.” The HPRP program type was renamed “Rapid Re-Housing,” because this sample’s HPRP enrollments were comprised solely of people who initially entered a program with a “literally homeless” housing status; DCA staff considers this to be a highly reliable method of distinguishing Rapid Re-Housing from Prevention services among Georgia’s HPRP programs. Several racial categories were grouped into “Other or Multi-Racial” due to low counts. The destinations of clients were grouped in three different ways: permanent versus temporary, subsidized versus unsubsidized, and independent versus dependent (Table A.2).
The outcome variable – a recurrence indicator – was retrieved iteratively for each program enrollment in the sample. A client who reappeared in HMIS as homeless within at least two years of her initial exit date was considered “recurrent.” In addition to the indicator, the program entry date of the future homeless enrollment was collected, from which the past exit date was subtracted to obtain the number of days it took the client to return to homelessness.
An issue that emerged was that there were 146 households with no adults. This does happen in the population; however, it is probably much more common for a data entry clerk to enroll a child into a program and forget to add the child into an already-existing household, making it appear as if the child was unaccompanied. The same can happen with groups of children, namely siblings, such that they are mistakenly shown as not associated with any adults. This and the relative scarcity of adult-less households in the sample suggested to me that unaccompanied children should be omitted from the analysis of some household variables.
The geographic variables were created manually by assigning a county to each homelessness agency (or program, if the agency had a presence in multiple counties). Since agencies and programs are
6
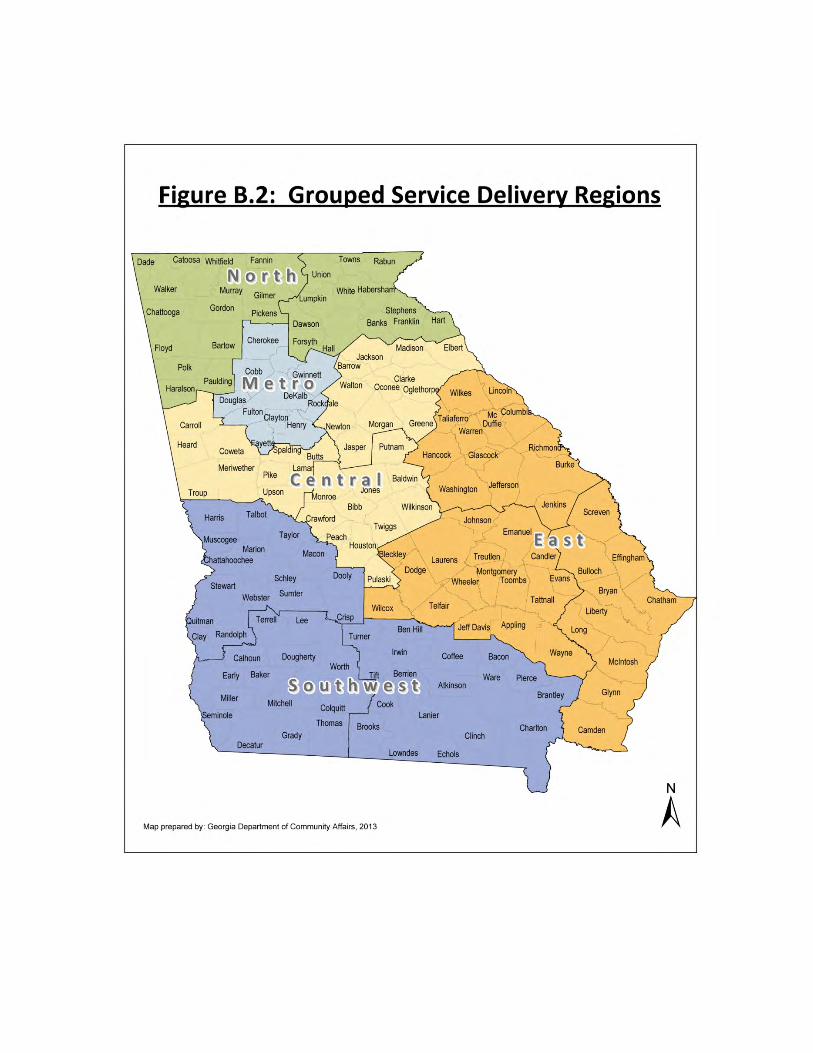
associated with enrollments in HMIS, I was then able to link each enrollment with a county or with aggregations of counties. “Region” originally consisted of twelve categories, each representing one of DCA’s State Service Delivery Regions (Figure B.1) – but because that seemed like too many, they were grouped into five super-regions based on which were adjacent to one another on a map (Figure B.2). Since CoCs are politically distinct from one another, they were not similarly aggregated. Counties were classified as “rural” based on the HUD definition (HEARTH Act of 2009 § 491).
In this paper, duration of program enrollment will always be mentioned in the context of the different program types, because in most cases the length of time a client is allowed to stay in a program is determined by that program’s structure. Enrollment durations took the values of “short” and “long,” which were relative only to other enrollments associated with that same program type. Because of this setup, I assumed interaction between program type and duration during the modeling.
Sample Characteristics In the original sample, there were 9,013 observations. Half of all enrollments were from
Emergency Shelter programs; predictably, relatively few were from Rapid Re-Housing programs, which were experimental at the time. Most enrollments ended in an unsubsidized, permanent, and independent destination, and were especially short in duration among Emergency Shelter enrollments. The sample was very evenly split between males and females, and a majority was African-American. Hispanic and veteran proportions were very small. Overwhelmingly, enrollments took place in non-rural areas, localizing around Metro Atlanta in particular. The two CoCs with the largest shares of enrollments during the time period was the Balance of State CoC (152 urban and rural counties) and the Tri-Jurisdictional CoC (Tri-J; i.e., DeKalb County, Fulton County, and the City of Atlanta).
Two-thirds of enrollments belonged to clients who had never before been identified by the Georgia HMIS system as homeless. While this is an imperfect attempt to measure which clients had ever experienced a homeless episode, it does have a reasonable expectation of accuracy given the focus by Pathways on maintaining accurate and non-redundant client keys and given the acceptable HMIS participation rate among Georgia’s providers. It might be expected to be a less-accurate measure in rural areas, where there are not many homeless service providers and consequently few who can enroll people into HMIS. However, the rural proportion of the sample was very small (less than 8%).
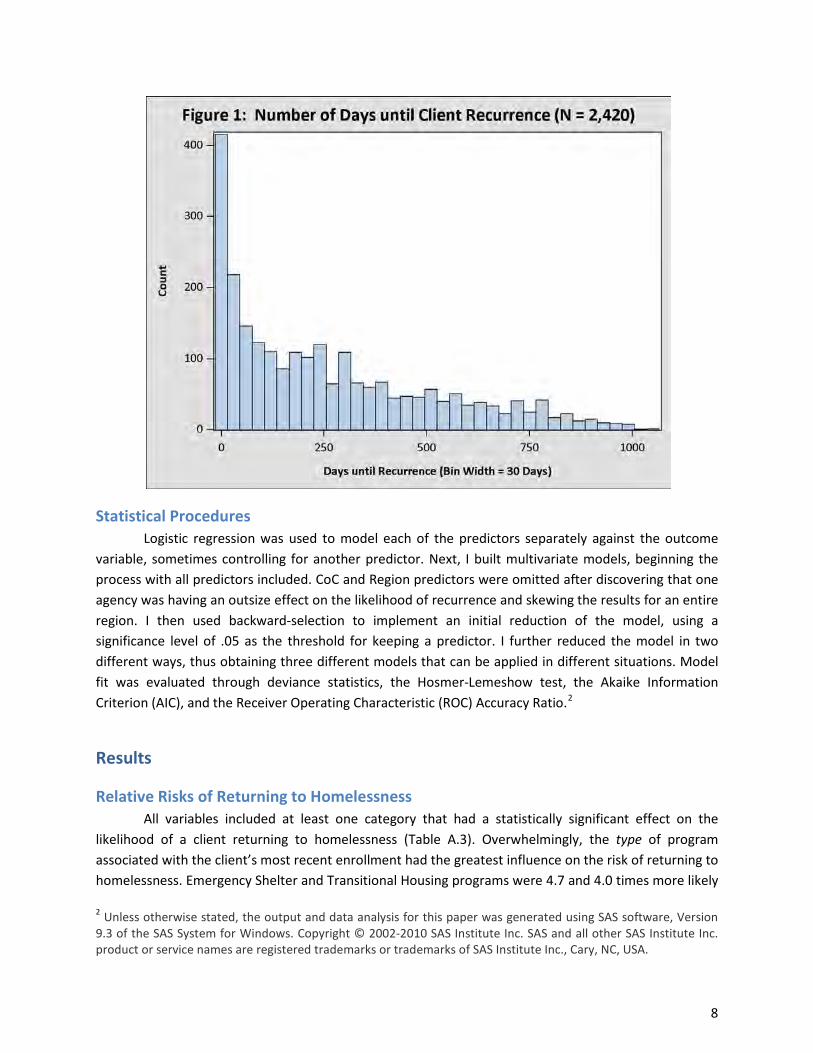
Altogether, 27% of enrollments resulted in homelessness recurrence within two years. For those 2,420 observations, the swiftness of return was recorded. This passage of time is depicted in Figure 1, where clients are grouped according to 30-day bins. A large number of people returned to homelessness within the first 30 days of leaving the program, and their return could be considered a continuation of the same “homeless episode” under some definitions of the term.
7
Statistical Procedures Logistic regression was used to model each of the predictors separately against the outcome
variable, sometimes controlling for another predictor. Next, I built multivariate models, beginning the process with all predictors included. CoC and Region predictors were omitted after discovering that one agency was having an outsize effect on the likelihood of recurrence and skewing the results for an entire region. I then used backward-selection to implement an initial reduction of the model, using a significance level of .05 as the threshold for keeping a predictor. I further reduced the model in two different ways, thus obtaining three different models that can be applied in different situations. Model fit was evaluated through deviance statistics, the Hosmer-Lemeshow test, the Akaike Information Criterion (AIC), and the Receiver Operating Characteristic (ROC) Accuracy Ratio.2
Results
Relative Risks of Returning to Homelessness All variables included at least one category that had a statistically significant effect on the likelihood of a client returning to homelessness (Table A.3). Overwhelmingly, the type of program associated with the client’s most recent enrollment had the greatest influence on the risk of returning to homelessness. Emergency Shelter and Transitional Housing programs were 4.7 and 4.0 times more likely
2 Unless otherwise stated, the output and data analysis for this paper was generated using SAS software, Version 9.3 of the SAS System for Windows. Copyright © 2002-2010 SAS Institute Inc. SAS and all other SAS Institute Inc. product or service names are registered trademarks or trademarks of SAS Institute Inc., Cary, NC, USA.
8
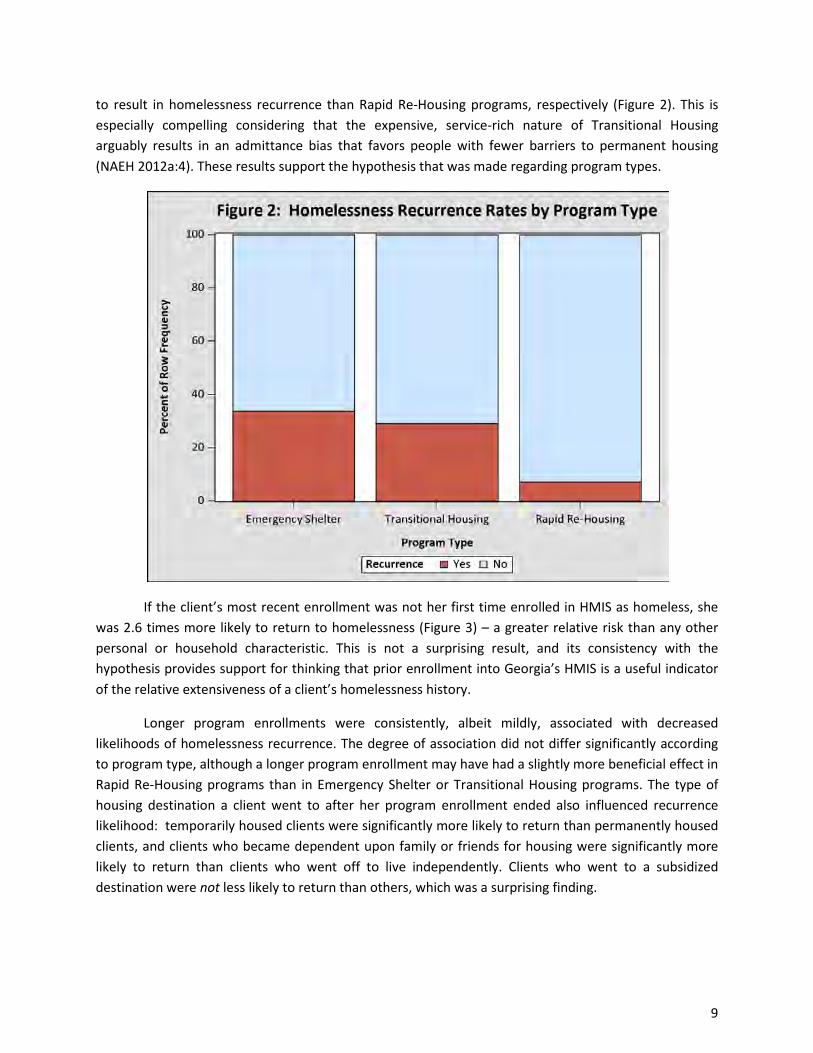
to result in homelessness recurrence than Rapid Re-Housing programs, respectively (Figure 2). This is especially compelling considering that the expensive, service-rich nature of Transitional Housing arguably results in an admittance bias that favors people with fewer barriers to permanent housing (NAEH 2012a:4). These results support the hypothesis that was made regarding program types.
If the client’s most recent enrollment was not her first time enrolled in HMIS as homeless, she was 2.6 times more likely to return to homelessness (Figure 3) – a greater relative risk than any other personal or household characteristic. This is not a surprising result, and its consistency with the hypothesis provides support for thinking that prior enrollment into Georgia’s HMIS is a useful indicator of the relative extensiveness of a client’s homelessness history.
Longer program enrollments were consistently, albeit mildly, associated with decreased likelihoods of homelessness recurrence. The degree of association did not differ significantly according to program type, although a longer program enrollment may have had a slightly more beneficial effect in Rapid Re-Housing programs than in Emergency Shelter or Transitional Housing programs. The type of housing destination a client went to after her program enrollment ended also influenced recurrence likelihood: temporarily housed clients were significantly more likely to return than permanently housed clients, and clients who became dependent upon family or friends for housing were significantly more likely to return than clients who went off to live independently. Clients who went to a subsidized destination were not less likely to return than others, which was a surprising finding.
9
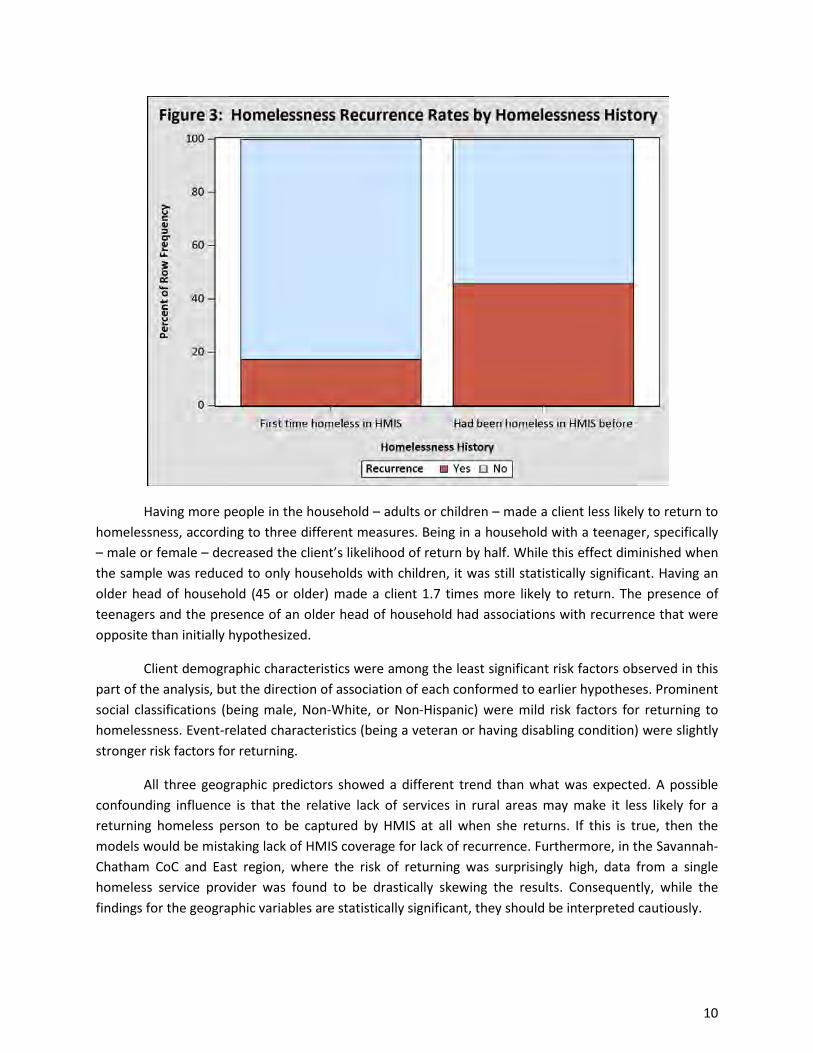
Having more people in the household – adults or children – made a client less likely to return to homelessness, according to three different measures. Being in a household with a teenager, specifically – male or female – decreased the client’s likelihood of return by half. While this effect diminished when the sample was reduced to only households with children, it was still statistically significant. Having an older head of household (45 or older) made a client 1.7 times more likely to return. The presence of teenagers and the presence of an older head of household had associations with recurrence that were opposite than initially hypothesized.
Client demographic characteristics were among the least significant risk factors observed in this part of the analysis, but the direction of association of each conformed to earlier hypotheses. Prominent social classifications (being male, Non-White, or Non-Hispanic) were mild risk factors for returning to homelessness. Event-related characteristics (being a veteran or having disabling condition) were slightly stronger risk factors for returning.
All three geographic predictors showed a different trend than what was expected. A possible confounding influence is that the relative lack of services in rural areas may make it less likely for a returning homeless person to be captured by HMIS at all when she returns. If this is true, then the models would be mistaking lack of HMIS coverage for lack of recurrence. Furthermore, in the Savannah-Chatham CoC and East region, where the risk of returning was surprisingly high, data from a single homeless service provider was found to be drastically skewing the results. Consequently, while the findings for the geographic variables are statistically significant, they should be interpreted cautiously.
10
Predictive Modeling A multivariate likelihood model of homelessness recurrence was created, with all predictors
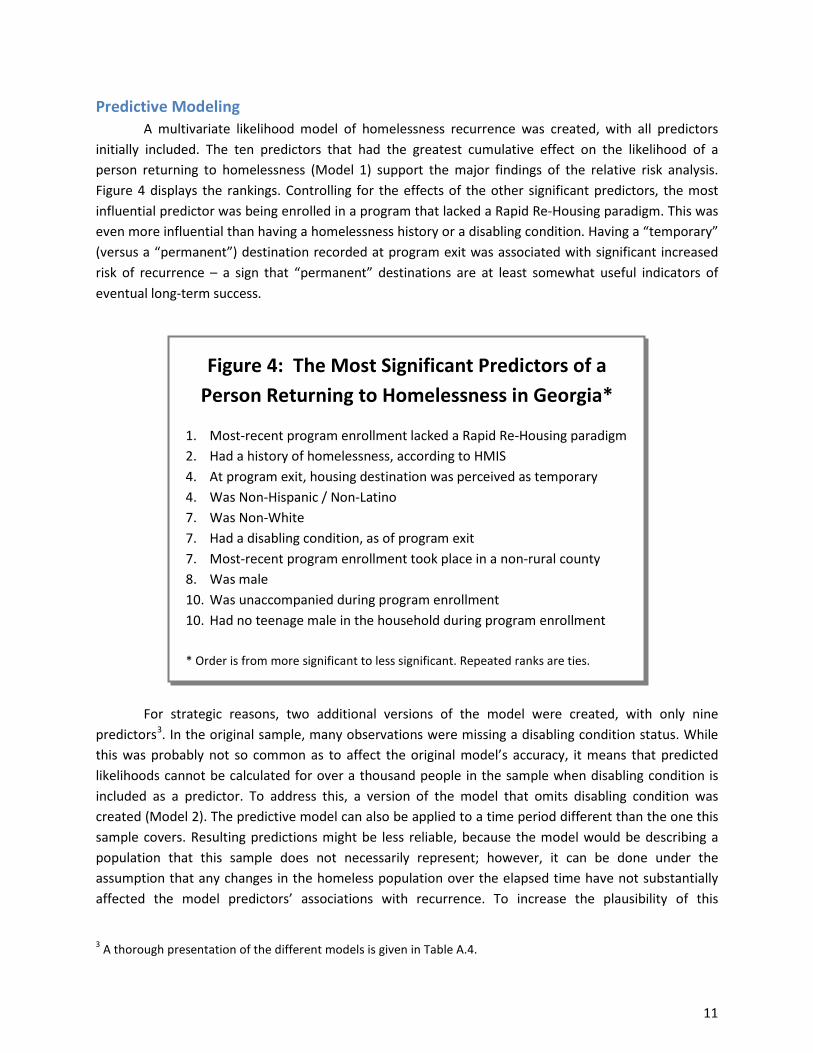
initially included. The ten predictors that had the greatest cumulative effect on the likelihood of a person returning to homelessness (Model 1) support the major findings of the relative risk analysis. Figure 4 displays the rankings. Controlling for the effects of the other significant predictors, the most influential predictor was being enrolled in a program that lacked a Rapid Re-Housing paradigm. This was even more influential than having a homelessness history or a disabling condition. Having a “temporary” (versus a “permanent”) destination recorded at program exit was associated with significant increased risk of recurrence – a sign that “permanent” destinations are at least somewhat useful indicators of eventual long-term success.
Figure 4: The Most Significant Predictors of a Person Returning to Homelessness in Georgia*
1. Most-recent program enrollment lacked a Rapid Re-Housing paradigm 2. Had a history of homelessness, according to HMIS 4. At program exit, housing destination was perceived as temporary 4. Was Non-Hispanic / Non-Latino 7. Was Non-White 7. Had a disabling condition, as of program exit 7. Most-recent program enrollment took place in a non-rural county 8. Was male 10. Was unaccompanied during program enrollment 10. Had no teenage male in the household during program enrollment
* Order is from more significant to less significant. Repeated ranks are ties.
For strategic reasons, two additional versions of the model were created, with only nine predictors3. In the original sample, many observations were missing a disabling condition status. While this was probably not so common as to affect the original model’s accuracy, it means that predicted likelihoods cannot be calculated for over a thousand people in the sample when disabling condition is included as a predictor. To address this, a version of the model that omits disabling condition was created (Model 2). The predictive model can also be applied to a time period different than the one this sample covers. Resulting predictions might be less reliable, because the model would be describing a population that this sample does not necessarily represent; however, it can be done under the assumption that any changes in the homeless population over the elapsed time have not substantially affected the model predictors’ associations with recurrence. To increase the plausibility of this
3 A thorough presentation of the different models is given in Table A.4.
11
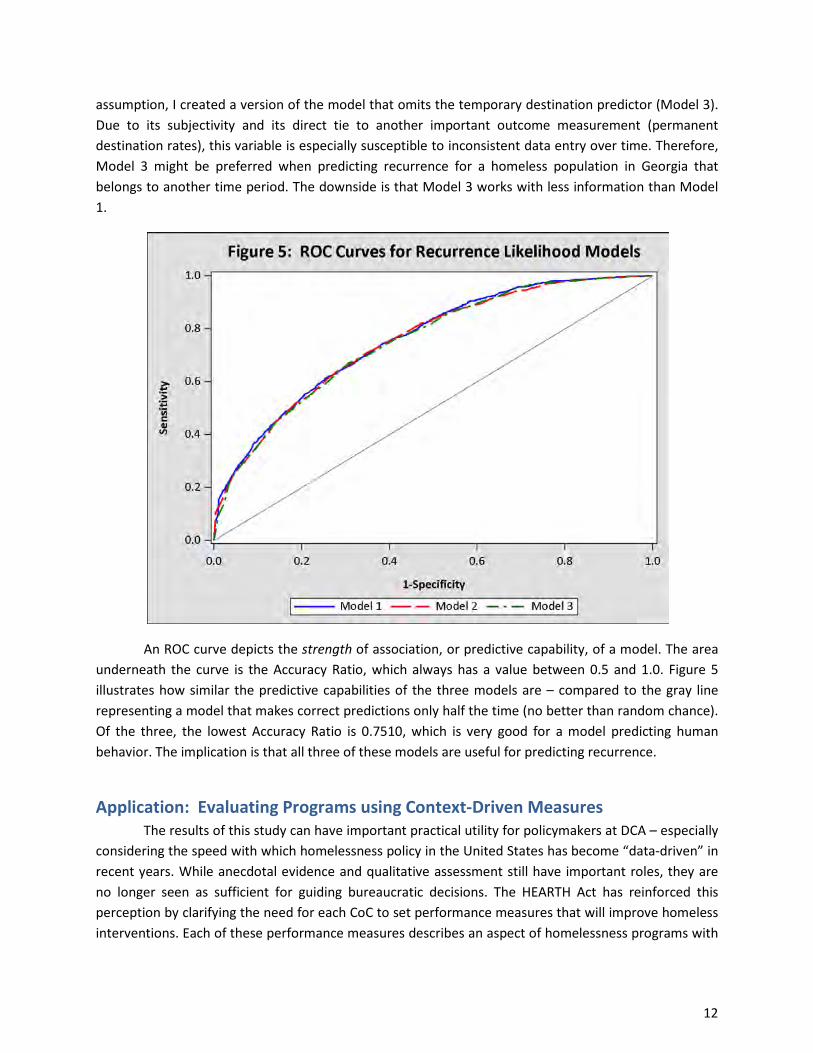
assumption, I created a version of the model that omits the temporary destination predictor (Model 3). Due to its subjectivity and its direct tie to another important outcome measurement (permanent destination rates), this variable is especially susceptible to inconsistent data entry over time. Therefore, Model 3 might be preferred when predicting recurrence for a homeless population in Georgia that belongs to another time period. The downside is that Model 3 works with less information than Model 1.
An ROC curve depicts the strength of association, or predictive capability, of a model. The area underneath the curve is the Accuracy Ratio, which always has a value between 0.5 and 1.0. Figure 5 illustrates how similar the predictive capabilities of the three models are – compared to the gray line representing a model that makes correct predictions only half the time (no better than random chance). Of the three, the lowest Accuracy Ratio is 0.7510, which is very good for a model predicting human behavior. The implication is that all three of these models are useful for predicting recurrence.
Application: Evaluating Programs using Context-Driven Measures The results of this study can have important practical utility for policymakers at DCA – especially
considering the speed with which homelessness policy in the United States has become “data-driven” in recent years. While anecdotal evidence and qualitative assessment still have important roles, they are no longer seen as sufficient for guiding bureaucratic decisions. The HEARTH Act has reinforced this perception by clarifying the need for each CoC to set performance measures that will improve homeless interventions. Each of these performance measures describes an aspect of homelessness programs with
12
a single number – which is appealing, because it is very simple and communicable. More importantly, numbers can be directly compared with one another, enabling a clearer sense of the relative success of specific programs. Despite the powerful benefits of this type of analysis, a price is paid: ultimately, less information is communicated to the people making decisions. Succinctness is acquired at the expense of context, and this can lead to misinterpretation. Therefore, program performance measures should be contextualized where possible, so long as their simplicity is not significantly degraded.
Typically, such “context-driven” performance measurement is not used when evaluating homelessness programs4, and this can be problematic. Simplistic measurement methodologies immediately place programs on the same scale, but oftentimes programs are not directly comparable to one another. They can differ drastically in their targeted homeless subpopulations, program paradigms, and regional characteristics. A 27% “success” rate might be a disappointing outcome for one subpopulation and an encouraging outcome for another; it depends on how the observed outcome compares with what was expected for each particular subpopulation. Failure to take this into account can result in distorted judgments of programs.
Of greater concern is the potential for overly-simplistic performance measures to influence which subpopulations are more likely to be served by homelessness programs and which subpopulations are not. If program outcomes are compared side-by-side, it creates a disincentive for providers to serve homeless persons who have higher-risk attributes, because doing so would likely have an unfair and damaging effect on how their program’s success is perceived. This fear may at times be well-founded, depending on how heavily funders rely on those performance measures. This is not fair to service providers, or to the homeless subpopulations most in need of assistance.
These concerns are relevant to the measurement of homelessness recurrence. After establishing a measurement procedure for recurrence, I wanted to find a way to transform the rate of recurrence into a context-driven performance measure that takes into account various client, programmatic, and geographical characteristics of programs. Using predictive modeling, we can obtain a measure of the “degree of deviation from expectation” (DDE) – that is, the degree to which a program’s observed recurrence rate deviates from what was expected for that program. These DDE values are better suited to be directly compared with one another than raw recurrence rates.
First, likelihoods of recurrence had to be obtained for different types of individuals in the sample. Each of the predictive models created in this study can be used to estimate the likelihood that a particular person returns to homelessness, as long as certain information is available. As an example, consider a former client named Annabelle who has the following characteristics: her most-recent enrollment was in a Rapid Re-Housing program; it was her first time in a homeless program, according to Georgia’s HMIS; she is Hispanic; she is Non-White; she was temporarily housed at the end of her stay; she was unaccompanied during her stay; she had a teenage male in her household; and her program was not located in a rural county. Like everyone else with these same traits, she is estimated to have an 18.2% chance of returning to homelessness (95% confidence interval, 14.7% - 22.2%) under Model 2
4 There are some exceptions. See, for example, NAEH.
13
(Table A.4). (As an aside: if she had exited from an Emergency Shelter program instead, her chance of returning would have jumped up to 46.7% [95% CI, 43.1% - 49.4%]).
One takeaway from this result is that Annabelle is more likely not to return to homelessness, and we would be surprised if she eventually did. Among people in Georgia’s formerly homeless population who have her same personal characteristics, recurrence would be considered atypical, which would beg the question why she had the unexpected outcome. The reason could be something personal, such as a health issue that suddenly emerged in her life, or it could be something more systematic, such as an issue related to the program she was last staying in. If many other people from that same program were found to have similarly unexpected outcomes, it would seem increasingly likely that something about their former program’s management was deficient.
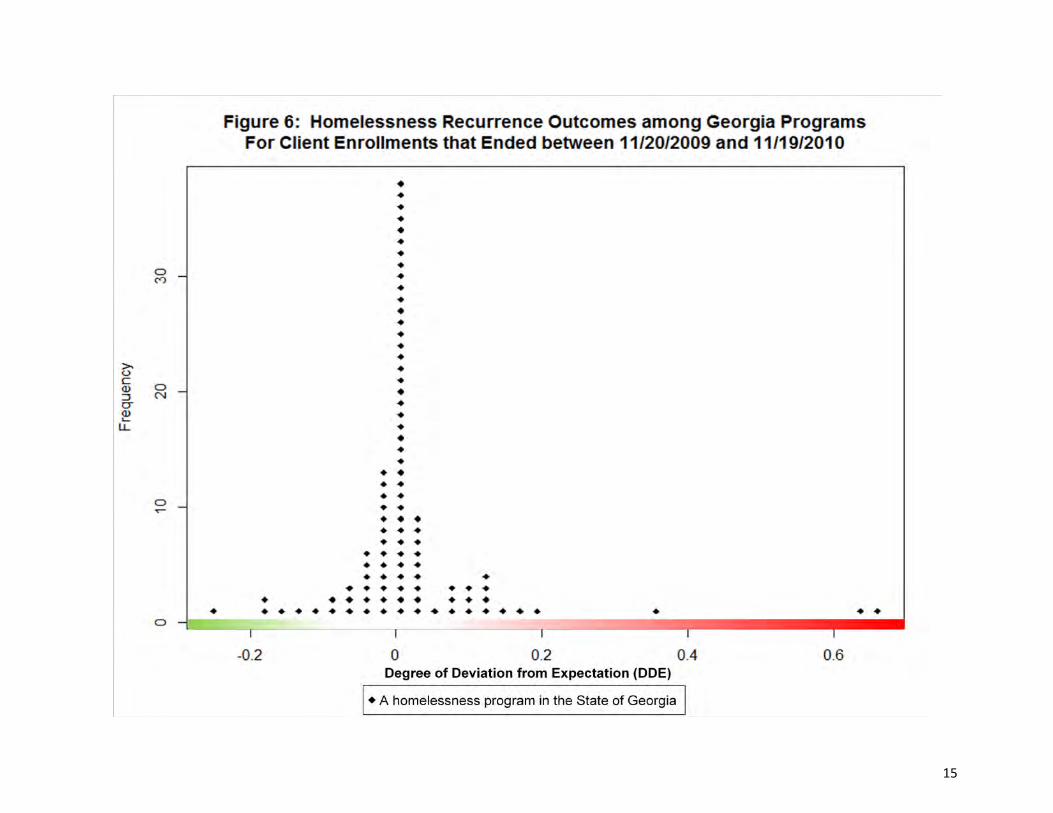
To test this for a particular program, Model 2 can be used to obtain individual recurrence likelihoods for all clients who were enrolled. Taking the average of their likelihoods produces an expected recurrence rate for that program.5 This result can then be compared against the program’s actual recurrence rate. Rather than relying on subjective opinion to interpret this comparison, a statistical measure can quantify the degree of deviation. There are different ways of acquiring this, and the method employed here was a chi-square goodness of fit test. Using the results of this test, we can derive a value called “phi,” which is a measure of DDE. Phi always falls between -1 and 1; if it is zero, then the actual recurrence rate did not differ from the expected recurrence rate. A positive phi-value means that the program performed worse than expected. Conversely, a negative phi-value means that the program performed better than expected. This process can be replicated for all programs and the results compared on a dot plot. Figure 6 shows what that looks like using data from this study’s sample. Each dot represents one homelessness program in Georgia and its DDE.
Most programs in Figure 6 accumulate around zero – meaning that most did not deviate much from their expected recurrence rates6. This is unsurprising, because expected recurrence rates are estimated based on typical trends in the sample. The DDE values are approximately normally distributed, which is what we would expect to see if the measure is unbiased. There are some noticeable outliers – particularly the two rightmost programs; their observed recurrence rates were far worse than what was expected for their clientele. After investigating these programs further, I found that they no longer exist, presumably because they were not very effective (which would seem to provide validation for this performance measure). There is one program on the far left that can be singled out for performing much better than expected.
This performance measure can be used to inform funding decisions, but preferably only as part of a holistic evaluation process that takes into account other quantitative and qualitative criteria. During the grant year, DDE can also be used as a flag indicating where closer inspection is needed. Since staff
5 The caveat here is that the level of uncertainty increases when an estimate is calculated using estimates, but this method can still provide a rough expected outcome for the program. As a check against bias, it should be verified that the recurrence likelihoods of individuals in the program are approximately normally distributed before accepting the mean of these likelihoods as an estimate of the program’s expected recurrence rate. 6 Figure 6 was created using the “epicalc” package for R Software (2012).
14
15
time and resources are limited, this can prove a valuable tool. If a program has a conspicuously high DDE, it could trigger an audit, an on-site monitoring visit, or a closer look at the program’s policies and procedures. On the other hand, if a program has a conspicuously low DDE, the policymaker might be interested in finding out what they are doing right. It could be a way of identifying best practices.
Due to the significant time delay involved in collecting data on recurrence, it may be desirable to recreate predictive models under a modified definition of recurrence. Since there is a relatively high frequency of persons returning within 90 days after program exit (Figure 1), these could be models that predict 90-day recurrence likelihoods. As a result, subsequent calculations of DDE values would be more contemporary, and decisions could then be based on data that is much less outdated. Improving rates of 90-day recurrence would most likely result in improved rates of two-year recurrence, so the conceptual departure might not result in much practical difference in the end.
Discussion The purpose of this study was threefold: to develop a reliable way of obtaining basic descriptive
statistics of homelessness recurrence in Georgia, to investigate its risk factors (and possible causes), and to develop a more contextualized outcome measurement that could prove useful in practice. Particularly meaningful research findings are summarized in Figure 7. Thorough presentations of findings can be found in Tables A.1, A.3, and A.4. All the tests were very sensitive due to the large sample size, so statistical significance alone is not particularly meaningful. Consequently, relative risks and comparisons between the effects of predictors should be given more consideration than statistical significance levels. Moreover, since all variables in this study were significantly related to the likelihood of recurrence, this section will only discuss findings that represent meaningful departures from hypotheses or meaningful confirmations of hypotheses.
The most notable finding of this study was the very high relative risk of recurrence among those who had not been enrolled in a Rapid Re-Housing program. This supports existing research (NAEH 2012b; Focus Strategies & Kate Bristol Consulting 2011) and provides further validation for DCA’s increased emphasis on Rapid Re-Housing funding. The fact that the association was so strong, even while controlling for other predictors and interactions between predictors, is a promising sign that the Rapid Re-Housing paradigm of homeless program truly results in better long-term housing outcomes for homeless persons than traditional paradigms.
Other findings were consistent with hypotheses as well. Having a history of homelessness in HMIS made a person 2.6 times more likely to return to homelessness, supporting findings in some studies (Dworsky & Piliavin 2000; Wong & Piliavin 1997) while departing from the non-significance found in others (Piliavin et al. 1996; Sosin, Piliavin, & Westerfelt 1990). Its clear support of the hypothesis of DCA staff could be an indication that one’s homelessness history in Georgia’s HMIS is an adequate substitute for one’s homelessness history in general.
Shorter program enrollments were mildly associated with an increased risk of recurrence, regardless of program type. This differs from the study by Wong, Culhane, & Kuhn (1997), who found
16
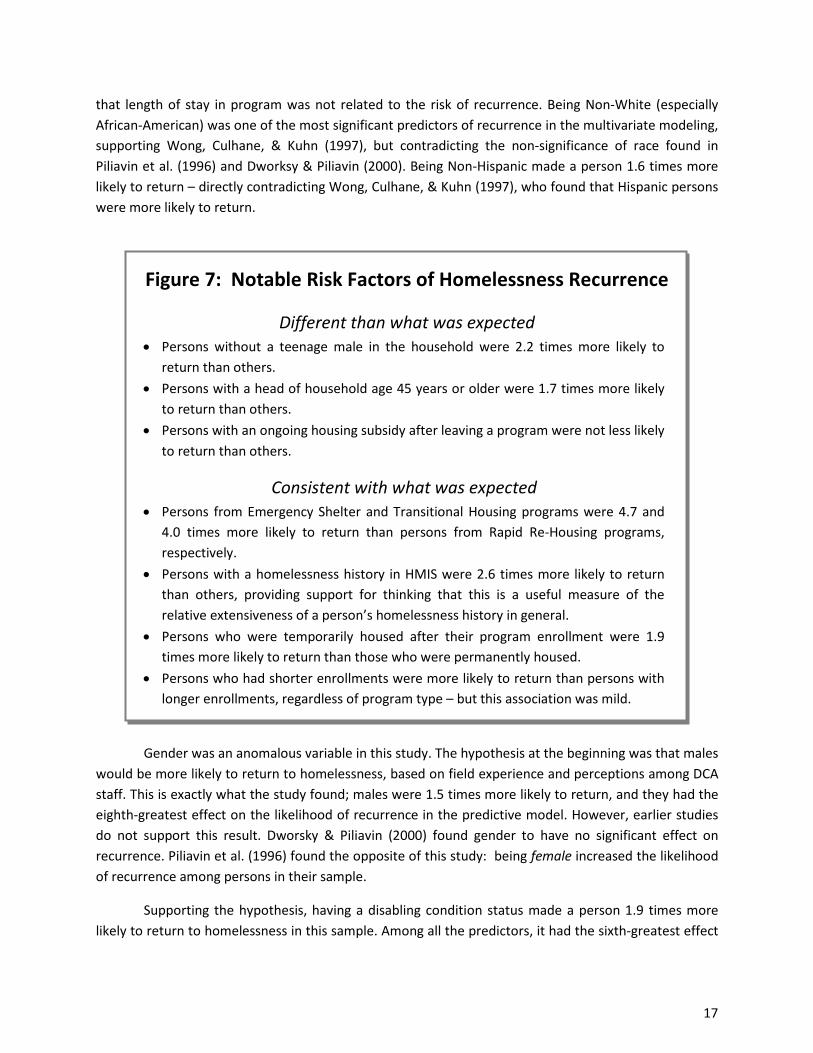
that length of stay in program was not related to the risk of recurrence. Being Non-White (especially African-American) was one of the most significant predictors of recurrence in the multivariate modeling, supporting Wong, Culhane, & Kuhn (1997), but contradicting the non-significance of race found in Piliavin et al. (1996) and Dworksy & Piliavin (2000). Being Non-Hispanic made a person 1.6 times more likely to return – directly contradicting Wong, Culhane, & Kuhn (1997), who found that Hispanic persons were more likely to return.
Figure 7: Notable Risk Factors of Homelessness Recurrence
Different than what was expected • Persons without a teenage male in the household were 2.2 times more likely to
return than others. • Persons with a head of household age 45 years or older were 1.7 times more likely
to return than others. • Persons with an ongoing housing subsidy after leaving a program were not less likely
to return than others.
Consistent with what was expected • Persons from Emergency Shelter and Transitional Housing programs were 4.7 and
4.0 times more likely to return than persons from Rapid Re-Housing programs, respectively.
• Persons with a homelessness history in HMIS were 2.6 times more likely to return than others, providing support for thinking that this is a useful measure of the relative extensiveness of a person’s homelessness history in general.
• Persons who were temporarily housed after their program enrollment were 1.9 times more likely to return than those who were permanently housed.
• Persons who had shorter enrollments were more likely to return than persons with longer enrollments, regardless of program type – but this association was mild.
Gender was an anomalous variable in this study. The hypothesis at the beginning was that males would be more likely to return to homelessness, based on field experience and perceptions among DCA staff. This is exactly what the study found; males were 1.5 times more likely to return, and they had the eighth-greatest effect on the likelihood of recurrence in the predictive model. However, earlier studies do not support this result. Dworsky & Piliavin (2000) found gender to have no significant effect on recurrence. Piliavin et al. (1996) found the opposite of this study: being female increased the likelihood of recurrence among persons in their sample.
Supporting the hypothesis, having a disabling condition status made a person 1.9 times more likely to return to homelessness in this sample. Among all the predictors, it had the sixth-greatest effect
17
in the predictive model. However, it was found to have no significant effect on recurrence by Piliavin et al. (1996).
The idea for the third destination classification (independent vs. dependent) was borrowed from Piliavin et al. (1996). The researchers found that it was not predictive of homelessness recurrence. However, in this sample, persons who were dependent on family or friends for housing upon leaving the homelessness program were 1.7 times more likely to return to homelessness. This contradicts their finding but supports the hypothesis of this study.
Being unaccompanied made a person 2.3 times more likely to return to homelessness. This supports the hypothesis made earlier. However, it contradicts Piliavin et al. (1996), who found no significant difference in recurrence likelihoods between unaccompanied persons and accompanied persons.
As expected, going to a “temporary” destination at program exit was associated with a greater likelihood of returning to homelessness – contrary to Stover-Wright (2012), who found no significant relationship. The association was not a perfect one, which is understandable given that a temporary housing arrangement does not necessarily imply a return to homelessness. However, we would like to think that the alternative association – that a permanent housing arrangement implies staying away from homelessness – is always true. Of those initially classified as “permanently housed”, 22% returned to homelessness within two years of receiving that classification. This does not include people who returned to homelessness without being detected by HMIS (however high that percentage is). We can conclude that, at a minimum, housing destinations were inaccurately classified as permanent 22% of the time. This suggests that, as a gauge of successful housing outcomes, this study’s measure of housing stability (i.e., lack of recurrence) was correct 1.3 times more often than initial permanent destination classifications.
The presence of teenagers in the household and its relationship with homelessness recurrence is not something that seems to have been tested in previous studies. However, DCA staff felt it was relevant to investigate here. Among some housing programs in Georgia, there has been a tendency to deny service to families with a teenage male or to insist that the teenage male stay in a nearby hotel away from the family. Following HUD, DCA policy is to deny funding to providers who engage in this form of discrimination, but many providers do not receive DCA funding and could currently be engaging in these practices. Some might do so in part because they perceive a household with a teenager as less likely to succeed, especially if the teenager is male. However, data from this study suggests the opposite: people in households with at least one teenage male were 2.2 times less likely to return the homelessness than people in households with no teenage males. Since most teenagers are children, and since households with children had a much better outcome than other households, I wanted to make sure that the relative risk for teenage males was not being inflated by that variable. To do this, I reduced the sample to include only persons in households with children. The relative risk of recurrence changed slightly, but the trend was still the same: among persons in households with children, persons in households with a teenage male were 1.5 times less likely to return to homelessness than persons not with a teenage male. In addition, the lack of a teenage male in the household was the tenth-greatest
18
predictor of homelessness in the predictive model. This all appears to be solid evidence for rejecting the hypothesis that was originally made.
In the literature, there are two contradictory findings on the effect of subsidized housing on the likelihood of homelessness recurrence. In Dworsky & Piliavin’s study (2000), persons who did not receive housing assistance were more likely to return. This was also the hypothesis of DCA staff for this study. However, Wong, Culhane, & Kuhn (1997) found subsidized housing to be associated with a higher risk of recurrence. This latter finding is supported by data from this study. Persons who were living in subsidized housing were 1.1 times more likely to return to homelessness. The lower bound of this relative risk’s confidence interval is barely above 1.0, so it would be better to say that persons living in subsidized housing were “not less likely” to return to homelessness. Still, this in itself is a surprising finding.
Before beginning this study, it was assumed that persons with a head of household aged 45 or older would be less likely to return to homelessness. This hypothesis was also supported by Wong, Culhane, & Kuhn (1997), who found that persons with a younger head of household were more likely to return (the likelihood decreased as age increased). However, this study found the opposite. Persons with a head of household aged 45 or older were 1.7 times more likely to return than other persons.
A predictive model found than ten risk factors were especially strong predictors of homelessness recurrence (Figure 4). Each of the three models developed were found to have strong predictive capability. This means they can be useful for predicting recurrence likelihoods of individuals, and even for obtaining predicted recurrence rates for groups of people. These group predictions can then be compared with actual recurrence rates, and resulting degrees of deviation from expectation (DDE values) can be computed. Consequently, DDE can provide a relatively simple way of identifying programs that performed much differently than expected. This application was tested for homelessness programs in the sample, and it was found that it could have important practical utility for DCA.
Limitations Recent applications of technology have allowed Georgia funders to monitor HMIS data more
easily. For example, ODBC and Java Database Connectivity (JDBC) have allowed DCA to generate custom data quality reports for individual programs and to incorporate statewide data quality measures onto monthly dashboards. Over the past two years, this has made service providers more conscious of their data’s completeness and quality. The data in this study’s sample were created prior to these advancements when HMIS requirements for service providers were more lenient and harder to monitor. Consequently, key variables – such as those related to income, special needs, and receipt of public assistance – were not able to be included in the analysis because of prohibitive amounts of missing data in HMIS. However, a replication of the analysis in two or more years’ time should be able to include them. Income in particular is considered to be a very important factor in the likelihood of returning to homelessness. There are other variables that are not in HMIS and might never be, such as whether or not someone went to a “doubled-up” situation upon leaving a homelessness program.
19
There were probably many individuals who should have been included in the analysis but were not, because their destination at exit was not known – making it impossible to tell if they had left homelessness to begin with. Missing destinations were fairly common during this time period; a disproportionate amount probably came from emergency shelters, since those programs have a greater tendency to function as a quick revolving door. Since relatively very few people exit from emergency shelters to non-homeless destinations, however, the number of observations missing from the analysis would seem to be rather limited. Even if this were not true, there does not seem to be much reason to think that these inadvertently-excluded clients would have had significantly different relative risks than the clients included in the sample. The relative risks observed in this sample, in other words, are most likely representative.
An assumption of this study was that homeless re-enrollment into HMIS was synonymous with homelessness recurrence. In reality, this is not necessarily always true. Persons who return to an unsheltered form of homelessness are more likely not to be captured by HMIS, which may be a more common problem in rural counties. Others may travel out of state, and consequently out of range of Georgia’s HMIS, when they return to homelessness. It is unknown how prevalent these circumstances are, but it is possible that some returns to homelessness go unrecorded, making it misleadingly appear as though certain recurrent clients are still stably housed. This is probably more prevalent among unaccompanied individuals, who are much more likely to be transient and to experience unsheltered homelessness.
Conclusion As homelessness policy becomes more data-driven, it is important that policymakers use
outcome measurements that are more robust. Although permanent destination rates can be used as an adequate preliminary indicator of client success, they are anticipatory and thus insufficient measures of what happens to former clients once they leave programs. Homelessness recurrence rates are objective, observation-based statistics that can make these outcome measurements more accurate.
More important that being able to track recurrence, however, is the ability to identify what could help reduce its prevalence. To this end, the findings in this study suggest that the best intervention that DCA could implement at this time would be to enable more homeless persons to have access to Rapid Re-Housing programs. In addition, the risk factors of recurrence discussed here can guide DCA toward establishing interventions for specific groups of people that are more at-risk.
Increased reliance on data for decision making among funders means that contextualization becomes an increasingly important way of mitigating some of the unintended consequences of using a handful of numbers to measure program performance. This paper proposes utilizing predictive modeling to create a context-driven performance measure that compares recurrence DDE values instead of raw recurrence rates. This would allow for basic client, programmatic, and geographical characteristics to be controlled for in order to produce a number that better isolates the actual competence of program management and staff. This would much more fairly evaluate the performance of service providers,
20

particularly those serving clients with high barriers to housing stability, and it will allow DCA more intelligently target its efforts in ways that hopefully will result in decreased levels of homelessness.
21
Works Cited
Dworsky, Amy Lynn and Irving Piliavin. 2000. “Homeless Spell Exits and Returns: Substantive and Methodological Elaborations on Recent Studies.” Social Service Review 74:193-213.
Focus Strategies & Bristol Consulting. 2012. “Assessment of Homelessness Prevention & Rapid Rehousing Program in San Jose.” Retrieved February 22, 2013 (http://focusstrategies.net/assets/components/Final%20Report_CTA.pdf).
National Alliance to End Homelessness (NAEH). 2012a. “Ending Family Homelessness: National Trends and Local System Responses.” Retrieved February 22, 2013 (http://www.endhomelessness.org/library/entry/ending-family-homelessness-national-trends-and-local-system-responses).
National Alliance to End Homelessness (NAEH). 2012b. “Rapid Re-Housing: Successfully Ending Family Homelessness.” Retrieved February 22, 2013 (http://www.endhomelessness.org/library/entry/rapid-re-housing-successfully-ending-family-homelessness).
Piliavin, Irving, Bradley Entner-Wright, Robert Mare, and Alex Westerfelt. 1996. “Exits from and Returns to Homelessness.” Social Service Review 70:33-57.
R Core Team. 2012. R: A language and environment for statistical computing. R Foundation for Statistical Computing, Vienna, Austria (http://www.R-project.org/).
Sosin, Michael, Irving Piliavin, and Herb Westerfelt. 1990. “Toward a Longitudinal Analysis of Homelessness.” Journal of Social Issues 46(4):157-174.
Stover-Wright, Ehren. 2012. “Measuring the Validity of Permanence of Destination at Exit from Homeless Services as a measure of Success in Outcomes Using HMIS Data.” Paper presented at the semiannual meeting of NHSDC, October 11-12, Washington DC.
U.S. Congress. 2009. McKinney-Vento Homeless Assistance Act as Amended by S.896 HEARTH Act of 2009. 111th Congress.
U.S. Department of Housing and Urban Development (HUD). Office of Community Planning and Development. 2011. The 2010 Annual Homeless Assessment Report to Congress. Washington, D.C.: Government Printing Office.
Wong, Yin-Ling Irene, Dennis Culhane, and Randall Kuhn. 1997. “Predictors of Exit and Reentry among Family Shelter Users in New York City.” Social Service Review 71:441-462.
Wong, Yin-Ling Irene and Irving Piliavin. 1997. “A Dynamic Analysis of Homeless-Domicile Transitions.” Social Problems 44:408-23.
Appendix A: Tables
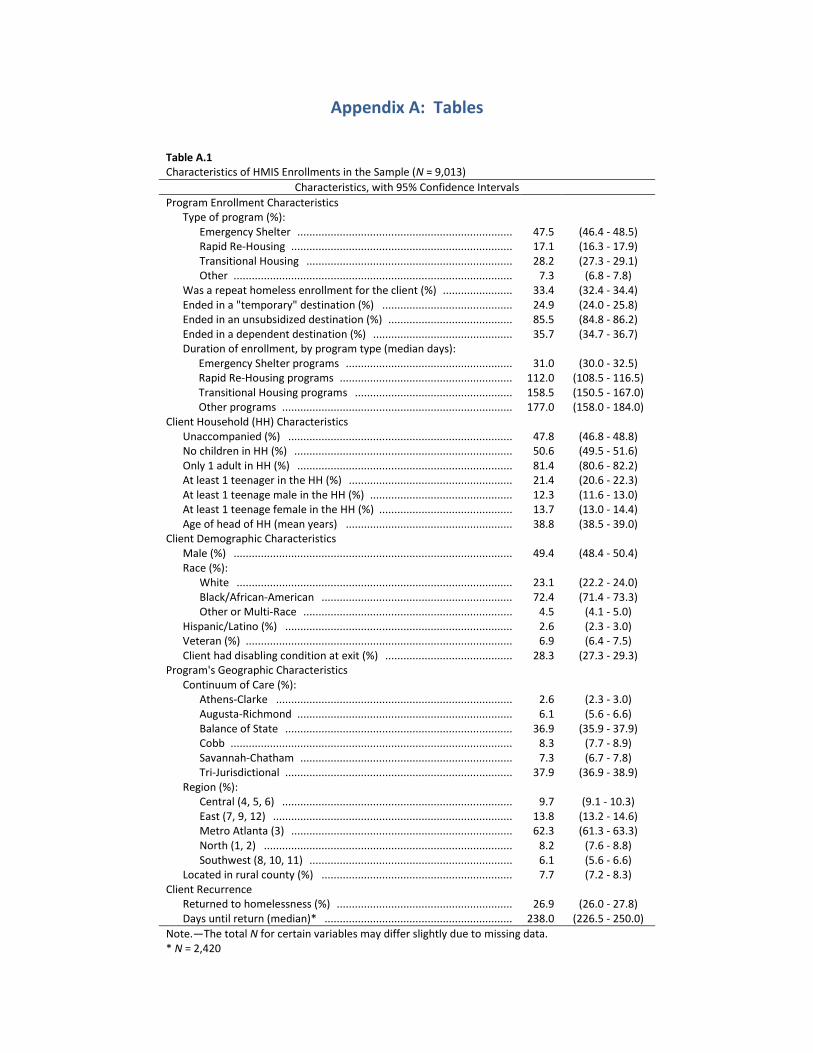
Table A.1 Characteristics of HMIS Enrollments in the Sample (N = 9,013)
Characteristics, with 95% Confidence Intervals Program Enrollment Characteristics
Type of program (%):
Emergency Shelter ....................................................................... 47.5 (46.4 - 48.5)
Rapid Re-Housing ......................................................................... 17.1 (16.3 - 17.9)
Transitional Housing .................................................................... 28.2 (27.3 - 29.1)
Other ............................................................................................ 7.3 (6.8 - 7.8)
Was a repeat homeless enrollment for the client (%) ....................... 33.4 (32.4 - 34.4)
Ended in a "temporary" destination (%) ........................................... 24.9 (24.0 - 25.8)
Ended in an unsubsidized destination (%) ......................................... 85.5 (84.8 - 86.2)
Ended in a dependent destination (%) .............................................. 35.7 (34.7 - 36.7)
Duration of enrollment, by program type (median days): Emergency Shelter programs ....................................................... 31.0 (30.0 - 32.5) Rapid Re-Housing programs ......................................................... 112.0 (108.5 - 116.5) Transitional Housing programs .................................................... 158.5 (150.5 - 167.0) Other programs ............................................................................ 177.0 (158.0 - 184.0) Client Household (HH) Characteristics
Unaccompanied (%) .......................................................................... 47.8 (46.8 - 48.8)
No children in HH (%) ........................................................................ 50.6 (49.5 - 51.6)
Only 1 adult in HH (%) ....................................................................... 81.4 (80.6 - 82.2)
At least 1 teenager in the HH (%) ...................................................... 21.4 (20.6 - 22.3)
At least 1 teenage male in the HH (%) ............................................... 12.3 (11.6 - 13.0)
At least 1 teenage female in the HH (%) ............................................ 13.7 (13.0 - 14.4)
Age of head of HH (mean years) ....................................................... 38.8 (38.5 - 39.0)
Client Demographic Characteristics
Male (%) ............................................................................................ 49.4 (48.4 - 50.4)
Race (%):
White ........................................................................................... 23.1 (22.2 - 24.0)
Black/African-American ............................................................... 72.4 (71.4 - 73.3)
Other or Multi-Race ..................................................................... 4.5 (4.1 - 5.0)
Hispanic/Latino (%) ........................................................................... 2.6 (2.3 - 3.0)
Veteran (%) ........................................................................................ 6.9 (6.4 - 7.5)
Client had disabling condition at exit (%) .......................................... 28.3 (27.3 - 29.3)
Program's Geographic Characteristics
Continuum of Care (%):
Athens-Clarke .............................................................................. 2.6 (2.3 - 3.0)
Augusta-Richmond ....................................................................... 6.1 (5.6 - 6.6)
Balance of State ........................................................................... 36.9 (35.9 - 37.9)
Cobb ............................................................................................. 8.3 (7.7 - 8.9)
Savannah-Chatham ...................................................................... 7.3 (6.7 - 7.8)
Tri-Jurisdictional ........................................................................... 37.9 (36.9 - 38.9)
Region (%):
Central (4, 5, 6) ............................................................................ 9.7 (9.1 - 10.3)
East (7, 9, 12) ............................................................................... 13.8 (13.2 - 14.6)
Metro Atlanta (3) ......................................................................... 62.3 (61.3 - 63.3)
North (1, 2) .................................................................................. 8.2 (7.6 - 8.8)
Southwest (8, 10, 11) ................................................................... 6.1 (5.6 - 6.6)
Located in rural county (%) ............................................................... 7.7 (7.2 - 8.3) Client Recurrence
Returned to homelessness (%) .......................................................... 26.9 (26.0 - 27.8)
Days until return (median)* .............................................................. 238.0 (226.5 - 250.0)
Note.―The total N for certain variables may differ slightly due to missing data. * N = 2,420
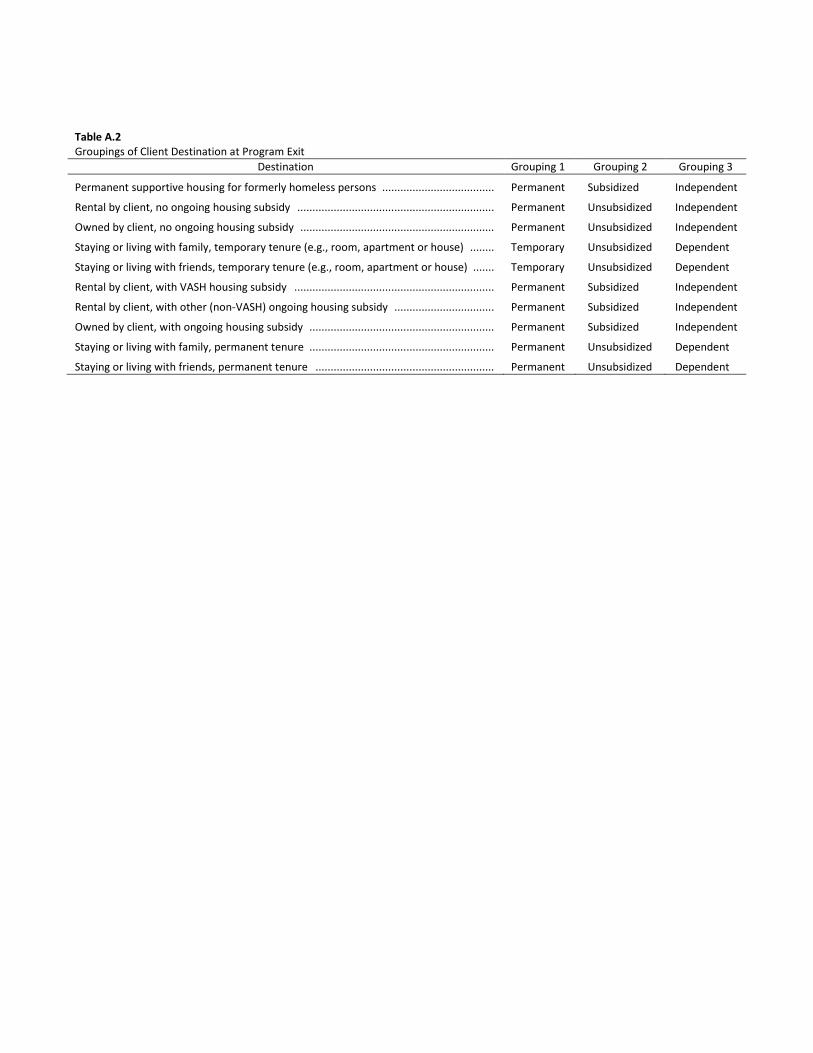
Table A.2 Groupings of Client Destination at Program Exit
Destination Grouping 1 Grouping 2 Grouping 3
Permanent supportive housing for formerly homeless persons ..................................... Permanent Subsidized Independent
Rental by client, no ongoing housing subsidy ................................................................. Permanent Unsubsidized Independent
Owned by client, no ongoing housing subsidy ................................................................ Permanent Unsubsidized Independent
Staying or living with family, temporary tenure (e.g., room, apartment or house) ........ Temporary Unsubsidized Dependent
Staying or living with friends, temporary tenure (e.g., room, apartment or house) ....... Temporary Unsubsidized Dependent
Rental by client, with VASH housing subsidy .................................................................. Permanent Subsidized Independent
Rental by client, with other (non-VASH) ongoing housing subsidy ................................. Permanent Subsidized Independent
Owned by client, with ongoing housing subsidy ............................................................. Permanent Subsidized Independent
Staying or living with family, permanent tenure ............................................................. Permanent Unsubsidized Dependent
Staying or living with friends, permanent tenure ........................................................... Permanent Unsubsidized Dependent
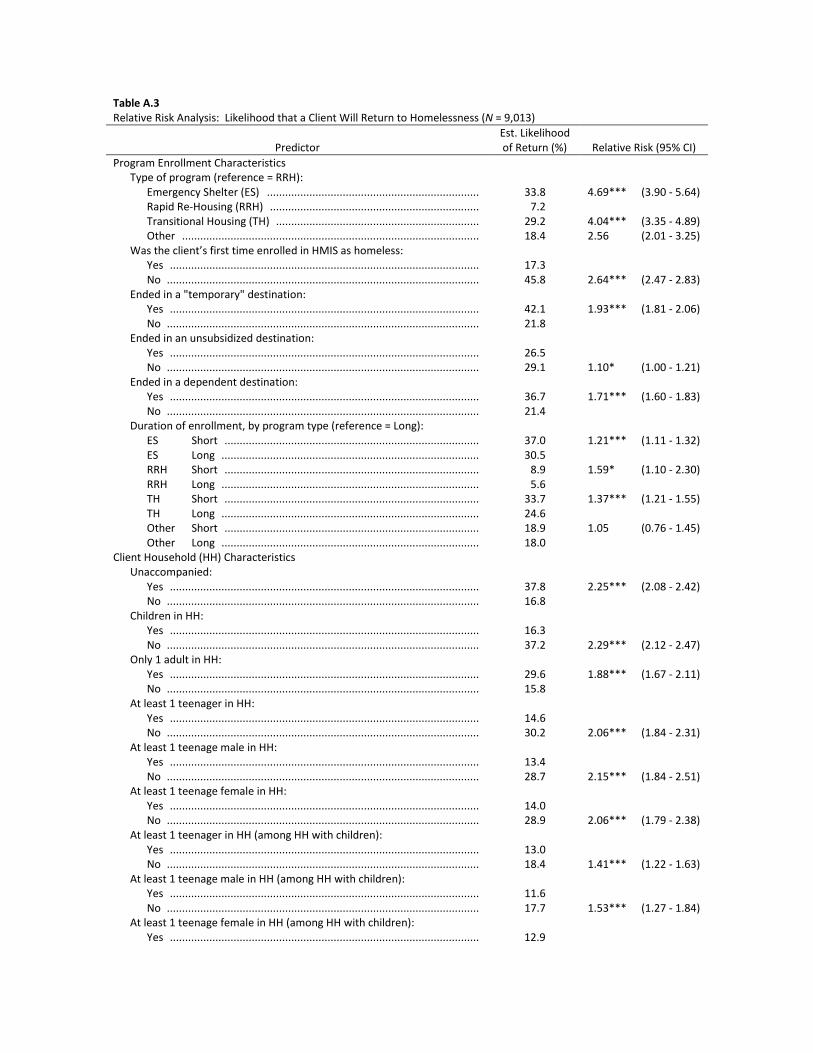
Table A.3
Relative Risk Analysis: Likelihood that a Client Will Return to Homelessness (N = 9,013)
Predictor Est. Likelihood of Return (%) Relative Risk (95% CI)
Program Enrollment Characteristics
Type of program (reference = RRH):
Emergency Shelter (ES) ...................................................................... 33.8 4.69*** (3.90 - 5.64) Rapid Re-Housing (RRH) ..................................................................... 7.2
Transitional Housing (TH) ................................................................... 29.2 4.04*** (3.35 - 4.89)
Other .................................................................................................. 18.4 2.56 (2.01 - 3.25)
Was the client’s first time enrolled in HMIS as homeless: Yes ...................................................................................................... 17.3 No ....................................................................................................... 45.8 2.64*** (2.47 - 2.83) Ended in a "temporary" destination: Yes ...................................................................................................... 42.1 1.93*** (1.81 - 2.06) No ....................................................................................................... 21.8 Ended in an unsubsidized destination: Yes ...................................................................................................... 26.5 No ....................................................................................................... 29.1 1.10* (1.00 - 1.21) Ended in a dependent destination: Yes ...................................................................................................... 36.7 1.71*** (1.60 - 1.83) No ....................................................................................................... 21.4 Duration of enrollment, by program type (reference = Long): ES Short .................................................................................... 37.0 1.21*** (1.11 - 1.32) ES Long ..................................................................................... 30.5 RRH Short .................................................................................... 8.9 1.59* (1.10 - 2.30) RRH Long ..................................................................................... 5.6 TH Short .................................................................................... 33.7 1.37*** (1.21 - 1.55) TH Long ..................................................................................... 24.6 Other Short .................................................................................... 18.9 1.05 (0.76 - 1.45) Other Long ..................................................................................... 18.0 Client Household (HH) Characteristics
Unaccompanied:
Yes ...................................................................................................... 37.8 2.25*** (2.08 - 2.42)
No ....................................................................................................... 16.8
Children in HH:
Yes ...................................................................................................... 16.3
No ....................................................................................................... 37.2 2.29*** (2.12 - 2.47)
Only 1 adult in HH: Yes ...................................................................................................... 29.6 1.88*** (1.67 - 2.11) No ....................................................................................................... 15.8 At least 1 teenager in HH: Yes ...................................................................................................... 14.6 No ....................................................................................................... 30.2 2.06*** (1.84 - 2.31) At least 1 teenage male in HH: Yes ...................................................................................................... 13.4 No ....................................................................................................... 28.7 2.15*** (1.84 - 2.51) At least 1 teenage female in HH: Yes ...................................................................................................... 14.0 No ....................................................................................................... 28.9 2.06*** (1.79 - 2.38) At least 1 teenager in HH (among HH with children): Yes ...................................................................................................... 13.0 No ....................................................................................................... 18.4 1.41*** (1.22 - 1.63) At least 1 teenage male in HH (among HH with children): Yes ...................................................................................................... 11.6 No ....................................................................................................... 17.7 1.53*** (1.27 - 1.84) At least 1 teenage female in HH (among HH with children): Yes ...................................................................................................... 12.9
No ....................................................................................................... 17.5 1.36*** (1.15 - 1.60)
Age of head of HH (reference = 18-44):
18-44 .................................................................................................. 22.4
45 and older ....................................................................................... 37.4 1.67*** (1.56 - 1.78)
Client Demographic Characteristics Gender (reference = Female): Male ................................................................................................... 32.3 1.50*** (1.40 - 1.60) Female ................................................................................................ 21.6
Race (reference = White):
White .................................................................................................. 19.7
Black/African-American ..................................................................... 30.0 1.52*** (1.38 - 1.67)
Other or Multi-Race ........................................................................... 25.5 1.29*** (1.07 - 1.56)
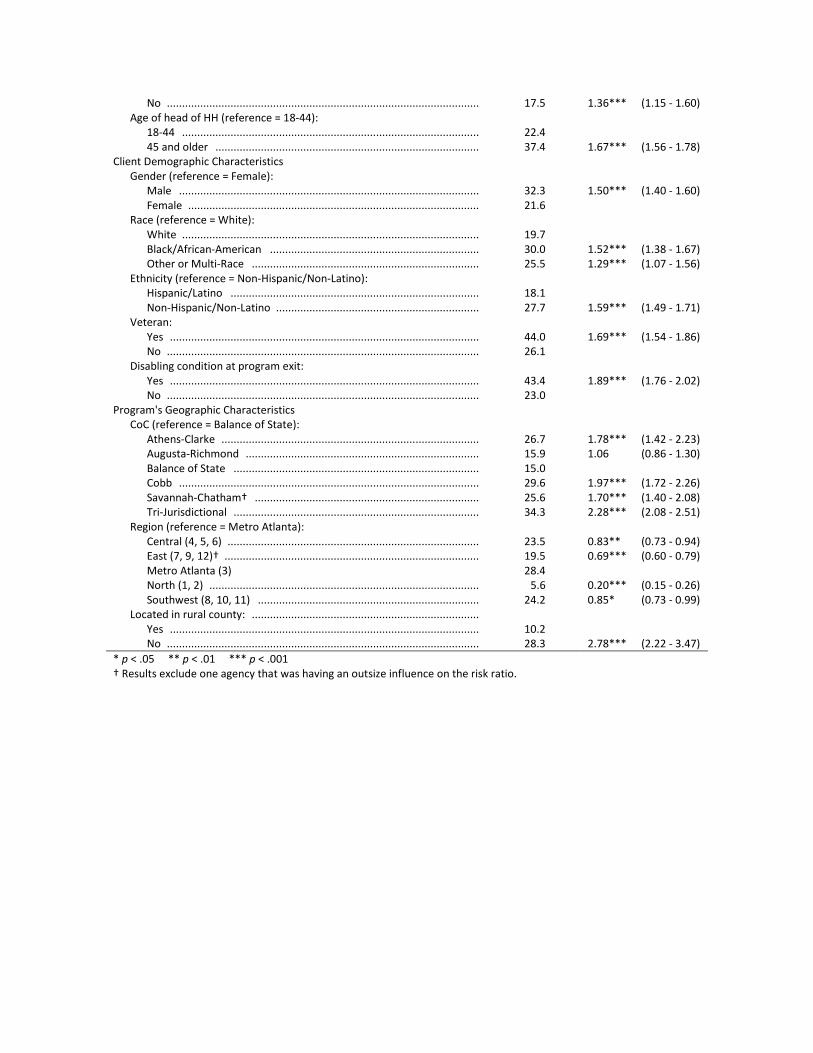
Ethnicity (reference = Non-Hispanic/Non-Latino): Hispanic/Latino .................................................................................. 18.1 Non-Hispanic/Non-Latino ................................................................... 27.7 1.59*** (1.49 - 1.71) Veteran: Yes ...................................................................................................... 44.0 1.69*** (1.54 - 1.86) No ....................................................................................................... 26.1 Disabling condition at program exit: Yes ...................................................................................................... 43.4 1.89*** (1.76 - 2.02) No ....................................................................................................... 23.0 Program's Geographic Characteristics
CoC (reference = Balance of State):
Athens-Clarke ..................................................................................... 26.7 1.78*** (1.42 - 2.23)
Augusta-Richmond ............................................................................. 15.9 1.06 (0.86 - 1.30)
Balance of State ................................................................................. 15.0
Cobb ................................................................................................... 29.6 1.97*** (1.72 - 2.26)
Savannah-Chatham† .......................................................................... 25.6 1.70*** (1.40 - 2.08)
Tri-Jurisdictional ................................................................................. 34.3 2.28*** (2.08 - 2.51)
Region (reference = Metro Atlanta):
Central (4, 5, 6) ................................................................................... 23.5 0.83** (0.73 - 0.94)
East (7, 9, 12)† .................................................................................... 19.5 0.69*** (0.60 - 0.79)
Metro Atlanta (3) 28.4
North (1, 2) ......................................................................................... 5.6 0.20*** (0.15 - 0.26)
Southwest (8, 10, 11) ......................................................................... 24.2 0.85* (0.73 - 0.99)
Located in rural county: ........................................................................... Yes ...................................................................................................... 10.2 No ....................................................................................................... 28.3 2.78*** (2.22 - 3.47) * p < .05 ** p < .01 *** p < .001 † Results exclude one agency that was having an outsize influence on the risk ratio.
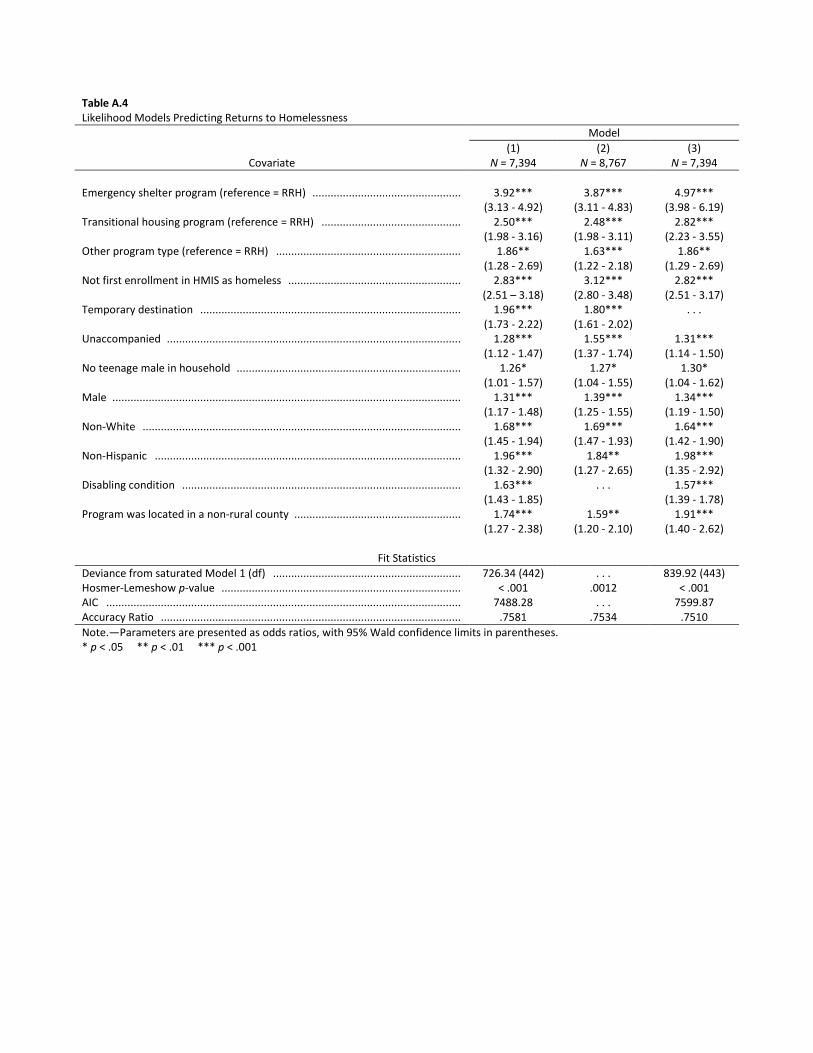
Table A.4 Likelihood Models Predicting Returns to Homelessness
Model
Covariate (1)
N = 7,394 (2)
N = 8,767 (3)
N = 7,394 Emergency shelter program (reference = RRH) ................................................. 3.92*** 3.87*** 4.97***
(3.13 - 4.92) (3.11 - 4.83) (3.98 - 6.19)
Transitional housing program (reference = RRH) .............................................. 2.50*** 2.48*** 2.82***
(1.98 - 3.16) (1.98 - 3.11) (2.23 - 3.55)
Other program type (reference = RRH) ............................................................. 1.86** 1.63*** 1.86**
(1.28 - 2.69) (1.22 - 2.18) (1.29 - 2.69)
Not first enrollment in HMIS as homeless ......................................................... 2.83*** 3.12*** 2.82***
(2.51 – 3.18) (2.80 - 3.48) (2.51 - 3.17)
Temporary destination ...................................................................................... 1.96*** 1.80*** . . .
(1.73 - 2.22) (1.61 - 2.02)
Unaccompanied ................................................................................................. 1.28*** 1.55*** 1.31***
(1.12 - 1.47) (1.37 - 1.74) (1.14 - 1.50)
No teenage male in household .......................................................................... 1.26* 1.27* 1.30*
(1.01 - 1.57) (1.04 - 1.55) (1.04 - 1.62)
Male ................................................................................................................... 1.31*** 1.39*** 1.34***
(1.17 - 1.48) (1.25 - 1.55) (1.19 - 1.50)
Non-White ......................................................................................................... 1.68*** 1.69*** 1.64***
(1.45 - 1.94) (1.47 - 1.93) (1.42 - 1.90)
Non-Hispanic ..................................................................................................... 1.96*** 1.84** 1.98***
(1.32 - 2.90) (1.27 - 2.65) (1.35 - 2.92)
Disabling condition ............................................................................................ 1.63*** . . . 1.57***
(1.43 - 1.85)
(1.39 - 1.78)
Program was located in a non-rural county ....................................................... 1.74*** 1.59** 1.91***
(1.27 - 2.38) (1.20 - 2.10) (1.40 - 2.62)
Fit Statistics Deviance from saturated Model 1 (df) .............................................................. 726.34 (442) . . . 839.92 (443) Hosmer-Lemeshow p-value ............................................................................... < .001 .0012 < .001 AIC ..................................................................................................................... 7488.28 . . . 7599.87 Accuracy Ratio ................................................................................................... .7581 .7534 .7510 Note.―Parameters are presented as odds ratios, with 95% Wald confidence limits in parentheses. * p < .05 ** p < .01 *** p < .001
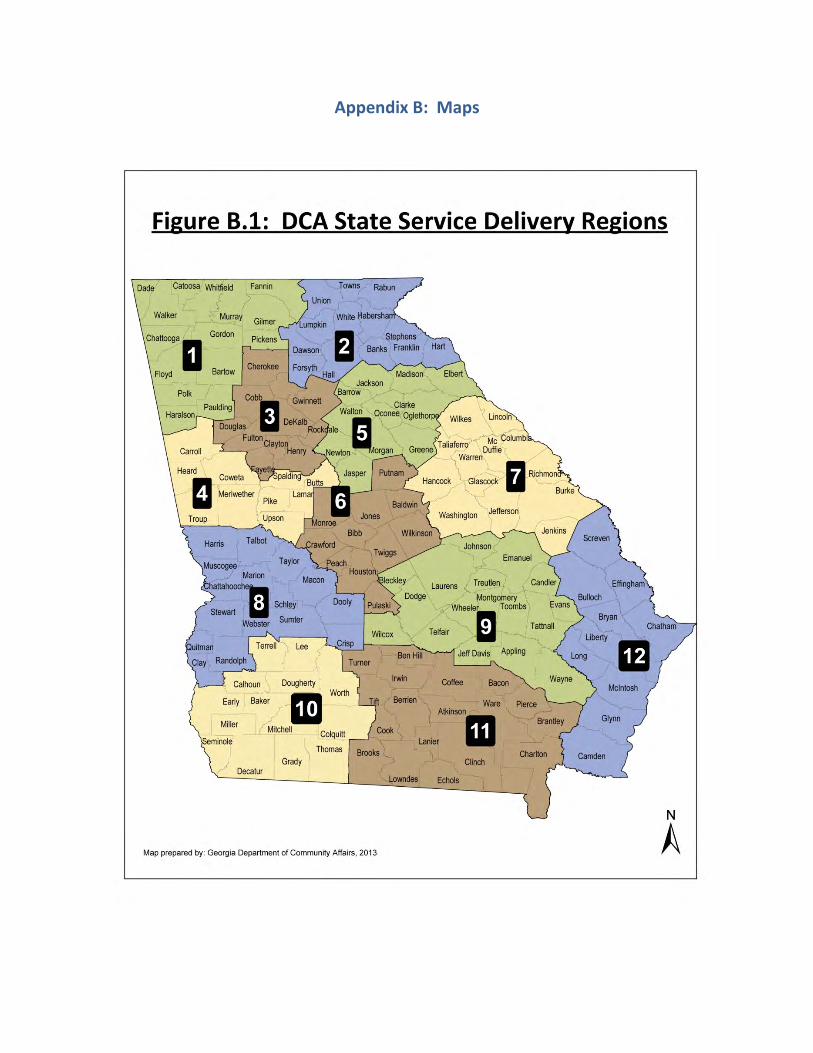
Appendix B: Maps