Embed Size (px)
Citation preview

ELSEVIER Int. J. Production Economics 45 (1996) 147-157
prod&ion economics
Inventories and customer service in Polish manufacturing companies
Danuta Kisperska-Moron*
Department of Business Logistics, Acndetny of Economics, ul. Bogucicko 14, 40-226 Katowice, Poland
Abstract
Challenging task of reconstruction of the Polish economy caused that the details of efficient company’s management tend to be neglected too often. Marketing and sales seem to be the current issues since the demand constraint puts severe limits to the volume of goods sold. The theory of the principles of modern logistics management becomes more and more popular; however, the precise tools and methods for managing effectively the flows of goods are not a common knowledge of the majority of managers as yet.
One of the major problems in the nearest future of Polish companies would concern strategy and management of customer service. The managers in Polish companies slowly becomes aware of the fact that a business that is successful in the long term is one of that provides for the needs of its customers better than its competition. However, performance measures of customer service are not widely used and recorded in many companies. An awareness of potential impact of the customer service on many aspects of the firm needs to be developed, so that it would help management increase the efficiency and effectiveness of a firm’s competitive position.
Inventories may support the customer service policy of a company, contributing to the net profits. On the contrary, inventories may be considered as a source of additional costs, therefore imposing some restrictions on reaching high levels of customer service. In both cases inventories play an essential role in shaping the final level of customer service in companies.
The paper addresses all the above mentioned problems. It has been based on the results of the survey on logistics management made in a sample of Polish manufacturing companies in 1993 and 1994.
Keyword: Inventories; Customer service; Polish manufacturing companies
1. Structure of inventories in the Polish economy
Experience of the last years has proved that both, the levels of inventories and their structure, were changing gradually as the transition economies were closer approaching the market rules. Inven-
* Tel.: 48 32 588 911; fax: 48 32 588 828.
tory levels were getting constantly lower and the share of finished products was growing larger (Fig. 1). It was true for general inventories in the economy.
However, the structure of inventories has been somewhat different in manufacturing sector, and, particularly, in its branches. Numbers in Table 1 present the structure of inventories in four different industries with various types of manufacturing
0925-5273/96/$15.00 Copyright x; 1996 Elsevier Science B.V. All rights reserved SSDI 0925-5273(95)00134-4

148 D. Kisprrslin-Moroniltlt. J. Production Economics 45 (1996) 147 Ii7
processes and different ranges of customers. Com- panies in metallurgical and electro-engineering industry still keep significant stocks resulting in the joint share of raw materials and work-in-process totalling up to 80-90X of the whole value of inven- tories. Chemical industry and light industry (e.g. plastic industry, ceramic industry and different types of small-scale supporting industries) have
1989 1990 1991 1993
q Finished products
q Work-in-process
0 Commodities
U Raw materials
Fig. I. The structure of inventories in Polish companies [l].
a significant share of finished products inventories and inventories of commodities reaching 40-50%.
These examples indicate that those branches which manufacture semi-products or means of pro- duction operate with high levels of inventories of production purposes. Products manufactured by those industries usually are destined for specified customers or particular orders. Stocks of final
products for ultimate consumers constitute the ma- jority of inventories in industries where products are typically designed for anonymous customers. In both these types of industries inventories of finished products and commodities might and should be an element of the customer service policy.
This paper attempts to justify the following pro- positions:
1. The changing structure of inventories in the Polish manufacturing industry is not a result of a deliberate policy in the field of customer service.
2. Levels and structure of inventories in the Polish manufacturing industry do not contribute to the achievement of the desirable level of cus- tomer service.
The analysis has been based on the sample of 30 companies in machine tools industry, 5 companies in metallurgical industry, 5 companies in chemical industry, 6 companies in non-fashion textiles and 6 companies in different branches of light industry.’
‘This research and survey was a part of the project sponsored by
the Central European University Research Grant no. 526;93.
The project was titled “Logistic Change During the Transition
Period in the Polish Economy”.
Table 1
The structure of inventories (O/u) in selected branches of the Polish industry [l]
Industries 1991 1992
RM WP FP GG RM WP FP CG
Poland-total 36.6 15.6 10.0 28.8 35.0 16.1 19.2 29.7
Industry: 46.9 24.8 23.0 5.3 45.9 24.3 23.2 6.5
Metallurgical 50.9 38.1 9.0 2.0 52.6 38.7 7.3 I .4
Electra-engineering 42.4 37.0 15.3 5.3 40.5 38.2 14.4 6.9
Chemical 49.5 12.4 32.0 6.1 47.3 12.2 31.4 9. I Light 29.3 22.3 39.6 8.8 30.6 22.2 37.1 10.1
RM raw materials; FP finished products; WP ~ work in progress; CG commercial goods.

D. Kispersku-Moron/Int. J. Production Economics 45 (1996) 147-157 149
Table 2
The structure of inventories (%) in the surveyed sample in 1993
Industries
Small machine tools
Metallurgical
Chemical
Light
Non-fashion textiles
Raw Work-in- Finished
materials process products
44.00 40.35 15.65
34.25 55.00 10.75
44.50 17.50 38.00
27.00 27.25 45.15
47.00 23.00 30.00
Table 3
Proportions of made-to-order and made-to-stock productton in
the surveyed sample
Industries Production made
to stock to order
Small machine tools 10 90
Metallurgical 8 92
Chemical 5 95
Light 28 72
Non-fashion textiles 5 95
The structure of inventories in the surveyed sample is presented in Table 2. That structure gen- erally resembles the pattern from Table 1 with exception of the non-fashion textiles industry. The share of raw materials inventories in those com- panies, producing mainly rugs and floor finish, used to be twice that large as in the other branches of light industry.
The structure of inventories results also from the average division between made-to-order and made- to-stock production. The larger share of inventories of finished products in light industry results partly from the relatively larger share of made-to-stock production in that branch (Table 3).
2. Multiple aspects of customer service
Customer service is a very wide term and varies from one company to the next. Moreover, vendors and customers often view that concept quite differ- ently. Without going into sublime theoretical dis- putes, the term “customer service” in this paper has
been used in a very broad sense and denotes not only a function or activity that has to be managed, such as order processing, invoicing and postsale support, but mainly deals with the total corporate philosophy and attitude leading to the planned action in the company and the market [a].
In practice, in order to make some diagnostic statements about customer service one has to be
able to measure the performance of the logistic system and how well that system creates time and place utility for a product. The most popular classi- fications divide the elements commonly associated with customer service into three groups: pretran- scation, transaction and post-transcation [3,4]. Discussion presented in this paper will take into account some of the basic elements and indicators of customer service:
1. Availability of an item, representing the abil- ity of the supplier to satisfy customers orders within a time limit (accepted generally for the particular
item). The number of stockouts is a usual measure of product availability.
2. Delivery time, elapsing between receipt by the supplier of a firm commitment for an order and receipt of the goods by the customer.
3. Reliability, meaning the supplier’s commit- ment to maintain a promised delivery schedule.
4. Accuracy of quantities and products ordered. Those elements as a rule have the most significant connection to the level and structure of inventories.
The level of customer service depends on a wide range of diversified factors; nevertheless, it is gener- ated mainly by the situation on the market and
mutual relations between buyers and sellers. Since the, so-called. sellers market does not exist in Poland any more, at present manufacturing and trade companies have to be more aware of the pattern of customers’ demand. Surveyed companies reported certain requirements that their customers expect from deliveries (Table 4).
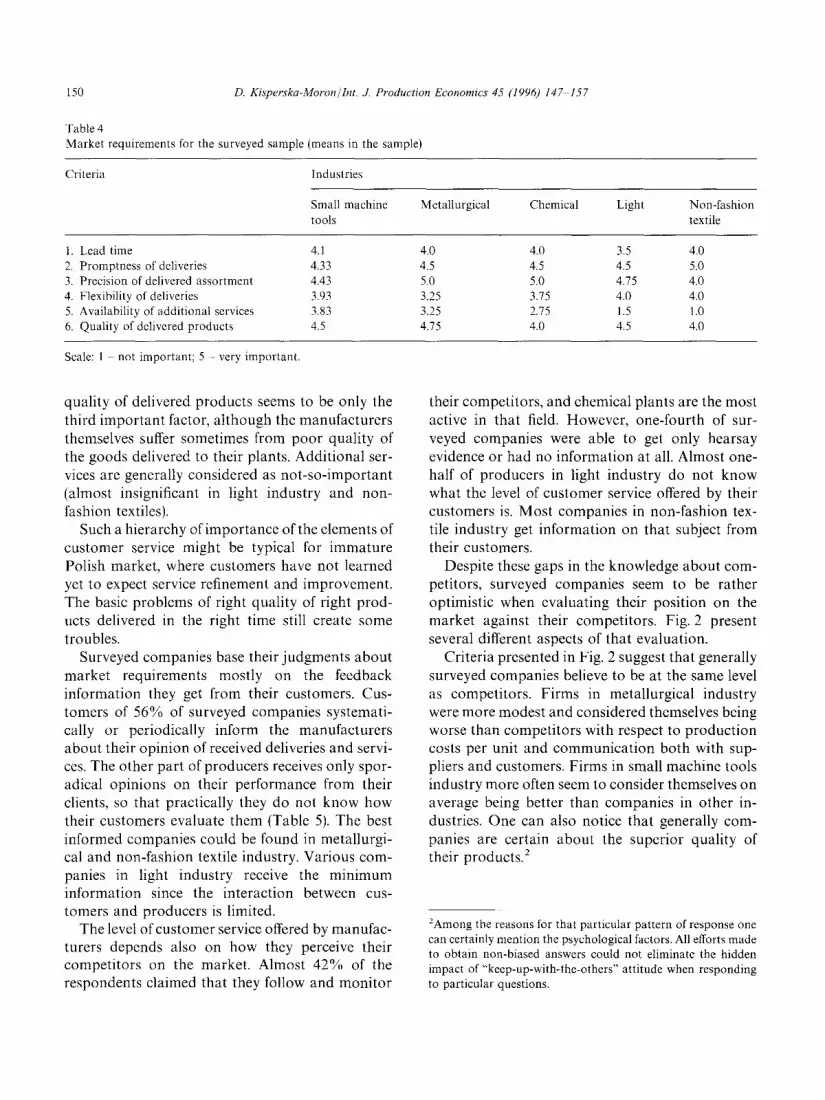
Table 4 presents different factors that manufac- turers have to consider while dealing with their customers. According to that opinion of producers actual market requires first of all that deliveries include precisely the ordered assortment of goods (particularly in metallurgical and chemical indus- try) and that deliveries are prompt (especially in non-fashion textiles industry). In that context the
150 D. Kisperska-MoronlInt. J. Production Economics 45 (19%) 147-157
Table 4
Market requirements for the surveyed sample (means in the sample)
Criteria Industries
Small machine Metallurgical Chemical
tools
Light Non-fashion
textile
1. Lead time 4.1 4.0 4.0 3.5 4.0
2. Promptness of deliveries 4.33 4.5 4.5 4.5 5.0
3. Precision of delivered assortment 4.43 5.0 5.0 4.15 4.0
4. Flexibility of deliveries 3.93 3.25 3.75 4.0 4.0
5. Availability of additional services 3.83 3.25 2.15 1.5 1.0
6. Quality of delivered products 4.5 4.75 4.0 4.5 4.0
Scale: I not important; 5 very important.
quality of delivered products seems to be only the
third important factor, although the manufacturers themselves suffer sometimes from poor quality of the goods delivered to their plants. Additional ser- vices are generally considered as not-so-important (almost insignificant in light industry and non- fashion textiles).
Such a hierarchy of importance of the elements of customer service might be typical for immature Polish market, where customers have not learned yet to expect service refinement and improvement. The basic problems of right quality of right prod- ucts delivered in the right time still create some
troubles. Surveyed companies base their judgments about
market requirements mostly on the feedback information they get from their customers. Cus- tomers of 56% of surveyed companies systemati- cally or periodically inform the manufacturers about their opinion of received deliveries and servi- ces. The other part of producers receives only spor- adical opinions on their performance from their clients, so that practically they do not know how their customers evaluate them (Table 5). The best informed companies could be found in metallurgi- cal and non-fashion textile industry. Various com- panies in light industry receive the minimum information since the interaction between cus- tomers and producers is limited.
The level of customer service offered by manufac- turers depends also on how they perceive their competitors on the market. Almost 42% of the respondents claimed that they follow and monitor
their competitors, and chemical plants are the most active in that field. However, one-fourth of sur- veyed companies were able to get only hearsay evidence or had no information at all. Almost one- half of producers in light industry do not know what the level of customer service offered by their customers is. Most companies in non-fashion tex- tile industry get information on that subject from their customers.
Despite these gaps in the knowledge about com- petitors, surveyed companies seem to be rather optimistic when evaluating their position on the market against their competitors. Fig. 2 present several different aspects of that evaluation.
Criteria presented in Fig. 2 suggest that generally
surveyed companies believe to be at the same level as competitors. Firms in metallurgical industry were more modest and considered themselves being worse than competitors with respect to production costs per unit and communication both with sup- pliers and customers. Firms in small machine tools industry more often seem to consider themselves on average being better than companies in other in- dustries. One can also notice that generally com- panies are certain about the superior quality of their products.’
‘Among the reasons for that particular pattern of response one
can certainly mention the psychological factors. All efforts made to obtain non-biased answers could not eliminate the hidden
impact of “keep-up-with-the-others” attitude when responding
to particular questions.

D. Kisperska-Moron/M J. Production Economics 45 (1996) 147-157 151
Table 5
Measurement of customer service (percent of respondents)
Problems Industries
Small
machine
tools
Metallurgical Chemical Light Non-fashion Average
textiles
Does your company measure the level of customer service?
Systematically or periodically 43.3
When customers complain 23.4 Lack of information 33.3
Do your clients inform you how they evaluate your services?
Systematically or periodically 40.0
Seldom, sporadically 60.0
Never
50.0
50.0
75.0
25.0
Does your company know competitors very well?
Yes, from customers 24.2 25.0 Yes, we watch them carefully 48.5 50.0 Hearsay evidence 21.2
No information 7.1 25.0
Did your company define customer service standards?
We have the whole set of standards 23.3 50.0 We have one or two accepted standards 33.3 25.0 No standards have been defined 43.5 25.0
Does your company ask its customers to define customer standards?
Several customers in each market segment 33.3 75.0 Few casual customers 43.3 25.0 No information 23.4
How often customer service is reported and analysed?
Constantly with respect to individual orders
and customers 13.3 Daily or once a week
Monthly or even less frequently 30.0 50.0 Never or almost never 56.1 50.0
25.0 25.0 90.0 46.7 50.0 50.0 10.0 26.1 25.0 25.0 ~ 26.6
50.0 25.0 90.0 56.0 50.0 75.0 10.0 44.0
75.0
25.0
75.0 75.0 80.0 25.0 25.0 20.0
25.0 25.0 90.0 49.1 50.0 25.0 10.0 30.7 25.0 50.0 - 19.6
25.0 50.0 17.7
25.0 25.0 80.0 42.0 50.0 25.0 20.0 40.3
25.0 90.0 32.8 25.0 10.0 41.7 25.0 ~ 14.2
25.0 - 11.3
14.7
57.7
27.6
Generally, one may have an impression that companies realize how tough the market require- ments are but those firms are also quite confident that they can cope with those requirements not worse than their competitors. Hence, the next problem arises: what activities do firms undertake in order to compete in the field of customer service and are they strictly connected to inventories management?
3. Performance measurement of customer service
In order to perform well in the field of customer service, companies should not only formulate
a proper strategy but should also develop a habit of constant measurement of that performance. Hence, the next problem - what should they measure? Some aspects of performance measurement have been presented in Table 5.
The first step would require the formulation of some evaluation standards of company’s customer service level (question no. 4 in Table 5). More than one-half of surveyed companies formulated one or two standards of their customer service (mostly lead times and number of stockouts). Only few companies defined the whole range of such stan- dards and, unfortunately, more than one-fourth of firms have not defined any standards of customer

152 D. Kisperslia-MoronlInt. J. Production Economics 45 (1996) 147-157
Criteria Customer service indicators
Unit production costs
Product quality
Production time
Lead time Late deliveries
Delivery promptness
Assortment flexibility Lead time
Production flexibility
Length of design cycle Production cycle time
Sales performance
Contact with suppliers Customer satisfaction
Contact with customers
Self-evaluation
Industries Industries
n smtools q metallur 0 chemical q light @textile n smtool a metallur 0 chemical q light q textile
Fig. 2. How surveyed manufacturers classify themselves against
their main competitors.
Fig. 3. What do firms measure in the field of customer service’?
service. Almost half of the formulated standards manufacturers used to discuss with a bunch of customers from different market segments (ques- tion no. 5 in Table 5). However, almost one-fifth of standards have been adopted with no information received from customers, thus relying on arbitrary judgments of producers themselves.
Relying on the data in Table 5, we can assume that 72.4% of surveyed companies have some sort of defined standards of customers service and 19.6% of them does not get any feedback from customers. This means that 14.19% C(72.4 x 19.6),1 1001 of surveyed firms may set false criteria for evaluation of customer service. Adding up the 27.6% of companies that do not use any standards we get a group of almost 42% of surveyed com- panies risking the lack of knowledge about the desired service level offered to their customers. Hence, the conclusion may be drawn that also the level of inventories in those companies has been shaped in a random manner or at least to criteria that do not reflect the market realities.
Almost one-half of surveyed companies claimed
that they systematically measure their level of cus- tomer service. About one-fourth of firms in the sample are interested in that subject only when they receive complaints from their customers. Another one-fourth of firms do not measure the level of customer service at all and these are mostly the companies with no defined standards for such a measurement. Fig. 3 presents more details about performance measurement in the field of customer service in surveyed companies.
Fig. 3 presents a picture of behavior of manufac- turers. Practically all producers have current data
on the level and structure of inventories but gener- ally they do not know exactly if their stocks are high or low compared to market requirements. Also firms often do not measure either lateness of dispatched deliveries or customer satisfaction. There is more interest in lead times and actual length of production cycle but all those measure- ments differ largely depending on the particular industry. There is no clear pattern emerging in this
0 20406080,
%

D. Kisperska-Moron/Int. J. Production Economics 45 (1996) 147-157 153
area; however, one may risk the following conclusions: ~ metallurgical and chemical industries are little
more conscious than the others about the time utility aspect of their products,
-. companies in light industry seem to neglect the time values in spite of the fact that they pay attention to customers’ satisfaction,
~ non-fashion textile industry does not measure almost any of those aspects. Comparing the practice of measurement of cus-
tomer service with the market requirements where the most important are: precision of delivered as- sortment and promptness of deliveries (Table 5) the following conclusions could be drawn: - detailed records of inventory status might be
helpful for the assortment accuracy of deliveries. - promptness of deliveries is not a declared policy
since time factors are often neglected; therefore, there is no ground for active inventory policy in the majority of surveyed companies.
Data on customer service level have been reported to be used practically once per month or even more seldom in 42% of surveyed companies. Another 40% (in small machine tools even 56%) claim that they never or almost never use their piece of avail- able information on how they perform in the held of customer service; that is the next factor which determines the weak interdependence between re- quirements of the market with its customers and inventories held by manufacturers.
4. Levels of inventories and lead times
The structure of inventories does not reflect their levels. In Poland absolute levels of inventories dropped in industry by around 20% in the period of 1990-1993. Nevertheless, their relative levels still seem to be quite high. Table 6 presents the levels of inventories in the surveyed sample. According to
the rule they are higher in industries where the range of finished products is larger (i.e. machine tools industry, metallurgic industry and various types of light industry).
In all industries (except of non-fashion textiles) the relative levels of finished products are higher than those of raw materials. On the average, these
Table 6
Levels of inventories in the sample
Industries
industries
1. Small machine tools
2. Metallurgical industry
3. Chemical industry
4. Light industry
5. Non fashion textiles
Average in the sample
Raw Finished
materials products
in days
55 74
45 56
20 22
36 48
39 27
39 45
inventories cover production requirements of 5.5 weeks and customers demand of 6.5 weeks. It seems that in the situation when the majority of com- panies declares to make to order such high levels of inventories of finished products might indicate
wrong policies or lack of any inventory strategy at all.
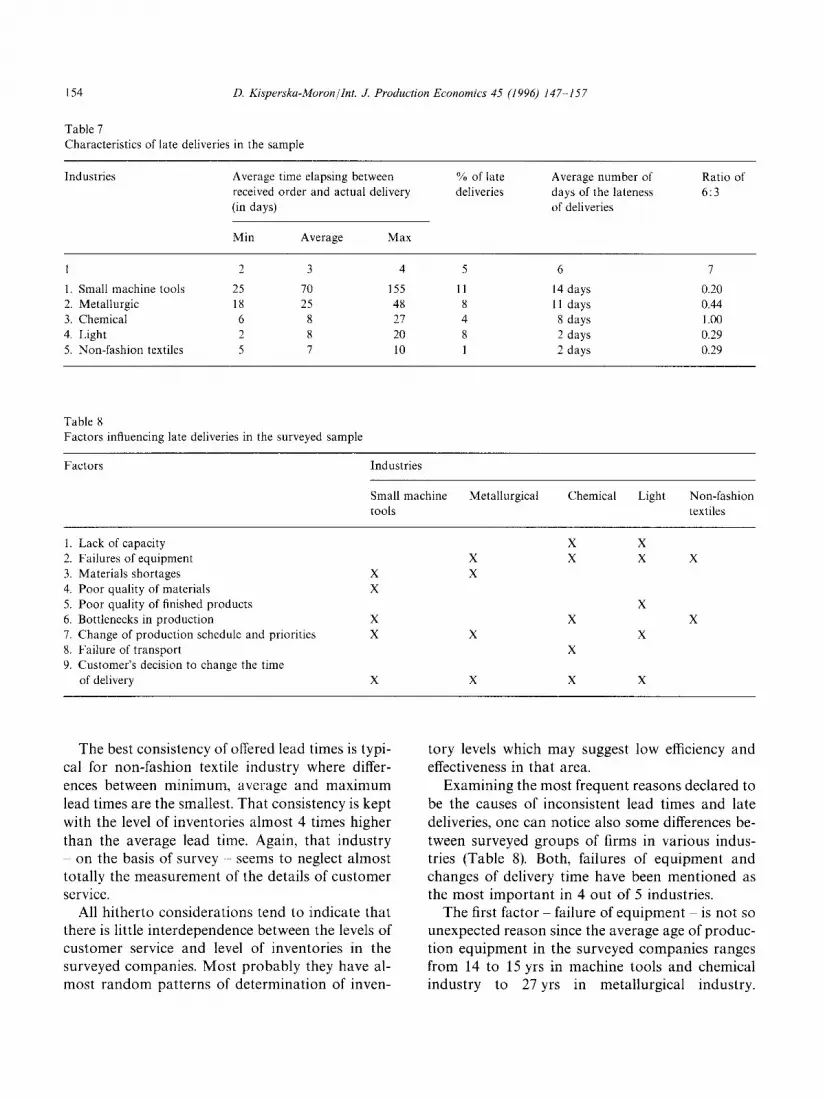
In order to evaluate the full extent of late delive- ries it might be useful to multiply the % of late deliveries times the ratio of days late and relate that to the average lead time (Table 7).3 That indicator is the smallest in case of small machine tools indus- try (11 x 0.20 = 2.2) and not much higher for the light industry (8 x 0.29 = 2.32). Small machine tools industry achieves that result with inventories almost equal to the offered lead time while light industry holds inventories almost 7 times larger than the average lead time (almost 2.5 times larger than maximum lead time).4 The extent of late or- ders seems to be the worst in chemical industry (with inventories 3.5 times exceeding average lead time) and in metallurgical industry (with invento- ries only 2 times bigger than lead times). It definite- ly does not support the picture of all the efforts in those industries made in order to measure the lead times and late deliveries, presented in the preceding section.
“Such indicator aggregates not only the relative number of late
deliveries, but also addresses the relative period of lateness
compared to the average lead time.
41t may be generated by the higher ratio of made-to-stock
production in light industry.
154 D. Kisperska-MoronlInt. J Production Economics 45 (1996) 147-157
Table 7
Characteristics of late deliveries in the sample
Industries Average time elapsing between
received order and actual delivery
(in days)
Min Average Max
% of late
deliveries
Average number of
days of the lateness
of deliveries
Ratio of
6:3
1 2 3 4 5 6 I
1. Small machine tools 25 70 155 11 14 days 0.20
2. Metallurgic 18 25 48 8 I1 days 0.44
3. Chemical 6 8 21 4 8 days 1 .oo
4. Light 2 8 20 8 2 days 0.29
5. Non-fashion textiles 5 7 10 1 2 days 0.29
Table 8
Factors influencing late deliveries in the surveyed sample
Factors Industries
Small machine
tools
Metallurgical Chemical Light Non-fashion
textiles
1. Lack of capacity
2. Failures of equipment
3. Materials shortages
4. Poor quality of materials
5. Poor quality of finished products
6. Bottlenecks in production
7. Change of production schedule and priorities
8. Failure of transport
9. Customer’s decision to change the time
of delivery
X X X X X X
X X X
X X X X X X X
X
X X X X
The best consistency of offered lead times is typi- cal for non-fashion textile industry where differ- ences between minimum, average and maximum lead times are the smallest. That consistency is kept with the level of inventories almost 4 times higher
than the average lead time. Again, that industry ~ on the basis of survey - seems to neglect almost totally the measurement of the details of customer service.
tory levels which may suggest low efficiency and effectiveness in that area.
Examining the most frequent reasons declared to be the causes of inconsistent lead times and late deliveries, one can notice also some differences be-
tween surveyed groups of firms in various indus- tries (Table 8). Both, failures of equipment and changes of delivery time have been mentioned as the most important in 4 out of 5 industries.
All hitherto considerations tend to indicate that The first factor - failure of equipment ~ is not so there is little interdependence between the levels of unexpected reason since the average age of produc- customer service and level of inventories in the tion equipment in the surveyed companies ranges surveyed companies. Most probably they have al- from 14 to 15 yrs in machine tools and chemical most random patterns of determination of inven- industry to 27 yrs in metallurgical industry.

D. Kisperska-Moron/Int. J Production Economics 45 (1996) 147-157 155
However, the lack of manufacturers’ abilities to conform to changing time of delivery prove that the desired flexibility of operation is missing. The struc- ture of inventories is not helpful in that respect since the share and levels of raw materials and work-in-process inventories are too high to react efficiently to such changes. Even large stocks of finished products do not contribute to greater flex- ibility because often these stocks do not include the items mostly desired by the customers (mostly due to limited knowledge of customers’ requirements).
Such a situation is even more frustrating since lead times and conditions of deliveries are negoti- ated with customers and perhaps only manufac-
turers in metallurgical and light industry feel being more pressed by customers. All these indicate that
manufacturers do not fully understand the total concept of superior customer service or perhaps even if they do understand, firms often do not have the required technical and organizational means to implement these concepts in practice and associate it with efficient inventory management.
Surveyed companies mentioned also some other reasons as being important for lateness of their deliveries such as bottlenecks in production process that occur together with changes of production schedules and changing production priorities. The art of precise translation of customers demand into the language of flexible production runs and eco-
nomic batch sizes still has to be mastered.
5. Prospects for the future
This paper has not been aimed at proving speci- fic research hypotheses concerning the relation be- tween inventories and customer service. There is quite a range of good recent literature in that field (e.g. [S, 61 and many others). The paper intended rather to present the general drawbacks and ob- stacles that have to be faced by many of the Polish companies on their way to efficient customer ser- vice in connection with inventory problems. On the basis of the set of discussed earlier factors one can predict what could be obtained in that field in the nearest future.
The relation between the actual structure and level of inventories and required level of customer
service is not very close. The following factors ex- plain that loose connection: - lack of proper knowledge in manufacturing com-
panies about the real expectations of their cus- tomers due to inadequate information system,
_ too much confidence in company’s own success and a sort of natural abilities to satisfy cus- tomers’ demand,
_ missing tradition and lack of professional tools for management of customer service,
~ conservative management methods and philos- ophies, inherited from central planning era and familiar to the majority of personnel, influence the current practice although they are not valid any more and have to be replaced. Surveyed companies usually consider their in-
ventories as a burden with financial consequences
for the firm and very seldom as a creative tool for a desired customer service level. However, that con- cept of inventory management requires some addi- tional shifts and changes. Table 9 presents the fields essential for improved inventory management and shows on which of those fields surveyed companies focused their attention and resources.
The most important area into which companies invested their resources was computer hardware and software. This is a very significant development im- proving information flows and tightening control procedures. Quick and reliable information will also suit the purpose of better inventory management. Present information systems do not fully support the flow of materials and products, partly due to inad- equate structure and quality of those systems. The most common use of computers in different areas of company’s activities has been presented in Fig. 4.
The outstanding fields with the highest degree of computerization are “sales” and ‘warehousing” (to- gether with inventory management). These are mainly systems used for invoicing, keeping current records of inventories, updating the list of com- pany’s customers, etc. Generally, very poor use of computers is typical for the areas closely connected to efficient customer service, i.e. sales forecasting and communication with suppliers and customers. Transport is the least computerized field out of the whole logistic chain. All these areas require better computerized information systems suitable for management purposes. Information technology is

156 D. Kisprrsku-Moron!Int. J. Production Economics 45 (1996) 147-157
Table 9
Areas where resources where directed during last two years in the surveyed sample of companies
Areas Industries
Small machine
tools
Change of organization of production 2.60
Computer hardware and software 3.37
Personnel training 2.57
Automation of production 1.83
Just-in-time systems 1.77
Reduction of production time 2.51
Materials requirements planning systems 2.90
Reduction of setup times 2.00
Systems analysis 2.27
Statistical control methods 2.00
Close cooperation with suppliers 3.20
Total quality management 2.90
Metallurgical Chemical Light
2.15 4.75 1.75
3.15 4.67 3.00
3.75 3.50 2.25
2.50 3.75 2.00
2.25 2.25 1.25
2.25 3.25 2.25
2.00 1.75 I .25
2.50 2.75 2.00
3.00 2.50 1.25
2.25 2.50 1.75
3.15 3.25 2.50
3.75 3.50 2.25
Non-fashion
textile
4.00
5.00
3.00
4.00
2.00
1 .oo
2.00
2.00
2.00
2.00
3.00
3.00
Average
3.17
3.96
3.01
2.82
I .90
2.26
I .98
2.25
2.00
2.10
3.14
3.08
Note: I no resources directed; 5 great resources directed.
Areas of use
Sales forecasting
Purchasing and supply
Production planning
Warehousing and invent i2\05 ~
Transport
Sales
Contact with suppliers
Contact with customers 1-1 1.87 : /
I / i4 012345
Extent of use
Fig. 4. Use of computers in the surveyed companies.
going to be a key component in future logistic systems [7, 81.
Improvement of customer service and efficient inventory management requires essential restruc-
turing of many other phases of logistics process. Surveyed companies put much effort into tightened cooperation with suppliers but did not invested much into just-in-time systems and material re- quirements planning (Table 9). Examined com- panies focused their resources also on the total quality management and changes in the organiza- tion of production process. All these efforts suggest that surveyed manufacturers strive for better opera- tion and performance in materials management and production. However, they do not put enough investment effort into logistics connected directly to customer service.
The growing degree of market saturation in Poland and also globally, will force Polish com- panies to search for additional tools to achieve competitive advantages. It can be noticed already since surveyed firms get less and less return on what they invest into marketing and production. The interdependence between inventories and customer service is an example of the relation between invest- ments and benefits that potentially could be ob- tained. However, efficiency in that area can be achieved only after intensive training and educa- tion of top management and executives. They must be able to gather the necessary logistics informa- tion and process it for the purpose of operational activities and strategic management [a]. Top man- agement support is critical to the development,
D. Kisprvska-Moron!Int. J. Production Economics 45 (I 996) 147-157 157
implementation and use of logistics information
systems at the advanced level of customer service. r51
References C61
PI
PI
c31
c41
Statistics Yearbooks of 1991. 1992. 1993, The Main Statistic
Office. Warsaw.
Stock, J.S. and Lambert. D.M.. 1987. Strategic Logistic
Management. Irwin. Homewood, pp. 1133115.
Ballou. R.H.. 1994. Business Logistics Management, Pren-
tice-Hall. Englewood Cliffs, NJ, pp. 80-81.
La Londe. B.J. and Zinszer. P.H., 1976. Customer Service:
Meaning and Measurement. National Council of Physical
Distribution Management. Chicago. pp. 272 ~282.
c71
PI
c91
Innis, D.E. and La Londe. B.J., 1994. Customer service: The
key to customer satisfaction. customer loyalty, and market
share. J. Bus. Logist., 15(l): l-28.
La Londe. B.J.. Cooper. M.C. and Noordewier, T.G.. 1988.
Customer Service: A Management Perspective. Council of
Logistics Management. Oak Brook.
Dawe, R.L., 1994. An investigation of the pace and deter-
mination of information technology use in the manu-
facturing materials logistics system. J. Bus. Logist., 15( 1): 229-260.
Mentzer. J.T. and Firman, J.. 1994. Logistics control sys-
tems in the 21st century. J. Bus. Logist.. 15(l): 215-228.
Bardi, E.J., Raghunathan, T.S. and Bagchr. P.K., 1994.
Logistics information systems: The strategic role of top
management. J. Bus. Logist., 5(l): 71-86.


![Cuba and Poland's Development Aid: the Activity of Polish NGOs in Cuba [Polish]](https://img.pdfslide.net/doc/110x75/631600c585333559270d664d/cuba-and-polands-development-aid-the-activity-of-polish-ngos-in-cuba-polish.jpg)


![Polish sortie on Myszyniec on 3rd September 1939 [Language: Polish]](https://img.pdfslide.net/doc/110x75/6324775b58da54334106498f/polish-sortie-on-myszyniec-on-3rd-september-1939-language-polish.jpg)