Embed Size (px)
Citation preview
University of Nevada, Reno
A Study of Factors that Impact Middle School Teacher Job Satisfaction
A dissertation submitted in partial fulfillment
of the requirements for the degree of Doctor of Education in
Educational Leadership
by
Kristen Maria McNeill
Dr. William Thornton, Dissertation Advisor
May 2016

Copyright by Kristen M. McNeill, 2016
All Rights Reserved
We recommend that the dissertation
prepared under our supervision by
KRISTEN M. MCNEILL
Entitled
A Study Of Factors That Impact Middle School Teacher Job Satisfaction
be accepted in partial fulfillment of the
requirements for the degree of
DOCTOR OF EDUCATION
Dr. William Thornton, Advisor
Dr. Joan Taylor, Committee Member
Dr. Gus Hill, Committee Member
Dr. Janet Usinger, Committee Member
Dr. Tom Harrison, Graduate School Representative
David W. Zeh, Ph. D., Dean, Graduate School
May, 2016
THE GRADUATE SCHOOL
i
ABSTRACT
There is a developing body of research suggesting low job satisfaction among teachers can
lead to potential consequences for educators, students, and school districts (Darling-Hammond,
2010; Ladebo, 2005; Sarnek, Musser, Caskey, Olsen & Green, 2006; Wu & Short, 1996). There is
also a growing concern about the number of teachers who are going to be retire soon; this loss of
experienced teachers may impact student learning. Recent research (NYSED, 2010; NCTAF,
2003) supports an assumption that job satisfaction is a major factor to increase retention of
teachers; however, there is a need for more research in this area. As school districts experience
teacher shortages, there is an increased need to recruit, hire, and retain highly effective teachers
because of either teachers leaving the profession early or because of retirement. The purpose of
this study was to examine the level of job satisfaction among middle school teachers employed at
13 middle schools in an urban school district, as well as to identify factors associated with teacher
job satisfaction. The study considered workforce and policy issues which may be leading to highly
effective teachers leaving the profession early, therefore impacting student achievement. Data
were gathered utilizing the Job Satisfaction Survey (JSS), created by Dr. Paul Spector (1985). The
JSS assesses job satisfaction in nine subscales that include pay, promotion, supervision, nature of
work, operating conditions, coworkers, communication, fringe benefits, and contingent rewards.
These nine subscales are classified as either extrinsic or intrinsic factors of job satisfaction.
Additional survey questions provided demographic data in categories including age, gender,
highest level of education, subject matter taught, years to retirement, salary, total years of teaching
experiences and the number of schools in which the teacher had been employed.
Overall results suggest that differences among the various teacher groups were associated
with extrinsic motivation rather than intrinsic motivation. For example, the youngest group of
ii
teachers scored higher on extrinsic motivation than did the oldest group of teachers. When
significant group differences were found, these differences tended to be associated with the
variables Fringe Benefits, Promotion, and Total Extrinsic Motivation. In addition, the group of
teachers with the most experience scored lower on Extrinsic Motivation than did the group of
teacher with less experience. For many of the various groupings of teachers, the comparisons
were not significant. That is, the characteristics of the groups were not associated with
differences in measures of motivation. In many instances, there were not significant differences
across groups based on the overall Intrinsic Motivation and Extrinsic Motivation; however,
differences were apparent on the individual subscales of the JSS. In general, the Extrinsic
constructs were more important to younger teachers than were these same constructs were to
more veteran teachers.
A comparison of the responses of the teachers in this study to the response published by
Spector was conducted for each subscale and for total assessment score. Thus, a total of ten
comparisons between the results for the study sample and the teacher norms provided by Spector
were conducted. Seven of these comparisons were significant: Pay, Promotion, Supervision,
Working Conditions, Coworkers, Communication, and Total Score. In six of these comparisons
of the means, the sample means were higher than the norm means; only Working Conditions
were less important to the sample than to the comparison group. That is, for teachers in the study
sample, these measures from the JSS were more important than for the teachers in the
comparison group.
The open-ended responses provided meaningful insight into teacher motivation with
specific respect to “compelling reasons to stay in a school.” Compensation was a significant
theme that surfaced during the analysis; however, issues related to compensation are part of
iii
negotiations between the teachers’ union and the school district. Therefore, this area is mostly
beyond the control of a building level school administrator. The other significant themes were
Teachers Value Support, Character of My Work, Importance of Students, and Need for Respect.
These themes are not independent but each of these themes is subject to influence from within
the school.
The parallel studies conducted by both Cui-Callahan (2012) and Bumgartner (2013),
mirrored the results found in this study. Specifically, all three studies showed teacher
respondents scored higher in Intrinsic job satisfaction than Extrinsic job satisfaction.
Finally, using the results from this research will help to inform other districts with
information on what job satisfaction factors are important to teachers. It is notable that overall
teachers scored higher at all levels with intrinsic motivational factors, but that younger, less
experienced teachers rated extrinsic motivational factors higher. This will help school boards,
district level administration, and building principals to be better informed as to demographics of
teachers and how to best target job satisfaction type incentives to better recruit and retain
teachers. In this era of teacher shortages, it can only benefit districts to have as much information
and data as possible to attract teachers and to reduce teacher turnover costs.
iv
ACKNOWLEDGEMENTS
There are so many people in my life who made the completion of this dissertation
possible. This journey would not have been possible without the continued support and
unwavering commitment of my Advisor, Dr. William Thornton. Without his constant motivation
and encouragement I would not have completed this paper. Also, the encouragement, advice, and
tremendous help with the many sections from Dr. Joan Taylor was invaluable to the completion
of my paper. Dr. Usinger’s critical eye and help with the IRB process was also greatly
appreciated.
The superb assistance of Marisa Crowder as my data “guru” and advisor was also a
reason this paper was completed. She was amazing and always on time in turning data back
quick. The help and support of my Executive Assistant, Deborah Banks, for also cheering me on
as well as assisting with the final edits of the paper. The support of all my work colleagues was
tremendous and a great encouragement for me to keep plugging away.
To our dear long-time family friends, Dr. Timothy and Kathleen Harney for their
mentorship and guidance through my early career as a teacher and principal. I am where I am
today because of their wisdom.
To my Aunt Carolyn, who inspried me to become a teacher as she was one of the most
well-respected math teachers of her time. Her love and dedication to her students is what
teaching is all about. To my Uncle Mac, where it started with a lunch at a Marie Callendars, and
his guidance on my “change of direction” from hotel administration into education. Some of the
best advice I have ever been given.
To my brother, Mathew, and sisters, Shana and Sarah who put up with me growing up…I
love you all so much!

v
To my best friend, love of my life, and some-day husband, Michael, who constantly told
me to keep at it, don’t stop. You are right when you tell me, “You would not let a student in your
classroom say ‘I can’t’ so don’t say it yourself!” Thank you for always being there for
me…always.
To my dearest children, Ean Thomas and Ever June, you both have had to pay a price for
your mom working late nights and weekends…but, hopefully, you both will see that with hard
work and dedication great things will come your way. You both are the lights of my heart and
keep me centered on what is important in life.
Finally, to my mom, June, and my dad, Herb, for all your love and support. Dad, you
understood before it was in all the educational research, all about Rigor, Relavance, and
Relationships as a middle school principal. The fact students and teachers still keep in touch with
you, is a testament to this. Mom, your love and devotion to your own children is known to all of
us. You also loved and truly cared for all of the students and families you helped as a school
psychologist. A person could not ask for better parents. You both are the reason I stayed with
this adventure! Love forever, Krissy Lump Lump.
vi
TABLE OF CONTENTS
ABSTRACT ............................................................................................................................... i
ACKNOWLEDGEMENTS ....................................................................................................... iv
LIST OF TABLES ..................................................................................................................... xi
LIST OF FIGURES ................................................................................................................... xiv
CHAPTER I. OVERVIEW OF THE STUDY
Statement of the Problem ............................................................................................... 3
Purpose of the Study ...................................................................................................... 5
Focus of the Study ......................................................................................................... 5
Research Questions ........................................................................................................ 6
Method ........................................................................................................................... 7
Significance of the Study ............................................................................................... 8
Assumptions ................................................................................................................... 8
Limitations ..................................................................................................................... 8
Delimitations .................................................................................................................. 9
Definitions of Terms ...................................................................................................... 9
Organization of the Study .............................................................................................. 14
CHAPTER II. REVIEW OF LITERATURE
Background .................................................................................................................... 16
Foundational Theories of Job Satisfaction ..................................................................... 17
Hoppock ............................................................................................................. 18
Maslow ............................................................................................................... 19
Herzberg ............................................................................................................. 19
vii
Adams ................................................................................................................ 22
Vroom ................................................................................................................ 22
Locke.................................................................................................................. 23
Bullock ............................................................................................................... 24
Selected Theories of Job Satisfaction in Education ....................................................... 25
Lortie .................................................................................................................. 25
Sergiovanni ........................................................................................................ 26
Hackman and Oldman........................................................................................ 26
Spector ............................................................................................................... 27
Consequences of Teacher Satisfaction and Dissatisfaction: Retention and Turnover ... 27
Surveying Job Satisfaction ............................................................................................. 31
Early job satisfaction surveys ............................................................................ 31
Job Description Index (JDI) ............................................................................... 32
The Minnesota Satisfaction Questionnaire (MSQ) ............................................ 32
The Job Diagnostic Survey (JDS) ...................................................................... 32
MetLife Survey of the American Teacher ......................................................... 33
Job Satisfaction Survey (JSS) ............................................................................ 35
Compensation or pay ......................................................................................... 35
Promotion ........................................................................................................... 37
Supervision ........................................................................................................ 38
Fringe Benefits ................................................................................................... 39
Contingent Rewards ........................................................................................... 39
Operating Conditions ......................................................................................... 40
viii
Co-workers and Colleagues ............................................................................... 41
Nature of the Work ............................................................................................ 41
Communication .................................................................................................. 42
Other Studies Using Spector’s JSS .................................................................... 43
Demographic Variables Related to this Study ............................................................... 44
Gender ................................................................................................................ 44
Level of Formal Education Completed .............................................................. 45
Teaching Assignment......................................................................................... 45
Years of Teaching Experience/Seniority and Years to Retirement ................... 47
Age Group .......................................................................................................... 48
Summary ........................................................................................................................ 49
CHAPTER III. METHODOLOGY
Restatement of the Purpose ............................................................................................ 51
Research Design............................................................................................................. 52
Participants ......................................................................................................... 53
Instrument .......................................................................................................... 54
Independent and Dependent Variables .............................................................. 55
Consistency and Reliability of the Instrument .............................................................. 57
Validity of the Instrument .............................................................................................. 61
Data Collection ............................................................................................................. 62
Data Analysis Procedures .............................................................................................. 63
CHAPTER IV. RESULTS AND FINDINGS
Data for the Study .......................................................................................................... 68
Analysis by Groups ........................................................................................................ 76
ix
Analysis with Groups Established by Gender ............................................................... 76
Analysis with Groups Established by Age..................................................................... 78
Analysis with Groups Established by Teacher Education ............................................. 80
Analysis with Groups Established by Teaching Content Variable ................................ 82
Analysis with Groups Established by the Variable Years to Retirement ...................... 84
Analysis with Groups Established by the Variable Teaching Experience ..................... 86
Analysis with Groups Established by the Variable Number of Schools ....................... 89
Analysis with Groups Established by the Variable Teacher’s Salary............................ 91
National Population Compared to Sample ..................................................................... 93
Results from Open-Ended Questions ............................................................................. 94
Results by JSS Subscales ............................................................................................... 95
Analysis Independent of the JSS Subscales ................................................................... 98
Teachers Need Support ...................................................................................... 99
Character of My Work ....................................................................................... 101
Compensation .................................................................................................... 102
The Importance of Students ............................................................................... 103
Need for Respect ................................................................................................ 104
Summary ........................................................................................................................ 105
CHAPTER V. KEY FINDINGS, IMPLICATIONS FOR PRACTICE, RECOMMENDATIONS
AND CONCLUSIONS
Key Findings .................................................................................................................. 107
Open-Ended Responses ..................................................................................... 110
Implications for Practice ................................................................................................ 113
x
Summary ........................................................................................................................ 115
Recommendations .............................................................................................. 116
Conclusion ......................................................................................................... 117
LIST OF REFERENCES ........................................................................................................... 119
APPENDIX A: Permission to Use Job Satisfaction Survey ...................................................... 133
APPENDIX B: Job Satisfaction Survey .................................................................................... 135
APPENDIX C: Letter of IRB Approval from University of Nevada, Reno .............................. 139
APPENDIX D: Correspondence for Planned Survey ................................................................ 141
xi
LIST OF TABLES
Table 1. Middle Schools and Number of Teachers .................................................................. 53
Table 2. Description of the Nine Subscales ............................................................................. 55
Table 3. Item Numbers Corresponding to Each Subscale ....................................................... 57
Table 4. Description of Spector’s Samples .............................................................................. 58
Table 5. Internal Consistency and Reliability for the Job Satisfaction Survey ....................... 59
Table 6. Job Satisfaction Norms of Total Americans .............................................................. 60
Table 7. Job Satisfaction Norms for Primary and Secondary .................................................. 61
Table 8. Summary of Distributions of the Demographic Variables by Levels ........................ 70
Table 9. Summary of Means and Standard Deviations for the Two Intrinsic and Extrinsic
JSS Subscales ............................................................................................................ 72
Table 10. Comparison of Internal Reliability Coefficients (Cronbach’s alpha) for the Nine
JSS Subscales ............................................................................................................ 73
Table 11. Summary of Correlation Coefficients among the Nine Subscales ............................ 75
Table 12. Summary Means and Standard Deviations for the Two Intrinsic and Extrinsic
JSS Subscales: Groups Established by Gender ......................................................... 77
Table 13. Summary Means and Standard Deviations for the Nine JSS Subscales: Groups
Established by Gender ............................................................................................... 78
Table 14. Summary of Means and Standard Deviations for the Two Intrinsic and Extrinsic
JSS Subscales: Groups Established by Age Group ................................................... 79
Table 15. Summary Means and Standard Deviations for the Nine JSS Subscales: Groups
Established by Age Groups ....................................................................................... 80
xii
Table 16. Summary of Means and Standard Deviations for the Two Intrinsic and Extrinsic
JSS Subscales: Groups Established by Education Level ........................................... 81
Table 17. Summary Means and Standard Deviations for the Nine JSS Subscales: Groups
Established by Education Level ................................................................................ 82
Table 18. Summary of Means and Standard Deviations for the Two Intrinsic and Extrinsic
JSS Subscales: Groups Established Content Areas ................................................... 83
Table 19. Summary Means and Standard Deviations for the Nine JSS Subscales: Groups
Established by Content Areas .................................................................................... 84
Table 20. Summary of Means and Standard Deviations for the Two Intrinsic and Extrinsic
JSS Subscales: Groups Established by Years to Retirement ..................................... 85
Table 21. Summary Means and Standard Deviations for the Nine JSS Subscales: Groups
Established by Years to Retirement .......................................................................... 86
Table 22. Summary of Means and Standard Deviations for the Two Intrinsic and Extrinsic
JSS Subscales: Groups Established by Years of Teaching Experience .................... 87
Table 23. Summary Means and Standard Deviations for the Nine JSS Subscales: Groups
Established by Years of Teaching Experience .......................................................... 89
Table 24. Summary of Means and Standard Deviations for the Two Intrinsic and Extrinsic
JSS Subscales: Groups Established by Number of Schools Taught ......................... 90
Table 25. Summary Means and Standard Deviations for the Nine JSS Subscales: Groups
Established by Number of Schools Taught ............................................................... 91
Table 26. Summary of Means and Standard Deviations for the Two Intrinsic and Extrinsic
JSS Subscales: Groups Established by Teacher Salary ............................................. 92
xiii
Table 27. Summary Means and Standard Deviations for the Nine JSS Subscales: Groups
Established by Teacher Salary .................................................................................. 93
Table 28. Summary of Population and Sample Means for the Nine JSS Subscales: Result
of Nine One-Sample t-tests ....................................................................................... 94
xiv
LIST OF FIGURES
Figure 1. Illustrates and Details the Number of Levels and Coding Labels in Each of the
Ten Demographic Categories .................................................................................. 65
Figure 2. Open-Ended Responses: Frequency of Responses Using the JSS Subscales............ 98
Figure 3. Open-Ended Questions Analyzed Independently of the JSS .................................... 105

1
CHAPTER I
OVERVIEW OF THE STUDY
There is a developing body of research that suggests low job satisfaction among teachers
can lead to potential consequences for educators, students, and school districts (Darling-
Hammond, 2010; Ladebo, 2005; Sarnek, Musser, Caskey, Olson, & Greene, 2006; Wu & Short,
1996). There is also a growing concern about the number of teachers who are going to be retiring
soon; this loss of experienced teachers may impact student learning. A report by the National
Commission on Teaching and America’s Future (NCTAF, 2003) “Who Will Teach? Experience
Matters,” highlighted this issue and emphasized that current human capital policies in education
are very much misaligned with the needs of 21st century schools.
In recent years, the federal role in education has been increasing with monetary
requirements attached through such grant programs as Race to the Top and Teacher Incentive
Fund programs. The addition of new content standards and assessments, teacher evaluation
systems including student achievement data, as well as increasing demands on teachers to
produce high levels of achievement for every child may in fact exacerbate this exodus of
teachers (Ravitch, 2010).
Teacher attrition rates have been increasing since 1994 with 30percent of teachers leaving
the profession in the first five years (NCTAF, 2003). The estimated dollar cost associated with
teacher turnover is in the billions (NCTAF, 2003). The loss of highly effective teachers is
notably high in relation to chronically low performing urban schools and schools serving high
numbers of students who live in poverty. With veteran teachers leaving the profession because of
retirement policies as well as new teachers not remaining in the profession, it may in fact be
more difficult to close achievement gaps (NCTAF, 2003). Studies that have investigated job
2
satisfaction among different sectors of business, industry, and education have been able to
establish a foundation for later work in the area of job satisfaction and retention. Measuring job
satisfaction among employees has to include an understanding of what employees expect from
their careers (Blau, 1999; Mudor & Tookson, 2011). There is a history of research on employee
motivation going back to 1959 with Herzberg’s theory relating to job satisfaction (motivation),
dissatisfaction (hygiene factors), and the implications of these on employee retention. Two of the
constructs Herzberg and his colleagues developed to frame and categorize motivators that lead to
job satisfaction and retention of employees are intrinsic and extrinsic motivators (Herzberg,
Mausner, & Snyder, 1959). Through the study of these two constructs, educational leaders and
their human resource department staff may be able to analyze and possibly increase teacher
retention rates.
Recent research (NYSED, 2010; NCTAF, 2003) supports an assumption that job
satisfaction is a major component to increased retention by teachers; however, there is a need for
more research in this area. As school districts experience an increased need to recruit, hire, and
retain highly effective teachers because of either teachers leaving the profession early or because
of retirement, two issues have developed: (1) the correlations between teacher retention and job
satisfaction, and (2) policies and practices that correlate with a high level of job satisfaction in
the teaching profession. The findings of this study will add to the growing body of literature
concerning teacher job satisfaction and retention.
The different educational environments in which teachers are employed make it difficult
to accurately measure job satisfaction. Educational environments are affected by wealth factors
and poverty rates (high vs. low socio economic), school and district setting (rural vs. urban),
governance (effective local boards vs. ineffective local boards), and district and school
3
achievement rates (high performing vs. chronically underperforming). The recent works by Cui-
Callahan (2012) and Bumgartner (2013) studied teacher job satisfaction; although, these studies
are based on different populations of teachers (urban vs. rural), they had similar methodologies.
Both studies were conducted in the same western state as this current study. Cui-Callahan (2012)
and Bumgartner (2013) both utilized the Job Satisfaction Survey (JSS) with teachers in districts
in this western state. This study paralleled these two research studies; however, this study
focused on middle school teachers, examining their job satisfaction and retention within an urban
district. This study informs school and district leaders, school boards, and legislators about
factors and practices that could lead to higher retention and job satisfaction of highly effective
middle school teachers in this particular district.
Statement of the Problem
The issue of fewer new teachers entering the profession and current teachers leaving the
profession, either because of a percceived lack of support and job fulfillment or because of
current retirement policies, will lead to a collapse of a viable teacher pipeline on both ends
(NCTAF, 2003). As an example of the scope of the problem of retiring teachers, between 2004
and 2008, 300,000 teachers left the profession through retirement (NCTAF, 2003). The hiring,
recruitment, and retention practices that were employed during the industrial era in which
teachers entered the profession and worked for 20 to 25 years are no longer viable (NCTAF,
2003). For the 21st century, in order to have the best prepared students, an entire workforce
development plan for teachers may need to be created. However, before the plan is developed
more intense research in the area of specific factors related to why teachers are leaving the
profession is needed.

4
There are unique challenges associated with retention and job satisfaction faced by
teachers in urban districts, most notably in high poverty schools. For some time, researchers have
known that teachers tend to leave the profession early. Ingersoll (2003) reported that as many as
46 percent of teachers leave the profession within the first five years. He identified the following
reasons: low job satisfaction, the desire for a better job, the need for a better working
environment, and the pursuit of other careers.
The factors associated with teachers’ job satisfaction are not implicit. Teacher job
satisfaction has been studied; however, significant changes have occurred within the educational
environment during the past few years. The impacts of such significant changes on teacher job
satisfaction are not well understood. An understanding of such factors is critical if educational
leaders are to influence teachers’ job satisfaction.
The level of middle school was selected because teachers at this level represent an
understudied group. Middle schools have unique characteristics that differentiate them from
elementary and high schools; likewise middle school teachers differ from the rest of the teaching
population. The characteristics of middle school students are unique and require educators who
are responsive to the developmentally appropriate needs of this age group. According to Harley
(2010), the real purpose for the distinctive characteristics of a middle school education “is to
promote intellectual development for young adolescence and enable everyone to think creatively,
to problem solve and work well with others and develop factual knowledge and skills that help all
students at this age level meet or exceed academic standards” (p. 8). Such characteristics may be
associated with unique factors in relationship to job satisfaction.
5
Purpose of the Study
The purpose of this study was to examine the level of job satisfaction among middle
school teachers employed at 13 middle schools in an urban school district, as well as to identify
factors associated with teacher job satisfaction. The study considered workforce and policy
issues which may be leading to highly effective teachers leaving the profession earlier than
needed and therefore impacting student achievement.
A better understanding of these motivational factors could help educational leaders to
develop and implement appropriate policies, procedures, and workforce development programs
to address factors associated with key issues. This study also explored possible ways to improve
teachers’ job satisfaction, thereby impacting factors associated with effective school reform.
Focus of the Study
This study focused on middle school teachers and some of the unique characteristics of
their schools. Limited research was found in the area of middle schools and job satisfaction
(Coca & Marinell, 2013) and more research in this area was needed. Through the use of the Job
Satisfaction Survey (Spector, 1985) and additional demographic questions included in the
survey, this study helped to add to the research on middle school teachers and their job
satisfaction. Recruiting and retaining teachers is becoming more difficult as the demands of the
profession increase (NCTQ, 2014); middle schools are no exception and in fact in certain subject
areas such as math, science, and special education, there is a critical need for quality teachers.
According to the American Association for Employment in Education, there is a considerable
shortage in 14 of 62 fields reported in the Educator Supply and Demand survey, including the
areas of special education (nine categories), physics, chemistry, math, speech pathology, and
bilingual education (AAEE, Executive Summary, 2008). In researching middle school teachers
6
and their job satisfaction, it was hoped this information could then be used to better recruit, hire,
and retain teachers.
Research Questions
The eight research questions were designed to determine if significant differences existed
between the demographic categories in the survey and the two dependent variables of intrinsic
and extrinsic job satisfaction. The research questions were analyzed through the gathering of data
from survey respondents. The eight research questions that guided this study were:
1. Were there significant differences between/among groups of middle school teachers’
responses when groups were established by Gender based on Intrinsic Motivation and
Extrinsic Motivation and based on subscale scores of the Job Satisfaction Survey?
2. Were there significant differences between/among groups of middle school teachers’
responses when groups were established by Highest Level of Education based on
Intrinsic Motivation and Extrinsic Motivation and based on subscale scores of the Job
Satisfaction Survey?
3. Were there significant differences between/among groups of middle school teachers’
responses when groups were established by Teaching in Core subjects v. Teaching in
Non-core subjects based on Intrinsic Motivation and Extrinsic Motivation and based
on subscale scores of the Job Satisfaction Survey?
4. Were there significant differences between/among groups of middle school teachers’
responses when groups were established by Age Group based on Intrinsic Motivation
and Extrinsic Motivation and based on subscale scores of the Job Satisfaction
Survey?
7
5. Were there significant differences between/among groups of middle school teachers’
responses when groups were established by Years to Retirement in the Current
Retirement System based on Intrinsic Motivation and Extrinsic Motivation and based
on subscale scores of the Job Satisfaction Survey?
6. Were there significant differences between/among groups of middle school teachers’
responses when groups were established by Total Years of Teaching Experience
based on Intrinsic Motivation and Extrinsic Motivation and based on subscale scores
of the Job Satisfaction Survey?
7. Were there significant differences between/among groups of middle school teachers’
responses when groups were established by Number of Schools Taught based on
Intrinsic Motivation and Extrinsic Motivation and based on subscale scores of the Job
Satisfaction Survey?
8. Were there significant differences between/among groups of middle school teachers’
responses when groups were established by Salary based on Intrinsic Motivation and
Extrinsic Motivation and based on subscale scores of the Job Satisfaction Survey?
Method
Data was collected through the Job Satisfaction Survey (JSS) developed by Spector
(1985). The JSS assesses job satisfaction in nine subscales including pay, promotion,
supervision, nature of work, operating conditions, coworkers, communication, fringe benefits
and contingent rewards. These nine subscales are classified as either intrinsic or extrinsic factors
of job satisfaction. Additional survey questions were provided to gather demographic data in
categories including age, gender, highest level of education, subject matter taught, and years to
8
retirement under the current retirement system, salary, total years of teaching experience, and the
number of schools in which the teacher has been employed.
Significance of the Study
This study was significant for a variety of reasons. First, the body of literature on urban
middle school teachers and their job satisfaction is limited. Second, there are concerns with
teachers leaving the profession in high numbers. Third, the current method of hiring, recruitment,
and retention may be outdated. One of the significances of this study was to see if differences in
job satisfaction across demographic groups could possibly make known areas for further study,
and possibly lead to solutions to alleviate the challenges associated with teacher job satisfaction,
thus leading to higher retention rates among teachers.
Assumptions
The assumptions present in this study were:
1. The participants in this study were representative of the total population of middle
school teachers in this urban school district.
2. The survey participants answered truthfully and accurately.
3. The instrument was valid and reliable.
4. The written instructions on the survey were clear to participants.
Limitations
The limitations present in this study were:
1. The principal investigator is in a visible leadership position within the district and if
known by a middle school teacher, there may have been bias in responses provided.
9
2. There was a recent superintendent change in the district after a highly publicized
parting between the Superintendent and Board of Trustees which may have impacted
a willingness to complete the survey and the responses given by participants.
3. The participants may not have believed their answers would remain completely
anonymous, even though every effort was made to make this the case.
Delimitations
The study was delimited to one urban school district in a western state. Therefore, results
of the study were not generalizable to other districts, schools, or populations.
Definition of Terms
Terms referenced in this study were, for the purposes of this study, defined below.
Definitions without a citation imply that the definition is based upon a common, widely held
understanding of the context and intent of the term.
Academic core content classes - the definition of core curriculum were a set of academic courses
that were considered basic and essential for future class work and graduation. Math, science,
English, history and geography are current examples of core curriculum in a middle school or
high school.
Attrition – also called turnover, is the measured rate that employees leave the system in which
they are employed (National Center for Education Statistics, 2007).
Contingent rewards – Rewards (not necessarily monetary) that are given by employers that are
generally awarded for exemplary service or for productivity above a certain par level set by the
organization (Spector, 1997). In education, examples of contingent rewards are column shifts in
salary (contingent upon increased education for the teacher), step salary increases (contingent
10
upon successful and satisfactory completion of a year of teaching service), and more recently,
merit pay (usually contingent upon attainment of student achievement goals).
Coworkers – teachers who are employed in the same school, or, in the same school district. The
definition is based upon a common understanding of the use of the term coworker as it applies in
school settings.
Extrinsic factors – Herzberg (1968) defines extrinsic factors as those elements of the job that, if
present, may not necessarily cause satisfaction, but if absent, or applied incorrectly, could lead to
dissatisfaction. They include: company policies and administration, supervision, relationships
with supervisors, peers and subordinates, working conditions, salary and benefits, personal life,
job status, and job security. The term is interchangeably used in literature with hygiene factors
(Herzberg, 1968).
Fringe Benefits – benefits other than salary, which could be either monetary or non-monetary in
nature, such as health benefits, time off, flexible schedules, insurance, vacations, etc. (Spector,
1997).
Full-time – for the purposes of this study, full-time teachers were defined as employees who
teach classes for full school days and number of days established by the local bargaining
agreement in order to be considered a full-time teacher. In the state where the study was
conducted, this usually equated to a contracted teaching assignment of a minimum of 185 days.
Hygiene factors – Herzberg (1968) defined these factors as psychological factors connected to
extrinsic influences on an employee’s well-being. Hygiene factors are job-related factors that, if
present could bring feelings of satisfaction about the job, but if not present, or inappropriately
applied, could also be the cause of dissatisfaction. They include: company policy and
11
administration, supervision, relationship with supervisor, work conditions, salary, relationship
with peers, personal life, relationships with subordinates, status, and security (Herzberg, 1968).
Incentive pay – is similar to contingent rewards and is usually a method of monetary
compensation given as an incentive to reach certain goals and in school settings are usually
associated with increases in student achievement.
Intrinsic factors – Herzberg (1968) defined intrinsic factors as those elements of the job that
tended to create satisfaction. They can include: achievement, recognition, work itself,
responsibility, advancement, and growth.
Job dissatisfaction – are negative feelings towards one’s job or occupation (Spector, 1997).
Job satisfaction – states of mind of employees that are positively oriented, as well as about
different aspects of the job such as pay and promotion (Spector, 1997).
Job Satisfaction Survey (JSS) – The JSS was developed by Dr. Paul E. Spector (1985) and was
designed to measure the job satisfaction levels of employees in a wide variety of occupations, but
was designed initially for use in service organizations, and public service sectors. It is a 36 item
survey utilized to collect data regarding an employee’s level of satisfaction in nine areas
correlating to his/her current job satisfaction. Four subscales measure satisfaction on intrinsic
factors and five measure satisfaction concerning extrinsic factors of the job (Spector, 1997).
Likert scale – refers to the format utilized in the JSS to pose questions to the respondent. The
Likert format was created by Rensis Likert (1932) and has two notable features: (1) the
respondent is requested to respond to a question that asks them to agree or disagree with a
statement, and, (2) it requires that the respondent note the degree of agreement or disagreement
(Dillman, 2000). The JSS, which employs a six point Likert scale, was utilized in this study.
Spector (1985) created the six point scale for question response, which range from strongly
12
agree to strongly disagree and with four other possible responses between those extremes
(Spector, 1985).
MANOVA – Acronym for the multi-variate analysis of variance utilized in this study. A multi-
variate analysis of variance is an analysis of variance when there is more than one dependent
variable. According to Aron et al. (1994), a MANOVA will produce an overall significance level
for differences among the vector of means of the dependent variables.
Means – An average among two or more numbers, factors, or items (Aron et al., 1994).
Merit pay – refers to the practice of rewarding a worker for service or production that goes above
and beyond a par standard (Spector, 1997), such as student achievement scores that are well
above average, or for other service that is clearly meritorious. It usually is paid as a bonus, and is
not part of base salary. Merit pay is synonymous with incentive pay, pay for performance,
performance-based pay, etc.
Middle school – For the purposes of this study, middle school was defined as a school (or
teacher) level that serves students in grades sixth through eighth grades.
Nature of work – Refers to the normal and expected tasks that must be performed by the
employee, as well as the intrinsic and extrinsic feelings of the employee that may result as a
consequence of employment in that particular job or occupation (Herzberg, Mausner, Peterson,
& Capwell, 1959). For the purposes of this study, the extent to which an employee enjoys or
does not enjoy the nature of the work will be a measurement factor relative to job satisfaction.
Nonacademic content classes-those courses that are either not required for graduation (electives)
or classes other than core academic courses.
13
Operating procedures – Herzberg et al. (1959) described operating procedures as factors of the
job that are perceived by employees negatively as barriers to productivity and may add
unnecessarily to one’s work load.
Overall job satisfaction – The extent to which an employee or individual feels satisfied about the
many interrelated aspects of the job or occupation.
Pay – For the purposes of this study, according to Spector (1997) pay is defined as a method of
financial compensation for doing routine, scheduled, or interval tasks as prescribed by a job.
Principal – A building-level administrator of a school.
Promotion – Advancements in careers usually associated with increases in compensation
(Herzberg et al., 1959).
Retention – The extent to which a school or school district is able to continuously employ an
employee in consecutive years (NCTAF, 2003).
School district – generally regarded as a cluster of schools under the supervision of a
superintendent, who oversees those schools exclusively.
Secondary school – For the purposes of this study, a secondary school was defined as a school
(or teacher) level that serves students in grades seven/nine through twelve.
SPSS – Acronym for the Statistical Package for Social Sciences program, for Windows 6.0,
which was the tool utilized in data analysis in this study.
Subscales – the term utilized by Spector (1997) to describe various aspects of the job which are
measured by the JSS. The subscales used in this study included: pay, promotion, supervision,
fringe benefits, contingent rewards, operating procedures, coworkers, nature of work, and
communication.
14
Supervision – One of the factors identified by Herzberg et al. (1959) as an extrinsic or hygiene
factor, which by its presence can cause satisfaction, or dissatisfaction, depending upon the
perceptions of the employee. Supervision may include overseeing the tasks that employees must
accomplish, goal setting and attainment, quality of work, and assurance that employees are
performing the required tasks in the manner expected by the company and/or supervisor.
Teacher – A person who is responsible for the instruction of pupils in an educational setting, and
who is responsible for the learning levels attained by students. For the purposes of this study,
was synonymous with full time employee.
Turnover – also called attrition, is the measured rate that employees leave the system in which
they are employed (National Center for Education Statistics, 1997).
Urban district – typically a school district found in large or urban cities, commonly with high
rates of poverty, minority students, and students who speak a second language.
Vector – a statistical construct that measures the movement and direction of a phenomenon. For
example, the vector of a traveling automobile would be the direction and velocity in which it is
moving, such as from SE to NW at 60 miles per hour (Aron, 1994).
Working conditions – an extrinsic factor identified by Herzberg et al. (1959) that influences,
either positively or negatively, the perceptions of employees in relation to their jobs, and which
can cause either satisfaction or dissatisfaction on the job. Working conditions may include: hours
worked, the environment under which work is performed, such as indoor work vs. outdoor work,
air conditioning vs. none, the quality of supervision, and a variety of other factors that are non-
compensatory in nature.
Organization of the Study
In this study, job satisfaction was assumed to be a key determining factor related to one’s
desire to remain in his/her current position as a middle school teacher in an urban district. This study
15
was designed to examine middle school teacher satisfaction in relation to demographic profiles and
the nine subscales in the JSS, developed by Paul Spector (1985).
The study was designed to answer the research questions and is presented in five
sections: an introduction, a review of literature, the design of the study, presentation of the data,
and conclusions.
Chapter I was the introduction to the study and included a statement of the problem, a
statement of the purpose of the study, research questions, significance of the study, assumptions
present in the study, limitations of the study, definition of terms, and the organization of the
study.
Chapter II provides a review of relevant literature that is pertinent to the subjects being
examined in the study, including: job satisfaction, employee retention, job satisfaction theories,
job satisfaction in education, workforce development in education, teacher retirement systems,
and literature relevant to the ten independent and the two dependent variables.
Chapter III describes the methodology that was employed in the study and includes the
research design, population and sample, the instrument, the dependent and independent
variables, scoring of the instrument, validity and reliability of the instrument data collection
procedures, and data analysis procedures.
Chapter IV will present the data collected, including analysis of the data, treatment of the
research questions, interpretation of the data, and a summary. Chapter V will present a summary
of the study, interpretation of the findings, practical application of the findings, and
recommendations.
16
CHAPTER II
REVIEW OF THE LITERATURE
Background
One of the most important issues confronting education leaders, human resource
department staff, and principals is staffing schools with quality teachers to increase student
achievement. This is especially important in high poverty and underperforming schools (Barnes,
Crowe, & Schaefer, 2007; Harris & Sass, 2010). Educators are faced with ever increasing
accountability to teach every student and to promote outcomes that document student growth in
all academic areas (Samek, Musser, Caskey, Olson, & Greene, 2006). This increased
accountability represents greater challenges in classrooms comprised of English language
learners, special needs students, and increased class sizes. Teachers today are faced with
implementing new standards (e.g. Common Core State Standards) and preparing students to meet
those standards as demonstrated through new assessments such as the Standards Based
Assessment Consortium (SBACs) or Partnership for Assessment of Readiness for College and
Careers (PARCC), as well as end of course exams. Teachers in many states are also experiencing
increased accountability pressure through performance evaluation systems with legislatively
approved mandates to include student achievement data. With these issues, it is becoming
increasingly difficult to recruit, hire, and retain quality teachers. Working conditions for teachers
are becoming more stressful (NCTAF, 2003) and there is less reason to stay in the profession as
evidenced by the high percentage of teachers leaving the field after only five years. The teacher
staffing issue is not only problematic with recruiting and retaining new teachers in the field but
also with retaining veteran teachers who may be faced with having to retire due to certain policy
17
issues and constraints in their retirement systems; when actually they may want to stay in the
classroom longer if there were additional incentives to remain (NCTAF, 2003).
The purpose of this study was to explore job satisfaction among middle school teachers in
an urban school district; the middle school level was selected because of its unique transitional
level between elementary and high school. “The middle school represents a crucial transition
phase in a child’s education” (Harley, 2010, p. 5). Knowing and understanding the transitional
stages of young adolescents and what they are experiencing is necessary if the teacher is to be
successful in the middle school environment (Harley, 2010). The unique educational needs, as
well as the social and emotional needs of middle school students, relates to the need to study
middle school teachers’ job satisfaction.
This review of literature explored the topics relevant to this study and includes
background on theories of job satisfaction, general studies on job satisfaction as well as those
relating to education, the consequences of retention and turnover, and the nine subscales that are
the foundation of the Job Satisfaction Survey (JSS) tool used in this study, and developed by
Spector (1985). The nine subscales were: pay, promotion, supervision, fringe benefits, contingent
rewards, operating conditions, co-workers, nature of work, and communication. The last topic
consists of a review of the demographic variables associated with this study: age, gender, highest
level of education, subject matter taught, and years to retirement under the current retirement
system, salary, total years of teaching experience, and the number of schools in which the teacher
has been employed.
Foundational Theories of Job Satisfaction
In its simplest form, job satisfaction is what makes a person want to come to work. Locke
(1969) defined job satisfaction and job dissatisfaction as “a function of the perceived relationship
18
between what one wants from one’s job and what one perceives it as offering or entailing” (p.
316). According to Spector (1997), job satisfaction includes the attitudinal values and variables
that influence the feelings a person holds regarding his or her job. It remains of interest to
employers because of the belief that satisfaction is linked to employee productivity output
(Gruneberg, 1976). In addition to economic benefits, there are moral implications to having a
work environment where employees are satisfied with their jobs; in theory, employees who are
satisfied will add value to the organization. Symbiotically, while job satisfaction can influence
the success of an organization, the successful characteristics of organizations can also influence
job satisfaction (Nash, 1985).
The perceived importance of job satisfaction to the success of organizations, has led to
job satisfaction becoming one of the most widely studied variables in organizational behavior
research (Spector, 1997). Following, are some of the most well-known theorists on this topic.
Hoppock
Tadisina (2001) has credited Robert Hoppock as one of the first researchers to observe
that job satisfaction “is a combination of psychological, physiological, and environmental
circumstances” (p. 3). Hoppock’s (1935) Job Satisfaction was the first publication that included
surveying methods and a focus on the multiplicity of factors that influence job satisfaction. His
work led to additional research conducted in the 1950s by such scholars as Maslow (1954) with
his hierarchy of needs and Herzberg et al. (1959) with his hygiene factor theory, as well as
Adams (1963), Vroom (1964), Sergiovanni (1967), Smith, Kendall and Huilin (1969), Locke
(1969), Lortie (1975), Hackman and Oldman (1976), Bullock (1984), and Spector (1997). These
theorists argued that job satisfaction was associated with specific job factors and the employee’s
perception of these factors.
19
Maslow
Maslow (1943) studied how individuals are motivated and how basic needs are met. He
was one of the early researchers in the area of organizational theory. The basic premise of
Maslow’s theory was that there is a hierarchy of needs that must be met incrementally; for
example, self-actualization (the highest level) cannot be achieved until the lower level needs are
met. According to Maslow, there are five stages of needs: (1) Basic needs include air, food,
drink, shelter, warmth, sex, and sleep; (2) Safety needs include protection from the elements,
security, order, law, stability, and freedom from fear; (3) Love and belonging needs include
friendship, intimacy, affection and love; (4) Esteem needs include achievement, mastery,
independence, status, dominance, prestige, self-respect and respect from others; and (5) Self-
actualization needs include realizing personal potential, self-fulfillment, seeking personal
growth, and peak experiences. Within this theoretical structure, one cannot achieve higher levels
without first satisfying the preceding levels; as lower needs are fulfilled, they no longer serve as
the basis for an individual’s performance. Lower order needs must be gratified before higher
order needs can be met.
Herzberg
Frederick Herzberg, recognized as one of the early researchers of job satisfaction,
advanced the idea that higher job satisfaction leads to higher productivity, lower absenteeism,
and better work performance (Herzberg et al., 1957; Herzberg, 1966). He explained motivation
as being grounded in basic human needs, but not in a hierarchical structure as proposed by
Maslow; however, Herzberg used Maslow’s (1954) Hierarchy of Need theory to more fully
develop his own theory.
20
His theory, referred to as Herzberg’s Motivator and Hygiene Factor Theory or Herzberg
Dual Factor Theory, is based on a study he and his associates conducted in the late 1950s
(Herzberg et al., 1959). Based on research, Herzberg’s theory posited that job satisfaction and
job dissatisfaction are not opposite factors; rather, they are separate and distinct and may
fluctuate independently of one another. He explained the opposite of dissatisfaction as being “no
dissatisfaction” and the opposite of satisfaction as being “no satisfaction.”
Dissatisfaction, according to the Motivator and Hygiene Factor Theory, is caused when
hygiene (extrinsic) factors decline to levels where employees feel work to be undesirable. In
addition, improving the conditions of hygiene factors to an ideal level does not necessarily
increase job satisfaction. It is predominantly the motivation (intrinsic) factors that improve
employee job satisfaction, particularly as a function of self-actualization or realization (Herzberg
et al., 1959; Herzberg, 1968). His theory attempted to disprove the ideas that by removing the
causes that made workers feel dissatisfied, they would in turn feel satisfied. As well, by
increasing motivators that helped workers to feel satisfied, this would result in making them feel
less dissatisfied.
Herzberg (1968) identified ten hygiene (extrinsic) factors based on physiological needs.
They included: company policy and administration, supervision, relationship with supervisor,
work conditions, salary, relationships with peers, personal life, relationships with subordinates,
status, and security which can be noted on a continuum of job dissatisfaction. Five motivation
(intrinsic) factors lead to a similar continuum, but instead were based on psychological needs and
job satisfaction. They included: achievement, recognition, work itself, responsibility,
advancement and growth; these motivators were the primary cause of satisfaction with the job.
21
Incentivizing methods based on hygiene factors are generally external rewards or threats
of punishment (physically or psychologically) to alter work performance. Herzberg (1968)
termed these “KITA” or “kick him in the pants” (p. 54) methods such as having to deal with “an
annoying boss, a low salary, an uncomfortable work space, and stupid rules” (Herzberg, 2003, p.
87). According to Herzberg (1966), positive hygiene factors, even when successful, only provide
short-term results. In addition, negative KITA may lead to only temporary movement; positive
KITA may occur, but in contrast to what is actually desired. For example, offering fewer work
hours for motivated workers, can be a disincentive. As well, higher wages and better fringe
benefits can ultimately be perceived as an employee right instead of an incentive. Additional
training and counseling sessions have, in some cases, ended up interfering with time and work
operations.
Herzberg suggested job enrichment for its long-term effects on employees’ attitudes;
supervisors provide appropriate personal challenges, increased autonomy and responsibilities
commensurate with demonstrated ability, and reassignment when applicable to fully utilize an
employee’s skills and growth. He referred to these as vertical loading motivators and contrasted
them with the less effective horizontal job loading factors where a job is merely restructured to
provide variety or a supervisor sets challenging goals as a means of incentives (Herzberg, 1968).
Herzberg’s theory provides an explanation about the various outlooks workers have
toward their jobs and has forced managers to consider whether or not job satisfaction consists of
employees seeking to achieve psychological growth, freedom from physical and psychological
discomfort, or both. It also helps managers consider how they might assist their workers in
meeting these separate need systems by providing a satisfying work environment (Herzberg,
1976).
22
Adams
In the 1960s, Adams (1963) presented a theory of inequity with particular attention to
wages and productivity. He found that employees’ perceptions of fairness in a reward system
influenced their efforts and productivity. Job satisfaction was present and workers were willing
to extend additional effort and personal sacrifice when they believed they were well paid
compared with others performing similar work. The theory is built on the concept employees
become non-motivated if they believe their inputs (e.g. effort or commitment) are greater than
the outputs (e.g. salary and benefits).
Vroom
Victor H. Vroom, a leading authority on the psychological analysis of behavior in
organizations, offered three assumptions about motivation:
1. People prefer tasks and jobs which they believe require the use of their abilities;
2. People prefer consistent information about their abilities rather than inconsistent
information;
3. People prefer receiving information to the effect that they possess valued abilities
rather than information that they do not possess valued abilities (Vroom, 1964, p.
286).
Vroom (1964) developed his expectancy theory dealing with job choice, satisfaction, and
performance. Job satisfaction, according to Vroom, is tied to employees’ beliefs that effort leads
to performance (expectancy), that performance leads to rewards (instrumentality), and that the
perceived value or preferences for rewards or outcomes is based on performance (valence). This
theory came to be known as the Valence, Instrumentality, Expectancy (VIE) Theory. It predicts
that if instrumentality and balance are held constant, expectancy would be positively associated
23
with performance. As all three of these factors interact, they produce motivation to increase
satisfaction and decrease dissatisfaction (Vroom, 1964). Vroom’s Expectancy Theory, with its
broad possibilities for application, has become one of the most widely accepted theories of
motivation to explain how and why people make decisions (Van Eerde & Thierry, 1996).
In a meta-analysis of 77 studies on the correlations of Vroom’s original expectancy
models and work-related criterion variables, Van Eerde and Thierry (1996) found contradictions
on how work motivation, as predicted by the VIE model, should be measured. While the VIE
variables were found to indeed be correlated to work-related criteria, they determined that
transforming these variables into utilities did not seem to increase the relationship as Vroom
proposed. They suggested possible connections with their meta-analysis to other models of
subjective expectancy such as the theory of reasoned action and self-efficacy.
Locke
Locke (1976) was critical of both Maslow’s and Herzberg’s theories, noting their lack of
specification of the particular job conditions necessary for job satisfaction and Herzberg’s
unipolar views on job satisfaction and dissatisfaction. Locke emphasized the need for events and
conditions such as work attributes that include appropriate mental challenges where employees
could experience progress in dealing with challenges before ultimately achieving success. In
addition to challenging tasks, he found satisfaction to be dependent on employees finding the
work personally interesting and meaningful and without the burden of physical strain. Rewards,
according to Locke, should be fair and working conditions compatible with an individual’s
physical needs and capacity. In addition to events and conditions, Locke also drew attention to
agents that impact job satisfaction, including the individual employee self-perceptions (self-
24
esteem) plus supervisors, co-workers, and subordinates where functional (professional) or entity
(personal) relationships might provide access to job values and needs.
In an extension of his earlier work, Locke developed a theory on work motivation and job
satisfaction which he termed “high performance cycle” (Locke & Latham, 1990, p. 240). The
cycle begins with a specific high challenge or goal that, if accompanied by high expectations of
success or self-efficacy and high performance results, can lead to job satisfaction. Prerequisites
for high performance results include a consensus of commitment to the goal, feedback tracked in
relation to the goal, adequate ability to approach or reach the goal, and low situational constraints
that could obstruct goal attainment.
Bullock
Bullock (1984), in his review of research on job satisfaction, grouped job satisfaction
within four distinct approaches: (1) the needs fulfillment, approach based on how an employee’s
needs (e.g., salary, self-respect) being satisfied; in some cases, these factors were weighted in
relation to their importance to individuals; (2) the discrepancy approach, based on the difference
between an employee’s desired goal and actual outcomes; (3) the equity approach, where an
input/effort to outcome/reward ratio is defined and compared with an employee’s comparisons of
their own ratio to their peers’; and (4) the two-factor approach, in which satisfaction and
dissatisfaction occur on separate continuums as defined in Herzberg’s Motivator and Hygiene
Factor Theory. Bullock suggested that job satisfaction be viewed as a result of complex
interconnectedness of attitudes, based on individual personal variables, as well as work factors so
that work and life satisfaction could be influenced by managers only partially. He reviewed job
satisfaction research by twelve content areas: participation; goal setting and management-by-
objectives (MBO); gainsharing; survey feedback; leadership; flextime; realistic job preview;
25
information cues; job redesign; pay; performance-satisfaction links; and team building. He
concluded that employee influence is the predominant theme over all the content areas. Bullock
found the dynamic influence that determines some level of control over work and life factors at
the individual and/or group level seems to exert the most influence on work and life satisfaction.
Selected Theories of Job Satisfaction in Education
Lortie
Lortie (1975) noted that few beginning teachers in the l960s and early 1970s expected to
remain in the classroom for their entire working careers; thus, leading to a present-oriented rather
than a future-oriented point of view in job satisfaction factors for educators. Using the interviews
that were part of his Five Towers study, Lortie classified teacher rewards linked to job
satisfaction as extrinsic, ancillary, or psychic (also termed intrinsic.) Extrinsic rewards included
salary and the level of prestige and power. He explained that these rewards have an objective
quality since teaching salaries are usually predetermined by a pay schedule based on years of
experience and levels of education. Ancillary rewards were defined as those tied to the work
itself that may be perceived as desirable such as daily work schedules and a white-collar working
environment. They can be both objective and subjective. Psychic rewards, according to Lortie,
were subjective and unique to individual preferences; for example, autonomy in classroom
management and “knowing I have ‘reached’ students and they have learned” (Lortie, 1975, p.
105). Respondents in Lortie’s study, indicated that desirable results with students provided the
greatest source of job satisfaction. Psychic rewards accounted for 76.5percent of work
satisfaction versus approximately 12percent each for extrinsic and ancillary rewards.
26
Sergiovanni
Sergiovanni (1967) reaffirmed Herzberg’s initial findings about factors that influence
teachers’ job satisfaction and dissatisfaction. He found satisfaction factors that focused on the
work itself differed from dissatisfaction factors that focused on the conditions of the work.
Achievement, recognition, and responsibility were the predominant work-centered factors for job
satisfaction. Achievement often in relation to a positive affective influence made by teachers on
students, was cited by one out of three respondents, Hygiene factors such as school policy and
administration, unfairness, status, personal life, and interpersonal relations with students,
colleagues, and supervisors were noted as factors for dissatisfaction. He concluded that job
satisfaction could not be attained by eliminating the factors connected to dissatisfaction;
however, he also noted the dependence of job satisfaction on factors associated with
dissatisfaction and suggested the unlikeliness of work satisfaction attainment without some
elimination or tempering of the distractions associated with the dissatisfaction factors.
Sergiovanni (1967) found little to no differences in the subgroups based on gender,
tenure, and teaching levels, that is, elementary versus secondary level grade assignments. Small,
but significant differences were found in tenured teachers’ greater dissatisfaction in interpersonal
relationships with superiors, nontenured teachers’ greater dissatisfaction in interpersonal
relationships with peers, and nontenured teachers’ dissatisfaction with security.
Hackman and Oldman
Hackman and Oldman (1976) proposed a job characteristics theory that explained
employees’ intrinsic motivation based on five specific job characteristics: skill variety; task
identity; task significance; autonomy; and job feedback. They developed the Job Diagnostic
Survey (JDS) to evaluate the variables of their theory. Using Herzberg’s job enrichment and job
27
enlargement concepts, they suggested a work redesign strategy that focused on three classes of
variables: varied work behavior; job characteristics that promoted positive psychological states;
and individuals’ personal attributes that determined their expected responses to complex and
challenging jobs. They focused on how the characteristics of jobs and the character traits of
employees might determine if job enrichment practices could benefit employee motivation. They
noted that some individuals were more likely to respond to enriched, complex tasks, and that job
characteristics can affect employees’ attitudes and work behaviors (Hackman & Lawler, 1971).
Their model extended, refined, and systemized the relationships between employees’ perceived
job characteristics and their individual responses to work.
Spector
Paul E. Spector, professor of industrial/organizational psychology, developed the Job
Satisfaction Survey (JSS), using common job facets to measure employee satisfaction. He noted
that while interviews are an effective way to ascertain job satisfaction, they are both expensive
and time consuming to administer. Spector identified the following nine factors: pay, promotion,
supervision, benefits, contingent rewards, operating procedures, coworkers, nature of work, and
communications as the essential features in his survey. He determined correlations among these
facets as being rather small, ranging from a low of .10 between supervision and benefits to a high
of .58 between promotion and contingent rewards (Spector, 1997). The instrument, initially
created in 1997, is now well-established has been repeatedly investigated for reliability and
validity. The JSS is one of the most frequently used job satisfaction instruments in the United
States (Giri & Kumar, 2010) and has been adapted and used in international studies as well (Liu,
Borg, & Spector, 2004; Yelboga, 2009).
28
Consequences of Teacher Satisfaction and Dissatisfaction: Retention and Turnover
Education reformers have lamented the difficulties in securing and retaining qualified
public school teachers in the United States since the earliest education reforms days of the 19th
century (Lortie, 1975; Mann, 1891). Educational researchers have been studying the issue since
the late 1920s (Almack, 1970). It has been suggested that teachers leave the profession due to
dissatisfaction with the organizational characteristics and conditions of the workplace (Ingersoll,
2001). It has also been posited that satisfaction and retention can only be achieved if teachers
feel successful based on the specific support that they receive from colleagues and administrators
in addition to favorable working conditions that enable them to be successful (Baldacci, 2006).
The teaching profession is complex and retaining the best teachers has long been of
critical importance to students and educational leaders. Having the highest quality teachers in
classrooms with students has proven academic benefits (Haycock, 2002). Organizationally, not
all turnover is negative; when ineffective teachers leave the profession, it is “necessary and
beneficial” (Ingersoll, 2003, p. 12). However holistically, it is important to understand why some
teachers leave their profession while others choose to stay. According to the Guidebook for
School Leaders Held Accountable for Student Success, developed by the Northeast Regional
Resource Center (NRRC, 2004), “While the root causes of the problem are due to a variety of
factors, the inescapable conclusion is that students suffer when quality teachers are not available
to teach them the skills they need to be successful in school and life” (p. 1). For many teachers,
positive incentives such as support of school leadership, working conditions, respect for the
profession, professional development opportunities, and mentoring are of key importance (Boyd,
Grossman, Ing, Lankford, Loeb, & Wyckoff, 2011; Horng, 2009; Pogodzinski, Youngs, &
Belman, 2012).
29
Retaining high quality teachers in the areas of math, science, and special education are
particularly difficult in urban and rural settings (American Association of Employment in
Education, 2008). Specifically, retention of special education teachers has become a major
problem in many districts. The job responsibilities unique to special education teachers are
associated with high levels of dissatisfaction, resulting in burnout. Responsibilities include:
unmanageable workloads, interference of paperwork with teaching, teaching students from four
or more disability categories, unsupportive school climates, minimal professional development
opportunities, and administrative burdens associated with the Individuals with Disabilities Act
(IDEA) (NRRC, 2004).
There are also costs associated with turnover including termination processes, hiring of
substitutes to fill vacancies, recruitment and hiring, orientation, and professional development.
In the midst of budget shortfalls, district leaders are reviewing various programs and policies to
retain teachers and lessen teacher turnover; these include programs on induction and mentoring.
The more teachers feel supported and satisfied with their jobs, the more likely they are to stay in
the profession (NRRC, 2004).
Some teachers do not necessarily want to retire from the profession at a pre-determined
age and are willing to stay if there was additional incentive for them to do so; however, because
of state pension policies, it is often not viable for them to remain (NCTAF, 2003). Veteran
teachers are of additional value to the profession because of experience in developing effective
teaching practices as well as their adding satisfied employees to the work force. “The average
teacher retirement age is 59, considerably lower than in other professions, but retirement
practices and pension policies in many states often move teachers into retirement at age 56 or
even earlier” (NCTAF, 2003, p. 3). When the NCTAF study was completed, it estimated a
30
million and half teachers would retire by 2018, leaving a dramatic vacuum of experienced
teachers who could lend assistance to new teachers who might benefit from the motivation
involved in strong mentoring and peer relationships.
Retention and turnover continue to be difficult and challenging issues for educational
leaders to manage. Researchers from the National Center for Educational Statistics (NCES,
2010) studied teacher attrition during the 2008-2009 school year. Selected findings from this
study were:
Of the 3,380,300 public school teachers who were teaching during the 2007-08 school
year, 84.5 percent remained at the same school (stayers), 7.6 percent moved to a
different school (movers), and 8.0 percent left the profession (leavers) during the
following year. Among the 487,300 private school teachers who were teaching during
the 2007-08 school year, 79.2 percent were stayers, 4.9 percent were movers, and
15.9 percent were leavers (NCES, 2010).
Among public school teachers with one to three– years of experience, 77.3 percent
stayed in their base-year school, 13.7 percent moved to another school, and 9.1
percent left teaching in 2008–09 (NCES, 2010).
Among private school teachers with one to three years of experience, 72.2 percent
stayed in their base-year school, 7.2 percent moved to another school, and 20.6
percent left teaching in 2008–09 (NCES, 2010).
Among public school teacher movers with four or more years of teaching experience,
55.3 percent moved from one public school to another public school in the same
district and 42.3 percent moved from one public school district to another public
school district between 2007–08 and 2008–09. Among private school teacher movers
31
with four or more years of teaching experience, 35.3 percent moved from a private
school to a public school and 64.7 percent moved from one private school to another
private school between 2007–08 and 2008–09 (NCES, 2010).
About 26.2 percent of public school teacher movers changed schools in 2008–09
because of personal life factors, compared to 16.0 percent of private teacher movers
(NCES, 2010).
About 5.3 percent of public school teacher leavers left teaching in 2008–09 because
their contract was not renewed compared to 13.0 percent of private school teacher
leavers (NCES, 2010).
Among teachers who left teaching in 2008–09, about 8.9 percent of public school
teachers, compared to 17.4 percent of private school teachers, were working in an
occupation outside the field of education, including military service (NCES, 2010).
Of teachers who left teaching in 2008–09, about 40.8 percent of public school
teachers, compared to 15.5 percent of private school teachers, reported opportunities
for learning from colleagues were better in their current position than in teaching
(NCES, 2010).
Surveying Job Satisfaction
Early job satisfaction surveys
In the 1950s, an initial number of instruments were developed and used to measure
morale and job satisfaction: the Science Research Associates (SRA) Employee Inventory, the
Thurstone Temperament Scale, the Air Force Job Satisfaction Inventory, and Tryon’s
Cumulative Communality Cluster Analysis. Researchers used a variety of systems and structures
32
to analyze factors from the results of these survey instruments in an attempt to determine
consistent and recurring patterns in employee satisfaction (Smith, Kendall, & Hulin, 1969).
Job Descriptive Index (JDI)
As a means of measuring attitudes related to job satisfaction across a variety of
professions Smith, Kendall, and Hulin (1969) introduced the Cornell Job Descriptive Index. The
five facets of job satisfaction were: the type of work, pay, opportunity for promotion,
supervision, and co-workers. Each scale consisted of nine to 18 items where subjects indicated a
Y where an item described a particular aspect of their job. With various updates, it has remained
a widely used measure of job satisfaction for the past 50 years (Bowling, Hendricks, & Wagner,
2008; Cooper-Hakim & Viswesvaran, 2005; Lake, Gopalkrishnan, Sliter, & Withrow, 2015).
The Minnesota Satisfaction Questionnaire (MSQ)
The MSQ was designed in the 1950s and 1960s on the Theory of Work Adjustment to
measure an employee's satisfaction with his or her job (Weiss, Dawis, England, & Lofquist,
1967). Work adjustment is predicted by matching an individual’s work personality with work
environments to find a correspondence between his/her abilities with the requirements of the
work and also how well the reinforcers in the work environment meet the needs of the employee.
The Job Diagnostic Survey (JDS)
Hackman and Oldman (1974) designed the JDS as an instrument to measure the
following classes of variables: objective job characteristics, personnel affective reactions of
individuals in their jobs and work setting, readiness of individuals to respond positively to job
enrichment. By analyzing jobs and surveying workers, they could determine if redesigning for
job enrichment could improve employee satisfaction and job performance.
33
MetLife Survey of the American Teacher
Recently, The MetLife Survey of the American Teacher (MetLife, 2013), a longitudinal
research project, examined the views of teachers and principals on a variety of issues, including
job satisfaction. The results indicated that teacher job satisfaction has declined to its lowest point
in 25 years and dropped five percentage points since 2012, from 44 percent to 39 percent for
very satisfied. Since 2008, teacher job satisfaction had dropped 23 percentage points.
Job satisfaction tied to work place conditions are vital in retaining teachers, with research
showing school staffing issues may not be only about the obvious problem of teachers retiring
at high rates, but also about large numbers of teachers who leave the profession for other
reasons such as job dissatisfaction and pursuit of other careers (Ingersoll, 2003). A study
conducted in 2008 by Perrachione, Petersen, and Rosser examined this problem by considering
both intrinsic and extrinsic variables that influence teacher job satisfaction and retention for
Missouri public elementary teachers. By studying the impact of professional experiences and
influences on a teacher’s decision to remain in the classroom, the researchers proposed to shift
the national debate on teacher attrition (retirement) to retention.
According to the MetLife survey, half (51 percent) of teachers indicated they were under
great stress several days a week, which could lead to job dissatisfaction. Elementary school
teachers indicated they experienced stress more frequently than other groups. They were more
likely than middle school or high school teachers to say they were under great stress at least
several days a week (59 percent elementary school vs. 44 percent middle school vs. 42 percent
high school). In 1985, the percentage of elementary teachers who experienced great stress at least
several days a week was 35 percent compared to 59 percent in the most recent survey (2013).
Other notable findings from the survey included:
34
Stress is related to job satisfaction for teachers. Teachers with lower job satisfaction
were more than twice as likely as those who said they were very satisfied with their
job to feel under great stress several days a week or more (65 percent vs. 28 percent)
(MetLife, 2013).
Teachers with lower job satisfaction were more likely to be mid-career teachers and
less likely to be new teachers (MetLife, 2013).
Teachers with lower job satisfaction were more likely to teach in schools with two-
thirds or more low-income students or in schools where most students were not
performing at or above grade level in English language arts and mathematics.
However, teachers with lower job satisfaction did not differ from very satisfied
teachers regarding other personal and school characteristics (MetLife, 2013).
Budget decreases were associated with lower morale and greater stress among
teachers. Teachers at schools where the budget had decreased within the past year
were less likely than teachers at other schools to be very satisfied with their
profession (33 percent vs. 48 percent). Furthermore, they were more likely to
experience great stress on the job at least several days a week (55 percent vs. 46
percent) (MetLife, 2013).
Collaboration time was associated with more job satisfaction. Teachers who were
highly satisfied with their careers were less likely than other teachers to report that
there have been decreases in time to collaborate with other teachers (16 percent vs. 29
percent) or with professional development opportunities (14 percent vs. 21 percent)
(MetLife, 2013).
35
Job Satisfaction Survey (JSS)
Paul E. Spector, professor of industrial/organizational psychology at the University of
South Florida, developed a number of instruments to assess self-reported and other-reported
psychological constructs, including job satisfaction. The JSS is a 36 item, nine facet scale that
assesses employee attitudes about the job and aspects of the job. The nine facets are pay,
promotion, supervision, fringe benefits, contingent rewards (performance based rewards),
operating procedures (required rules and procedures), coworkers, nature of work, and
communication.
Compensation or pay
According to Spector (1997) pay is defined as a method of financial compensation for
doing routine, scheduled, or interval tasks as prescribed by a job. There have been several studies
that have investigated the relationship between job satisfaction and pay for teachers. Perrachione
et al. (2008) found that intrinsic variables (i.e., working with students, job satisfaction, and
personal teaching efficacy) and extrinsic variables (i.e., small class size and teacher support) can
influence teacher job satisfaction. However, dissatisfaction in teaching can be attributed to
extrinsic factors such as low pay, large class sizes, and parent support. The findings from other
research (Cohn, 1992; Lortie, 1975; Taylor & Tashakkori, 1995) suggest that teacher job
satisfaction increases when there is a lack of barriers, while an intensification of barriers can
reduce job satisfaction. In addition to job satisfaction, having gratification in what individuals are
paid for their job responsibilities has shown to have influence in overall motivation and
performance, absenteeism, and turnover (Cable & Judge, 1994; Gerhart & Milkovich, 1990;
Huselid, 1995; Milkovich & Newman, 2002).
36
In regard to compensation, teachers often make less than their professional counterparts
(Allegretto, Corcoran, & Lawrence, 2004) and it takes considerable time and expense for
teachers to reach the top of their salary ranges. The National Center on Teacher Quality (NCTQ,
2014) reported that in several urban cities the amount of time it takes a teacher to reach a salary
of $75,000 for a 30 year career varies dramatically: from Boston, where in seven years a teacher
can reach $75,000 and work 23 years more, to St. Paul, where teachers make less than $75,000
for about 11 years and then increase to above $75,000 by their 12th year.
In the publication, How Does Teacher Pay Compare Methodological Challenges
(Allegretto, Corcoran, & Mishel, 2004), the authors compared teacher pay to other profession
and the major findings were:
Teachers earn significantly less than like workers, and this wage disadvantage has
grown considerably over the last 10 years (Allegretto, Corcoran, & Mishel, 2004).
Teachers’ weekly wages have fallen behind those of other workers since 1996, with
teachers’ inflation-adjusted weekly wages rising just 0.8 percent, far less than the 12
percent weekly wage growth of other college graduates and of all workers
(Allegretto, Corcoran, & Mishel, 2004).
A comparison of teachers’ weekly wages to those of other workers with similar
education and experience shows that, since 1993, female teacher wages have fallen
behind 13 percent and male teacher wages 12.5 percent.Since 1979, teacher wages
relative to those of other similar workers have dropped 18.5 percent among women,
9.3 percent among men, and 13.1 percent among both combined (Allegretto,
Corcoran, & Mishel, 2004).
37
A comparison of teachers’ wages to those of workers with comparable skill
requirements, including accountants, reporters, registered nurses, computer
programmers, clergy, personnel officers, and vocational counselors and inspectors,
shows that teachers earned $116 less per week in 2002, a wage disadvantage of 12.2
percent. Because teachers worked more hours per week than the other professions, the
hourly wage disadvantage was an even larger 14.1 percent (Allegretto, Corcoran, &
Mishel, 2004).
Teachers’ weekly wages have grown far more slowly than those in comparable
occupations such as those listed in the bullet above; teacher wages have deteriorated
about 14.8 percent since 1993 and by 12.0 percent since 1983, relative to comparable
occupations (Allegretto, Corcoran, & Mishel, 2004).
Although teachers have somewhat better health and pension benefits than other
professionals, these are offset partly by lower payroll taxes paid by employers (since
many teachers are not in the Social Security System). Teachers have less premium
pay (e.g. overtime and shift pay), less paid leave, and fewer wage bonuses than do
other professionals. Teacher benefits have not improved relative to other
professionals since 1994, so the growth in the teacher wage disadvantage has not been
offset by improved benefits (Allegretto, Corcoran, & Mishel, 2004).
Promotion
Job promotion plays a key role in producing feelings of satisfaction and may lead to
better retention of employees. Kosteas (2011) found that promotions lead to more satisfied
employees and in fact, “Workers who believe a promotion is possible in the next two years also
38
report higher job satisfaction” (p. 1). Promotions are important aspects of an employee’s career
and life, affecting other facets of the work experience.
Traditionally, promotions in education are typically found when a teacher is promoted to
an administrative position such as an assistant principal or principal. There is relatively little
ability for a teacher to receive a promotion other than the traditional route of becoming a
building or central office leader. However, in many districts this is changing and there are more
opportunities for teachers to receive increased responsibilities and pay. Career ladders and
lattices are becoming more common and include programs to give teachers additional duties and
responsibilities without having to leave the classroom. As reported in the Teacher Incentive Fund
Survey results (Teacher Incentive Fund Survey, 2014), several schools using funds from a grant
are able to participate in a mentor and master teacher career lattice program. Teachers are able to
apply to these building level positions and receive additional compensation. According to
surveys of teachers at these schools, there is an increase in job satisfaction (Teacher Incentive
Fund Survey, 2014). If there is little opportunity for advancement, employees will most likely
feel negative toward their work and have low job satisfaction (Anfara et al., 2013).
Supervision
“Supervision is defined as the amount of regulation and control provided by the school
administrator and the interpersonal relationships the teachers have with the supervisor” (Knox, &
Anfara, 2013, p. 59). School principals are the educational leaders in the school; therefore, they
are directly responsible for the supervision of teachers. As an external hygiene factor,
supervision can be seen as both a satisfier and a dissatisfier in relation to job satisfaction. A
primary method to impacting teaching is through the instructional leadership of the principal
(Range, Finch, Young, & Hvidston, 2014). The role of the principal has changed radically in the
39
past 10-15 years with a clear call from federal and state agencies and policy for the principal to
be the instructional leader of the building and less of a manager. If principals function as
instructional leaders and provide effective feedback, there is less of a tendency for isolation and
more of an opportunity for clear focus on improving teaching (Range et al., 2014).
Fringe Benefits
Fringe benefits for employees in any institution may include such examples as health
care, life insurance, child-care, vacations, personal days, holiday pay, retirement plans, tuition
reimbursement, compensatory time for time worked over and above that expected, and paid
professional development. As intended, fringe benefits are usually provided to an employee in an
effort to enhance job satisfaction and thus, retention. Unique to education are what some might
also consider fringe benefits such as the possibility of having a teacher’s child attend the same
school in which the teacher works, working days and hours that match those of children, and
time off in summer (although many teachers are involved in professional development during
summer).
Benefit packages influence employee loyalty, productivity, job satisfaction, and retention
(Ladebo, 2005). Donahue and Heywood (2002) found a significant difference in fringe benefits
benefit preferences based on gender. They found white-collar females reporting significantly
higher levels of satisfaction when childcare benefits were available and when working for a
small firm. White-collar males, on the other hand, reported significantly higher levels of job
satisfaction when there was a retirement plan available.
Contingent rewards
Contingent rewards are incentives that are not necessarily monetary, but can add to job
satisfaction both in terms intrinsic and extrinsic motivation. According to Spector (2008),
40
contingent rewards support the reinforcement theory of motivation, in terms of which
performance-relevant behaviors will increase in frequency if rewarded. Examples from education
include selection of classes or grade levels to be taught (extrinsic based), greater freedom in
scheduling (extrinsic based), positive feedback from parents (intrinsic based), and support from
supervisors (intrinsic based). Other examples of contingent rewards include an effective teacher
mentoring program for underperforming teachers or new teachers. Spector (1997) argued that the
goal for both intrinsic and extrinsic based rewards should be to reward desired behavior and
positive work patterns. Offering teachers the opportunity to participate in Professional Learning
Communities within the instructional day to provide time for collaboration and idea sharing of
effective lessons, is viewed as a contingent award and has led to improved job satisfaction
(Firestone & Pennell, 1993; Ladd, 2011).
Operating conditions
Because there has been a correlation between job satisfaction and teacher retention,
(Ladd, 2011; Ladebo, 2005) it is important to understand the working conditions teachers may
experience that have an impact on job satisfaction as well. The operating conditions or working
conditions in the school environment have been shown to impact teacher retention either
positively or negatively (Ingersoll, 2001). Working conditions that offer teachers the ability to
share ideas, share in decision making, follow through from administration on discipline matters,
and meaningful professional development for teachers have been successful in retaining teachers
(NYSED, 2010). Studies have shown the higher level of involvement for teachers in the
organization, the higher the job satisfaction (Firestone & Pennell, 1998; Knox & Anfara, 2013).
“For effective teacher empowerment, school administrators need to clearly define the parameters
41
surrounding the decision-making process; teachers need to understand the limits of their
influence and authority” (Knox & Anfara, 2013, p. 61).
Co-workers and colleagues
Unique to the middle school concept is the concept of teaming in which core teachers
share a team of students. Interdisciplinary teaming was a recommendation of the Carnegie
Council on Adolescent Development in their landmark Turning points: Preparing American
Youth for the 21st century. (Carnegie Council on Adolescent Development, 1989) and has
continued to be valued and used in middle schools (Sarnek et al., 2006). For both the educator
and student, “learning communities create stable, close, and mutually respectful relationships”
(Harley, 2010, p. 126). The team/community approach is important for the middle school teacher
as it provides a collegial atmosphere. Time to work with fellow teachers for the improvement
and planning of instructional practices for this age group leads to improved feelings among
teachers. “If the team is interdisciplinary, teachers attempt to integrate disciplines rather than
fragment them, helping young adolescent students see the relationships between knowledge,
skill, and practical application” (Harley, 2010, p. 129).
Nature of the work
The nature of work, sometimes termed work itself, is one of the intrinsic factors noted in
Herzberg’s Motivator and Hygiene Factor Theory. It was identified as producing satisfaction in
“the actual doing of the job or tasks of the job” (Herzberg et. al, 1959, p. 48). Sergiovanni (1967)
supported its importance by noting that factors associated with high attitudes of teacher
satisfaction were often related to the work itself.
Additional research studies (Judge & Church, 2000; Jurgensen, 1978; Khaleque &
Chowdhary, 1984) have shown that when employees are asked to evaluate job satisfaction
42
factors for their jobs, the nature of the work itself often emerges as the one of most important job
facets. The work itself is a factor independent of objective job quality; that is, the tasks
associated with the type of work performed can make the job personally meaningful and
enjoyable, regardless of the perceived quality of the position by others (James & Jones, 1980;
Llorente & Macias, 2005; Taber & Alliger, 1995).
Verdugo, Greenburg, Henderson, Uribe, and Schneider (1997), using data from a national
survey of National Education Association teacher members, found teachers’ commitment to their
profession and their students’ academic success were important contributors to job satisfaction.
They suggested that many failed school reform attempts were the result of not considering the
climate or culture in which teachers worked. Verdugo et al. noted that worker involvement in
decision-making brought legitimacy and community to the work itself. They recommended that
organizations, through their leadership, must create and maintain an environment that permits
teachers to perform their duties in a professional autonomous manner and concluded that
whether bureaucratic or communitarian, teachers should feel that the system is legitimate.
Communication
Communication is the means by which individual and group activities are coordinated to
plan, distribute, and pursue goals, expectations, instructions, and evaluations. Its importance and
impact on the effectiveness on an organization has been studied extensively (Giri & Kumar,
2009).
Some research studies (e.g. Burton, Pathak, & Zigli, 1976; Pincus, 1986; Schuler, 1979)
have found a significant relationship between organizational communication and job satisfaction.
Others (e.g. Rodwell, Kienzle, & Shadur, 1998) have found employee perceptions of
communication and job satisfaction, along with commitment, stress, and teamwork as strong
43
predictors of self-rated performance. Unexpectedly, this last group of researchers found
communication to be negatively related to performance. They concluded that too much
communication can have adverse rather than positive effects.
A research model developed by Pincus (1986) showed that both relational and
informational dimensions of communications were significantly related to job satisfaction.
However, relational dimensions such as communications between subordinates and supervisors
were more strongly related to job satisfaction than informational dimensions such as media
quality and organizational integrity.
Kulhavy and Schwartz (1981) warned administrators to structure general
communications to employees to ensure the proper tone is reflective of the desired attitude they
intend for the organization. In their study, even small wording changes affected the tone and led
to substantial shifts in employee attitudes toward the company. Weiss (2002) concurred and
recommended that the effectiveness of employees is dependent on how supervisors communicate
with them. Smith (1973) also found the quality of communication was more important than the
quantity in determining the degree of satisfaction with the relationship. According to Smith,
face-to-face communication is and probably always will be the preferred source of information
for all employees.
Other studies using Spector’s JSS
Cui-Callahan (2012) used the JSS to explore the job satisfaction of teachers who worked
in seven urban high schools. While all teacher-respondents scored higher in intrinsic job
satisfaction than extrinsic job satisfaction, younger, less experienced, and consequently lower-
salaried teachers had higher intrinsic and extrinsic job satisfaction than their older, more
educated, counterparts.
44
A similar study involving elementary and secondary teachers in five rural school districts
(Grades K-12) was conducted by Bumgartener (2013). This study, too, found intrinsic rewards
were more important than extrinsic ones for teachers and those with less experience were more
satisfied. In addition, the study noted greater levels of satisfaction for elementary teachers over
secondary teachers.
Demographic Variables Related to this Study
Gender
Some research studies (e.g. Clark, 1997; Holmes, 2007; Mueller & Wallace, 1996;
Phelan, 1994; Sousa-Poza & Sousa-Poza, 2000) have routinely shown women reporting equal or
greater job satisfaction than men. Since women typically experience less favorable job
conditions than men, this might seem paradoxical (Phelan, 1994). The explanation for these
findings is that women tend to experience labor market success greater than their expectations
(Clark, 1997) or they may be socialized not to express discontent (Hagan & Kay, 1995). Results
from the U.S. cohort in National Longitudinal Survey of Youth indicated little difference in job
satisfaction among young men and women with the exception of women being more sensitive to
both actual and comparison earnings than that of men (Donahue & Heywood, 2004).
In a meta-analysis of 31 studies, Konrad, Corrigall, Lieb, and Ritchie (2000) found
women and men in business management did not differ significantly in nine of 21 job attribute
preferences. For the twelve attributes where attribute preference based on gender was present,
men considered earnings and responsibility as more important, and women considered prestige,
challenges, task significance, variety, growth, job security, good coworkers, a good supervisor,
and the physical work environment to be more important.
45
Level of formal education completed
Some studies suggest a significant change in job satisfaction can be correlated with
education (Clark, 1996; Glenn & Weaver, 1982; Meng, 1990). Others found no significant effect
of education level on overall job satisfaction (Idson, 1990; King, Murray, & Atkinson, 1982).
Florit & Lladosa (2007) used independent single-equation models and structural equation
models to analyze both direct and indirect impacts of workers’ education on job satisfaction.
They concluded that the effects of education on job satisfaction were mainly indirect effects that
resulted in changes in workers’ health status, wages, and other observable job characteristics
such as a clearer understanding of job expectations, more choices in the labor market, or
enjoying greater autonomy or social prestige commensurate with higher education degrees.
Results from a meta-analysis (Brush, Moch, & Podyan, 1986), involving twenty-one
independent studies and over 10,000 employees on the relationship between education level and
job satisfaction, varied greatly across the different studies. They found no significant correlations
with job satisfaction for levels of education.
Although the relationship between educational level and job satisfaction remains unclear,
the level of teachers’ formal education is a unique variable in job satisfaction for a number of
reasons. First, additional formal education for teachers holds the promise for increasing their
knowledge about better teaching practices and also their confidence in their classrooms.
Additional formal education is also importantly tied to increases in the salary schedule for
teachers.
Teaching assignment
O’Reilly (2014) found composite job satisfaction scores between elementary and
secondary teaching levels to be not statistically significant based on survey data. However, this
46
study also showed that secondary teachers were less satisfied with their present teaching
assignments than elementary teachers. O’Reilly also found that while school level taught did
indeed play a role in professional satisfaction, teachers at elementary and secondary levels were
most satisfied with their work when intrinsically motivated, and most often in relationships with
their students and as an outcome based on their students’ successes.
In a study comparing elementary and secondary teacher job satisfaction and job
dissatisfaction using Herzberg’s hygiene and motivator factors, Bing (2001) found there were no
significant differences between elementary and secondary teachers’ perceptions of the presence
of motivator factors on the job. However, significant differences were found between elementary
and secondary teachers in the presence of hygiene factors and in the perceptions of the
importance of motivator factors and hygiene factors on the job. Elementary teachers perceived
motivator factors to be more important than their secondary counterparts. In addition, elementary
teachers perceived hygiene factors to be more prevalent and more important than secondary
teachers.
In another study (Marston, Brunetti, & Courtney, 2005), elementary and high school
teachers were found to be similar in their satisfaction with teaching, devotion to students, and
how they balanced their lives in and outside of school, but different in the ways they valued
freedom and flexibility in the classroom, the subject(s) they taught, and their relationships with
teacher-colleagues and administrators. While both groups expressed satisfaction with their jobs,
elementary teachers expressed a higher degree of satisfaction than secondary teachers. Secondary
teachers appeared to value autonomy termed “freedom and flexibility” (Marston et al., p. 475) in
their classrooms more than elementary teachers. Elementary teachers valued relationships with
fellow teachers and having a good supervisor more highly than secondary teachers.
47
Years of teaching experience/seniority and years to retirement
Unlike other professions and crafts where experience comes with certain markers of
advancement (e.g., lawyers or accountants who become an appointed partner), the career line for
teaching is flat with little recognition for greater mastery of core tasks (Lortie, 1975). The most
likely line of advancement is to leave the teaching profession for administrative work. However,
it is of note that teachers consider experience rather than training as the key to their
legitimization as teachers (Lortie, 1975).
The most obvious tangible benefit and source of job satisfaction associated with
increased years of teaching experience (seniority) are the increased steps on the annual salary
scale that teachers automatically attain with each year of experience. In addition, experienced
teachers may also gain a certain amount of prestige or moral authority as well as some personal
autonomy from superordinate interventions with additional years of experience (Lortie, 1975).
Thus, extrinsic rewards (e.g., salary and relationship with supervisor) are most liable to be
correlated with years of teaching experience.
Rosenholtz and Simpson (1990) found that years of teaching experience influenced
teachers’ concerns with core or periphery issues. The greater the years of teaching experience,
the greater the concern for core issues and the less concern for peripheral issues. Klassen and
Chiu (2010) found years of experience were positively linked to classroom management
(teaching strategies, classroom management, and student engagement) and self-efficacy for the
first 23 years of teaching and fell afterwards. Bishay’s (1996) study of teachers within various
teaching subjects showed similar results of higher job satisfaction among more experienced
teachers.
48
Huberman (1989) described the teaching life cycle as a progression from survival and
discovery in the first years, to stabilization or choice in leaving the profession in the next four to
six years. As they enter years seven through eighteen years, mid-career teachers experience a
period of experimentation and activism with more confidence and experience or they engage in
reassessment of their career choice. In later years, they reach a period of serenity as well as a
greater sense of confidence and self-acceptance. Each of these cycles is open to varying job
satisfaction.
Consistent with Huberman’s teaching cycles, Klassen and Chiu (2010) found that
teachers’ years of experience, gender, and three domains of self-efficacy (student engagement,
instructional strategies, and classroom management) were related to their job stress (workload
and classroom stress) and job satisfaction. They found growth in self-efficacy in the early years
of teaching declined after 23 years of experience. They determined that the results from their
study reinforced previous findings that teacher self-efficacy is linked with job satisfaction
thereby demonstrating an indirect link between years of experience and job satisfaction.
Age group
Meta-analyses (McElvoy & Cascio, 1989; Rhodes, 1983; Waldman & Avolio, 1986)
have examined relationships between age and work productivity. Rhodes (1983), in her meta-
analysis of more than 185 research studies involving age-related differences, concluded age was
consistently and positively related to overall job satisfaction, satisfaction with work itself, job
involvement, internal work motivation, and organizational commitment. In contrast, age was
negatively related to turnover intention. McElvoy and Cascio (1989), on the other hand, found
that age and job performances generally were unrelated. Another meta-analysis by Waldman and
Avolio (1986) showed little variance, and suggested different occupational types might influence
49
the relationship between age and work performance. In a later study, Waldman and Avilio (1990)
noted that both age and experience better predicted performance for jobs requiring higher levels
of complexity or mastery, but that length of job experience was a better predictor than age.
In a more recent meta-analysis, Ng and Feldman (2010) found the relationships between
chronological age and favorable attitudes (and/or to less unfavorable attitudes) toward work
tasks, colleagues and supervisors, and organizations were generally significant and of weak to
moderate in strength; that is, older workers had more favorable job attitudes (and/or less
unfavorable job attitudes) than younger workers did. They also noted that among the 800 articles
studied, publication year of the study moderated the relationships between age and job attitudes.
They pointed out the shift in the mean age of the U.S. workforce from 35 years old in 1980 to 41
years old in 2008, and noted that in 2010 more than half (54percent) of the work force was
between 40 and 75 years of age, and further indicated that this trend was a worldwide
phenomenon in developed countries.
Takahara (2014) compared the age-job satisfaction of public school teachers in Japan
with that of company employees in the same cultural context and found the teacher group
showed higher intrinsic satisfaction and lower extrinsic satisfaction compared to the company
employees group, and the age-job satisfaction for teachers decreased with age.
Summary
Chapter II offered a review of relevant literature to clarify the problem and to highlight
research about the topic of job satisfaction among middle school teachers. The theoretical
constructs of motivation and job satisfaction were described which provide the bases of this
study. Both Maslow (1954) and Herzberg (1959) were emphasized for their foundational work in
these areas. The construct of job satisfaction was defined and current research cited.
50
The unique characteristics of a middle school were provided (Harley, 2010), as well as
data from the MetLife Survey of the American Teacher (2013) which reported a decline in job
satisfaction for teachers in recent years. Also within this chapter, current and relevant literature
on the nine subscales including retention and turnover, compensation, promotion, supervision,
fringe benefits, contingent rewards, operating conditions and co-workers was provided as were
the demographic variables related to this study.
Chapter III reports on the methodology that will be utilized in collecting and analyzing
data relative to the job satisfaction of middle school teachers in the schools used in this study.
51
CHAPTER III
METHODOLOGY
Chapter III provides details concerning the methodology that was utilized in the
collection and treatment of the data for this study. It includes: a restatement of the purpose of the
study; a description of the participants of the study; a description of the research design; an
explanation of the Job Satisfaction Survey (JSS) employed; dependent and independent
variables; the method employed in scoring the JSS; the psychometrics relevant to the
consistency, reliability, and validity of the instrument; data collection and analysis procedures;
and a summary. The methodology employed in this study parallels previous work done by
Natalia Cui-Callahan (2012) and Michael Bumgartner (2013) who both conducted studies of
teacher job satisfaction in urban high schools and rural schools respectively.
Restatement of the Purpose
The purpose of this study was to investigate the level of teacher job satisfaction in thirteen
middle schools located in an urban school district in a western state, as well as to possibly identify
factors that lead to job satisfaction in middle schools. The research questions this study
investigated were:
1. Were there significant differences between groups of middle school teachers
established by Gender Group on the intrinsic and extrinsic scores of the Job
Satisfaction Survey?
2. Were there significant differences between groups of middle school teachers
established by Highest Level of Education on the intrinsic and extrinsic scores of the
Job Satisfaction Survey?
3. Were there significant differences between groups of middle school teachers
52
established by Teaching in Core subjects v. Teaching in Non-core subjects based on
the intrinsic and extrinsic scores of the JSS?
4. Were there significant differences between groups of middle school teachers
established by Age Group based on the intrinsic and extrinsic scores of the JSS?
5. Were there significant differences between groups of middle school teachers
established by Years to Retirement in the Current Retirement System based on the
intrinsic and extrinsic scores of the JSS?
6. Were there significant differences between groups of middle school teachers
established by Total Years of Teaching Experience based on the intrinsic and extrinsic
scores of the JSS?
7. Were there significant differences between groups of middle school teachers
established by Number of Schools Taught based on the intrinsic and extrinsic scores
of the JSS?
8. Were there significant differences between groups of middle school teachers
established by Salary in the urban district based on the intrinsic and extrinsic means
of the JSS?
Specifics concerning the research design are explained in the next section.
Research Design
This was a quantitative study that utilized an established questionnaire designed
to assess job satisfaction. In addition, one qualitative item was included in the survey. Data was
collected from middle school teachers in a large urban district. Individual components of the
research design are discussed below.
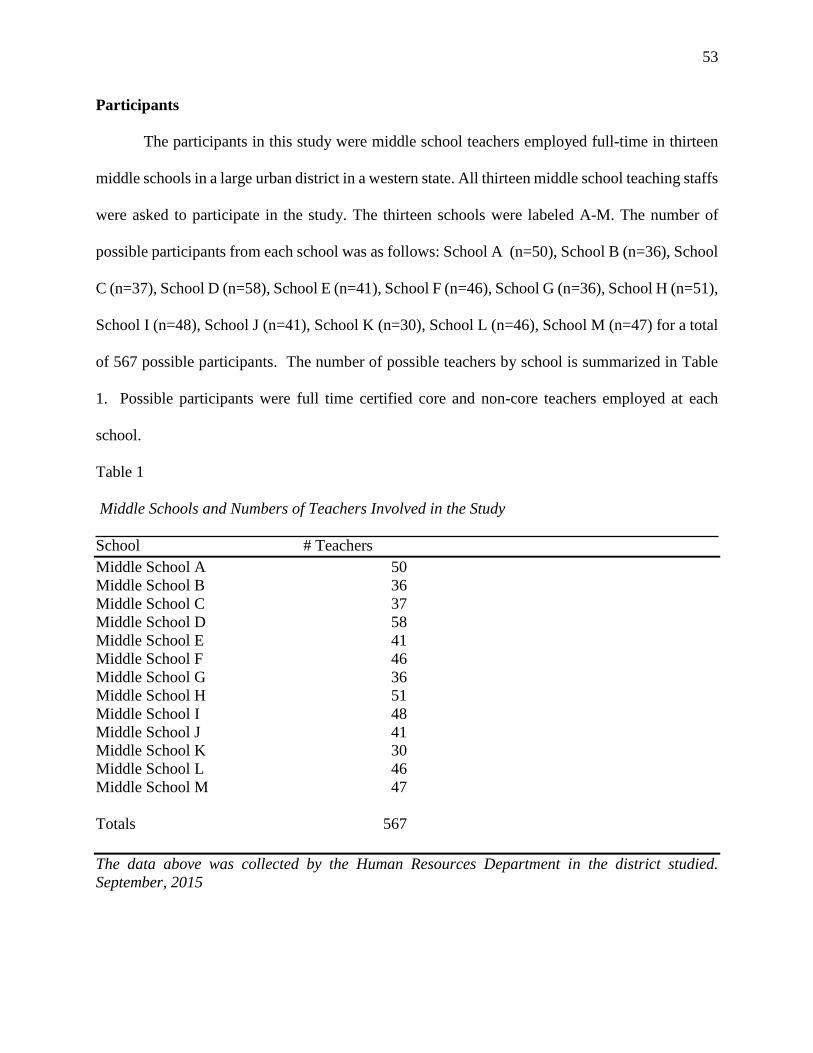
53
Participants
The participants in this study were middle school teachers employed full-time in thirteen
middle schools in a large urban district in a western state. All thirteen middle school teaching staffs
were asked to participate in the study. The thirteen schools were labeled A-M. The number of
possible participants from each school was as follows: School A (n=50), School B (n=36), School
C (n=37), School D (n=58), School E (n=41), School F (n=46), School G (n=36), School H (n=51),
School I (n=48), School J (n=41), School K (n=30), School L (n=46), School M (n=47) for a total
of 567 possible participants. The number of possible teachers by school is summarized in Table
1. Possible participants were full time certified core and non-core teachers employed at each
school.
Table 1
Middle Schools and Numbers of Teachers Involved in the Study
School # Teachers
Middle School A 50
Middle School B 36
Middle School C 37
Middle School D 58
Middle School E 41
Middle School F 46
Middle School G 36
Middle School H 51
Middle School I 48
Middle School J 41
Middle School K 30
Middle School L 46
Middle School M 47
Totals 567
The data above was collected by the Human Resources Department in the district studied.
September, 2015
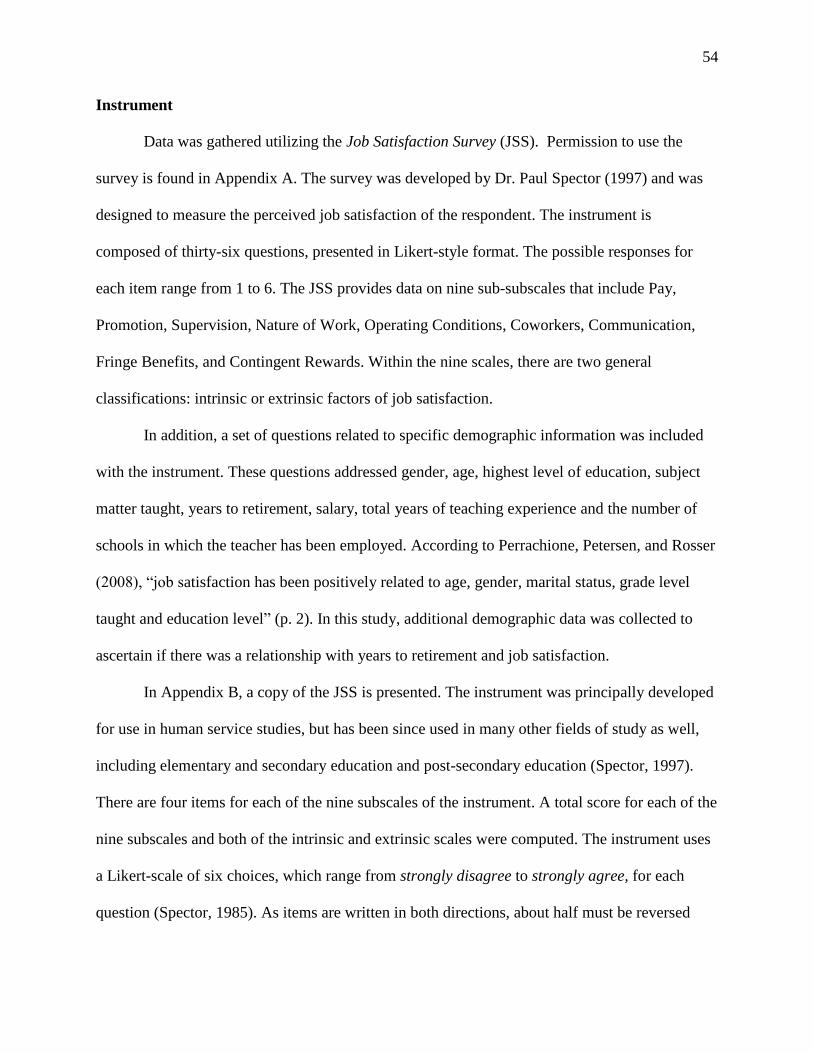
54
Instrument
Data was gathered utilizing the Job Satisfaction Survey (JSS). Permission to use the
survey is found in Appendix A. The survey was developed by Dr. Paul Spector (1997) and was
designed to measure the perceived job satisfaction of the respondent. The instrument is
composed of thirty-six questions, presented in Likert-style format. The possible responses for
each item range from 1 to 6. The JSS provides data on nine sub-subscales that include Pay,
Promotion, Supervision, Nature of Work, Operating Conditions, Coworkers, Communication,
Fringe Benefits, and Contingent Rewards. Within the nine scales, there are two general
classifications: intrinsic or extrinsic factors of job satisfaction.
In addition, a set of questions related to specific demographic information was included
with the instrument. These questions addressed gender, age, highest level of education, subject
matter taught, years to retirement, salary, total years of teaching experience and the number of
schools in which the teacher has been employed. According to Perrachione, Petersen, and Rosser
(2008), “job satisfaction has been positively related to age, gender, marital status, grade level
taught and education level” (p. 2). In this study, additional demographic data was collected to
ascertain if there was a relationship with years to retirement and job satisfaction.
In Appendix B, a copy of the JSS is presented. The instrument was principally developed
for use in human service studies, but has been since used in many other fields of study as well,
including elementary and secondary education and post-secondary education (Spector, 1997).
There are four items for each of the nine subscales of the instrument. A total score for each of the
nine subscales and both of the intrinsic and extrinsic scales were computed. The instrument uses
a Likert-scale of six choices, which range from strongly disagree to strongly agree, for each
question (Spector, 1985). As items are written in both directions, about half must be reversed
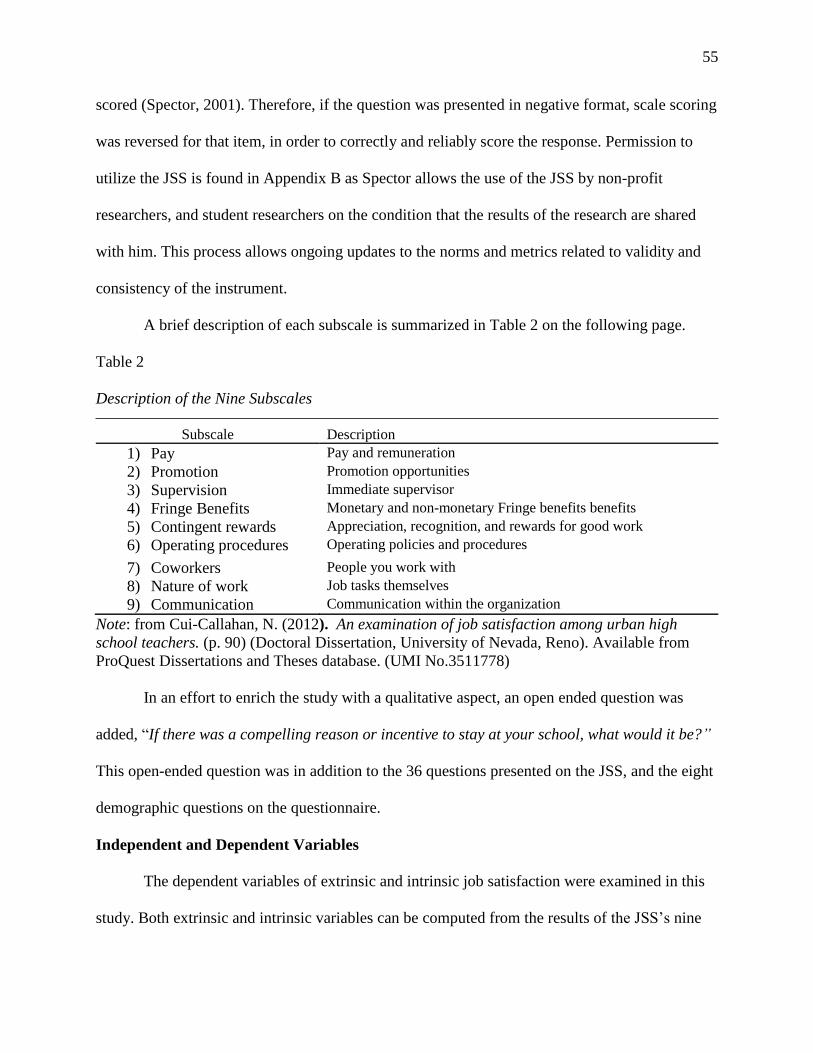
55
scored (Spector, 2001). Therefore, if the question was presented in negative format, scale scoring
was reversed for that item, in order to correctly and reliably score the response. Permission to
utilize the JSS is found in Appendix B as Spector allows the use of the JSS by non-profit
researchers, and student researchers on the condition that the results of the research are shared
with him. This process allows ongoing updates to the norms and metrics related to validity and
consistency of the instrument.
A brief description of each subscale is summarized in Table 2 on the following page.
Table 2
Description of the Nine Subscales
Subscale Description
1) Pay Pay and remuneration
2) Promotion Promotion opportunities
3) Supervision Immediate supervisor
4) Fringe Benefits Monetary and non-monetary Fringe benefits benefits
5) Contingent rewards Appreciation, recognition, and rewards for good work
6) Operating procedures Operating policies and procedures
7) Coworkers People you work with
8) Nature of work Job tasks themselves
9) Communication Communication within the organization
Note: from Cui-Callahan, N. (2012). An examination of job satisfaction among urban high
school teachers. (p. 90) (Doctoral Dissertation, University of Nevada, Reno). Available from
ProQuest Dissertations and Theses database. (UMI No.3511778)
In an effort to enrich the study with a qualitative aspect, an open ended question was
added, “If there was a compelling reason or incentive to stay at your school, what would it be?”
This open-ended question was in addition to the 36 questions presented on the JSS, and the eight
demographic questions on the questionnaire.
Independent and Dependent Variables
The dependent variables of extrinsic and intrinsic job satisfaction were examined in this
study. Both extrinsic and intrinsic variables can be computed from the results of the JSS’s nine
56
subscales. Thus, the dependent variables included the nine JSS subscales, Intrinsic Motivation,
and Extrinsic Motivation. Moreover, the study analyzed the impact of eight independent
demographic variables in relationship to the various measures of job satisfaction: gender, age,
highest level of education, subject matter taught, years to retirement, salary, total years of
teaching experience and the number of schools in which the teacher was employed.
Each of the nine subscales were associated with four survey questions. Each survey
question had a rating scale between one and six. Accordingly, for each response, each of the nine
subscales received a total score between 4 and 24 for each survey respondent. In addition, a total
Intrinsic Motivation score and a total Extrinsic Motivation score were computed. Four
subscales or 16 items were associated with intrinsic motivation for a possible range from 16-96.
Five subscales or 20 items were associated with Extrinsic Motivation for a range of 20 to 120.
According to Spector, for individual items, high scores (6) represent high satisfaction, while low
scores (1) represent low satisfaction. It is important to note that because nearly half of the
questions were stated in a negative format, scoring was reversed in those items. Thus, the final
score indicated that larger values were illustrative of higher motivation than were smaller values.
The items associated with each subscales and corresponding subscales associated with the
dependent variables of extrinsic and intrinsic motivation are summarized in Table 3.
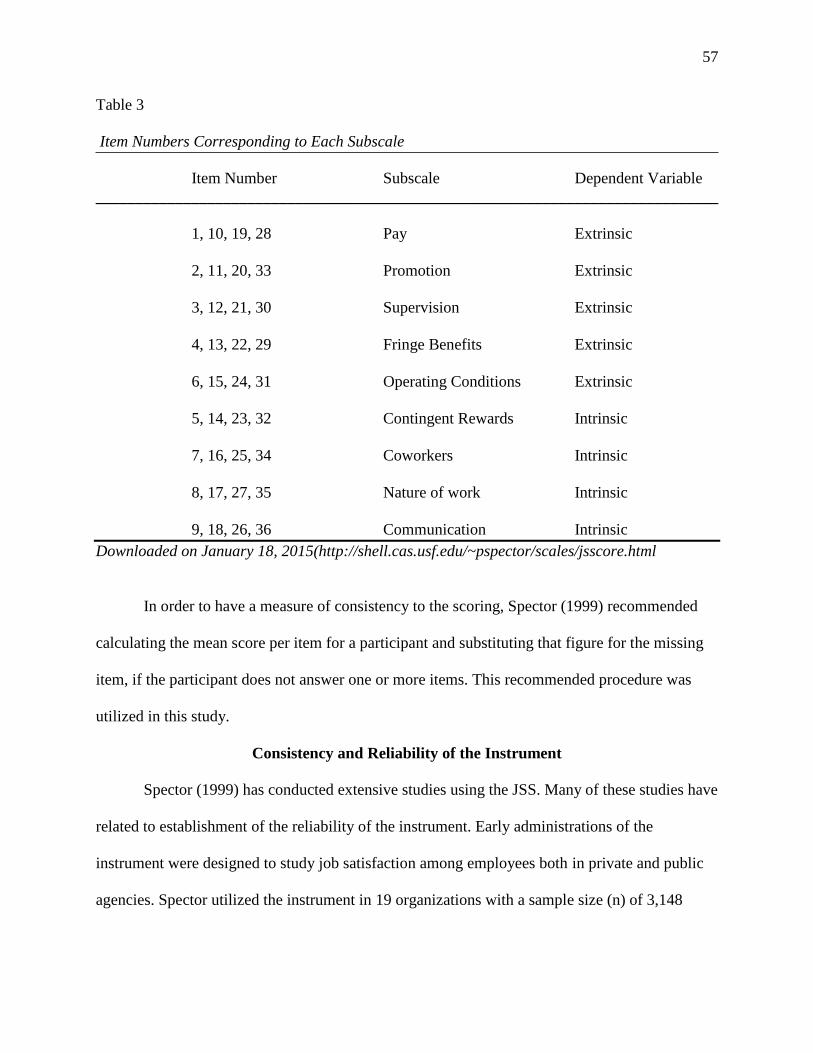
57
Table 3
Item Numbers Corresponding to Each Subscale
Item Number Subscale Dependent Variable
______________________________________________________________________________
1, 10, 19, 28 Pay Extrinsic
2, 11, 20, 33 Promotion Extrinsic
3, 12, 21, 30 Supervision Extrinsic
4, 13, 22, 29 Fringe Benefits Extrinsic
6, 15, 24, 31 Operating Conditions Extrinsic
5, 14, 23, 32 Contingent Rewards Intrinsic
7, 16, 25, 34 Coworkers Intrinsic
8, 17, 27, 35 Nature of work Intrinsic
9, 18, 26, 36 Communication Intrinsic
Downloaded on January 18, 2015(http://shell.cas.usf.edu/~pspector/scales/jsscore.html
In order to have a measure of consistency to the scoring, Spector (1999) recommended
calculating the mean score per item for a participant and substituting that figure for the missing
item, if the participant does not answer one or more items. This recommended procedure was
utilized in this study.
Consistency and Reliability of the Instrument
Spector (1999) has conducted extensive studies using the JSS. Many of these studies have
related to establishment of the reliability of the instrument. Early administrations of the
instrument were designed to study job satisfaction among employees both in private and public
agencies. Spector utilized the instrument in 19 organizations with a sample size (n) of 3,148
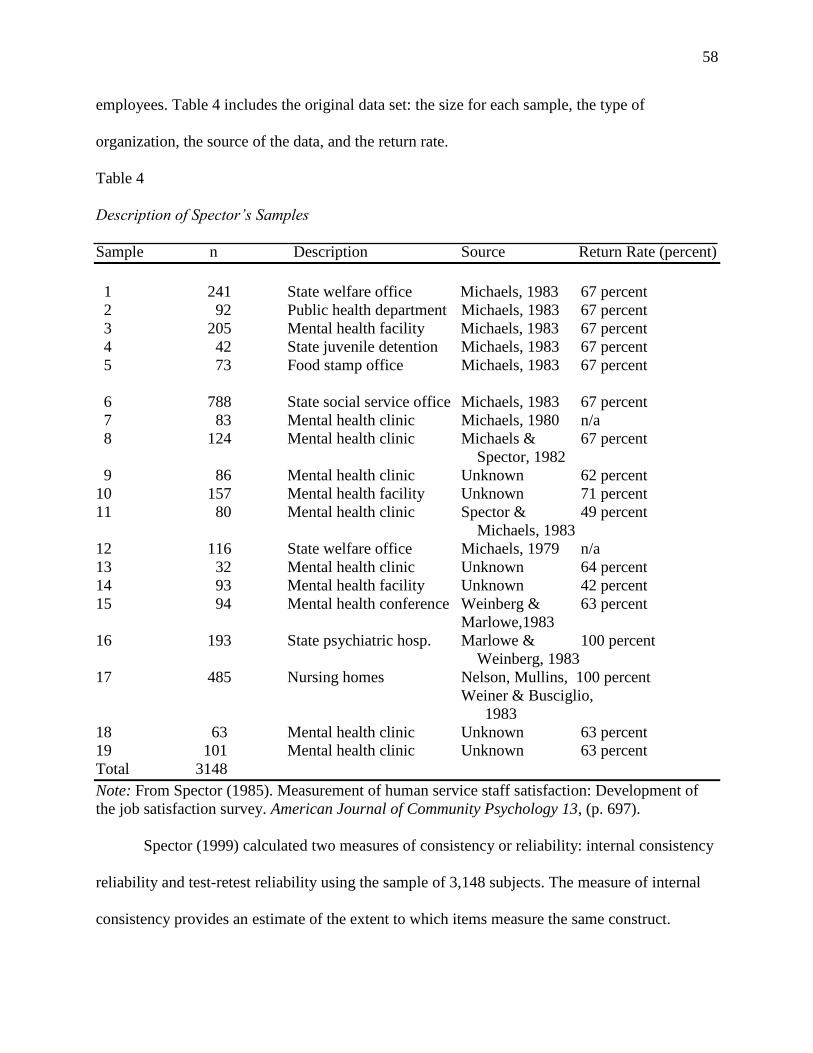
58
employees. Table 4 includes the original data set: the size for each sample, the type of
organization, the source of the data, and the return rate.
Table 4
Description of Spector’s Samples
Sample n Description Source Return Rate (percent)
1 241 State welfare office Michaels, 1983 67 percent
2 92 Public health department Michaels, 1983 67 percent
3 205 Mental health facility Michaels, 1983 67 percent
4 42 State juvenile detention Michaels, 1983 67 percent
5 73 Food stamp office Michaels, 1983 67 percent
6 788 State social service office Michaels, 1983 67 percent
7 83 Mental health clinic Michaels, 1980 n/a
8 124 Mental health clinic Michaels & 67 percent
Spector, 1982
9 86 Mental health clinic Unknown 62 percent
10 157 Mental health facility Unknown 71 percent
11 80 Mental health clinic Spector & 49 percent
Michaels, 1983
12 116 State welfare office Michaels, 1979 n/a
13 32 Mental health clinic Unknown 64 percent
14 93 Mental health facility Unknown 42 percent
15 94 Mental health conference Weinberg & 63 percent
Marlowe,1983
16 193 State psychiatric hosp. Marlowe & 100 percent
Weinberg, 1983
17 485 Nursing homes Nelson, Mullins, 100 percent
Weiner & Busciglio,
1983
18 63 Mental health clinic Unknown 63 percent
19 101 Mental health clinic Unknown 63 percent
Total 3148
Note: From Spector (1985). Measurement of human service staff satisfaction: Development of
the job satisfaction survey. American Journal of Community Psychology 13, (p. 697).
Spector (1999) calculated two measures of consistency or reliability: internal consistency
reliability and test-retest reliability using the sample of 3,148 subjects. The measure of internal
consistency provides an estimate of the extent to which items measure the same construct.
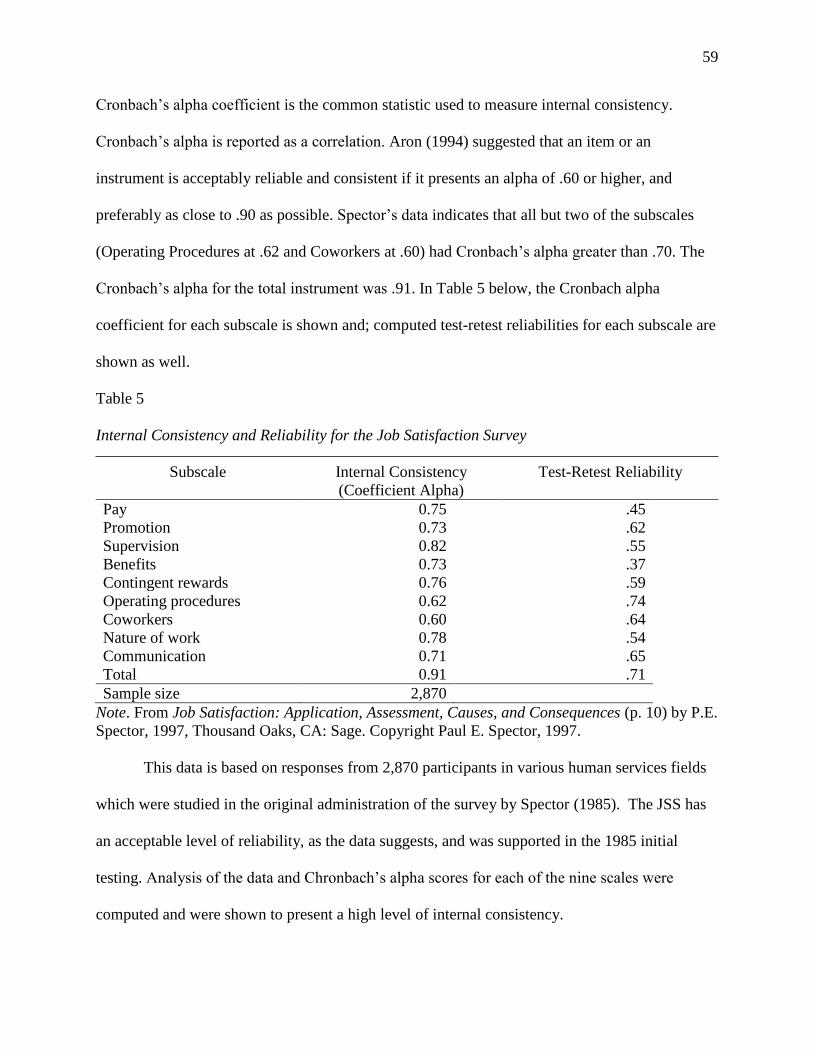
59
Cronbach’s alpha coefficient is the common statistic used to measure internal consistency.
Cronbach’s alpha is reported as a correlation. Aron (1994) suggested that an item or an
instrument is acceptably reliable and consistent if it presents an alpha of .60 or higher, and
preferably as close to .90 as possible. Spector’s data indicates that all but two of the subscales
(Operating Procedures at .62 and Coworkers at .60) had Cronbach’s alpha greater than .70. The
Cronbach’s alpha for the total instrument was .91. In Table 5 below, the Cronbach alpha
coefficient for each subscale is shown and; computed test-retest reliabilities for each subscale are
shown as well.
Table 5
Internal Consistency and Reliability for the Job Satisfaction Survey
Subscale Internal Consistency
(Coefficient Alpha)
Test-Retest Reliability
Pay 0.75 .45
Promotion 0.73 .62
Supervision 0.82 .55
Benefits 0.73 .37
Contingent rewards 0.76 .59
Operating procedures 0.62 .74
Coworkers 0.60 .64
Nature of work 0.78 .54
Communication 0.71 .65
Total 0.91 .71
Sample size 2,870
Note. From Job Satisfaction: Application, Assessment, Causes, and Consequences (p. 10) by P.E.
Spector, 1997, Thousand Oaks, CA: Sage. Copyright Paul E. Spector, 1997.
This data is based on responses from 2,870 participants in various human services fields
which were studied in the original administration of the survey by Spector (1985). The JSS has
an acceptable level of reliability, as the data suggests, and was supported in the 1985 initial
testing. Analysis of the data and Chronbach’s alpha scores for each of the nine scales were
computed and were shown to present a high level of internal consistency.
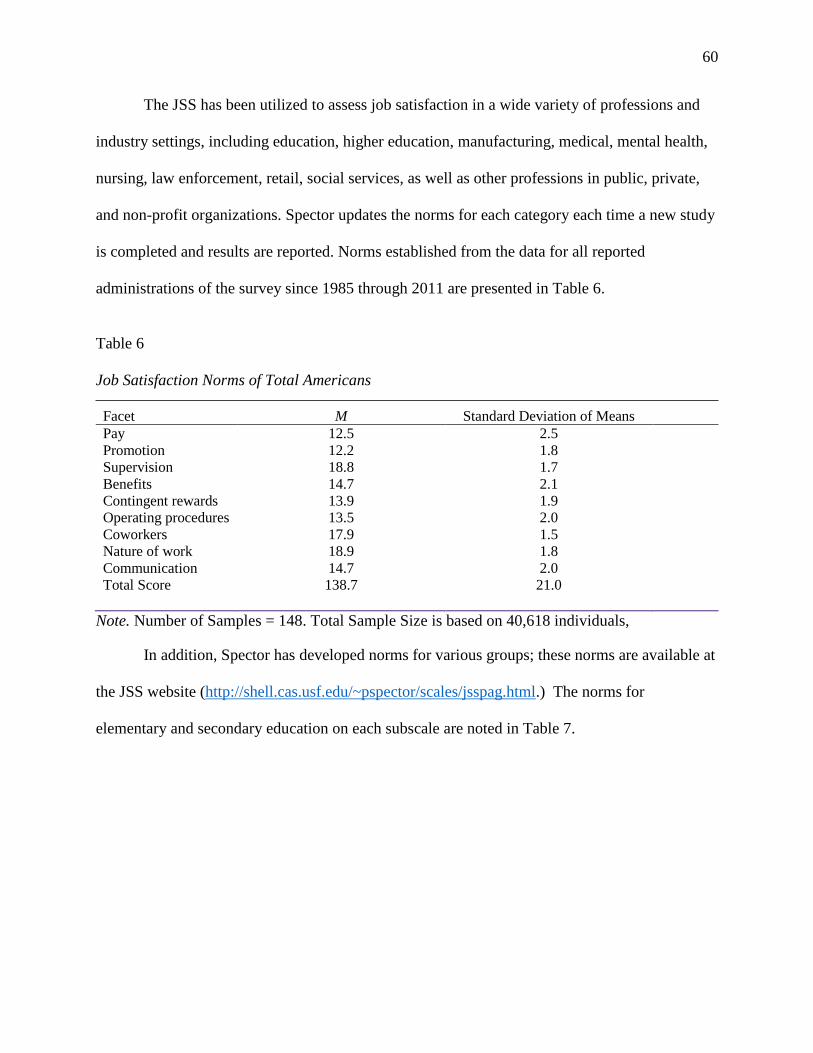
60
The JSS has been utilized to assess job satisfaction in a wide variety of professions and
industry settings, including education, higher education, manufacturing, medical, mental health,
nursing, law enforcement, retail, social services, as well as other professions in public, private,
and non-profit organizations. Spector updates the norms for each category each time a new study
is completed and results are reported. Norms established from the data for all reported
administrations of the survey since 1985 through 2011 are presented in Table 6.
Table 6
Job Satisfaction Norms of Total Americans
Facet M Standard Deviation of Means
Pay 12.5 2.5
Promotion 12.2 1.8
Supervision 18.8 1.7
Benefits 14.7 2.1
Contingent rewards 13.9 1.9
Operating procedures 13.5 2.0
Coworkers 17.9 1.5
Nature of work 18.9 1.8
Communication 14.7 2.0
Total Score 138.7 21.0
Note. Number of Samples = 148. Total Sample Size is based on 40,618 individuals,
In addition, Spector has developed norms for various groups; these norms are available at
the JSS website (http://shell.cas.usf.edu/~pspector/scales/jsspag.html.) The norms for
elementary and secondary education on each subscale are noted in Table 7.
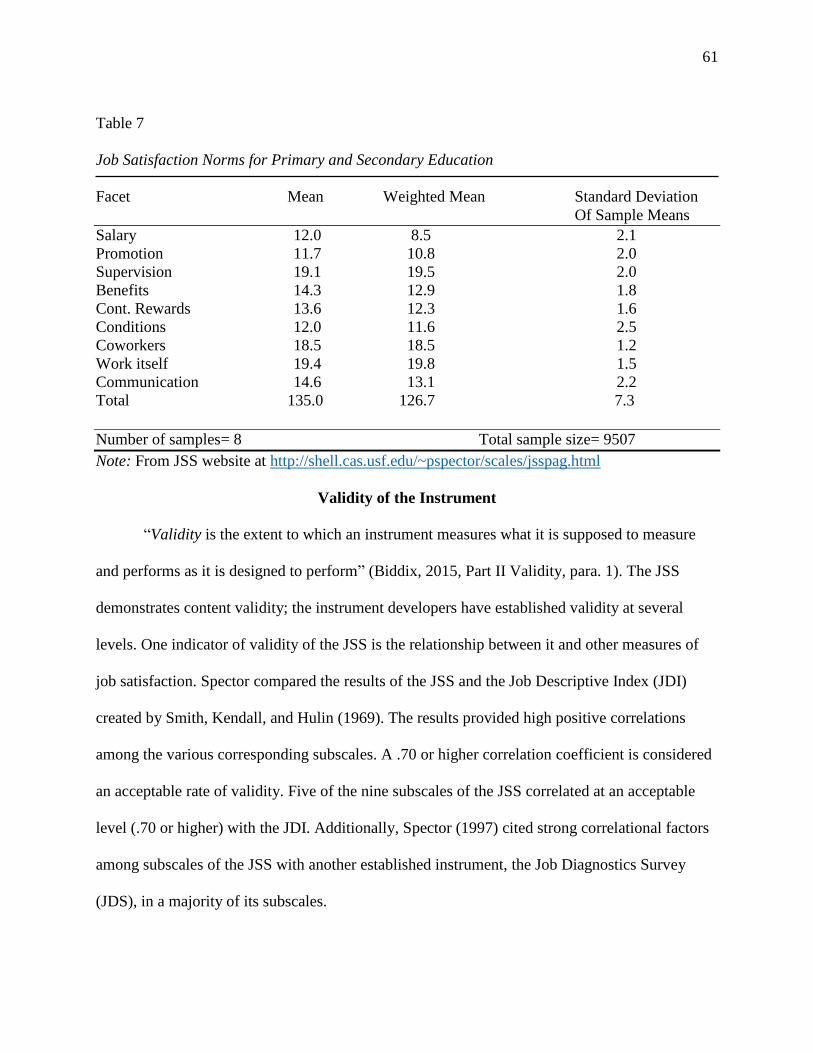
61
Table 7
Job Satisfaction Norms for Primary and Secondary Education
Facet Mean Weighted Mean Standard Deviation
Of Sample Means
Salary 12.0 8.5 2.1
Promotion 11.7 10.8 2.0
Supervision 19.1 19.5 2.0
Benefits 14.3 12.9 1.8
Cont. Rewards 13.6 12.3 1.6
Conditions 12.0 11.6 2.5
Coworkers 18.5 18.5 1.2
Work itself 19.4 19.8 1.5
Communication 14.6 13.1 2.2
Total 135.0 126.7 7.3
Number of samples= 8 Total sample size= 9507
Note: From JSS website at http://shell.cas.usf.edu/~pspector/scales/jsspag.html
Validity of the Instrument
“Validity is the extent to which an instrument measures what it is supposed to measure
and performs as it is designed to perform” (Biddix, 2015, Part II Validity, para. 1). The JSS
demonstrates content validity; the instrument developers have established validity at several
levels. One indicator of validity of the JSS is the relationship between it and other measures of
job satisfaction. Spector compared the results of the JSS and the Job Descriptive Index (JDI)
created by Smith, Kendall, and Hulin (1969). The results provided high positive correlations
among the various corresponding subscales. A .70 or higher correlation coefficient is considered
an acceptable rate of validity. Five of the nine subscales of the JSS correlated at an acceptable
level (.70 or higher) with the JDI. Additionally, Spector (1997) cited strong correlational factors
among subscales of the JSS with another established instrument, the Job Diagnostics Survey
(JDS), in a majority of its subscales.
62
The JSS has been used in numerous studies, has reliability for each subscale, has been
used in various public and private professions, and has been in use for over thirty years. The
instrument has survived intense scrutiny by researchers. As with any survey instrument, the JSS
does present some disadvantages. One of the most substantial disadvantage is the subscales
measured are somewhat generic in nature; meaning, that for a specific profession and unique job
satisfaction elements of the profession cannot be measured.
Data Collection
Permission was obtained from the University Institutional Review Board (IRB) to
conduct the study (Appendix C). Permission to administer the survey was obtained from the
district’s internal Accountability Department. Once permission was granted, the principal at each
middle school in the district under study was contacted for the purpose of explaining the study,
the survey, the importance of the study, an explanation of voluntary participation, the potential
benefits and risks of participation, and to obtain permission to collect data at that site. The
Principal Investigator (PI) asked each middle school principal to provide time during a staff
meeting when the PI was able to provide information about the study and the survey.
Each teacher received an email with the survey link which enabled them to take the
survey. The directions to the teacher included information on security and the level taken to
secure anonymity of responses as well as the explicit information that the completion of the
survey was voluntary. A copy of specific instructions and email communication can be found in
Appendix D. Because the survey was administered online, teachers were able to take the survey
at any time and it did not interfere with their work day. Each respondent was given a numerical
coding in order to assure the survey was anonymous. It is estimated that the survey took
63
approximately 20 minutes to complete. The responses were downloaded by a graduate student
who was compensated for her time to collect and sort the data.
Data Analysis Procedures
Upon receipt of the completed surveys, data from each completed survey was entered
into an Excel spreadsheet. Key steps in the analysis of the data included pre-analysis,
computation of subscale scores, summary of descriptive statistics, and Multivariate Analysis of
Variance. Data analysis occurred through the use of Statistical Package for Social Sciences
(SPSS) software.
As an initial step, the data was screened for missing data. For missing data, Spector
(1999) recommended calculating the mean score per item for a participant and substituting the
computed mean for the missing item. Thus, if a respondent did not answer a question within the
JSS survey instrument, the item mean score was provided for the missing data. Out of the
possible 567 middle school teachers, 232 responded to the survey to yield an overall response
rate of 41 percent. Eight surveys were removed from the data set which had responses for 13 or
less items. Of the remaining 224, the number of missing observations for each item varied
between zero and six. The most items missing on a single survey was five. If information was
missing for demographic questions, the case was removed for analysis related to that question.
For example, if the respondent did not complete the question related to highest degree earned,
then the case was removed for analysis related to highest degree earned.
Scoring for item responses and the computation of subscale scores followed guidelines
established by Spector (1985). The items on the JSS are directional; therefore, some of the items
needed to be reverse scored before subscale scores were computed. Based on the research of Cui-
Callahan (2012) and Bumgartner (2013), the subscales were grouped into two clusters. Each of
64
the nine subscales of the survey was grouped to form two additional subscales: an extrinsic
subscale and an intrinsic subscale. The first were subscales that were associated with extrinsic
motivation. The extrinsic subscale was computed as the total sum value of pay, promotional
opportunities, supervision, fringe benefits, and operating conditions subscales. The second
subscales were based on intrinsic motivation and included the total sum value of contingent
rewards, coworkers, nature of work, and communication. The responses for these subscales were
summed to provide a measure for intrinsic job satisfaction. The means of the intrinsic and
extrinsic factor groupings served as the two dependent variables.
Descriptive statistics were then computed for each of the demographic variables. These
statistics included means and frequencies distributions as appropriate. The demographic
variables were gender, age, highest level of education, subject matter taught, years to retirement,
salary, total years of teaching experience and the number of schools in which the teacher has
been employed. Demographic data (independent variables) were coded to establish either two
groups or three groups for each variable. Figure 1 reports the eight research questions and the
levels of groupings as well as the labels for each grouping.
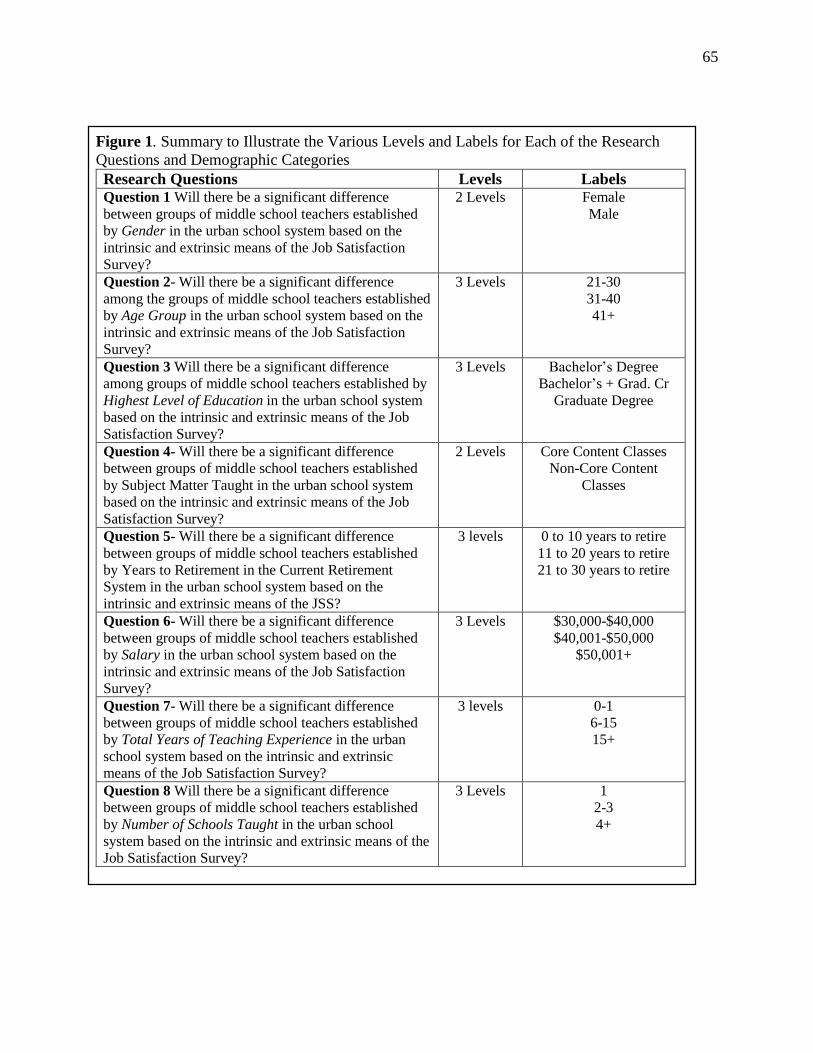
65
Figure 1. Summary to Illustrate the Various Levels and Labels for Each of the Research
Questions and Demographic Categories
Research Questions Levels Labels Question 1 Will there be a significant difference
between groups of middle school teachers established
by Gender in the urban school system based on the
intrinsic and extrinsic means of the Job Satisfaction
Survey?
2 Levels Female
Male
Question 2- Will there be a significant difference
among the groups of middle school teachers established
by Age Group in the urban school system based on the
intrinsic and extrinsic means of the Job Satisfaction
Survey?
3 Levels 21-30
31-40
41+
Question 3 Will there be a significant difference
among groups of middle school teachers established by
Highest Level of Education in the urban school system
based on the intrinsic and extrinsic means of the Job
Satisfaction Survey?
3 Levels Bachelor’s Degree
Bachelor’s + Grad. Cr
Graduate Degree
Question 4- Will there be a significant difference
between groups of middle school teachers established
by Subject Matter Taught in the urban school system
based on the intrinsic and extrinsic means of the Job
Satisfaction Survey?
2 Levels Core Content Classes
Non-Core Content
Classes
Question 5- Will there be a significant difference
between groups of middle school teachers established
by Years to Retirement in the Current Retirement
System in the urban school system based on the
intrinsic and extrinsic means of the JSS?
3 levels 0 to 10 years to retire
11 to 20 years to retire
21 to 30 years to retire
Question 6- Will there be a significant difference
between groups of middle school teachers established
by Salary in the urban school system based on the
intrinsic and extrinsic means of the Job Satisfaction
Survey?
3 Levels $30,000-$40,000
$40,001-$50,000
$50,001+
Question 7- Will there be a significant difference
between groups of middle school teachers established
by Total Years of Teaching Experience in the urban
school system based on the intrinsic and extrinsic
means of the Job Satisfaction Survey?
3 levels 0-1
6-15
15+
Question 8 Will there be a significant difference
between groups of middle school teachers established
by Number of Schools Taught in the urban school
system based on the intrinsic and extrinsic means of the
Job Satisfaction Survey?
3 Levels 1
2-3
4+
66
In summary of Chapter III, the analysis of the data included a series of steps. Preliminary
data analysis was completed and a MANOVA was conducted. A five-step protocol was followed
which is detailed below:
1. A series of groups were established based on the selected demographic variables. For
example, the responses were grouped by gender. That is, group one represented
female responders and group two represented male responders. This provided the two
groups which were the basis to address the research question. In a similar manner,
groups were established to address each research question.
2. Data analysis was conducted utilizing the SPSS program utilizing multivariate
analysis of variance tests (MANOVAs). A multivariate analysis of variance is
appropriate when more than one dependent variable is to be considered (Mertler &
Vannata, 2005). A MANOVA produces statistics to compare possible differences
between or among groups. First, an overall comparison of groups was conducted to
determine possible significance differences based on the dependent variables. For this
study, a MANOVA was computed for each demographic variable as appropriate. The
proposed number of groups for each demographic variable is summarized in Figure 1.
For the purposes of this study, significance level was set at the alpha (p) of p < .05.
MANOVA and ANOVA analysis followed the procedures established by Mertler and
Vannata (2005).
3. Post Hoc Analysis- If significant differences existed among groups, the appropriate
post hoc analysis was conducted. For each dependent variable, an ANOVA was
computed. If the number of groups was greater than two, then appropriate post hoc
analysis was conducted. If the ANOVAs were based on two groups, then the
67
corresponding means was inspected. Thus, the one way ANOVAs and corresponding
post hoc tests were used to determine possible significant differences between or
among corresponding group means.
4. Analysis of the open-ended question was conducted to study responses in relation to
job satisfaction.
5. Interpret the data- The results of the various statistical analyses was studied and
results interpreted. For this study, tests were considered significant if p values were
less than .05.
In conclusion, Chapter III provides details regarding the methodology that was used in
the collection and analysis of the data. Included are a restatement of the purpose of the study, the
research design of the study, participants in the study, the instruments used including the JSS,
demographic survey and one open-ended question, the independent and dependent variables,
scoring methods, reliability and validity of the JSS, data collection procedures, and the IRB
process. Chapter IV provides a summary of the results of the analysis of the data.

68
CHAPTER IV
RESULTS AND FINDINGS
The purpose of this study was to explore factors associated with job satisfaction among
middle school teachers employed at 13 middle schools in an urban school district. Chapter IV
presents a summary of the results of the analysis of the data in three sections. The first section
describes the process of cleaning the data which included the removal of certain cases related to
non-responses, and selected descriptive statistics. The second section presents a summary of the
results of the analysis of the data by each research question. Two sets of MANOVA results are
provided for each question, the first examines possible group differences based on Intrinsic
Motivation and Extrinsic Motivation subscales. The second MANOVA explores possible
differences among groups using the nine subscales as independent variables. The final section of
the chapter provides a summary of the analysis of the results of the open-ended question. The
chapter concludes with a brief summary of the results of the various analyses.
Data for the Study
Data were collected using the online survey software Survey Monkey. The data from the
results of the survey were used as the basis to study the research questions. Specifically, middle
school teachers were asked to complete the Job Satisfaction Survey (JSS) and to answer a series
of questions related to their demographic characteristics. In addition, the respondents were asked
one open ended question. The data were “cleaned” to develop the final data set for this study.
Out of the possible 567 middle school teachers, 232 responded to the survey to yield an
overall response rate of 41 percent. Eight responses were removed from the data set because the
teachers completed 13 survey items or less. Of the remaining 224, the number of missing
observations for each item varied between 0 and 6. For one respondent, the most survey items
69
missing were 5. That is, a review of the remaining responses indicated that no individual
respondent had omitted more than 5 items on the JSS portion of the survey instrument.
Some of the items on the JSS are negatively stated and some items are positively stated.
Using the guidelines provided by its authors a total score for each item was obtained and an
average score for each item was computed. That is, the negatively stated items were reverse
scored. After reverse-scoring the negatively-valence items, the average item score across the
224 observations was computed. For the remaining respondents, if a response for an item was
omitted, the specific item mean was used to replace the missing value. Using this approach, a
total of 56 values were replaced within the data set.
The demographic characteristics of the respondents were summarized and the results are
provided in Table 8. Two-hundred and twenty-two teachers indicated their gender.
Approximately 72.5percent of these teachers were female and 26.5percent were male. For this
study, the Age variable was collected using three categories: between 21 and 30 years old,
between 31 and 40 years old, and those 41 and older. The majority of teachers fell into the oldest
age category (41 and older, n = 113). Seventy teachers indicated that they were between the ages
of 31 and 40. Thirty eight teachers indicated that they were between 21 and 30.
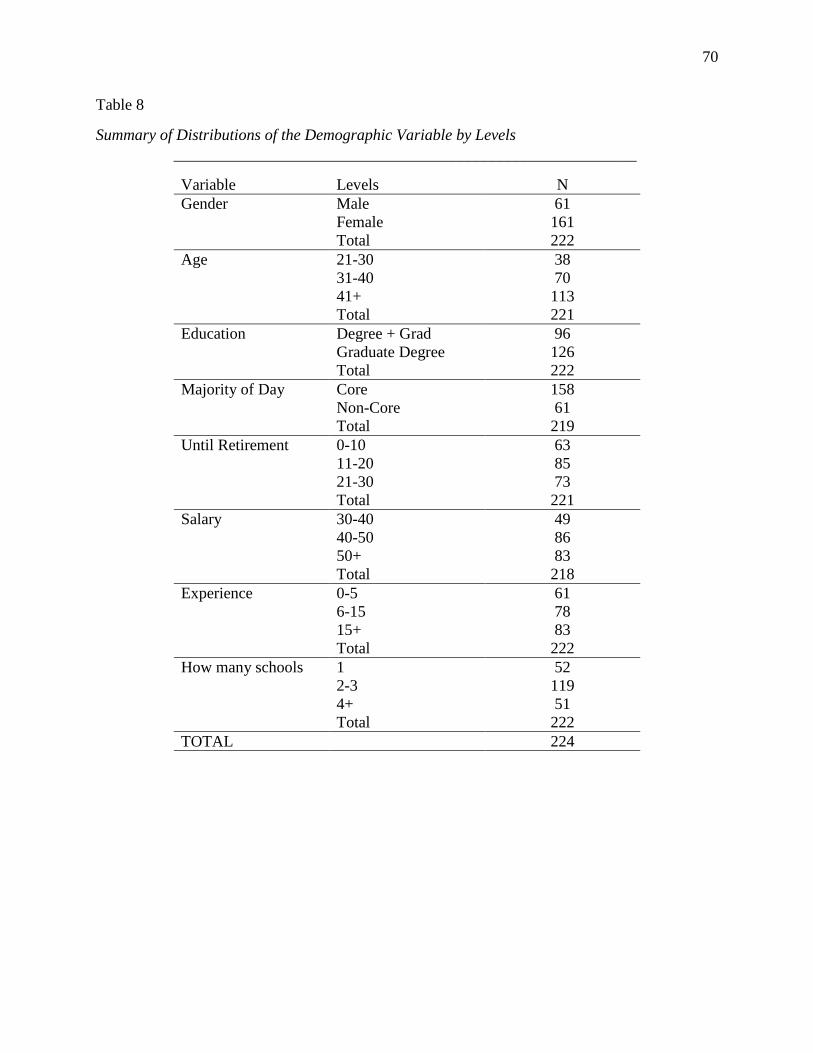
70
Table 8
Summary of Distributions of the Demographic Variable by Levels
__________________________________________________________
Variable Levels N
Gender Male 61
Female 161
Total 222
Age 21-30 38
31-40 70
41+ 113
Total 221
Education Degree + Grad 96
Graduate Degree 126
Total 222
Majority of Day Core 158
Non-Core 61
Total 219
Until Retirement 0-10 63
11-20 85
21-30 73
Total 221
Salary 30-40 49
40-50 86
50+ 83
Total 218
Experience 0-5 61
6-15 78
15+ 83
Total 222
How many schools 1 52
2-3 119
4+ 51
Total 222
TOTAL 224
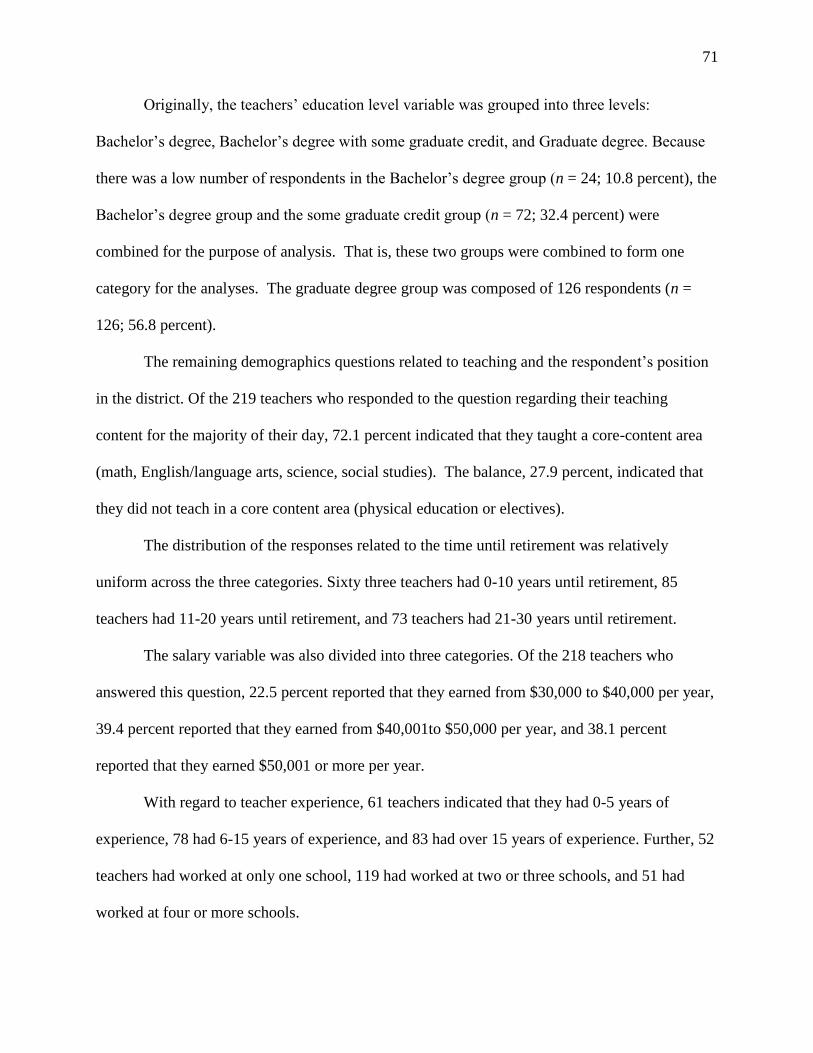
71
Originally, the teachers’ education level variable was grouped into three levels:
Bachelor’s degree, Bachelor’s degree with some graduate credit, and Graduate degree. Because
there was a low number of respondents in the Bachelor’s degree group (n = 24; 10.8 percent), the
Bachelor’s degree group and the some graduate credit group (n = 72; 32.4 percent) were
combined for the purpose of analysis. That is, these two groups were combined to form one
category for the analyses. The graduate degree group was composed of 126 respondents (n =
126; 56.8 percent).
The remaining demographics questions related to teaching and the respondent’s position
in the district. Of the 219 teachers who responded to the question regarding their teaching
content for the majority of their day, 72.1 percent indicated that they taught a core-content area
(math, English/language arts, science, social studies). The balance, 27.9 percent, indicated that
they did not teach in a core content area (physical education or electives).
The distribution of the responses related to the time until retirement was relatively
uniform across the three categories. Sixty three teachers had 0-10 years until retirement, 85
teachers had 11-20 years until retirement, and 73 teachers had 21-30 years until retirement.
The salary variable was also divided into three categories. Of the 218 teachers who
answered this question, 22.5 percent reported that they earned from $30,000 to $40,000 per year,
39.4 percent reported that they earned from $40,001to $50,000 per year, and 38.1 percent
reported that they earned $50,001 or more per year.
With regard to teacher experience, 61 teachers indicated that they had 0-5 years of
experience, 78 had 6-15 years of experience, and 83 had over 15 years of experience. Further, 52
teachers had worked at only one school, 119 had worked at two or three schools, and 51 had
worked at four or more schools.
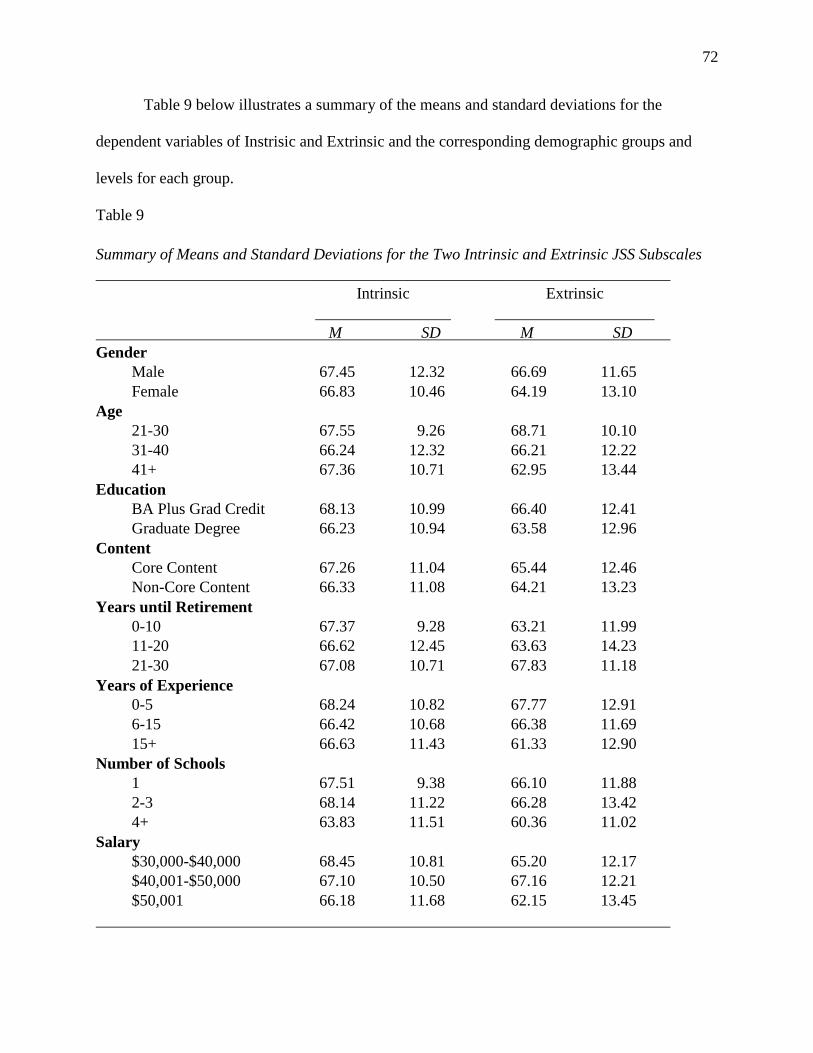
72
Table 9 below illustrates a summary of the means and standard deviations for the
dependent variables of Instrisic and Extrinsic and the corresponding demographic groups and
levels for each group.
Table 9
Summary of Means and Standard Deviations for the Two Intrinsic and Extrinsic JSS Subscales
________________________________________________________________________
Intrinsic Extrinsic
_________________ ____________________
M SD M SD
Gender
Male 67.45 12.32 66.69 11.65
Female 66.83 10.46 64.19 13.10
Age
21-30 67.55 9.26 68.71 10.10
31-40 66.24 12.32 66.21 12.22
41+ 67.36 10.71 62.95 13.44
Education
BA Plus Grad Credit 68.13 10.99 66.40 12.41
Graduate Degree 66.23 10.94 63.58 12.96
Content
Core Content 67.26 11.04 65.44 12.46
Non-Core Content 66.33 11.08 64.21 13.23
Years until Retirement
0-10 67.37 9.28 63.21 11.99
11-20 66.62 12.45 63.63 14.23
21-30 67.08 10.71 67.83 11.18
Years of Experience
0-5 68.24 10.82 67.77 12.91
6-15 66.42 10.68 66.38 11.69
15+ 66.63 11.43 61.33 12.90
Number of Schools
1 67.51 9.38 66.10 11.88
2-3 68.14 11.22 66.28 13.42
4+ 63.83 11.51 60.36 11.02
Salary
$30,000-$40,000 68.45 10.81 65.20 12.17
$40,001-$50,000 67.10 10.50 67.16 12.21
$50,001 66.18 11.68 62.15 13.45
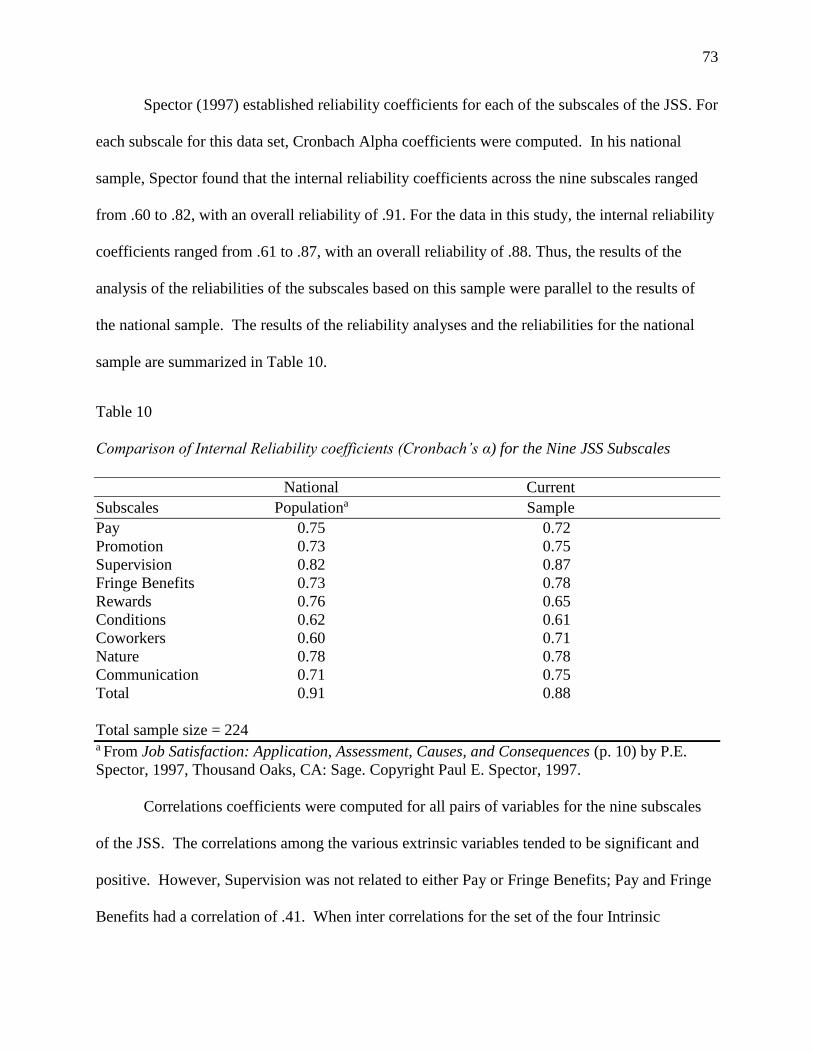
73
Spector (1997) established reliability coefficients for each of the subscales of the JSS. For
each subscale for this data set, Cronbach Alpha coefficients were computed. In his national
sample, Spector found that the internal reliability coefficients across the nine subscales ranged
from .60 to .82, with an overall reliability of .91. For the data in this study, the internal reliability
coefficients ranged from .61 to .87, with an overall reliability of .88. Thus, the results of the
analysis of the reliabilities of the subscales based on this sample were parallel to the results of
the national sample. The results of the reliability analyses and the reliabilities for the national
sample are summarized in Table 10.
Table 10
Comparison of Internal Reliability coefficients (Cronbach’s α) for the Nine JSS Subscales
National Current
Subscales Populationa Sample
Pay 0.75 0.72
Promotion 0.73 0.75
Supervision 0.82 0.87
Fringe Benefits 0.73 0.78
Rewards 0.76 0.65
Conditions 0.62 0.61
Coworkers 0.60 0.71
Nature 0.78 0.78
Communication 0.71 0.75
Total 0.91 0.88
Total sample size = 224 a From Job Satisfaction: Application, Assessment, Causes, and Consequences (p. 10) by P.E.
Spector, 1997, Thousand Oaks, CA: Sage. Copyright Paul E. Spector, 1997.
Correlations coefficients were computed for all pairs of variables for the nine subscales
of the JSS. The correlations among the various extrinsic variables tended to be significant and
positive. However, Supervision was not related to either Pay or Fringe Benefits; Pay and Fringe
Benefits had a correlation of .41. When inter correlations for the set of the four Intrinsic
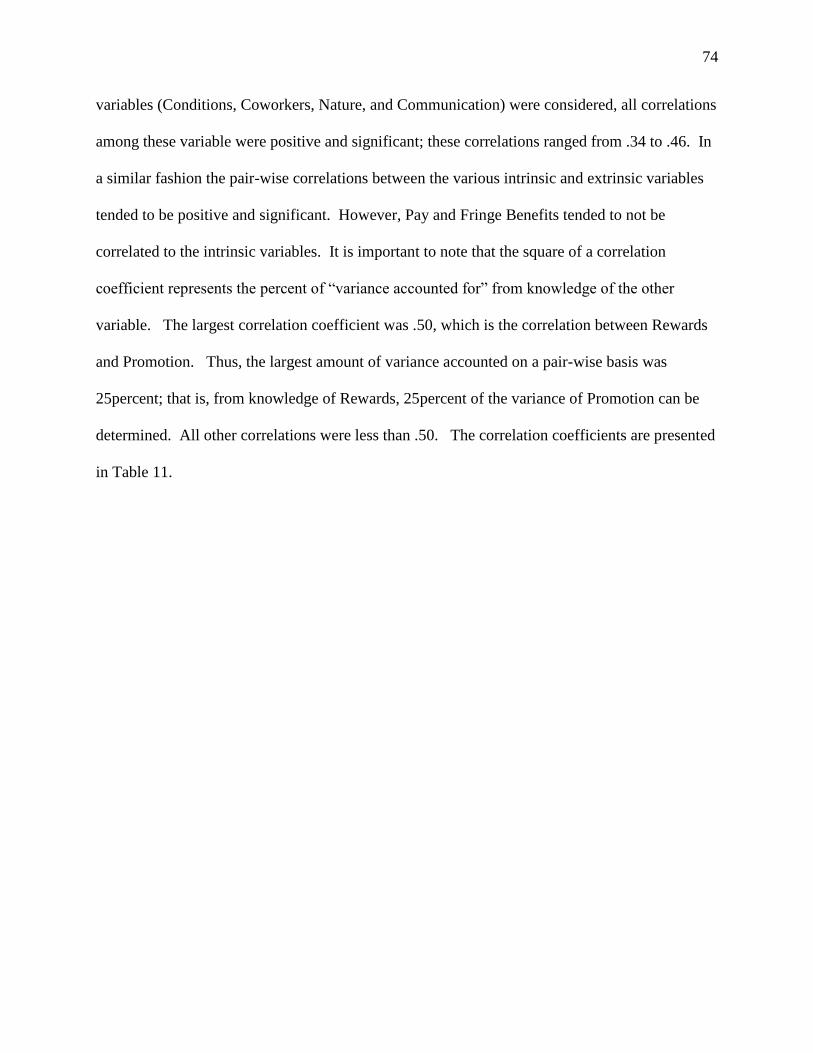
74
variables (Conditions, Coworkers, Nature, and Communication) were considered, all correlations
among these variable were positive and significant; these correlations ranged from .34 to .46. In
a similar fashion the pair-wise correlations between the various intrinsic and extrinsic variables
tended to be positive and significant. However, Pay and Fringe Benefits tended to not be
correlated to the intrinsic variables. It is important to note that the square of a correlation
coefficient represents the percent of “variance accounted for” from knowledge of the other
variable. The largest correlation coefficient was .50, which is the correlation between Rewards
and Promotion. Thus, the largest amount of variance accounted on a pair-wise basis was
25percent; that is, from knowledge of Rewards, 25percent of the variance of Promotion can be
determined. All other correlations were less than .50. The correlation coefficients are presented
in Table 11.
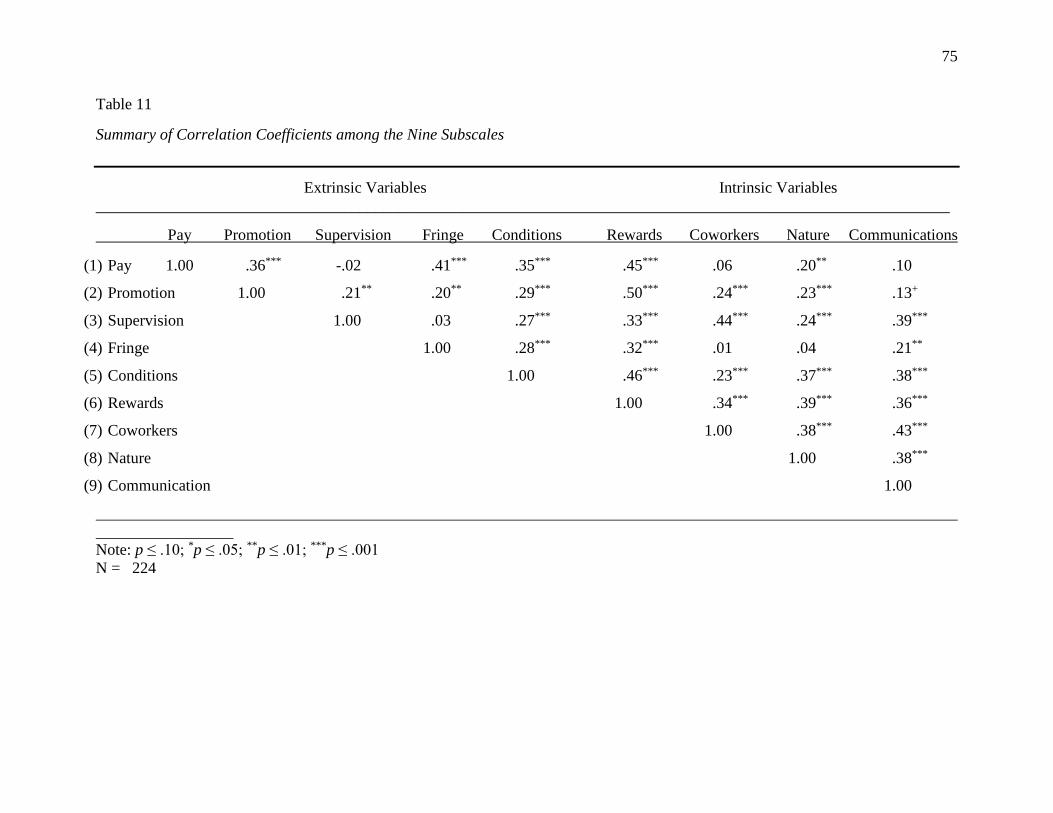
75
Table 11
Summary of Correlation Coefficients among the Nine Subscales
Extrinsic Variables Intrinsic Variables
___________________________________________________________________________________________________________
Pay Promotion Supervision Fringe Conditions Rewards Coworkers Nature Communications
(1) Pay 1.00 .36*** -.02 .41*** .35*** .45*** .06 .20** .10
(2) Promotion 1.00 .21** .20** .29*** .50*** .24*** .23*** .13+
(3) Supervision 1.00 .03 .27*** .33*** .44*** .24*** .39***
(4) Fringe 1.00 .28*** .32*** .01 .04 .21**
(5) Conditions 1.00 .46*** .23*** .37*** .38***
(6) Rewards 1.00 .34*** .39*** .36***
(7) Coworkers 1.00 .38*** .43***
(8) Nature 1.00 .38***
(9) Communication 1.00
Note: p ≤ .10; *p ≤ .05; **p ≤ .01; ***p ≤ .001
N = 224
76
Analysis by Groups
The JSS has nine subscales. The five subscales of Pay, Promotion, Supervision,
Fringe Benefits, and Operating Conditions have been identified by the developer of the
instruments as related to Extrinsic Motivation (Spector, 1997). The scores from these
subscales were totaled to provide the computed value for Extrinsic Motivation for each
respondent. The instrument has four subscales that have been identified as Intrinsic
Motivational subscales. These subscales are Contingent Rewards, Coworkers, Nature of
Work, and Communication. The results for these subscales were totaled to provide the
computed value for intrinsic motivation for each respondent.
These computed values for Intrinsic Motivation and Extrinsic Motivation became
the basis for the first set of MANOVAs. For this particular study, the level of
significance was established at alpha equal to 0.05 or 0.01. The responses were grouped
using selected demographic variables (i.e., gender, age, highest level of education,
subject matter taught, years to retirement, salary, total years of teaching experience, and
the number of schools in which the teacher has been employed). That is, a total of 8 one-
way MANOVAs were computed using the Extrinsic Motivation and the Intrinsic
Motivation as the dependent variable. In addition, 8 one-way MANOVAs were
computed using the 9 subscales of the JSS. The results are discussed by grouping
variable.
Analysis with Groups Established by Gender
As discussed above, the group of males had 61 respondents and the group of
females had 161 respondents. A Multivariate Analysis of Variance (MANOVA) was
conducted for the two groups with Intrinsic Motivation and Extrinsic Motivation as the
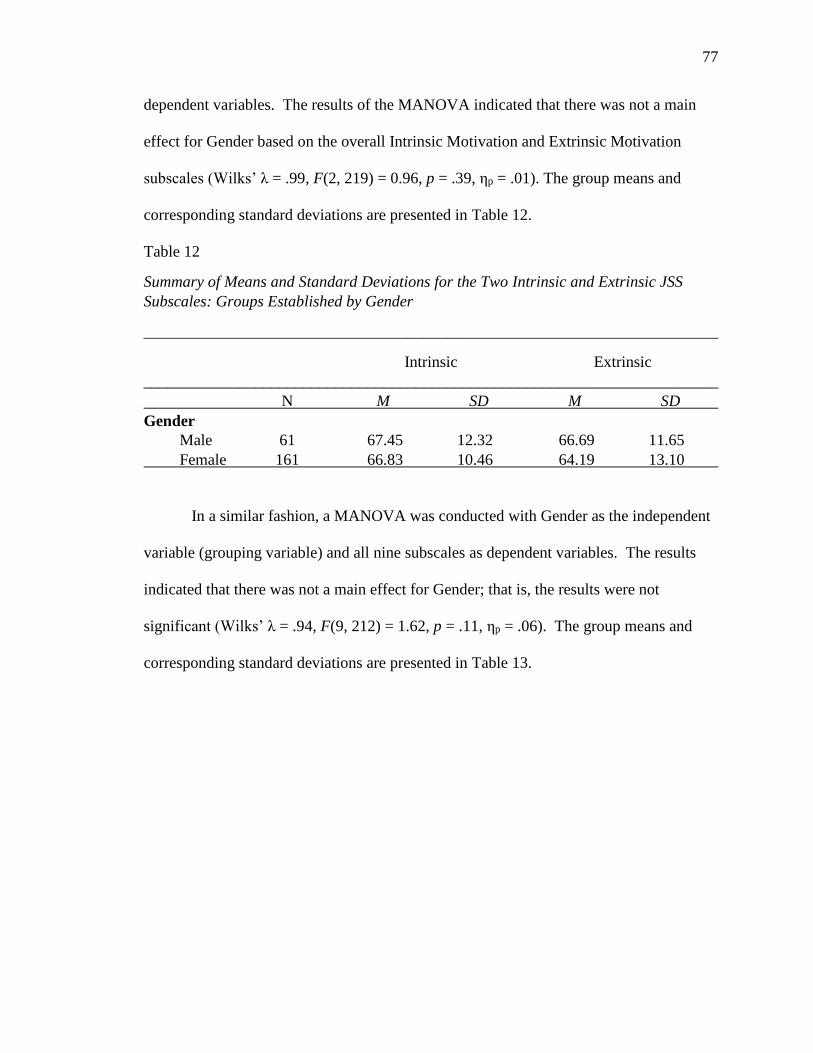
77
dependent variables. The results of the MANOVA indicated that there was not a main
effect for Gender based on the overall Intrinsic Motivation and Extrinsic Motivation
subscales (Wilks’ λ = .99, F(2, 219) = 0.96, p = .39, ηp = .01). The group means and
corresponding standard deviations are presented in Table 12.
Table 12
Summary of Means and Standard Deviations for the Two Intrinsic and Extrinsic JSS
Subscales: Groups Established by Gender
________________________________________________________________________
Intrinsic Extrinsic
________________________________________________________________________
N M SD M SD
Gender
Male 61 67.45 12.32 66.69 11.65
Female 161 66.83 10.46 64.19 13.10
In a similar fashion, a MANOVA was conducted with Gender as the independent
variable (grouping variable) and all nine subscales as dependent variables. The results
indicated that there was not a main effect for Gender; that is, the results were not
significant (Wilks’ λ = .94, F(9, 212) = 1.62, p = .11, ηp = .06). The group means and
corresponding standard deviations are presented in Table 13.
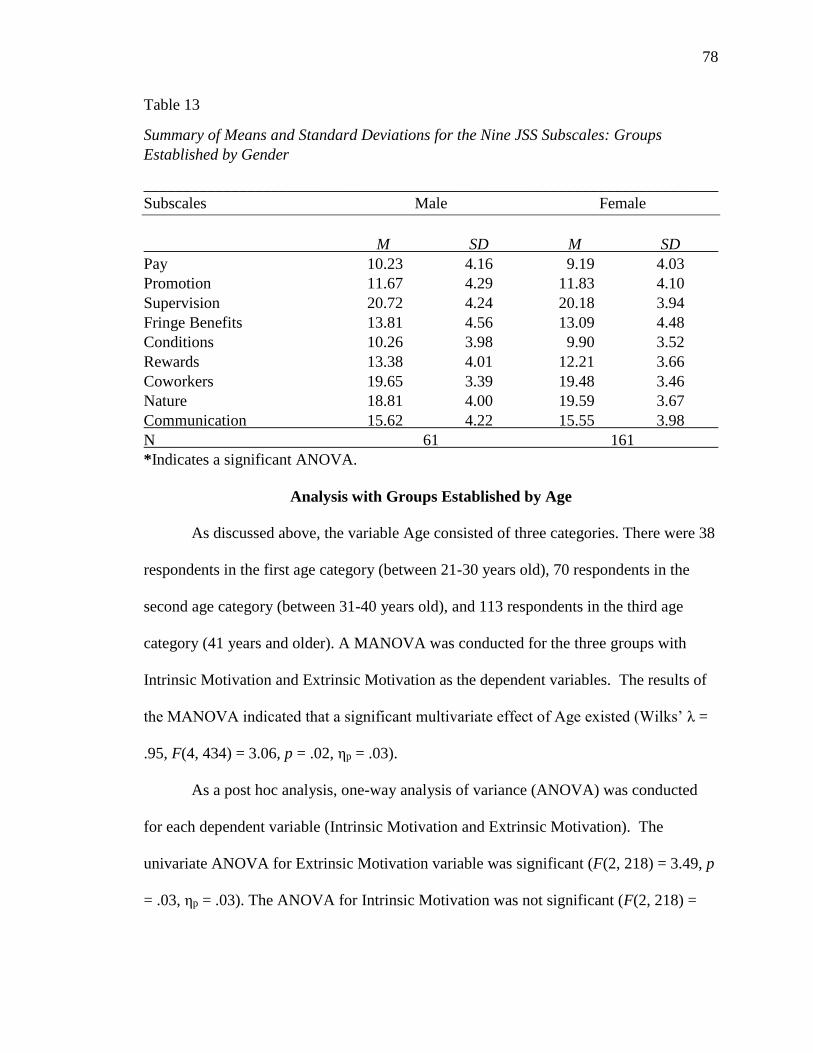
78
Table 13
Summary of Means and Standard Deviations for the Nine JSS Subscales: Groups
Established by Gender
________________________________________________________________________
Subscales Male Female
M SD M SD
Pay 10.23 4.16 9.19 4.03
Promotion 11.67 4.29 11.83 4.10
Supervision 20.72 4.24 20.18 3.94
Fringe Benefits 13.81 4.56 13.09 4.48
Conditions 10.26 3.98 9.90 3.52
Rewards 13.38 4.01 12.21 3.66
Coworkers 19.65 3.39 19.48 3.46
Nature 18.81 4.00 19.59 3.67
Communication 15.62 4.22 15.55 3.98
N 61 161
*Indicates a significant ANOVA.
Analysis with Groups Established by Age
As discussed above, the variable Age consisted of three categories. There were 38
respondents in the first age category (between 21-30 years old), 70 respondents in the
second age category (between 31-40 years old), and 113 respondents in the third age
category (41 years and older). A MANOVA was conducted for the three groups with
Intrinsic Motivation and Extrinsic Motivation as the dependent variables. The results of
the MANOVA indicated that a significant multivariate effect of Age existed (Wilks’ λ =
.95, F(4, 434) = 3.06, p = .02, ηp = .03).
As a post hoc analysis, one-way analysis of variance (ANOVA) was conducted
for each dependent variable (Intrinsic Motivation and Extrinsic Motivation). The
univariate ANOVA for Extrinsic Motivation variable was significant (F(2, 218) = 3.49, p
= .03, ηp = .03). The ANOVA for Intrinsic Motivation was not significant (F(2, 218) =
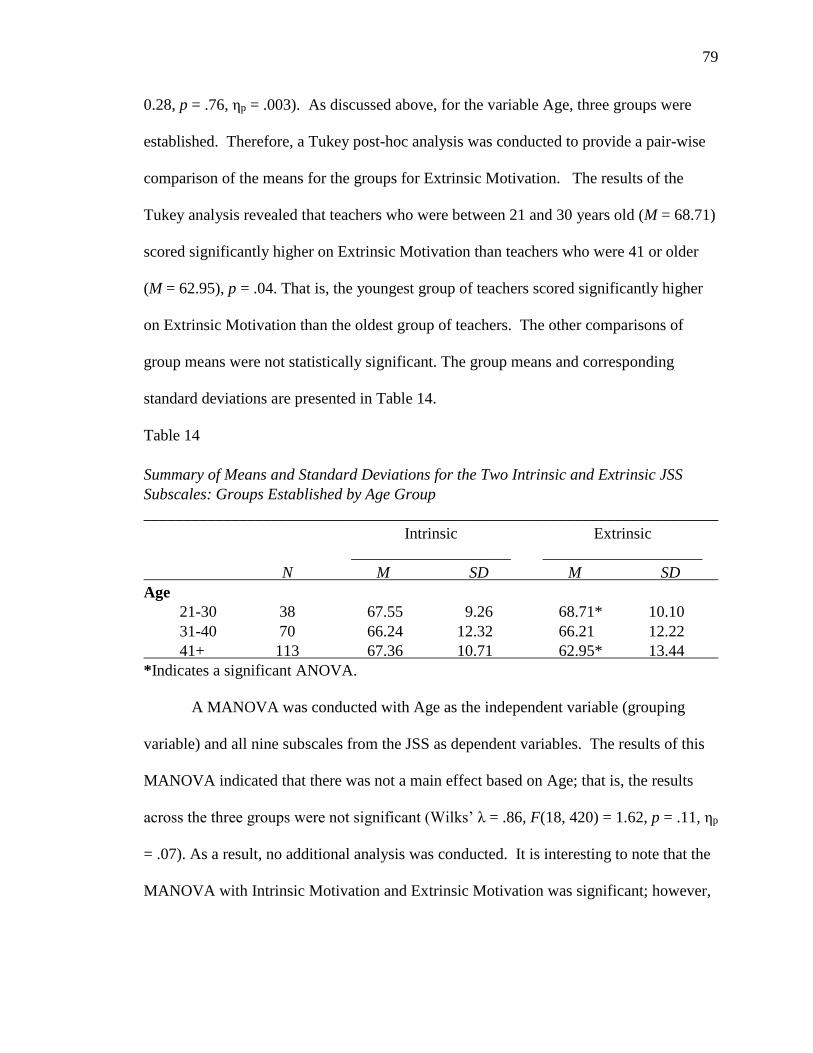
79
0.28, p = .76, ηp = .003). As discussed above, for the variable Age, three groups were
established. Therefore, a Tukey post-hoc analysis was conducted to provide a pair-wise
comparison of the means for the groups for Extrinsic Motivation. The results of the
Tukey analysis revealed that teachers who were between 21 and 30 years old (M = 68.71)
scored significantly higher on Extrinsic Motivation than teachers who were 41 or older
(M = 62.95), p = .04. That is, the youngest group of teachers scored significantly higher
on Extrinsic Motivation than the oldest group of teachers. The other comparisons of
group means were not statistically significant. The group means and corresponding
standard deviations are presented in Table 14.
Table 14
Summary of Means and Standard Deviations for the Two Intrinsic and Extrinsic JSS
Subscales: Groups Established by Age Group
________________________________________________________________________
Intrinsic Extrinsic
____________________ ____________________
N M SD M SD
Age
21-30 38 67.55 9.26 68.71* 10.10
31-40 70 66.24 12.32 66.21 12.22
41+ 113 67.36 10.71 62.95* 13.44
*Indicates a significant ANOVA.
A MANOVA was conducted with Age as the independent variable (grouping
variable) and all nine subscales from the JSS as dependent variables. The results of this
MANOVA indicated that there was not a main effect based on Age; that is, the results
across the three groups were not significant (Wilks’ λ = .86, F(18, 420) = 1.62, p = .11, ηp
= .07). As a result, no additional analysis was conducted. It is interesting to note that the
MANOVA with Intrinsic Motivation and Extrinsic Motivation was significant; however,
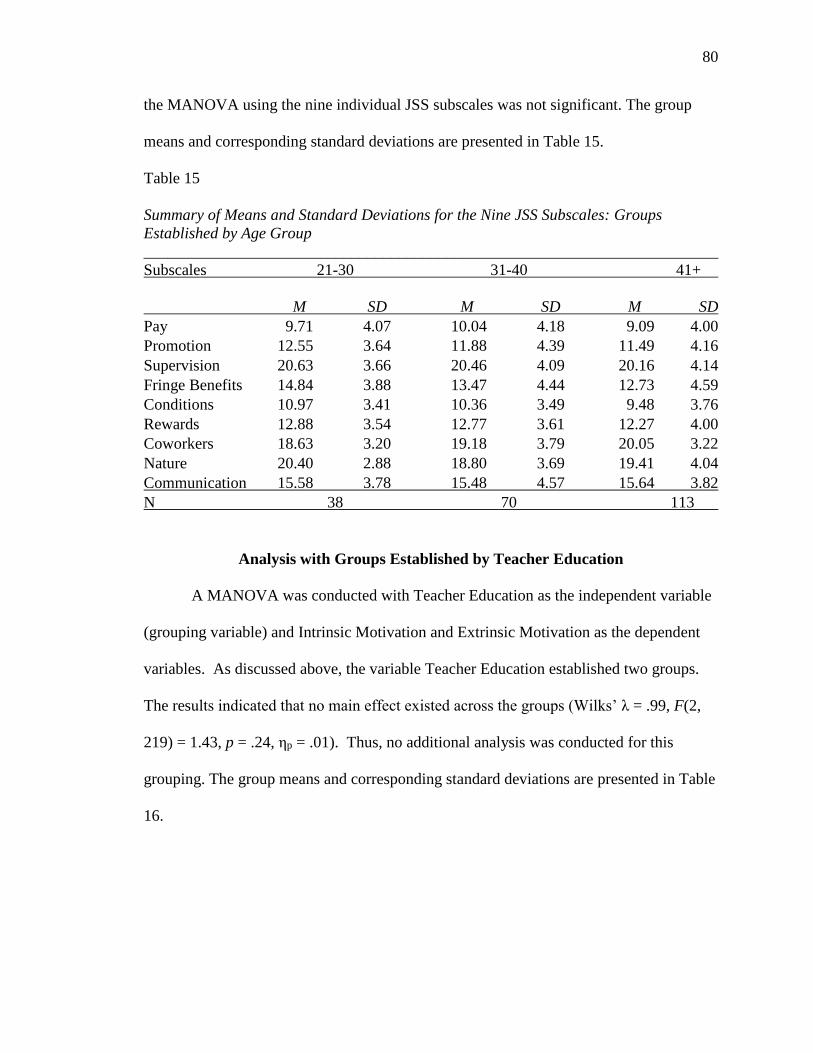
80
the MANOVA using the nine individual JSS subscales was not significant. The group
means and corresponding standard deviations are presented in Table 15.
Table 15
Summary of Means and Standard Deviations for the Nine JSS Subscales: Groups
Established by Age Group
________________________________________________________________________
Subscales 21-30 31-40 41+
M SD M SD M SD
Pay 9.71 4.07 10.04 4.18 9.09 4.00
Promotion 12.55 3.64 11.88 4.39 11.49 4.16
Supervision 20.63 3.66 20.46 4.09 20.16 4.14
Fringe Benefits 14.84 3.88 13.47 4.44 12.73 4.59
Conditions 10.97 3.41 10.36 3.49 9.48 3.76
Rewards 12.88 3.54 12.77 3.61 12.27 4.00
Coworkers 18.63 3.20 19.18 3.79 20.05 3.22
Nature 20.40 2.88 18.80 3.69 19.41 4.04
Communication 15.58 3.78 15.48 4.57 15.64 3.82
N 38 70 113
Analysis with Groups Established by Teacher Education
A MANOVA was conducted with Teacher Education as the independent variable
(grouping variable) and Intrinsic Motivation and Extrinsic Motivation as the dependent
variables. As discussed above, the variable Teacher Education established two groups.
The results indicated that no main effect existed across the groups (Wilks’ λ = .99, F(2,
219) = 1.43, p = .24, ηp = .01). Thus, no additional analysis was conducted for this
grouping. The group means and corresponding standard deviations are presented in Table
16.
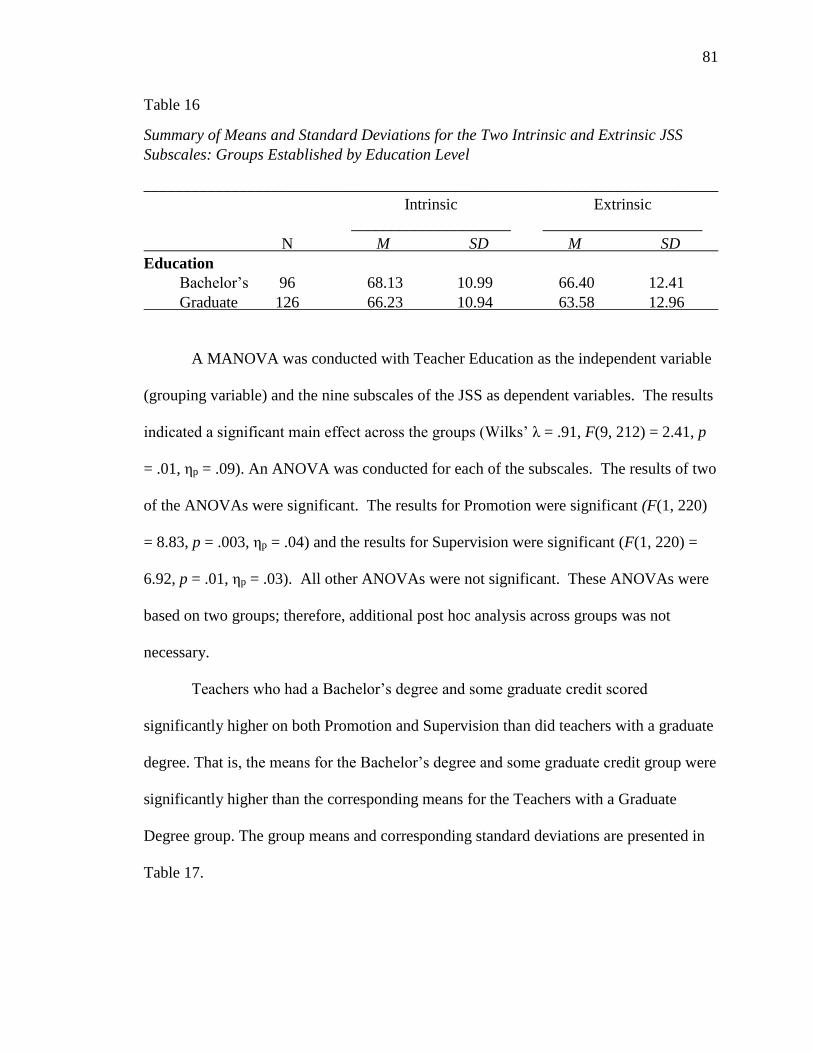
81
Table 16
Summary of Means and Standard Deviations for the Two Intrinsic and Extrinsic JSS
Subscales: Groups Established by Education Level
________________________________________________________________________
Intrinsic Extrinsic
____________________ ____________________
N M SD M SD
Education
Bachelor’s 96 68.13 10.99 66.40 12.41
Graduate 126 66.23 10.94 63.58 12.96
A MANOVA was conducted with Teacher Education as the independent variable
(grouping variable) and the nine subscales of the JSS as dependent variables. The results
indicated a significant main effect across the groups (Wilks’ λ = .91, F(9, 212) = 2.41, p
= .01, ηp = .09). An ANOVA was conducted for each of the subscales. The results of two
of the ANOVAs were significant. The results for Promotion were significant (F(1, 220)
= 8.83, p = .003, ηp = .04) and the results for Supervision were significant (F(1, 220) =
6.92, p = .01, ηp = .03). All other ANOVAs were not significant. These ANOVAs were
based on two groups; therefore, additional post hoc analysis across groups was not
necessary.
Teachers who had a Bachelor’s degree and some graduate credit scored
significantly higher on both Promotion and Supervision than did teachers with a graduate
degree. That is, the means for the Bachelor’s degree and some graduate credit group were
significantly higher than the corresponding means for the Teachers with a Graduate
Degree group. The group means and corresponding standard deviations are presented in
Table 17.
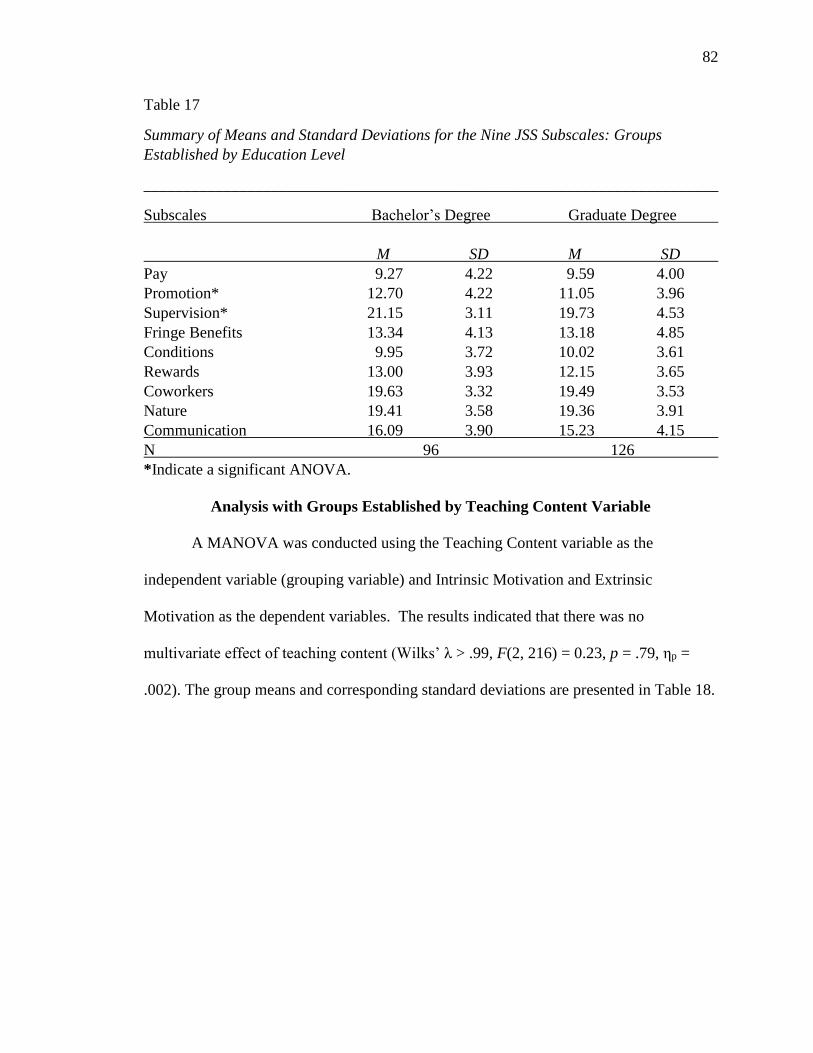
82
Table 17
Summary of Means and Standard Deviations for the Nine JSS Subscales: Groups
Established by Education Level
________________________________________________________________________
Subscales Bachelor’s Degree Graduate Degree
M SD M SD
Pay 9.27 4.22 9.59 4.00
Promotion* 12.70 4.22 11.05 3.96
Supervision* 21.15 3.11 19.73 4.53
Fringe Benefits 13.34 4.13 13.18 4.85
Conditions 9.95 3.72 10.02 3.61
Rewards 13.00 3.93 12.15 3.65
Coworkers 19.63 3.32 19.49 3.53
Nature 19.41 3.58 19.36 3.91
Communication 16.09 3.90 15.23 4.15
N 96 126
*Indicate a significant ANOVA.
Analysis with Groups Established by Teaching Content Variable
A MANOVA was conducted using the Teaching Content variable as the
independent variable (grouping variable) and Intrinsic Motivation and Extrinsic
Motivation as the dependent variables. The results indicated that there was no
multivariate effect of teaching content (Wilks’ λ > .99, F(2, 216) = 0.23, p = .79, ηp =
.002). The group means and corresponding standard deviations are presented in Table 18.
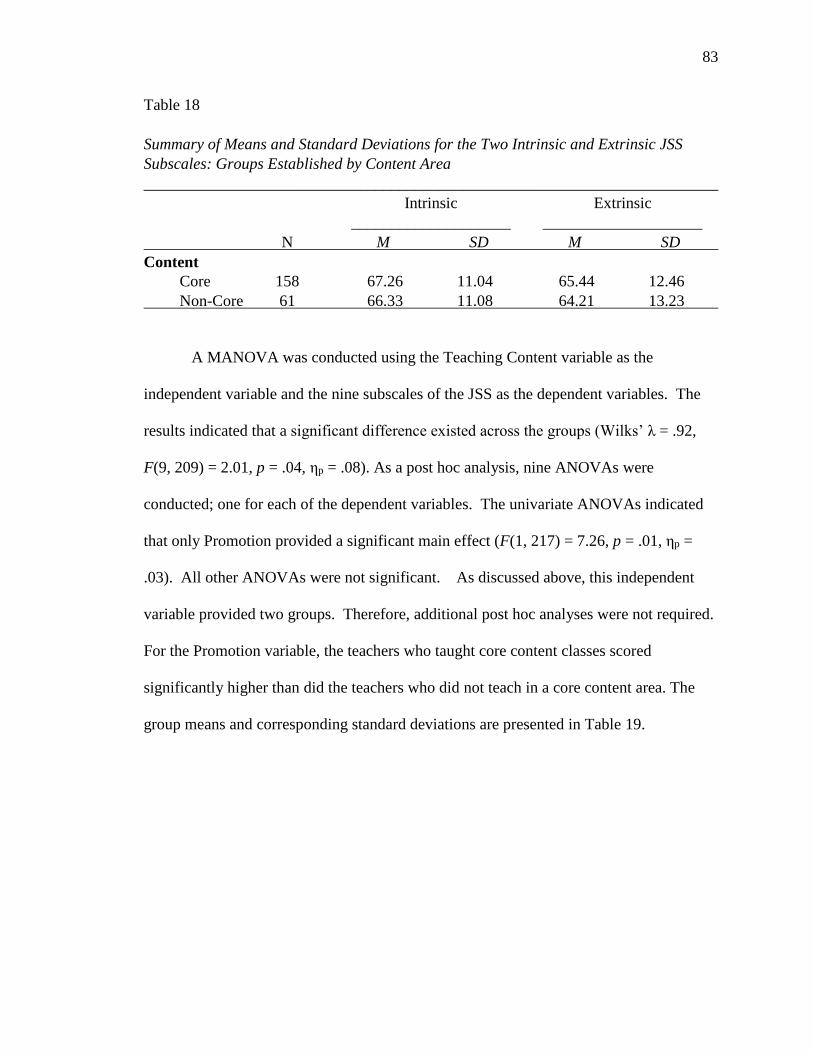
83
Table 18
Summary of Means and Standard Deviations for the Two Intrinsic and Extrinsic JSS
Subscales: Groups Established by Content Area
________________________________________________________________________
Intrinsic Extrinsic
____________________ ____________________
N M SD M SD
Content
Core 158 67.26 11.04 65.44 12.46
Non-Core 61 66.33 11.08 64.21 13.23
A MANOVA was conducted using the Teaching Content variable as the
independent variable and the nine subscales of the JSS as the dependent variables. The
results indicated that a significant difference existed across the groups (Wilks’ λ = .92,
F(9, 209) = 2.01, p = .04, ηp = .08). As a post hoc analysis, nine ANOVAs were
conducted; one for each of the dependent variables. The univariate ANOVAs indicated
that only Promotion provided a significant main effect (F(1, 217) = 7.26, p = .01, ηp =
.03). All other ANOVAs were not significant. As discussed above, this independent
variable provided two groups. Therefore, additional post hoc analyses were not required.
For the Promotion variable, the teachers who taught core content classes scored
significantly higher than did the teachers who did not teach in a core content area. The
group means and corresponding standard deviations are presented in Table 19.
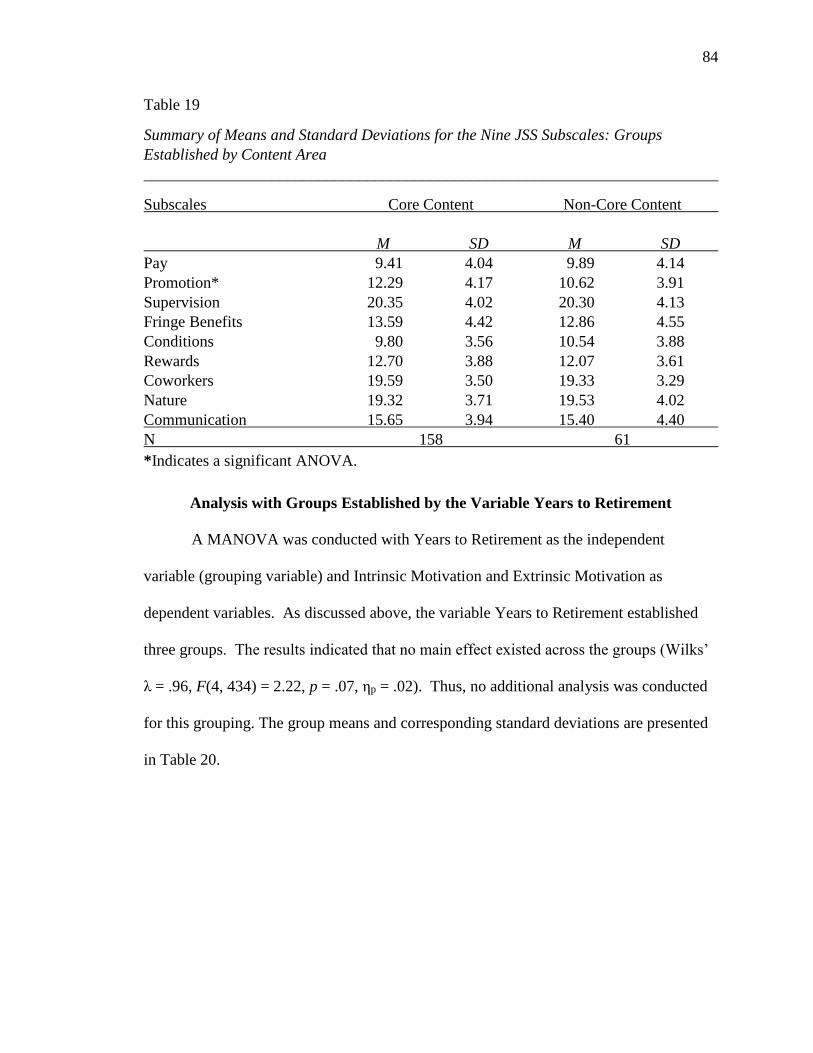
84
Table 19
Summary of Means and Standard Deviations for the Nine JSS Subscales: Groups
Established by Content Area
________________________________________________________________________
Subscales Core Content Non-Core Content
M SD M SD
Pay 9.41 4.04 9.89 4.14
Promotion* 12.29 4.17 10.62 3.91
Supervision 20.35 4.02 20.30 4.13
Fringe Benefits 13.59 4.42 12.86 4.55
Conditions 9.80 3.56 10.54 3.88
Rewards 12.70 3.88 12.07 3.61
Coworkers 19.59 3.50 19.33 3.29
Nature 19.32 3.71 19.53 4.02
Communication 15.65 3.94 15.40 4.40
N 158 61
*Indicates a significant ANOVA.
Analysis with Groups Established by the Variable Years to Retirement
A MANOVA was conducted with Years to Retirement as the independent
variable (grouping variable) and Intrinsic Motivation and Extrinsic Motivation as
dependent variables. As discussed above, the variable Years to Retirement established
three groups. The results indicated that no main effect existed across the groups (Wilks’
λ = .96, F(4, 434) = 2.22, p = .07, ηp = .02). Thus, no additional analysis was conducted
for this grouping. The group means and corresponding standard deviations are presented
in Table 20.
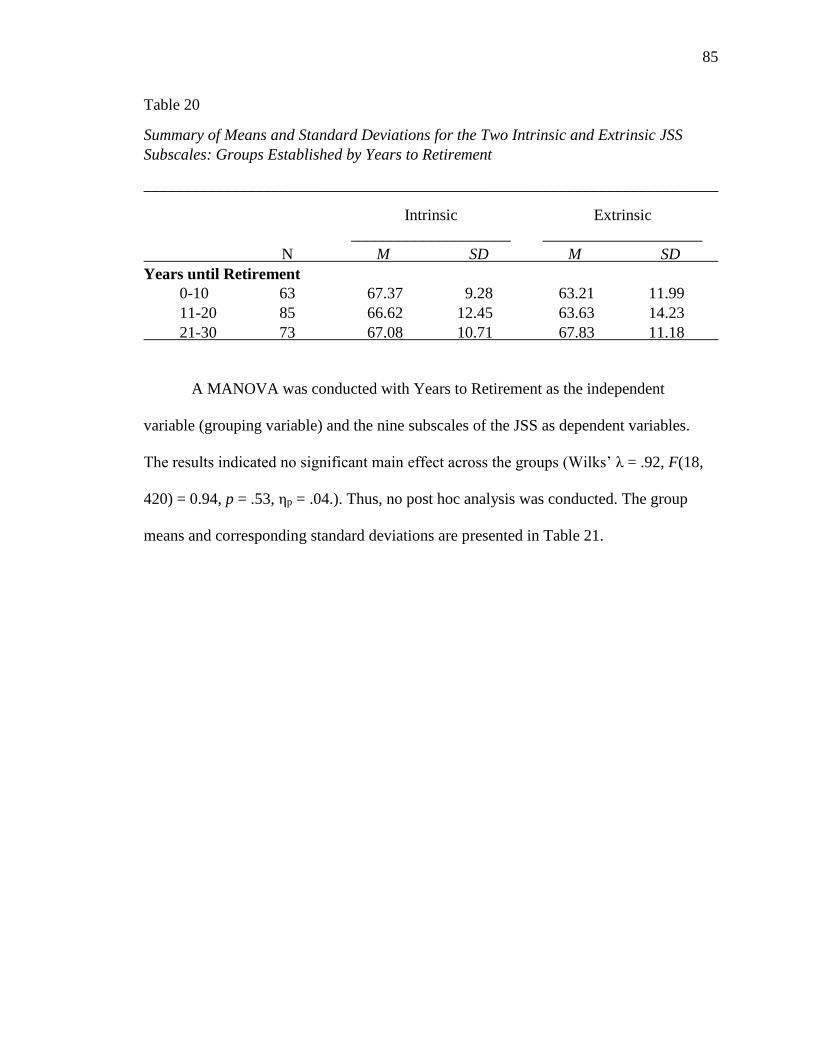
85
Table 20
Summary of Means and Standard Deviations for the Two Intrinsic and Extrinsic JSS
Subscales: Groups Established by Years to Retirement
________________________________________________________________________
Intrinsic Extrinsic
____________________ ____________________
N M SD M SD
Years until Retirement
0-10 63 67.37 9.28 63.21 11.99
11-20 85 66.62 12.45 63.63 14.23
21-30 73 67.08 10.71 67.83 11.18
A MANOVA was conducted with Years to Retirement as the independent
variable (grouping variable) and the nine subscales of the JSS as dependent variables.
The results indicated no significant main effect across the groups (Wilks’ λ = .92, F(18,
420) = 0.94, p = .53, ηp = .04.). Thus, no post hoc analysis was conducted. The group
means and corresponding standard deviations are presented in Table 21.
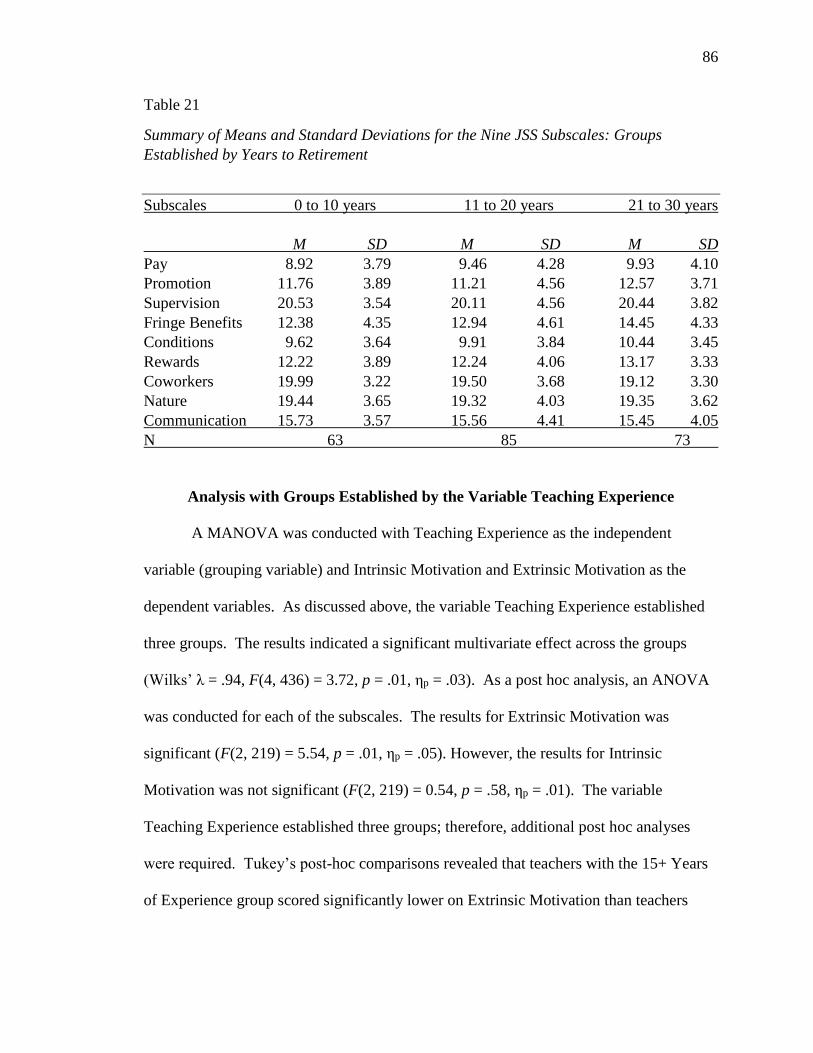
86
Table 21
Summary of Means and Standard Deviations for the Nine JSS Subscales: Groups
Established by Years to Retirement
Subscales 0 to 10 years 11 to 20 years 21 to 30 years
M SD M SD M SD
Pay 8.92 3.79 9.46 4.28 9.93 4.10
Promotion 11.76 3.89 11.21 4.56 12.57 3.71
Supervision 20.53 3.54 20.11 4.56 20.44 3.82
Fringe Benefits 12.38 4.35 12.94 4.61 14.45 4.33
Conditions 9.62 3.64 9.91 3.84 10.44 3.45
Rewards 12.22 3.89 12.24 4.06 13.17 3.33
Coworkers 19.99 3.22 19.50 3.68 19.12 3.30
Nature 19.44 3.65 19.32 4.03 19.35 3.62
Communication 15.73 3.57 15.56 4.41 15.45 4.05
N 63 85 73
Analysis with Groups Established by the Variable Teaching Experience
A MANOVA was conducted with Teaching Experience as the independent
variable (grouping variable) and Intrinsic Motivation and Extrinsic Motivation as the
dependent variables. As discussed above, the variable Teaching Experience established
three groups. The results indicated a significant multivariate effect across the groups
(Wilks’ λ = .94, F(4, 436) = 3.72, p = .01, ηp = .03). As a post hoc analysis, an ANOVA
was conducted for each of the subscales. The results for Extrinsic Motivation was
significant (F(2, 219) = 5.54, p = .01, ηp = .05). However, the results for Intrinsic
Motivation was not significant (F(2, 219) = 0.54, p = .58, ηp = .01). The variable
Teaching Experience established three groups; therefore, additional post hoc analyses
were required. Tukey’s post-hoc comparisons revealed that teachers with the 15+ Years
of Experience group scored significantly lower on Extrinsic Motivation than teachers
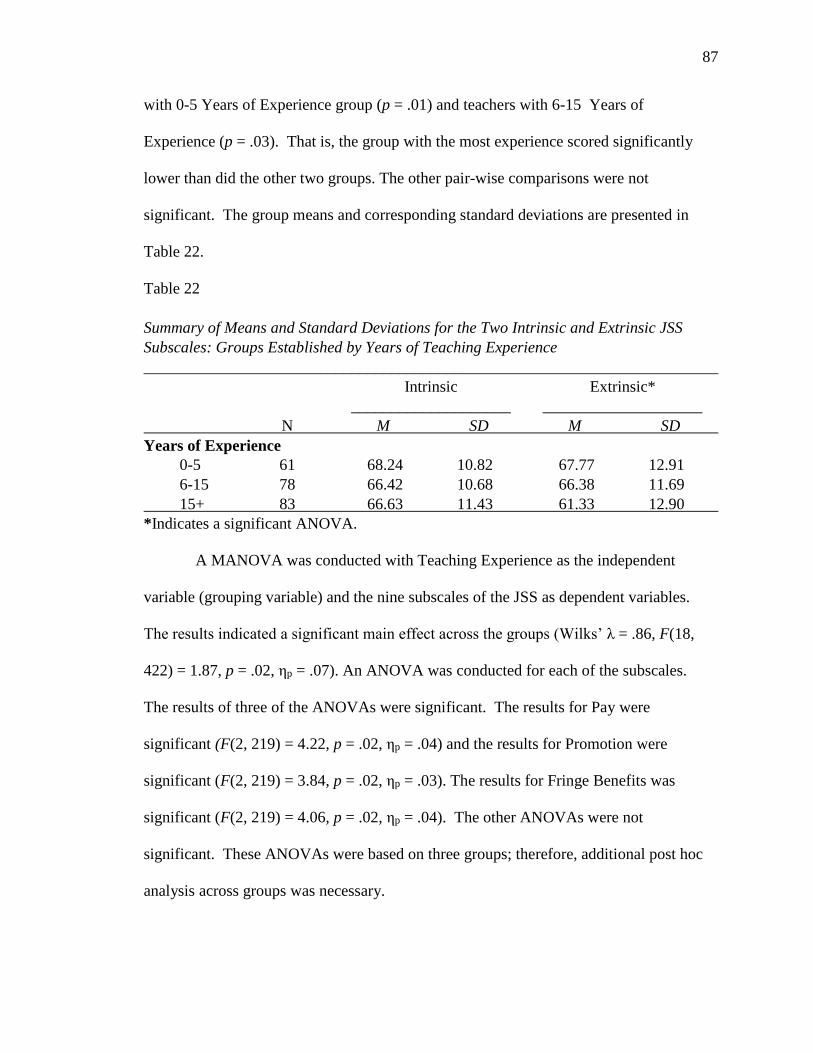
87
with 0-5 Years of Experience group (p = .01) and teachers with 6-15 Years of
Experience (p = .03). That is, the group with the most experience scored significantly
lower than did the other two groups. The other pair-wise comparisons were not
significant. The group means and corresponding standard deviations are presented in
Table 22.
Table 22
Summary of Means and Standard Deviations for the Two Intrinsic and Extrinsic JSS
Subscales: Groups Established by Years of Teaching Experience
________________________________________________________________________
Intrinsic Extrinsic*
____________________ ____________________
N M SD M SD
Years of Experience
0-5 61 68.24 10.82 67.77 12.91
6-15 78 66.42 10.68 66.38 11.69
15+ 83 66.63 11.43 61.33 12.90
*Indicates a significant ANOVA.
A MANOVA was conducted with Teaching Experience as the independent
variable (grouping variable) and the nine subscales of the JSS as dependent variables.
The results indicated a significant main effect across the groups (Wilks’ λ = .86, F(18,
422) = 1.87, p = .02, ηp = .07). An ANOVA was conducted for each of the subscales.
The results of three of the ANOVAs were significant. The results for Pay were
significant (F(2, 219) = 4.22, p = .02, ηp = .04) and the results for Promotion were
significant (F(2, 219) = 3.84, p = .02, ηp = .03). The results for Fringe Benefits was
significant (F(2, 219) = 4.06, p = .02, ηp = .04). The other ANOVAs were not
significant. These ANOVAs were based on three groups; therefore, additional post hoc
analysis across groups was necessary.
88
A Tukey analysis was conducted for each significant ANOVA. For the variable
Pay, Tukey’s post-hoc comparisons revealed that teachers with 15+ years of experience
scored significantly lower on than did teachers with 0-5 years of experience (p = .05).
The teachers with 15+ years of experience scored significantly lower on than did teachers
with 6-15 years of experience (p = .01). For the variable Pay, all other pair-wise
comparisons were not significant.
A Tukey post hoc analysis was conducted across groups for the variable
Promotion. The results indicated that teachers with 15+ years of experience scored
significantly lower on Promotion than did teachers with 0-5 years of experience (p = .01).
All other pair-wise comparisons for the variable Promotion across group means were not
significant.
Finally, a Tukey post hoc analysis was conducted across group means for the
variable Fringe Benefits. The results indicated that teachers with 15+ years of experience
scored significantly lower on the variable Fringe Benefits than did teachers with 0-5
years of experience (p = .02). In addition, teachers with 15+ years of experience scored
significantly lower on the variable Fringe Benefits than did teachers with 6-15 years of
experience (p = .02). For the variable Fringe Benefits, all other pair-wise comparisons
were not significant. The group means and corresponding standard deviations are
presented in Table 23.
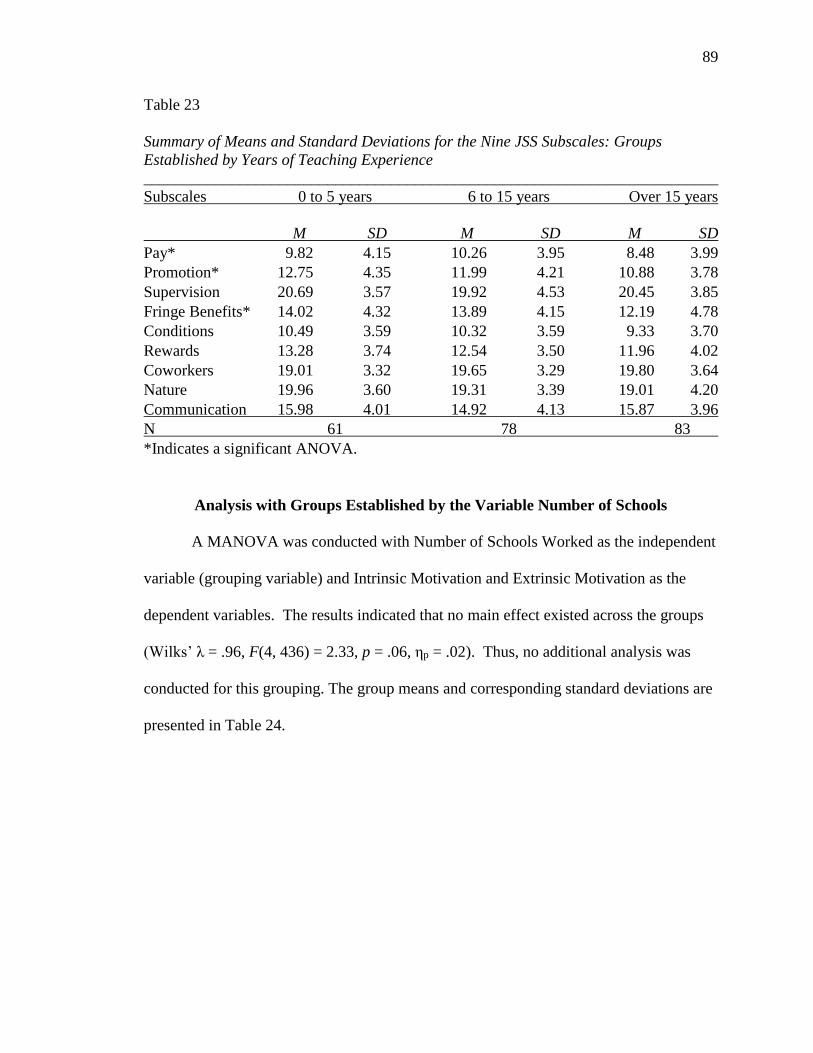
89
Table 23
Summary of Means and Standard Deviations for the Nine JSS Subscales: Groups
Established by Years of Teaching Experience
________________________________________________________________________
Subscales 0 to 5 years 6 to 15 years Over 15 years
M SD M SD M SD
Pay* 9.82 4.15 10.26 3.95 8.48 3.99
Promotion* 12.75 4.35 11.99 4.21 10.88 3.78
Supervision 20.69 3.57 19.92 4.53 20.45 3.85
Fringe Benefits* 14.02 4.32 13.89 4.15 12.19 4.78
Conditions 10.49 3.59 10.32 3.59 9.33 3.70
Rewards 13.28 3.74 12.54 3.50 11.96 4.02
Coworkers 19.01 3.32 19.65 3.29 19.80 3.64
Nature 19.96 3.60 19.31 3.39 19.01 4.20
Communication 15.98 4.01 14.92 4.13 15.87 3.96
N 61 78 83
*Indicates a significant ANOVA.
Analysis with Groups Established by the Variable Number of Schools
A MANOVA was conducted with Number of Schools Worked as the independent
variable (grouping variable) and Intrinsic Motivation and Extrinsic Motivation as the
dependent variables. The results indicated that no main effect existed across the groups
(Wilks’ λ = .96, F(4, 436) = 2.33, p = .06, ηp = .02). Thus, no additional analysis was
conducted for this grouping. The group means and corresponding standard deviations are
presented in Table 24.
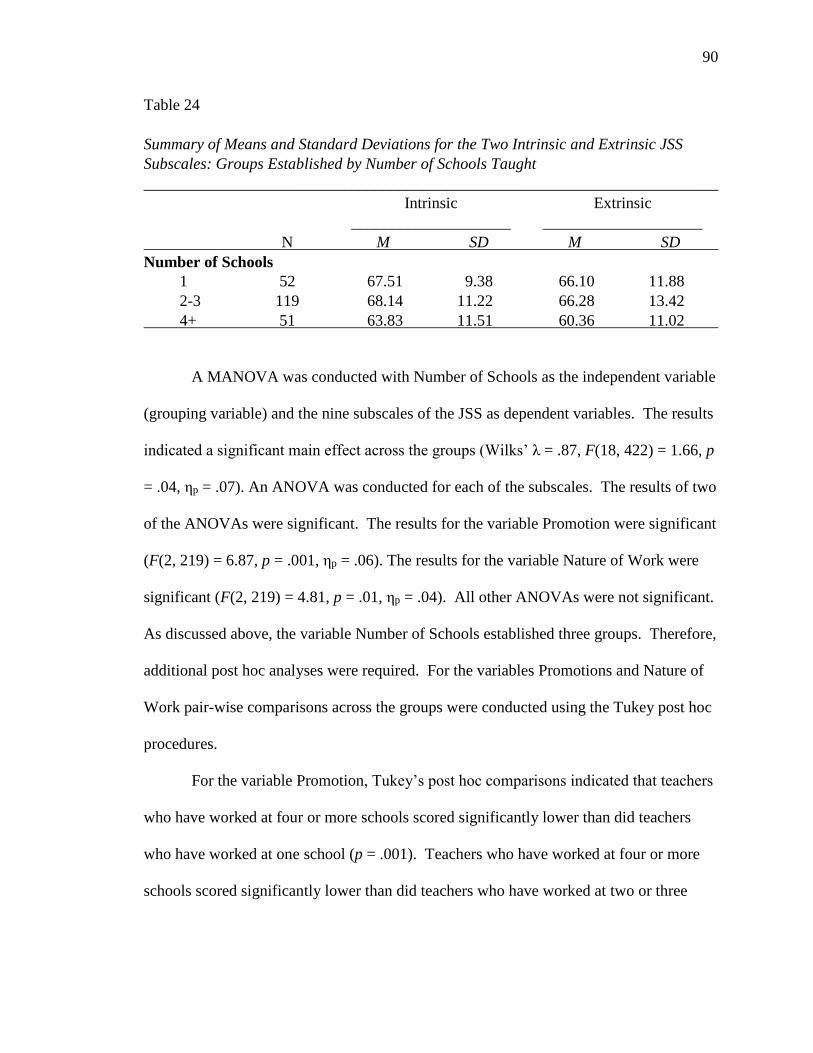
90
Table 24
Summary of Means and Standard Deviations for the Two Intrinsic and Extrinsic JSS
Subscales: Groups Established by Number of Schools Taught
________________________________________________________________________
Intrinsic Extrinsic
____________________ ____________________
N M SD M SD
Number of Schools
1 52 67.51 9.38 66.10 11.88
2-3 119 68.14 11.22 66.28 13.42
4+ 51 63.83 11.51 60.36 11.02
A MANOVA was conducted with Number of Schools as the independent variable
(grouping variable) and the nine subscales of the JSS as dependent variables. The results
indicated a significant main effect across the groups (Wilks’ λ = .87, F(18, 422) = 1.66, p
= .04, ηp = .07). An ANOVA was conducted for each of the subscales. The results of two
of the ANOVAs were significant. The results for the variable Promotion were significant
(F(2, 219) = 6.87, p = .001, ηp = .06). The results for the variable Nature of Work were
significant (F(2, 219) = 4.81, p = .01, ηp = .04). All other ANOVAs were not significant.
As discussed above, the variable Number of Schools established three groups. Therefore,
additional post hoc analyses were required. For the variables Promotions and Nature of
Work pair-wise comparisons across the groups were conducted using the Tukey post hoc
procedures.
For the variable Promotion, Tukey’s post hoc comparisons indicated that teachers
who have worked at four or more schools scored significantly lower than did teachers
who have worked at one school (p = .001). Teachers who have worked at four or more
schools scored significantly lower than did teachers who have worked at two or three
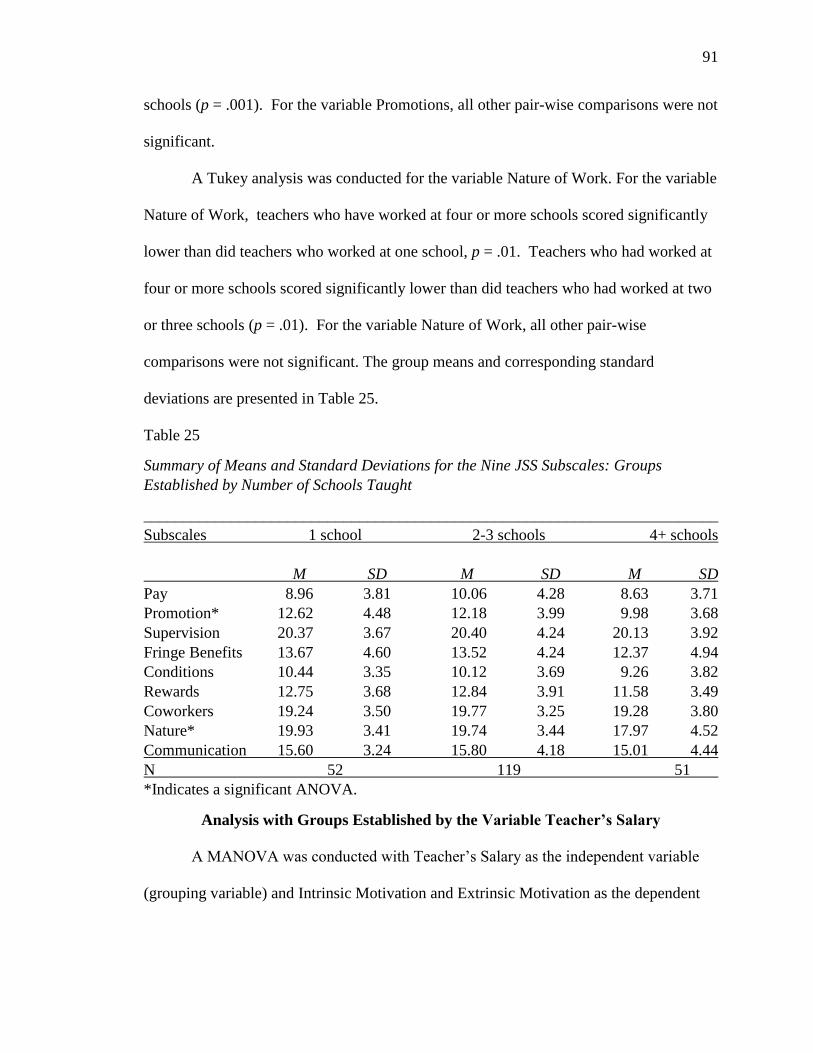
91
schools (p = .001). For the variable Promotions, all other pair-wise comparisons were not
significant.
A Tukey analysis was conducted for the variable Nature of Work. For the variable
Nature of Work, teachers who have worked at four or more schools scored significantly
lower than did teachers who worked at one school, p = .01. Teachers who had worked at
four or more schools scored significantly lower than did teachers who had worked at two
or three schools (p = .01). For the variable Nature of Work, all other pair-wise
comparisons were not significant. The group means and corresponding standard
deviations are presented in Table 25.
Table 25
Summary of Means and Standard Deviations for the Nine JSS Subscales: Groups
Established by Number of Schools Taught
________________________________________________________________________
Subscales 1 school 2-3 schools 4+ schools
M SD M SD M SD
Pay 8.96 3.81 10.06 4.28 8.63 3.71
Promotion* 12.62 4.48 12.18 3.99 9.98 3.68
Supervision 20.37 3.67 20.40 4.24 20.13 3.92
Fringe Benefits 13.67 4.60 13.52 4.24 12.37 4.94
Conditions 10.44 3.35 10.12 3.69 9.26 3.82
Rewards 12.75 3.68 12.84 3.91 11.58 3.49
Coworkers 19.24 3.50 19.77 3.25 19.28 3.80
Nature* 19.93 3.41 19.74 3.44 17.97 4.52
Communication 15.60 3.24 15.80 4.18 15.01 4.44
N 52 119 51
*Indicates a significant ANOVA.
Analysis with Groups Established by the Variable Teacher’s Salary
A MANOVA was conducted with Teacher’s Salary as the independent variable
(grouping variable) and Intrinsic Motivation and Extrinsic Motivation as the dependent
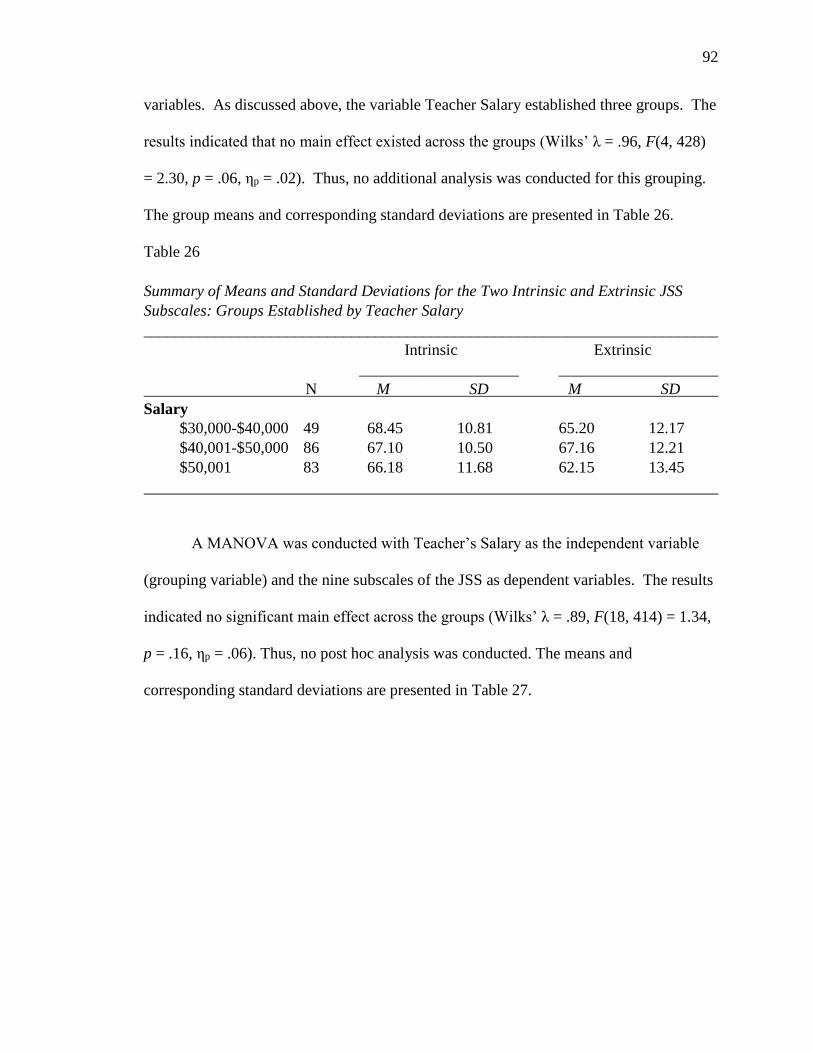
92
variables. As discussed above, the variable Teacher Salary established three groups. The
results indicated that no main effect existed across the groups (Wilks’ λ = .96, F(4, 428)
= 2.30, p = .06, ηp = .02). Thus, no additional analysis was conducted for this grouping.
The group means and corresponding standard deviations are presented in Table 26.
Table 26
Summary of Means and Standard Deviations for the Two Intrinsic and Extrinsic JSS
Subscales: Groups Established by Teacher Salary
________________________________________________________________________
Intrinsic Extrinsic
____________________ ____________________
N M SD M SD
Salary
$30,000-$40,000 49 68.45 10.81 65.20 12.17
$40,001-$50,000 86 67.10 10.50 67.16 12.21
$50,001 83 66.18 11.68 62.15 13.45
A MANOVA was conducted with Teacher’s Salary as the independent variable
(grouping variable) and the nine subscales of the JSS as dependent variables. The results
indicated no significant main effect across the groups (Wilks’ λ = .89, F(18, 414) = 1.34,
p = .16, ηp = .06). Thus, no post hoc analysis was conducted. The means and
corresponding standard deviations are presented in Table 27.
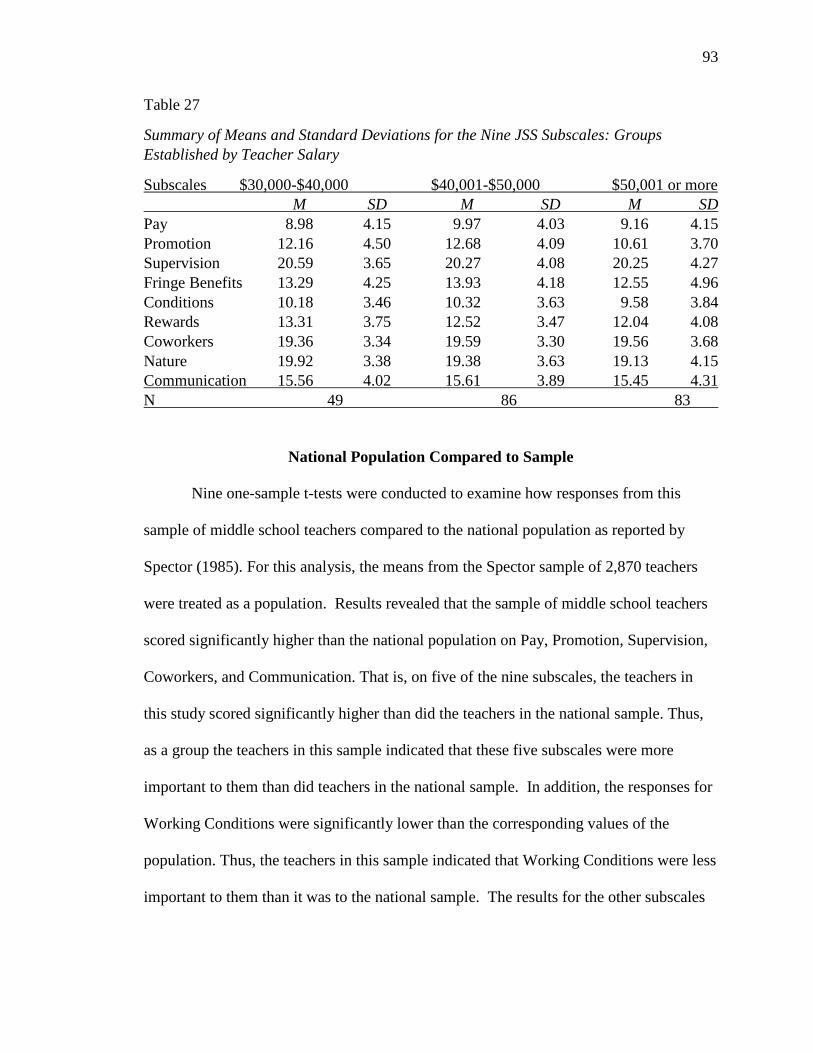
93
Table 27
Summary of Means and Standard Deviations for the Nine JSS Subscales: Groups
Established by Teacher Salary
Subscales $30,000-$40,000 $40,001-$50,000 $50,001 or more
M SD M SD M SD
Pay 8.98 4.15 9.97 4.03 9.16 4.15
Promotion 12.16 4.50 12.68 4.09 10.61 3.70
Supervision 20.59 3.65 20.27 4.08 20.25 4.27
Fringe Benefits 13.29 4.25 13.93 4.18 12.55 4.96
Conditions 10.18 3.46 10.32 3.63 9.58 3.84
Rewards 13.31 3.75 12.52 3.47 12.04 4.08
Coworkers 19.36 3.34 19.59 3.30 19.56 3.68
Nature 19.92 3.38 19.38 3.63 19.13 4.15
Communication 15.56 4.02 15.61 3.89 15.45 4.31
N 49 86 83
National Population Compared to Sample
Nine one-sample t-tests were conducted to examine how responses from this
sample of middle school teachers compared to the national population as reported by
Spector (1985). For this analysis, the means from the Spector sample of 2,870 teachers
were treated as a population. Results revealed that the sample of middle school teachers
scored significantly higher than the national population on Pay, Promotion, Supervision,
Coworkers, and Communication. That is, on five of the nine subscales, the teachers in
this study scored significantly higher than did the teachers in the national sample. Thus,
as a group the teachers in this sample indicated that these five subscales were more
important to them than did teachers in the national sample. In addition, the responses for
Working Conditions were significantly lower than the corresponding values of the
population. Thus, the teachers in this sample indicated that Working Conditions were less
important to them than it was to the national sample. The results for the other subscales
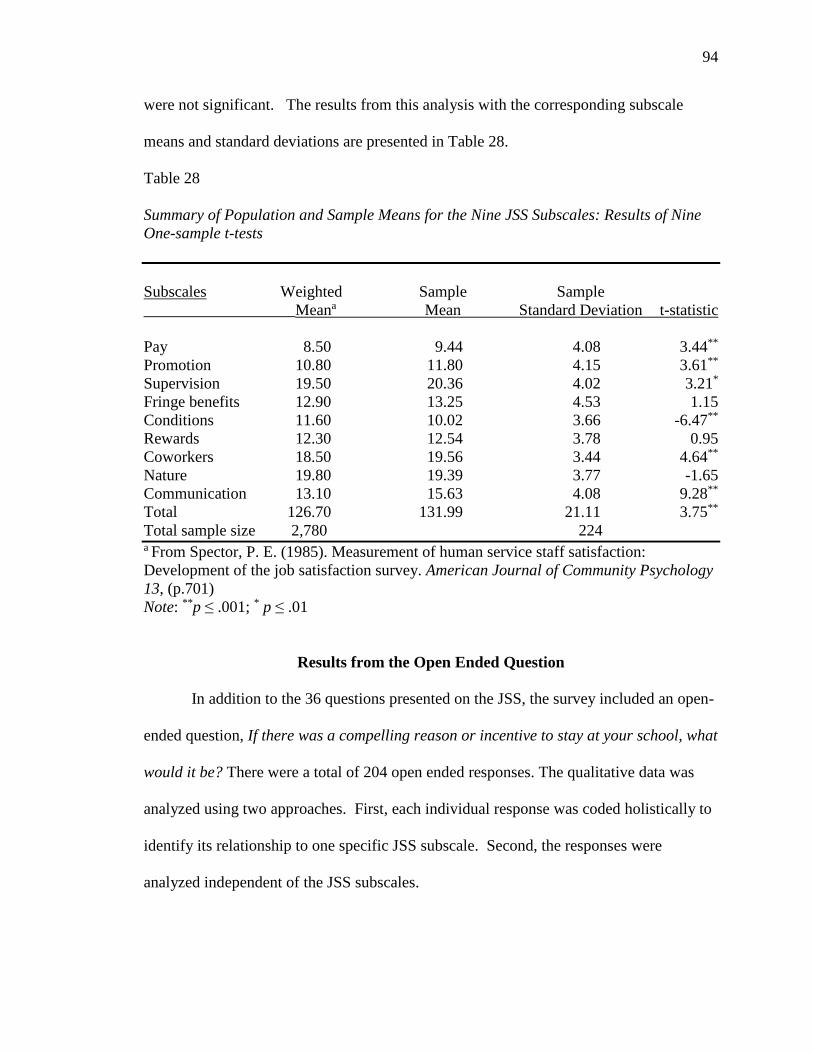
94
were not significant. The results from this analysis with the corresponding subscale
means and standard deviations are presented in Table 28.
Table 28
Summary of Population and Sample Means for the Nine JSS Subscales: Results of Nine
One-sample t-tests
Subscales Weighted Sample Sample
___________________Meana Mean Standard Deviation t-statistic
Pay 8.50 9.44 4.08 3.44**
Promotion 10.80 11.80 4.15 3.61**
Supervision 19.50 20.36 4.02 3.21*
Fringe benefits 12.90 13.25 4.53 1.15
Conditions 11.60 10.02 3.66 -6.47**
Rewards 12.30 12.54 3.78 0.95
Coworkers 18.50 19.56 3.44 4.64**
Nature 19.80 19.39 3.77 -1.65
Communication 13.10 15.63 4.08 9.28**
Total 126.70 131.99 21.11 3.75**
Total sample size 2,780 224 a From Spector, P. E. (1985). Measurement of human service staff satisfaction:
Development of the job satisfaction survey. American Journal of Community Psychology
13, (p.701)
Note: **p ≤ .001; * p ≤ .01
Results from the Open Ended Question
In addition to the 36 questions presented on the JSS, the survey included an open-
ended question, If there was a compelling reason or incentive to stay at your school, what
would it be? There were a total of 204 open ended responses. The qualitative data was
analyzed using two approaches. First, each individual response was coded holistically to
identify its relationship to one specific JSS subscale. Second, the responses were
analyzed independent of the JSS subscales.
95
The analysis of qualitative data can be approached in several ways. Fossey, et al
(2002) explained that, “Coding, that is, labelling segments of data to identify themes, or
processes, is central to effective data retrieval in two ways … It enables the researcher to
locate and bring together similarly labelled data for examination and to retrieve data
related to more than one label when wanting to consider patterns, connections, or
distinctions between them” (p. 728). In addition, Creswell (2009) indicated that
qualitative data should be categorized to identify common themes, and then define sub-
themes. The next step would be to interpret and identify possible inter relationships
among themes. For this study, first the qualitative data was reviewed, interpreted, and
coded to identify possible relationships to the nine subscales of the JSS.
Next the open-ended responses were analyzed independent of the nine subscales
to determine any patterns, to identify themes and sub themes, and to discover possible
inconsistencies. The results of this analysis are also discussed below. Then results of
both approaches were integrated and compared to develop an understanding of any
themes across the data. Finally, the results were compared against the quantitative data
results related to the JSS. Within the data for this study, there were some overlapping
themes, some contradictory results, and some differences. The outcomes related to the
analysis of the open-ended question are discussed below. Both complimentary and
contradictory outcomes are reported and implications are discussed in Chapter V.
Results by JSS Subscales
First, the relationship between the responses and the JSS subscales were
considered. The following information is related to the data when analyzed in
relationship to the subscales in the JSS. A frequency distribution was developed to rate
96
each response holistically to identify its best fit with one of the JSS subscales. By
design, the themes identified in this approach were the subscales of the JSS. The
subscales with the highest frequencies of comments were Conditions, Pay, Supervision,
and Fringe Benefits for the extrinsic subscales. For the Intrinsic subscales, Nature of
Work and Co-workers were the highest. The other subscales were associated with
relatively low frequencies.
Using this approach, overall, a majority of responses (68 percent) were related to
the Extrinsic motivational subscales. Responses related to Working Conditions (60
responses) and Pay (47 responses) were the most frequent. The next most frequent area
was related to Supervision (27 responses). Approximately 31 percent of responses were
related to Intrinsic factors as defined by the JSS. Overall, the Intrinsic area of Nature of
Work had the third highest number of responses (41 responses).
The teachers related Nature of Work to working with students, type of work, and
joy of student improvement. Common statements related to Nature of Work included
working with students, growth of students, and rewarding job. Responses related to
Working Conditions were the most common. The general areas related to Working
Conditions included comments related to culture and climate of the school, hours
required to meet job expectations, extra duties assigned, ongoing paperwork, and
curriculum issues.
Responses related to Pay included additional salary steps, better pay for teachers,
stipends for extra duties, incentives pay, and cost of living increases. One teacher
responded, “A compelling incentive would be pay.” Another illustrated the feelings that
teachers are under paid, stating, “A salary increase equitable to world standards. No
97
salary ceiling which limits the amount of pay a teacher can get regardless of time of
service and educational efforts.” Other teachers reflected concerns related to equity of
pay. One explained, “My biggest complaint is that I am paid less than most of my
coworkers.” Several of the responses related to providing some type of incentives.
Examples included, providing “incentives for staying at a school,” pay for performance,
and types of pay for performance. Several respondents indicated the importance of cost
of living raises.
Responses related to Supervision were the fourth highest area. These included
items related to school culture and climate that could be linked back to the principal. The
comments included “loving my principal”, “supportive administration”, “great
administration,” and “[principal] makes sure we have what we need.” A typical response
is illustrated by the comment “I feel supported by my principal.” Several respondents
indicated that the reason that they stayed at the school was directly related to the
principal. One respondent explained “Having a principal that filters what the district
hands down and allows me to actually TEACH, and not jump through hoops.”
Many responses related to the Co-worker subscale. The view of the important
role of co-workers is illustrated by the comment “the support of coworkers adds to the
reason that I stay at this school.” Another teacher explained that “My administration and
coworkers have a positive vision on how to help students.” Many linked their compelling
reason for staying at a school directly to their co-workers and provided intrinsic type
examples. Others simply indicated that the reason or the incentive was their co-workers.
The responses related to the other JSS subscales were fewer. Figure 2 below illustrates
the frequency of the open-ended responses using the JSS subscales.
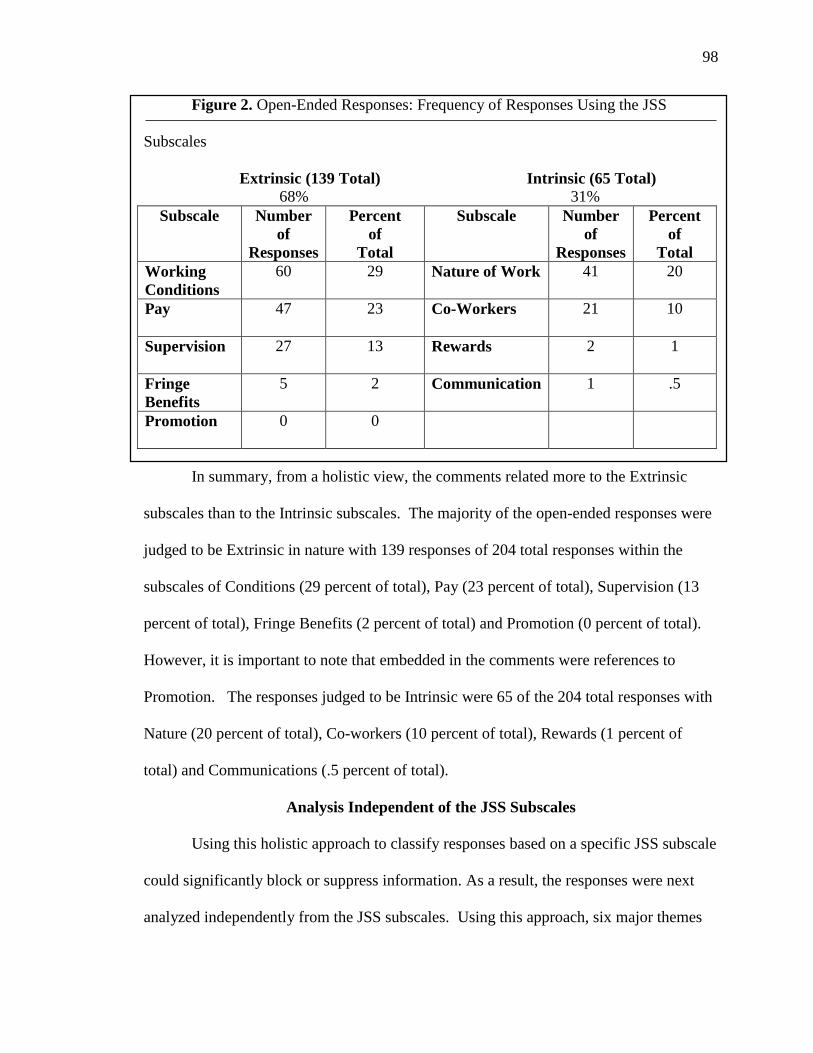
98
Figure 2. Open-Ended Responses: Frequency of Responses Using the JSS
Subscales
Extrinsic (139 Total) Intrinsic (65 Total)
68% 31%
Subscale Number
of
Responses
Percent
of
Total
Subscale Number
of
Responses
Percent
of
Total
Working
Conditions
60 29 Nature of Work 41 20
Pay 47 23 Co-Workers 21 10
Supervision 27 13 Rewards 2 1
Fringe
Benefits
5 2 Communication 1 .5
Promotion 0 0
In summary, from a holistic view, the comments related more to the Extrinsic
subscales than to the Intrinsic subscales. The majority of the open-ended responses were
judged to be Extrinsic in nature with 139 responses of 204 total responses within the
subscales of Conditions (29 percent of total), Pay (23 percent of total), Supervision (13
percent of total), Fringe Benefits (2 percent of total) and Promotion (0 percent of total).
However, it is important to note that embedded in the comments were references to
Promotion. The responses judged to be Intrinsic were 65 of the 204 total responses with
Nature (20 percent of total), Co-workers (10 percent of total), Rewards (1 percent of
total) and Communications (.5 percent of total).
Analysis Independent of the JSS Subscales
Using this holistic approach to classify responses based on a specific JSS subscale
could significantly block or suppress information. As a result, the responses were next
analyzed independently from the JSS subscales. Using this approach, six major themes
99
were identified: Teachers Need Support, Characteristics of My Work, Compensation,
Importance of Students, Need for Respect, Location of School, and Communication. In
addition within several of these major themes smaller related sub-themes were identified.
The results are discussed below.
Teachers Need Support
Teachers Need Support was associated with the largest number of responses and
the theme had several sub-themes. Many of the respondents indicated that one of the
major reasons that they continued to work in a specific building was their perception that
they were supported by the principal, their peers, or both. Within the theme of Teachers’
Need for Support was a sub-theme of Administrator Support. For example, one teacher
stated, “The administration and staff are amazing! The support they give is awesome!”
Another explained, “I enjoy working for and with Mr. --------. He is a fair supervisor and
always "there" for me. I'd stay here just because of him.” Another teacher linked the
support to school culture, “Administration is supportive and responsive to
requests/concerns. Current atmosphere for staff and students is very positive.” The
general context of these responses was that effective leadership was associated with a
supportive principal who enabled teachers to “do their job.” The comments within this
sub theme were directly linked to principal activities and principal behaviors which the
teacher viewed as supportive.
The next sub-theme could be characterized as Collegial Support. The responses
associated with this sub-theme were directly linked to co-workers, teams, and/or people
within their departments. Many of the responses linked the joy of work directly to the
people at the school. Characteristic phrases included “camaraderie of the staff,” “staff at
100
this school take care of each other,” and “colleagues are wonderful to work with.” One
teacher explained the compelling reason to stay was “Staff relations- People get along,
collaborate, and work well together.” Another teacher identified “The caring, dedication
and personality of fellow teachers” as the reason to stay.
The theme of Collegial Support included support at all levels. Many of the
comments related to support from administration, from members of their department, and
from the staff. A teacher explained that the compelling reason was “my boss is amazing
and our team has a goal and clear focus as to how to get there. Principal’s leadership and
collaborative style makes coming to work wonderful... even when there is hard stuff to
accomplish. We are a team. I love working at -------- Middle School.” Another teacher
explained that it was the people associated with the school; “The most compelling reason
is a supportive environment, with colleagues, administrators, students and parents.”
This major theme, Teachers Need Support, also included support in the form of
Financial Resources. The comments associated with the sub-theme of Financial
Resources were directly or indirectly linked to funds, materials, or activities that
supported the efforts of the teachers. Key phrases included “money for my program” and
“adequate resources.” Some of these responses related to available resources; however,
some indicated that additional resources were required.
Another sub-theme within Teachers Need Support related Opportunities. The
comments associated with this sub-theme were associated with professional development,
improvement of teaching methods, and trainings related to possible advancement. One
teacher explained, “Administration supports and provides efforts for new trainings to
improve teaching and student outcomes.” Another indicated that a compelling reason to
101
stay was “Administration supports and provides efforts for new trainings to improve
teaching and student outcomes.” The comments associated with this sub-theme were
linked to opportunities to improve as teachers or to support possible advancement.
Interestingly, another sub-theme was associated with supports for Technology.
These comments were linked to impacts of technology on teaching and student learning.
Some of the comments indicated a need for more technology, while others indicated that
they stayed because of good technology support within their building.
Character of My Work
The Character of My Work was identified as another major theme. This major
theme was associated with four sub-themes: Control over Teaching, Relief from Non-
teaching Responsibilities, Smaller Class Size, and General Issues. The sub-theme of
Control over Teaching could be associated with two specific groups. The smaller, first
group of responses indicated that they had significant amounts of autonomy and were
pleased. One teacher responded, “I am given control to make decisions in my classroom
about content I teach.”
However, most of the responses could be associated with the desire for more
autonomy. The larger, second group indicated that they lacked sufficient autonomy and
that they desired more involvement in decisions related to teaching and learning. One
teacher explained the concern, “More autonomy in my classroom, less repetitive
paperwork and second guessing of the experienced teachers and our choices regarding
instruction.” Another stated, “Reduction of top down implementation and inclusion of
classroom professionals with a real say in matters affecting the school and classroom and
less as a focus of blame especially with limited amount of influence that exist.” One
102
teacher explained that a compelling reason to stay was “To be free to teach my specific
content without having to jump through administrative hoops and the newest educational
band-aide du jour.” Teachers’ concerns included too much paper work, lack of
involvement, and top-down decisions.
Another sub-theme within the major theme of Character of My Work was Relief
from Non-teaching Responsibilities. The comments related to activities and requirements
that were associated with events and activities outside the classrooms. Characteristic
phrases included less paper work, extracurricular duties, less busy work, and to provide
useful trainings. These comments tended to suggest a need to reduce requirements that
teachers associated with useless busy work.
The sub-theme of Smaller Class Size was identified by many of the comments.
This sub-theme suggested the importance of smaller class size. These responses
indicated the belief that “class size does matter” and that smaller class size was associated
with better teaching and learning.
The final sub-theme related to Character of My Work was General Concerns.
These comments were related to a wide variety of areas. The concerns included
curriculum, start time, testing, and non-core subjects. Many of the comments in this area
provide suggestions for improvements.
Compensation
The major area of Compensation which included three sub-themes was identified.
These sub-themes were Salary Issues, Differential Pay, and Fringe Benefits. Many of the
respondents indicate that Salary Issues were associated with a compelling reason to stay.
The responses associated with the Salary Issues sub-theme indicated the need for more
103
money and better pay. Some of the comments were related to pay for extra work; “We
are not paid for all the extra time that we put into completing all the forms and documents
required at this site.” Many of these comment provided straightforward statements
related to low pay. Characteristic phrases included bonus, incentive pay, and better
salary schedules.
A group of responses were associated with Differential Pay issues. The general
comments associated with this sub-theme could be characterized as “I deserve more pay
than other because…” The reasons suggested for differential pay included type of
school, characteristics of students, and specific teacher endorsement.
Another sub-theme associated with Compensation was Fringe Benefits. These
responses indicated that better Fringe Benefits were desirable. These responses included
a wide variety of areas: student loan forgiveness, health benefits, and improved
retirement. Several of the response suggested that improved health benefits were
important.
The Importance of Students
The Importance of Students was identified as a major theme with three
subthemes: Student in General, Qualified Statement about Students, and School District
Policies. Many of the teachers indicated that the compelling reason for staying was the
students. Characteristic phrases included, “I love the students”, “growth of students”,
“working with students”, and “great kids”. For example, one teacher explained, “I enjoy
my students and their joy in learning.” The responses for this sub-theme consistently
centered around the importance of students.

104
The responses associated with the Qualified Statements about Students sub-theme
could be characterized by “I like to work with some students” type statements. One
teacher responded, “I enjoy working with kids who want to be successful.” Another
teacher explained, “Most of the students and parents are kind.”
The third sub-theme associated with Importance of students was School District
Policy. These comments were associated with a wide variety of concern about various
district policies. Concerns included social promotions of students, safety, discipline, and
push in procedures. Many of these comments included suggestion for changes in policies
and procedures.
Need for Respect
A major theme identified was Need for Respect. This theme had two identified
sub-themes: Public Respect and Respect for Teachers within the District. The Public
Respect subtheme included comments related to the press, teaching as profession, and
lack of community respect. The sub-theme of Respect for Teachers within the District
included comments related to respect from administrators, lack of respect from peers,
lack of respect from students, and salary as an indicator of respect. The comments
related to this major theme indicated that the respondents believed that teachers and the
teaching profession were not respected by the public and in some cases by members of
the educational community.
A small group of respondents indicated that location of the school was important
and another small group indicated that quality of communication was important.
Figure 3 below highlights the Themes and Sub-Themes from the analysis of the
open-ended responses independent of the Instrinsic and Extrinsic factors.
105
Figure 3. Open-Ended Question Analyzed Independently of the JSS
Themes Intrinsic Extrinsic Sub-Themes
Teachers
Need Support
* * Administration Support
Collegial Support
Financial Resources
Opportunities
Character of
Work
* Control Over Teaching
Relief from Non-teaching
Smaller Class Size
General Issues
Compensation * Salary Issues
Differential Pay
Fringe Benefits
Importance of
Students
* Students in General
Qualified Student Comment
School District Policies
Need for
Respect
* Public Respect
Respect for Teachers in the District
Summary
Overall results suggest that differences among the various teacher groups were
associated with extrinsic motivation rather than intrinsic motivation. For example, the
youngest group of teachers scored higher on extrinsic motivation than did the oldest
group of teachers. When significant group differences were found, these differences
tended to be associated with the variables Fringe Benefits, Promotion, and Total Extrinsic
Motivation. In addition, the group of teachers with the most experience scored lower on
Extrinsic Motivation than did the group of teacher with less experience. For many of
the various groupings of teachers, the comparisons were not significant. That is, the
106
characteristics of the groups were not associated with differences in measures of
motivation. In many instances, there were not significant differences across groups based
on the overall Intrinsic Motivation and Extrinsic Motivation; however, differences were
apparent on the individual subscales of the JSS. For example, there was no difference
between groups on either Intrinsic Motivation or Extrinsic Motivation when groups were
established based on the variable Teacher Education. However, there were significant
differences across groups based on the variables Promotion and Supervision. In addition
the results of the analysis of the open ended question, provided insight in the statements
of teachers related to reasons to stay at a specific school, and issues tied to district human
resources issues of teacher retention. The implications for practice and discussion of the
results are presented in Chapter V.
107
CHAPTER V
KEY FINDINGS, IMPLICATIONS FOR PRACTICE, RECOMMENDATIONS AND
CONCLUSION
The primary purpose in conducting the study was to explore the job
satisfaction of middle school teachers. The study was based on the results from 13 middle
schools in an urban school district in the western United States. An on-line survey was
conducted with full-time certified teachers both in core and non-core subjects in each of
these middle schools. The survey used was the Job Satisfaction Survey (Spector, 1997)
and included demographic questions as well as one open ended question. As stated
earlier, job satisfaction is perceived to be a factor in teacher retention and attrition
(Ingersoll, 2003). Also stated earlier was the notion of the high cost of teacher turnover;
identifying factors of job satisfaction may allow education leaders to mitigate these costs
to some extent. This chapter provides a brief summary of Key Findings, Implications for
Practice, Recommendations and a Conclusion.
Key Findings
A summary of the key findings from the study in relationship to job satisfaction
for middle school teachers is discussed in the following sections. First, when the
comparisons of mean responses of the established groups using the various dependent
measures were considered, the number of significant results was relatively small. That is,
for the eight different groupings of the teacher responses, the responses of groups tended
to be more similar than significantly different.
The second finding was when there were significant differences among the
various groups, these differences tended to be associated with measures of extrinsic
108
motivation. Differences were associated with groups established by the demographics of
Age, Teaching Experience, Number of Schools, Content Taught, and Education Level.
The measures of motivation that were associated with significant group differences were
Promotion, Supervision, Fringe Benefits, Nature of Work, Intrinsic Motivation, and
Extrinsic Motivation. As well, Extrinsic measures were more important to new teachers
than to veteran teachers who had been in the system for more years. Nature of Work was
the only Intrinsic subscale variable which was associated with significant group
differences. Grouping variables associated with significant differences were Age,
Education, Content Area, Experience, and Number of Schools. Except for Content Area,
these grouping variables can be directly associated with years in the system. In general,
the Extrinsic constructs were more important to younger teachers than were these same
constructs were to more veteran teachers.
A comparison of the responses of the teachers in this study to the response
published by Spector (1997) was conducted for each subscale and for total assessment
score. Thus, a total of ten comparisons between the results for the study sample and the
teacher norms provided by Spector were conducted. Seven of these comparisons were
significant: Pay, Promotion, Supervision, Working Conditions, Coworkers,
Communication, and Total Score. In six of these comparisons of the means, the sample
means were higher than the norm means; only Working Conditions were less important
to the sample than to the comparison group. That is, for teachers in the study sample,
these measures from the JSS were more important than for the teachers in the comparison
group.
109
The following section provides a brief summary of the significant comparisons.
The research questions sought to determine if significant differences were found across
the demographic categories based on the dependent variables of Extrinsic and Intrinsic as
well as the nine subscales and the levels within each demographic category.
For age, it was interesting to note that younger teachers (21 to 30 years old)
scored significantly higher than their older counterparts in areas of Extrinsic Motivation
(mean of 68.71 for 21-30 versus means of 66.21 for 31-40 and 62.95 for 41 years or
older). This was not the case for the nine subscales as there were no significant
differences noted across the three groups. This could be interpreted as younger teachers
having increased motivation associated with Extrinsic variables; that is, younger teachers,
who tend to be at the beginning of the salary schedule are motivated by extrinsic factors
such as pay and promotion.
For groups established by Teacher Education, teachers with Bachelor’s and some
graduate credit scored higher on Promotion and Supervision (Extrinsic motivational
factors) than did the teachers with Graduate degrees. This could be a result of teachers
with Bachelor’s typically have less years in the district and a perception that a
promotional opportunity would be a way to increase their pay. With reference to the
significant difference associated with Supervision, Teachers with Bachelor’s may look to
their building administrators for more support than do teachers with a Graduate degree.
In addition, these teachers tend to have less time in the district; therefore, they need
direction and support from their principals in many areas.
For groups established by Content category, teachers in the Core content areas
scored higher on the Promotion subscale than did the Non-Core Content group. This
110
may be a reflection that educators who teach Core Content classes are more apt to seek
promotional opportunities such as an Instructional Coach in the core areas of math,
language arts, and science.
For groups established by Teaching Experience, significant results were obtained
for both Extrinsic and Intrinsic scales. On the Extrinsic scale, teachers with more
experience scored lower than did teachers with less experience. Similar response patterns
were observed of Pay, Promotion, and Fringe Benefits. These results suggest that
teachers who have fewer numbers of years of experience have a tendency to consider
Extrinsic motivational factors more important than do teachers who have taught for 15
years or more.
For groups established by the Number of Schools variable, there were significant
differences for Promotion and Nature of Work. That is, teachers who had worked at four
or more schools had significantly lower scores than did teachers who had been at one or
two to three schools. A possible interpretation could be that the teachers who had been at
four or more schools were not motivated by promotional opportunities; while teachers in
the other two groups were more interested in possible promotions. The significance of
Nature of Work may suggest that teachers who have been at four or more schools are less
motivated by the Intrinsic nature of the job when compared to teachers who have worked
in fewer schools.
Open Ended Responses
The open-ended responses provided meaningful insight into teacher motivation
with specific respect to “compelling reasons to stay in a school.” Compensation was a
significant theme that surfaced during the analysis; however, issues related to
111
compensation are part of negotiations between the teachers’ union and the school district.
Therefore, this area is mostly beyond the control of a building level school administrator.
The other significant themes were Teachers Value Support, Character of My
Work, Importance of Students, and Need for Respect. These themes are not independent
but each of these themes is subject to influence from within the school. These themes are
related to more global issues such as positive interactions with others or a role as a
professional. It is interesting to note that when the comments are considered across all of
these themes, the comments fell into one of two major groups. The first type of
responses suggested that this condition was a source of satisfaction for the respondent
because the item or issue was present. For example, the teacher had meaningful support
from the principal or colleagues. For the second group, the comments seemed to indicate
that the item or issue was not present and that absence was a source of no satisfaction
because the item was absent. These themes as defined by the comments of the
respondents tended to be associated with motivational factors of Herzberg (1968), which
include achievement, recognition, work itself, responsibility, advancement, and growth.
Herzberg argued that motivators, if present, are associated with satisfaction. If the
motivators are not present, then their absence is associated with no satisfaction. The
comments related to these themes are aligned with Hertzberg’s argument.
The comments related to Teachers Value Support provide examples that illustrate
what effective leaders within a school could or should do to promote teacher motivation
or job satisfaction. Many of the comments illustrated teachers’ perceptions that they
were supported and that such support was the reason that they stayed in the teaching
profession. That is, these teachers were satisfied. Other teachers indicated that they
112
needed support and follow through from administration. These teachers were expressing
a condition of no satisfaction as defined be Herzberg (1968). This theme had five sub
themes: Administrator Support, Colleague Support, Colleague Support at all Levels,
Financial Resources, Opportunities, and Technology. Each subtheme identifies an area in
which a principal could support his/her teaching staff. Some themes may be more
difficult to provide than others. For example, a principal in a Title I school may have
financial resources to facilitate satisfaction in relationship to the sub theme of
Administrator Support. At the same time, principals in other schools may lack such
financial resources. However, a principal must be keenly aware that teachers value
support and that such support is a source of satisfaction for teachers.
Likewise, the theme, The Characteristics of My Work, is very much under the
direct influence of a building principal. The sub-themes tended to relate to teacher
autonomy within the classroom: Control over Teaching, Relief from Non-teaching
Responsibilities, Smaller Class Sizes, and Other general concerns. Clearly, class size is
determined, in most cases, by forces outside the building. However, the other issues are
very much associated with the culture and climate of the school itself. The principal has
significant influence of these areas. A review of the comments related to this theme
again suggest that either teachers had autonomy and were satisfied or that autonomy was
lacking, which caused no satisfaction. Principals should take steps to help teachers
achieve more control over their classrooms, when possible, reduce paper work, and be an
advocate for more proactive involvement of teachers in key decisions.
The theme, Importance of the Students, is related to the intrinsic values that
teachers have related to working with students. The comments related to this theme
113
consistently relate to working with students, student growth, and “great” students.
Clearly, teacher satisfaction was related to working with the students. Some of the
comments suggested that policies needed to be adjusted and some comments were
conditional statements. However, the comments across this theme consistently indicated
that teachers valued positive interactions with students, which, according to Herzberg
(1968) facilitate satisfaction. Thus, the data suggests that principals could improve
satisfaction by improving quality and quantity of teacher-student interactions.
Implications for Practice
The results suggest that educational leaders should carefully plan activities related
to hiring, recruitment, and retention of teachers. The mantra of “a highly effective teacher
in each classroom” is critical if students are going to be able to meet the demands of the
21st Century. Effective programs to retain highly qualified and highly effective teachers
would positively impact the teacher shortage.
This study suggests that many of the factors which teachers have self-identified as
“compelling reasons to stay in a school” can be directly influenced by district leaders
and, more specifically, by building principals. District leaders should work with building
principals to review implications and the implementation of policies, regulations, and
processes put into place that may be intendended to support teachers, but may in fact
increase their workload and take away valuable student centered time. The study suggests
teachers are motivated and find satisfaction in teaching their students, and not necessarily
the paperwork associated with their classroom responsibilities.
Districts and Superintendents should react proactively to address the shortage of
teachers and develop partnerships with universities and colleges to better prepare teachers
114
while in their pre-service courses. For example, teachers who are trained and are
knowledgeable about recent changes to standards and assessments, are more apt to feel
confident and effective in the classroom. District leaders should also re-think salary
structures that have been historically calibrated on years in the district with increases
being given for cost of living increases and additional course work. As noted previously,
the National Center on Teacher Quality conducted a study on several districts regarding
teachers’ salaries and found, “Most lock-step salary schedules that are entirely dependent
on experience and educational credits do not allow districts to create a competitive edge
or reward teachers for their accomplishments” (NCTQ, 2014, p.15).
Although salary is typically found to be a district-level responsibility, principals
are able to provide both extrinsic and intrinsic motivators for teachers if done
thoughtfully and staying within all district policies. For example, principals are able to
provide teachers with work conditions that encourage collaboration and team-work.
Through such activities as grade and/or department planning and professional learning
communities, teachers are able to share student achievement data as well as proven
instructional strategies. Principals are critical to leading these efforts within a school and
showing their support to teachers. Principals are also able to encourage teacher leaders
within their buildings through such means as appointment of department chairs,
recommendations to serve on school or district committees, serving as a mentor or master
teacher, or providing professional development to other teachers. The above methods
speak to the results demonstrated in this study’s data, for the factors of Promotion, Pay,
Supervision (Extrinsic) and Conditions (Intrinsic). The effective principals can develop a
culture and climate that addresses the significant themes of Teachers Value Support,
115
Character of My Work, Importance of Students, and Need for Respect. In addition,
central office leadership could support principals’ efforts through effective feedback,
data, and ongoing professional development.
Using the results from this research could help to inform other district leaders
with information on what job satisfaction factors are important to teachers. It is notable
that overall teachers scored higher at all levels with intrinsic motivational factors, but that
younger, less experienced teachers rated extrinsic motivational factors higher. This would
help school boards, district level administration, and building principals to be better
informed as to demographics of teachers and how to best target job satisfaction type
incentives to better recruit and retain teachers. In this era of teacher shortages, it can only
benefit districts to have as much information and data as possible to attract teachers and
to reduce teacher turnover costs.
Summary
In comparison to much of the related literature, the results of this study
demonstrated some interesting points. The Intrinsic motivational factors were high across
all variables and all groups; this may confirm a point in Lortie’s (1975) research whereby
working with students provided the greatest source of job satisfaction for teachers. This is
consistent with the open-ended responses related to the themes Character of My Work
and Importance of Students; teachers indicated the intrinsic value of working with
students. Similarly, Sergiovanni (1967) noted the positive affective influences of teachers
on students. More recent research supports the influence of principals and administrators
on a teacher job satisfaction as well as job dissatisfaction (Range, Finch, Young, &
Hvidston, 2014). Again, the results of this study were supportive of the potential positive
116
impacts of principals on teacher job satisfaction. In addition, the literature indicates that
working conditions and the work environment impact job satisfaction; similarly, the
results indicated that teachers need support, teachers value autonomy, and teachers need
respect. Here again, the principal can directly support factors that increase teachers’ job
satisfaction. As found by NYSED (2010), operating conditions in the school
environment impact teacher retention negatively or positively; principals can support
environmental conditions that positively support teacher retention.
Finally, the parallel studies conducted by Cui-Callahan (2012) and Bumgartner
(2013), mirrored the results found in this study. Specifically, all three studies indicated
that teacher respondents scored higher in Intrinsic job satisfaction than Extrinsic job
satisfaction; that is, intrinsic motivational factors tended to be more important than
extrinsic factors. Similar to this study, Cui-Callahan’s results found that younger, less
experienced teachers had higher Intrinsic and Extrinsic job satisfaction than did their
older, more educated, counterparts. Likewise, Bumgartner’s study found that teachers
with less experience were more satisfied and elementary teachers had greater satisfaction
than secondary teachers.
Recommendations
Several recommendations can be made to further expand research in the area of
teacher job satisfaction:
1. Expand the use of qualitative questions to further explore job satisfaction
among teachers.
117
2. Conduct focus groups with various demographics of teachers across all levels
of elementary, middle and high to determine commonalities for job
satisfaction.
3. Expand the research on “Nature of Work” and “Conditions” to see exactly
what the impact is on student learning when teachers are motivated by these
factors and have either job satisfaction or job dissatisfaction caused by these
variables.
4. Conduct a study on which type of extrinsic motivational factor of Pay has
more impact on teachers. For example, an increase in the Cost of Living
across the board for all teachers or a more targeted approach such as an
incentive pay system.
Conclusion
Job satisfaction and its relation to middle school teachers’ motivation was the
focus of this study. The many aspects associated with job satisfaction such as recruitment
and retention for teachers are significant, especially in this western state with an expected
increase in the need for teachers over the next decade. This study considered workforce
and policy issues which may be leading to highly effective teachers leaving the
profession earlier than needed and therefore impacting student achievement. The review
of literature noted several important factors related to job satisfaction and theories on
motivation. Using the JSS and demographic questions as well as one open-ended
response, the data were analyzed. The preliminary data analysis was completed and a
MANOVA was conducted in addition to a five-step protocol that was followed. Through
this analysis and in summary, it was found that all teachers in this sample scored higher
118
at all levels with intrinsic motivational factors and that younger, less experienced teachers
rated extrinsic motivational factors higher. This study reinforced previous research on
Intrinsic and Extrinsic motivational factors with significance relegated to intrinsic factors
across all teachers being important to job satisfaction. It is the hope that the results of this
study will add to the body of literature and a more comprehensive understanding of job
satisfaction among middle school teachers.
119
REFERENCES
Adams, J. S. (1963). Toward an understanding of inequity. Journal of Abnormal and
Social Psychology, 67(5), 422-436.
Allegretto, Sylvia A., Corcoran, Sean P., & Mishel, L. (2004). How Does Teacher Pay
Compare? Methodological Challenges & Answers. Economic Policy Institute.
Washington, DC: Author.
Almack, J. (1933). Modern school administration, its problems and progress. Boston,
MA: Ayer.
American Association of Employment in Education, (AAEE). (2008). Educator Supply
and Demand in the United States. Retrieved from
http://www.aaee.org/cwt/external/wcpages/resource/index.aspx
Anfara, V. A., Jr., Flowers, N. Caskey, M. M., & Mertens, S. B. (2013). Common
planning time: A review of literature. In S. B. Mertens, V. A. Anfara, Jr., M. M.
Caskey, & N. Flowers (Eds.), Common planning time in middle level schools:
Research studies from the MLER SIG’s national project (pp. 13–26). Charlotte,
NC: Information Age.
Anfara, V.A. (2013). Understanding job satisfaction and its relationship to student
academic performance. Middle School Journal; 44(3), 58-64.
Aron, A., Aron, E. N., & Coups, E. J. (1994). Statistics for psychology. Upper Saddle
River, NJ: Pearson Education Inc.
Baldacci, L. (2006). Why New Teachers Leave... and Why New Teachers Stay. American
Educator, 30(2), 8-12.
120
Barnes, G., Crowe, E., & Schaefer, B. (2007). The cost of teacher turnover in five school
districts. Teaching and America’s Future. Retrieved from
http://www.nctaf.org/resources/demonstration_projects/turnover/documents/CTT
FullReportfinal.pdf
Biddix, J. P. (2015). Research rundowns. Retrieved from,
https://researchrundowns.wordpress.com/quantitative-methods/instrument-
validity-reliability/
Bing, B. J. (2001). The presence and importance of job satisfaction and job
dissatisfaction among elementary and secondary teachers (Doctoral Dissertation,
South Carolina State University). Retrieved from ProQuest Dissertations and
Theses database. (UMI No. 304768173.)
Bishay, A. (1996). Teacher motivation and job satisfaction: A study employing the
experience sampling method. Journal of Undergraduate Science, 3, 147-154.
Blau, G. (1999). Testing the longitudinal impact of work variables and performance
appraisal satisfaction on subsequent overall job satisfaction. Human Relations
52(8), Health Reference Center Academic. Web. 5 Oct. 2015.
Bowling, N. A., Hendricks, E. A., & Wagner, S. H. (2008). Positive and negative
affectivity and facet satisfaction: A meta-analysis. Journal of Business and
Psychology, 23, 115-125.
Boyd, D., Grossman, P., Ing, M., Lankford, H., Loeb, S., & Wyckoff, J. (2011). The
influence of school administrators on teacher retention decisions. American
Educational Research Journal, 48, 303-333.
Brush, D. H., Moch, M. K., & Podyan, A. (1986). Individual demographic differences
121
and job satisfaction. Journal of Organizational Behavior, 8, 139-155.
Bullock, R. J. (1984). Improving job satisfaction. New York, NY: Pergamon Press.
Bumgartner, M. (2013). A study of factors that impact teacher job satisfaction in rural
schools. (Doctoral Dissertation) Retrieved from ProQuest Dissertation and
Theses database. (UMI Dissertations Publishing. No. 3566242.)
Burton, G. E., Pathak, D. S., & Vaught, B. C. (1976). The effects of organizational
communication on job satisfaction and motivation factors for management.
Journal of Management, 2(2), 17-25.
Cable, D. M., & Judge, T. A. (1994). Pay preferences and job search decisions: A person-
organization fit perspective. Personnel Psychology, 47(1), 317-348.
Carnegie Council on Adolescent Development. (1989). Turning points: Preparing
American youth for the 21st century : the report of the Task Force on Education
of Young Adolescents. Washington DC: Author.
Clark, A. E. (1996). Job satisfaction in Britain. British Journal of Industrial Relations,
34(2), 189-217.
Clark, A.E. (1997). Job satisfaction and gender: Why are women so happy at work?”
LabourEconomics, 4, 341-72.
Coca, Vanessa M., & Marinell, W. (2013). Who Stays & Who Leaves? Findings from a
three-part study of teacher turnover in New York City Middle Schools. The
Research Alliance for New York City Schools.
Cohn, M. M. (1992). How teachers perceive teaching: Change over two decades, 1964-
1984. In A. Lieberman (Ed.), The changing contexts of teaching (pp. 110-137).
Chicago, IL: The University of Chicago Press.
122
Cooper-Hakim, A., & Viswesvaran, C. (2005). The construct of work commitment:
Testing an integrative framework. Psychological Bulletin, 131, 241–259.
Cui-Callahan, N. (2012). An examination of job satisfaction among urban high school
teachers. (Doctoral Dissertation). Retrieved from ProQuest Dissertations and
Theses database. (UMI Dissertations Publishing No. 3511778.)
Darling-Hammond, L. (2010). The flat world and education: How America's commitment
to equity will determine our future. New York, NY: Teachers College Press.
Dillman, D. A. (2000). Mail and Internet surveys: The tailored design method. New
York: Wiley.
Donahue, S. M., & Heywood, J. S. (2004). Job satisfaction and gender: An expanded
specification from the NLSY. International Journal of Manpower, 25(2), 211-
238. Firestone, W. A., & Pennel, J. R. (1993). Teacher commitment, working
conditions and differential incentive policies. Review of Educational Research,
63(4), 489-525.
Florit, E. F., & Vila Lladosa, L. E. (2007). Evaluation of the effects of education on job
satisfaction: Independent single-equation vs. structural equation models.
International Advances in Economic Research, 13(2), 157-170.
Gerhart, B., & Milkovich, G. T. (1990). Organizational differences in managerial
compensation financial performance. Academy of Management Journal, 33, 663-
691.
Giri, V.N., & Kumar, B.P. (2010). Assessing the impact of organizational communication
on job satisfaction and job performance. Psychological Studies, 55(2), 137-143.
Glenn, N.D. and Weaver, C.H. (1982). Further Evidence on Education and Job
123
Satisfaction. Social Forces, 61, 46–55.
Gruneberg, M. M. (1976). Job Satisfaction. London: Macmillan.
Hackman, J. R., & Lawler, E. E. (1971). Employee reactions to job characteristics.
Journal of Applied Psychology Monograph, 55, 259-286.
Hackman, J. R., & Oldham, G. R. (1974). The job diagnostic survey: An instrument for
the diagnosis of jobs and the evaluation of job redesign projects. (Technical
Report No. 4). Department of Administrative Sciences: Yale University.
Retrieved from http://files.eric.ed.gov/fulltext/ED099580.pdf
Hackman J. R., & Oldham, G. R. (1976). Motivation through the design of work: Test of
a theory. Organizational Behavior and Human Performance, 16(2), 250-279.
Hagan‚ J.‚ & Kay‚ F. (1995). Gender in practice: A study of lawyers’ lives. New
York, NY: Oxford University.
Harley, S. (2010). The Historical and Social Context of U.S. Middle School Education:
Vade Mecum for Middle School Leaders. (Doctoral Dissertation). Retrieved from
ProQuest Dissertations and Theses database. (UMI Dissertations Publishing No
3440771.)
Haycock, K., Gerald, C., & Wilkins, A. (2009). Fighting for quality and equality, too.
The Education Trust, 1-9.
Herzberg, F. (1966). Work and the nature of man. New York, NY: The World Publishing
Company.
Herzberg, F. (1968). One more time: How do you motivate employees? Harvard
Business Review, 46(1), 33-64.
Herzberg, F. (1976). The Managerial Choice: To be Efficient and to be Human. Illinois:
124
Dow Jones-Irwin.
Herzberg, F. (2003). One more time: How do you motivate employees? Harvard
Business Review, 81(1) 87-96.
Herzberg, F., Mausner, B., Peterson, R. O., & Capwell, D. F. (1957). Job attitudes:
Review of Research and Opinion. Pittsburgh: Psychological Service of Pittsburgh.
Herzberg, F., Mausner, B., & Snydner, B. B. (1959). The motivation to work. New
York, NY: Wiley & Son.)
Holmes, K. J. (2007). Post downsizing: What to do with the surviving employees to bring
back morale and motivation (Doctoral dissertation). Retrieved from ProQuest
Dissertations and Theses database. (UMI No. AAT 3262861.)
Hoppock, R. (1935). Job satisfaction. New York, NY: Harper & Bros.
Horng, E. L. (2009). Teacher trade-offs: Disentangling teachers’ preferences for working
conditions and student demographics. American Educational Research Journal,
46, 690-717.
Huberman, M. (1989). The professional life cycle of teachers. Teachers College Record,
91, 31-57.
Huselid, M. A. (1995). The impact of human resource management practice on turnover,
productivity and corporate financial performances. Academy of Management
Journal, 38, 635-672.
Idson, T. L. (1990). The establishment size, job satisfaction and the structure of work.
Applied Economics, 22, 1007-1018.
Ingersoll, R. (2001). Teacher turnover, teacher shortages, and the organization of schools.
125
Retrieved from UW Departments Web Server:
depts.washington.edu/ctpmail/PDFs/Turnover-Ing-01-2001.pdf
Ingersoll, R. (2003). Who control’s teachers’ work? Power and accountability in
America’s schools. Cambridge, MA: Harvard University Press.
James, L. & Jones, A. P. (1980). Perceived job characteristics and job satisfaction: An
examination of reciprocal causation. Personnel Psychology, 33(1), 97-135.
Judge, T. A., & Church, A. H. (2000). Job satisfaction: Research and practice. In C. L.
Cooper & E. A. Locke (Eds.), Industrial and organizational psychology: Linking
theory with practice (pp. 166-198). Oxford, UK: Blackwell.
Jurgensen, C. E. (1978). Job preferences: What makes a job good or bad? Journal of
Applied Psychology, 63, 267-276.
Khaleque, A., & Choudhary, N. (1984). Job facets and overall job satisfaction of
industrial managers. Industrial Relations, 20(2), 55-64.
King, M., Murray, M., & Atkinson, T. (1982). Background personality, job
characteristics and satisfaction with work in a national sample. Human Relations,
35, 119-133.
Klassen, R.M. Chiu, M. M. (2010). Effects on teachers’ self-efficacy and job satisfaction:
Teacher gender, years of experience, and job stress. Journal of Educational
Psychology, 102(3), 741-756.
Knox, J. A., Anfara, V., Jr. (2013). Understanding job satisfaction and its relationship to
student academic performance. Middle School Journal, 44(3), 58-65.
Konrad, A., Corrigall, E., Lieb, P., & Ritchie, J. (2000). Sex differences in job attribute
preferences among managers and business students. Group and Organization
126
Management, 25(2), 108-131.
Kosteas, V. D. (2011). Job satisfaction and promotion. Industrial Relations: A Journal of
Economy and Society, 50(1) 174-194.
Kulhavy, R. W., & Schwartz, N. H. (1981). Tone of communication and climate
perceptions. Journal of Business Communication, 18(1), 17-24.
Ladd, H. F. (2011). Teachers’ perceptions of their working conditions: How predictive of
planned and actual teacher movement? Educational Evaluation and Policy
Analysis, 33(2), 235-261.
Ladebo, O. J. (2005). Effects of work-related attitudes on the intention to leave the
profession: An examination of school teachers in Nigeria. Educational
Management Administration & Leadership, 33(3), 355-369.
Lake, C. J., Gopalkrishnan, P., Sliter, M. T., & Withrow, S. (2015). The Job Descriptive
Index: Newly Updated and Available for Download. Retrieved from
http://www.siop.org/tip/july10/06jdi.aspx
Likert, R. (1932).A technique for the measurement of attitudes. Archives of Psychology
140: 1-55.
Liu, C., Borg, I., & Spector, P.E. (2004). Measurement equivalence of the German job
satisfaction survey used in a multinational organization: Implications of
Schwartz’s culture model. Journal of Applied Psychology, 89(6), 1070-1082.
Llorente, R. M. B., & Macias, E. F. (2005). Job satisfaction as an indicator of the quality
of work. The Journal of Socio-Economics, 34(6), 656-673.
Locke, E. A. (1969). What is job satisfaction? Organizational Behavior and Human
Performance, 4(1), 309-336.
127
Locke, E. A. (1976). Nature and causes of job satisfaction. In M. D. Dunnette (Ed.),
Handbook of industrial and organizational psychology (pp. 1297-1349), Chicago,
IL: Rand McNally College Publishing Company.
Locke, E. A., & Latham, G. P. (1990). Work motivation and satisfaction: Light at the end
of the tunnel. Psychological Science, 1(4), 240-246.
Lortie, D. C. (1975). School teachers: A sociological study. Chicago, IL: University of
Chicago.
Mann, H. (1891). Life and works of Horace Mann, Vol. III: Annual reports of the
secretary of the board of education of Massachusetts for the years 1839-1844.
Boston, MA: Lee and Shepard Publishers. (Original work published 1839-1844)
Marston, S. H., Brunetti, G. J., & Courtney, V. B. (2005). Elementary and high school
teachers: Birds of a feather? Education (Chula Vista, Calif.), 125(3), 469-495.
Maslow, A. H. (1943). A theory of human motivation. Psychological Review, 50(4), 370-
396.
Maslow, A. H. (1954). Motivation and personality. New York: Harper & Row.
Meng, R. (1990). The relationship between unions and job satisfaction. Applied
Economics, 22, 1635-1648.
Mertler, C. A., & Vannata, R. A. (2005). Advanced and multivariate statistical methods:
Practical application and interpretation (3rd ed.). Glendale, CA: Pyrczak
Publishing.
MetLife. (2013). The MetLife survey of the American teacher: Challenges for school
leadership. Retrieved from
128
https://www.metlife.com/assets/cao/foundation/MetLife-Teacher-Survey-
2012.pdf
Milkovich, G. T., & Newman, J. (2002). Compensation (7th ed.). Homewood, IL: Irwin.
Mudor, H., & Tookson, P. (2011). Conceptual framework on the relationship between
human resource management practices, job satisfaction, and turnover. Journal of
Economics and Behavioral Studies, 2(2), 41-49.
Mueller, C.W. and Wallace, J.E. (1996). Justice and the paradox of the contented female
worker. Social Psychology Quarterly, 59(4), 338-349.
Nash, M. (1985). Managing organizational performance. San Francisco, CA: Jossey-
Bass. National Center for Education Statistics. (2010). Teacher attrition and
mobility: Results from the 2008/09 teacher follow-up survey: Schools and staffing
survey, 2007/08; 2010 ASI 4836-11.7; NCES 2010-353.
National Commission on Teaching and America's Future (NCTAF). (2003, January). No
dream denied: A pledge to America's children. Retrieved from www.nctaf.org
NCTAF.
Ng, T. W. H., & Feldman, D. C. (2010). The relationships of age with job attitudes: A
meta- analysis. Personnel Psychology, 63(3), 677-718.
O’Reilly, P. E. (2014). Teachers at work: Factors influencing satisfaction, retention and
the professional well-being of elementary and secondary educators (Doctoral
Dissertation). Retrieved from ProQuest Dissertations and Theses database. (UMI
Dissertations Publishing No. 3612474.)
Perrachione, B. A., Petersen, G. J., & Rosser, V. J. (2008). Why do they stay?
Elementary teachers’ perceptions of job satisfaction and retention. The
129
Professional Educator, 32(2), 1-17. Retrieved from
http://files.eric.ed.gov/fulltext/EJ862759.pdf.
Phelan, J. (1994). The paradox of the contented female worker: An assessment of
alternative explanations. Social Psychology Quarterly, 57, 95-107.
Pincus, J. D. (1986). Communication satisfaction, job satisfaction, and job performance.
Human Communication Research, 12(3), 395-419.
Pogodzinski, B., Youngs, P., & Belman, D. (2012). Administrative climate and novices’
intent to remain teaching. The Elementary School Journal, 113(2), 252-275.
Range, B. G., Finch, K., Young, S., & Hvidston, D. J. (2014). Teachers’ perceptions
based on tenure status and gender about principals’ supervision. NCPEA
International Journal of Educational Leadership Preparation 9(1).
Ravitch, D. (2010). The death and life of the great American school system: How testing
and choice are undermining education. New York, NY: Basic Books.
Rhodes, S. (1983). Age-related differences in work attitudes and behavior. A review and
conceptual analysis. Psychological Bulletin, 93(2), 328-367. Washington‚ DC:
U.S. Department of Labor.
Rodwell, J. J., Kienzle, R., & Shadur, M. A. (1998). The relationships among work-
related perceptions, employee attitudes, and employee performance: The integral
role of communication. Human Resource Management, 37(3-4), 277-293).
Rosenholtz, S. J., & Simpson, C. (1990). Workplace conditions and the rise and fall of
teachers’ commitment. Sociology of Education, 63, 241-257.
Samek, L. L., Musser, P. M., Caskey, M. M., Olson, M., & Greene., W. L. (2006, April).
130
Accountability and the changing practice of middle school teachers: Unintended
consequences. Paper presented at the annual meeting of the American Education
Research Association, San Francisco, CA.
Schuler, R. S. (1979). A role perception transactional process model for organizational
communication-outcome relationships. Organizational Behavior and Human
Performance, 23(2), 268-291.
Sergiovanni, T. J. (1967). Factors which affect satisfaction/dissatisfaction of teachers.
The Journal of Educational Administration, 5(1), 66-82.
Smith, P. C., Kendall, L. M., & Hulin, C. L. (1969). The measurement of satisfaction in
work and retirement. Chicago, IL: Rand McNally.
Smith, P. I. (1973). Job Involvement and Communications. London: Business Books
Limited.
Sousa-Poza, A. and Sousa-Poza, A. (2000). Taking another look at the gender/job
satisfaction paradox. Kyklos, 53, 135-152.
Spector, P. E. (1985). Measurement of human service staff satisfaction: Development of
the job satisfaction survey. American Journal of Community Psychology, 13, 693-
713.
Spector, P. E. (1997). Job satisfaction: Application, assessment, causes, and
consequences. Thousand Oaks, CA: Sage Publications.
Spector, P. E. (1999). Job satisfaction survey. Retrieved from Professor Paul E. Spector's
I/O psychology website at the University of South Florida.
http://shell.cas.usf.edu/~pspector/scales/jsspag.html
131
Taber, T. D., & Alliger, G. M. (1995). A task level assessment of job satisfaction.
Journal of Organizational Behavior, 16(2), 102-121.
Tadisina, Suresh K. (2001). Job Satisfaction: Empirical Evidence for Alternatives to JDI
Retrieved from http://ramayah.com/journalarticlespdf/jobsatisfaction.pdf
Takahara, R. (2014). Age-job satisfaction relationship for Japanese public school
teachers: a comparison of teachers' labor union members and professional and
technical employee members of private company labor unions. Journal of
Occupational Health, 56(4), 91.
Teacher Incentive Fund Survey. (2014). Washoe County School District, Reno, Nevada.
U.S. Department of Education Teacher Incentive Fund Grant Program.
Van Eerde, W., & Thierry, H. (1996). Vroom’s expectancy models and work-related
criteria: A meta-analysis. Journal of Applied Psychology, 81(5), 575-586.
Verdugo, R. R., Greenburg, N. M., Henderson, R. D., Uribe Jr., O., & Schneider, J. M.
(1997). School governance regimes and teachers’ job satisfaction: Bureaucracy
legitimacy, and community. Education Administration Quarterly, 33(1), 38-66.
Vroom, V. H. (1964). Work and motivation. New York, NY: John Wiley & Sons, Inc.
Waldman, D. A., & Avolio, B. J. (1986). A meta-analysis of age differences in job
performance. Journal of Applied Psychology, 71, 33-38.
Waldman, D., & Avolio, B. (1990). Age and work performance in non-management jobs.
The effects of experience and occupational type. Academy of Management
Journal, 33(2), 407-422.
Weiss, D. J., Dawis, R. V., England, G. W., & Lofquist, L. H. (1967). Instrumentation for
the theory of work adjustment. Minnesota Studies in Vocational Rehabilitation
132
(Whole No. XXII). Retrieved from
http://vpr.psych.umn.edu/assets/pdf/Monographpercent20XXIIpercent20-
percent20Manualpercent20forpercent20thepercent20MNpercent20Satisfactionper
cent20Questionnaire.pdf
Weiss, W. H. (2002). Organizing for quality productivity, and job satisfaction.
Supervision, 63(2), 13-15.
Wu, V., & Short, P. (1996). The relationship of empowerment to teacher job commitment
and job satisfaction. Journal of Instructional Psychology, 23, 85-90.
Yelboga, A. (2009). Validity and reliability of the Turkish version of the job satisfaction
survey (JSS). World Applied Sciences Journal, 6(8), 1066-1072.
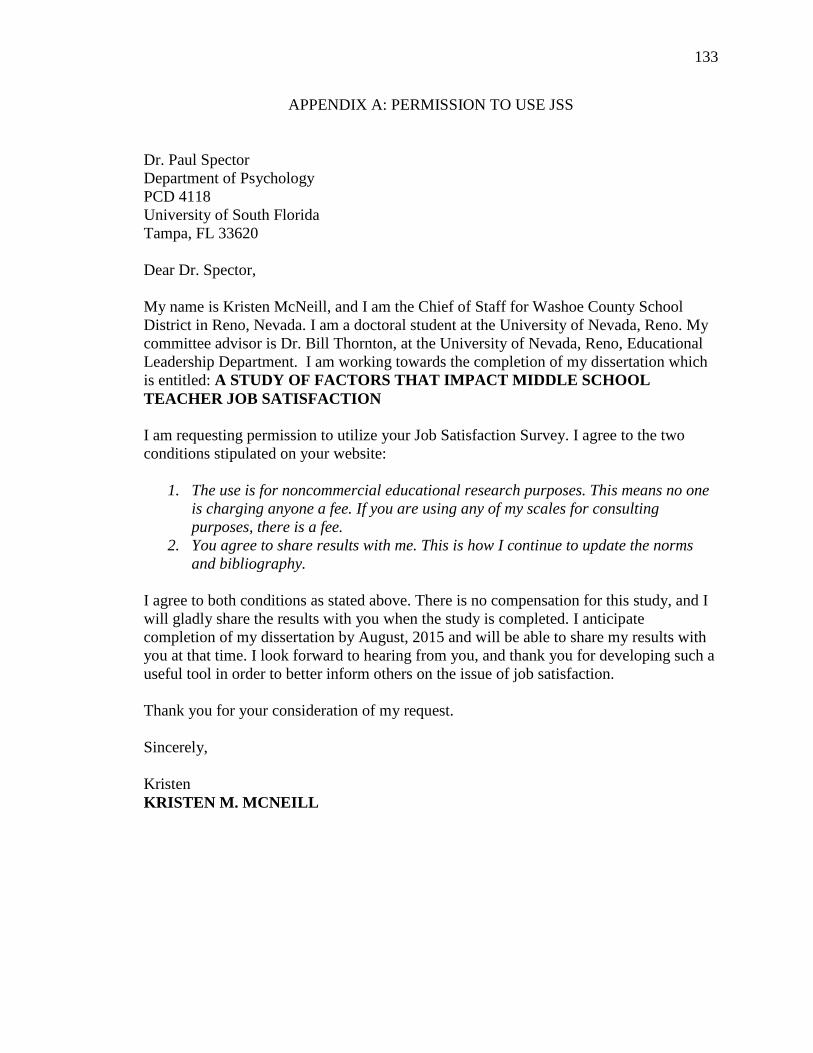
133
APPENDIX A: PERMISSION TO USE JSS
Dr. Paul Spector
Department of Psychology
PCD 4118
University of South Florida
Tampa, FL 33620
Dear Dr. Spector,
My name is Kristen McNeill, and I am the Chief of Staff for Washoe County School
District in Reno, Nevada. I am a doctoral student at the University of Nevada, Reno. My
committee advisor is Dr. Bill Thornton, at the University of Nevada, Reno, Educational
Leadership Department. I am working towards the completion of my dissertation which
is entitled: A STUDY OF FACTORS THAT IMPACT MIDDLE SCHOOL
TEACHER JOB SATISFACTION
I am requesting permission to utilize your Job Satisfaction Survey. I agree to the two
conditions stipulated on your website:
1. The use is for noncommercial educational research purposes. This means no one
is charging anyone a fee. If you are using any of my scales for consulting
purposes, there is a fee.
2. You agree to share results with me. This is how I continue to update the norms
and bibliography.
I agree to both conditions as stated above. There is no compensation for this study, and I
will gladly share the results with you when the study is completed. I anticipate
completion of my dissertation by August, 2015 and will be able to share my results with
you at that time. I look forward to hearing from you, and thank you for developing such a
useful tool in order to better inform others on the issue of job satisfaction.
Thank you for your consideration of my request.
Sincerely,
Kristen
KRISTEN M. MCNEILL

134
Dear Kristen:
You have my permission to use the JSS in your research. You can find copies of the scale
in the original English and several other languages, as well as details about the scale's
development and norms in the Scales section of my website
http://shell.cas.usf.edu/~spector. I allow free use for noncommercial research and
teaching purposes in return for sharing of results. This includes student theses and
dissertations, as well as other student research projects. Copies of the scale can be
reproduced in a thesis or dissertation as long as the copyright notice is included,
"Copyright Paul E. Spector 1994, All rights reserved." Results can be shared by
providing an e-copy of a published or unpublished research report (e.g., a dissertation).
You also have permission to translate the JSS into another language under the same
conditions in addition to sharing a copy of the translation with me. Be sure to include the
copyright statement, as well as credit the person who did the translation with the year.
Thank you for your interest in the JSS, and good luck with your research.
Best,
Paul Spector, Distinguished Professor
Department of Psychology
PCD 4118
University of South Florida
Tampa, FL 33620
813-974-0357
http://shell.cas.usf.edu/~spector
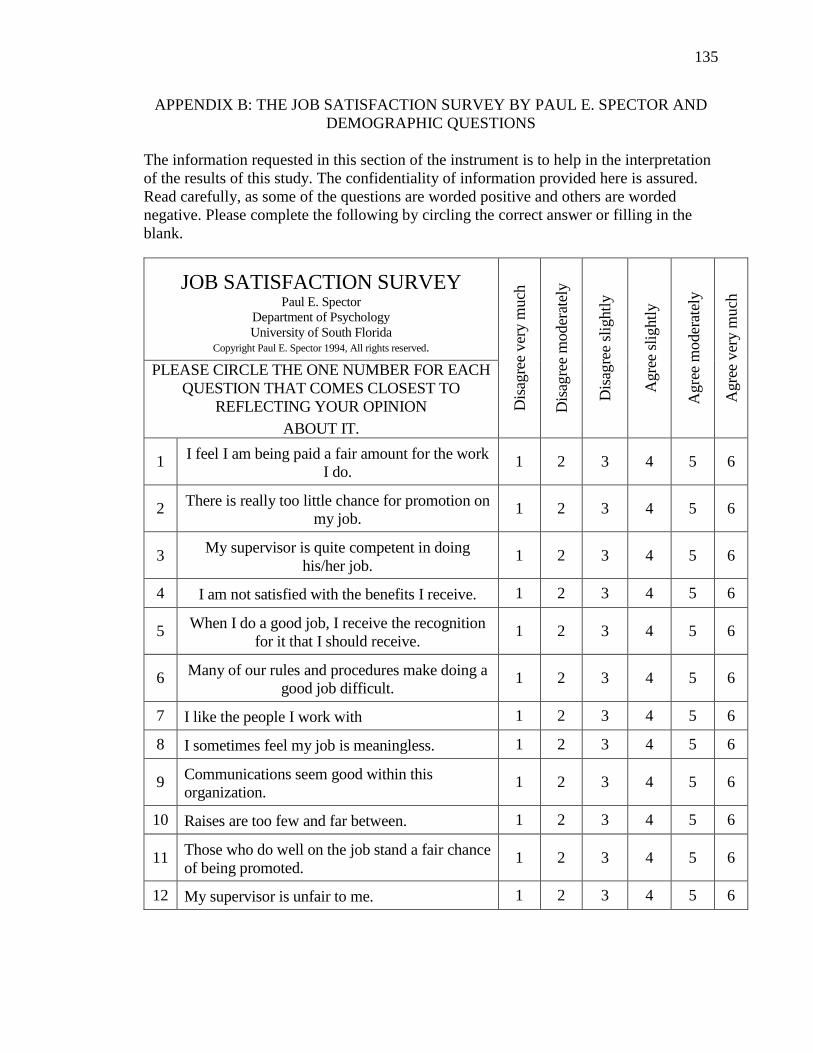
135
APPENDIX B: THE JOB SATISFACTION SURVEY BY PAUL E. SPECTOR AND
DEMOGRAPHIC QUESTIONS
The information requested in this section of the instrument is to help in the interpretation
of the results of this study. The confidentiality of information provided here is assured.
Read carefully, as some of the questions are worded positive and others are worded
negative. Please complete the following by circling the correct answer or filling in the
blank.
JOB SATISFACTION SURVEY Paul E. Spector
Department of Psychology
University of South Florida
Copyright Paul E. Spector 1994, All rights reserved.
Dis
agre
e ver
y m
uch
Dis
agre
e m
oder
atel
y
Dis
agre
e sl
ightl
y
Agre
e sl
ightl
y
Agre
e m
oder
atel
y
Agre
e ver
y m
uch
PLEASE CIRCLE THE ONE NUMBER FOR EACH
QUESTION THAT COMES CLOSEST TO
REFLECTING YOUR OPINION
ABOUT IT.
1 I feel I am being paid a fair amount for the work
I do. 1 2 3 4 5 6
2 There is really too little chance for promotion on
my job. 1 2 3 4 5 6
3 My supervisor is quite competent in doing
his/her job. 1 2 3 4 5 6
4 I am not satisfied with the benefits I receive. 1 2 3 4 5 6
5 When I do a good job, I receive the recognition
for it that I should receive. 1 2 3 4 5 6
6 Many of our rules and procedures make doing a
good job difficult. 1 2 3 4 5 6
7 I like the people I work with 1 2 3 4 5 6
8 I sometimes feel my job is meaningless. 1 2 3 4 5 6
9 Communications seem good within this
organization. 1 2 3 4 5 6
10 Raises are too few and far between. 1 2 3 4 5 6
11 Those who do well on the job stand a fair chance
of being promoted. 1 2 3 4 5 6
12 My supervisor is unfair to me. 1 2 3 4 5 6
136
13 The benefits we receive are as good as most
other organizations offer. 1 2 3 4 5 6
14 I do not feel that the work I do is appreciated. 1 2 3 4 5 6
15 My efforts to do a good job are seldom blocked
by red tape. 1 2 3 4 5 6
16 I find I have to work harder at my job because of
the incompetence of people I work with. 1 2 3 4 5 6
17 I like doing the things I do at work. 1 2 3 4 5 6
18 The goals of this organization are not clear to
me. 1 2 3 4 5 6
19 I feel unappreciated by the organization when I
think about what they pay me. 1 2 3 4 5 6
20 People get ahead as fast here as they do in other
places. 1 2 3 4 5 6
21 My supervisor shows too little interest in the
feelings of subordinates. 1 2 3 4 5 6
22 The benefit package we have is equitable. 1 2 3 4 5 6
23 There are few rewards for those who work here. 1 2 3 4 5 6
24 I have too much to do at work. 1 2 3 4 5 6
25 I enjoy my coworkers. 1 2 3 4 5 6
26 I often feel that I do not know what is going on
with the organization. 1 2 3 4 5 6
27 I feel a sense of pride in doing my job. 1 2 3 4 5 6
28 I feel satisfied with my chances for salary
increases. 1 2 3 4 5 6
29 There are benefits we do not have which we
should have. 1 2 3 4 5 6
30 I like my supervisor. 1 2 3 4 5 6
31 I have too much paperwork. 1 2 3 4 5 6
32 I don't feel my efforts are rewarded the way they
should be. 1 2 3 4 5 6
33 I am satisfied with my chances for promotion. 1 2 3 4 5 6
137
34 There is too much bickering and fighting at
work. 1 2 3 4 5 6
35 My job is enjoyable. 1 2 3 4 5 6
36 Work assignments are not fully explained. 1 2 3 4 5 6
138
Demographic Questions
1. What is your gender?
[ ] M [ ] F
2. What is your age group?
[ ] 21-30 [ ] 31-40
[ ] 41+
3. What is your marital status?
[ ] Married [ ] Not married
4. What level of formal education have you completed?
[ ] Bachelor’s Degree [ ] Bachelors + Graduate Credit
[ ] Graduate Degree (MA, MS, Ed.S, Ed.D, Ph.D)
5. Do you teach which of the following the majority of your day?
[ ] Core Content Classes [ ] Non-Core Content Classes
6. How many years do you have to retirement?
[ ] 0 to 10 years
[ ] 11 to 20 years
[ ] 21 to 30 years
7. Are you vested in the Public Employees Retirement System (PERS)
[ ] In PERS less than 5 years [ ] In PERS 5 or more years
8. What is Your Salary?
[ ] $30,000-$40,000 [ ] $40,001-$50,000
[ ] $50,001+
9. What are your total years of teaching experience (K-12)?
[ ] 0-5 [ ] 6-15 [ ] 15+
10. How many different schools have you taught in during your teaching career?
[ ] 1 [ ] 2-3
[ ] 4+
139
APPENDIX C: LETTER OF APPROVAL FROM UNIVERISTY OF NEVADA, RENO
INTERNAL REVIEW BOARD (IRB)
Research Integrity Office
218 Ross Hall / 331, University of Nevada, Reno Reno, Nevada 89557 775.327.2368 / 775.327.2369 fax www.unr.edu/research-integrity
DATE: June 9, 2015
TO: William Thornton, Ed.D
FROM: University of Nevada, Reno Social Behavior and Education
IRB
PROJECT TITLE: [742345-1] A Study of Factors that Impact Middle School
Teacher Job Satisfaction
REFERENCE #:
SUBMISSION TYPE: New Project
ACTION: DETERMINATION OF EXEMPT STATUS
DECISION DATE: June 9, 2015
REVIEW
CATEGORY:
Exemption category # 2
The UNR Institutional Review Board has determined this project is EXEMPT FROM
IRB REVIEW according to federal regulations. Please note, the federal government has
identified certain categories of research involving human subjects that qualify for
exemption from federal regulations. The IRB is authorized by the federal government to
determine whether studies thought by the principal investigator (PI) to be exempt from
federal regulations actually qualify for exemption criteria. Only the IRB has authority to
make a determination that a study is exempt from federal regulations and from IRB
review and approval. The above-referenced protocol was reviewed and the research
deemed eligible to proceed in accordance with the requirements of the Code of Federal
Regulations on the Protection of Human Subjects (45 CFR 46.101 paragraph [b]).
• Application Form - Exempt Tests Surveys Interviews Observation 121614-1 (6)
_MC editsKM.docx (UPDATED: 06/1/2015)
• Consent Form - letters to principal and teachers (UPDATED: 06/1/2015)
• Letter - Approval letter from IRB in WCSD (UPDATED: 05/30/2015)
• Questionnaire/Survey - Job Satisfaction Survey (UPDATED: 06/1/2015)
140
• University of Nevada, Reno - Part I, Cover Sheet - University of Nevada, Reno -
Part I, Cover Sheet (UPDATED: 05/30/2015)
We will retain a copy of this correspondence within our records.
If you have any questions, please contact Valerie Smith at 775.327.2370 or
[email protected]. Please include your project title and reference number in all
correspondence with this committee. Sincerely,
Nancy Moody JD MA
Director, Research Integrity Office
University of Nevada Reno
This letter has been electronically signed in accordance with all applicable regulations, and a copy is retained within University of
Nevada, Reno Social Behavior and Education IRB's records.
141
APPENDIX D: CORRESPONDENCE FOR PLANNED SURVEY
February 2015
Dear Middle School Principal,
I am currently working to complete my doctorate, and am conducting a study on teacher
job satisfaction in middle schools. I would like to have your permission to conduct an on-
line survey of your teaching staff. The study seeks to gauge the job satisfaction of
teachers in order to understand which factors of the job lead to satisfaction as well as
dissatisfaction. The results may aid in implementing practices that could lead to higher
retention rates of quality teachers in the Washoe County School District and possibly
other large urban school districts. The survey responses will be anonymous and only
reported at the aggregate level. If you are willing to have your teachers participate in this
survey, please respond to this email with your acknowledgement that the survey will be
sent to your teaching staff and you are providing your permission to do so.
The dates of the survey will be:
__________________________________________________
Thank you in advance,
Kristen M. McNeill
Dear Middle School Teacher,
You are being asked to participate in a survey that will enable this researcher to gauge
teacher satisfaction in middle schools in a large urban school district.
Benefits of the Study
Research has shown that the demands of the teaching profession have increased
significantly over the last decade. This has been highlighted recently with the
requirement to learn new standards and assessments along with the legislation including
student achievement into evaluations of teachers and principals. Given these facts, we
want to find out how do teachers feel about their jobs? Are they being relatively satisfied,
or not?
There is another challenge, and that is retaining quality teachers. The average age of
teachers is increasing every year, which will most likely lead to high numbers of teachers
leaving for retirement, and not enough new teachers are entering the profession the
replace them. Research shows that up to 50percent of new teachers leave the profession
within the first five years, leading to another important question: Are teacher retention
and job satisfaction related? The study being conducted seeks to answer those questions,
and possibly provide information that will allow greater retention of teachers in the
WCSD. Your responses to the survey will greatly aid in providing much needed
information concerning the levels of satisfaction teachers feel about their jobs. It is a
critically important study.
142
Participation Details and Potential Risks
Completion of the on-line survey will take about twenty minutes. Participants in the
survey must be certified teachers. Every step will be taken to be sure responses are secure
and confidential, and there is an extremely low risk that individual respondents can be
identified. Participation is strictly voluntary. You are not required to answer all questions,
and may skip questions you feel you are unable or unwilling to answer. Responses will be
aggregated and individual schools will not be identified in the study.
We will be having a raffle for several prizes including a dinner for two at Charlie
Palmer’s at the Grand Sierra Resort and five Amazon.com $30.00 gift cards.
Please follow this link to the survey: _____________________________________
Thank you greatly for your participation!
Kristen M. McNeill
Student Researcher
University of Nevada, Reno


![Blood signs| [Stories] - ScholarWorks at University of Montana](https://img.pdfslide.net/doc/110x75/631eae0b5ff22fc74506cf41/blood-signs-stories-scholarworks-at-university-of-montana.jpg)


![Violent mercy| [Poems] - ScholarWorks at University of Montana](https://img.pdfslide.net/doc/110x75/63211d28b71aaa142a04186a/violent-mercy-poems-scholarworks-at-university-of-montana.jpg)