Embed Size (px)
Citation preview
Prepared by Beacon Economics, LLCPresented by Western Alliance Bank
NOVEMBER 2021
National Economic Intelligence Report
Despite the headlines, a quick recovery was to be expected given the nature of the shock the economic system sustained. This was a natural disaster-type supply shock—and as tragic as that is for the population, it simply doesn’t have the same long-run effects of a more traditional demand shock such as what caused the Great Recession. The Federal government’s effort should have been largely focused on pandemic control with narrow economic mitigation efforts directed at the parts of the economy that suffered the most direct harm from temporary closures and restricted activity, such as restaurants, hotels and entertainment.
Unfortunately, this logic didn’t stand a chance in the hyper-political world of 2020. One side has viewed the entire episode as a coordinated effort to destroy the U.S. economy, while the other has viewed the event as an existential threat to the bottom 80% of the population. Headlines predicted an economic depression, and the media continues to rumble about an economy “at the brink,” “on the edge,” or “falling over a cliff.” Ultimately, the Federal government ended up pouring trillions of dollars in the form of monetary and fiscal stimulus across the entire economy, regardless of whether a sector or group was actually at risk of pandemic-related fallout. And it didn’t stop there, with governments at every level indulging in a wide range of policy tools to prevent problems that weren’t that much of a threat.
There is little doubt that the stimulus efforts have hastened the recovery and given plenty of politicians bragging rights for saving the world (even though it didn’t need that kind of saving). However, stimulus is not free, and the massive injection of money into the economy comes at a serious cost. These excesses will end up introducing dangerous instabilities into the next expansion, such as inflation and asset bubbles, deepen the nation’s long-run fiscal budget challenges, and possibly sow the seeds for the next downturn. Just as significantly, political distractions have prevented policymakers from discussing, much less trying to solve, the critical long-run issues facing the U.S. Indeed, governments at every level continue to operate in crisis mode even though the nation has largely moved beyond the crisis.
0
5,000
10,000
15,000
20,000
25,000
Q2-01
Q2-02
Q2-03
Q2-04
Q2-05
Q2-06
Q2-07
Q2-08
Q2-09
Q2-10
Q2-11
Q2-12
Q2-13
Q2-14
Q2-15
Q2-16
Q2-17
Q2-18
Q2-19
Q2-20
Q2-21
Real
GDP
($ B
illio
ns 2
012,
SAA
R)
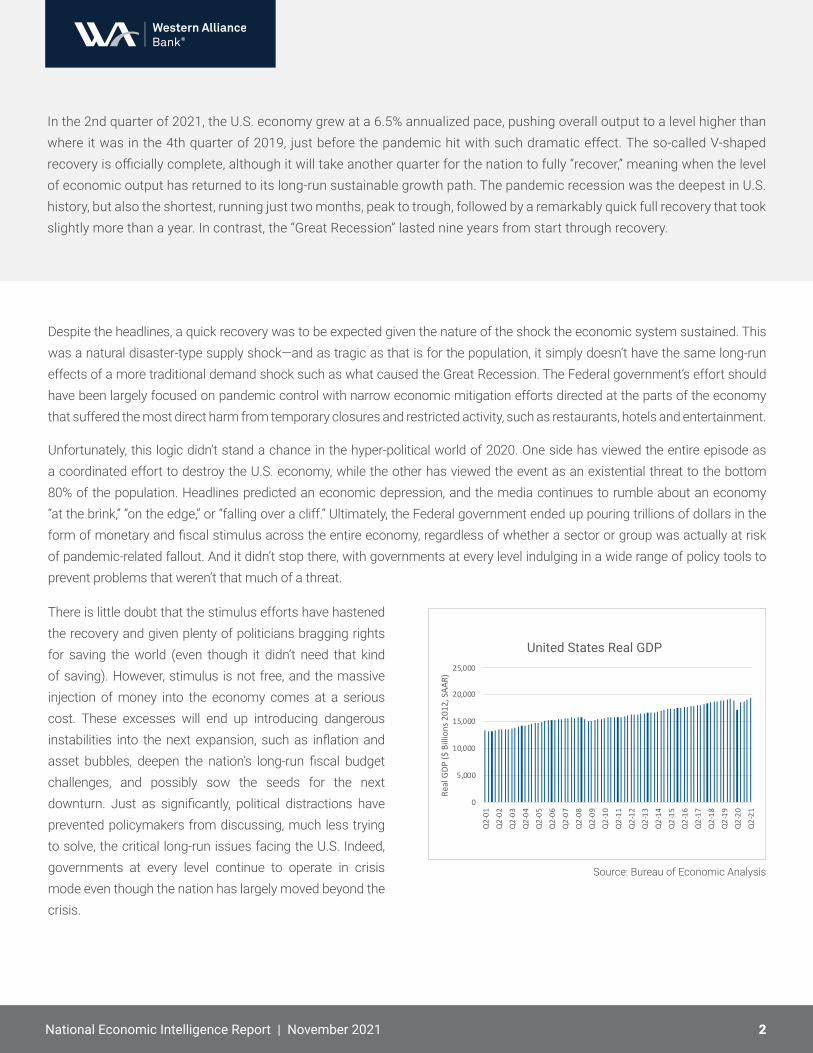
United States Real GDP
In the 2nd quarter of 2021, the U.S. economy grew at a 6.5% annualized pace, pushing overall output to a level higher than where it was in the 4th quarter of 2019, just before the pandemic hit with such dramatic effect. The so-called V-shaped recovery is officially complete, although it will take another quarter for the nation to fully “recover,” meaning when the level of economic output has returned to its long-run sustainable growth path. The pandemic recession was the deepest in U.S. history, but also the shortest, running just two months, peak to trough, followed by a remarkably quick full recovery that took slightly more than a year. In contrast, the “Great Recession” lasted nine years from start through recovery.
National Economic Intelligence Report | November 2021 2
Source: Bureau of Economic Analysis
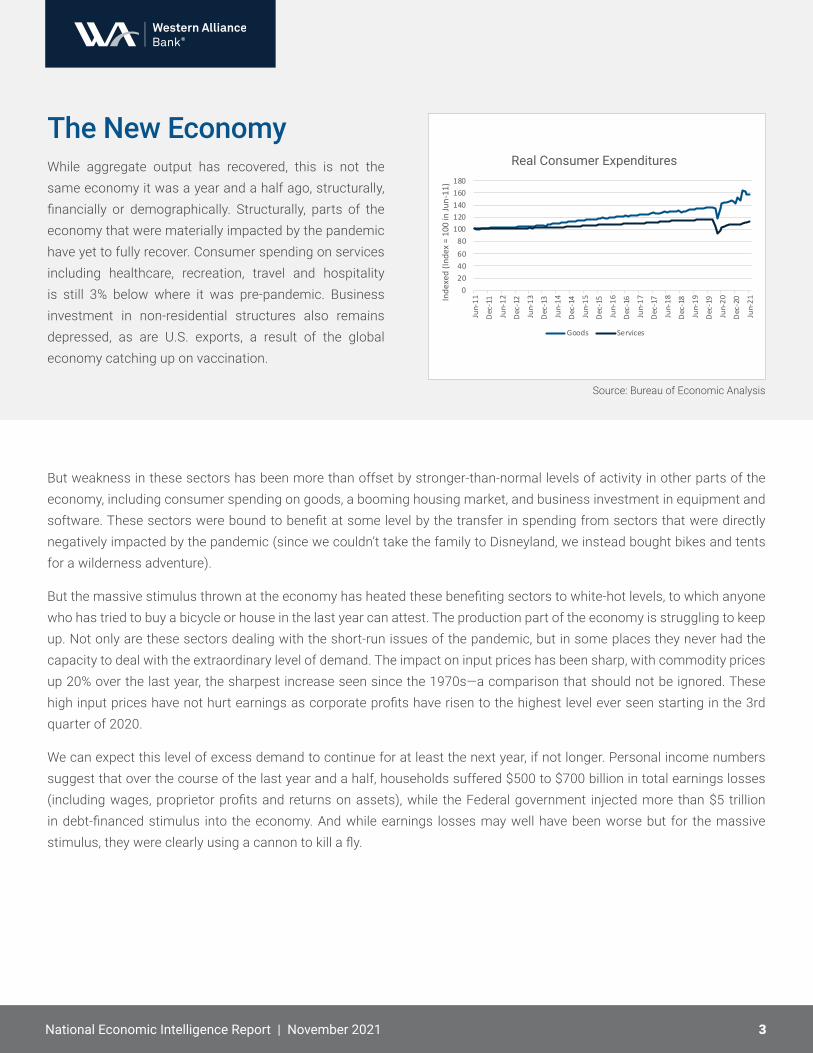
The New EconomyWhile aggregate output has recovered, this is not the same economy it was a year and a half ago, structurally, financially or demographically. Structurally, parts of the economy that were materially impacted by the pandemic have yet to fully recover. Consumer spending on services including healthcare, recreation, travel and hospitality is still 3% below where it was pre-pandemic. Business investment in non-residential structures also remains depressed, as are U.S. exports, a result of the global economy catching up on vaccination.
But weakness in these sectors has been more than offset by stronger-than-normal levels of activity in other parts of the economy, including consumer spending on goods, a booming housing market, and business investment in equipment and software. These sectors were bound to benefit at some level by the transfer in spending from sectors that were directly negatively impacted by the pandemic (since we couldn’t take the family to Disneyland, we instead bought bikes and tents for a wilderness adventure).
But the massive stimulus thrown at the economy has heated these benefiting sectors to white-hot levels, to which anyone who has tried to buy a bicycle or house in the last year can attest. The production part of the economy is struggling to keep up. Not only are these sectors dealing with the short-run issues of the pandemic, but in some places they never had the capacity to deal with the extraordinary level of demand. The impact on input prices has been sharp, with commodity prices up 20% over the last year, the sharpest increase seen since the 1970s—a comparison that should not be ignored. These high input prices have not hurt earnings as corporate profits have risen to the highest level ever seen starting in the 3rd quarter of 2020.
We can expect this level of excess demand to continue for at least the next year, if not longer. Personal income numbers suggest that over the course of the last year and a half, households suffered $500 to $700 billion in total earnings losses (including wages, proprietor profits and returns on assets), while the Federal government injected more than $5 trillion in debt-financed stimulus into the economy. And while earnings losses may well have been worse but for the massive stimulus, they were clearly using a cannon to kill a fly.
020406080
100120140160180
Jun-11
Dec-11
Jun-12
Dec-12
Jun-13
Dec-13
Jun-14
Dec-14
Jun-15
Dec-15
Jun-16
Dec-16
Jun-17
Dec-17
Jun-18
Dec-18
Jun-19
Dec-19
Jun-20
Dec-20
Jun-21In
dexe
d (In
dex
= 10
0 in
Jun-
11)
Real Consumer Expenditures
Goods Services
3
Source: Bureau of Economic Analysis
National Economic Intelligence Report | November 2021
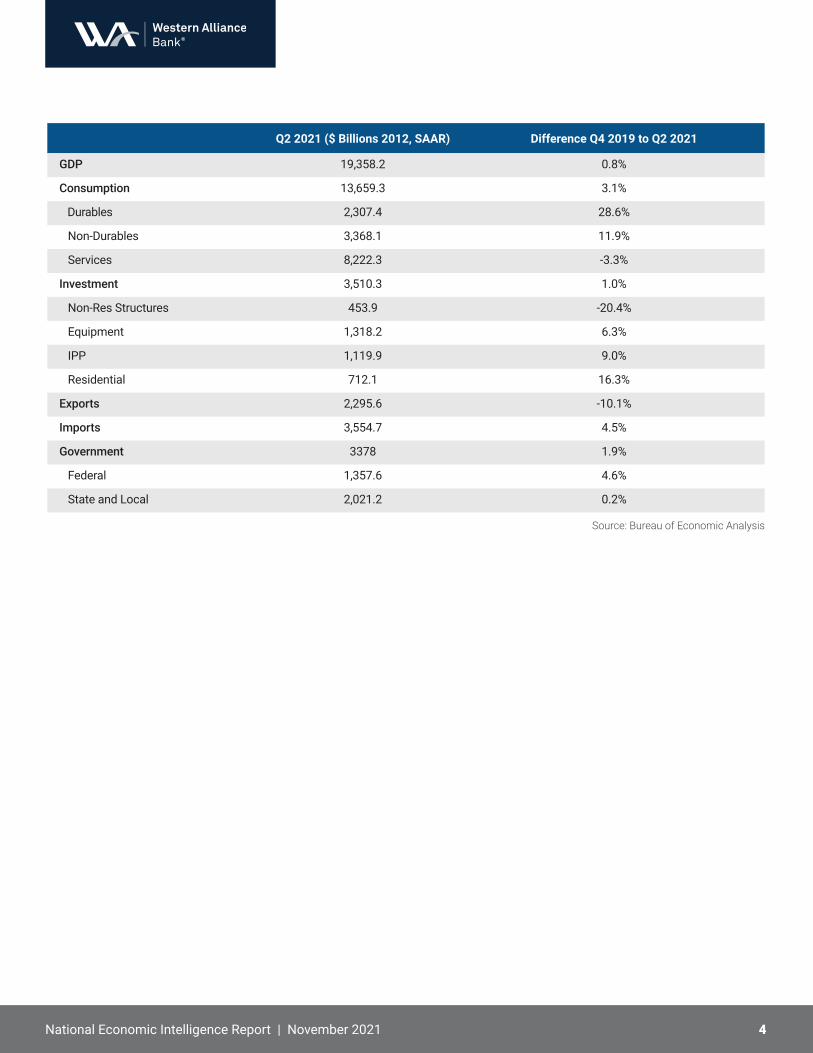
Q2 2021 ($ Billions 2012, SAAR) Difference Q4 2019 to Q2 2021
GDP 19,358.2 0.8%
Consumption 13,659.3 3.1%
Durables 2,307.4 28.6%
Non-Durables 3,368.1 11.9%
Services 8,222.3 -3.3%
Investment 3,510.3 1.0%
Non-Res Structures 453.9 -20.4%
Equipment 1,318.2 6.3%
IPP 1,119.9 9.0%
Residential 712.1 16.3%
Exports 2,295.6 -10.1%
Imports 3,554.7 4.5%
Government 3378 1.9%
Federal 1,357.6 4.6%
State and Local 2,021.2 0.2%
4
Source: Bureau of Economic Analysis
National Economic Intelligence Report | November 2021
5
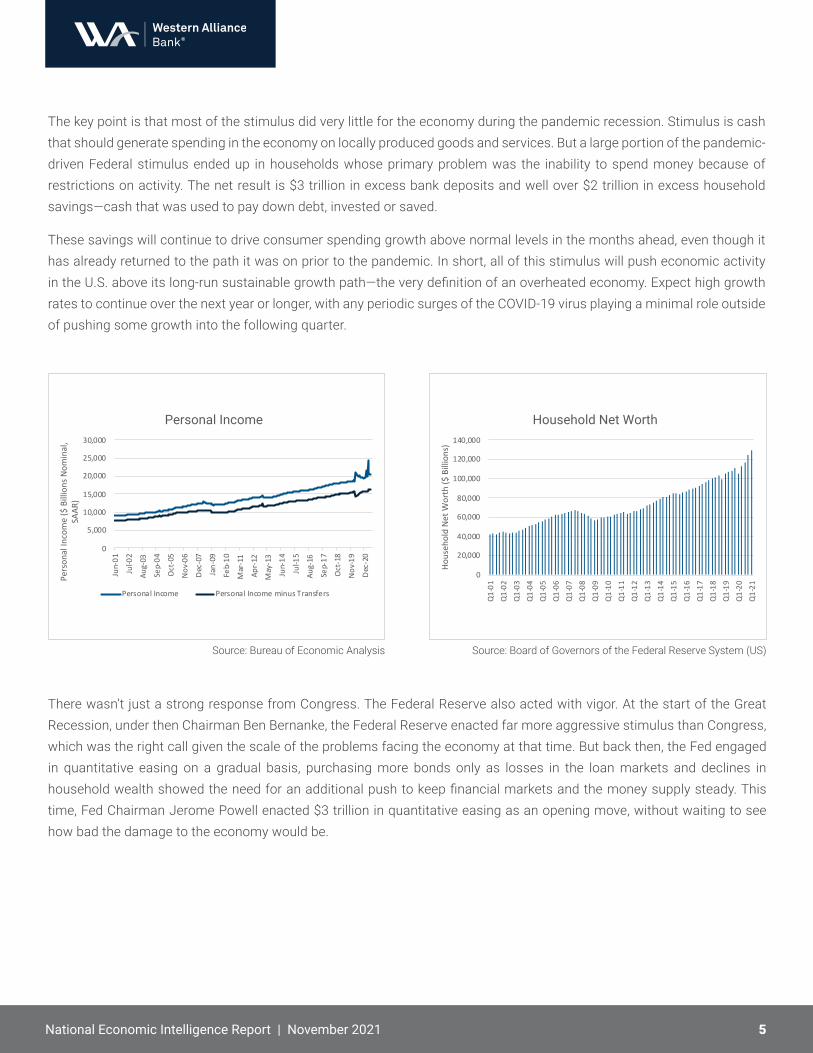
The key point is that most of the stimulus did very little for the economy during the pandemic recession. Stimulus is cash that should generate spending in the economy on locally produced goods and services. But a large portion of the pandemic-driven Federal stimulus ended up in households whose primary problem was the inability to spend money because of restrictions on activity. The net result is $3 trillion in excess bank deposits and well over $2 trillion in excess household savings—cash that was used to pay down debt, invested or saved.
These savings will continue to drive consumer spending growth above normal levels in the months ahead, even though it has already returned to the path it was on prior to the pandemic. In short, all of this stimulus will push economic activity in the U.S. above its long-run sustainable growth path—the very definition of an overheated economy. Expect high growth rates to continue over the next year or longer, with any periodic surges of the COVID-19 virus playing a minimal role outside of pushing some growth into the following quarter.
National Economic Intelligence Report | November 2021
0
5,000
10,000
15,000
20,000
25,000
30,000
Jun-
01
Jul-0
2
Aug-
03
Sep-
04
Oct
-05
Nov
-06
Dec
-07
Jan-
09
Feb-
10
Mar
-11
Apr-
12
May
-13
Jun-
14
Jul-1
5
Aug-
16
Sep-
17
Oct
-18
Nov
-19
Dec
-20
Pers
onal
Inco
me
($ B
illio
ns N
omin
al,
SAAR
)
Personal Income
Personal Income Personal Income minus Transfers
Source: Bureau of Economic Analysis
There wasn’t just a strong response from Congress. The Federal Reserve also acted with vigor. At the start of the Great Recession, under then Chairman Ben Bernanke, the Federal Reserve enacted far more aggressive stimulus than Congress, which was the right call given the scale of the problems facing the economy at that time. But back then, the Fed engaged in quantitative easing on a gradual basis, purchasing more bonds only as losses in the loan markets and declines in household wealth showed the need for an additional push to keep financial markets and the money supply steady. This time, Fed Chairman Jerome Powell enacted $3 trillion in quantitative easing as an opening move, without waiting to see how bad the damage to the economy would be.
0
20,000
40,000
60,000
80,000
100,000
120,000
140,000
Q1-01
Q1-02
Q1-03
Q1-04
Q1-05
Q1-06
Q1-07
Q1-08
Q1-09
Q1-10
Q1-11
Q1-12
Q1-13
Q1-14
Q1-15
Q1-16
Q1-17
Q1-18
Q1-19
Q1-20
Q1-21
Hous
ehol
d N
et W
orth
($ B
illio
ns)
Household Net Worth
Source: Board of Governors of the Federal Reserve System (US)
6
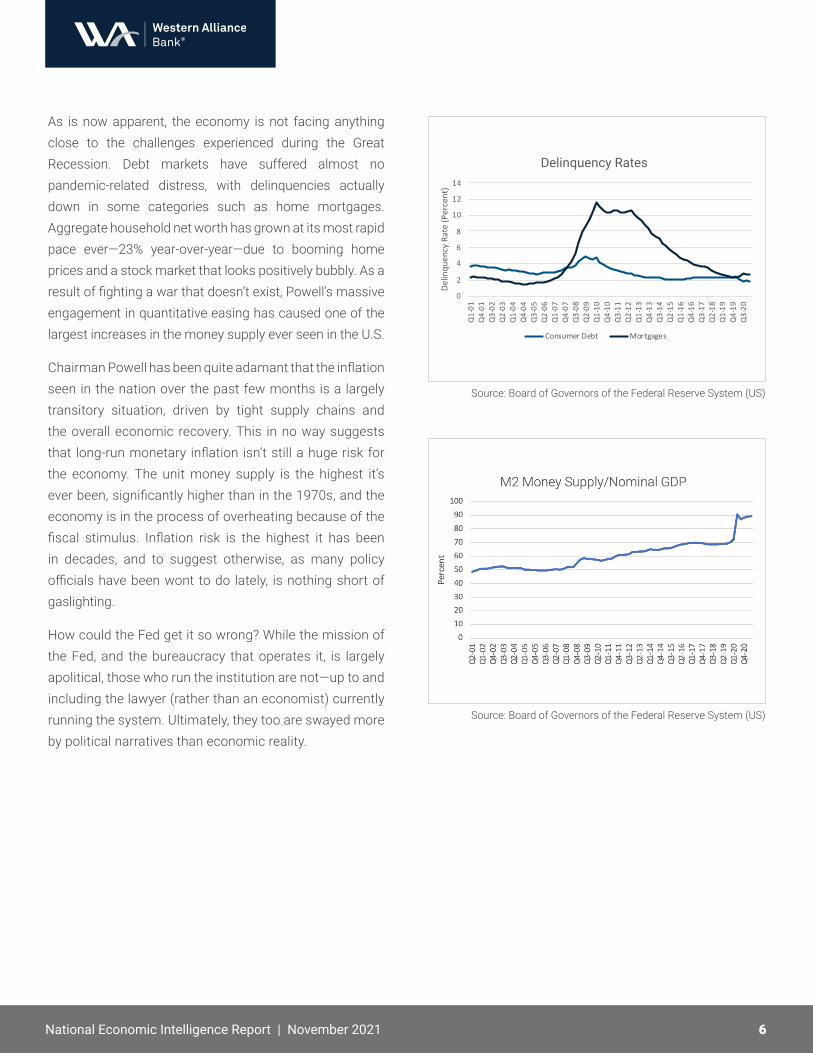
As is now apparent, the economy is not facing anything close to the challenges experienced during the Great Recession. Debt markets have suffered almost no pandemic-related distress, with delinquencies actually down in some categories such as home mortgages. Aggregate household net worth has grown at its most rapid pace ever—23% year-over-year—due to booming home prices and a stock market that looks positively bubbly. As a result of fighting a war that doesn’t exist, Powell’s massive engagement in quantitative easing has caused one of the largest increases in the money supply ever seen in the U.S.
Chairman Powell has been quite adamant that the inflation seen in the nation over the past few months is a largely transitory situation, driven by tight supply chains and the overall economic recovery. This in no way suggests that long-run monetary inflation isn’t still a huge risk for the economy. The unit money supply is the highest it’s ever been, significantly higher than in the 1970s, and the economy is in the process of overheating because of the fiscal stimulus. Inflation risk is the highest it has been in decades, and to suggest otherwise, as many policy officials have been wont to do lately, is nothing short of gaslighting.
How could the Fed get it so wrong? While the mission of the Fed, and the bureaucracy that operates it, is largely apolitical, those who run the institution are not—up to and including the lawyer (rather than an economist) currently running the system. Ultimately, they too are swayed more by political narratives than economic reality.
National Economic Intelligence Report | November 2021
0
2
4
6
8
10
12
14
Q1-
01Q
4-01
Q3-
02Q
2-03
Q1-
04Q
4-04
Q3-
05Q
2-06
Q1-
07Q
4-07
Q3-
08Q
2-09
Q1-
10Q
4-10
Q3-
11Q
2-12
Q1-
13Q
4-13
Q3-
14Q
2-15
Q1-
16Q
4-16
Q3-
17Q
2-18
Q1-
19Q
4-19
Q3-
20
Delin
quen
cy R
ate
(Per
cent
)
Delinquency Rates
Consumer Debt Mortgages
Source: Board of Governors of the Federal Reserve System (US)
Source: Board of Governors of the Federal Reserve System (US)
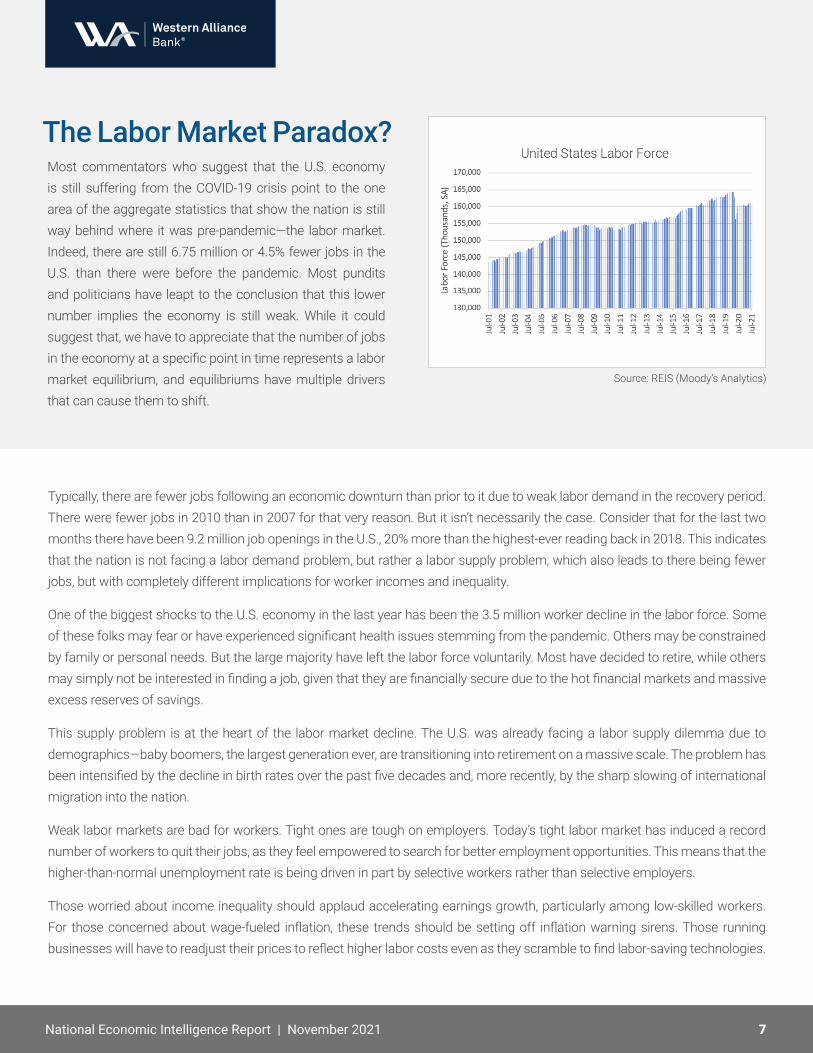
Most commentators who suggest that the U.S. economy is still suffering from the COVID-19 crisis point to the one area of the aggregate statistics that show the nation is still way behind where it was pre-pandemic—the labor market. Indeed, there are still 6.75 million or 4.5% fewer jobs in the U.S. than there were before the pandemic. Most pundits and politicians have leapt to the conclusion that this lower number implies the economy is still weak. While it could suggest that, we have to appreciate that the number of jobs in the economy at a specific point in time represents a labor market equilibrium, and equilibriums have multiple drivers that can cause them to shift.
Typically, there are fewer jobs following an economic downturn than prior to it due to weak labor demand in the recovery period. There were fewer jobs in 2010 than in 2007 for that very reason. But it isn’t necessarily the case. Consider that for the last two months there have been 9.2 million job openings in the U.S., 20% more than the highest-ever reading back in 2018. This indicates that the nation is not facing a labor demand problem, but rather a labor supply problem, which also leads to there being fewer jobs, but with completely different implications for worker incomes and inequality.
One of the biggest shocks to the U.S. economy in the last year has been the 3.5 million worker decline in the labor force. Some of these folks may fear or have experienced significant health issues stemming from the pandemic. Others may be constrained by family or personal needs. But the large majority have left the labor force voluntarily. Most have decided to retire, while others may simply not be interested in finding a job, given that they are financially secure due to the hot financial markets and massive excess reserves of savings.
This supply problem is at the heart of the labor market decline. The U.S. was already facing a labor supply dilemma due to demographics—baby boomers, the largest generation ever, are transitioning into retirement on a massive scale. The problem has been intensified by the decline in birth rates over the past five decades and, more recently, by the sharp slowing of international migration into the nation.
Weak labor markets are bad for workers. Tight ones are tough on employers. Today’s tight labor market has induced a record number of workers to quit their jobs, as they feel empowered to search for better employment opportunities. This means that the higher-than-normal unemployment rate is being driven in part by selective workers rather than selective employers.
Those worried about income inequality should applaud accelerating earnings growth, particularly among low-skilled workers. For those concerned about wage-fueled inflation, these trends should be setting off inflation warning sirens. Those running businesses will have to readjust their prices to reflect higher labor costs even as they scramble to find labor-saving technologies.
7
Source: REIS (Moody’s Analytics)
National Economic Intelligence Report | November 2021
The Labor Market Paradox?
The Law of GravityEconomies can only stay overheated when there is a fuel source fueling the flames. While there are few signs of a balanced budget coming out of Washington, D.C., anytime soon, the nation’s current spending binge is clearly unsustainable. Eventually the U.S. will be forced to back off on its borrowing-fueled fiscal stimulus. Bank accounts will start to shrink back towards normal levels, and the nation will experience sharply slowing growth rates.
The interaction between excessive monetary and fiscal stimulus is of serious concern. One reason the Federal government has not yet suffered the consequences of its borrowing binge is because the cost of borrowing has remained remarkably low. This has occurred despite the inflation surge seen in the last few months and the huge buildup in the money supply, which suggests more inflation to come. But history tells us that bond markets are shockingly slow in reacting to inflation, and generally don’t until the market is being pummeled by inflation-driven losses.
The two issues, a sharp slowdown in growth following the stimulus and inflation, will lead to that unpleasant economic condition known as stagflation and will almost assuredly drive a re-pricing in the similarly overheated equity markets. But this will lead to a spike in debt costs for the Federal government, creating budget problems. And ultimately the Fed will have to shrink the money supply to try and get price growth under control.
Will this be enough to set off another recession not unlike the early 1980s when then Chairman of the Federal Reserve Paul Volcker waged his fight against inflation? Very possibly, but much will depend on the path that policymakers take in the coming months. The near-term forecast boils down to this: expect a great run over the next couple of years, with the major constraint being the ability to find the workforce to manage demand.
8National Economic Intelligence Report | November 2021
westernalliancebank.com
Divisions of Western Alliance Bank, Member FDIC.
Beacon Economics, LLC is a leading provider of economic research, forecasting, industry analysis, and data services. By delivering independent, rigorous analysis we give our clients the knowledge they need to make the right strategic decisions about investment, growth, revenue, and policy. For more information, please visit www.BeaconEcon.com
Prepared By Beacon Economics
Western Alliance Bank is one of the country’s top-performing financial institutions. Western Alliance is unique because we offer businesses the best of both worlds: the resources and sophisticated services and solutions of a national bank along with the flexibility, commitment and market knowledge of a bank with strong regional roots.
• Economic, revenue & occupational forecasting
• Economic impact analysis
• Regional economic analysis• Economic policy analysis• Real estate market analysis
• Industry and market analysis• EB-5 Economic analysis• Public Speaking
• Expert Testimony
Services
©2021 Beacon Economics, LLC. All rights reserved.