Embed Size (px)
Citation preview
NI 43-101 Technical Report Hardrock Project Ontario, Canada
Prepared for:
Premier Gold Mines Limited
1100 Russell Street, Suite 200
Thunder Bay, Ontario P7B 5N2
Prepared by:
G Mining Services Inc. D200, 7900, Taschereau Blvd. Brossard, Québec, J4X 1C2
Effective Date: December 16, 2020
Issue Date: January 26, 2021
Louis-Pierre Gignac, P.Eng., G Mining Services Inc. Réjean Sirois, P.Eng., G Mining Services Inc.
James Purchase, P.Geo., G Mining Services Inc. Michael Franceschini, P.Eng., Ausenco Engineering Canada Inc.
Tommaso Raponi, P.Eng., Ausenco Engineering Canada Inc. Michelle Fraser, P. Geo., Stantec Consulting Ltd.
David Ritchie, P.Eng., SLR Consulting Ltd. Mickey M. Davachi, P.Eng., Wood plc
Pierre Roy, P.Eng., Soutex Inc.

NI 43-101 Technical Report Feasibility Study Update Hardrock Project, Ontario, Canada
IMPORTANT NOTE
This Report was prepared as a National Instrument 43-101 Technical Report, in accordance with
Form 43-101F1, for Premier Gold Mines Limited (“Premier”) by G Mining Services Inc. (“GMS”) and Wood
Canada Limited. The quality of information, conclusions, and estimates contained herein is based on:
i) information available at the time of preparation, ii) data supplied by outside sources, and iii) the
assumptions, conditions, and qualifications set forth in this Report.
NI 43-101 Technical Report Feasibility Study Update Hardrock Project, Ontario, Canada
Qualified Persons
Prepared by:
(signed and sealed) “Louis-Pierre Gignac” Date: January 26, 2021
Louis-Pierre Gignac, P.Eng. Co-President G Mining Services Inc.
(signed and sealed) “Réjean Sirois” Date: January 26, 2021
Réjean Sirois, P.Eng. Vice-President, Geology & Resources G Mining Services Inc.
(signed and sealed) “James Purchase” Date: January 26, 2021
James Purchase, P.Geo. Director, Geology & Resources G Mining Services Inc
(signed and sealed) “Michael Franceschini” Date: January 26, 2021
Michael Franceschini, P.Eng. Engineering Manager Ausenco Engineering Canada Inc.
(signed and sealed) “Tommaso Raponis” Date: January 26, 2021
Tommaso Raponi, P.Eng. Principal Metallurgist Ausenco Engineering Canada Inc.
NI 43-101 Technical Report Feasibility Study Update Hardrock Project, Ontario, Canada
Prepared by:
(signed and sealed) “Michelle Fraser” Date: January 26, 2021
Michelle Fraser, P.Geo. Hydrologist, National Technical Leader Stantec Consulting Ltd.
(signed and sealed) “David Ritchie” Date: January 26, 2021
David Ritchie, P.Eng. Title SLR Consulting Ltd.
(signed and sealed) “Mickey M. Davachi” Date: January 26, 2021
Mickey M. Davachi, P.Eng. Title Wood plc
(signed and sealed) “Pierre Roy” Date: January 26, 2021
Pierre Roy, P.Eng. Sr. Metallurgist-Mineral Processing Specialist Soutex Inc.
NI 43-101 Technical Report Feasibility Study Update Hardrock Project, Ontario, Canada
Table of Contents January 2021 Page i
Table of Contents SUMMARY .......................................................................................................... 1-1
1.1 Introduction ............................................................................................................. 1-1
1.2 Property Description and Land Tenure ................................................................... 1-2
1.3 Mineral Resource Estimate ..................................................................................... 1-2
1.3.1 Hardrock Project ...................................................................................................... 1-2 1.3.2 Other Greenstone Gold Deposits ............................................................................ 1-5
1.4 Mineral Reserves .................................................................................................... 1-6
1.5 Mining ..................................................................................................................... 1-7
1.6 Mineral Processing and Metallurgical Testing ........................................................ 1-9
1.7 Mine Infrastructure and Services .......................................................................... 1-10
1.8 Water Management .............................................................................................. 1-13
1.9 Tailings Management Facility ............................................................................... 1-14
1.10 Environmental Studies .......................................................................................... 1-14
1.11 Execution Plan ...................................................................................................... 1-16
1.12 Capital Cost Estimate ........................................................................................... 1-16
1.13 Operating Cost Estimate ....................................................................................... 1-17
1.14 Economic Analysis ................................................................................................ 1-18
1.15 Interpretation and Conclusions ............................................................................. 1-21
1.16 Risks and Opportunities ........................................................................................ 1-25
1.17 Recommendations ................................................................................................ 1-27
1.17.1 Exploration and Geology ....................................................................................... 1-27 1.17.2 Detailed Engineering Phase .................................................................................. 1-28
INTRODUCTION ................................................................................................. 2-1
2.1 Sources of Information and Data ............................................................................ 2-3
2.2 Site Visit .................................................................................................................. 2-3
2.3 TMF Site Visits ........................................................................................................ 2-4
2.4 Units of Measure, Abbreviations and Nomenclature ............................................... 2-4
RELIANCE ON OTHER EXPERTS ..................................................................... 3-1
PROPERTY DESCRIPTION AND LOCATION ................................................... 4-1
4.1 Location and Access ............................................................................................... 4-1
4.2 Property Description ............................................................................................... 4-1
4.3 Hardrock Project Area ............................................................................................. 4-3
NI 43-101 Technical Report Feasibility Study Update Hardrock Project, Ontario, Canada
Table of Contents January 2021 Page ii
4.3.1 Hardrock Properties ................................................................................................. 4-3 4.3.2 Hardrock Agreement Overview ............................................................................... 4-4 4.3.3 Greenstone Gold Property Partnerships ................................................................. 4-5 4.3.4 Agreement with Tombill Mines ................................................................................ 4-6
4.4 Brookbank Project Area .......................................................................................... 4-6
4.4.1 Brookbank Agreements ........................................................................................... 4-7 4.5 Viper Project Area ................................................................................................... 4-7
4.6 Permits .................................................................................................................... 4-7
ACCESSIBILITY, CLIMATE, LOCAL RESOURCES, INFRASTRUCTURE AND PHYSIOGRAPHY ................................................................................................ 5-1
5.1 Accessibility ............................................................................................................ 5-1
5.1.1 Hardrock .................................................................................................................. 5-1 5.1.2 Brookbank / Key Lake / Kailey / Viper ..................................................................... 5-3
5.2 Climate .................................................................................................................... 5-3
5.3 Local Resources ..................................................................................................... 5-3
5.4 Infrastructure ........................................................................................................... 5-4
5.4.1 Water ....................................................................................................................... 5-6 5.4.2 Sewage .................................................................................................................... 5-6
5.5 Physiography .......................................................................................................... 5-6
5.6 Topography and Vegetation .................................................................................... 5-6
HISTORY ............................................................................................................. 6-1
6.1 Exploration History .................................................................................................. 6-1
6.2 Brookbank ............................................................................................................. 6-16
6.2.1 Exploration History ................................................................................................. 6-16 6.2.2 Production History ................................................................................................. 6-21 6.2.3 Previous Resource Estimates ............................................................................... 6-21
6.3 Key Lake ............................................................................................................... 6-22
6.3.1 Exploration History ................................................................................................. 6-22 6.3.2 Production History ................................................................................................. 6-23 6.3.3 Previous Resource Estimates ............................................................................... 6-23
6.4 Kailey (“Little Long Lac”) ....................................................................................... 6-23
6.4.1 Exploration History ................................................................................................. 6-23 6.4.2 Production History ................................................................................................. 6-24 6.4.3 Previous Resource Estimates ............................................................................... 6-25
GEOLOGICAL HISTORY AND MINERALIZATION ........................................... 7-1
7.1 Hardrock Regional Geological Setting .................................................................... 7-1
7.2 Property Geology .................................................................................................... 7-5
7.3 Alteration ............................................................................................................... 7-10
7.4 Mineralization ........................................................................................................ 7-11
NI 43-101 Technical Report Feasibility Study Update Hardrock Project, Ontario, Canada
Table of Contents January 2021 Page iii
7.4.1 Identification of Gold Mineralization ....................................................................... 7-12 7.4.2 Style of Gold Mineralization ................................................................................... 7-17 7.4.3 Mineralization by Zone ........................................................................................... 7-20
7.5 Other Greenstone Gold Property Deposits (Brookbank, Key Lake and Kailey) .... 7-23
7.5.1 Regional Geological Setting .................................................................................. 7-23 7.5.2 Brookbank Project Local Geology ......................................................................... 7-23 7.5.3 Brookbank Project Mineralization .......................................................................... 7-24 7.5.4 Key Lake Project Local Geology ........................................................................... 7-26 7.5.5 Key Lake Project Mineralization ............................................................................ 7-27 7.5.6 Kailey Project Local Geology ................................................................................. 7-29 7.5.7 Kailey Project Mineralization ................................................................................. 7-31
DEPOSIT TYPES ................................................................................................ 8-1
8.1 Hydrothermal IF-Hosted Gold Deposits .................................................................. 8-1
8.1.1 Non-Stratiform Type ................................................................................................ 8-1 8.1.2 Greenstone-Hosted Quartz-Carbonate Vein Deposits ............................................ 8-2
8.2 Other Greenstone Gold Deposits ............................................................................ 8-5
8.2.1 Brookbank ................................................................................................................ 8-5 8.2.2 Key Lake .................................................................................................................. 8-6 8.2.3 Kailey ....................................................................................................................... 8-6
AEXPLORATION ................................................................................................ 9-1
9.1 Hardrock Property ................................................................................................... 9-1
9.2 Other Properties ...................................................................................................... 9-2
9.2.1 Brookbank ................................................................................................................ 9-2 9.2.2 Kailey and Key Lake ................................................................................................ 9-2
DRILLING .......................................................................................................... 10-1
10.1 Hardrock ............................................................................................................... 10-1
10.1.1 Collar Locations, Orientations and Down Hole Surveys ........................................ 10-2 10.1.2 Core Marking and Logging Procedures ................................................................. 10-2
10.1.2.1 RC Chip Logging Procedures ............................................................ 10-3 10.1.3 Drilling and Re-sampling Included in the 2016 Mineral Resource Estimate ......... 10-3 10.1.4 2018 RC Grade Control and Blasthole Drill Program ............................................ 10-7 10.1.5 2019 Drill Program ................................................................................................. 10-8 10.1.6 QP Opinion on Drilling – Hardrock Project .......................................................... 10-11
10.2 Other Greenstone Gold Property Deposits Brookbank, Kailey (Little Long Lac) and Key Lake ..................................................................................................... 10-11
10.2.1 Drilling Procedures .............................................................................................. 10-12 10.2.2 Collar Locations, Orientations and Down Hole Surveys ...................................... 10-12 10.2.3 Core Logging and Sampling ................................................................................ 10-13 10.2.4 Brookbank ............................................................................................................ 10-14
10.2.4.1 Summary of Drilling Campaigns ....................................................... 10-14 10.2.5 Kailey (“Little Long Lac”) ...................................................................................... 10-17
10.2.5.1 Drilling Campaigns ........................................................................... 10-17
NI 43-101 Technical Report Feasibility Study Update Hardrock Project, Ontario, Canada
Table of Contents January 2021 Page iv
10.2.6 Key Lake .............................................................................................................. 10-18 10.2.6.1 Drilling Campaigns ........................................................................... 10-18
10.2.7 QP Opinion on Drilling – Brookbank, Kailey and Key Lake ................................. 10-19 SAMPLE PREPARATION, ANALYSES AND SECURITY ................................ 11-1
11.1 Hardrock ............................................................................................................... 11-1
11.1.1 Laboratory Accreditation and Certification ............................................................. 11-1 11.1.2 GGM Sampling and Security ................................................................................. 11-1
11.1.2.1 RCGC Sampling ................................................................................. 11-1 11.1.2.2 DDH Sampling .................................................................................... 11-3 11.1.2.3 Quality Control (“QC”) Sample Preparation by GGM ......................... 11-4
11.1.3 Assay Procedure - Sample Preparation and Analysis ........................................... 11-5 11.1.3.1 Fire Assay Sample Preparation (Actlabs Geraldton) ......................... 11-5 11.1.3.2 Metallic Sieve Sample Preparation (Actlabs Geraldton) .................... 11-5 11.1.3.3 Fire Assay Procedures (Actlabs Geraldton) ....................................... 11-6 11.1.3.4 Fire Assay Procedures with Gravimetric or Atomic Absorption Finish
(ALS-Chemex Thunder Bay) .......................................................................... 11-6 11.1.4 Quality Control Results – 2012 to 2016 ................................................................. 11-7
11.1.4.1 Blanks ................................................................................................. 11-9 11.1.4.2 Certified Reference Material (Standards) ........................................ 11-11 11.1.4.3 Coarse Reject Duplicates ................................................................. 11-13
11.1.5 Quality Control Results – 2018 and 2019 Drilling Programs ............................... 11-15 11.1.5.1 Blanks ............................................................................................... 11-16 11.1.5.2 Certified Reference Material (“CRMs” or Standards) ....................... 11-17 11.1.5.3 RC Field Duplicates and ¼ Core Duplicates .................................... 11-21
11.1.6 QP Conclusions ................................................................................................... 11-25 11.2 Brookbank, Kailey and Key Lake Deposits ......................................................... 11-25
11.2.1 Historical Sampling Procedures and QA/QC (Pre-Premier Gold Involvement) ... 11-25 11.2.1.1 Brookbank ........................................................................................ 11-25 11.2.1.2 Kailey ................................................................................................ 11-33 11.2.1.3 Key Lake .......................................................................................... 11-33
11.2.2 Premier Sampling Procedures and QA/QC ......................................................... 11-40 11.2.2.1 Protocols Before Sample Dispatch .................................................. 11-40 11.2.2.2 Sample Preparation and Analysis .................................................... 11-41 11.2.2.3 Quality Assurance / Quality Control ................................................. 11-41 11.2.2.4 Security ............................................................................................ 11-49
11.2.3 QP Conclusions ................................................................................................... 11-50 DATA VERIFICATION ....................................................................................... 12-1
12.1 Hardrock Data Verification .................................................................................... 12-1
12.1.1 Data Verification for the 2016 MRE ....................................................................... 12-1 12.1.1.1 Historical Work ................................................................................... 12-1 12.1.1.2 GGM Database .................................................................................. 12-1 12.1.1.3 Greenstone Gold Mines Diamond Drilling .......................................... 12-2 12.1.1.4 GGM Logging, Sampling and Assaying Procedures .......................... 12-3 12.1.1.5 Independent Re-sampling .................................................................. 12-4 12.1.1.6 Mined-out Voids ................................................................................. 12-6
NI 43-101 Technical Report Feasibility Study Update Hardrock Project, Ontario, Canada
Table of Contents January 2021 Page v
12.1.1.7 Conclusion .......................................................................................... 12-8 12.1.2 Data Verification for the 2019 MRE ....................................................................... 12-8
12.1.2.1 2019 MRE Drilling Database .............................................................. 12-9 12.1.2.2 Mined-Out Voids Model Update ....................................................... 12-11
12.1.3 Data Validation Conclusions and Recommendations – Hardrock Deposit ......... 12-14 12.2 Brookbank, Kailey and Key Lake Data Verification ............................................. 12-15
12.2.1 Recent Site Visit .................................................................................................. 12-15 12.2.2 Independent Repeat Analyses ............................................................................ 12-16 12.2.3 Database Validation ............................................................................................. 12-17 12.2.4 Underground Void Models ................................................................................... 12-18 12.2.5 Data Verification Conclusions and Recommendations – Brookbank, Kailey and Key
Lake ..................................................................................................................... 12-20 12.3 Data Verification for Tailings Management Facility ............................................. 12-20
MINERAL PROCESSING AND METALLURGICAL TESTING ......................... 13-1
13.1 Previous Test Work ............................................................................................... 13-1
13.1.1 Gold Recovery Test Work at SGS Lakefield (Phase 1) ......................................... 13-1 13.1.1.1 Head Assays ...................................................................................... 13-1 13.1.1.2 Mineralogy .......................................................................................... 13-2 13.1.1.3 Grindability Test Work ........................................................................ 13-3 13.1.1.4 Gravity Separation ............................................................................. 13-4 13.1.1.5 Flotation .............................................................................................. 13-4 13.1.1.6 Cyanidation ........................................................................................ 13-5
13.1.2 Gold Recovery Test Work at SGS Lakefield (Phase 2) ......................................... 13-7 13.1.2.1 Head Assays ...................................................................................... 13-8 13.1.2.2 Mineralogy .......................................................................................... 13-8 13.1.2.3 Grindability Test Work ........................................................................ 13-8 13.1.2.4 Gravity Recoverable Gold .................................................................. 13-9 13.1.2.5 Gravity Separation ............................................................................. 13-9 13.1.2.6 Flotation .............................................................................................. 13-9 13.1.2.7 Pressure Oxidation ........................................................................... 13-10 13.1.2.8 Cyanidation ...................................................................................... 13-11
13.1.3 Whole Ore Cyanidation Testing at McClelland .................................................... 13-11 13.1.3.1 Results ............................................................................................. 13-12
13.1.4 QEM Rapid Mineral Scan at SGS ....................................................................... 13-13 13.2 Feasibility Study Test Work ................................................................................ 13-14
13.2.1 Grindability Test Work ......................................................................................... 13-14 13.2.1.1 Grindability Tests Results ................................................................ 13-14
13.2.2 Characterization and Recovery Test Work .......................................................... 13-18 13.2.2.1 Characterization and Recovery Tests Results ................................. 13-19
13.2.3 Thickening and Rheology Tests .......................................................................... 13-29 13.2.3.1 Thickening and Rheology Results.................................................... 13-29
13.2.4 HPGR Test Work ................................................................................................. 13-30 13.2.4.1 Labwal Tests Results ....................................................................... 13-31 13.2.4.2 Atwal Tests Results .......................................................................... 13-32 13.2.4.3 Bond Ball Mill Grindability Tests Results ......................................... 13-33
NI 43-101 Technical Report Feasibility Study Update Hardrock Project, Ontario, Canada
Table of Contents January 2021 Page vi
13.2.4.4 Pilot Plant Tests Results .................................................................. 13-34 13.3 Detailed Engineering Test Work ......................................................................... 13-36
13.3.1 Characterization and Recovery Test Work .......................................................... 13-36 13.3.1.1 Characterization and Recovery Tests Results ................................. 13-37
13.4 Conclusions and Recommendations .................................................................. 13-42
13.4.1 Grinding ............................................................................................................... 13-42 13.4.2 High-Pressure Grinding ....................................................................................... 13-43 13.4.3 Magnetic Separation ............................................................................................ 13-43 13.4.4 Gravity Recovery ................................................................................................. 13-43 13.4.5 Flotation ............................................................................................................... 13-43 13.4.6 Pressure Oxidation .............................................................................................. 13-43 13.4.7 Cyanidation .......................................................................................................... 13-44 13.4.8 Cyanide Destruction ............................................................................................ 13-44 13.4.9 Solid-Liquid Separation and Rheology ................................................................ 13-44
13.5 Future Work ........................................................................................................ 13-44
MINERAL RESOURCE ESTIMATES ................................................................ 14-1
14.1 Hardrock Mineral Resource Estimate ................................................................... 14-1
14.1.1 Drill Hole Database ................................................................................................ 14-2 14.1.2 Geological Modelling Approach ............................................................................. 14-5
14.1.2.1 Principal Mineralization Domains ....................................................... 14-6 14.1.2.2 Internal Sub-domain Grade Shells ..................................................... 14-9 14.1.2.3 External Grade Shells ...................................................................... 14-11 14.1.2.4 Structural Domain Subdivisions ....................................................... 14-12 14.1.2.5 Topographic and Bedrock Surfaces ................................................. 14-12
14.1.3 Assay Capping and Compositing ........................................................................ 14-12 14.1.3.1 High-grade Capping ......................................................................... 14-12 14.1.3.2 Arsenic and Sulfur Database ........................................................... 14-12 14.1.3.3 Compositing ..................................................................................... 14-16
14.1.4 Variography ......................................................................................................... 14-19 14.1.5 Search Ellipsoids ................................................................................................. 14-21 14.1.6 Domain Boundaries ............................................................................................. 14-23 14.1.7 Treatment of High Grades ................................................................................... 14-25 14.1.8 Bulk Density Data ................................................................................................ 14-27 14.1.9 Block Model ......................................................................................................... 14-29 14.1.10 Grade Estimation ................................................................................................. 14-30 14.1.11 Block Model Validation ........................................................................................ 14-32
14.1.11.1 Visual Validation – Composite Grades vs. Block Grades ................ 14-33 14.1.11.2 Global Statistical Validation .............................................................. 14-33 14.1.11.3 Local Statistical Validation - Swath Plots ......................................... 14-35 14.1.11.4 Grade Smoothing / Conditional Bias Validations ............................. 14-36 14.1.11.5 Sensitivity Grade Estimations .......................................................... 14-36 14.1.11.6 Discussion on Block Model Validation ............................................. 14-37
14.1.12 Mineral Resource Classification .......................................................................... 14-37 14.1.12.1 Mineral Resource Classification Definition ....................................... 14-37 14.1.12.2 Resource Classification for the Hardrock Project ............................ 14-38
NI 43-101 Technical Report Feasibility Study Update Hardrock Project, Ontario, Canada
Table of Contents January 2021 Page vii
14.1.13 In-Pit Constrained Mineral Resources (Inclusive of Mineral Reserves) .............. 14-40 14.1.14 Underground Mineral Resources ......................................................................... 14-43 14.1.15 Mineral Resource Sensitivity ............................................................................... 14-44 14.1.16 Summary of the 2019 Hardrock Mineral Resource ............................................. 14-47 14.1.17 Comparison with the Previous Estimate .............................................................. 14-49 14.1.18 2019 In-Pit Constrained Mineral Resources (Exclusive of Mineral Reserves) .... 14-51 14.1.19 Underground Mineral Resources (Exclusive of Mineral Reserves) ..................... 14-53
14.2 Brookbank, Kailey and Key Lake Deposits Mineral Resource Estimates ........... 14-53
14.2.1 Brookbank Deposit .............................................................................................. 14-53 14.2.1.1 Drill Hole Database .......................................................................... 14-53 14.2.1.2 Topography ...................................................................................... 14-54 14.2.1.3 Geological Modelling Approach ....................................................... 14-54 14.2.1.4 Assay Capping and Compositing ..................................................... 14-56 14.2.1.5 Variography ...................................................................................... 14-58 14.2.1.6 Block Modelling ................................................................................ 14-59 14.2.1.7 Bulk Density Data ............................................................................. 14-60 14.2.1.8 Search Ellipsoids and High-grade Restraining ................................ 14-61 14.2.1.9 Grade Interpolation .......................................................................... 14-62 14.2.1.10 Block Model Validation ..................................................................... 14-63 14.2.1.11 Determination of Mineral Resources (Open Pit Shell vs. Underground) –
All Deposits ................................................................................................... 14-64 14.2.1.12 Resource Categorization .................................................................. 14-67 14.2.1.13 Mineral Resource Statement ............................................................ 14-68 14.2.1.14 Mineral Resource Sensitivity ............................................................ 14-69 14.2.1.15 QP Commentary............................................................................... 14-70
14.2.2 Key Lake .............................................................................................................. 14-71 14.2.2.1 Drill hole Database ........................................................................... 14-71 14.2.2.2 Topography ...................................................................................... 14-71 14.2.2.3 Geological Modelling Approach ....................................................... 14-71 14.2.2.4 Assay Capping and Compositing ..................................................... 14-73 14.2.2.5 Variography ...................................................................................... 14-76 14.2.2.6 Block Modelling ................................................................................ 14-77 14.2.2.7 Bulk Density Data ............................................................................. 14-78 14.2.2.8 Search Ellipsoids .............................................................................. 14-78 14.2.2.9 Grade Interpolation .......................................................................... 14-79 14.2.2.10 Block Model Validation ..................................................................... 14-80 14.2.2.11 Determination of Mineral Resources (Open Pit Shell vs. Underground)
14-82 14.2.2.12 Underground Voids .......................................................................... 14-83 14.2.2.13 Resource Categorization .................................................................. 14-83 14.2.2.14 Mineral Resource Statement ............................................................ 14-84 14.2.2.15 Mineral Resource Sensitivity ............................................................ 14-85 14.2.2.16 QP Commentary............................................................................... 14-86
14.2.3 Kailey Deposit ...................................................................................................... 14-86 14.2.3.1 Drill hole Database ........................................................................... 14-87 14.2.3.2 Topography ...................................................................................... 14-87 14.2.3.3 Geological Modelling Approach ....................................................... 14-87
NI 43-101 Technical Report Feasibility Study Update Hardrock Project, Ontario, Canada
Table of Contents January 2021 Page viii
14.2.3.4 Assay Capping and Compositing ..................................................... 14-89 14.2.3.5 Variography ...................................................................................... 14-91 14.2.3.6 Block Modelling ................................................................................ 14-92 14.2.3.7 Bulk Density Data ............................................................................. 14-93 14.2.3.8 Search Ellipsoids .............................................................................. 14-94 14.2.3.9 Grade Interpolation .......................................................................... 14-95 14.2.3.10 Determination of Mineral Resources (Open Pit Shell vs. Underground)
14-96 14.2.3.11 Underground Voids .......................................................................... 14-97 14.2.3.12 Resource Categorization .................................................................. 14-98 14.2.3.13 Mineral Resource Statement ............................................................ 14-99 14.2.3.14 Mineral Resource Sensitivity .......................................................... 14-100 14.2.3.15 QP Commentary............................................................................. 14-101
MINERAL RESERVE ESTIMATES ................................................................... 15-1
15.1 Summary ............................................................................................................... 15-1
15.2 Resource Block Model .......................................................................................... 15-1
15.3 Pit Optimization ..................................................................................................... 15-2
15.3.1 Pit Slope Geotechnical Assessment ...................................................................... 15-2 15.3.2 Mining Dilution and Ore Loss ................................................................................ 15-3 15.3.3 Pit Optimization Parameters .................................................................................. 15-4 15.3.4 Cut-Off Grades ...................................................................................................... 15-5 15.3.5 Open Pit Optimization Results ............................................................................... 15-7
15.4 Mine Design ........................................................................................................ 15-10
15.4.1 Underground Voids .............................................................................................. 15-10 15.4.2 Ramp Design Criteria .......................................................................................... 15-10 15.4.3 Open Pit Mine Design Results ............................................................................. 15-11
15.5 Mineral Reserve Statement ................................................................................ 15-13
MINING METHODS ........................................................................................... 16-1
16.1 Introduction ........................................................................................................... 16-1
16.2 Mine Designs ........................................................................................................ 16-1
16.2.1 Open Pit Phases .................................................................................................... 16-1 16.2.2 Overburden and Waste Rock Storage ................................................................... 16-9 16.2.3 Ore Stockpiles ..................................................................................................... 16-10 16.2.4 Mine Haul Roads ................................................................................................. 16-10
16.3 Production Schedule ........................................................................................... 16-11
16.4 Mine Operations and Equipment Selection ......................................................... 16-20
16.4.1 Mine Operations Approach .................................................................................. 16-20 16.4.2 Production Drilling and Blasting ........................................................................... 16-20 16.4.3 Grade Control ...................................................................................................... 16-22 16.4.4 Pre-Split ............................................................................................................... 16-23 16.4.5 Loading ................................................................................................................ 16-24 16.4.6 Hauling ................................................................................................................. 16-27 16.4.7 Dewatering ........................................................................................................... 16-32
NI 43-101 Technical Report Feasibility Study Update Hardrock Project, Ontario, Canada
Table of Contents January 2021 Page ix
16.4.8 Road and Dump Maintenance ............................................................................. 16-32 16.4.9 Support Equipment .............................................................................................. 16-33 16.4.10 Mine Maintenance ............................................................................................... 16-33 16.4.11 Mine Management and Technical Services ......................................................... 16-33 16.4.12 Roster Schedules ................................................................................................ 16-34 16.4.13 Equipment Usage Model Assumptions ................................................................ 16-34
16.5 Fleet Management .............................................................................................. 16-34
16.6 Pit Slope Monitoring and Voids Management ..................................................... 16-35
16.6.1 Pit Slope Monitoring ............................................................................................. 16-35 16.6.2 Voids Management .............................................................................................. 16-35
16.7 Mine Equipment Requirements ........................................................................... 16-36
16.8 Mine Workforce Requirements ........................................................................... 16-37
RECOVERY METHODS .................................................................................... 17-1
17.1 Process Plant Design Criteria ............................................................................... 17-1
17.1.1 Comminution Design Values ................................................................................. 17-2 17.1.2 Grind Size Determination ....................................................................................... 17-3 17.1.3 Impact of Mineralogical Composition on Leach Performance ............................... 17-4
17.2 Flowsheet and Process Description ...................................................................... 17-7
17.2.1 Crushing, Crushed Ore Storage and Reclaim Circuit ............................................ 17-8 17.2.1.1 Primary Crushing................................................................................ 17-9 17.2.1.2 Secondary Crushing and Screening .................................................. 17-9 17.2.1.3 Crushed Ore Stockpile and Reclaim ................................................ 17-10
17.2.2 HPGR/Grinding and Gravity Recovery Circuit ..................................................... 17-10 17.2.2.1 High Pressure Grinding Rolls (HPGR) ............................................. 17-11 17.2.2.2 Grinding ............................................................................................ 17-12 17.2.2.3 Gravity Concentration ...................................................................... 17-13 17.2.2.4 Gravity Concentrate Intensive Leaching .......................................... 17-13
17.2.3 Pre-Leach, Leach and Carbon-In-Pulp ................................................................ 17-13 17.2.3.1 Pre-Leach Thickening ...................................................................... 17-14 17.2.3.2 Leach Circuit .................................................................................... 17-14 17.2.3.3 CIP ................................................................................................... 17-14
17.2.4 Cyanide Destruction and Final Tailings ............................................................... 17-15 17.2.4.1 Cyanide Destruction ......................................................................... 17-15 17.2.4.2 Final Tailings .................................................................................... 17-16
17.2.5 Acid Wash, Elution and Carbon Regeneration .................................................... 17-16 17.2.5.1 Carbon Acid Wash and Elution ........................................................ 17-16 17.2.5.2 Carbon Regeneration ....................................................................... 17-17
17.2.6 Electrowinning and Smelting ............................................................................... 17-17 17.2.6.1 Electrowinning .................................................................................. 17-17 17.2.6.2 Smelting ........................................................................................... 17-18
17.2.7 Gas and Reagents ............................................................................................... 17-18 17.2.7.1 Compressed Air................................................................................ 17-18 17.2.7.2 Oxygen (O2) ..................................................................................... 17-18 17.2.7.3 Cyanide (NaCN) ............................................................................... 17-18
NI 43-101 Technical Report Feasibility Study Update Hardrock Project, Ontario, Canada
Table of Contents January 2021 Page x
17.2.7.4 Caustic (NaOH) ................................................................................ 17-19 17.2.7.5 Quicklime (CaO) ............................................................................... 17-19 17.2.7.6 Flocculant ......................................................................................... 17-19 17.2.7.7 Hydrochloric Acid (HCl) .................................................................... 17-20 17.2.7.8 Copper Sulfate (CuSO4·5H2O) ......................................................... 17-20 17.2.7.9 Sulphur Dioxide (SO2) ...................................................................... 17-20 17.2.7.10 Antiscalant ........................................................................................ 17-20
17.3 Mass and Water Balance .................................................................................... 17-20
17.4 Process Equipment ............................................................................................. 17-21
17.5 Cyanide Management ......................................................................................... 17-22
17.6 Power Requirements .......................................................................................... 17-22
17.7 Plant Layout ........................................................................................................ 17-22
17.7.1 Process Plant Location ........................................................................................ 17-22 17.7.2 Building Architecture ............................................................................................ 17-22 17.7.3 Heating, Ventilation and Air Conditioning (HVAC) .............................................. 17-23 17.7.4 Fire Protection ..................................................................................................... 17-23 17.7.5 Electrical Distribution ........................................................................................... 17-24 17.7.6 Control System .................................................................................................... 17-24
PROJECT INFRASTRUCTURE ........................................................................ 18-1
18.1 General ................................................................................................................. 18-1
18.2 Tailings Management ............................................................................................ 18-1
18.2.1 Geotechnical Subsurface Investigations ............................................................... 18-2 18.2.2 Design Criteria ....................................................................................................... 18-3 18.2.3 Tailings Characteristics .......................................................................................... 18-3 18.2.4 Tailings Deposition Plan ........................................................................................ 18-4 18.2.5 TMF Water Management ....................................................................................... 18-6 18.2.6 TMF Seepage Mitigation and Control .................................................................... 18-6 18.2.7 Dam Design ........................................................................................................... 18-7 18.2.8 TMF Dam Raising Schedule .................................................................................. 18-9 18.2.9 Closure Considerations ......................................................................................... 18-9 18.2.10 Construction Borrow Materials .............................................................................. 18-9
18.3 Goldfield Creek Diversion ................................................................................... 18-11
18.3.1 Design Criteria ..................................................................................................... 18-13 18.3.2 Diversion Design .................................................................................................. 18-14 18.3.3 Diversion Dyke Design ........................................................................................ 18-14 18.3.3 Closure Considerations ....................................................................................... 18-15
18.4 Water Management ............................................................................................ 18-15
18.4.1 Administrative Water Services ............................................................................. 18-15 18.4.2 Effluents ............................................................................................................... 18-15 18.4.3 Site Runoff and Spillage Control ......................................................................... 18-16 18.4.4 Collection Ponds .................................................................................................. 18-17 18.4.5 Effluent Treatment Plant ...................................................................................... 18-19
18.5 Power Supply and Distribution ............................................................................ 18-19
NI 43-101 Technical Report Feasibility Study Update Hardrock Project, Ontario, Canada
Table of Contents January 2021 Page xi
18.5.1 Power Demand Estimates ................................................................................... 18-19 18.5.2 Power Plant Design ............................................................................................. 18-20 18.5.3 Power Distribution ................................................................................................ 18-20
18.6 Other Project Infrastructure ................................................................................. 18-21
18.6.1 Truck Maintenance Shop and Warehouse .......................................................... 18-21 18.6.2 Reagents Cold Storage Facility ........................................................................... 18-22 18.6.3 Explosives Reagent Facility ................................................................................. 18-22 18.6.4 Sewage Treatment Plant ..................................................................................... 18-22 18.6.5 Fuel Supply Storage & Distribution ...................................................................... 18-22 18.6.6 Information Technology and Communications Systems ..................................... 18-23 18.6.7 Roads ................................................................................................................... 18-23 18.6.8 Assay Laboratory ................................................................................................. 18-23 18.6.9 Admin Building ..................................................................................................... 18-24 18.6.10 Fire Protection ..................................................................................................... 18-24 18.6.11 Security ................................................................................................................ 18-24
18.7 Infrastructure Relocation and Offsite Infrastructure ............................................ 18-24
18.7.1 Private Properties ................................................................................................ 18-25 18.7.2 Government and Municipal Properties ................................................................ 18-25 18.7.3 Relocation of Highway 11 and MTO Patrol Station ............................................. 18-26 18.7.4 Natural Gas Distribution Pipeline ......................................................................... 18-26 18.7.5 Relocation of Hydro One Electrical Infrastructure ............................................... 18-26 18.7.6 Historical Tailings Relocation............................................................................... 18-27
18.8 Temporary Construction Infrastructure ............................................................... 18-28
18.8.1 Temporary Camp ................................................................................................. 18-28 MARKET STUDIES AND CONTRACTS ........................................................... 19-1
ENVIRONMENTAL STUDIES, PERMTTING AND SOCIAL OR COMMUNITY IMPACT ............................................................................................................. 20-1
20.1 Introduction ........................................................................................................... 20-1
20.2 Environmental Studies .......................................................................................... 20-2
20.2.1 Overview ................................................................................................................ 20-2 20.2.2 Geology and Geomorphology ................................................................................ 20-5
20.2.2.1 Physiography ...................................................................................... 20-5 20.2.2.2 Surficial Soils and Geology ................................................................ 20-5 20.2.2.3 Bedrock Geology ................................................................................ 20-6
20.2.3 Acid Rock Drainage/Metal Leaching Potential ...................................................... 20-6 20.2.3.1 Overburden ........................................................................................ 20-6 20.2.3.2 Waste Rock ........................................................................................ 20-6 20.2.3.3 Future Tailings .................................................................................... 20-7
20.2.4 Atmospheric Environment...................................................................................... 20-8 20.2.5 Acoustic Environment ............................................................................................ 20-8 20.2.6 Groundwater .......................................................................................................... 20-9 20.2.7 Soil Quality ........................................................................................................... 20-10 20.2.8 Surface Water ...................................................................................................... 20-10
20.2.8.1 Hydrology ......................................................................................... 20-10
NI 43-101 Technical Report Feasibility Study Update Hardrock Project, Ontario, Canada
Table of Contents January 2021 Page xii
20.2.8.2 Surface Water Quality ...................................................................... 20-11 20.2.9 Fish and Fish Habitat ........................................................................................... 20-12
20.2.9.1 Sediment Quality .............................................................................. 20-13 20.2.10 Vegetation Communities ...................................................................................... 20-13 20.2.11 Wildlife and Wildlife Habitat ................................................................................. 20-14 20.2.12 Labour and Economy ........................................................................................... 20-15 20.2.13 Community Services and Infrastructure .............................................................. 20-15 20.2.14 Land and Resource Use ...................................................................................... 20-16 20.2.15 Heritage Resources ............................................................................................. 20-17
20.2.15.1 Archaeology Resources ................................................................... 20-17 20.2.15.2 Architectural/Historical Resources ................................................... 20-17
20.2.16 Traditional Land and Resource Use (TLRU) ....................................................... 20-17 20.3 Environmental Constraints .................................................................................. 20-18
20.4 Environmental Approval Requirements .............................................................. 20-20
20.4.1 Environmental Assessment ................................................................................. 20-20 20.4.1.1 Overview .......................................................................................... 20-20 20.4.1.2 Consultation ..................................................................................... 20-20 20.4.1.3 Preliminary Effects Assessment ....................................................... 20-21 20.4.1.4 Cumulative Effects Assessment ....................................................... 20-34
20.4.2 Permits or Approvals to Obtain ............................................................................ 20-34 20.5 Consultation Activities ......................................................................................... 20-37
20.5.1 Indigenous Engagement ...................................................................................... 20-38 20.5.2 Summary of Influence of Consultation and Engagement on the Project ............. 20-39
20.6 Follow-up Environmental Monitoring and Management Plans ............................ 20-42
20.7 Closure, Decommissioning and Reclamation ..................................................... 20-43
CAPITAL AND OPERATING COSTS ............................................................... 21-1
21.1 Capital Expenditures ............................................................................................. 21-1
21.1.1 Responsibility Matrix .............................................................................................. 21-1 21.1.2 Basis of Estimate ................................................................................................... 21-2 21.1.3 CAPEX Summary .................................................................................................. 21-2
21.1.3.1 Direct Costs ........................................................................................ 21-3 21.1.4 Construction Indirect Costs and Owner’s Costs .................................................... 21-6
21.1.4.1 Allowances, Contingency and Escalation .......................................... 21-8 21.1.5 Sustaining Capital .................................................................................................. 21-9
21.2 Operating Costs .................................................................................................. 21-10
21.2.1 Operating Costs Summary .................................................................................. 21-10 21.3 Mining Costs ....................................................................................................... 21-13
21.3.1 Processing Costs ................................................................................................. 21-15 21.3.2 General and Administration Costs ....................................................................... 21-17
ECONOMIC ANALYSIS .................................................................................... 22-1
22.1 Assumptions ......................................................................................................... 22-1
22.1.1 Gold Price .............................................................................................................. 22-1
NI 43-101 Technical Report Feasibility Study Update Hardrock Project, Ontario, Canada
Table of Contents January 2021 Page xiii
22.1.2 Exchange Rates .................................................................................................... 22-1 22.1.3 Fuel 22-2 22.1.4 Natural Gas ............................................................................................................ 22-2
22.2 Metal Production and Revenues ........................................................................... 22-3
22.3 Royalties ............................................................................................................... 22-7
22.4 Operating Cost Summary ..................................................................................... 22-7
22.5 Capital Expenditures ............................................................................................. 22-8
22.5.1 Initial Capital .......................................................................................................... 22-8 22.5.2 Sustaining Capital Expenditures ............................................................................ 22-9 22.5.3 Salvage Value ........................................................................................................ 22-9
22.6 Working Capital ................................................................................................... 22-10
22.7 Reclamation and Closure Costs ......................................................................... 22-10
22.8 Project Financing ................................................................................................ 22-10
22.9 Taxation .............................................................................................................. 22-11
22.9.1 Ontario Mining Tax .............................................................................................. 22-11 22.9.2 Income Taxes ...................................................................................................... 22-11
22.10 Economic Results ............................................................................................... 22-12
22.11 Sensitivity Analysis ............................................................................................. 22-14
ADJACENT PROPERTIES ............................................................................... 23-1
23.1 Overview ............................................................................................................... 23-1
23.1.1 Talmora Long Lac .................................................................................................. 23-1 23.1.2 Little Long Lac Mine (Past Producer) .................................................................... 23-4 23.1.3 Magnet Consolidated Mine (Past-Producer) ......................................................... 23-5 23.1.4 Bankfield Mine (Past-Producer) ............................................................................. 23-6 23.1.5 Tombill Mine (Past-Producer) ................................................................................ 23-7 23.1.6 Gold Potential of the Other Historical Mines .......................................................... 23-7
OTHER RELEVANT DATA AND INFORMATION ............................................ 24-1
24.1 Project Execution and Organization ...................................................................... 24-1
24.1.1 Health, Safety and Environment ............................................................................ 24-2 24.1.2 Indigenous Relations ............................................................................................. 24-3 24.1.3 Engineering and Procurement Management ......................................................... 24-4 24.1.4 Construction Management..................................................................................... 24-4 24.1.5 Operational Readiness, Commissioning and Ramp-up Strategy .......................... 24-5 24.1.6 Risk Management .................................................................................................. 24-5 24.1.7 Quality Assurance and Quality Control .................................................................. 24-5 24.1.8 Project Controls ..................................................................................................... 24-6
24.2 Project Schedule ................................................................................................... 24-6
24.3 Operating Plan ...................................................................................................... 24-8
INTERPRETATION AND CONCLUSIONS ....................................................... 25-1
25.1 Conclusions .......................................................................................................... 25-1
NI 43-101 Technical Report Feasibility Study Update Hardrock Project, Ontario, Canada
Table of Contents January 2021 Page xiv
25.1.1 Geology and Mineral Resources ........................................................................... 25-1 25.1.2 Mining and Mineral Reserves ................................................................................ 25-3 25.1.3 Metallurgical Testing and Mineral Processing ....................................................... 25-3 25.1.4 Infrastructure .......................................................................................................... 25-4 25.1.5 Environmental Considerations ............................................................................... 25-4 25.1.6 Capital and Operating Costs.................................................................................. 25-5
25.2 Risks and Opportunities ........................................................................................ 25-6
25.2.1 Risks ...................................................................................................................... 25-6 25.2.2 Discussion of Risks ................................................................................................ 25-6
25.2.2.1 People ................................................................................................ 25-6 25.2.2.2 Gold Production.................................................................................. 25-7 25.2.2.3 Permitting ........................................................................................... 25-8 25.2.2.4 Tailings Management Facility ............................................................. 25-8 25.2.2.5 Project Cost Estimate ......................................................................... 25-8 25.2.2.6 Accidents and Incidents ..................................................................... 25-9 25.2.2.7 Pit Wall Failure ................................................................................... 25-9 25.2.2.8 Stability of Historical Tailings ............................................................. 25-9 25.2.2.9 Relocation of Infrastructure .............................................................. 25-10 25.2.2.10 Water Management .......................................................................... 25-10
25.2.3 Opportunities ....................................................................................................... 25-11 RECOMMENDATIONS ..................................................................................... 26-1
26.1 Hardrock Project Recommendations .................................................................... 26-1
26.1.1 Exploration and Geology ....................................................................................... 26-1 26.1.2 Detailed Engineering Phase .................................................................................. 26-2
REFERENCES .................................................................................................. 27-1
NI 43-101 Technical Report Feasibility Study Update Hardrock Project, Ontario, Canada
List of Figures January 2021 Page i
List of Figures Figure 1.1: Annual Mine Production ........................................................................................................... 1-8 Figure 1.2: Annual Mine Production ........................................................................................................... 1-8 Figure 1.3: Hardrock Site General Arrangement ..................................................................................... 1-11 Figure 1.4: Process Plant and Mine Infrastructure .................................................................................. 1-12 Figure 1.5: Annual Gold Sales ................................................................................................................. 1-19 Figure 4.1: Location Map for the Hardrock Project .................................................................................... 4-2 Figure 4.2: Overview of GGMs Land Tenure ............................................................................................. 4-3 Figure 4.3: Hardrock Project Properties ..................................................................................................... 4-4 Figure 4.4: Hardrock Project Royalties Map .............................................................................................. 4-5 Figure 4.5: Brookbank Project Properties .................................................................................................. 4-6 Figure 4.6: Viper Project Properties ........................................................................................................... 4-7 Figure 5.1: Hardrock Project Access Routes ............................................................................................. 5-2 Figure 5.2: General Site Layout ................................................................................................................. 5-5 Figure 6.1: Map of the Hardrock Project - 2016 Resource Estimate Area (red outline) Representing Limits
of Historical Work ....................................................................................................................................... 6-3 Figure 6.2: Major Helicopter Borne Geophysical Targets on the Brookbank Property ............................ 6-19 Figure 7.1: Plan Map of Major Geological Elements – Wabigoon Subprovince (Card and Poulsen, 1998) 7-
2 Figure 7.2: Regional Geology Map of the Geraldton-Beadmore Area ....................................................... 7-4 Figure 7.3: Hardrock Property Geology ..................................................................................................... 7-7 Figure 7.4: Arkosic Unit within Greywackes, Hardrock Deposit Area, DDH 19-21 .................................... 7-8 Figure 7.5: Contact of Hardrock Porphyry and Greywacke. Pen Points North .......................................... 7-9 Figure 7.6: Contact of Sheared Gabbro (right) with BIF (left) DDH 19-52 ............................................... 7-10 7.7:Quartz Carbonate Veins and Sericite Carbonate Alteration at the F-Zone ....................................... 7-11 Figure 7.8: Block Diagram of North Zone at the MacLeod Cockshutt and Hard Rock Mines showing Ore
Bods in Black (From Lafrance et al. 2004) ............................................................................................... 7-12 Figure 7.9: Plan View of Litho-Structural Model showing Mineralized Zones at Elevations 300 m and -
200 m (Projection: UTM NAD 83 Zone 16) .............................................................................................. 7-15 Figure 7.10: Litho-structural Model showing Various Mineralized Zones (Cross section 4200, looking
west) ......................................................................................................................................................... 7-16 Figure 7.11: Litho-structural Model showing Various Mineralized Zones (Cross section 4950, looking
west) ......................................................................................................................................................... 7-17 Figure 7.12: Deformed Quartz-carbonate Stringers in BIF, Headframe Outcrop .................................... 7-18 Figure 7.13: Folded Quartz-carbonate Veins within Altered Quartz-porphyry, Porphyry Hill .................. 7-19 Figure 7.14: Brookbank Project Geology ................................................................................................. 7-24
NI 43-101 Technical Report Feasibility Study Update Hardrock Project, Ontario, Canada
List of Figures January 2021 Page ii
Figure 7.15: Exposure of the Brookbank Mineralized Corridor showing Intense Hydrothermal Alteration.. 7-
25 Figure 7.16: Cross Section 1500W .......................................................................................................... 7-26 Figure 7.17: Generalized Geology of the Key Lake Property .................................................................. 7-27 Figure 7.18: Example of Fracture-controlled Pyrite Mineralization in Sericite-silica Arkosic Wacke,
0.54 ppm Au ............................................................................................................................................. 7-29 Figure 7.19: Example of Sericite-altered Quartz-feldspar Porphyry; 7.75 ppm Au. Dyke Intrudes Arkose
(top core) .................................................................................................................................................. 7-29 Figure 7.20: Kailey Project Geology ........................................................................................................ 7-30 Figure 7.21: Isometric view of the Kailey, North, South and No.9 Vein Mineralization with the Folded
Arkosic Host Unit ...................................................................................................................................... 7-31 Figure 8.1: Setting of Greenstone Hosted Gold Deposits .......................................................................... 8-3 Figure 8.2: Sheeted Quartz-Carbonate Veins Hosted in Greywacke, DDH-19-54 .................................... 8-5 Figure 8.3: Exposure of the Brookbank Deposit Quartz Carbonate Veins/Stringers, Fractures/Stockworks
................................................................................................................................................................... 8-6 Figure 10.1: Location of Greenstone Drill Holes used in the 2016 MRE, Prior to the 2018 and 2019 Drilling
Programs .................................................................................................................................................. 10-5 Figure 10.2: Location of Greenstone Gold Mines Condemnation Drill Holes in the Hardrock Deposit Area
................................................................................................................................................................. 10-6 Figure 10.3: 2018 RCGC and Blast Hole Drilling Locations at the Hardrock Project .............................. 10-8 Figure 10.4: 2019 Drilling Programs - Hardrock Project .......................................................................... 10-9 Figure 10.5: Hardab 7000 Maxidrill RC Drill Rig .................................................................................... 10-10 Figure 10.6: Diamond Drill Rig ............................................................................................................... 10-11 Figure 10.7: Six (6) Drill Traces of Two Drilling Campaigns Performed at Brookbank in 2016 (green –
Brookbank training, blue – Brookbank East, yellow – Brookbank) ........................................................ 10-15 Figure 11.1: Principal Sample (small) and Metallurgical Sample (large) from a
2 m Interval - RCGC Sample ................................................................................................................... 11-2 Figure 11.2: Hardab 7000 Maxidrill RC Drill Rig and Splitter in Operation .............................................. 11-3 Figure 11.3: Drill Core – Sawing Shack ................................................................................................... 11-4 Figure 11.4: Results of Blank Samples used for Quality Control during Channelling Program Hardrock
Deposit between July 30, 2014 and September 2, 2015. Detection Limit = 0.005 g Au/t for AA Finish 11-10 Figure 11.5: Results of Blank Samples used for Quality Control during Drilling Program on the Hardrock
Deposit between July 30, 2014 and July 22, 2015. Detection Limit = 0.005 g Au/t for AA Finish ......... 11-11 Figure 11.6: Linear Graph Comparing Original Samples and Crush Coarse Duplicate Samples (duplicate
pairs) between July 30, 2014 and September 2, 2015 (channelling) .................................................... 11-14 Figure 11.7: Linear Graph Comparing Original Samples and Crush Coarse Duplicate Samples (duplicate
pairs) for the Period between July 30, 2014 and July 22, 2015 (drilling) ............................................... 11-15
NI 43-101 Technical Report Feasibility Study Update Hardrock Project, Ontario, Canada
List of Figures January 2021 Page iii
Figure 11.8: QA/QC - 2018 Blank Results of RCGC Samples .............................................................. 11-16 Figure 11.9: QA/QC - 2019 Blank Results of RCGC Assays ................................................................. 11-17 Figure 11.10: QA/QC - Blank Results of DDH Assays .......................................................................... 11-17 Figure 11.11: Standard CDN-GS-P4G Results – RC Assays ................................................................ 11-19 Figure 11.12: Standard CDN-GS-P4G Results – DDH Assays ............................................................. 11-19 Figure 11.13: 2018 Field Duplicates for Gold Values – RCGC Samples .............................................. 11-22 Figure 11.14: 2019 ¼ Core Duplicates for Gold Values – DDH Samples ............................................. 11-23 Figure 11.15: 2019 Field Duplicates for Gold Values – RCGC Samples .............................................. 11-24 Figure 11.16: Blanks at Swastika Laboratories Ltd. Ontex 2009 Drilling Campaign ............................. 11-30 Figure 11.17: Control Chart of Certified Standard (SN38) – 2009 QA/QC Program ............................. 11-31 Figure 11.18: Control Chart of Certified Standard (HiSilP1) – 2009 QA/QC Program .......................... 11-31 Figure 11.19: Pulp Duplicate Results Comparing Swastika and Actlabs Laboratories - 2009 .............. 11-32 Figure 11.20: Actlabs Internal Quality Control Chart – Brookbank (2009) ............................................ 11-33 Figure 11.21: Performance of Blank for Au ............................................................................................ 11-35 Figure 11.22: Performance of OREAS 2Pd Reference Material for Au ................................................. 11-36 Figure 11.23: Performance of OREAS 6Pc Reference Material for Au ................................................. 11-37 Figure 11.24: Field Duplicates Control Chart – Key Lake (2010 to 2011) ............................................. 11-38 Figure 11.25: Coarse Reject Duplicates Control Chart – Key Lake (2010 to 2011) .............................. 11-39 Figure 11.26: Pulp Duplicates Control Chart – Key Lake (2010 to 2011) .............................................. 11-40 Figure 11.27: Control Chart - Standard CDN-GS-5F : Outliers Included - Kailey Drilling Program (2011)11-
43 Figure 11.28: Control Chart - Standard CDN-GS-8A : Outliers Included – Key Lake Drilling
Program (2011) ...................................................................................................................................... 11-44 Figure 11.29: Control Chart of Certified CDN-GS-P4B – ALS vs Actlabs Laboratories Check (Source:
GGM QA/QC Report,2016) .................................................................................................................... 11-45 Figure 11.30: Umpire Repeat Assays – Actlabs vs ALS – Brookbank Project ...................................... 11-46 Figure 11.31: Scatter Plot – Drill Hole (Sample Name) : Original vs. Coarse Reject Duplicate for Au (g/t)
FA AAS Analytical Method (Source: GGM QA/QC Report, 2016) ......................................................... 11-48 Figure 11.32: Field Duplicates Control Chart – Kailey (2007 to 2011) .................................................. 11-49 Figure 12.1: Drill Hole Collars Surveyed during GMS 2016 Site Visit ..................................................... 12-3 Figure 12.2: Core Logging Procedures Reviewed during Site Visit ......................................................... 12-4 Figure 12.3: Original Assays Compared to Check Assays ...................................................................... 12-6 Figure 12.4: Isometric View looking NNW showing a Compilation of the Mined-out Underground Voids: A)
Overall View of Stopes and Drifts by Level of Precision; B) Close-up View of the Stopes Modelled in
2014; C) Close-up View of the Stopes Updated in 2016 ......................................................................... 12-7 Figure 12.5: Isometric View looking NNW showing a Compilation of the Mined-out Underground Voids
Based on their Backfill Type..................................................................................................................... 12-8
NI 43-101 Technical Report Feasibility Study Update Hardrock Project, Ontario, Canada
List of Figures January 2021 Page iv
Figure 12.6: 2018-2019 Drilling Programs - Hardrock Project ............................................................... 12-10 Figure 12.7: Mined-out Voids Status as Intercepted by RC and DDH Drilling Programs ...................... 12-12 Figure 12.8: Reported Voids: Expected Length vs. Actual Length ........................................................ 12-12 Figure 12.9: New Voids: Expected Length vs. Actual Length ................................................................ 12-13 Figure 12.10: 2018 RC Holes vs. Historical Openings – Section 4805E (Looking West) ..................... 12-14 Figure 12.11: Left: Mine Workings and the Capped Jellicoe Shaft, Key Lake Property. Right: Drill Hole
Collar PLL 08-32 at the Kailey Property. ................................................................................................ 12-16 Figure 12.12: Comparison of Original (OG) and Repeat Analyses (RA) ............................................... 12-17 Figure 12.13: Top: Jellicoe Shaft and Underground Drives at Key Lake, Bottom: Little Long Lac (Kailey)
Shaft and Underground Drifts, with the Mined Vein Wireframe ............................................................. 12-19 Figure 13.1: Gravity Tailings Bulk Rougher Kinetics Results .................................................................. 13-5 Figure 13.2: Comparison of Combined Results ....................................................................................... 13-7 Figure 13.3: Gold Occurrence (by Distribution) ..................................................................................... 13-22 Figure 13.4: Variability Composites Gravity Recovery Results ............................................................. 13-23 Figure 13.5: Gold Recovery as a Function of Grind Size (Global Composite) ...................................... 13-24 Figure 13.6: Pilot Plant Test Third Cycle Size Distribution .................................................................... 13-36 Figure 13.7: Composites Gravity Recovery Results .............................................................................. 13-39 Figure 13.8: Oxygen Uptake Test .......................................................................................................... 13-41 Figure 14.1: Plan View of Drill Hole Collars – Hardrock Project .............................................................. 14-4 Figure 14.2: 3D View of Drill Holes, View towards North-East and 2016 FS Pit Design ......................... 14-5 Figure 14.3: 2019 Interpretation vs. 2016 Interpretation. Left: Section 504,250mE North 1-Zone. Right:
Section 504,845mE North 2-Zone ........................................................................................................... 14-6 Figure 14.4: Isometric View of the 17 Principal Domains. Looking NE. and 2016 FS Pit Design shown for
Scale ........................................................................................................................................................ 14-8 Figure 14.5: Long-Section Views (looking north) of Six of the 17 Principal Domains, showing 2016 FS Pit
Design for Scale ....................................................................................................................................... 14-8 Figure 14.6: Section 504,600mE, Looking West: Principal Domains and Drilling (g Au/t), 2016 FS Pit
Design shown for Scale ........................................................................................................................... 14-9 Figure 14.7: Section 504,815mE (looking west) - Example of Internal Grade Shell Sub-domains for the SP
Zone. Blue: < 0.1 g/t, Yellow: 0.1 – 0.6 g/t, Red: > 0.6 g/t. .................................................................... 14-10 Figure 14.8: Probability Plot Au (g/t) – High-grade Sub-domain (> 0.6 g/t) of the F-Zone (upper image)
and North 1-Zone (lower image) Zone ................................................................................................... 14-14 Figure 14.9: Probability Plot Au (g/t) – High-grade Sub-domain (> 0.6 g/t) of the F2-Zone (upper image)
and SP-Zone (lower image) Zone .......................................................................................................... 14-15 Figure 14.10: Pairwise-Relative Variogram for the SP Zone (black = major axis, red = semimajor axis) . 14-
19 Figure 14.11: Pairwise-Relative Model for the SP Zone (Domain 3500) ............................................... 14-20
NI 43-101 Technical Report Feasibility Study Update Hardrock Project, Ontario, Canada
List of Figures January 2021 Page v
Figure 14.12: Section Views (looking west) of Wireframe Subdivisions (soft boundaries) to Guide Search
Ellipses. Left: SP-Zone, Right: North 2-Zone ......................................................................................... 14-22 Figure 14.13: Section 504,325 mE (looking west) of Search Ellipse Sub-domains (grey shades) for
External Grade Shell Domains 500, 501 and 506. Iron-Formations shown in Yellow ........................... 14-23 Figure 14.14: Contact Analysis Plots of the North 1-Zone (top) and the SP-Zone (bottom) ................. 14-24 Figure 14.15: Plan View at 135 RL showing Estimated Block Grades of the Hardrock Deposit ........... 14-31 Figure 14.16: Section 504,325 mE (looking west) showing Estimated Block Grades of the
Hardrock Deposit ................................................................................................................................... 14-32 Figure 14.17: Blocks vs. Composites - Section 504,675 Em (looking west). The 2019 MII MRE Pit and
Optimization ........................................................................................................................................... 14-33 Figure 14.18: Swath Plot of Gold g/t for the SP-Zone by Easting (Pass 1 to 3) within the In-Pit Area .. 14-35 Figure 14.19: Q:Q Plot Comparing the Three Grade Interpolators for the F-Zone (3105) within the 2019
MII Pit Optimization ................................................................................................................................ 14-36 Figure 14.20: Plan View showing the Categorized Mineral Resources and the 2019 Whittle Optimized
Shell (elevation 300 m) .......................................................................................................................... 14-39 Figure 14.21: Longitudinal View showing the Categorized Mineral Resources and the 2019 Whittle
Optimized Pit Shell (longitudinal view 5,503,000N) ............................................................................... 14-39 Figure 14.22: Longitudinal View showing the Categorized Mineral Resources and the 2019 Whittle
Optimized Shell (longitudinal View 5,502,830N) .................................................................................... 14-40 Figure 14.23: Waterfall Chart of 2019 In-Pit Measured + Indicated Ounces showing Sensitivity to Capping
and High-grade Restraining, and Deepening of Pit Optimization Shell ................................................. 14-46 Figure 14.24: In-Pit Constrained Measured and Indicated Mineral Resources Waterfall Chart
(0.3 g/t Lower Cut-off) of Ounces ........................................................................................................... 14-50 Figure 14.25: Modelled Solids of the Brookbank Deposits, looking NW ............................................... 14-55 Figure 14.26: Typical section (looking east) showing the Footwall (blue) and Hanging Wall (orange)
Veins. Bar Charts on Drilling Traces show Gold Grades ....................................................................... 14-56 Figure 14.27: Example of a Probability Plot for the FW Vein ................................................................. 14-57 Figure 14.28: Plan View of Brookbank Block Model, Wireframes and Drill Traces ............................... 14-60 Figure 14.29: Brookbank Gold Grade Distribution in the FW Domain, looking NW .............................. 14-63 Figure 14.30: Swath Plot Comparing Block Gold Grades (blue) with Capped Composite Gold Grades (red
dotted) for the FW Domain, by Easting .................................................................................................. 14-64 Figure 14.31: Brookbank Project Pit Optimization - US$1,500 Pit Shell, MII Blocks ............................. 14-67 Figure 14.32: Brookbank Mineral Resource Classification .................................................................... 14-68 Figure 14.33: Modelled Solids of the Key Lake Deposit, Looking NW .................................................. 14-72 Figure 14.34: Typical Section (looking south-east) showing the Mineralization Wireframes and
Overburden. Bar Charts on Drilling Traces show Gold Grades ............................................................. 14-73 Figure 14.35: Example of a Probability Plot for the KL-5 Domain ......................................................... 14-75
NI 43-101 Technical Report Feasibility Study Update Hardrock Project, Ontario, Canada
List of Figures January 2021 Page vi
Figure 14.36: Plan View of Key Lake Block Model, Wireframes and Drill Traces ................................. 14-77 Figure 14.37: Key Lake Gold Grade Distribution in Resource Block Model, looking NW ..................... 14-80 Figure 14.38: Swath Plot Comparing Block Gold Grades (blue) with Capped Composite Gold Grades (red
dotted) for the 12 Domains Grouped Together, by Easting ................................................................... 14-82 Figure 14.39: Key Lake Deposit Pit Optimization - US$1,500 Pit Shell, MII Blocks .............................. 14-83 Figure 14.40: Key Lake Deposit Coloured by Resource Category. Red = Indicated, Light Blue = Inferred
............................................................................................................................................................... 14-84 Figure 14.41: Isometric View looking NW of the Three Domains at the Kailey Deposit. Also shown are
Underground Workings .......................................................................................................................... 14-88 Figure 14.42: Typical Section showing Kailey and Main Domains Near Surface, and No. 9 Domain at
Depth. Drill Holes Coloured by Gold ...................................................................................................... 14-89 Figure 14.43: Example of a Probability Plot for the Main Domain ......................................................... 14-90 Figure 14.44: Example Variogram for the Major Axis of the Kailey Domains ........................................ 14-92 Figure 14.45: Plan view of Kailey Block Model, Wireframes and Drill Traces ....................................... 14-93 Figure 14.46: Kailey Gold Grade Distribution in Resource Block Model, looking NW ........................... 14-96 Figure 14.47: Key Lake Deposit Pit Optimization - US$1,500 Pit Shell, MII Blocks .............................. 14-97 Figure 14.48: Underground Void Model (grey) and Three Modelled Domains at Kailey ....................... 14-98 Figure 14.49: Kailey Deposit Coloured by Resource Category. Yellow = Indicated, Blue = Inferred .... 14-99 Figure 15.1: Pit Limit Hard Boundary Constraint ..................................................................................... 15-5 Figure 15.2: Pit by Pit Graph M&I Resource ............................................................................................ 15-9 Figure 15.3: Final Pit Design .................................................................................................................. 15-12 Figure 15.4: 3D View of Final Open Pit with Historical Underground Voids .......................................... 15-13 Figure 16.1: Starter Pit Phase Design ..................................................................................................... 16-4 Figure 16.2: Phase 1 Design.................................................................................................................... 16-5 Figure 16.3: Phase 2 Design.................................................................................................................... 16-5 Figure 16.4: Phase 2.5 Design ................................................................................................................ 16-6 Figure 16.5: Phase 3 Design.................................................................................................................... 16-6 Figure 16.6: Phase 4 Design.................................................................................................................... 16-7 Figure 16.7: Phase 4.5 Design ................................................................................................................ 16-7 Figure 16.8: Phase 5 Design.................................................................................................................... 16-8 Figure 16.9: Phase 5.5 Design ................................................................................................................ 16-8 Figure 16.10: Annual Mine Production ................................................................................................... 16-12 Figure 16.11: Annual Stockpile Inventory .............................................................................................. 16-13 Figure 16.12: Annual Mill Production ..................................................................................................... 16-13 Figure 16.13: Annual Gold Production ................................................................................................... 16-14 Figure 16.14: Production Schedule – Year -1 ........................................................................................ 16-15 Figure 16.15: Production Schedule – Year 3 ......................................................................................... 16-16
NI 43-101 Technical Report Feasibility Study Update Hardrock Project, Ontario, Canada
List of Figures January 2021 Page vii
Figure 16.16: Production Schedule - Year 10 ........................................................................................ 16-17 Figure 16.17: Production Schedule - Year 15 ........................................................................................ 16-18 Figure 16.18: Cycle Time by Category and Material Moved .................................................................. 16-29 Figure 16.19: Mining Truck Fuel Requirements ..................................................................................... 16-31 Figure 16.20: Truck Requirement – Required vs. Budgeted ................................................................. 16-32 Figure 16.21: Mine Equipment Requirements ....................................................................................... 16-37 Figure 17.1: Global Composite Tailings Grade and Recovery vs. Grind Size ......................................... 17-4 Figure 17.2: Hardrock Project Simplified Flowsheet ................................................................................ 17-8 Figure 17.3: Hardrock Project Process Plant Water Balance ................................................................ 17-21 Figure 18.1: General Arrangement Plan TMF .......................................................................................... 18-5 Figure 18.2: TMF Struck Level Capacity ................................................................................................ 18-10 Figure 18.3: Diversion Components ...................................................................................................... 18-13 Figure 20.1: Local Assessment Areas ..................................................................................................... 20-3 Figure 20.2: Regional Assessment Areas ................................................................................................ 20-4 Figure 21.1: Operating Cost by Year ..................................................................................................... 21-11 Figure 22.1: Daily Rack Pricing Data for Wholesale Diesel from January 2nd, 2018 until July 31st, 2019 . 22-
2 Figure 22.2: Annual Gold Sales Profile .................................................................................................... 22-4 Figure 22.3: Mine and Mill Production Profile .......................................................................................... 22-6 Figure 22.4: Initial CAPEX by Month ....................................................................................................... 22-8 Figure 22.5: Project After-Tax NPV 5% Sensitivity ................................................................................ 22-16 Figure 22.6: Project After-Tax IRR Sensitivity ....................................................................................... 22-16 Figure 23.1: Past Gold Producers on the Hardrock Project ..................................................................... 23-3 Figure 24.1: Hardrock Project Organization Chart ................................................................................... 24-2 Figure 24.2: Hardrock Project Level 1 Schedule ..................................................................................... 24-7 Figure 24.3: Hardrock Project Workforce ................................................................................................. 24-8 Figure 24.4: Operation General Organizational Chart ............................................................................. 24-9
NI 43-101 Technical Report Feasibility Study Update Hardrock Project, Ontario, Canada
List of Tables January 2021 Page i
List of Tables Table 1.1: Mineral Resource Estimate (Exclusive of Mineral Reserves) for the Hardrock Project ............ 1-4 Table 1.2: Summary of Brookbank, Kailey and Key Lake Mineral Resources .......................................... 1-5 Table 1.3: Mineral Reserve Estimate (Open-Pit) ....................................................................................... 1-6 Table 1.4: Capital Expenditures Summary .............................................................................................. 1-17 Table 1.5: Operating Cost Summary ....................................................................................................... 1-18 Table 1.6: Project Economics Result Summary....................................................................................... 1-20 Table 1.7: Project Net Present Values at Various Discount Rates .......................................................... 1-21 Table 1.8: Project After-Tax Sensitivities ................................................................................................. 1-21 Table 2.1: Summary of Qualified Persons ................................................................................................. 2-2 Table 2.2: List of Abbreviations .................................................................................................................. 2-5 Table 4.1: Summary of Types of Land Tenure in GGM Land Package – as of November 6, 2019 .......... 4-2 Table 4.2: Permits on GGM Properties ...................................................................................................... 4-8 Table 6.1: Gold Production, Diamond Drilling and Underground Development Statistics – Little Long Lac,
Hardrock, MacLeod-Cockshutt, Mosher Long Lac and MacLeod Mines ................................................... 6-4 Table 6.2: Mineral Resources - Hardrock Area (Reddick et al,. 2010) ...................................................... 6-7 Table 6.3: Mineral Resources - Hardrock Deposit (Murahwi et al., 2011) ................................................. 6-8 Table 6.4: Mineral Resources - Hardrock Deposit (Murahwi et al., 2013) ................................................. 6-9 Table 6.5: Mineral Resources - Hardrock Deposit (Brousseau et al, 2013) .............................................. 6-9 Table 6.6: Mineral Resources - Hardrock Deposit (Brousseau et al., 2014) ........................................... 6-10 Table 6.7: Summary of Post-Production Exploration Activity .................................................................. 6-13 Table 6.8: Historic Drilling on the Brookbank Property (1999-2009 Drilling Campaigns) ........................ 6-20 Table 6.9: Scott Wilson RPA 2009 Mineral Resource Estimate for the Brookbank Project .................... 6-21 Table 6.10: Micon 2012 Resource Estimate for the Brookbank Deposit ................................................. 6-22 Table 6.11: Micon 2012 Estimate of Key Lake Resources ...................................................................... 6-23 Table 6.12: Historic Mine Production in the Beardmore-Geraldton Area (From Mason and
McConnell, 1983) ..................................................................................................................................... 6-24 Table 6.13: Micon 2012 Kailey Resource Estimate ................................................................................. 6-25 Table 7.1: Summary of Deformation and Gold Mineralization Events – Beardmore-Geraldton Greenstone
Belt (Lafrance et al, 2004; Tóth et al. 2013, 2014a, 2014b) ...................................................................... 7-5 Table 7.2: Historical and Current Nomenclature of Mineralized Zones ................................................... 7-20 Table 10.1: Number of Drill Holes and Core Size per Year ..................................................................... 10-1 Table 10.2: Targeted Areas for the RCGC and DTH Drilling at Hardrock ............................................... 10-7 Table 10.3: Summary of Brookbank Project Drilling Programs ............................................................. 10-16 Table 10.4: Summary of the Kailey Project Drilling Programs ............................................................... 10-18 Table 10.5: Summary of the Key Lake Project Drilling Programs .......................................................... 10-19
NI 43-101 Technical Report Feasibility Study Update Hardrock Project, Ontario, Canada
List of Tables January 2021 Page ii
Table 11.1: Results for Standards used by Premier during the 2012-2013 Drilling Program
on the Hardrock Deposit .......................................................................................................................... 11-8 Table 11.2: Results for Standards used by Premier during the Drilling Program on the Hardrock Deposit
from August 12, 2013 to December 31, 2013 .......................................................................................... 11-9 Table 11.3: Results for Standards used by Premier during the Drilling Program on the Hardrock Deposit
from January 2, 2014 to May 26, 2014 .................................................................................................... 11-9 Table 11.4: Results for Standards used by GGM during Channelling Program on Hardrock Deposit
July 20, 2014 – September 2, 2015 ....................................................................................................... 11-12 Table 11.5: Results for Standards used by Premier during the Drilling Program on Hardrock Deposit from
July 30, 2014 to July 22, 2015 ............................................................................................................... 11-13 Table 11.6: 2018 Standard Result Summary (excluding internal lab standards) – RCGC Samples ..... 11-20 Table 11.7: 2019 Standard Result Summary (excluding internal lab standards) – RCGC Samples ..... 11-21 Table 11.8: Standard Result Summary (excluding internal lab standards) – DDH Samples ................ 11-21 Table 11.9: ROCKLABS Certified Material used by Ontex between April to August 2009 ................... 11-30 Table 11.10: Results for Standards Used by Premier During the Drilling Program on the Brookbank
Deposit from 2016 to 2017 ..................................................................................................................... 11-42 Table 11.11: Results for Standards Used by Premier During the Drilling Program on the Kailey (“Little
Long Lac”) Deposit from 2007 to 2011 .................................................................................................. 11-42 Table 11.12: Results for Standards Used by Premier During the Drilling Program on the Key Lake Deposit
from 2011 ............................................................................................................................................... 11-43 Table 11.13: Standard Blank : Outliers Included – All Projects (2011 - 2016) ...................................... 11-46 Table 11.14: Duplicate Gold Results with a Precision >20% (Control Limit) – Brookbank QA/QC Program
............................................................................................................................................................... 11-48 Table 12.1: Drill Hole Collar Checks - 2016 Site Visit .............................................................................. 12-3 Table 12.2: Original and Re-sampling Gold Analysis Results ................................................................. 12-5 Table 12.3: Hardrock Gold Deposit - Resource Database Summary ...................................................... 12-9 Table 12.4: List of Drill Hole Collars Identified in the Field at the Brookbank, Kailey and Key Lake
Deposits ................................................................................................................................................. 12-15 Table 13.1: Gold Head Analyses by Metallic Sieve ................................................................................. 13-2 Table 13.2: Constituents of Composite 1 and Composite 2 .................................................................... 13-3 Table 13.3: Composites 1 and 2 Bond Ball Mill Grindability Tests Results ............................................. 13-4 Table 13.4: Cyanidation of Whole Ore, Gravity Tailings and Flotation Concentration ............................ 13-6 Table 13.5: Gold Head Analyses by Metallic Sieve ................................................................................. 13-8 Table 13.6: Whole Ore and Gravity Tailings Cleaner Flotation Tests ................................................... 13-10 Table 13.7: Locked-Cycle Metallurgical Projected Results .................................................................... 13-10 Table 13.8: Whole Ore Cyanidation vs. Flotation Concentrate Cyanidation ......................................... 13-11 Table 13.9: Whole Ore Cyanidation Tests Results ................................................................................ 13-12
NI 43-101 Technical Report Feasibility Study Update Hardrock Project, Ontario, Canada
List of Tables January 2021 Page iii
Table 13.10: QEMSCAN Modals on Global Composite ........................................................................ 13-13 Table 13.11: Composites, PQ Core and Dilution Samples Comminution Tests Results ...................... 13-15 Table 13.12: Comminution Test Results per Lithologies ....................................................................... 13-17 Table 13.13: Core Interval Samples Comminution Tests Results ......................................................... 13-17 Table 13.14: Global, Master, Variability and Low-Grade Samples Composition ................................... 13-19 Table 13.15: Composite Samples Direct and Calculated Head Grade ................................................. 13-20 Table 13.16: Gold Deportment Results .................................................................................................. 13-21 Table 13.17: Leach / CIP Modelling Results .......................................................................................... 13-26 Table 13.18: Two-Stage Cyanide Destruction Discharge Solution Analysis ......................................... 13-27 Table 13.19: Dynamic Settling Test Results .......................................................................................... 13-28 Table 13.20: Underflow Rheology Test Results .................................................................................... 13-29 Table 13.21: Thickening and Rheology Tests Results Summary .......................................................... 13-30 Table 13.22: HPGR Tests Samples Preparation Details ....................................................................... 13-31 Table 13.23: Labwal Tests Results ........................................................................................................ 13-32 Table 13.24: Atwal Tests Results .......................................................................................................... 13-33 Table 13.25: Bond Ball Mill Grindability Tests Results .......................................................................... 13-34 Table 13.26: Composite Samples Direct and Calculated Gold Head Grade ......................................... 13-38 Table 13.27: Dynamic Thickening – Overall Results Summary ............................................................. 13-42 Table 14.1: Summary of MRE Drilling Database for the Hardrock Gold Deposit .................................... 14-2 Table 14.2: Volume Changes – 2016 vs. 2019 Geological Modelling – All the Deposit ........................ 14-11 Table 14.3: Summary Statistics of Raw Assays by Domain and Sub-domain ...................................... 14-13 Table 14.4: Summary Statistics for As (ppm) and S (%) Raw Assays by Domain ................................ 14-16 Table 14.5: Statistics of Composites Grouped by Length for the > 0.6 g Au/t Internal Grade Shell for the
SP-Zone ................................................................................................................................................. 14-17 Table 14.6: Summary Statistics for the 2.0 m Composites .................................................................... 14-18 Table 14.7: Variogram Model Parameters for Domain .......................................................................... 14-21 Table 14.8: Final Search Ellipsoid Parameters and Threshold Dimensions .......................................... 14-26 Table 14.9: Bulk Density Assigned to Block Model by Domain ............................................................. 14-28 Table 14.10: Block Model Properties ..................................................................................................... 14-29 Table 14.11: Hardrock Block Model – Zones_5050 Folder ................................................................... 14-30 Table 14.12: Comparison of the Block and Composite Mean Gold Grades within In-Pit Area for the
Mineralized an External Grade Shell Domains ...................................................................................... 14-34 Table 14.13: Hardrock Pit Optimization Parameters ............................................................................. 14-41 Table 14.14: 2019 In-Pit Mineral Resources (Inclusive of Mineral Reserves) at Various Cut-off Grades for
the Hardrock Deposit – Measured and Indicated Category ................................................................... 14-42 Table 14.15: Input Parameters used for the Underground Cut-off Grade (UCoG) Estimation - Hardrock
Deposit ................................................................................................................................................... 14-43
NI 43-101 Technical Report Feasibility Study Update Hardrock Project, Ontario, Canada
List of Tables January 2021 Page iv
Table 14.16: 2019 Underground Mineral Resources at Various Cut-off Grades for the Hardrock Deposit –
Indicated and Inferred Category ............................................................................................................ 14-44 Table 14.17: Summary of Grade Sensitivities Undertaken on the Block Model. Measured and Indicated
Categories Combined, Reported within the 2019 MRE Pit Optimization Shell ...................................... 14-45 Table 14.18: Sensitivity Grade Estimate using more Conservative Capping Approach. Measured and
Indicated Categories Combined, Reported within the 2019 MRE Pit Optimization Shell ...................... 14-47 Table 14.19: Summary of 2019 Mineral Resource Estimate (Inclusive of Open-Pit Mineral Reserves) for
the Hardrock Project .............................................................................................................................. 14-48 Table 14.20: Summary of Changes in 2019 Mineral Resource Estimate (Measured and Indicated) vs.
2016 Estimate ........................................................................................................................................ 14-50 Table 14.21: 2019 In-Pit Mineral Resources (Exclusive of Mineral Reserves) at Various Cut-off Grades for
the Hardrock Deposit – Indicated and Inferred Categories .................................................................... 14-52 Table 14.22: Length-weighted Assays Statistics showing Grade Capping Levels and Metal Loss Factors
............................................................................................................................................................... 14-57 Table 14.23: Length-weighted Composite Statistics of Capped Gold Grades by Domain .................... 14-58 Table 14.24: Variogram Parameters for the Brookbank Deposit ........................................................... 14-59 Table 14.25: Brookbank Main Deposit Block Model Attributes .............................................................. 14-59 Table 14.26: Statistical Summary Of Bulk Density Data for the Brookbank Deposit ............................. 14-60 Table 14.27: Summary of Search Parameters - Brookbank Deposit ..................................................... 14-62 Table 14.28: Global Statistical Comparison between Blocks and Declustered Composites for all
Estimation Passes at Brookbank ........................................................................................................... 14-63 Table 14.29: Economic Parameters used in the Open Pit Analysis ...................................................... 14-65 Table 14.30: Economic Parameters used in the Underground Analysis ............................................... 14-66 Table 14.31: Summary of the Brookbank Mineral Resource ................................................................. 14-69 Table 14.32: Brookbank Open-Pit Mineral Resource Sensitivity ........................................................... 14-70 Table 14.33: Brookbank Underground Mineral Resource Sensitivity .................................................... 14-70 Table 14.34: Length-Weighted Assays Statistics showing Grade Capping Levels and Metal Loss Factors
............................................................................................................................................................... 14-74 Table 14.35: Length-weighted 2 m Composite Statistics of Capped Gold Grades by Domain ............. 14-76 Table 14.36: Key Lake Deposit Block Model Attributes ......................................................................... 14-77 Table 14.37: Statistical Summary of Bulk Density Data for the Key Lake Deposit ................................ 14-78 Table 14.38: Summary of Search Parameters – Key Lake Deposit ...................................................... 14-79 Table 14.39: Global Statistical Comparison between Blocks and Declustered Composites for all
Estimation Passes at Key Lake ............................................................................................................. 14-81 Table 14.40: Summary of the 2020 Key Lake Mineral Resource .......................................................... 14-85 Table 14.41: Key Lake Open-Pit Mineral Resource Sensitivity ............................................................. 14-86
NI 43-101 Technical Report Feasibility Study Update Hardrock Project, Ontario, Canada
List of Tables January 2021 Page v
Table 14.42: Length-Weighted Assays Statistics Showing Grade Capping Levels and Metal Loss Factors
............................................................................................................................................................... 14-90 Table 14.43: Length-weighted 2 m Composite Statistics of Capped Gold Grades by Domain ............. 14-91 Table 14.44: Variogram Parameters for the Kailey Deposit .................................................................. 14-92 Table 14.45: Kailey Deposit Block Model Attributes .............................................................................. 14-93 Table 14.46: Statistical Summary of Bulk Density Data for the Key Lake Deposit ................................ 14-94 Table 14.47: Summary of Search Parameters – Kailey Deposit ........................................................... 14-95 Table 14.48: Summary of Kailey Mineral Resource ............................................................................ 14-100 Table 14.49: Kailey Open-Pit Mineral Resource Sensitivity ................................................................ 14-101 Table 15.1: Hardrock Open Pit Mineral Reserve Estimate ...................................................................... 15-1 Table 15.2: Hardrock Final Wall Geotechnical Recommendations ......................................................... 15-3 Table 15.3: Optimization Parameters ...................................................................................................... 15-7 Table 15.4: Measured and Indicated Mineral Resource Whittle Shell Results ........................................ 15-8 Table 15.5: Measured and Indicated Mineral Resource Pit Shell Selection .......................................... 15-10 Table 15.6: Resource to Reserve Reconciliation ................................................................................... 15-13 Table 15.7: Hardrock Open Pit Mineral Reserves and Quantities ......................................................... 15-14 Table 16.1: Pit Phase Design Summary .................................................................................................. 16-2 Table 16.2: Pit Phase Design Criteria ...................................................................................................... 16-3 Table 16.3: Waste Storage Capacities .................................................................................................... 16-9 Table 16.4: Waste Pile Design Criteria .................................................................................................... 16-9 Table 16.5: Ore Grade Bins Cut-off-Grades .......................................................................................... 16-10 Table 16.6: Stockpile Design Criteria ..................................................................................................... 16-10 Table 16.7: Life-of-Mine Production Schedule ....................................................................................... 16-19 Table 16.8: Drill & Blast Parameters ...................................................................................................... 16-21 Table 16.9: Pre-Split Parameters ........................................................................................................... 16-24 Table 16.10: Loading Specifications ...................................................................................................... 16-26 Table 16.11: Speed Limits ..................................................................................................................... 16-27 Table 16.12: Rolling Resistance ............................................................................................................ 16-27 Table 16.13: Cycle Time Components ................................................................................................... 16-28 Table 16.14: Haulages Hours and Cycle Times by Material Type......................................................... 16-30 Table 16.15: Equipment Usage Model Assumptions ............................................................................. 16-34 Table 16.16: Equipment Purchase Schedule ......................................................................................... 16-38 Table 16.17: Workforce Requirements .................................................................................................. 16-39 Table 17.1: Key General Process Design Criteria ................................................................................... 17-1 Table 17.2: Global Composite Sample Composition ............................................................................... 17-2 Table 17.3: Comminution Parameters (Weighted Averages) .................................................................. 17-3 Table 17.4: Composite for Multivariate Analysis ...................................................................................... 17-6
NI 43-101 Technical Report Feasibility Study Update Hardrock Project, Ontario, Canada
List of Tables January 2021 Page vi
Table 17.5: Leach Tests Parameters Range ........................................................................................... 17-7 Table 18.1: Maximum Operating Volumes and EDF Storage for Each Pond ........................................ 18-18 Table 18.2: Average and Peak Power Demand..................................................................................... 18-20 Table 20.1: Potential Permits / Approvals .............................................................................................. 20-35 Table 20.2: Influence of Consultation on the EIS/EA ............................................................................. 20-40 Table 21.1: Capital Expenditures Summary ............................................................................................ 21-2 Table 21.2: Infrastructure Capital Expenditures....................................................................................... 21-4 Table 21.3: Power Supply and Communications Capital Expenditures .................................................. 21-4 Table 21.4: Water and Tailings Management Capital Expenditures ....................................................... 21-5 Table 21.5: Mobile Equipment Capital Expenditures ............................................................................... 21-6 Table 21.6: Process Plant Capital Costs ................................................................................................. 21-6 Table 21.7: Indirect Costs ........................................................................................................................ 21-8 Table 21.8: Sustaining Capital Costs ..................................................................................................... 21-10 Table 21.9: Operating Costs Summary .................................................................................................. 21-10 Table 21.10: Peak Operations Workforce .............................................................................................. 21-11 Table 21.11: Total Operating Costs Summary ....................................................................................... 21-12 Table 21.12: Mining Cost Summary Total .............................................................................................. 21-14 Table 21.13: Top Three Mining Costs by Cost Type ............................................................................. 21-14 Table 21.14: Process Operating Costs Summary ................................................................................. 21-15 Table 21.15: General and Administration Operating Costs Summary ................................................... 21-18 Table 22.1: Mill Commissioning and Ramp-up ........................................................................................ 22-3 Table 22.2: Annual Mine and Mill Production Summary .......................................................................... 22-5 Table 22.3: Operating Cost Summary ..................................................................................................... 22-7 Table 22.4: Sustaining Capital Summary ................................................................................................. 22-9 Table 22.5: Salvage Value ....................................................................................................................... 22-9 Table 22.6: Reclamation and Closure Cost ........................................................................................... 22-10 Table 22.7: Funding Summary ............................................................................................................... 22-11 Table 22.8: Project Economic Results Summary................................................................................... 22-13 Table 22.9: Project Net Present Values at Various Discount Rates ...................................................... 22-14 Table 22.10: Project After-Tax Sensitivities ........................................................................................... 22-14 Table 22.11: Project Cash Flow Summary ............................................................................................ 22-15 Table 23.1: Gold Production Statistics for the Bankfield, Little Long Lac, Magnet, Talmora Long Lac and
Tombill Mines (from Ferguson et al., 1971; Mason and White 1986) ...................................................... 23-1 Table 25.1: Technical FS Update – LOM Results ................................................................................... 25-1 Table 26.1: Costs Associated with Exploration & Geology-Related Recommendations ......................... 26-2
NI 43-101 Technical Report Feasibility Study Update Hardrock Project, Ontario Canada
Section 1 January 2021 Page 1-1
SUMMARY
1.1 Introduction
The 2016 Hardrock Project Feasibility Study (“FS”) concluded that the Hardrock Project (the “Project”) is
technically and economically feasible. Since the FS, Greenstone Gold Mines GP Inc. acting as the
managing partner of Greenstone Gold Mines LP (collectively, “GGM”), has advanced Project de-risking
activities, including receiving federal and provincial approval of the EIS/EA, establishing the Long Term
Relationship Agreements, advancing permitting activities, confirming the continuity of gold grade through
additional drilling, optimizing the pit design and mining plan and concluding a value engineering initiative.
As part of the 2019 approved work plan, GGM, G Mining Services Inc. (“GMS”) and several engineering
consultants collaborated to prepare a Technical Report Feasibility Study Update. The objective of the
Project Update included updating the resource and reserve models, revising the life of mine plan, advancing
detailed engineering and completing firm price bid processes for all major process plant, equipment, power
plant equipment, effluent and sewage treatment plants and the mine mobile equipment fleet. This work
formed the basis of the capital cost, operating cost and project economic update. This Report Feasibility
Study Update Report (“Report”) was prepared for Premier Gold Mines Limited (“Premier”) and summarizes
the results of this work.
On December 15, 2020 the Orion Mine Finance Group (“Orion”), has entered into an agreement (the
“Purchase Agreement”) with Centerra and Premier pursuant to which Orion will acquire Centerra's 50%
interest in the GGM Partnership. On December 16, 2020 Equinox Gold Corp. and Premier entered into a
definitive agreement (the “Agreement”) whereby Equinox Gold will acquire all of the outstanding shares of
Premier. Equinox Gold will retain Premier’s interest in the world-class Hardrock Project in Ontario.
The scope of this Report includes the geology and Mineral Resources of the Hardrock Property and the
other properties (Brookbank, Kailey and Key Lake, collectively known as the “Hardrock Satellite Deposits”).
The Mineral Reserves, mining, infrastructure, processing and financial analysis sections of this Report
consider the Hardrock Deposit only.
The Report and Project Update responsibilities of the engineering consultants follow:
• G Mining Services Inc. (“GMS”) - overall Report and integration, property description and location,
accessibility, history, geological setting and mineralization, deposit types, exploration, drilling,
sample preparation and security, data verification, Mineral Resource estimates, Mineral Reserves
NI 43-101 Technical Report Feasibility Study Update Hardrock Project, Ontario Canada
Section 1 January 2021 Page 1-2
(pertaining to the Hardrock deposit only), mining methods, economic analysis, operating costs
pertaining to mining, review of capital costs;
• Stantec Consulting Limited (“Stantec”) - climate and physiology, environmental, permitting unless
otherwise noted, and social aspects;
• Soutex Inc. (“Soutex”) - metallurgical testing, recovery methods, mineral processing operating cost;
• Ausenco Engineering Canada Inc. (”Ausenco”) – processing plant and supporting infrastructure
engineering;
• Wood Canada Limited (“Wood”) - Tailings Management Facility (TMF) design, Goldfield Creek
diversion design, geotechnical engineering for the waste rock storage areas, TMF Closure Plan and
permitting of TMF related facilities;
• SLR Consulting (Canada) Ltd. (“SLR”) – northside water management, mine rock stockpile pond
design and mine site water balance.
1.2 Property Description and Land Tenure
GGM’s Greenstone Gold Property, formerly known as the Trans-Canada Property (the “Property”) is located
approximately 275 km northeast of Thunder Bay, Ontario. The Property includes three blocks of contiguous
claims known as the Hardrock, Brookbank and Viper areas, over a distance of more than 100 km, located
along, or in close proximity to, the Trans-Canada Highway between the towns of Beardmore and Longlac,
Ontario.
The Hardrock claim group includes the Hardrock, Key Lake and Kailey Deposits. The Brookbank claim
group hosts the Brookbank, Cherbourg and Fox Ear deposits and the Irwin prospect.
As of the date of this Report, the Property consists of a contiguous block of patented claims, mining leases,
licences of occupation and cell claims covering a total area 39,072.1 hectares (“ha”), of which 15,862.7 ha
relates to Hardrock Project claims. All claims, leases and licences of occupation are beneficially held by
GGM on behalf of the Partnership and are subject to terms under a number of agreements.
1.3 Mineral Resource Estimate
1.3.1 Hardrock Project
Since the previous Mineral Resource was released in 2016, substantial drilling has been conducted and
was successful in de-risking the Mineral Resource Estimate (“MRE”) in the early years of production.
NI 43-101 Technical Report Feasibility Study Update Hardrock Project, Ontario Canada
Section 1 January 2021 Page 1-3
RC grade control drilling on a 20 m (X) by 10 m (Y) spacing was undertaken in 2018 and 2019 targeting
the first three benches of production, and also partially tested an additional four benches in certain areas.
In 2019, diamond drilling was undertaken in areas identified as requiring infill drilling, and resulted in the
validation of the new geological interpretation and confirmation of the grade continuity.
The principal factors contributing to the increase in the current MRE are as follows:
• The 2019 MRE is constrained by a deeper pit optimization, which incorporates significantly more
resources compared to the 2016 MRE;
• The reduction of internal dilution within the seventeen principal domains has resulted in a 24%
increase in average grade of assays within these domains, thus a higher overall gold grade in the
mineral resource;
• Grade capping was revisited in 2019 (due to the refined wireframes), and new capping thresholds
were chosen. They are generally less restrictive than the capping chosen in 2016;
• RC grade-control drilling and validation diamond drilling conducted in 2018 and 2019 confirmed
grade continuity, and generally intersected higher-grades than expected in the 2016 block model.
Definitions for Mineral Resource categories used in this Report are consistent with the Canadian Institute
of Mining, Metallurgy and Petroleum (“CIM”) Definition Standards for Mineral Resources and Mineral
Reserves dated May 10, 2014 (“CIM definitions”) and adopted by NI 43-101. GMS is not aware of any
environmental, permitting, legal, title-related, taxation, socio-political, marketing or other relevant issue that
could materially affect the Mineral Resource estimate.
This Report is based on an open pit mining scenario. The in-pit Mineral Resources at the Hardrock Deposit
are constrained within the design pit using a cut-off grade of 0.30 g Au/t. In addition to in-pit Mineral
Resources, an underground Mineral Resource was estimated outside the open pit using a 2.0 g Au/t cut-
off grade. The Project open pit and underground Mineral Resources are summarized in Table 1.1.
The Mineral Resource estimate covers a corridor of the Hardrock deposit with a strike length of 5.7 km and
a width of approximately 1.7 km, down to a vertical depth of 1.8 km below surface. Mineralized zones were
interpreted in 3D using Leapfrog GEO™ software based on a litho-structural model and the drill hole
database. The drill hole database used in the estimate contained 312,408 sampled intervals from
696,125 m of diamond drilling in 1,682 holes, and 11,871 assays from 25,961 m of RC drilling in 481 holes.
Channel samples were not used in the estimation.
Mineral Resources were estimated by applying a minimum true thickness of 3.0 m and using the grade of
the adjacent material when assayed or a value of zero when not assayed. High-grade capping on raw assay
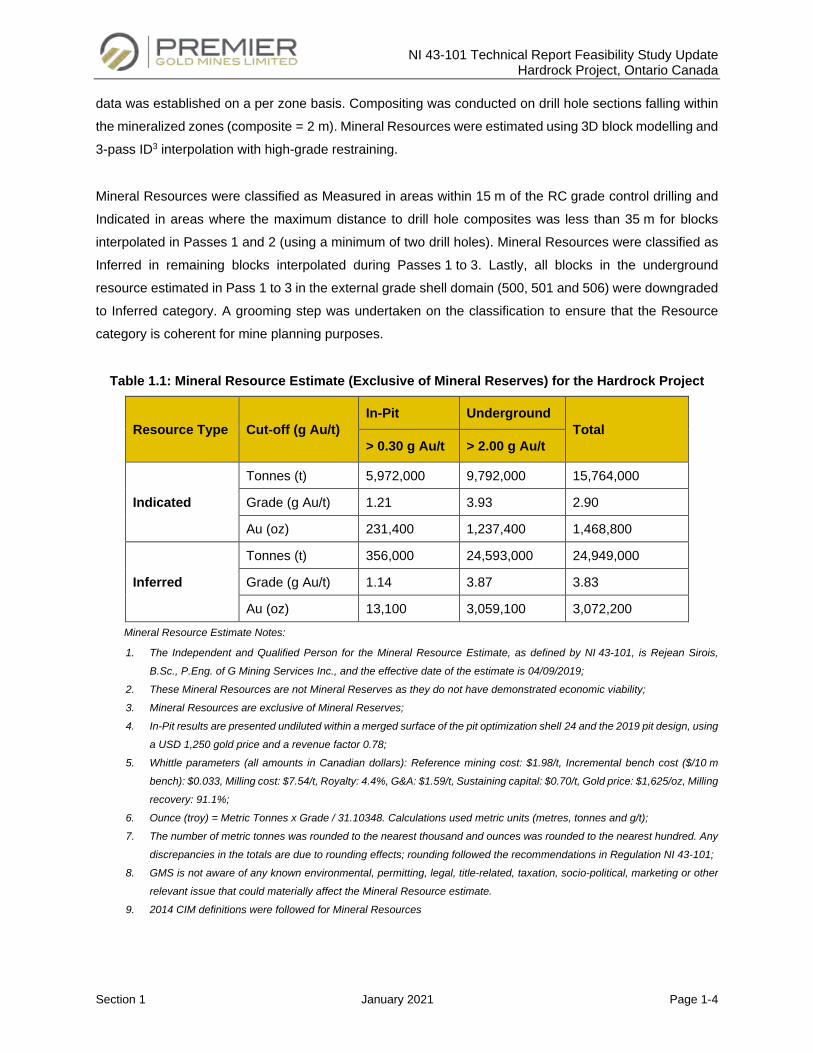
NI 43-101 Technical Report Feasibility Study Update Hardrock Project, Ontario Canada
Section 1 January 2021 Page 1-4
data was established on a per zone basis. Compositing was conducted on drill hole sections falling within
the mineralized zones (composite = 2 m). Mineral Resources were estimated using 3D block modelling and
3-pass ID3 interpolation with high-grade restraining.
Mineral Resources were classified as Measured in areas within 15 m of the RC grade control drilling and
Indicated in areas where the maximum distance to drill hole composites was less than 35 m for blocks
interpolated in Passes 1 and 2 (using a minimum of two drill holes). Mineral Resources were classified as
Inferred in remaining blocks interpolated during Passes 1 to 3. Lastly, all blocks in the underground
resource estimated in Pass 1 to 3 in the external grade shell domain (500, 501 and 506) were downgraded
to Inferred category. A grooming step was undertaken on the classification to ensure that the Resource
category is coherent for mine planning purposes.
Table 1.1: Mineral Resource Estimate (Exclusive of Mineral Reserves) for the Hardrock Project
Resource Type Cut-off (g Au/t) In-Pit Underground
Total > 0.30 g Au/t > 2.00 g Au/t
Indicated
Tonnes (t) 5,972,000 9,792,000 15,764,000
Grade (g Au/t) 1.21 3.93 2.90
Au (oz) 231,400 1,237,400 1,468,800
Inferred
Tonnes (t) 356,000 24,593,000 24,949,000
Grade (g Au/t) 1.14 3.87 3.83
Au (oz) 13,100 3,059,100 3,072,200
Mineral Resource Estimate Notes:
1. The Independent and Qualified Person for the Mineral Resource Estimate, as defined by NI 43-101, is Rejean Sirois,
B.Sc., P.Eng. of G Mining Services Inc., and the effective date of the estimate is 04/09/2019;
2. These Mineral Resources are not Mineral Reserves as they do not have demonstrated economic viability;
3. Mineral Resources are exclusive of Mineral Reserves;
4. In-Pit results are presented undiluted within a merged surface of the pit optimization shell 24 and the 2019 pit design, using
a USD 1,250 gold price and a revenue factor 0.78;
5. Whittle parameters (all amounts in Canadian dollars): Reference mining cost: $1.98/t, Incremental bench cost ($/10 m
bench): $0.033, Milling cost: $7.54/t, Royalty: 4.4%, G&A: $1.59/t, Sustaining capital: $0.70/t, Gold price: $1,625/oz, Milling
recovery: 91.1%;
6. Ounce (troy) = Metric Tonnes x Grade / 31.10348. Calculations used metric units (metres, tonnes and g/t);
7. The number of metric tonnes was rounded to the nearest thousand and ounces was rounded to the nearest hundred. Any
discrepancies in the totals are due to rounding effects; rounding followed the recommendations in Regulation NI 43-101;
8. GMS is not aware of any known environmental, permitting, legal, title-related, taxation, socio-political, marketing or other
relevant issue that could materially affect the Mineral Resource estimate.
9. 2014 CIM definitions were followed for Mineral Resources
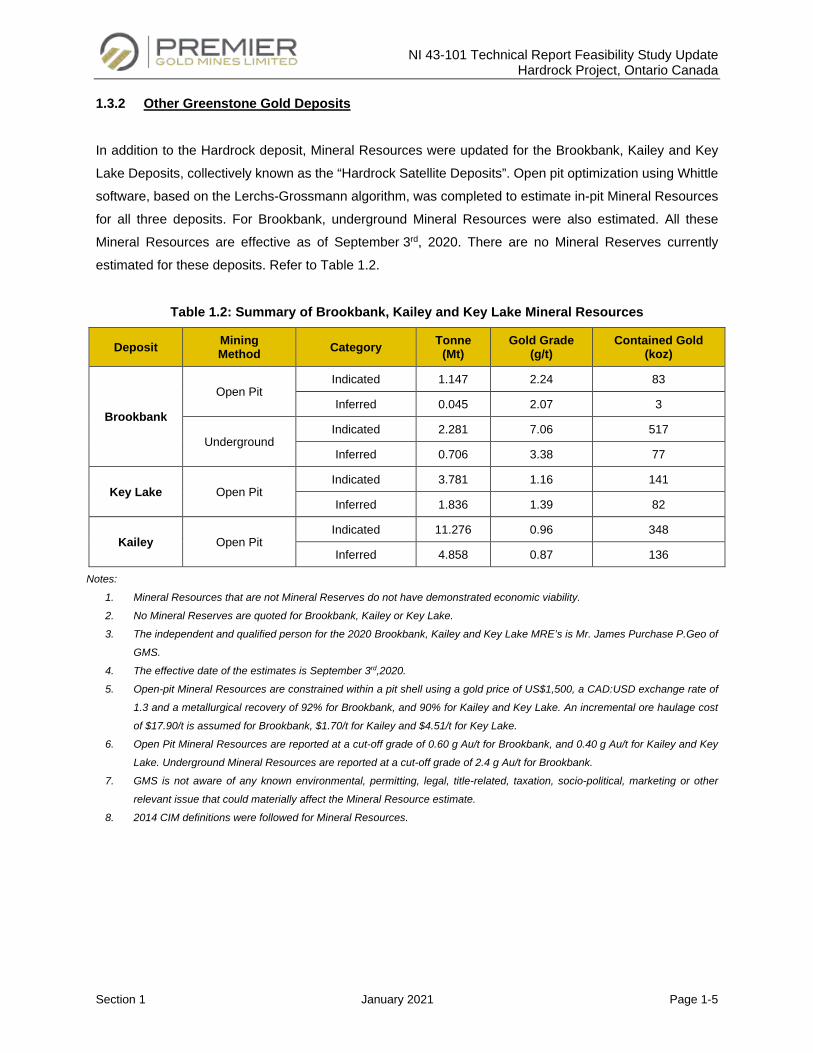
NI 43-101 Technical Report Feasibility Study Update Hardrock Project, Ontario Canada
Section 1 January 2021 Page 1-5
1.3.2 Other Greenstone Gold Deposits
In addition to the Hardrock deposit, Mineral Resources were updated for the Brookbank, Kailey and Key
Lake Deposits, collectively known as the “Hardrock Satellite Deposits”. Open pit optimization using Whittle
software, based on the Lerchs-Grossmann algorithm, was completed to estimate in-pit Mineral Resources
for all three deposits. For Brookbank, underground Mineral Resources were also estimated. All these
Mineral Resources are effective as of September 3rd, 2020. There are no Mineral Reserves currently
estimated for these deposits. Refer to Table 1.2.
Table 1.2: Summary of Brookbank, Kailey and Key Lake Mineral Resources
Deposit Mining Method Category Tonne
(Mt) Gold Grade
(g/t) Contained Gold
(koz)
Brookbank
Open Pit Indicated 1.147 2.24 83
Inferred 0.045 2.07 3
Underground Indicated 2.281 7.06 517
Inferred 0.706 3.38 77
Key Lake Open Pit Indicated 3.781 1.16 141
Inferred 1.836 1.39 82
Kailey Open Pit Indicated 11.276 0.96 348
Inferred 4.858 0.87 136
Notes:
1. Mineral Resources that are not Mineral Reserves do not have demonstrated economic viability.
2. No Mineral Reserves are quoted for Brookbank, Kailey or Key Lake.
3. The independent and qualified person for the 2020 Brookbank, Kailey and Key Lake MRE’s is Mr. James Purchase P.Geo of
GMS.
4. The effective date of the estimates is September 3rd,2020.
5. Open-pit Mineral Resources are constrained within a pit shell using a gold price of US$1,500, a CAD:USD exchange rate of
1.3 and a metallurgical recovery of 92% for Brookbank, and 90% for Kailey and Key Lake. An incremental ore haulage cost
of $17.90/t is assumed for Brookbank, $1.70/t for Kailey and $4.51/t for Key Lake.
6. Open Pit Mineral Resources are reported at a cut-off grade of 0.60 g Au/t for Brookbank, and 0.40 g Au/t for Kailey and Key
Lake. Underground Mineral Resources are reported at a cut-off grade of 2.4 g Au/t for Brookbank.
7. GMS is not aware of any known environmental, permitting, legal, title-related, taxation, socio-political, marketing or other
relevant issue that could materially affect the Mineral Resource estimate.
8. 2014 CIM definitions were followed for Mineral Resources.
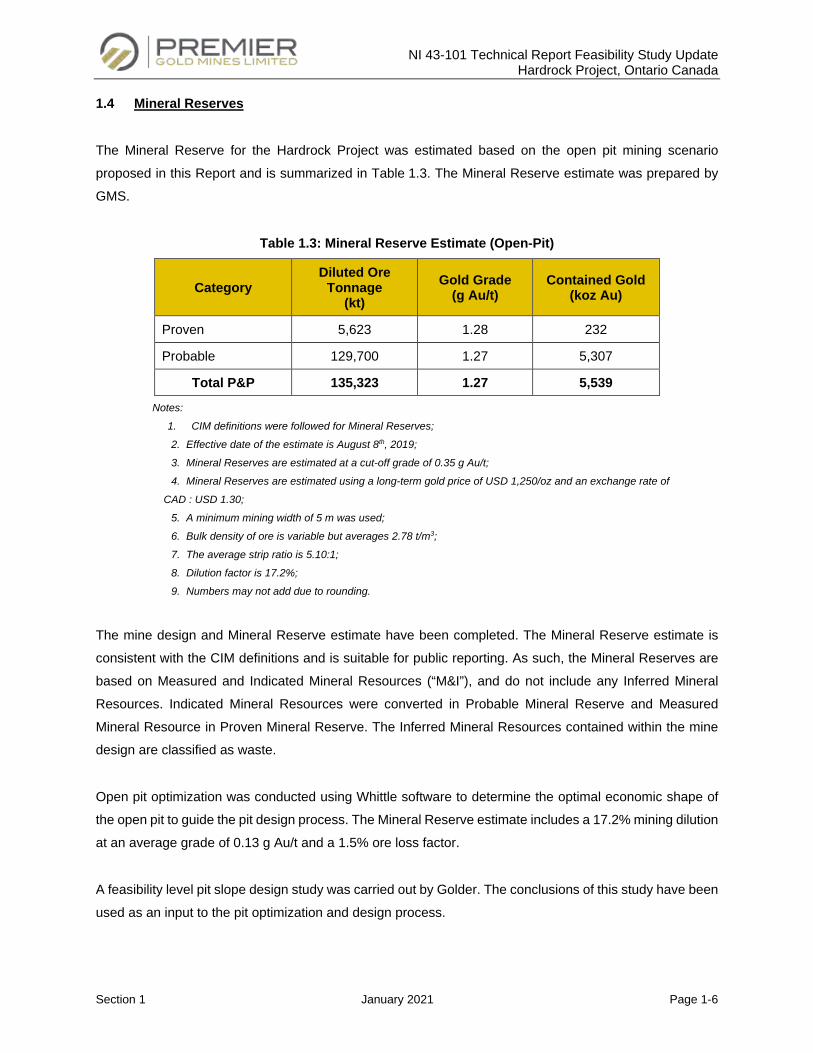
NI 43-101 Technical Report Feasibility Study Update Hardrock Project, Ontario Canada
Section 1 January 2021 Page 1-6
1.4 Mineral Reserves
The Mineral Reserve for the Hardrock Project was estimated based on the open pit mining scenario
proposed in this Report and is summarized in Table 1.3. The Mineral Reserve estimate was prepared by
GMS.
Table 1.3: Mineral Reserve Estimate (Open-Pit)
Category Diluted Ore
Tonnage (kt)
Gold Grade (g Au/t)
Contained Gold (koz Au)
Proven 5,623 1.28 232
Probable 129,700 1.27 5,307
Total P&P 135,323 1.27 5,539
Notes:
1. CIM definitions were followed for Mineral Reserves;
2. Effective date of the estimate is August 8th, 2019;
3. Mineral Reserves are estimated at a cut-off grade of 0.35 g Au/t;
4. Mineral Reserves are estimated using a long-term gold price of USD 1,250/oz and an exchange rate of
CAD : USD 1.30;
5. A minimum mining width of 5 m was used;
6. Bulk density of ore is variable but averages 2.78 t/m3;
7. The average strip ratio is 5.10:1;
8. Dilution factor is 17.2%;
9. Numbers may not add due to rounding.
The mine design and Mineral Reserve estimate have been completed. The Mineral Reserve estimate is
consistent with the CIM definitions and is suitable for public reporting. As such, the Mineral Reserves are
based on Measured and Indicated Mineral Resources (“M&I”), and do not include any Inferred Mineral
Resources. Indicated Mineral Resources were converted in Probable Mineral Reserve and Measured
Mineral Resource in Proven Mineral Reserve. The Inferred Mineral Resources contained within the mine
design are classified as waste.
Open pit optimization was conducted using Whittle software to determine the optimal economic shape of
the open pit to guide the pit design process. The Mineral Reserve estimate includes a 17.2% mining dilution
at an average grade of 0.13 g Au/t and a 1.5% ore loss factor.
A feasibility level pit slope design study was carried out by Golder. The conclusions of this study have been
used as an input to the pit optimization and design process.
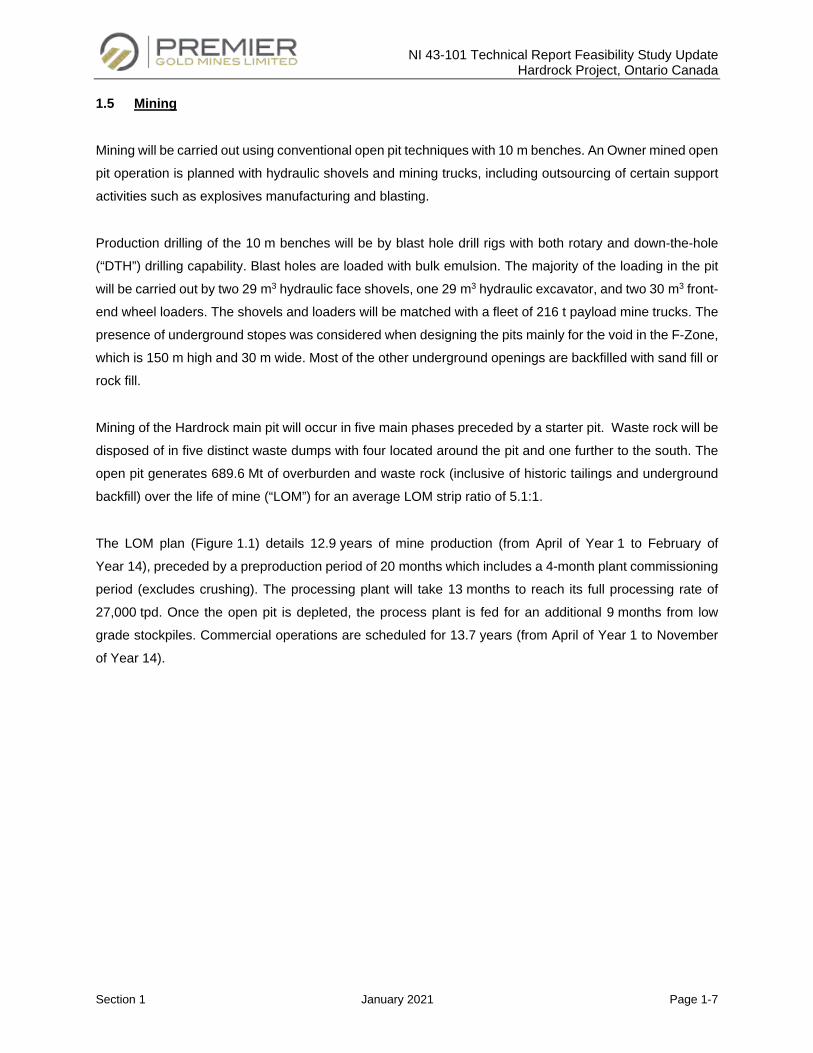
NI 43-101 Technical Report Feasibility Study Update Hardrock Project, Ontario Canada
Section 1 January 2021 Page 1-7
1.5 Mining
Mining will be carried out using conventional open pit techniques with 10 m benches. An Owner mined open
pit operation is planned with hydraulic shovels and mining trucks, including outsourcing of certain support
activities such as explosives manufacturing and blasting.
Production drilling of the 10 m benches will be by blast hole drill rigs with both rotary and down-the-hole
(“DTH”) drilling capability. Blast holes are loaded with bulk emulsion. The majority of the loading in the pit
will be carried out by two 29 m3 hydraulic face shovels, one 29 m3 hydraulic excavator, and two 30 m3 front-
end wheel loaders. The shovels and loaders will be matched with a fleet of 216 t payload mine trucks. The
presence of underground stopes was considered when designing the pits mainly for the void in the F-Zone,
which is 150 m high and 30 m wide. Most of the other underground openings are backfilled with sand fill or
rock fill.
Mining of the Hardrock main pit will occur in five main phases preceded by a starter pit. Waste rock will be
disposed of in five distinct waste dumps with four located around the pit and one further to the south. The
open pit generates 689.6 Mt of overburden and waste rock (inclusive of historic tailings and underground
backfill) over the life of mine (“LOM”) for an average LOM strip ratio of 5.1:1.
The LOM plan (Figure 1.1) details 12.9 years of mine production (from April of Year 1 to February of
Year 14), preceded by a preproduction period of 20 months which includes a 4-month plant commissioning
period (excludes crushing). The processing plant will take 13 months to reach its full processing rate of
27,000 tpd. Once the open pit is depleted, the process plant is fed for an additional 9 months from low
grade stockpiles. Commercial operations are scheduled for 13.7 years (from April of Year 1 to November
of Year 14).
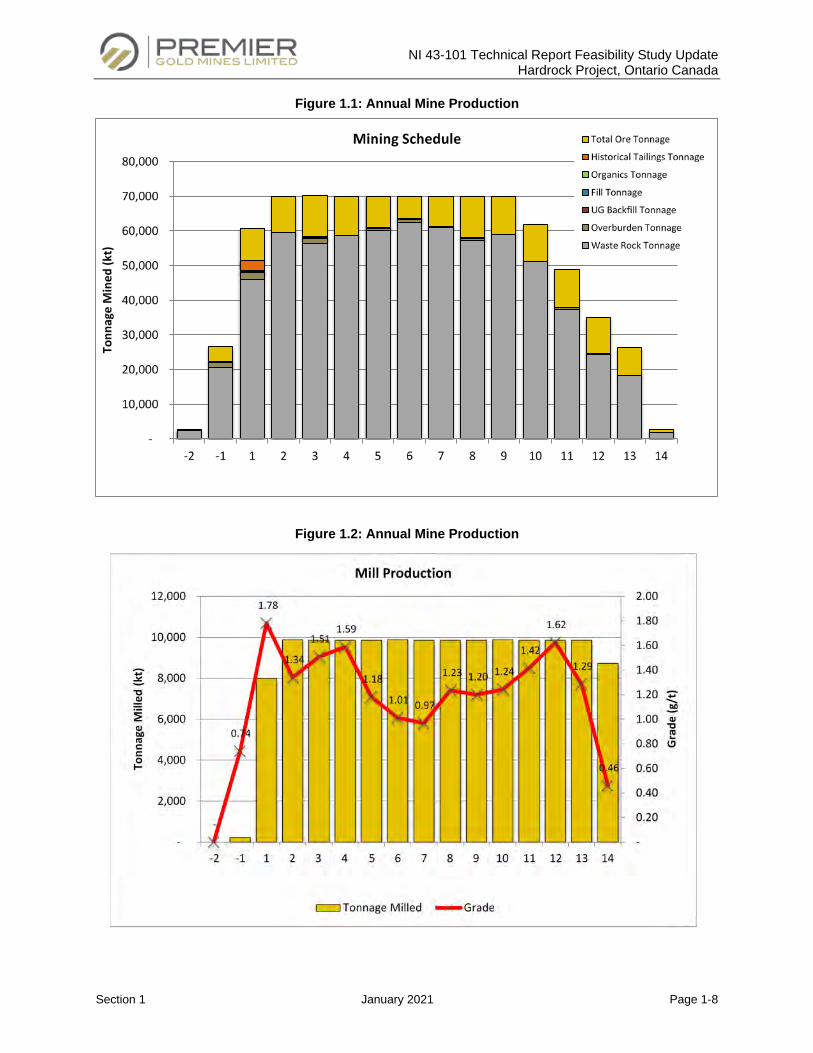
NI 43-101 Technical Report Feasibility Study Update Hardrock Project, Ontario Canada
Section 1 January 2021 Page 1-8
Figure 1.1: Annual Mine Production
Figure 1.2: Annual Mine Production
NI 43-101 Technical Report Feasibility Study Update Hardrock Project, Ontario Canada
Section 1 January 2021 Page 1-9
1.6 Mineral Processing and Metallurgical Testing
The process design criteria have been established based on testwork results, GGM and vendor
recommendations or requirements and industry practices.
Prior to the start of the FS, between 2011 and 2013, mineralogy, grindability and gold recovery testwork
was performed by SGS Lakefield Research Limited (“SGS Lakefield”) and McClelland Laboratories Inc.
(“McClelland”). The SGS Lakefield testwork showed that the ore is composed mainly of quartz and
plagioclase with minor amounts of pyrite and arsenopyrite, gold occurs mainly as native gold, the ore is in
the category of medium hardness to moderately hard, a portion of the gold can be recovered by gravity
concentration and gold can be recovered to a bulk flotation concentrate. The subsequent McClelland
testwork showed that gold recovery increased with finer grind size and was unaffected by cyanide
concentration.
In the course of the Preliminary Economic Assessment (“PEA”) and FS, additional testwork was carried out
by SGS Lakefield, JKTech Pty Ltd and FLSmidth. Primarily, high pressure grinding roll (“HPGR”) tests
confirmed the ore amenability for high pressure grinding, and facilitated equipment selection and operating
cost estimation. Grindability, head grade determination, mineralogy, magnetic separation, gravity recovery,
flotation, cyanidation, cyanide destruction, solid-liquid separation and other tests were completed.
Additional thickening and rheology testwork were carried out to determine the sizing and operating
parameters of a pre-leach thickener.
The HPGR testing program included laboratory scale tests to determine the amenability of the ore to HPGR
milling and yield preliminary sizing data; abrasion tests to predict the service life of the rolls and a large-
scale pilot plant test to size the equipment. Bond grindability testing was performed to evaluate the Ball
Work Index (“BWI”) reduction of the HPGR product compared to the feed. A detailed comminution trade-
off study recommended two-stage crushing followed by HPGR and ball milling over crushing followed by
semi-autogenous (“SAG”) milling and ball milling, to reduce throughput risk and increase energy efficiency.
In the detailed engineering phase additional leach test work was carried out on near-surface samples from
the 2018 drilling campaign to characterize gold recovery, oxygen consumption, solid-liquid separation and
rheology.
A multivariate linear regression analysis was used to estimate gold recovery based on ore grade and
mineralogical composition. The results of the cyanidation tests conducted on composites were used as the
basis for the analysis. The residual gold grade from the cyanidation testwork was found to be highly
correlated to the gold, arsenic and sulphur head sample grades, and somewhat less on grind size.
NI 43-101 Technical Report Feasibility Study Update Hardrock Project, Ontario Canada
Section 1 January 2021 Page 1-10
The gold recovery process for the Project consists of a crushing circuit (gyratory and cone), a grinding
circuit (HPGR and ball mill), pre-leach thickening and cyanide leaching, a carbon in pulp (“CIP”) circuit,
carbon elution and regeneration, electrowinning and gold refining, cyanide destruction and tailings disposal.
The plant is designed to operate at a throughput of 27,000 t/d. The process operation schedule is 24 hours
per day, 365 days per year, with an overall availability of 92%.
Gold production averages 414 koz for the first five years of production (from start of Year 1 to end of Year 5)
with an average head grade of 1.45 g Au/t and an average metallurgical recovery of 91.2%.
1.7 Mine Infrastructure and Services
The Project occurs in a district with active mines and processing facilities located at Hemlo and Timmins,
Ontario and therefore has access to good transportation and regional mining related infrastructure. The
Project is located in close proximity to the Trans-Canada Highway 11, TransCanada Pipelines Limited
Canadian Mainline (“TCPL Mainline”) natural gas pipeline, a Hydro One electrical substation and Geraldton
hosts a municipal airport, which has a 1,500 m runway capable of accommodating large aircraft. Geraldton
has its own potable water treatment system and water distribution network, which are proposed to be used
for the Project.
General infrastructure for the Project that will be constructed to support mining and processing will include:
• Site access and haul roads;
• Workshop and maintenance facility;
• Warehousing for spare parts and reagents;
• Administration building including a dry facility, gatehouse and parking area;
• Explosive reagent storage;
• Fuel storage and distribution;
• Recycling and sorting facility;
• Potable water and sewage systems;
• Fire water systems;
• Site security and fencing.
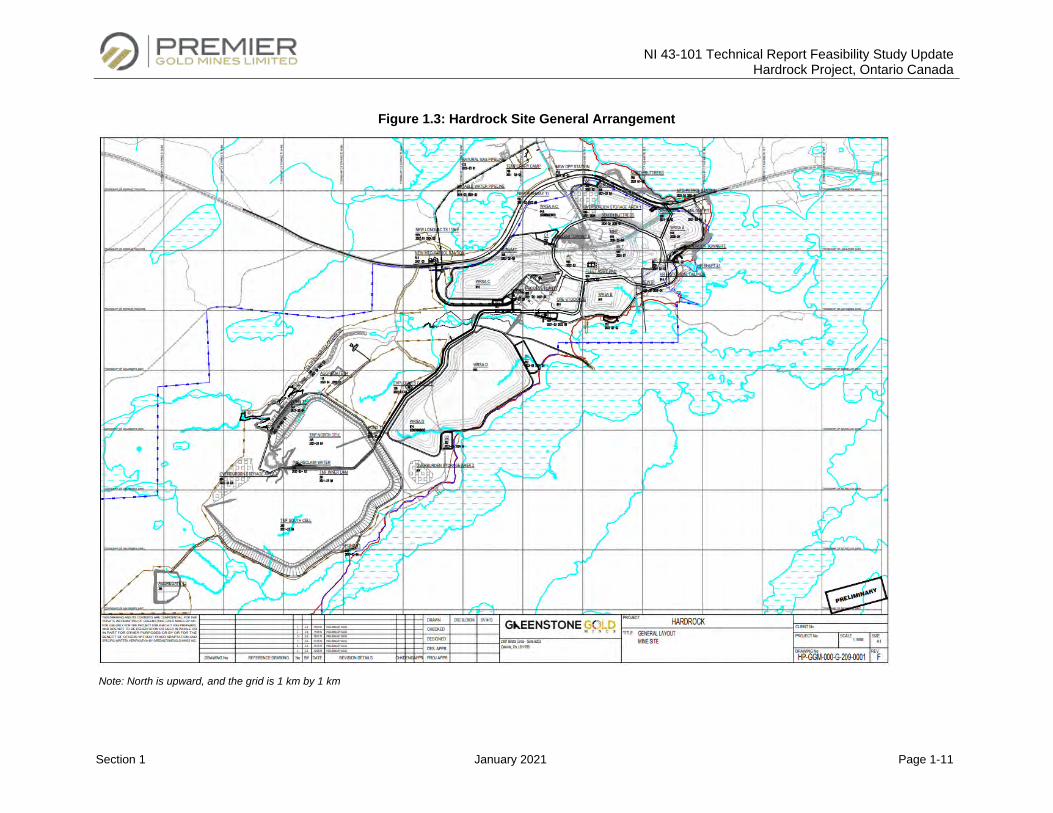
NI 43-101 Technical Report Feasibility Study Update Hardrock Project, Ontario Canada
Section 1 January 2021 Page 1-11
Figure 1.3: Hardrock Site General Arrangement
Note: North is upward, and the grid is 1 km by 1 km
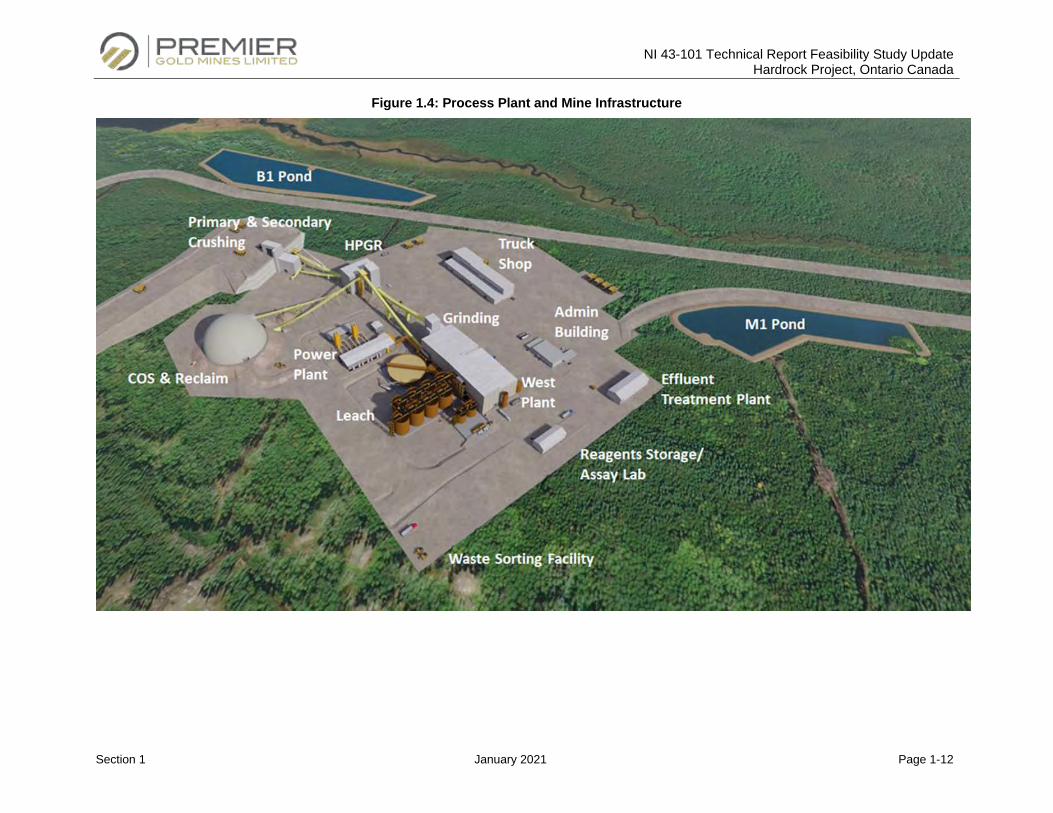
NI 43-101 Technical Report Feasibility Study Update Hardrock Project, Ontario Canada
Section 1 January 2021 Page 1-12
Figure 1.4: Process Plant and Mine Infrastructure
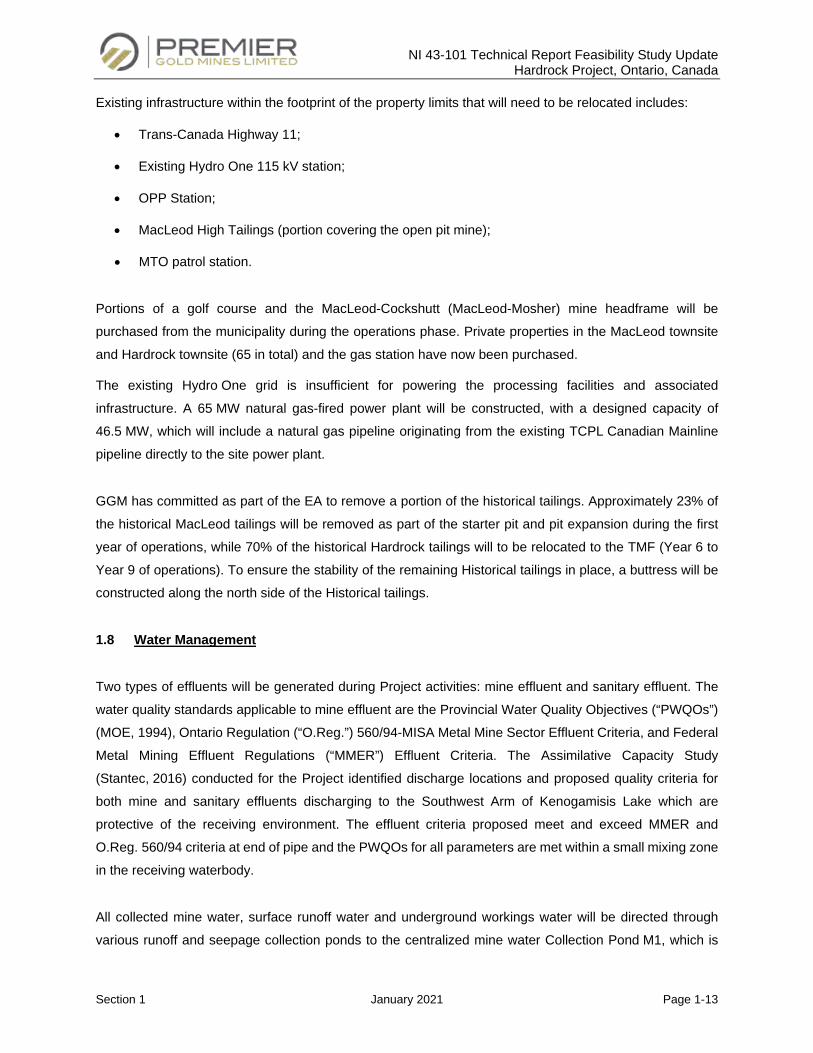
NI 43-101 Technical Report Feasibility Study Update Hardrock Project, Ontario, Canada
Section 1 January 2021 Page 1-13
Existing infrastructure within the footprint of the property limits that will need to be relocated includes:
• Trans-Canada Highway 11;
• Existing Hydro One 115 kV station;
• OPP Station;
• MacLeod High Tailings (portion covering the open pit mine);
• MTO patrol station.
Portions of a golf course and the MacLeod-Cockshutt (MacLeod-Mosher) mine headframe will be
purchased from the municipality during the operations phase. Private properties in the MacLeod townsite
and Hardrock townsite (65 in total) and the gas station have now been purchased.
The existing Hydro One grid is insufficient for powering the processing facilities and associated
infrastructure. A 65 MW natural gas-fired power plant will be constructed, with a designed capacity of
46.5 MW, which will include a natural gas pipeline originating from the existing TCPL Canadian Mainline
pipeline directly to the site power plant.
GGM has committed as part of the EA to remove a portion of the historical tailings. Approximately 23% of
the historical MacLeod tailings will be removed as part of the starter pit and pit expansion during the first
year of operations, while 70% of the historical Hardrock tailings will to be relocated to the TMF (Year 6 to
Year 9 of operations). To ensure the stability of the remaining Historical tailings in place, a buttress will be
constructed along the north side of the Historical tailings.
1.8 Water Management
Two types of effluents will be generated during Project activities: mine effluent and sanitary effluent. The
water quality standards applicable to mine effluent are the Provincial Water Quality Objectives (“PWQOs”)
(MOE, 1994), Ontario Regulation (“O.Reg.”) 560/94-MISA Metal Mine Sector Effluent Criteria, and Federal
Metal Mining Effluent Regulations (“MMER”) Effluent Criteria. The Assimilative Capacity Study
(Stantec, 2016) conducted for the Project identified discharge locations and proposed quality criteria for
both mine and sanitary effluents discharging to the Southwest Arm of Kenogamisis Lake which are
protective of the receiving environment. The effluent criteria proposed meet and exceed MMER and
O.Reg. 560/94 criteria at end of pipe and the PWQOs for all parameters are met within a small mixing zone
in the receiving waterbody.
All collected mine water, surface runoff water and underground workings water will be directed through
various runoff and seepage collection ponds to the centralized mine water Collection Pond M1, which is
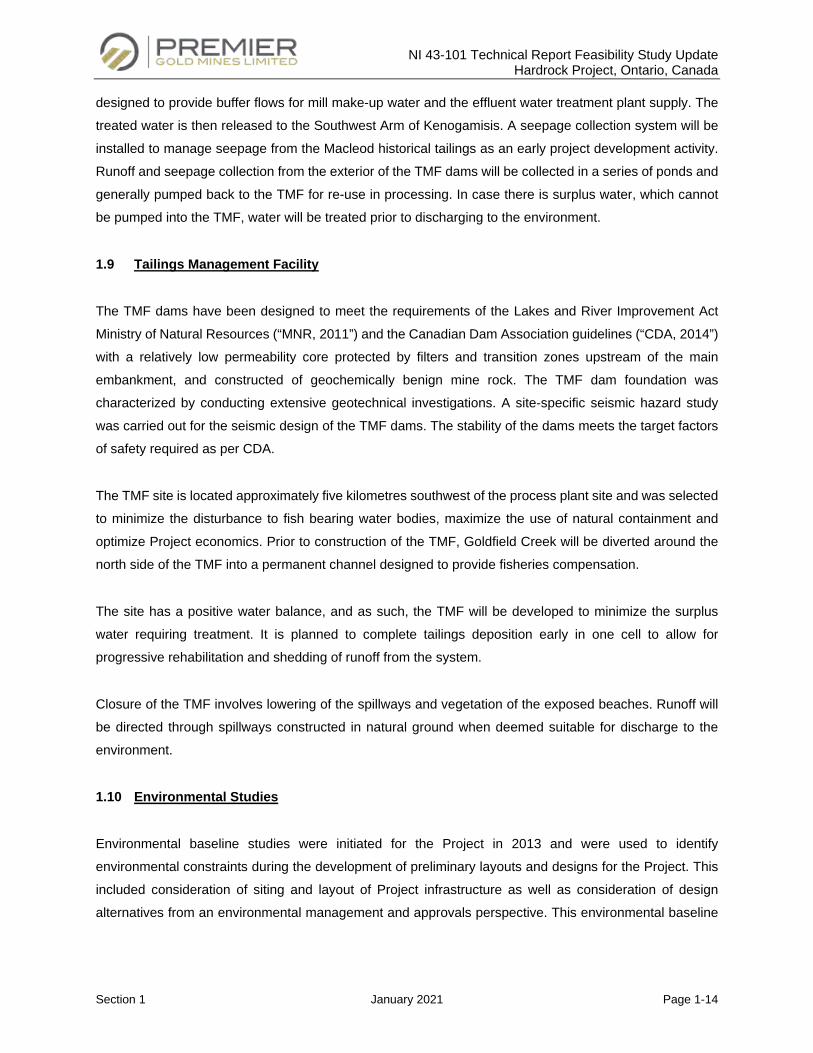
NI 43-101 Technical Report Feasibility Study Update Hardrock Project, Ontario, Canada
Section 1 January 2021 Page 1-14
designed to provide buffer flows for mill make-up water and the effluent water treatment plant supply. The
treated water is then released to the Southwest Arm of Kenogamisis. A seepage collection system will be
installed to manage seepage from the Macleod historical tailings as an early project development activity.
Runoff and seepage collection from the exterior of the TMF dams will be collected in a series of ponds and
generally pumped back to the TMF for re-use in processing. In case there is surplus water, which cannot
be pumped into the TMF, water will be treated prior to discharging to the environment.
1.9 Tailings Management Facility
The TMF dams have been designed to meet the requirements of the Lakes and River Improvement Act
Ministry of Natural Resources (“MNR, 2011”) and the Canadian Dam Association guidelines (“CDA, 2014”)
with a relatively low permeability core protected by filters and transition zones upstream of the main
embankment, and constructed of geochemically benign mine rock. The TMF dam foundation was
characterized by conducting extensive geotechnical investigations. A site-specific seismic hazard study
was carried out for the seismic design of the TMF dams. The stability of the dams meets the target factors
of safety required as per CDA.
The TMF site is located approximately five kilometres southwest of the process plant site and was selected
to minimize the disturbance to fish bearing water bodies, maximize the use of natural containment and
optimize Project economics. Prior to construction of the TMF, Goldfield Creek will be diverted around the
north side of the TMF into a permanent channel designed to provide fisheries compensation.
The site has a positive water balance, and as such, the TMF will be developed to minimize the surplus
water requiring treatment. It is planned to complete tailings deposition early in one cell to allow for
progressive rehabilitation and shedding of runoff from the system.
Closure of the TMF involves lowering of the spillways and vegetation of the exposed beaches. Runoff will
be directed through spillways constructed in natural ground when deemed suitable for discharge to the
environment.
1.10 Environmental Studies
Environmental baseline studies were initiated for the Project in 2013 and were used to identify
environmental constraints during the development of preliminary layouts and designs for the Project. This
included consideration of siting and layout of Project infrastructure as well as consideration of design
alternatives from an environmental management and approvals perspective. This environmental baseline

NI 43-101 Technical Report Feasibility Study Update Hardrock Project, Ontario, Canada
Section 1 January 2021 Page 1-15
was the basis for determining incremental changes and predicting environmental effects associated with
the Project.
A final environmental impact statement / environmental assessment (“EIS/EA”) has been completed and
approved by provincial and federal regulatory agencies. Project interactions were analyzed for 13 valued
components (“VCs”) to determine potential environmental effects associated with the Project for
construction, operation and closure phases. In addition to the VCs, the effects assessment also considered
effects of the environment on the Project, accidents and malfunction scenarios and cumulative effects.
Conceptual environmental management and monitoring plans (“EMMPs”) were provided in the final EIS/EA,
including measures related to both compliance and EIS/EA monitoring for all phases of the Project. The
EMMPs are being advanced beyond the conceptual stage throughout 2019 and 2020 and will be ‘living’
documents as the Project progresses.
A conceptual Closure Plan was developed as part of the EIS/EA to provide an early opportunity to discuss
the closure approach and initial costing. At the end of mining operations, the main features requiring closure
will include the main open pit, water management and drainage systems, waste rock storage areas, TMF,
site access roads and buildings and associated infrastructure. After the closure works have been
completed, a post-closure monitoring program will be carried out to verify that the closure objectives and
criteria have been met and confirm that the Project can proceed to final close out status. The Closure Plan
has now advanced to a final version and was approved by the MENDM in January 2020.
The results of the final EIS/EA, including implementing the identified mitigation measures, supports the
conclusion that the Project will not cause significant adverse environmental effects. There are no issues
identified to date that would materially affect the ability of GGM to extract minerals from the Project. Since
completing the final EIS/EA, GGM has completed slight modifications of Project components as detailed
engineering advances, which form the basis for the final mine plan used for this Report. Active consultation
with stakeholders (community members, agencies and interested parties) and Indigenous communities has
been undertaken throughout Project planning and will continue as the Project progresses through permitting
and detailed engineering.
GGM has established Long Term Relationship Agreements ("LTRAs") with the five local Indigenous
communities. The agreements establish increased clarity regarding GGM’s ability to develop the Project
and the Indigenous communities’ opportunity to benefit from future mining opportunities in the region,
including the potential to extend the life of the Project.
NI 43-101 Technical Report Feasibility Study Update Hardrock Project, Ontario, Canada
Section 1 January 2021 Page 1-16
1.11 Execution Plan
The Project will be executed using an “Owner-managed” project delivery model. All aspects of engineering,
procurement and construction for the Project will be managed directly by the Owner. Detailed engineering
and a portion of the procurement will be outsourced. The pre-production CAPEX period is planned for
39 months (start of CAPEX period to commercial production), which includes 8 months of construction
readiness and pre-construction and 27 months for major construction. The process plant cold
commissioning, hot commissioning and ramp up to commercial production is planned to be completed over
7 months. The peak construction workforce on site is estimated at 660 people.
The operating organization consists of three departments: mine, including mine operations, geology,
engineering and maintenance; process and power plant, including operations and maintenance; and
general and administrative including human resources, environment, health and safety, site services and
accounting. The planned peak total operating workforce is 521 employees (reached in Year 4).
1.12 Capital Cost Estimate
The CAPEX estimate was based on material take-offs from detailed engineering in most areas (50% to
90%). The process plant equipment, power plant equipment, temporary and permanent effluent treatment
plants, sewage treatment plant and mine mobile equipment fleet was based on firm price Request for
Proposal (“RFP”) processes. The remaining equipment and material costs were based on budgetary bid
processes, quotes, consultant’s historical data and in-house databases or benchmarked from previous
projects. Labour unit rates were developed from first principles based on budgetary quotations and direct
installation hours were based on a combination of firm price proposals, budgetary quotes and feasibility
study estimates, benchmarked against previous projects and reviewed by experienced construction
personnel. Firm price RFP processes were completed for the TMF, Goldfield Creek diversion and
Highway 11 relocation. A Quantitative Risk Assessment (“QRA”) session was held to establish the
contingency for the CAPEX update.
The initial CAPEX for Project construction, equipment purchases and pre-production activities is estimated
to be CAD 1,301M (before preproduction revenue and LTRA costs), as shown in Table 1.4.
The CAPEX includes a contingency of CAD 108M, which is 9.0% of the total before contingency. The
project initial CAPEX excludes pre-production revenue and IBA payments scheduled prior to commercial
production.
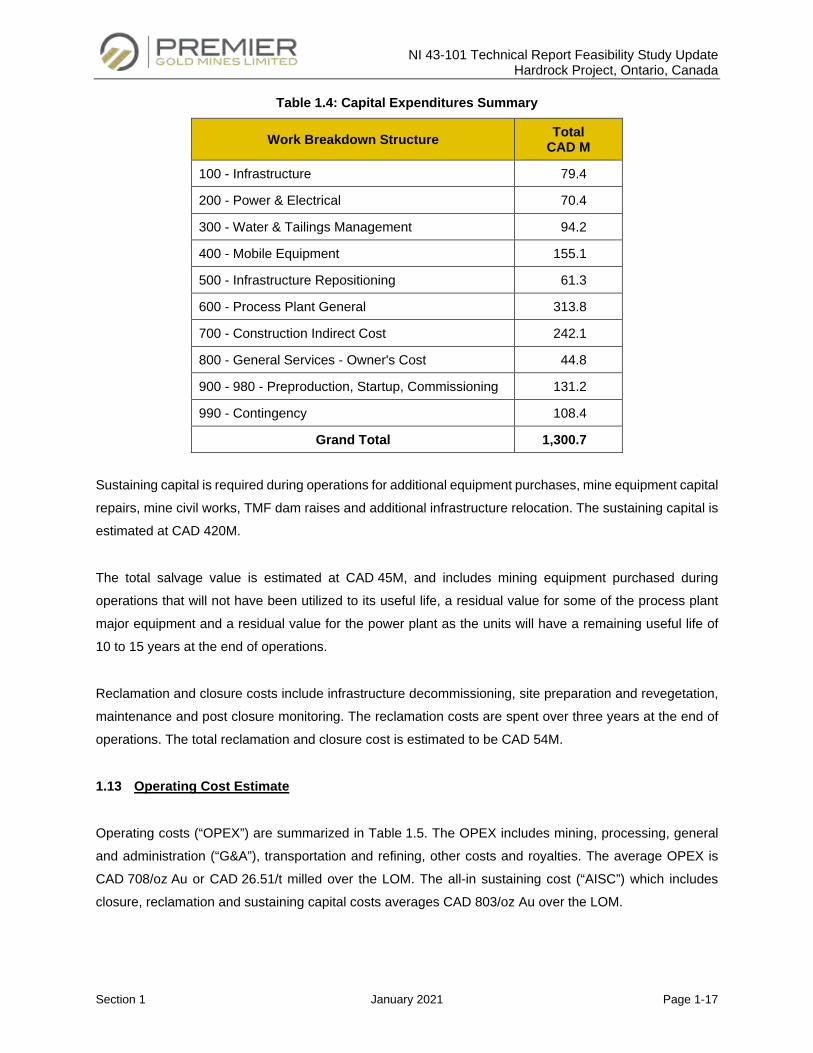
NI 43-101 Technical Report Feasibility Study Update Hardrock Project, Ontario, Canada
Section 1 January 2021 Page 1-17
Table 1.4: Capital Expenditures Summary
Work Breakdown Structure Total CAD M
100 - Infrastructure 79.4
200 - Power & Electrical 70.4
300 - Water & Tailings Management 94.2
400 - Mobile Equipment 155.1
500 - Infrastructure Repositioning 61.3
600 - Process Plant General 313.8
700 - Construction Indirect Cost 242.1
800 - General Services - Owner's Cost 44.8
900 - 980 - Preproduction, Startup, Commissioning 131.2
990 - Contingency 108.4
Grand Total 1,300.7
Sustaining capital is required during operations for additional equipment purchases, mine equipment capital
repairs, mine civil works, TMF dam raises and additional infrastructure relocation. The sustaining capital is
estimated at CAD 420M.
The total salvage value is estimated at CAD 45M, and includes mining equipment purchased during
operations that will not have been utilized to its useful life, a residual value for some of the process plant
major equipment and a residual value for the power plant as the units will have a remaining useful life of
10 to 15 years at the end of operations.
Reclamation and closure costs include infrastructure decommissioning, site preparation and revegetation,
maintenance and post closure monitoring. The reclamation costs are spent over three years at the end of
operations. The total reclamation and closure cost is estimated to be CAD 54M.
1.13 Operating Cost Estimate
Operating costs (“OPEX”) are summarized in Table 1.5. The OPEX includes mining, processing, general
and administration (“G&A”), transportation and refining, other costs and royalties. The average OPEX is
CAD 708/oz Au or CAD 26.51/t milled over the LOM. The all-in sustaining cost (“AISC”) which includes
closure, reclamation and sustaining capital costs averages CAD 803/oz Au over the LOM.
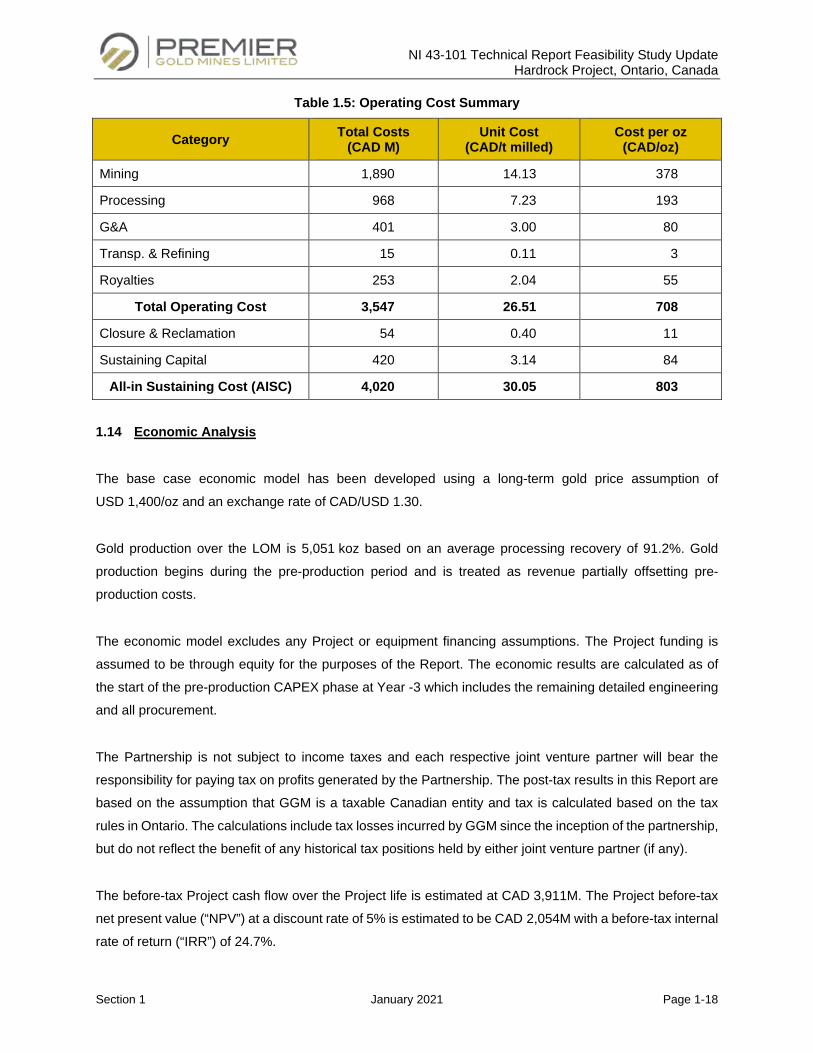
NI 43-101 Technical Report Feasibility Study Update Hardrock Project, Ontario, Canada
Section 1 January 2021 Page 1-18
Table 1.5: Operating Cost Summary
Category Total Costs (CAD M)
Unit Cost (CAD/t milled)
Cost per oz (CAD/oz)
Mining 1,890 14.13 378
Processing 968 7.23 193
G&A 401 3.00 80
Transp. & Refining 15 0.11 3
Royalties 253 2.04 55
Total Operating Cost 3,547 26.51 708
Closure & Reclamation 54 0.40 11
Sustaining Capital 420 3.14 84
All-in Sustaining Cost (AISC) 4,020 30.05 803
1.14 Economic Analysis
The base case economic model has been developed using a long-term gold price assumption of
USD 1,400/oz and an exchange rate of CAD/USD 1.30.
Gold production over the LOM is 5,051 koz based on an average processing recovery of 91.2%. Gold
production begins during the pre-production period and is treated as revenue partially offsetting pre-
production costs.
The economic model excludes any Project or equipment financing assumptions. The Project funding is
assumed to be through equity for the purposes of the Report. The economic results are calculated as of
the start of the pre-production CAPEX phase at Year -3 which includes the remaining detailed engineering
and all procurement.
The Partnership is not subject to income taxes and each respective joint venture partner will bear the
responsibility for paying tax on profits generated by the Partnership. The post-tax results in this Report are
based on the assumption that GGM is a taxable Canadian entity and tax is calculated based on the tax
rules in Ontario. The calculations include tax losses incurred by GGM since the inception of the partnership,
but do not reflect the benefit of any historical tax positions held by either joint venture partner (if any).
The before-tax Project cash flow over the Project life is estimated at CAD 3,911M. The Project before-tax
net present value (“NPV”) at a discount rate of 5% is estimated to be CAD 2,054M with a before-tax internal
rate of return (“IRR”) of 24.7%.
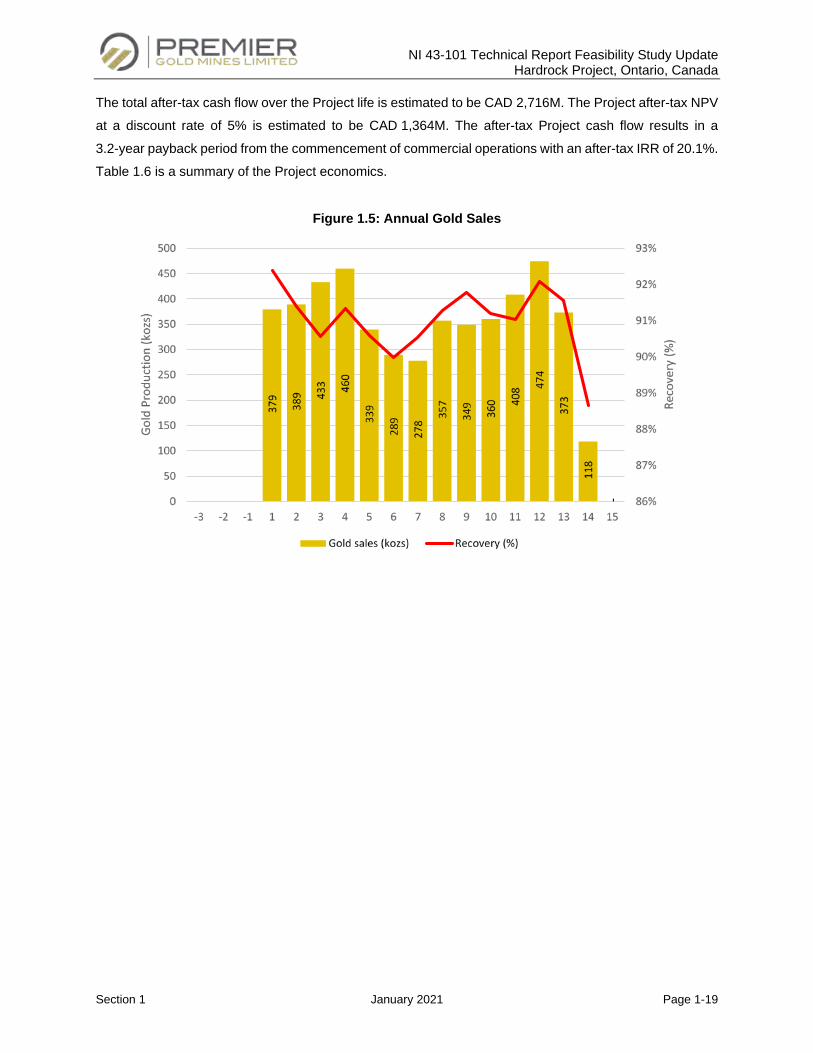
NI 43-101 Technical Report Feasibility Study Update Hardrock Project, Ontario, Canada
Section 1 January 2021 Page 1-19
The total after-tax cash flow over the Project life is estimated to be CAD 2,716M. The Project after-tax NPV
at a discount rate of 5% is estimated to be CAD 1,364M. The after-tax Project cash flow results in a
3.2-year payback period from the commencement of commercial operations with an after-tax IRR of 20.1%.
Table 1.6 is a summary of the Project economics.
Figure 1.5: Annual Gold Sales

NI 43-101 Technical Report Feasibility Study Update Hardrock Project, Ontario, Canada
Section 1 January 2021 Page 1-20
Table 1.6: Project Economics Result Summary
Project Economics Base Case Results
Production Summary
Tonnage Mined Mt 824.9
Ore Milled Mt 135.3
Head Grade g Au/t 1.27
Gold Processed k ozs 5,539
Recovery % 91.2%
Gold Production k ozs 5,051
Cash Flow Summary
Gross Revenue M CAD 9,112 Mining Costs (incl. rehandle) M CAD (1,890) Processing Costs M CAD (968) G&A Costs (incl. transport & refining) M CAD (416) Royalty Costs M CAD (273) Total Operating Costs M CAD (3,547) Operating Cash Flow Before Taxes M CAD 5,566 Initial CAPEX M CAD (1,226) Sustaining CAPEX M CAD (420) Total CAPEX M CAD (1,646) Salvage Value M CAD 45 Closure Costs M CAD (54) Interest and Financing Expenses M CAD - Taxes (mining, prov. & fed.) M CAD (1195) Before-Tax Results
Before-Tax Undiscounted Cash Flow M CAD 3,911
NPV 5% Before-Tax M CAD 2,054
Project Before-Tax Payback Period years 2.8
Project Before-Tax IRR % 24.7%
After-Tax Results
After-Tax Undiscounted Cash Flow M CAD 2,716
NPV 5% After-Tax M CAD 1,364
Project After-Tax Payback Period years 3.2
Project After-Tax IRR % 20.1%
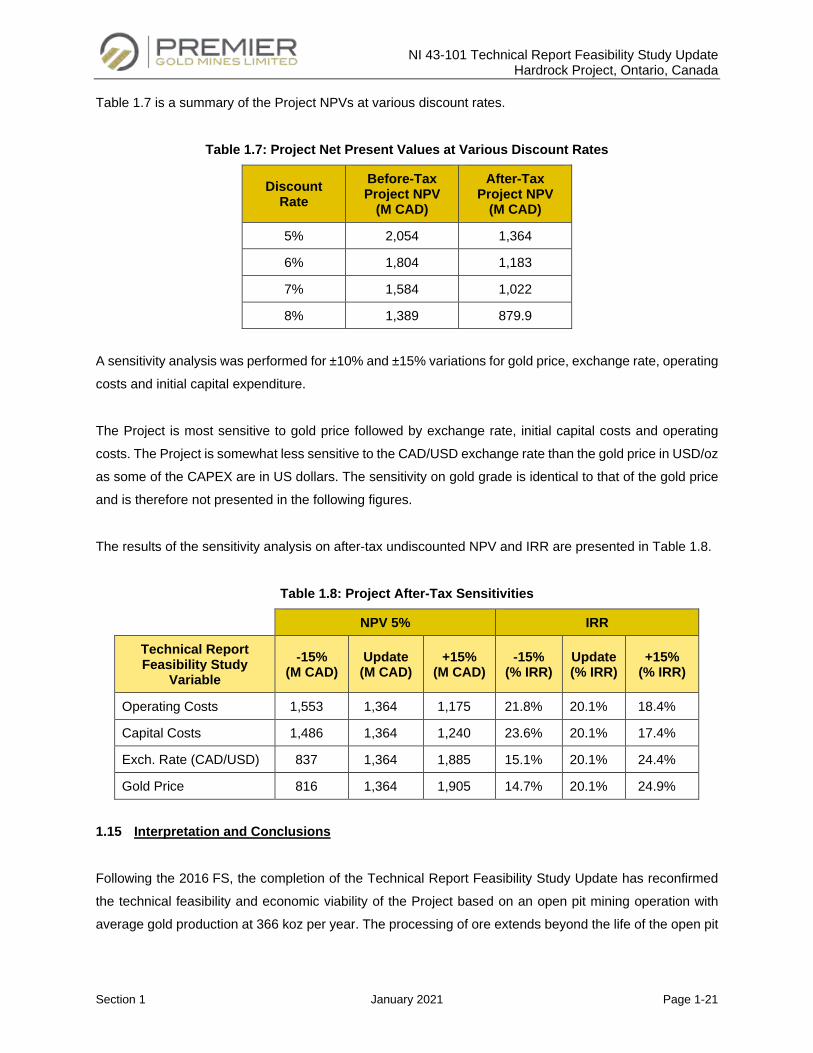
NI 43-101 Technical Report Feasibility Study Update Hardrock Project, Ontario, Canada
Section 1 January 2021 Page 1-21
Table 1.7 is a summary of the Project NPVs at various discount rates.
Table 1.7: Project Net Present Values at Various Discount Rates
Discount Rate
Before-Tax Project NPV
(M CAD)
After-Tax Project NPV
(M CAD)
5% 2,054 1,364
6% 1,804 1,183
7% 1,584 1,022
8% 1,389 879.9
A sensitivity analysis was performed for ±10% and ±15% variations for gold price, exchange rate, operating
costs and initial capital expenditure.
The Project is most sensitive to gold price followed by exchange rate, initial capital costs and operating
costs. The Project is somewhat less sensitive to the CAD/USD exchange rate than the gold price in USD/oz
as some of the CAPEX are in US dollars. The sensitivity on gold grade is identical to that of the gold price
and is therefore not presented in the following figures.
The results of the sensitivity analysis on after-tax undiscounted NPV and IRR are presented in Table 1.8.
Table 1.8: Project After-Tax Sensitivities
NPV 5% IRR
Technical Report Feasibility Study
Variable -15%
(M CAD) Update (M CAD)
+15% (M CAD)
-15% (% IRR)
Update (% IRR)
+15% (% IRR)
Operating Costs 1,553 1,364 1,175 21.8% 20.1% 18.4%
Capital Costs 1,486 1,364 1,240 23.6% 20.1% 17.4%
Exch. Rate (CAD/USD) 837 1,364 1,885 15.1% 20.1% 24.4%
Gold Price 816 1,364 1,905 14.7% 20.1% 24.9%
1.15 Interpretation and Conclusions
Following the 2016 FS, the completion of the Technical Report Feasibility Study Update has reconfirmed
the technical feasibility and economic viability of the Project based on an open pit mining operation with
average gold production at 366 koz per year. The processing of ore extends beyond the life of the open pit
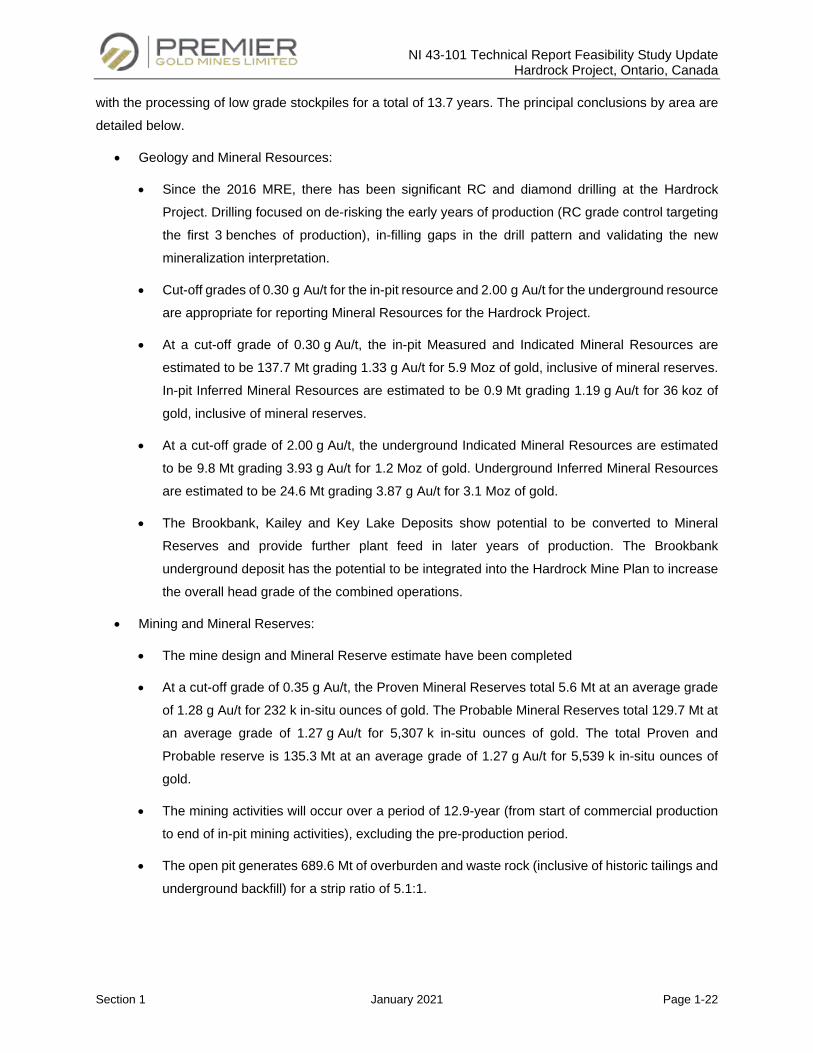
NI 43-101 Technical Report Feasibility Study Update Hardrock Project, Ontario, Canada
Section 1 January 2021 Page 1-22
with the processing of low grade stockpiles for a total of 13.7 years. The principal conclusions by area are
detailed below.
• Geology and Mineral Resources:
• Since the 2016 MRE, there has been significant RC and diamond drilling at the Hardrock
Project. Drilling focused on de-risking the early years of production (RC grade control targeting
the first 3 benches of production), in-filling gaps in the drill pattern and validating the new
mineralization interpretation.
• Cut-off grades of 0.30 g Au/t for the in-pit resource and 2.00 g Au/t for the underground resource
are appropriate for reporting Mineral Resources for the Hardrock Project.
• At a cut-off grade of 0.30 g Au/t, the in-pit Measured and Indicated Mineral Resources are
estimated to be 137.7 Mt grading 1.33 g Au/t for 5.9 Moz of gold, inclusive of mineral reserves.
In-pit Inferred Mineral Resources are estimated to be 0.9 Mt grading 1.19 g Au/t for 36 koz of
gold, inclusive of mineral reserves.
• At a cut-off grade of 2.00 g Au/t, the underground Indicated Mineral Resources are estimated
to be 9.8 Mt grading 3.93 g Au/t for 1.2 Moz of gold. Underground Inferred Mineral Resources
are estimated to be 24.6 Mt grading 3.87 g Au/t for 3.1 Moz of gold.
• The Brookbank, Kailey and Key Lake Deposits show potential to be converted to Mineral
Reserves and provide further plant feed in later years of production. The Brookbank
underground deposit has the potential to be integrated into the Hardrock Mine Plan to increase
the overall head grade of the combined operations.
• Mining and Mineral Reserves:
• The mine design and Mineral Reserve estimate have been completed
• At a cut-off grade of 0.35 g Au/t, the Proven Mineral Reserves total 5.6 Mt at an average grade
of 1.28 g Au/t for 232 k in-situ ounces of gold. The Probable Mineral Reserves total 129.7 Mt at
an average grade of 1.27 g Au/t for 5,307 k in-situ ounces of gold. The total Proven and
Probable reserve is 135.3 Mt at an average grade of 1.27 g Au/t for 5,539 k in-situ ounces of
gold.
• The mining activities will occur over a period of 12.9-year (from start of commercial production
to end of in-pit mining activities), excluding the pre-production period.
• The open pit generates 689.6 Mt of overburden and waste rock (inclusive of historic tailings and
underground backfill) for a strip ratio of 5.1:1.
NI 43-101 Technical Report Feasibility Study Update Hardrock Project, Ontario, Canada
Section 1 January 2021 Page 1-23
• Metallurgical Testing and Mineral Processing:
• The process design criteria have been established based on test results, Owner and Vendor
recommendations and on industry practices.
• Processing options for the Project were selected based on the results of this testwork and are
well known technologies currently used in the mining industry.
• Trade-off studies have determined that the ore processing plant should be sized at 27,000 t/d
and using standard proven technology for crushing, grinding, thickening, leaching, CIP and gold
recovery.
• The gold recovery process for the Project consists of a crushing circuit, a HPGR/ball mill grinding
circuit, pre-leach thickening and cyanide leaching; CIP circuit, carbon elution and regeneration;
electrowinning and gold refining; cyanide destruction and tailings disposal. The process plant is
designed to operate at a throughput of 27,000 t/d.
• The overall gold recovery is 91.2% and is based upon metallurgical testing completed
comprising of composite samples representing the full (global) deposit, early production years,
lithological zones, low grade and near surface areas. The results demonstrate that the ore is
amenable to gold recovery via cyanidation. Gold recovery is correlated to grind size, gold,
sulphur and arsenic head grade. Block models have been created and each is assigned a gold
recovery based upon the block attributes and the target grind size.
• Infrastructure:
• Existing infrastructure within the footprint of the property limits will need to be relocated or
purchased and dismantled. The most significant relocation is that of the TransCanada
Highway 11. All private properties within the project area have been purchased.
• Power availability from the existing grid is deemed insufficient and unreliable. Construction of a
65 MW natural gas-fired power plant is planned, with a designed capacity of 46.5 MW.
• As with the other main infrastructure, the administration building, truck shop, reagent storage
and explosives plant and tailings management facility have been sized to support the mine and
process operation.
• GFC which currently traverses through the TMF footprint will be permanently diverted towards
northeast to Kenogamisis Lake. The permanent GFC diversion channel design meets the fish
offset guidelines. The GFC diversion dyke required for the diversion is designed in accordance
with CDA and LRIA guidelines.
• TMF has been designed in accordance with LRIA and CDA guidelines. The stability of the dams
meets the target factors of safety required as per CDA. Tailings deposition plans have been
NI 43-101 Technical Report Feasibility Study Update Hardrock Project, Ontario, Canada
Section 1 January 2021 Page 1-24
developed in such a way that the wide tailings beaches abut the perimeter rock fill dams and
pond being pushed to the west abutting natural ground.
• Seepage and runoff form TMF will be pumped back to the TMF. In case there is surplus water,
which cannot be pumped into the TMF, water will be treated prior to discharging to the
environment.
• Environmental Considerations:
• The EIS/EA received Federal approval on December 13, 2018 and Provincial approval on
March 12, 2019. The EIS/EA, including implementing the identified mitigation measures,
supports the conclusion that the Project will not cause significant adverse environmental effects,
including effects from accidents and malfunctions, effects of the environment on the Project and
cumulative effects.
• Conceptual environmental management and monitoring plans ("EMMPs") were provided in the
final EIS/EA and include measures related to both compliance and EIS/EA monitoring for all
phases of the Project. The collective monitoring activities associated with the Project will also
be used to inform adaptive management for the Project, as required. The management and
monitoring requirements have been incorporated into Project plans and budgets.
• Active consultation with stakeholders (community members, agencies and interested parties)
and Indigenous communities has been undertaken throughout Project planning and will
continue as the Project progresses.
• GGM has established LTRAs with the five local Indigenous communities. The agreements
establish increased clarity regarding GGM's ability to develop the Project and the Indigenous
communities' opportunity to benefit from future mining opportunities in the region, including the
potential to extend the life of the Project.
• Capital and Operating Costs:
• The CAPEX estimate was based on material take-offs from detailed engineering in most areas
(50% to 90%), and firm price bids for the majority of process plant, power plant equipment, and
the mine mobile equipment fleet. A QRA session was held to establish the contingency for the
CAPEX update.
• The initial CAPEX for Project construction, including processing, mine equipment purchases
and pre-production activities, infrastructure and other direct and indirect costs, is estimated to
be CAD 1,301M (before pre-production revenue and LTRA costs). The total initial capital
includes a contingency of CAD 108M, which is 9.0% of the total CAPEX.
NI 43-101 Technical Report Feasibility Study Update Hardrock Project, Ontario, Canada
Section 1 January 2021 Page 1-25
• Sustaining capital required during operations for additional equipment purchases, mine
equipment capital repairs, mine civil works, TMF dam raises and additional infrastructure
relocation is estimated at CAD 420M.
• A salvage value of CAD 45M is estimated for some mining and processing equipment and the
power plant that will not have been utilized to their useful life.
• The total reclamation and closure cost is estimated to be CAD 54M.
• The average operating cost is CAD 708/oz Au or CAD 26.51/t milled over the life of the mine.
The all-in sustaining cost (“AISC”) which includes closure, reclamation and sustaining capital
costs average CAD 803/oz Au over the mine life.
1.16 Risks and Opportunities
GGM’s risk identification and assessment process is iterative and has been applied throughout the FS and
Detailed Engineering phases. Through a series of risk assessment sessions, risks are identified in relation
to Project objectives and the internal and external context at the time of each assessment and are
summarized into the Hardrock Project Corporate Risk Register. The risk evaluation process uses a
5 x 5 Impact and Likelihood matrix to rate risks at the enterprise level. A broad range of Project risk areas
(health and safety, technical, environmental, community, financial, etc.) are assessed in order to provide a
business or enterprise level perspective. Risk assessments by department or discipline are undertaken at
the appropriate stages. Various standard engineering risk assessment processes, such as HAZOPs and
Failure Mode and Effects Analysis (“FMEA”) are undertaken during the detailed engineering phase. Health
and safety risk assessment processes will be implemented for the construction phase.
Risk treatment plans are developed for each risk to reduce the risk’s probability of occurring and / or impact
to an acceptable or practical level. Certain risk mitigation activities were completed as planned during the
current project phase, while other actions are planned for construction, operations or closure phases as
appropriate. These mitigation plans are incorporated in the project execution plans and where required in
the CAPEX and OPEX budgets. The key risks areas that are being managed through current controls and
future phase mitigation plans include project execution people, gold production (process plant ramp-up),
permitting approval timelines, tailings management facility, project costs, safety, pit wall failure, relocation
of infrastructure and water management,
There are several opportunities to improve overall Project economics and sustainability.
NI 43-101 Technical Report Feasibility Study Update Hardrock Project, Ontario, Canada
Section 1 January 2021 Page 1-26
• Revenue Related Potential Opportunities:
• The use of the Hardrock process plant and TMF for the future processing of gold from other
GGM properties including the Hardrock underground resource and the regional exploration to
improve the LOM average grade and/or extend the LOM. The Indigenous Agreements include
agreed financial benefits to allow GGM to develop Hardrock Underground.
• The Project is permitted for 30,000 tpd providing the opportunity to increase throughput, post
ramp-up through optimization. Additional throughput may be achieved through the milling circuit
as a result of microcracks generated from the high-pressure grinding rolls; not accounted for in
the throughput rate estimate. The use of the Hardrock process plant and TMF to process some
portion of the existing surface historic tailings in order to recover gold, generate revenue, and
also potentially mitigate environmental liabilities related to sulphides, arsenic and other
contaminants.
• Connecting the natural gas power plant to the grid and selling spare power generation to the
grid during times of shutdowns or excess capacity.
• OPEX Related Potential Opportunities:
• Consider the possibility of a potential blend of LNG and diesel as a fuel source is possible for
the mine haul trucks. Currently, the mine fleet uses 100% diesel.
• Utilize new, commercially available technologies/autonomous haulage to increase operational
effectiveness and reduce costs (Year 3+).
• Optimize remote assisted drilling to its full potential. While the base case includes remote
assisted drilling, additional benefits can be achieved via labour mine productivity
improvements.
• Investigate the availability of high-quality second-hand mining equipment.
• CAPEX Related Potential Opportunities:
• Pursue possible improvements in the TMF deposition plan and dam raise schedule, and the
elimination of certain temporary structures in the initial construction in order to improve initial
CAPEX.
• Complete construction phase and/or ramp-up to commercial production earlier than planned.
• Consider the possibility of equipment leasing to reduce upfront capital while protecting overall
project economics.
• Actively pursue government financial assistance for certain existing infrastructure relocations.
NI 43-101 Technical Report Feasibility Study Update Hardrock Project, Ontario, Canada
Section 1 January 2021 Page 1-27
1.17 Recommendations
After the completion of the 2016 Hardrock Project Feasibility Study, GGM successfully completed work
plans in 2017 and 2018 to further de-risk the project. Federal approval of the Environmental Assessment
was received in December 2018 and Provincial approval was received on March 2019. Permitting work has
advanced, and after thorough consultation with the affected Indigenous communities and agencies, all pre-
construction permit applications have been submitted. All permits required for construction were submitted.
The forecast approval timelines support the planned construction schedule. GGM has now signed
agreements with the local Indigenous communities, and implementation of these agreements is underway.
The Independent Tailings Review Board (“ITRB”) was implemented in 2017 to provide advice and guidance
during the TMF detailed engineering phase and extensive TMF geotechnical programs have been
completed. Conceptual construction execution plans were developed for the TMF, Goldfield Creek and
Highway 11 and the construction schedule for these facilities has been de-risked. The 2018 and 2019
drilling programs were successful and provided the basis for improved resource and reserve estimates.
The scope of the Technical Report Feasibility Study Update included updating the resource and reserve
models, revising the mine plan, advancing detailed engineering in higher risk areas and completing firm
price bid processes for all major process and power plant equipment, effluent and sewage treatment plants
and the mine mobile equipment fleet. This work formed the basis of the capital cost, operating cost and
project economic update. Activities related to establishing financing for the Project are underway.
The Technical Report Feasibility Study Update has reconfirmed the technical feasibility of the Project and
significantly improved the economic results.
The list of preliminary recommendations that follows was prepared by GGM and GMS and reflects
recommendations for subsequent phases of work, including completion of the detailed engineering phase,
the construction phase and the operations phase. The cost of addressing each of these recommendations
are generally within the scope of Project CAPEX, sustaining capital, closure costs and OPEX outlined in
this Report.
1.17.1 Exploration and Geology
• Revalidate collar coordinates from the 2018 RC drilling campaign at Hardrock before the
commencement of mining activities.
• Incorporate underground drill holes at Hardrock (not included in Mineral Resource) and adjust
mineralization interpretation to produce a more locally accurate block model for internal purposes.
NI 43-101 Technical Report Feasibility Study Update Hardrock Project, Ontario, Canada
Section 1 January 2021 Page 1-28
• Update the level of definition of the PAG (potentially acid generating) and non-PAG model.
• Undertake metallurgical test-work for the Kailey Deposit to confirm metallurgical recoveries
assumed in the MRE.
• Retake core duplicates of existing Metalore-era drill core at Brookbank to confirm historical results
where QA/QC protocols were lacking. Compile and digitise all QA/QC data for the Ontex-era drilling
pre-2009 (present in drill logs and assay certificates).
• Resample drill core at Key Lake to increase the overall sample coverage and to overcome the effects
of undersampling in the past.
• Undertake further resource definition drilling at Kailey, targeting the No.9 Zone near surface to
convert existing Inferred to Indicated category, and to discover new ounces in the existing pit shell.
• Undertake a scoping study at Brookbank to understand if it could be a potential source of higher-
grade plant feed for the overall Hardrock operation.
1.17.2 Detailed Engineering Phase
• Review specific sections of waste rock storage designs C and D based on the latest geotechnical
stability analysis produced by Woods in September 2019.
• Review specific sections of the overburden storage design based on the latest geotechnical stability
analysis produced by Woods in August 2019.
• Conduct additional pit slope geotechnical work such as detailed review of variation in structural
fabric orientation to identify possible localized sub-domains with stronger controls on achievable
bench face angles; and conduct sensitivity analyses on slope saturation and lower effective shear
strength. Additional laboratory testing such triaxial testing and intact shear strength of foliation is
recommended.
NI 43-101 Technical Report Feasibility Study Update Hardrock Project, Ontario, Canada
Section 2 January 2021 Page 2-1
INTRODUCTION
On March 9, 2015 Centerra Gold Inc. (“Centerra”) and Premier Gold Mines Limited (“Premier”) formed a
50/50 partnership to facilitate the joint ownership, exploration and future development of the Trans-Canada
Property (subsequently renamed the Greenstone Gold Property) (the “Property”), which includes the
Hardrock Project (the “Project”). The partnership was originally called TCP Limited Partnership and was
subsequently changed to Greenstone Gold Mines LP (the “Partnership”). The Partnership is managed by
Greenstone Gold Mines GP Inc. which acts on behalf of the Partnership (“GGM”).
On December 15, 2020 the Orion Mine Finance Group (“Orion”), has entered into an agreement (the
“Purchase Agreement”) with Centerra and Premier pursuant to which Orion will acquire Centerra's 50%
interest in the Greenstone Gold Mines Partnership (“GGM”). On December 16, 2020 Equinox Gold Corp.
and Premier entered into a definitive agreement (the “Agreement”) whereby Equinox Gold will acquire all
of the outstanding shares of Premier. Equinox Gold will retain Premier’s interest in the world-class Hardrock
Project in Ontario.
The Hardrock Project Feasibility Study (“FS”) was completed in 2016 and concluded that the Project is
technically and economically feasible. Since the FS, GGM advanced Project de-risking activities, including
approval of the EIS/EA, establishing the planned Long-Term Relationship Agreements, advancing on
permitting activities, including the submission of all initial construction permit applications and completing a
value engineering initiative.
As part of the 2019 approved workplan, GGM, GMS and several engineering consultants collaborated to
prepare a Technical Report Feasibility Study Update. The scope of the Report included updating the
resource and reserve models, revising the life of mine plan, advancing detailed engineering in higher risk
areas and completing request for proposal (“RFP”) processes for all major process plant, equipment, power
plant equipment, effluent and sewage treatment plants, the mine mobile equipment fleet as well as for the
TMF, GFC and Highway 11.This work formed the basis of the capital cost, operating cost and project
economic update.
The scope of this Report includes the geology and Mineral Resources of the Hardrock Property and the
other properties (Brookbank, Kailey and Key Lake, collectively known as the “Hardrock Satellite Deposits”).
The Mineral Reserves, mining, infrastructure, processing and financial analysis sections of this Report
consider the Hardrock deposit only.
The Report and Project Update responsibilities of the engineering consultants follow:
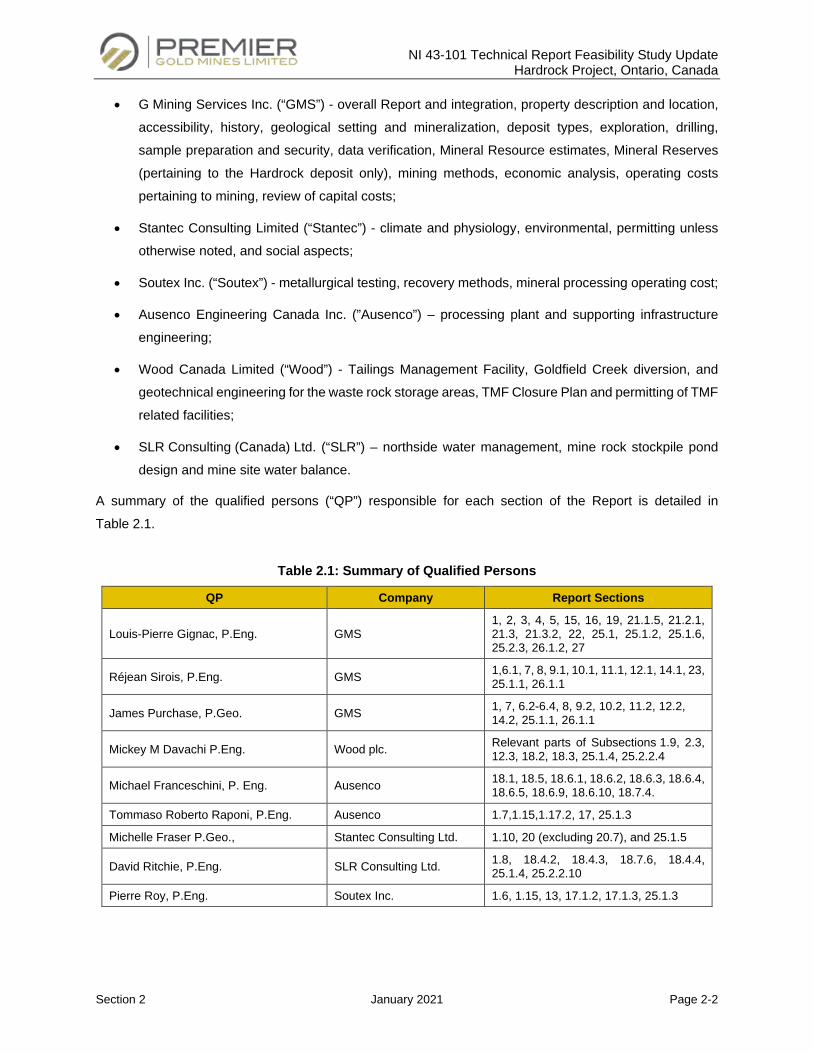
NI 43-101 Technical Report Feasibility Study Update Hardrock Project, Ontario, Canada
Section 2 January 2021 Page 2-2
• G Mining Services Inc. (“GMS”) - overall Report and integration, property description and location,
accessibility, history, geological setting and mineralization, deposit types, exploration, drilling,
sample preparation and security, data verification, Mineral Resource estimates, Mineral Reserves
(pertaining to the Hardrock deposit only), mining methods, economic analysis, operating costs
pertaining to mining, review of capital costs;
• Stantec Consulting Limited (“Stantec”) - climate and physiology, environmental, permitting unless
otherwise noted, and social aspects;
• Soutex Inc. (“Soutex”) - metallurgical testing, recovery methods, mineral processing operating cost;
• Ausenco Engineering Canada Inc. (”Ausenco”) – processing plant and supporting infrastructure
engineering;
• Wood Canada Limited (“Wood”) - Tailings Management Facility, Goldfield Creek diversion, and
geotechnical engineering for the waste rock storage areas, TMF Closure Plan and permitting of TMF
related facilities;
• SLR Consulting (Canada) Ltd. (“SLR”) – northside water management, mine rock stockpile pond
design and mine site water balance.
A summary of the qualified persons (“QP”) responsible for each section of the Report is detailed in
Table 2.1.
Table 2.1: Summary of Qualified Persons
QP Company Report Sections
Louis-Pierre Gignac, P.Eng. GMS 1, 2, 3, 4, 5, 15, 16, 19, 21.1.5, 21.2.1, 21.3, 21.3.2, 22, 25.1, 25.1.2, 25.1.6, 25.2.3, 26.1.2, 27
Réjean Sirois, P.Eng. GMS 1,6.1, 7, 8, 9.1, 10.1, 11.1, 12.1, 14.1, 23, 25.1.1, 26.1.1
James Purchase, P.Geo. GMS 1, 7, 6.2-6.4, 8, 9.2, 10.2, 11.2, 12.2, 14.2, 25.1.1, 26.1.1
Mickey M Davachi P.Eng. Wood plc. Relevant parts of Subsections 1.9, 2.3, 12.3, 18.2, 18.3, 25.1.4, 25.2.2.4
Michael Franceschini, P. Eng. Ausenco 18.1, 18.5, 18.6.1, 18.6.2, 18.6.3, 18.6.4, 18.6.5, 18.6.9, 18.6.10, 18.7.4.
Tommaso Roberto Raponi, P.Eng. Ausenco 1.7,1.15,1.17.2, 17, 25.1.3
Michelle Fraser P.Geo., Stantec Consulting Ltd. 1.10, 20 (excluding 20.7), and 25.1.5
David Ritchie, P.Eng. SLR Consulting Ltd. 1.8, 18.4.2, 18.4.3, 18.7.6, 18.4.4, 25.1.4, 25.2.2.10
Pierre Roy, P.Eng. Soutex Inc. 1.6, 1.15, 13, 17.1.2, 17.1.3, 25.1.3
NI 43-101 Technical Report Feasibility Study Update Hardrock Project, Ontario, Canada
Section 2 January 2021 Page 2-3
2.1 Sources of Information and Data
Unless otherwise stated, all the information and data contained in the Report or used in its preparation has
been provided by GGM, and all currencies are expressed in Canadian dollars (CAD).
The QPs who prepared the Report relied on information provided by the following sources who are not QPs
for this Report:
• SRK Consulting Inc. (“SRK”) provided input regarding key parameters for the economic evaluation;
• Eagle Mapping Ltd provided 0.5 m accuracy topography in digital format of the Project area which
was used to determine the ground surface shapes used in open pit and infrastructure / processing/
tailings management facility earthworks quantity estimates;
• SGS Minerals Services, ThyssenKrupp and SimSAGe provided metallurgical reporting and studies
as referenced in Section 13 - Mineral Processing and Metallurgical Testing, managed principally by
GGM;
• Golder Associates Ltd. (“Golder”) – provided rock mechanics and open pit geotechnical studies as
referenced in Section 16 - Mining Methods;
• TBT Engineering Limited (“TBT”) - re-alignment of Trans-Canada Highway 11, Ontario Ministry of
Transportation (“MTO”) patrol station, MTO related permits;
• SGS Mineral Services provided laboratory geochemical and mineralogical testing, managed
principally by GGM;
• Golder Associates Ltd. (“Golder”) relied on the oriented core data collected by MD Engineering
(“MDE”) for the evaluation of the open pit geotechnical parameters and pit slope studies. Golder
validated the MDE methodology and validated < 5% of the total oriented core. Golder has no reason
to believe that the remainder were not also collected in a professional manner;
• Enbridge provided engineering studies, market information and a construction cost estimate for a
natural gas pipeline from the TCPL Canadian Mainline pipeline to the Project site.
• Greenstone Gold Mines GP Inc (“GGM”) – capital cost estimate compilation and basis of estimate,
power generation, effluent treatment plants, infrastructure relocation estimates, construction
indirects, schedule, project execution plan.
2.2 Site Visit
The following QPs visited the Project site as detailed below.
NI 43-101 Technical Report Feasibility Study Update Hardrock Project, Ontario, Canada
Section 2 January 2021 Page 2-4
• Louis-Pierre Gignac, P.Eng., GMS, visited the site on June 3, 2014;
• Réjean Sirois, P.Eng., GMS, visited the site at numerous occasions since August 2016. The last
visit was on August 5, 2020;
• James Purchase, P.Geo., GMS, visited the site from July 27, 2020 to July 30, 2020;
• Pierre Roy, P.Eng., Soutex, visited the site on June 3, 2014;
• David Ritchie, P.Eng., SLR, visited the site from July 2 to 3, 2014.
2.3 TMF Site Visits
The site visit revealed the necessity for field investigations to characterize the sub-surface conditions along
the TMF dam footprint. Geotechnical investigations were undertaken during 2014, 2015, 2016, 2018 and
2019 which included test pitting, borehole drilling, cone penetration test and field vane shear tests.
Disturbed and undisturbed samples were extracted and tested for various index, strength parameters in an
approved laboratory. The stratigraphic and strength information of the subsurface units were reviewed,
interpreted and utilized in the design of the TMF dams.
2.4 Units of Measure, Abbreviations and Nomenclature
The units of measure presented in this Report, unless noted otherwise, are in the metric system.
A list of the main abbreviations and terms used throughout this Report is presented in Table 2.2.
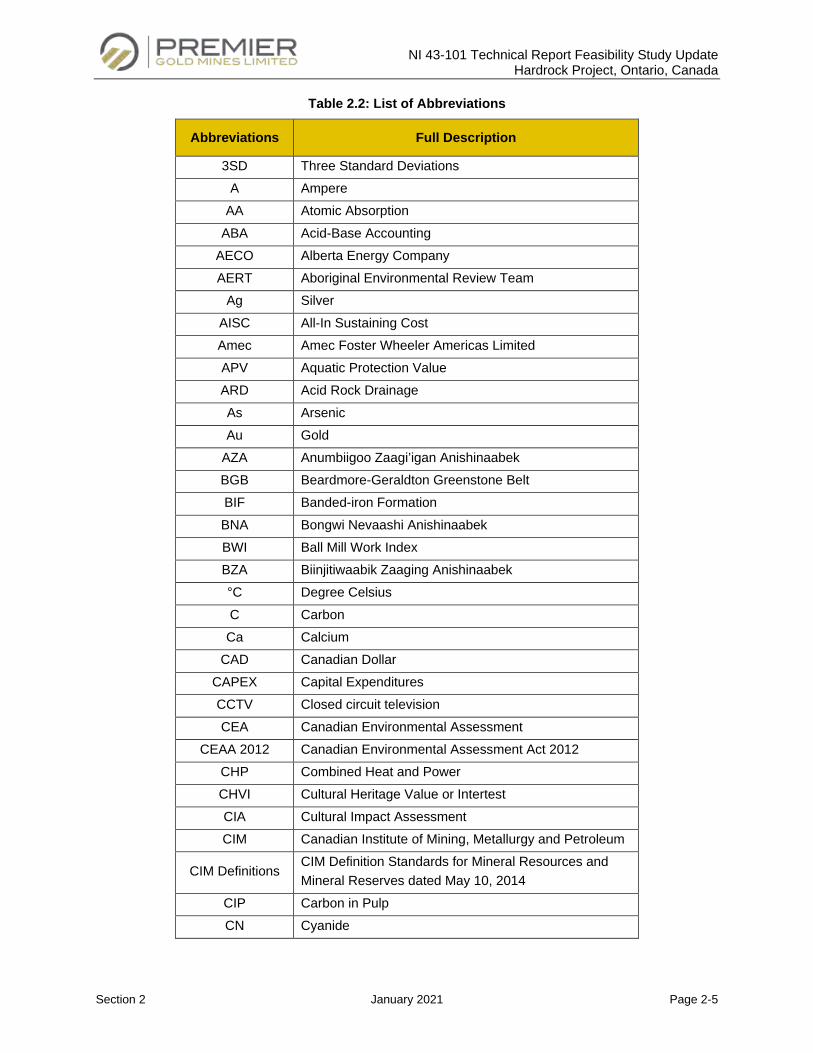
NI 43-101 Technical Report Feasibility Study Update Hardrock Project, Ontario, Canada
Section 2 January 2021 Page 2-5
Table 2.2: List of Abbreviations
Abbreviations Full Description
3SD Three Standard Deviations A Ampere
AA Atomic Absorption ABA Acid-Base Accounting
AECO Alberta Energy Company AERT Aboriginal Environmental Review Team
Ag Silver AISC All-In Sustaining Cost Amec Amec Foster Wheeler Americas Limited APV Aquatic Protection Value ARD Acid Rock Drainage As Arsenic Au Gold
AZA Anumbiigoo Zaagi’igan Anishinaabek BGB Beardmore-Geraldton Greenstone Belt BIF Banded-iron Formation BNA Bongwi Nevaashi Anishinaabek BWI Ball Mill Work Index BZA Biinjitiwaabik Zaaging Anishinaabek °C Degree Celsius C Carbon Ca Calcium
CAD Canadian Dollar CAPEX Capital Expenditures CCTV Closed circuit television CEA Canadian Environmental Assessment
CEAA 2012 Canadian Environmental Assessment Act 2012 CHP Combined Heat and Power CHVI Cultural Heritage Value or Intertest CIA Cultural Impact Assessment CIM Canadian Institute of Mining, Metallurgy and Petroleum
CIM Definitions CIM Definition Standards for Mineral Resources and Mineral Reserves dated May 10, 2014
CIP Carbon in Pulp CN Cyanide
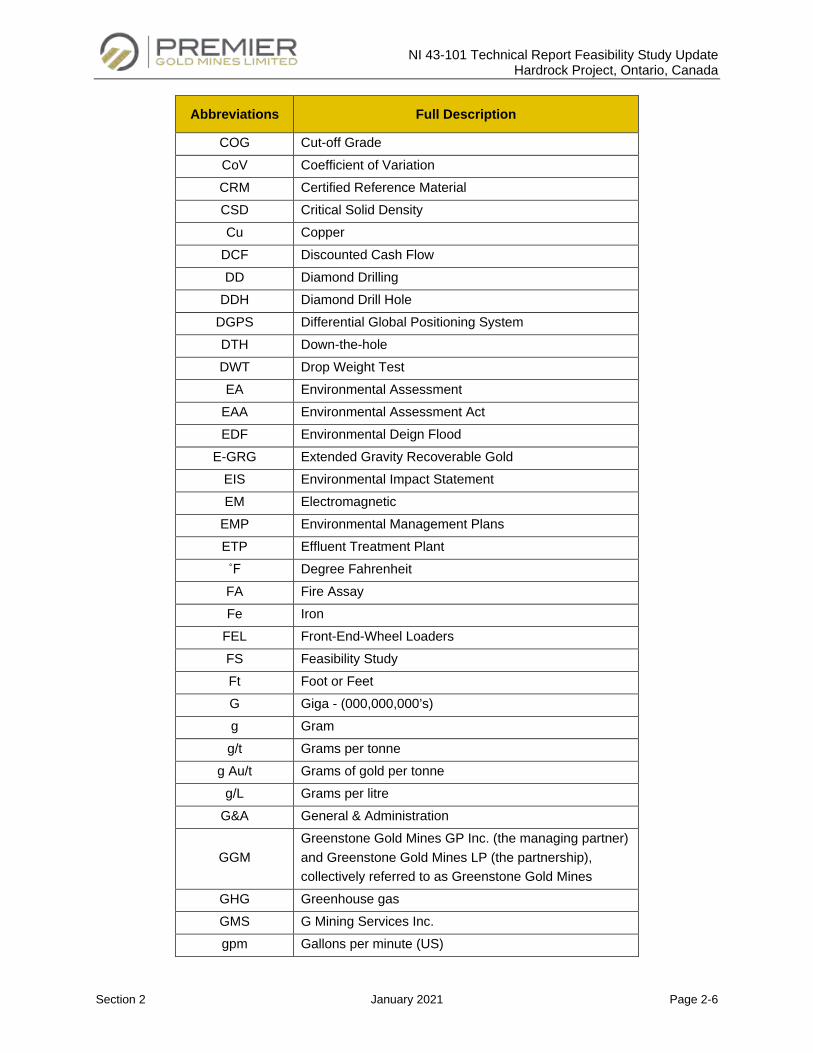
NI 43-101 Technical Report Feasibility Study Update Hardrock Project, Ontario, Canada
Section 2 January 2021 Page 2-6
Abbreviations Full Description
COG Cut-off Grade CoV Coefficient of Variation CRM Certified Reference Material CSD Critical Solid Density Cu Copper
DCF Discounted Cash Flow DD Diamond Drilling
DDH Diamond Drill Hole DGPS Differential Global Positioning System DTH Down-the-hole DWT Drop Weight Test EA Environmental Assessment
EAA Environmental Assessment Act EDF Environmental Deign Flood
E-GRG Extended Gravity Recoverable Gold EIS Environmental Impact Statement EM Electromagnetic
EMP Environmental Management Plans ETP Effluent Treatment Plant ˚F Degree Fahrenheit FA Fire Assay Fe Iron
FEL Front-End-Wheel Loaders FS Feasibility Study Ft Foot or Feet G Giga - (000,000,000’s) g Gram g/t Grams per tonne
g Au/t Grams of gold per tonne g/L Grams per litre
G&A General & Administration
GGM Greenstone Gold Mines GP Inc. (the managing partner) and Greenstone Gold Mines LP (the partnership), collectively referred to as Greenstone Gold Mines
GHG Greenhouse gas GMS G Mining Services Inc. gpm Gallons per minute (US)
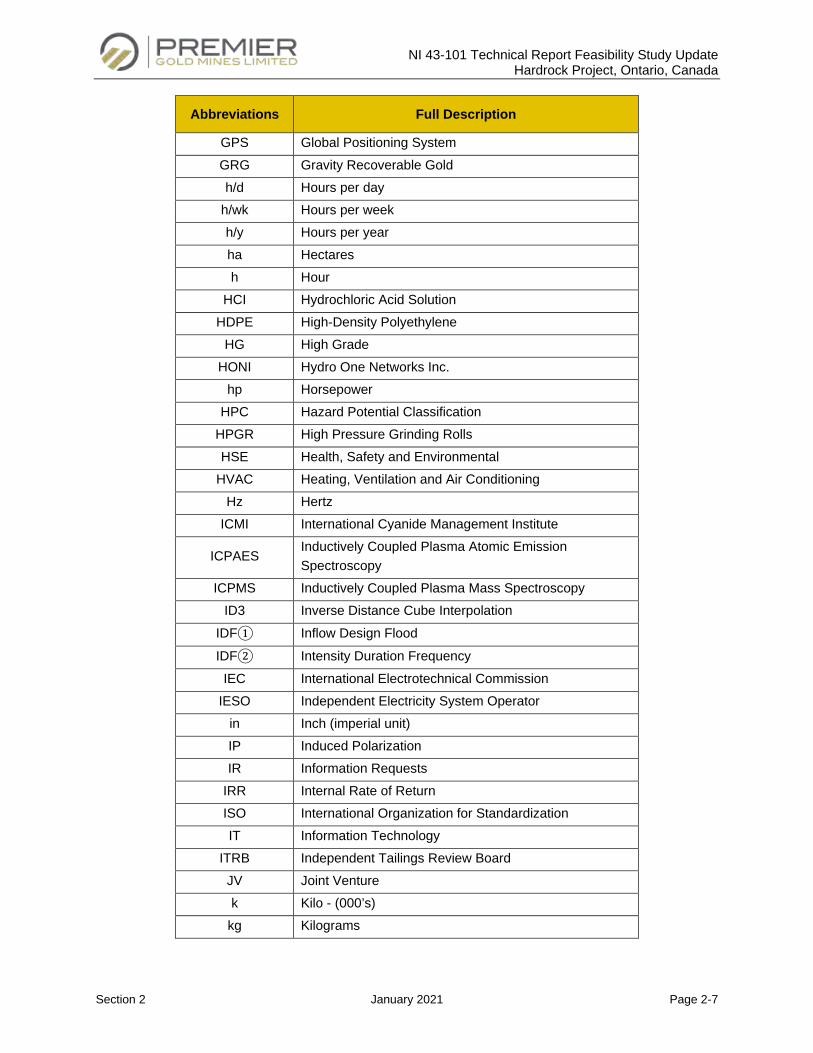
NI 43-101 Technical Report Feasibility Study Update Hardrock Project, Ontario, Canada
Section 2 January 2021 Page 2-7
Abbreviations Full Description
GPS Global Positioning System GRG Gravity Recoverable Gold h/d Hours per day
h/wk Hours per week h/y Hours per year ha Hectares h Hour
HCI Hydrochloric Acid Solution HDPE High-Density Polyethylene
HG High Grade HONI Hydro One Networks Inc.
hp Horsepower HPC Hazard Potential Classification
HPGR High Pressure Grinding Rolls HSE Health, Safety and Environmental
HVAC Heating, Ventilation and Air Conditioning Hz Hertz
ICMI International Cyanide Management Institute
ICPAES Inductively Coupled Plasma Atomic Emission Spectroscopy
ICPMS Inductively Coupled Plasma Mass Spectroscopy ID3 Inverse Distance Cube Interpolation
IDF① Inflow Design Flood
IDF② Intensity Duration Frequency IEC International Electrotechnical Commission
IESO Independent Electricity System Operator in Inch (imperial unit) IP Induced Polarization IR Information Requests
IRR Internal Rate of Return ISO International Organization for Standardization IT Information Technology
ITRB Independent Tailings Review Board JV Joint Venture k Kilo - (000’s)
kg Kilograms
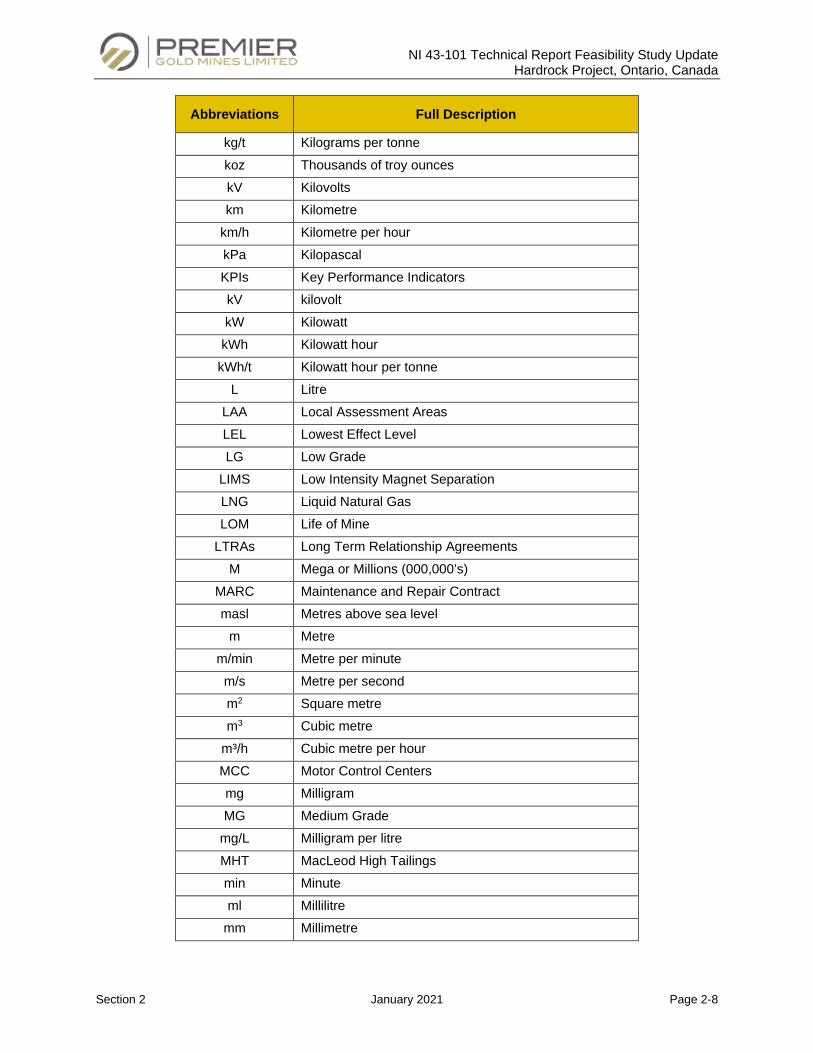
NI 43-101 Technical Report Feasibility Study Update Hardrock Project, Ontario, Canada
Section 2 January 2021 Page 2-8
Abbreviations Full Description
kg/t Kilograms per tonne koz Thousands of troy ounces kV Kilovolts km Kilometre
km/h Kilometre per hour kPa Kilopascal KPIs Key Performance Indicators kV kilovolt kW Kilowatt kWh Kilowatt hour
kWh/t Kilowatt hour per tonne L Litre
LAA Local Assessment Areas LEL Lowest Effect Level LG Low Grade
LIMS Low Intensity Magnet Separation LNG Liquid Natural Gas LOM Life of Mine
LTRAs Long Term Relationship Agreements M Mega or Millions (000,000’s)
MARC Maintenance and Repair Contract masl Metres above sea level
m Metre m/min Metre per minute
m/s Metre per second m2 Square metre m3 Cubic metre
m³/h Cubic metre per hour MCC Motor Control Centers mg Milligram MG Medium Grade
mg/L Milligram per litre MHT MacLeod High Tailings min Minute ml Millilitre
mm Millimetre
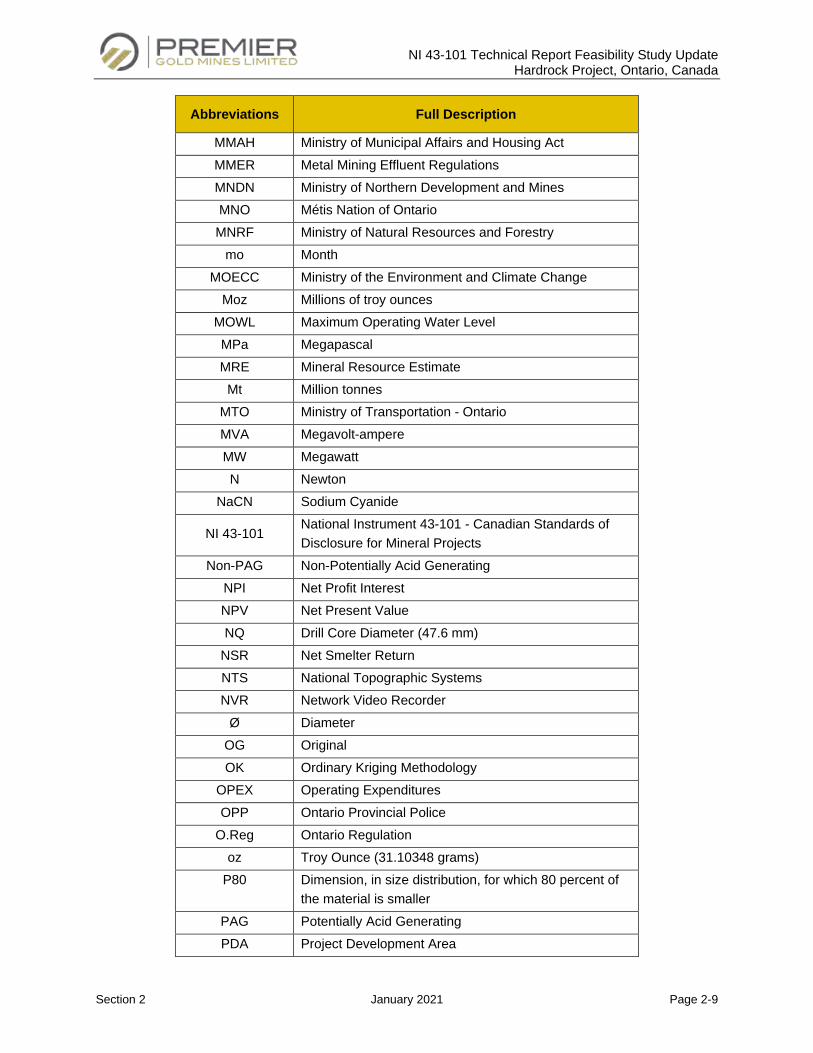
NI 43-101 Technical Report Feasibility Study Update Hardrock Project, Ontario, Canada
Section 2 January 2021 Page 2-9
Abbreviations Full Description
MMAH Ministry of Municipal Affairs and Housing Act MMER Metal Mining Effluent Regulations MNDN Ministry of Northern Development and Mines MNO Métis Nation of Ontario MNRF Ministry of Natural Resources and Forestry
mo Month MOECC Ministry of the Environment and Climate Change
Moz Millions of troy ounces MOWL Maximum Operating Water Level MPa Megapascal MRE Mineral Resource Estimate
Mt Million tonnes MTO Ministry of Transportation - Ontario MVA Megavolt-ampere MW Megawatt N Newton
NaCN Sodium Cyanide
NI 43-101 National Instrument 43-101 - Canadian Standards of Disclosure for Mineral Projects
Non-PAG Non-Potentially Acid Generating NPI Net Profit Interest NPV Net Present Value NQ Drill Core Diameter (47.6 mm)
NSR Net Smelter Return NTS National Topographic Systems NVR Network Video Recorder
Ø Diameter OG Original OK Ordinary Kriging Methodology
OPEX Operating Expenditures OPP Ontario Provincial Police
O.Reg Ontario Regulation oz Troy Ounce (31.10348 grams)
P80 Dimension, in size distribution, for which 80 percent of the material is smaller
PAG Potentially Acid Generating PDA Project Development Area
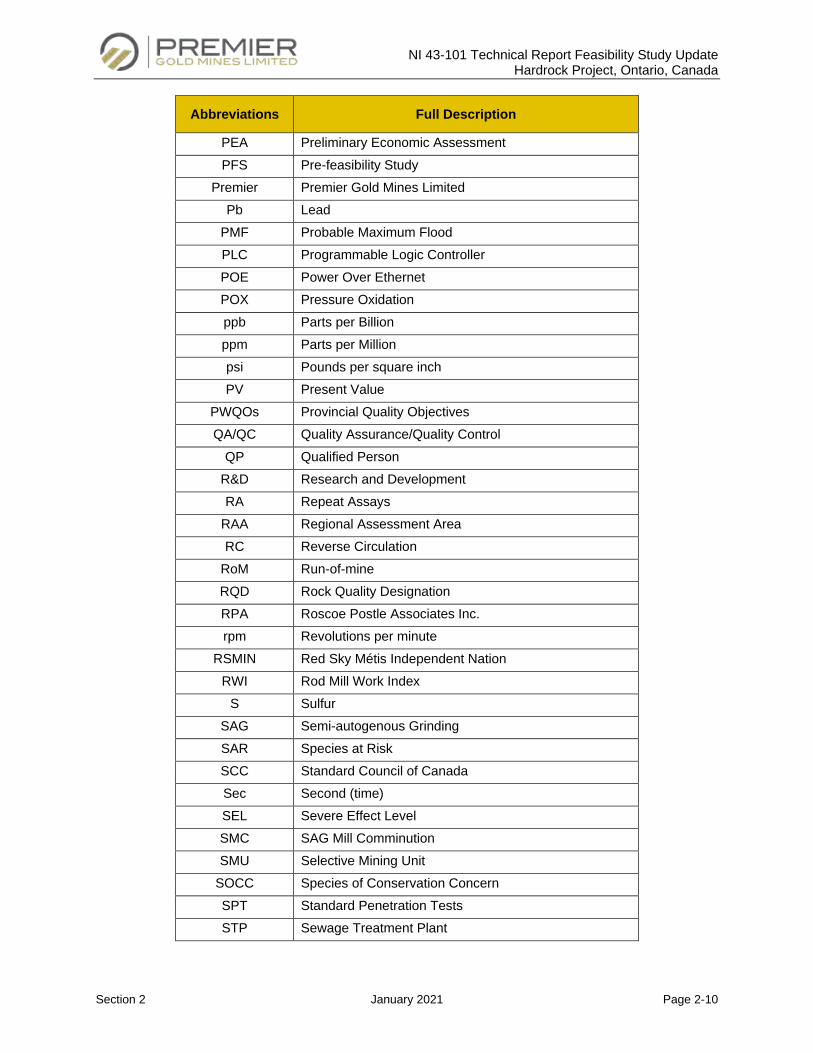
NI 43-101 Technical Report Feasibility Study Update Hardrock Project, Ontario, Canada
Section 2 January 2021 Page 2-10
Abbreviations Full Description
PEA Preliminary Economic Assessment PFS Pre-feasibility Study
Premier Premier Gold Mines Limited Pb Lead
PMF Probable Maximum Flood PLC Programmable Logic Controller POE Power Over Ethernet POX Pressure Oxidation ppb Parts per Billion ppm Parts per Million psi Pounds per square inch PV Present Value
PWQOs Provincial Quality Objectives QA/QC Quality Assurance/Quality Control
QP Qualified Person R&D Research and Development RA Repeat Assays
RAA Regional Assessment Area RC Reverse Circulation
RoM Run-of-mine RQD Rock Quality Designation RPA Roscoe Postle Associates Inc. rpm Revolutions per minute
RSMIN Red Sky Métis Independent Nation RWI Rod Mill Work Index
S Sulfur SAG Semi-autogenous Grinding SAR Species at Risk SCC Standard Council of Canada Sec Second (time) SEL Severe Effect Level SMC SAG Mill Comminution SMU Selective Mining Unit
SOCC Species of Conservation Concern SPT Standard Penetration Tests STP Sewage Treatment Plant
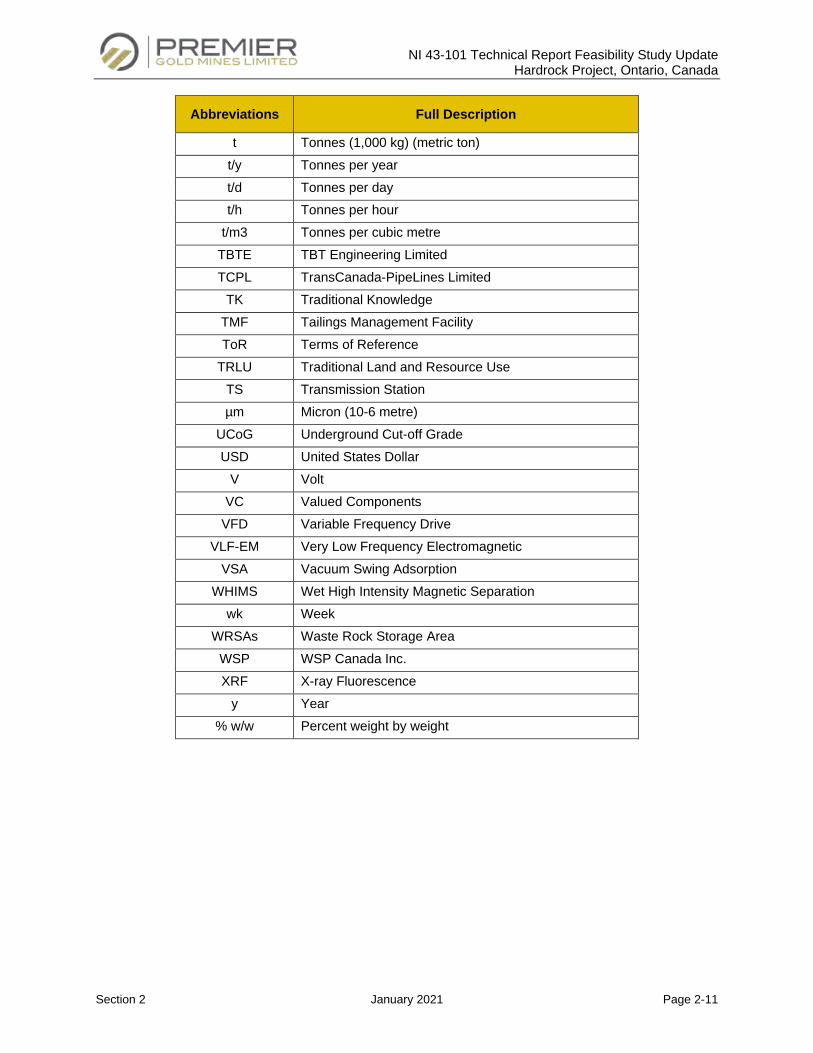
NI 43-101 Technical Report Feasibility Study Update Hardrock Project, Ontario, Canada
Section 2 January 2021 Page 2-11
Abbreviations Full Description
t Tonnes (1,000 kg) (metric ton) t/y Tonnes per year t/d Tonnes per day t/h Tonnes per hour
t/m3 Tonnes per cubic metre TBTE TBT Engineering Limited TCPL TransCanada-PipeLines Limited
TK Traditional Knowledge TMF Tailings Management Facility ToR Terms of Reference
TRLU Traditional Land and Resource Use TS Transmission Station µm Micron (10-6 metre)
UCoG Underground Cut-off Grade USD United States Dollar
V Volt VC Valued Components
VFD Variable Frequency Drive VLF-EM Very Low Frequency Electromagnetic
VSA Vacuum Swing Adsorption WHIMS Wet High Intensity Magnetic Separation
wk Week WRSAs Waste Rock Storage Area
WSP WSP Canada Inc. XRF X-ray Fluorescence
y Year % w/w Percent weight by weight
NI 43-101 Technical Report Feasibility Study Update Hardrock Project, Ontario, Canada
Section 3 January 2021 Page 3-1
RELIANCE ON OTHER EXPERTS
This Report has been prepared by G Mining Services Inc. (“GMS”) for Premier Gold Mines Limited
(“Premier”). The information, conclusions, opinions, and estimates contained herein are based on:
• Information available to GMS at the time of preparation of this Report;
• Assumptions, conditions, and qualifications as set forth in this Report;
• Data, reports, and other information supplied by Greenstone Gold Mines (“GGM”) and other third-
party sources.
For the purpose of this Report, GMS has relied on ownership information provided by GGM. GMS has not
researched property titles or mineral rights for the Project and expresses no opinion as to the ownership
status of the property.
GMS has relied on GGM for guidance on applicable taxes, royalties, and other government levies or
interests, applicable to revenue or income from the Project.
Except for the purposes legislated under Canadian provincial securities law, any use of the Report by any
third part is at that party’s sole risk.
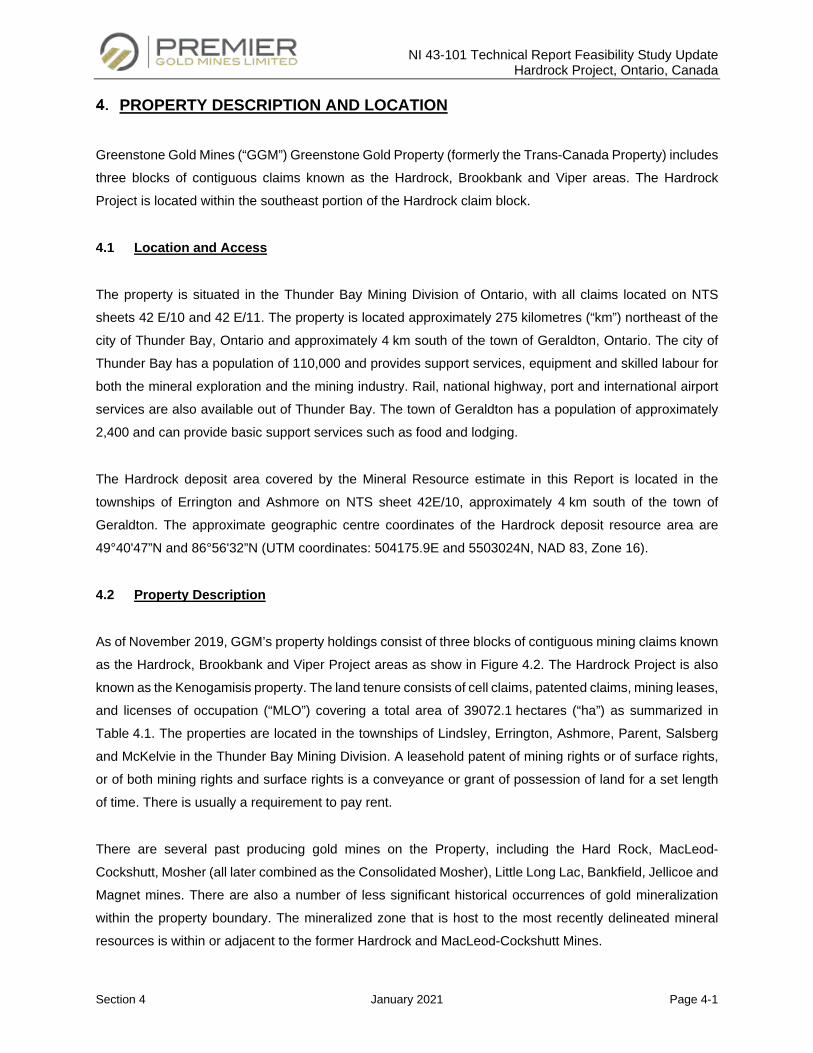
NI 43-101 Technical Report Feasibility Study Update Hardrock Project, Ontario, Canada
Section 4 January 2021 Page 4-1
PROPERTY DESCRIPTION AND LOCATION
Greenstone Gold Mines (“GGM”) Greenstone Gold Property (formerly the Trans-Canada Property) includes
three blocks of contiguous claims known as the Hardrock, Brookbank and Viper areas. The Hardrock
Project is located within the southeast portion of the Hardrock claim block.
4.1 Location and Access
The property is situated in the Thunder Bay Mining Division of Ontario, with all claims located on NTS
sheets 42 E/10 and 42 E/11. The property is located approximately 275 kilometres (“km”) northeast of the
city of Thunder Bay, Ontario and approximately 4 km south of the town of Geraldton, Ontario. The city of
Thunder Bay has a population of 110,000 and provides support services, equipment and skilled labour for
both the mineral exploration and the mining industry. Rail, national highway, port and international airport
services are also available out of Thunder Bay. The town of Geraldton has a population of approximately
2,400 and can provide basic support services such as food and lodging.
The Hardrock deposit area covered by the Mineral Resource estimate in this Report is located in the
townships of Errington and Ashmore on NTS sheet 42E/10, approximately 4 km south of the town of
Geraldton. The approximate geographic centre coordinates of the Hardrock deposit resource area are
49°40'47”N and 86°56'32”N (UTM coordinates: 504175.9E and 5503024N, NAD 83, Zone 16).
4.2 Property Description
As of November 2019, GGM’s property holdings consist of three blocks of contiguous mining claims known
as the Hardrock, Brookbank and Viper Project areas as show in Figure 4.2. The Hardrock Project is also
known as the Kenogamisis property. The land tenure consists of cell claims, patented claims, mining leases,
and licenses of occupation (“MLO”) covering a total area of 39072.1 hectares (“ha”) as summarized in
Table 4.1. The properties are located in the townships of Lindsley, Errington, Ashmore, Parent, Salsberg
and McKelvie in the Thunder Bay Mining Division. A leasehold patent of mining rights or of surface rights,
or of both mining rights and surface rights is a conveyance or grant of possession of land for a set length
of time. There is usually a requirement to pay rent.
There are several past producing gold mines on the Property, including the Hard Rock, MacLeod-
Cockshutt, Mosher (all later combined as the Consolidated Mosher), Little Long Lac, Bankfield, Jellicoe and
Magnet mines. There are also a number of less significant historical occurrences of gold mineralization
within the property boundary. The mineralized zone that is host to the most recently delineated mineral
resources is within or adjacent to the former Hardrock and MacLeod-Cockshutt Mines.
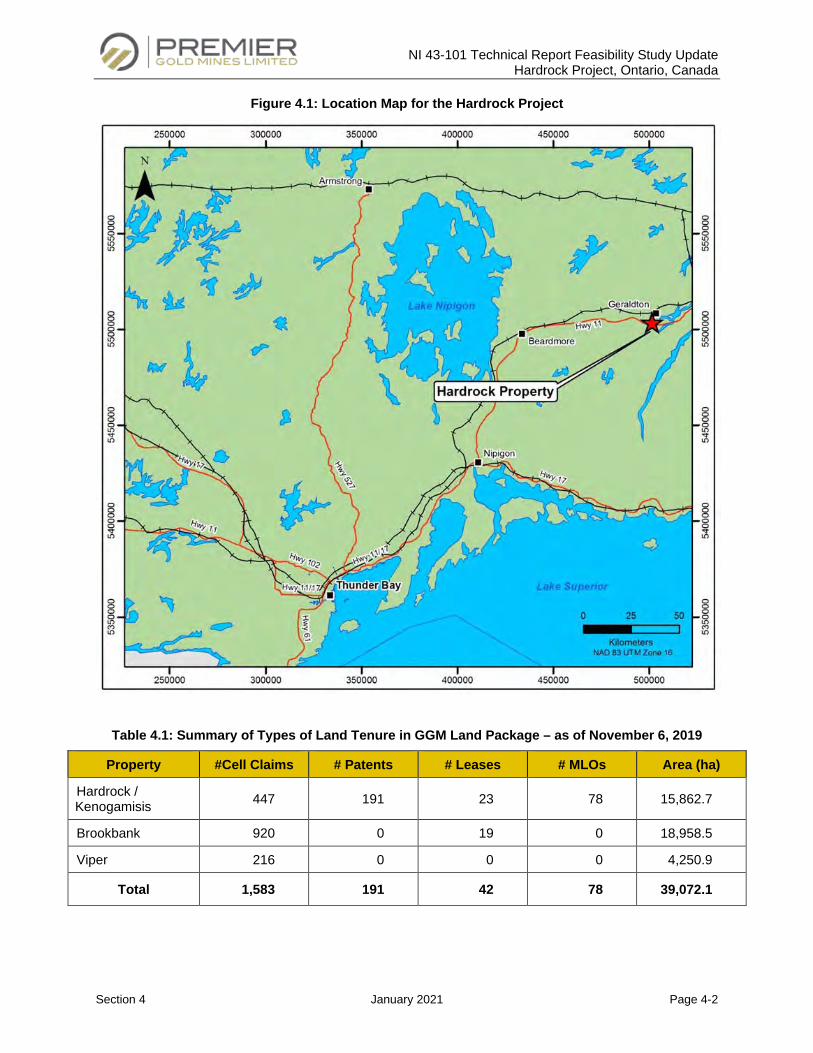
NI 43-101 Technical Report Feasibility Study Update Hardrock Project, Ontario, Canada
Section 4 January 2021 Page 4-2
Figure 4.1: Location Map for the Hardrock Project
Table 4.1: Summary of Types of Land Tenure in GGM Land Package – as of November 6, 2019
Property #Cell Claims # Patents # Leases # MLOs Area (ha)
Hardrock / Kenogamisis 447 191 23 78 15,862.7
Brookbank 920 0 19 0 18,958.5
Viper 216 0 0 0 4,250.9
Total 1,583 191 42 78 39,072.1
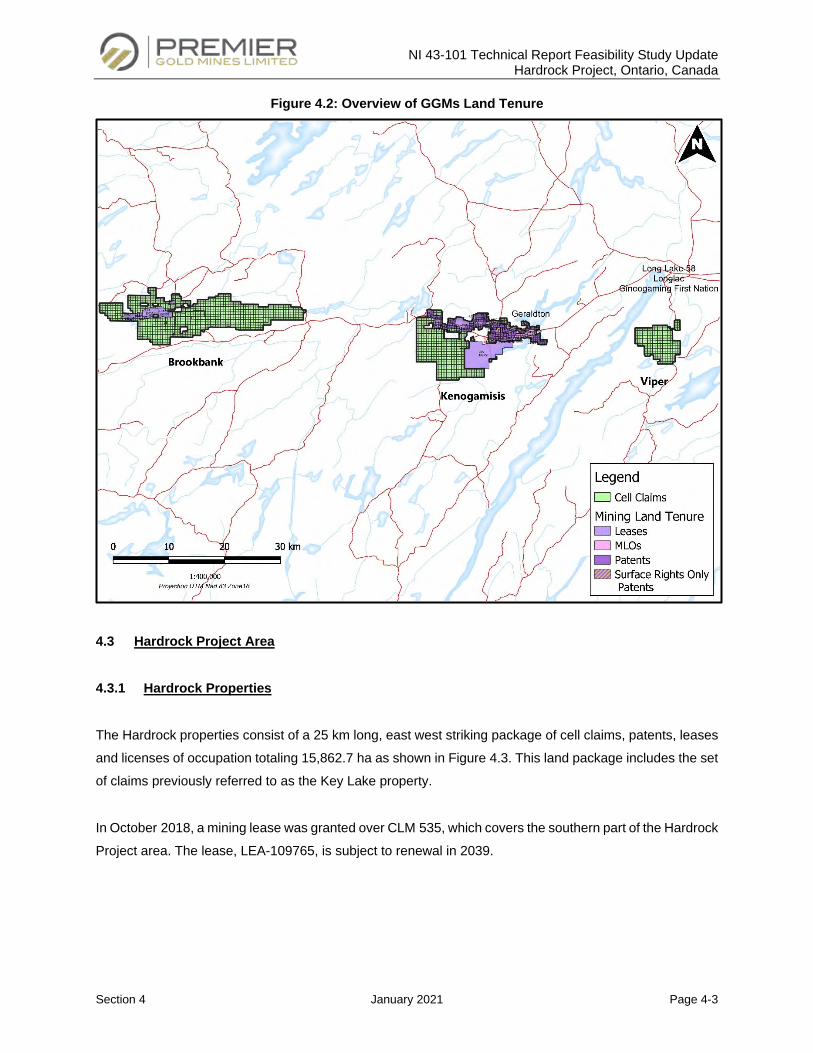
NI 43-101 Technical Report Feasibility Study Update Hardrock Project, Ontario, Canada
Section 4 January 2021 Page 4-3
Figure 4.2: Overview of GGMs Land Tenure
4.3 Hardrock Project Area
4.3.1 Hardrock Properties
The Hardrock properties consist of a 25 km long, east west striking package of cell claims, patents, leases
and licenses of occupation totaling 15,862.7 ha as shown in Figure 4.3. This land package includes the set
of claims previously referred to as the Key Lake property.
In October 2018, a mining lease was granted over CLM 535, which covers the southern part of the Hardrock
Project area. The lease, LEA-109765, is subject to renewal in 2039.
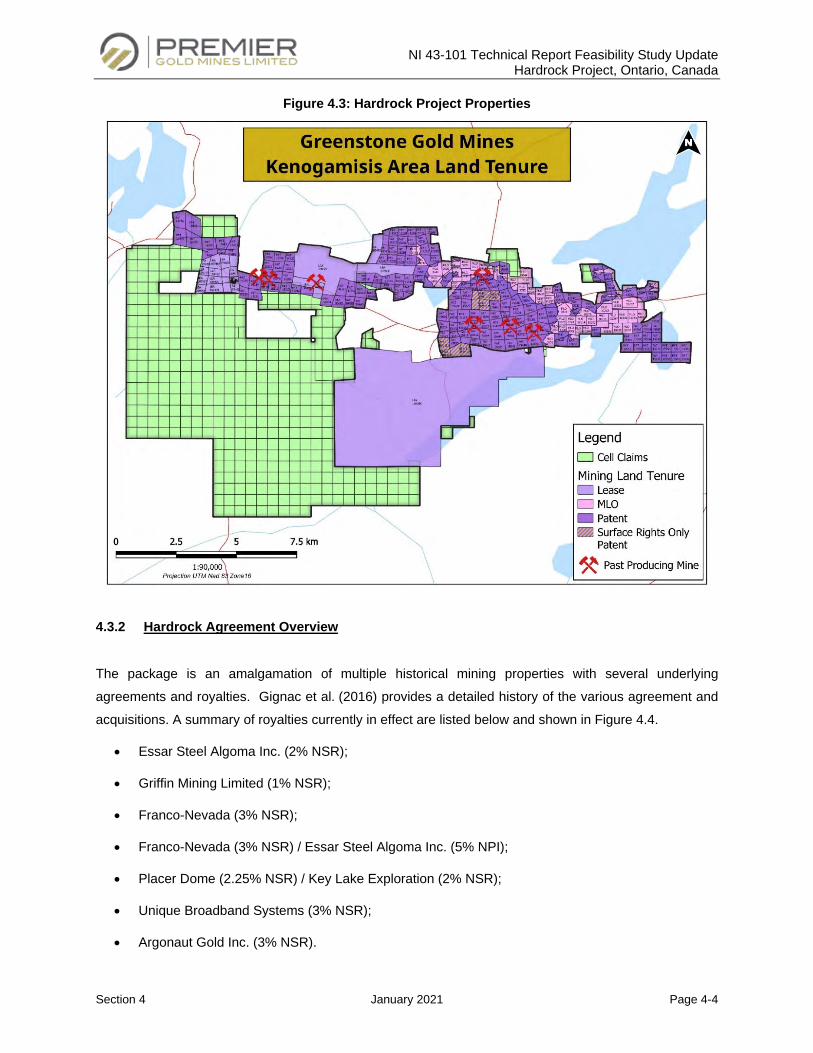
NI 43-101 Technical Report Feasibility Study Update Hardrock Project, Ontario, Canada
Section 4 January 2021 Page 4-4
Figure 4.3: Hardrock Project Properties
4.3.2 Hardrock Agreement Overview
The package is an amalgamation of multiple historical mining properties with several underlying
agreements and royalties. Gignac et al. (2016) provides a detailed history of the various agreement and
acquisitions. A summary of royalties currently in effect are listed below and shown in Figure 4.4.
• Essar Steel Algoma Inc. (2% NSR);
• Griffin Mining Limited (1% NSR);
• Franco-Nevada (3% NSR);
• Franco-Nevada (3% NSR) / Essar Steel Algoma Inc. (5% NPI);
• Placer Dome (2.25% NSR) / Key Lake Exploration (2% NSR);
• Unique Broadband Systems (3% NSR);
• Argonaut Gold Inc. (3% NSR).
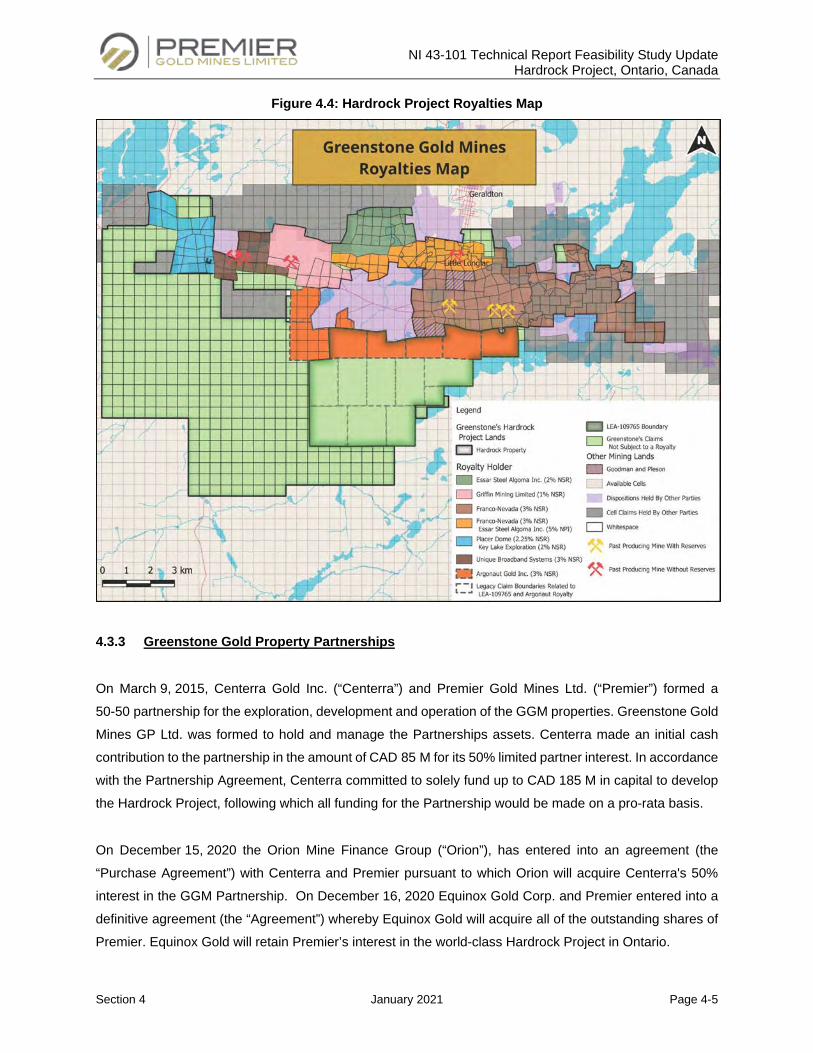
NI 43-101 Technical Report Feasibility Study Update Hardrock Project, Ontario, Canada
Section 4 January 2021 Page 4-5
Figure 4.4: Hardrock Project Royalties Map
4.3.3 Greenstone Gold Property Partnerships
On March 9, 2015, Centerra Gold Inc. (“Centerra”) and Premier Gold Mines Ltd. (“Premier”) formed a
50-50 partnership for the exploration, development and operation of the GGM properties. Greenstone Gold
Mines GP Ltd. was formed to hold and manage the Partnerships assets. Centerra made an initial cash
contribution to the partnership in the amount of CAD 85 M for its 50% limited partner interest. In accordance
with the Partnership Agreement, Centerra committed to solely fund up to CAD 185 M in capital to develop
the Hardrock Project, following which all funding for the Partnership would be made on a pro-rata basis.
On December 15, 2020 the Orion Mine Finance Group (“Orion”), has entered into an agreement (the
“Purchase Agreement”) with Centerra and Premier pursuant to which Orion will acquire Centerra's 50%
interest in the GGM Partnership. On December 16, 2020 Equinox Gold Corp. and Premier entered into a
definitive agreement (the “Agreement”) whereby Equinox Gold will acquire all of the outstanding shares of
Premier. Equinox Gold will retain Premier’s interest in the world-class Hardrock Project in Ontario.
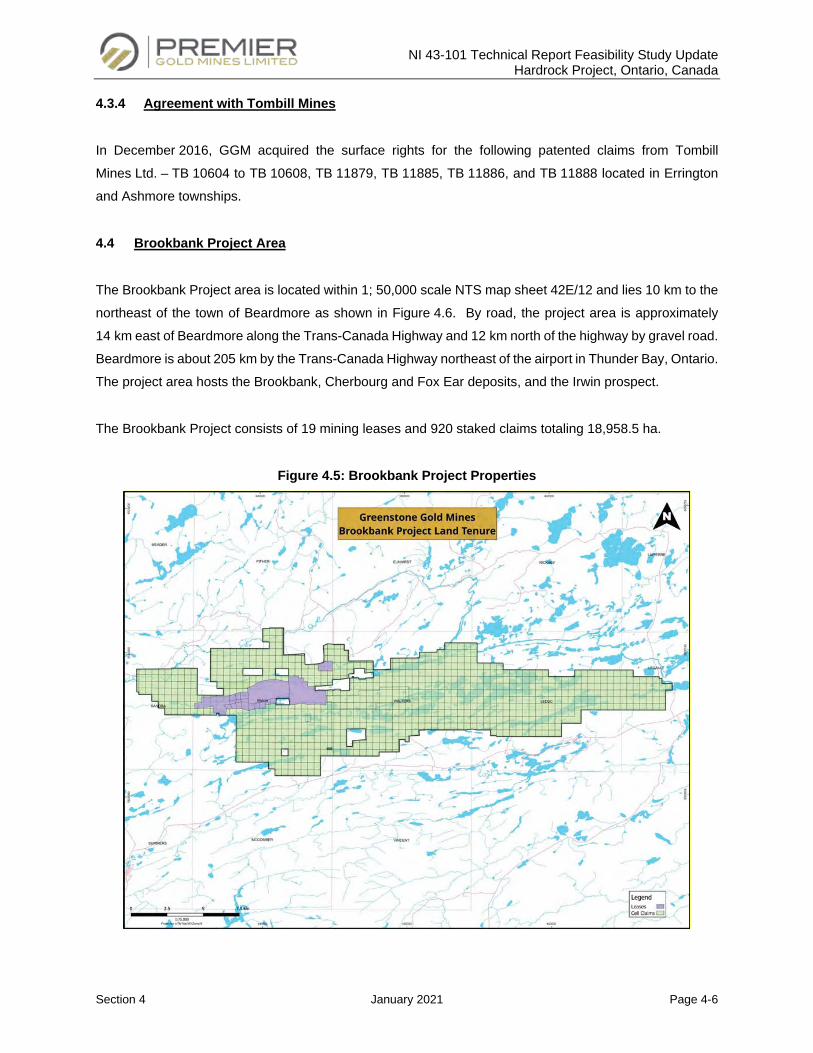
NI 43-101 Technical Report Feasibility Study Update Hardrock Project, Ontario, Canada
Section 4 January 2021 Page 4-6
4.3.4 Agreement with Tombill Mines
In December 2016, GGM acquired the surface rights for the following patented claims from Tombill
Mines Ltd. – TB 10604 to TB 10608, TB 11879, TB 11885, TB 11886, and TB 11888 located in Errington
and Ashmore townships.
4.4 Brookbank Project Area
The Brookbank Project area is located within 1; 50,000 scale NTS map sheet 42E/12 and lies 10 km to the
northeast of the town of Beardmore as shown in Figure 4.6. By road, the project area is approximately
14 km east of Beardmore along the Trans-Canada Highway and 12 km north of the highway by gravel road.
Beardmore is about 205 km by the Trans-Canada Highway northeast of the airport in Thunder Bay, Ontario.
The project area hosts the Brookbank, Cherbourg and Fox Ear deposits, and the Irwin prospect.
The Brookbank Project consists of 19 mining leases and 920 staked claims totaling 18,958.5 ha.
Figure 4.5: Brookbank Project Properties
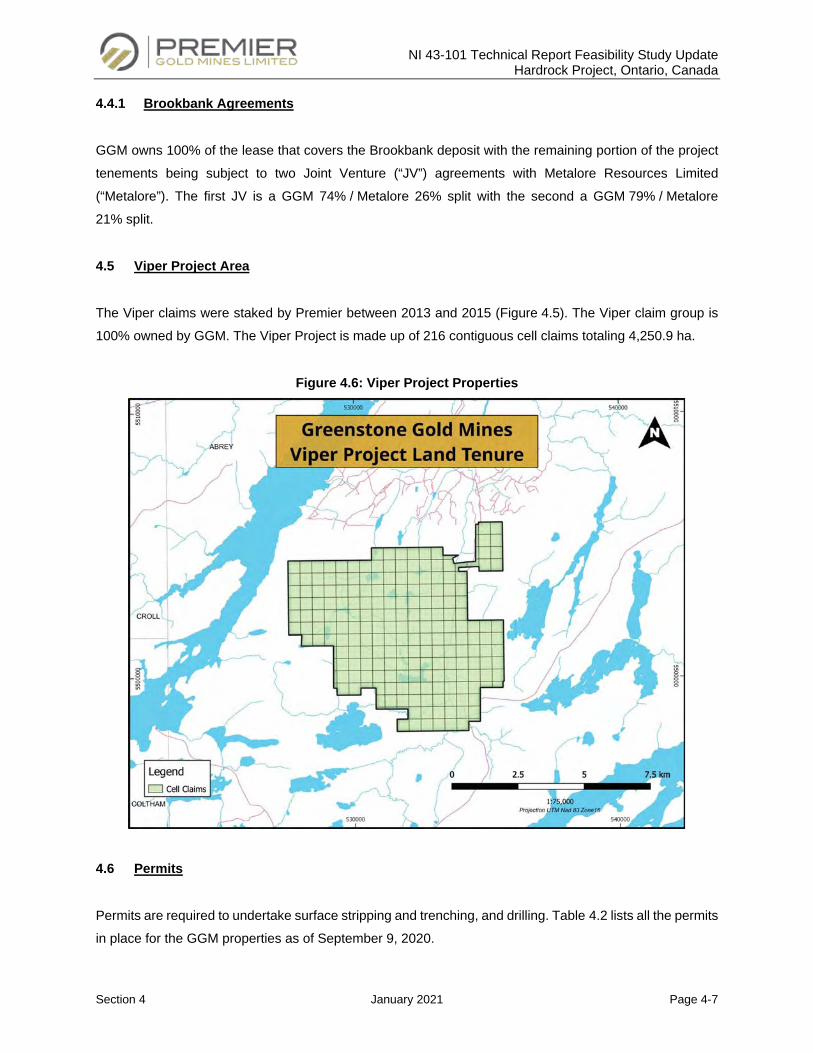
NI 43-101 Technical Report Feasibility Study Update Hardrock Project, Ontario, Canada
Section 4 January 2021 Page 4-7
4.4.1 Brookbank Agreements
GGM owns 100% of the lease that covers the Brookbank deposit with the remaining portion of the project
tenements being subject to two Joint Venture (“JV”) agreements with Metalore Resources Limited
(“Metalore”). The first JV is a GGM 74% / Metalore 26% split with the second a GGM 79% / Metalore
21% split.
4.5 Viper Project Area
The Viper claims were staked by Premier between 2013 and 2015 (Figure 4.5). The Viper claim group is
100% owned by GGM. The Viper Project is made up of 216 contiguous cell claims totaling 4,250.9 ha.
Figure 4.6: Viper Project Properties
4.6 Permits
Permits are required to undertake surface stripping and trenching, and drilling. Table 4.2 lists all the permits
in place for the GGM properties as of September 9, 2020.
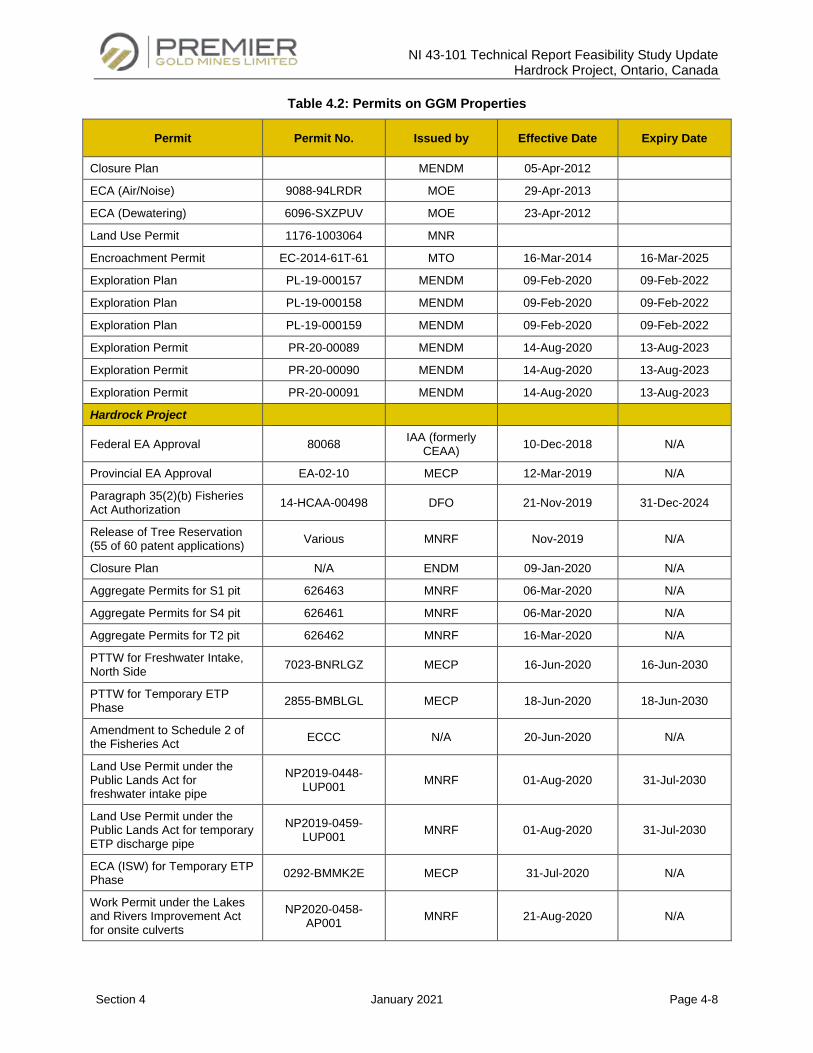
NI 43-101 Technical Report Feasibility Study Update Hardrock Project, Ontario, Canada
Section 4 January 2021 Page 4-8
Table 4.2: Permits on GGM Properties
Permit Permit No. Issued by Effective Date Expiry Date
Closure Plan MENDM 05-Apr-2012
ECA (Air/Noise) 9088-94LRDR MOE 29-Apr-2013
ECA (Dewatering) 6096-SXZPUV MOE 23-Apr-2012
Land Use Permit 1176-1003064 MNR
Encroachment Permit EC-2014-61T-61 MTO 16-Mar-2014 16-Mar-2025
Exploration Plan PL-19-000157 MENDM 09-Feb-2020 09-Feb-2022
Exploration Plan PL-19-000158 MENDM 09-Feb-2020 09-Feb-2022
Exploration Plan PL-19-000159 MENDM 09-Feb-2020 09-Feb-2022
Exploration Permit PR-20-00089 MENDM 14-Aug-2020 13-Aug-2023
Exploration Permit PR-20-00090 MENDM 14-Aug-2020 13-Aug-2023
Exploration Permit PR-20-00091 MENDM 14-Aug-2020 13-Aug-2023
Hardrock Project
Federal EA Approval 80068 IAA (formerly CEAA) 10-Dec-2018 N/A
Provincial EA Approval EA-02-10 MECP 12-Mar-2019 N/A
Paragraph 35(2)(b) Fisheries Act Authorization 14-HCAA-00498 DFO 21-Nov-2019 31-Dec-2024
Release of Tree Reservation (55 of 60 patent applications) Various MNRF Nov-2019 N/A
Closure Plan N/A ENDM 09-Jan-2020 N/A
Aggregate Permits for S1 pit 626463 MNRF 06-Mar-2020 N/A
Aggregate Permits for S4 pit 626461 MNRF 06-Mar-2020 N/A
Aggregate Permits for T2 pit 626462 MNRF 16-Mar-2020 N/A
PTTW for Freshwater Intake, North Side 7023-BNRLGZ MECP 16-Jun-2020 16-Jun-2030
PTTW for Temporary ETP Phase 2855-BMBLGL MECP 18-Jun-2020 18-Jun-2030
Amendment to Schedule 2 of the Fisheries Act ECCC N/A 20-Jun-2020 N/A
Land Use Permit under the Public Lands Act for freshwater intake pipe
NP2019-0448-LUP001 MNRF 01-Aug-2020 31-Jul-2030
Land Use Permit under the Public Lands Act for temporary ETP discharge pipe
NP2019-0459-LUP001 MNRF 01-Aug-2020 31-Jul-2030
ECA (ISW) for Temporary ETP Phase 0292-BMMK2E MECP 31-Jul-2020 N/A
Work Permit under the Lakes and Rivers Improvement Act for onsite culverts
NP2020-0458-AP001 MNRF 21-Aug-2020 N/A
NI 43-101 Technical Report Feasibility Study Update Hardrock Project, Ontario Canada
Section 5 January 2021 Page 5-1
ACCESSIBILITY, CLIMATE, LOCAL RESOURCES, INFRASTRUCTURE AND PHYSIOGRAPHY
5.1 Accessibility
5.1.1 Hardrock
The Hardrock Project is located in the Municipality of Greenstone in the Province of Ontario, near the town
of Geraldton. The area is accessible year-round via paved roads from Geraldton or Highway 11, which
crosses the property from east to west (Figure 5.1). The closest major city is Thunder Bay, Ontario, located
275 km to the southwest, and it can be reached by Trans-Canada Highway 11. Public roads are maintained
by various levels of government. Geraldton also hosts a municipal airport, which is equipped to
accommodate small aircrafts.
The south portion of the Hardrock Project is accessed via Highway 11. The remainder of the Hardrock
Project can be easily accessed by four-wheel drive vehicles via numerous logging/bush roads that branch
off from the paved highways. Drill roads provide excellent access to the areas being explored by
Greenstone Gold Mines (“GGM”). Those areas of the Hardrock Project not serviced by roads can be
accessed by ATV, on foot or by boat during the summer and by snowmobile in the winter.
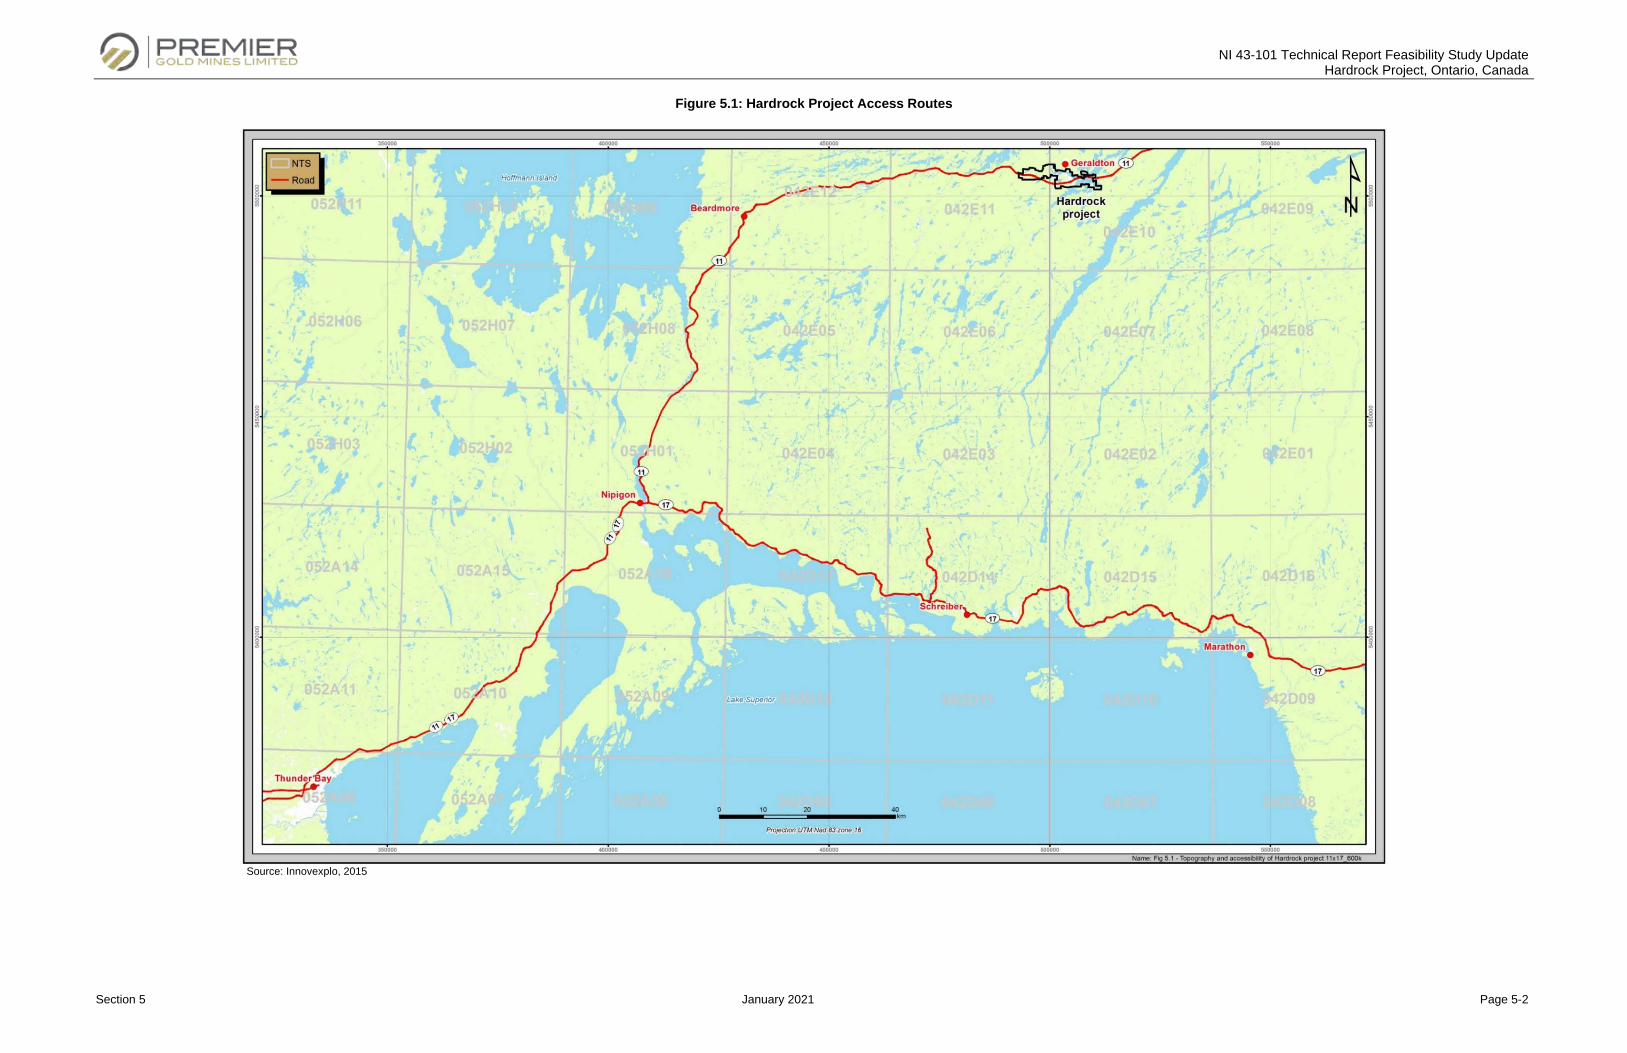
NI 43-101 Technical Report Feasibility Study Update Hardrock Project, Ontario, Canada
Section 5 January 2021 Page 5-2
Figure 5.1: Hardrock Project Access Routes
Source: Innovexplo, 2015
NI 43-101 Technical Report Feasibility Study Update Hardrock Project, Ontario, Canada
Section 5 January 2021 Page 5-3
5.1.2 Brookbank / Key Lake / Kailey / Viper
The Brookbank, Key Lake, Kailey and Viper projects are also located in the Municipality of Greenstone in
the Province of Ontario, between the towns of Beardmore and Geraldton. The main part of the Brookbank
property can be accessed via the Wendigokan Road, an all-weather gravel road which connects to
Highway 11. The eastern part of the Brookbank property is accessible by Highway 801, a paved secondary
road which also connects to Highway 11.
5.2 Climate
The Project is located in northern Ontario, which has a continental climate typical for temperate regions in
the mid-latitudes that are influenced by both polar and tropical air masses. In this climate, seasonal
temperature variations are represented by short summers and cold winters.
The nearest permanent weather monitoring station is located approximately 14 km north of the Project at
the Greenstone Regional Airport, which services Geraldton and the surrounding area. Weather statistics
for the period between 1971 to 2000 indicate a mean daily temperature of 3.9°C. Temperature ranges
between a maximum of 37°C and a minimum of -50.2°C with a mean annual rainfall of 546.4 mm and the
mean annual snowfall of 244.5 cm. On average, precipitations were recorded for 167 days during the
course of a year. The annual average relative humidity in the morning is about 83.6%. The annual average
wind speed for the area is about 11.2 km/h and the most frequent wind direction, on an annual basis, is
from the west. In the summer, winds blow most frequently from the west and south, while in the fall to winter,
the most frequent direction is from the west.
Weather conditions do not seriously hinder exploration and mining activities on the property, but
adjustments on the type of work performed are subject to season variations, such as, geological mapping
in the summer months and drilling in the winter months on frozen lakes.
5.3 Local Resources
The Hardrock Project benefits from local human resources and services in the town of Geraldton and
surrounding areas. Geraldton has a population of approximately 1,900 people and is part of the Municipality
of Greenstone, which also includes Longlac, Nakina, Beardmore and an extensive area of unincorporated
territory. Greenstone itself has an approximate population of 4,700 people. Throughout all phases of the
Project, GGM has done extensive consultation with local Indigenous communities and the town of
Geraldton.
NI 43-101 Technical Report Feasibility Study Update Hardrock Project, Ontario, Canada
Section 5 January 2021 Page 5-4
Although there has been no mining activity in the immediate area since 1970, the area has a workforce to
support the future mining activities. Geraldton has all of the services typical for a town of that size including
hospital, emergency services, school, sports centre, food, lodging, wireless, and wireline
telecommunications.
5.4 Infrastructure
GGM has established a field office in the town of Geraldton near the Hardrock Project itself for core
logging/cutting and core storage. This consists of an “Atco” style prefab office space, two office trailers
(used primarily by the Environmental group), a core cutting room with space for 2 diamond saws, temporary
core storage, sampling area and sediment settling/water re-use area and a separate garage, which has
been re-purposed for use as a core logging facility. Likewise, a garage at one of the former Hardrock
residences serves as a depot for the RC samples. Off-site storage of core, RC rep samples and assay
pulps and rejects is located at the Magnet Mine Site. A house in the MacLeod townsite contains all historical
maps and sections from the mines in the JV area as well as exploration projects.
GGM has also established a second office in the commercial district of Geraldton for public relations.
An independent sample preparation facility (“Actlabs”) is located in Geraldton. In times of heavy sample
flow, this facility may cooperate with the Actlabs facility in Thunder Bay to ensure timely turn-around.
Other significant infrastructure includes the Trans-Canada Highway, a TransCanada Pipelines Limited
(“TransCanada”) gas pipeline, a Hydro One electrical substation, and Geraldton hosts a municipal airport,
which has a 1,500 m runway capable of accommodating large aircraft.
The Hardrock Project occurs in a mining friendly district with active mines and milling facilities located at
Hemlo, Thunder Bay, Kapuskasing and Timmins with good transportation and regional mining related
infrastructure.
There are adequate surface rights for the planned mining related infrastructure – waste rock storage areas,
tailings management facility, processing and administration facilities as depicted in Figure 5.2. The
arrangement of mining related infrastructure will be constrained by the surrounding lakes and watercourses.
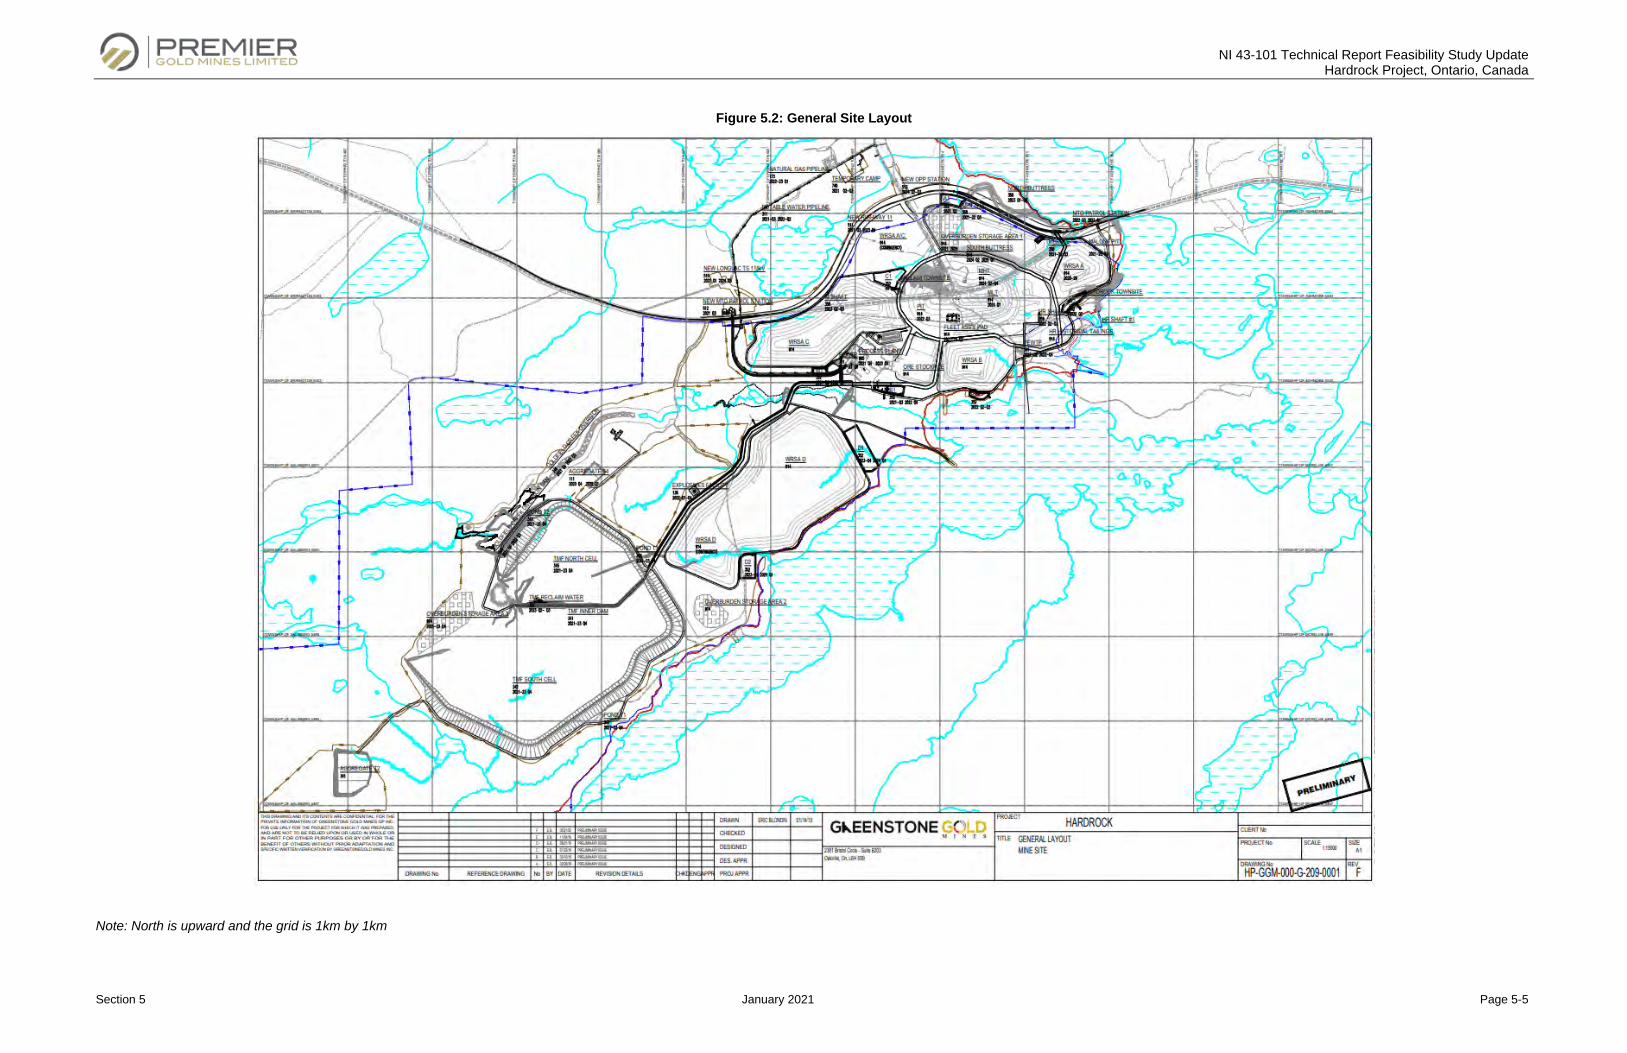
NI 43-101 Technical Report Feasibility Study Update Hardrock Project, Ontario, Canada
Section 5 January 2021 Page 5-5
Figure 5.2: General Site Layout
Note: North is upward and the grid is 1km by 1km
NI 43-101 Technical Report Feasibility Study Update Hardrock Project, Ontario, Canada
Section 5 January 2021 Page 5-6
5.4.1 Water
The town of Geraldton has its own potable water treatment system and water distribution network. The
GGM field office and houses in the Hardrock sub-division are currently serviced by this system. The plan is
to use the Municipality’s potable water for the Hardrock Project.
5.4.2 Sewage
The town of Geraldton has its own sewage treatment facility. The collecting network for sewage, however,
does not come south of Kenogamisis Lake. Consequently, houses in the MacLeod and Hardrock townsites
have their own septic beds.
5.5 Physiography
The Project lies within the Boreal Shield, a Canadian Ecozone where the Canadian Shield and the boreal
forest overlap. Precambrian bedrock at or near the surface plays an important role in shaping the
biophysical landscape. Lakes, ponds and wetlands are abundant in this landscape and drainage patterns
are typically dendritic, with sporadic angular drainage as influenced by bedrock outcrops.
The topography in the Project area is relatively flat to gently rolling with local relief up to 20 m, largely
attributed to glacial deposits that blanket the bedrock. There are no distinct topographic features that stand
out in relief. Lower lying areas are characterized by swamps and ponds with overall very poor drainage
throughout the area. The surrounding land has an altitude of about 335 masl. The largest lake adjacent to
the Project is Kenogamisis Lake and it bounds the Project to the south, east and north. This lake elevation
is about 330 masl.
5.6 Topography and Vegetation
The topography of the area is relatively flat with some gently rolling hills. Local relief ranges up to 20 m and
that is largely due to glacial deposits that cover the bedrock. Lower lying areas are characterized by swamps
and ponds with overall drainage in the area being very poor. The largest Lake on the Property is
Kenogamisis Lake, which bounds the project area to the south, east and north.
Vegetation in the area is dominated by coniferous trees, with the most common tree species being black
spruce, tamarack and cedar. There are local stands of birch, jack pine, and poplar in areas with better
drainage, such as eskers and moraines.
NI 43-101 Technical Report Feasibility Study Update Hardrock Project, Ontario, Canada
Section 6 January 2021 Page 6-1
HISTORY
6.1 Exploration History
Information described in this section was derived from the previous 2013 Technical Report on the Mineral
Resource Estimates for the Hardrock, Brookbank and Key Lake Projects by Micon International Ltd.
(“Micon”) and the 2016 MRE update NI 43 101 Technical Report completed by G Mining Services Inc.
(“GMS”).
This section provides a summary of the historical work carried out on the Hard Rock, MacLeod-Cockshutt
and Mosher Mines. Table 6.1 presents the statistics on gold production, diamond drilling and underground
development for all three mines. A detailed chronological summary of the historical work carried out on
these mines since 1980 is provided on Table 6.7.
The first gold discovery in the area of the Property was made between 1916 and 1918 when a gold-bearing
boulder was discovered south of the Main Narrows of Kenogamisis Lake. In 1931, W.W. “Hard Rock” Smith
discovered gold-bearing quartz stringers near the location of the Hard Rock Number One Shaft and
Tom Johnson and Robert Wells discovered gold on Magnet Lake, which later hosted the Bankfield Gold
Mine. Soon to follow was the discovery of gold by T. A. Johnson and T. Oklend in a small quartz vein along
the southern shore of Barton Bay on Kenogamisis Lake which is now the location of the Little Long Lac
Property.
In 1934, the period of mine production in the area began with the Little Long Lac Mine, which was the first
successfully producing mine in the area. To the west of the 1931 Hard Rock discovery, F. MacLeod and
A. Cockshutt staked claims and continually explored the area throughout the 1930’s and 1940’s. By the late
1940’s the F-Zone, a low-grade, large-tonnage orebody in greywacke, was identified on both the MacLeod-
Cockshutt and Hard Rock Properties.
Production on the Mosher Long Lac Mine (located west of, and immediately down plunge of the same
mineralized zones exploited in the MacLeod-Cockshutt Mine) began in 1962, then in 1967, the MacLeod-
Cockshutt, Mosher and Hard Rock Mines amalgamated and remained in production until 1970. The
consolidated Hard Rock, MacLeod-Cockshutt and Mosher Mines produced 2,146,326 ounces of gold at an
average grade of approximately 0.14 ounces of gold per ton (~14 Mt @ 4.9 g Au/t) in the period from
1934 to 1970.

NI 43-101 Technical Report Feasibility Study Update Hardrock Project, Ontario, Canada
Section 6 January 2021 Page 6-2
In the 1980s, Lac Minerals Ltd. reviewed the remaining underground reserves and conducted litho-
geochemistry, ground geophysical work and 15,240 m of diamond drilling in 77 holes to target areas with
open-pit potential (e.g. Hard Rock D and F; North and South Porphyry; and Porphyry Hill zones).
In 1992, Asarco Exploration Company of Canada Limited (“Asarco”) entered into a five-year earn-in
agreement with Lac Minerals and in 1993 carried out a program of reverse circulation (“RC”) overburden
drilling and diamond drilling, the latter largely focusing on the near-surface portion of the F-Zone and targets
along the plunging nose of the albite porphyry.
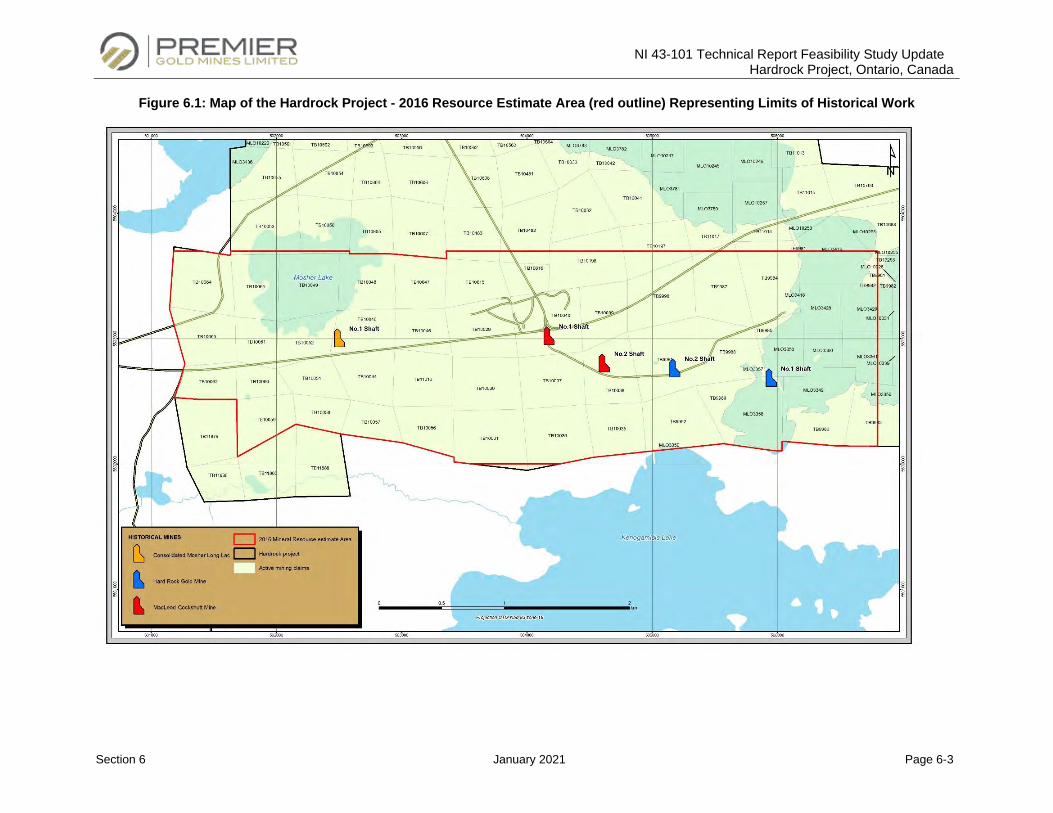
NI 43-101 Technical Report Feasibility Study Update Hardrock Project, Ontario, Canada
Section 6 January 2021 Page 6-3
Figure 6.1: Map of the Hardrock Project - 2016 Resource Estimate Area (red outline) Representing Limits of Historical Work
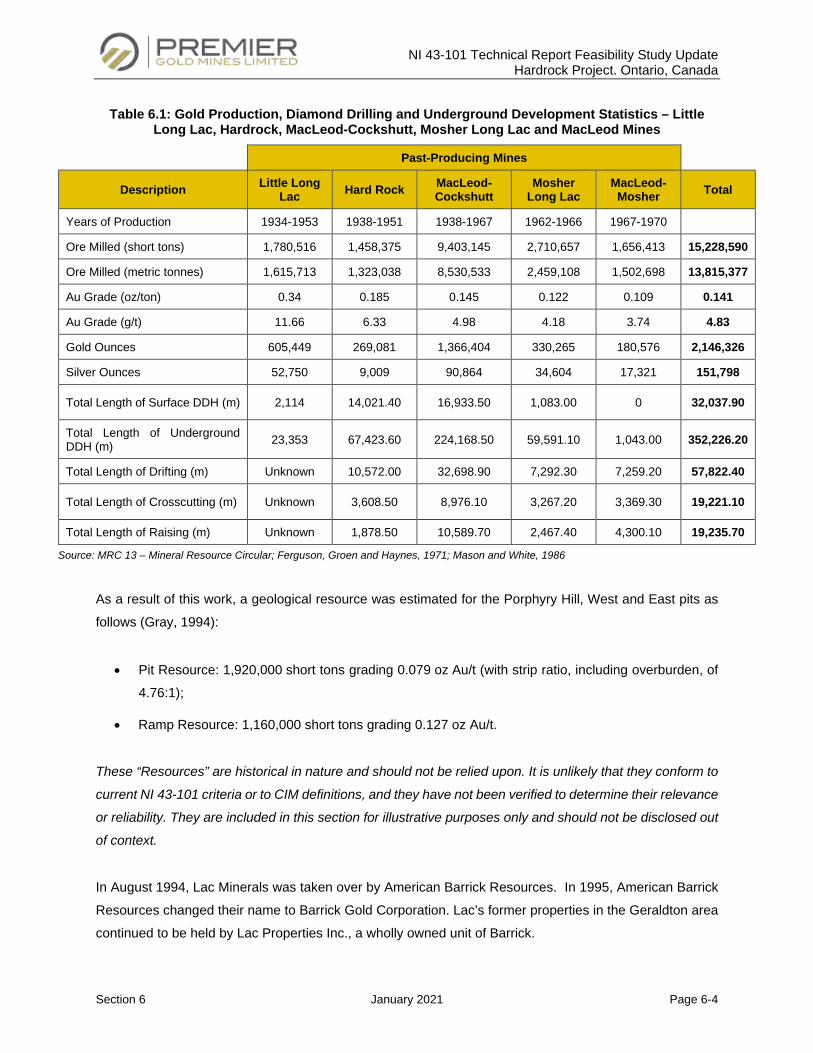
NI 43-101 Technical Report Feasibility Study Update Hardrock Project. Ontario, Canada
Section 6 January 2021 Page 6-4
Table 6.1: Gold Production, Diamond Drilling and Underground Development Statistics – Little Long Lac, Hardrock, MacLeod-Cockshutt, Mosher Long Lac and MacLeod Mines
Past-Producing Mines
Description Little Long Lac Hard Rock MacLeod-
Cockshutt Mosher
Long Lac MacLeod-
Mosher Total
Years of Production 1934-1953 1938-1951 1938-1967 1962-1966 1967-1970
Ore Milled (short tons) 1,780,516 1,458,375 9,403,145 2,710,657 1,656,413 15,228,590
Ore Milled (metric tonnes) 1,615,713 1,323,038 8,530,533 2,459,108 1,502,698 13,815,377
Au Grade (oz/ton) 0.34 0.185 0.145 0.122 0.109 0.141
Au Grade (g/t) 11.66 6.33 4.98 4.18 3.74 4.83
Gold Ounces 605,449 269,081 1,366,404 330,265 180,576 2,146,326
Silver Ounces 52,750 9,009 90,864 34,604 17,321 151,798
Total Length of Surface DDH (m) 2,114 14,021.40 16,933.50 1,083.00 0 32,037.90
Total Length of Underground DDH (m) 23,353 67,423.60 224,168.50 59,591.10 1,043.00 352,226.20
Total Length of Drifting (m) Unknown 10,572.00 32,698.90 7,292.30 7,259.20 57,822.40
Total Length of Crosscutting (m) Unknown 3,608.50 8,976.10 3,267.20 3,369.30 19,221.10
Total Length of Raising (m) Unknown 1,878.50 10,589.70 2,467.40 4,300.10 19,235.70
Source: MRC 13 – Mineral Resource Circular; Ferguson, Groen and Haynes, 1971; Mason and White, 1986
As a result of this work, a geological resource was estimated for the Porphyry Hill, West and East pits as
follows (Gray, 1994):
• Pit Resource: 1,920,000 short tons grading 0.079 oz Au/t (with strip ratio, including overburden, of
4.76:1);
• Ramp Resource: 1,160,000 short tons grading 0.127 oz Au/t.
These “Resources” are historical in nature and should not be relied upon. It is unlikely that they conform to
current NI 43-101 criteria or to CIM definitions, and they have not been verified to determine their relevance
or reliability. They are included in this section for illustrative purposes only and should not be disclosed out
of context.
In August 1994, Lac Minerals was taken over by American Barrick Resources. In 1995, American Barrick
Resources changed their name to Barrick Gold Corporation. Lac’s former properties in the Geraldton area
continued to be held by Lac Properties Inc., a wholly owned unit of Barrick.
NI 43-101 Technical Report Feasibility Study Update Hardrock Project. Ontario, Canada
Section 6 January 2021 Page 6-5
Asarco continued their exploration program into 1994, completing reverse circulation holes in overburden,
sonic holes in tailings, and an additional 40,000 ft of diamond drilling, mostly on the aforementioned targets
(Gray, 1994). Cyprus Canada Inc. (“Cyprus”) assumed Asarco’s role in the Lac Minerals agreement in 1996
and drilled 24 holes, leading to the discovery of the B-Zone (Mason and White, 1997).
The agreement ended in 1997. Barrick, through Lac Properties Inc., began a rehabilitation program which
continued until 2001. This saw the construction of the current Visitor’s Centre, re-contouring and seeding
of the MacLeod tailings near Highway 11 and capping of old mine shafts.
In 2000, Golder was retained by Lac Properties Inc. (“Lac Properties”) to conduct a stability assessment of
the F-Zone crown pillar of the MacLeod-Cockshutt mine (Telesnicki and Steed, 2007). From
November 27 to December 12, 2000, Golder conducted a field investigation to determine whether caving
had occurred above the stoping. One investigation borehole (369.5 m) was drilled in order to perform this
investigation. The study also included a literature review of the properties of the mined material at the Hard
Rock mine, rock mass classification of the rock core from the investigation borehole, an empirical analysis
using the Scaled Span crown pillar stability assessment, an analysis using the CPillar crown pillar stability
assessment, numerical modelling to determine the stability of the crown pillar using PHASE software, and
a correlation of numerical modelling results with the field investigation and conclusions.
Investigation drilling at the MacLeod-Cockshutt mine allowed Golder to confirm that the crown pillar
overlying the workings was intact at the time of the study. No unravelling or caving of the crown pillar above
the working was observed. Classification of the rock mass overlying the workings indicated the quality to
be "good" to "very good". Empirical, analytical and numerical modelling of the stability of the crown pillar
overlying the mined zone indicated that the crown pillar was stable. Due to the depth of the mine workings
and quality of the rock mass, it was not considered probable that significant caving could occur or would
have an influence on the overlying ground surface.
In 2002, Golder was retained by Lac Properties to conduct a stability assessment of the crown pillar of the
Hard Rock Mine (Soni and Steed, 2002). A total of 16 investigation boreholes (2,116.8 m) were drilled to
determine whether caving in the crown of the stope had occurred. The study comprised a literature review
of the properties of the mined material at the Hard Rock Mine, rock mass classification of the rock core from
the investigation boreholes, an empirical analysis using the Scaled Span crown pillar stability assessment,
an analytical analysis using the CPillar crown pillar stability assessment, numerical modelling to determine
the stability of the crown pillar using PHASE software, and a correlation of numerical modelling results with
the field investigation and conclusions.
NI 43-101 Technical Report Feasibility Study Update Hardrock Project. Ontario, Canada
Section 6 January 2021 Page 6-6
Investigation drilling at the MacLeod-Cockshutt mine allowed Golder to confirm that the crown pillar
overlying the workings was intact at the time of the study. No unravelling or caving of the crown pillar above
the working was observed. Classification of the rock mass overlying the workings indicated the quality to
be "good" to "very good". Empirical, analytical and numerical modelling of the stability of the crown pillar
overlying the mined zone indicated that the crown pillar was stable. Due to the depth of the mine workings
and quality of the rock mass, it was not considered probable that significant caving could occur or would
have an influence on the overlying ground surface.
In 2002, Golder was retained by Lac Properties to conduct a stability assessment of the crown pillar of the
Hard Rock Mine (Soni and Steed, 2002). A total of 16 investigation boreholes (2,116.8 m) were drilled to
determine whether caving in the crown of the stope had occurred. The study comprised a literature review
of the properties of the mined material at the Hard Rock Mine, rock mass classification of the rock core from
the investigation boreholes, an empirical analysis using the Scaled Span crown pillar stability assessment,
an analytical analysis using the CPillar crown pillar stability assessment, numerical modelling to determine
the stability of the crown pillar using PHASE software, and a correlation of numerical modelling results with
the field investigation and conclusions.
Investigation drilling at the Hard Rock Mine indicated that the crown pillar overlying the workings was intact
at the time of the study. No unraveling or caving of the crown pillar above the working was observed by
Golder and no unexpected geometries were encountered. Classification of the rock mass overlying the
workings indicated the quality to be "good". Empirical, analytical and numerical modelling of the stability of
the crown pillar overlying the mined zone indicated the crown pillar to be stable, even when conservative
values were used for stope geometries, strength, and rock mass classification, thus ensuring an additional
built-in factor of safety.
In 2007, six geotechnical diamond drill holes totaling 1,208.1 m were drilled by Lac Properties in the crown
pillars (Murahwi et al., 2011; 2013).
In 2007, Premier Gold Mines Limited (“Premier”) began signing various agreements to gain interest in the
property and soon after began exploration drilling on the property (see Section 4).
Following Premier’s acquisition of Lac Properties’ claims in late 2008, a total of 91,802 m in 346 holes were
drilled, with work focused on the North Iron Formation Area, the Hard Rock-Porphyry Hill Area and the Hard
Rock-East Pit Area.
There were two areas where overburden stripping and related work were carried out. The GP-Zone, located
north of the Trans-Canada Highway approximately one kilometre west of the Geraldton turn-off, was
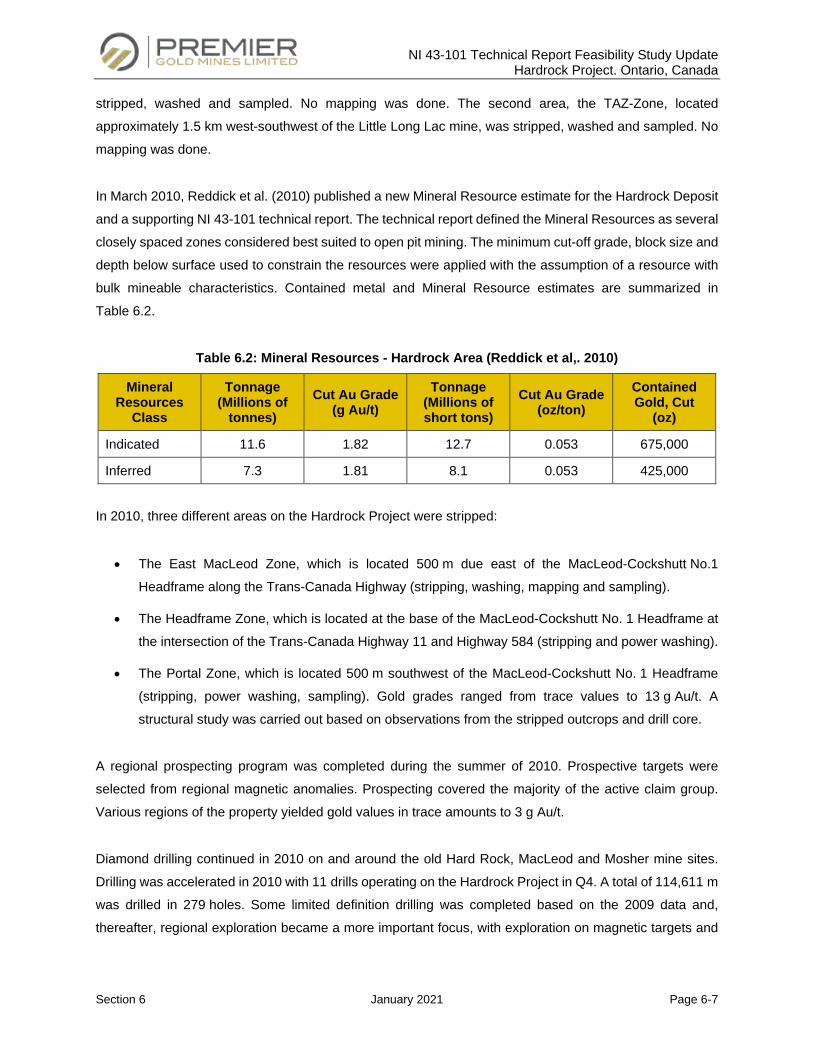
NI 43-101 Technical Report Feasibility Study Update Hardrock Project. Ontario, Canada
Section 6 January 2021 Page 6-7
stripped, washed and sampled. No mapping was done. The second area, the TAZ-Zone, located
approximately 1.5 km west-southwest of the Little Long Lac mine, was stripped, washed and sampled. No
mapping was done.
In March 2010, Reddick et al. (2010) published a new Mineral Resource estimate for the Hardrock Deposit
and a supporting NI 43-101 technical report. The technical report defined the Mineral Resources as several
closely spaced zones considered best suited to open pit mining. The minimum cut-off grade, block size and
depth below surface used to constrain the resources were applied with the assumption of a resource with
bulk mineable characteristics. Contained metal and Mineral Resource estimates are summarized in
Table 6.2.
Table 6.2: Mineral Resources - Hardrock Area (Reddick et al,. 2010)
Mineral Resources
Class
Tonnage (Millions of
tonnes) Cut Au Grade
(g Au/t) Tonnage
(Millions of short tons)
Cut Au Grade (oz/ton)
Contained Gold, Cut
(oz)
Indicated 11.6 1.82 12.7 0.053 675,000
Inferred 7.3 1.81 8.1 0.053 425,000
In 2010, three different areas on the Hardrock Project were stripped:
• The East MacLeod Zone, which is located 500 m due east of the MacLeod-Cockshutt No.1
Headframe along the Trans-Canada Highway (stripping, washing, mapping and sampling).
• The Headframe Zone, which is located at the base of the MacLeod-Cockshutt No. 1 Headframe at
the intersection of the Trans-Canada Highway 11 and Highway 584 (stripping and power washing).
• The Portal Zone, which is located 500 m southwest of the MacLeod-Cockshutt No. 1 Headframe
(stripping, power washing, sampling). Gold grades ranged from trace values to 13 g Au/t. A
structural study was carried out based on observations from the stripped outcrops and drill core.
A regional prospecting program was completed during the summer of 2010. Prospective targets were
selected from regional magnetic anomalies. Prospecting covered the majority of the active claim group.
Various regions of the property yielded gold values in trace amounts to 3 g Au/t.
Diamond drilling continued in 2010 on and around the old Hard Rock, MacLeod and Mosher mine sites.
Drilling was accelerated in 2010 with 11 drills operating on the Hardrock Project in Q4. A total of 114,611 m
was drilled in 279 holes. Some limited definition drilling was completed based on the 2009 data and,
thereafter, regional exploration became a more important focus, with exploration on magnetic targets and
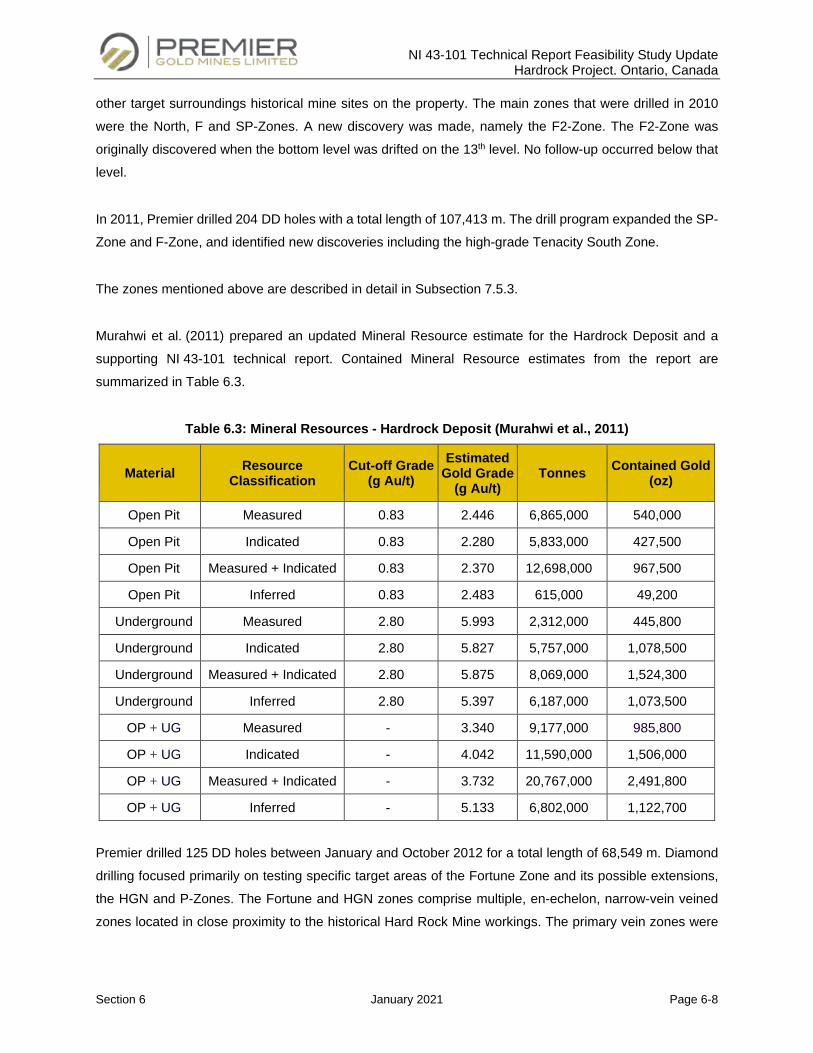
NI 43-101 Technical Report Feasibility Study Update Hardrock Project. Ontario, Canada
Section 6 January 2021 Page 6-8
other target surroundings historical mine sites on the property. The main zones that were drilled in 2010
were the North, F and SP-Zones. A new discovery was made, namely the F2-Zone. The F2-Zone was
originally discovered when the bottom level was drifted on the 13th level. No follow-up occurred below that
level.
In 2011, Premier drilled 204 DD holes with a total length of 107,413 m. The drill program expanded the SP-
Zone and F-Zone, and identified new discoveries including the high-grade Tenacity South Zone.
The zones mentioned above are described in detail in Subsection 7.5.3.
Murahwi et al. (2011) prepared an updated Mineral Resource estimate for the Hardrock Deposit and a
supporting NI 43-101 technical report. Contained Mineral Resource estimates from the report are
summarized in Table 6.3.
Table 6.3: Mineral Resources - Hardrock Deposit (Murahwi et al., 2011)
Material Resource Classification
Cut-off Grade (g Au/t)
Estimated Gold Grade
(g Au/t) Tonnes Contained Gold
(oz)
Open Pit Measured 0.83 2.446 6,865,000 540,000
Open Pit Indicated 0.83 2.280 5,833,000 427,500
Open Pit Measured + Indicated 0.83 2.370 12,698,000 967,500
Open Pit Inferred 0.83 2.483 615,000 49,200
Underground Measured 2.80 5.993 2,312,000 445,800
Underground Indicated 2.80 5.827 5,757,000 1,078,500
Underground Measured + Indicated 2.80 5.875 8,069,000 1,524,300
Underground Inferred 2.80 5.397 6,187,000 1,073,500
OP + UG Measured - 3.340 9,177,000 985,800
OP + UG Indicated - 4.042 11,590,000 1,506,000
OP + UG Measured + Indicated - 3.732 20,767,000 2,491,800
OP + UG Inferred - 5.133 6,802,000 1,122,700
Premier drilled 125 DD holes between January and October 2012 for a total length of 68,549 m. Diamond
drilling focused primarily on testing specific target areas of the Fortune Zone and its possible extensions,
the HGN and P-Zones. The Fortune and HGN zones comprise multiple, en-echelon, narrow-vein veined
zones located in close proximity to the historical Hard Rock Mine workings. The primary vein zones were
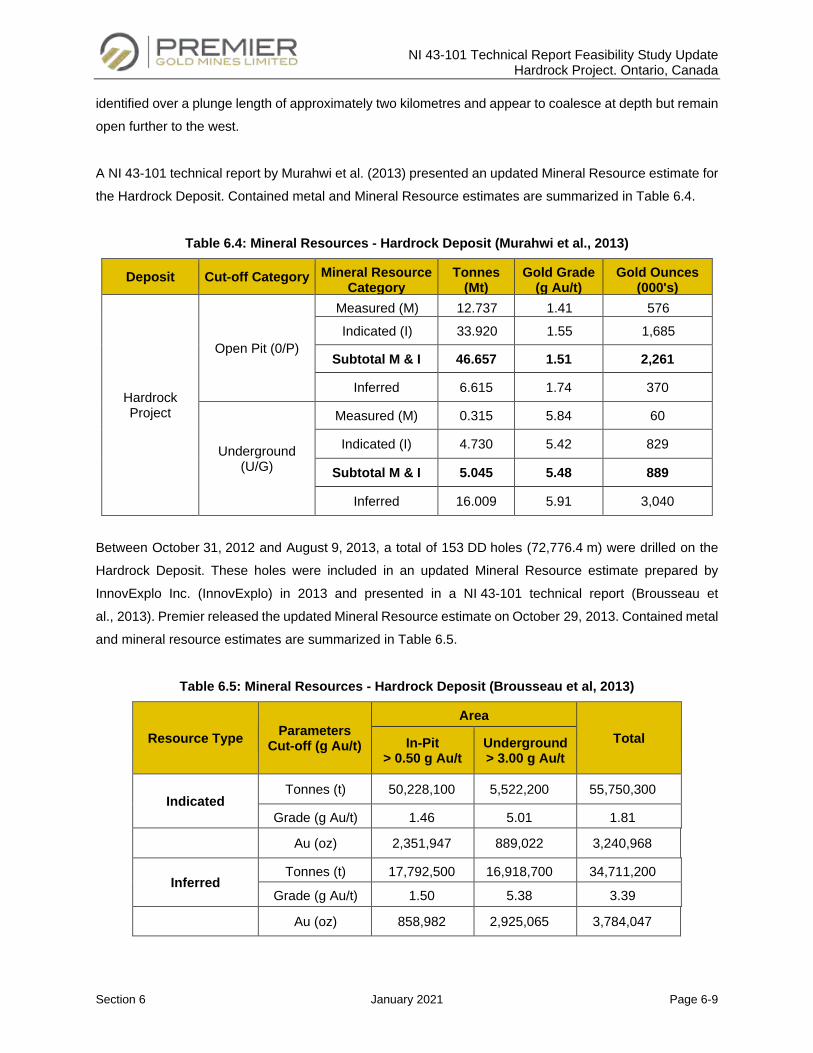
NI 43-101 Technical Report Feasibility Study Update Hardrock Project. Ontario, Canada
Section 6 January 2021 Page 6-9
identified over a plunge length of approximately two kilometres and appear to coalesce at depth but remain
open further to the west.
A NI 43-101 technical report by Murahwi et al. (2013) presented an updated Mineral Resource estimate for
the Hardrock Deposit. Contained metal and Mineral Resource estimates are summarized in Table 6.4.
Table 6.4: Mineral Resources - Hardrock Deposit (Murahwi et al., 2013)
Deposit Cut-off Category Mineral Resource Category
Tonnes (Mt)
Gold Grade (g Au/t)
Gold Ounces (000's)
Hardrock Project
Open Pit (0/P)
Measured (M) 12.737 1.41 576
Indicated (I) 33.920 1.55 1,685
Subtotal M & I 46.657 1.51 2,261
Inferred 6.615 1.74 370
Underground (U/G)
Measured (M) 0.315 5.84 60
Indicated (I) 4.730 5.42 829
Subtotal M & I 5.045 5.48 889
Inferred 16.009 5.91 3,040
Between October 31, 2012 and August 9, 2013, a total of 153 DD holes (72,776.4 m) were drilled on the
Hardrock Deposit. These holes were included in an updated Mineral Resource estimate prepared by
InnovExplo Inc. (InnovExplo) in 2013 and presented in a NI 43-101 technical report (Brousseau et
al., 2013). Premier released the updated Mineral Resource estimate on October 29, 2013. Contained metal
and mineral resource estimates are summarized in Table 6.5.
Table 6.5: Mineral Resources - Hardrock Deposit (Brousseau et al, 2013)
Resource Type Parameters Cut-off (g Au/t)
Area Total In-Pit
> 0.50 g Au/t Underground > 3.00 g Au/t
Indicated Tonnes (t) 50,228,100 5,522,200 55,750,300
Grade (g Au/t) 1.46 5.01 1.81
Au (oz) 2,351,947 889,022 3,240,968
Inferred Tonnes (t) 17,792,500 16,918,700 34,711,200
Grade (g Au/t) 1.50 5.38 3.39
Au (oz) 858,982 2,925,065 3,784,047
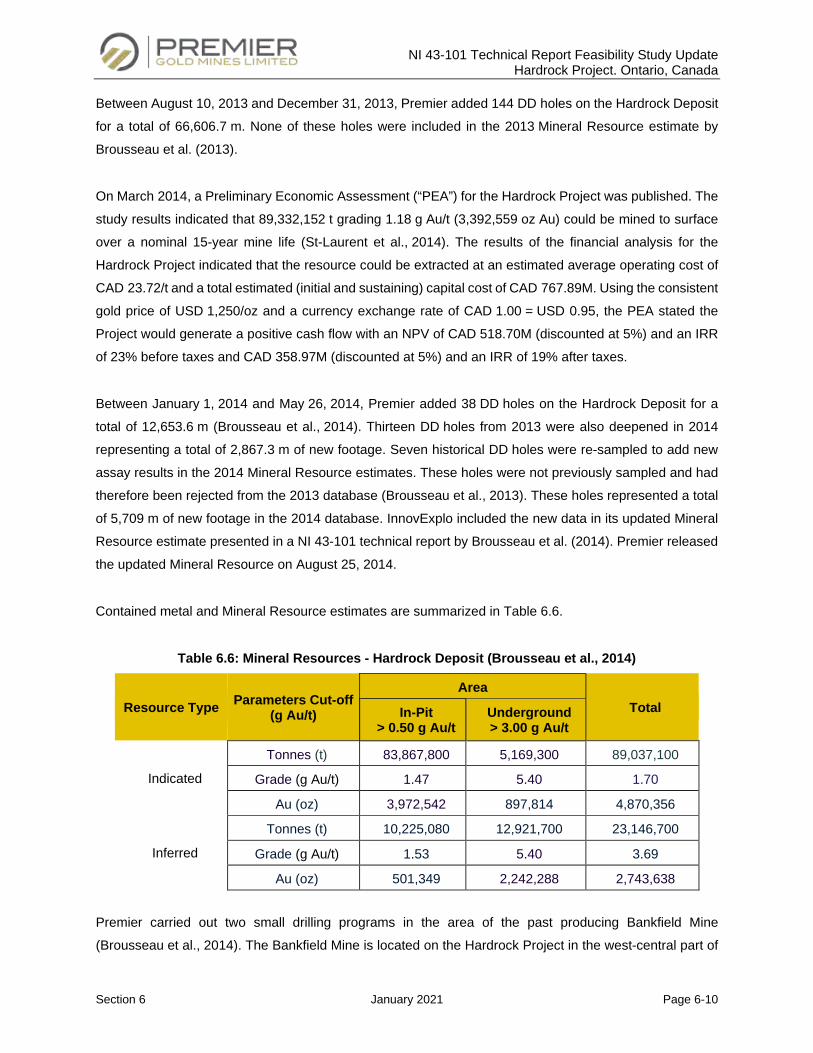
NI 43-101 Technical Report Feasibility Study Update Hardrock Project. Ontario, Canada
Section 6 January 2021 Page 6-10
Between August 10, 2013 and December 31, 2013, Premier added 144 DD holes on the Hardrock Deposit
for a total of 66,606.7 m. None of these holes were included in the 2013 Mineral Resource estimate by
Brousseau et al. (2013).
On March 2014, a Preliminary Economic Assessment (“PEA”) for the Hardrock Project was published. The
study results indicated that 89,332,152 t grading 1.18 g Au/t (3,392,559 oz Au) could be mined to surface
over a nominal 15-year mine life (St-Laurent et al., 2014). The results of the financial analysis for the
Hardrock Project indicated that the resource could be extracted at an estimated average operating cost of
CAD 23.72/t and a total estimated (initial and sustaining) capital cost of CAD 767.89M. Using the consistent
gold price of USD 1,250/oz and a currency exchange rate of CAD 1.00 = USD 0.95, the PEA stated the
Project would generate a positive cash flow with an NPV of CAD 518.70M (discounted at 5%) and an IRR
of 23% before taxes and CAD 358.97M (discounted at 5%) and an IRR of 19% after taxes.
Between January 1, 2014 and May 26, 2014, Premier added 38 DD holes on the Hardrock Deposit for a
total of 12,653.6 m (Brousseau et al., 2014). Thirteen DD holes from 2013 were also deepened in 2014
representing a total of 2,867.3 m of new footage. Seven historical DD holes were re-sampled to add new
assay results in the 2014 Mineral Resource estimates. These holes were not previously sampled and had
therefore been rejected from the 2013 database (Brousseau et al., 2013). These holes represented a total
of 5,709 m of new footage in the 2014 database. InnovExplo included the new data in its updated Mineral
Resource estimate presented in a NI 43-101 technical report by Brousseau et al. (2014). Premier released
the updated Mineral Resource on August 25, 2014.
Contained metal and Mineral Resource estimates are summarized in Table 6.6.
Table 6.6: Mineral Resources - Hardrock Deposit (Brousseau et al., 2014)
Resource Type Parameters Cut-off (g Au/t)
Area Total In-Pit
> 0.50 g Au/t Underground > 3.00 g Au/t
Indicated
Tonnes (t) 83,867,800 5,169,300 89,037,100
Grade (g Au/t) 1.47 5.40 1.70
Au (oz) 3,972,542 897,814 4,870,356
Inferred
Tonnes (t) 10,225,080 12,921,700 23,146,700
Grade (g Au/t) 1.53 5.40 3.69
Au (oz) 501,349 2,242,288 2,743,638
Premier carried out two small drilling programs in the area of the past producing Bankfield Mine
(Brousseau et al., 2014). The Bankfield Mine is located on the Hardrock Project in the west-central part of

NI 43-101 Technical Report Feasibility Study Update Hardrock Project. Ontario, Canada
Section 6 January 2021 Page 6-11
Errington Township, extending into Lindsley Township and enclosing the southwest part of Magnet Lake.
This historical mine is situated about 10 km west-southwest of the Town of Geraldton. Between
December 15, 2013 and January 24, 2014, two DD drill holes were drilled for a total of 1,043 m. Between
April 22, 2014 and May 17, 2014, six DD holes were added in this area totaling 2,513 m. None of these
holes were included in the Mineral Resource estimate prepared by Brosseau et al in 2014.
June 1, 2014 through 2016, Premier conducted stripping in the 2014 resource area, east of MacLeod Shaft
No. 1 (Brousseau et al., 2014). The work consisted of three stripped areas with detailed geological mapping
and channel sampling. The channels were five meters apart in the east-west direction and sampled to the
extent of the outcrop every one meter. The purpose of this work was to verify and establish structural
elements and grade continuity at surface.
During 2014, a total of 128 mechanical test pits were completed on the Hardrock Project to evaluate the
overburden thickness. Results of these test pits were not used in the 2014 Mineral Resource estimate
update (Brousseau et al., 2015).
In February 2015, Premier and Centerra Gold Inc. formed a definitive 50/50 partnership for development of
the Hardrock Property. In July 2015, the joint partnership was named Greenstone Gold Mines GP Inc
(“GGM”).
Through 2015, work continued to support a Feasibility Study to mine the Hardrock. A NI 43-101 compliant
report was authored by GMS of Montreal, Qc., in December 2016. The Feasibility Study envisaged an
open pit mining/milling operation processing 27,000 tpd of ore and producing an average of 279 koz of gold
over a 15 year period, for a total of 4,193 koz produced from 4,647 koz contained. The pit would effectively
mine out the area of the former Hardrock No. 2 Shaft and the MacLeod No.1 and No. 2 Shafts. The push
back on the north wall of the pit would mine out a portion of the historic MacLeod tailings and would also
require the relocation of Highway 11, the MTO garage and the OPP station. The pit and rock piles would
effectively occupy a large portion of the historic MacLeod and Hardrock townsites. To this end, GGM
embarked on a campaign to buy the surface rights from individual landowners in these areas. The
Feasibility Study also included designs for rock piles, Tailings Management Facility (“TMF”) and related
run-off collection ditches and water treatment. The TMF would be located southwest of the mine and mill
facilities. This would require the relocation of Goldfield Creek.
Total undiscounted cash flow, after taxes, was estimated at CAD 1,636M, or CAD 709M at a 5% discount
rate, after total CAPEX of CAD 1,242M and sustaining capital of CAD 257M, generating an after-tax IRR of
14.4%.

NI 43-101 Technical Report Feasibility Study Update Hardrock Project. Ontario, Canada
Section 6 January 2021 Page 6-12
Project design work continued through 2017. In 2018, a program of tightly spaced (20 m x 10 m grid)
reverse circulation drilling was conducted over key areas to gain more detailed information on the grade
continuity of the deposit. This resulted in 19,995 m drilled in 405 holes. As well, 62 blast holes, totaling
535 m were drilled to test penetration rates in the host rock. The results of this program are included in the
current resource update.
Definition drilling continued in 2019, with 76 RC holes totaling 5,946 m and 54 NQ size diamond drill holes
for 12,108 m being drilled. The results of this drilling are also included in the current resource estimate.
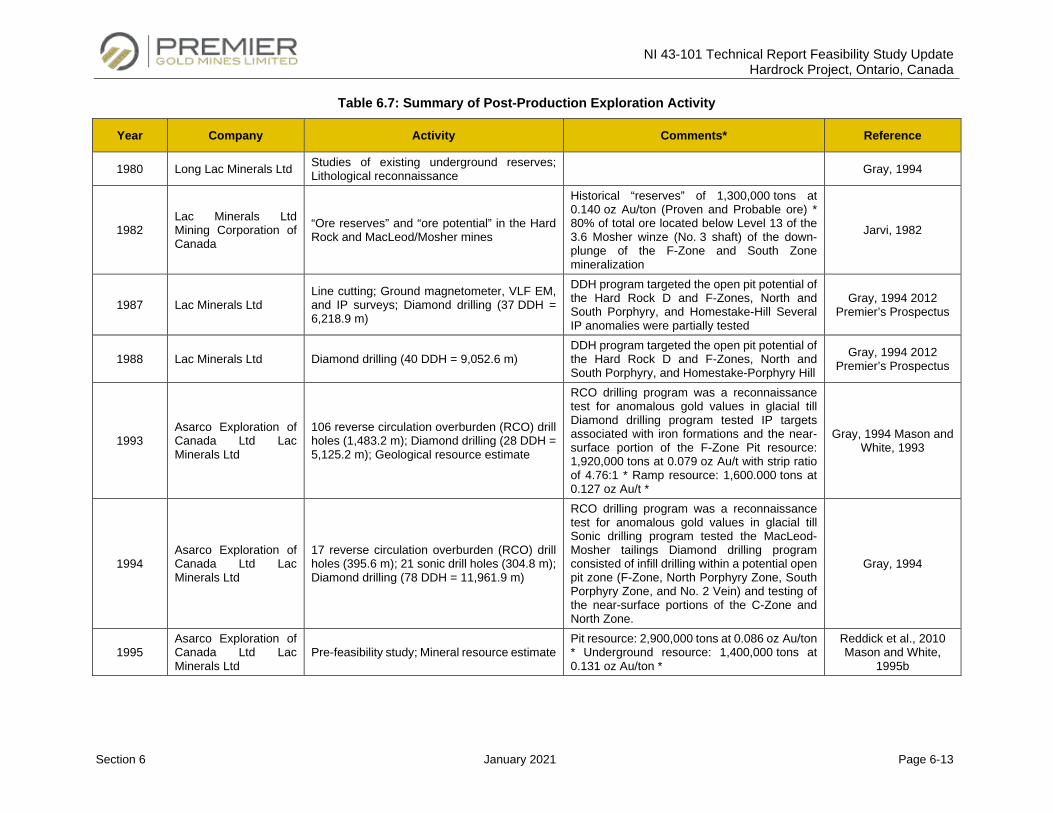
NI 43-101 Technical Report Feasibility Study Update Hardrock Project, Ontario, Canada
Section 6 January 2021 Page 6-13
Table 6.7: Summary of Post-Production Exploration Activity
Year Company Activity Comments* Reference
1980 Long Lac Minerals Ltd Studies of existing underground reserves; Lithological reconnaissance Gray, 1994
1982 Lac Minerals Ltd Mining Corporation of Canada
“Ore reserves” and “ore potential” in the Hard Rock and MacLeod/Mosher mines
Historical “reserves” of 1,300,000 tons at 0.140 oz Au/ton (Proven and Probable ore) * 80% of total ore located below Level 13 of the 3.6 Mosher winze (No. 3 shaft) of the down-plunge of the F-Zone and South Zone mineralization
Jarvi, 1982
1987 Lac Minerals Ltd Line cutting; Ground magnetometer, VLF EM, and IP surveys; Diamond drilling (37 DDH = 6,218.9 m)
DDH program targeted the open pit potential of the Hard Rock D and F-Zones, North and South Porphyry, and Homestake-Hill Several IP anomalies were partially tested
Gray, 1994 2012 Premier’s Prospectus
1988 Lac Minerals Ltd Diamond drilling (40 DDH = 9,052.6 m) DDH program targeted the open pit potential of the Hard Rock D and F-Zones, North and South Porphyry, and Homestake-Porphyry Hill
Gray, 1994 2012 Premier’s Prospectus
1993 Asarco Exploration of Canada Ltd Lac Minerals Ltd
106 reverse circulation overburden (RCO) drill holes (1,483.2 m); Diamond drilling (28 DDH = 5,125.2 m); Geological resource estimate
RCO drilling program was a reconnaissance test for anomalous gold values in glacial till Diamond drilling program tested IP targets associated with iron formations and the near-surface portion of the F-Zone Pit resource: 1,920,000 tons at 0.079 oz Au/t with strip ratio of 4.76:1 * Ramp resource: 1,600.000 tons at 0.127 oz Au/t *
Gray, 1994 Mason and White, 1993
1994 Asarco Exploration of Canada Ltd Lac Minerals Ltd
17 reverse circulation overburden (RCO) drill holes (395.6 m); 21 sonic drill holes (304.8 m); Diamond drilling (78 DDH = 11,961.9 m)
RCO drilling program was a reconnaissance test for anomalous gold values in glacial till Sonic drilling program tested the MacLeod-Mosher tailings Diamond drilling program consisted of infill drilling within a potential open pit zone (F-Zone, North Porphyry Zone, South Porphyry Zone, and No. 2 Vein) and testing of the near-surface portions of the C-Zone and North Zone.
Gray, 1994
1995 Asarco Exploration of Canada Ltd Lac Minerals Ltd
Pre-feasibility study; Mineral resource estimate Pit resource: 2,900,000 tons at 0.086 oz Au/ton * Underground resource: 1,400,000 tons at 0.131 oz Au/ton *
Reddick et al., 2010 Mason and White,
1995b
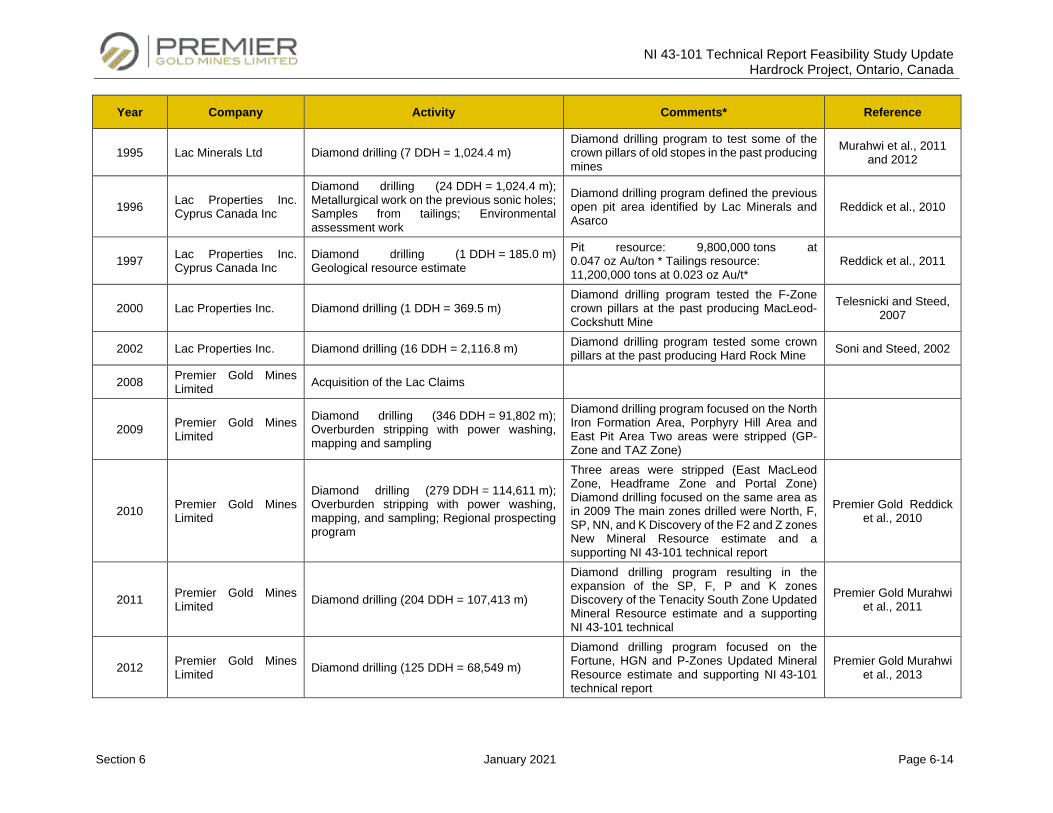
NI 43-101 Technical Report Feasibility Study Update Hardrock Project, Ontario, Canada
Section 6 January 2021 Page 6-14
Year Company Activity Comments* Reference
1995 Lac Minerals Ltd Diamond drilling (7 DDH = 1,024.4 m) Diamond drilling program to test some of the crown pillars of old stopes in the past producing mines
Murahwi et al., 2011 and 2012
1996 Lac Properties Inc. Cyprus Canada Inc
Diamond drilling (24 DDH = 1,024.4 m); Metallurgical work on the previous sonic holes; Samples from tailings; Environmental assessment work
Diamond drilling program defined the previous open pit area identified by Lac Minerals and Asarco
Reddick et al., 2010
1997 Lac Properties Inc. Cyprus Canada Inc
Diamond drilling (1 DDH = 185.0 m) Geological resource estimate
Pit resource: 9,800,000 tons at 0.047 oz Au/ton * Tailings resource: 11,200,000 tons at 0.023 oz Au/t*
Reddick et al., 2011
2000 Lac Properties Inc. Diamond drilling (1 DDH = 369.5 m) Diamond drilling program tested the F-Zone crown pillars at the past producing MacLeod-Cockshutt Mine
Telesnicki and Steed, 2007
2002 Lac Properties Inc. Diamond drilling (16 DDH = 2,116.8 m) Diamond drilling program tested some crown pillars at the past producing Hard Rock Mine Soni and Steed, 2002
2008 Premier Gold Mines Limited Acquisition of the Lac Claims
2009 Premier Gold Mines Limited
Diamond drilling (346 DDH = 91,802 m); Overburden stripping with power washing, mapping and sampling
Diamond drilling program focused on the North Iron Formation Area, Porphyry Hill Area and East Pit Area Two areas were stripped (GP-Zone and TAZ Zone)
2010 Premier Gold Mines Limited
Diamond drilling (279 DDH = 114,611 m); Overburden stripping with power washing, mapping, and sampling; Regional prospecting program
Three areas were stripped (East MacLeod Zone, Headframe Zone and Portal Zone) Diamond drilling focused on the same area as in 2009 The main zones drilled were North, F, SP, NN, and K Discovery of the F2 and Z zones New Mineral Resource estimate and a supporting NI 43-101 technical report
Premier Gold Reddick et al., 2010
2011 Premier Gold Mines Limited Diamond drilling (204 DDH = 107,413 m)
Diamond drilling program resulting in the expansion of the SP, F, P and K zones Discovery of the Tenacity South Zone Updated Mineral Resource estimate and a supporting NI 43-101 technical
Premier Gold Murahwi et al., 2011
2012 Premier Gold Mines Limited Diamond drilling (125 DDH = 68,549 m)
Diamond drilling program focused on the Fortune, HGN and P-Zones Updated Mineral Resource estimate and supporting NI 43-101 technical report
Premier Gold Murahwi et al., 2013
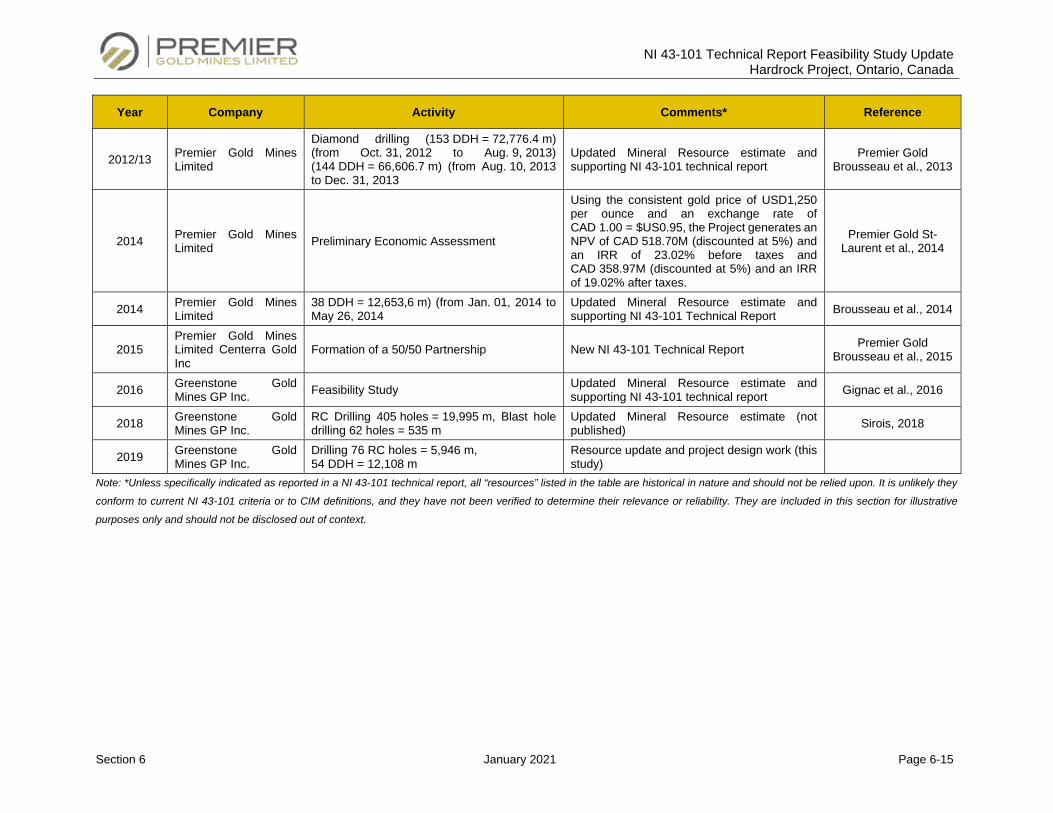
NI 43-101 Technical Report Feasibility Study Update Hardrock Project, Ontario, Canada
Section 6 January 2021 Page 6-15
Year Company Activity Comments* Reference
2012/13 Premier Gold Mines Limited
Diamond drilling (153 DDH = 72,776.4 m) (from Oct. 31, 2012 to Aug. 9, 2013) (144 DDH = 66,606.7 m) (from Aug. 10, 2013 to Dec. 31, 2013
Updated Mineral Resource estimate and supporting NI 43-101 technical report
Premier Gold Brousseau et al., 2013
2014 Premier Gold Mines Limited Preliminary Economic Assessment
Using the consistent gold price of USD1,250 per ounce and an exchange rate of CAD 1.00 = $US0.95, the Project generates an NPV of CAD 518.70M (discounted at 5%) and an IRR of 23.02% before taxes and CAD 358.97M (discounted at 5%) and an IRR of 19.02% after taxes.
Premier Gold St-Laurent et al., 2014
2014 Premier Gold Mines Limited
38 DDH = 12,653,6 m) (from Jan. 01, 2014 to May 26, 2014
Updated Mineral Resource estimate and supporting NI 43-101 Technical Report Brousseau et al., 2014
2015 Premier Gold Mines Limited Centerra Gold Inc
Formation of a 50/50 Partnership New NI 43-101 Technical Report Premier Gold Brousseau et al., 2015
2016 Greenstone Gold Mines GP Inc. Feasibility Study Updated Mineral Resource estimate and
supporting NI 43-101 technical report Gignac et al., 2016
2018 Greenstone Gold Mines GP Inc.
RC Drilling 405 holes = 19,995 m, Blast hole drilling 62 holes = 535 m
Updated Mineral Resource estimate (not published) Sirois, 2018
2019 Greenstone Gold Mines GP Inc.
Drilling 76 RC holes = 5,946 m, 54 DDH = 12,108 m
Resource update and project design work (this study)
Note: *Unless specifically indicated as reported in a NI 43-101 technical report, all “resources” listed in the table are historical in nature and should not be relied upon. It is unlikely they
conform to current NI 43-101 criteria or to CIM definitions, and they have not been verified to determine their relevance or reliability. They are included in this section for illustrative
purposes only and should not be disclosed out of context.
NI 43-101 Technical Report Feasibility Study Update Hardrock Project, Ontario, Canada
Section 6 January 2021 Page 6-16
6.2 Brookbank
6.2.1 Exploration History
The following summary of exploration activities on the Brookbank Project is derived from the 2013 Micon
technical report which was mostly based on the Scott Wilson RPA (2009, now RPA) NI 43-101 technical
report and is restricted to those leases and claims covering the Brookbank, Cherbourg and Foxear zones.
The earliest known work on the Brookbank Project is a program of surface trenching and limited diamond
drilling carried out in 1934 by Connell Mining and Exploration Co. Ltd. (“Connell Mining”). A total of
17 trenches, plus numerous test pits, exposed a rusty shear zone in mafic flows over a strike length of
396 m. Gold values from samples in this zone were low and erratic, and the results for the diamond drilling
are not known. Work was suspended in late 1935.
In 1944, Noranda Exploration Company Limited (“Noranda”) completed detailed mapping, trenching and
1,860 m of diamond drilling in 40 holes to test the Brookbank Zone. Brookbank-Sturgeon Mines Limited
(“Brookbank-Sturgeon”), a predecessor company to Ontex Resources Limited (“Ontex”), acquired the
claims covering the current property in 1950; however, there is no record of the work performed (if any) by
Brookbank-Sturgeon.
Between 1974 and 1975, Lynx Canada Explorations Limited (“Lynx”) completed geological mapping,
ground magnetic surveys and diamond drilling over a portion of the property. In 1974, Lynx carried out
surface mapping and a magnetometer survey on the eastward extension of the Noranda showing. In the
following year, Lynx completed six diamond drill (“DD”) holes totaling 376 m to test a thin siliceous band
along the metavolcanic-metasedimentary contact.
In 1981, Metalore optioned the property from Brookbank-Sturgeon and completed line-cutting followed by
an electromagnetic (“EM”) survey over the entire grid and a very low frequency electromagnetic (“VLF-EM”)
survey over selected portions of the property. Metalore subsequently drilled 30 DD holes totaling 3,567 m.
Between late 1982 and early 1983, Metalore drilled three widely spaced DD holes totaling 330 m to test the
metavolcanic-metasedimentary contact on the Brookbank West Property and one 453 m DD hole on the
Foxear Property.
From September 1983 to March 1984, Metalore completed an additional 62 DD holes totaling 6,946 m,
including four wedges. In July 1984, Metalore commissioned a combined helicopter-borne magnetometer,
NI 43-101 Technical Report Feasibility Study Update Hardrock Project, Ontario, Canada
Section 6 January 2021 Page 6-17
gamma ray spectrometer, and VLF survey over its holdings in Sandra, Irwin and Walters townships,
including the Brookbank Project.
From 1984 to 1985, Metalore drilled 23 DD holes, including 14 wedges, on the Brookbank Zone totaling
4,421 m, six DD holes on the Cherbourg Zone totaling 6,684 m, and 26 DD holes on the Foxear Zone
totaling 2,202 m.
In 1986, Metalore concentrated on the Cherbourg Zone and completed 43 drill DD holes for a total of
4,368 m. On October 1, 1986, Metalore entered into an exploration and development agreement with
Hudson Bay Mining and Smelting Co., Ltd. (“Hudson Bay”).
In 1987, Hudson Bay drilled 44 DD holes for a total of 11,203 m on the Brookbank Zone and 10 DD holes
for a total of 2,777 m on the Foxear Zone. Mineralogical studies and preliminary metallurgical testing were
completed on one mineralized sample and approximately 70 drill collars were located and surveyed.
Metalore’s agreement with Hudson Bay was terminated in 1988 because of an ownership dispute between
Metalore and Ontex. In October 1998, Ontex acquired a release of Metalore’s right to earn an interest in
the Brookbank leases, subject to a 1% Net Smelter Royalty (“NSR”) due to Metalore upon production.
In July 1989, Placer Dome Inc. (“Placer”) and Metalore signed an option agreement to which Ontex was
not a party. From early August to late November of that year, Placer completed a program consisting of
power stripping/trenching, detailed geological mapping, channel sampling and diamond drilling. Placer
exposed an area of about 650 m x 15 m and took 215 channel samples totaling 244 linear meters. Detailed
mapping was completed at an Imperial scale of one inch to ten feet. During 1989, drilling at the Brookbank
zone consisted of 18 DD holes totaling 7,010 m to test the lateral and down-dip extensions to a vertical
depth of 670 m. A Sperry Sun gyro-log system was used to confirm downhole deviations for 13 of the
DD holes drilled in 1989 and 15 of the pre-existing holes. Additional Placer drilling at Cherbourg consisted
of five DD holes totaling 1,437 m with a further two DD holes totaling 984 m drilled at Foxear. Placer
dropped its option due to ongoing litigation between Ontex and Metalore.
From 1990 through to 1996, the Brookbank Project was the subject of Superior Court of Ontario litigation
between Ontex and Metalore [Ontex Resources Ltd. v. Metalore Resources Ltd. (1990), 75 O.R. (2d) 513
(Gen. Div.), with an appeal allowed in part (1993) 13 O.R. (3d) 229, 103 D.L.R. (4th) 158, 12 B.L.R. (2d)
226 C.A.)]. Costs were subsequently awarded to Ontex [(1996), 45 C.P.C. (3d) 237 (Ont. Assmt. Officer)].
Between 1993 and 1994, Metalore completed four DD holes totaling 533 m on the Brookbank Zone,
fifteen DD holes totaling 2,107 m at Cherbourg and seven DD holes (including one wedge) totaling 3,323 m
NI 43-101 Technical Report Feasibility Study Update Hardrock Project, Ontario, Canada
Section 6 January 2021 Page 6-18
at Foxear. In 1994, reviews of the data by both Micon and J.R. Trussler & Associates, on behalf of Metalore,
were positive and additional work was recommended by both companies. However, the ongoing litigation
between Ontex and Metalore precluded work being done.
In October 1998, Ontex and Metalore announced a settlement whereby Ontex acquired a release of
Metalore’s right to earn an interest in the Brookbank leases and Ontex took over as the operator of the
Brookbank Deposit and all of the Metalore property in the area.
From 1999 until 2009, all exploration on the property was conducted by Ontex. The most significant of all
of Ontex’s exploration programs was achieved in September 1999 when Geoterrex-Dighem Ltd. completed
a combined helicopter borne magnetic, VLF-EM and radiometric survey along 1,807 line kilometers over
the entire property in a north-south direction. The airborne program included the collection and delivery of
total field and calculated vertical gradient magnetics, VLF-EM, resistivity and radiometrics K/Th/U ratio. The
results are summarized in Figure 6.2.
The airborne survey results are reflective of geology and favorable structure and alteration but are not a
direct guide to mineralization. The Brookbank Deposit geophysical signature is very subtle and is too
subdued to be a reliable guide to the direct location of further mineralization along the favorable structural
break between known gold zones. The geophysical signature, however, can be used to locate alteration on
structural breaks that might contain mineralization.
The geophysical targets shown in Figure 6.2 have been used to guide the test-drilling and evaluation
programs that have been completed on the Brookbank Deposit to date. Almost all of the completed drilling
is in the central part of the claim area. Other targets to the east and west of the Brookbank-Cherbourg-
Foxear zone remain to be investigated in greater detail.
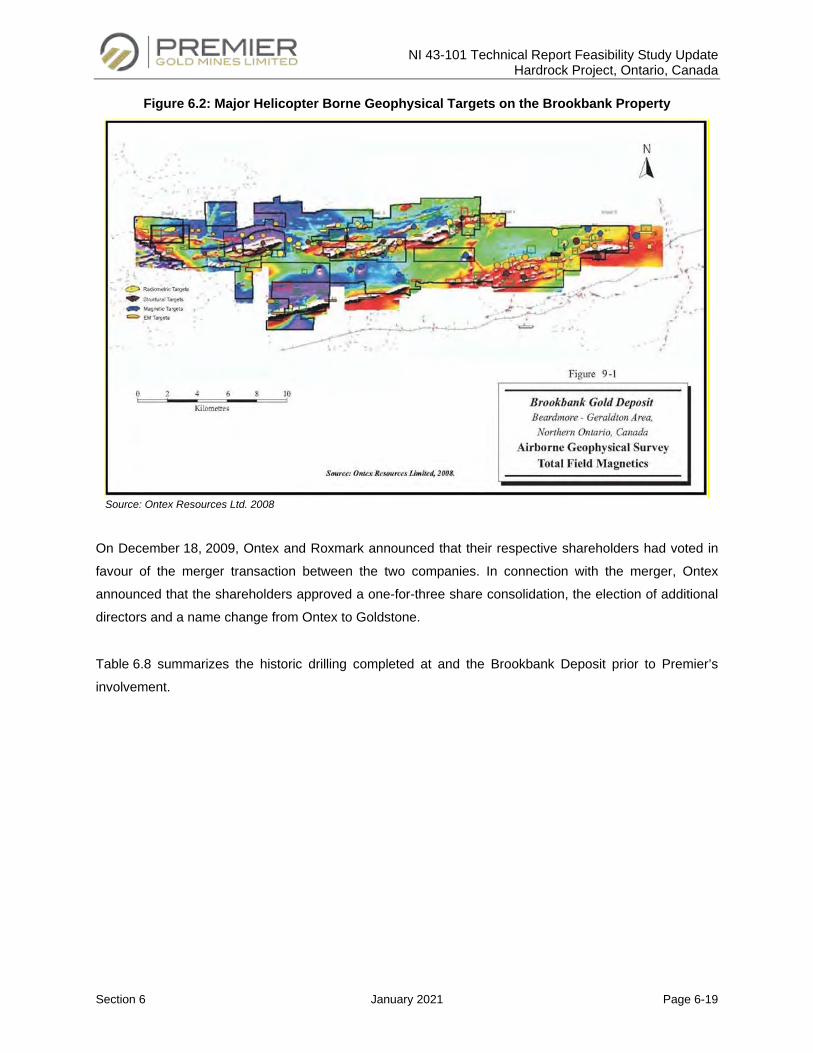
NI 43-101 Technical Report Feasibility Study Update Hardrock Project, Ontario, Canada
Section 6 January 2021 Page 6-19
Figure 6.2: Major Helicopter Borne Geophysical Targets on the Brookbank Property
Source: Ontex Resources Ltd. 2008
On December 18, 2009, Ontex and Roxmark announced that their respective shareholders had voted in
favour of the merger transaction between the two companies. In connection with the merger, Ontex
announced that the shareholders approved a one-for-three share consolidation, the election of additional
directors and a name change from Ontex to Goldstone.
Table 6.8 summarizes the historic drilling completed at and the Brookbank Deposit prior to Premier’s
involvement.
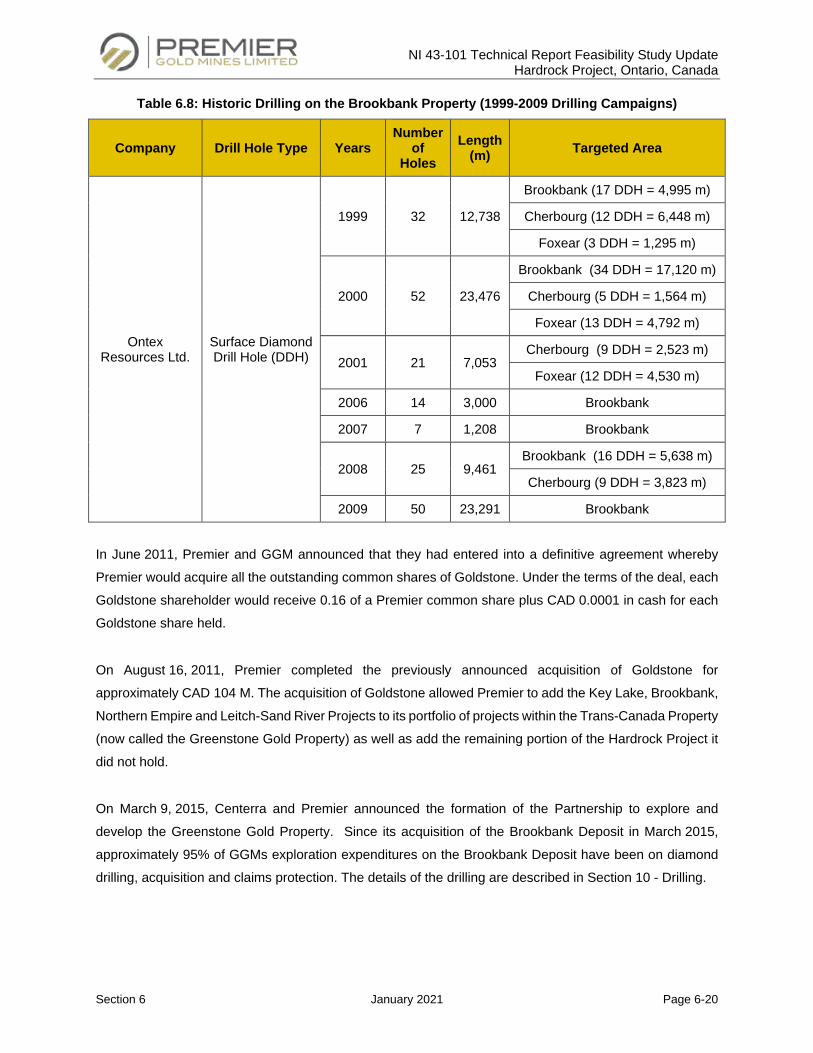
NI 43-101 Technical Report Feasibility Study Update Hardrock Project, Ontario, Canada
Section 6 January 2021 Page 6-20
Table 6.8: Historic Drilling on the Brookbank Property (1999-2009 Drilling Campaigns)
Company Drill Hole Type Years Number
of Holes
Length (m) Targeted Area
Ontex Resources Ltd.
Surface Diamond Drill Hole (DDH)
1999 32 12,738
Brookbank (17 DDH = 4,995 m)
Cherbourg (12 DDH = 6,448 m)
Foxear (3 DDH = 1,295 m)
2000 52 23,476
Brookbank (34 DDH = 17,120 m)
Cherbourg (5 DDH = 1,564 m)
Foxear (13 DDH = 4,792 m)
2001 21 7,053 Cherbourg (9 DDH = 2,523 m)
Foxear (12 DDH = 4,530 m)
2006 14 3,000 Brookbank
2007 7 1,208 Brookbank
2008 25 9,461 Brookbank (16 DDH = 5,638 m)
Cherbourg (9 DDH = 3,823 m)
2009 50 23,291 Brookbank
In June 2011, Premier and GGM announced that they had entered into a definitive agreement whereby
Premier would acquire all the outstanding common shares of Goldstone. Under the terms of the deal, each
Goldstone shareholder would receive 0.16 of a Premier common share plus CAD 0.0001 in cash for each
Goldstone share held.
On August 16, 2011, Premier completed the previously announced acquisition of Goldstone for
approximately CAD 104 M. The acquisition of Goldstone allowed Premier to add the Key Lake, Brookbank,
Northern Empire and Leitch-Sand River Projects to its portfolio of projects within the Trans-Canada Property
(now called the Greenstone Gold Property) as well as add the remaining portion of the Hardrock Project it
did not hold.
On March 9, 2015, Centerra and Premier announced the formation of the Partnership to explore and
develop the Greenstone Gold Property. Since its acquisition of the Brookbank Deposit in March 2015,
approximately 95% of GGMs exploration expenditures on the Brookbank Deposit have been on diamond
drilling, acquisition and claims protection. The details of the drilling are described in Section 10 - Drilling.
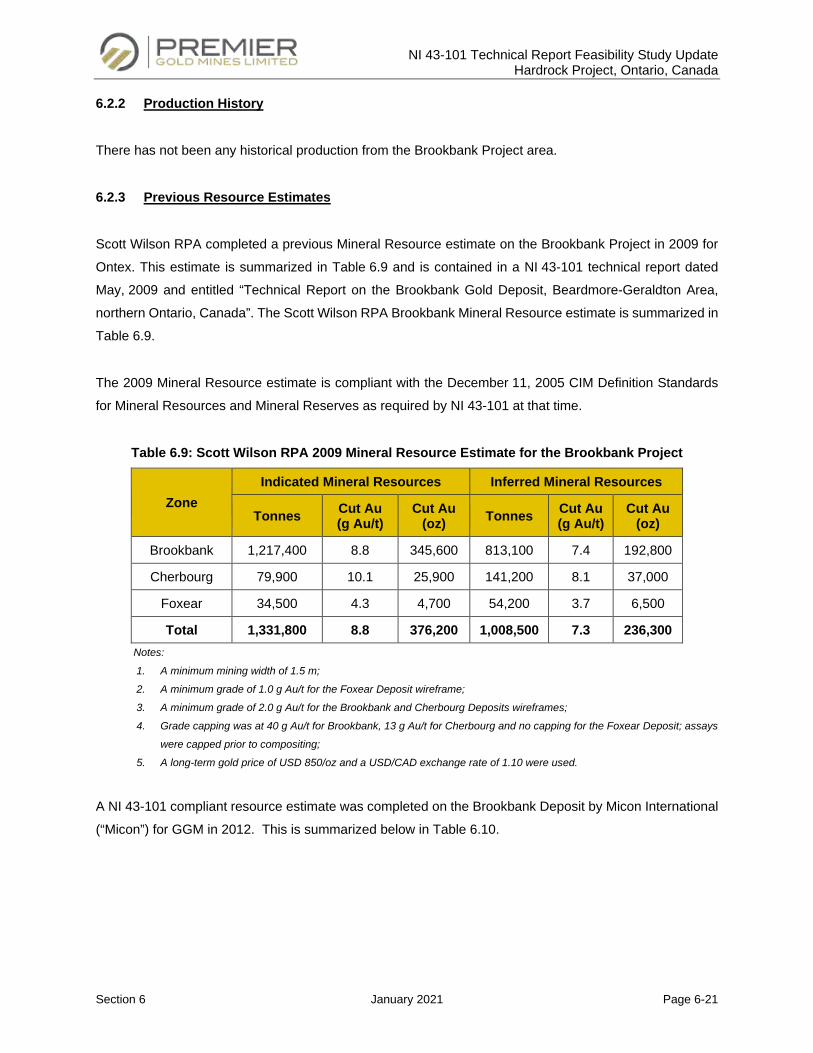
NI 43-101 Technical Report Feasibility Study Update Hardrock Project, Ontario, Canada
Section 6 January 2021 Page 6-21
6.2.2 Production History
There has not been any historical production from the Brookbank Project area.
6.2.3 Previous Resource Estimates
Scott Wilson RPA completed a previous Mineral Resource estimate on the Brookbank Project in 2009 for
Ontex. This estimate is summarized in Table 6.9 and is contained in a NI 43-101 technical report dated
May, 2009 and entitled “Technical Report on the Brookbank Gold Deposit, Beardmore-Geraldton Area,
northern Ontario, Canada”. The Scott Wilson RPA Brookbank Mineral Resource estimate is summarized in
Table 6.9.
The 2009 Mineral Resource estimate is compliant with the December 11, 2005 CIM Definition Standards
for Mineral Resources and Mineral Reserves as required by NI 43-101 at that time.
Table 6.9: Scott Wilson RPA 2009 Mineral Resource Estimate for the Brookbank Project
Zone Indicated Mineral Resources Inferred Mineral Resources
Tonnes Cut Au (g Au/t)
Cut Au (oz) Tonnes Cut Au
(g Au/t) Cut Au
(oz)
Brookbank 1,217,400 8.8 345,600 813,100 7.4 192,800
Cherbourg 79,900 10.1 25,900 141,200 8.1 37,000
Foxear 34,500 4.3 4,700 54,200 3.7 6,500
Total 1,331,800 8.8 376,200 1,008,500 7.3 236,300 Notes:
1. A minimum mining width of 1.5 m;
2. A minimum grade of 1.0 g Au/t for the Foxear Deposit wireframe;
3. A minimum grade of 2.0 g Au/t for the Brookbank and Cherbourg Deposits wireframes;
4. Grade capping was at 40 g Au/t for Brookbank, 13 g Au/t for Cherbourg and no capping for the Foxear Deposit; assays
were capped prior to compositing;
5. A long-term gold price of USD 850/oz and a USD/CAD exchange rate of 1.10 were used.
A NI 43-101 compliant resource estimate was completed on the Brookbank Deposit by Micon International
(“Micon”) for GGM in 2012. This is summarized below in Table 6.10.
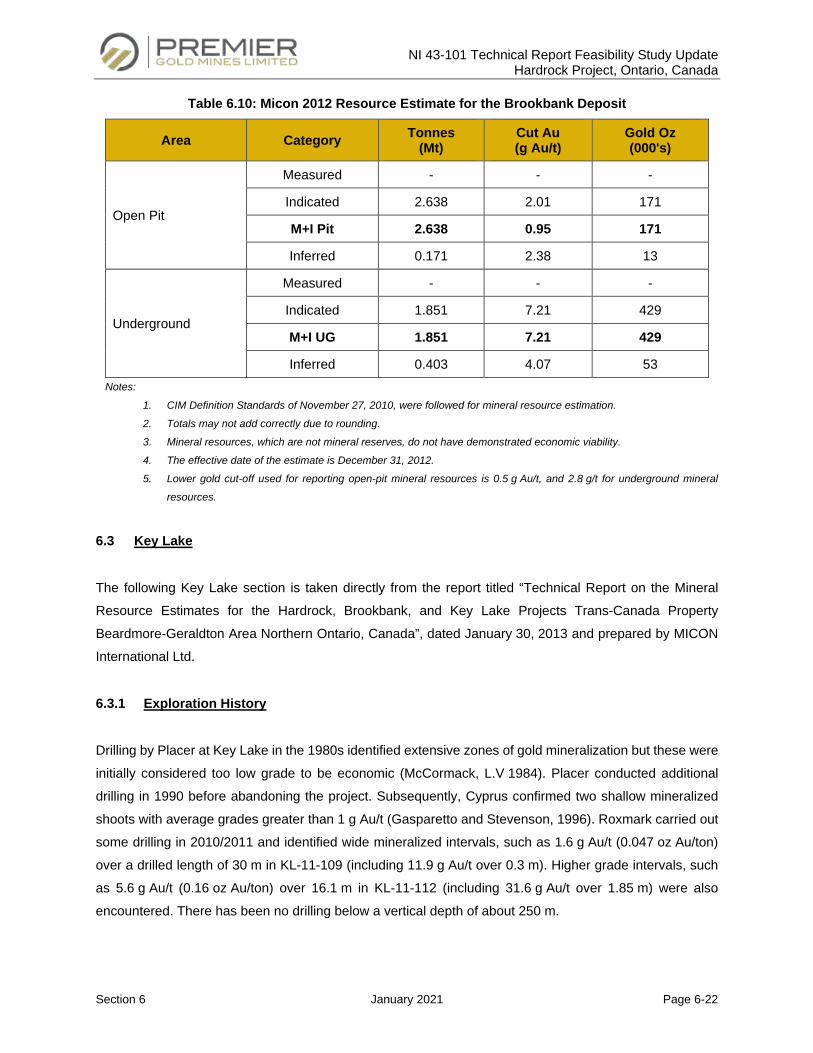
NI 43-101 Technical Report Feasibility Study Update Hardrock Project, Ontario, Canada
Section 6 January 2021 Page 6-22
Table 6.10: Micon 2012 Resource Estimate for the Brookbank Deposit
Area Category Tonnes (Mt)
Cut Au (g Au/t)
Gold Oz (000's)
Open Pit
Measured - - -
Indicated 2.638 2.01 171
M+I Pit 2.638 0.95 171
Inferred 0.171 2.38 13
Underground
Measured - - -
Indicated 1.851 7.21 429
M+I UG 1.851 7.21 429
Inferred 0.403 4.07 53 Notes:
1. CIM Definition Standards of November 27, 2010, were followed for mineral resource estimation.
2. Totals may not add correctly due to rounding.
3. Mineral resources, which are not mineral reserves, do not have demonstrated economic viability.
4. The effective date of the estimate is December 31, 2012.
5. Lower gold cut-off used for reporting open-pit mineral resources is 0.5 g Au/t, and 2.8 g/t for underground mineral
resources.
6.3 Key Lake
The following Key Lake section is taken directly from the report titled “Technical Report on the Mineral
Resource Estimates for the Hardrock, Brookbank, and Key Lake Projects Trans-Canada Property
Beardmore-Geraldton Area Northern Ontario, Canada”, dated January 30, 2013 and prepared by MICON
International Ltd.
6.3.1 Exploration History
Drilling by Placer at Key Lake in the 1980s identified extensive zones of gold mineralization but these were
initially considered too low grade to be economic (McCormack, L.V 1984). Placer conducted additional
drilling in 1990 before abandoning the project. Subsequently, Cyprus confirmed two shallow mineralized
shoots with average grades greater than 1 g Au/t (Gasparetto and Stevenson, 1996). Roxmark carried out
some drilling in 2010/2011 and identified wide mineralized intervals, such as 1.6 g Au/t (0.047 oz Au/ton)
over a drilled length of 30 m in KL-11-109 (including 11.9 g Au/t over 0.3 m). Higher grade intervals, such
as 5.6 g Au/t (0.16 oz Au/ton) over 16.1 m in KL-11-112 (including 31.6 g Au/t over 1.85 m) were also
encountered. There has been no drilling below a vertical depth of about 250 m.
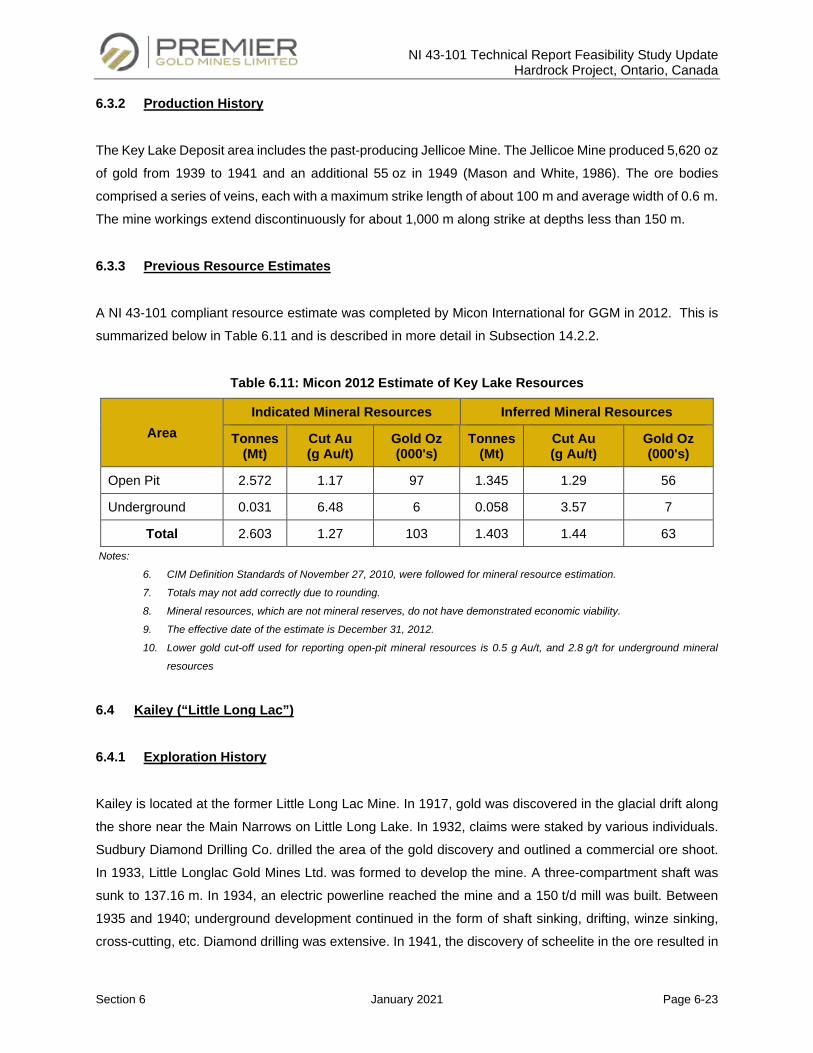
NI 43-101 Technical Report Feasibility Study Update Hardrock Project, Ontario, Canada
Section 6 January 2021 Page 6-23
6.3.2 Production History
The Key Lake Deposit area includes the past-producing Jellicoe Mine. The Jellicoe Mine produced 5,620 oz
of gold from 1939 to 1941 and an additional 55 oz in 1949 (Mason and White, 1986). The ore bodies
comprised a series of veins, each with a maximum strike length of about 100 m and average width of 0.6 m.
The mine workings extend discontinuously for about 1,000 m along strike at depths less than 150 m.
6.3.3 Previous Resource Estimates
A NI 43-101 compliant resource estimate was completed by Micon International for GGM in 2012. This is
summarized below in Table 6.11 and is described in more detail in Subsection 14.2.2.
Table 6.11: Micon 2012 Estimate of Key Lake Resources
Area Indicated Mineral Resources Inferred Mineral Resources
Tonnes (Mt)
Cut Au (g Au/t)
Gold Oz (000's)
Tonnes (Mt)
Cut Au (g Au/t)
Gold Oz (000's)
Open Pit 2.572 1.17 97 1.345 1.29 56
Underground 0.031 6.48 6 0.058 3.57 7
Total 2.603 1.27 103 1.403 1.44 63 Notes:
6. CIM Definition Standards of November 27, 2010, were followed for mineral resource estimation.
7. Totals may not add correctly due to rounding.
8. Mineral resources, which are not mineral reserves, do not have demonstrated economic viability.
9. The effective date of the estimate is December 31, 2012.
10. Lower gold cut-off used for reporting open-pit mineral resources is 0.5 g Au/t, and 2.8 g/t for underground mineral
resources
6.4 Kailey (“Little Long Lac”)
6.4.1 Exploration History
Kailey is located at the former Little Long Lac Mine. In 1917, gold was discovered in the glacial drift along
the shore near the Main Narrows on Little Long Lake. In 1932, claims were staked by various individuals.
Sudbury Diamond Drilling Co. drilled the area of the gold discovery and outlined a commercial ore shoot.
In 1933, Little Longlac Gold Mines Ltd. was formed to develop the mine. A three-compartment shaft was
sunk to 137.16 m. In 1934, an electric powerline reached the mine and a 150 t/d mill was built. Between
1935 and 1940; underground development continued in the form of shaft sinking, drifting, winze sinking,
cross-cutting, etc. Diamond drilling was extensive. In 1941, the discovery of scheelite in the ore resulted in
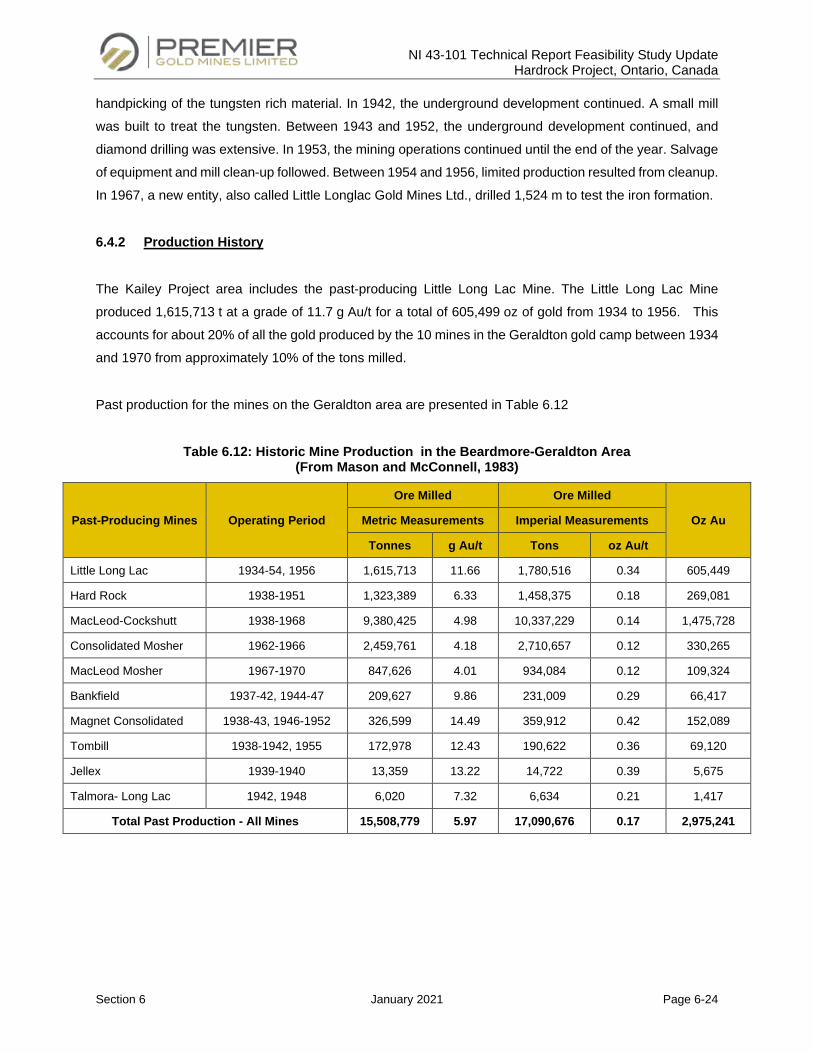
NI 43-101 Technical Report Feasibility Study Update Hardrock Project, Ontario, Canada
Section 6 January 2021 Page 6-24
handpicking of the tungsten rich material. In 1942, the underground development continued. A small mill
was built to treat the tungsten. Between 1943 and 1952, the underground development continued, and
diamond drilling was extensive. In 1953, the mining operations continued until the end of the year. Salvage
of equipment and mill clean-up followed. Between 1954 and 1956, limited production resulted from cleanup.
In 1967, a new entity, also called Little Longlac Gold Mines Ltd., drilled 1,524 m to test the iron formation.
6.4.2 Production History
The Kailey Project area includes the past-producing Little Long Lac Mine. The Little Long Lac Mine
produced 1,615,713 t at a grade of 11.7 g Au/t for a total of 605,499 oz of gold from 1934 to 1956. This
accounts for about 20% of all the gold produced by the 10 mines in the Geraldton gold camp between 1934
and 1970 from approximately 10% of the tons milled.
Past production for the mines on the Geraldton area are presented in Table 6.12
Table 6.12: Historic Mine Production in the Beardmore-Geraldton Area (From Mason and McConnell, 1983)
Past-Producing Mines Operating Period
Ore Milled Ore Milled
Oz Au Metric Measurements Imperial Measurements
Tonnes g Au/t Tons oz Au/t
Little Long Lac 1934-54, 1956 1,615,713 11.66 1,780,516 0.34 605,449
Hard Rock 1938-1951 1,323,389 6.33 1,458,375 0.18 269,081
MacLeod-Cockshutt 1938-1968 9,380,425 4.98 10,337,229 0.14 1,475,728
Consolidated Mosher 1962-1966 2,459,761 4.18 2,710,657 0.12 330,265
MacLeod Mosher 1967-1970 847,626 4.01 934,084 0.12 109,324
Bankfield 1937-42, 1944-47 209,627 9.86 231,009 0.29 66,417
Magnet Consolidated 1938-43, 1946-1952 326,599 14.49 359,912 0.42 152,089
Tombill 1938-1942, 1955 172,978 12.43 190,622 0.36 69,120
Jellex 1939-1940 13,359 13.22 14,722 0.39 5,675
Talmora- Long Lac 1942, 1948 6,020 7.32 6,634 0.21 1,417
Total Past Production - All Mines 15,508,779 5.97 17,090,676 0.17 2,975,241
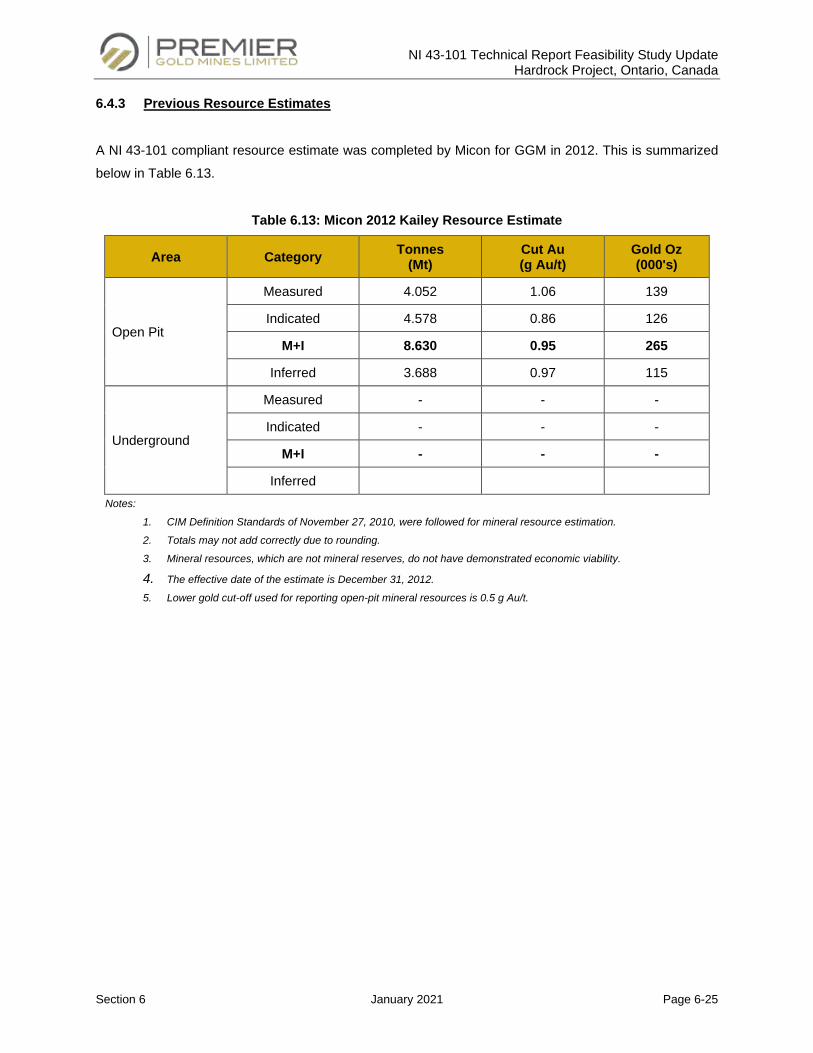
NI 43-101 Technical Report Feasibility Study Update Hardrock Project, Ontario, Canada
Section 6 January 2021 Page 6-25
6.4.3 Previous Resource Estimates
A NI 43-101 compliant resource estimate was completed by Micon for GGM in 2012. This is summarized
below in Table 6.13.
Table 6.13: Micon 2012 Kailey Resource Estimate
Area Category Tonnes (Mt)
Cut Au (g Au/t)
Gold Oz (000's)
Open Pit
Measured 4.052 1.06 139
Indicated 4.578 0.86 126
M+I 8.630 0.95 265
Inferred 3.688 0.97 115
Underground
Measured - - -
Indicated - - -
M+I - - -
Inferred Notes:
1. CIM Definition Standards of November 27, 2010, were followed for mineral resource estimation.
2. Totals may not add correctly due to rounding.
3. Mineral resources, which are not mineral reserves, do not have demonstrated economic viability.
4. The effective date of the estimate is December 31, 2012. 5. Lower gold cut-off used for reporting open-pit mineral resources is 0.5 g Au/t.
NI 43-101 Technical Report Feasibility Study Update Hardrock Project, Ontario, Canada
Section 7 January 2021 Page 7-1
GEOLOGICAL HISTORY AND MINERALIZATION
7.1 Hardrock Regional Geological Setting
The Hardrock Project lies within the granite-greenstone Wabigoon Subprovince of the Archean Superior
craton, in eastern Canada (Figure 7.1). The Wabigoon Subprovince, averaging 100 km wide, is exposed
for some 900 km eastward from Manitoba and Minnesota, beneath the Mesoproterozoic cover of the
Nipigon Embayment, to the Phanerozoic cover of the James Bay Lowlands (Card and Poulsen, 1998). The
Wabigoon Subprovince is bounded on the south by the metasedimentary Quetico Subprovince, on the
northwest by the plutonic Winnipeg River Subprovince, and on the northeast by the metasedimentary
English River Subprovince. The Wabigoon-Quetico Subprovince boundary is a structurally complex, largely
faulted interface.
The Wabigoon Subprovince can be subdivided into western greenstone-rich domains in the Lake of the
Woods-Savant Lake and Rainy Lake Areas, a central dominantly plutonic domain, and an eastern
greenstone-rich domain in the Beardmore-Geraldton Area (Blackburn et al., 1991). Deformation and
syn- to post-tectonic plutonism occurred between 2711 to 2685 Ma. Based on limited geochronological
data, the diverse arc-type volcanic sequences in the eastern Wabigoon Subprovince are thought to be
mainly Neoarchean, some as old as 2769 Ma (Anglin et al., 1988).
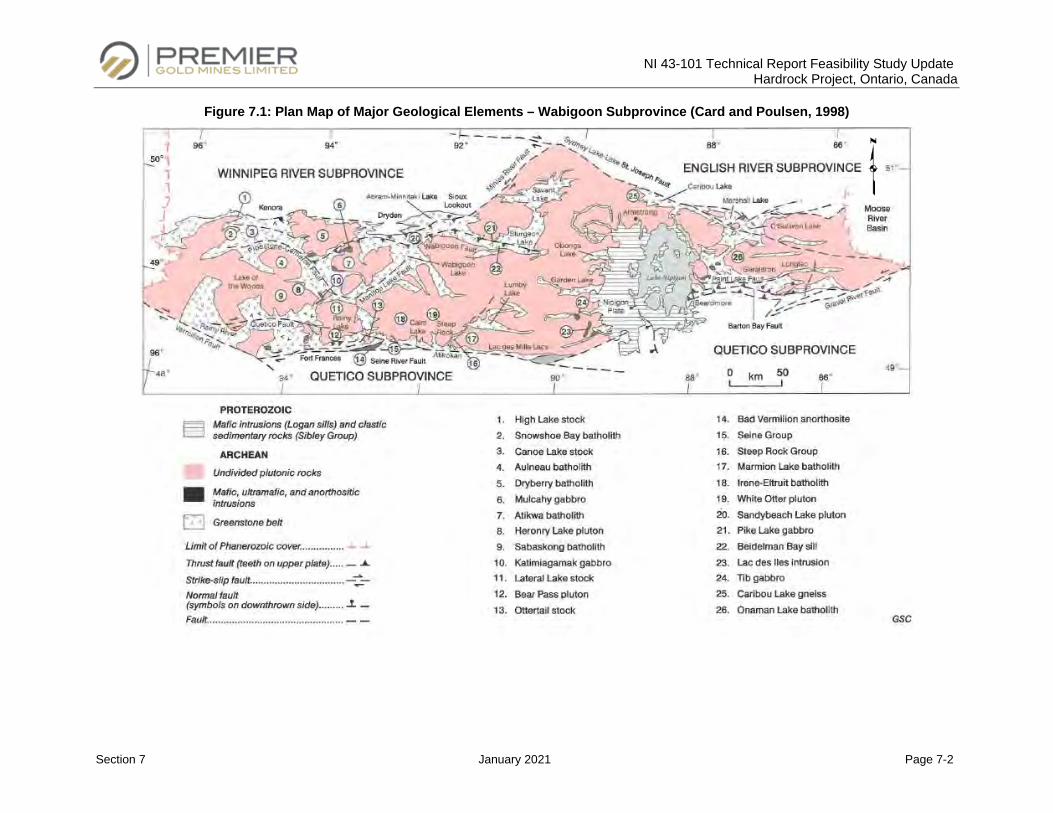
NI 43-101 Technical Report Feasibility Study Update Hardrock Project, Ontario, Canada
Section 7 January 2021 Page 7-2
Figure 7.1: Plan Map of Major Geological Elements – Wabigoon Subprovince (Card and Poulsen, 1998)
NI 43-101 Technical Report Feasibility Study Update Hardrock Project, Ontario, Canada
Section 7 January 2021 Page 7-3
A map showing the regional geology of the Beardmore-Geraldton area is shown in Figure 7.2. The following
has been taken from the Hardrock Property 2010 NI 43-101 Report completed by Reddick Consulting Inc.
(T. Armstrong, M. Srivastava, and J. Reddick, 2010);
The Hardrock Property is located within the Beardmore-Geraldton Greenstone belt that contains several
narrow, east-west striking sequences of volcanic and sedimentary rocks of Archean age. The southern
edges of these sequences are spatially related to the through-going, major structural discontinuities thought
to be thrust faults that have imbricated the sedimentary sequences. A comprehensive description of the
regional geology can be found in Smyk et al., 2005. In the Geraldton area, most of the gold mines and a
number of gold showings occur within or in proximity to the Bankfield-Tombill Deformation Zone (also known
as the Barton Bay Deformation Zone), a zone of folding and shearing up to 1 km wide. The southern limit
of the Tombill-Bankfield Deformation Zone is marked by the Tombill-Bankfield Fault, a zone of intense
shearing up to 12 m wide.
In the immediate Geraldton area, the dominant rock types are clastic sediments (greywacke and arenite),
oxide facies iron formations (“BIF”) and minor mafic metavolcanics. There are a number of younger
intrusives, including an albite-rich porphyry unit (Hard Rock Porphyry) that is spatially associated with much
of the gold mineralization on the Hard Rock, MacLeod-Cockshutt and Mosher Mines. Significant gold
mineralization is also often spatially associated with BIF. In the case of the Little Long Lac Mine, gold
mineralization is primarily hosted by an arkosic unit.
In addition to the belt scale and local faulting, there has been locally intense ductile deformation of the rocks
in the Geraldton area which is manifested as tight to almost isoclinal, generally upright, polyharmonic folding
of major lithologic units, penetrative deformation, folding and boundinage of veins, lithographic units and
local transposition of primary contacts. The degree of deformation is apparent in deformed rocks that are
dependent on both primary lithology and proximity to the Bankfield-Tombill Fault.
Gold mineralization in the Hard Rock, MacLeod-Cockshutt, Mosher Mines and the Little Long Lac Mine
generally occurs in association with subvertical structures associated with quartz veins or stringers, minor
to semi-massive sulphides (associated with replacement zones in BIF), weak to moderate carbonate and
weak to strong sericite alteration. The ore zones rake shallowly towards the west in the vicinity of the Hard
Rock, MacLeod-Cockshutt and Mosher Mines (15-30° W) and slightly more steeply towards the west at the
Little Long Lac Mines (50-60° W), indicative of a strong structural control that post-dates the tight folding of
the primary lithological units.
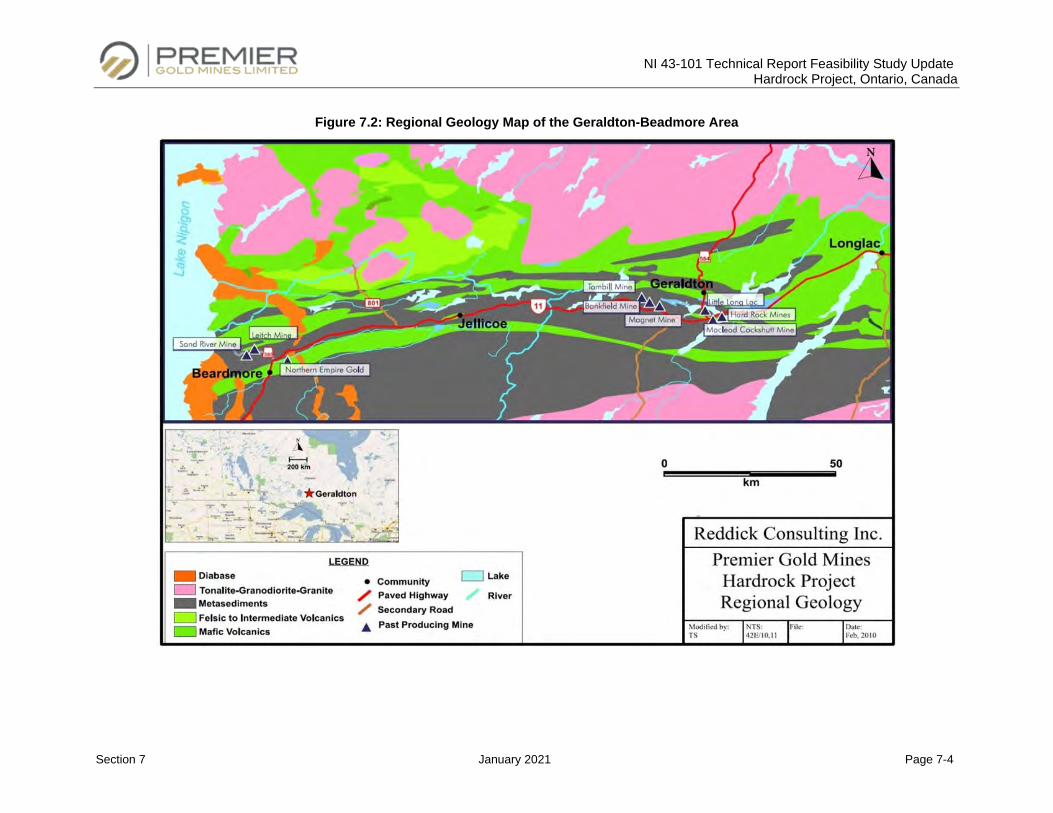
NI 43-101 Technical Report Feasibility Study Update Hardrock Project, Ontario, Canada
Section 7 January 2021 Page 7-4
Figure 7.2: Regional Geology Map of the Geraldton-Beadmore Area
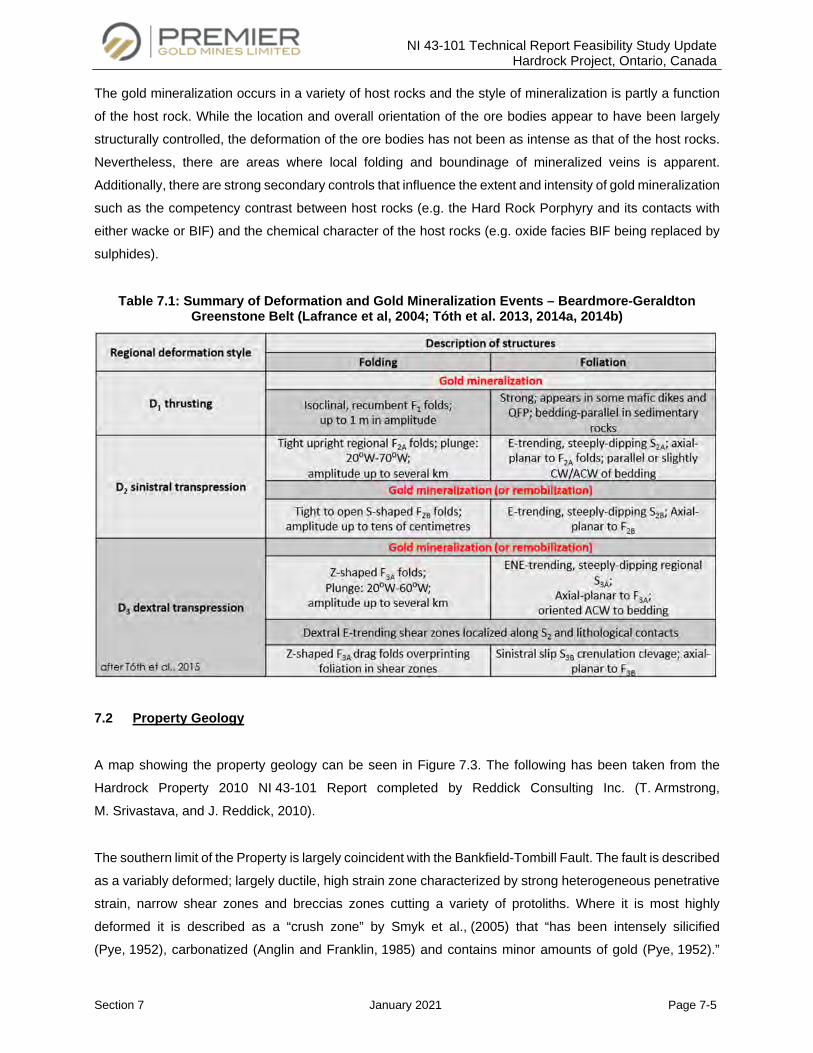
NI 43-101 Technical Report Feasibility Study Update Hardrock Project, Ontario, Canada
Section 7 January 2021 Page 7-5
The gold mineralization occurs in a variety of host rocks and the style of mineralization is partly a function
of the host rock. While the location and overall orientation of the ore bodies appear to have been largely
structurally controlled, the deformation of the ore bodies has not been as intense as that of the host rocks.
Nevertheless, there are areas where local folding and boundinage of mineralized veins is apparent.
Additionally, there are strong secondary controls that influence the extent and intensity of gold mineralization
such as the competency contrast between host rocks (e.g. the Hard Rock Porphyry and its contacts with
either wacke or BIF) and the chemical character of the host rocks (e.g. oxide facies BIF being replaced by
sulphides).
Table 7.1: Summary of Deformation and Gold Mineralization Events – Beardmore-Geraldton Greenstone Belt (Lafrance et al, 2004; Tóth et al. 2013, 2014a, 2014b)
7.2 Property Geology
A map showing the property geology can be seen in Figure 7.3. The following has been taken from the
Hardrock Property 2010 NI 43-101 Report completed by Reddick Consulting Inc. (T. Armstrong,
M. Srivastava, and J. Reddick, 2010).
The southern limit of the Property is largely coincident with the Bankfield-Tombill Fault. The fault is described
as a variably deformed; largely ductile, high strain zone characterized by strong heterogeneous penetrative
strain, narrow shear zones and breccias zones cutting a variety of protoliths. Where it is most highly
deformed it is described as a “crush zone” by Smyk et al., (2005) that “has been intensely silicified
(Pye, 1952), carbonatized (Anglin and Franklin, 1985) and contains minor amounts of gold (Pye, 1952).”
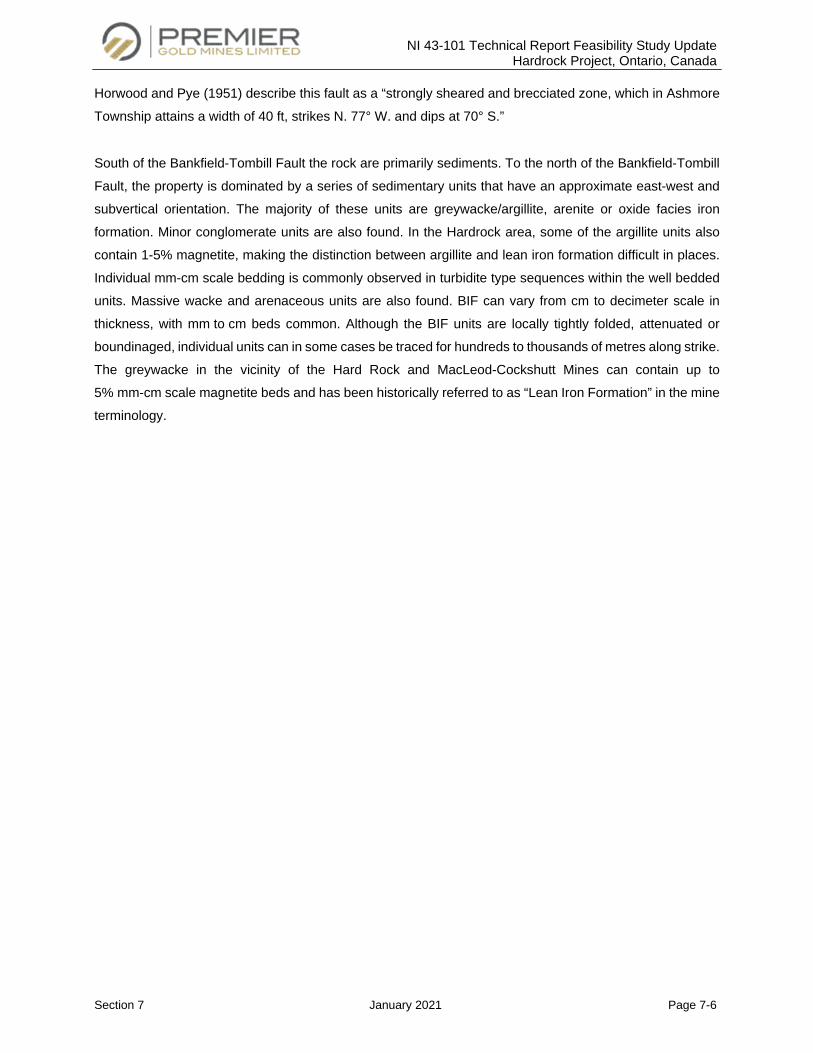
NI 43-101 Technical Report Feasibility Study Update Hardrock Project, Ontario, Canada
Section 7 January 2021 Page 7-6
Horwood and Pye (1951) describe this fault as a “strongly sheared and brecciated zone, which in Ashmore
Township attains a width of 40 ft, strikes N. 77° W. and dips at 70° S.”
South of the Bankfield-Tombill Fault the rock are primarily sediments. To the north of the Bankfield-Tombill
Fault, the property is dominated by a series of sedimentary units that have an approximate east-west and
subvertical orientation. The majority of these units are greywacke/argillite, arenite or oxide facies iron
formation. Minor conglomerate units are also found. In the Hardrock area, some of the argillite units also
contain 1-5% magnetite, making the distinction between argillite and lean iron formation difficult in places.
Individual mm-cm scale bedding is commonly observed in turbidite type sequences within the well bedded
units. Massive wacke and arenaceous units are also found. BIF can vary from cm to decimeter scale in
thickness, with mm to cm beds common. Although the BIF units are locally tightly folded, attenuated or
boundinaged, individual units can in some cases be traced for hundreds to thousands of metres along strike.
The greywacke in the vicinity of the Hard Rock and MacLeod-Cockshutt Mines can contain up to
5% mm-cm scale magnetite beds and has been historically referred to as “Lean Iron Formation” in the mine
terminology.
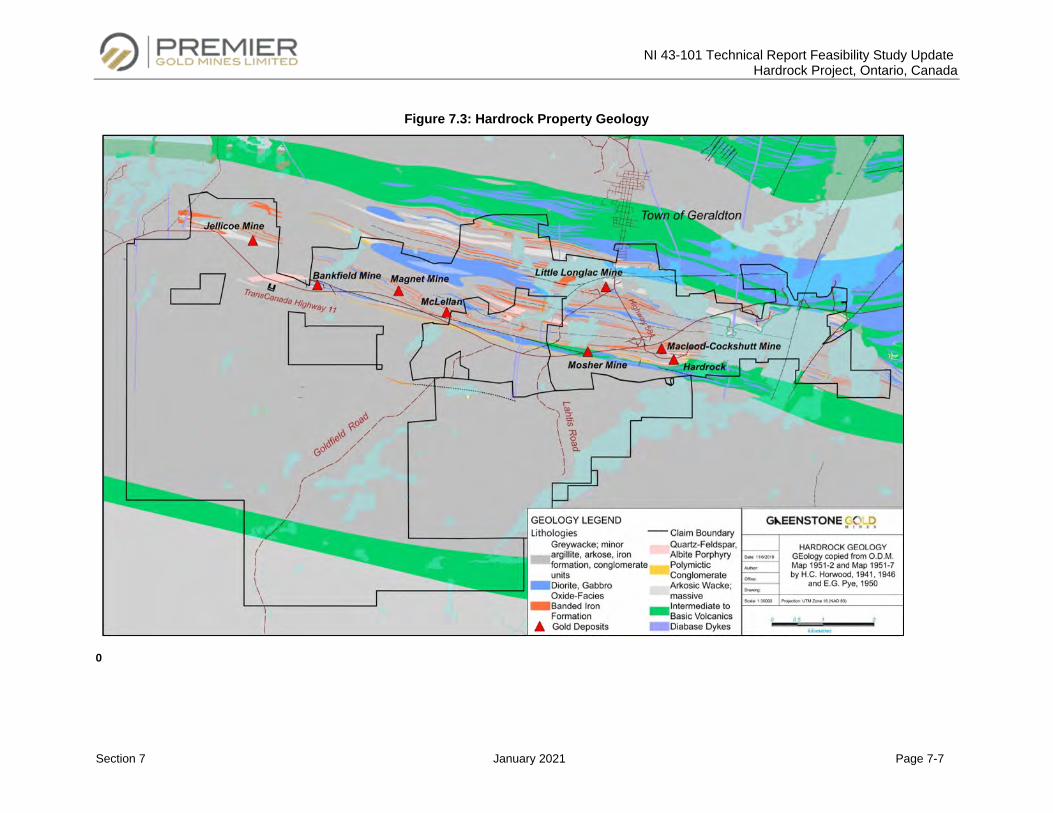
NI 43-101 Technical Report Feasibility Study Update Hardrock Project, Ontario, Canada
Section 7 January 2021 Page 7-7
Figure 7.3: Hardrock Property Geology
0
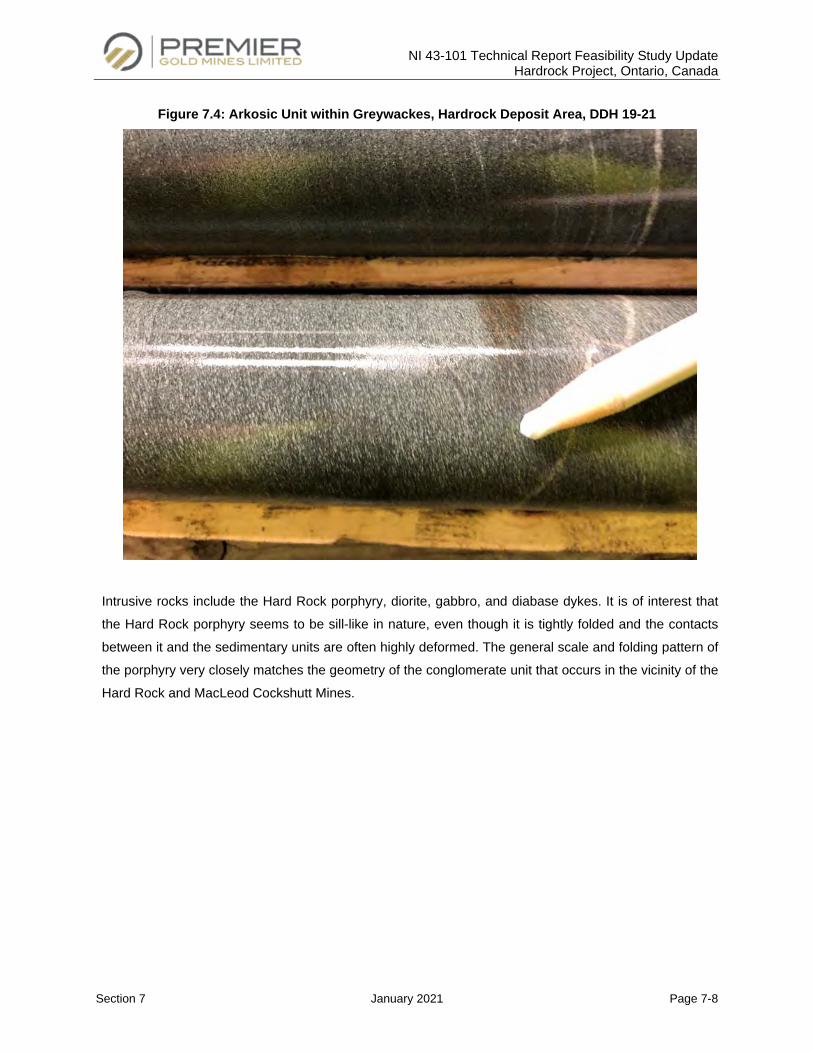
NI 43-101 Technical Report Feasibility Study Update Hardrock Project, Ontario, Canada
Section 7 January 2021 Page 7-8
Figure 7.4: Arkosic Unit within Greywackes, Hardrock Deposit Area, DDH 19-21
Intrusive rocks include the Hard Rock porphyry, diorite, gabbro, and diabase dykes. It is of interest that
the Hard Rock porphyry seems to be sill-like in nature, even though it is tightly folded and the contacts
between it and the sedimentary units are often highly deformed. The general scale and folding pattern of
the porphyry very closely matches the geometry of the conglomerate unit that occurs in the vicinity of the
Hard Rock and MacLeod Cockshutt Mines.
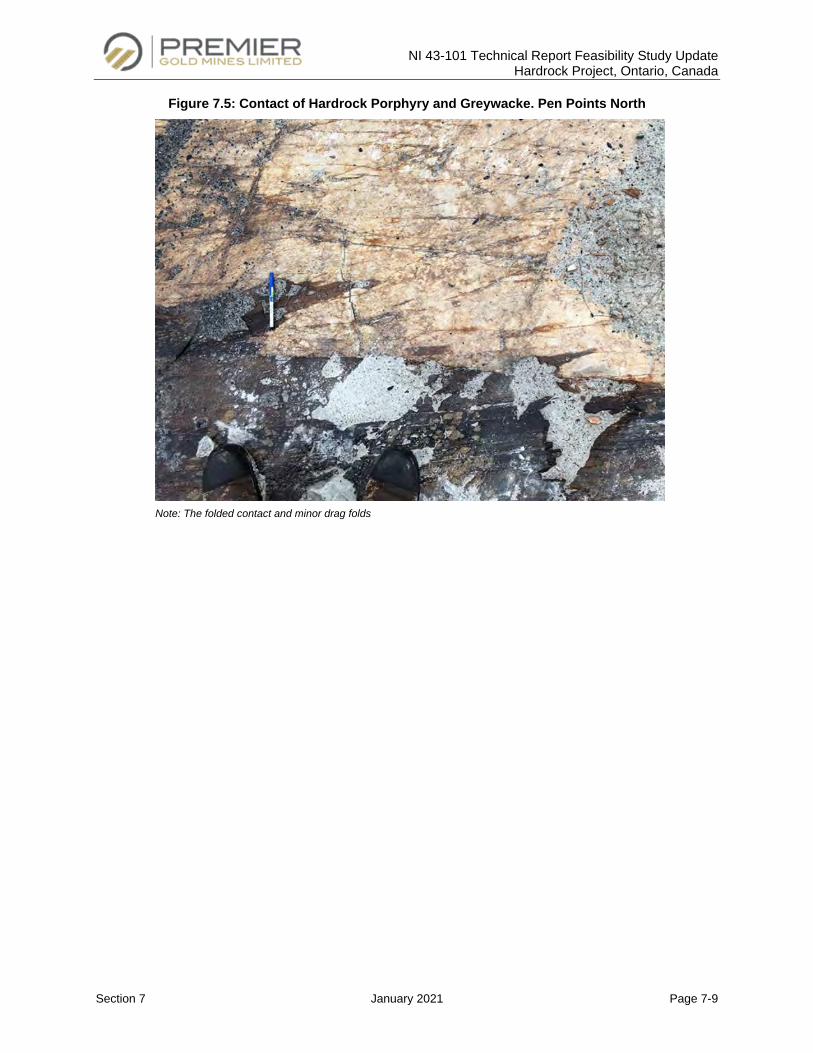
NI 43-101 Technical Report Feasibility Study Update Hardrock Project, Ontario, Canada
Section 7 January 2021 Page 7-9
Figure 7.5: Contact of Hardrock Porphyry and Greywacke. Pen Points North
Note: The folded contact and minor drag folds
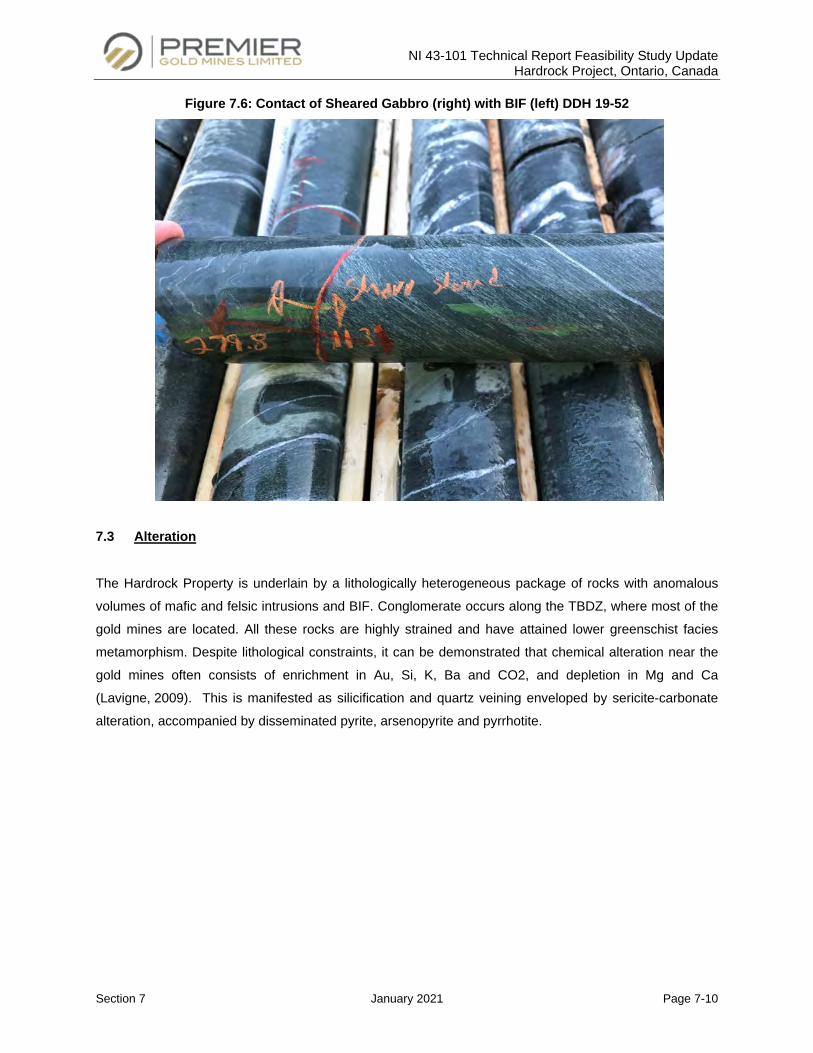
NI 43-101 Technical Report Feasibility Study Update Hardrock Project, Ontario, Canada
Section 7 January 2021 Page 7-10
Figure 7.6: Contact of Sheared Gabbro (right) with BIF (left) DDH 19-52
7.3 Alteration
The Hardrock Property is underlain by a lithologically heterogeneous package of rocks with anomalous
volumes of mafic and felsic intrusions and BIF. Conglomerate occurs along the TBDZ, where most of the
gold mines are located. All these rocks are highly strained and have attained lower greenschist facies
metamorphism. Despite lithological constraints, it can be demonstrated that chemical alteration near the
gold mines often consists of enrichment in Au, Si, K, Ba and CO2, and depletion in Mg and Ca
(Lavigne, 2009). This is manifested as silicification and quartz veining enveloped by sericite-carbonate
alteration, accompanied by disseminated pyrite, arsenopyrite and pyrrhotite.
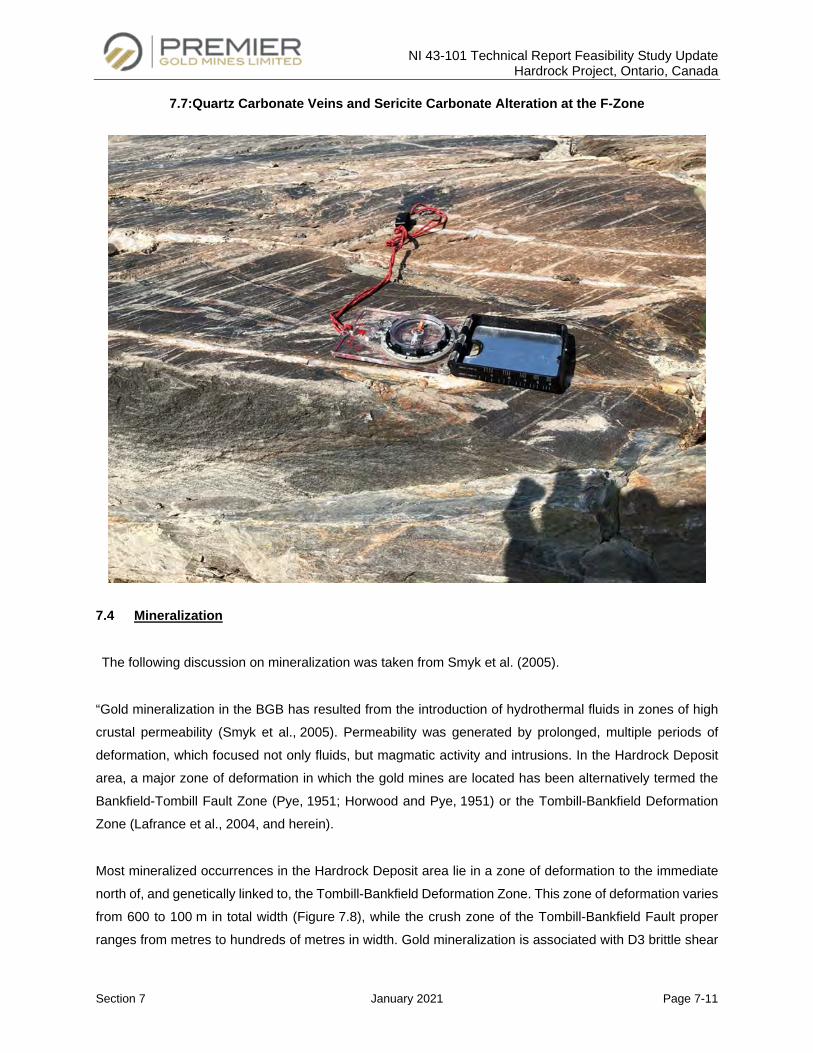
NI 43-101 Technical Report Feasibility Study Update Hardrock Project, Ontario, Canada
Section 7 January 2021 Page 7-11
7.7:Quartz Carbonate Veins and Sericite Carbonate Alteration at the F-Zone
7.4 Mineralization
The following discussion on mineralization was taken from Smyk et al. (2005).
“Gold mineralization in the BGB has resulted from the introduction of hydrothermal fluids in zones of high
crustal permeability (Smyk et al., 2005). Permeability was generated by prolonged, multiple periods of
deformation, which focused not only fluids, but magmatic activity and intrusions. In the Hardrock Deposit
area, a major zone of deformation in which the gold mines are located has been alternatively termed the
Bankfield-Tombill Fault Zone (Pye, 1951; Horwood and Pye, 1951) or the Tombill-Bankfield Deformation
Zone (Lafrance et al., 2004, and herein).
Most mineralized occurrences in the Hardrock Deposit area lie in a zone of deformation to the immediate
north of, and genetically linked to, the Tombill-Bankfield Deformation Zone. This zone of deformation varies
from 600 to 100 m in total width (Figure 7.8), while the crush zone of the Tombill-Bankfield Fault proper
ranges from metres to hundreds of metres in width. Gold mineralization is associated with D3 brittle shear
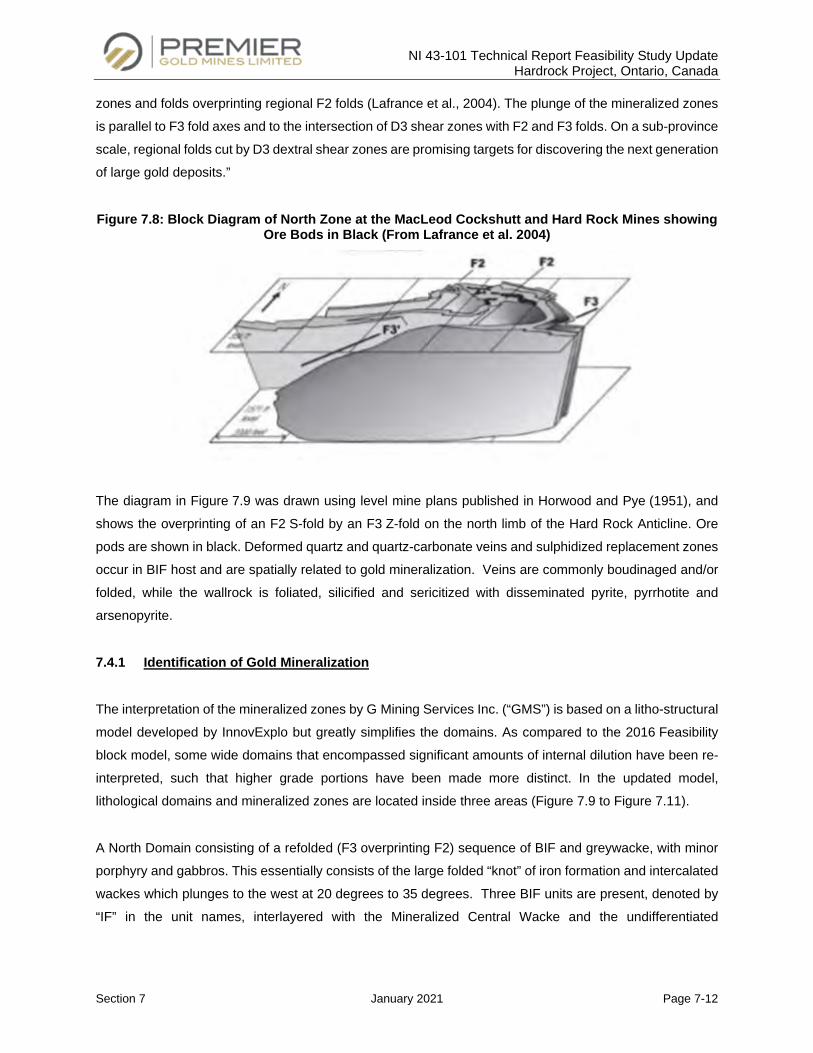
NI 43-101 Technical Report Feasibility Study Update Hardrock Project, Ontario, Canada
Section 7 January 2021 Page 7-12
zones and folds overprinting regional F2 folds (Lafrance et al., 2004). The plunge of the mineralized zones
is parallel to F3 fold axes and to the intersection of D3 shear zones with F2 and F3 folds. On a sub-province
scale, regional folds cut by D3 dextral shear zones are promising targets for discovering the next generation
of large gold deposits.”
Figure 7.8: Block Diagram of North Zone at the MacLeod Cockshutt and Hard Rock Mines showing Ore Bods in Black (From Lafrance et al. 2004)
The diagram in Figure 7.9 was drawn using level mine plans published in Horwood and Pye (1951), and
shows the overprinting of an F2 S-fold by an F3 Z-fold on the north limb of the Hard Rock Anticline. Ore
pods are shown in black. Deformed quartz and quartz-carbonate veins and sulphidized replacement zones
occur in BIF host and are spatially related to gold mineralization. Veins are commonly boudinaged and/or
folded, while the wallrock is foliated, silicified and sericitized with disseminated pyrite, pyrrhotite and
arsenopyrite.
7.4.1 Identification of Gold Mineralization
The interpretation of the mineralized zones by G Mining Services Inc. (“GMS”) is based on a litho-structural
model developed by InnovExplo but greatly simplifies the domains. As compared to the 2016 Feasibility
block model, some wide domains that encompassed significant amounts of internal dilution have been re-
interpreted, such that higher grade portions have been made more distinct. In the updated model,
lithological domains and mineralized zones are located inside three areas (Figure 7.9 to Figure 7.11).
A North Domain consisting of a refolded (F3 overprinting F2) sequence of BIF and greywacke, with minor
porphyry and gabbros. This essentially consists of the large folded “knot” of iron formation and intercalated
wackes which plunges to the west at 20 degrees to 35 degrees. Three BIF units are present, denoted by
“IF” in the unit names, interlayered with the Mineralized Central Wacke and the undifferentiated
NI 43-101 Technical Report Feasibility Study Update Hardrock Project, Ontario, Canada
Section 7 January 2021 Page 7-13
greywackes. The North Gabbro is located between the two northernmost BIF units. From top to bottom,
the units are as follows:
• North IF 3;
• North Gabbro;
• North IF 2;
• North IF 1.
In the North Domain, mineralization appears to be preferentially spatially associated with the complex
refolded area affecting the BIFs and the North Gabbro. Gold mineralization occurs within all rock types but
shows a preferential association with the BIFs and gabbro. The three mineralized zones are as follows:
• North 1-Zone;
• North 2-Zone;
• North 3-Zone.
A Central Domain consisting mainly of an undifferentiated greywacke sequence and a mineralized portion
of this greywacke, defined as the Mineralized Central Wacke, which are both likely sheared and folded.
Three mineralized zones have been defined within the Central Domain to constrain zones of higher-grade
gold mineralization inside the Mineralized Central Wacke. From south to north, the three mineralized zones
are as follows:
• F-Zone;
• F2-Zone;
• Central-Zone.
A South Domain characterized by a tightly folded (F2) stratigraphic sequence, consisting of the following
units from top to bottom:
• Upper Greywacke;
• Mid BIF;
• Upper BIF;
• Porphyry;
NI 43-101 Technical Report Feasibility Study Update Hardrock Project, Ontario, Canada
Section 7 January 2021 Page 7-14
• Lower BIF;
• Mid Conglomerate;
• Mid Ultramafic;
• Mid Greywacke;
• Lower Conglomerate;
• Lower Greywacke.
Five mineralized zones have been defined within the South Domain, in which gold mineralization appears
primarily associated with the “main” anticline (Hardrock Anticline) and preferentially within both BIFs. These
mineralized zones are as follows (from south to north):
• Tenacity Zone;
• SP2-Zone;
• SP-Zone;
• Lower Zone;
• A-Zone.
There are also a number of mineralized intersections within the wackes and near the contacts of the south
porphyry. For the most part, this scattered mineralization has not been defined.
The South Gabbro unit marks the southern limit of the deposit and is interpreted to be spatially associated
with the Tombill-Bankfield Deformation Zone but shows no evidence of mineralization.
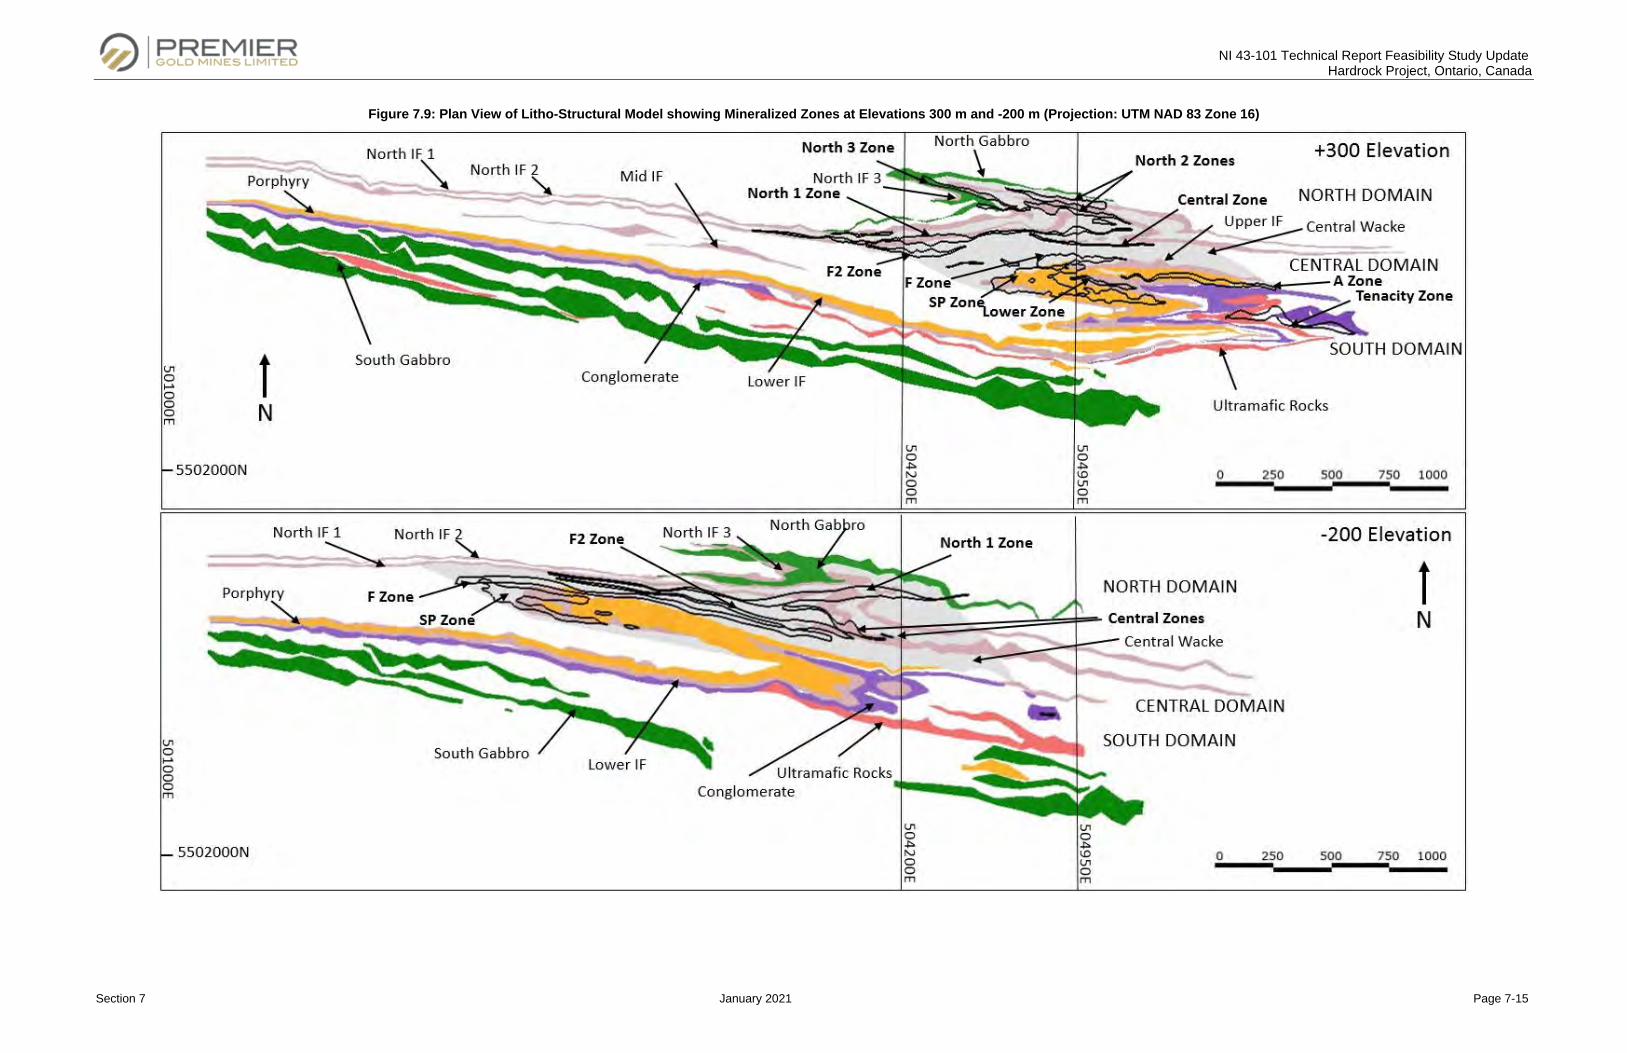
NI 43-101 Technical Report Feasibility Study Update Hardrock Project, Ontario, Canada
Section 7 January 2021 Page 7-15
Figure 7.9: Plan View of Litho-Structural Model showing Mineralized Zones at Elevations 300 m and -200 m (Projection: UTM NAD 83 Zone 16)
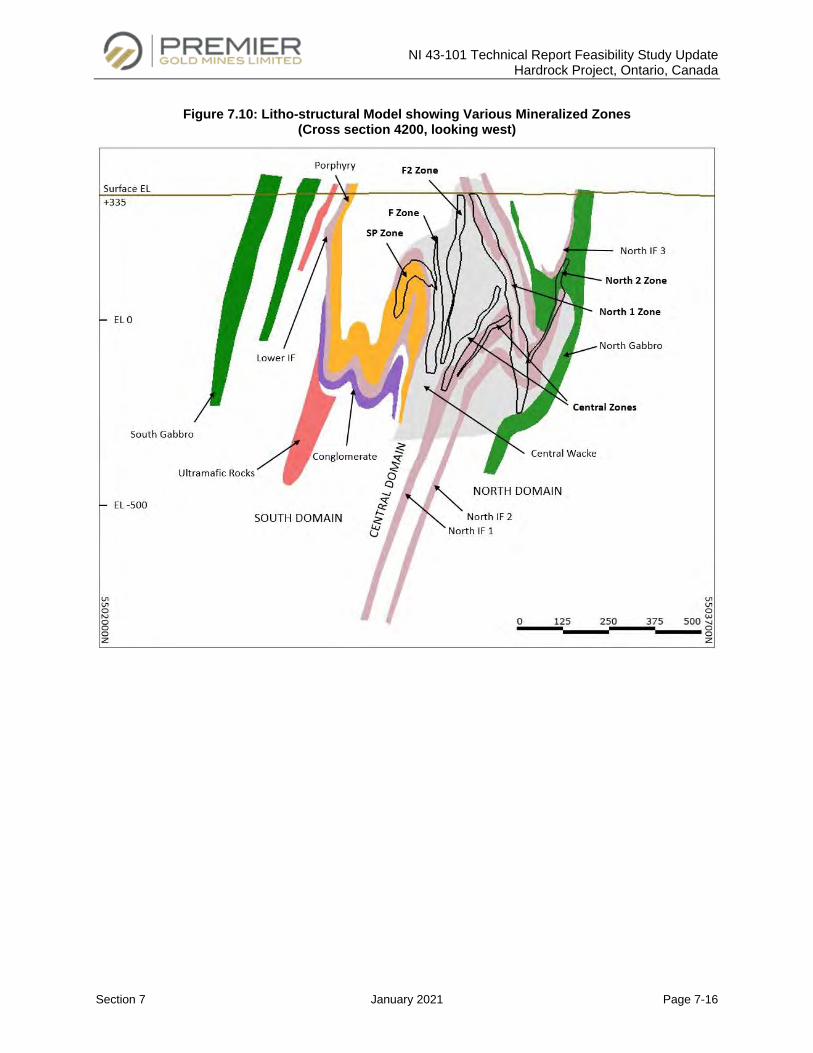
NI 43-101 Technical Report Feasibility Study Update Hardrock Project, Ontario, Canada
Section 7 January 2021 Page 7-16
Figure 7.10: Litho-structural Model showing Various Mineralized Zones (Cross section 4200, looking west)
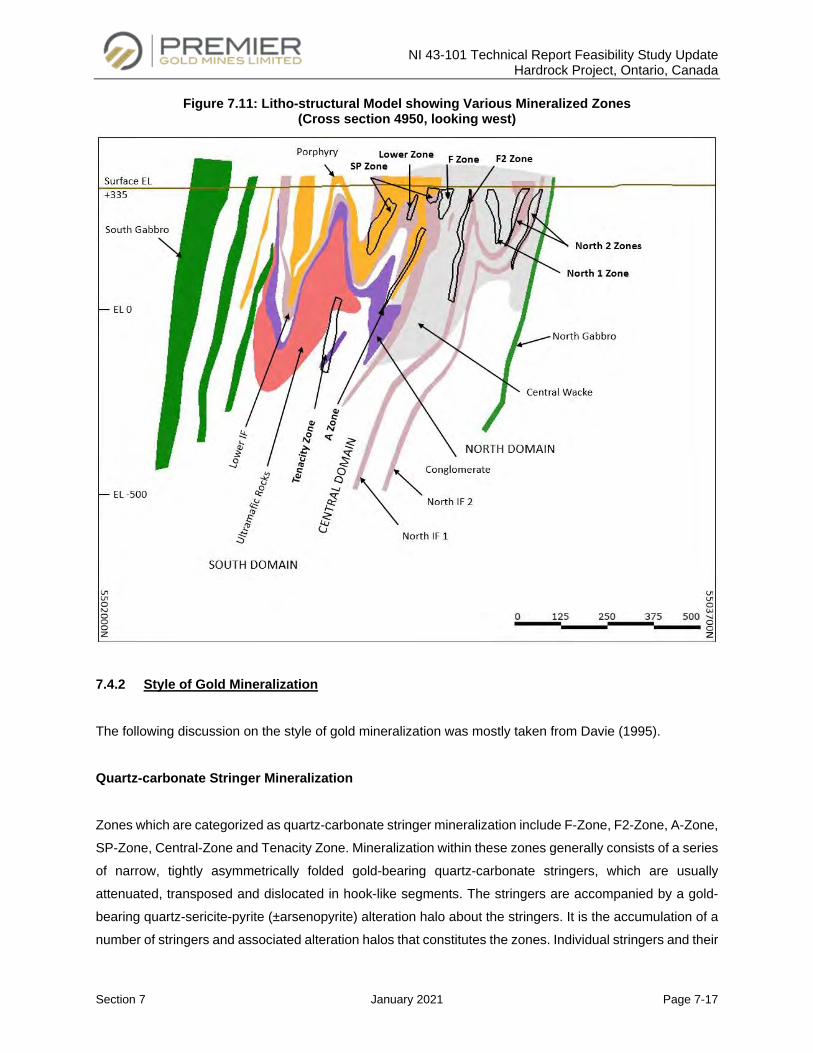
NI 43-101 Technical Report Feasibility Study Update Hardrock Project, Ontario, Canada
Section 7 January 2021 Page 7-17
Figure 7.11: Litho-structural Model showing Various Mineralized Zones (Cross section 4950, looking west)
7.4.2 Style of Gold Mineralization
The following discussion on the style of gold mineralization was mostly taken from Davie (1995).
Quartz-carbonate Stringer Mineralization
Zones which are categorized as quartz-carbonate stringer mineralization include F-Zone, F2-Zone, A-Zone,
SP-Zone, Central-Zone and Tenacity Zone. Mineralization within these zones generally consists of a series
of narrow, tightly asymmetrically folded gold-bearing quartz-carbonate stringers, which are usually
attenuated, transposed and dislocated in hook-like segments. The stringers are accompanied by a gold-
bearing quartz-sericite-pyrite (±arsenopyrite) alteration halo about the stringers. It is the accumulation of a
number of stringers and associated alteration halos that constitutes the zones. Individual stringers and their
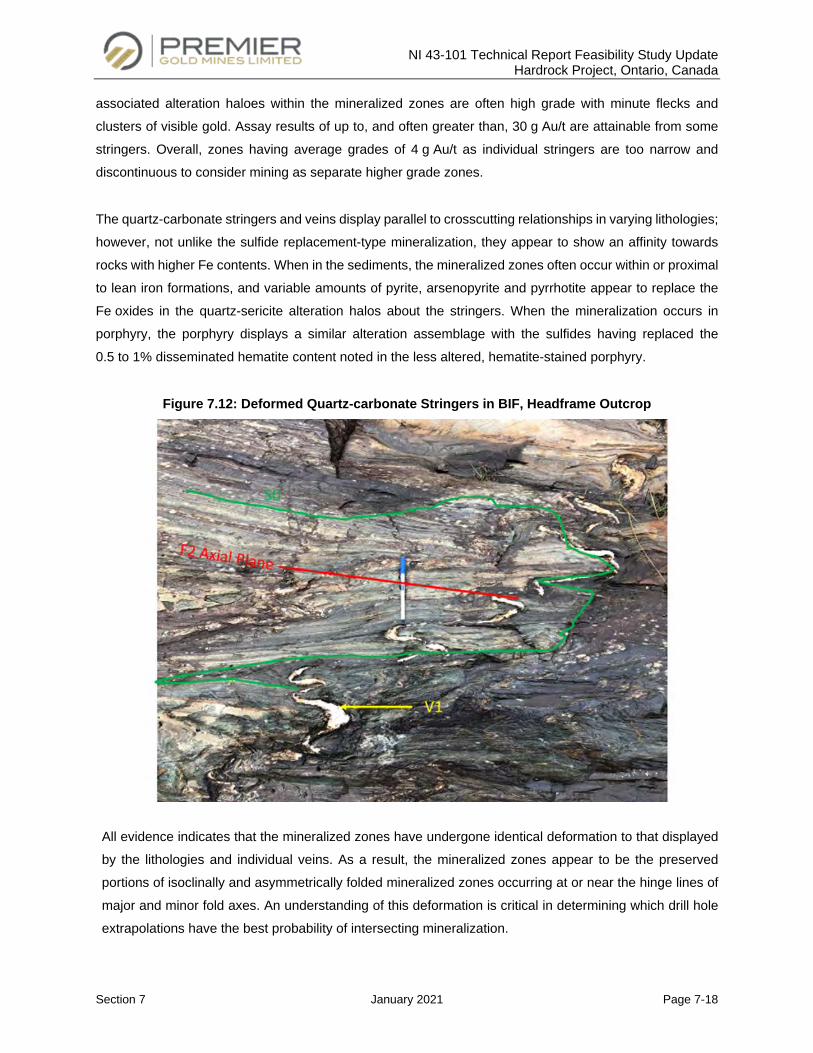
NI 43-101 Technical Report Feasibility Study Update Hardrock Project, Ontario, Canada
Section 7 January 2021 Page 7-18
associated alteration haloes within the mineralized zones are often high grade with minute flecks and
clusters of visible gold. Assay results of up to, and often greater than, 30 g Au/t are attainable from some
stringers. Overall, zones having average grades of 4 g Au/t as individual stringers are too narrow and
discontinuous to consider mining as separate higher grade zones.
The quartz-carbonate stringers and veins display parallel to crosscutting relationships in varying lithologies;
however, not unlike the sulfide replacement-type mineralization, they appear to show an affinity towards
rocks with higher Fe contents. When in the sediments, the mineralized zones often occur within or proximal
to lean iron formations, and variable amounts of pyrite, arsenopyrite and pyrrhotite appear to replace the
Fe oxides in the quartz-sericite alteration halos about the stringers. When the mineralization occurs in
porphyry, the porphyry displays a similar alteration assemblage with the sulfides having replaced the
0.5 to 1% disseminated hematite content noted in the less altered, hematite-stained porphyry.
Figure 7.12: Deformed Quartz-carbonate Stringers in BIF, Headframe Outcrop
All evidence indicates that the mineralized zones have undergone identical deformation to that displayed
by the lithologies and individual veins. As a result, the mineralized zones appear to be the preserved
portions of isoclinally and asymmetrically folded mineralized zones occurring at or near the hinge lines of
major and minor fold axes. An understanding of this deformation is critical in determining which drill hole
extrapolations have the best probability of intersecting mineralization.
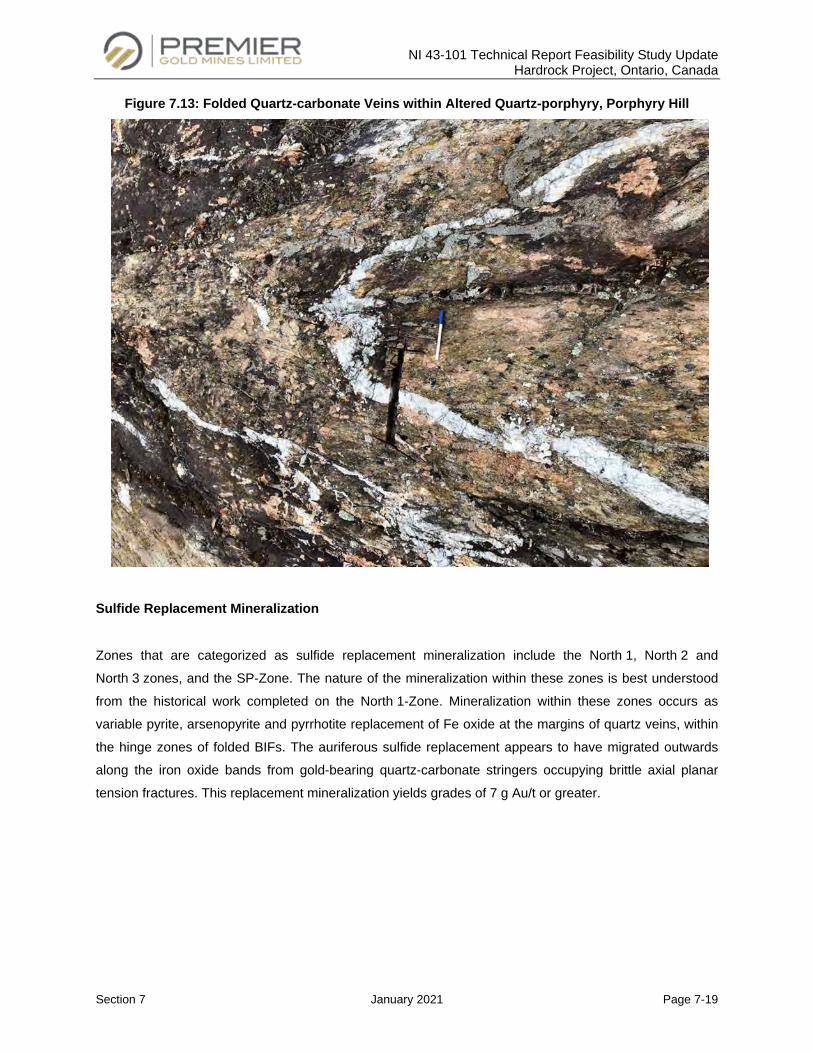
NI 43-101 Technical Report Feasibility Study Update Hardrock Project, Ontario, Canada
Section 7 January 2021 Page 7-19
Figure 7.13: Folded Quartz-carbonate Veins within Altered Quartz-porphyry, Porphyry Hill
Sulfide Replacement Mineralization
Zones that are categorized as sulfide replacement mineralization include the North 1, North 2 and
North 3 zones, and the SP-Zone. The nature of the mineralization within these zones is best understood
from the historical work completed on the North 1-Zone. Mineralization within these zones occurs as
variable pyrite, arsenopyrite and pyrrhotite replacement of Fe oxide at the margins of quartz veins, within
the hinge zones of folded BIFs. The auriferous sulfide replacement appears to have migrated outwards
along the iron oxide bands from gold-bearing quartz-carbonate stringers occupying brittle axial planar
tension fractures. This replacement mineralization yields grades of 7 g Au/t or greater.
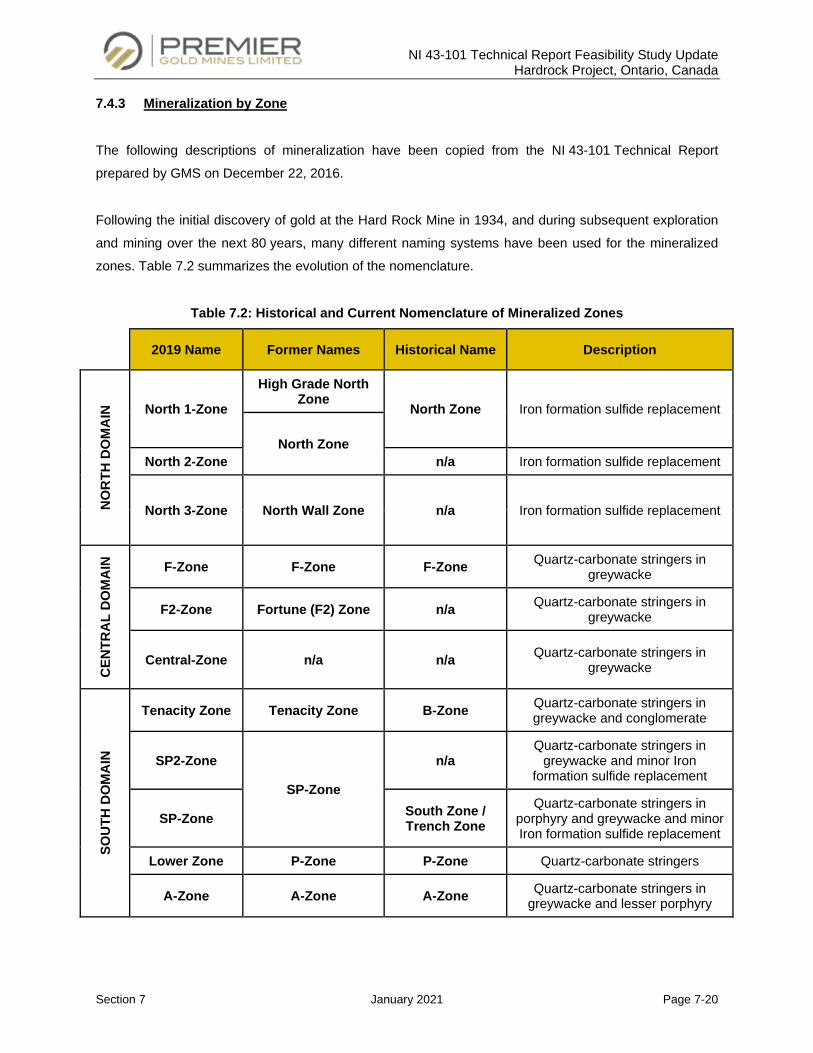
NI 43-101 Technical Report Feasibility Study Update Hardrock Project, Ontario, Canada
Section 7 January 2021 Page 7-20
7.4.3 Mineralization by Zone
The following descriptions of mineralization have been copied from the NI 43-101 Technical Report
prepared by GMS on December 22, 2016.
Following the initial discovery of gold at the Hard Rock Mine in 1934, and during subsequent exploration
and mining over the next 80 years, many different naming systems have been used for the mineralized
zones. Table 7.2 summarizes the evolution of the nomenclature.
Table 7.2: Historical and Current Nomenclature of Mineralized Zones
2019 Name Former Names Historical Name Description
NO
RTH
DO
MA
IN North 1-Zone
High Grade North Zone
North Zone Iron formation sulfide replacement
North Zone North 2-Zone n/a Iron formation sulfide replacement
North 3-Zone North Wall Zone n/a Iron formation sulfide replacement
CEN
TRA
L D
OM
AIN
F-Zone F-Zone F-Zone Quartz-carbonate stringers in greywacke
F2-Zone Fortune (F2) Zone n/a Quartz-carbonate stringers in greywacke
Central-Zone n/a n/a Quartz-carbonate stringers in greywacke
SOU
TH D
OM
AIN
Tenacity Zone Tenacity Zone B-Zone Quartz-carbonate stringers in greywacke and conglomerate
SP2-Zone
SP-Zone
n/a Quartz-carbonate stringers in
greywacke and minor Iron formation sulfide replacement
SP-Zone South Zone / Trench Zone
Quartz-carbonate stringers in porphyry and greywacke and minor Iron formation sulfide replacement
Lower Zone P-Zone P-Zone Quartz-carbonate stringers
A-Zone A-Zone A-Zone Quartz-carbonate stringers in greywacke and lesser porphyry
NI 43-101 Technical Report Feasibility Study Update Hardrock Project, Ontario, Canada
Section 7 January 2021 Page 7-21
North 1 and 2 Zones
The North 1 and North 2 zones both represent two main types of mineralization, fracture filling and
replacement. They are characterized by the presence of massive sulfides, but the fracture filling type
contains greater amounts of quartz and carbonate.
The North 1-Zone is an amalgamation of mineralized areas of the historical North Zone located at the
Z fold hinge of the main iron formation, and the High Grade North Zone located further west. The
North 2-Zone is located along the northern synclinal limb of the historical North Zone and encompasses the
majority of its mined resource.
North 3-Zone
Mineralization is primarily quartz-carbonate stringers concentrated at the synclinal hinge contact between
the upper iron formation and the northern gabbro and enveloping greywacke. Gold mineralization is focused
in areas with intercalated bands (1 to 50 cm wide) composed of all three lithologies, indicating tight isoclinal
folding. Mineralization is accompanied by moderate chlorite and sericite alteration in the gabbro and
greywacke, and weak to moderate fuchsite alteration in the gabbro. Mineralization is associated with
arsenopyrite and pyrite sulfides in all three lithologies.
F-Zone
The F-Zone mineralization lies proximal to the northern contact between the quartz-feldspar porphyry and
greywacke. Gold mineralization is associated with trace to 5% pyrite and lesser arsenopyrite and pyrrhotite
and moderate to minor sericite, chlorite and carbonate alteration.
F2-Zone
The F2-Zone horizon is composed of multiple, en-echelon, narrow vein zones located between the F-Zone
to the south and the North 1 Zone to the north. Gold mineralization is associated with trace to 5% pyrite,
with lesser arsenopyrite and pyrrhotite, and moderate to minor sericite, chlorite and carbonate alteration.
Central-Zone
The Central-Zone is a lens within the greywacke envelope adjacent to the North 1-Zone and subparallel to
the south limb of the North IF-1 unit. Similar to the F2-Zone, the Central-Zone is characterized by quartz
NI 43-101 Technical Report Feasibility Study Update Hardrock Project, Ontario, Canada
Section 7 January 2021 Page 7-22
carbonate stringers with trace to 2% pyrite and lesser arsenopyrite, hosted in greywacke with moderate to
minor sericite, chlorite and carbonate alteration.
Tenacity Zone
The Tenacity Zone is marked by moderately to intensely silicified and veined greywacke host rocks,
adjacent to folded altered ultramafic and conglomerate units. Gold mineralization is associated with traces
to 5% pyrite and lesser pyrrhotite and arsenopyrite, accompanied by sericite and chlorite alterations in
sediments or talc and serpentine alterations in ultramafics.
SP and SP2-Zones
The mineralization is partly quartz-carbonate stringer and partly sulfide replacement and occurs at the
contact between the porphyry and the lean iron formation/greywacke unit of the southern limb of the main
porphyry anticline. The mineralization is located along the southern limb, proximal to the hinge of a parasitic
asymmetrical Z-fold of the contact. Quartz-carbonate stringer mineralization is predominantly found in the
porphyry and greywacke and is associated with trace to 5% pyrite and lesser arsenopyrite. Sulfide
replacement mineralization is localized at the contact margins between porphyry and iron formation and
consists of 2 to 10% blebby pyrite.
Lower Zone
Mineralization is primarily quartz-carbonate stringers located in the hinge of the Lower BIF with intercalated
greywacke. Gold mineralization is associated with trace to 5% pyrite as stringers and blebs, contained in
veinlets with 10 to 30% quartz and carbonate. Alteration is strong to moderate chloritization. The
mineralized zone is often crosscut by moderately chlorite- and fuchsite-altered gabbro.
A-Zone
The mineralization consists mainly of gold-bearing, irregularly folded, quartz-carbonate stringers that are
generally less than 10 cm wide. Most of this gold occurs freely in the quartz-carbonate stringers, although
some is associated with pyrite. The mineralization occurs within a folded and fractured greywacke and
conglomerate and stops in the northern limb of the porphyry. Gold mineralization is associated with trace
to 10% pyrite and lesser arsenopyrite, accompanied by carbonate and sericite alteration.
NI 43-101 Technical Report Feasibility Study Update Hardrock Project, Ontario, Canada
Section 7 January 2021 Page 7-23
7.5 Other Greenstone Gold Property Deposits (Brookbank, Key Lake and Kailey)
The following is largely derived from the Technical Report prepared by GMS on December 22, 2016.
7.5.1 Regional Geological Setting
The regional geological setting described in Subsection 7.1 for the Hardrock Project and summarized in
Table 7.1 is applicable to the Greenstone Gold Property (formerly the Trans-Canada Property) as a whole,
which includes the Brookbank, Key Lake and Kailey Projects.
7.5.2 Brookbank Project Local Geology
The Brookbank Project is underlain predominantly by east-west trending and steeply south to vertically
dipping meta-volcanic and metasedimentary rocks. Meta-volcanic rocks consist of massive and pillowed,
locally amygdaloidal, flows of basaltic composition along with related tuffaceous rocks. Pillowed flows
exhibit tops to the north. They are locally intercalated with coarser-grained rocks of similar composition that
have been interpreted as either intrusions or coarse-grained volcanic phases at the center of thicker basaltic
flows. The meta-volcanic rocks are locally intruded by quartz-feldspar porphyritic dykes. See Figure 7.14
for a geological map of the prospect.
Mafic meta-volcanic rocks are fault-bounded against domains of metasedimentary rocks. The northern
domain consists of a polymictic conglomerate with pebble- to boulder-sized, rounded to sub-rounded clasts
in a feldspar-quartz-sericite matrix. Clasts consist of volcanic and intrusive rock types of various
compositions, quartz pebbles and jasper, the latter suggesting affinity with Timiskaming Formation
conglomerates in the Timmins (Porcupine) Mining District.
Metasedimentary domains south of Windigokan Lake also contain polymictic conglomerate as well as
feldspathic and quartzose sandstone and wacke, siltstone, minor argillite and hematitic iron formation.
Felsic to intermediate pyroclastic rocks and flows occur in the north part of the property and are fault
bounded with mafic meta-volcanic rocks across the Paint Lake Fault. They consist of tuff breccia,
pyroclastic breccia and tuff, and massive to porphyritic rhyolite flows.
Intermediate to mafic intrusions cut the meta-volcanic and metasedimentary rocks in the central part of the
Brookbank Property. They consist of quartz diorite, diorite and gabbro. North-trending, flat-lying, locally
porphyritic diabase dykes of Keweenawan age cut the meta-volcanic and metasedimentary rocks along the
western boundary of the property in Sandra Township and along the western boundary of Irwin Township.
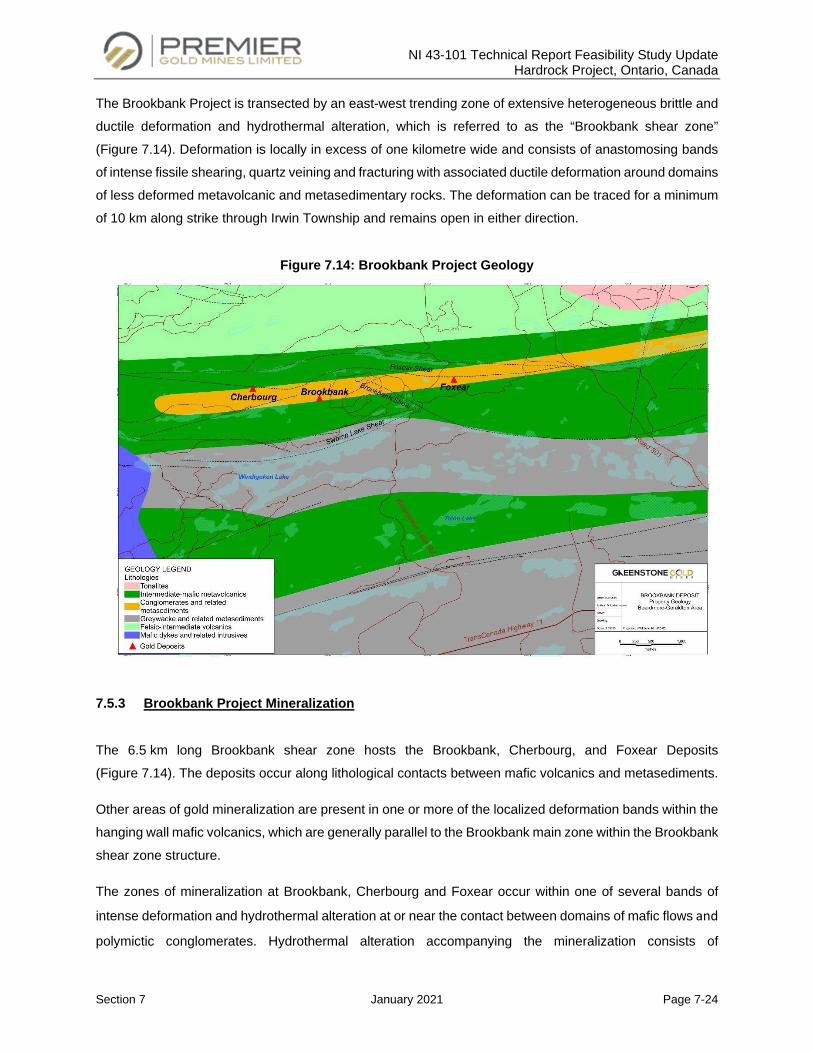
NI 43-101 Technical Report Feasibility Study Update Hardrock Project, Ontario, Canada
Section 7 January 2021 Page 7-24
The Brookbank Project is transected by an east-west trending zone of extensive heterogeneous brittle and
ductile deformation and hydrothermal alteration, which is referred to as the “Brookbank shear zone”
(Figure 7.14). Deformation is locally in excess of one kilometre wide and consists of anastomosing bands
of intense fissile shearing, quartz veining and fracturing with associated ductile deformation around domains
of less deformed metavolcanic and metasedimentary rocks. The deformation can be traced for a minimum
of 10 km along strike through Irwin Township and remains open in either direction.
Figure 7.14: Brookbank Project Geology
7.5.3 Brookbank Project Mineralization
The 6.5 km long Brookbank shear zone hosts the Brookbank, Cherbourg, and Foxear Deposits
(Figure 7.14). The deposits occur along lithological contacts between mafic volcanics and metasediments.
Other areas of gold mineralization are present in one or more of the localized deformation bands within the
hanging wall mafic volcanics, which are generally parallel to the Brookbank main zone within the Brookbank
shear zone structure.
The zones of mineralization at Brookbank, Cherbourg and Foxear occur within one of several bands of
intense deformation and hydrothermal alteration at or near the contact between domains of mafic flows and
polymictic conglomerates. Hydrothermal alteration accompanying the mineralization consists of
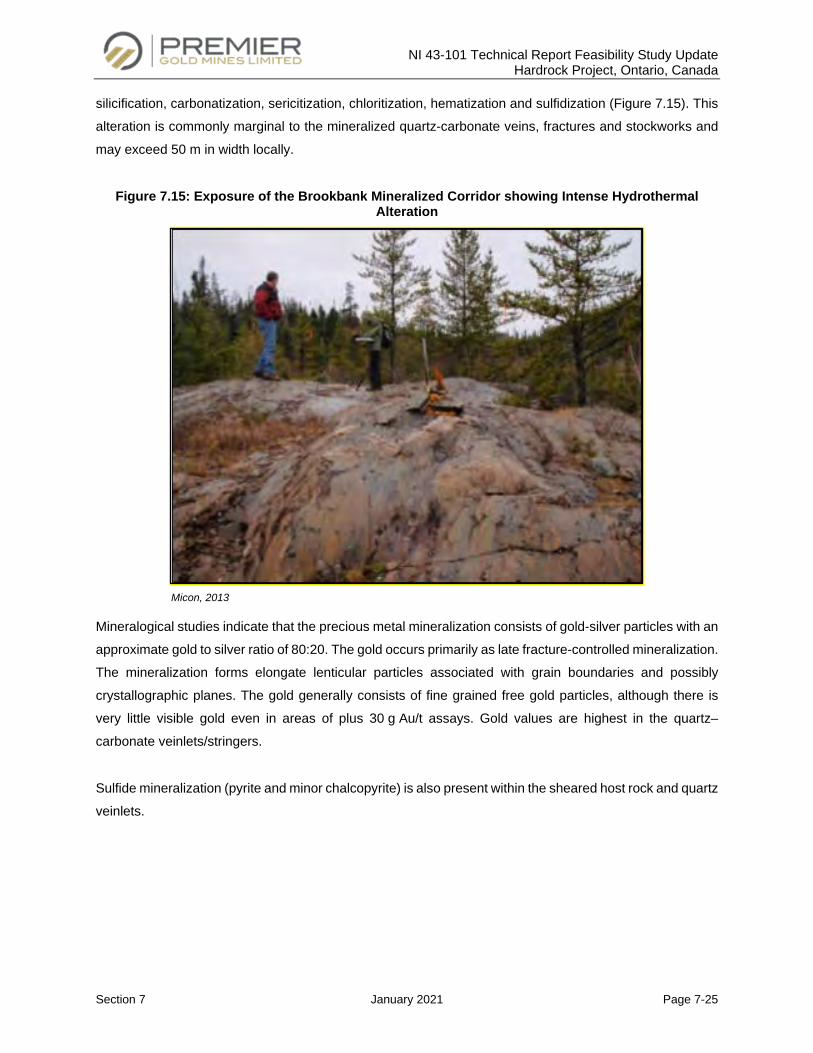
NI 43-101 Technical Report Feasibility Study Update Hardrock Project, Ontario, Canada
Section 7 January 2021 Page 7-25
silicification, carbonatization, sericitization, chloritization, hematization and sulfidization (Figure 7.15). This
alteration is commonly marginal to the mineralized quartz-carbonate veins, fractures and stockworks and
may exceed 50 m in width locally.
Figure 7.15: Exposure of the Brookbank Mineralized Corridor showing Intense Hydrothermal Alteration
Micon, 2013
Mineralogical studies indicate that the precious metal mineralization consists of gold-silver particles with an
approximate gold to silver ratio of 80:20. The gold occurs primarily as late fracture-controlled mineralization.
The mineralization forms elongate lenticular particles associated with grain boundaries and possibly
crystallographic planes. The gold generally consists of fine grained free gold particles, although there is
very little visible gold even in areas of plus 30 g Au/t assays. Gold values are highest in the quartz–
carbonate veinlets/stringers.
Sulfide mineralization (pyrite and minor chalcopyrite) is also present within the sheared host rock and quartz
veinlets.
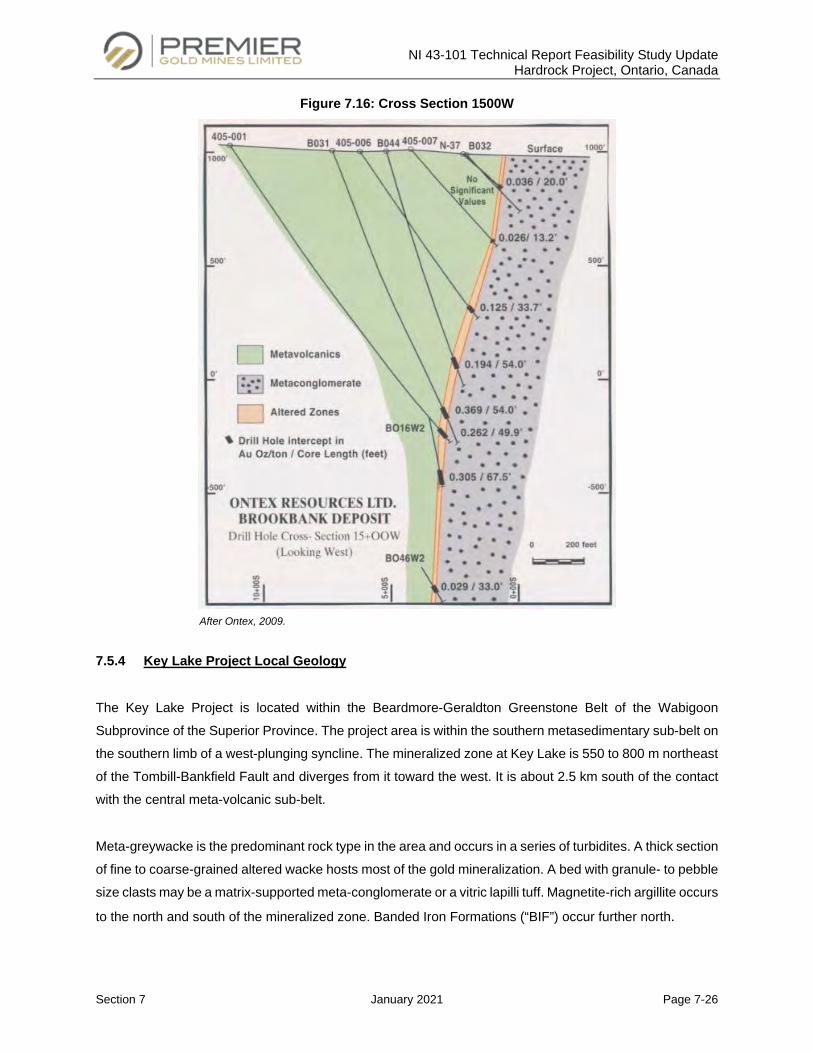
NI 43-101 Technical Report Feasibility Study Update Hardrock Project, Ontario, Canada
Section 7 January 2021 Page 7-26
Figure 7.16: Cross Section 1500W
After Ontex, 2009.
7.5.4 Key Lake Project Local Geology
The Key Lake Project is located within the Beardmore-Geraldton Greenstone Belt of the Wabigoon
Subprovince of the Superior Province. The project area is within the southern metasedimentary sub-belt on
the southern limb of a west-plunging syncline. The mineralized zone at Key Lake is 550 to 800 m northeast
of the Tombill-Bankfield Fault and diverges from it toward the west. It is about 2.5 km south of the contact
with the central meta-volcanic sub-belt.
Meta-greywacke is the predominant rock type in the area and occurs in a series of turbidites. A thick section
of fine to coarse-grained altered wacke hosts most of the gold mineralization. A bed with granule- to pebble
size clasts may be a matrix-supported meta-conglomerate or a vitric lapilli tuff. Magnetite-rich argillite occurs
to the north and south of the mineralized zone. Banded Iron Formations (“BIF”) occur further north.
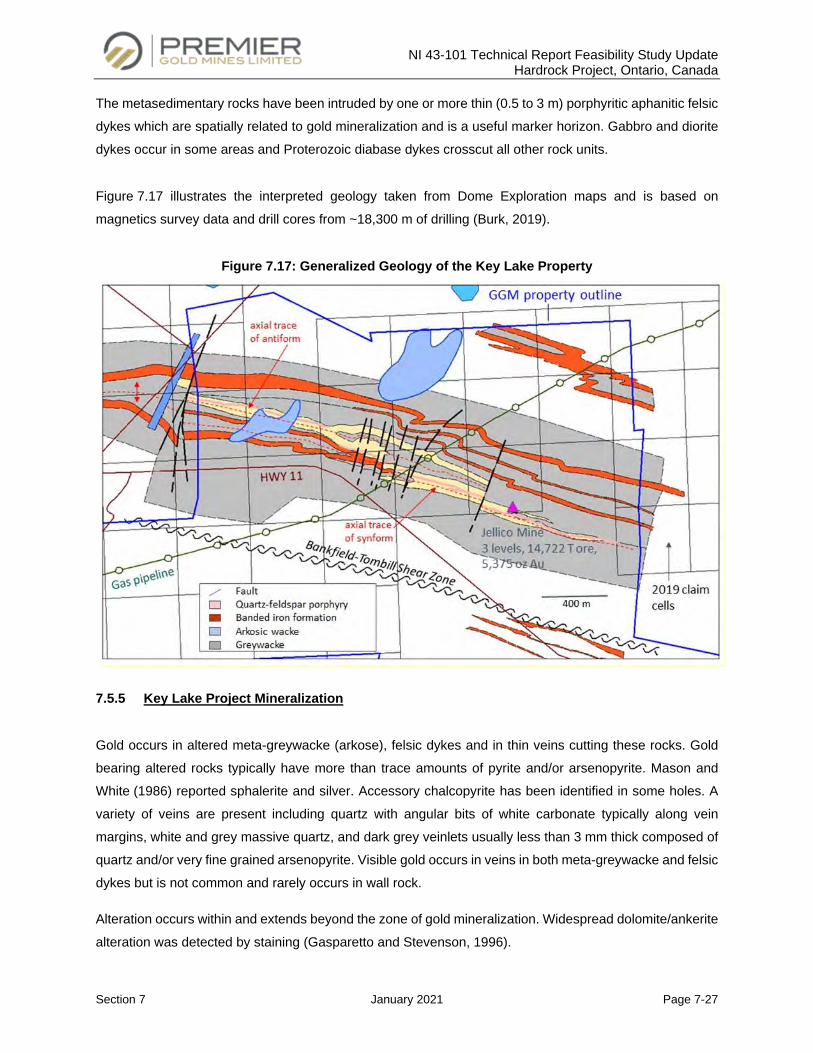
NI 43-101 Technical Report Feasibility Study Update Hardrock Project, Ontario, Canada
Section 7 January 2021 Page 7-27
The metasedimentary rocks have been intruded by one or more thin (0.5 to 3 m) porphyritic aphanitic felsic
dykes which are spatially related to gold mineralization and is a useful marker horizon. Gabbro and diorite
dykes occur in some areas and Proterozoic diabase dykes crosscut all other rock units.
Figure 7.17 illustrates the interpreted geology taken from Dome Exploration maps and is based on
magnetics survey data and drill cores from ~18,300 m of drilling (Burk, 2019).
Figure 7.17: Generalized Geology of the Key Lake Property
7.5.5 Key Lake Project Mineralization
Gold occurs in altered meta-greywacke (arkose), felsic dykes and in thin veins cutting these rocks. Gold
bearing altered rocks typically have more than trace amounts of pyrite and/or arsenopyrite. Mason and
White (1986) reported sphalerite and silver. Accessory chalcopyrite has been identified in some holes. A
variety of veins are present including quartz with angular bits of white carbonate typically along vein
margins, white and grey massive quartz, and dark grey veinlets usually less than 3 mm thick composed of
quartz and/or very fine grained arsenopyrite. Visible gold occurs in veins in both meta-greywacke and felsic
dykes but is not common and rarely occurs in wall rock.
Alteration occurs within and extends beyond the zone of gold mineralization. Widespread dolomite/ankerite
alteration was detected by staining (Gasparetto and Stevenson, 1996).

NI 43-101 Technical Report Feasibility Study Update Hardrock Project, Ontario, Canada
Section 7 January 2021 Page 7-28
Zones of greenish, brownish, and rarely yellowish sericitization are more limited and envelope all but a
small fraction of the gold mineralization. Silicification is more limited still and is a very good indicator of gold
mineralization. However, a significant proportion of the gold mineralization does not occur in silicified rocks.
Two examples of mineralization observed on the Key Lake Deposit are shown in Figure 7.18 and
Figure 7.19.
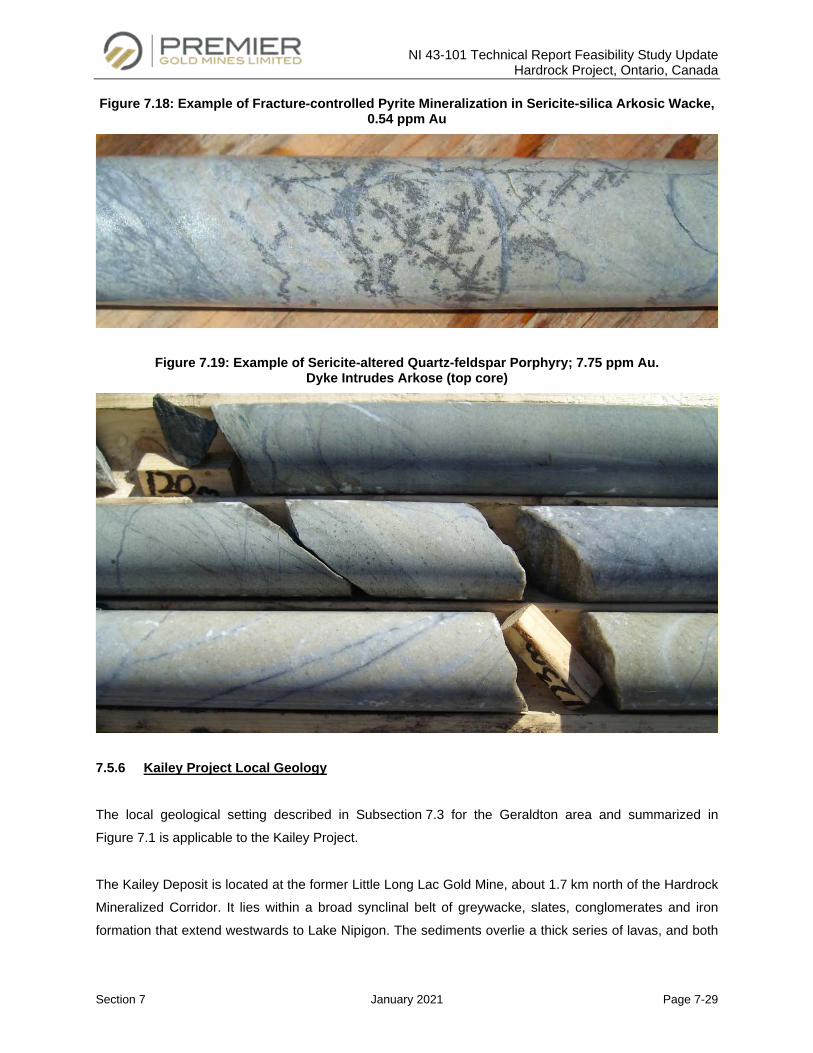
NI 43-101 Technical Report Feasibility Study Update Hardrock Project, Ontario, Canada
Section 7 January 2021 Page 7-29
Figure 7.18: Example of Fracture-controlled Pyrite Mineralization in Sericite-silica Arkosic Wacke, 0.54 ppm Au
Figure 7.19: Example of Sericite-altered Quartz-feldspar Porphyry; 7.75 ppm Au. Dyke Intrudes Arkose (top core)
7.5.6 Kailey Project Local Geology
The local geological setting described in Subsection 7.3 for the Geraldton area and summarized in
Figure 7.1 is applicable to the Kailey Project.
The Kailey Deposit is located at the former Little Long Lac Gold Mine, about 1.7 km north of the Hardrock
Mineralized Corridor. It lies within a broad synclinal belt of greywacke, slates, conglomerates and iron
formation that extend westwards to Lake Nipigon. The sediments overlie a thick series of lavas, and both
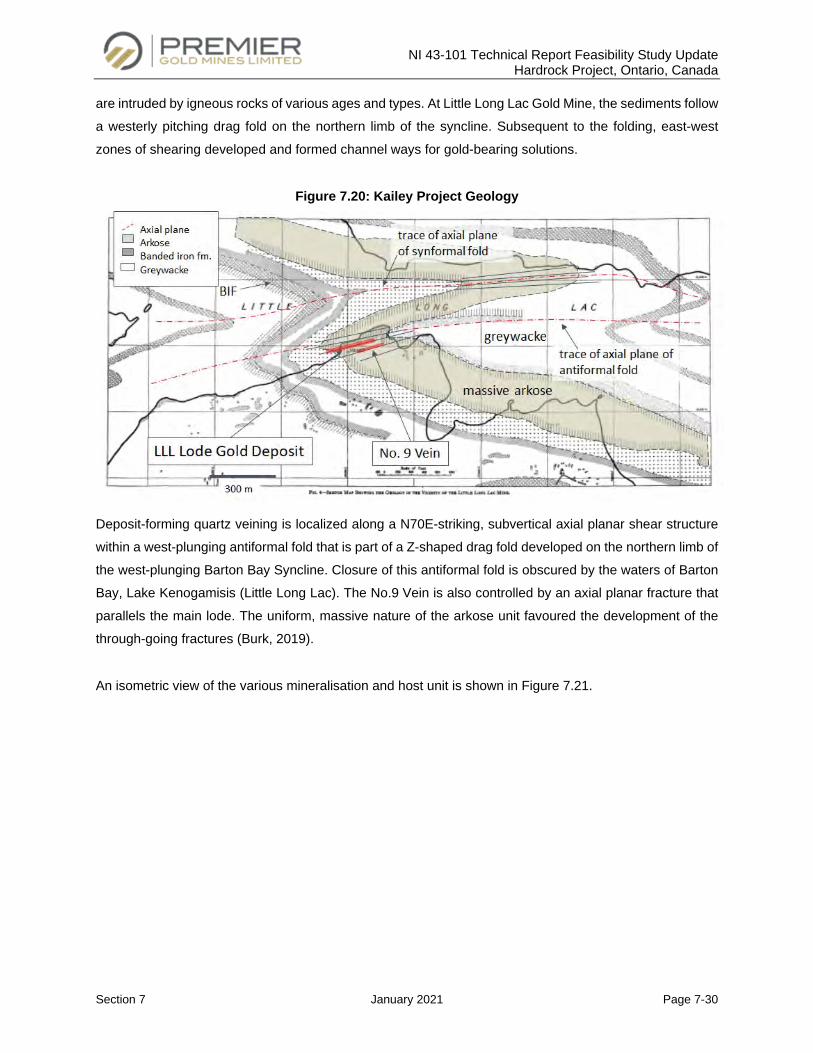
NI 43-101 Technical Report Feasibility Study Update Hardrock Project, Ontario, Canada
Section 7 January 2021 Page 7-30
are intruded by igneous rocks of various ages and types. At Little Long Lac Gold Mine, the sediments follow
a westerly pitching drag fold on the northern limb of the syncline. Subsequent to the folding, east-west
zones of shearing developed and formed channel ways for gold-bearing solutions.
Figure 7.20: Kailey Project Geology
Deposit-forming quartz veining is localized along a N70E-striking, subvertical axial planar shear structure
within a west-plunging antiformal fold that is part of a Z-shaped drag fold developed on the northern limb of
the west-plunging Barton Bay Syncline. Closure of this antiformal fold is obscured by the waters of Barton
Bay, Lake Kenogamisis (Little Long Lac). The No.9 Vein is also controlled by an axial planar fracture that
parallels the main lode. The uniform, massive nature of the arkose unit favoured the development of the
through-going fractures (Burk, 2019).
An isometric view of the various mineralisation and host unit is shown in Figure 7.21.
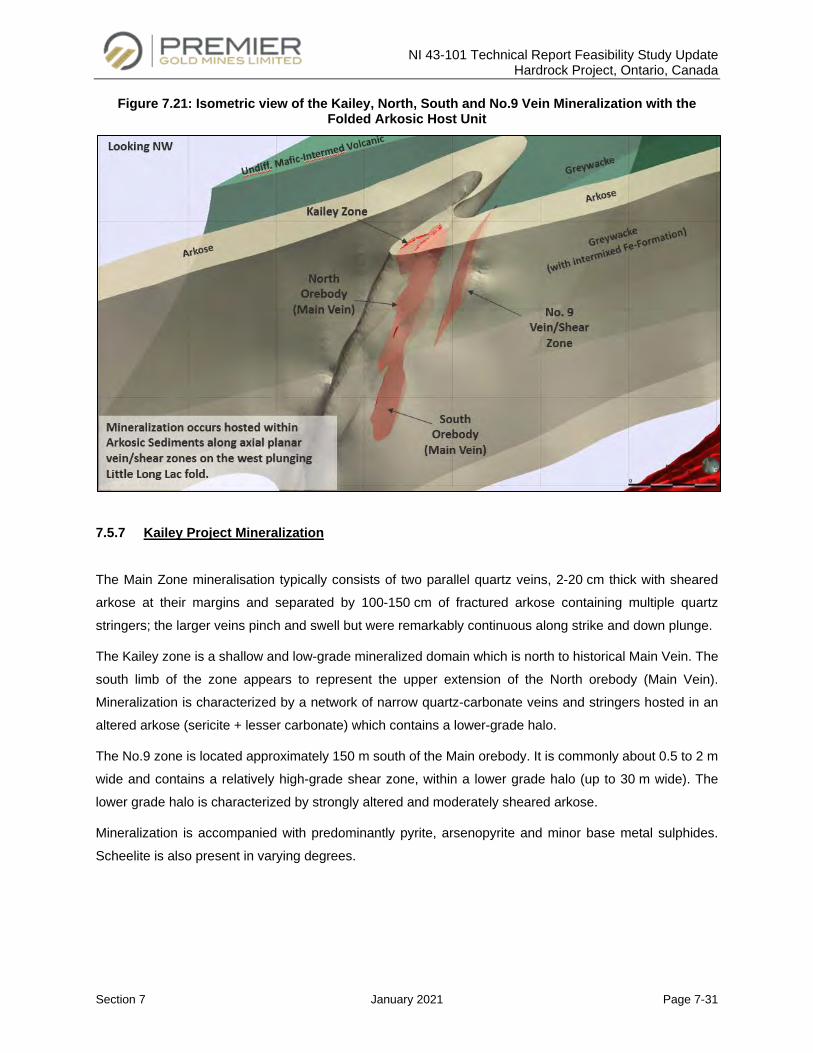
NI 43-101 Technical Report Feasibility Study Update Hardrock Project, Ontario, Canada
Section 7 January 2021 Page 7-31
Figure 7.21: Isometric view of the Kailey, North, South and No.9 Vein Mineralization with the Folded Arkosic Host Unit
7.5.7 Kailey Project Mineralization
The Main Zone mineralisation typically consists of two parallel quartz veins, 2-20 cm thick with sheared
arkose at their margins and separated by 100-150 cm of fractured arkose containing multiple quartz
stringers; the larger veins pinch and swell but were remarkably continuous along strike and down plunge.
The Kailey zone is a shallow and low-grade mineralized domain which is north to historical Main Vein. The
south limb of the zone appears to represent the upper extension of the North orebody (Main Vein).
Mineralization is characterized by a network of narrow quartz-carbonate veins and stringers hosted in an
altered arkose (sericite + lesser carbonate) which contains a lower-grade halo.
The No.9 zone is located approximately 150 m south of the Main orebody. It is commonly about 0.5 to 2 m
wide and contains a relatively high-grade shear zone, within a lower grade halo (up to 30 m wide). The
lower grade halo is characterized by strongly altered and moderately sheared arkose.
Mineralization is accompanied with predominantly pyrite, arsenopyrite and minor base metal sulphides.
Scheelite is also present in varying degrees.
NI 43-101 Technical Report Feasibility Study Update Hardrock Project, Ontario, Canada
Section 8 January 2021 Page 8-1
DEPOSIT TYPES
8.1 Hydrothermal IF-Hosted Gold Deposits
The gold orebodies at the MacLeod-Cockshutt Mine are one of the type examples of BIF-hosted gold
deposits. Other well-known Canadian examples include the Central Patricia Mine, ON and Lupin Mine, NT.
In these types of deposits, ductility contrasts between the iron formation units and enclosing sedimentary
units create structural traps that encourage the flow of hydrothermal fluids. The iron formation also acts as
a chemical trap, precipitating Sulphur, arsenic and attendant precious metals from the hydrothermal fluids.
In Archean terranes, this usually occurs in a brittle-ductile structural regime, depositing mesothermal
mineralization. Quartz-carbonate veins and sulphide replacement zones are common. It should be noted,
however, that the bulk of the “iron formation-hosted” mineralization at Hardrock actually occurs within the
interbedded wacke and argillite. This suggests that during deformation, the iron formation deformed
ductilely, while the wacke units were more brittle. Alteration includes the addition of silica, K, CO2, S, +/- As
and the depletion of Ca and Mg. This is manifested in the rock as quartz-carbonate veining, silicification
and/or semi-massive to massive sulphides (pyrite, pyrrhotite +/- arsenopyrite) surrounded by a halo of
sericite-carbonate-pyrite alteration.
The following sub-types are recognized and are present in the Hardrock Project. The following descriptions
are copied from the 2016 FS report, which in turn is quoted from Kerswill (1993).
8.1.1 Non-Stratiform Type
In non-stratiform deposits, gold is restricted to late structures (quartz veins and/or shear zones) and/or
sheared sulfide BIF immediately adjacent to such structures. Mineralization is confined to discrete,
commonly small, shoots separated by barren (gold- and sulfide-poor), typically oxide BIF. Mineralized rocks
are generally less deformed than associated rocks. Iron-sulfide minerals are in many cases relatively
undeformed and unmetamorphosed. Pyrite and/or sheared pyrrhotite have clearly replaced other pre-
existing iron-rich minerals, notably magnetite. Arsenic-bearing minerals are common, but not always
present. If they are present, a strong positive correlation generally exists between gold and arsenic.
Alteration is usually typical of that associated with "mesothermal vein" gold deposits. Mineralization is
relatively silver-poor, and gold grains generally have gold/silver ratios of >8.0. Non-stratiform deposits are
relatively common, typically small and, compared with stratiform deposits, difficult to evaluate and mine.
Non-stratiform deposits contain sulfide-rich alteration zones immediately adjacent to late structures and are
similar to mesothermal vein-type gold deposits. Late quartz veins and/or shear zones are present in most
known BIF-hosted gold deposits. The distributions of gold-bearing veins and sulfide-rich zones are
NI 43-101 Technical Report Feasibility Study Update Hardrock Project, Ontario, Canada
Section 8 January 2021 Page 8-2
commonly controlled by fold structures. Major faults ("breaks") of regional scale have been recognized near
many non-stratiform deposits.
Irregular, massive lenses of sulfides and quartz occur in a folded series of greywacke and iron formation in
the Hard Rock and MacLeod-Cockshutt mines (Horwood and Pye, 1951). These massive replacement
lenses (up to 65%, sulfides) cut the Z-folded iron formation and are related to quartz-carbonate veins up to
0.6 m wide. Veins are usually barren of gold mineralization except where they contain sulfides, consisting
primarily of pyrite, arsenopyrite and pyrrhotite. Mineralization is preferentially concentrated in the wall rocks
outward from the quartz veins and ore is locally banded due to the selective replacement of the less
competent wacke laminae in the iron formation by sulfides.
Examples of this type of deposit at the Hardrock Project include the North Zones, as well as parts of the
F, F2 and Central Zones.
8.1.2 Greenstone-Hosted Quartz-Carbonate Vein Deposits
Greenstone-hosted quartz-carbonate vein deposits occur as quartz and quartz-carbonate veins, with
valuable amounts of gold and silver in faults and shear zones located within deformed terrains of ancient
to recent greenstone belts commonly metamorphosed at greenschist facies (Dubé and Gosselin, 2007).
Greenstone-hosted quartz-carbonate vein deposits are a subtype of lode gold deposits (Poulsen et
al., 2000) (Figure 8.1). They are also known as mesothermal, orogenic. They consist of simple to complex
networks of gold-bearing, laminated quartz-carbonate fault-fill veins in moderately to steeply dipping,
compressional brittle-ductile shear zones and faults, with locally associated extensional veins and
hydrothermal breccias. They can coexist regionally with iron formation-hosted vein and disseminated
deposits, as well as with turbidite-hosted quartz-carbonate vein deposits (Figure 8.2). They are typically
distributed along reverse-oblique crustal-scale major fault zones, commonly marking the convergent
margins between major lithological boundaries such as volcano-plutonic and sedimentary domains. These
major structures are characterized by different increments of strain, and consequently several generations
of steeply dipping foliations and folds resulting in a fairly complex geological collisional setting.
The crustal scale faults are thought to represent the main hydrothermal pathways towards higher crustal
level. However, the deposits are spatially and genetically associated with higher order compressional
reverse-oblique to oblique brittle-ductile high-angle shear zones commonly located less than 5 km away
and best developed in the hanging wall of the major fault (Robert, 1990). Brittle faults may also be the main
host to mineralization as illustrated by the Kirkland Lake Main Break; a brittle structure hosting the 25 Moz
Au Kirkland Lake Deposit.
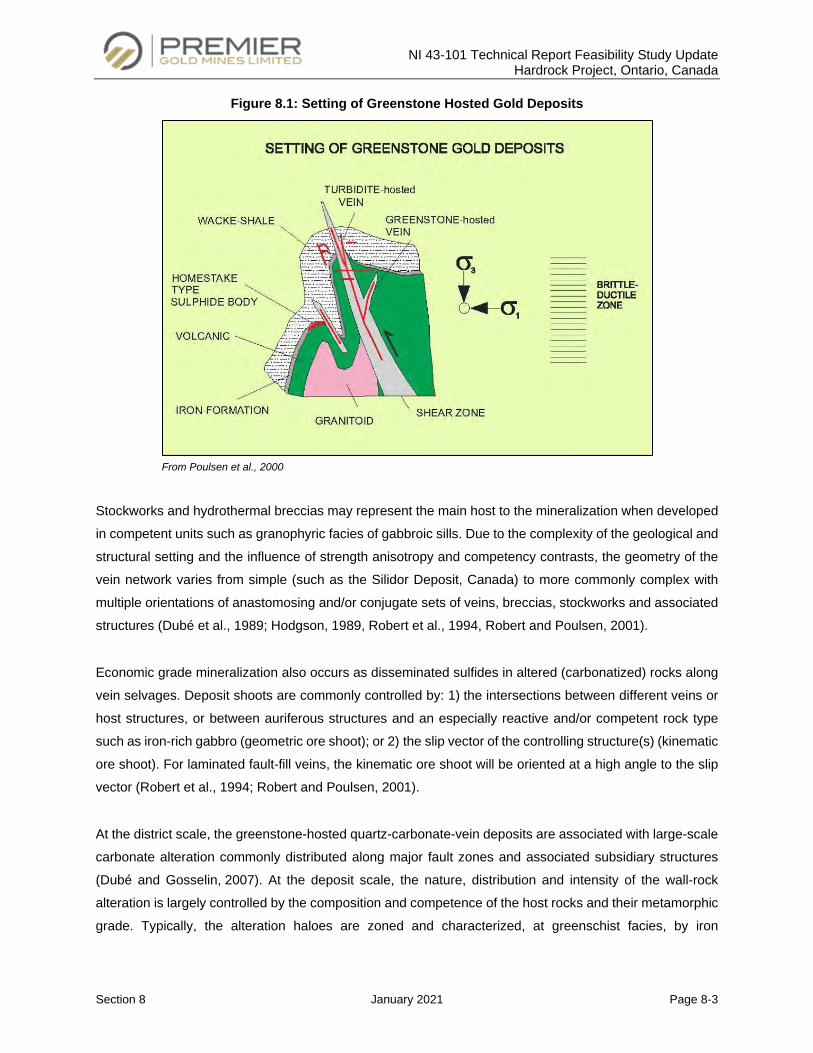
NI 43-101 Technical Report Feasibility Study Update Hardrock Project, Ontario, Canada
Section 8 January 2021 Page 8-3
Figure 8.1: Setting of Greenstone Hosted Gold Deposits
From Poulsen et al., 2000
Stockworks and hydrothermal breccias may represent the main host to the mineralization when developed
in competent units such as granophyric facies of gabbroic sills. Due to the complexity of the geological and
structural setting and the influence of strength anisotropy and competency contrasts, the geometry of the
vein network varies from simple (such as the Silidor Deposit, Canada) to more commonly complex with
multiple orientations of anastomosing and/or conjugate sets of veins, breccias, stockworks and associated
structures (Dubé et al., 1989; Hodgson, 1989, Robert et al., 1994, Robert and Poulsen, 2001).
Economic grade mineralization also occurs as disseminated sulfides in altered (carbonatized) rocks along
vein selvages. Deposit shoots are commonly controlled by: 1) the intersections between different veins or
host structures, or between auriferous structures and an especially reactive and/or competent rock type
such as iron-rich gabbro (geometric ore shoot); or 2) the slip vector of the controlling structure(s) (kinematic
ore shoot). For laminated fault-fill veins, the kinematic ore shoot will be oriented at a high angle to the slip
vector (Robert et al., 1994; Robert and Poulsen, 2001).
At the district scale, the greenstone-hosted quartz-carbonate-vein deposits are associated with large-scale
carbonate alteration commonly distributed along major fault zones and associated subsidiary structures
(Dubé and Gosselin, 2007). At the deposit scale, the nature, distribution and intensity of the wall-rock
alteration is largely controlled by the composition and competence of the host rocks and their metamorphic
grade. Typically, the alteration haloes are zoned and characterized, at greenschist facies, by iron
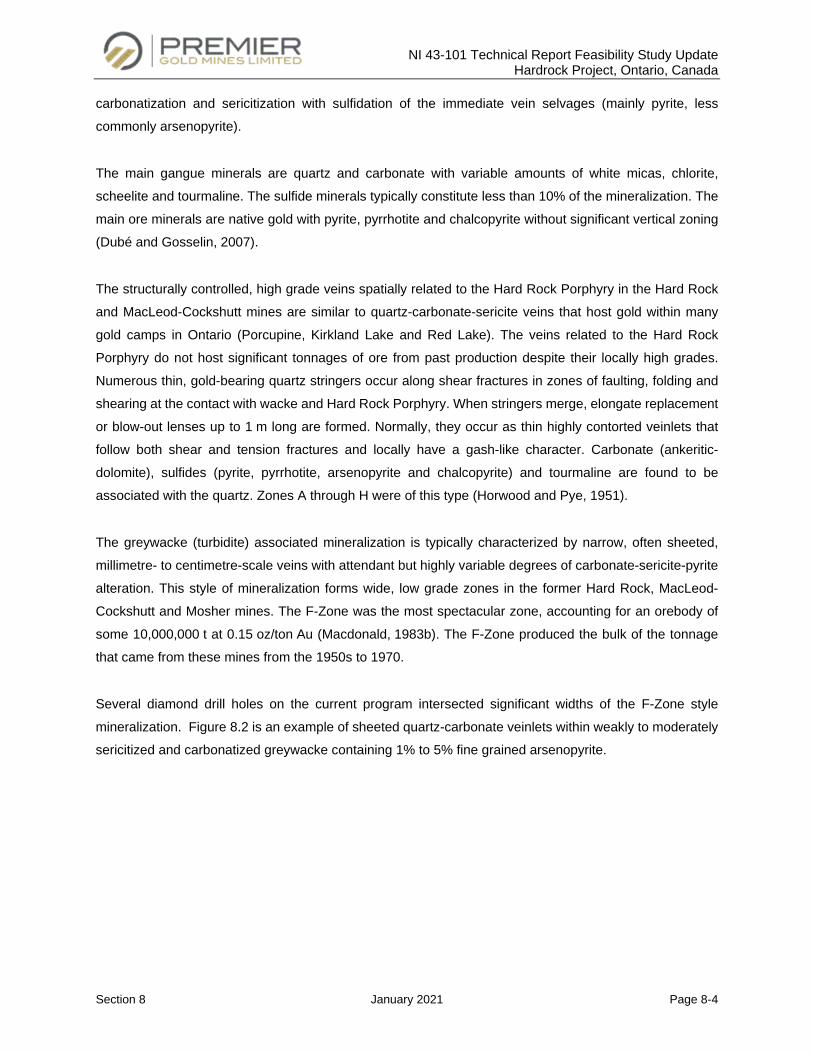
NI 43-101 Technical Report Feasibility Study Update Hardrock Project, Ontario, Canada
Section 8 January 2021 Page 8-4
carbonatization and sericitization with sulfidation of the immediate vein selvages (mainly pyrite, less
commonly arsenopyrite).
The main gangue minerals are quartz and carbonate with variable amounts of white micas, chlorite,
scheelite and tourmaline. The sulfide minerals typically constitute less than 10% of the mineralization. The
main ore minerals are native gold with pyrite, pyrrhotite and chalcopyrite without significant vertical zoning
(Dubé and Gosselin, 2007).
The structurally controlled, high grade veins spatially related to the Hard Rock Porphyry in the Hard Rock
and MacLeod-Cockshutt mines are similar to quartz-carbonate-sericite veins that host gold within many
gold camps in Ontario (Porcupine, Kirkland Lake and Red Lake). The veins related to the Hard Rock
Porphyry do not host significant tonnages of ore from past production despite their locally high grades.
Numerous thin, gold-bearing quartz stringers occur along shear fractures in zones of faulting, folding and
shearing at the contact with wacke and Hard Rock Porphyry. When stringers merge, elongate replacement
or blow-out lenses up to 1 m long are formed. Normally, they occur as thin highly contorted veinlets that
follow both shear and tension fractures and locally have a gash-like character. Carbonate (ankeritic-
dolomite), sulfides (pyrite, pyrrhotite, arsenopyrite and chalcopyrite) and tourmaline are found to be
associated with the quartz. Zones A through H were of this type (Horwood and Pye, 1951).
The greywacke (turbidite) associated mineralization is typically characterized by narrow, often sheeted,
millimetre- to centimetre-scale veins with attendant but highly variable degrees of carbonate-sericite-pyrite
alteration. This style of mineralization forms wide, low grade zones in the former Hard Rock, MacLeod-
Cockshutt and Mosher mines. The F-Zone was the most spectacular zone, accounting for an orebody of
some 10,000,000 t at 0.15 oz/ton Au (Macdonald, 1983b). The F-Zone produced the bulk of the tonnage
that came from these mines from the 1950s to 1970.
Several diamond drill holes on the current program intersected significant widths of the F-Zone style
mineralization. Figure 8.2 is an example of sheeted quartz-carbonate veinlets within weakly to moderately
sericitized and carbonatized greywacke containing 1% to 5% fine grained arsenopyrite.
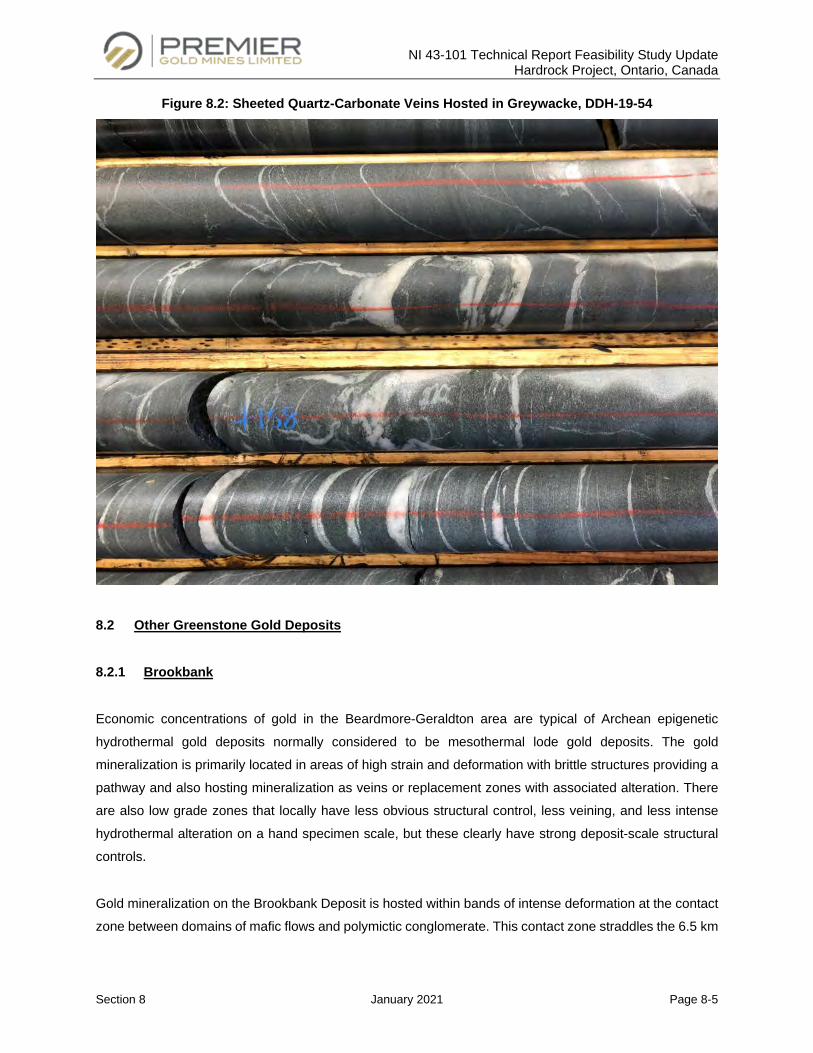
NI 43-101 Technical Report Feasibility Study Update Hardrock Project, Ontario, Canada
Section 8 January 2021 Page 8-5
Figure 8.2: Sheeted Quartz-Carbonate Veins Hosted in Greywacke, DDH-19-54
8.2 Other Greenstone Gold Deposits
8.2.1 Brookbank
Economic concentrations of gold in the Beardmore-Geraldton area are typical of Archean epigenetic
hydrothermal gold deposits normally considered to be mesothermal lode gold deposits. The gold
mineralization is primarily located in areas of high strain and deformation with brittle structures providing a
pathway and also hosting mineralization as veins or replacement zones with associated alteration. There
are also low grade zones that locally have less obvious structural control, less veining, and less intense
hydrothermal alteration on a hand specimen scale, but these clearly have strong deposit-scale structural
controls.
Gold mineralization on the Brookbank Deposit is hosted within bands of intense deformation at the contact
zone between domains of mafic flows and polymictic conglomerate. This contact zone straddles the 6.5 km
NI 43-101 Technical Report Feasibility Study Update Hardrock Project, Ontario, Canada
Section 8 January 2021 Page 8-6
east-west trending Brookbank shear zone. The mineralization occurs within quartz-carbonate
veinlets/stringers, fractures and/or stockworks associated with hydrothermal alteration (Figure 8.3).
Figure 8.3: Exposure of the Brookbank Deposit Quartz Carbonate Veins/Stringers, Fractures/Stockworks
Micon, 2013.
Taking into account the deposit model discussed above, previous and current exploration activities have
been focused on the contact zone between the sedimentary and volcanic assemblages within the confines
of the Brookbank shear zone.
8.2.2 Key Lake
The Key Lake Deposit consists of an altered and mineralized felsic dyke in contact with sericitized and
mineralized arkose. Higher grades appear to plunge to the west, following the plunge of folds in the area.
This is a good example of stockwork quartz-carbonate with disseminated gold style of mineralization.
8.2.3 Kailey
Kailey is located within the area of the former Little Long Lac Gold Mine. The Little Long Lac Deposit occurs
in the large Z-shaped minor fold on the north limb of the Barton syncline. The fold plunges 45 to 55° to the
NI 43-101 Technical Report Feasibility Study Update Hardrock Project, Ontario, Canada
Section 8 January 2021 Page 8-7
west. Numerous smaller flexures are superimposed, some of which are believed to have been formed
during a later period of deformation. The deposit consists of more or less parallel quartz veins and stringers
within fracture zones in massive arkose. For the most part, the sulfides are confined to narrow selvages
and books of altered wall rock along and within the individual veins, although small amounts are commonly
enclosed by the vein quartz itself. The quartz veins have, along their walls, narrow selvages, generally less
than half an inch thick, of highly sheared and sericitized arkose impregnated with small amounts of finely
divided sulfides, consisting mainly of pyrite and arsenopyrite.
In 1935, Bruce proposed three types of gold deposits for the Little Long Lac Gold Mine area:
• Shear zones in sedimentary rocks, along which narrow, but closely spaced quartz veins occur in
parallel planes;
• Irregular veins of quartz accompanied by pyrite, filling fractures in iron formation;
• Zones of pyritization and silicification in both in sedimentary and intrusive rocks.
The most favorable type of sediments for deposits of the first type is the belt of Timiskaming sediments of
massive and thickly-bedded greywacke or arkose that lies between the two northern bands of iron
formation. It is in this belt that the veins of the Little Long Lac mine are located, and ae almost exclusively
hosted within the Arkose.
NI 43-101 Technical Report Feasibility Study Update Hardrock Project, Ontario, Canada
Section 9 January 2021 Page 9-1
AEXPLORATION
9.1 Hardrock Property
The first gold discovery in the area of the Property was made between 1916 and 1918. Since then, the
Hardrock Project has been the subject of extensive exploration by a number of companies. In 1931,
W.W. “Hard Rock” Smith discovered gold-bearing quartz stringers near the location of the Hard Rock
Number One Shaft and Tom Johnson and Robert Wells discovered gold on Magnet Lake, which later
hosted the Bankfield Gold Mine.
In 1934, the period of mine production in the area began with the Little Long Lac Mine, which was the first
successfully producing mine in the area. To the west of the 1931 Hard Rock discovery, F. MacLeod and
A. Cockshutt staked claims and continually explored the area throughout the 1930s and 1940s. By the late
1940s the F-Zone, a low-grade, large-tonnage orebody in greywacke, was identified on both the MacLeod-
Cockshutt and Hard Rock Properties.
Production on the Mosher Long Lac Mine (located west of, and immediately down plunge of the same
mineralized zones exploited in the MacLeod-Cockshutt Mine) began in 1962, then in 1967, the MacLeod-
Cockshutt, Mosher and Hard Rock mines amalgamated and remained in production until 1970. The
consolidated Hard Rock, MacLeod-Cockshutt and Mosher Mines had produced 2,075,074 ounces of gold
at an average grade of approximately 0.14 ounces of gold per ton (~13 Mt @ 4.9 g Au/t) in the period from
1934 to 1970.
In the 1980s, Lac Minerals Ltd. reviewed the remaining underground reserves and conducted ground
geophysical work and diamond drilling to target areas with open-pit potential.
In 1993 and 1994, Asarco conducted various types of drilling to evaluate the potential of the near surface
portion of the F-Zone. Subsequently, Cyprus Canada Inc. signed various agreements with Lac Minerals Ltd
and Roxmark Mines Ltd. to earn an interest in and acquire ground in the area. Cyprus then drilled 25 holes
in 1996 and 1997 to help in better understanding and assessing the open-pit potential on the Property.
In 2007, Premier Gold Mines Limited (“Premier”) began assembling the current property. Results of
1,629 drill holes were included in the 2016 Feasibility Study (“FS”).
In February 2015, Premier and Centerra Gold Inc. formed a definitive 50/50 partnership for development of
the Hardrock property. In July 2015, the joint partnership was named Greenstone Gold Mines GP Inc
(“GGM”).
NI 43-101 Technical Report Feasibility Study Update Hardrock Project, Ontario, Canada
Section 9 January 2021 Page 9-2
In 2016, GGM conducted 34 km of induced polarization (“IP”) surveys over the Little Long Lac, MacLellan,
Magnet, Bankfield and Bankfield West deposits and 23 km of IP over the Hardrock Deposit. This was done
mainly to test the geophysical response and establish a signature for these deposits. Outcrop stripping and
channel sampling were also conducted at the F-Zone, Porphyry Hill, Headframe, Headframe East and
“OPP” exposures. Results of this work are detailed in the 2016 Technical Report.
In 2018, 405 RC holes totaling 19,995 m and 62 blast holes totaling 535 m were drilled to provide further
definition of near surface gold mineralization in 5 different areas on the Property.
A total of 76 RC holes (5,946 m) and 54 diamond drill holes (12,108 m) were drilled on the Hardrock Deposit
in 2019.
9.2 Other Properties
Since Premier started his acquisition on the other projects within the Hardrock Property in 2007, mostly of
the exploration work have been focused on diamond drilling. The details of any historical exploration
program performed before Premier have been summarized in Section 6 - History.
9.2.1 Brookbank
Between 2012 to 2013, two (2) hole drill program was completed on the Brookbank Project by Premier,
totalling 1,393 m. These holes were designed to target IP anomalies near the known gold deposit at
Brookbank.
In 2016, GGM completed 14 diamond drill holes for a total of 6,377.4 m of drilling on the project. In addition,
orientation till and soil surveys were conducted over the Brookbank, Brookbank East and Patter Lake areas,
while limited ground magnetics and outcrop channel sampling was conducted over Brookbank East, along
with selected re-logging/re-sampling of diamond drill holes.
9.2.2 Kailey and Key Lake
2011 exploration activities had a focus on in-fill drilling proximal to the historic Little Long Lac and Brookbank
Gold Mines to delineate previously discovered high-grade zones in the main resource areas estimated by
previous operators. The details of each drilling program completed by Premier and GGM are fully described
in Section 10 - Drilling.

NI 43-101 Technical Report Feasibility Study Update Hardrock Project, Ontario, Canada
Section 9 January 2021 Page 9-3
There has been no new exploration field work conducted on the Brookbank, Key Lake, Kailey or other
satellite properties since the 2016 Feasibility Study. Work during this time has consisted mainly of data
compilation and selected re-logging of diamond drill holes.
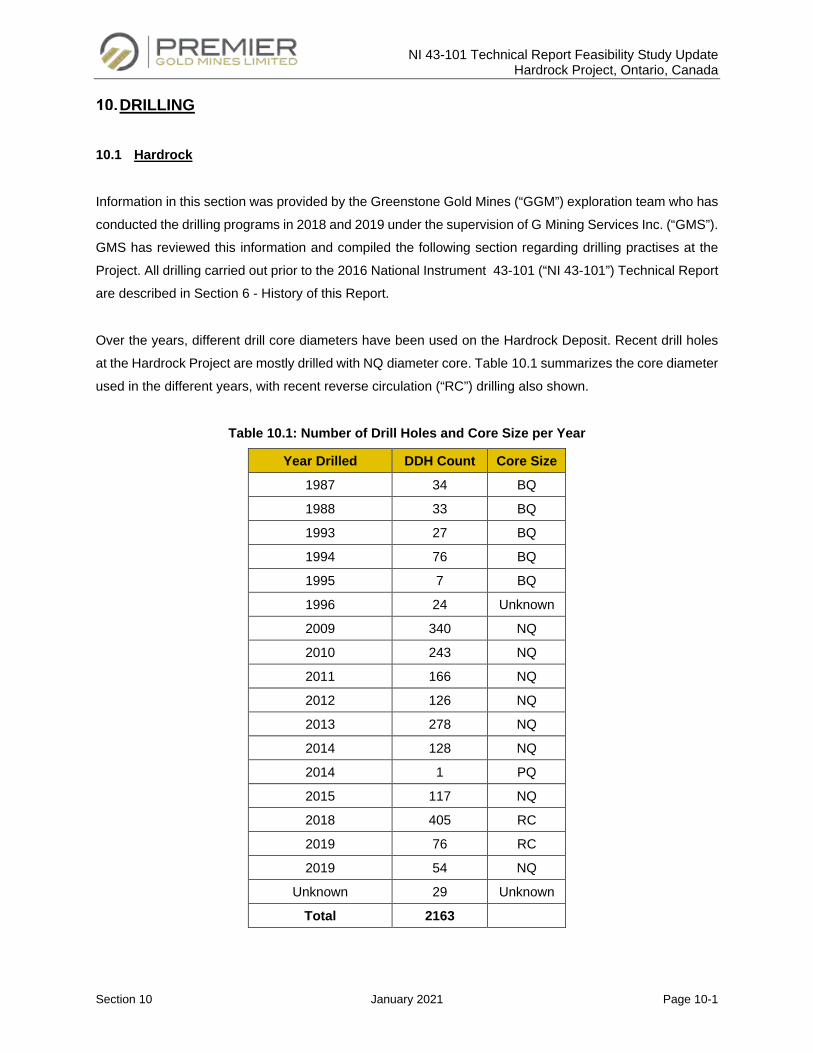
NI 43-101 Technical Report Feasibility Study Update Hardrock Project, Ontario, Canada
Section 10 January 2021 Page 10-1
DRILLING
10.1 Hardrock
Information in this section was provided by the Greenstone Gold Mines (“GGM”) exploration team who has
conducted the drilling programs in 2018 and 2019 under the supervision of G Mining Services Inc. (“GMS”).
GMS has reviewed this information and compiled the following section regarding drilling practises at the
Project. All drilling carried out prior to the 2016 National Instrument 43-101 (“NI 43-101”) Technical Report
are described in Section 6 - History of this Report.
Over the years, different drill core diameters have been used on the Hardrock Deposit. Recent drill holes
at the Hardrock Project are mostly drilled with NQ diameter core. Table 10.1 summarizes the core diameter
used in the different years, with recent reverse circulation (“RC”) drilling also shown.
Table 10.1: Number of Drill Holes and Core Size per Year
Year Drilled DDH Count Core Size
1987 34 BQ
1988 33 BQ
1993 27 BQ
1994 76 BQ
1995 7 BQ
1996 24 Unknown
2009 340 NQ
2010 243 NQ
2011 166 NQ
2012 126 NQ
2013 278 NQ
2014 128 NQ
2014 1 PQ
2015 117 NQ
2018 405 RC
2019 76 RC
2019 54 NQ
Unknown 29 Unknown
Total 2163
NI 43-101 Technical Report Feasibility Study Update Hardrock Project, Ontario, Canada
Section 10 January 2021 Page 10-2
10.1.1 Collar Locations, Orientations and Down Hole Surveys
Collar locations for the drill holes on the Hardrock Project were determined using a cut grid or a hand-held
GPS. Subsequent to completion, the collars were located, depending on the years drilled, using either a
GPS, a Trimble and more recently since 2014 the more precise Trimble RTK survey instrument. A total of
55% of the holes drilled prior to 2013 have been surveyed using a hand-held GPS.
Whenever it was possible, casings were left in the ground after drilling operations. A collar re-survey
campaign, using the Trimble RTK survey instrument, took place in the summer of 2014 for a total of 536 drill
holes for which casing was found. Of these 536 resurveyed collars, 489 were previously surveyed by a
handheld GPS. Following the ranking system described below, the Trimble survey replaced the original
survey improving the precision of the collar location for 30% of the drill holes in the database.
Once the holes were drilled, the drill hole azimuth and precise UTM coordinates were determined by placing
an APS unit on the drill casing. The downhole dip and drill hole orientations were surveyed using a
gyroscope unit (REFLEX Gyro™). The UTM Coordinate System, NAD 83, Zone 16, is used to record the
locations (x, y, and z) of the drill collars.
For the 2018 and 2019 drilling programs, the site surveyor and geologists spotted the reverse circulation
grade control (“RCGC”) and blast holes using a Trimble device with RTK base station using the coordinates
planned by GMS or GGM. In the event of unstable or poor ground access, the hole was moved a few
metres. The drill is aligned to the proper azimuth and dip using a Reflex Astronomic Positioning System
(“APS”). Down-hole surveys were taken every 30 m in the diamond drill holes using a Reflex EZ-GyroTM
instrument.
10.1.2 Core Marking and Logging Procedures
The first time the core is handled is at the drill rig by the driller helper who takes the core from the core tube
and places it in core boxes, marking off every 3 m. Once a core box is full, the helper wraps the box with
tape or wire depending on the preference of the drilling company. At the end of each shift, the core is
delivered to the core shack. GGM personnel remove the wire or tape and bring the boxes to the logging
trailers. The technicians rotate the core so that all the pieces slant one way, at about a 45° angle. They also
check that distances are correctly indicated on the wooden blocks placed every 3 m. If there is a mistake
on any of the blocks, the Project Manager is informed, and the Drill Foreman is brought in. The core is
measured in each box and the box labelled. Red lines are drawn along the centre of the core to provide a
reference for the core cutters. Geological technicians and geologists are then responsible for taking
photographs of the core.
NI 43-101 Technical Report Feasibility Study Update Hardrock Project, Ontario, Canada
Section 10 January 2021 Page 10-3
Rock quality designation (“RQD”) is done by either geologists or the geological technicians. Any breakage
under 10 cm is recorded. Core from the Hardrock Deposit is of very good quality and recovery is high.
Logging of diamond drill core was performed on site by geologists contracted to GGM. Logging was typically
recorded by hand onto paper or a notebook and then transcribed later into LogChief software. Geologists
note intervals of varying lithology, accessory minerals, the type and style of any veins (e.g. quartz-carbonate
veins), the type and habit of sulphide mineralization (pyrite, arsenopyrite, pyrrhotite) and whether the unit
appears folded and relevant structural measurements (e.g. bedding, foliation, fracture or vein orientation,
fold axes). Visible gold (“VG”) is also noted, if present.
Samples were generally taken along the entire length of the holes (continuous sampling) and are entered
in the related Datashed software. Sample length typically ranged from 0.5 m to 1.5 m. In clearly mineralized
zones where visible gold is present, the geologist will place a piece of colored ribbon in the core box. The
core cutters, upon seeing this, will cut a piece of brick after the sample, in order to clean any residual gold
from the saw. Cutting was accomplished with two Vancon core saws. Cuttings are allowed to decant in a
series of settling tanks and the water is recirculated back to the cutting area. These tanks are cleaned
periodically to avoid contamination. The individual cut samples were placed into polyethylene bags, along
with the sample tag and sealed. Samples were then placed into rice bags (approximately 8 to 10 samples
per bag) and taken Activation Laboratories Ltd. (“Actlabs Geraldton”) facility in Geraldton.
10.1.2.1 RC Chip Logging Procedures
During sampling of the RCGC drill holes, approximately 100 g of the 10 kg representative samples, were
collected and put into wet and dry chip trays (50 g in each) for the geologists to log. The dry samples were
placed directly into the tray. An equal amount was sieved and cleaned and placed into the wet tray. The
wet samples were subsequently logged by geologists using a SciOptic fiber optic microscope. Information
on lithology, alteration and mineralization was recorded in DataShed by the onsite geologists.
The off-site storage of core, RCGC duplicate samples, assay pulps and rejects are located at the Magnet
Mine Site.
10.1.3 Drilling and Re-sampling Included in the 2016 Mineral Resource Estimate
Between May 26, 2014 and November 18, 2015, GGM added 157 diamond drill holes (“DDH”) on the
Hardrock Deposit for a total of 54,027 m. One diamond drill hole (MM043) included in the 2014 Mineral
Resource Estimate (“MRE”) was also deepened, from 456 m to 655 m, representing a total of 199 m of new
meterage.

NI 43-101 Technical Report Feasibility Study Update Hardrock Project, Ontario, Canada
Section 10 January 2021 Page 10-4
Seventy-nine (79) historical DDH were re-sampled to add new assay results in the 2016 MRE. These holes
represent a total of 8,733 m and 6,411 samples included in the 2016 Project database.
Figure 10.1 shows the locations of the drill holes included in the 2016 MRE. The new drill holes (red), the
re-sampled DDH (blue) and extended drill hole (yellow) that are included in the 2016 MRE are presented
in Figure 10.1.
Figure 10.2 shows the locations of the condemnation drill holes drilled in the area of the Hardrock Deposit.
A total of 55 condemnation DDH totalling 8,512 m were drilled by GGM.
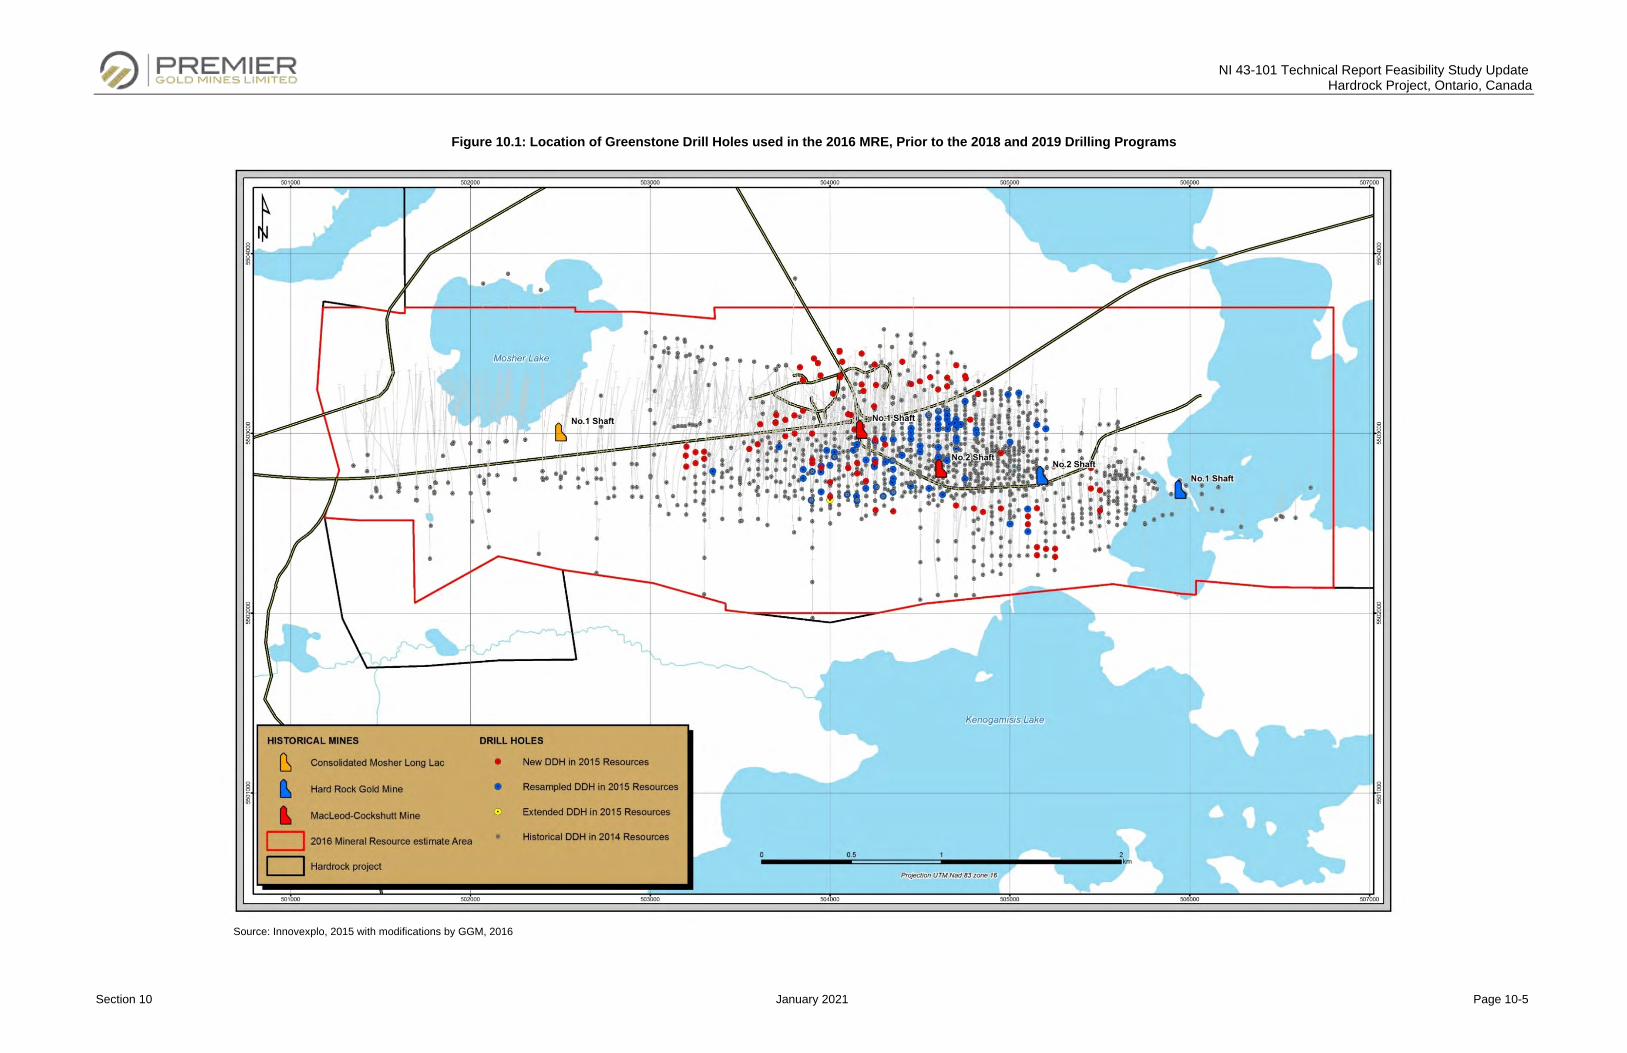
NI 43-101 Technical Report Feasibility Study Update
Hardrock Project, Ontario, Canada
Section 10 January 2021 Page 10-5
Figure 10.1: Location of Greenstone Drill Holes used in the 2016 MRE, Prior to the 2018 and 2019 Drilling Programs
Source: Innovexplo, 2015 with modifications by GGM, 2016
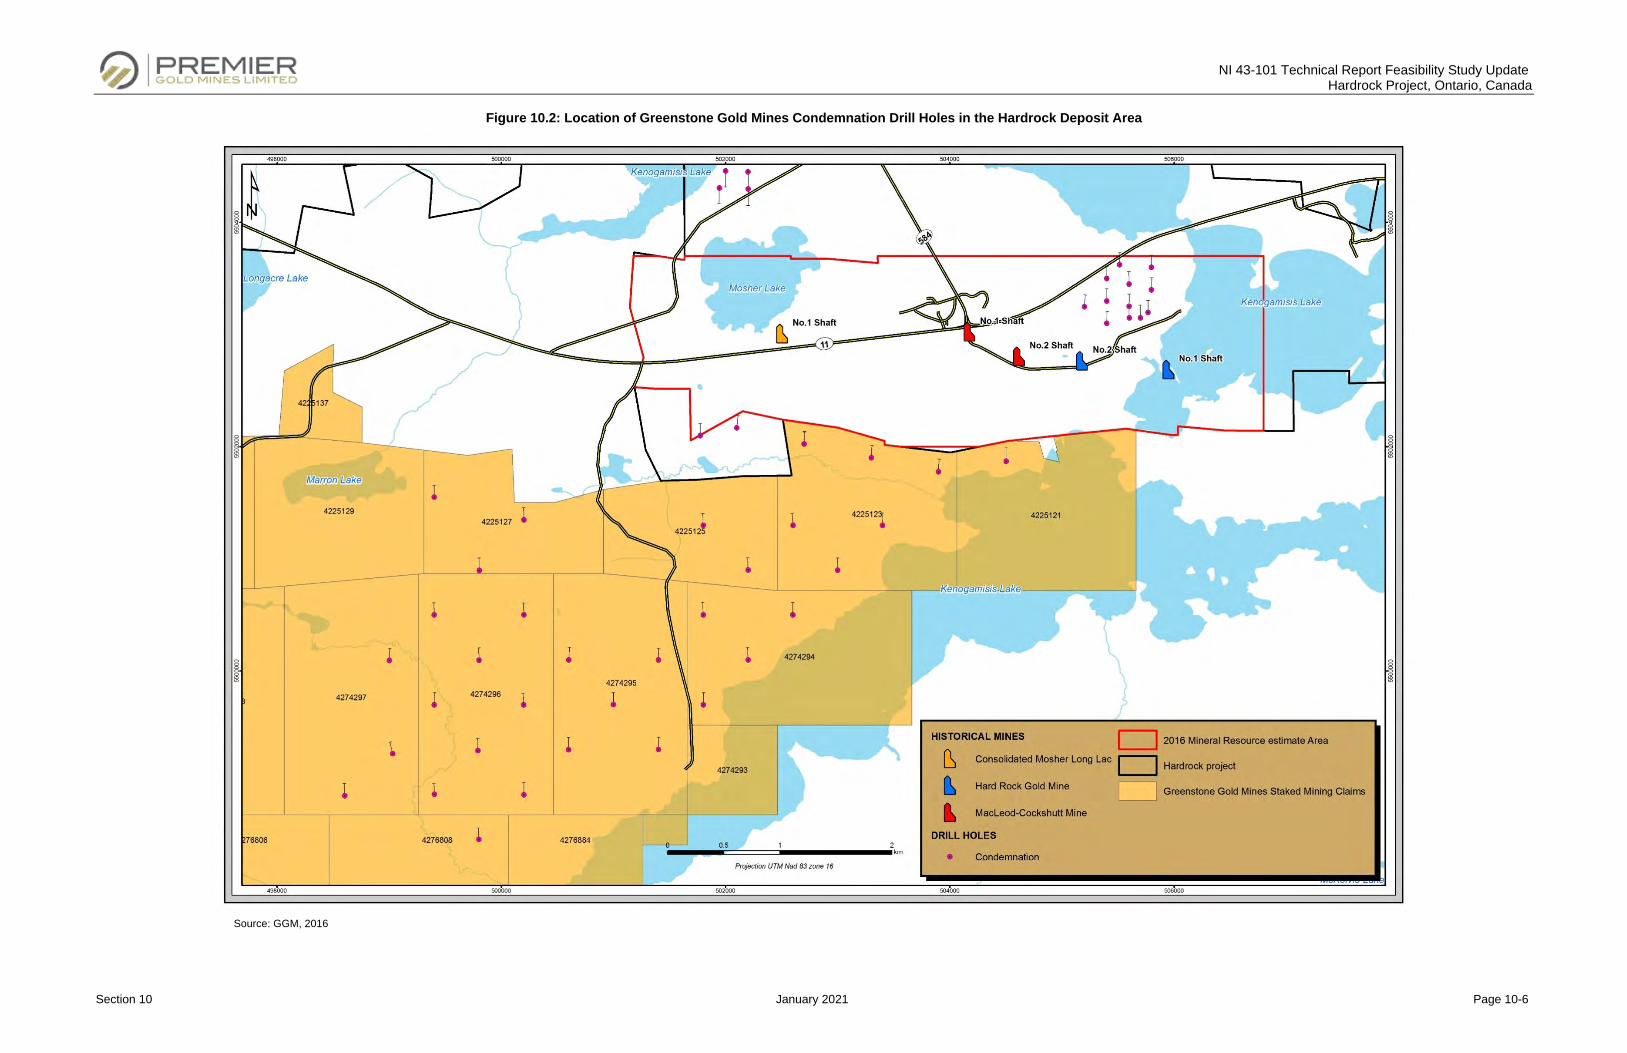
NI 43-101 Technical Report Feasibility Study Update
Hardrock Project, Ontario, Canada
Section 10 January 2021 Page 10-6
Figure 10.2: Location of Greenstone Gold Mines Condemnation Drill Holes in the Hardrock Deposit Area
Source: GGM, 2016
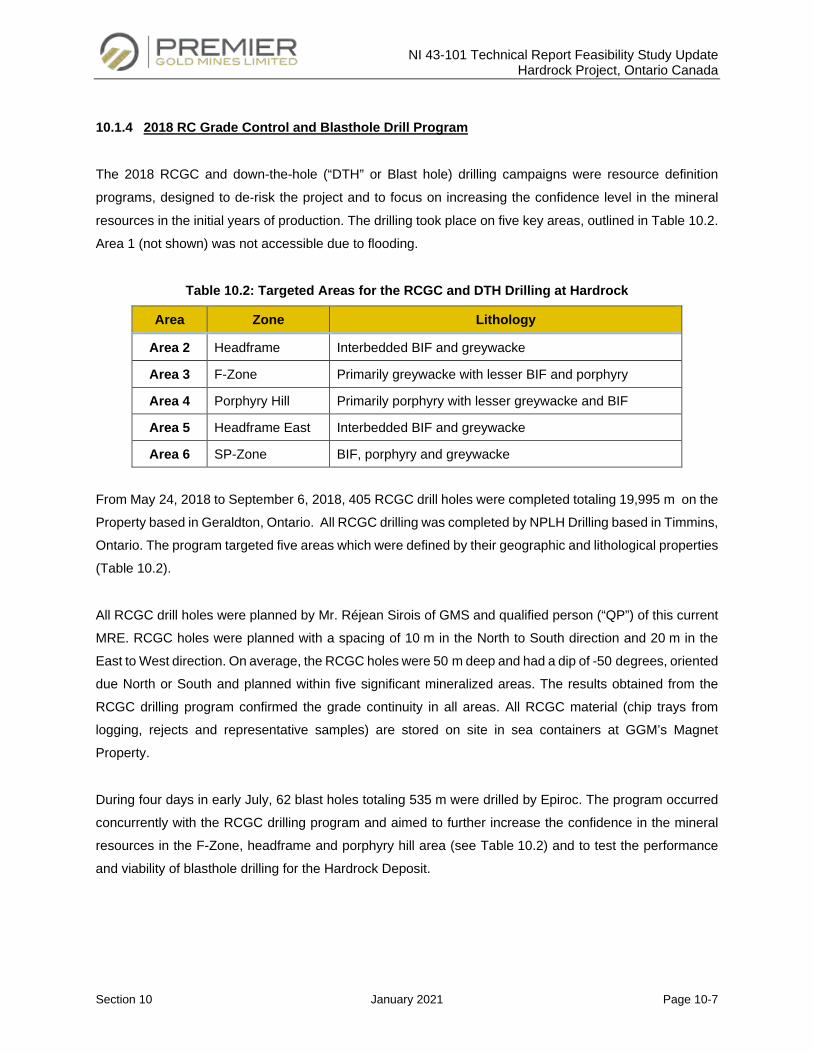
NI 43-101 Technical Report Feasibility Study Update Hardrock Project, Ontario Canada
Section 10 January 2021 Page 10-7
10.1.4 2018 RC Grade Control and Blasthole Drill Program
The 2018 RCGC and down-the-hole (“DTH” or Blast hole) drilling campaigns were resource definition
programs, designed to de‐risk the project and to focus on increasing the confidence level in the mineral
resources in the initial years of production. The drilling took place on five key areas, outlined in Table 10.2.
Area 1 (not shown) was not accessible due to flooding.
Table 10.2: Targeted Areas for the RCGC and DTH Drilling at Hardrock
Area Zone Lithology
Area 2 Headframe Interbedded BIF and greywacke
Area 3 F-Zone Primarily greywacke with lesser BIF and porphyry
Area 4 Porphyry Hill Primarily porphyry with lesser greywacke and BIF
Area 5 Headframe East Interbedded BIF and greywacke
Area 6 SP-Zone BIF, porphyry and greywacke
From May 24, 2018 to September 6, 2018, 405 RCGC drill holes were completed totaling 19,995 m on the
Property based in Geraldton, Ontario. All RCGC drilling was completed by NPLH Drilling based in Timmins,
Ontario. The program targeted five areas which were defined by their geographic and lithological properties
(Table 10.2).
All RCGC drill holes were planned by Mr. Réjean Sirois of GMS and qualified person (“QP”) of this current
MRE. RCGC holes were planned with a spacing of 10 m in the North to South direction and 20 m in the
East to West direction. On average, the RCGC holes were 50 m deep and had a dip of -50 degrees, oriented
due North or South and planned within five significant mineralized areas. The results obtained from the
RCGC drilling program confirmed the grade continuity in all areas. All RCGC material (chip trays from
logging, rejects and representative samples) are stored on site in sea containers at GGM’s Magnet
Property.
During four days in early July, 62 blast holes totaling 535 m were drilled by Epiroc. The program occurred
concurrently with the RCGC drilling program and aimed to further increase the confidence in the mineral
resources in the F-Zone, headframe and porphyry hill area (see Table 10.2) and to test the performance
and viability of blasthole drilling for the Hardrock Deposit.
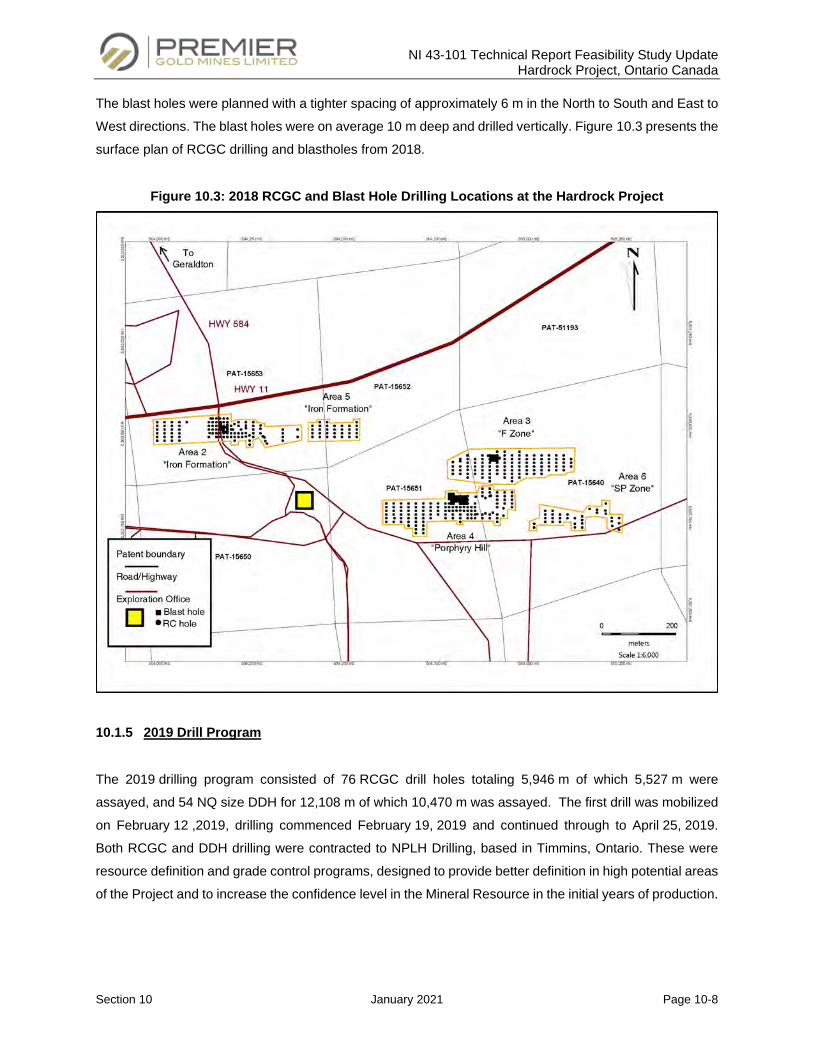
NI 43-101 Technical Report Feasibility Study Update Hardrock Project, Ontario Canada
Section 10 January 2021 Page 10-8
The blast holes were planned with a tighter spacing of approximately 6 m in the North to South and East to
West directions. The blast holes were on average 10 m deep and drilled vertically. Figure 10.3 presents the
surface plan of RCGC drilling and blastholes from 2018.
Figure 10.3: 2018 RCGC and Blast Hole Drilling Locations at the Hardrock Project
10.1.5 2019 Drill Program
The 2019 drilling program consisted of 76 RCGC drill holes totaling 5,946 m of which 5,527 m were
assayed, and 54 NQ size DDH for 12,108 m of which 10,470 m was assayed. The first drill was mobilized
on February 12 ,2019, drilling commenced February 19, 2019 and continued through to April 25, 2019.
Both RCGC and DDH drilling were contracted to NPLH Drilling, based in Timmins, Ontario. These were
resource definition and grade control programs, designed to provide better definition in high potential areas
of the Project and to increase the confidence level in the Mineral Resource in the initial years of production.
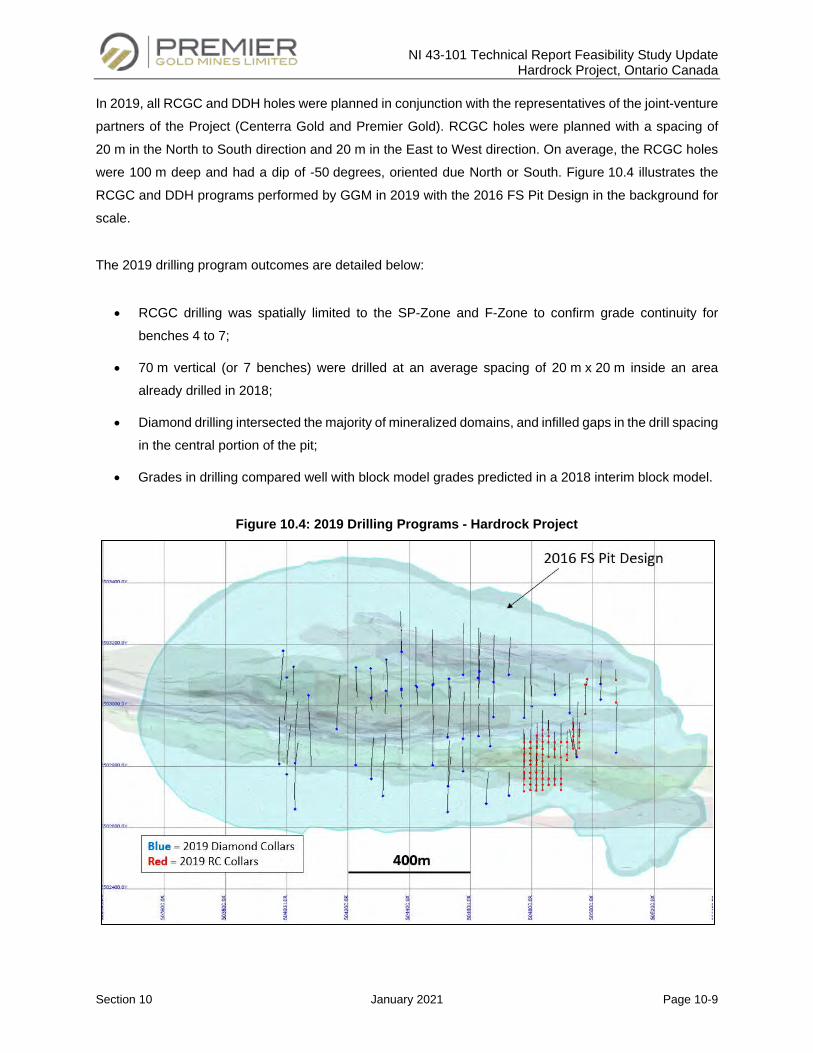
NI 43-101 Technical Report Feasibility Study Update Hardrock Project, Ontario Canada
Section 10 January 2021 Page 10-9
In 2019, all RCGC and DDH holes were planned in conjunction with the representatives of the joint-venture
partners of the Project (Centerra Gold and Premier Gold). RCGC holes were planned with a spacing of
20 m in the North to South direction and 20 m in the East to West direction. On average, the RCGC holes
were 100 m deep and had a dip of -50 degrees, oriented due North or South. Figure 10.4 illustrates the
RCGC and DDH programs performed by GGM in 2019 with the 2016 FS Pit Design in the background for
scale.
The 2019 drilling program outcomes are detailed below:
• RCGC drilling was spatially limited to the SP-Zone and F-Zone to confirm grade continuity for
benches 4 to 7;
• 70 m vertical (or 7 benches) were drilled at an average spacing of 20 m x 20 m inside an area
already drilled in 2018;
• Diamond drilling intersected the majority of mineralized domains, and infilled gaps in the drill spacing
in the central portion of the pit;
• Grades in drilling compared well with block model grades predicted in a 2018 interim block model.
Figure 10.4: 2019 Drilling Programs - Hardrock Project

NI 43-101 Technical Report Feasibility Study Update Hardrock Project, Ontario Canada
Section 10 January 2021 Page 10-10
Figure 10.5 and Figure 10.6 show both drill rigs used to carry out the resource definition drilling campaigns
in 2019.
Figure 10.5: Hardab 7000 Maxidrill RC Drill Rig
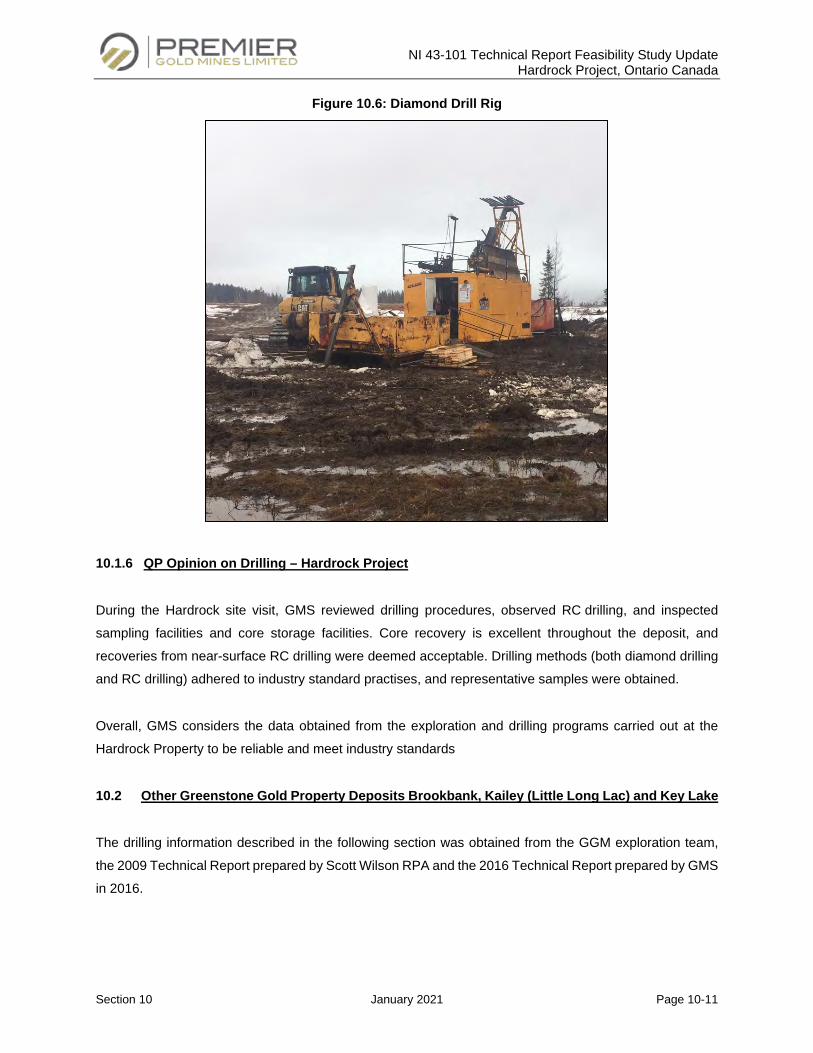
NI 43-101 Technical Report Feasibility Study Update Hardrock Project, Ontario Canada
Section 10 January 2021 Page 10-11
Figure 10.6: Diamond Drill Rig
10.1.6 QP Opinion on Drilling – Hardrock Project
During the Hardrock site visit, GMS reviewed drilling procedures, observed RC drilling, and inspected
sampling facilities and core storage facilities. Core recovery is excellent throughout the deposit, and
recoveries from near-surface RC drilling were deemed acceptable. Drilling methods (both diamond drilling
and RC drilling) adhered to industry standard practises, and representative samples were obtained.
Overall, GMS considers the data obtained from the exploration and drilling programs carried out at the
Hardrock Property to be reliable and meet industry standards
10.2 Other Greenstone Gold Property Deposits Brookbank, Kailey (Little Long Lac) and Key Lake
The drilling information described in the following section was obtained from the GGM exploration team,
the 2009 Technical Report prepared by Scott Wilson RPA and the 2016 Technical Report prepared by GMS
in 2016.
NI 43-101 Technical Report Feasibility Study Update Hardrock Project, Ontario Canada
Section 10 January 2021 Page 10-12
10.2.1 Drilling Procedures
All Ontex diamond drilling was completed from surface using NQ wire-line stabilized hexagonal core barrels
with an 18 in. long shell. For deep holes hexagonal core barrels are first utilized. Wedge cuts were
completed on parent holes. Hole collars are well marked with casings generally left in the hole. Core
diameter was usually NQ.
Diamond drilling for 2008 was contracted to Chibougamau Diamond Drilling (“Chibougamau Drilling”) based
in Chibougamau, Québec and Major Drilling out of New Brunswick. The drill rigs were mounted on skids
and dragged into position using a skidder or bulldozer
During the 2016 Brookbank drilling program, one (1) hole was drilled by Confederation College and the
other 13 holes by ForageG4 drilling. Drill holes were surveyed approximately every 10 m using a
TN14 instrument for single shot surveys and an EZ-Gyro for multishot surveys.
Core diameter for Premier Gold Mines Limited (“Premier”) drilling is NQ size (48 mm in diameter) and all
drilling was recorded in metres. The core was placed in three-row wooden core boxes provided by the
contractor. The boxes and distance (in metres) were labelled by the drill crews. Upon receipt at the Premier
core shack, the boxes were then labelled with permanent metal tags according to drill hole number, box
number, and metres down-hole. After the core was logged and sampled, it was permanently stored in core
racks at the Magnet mine site or at a site constructed in 2009 on Old Arena Road near the Premier core
shack in Geraldton.
10.2.2 Collar Locations, Orientations and Down Hole Surveys
Collar locations for the Ontex drilling for the Brookbank Property were located using a hand-held GPS
(“Garmin Etrex GPS”). Holes were later resurveyed by a professional land surveyor using differential GPS.
At Brookbank, a large collar resurveying campaign was undertaken in 2008 by JDB using a differential
GPS. The objective was to resurvey drill holes in NAD83 as previous drill collars were surveyed in local
coordinates. A total of 157 drill collars were found and resurveyed. The remaining 150 drill holes were
converted from local grid to NAD83 using the prior surveys to control the grid transformation.
Collar locations for the Premier drilling were located using a cut grid or by using a hand-held GPS.
Subsequent to completion, most collars were located using a Trimble GPS survey instrument. Some hole
locations are only recorded to the nearest metre, even though more accurate measurements were possible.
NI 43-101 Technical Report Feasibility Study Update Hardrock Project, Ontario Canada
Section 10 January 2021 Page 10-13
In 2007, a Reflex Instruments down-hole survey tool provided by the drill contractor was used with surveys
typically taken every 50 m. A Reflex Instruments Maxibore tool was also used for down-hole surveys
starting in November 2007 as standard practice even though azimuth readings were still an issue. This
survey tool was operated by Premier employees and has been used for approximately 95% of the holes
since it became available. In May-June 2010, Premier changed to an Icefields Gyro survey tool to achieve
more efficient and more accurate survey data. In late 2009 and again in October 2010, a survey determined
drill hole orientations using a gyroscope at surface on casings for 79 historic holes and 310 holes drilled by
Premier.
10.2.3 Core Logging and Sampling
The geologist prepared a detailed geological log including lithology, veining, alteration, mineralization,
structures (oriented core), surveying, assays (gold and trace elements) and magnetic susceptibility.
Magnetic susceptibility was collected every meter downhole using the MPP susceptibility meter from
GDD Instruments based out of Quebec City.
The drillers provided the “ori-marks” and core was then oriented by geotechnicians and geologists at the
logging site to obtain alpha and beta measurements and ultimately strike and dip of geological structures.
Although core recovery for the program was very good, the high fracture zones (“HFZs”) encountered in
every hole meant that only approximately 60% of the core could be oriented.
The geologist then identified and marked the beginning and the end of the sampling intervals. Upon
completion of the logging and demarcating the sample intervals, technicians sawed the core longitudinally
in half with a diamond saw, except for material which was highly fractured and contained clay minerals,
which was divided manually with hammer and chisel. One half of the core was bagged, tagged with a
sample number and then sealed; the other half was put back in the core boxes and kept as a reference and
check sample in the event that duplicate assays are required. Generally, samples of 1 m length were taken
in longer sections of similarly mineralized rocks; however, sample size was reduced to as low as 0.4 m
in areas of particular interest, or where lithology and mineralization were distinct.
Premier re-sampled and analyzed the holes drilled by their predecessor as part of their validation of
previous work.
NI 43-101 Technical Report Feasibility Study Update Hardrock Project, Ontario Canada
Section 10 January 2021 Page 10-14
10.2.4 Brookbank
10.2.4.1 Summary of Drilling Campaigns
Since the mid-1940s, numerous drill programs have been carried-out on the Brookbank, Cherbourg, and
Foxear areas. The details of all historical drilling programs performed before Premier have been
summarized in Section 6 - History of this Report.
During 2016, the Brookbank Deposit was operated by the GGM. and Premier joint venture.
Two drilling programs were completed on the Brookbank Property between July 17th and
December 16th, 2016; the Brookbank Deposit infill program and Brookbank East exploration drilling
program. In total, 14 holes (1 abandoned, therefore 13 exploration holes) were drilled during the two drilling
programs (Figure 10.7).
Between October 24th, 2016 and December 4th, 2016, the infill program consisted of six holes which
targeted the Brookbank Mineral Resource area. The program was designed to increase confidence in the
resource and to test the interpretation of the geological model. Results obtained from the drilling program
were encouraging, increasing confidence in the high-grade portion of the resource and defined targets at
depth.
Exploration drilling at Brookbank East, approximately 1 km east of the second exploration program, was
performed between November 8th to December 16th, 2016. The purpose of the program was to test the
intersection of the main mineralized iron-carbonate shear zone and many oblique structures observed at
outcrop and interpreted from the detailed magnetics surveys.
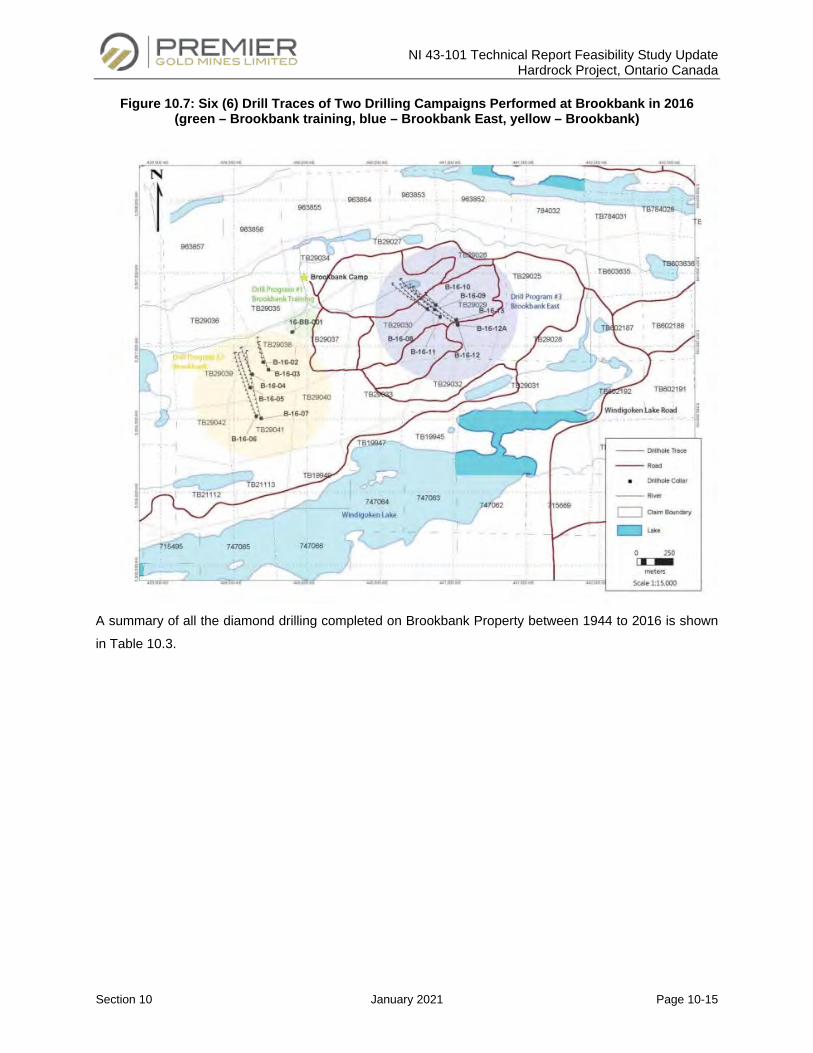
NI 43-101 Technical Report Feasibility Study Update Hardrock Project, Ontario Canada
Section 10 January 2021 Page 10-15
Figure 10.7: Six (6) Drill Traces of Two Drilling Campaigns Performed at Brookbank in 2016 (green – Brookbank training, blue – Brookbank East, yellow – Brookbank)
A summary of all the diamond drilling completed on Brookbank Property between 1944 to 2016 is shown
in Table 10.3.
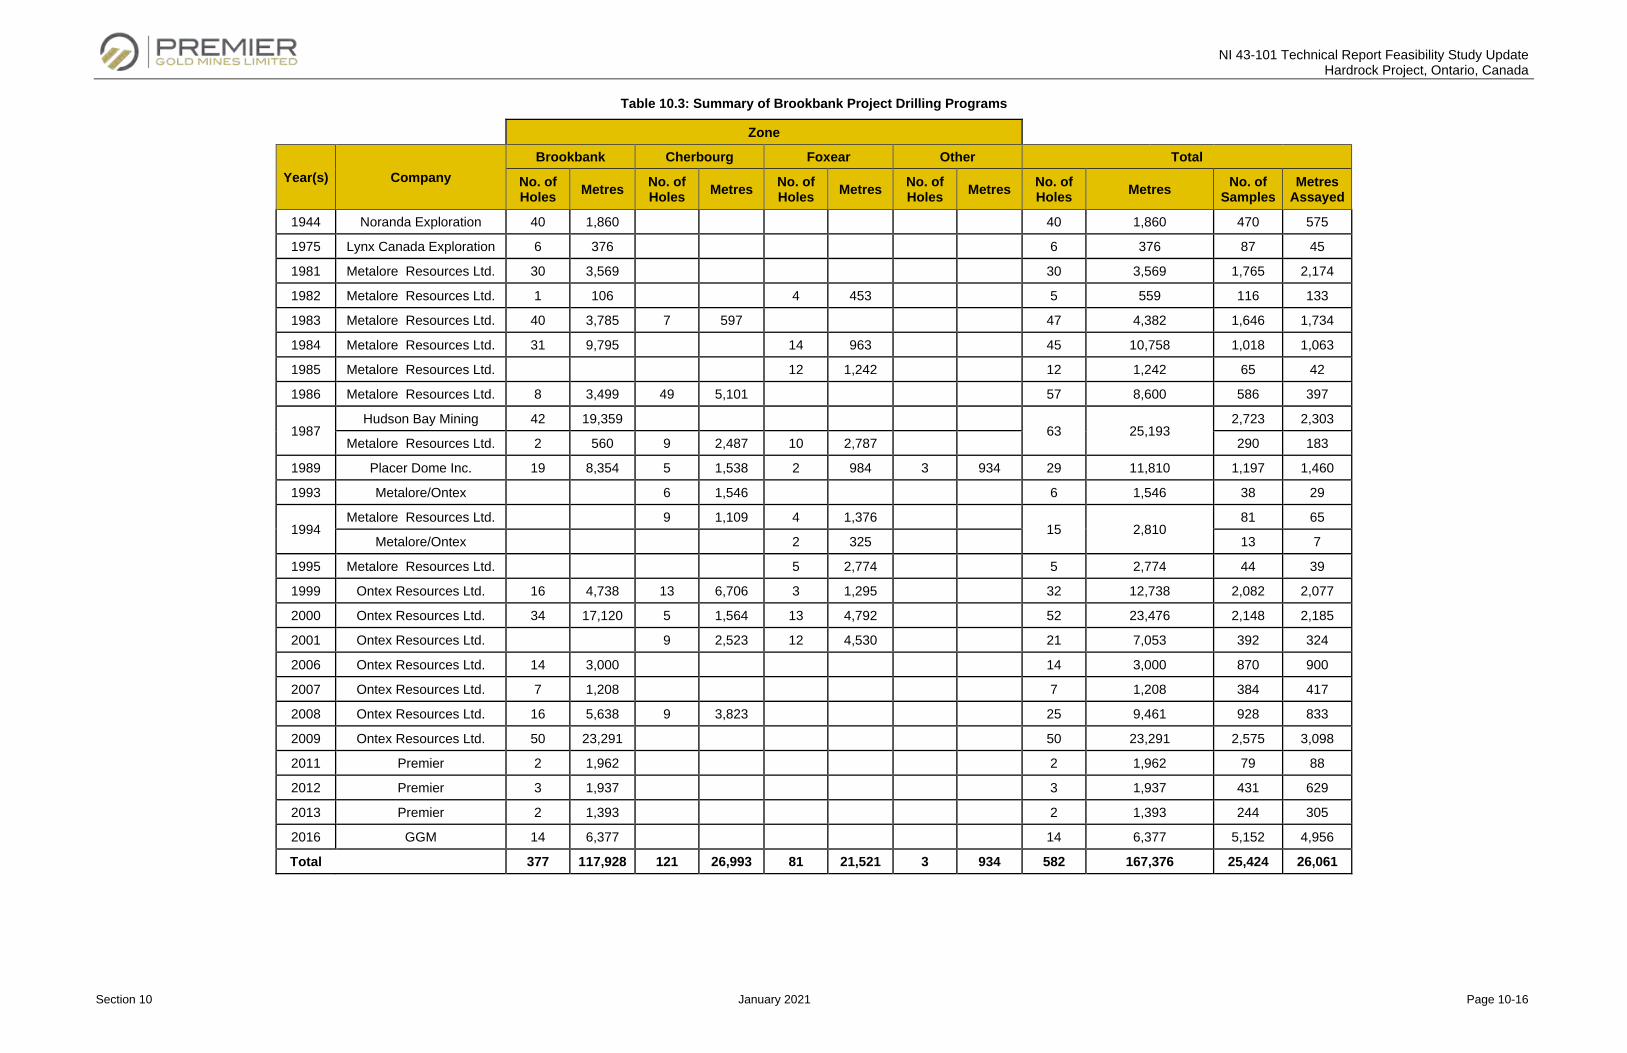
NI 43-101 Technical Report Feasibility Study Update Hardrock Project, Ontario, Canada
Section 10 January 2021 Page 10-16
Table 10.3: Summary of Brookbank Project Drilling Programs
Zone
Year(s) Company Brookbank Cherbourg Foxear Other Total
No. of Holes Metres No. of
Holes Metres No. of Holes Metres No. of
Holes Metres No. of Holes Metres No. of
Samples Metres
Assayed
1944 Noranda Exploration 40 1,860 40 1,860 470 575
1975 Lynx Canada Exploration 6 376 6 376 87 45
1981 Metalore Resources Ltd. 30 3,569 30 3,569 1,765 2,174
1982 Metalore Resources Ltd. 1 106 4 453 5 559 116 133
1983 Metalore Resources Ltd. 40 3,785 7 597 47 4,382 1,646 1,734
1984 Metalore Resources Ltd. 31 9,795 14 963 45 10,758 1,018 1,063
1985 Metalore Resources Ltd. 12 1,242 12 1,242 65 42
1986 Metalore Resources Ltd. 8 3,499 49 5,101 57 8,600 586 397
1987 Hudson Bay Mining 42 19,359
63 25,193 2,723 2,303
Metalore Resources Ltd. 2 560 9 2,487 10 2,787 290 183
1989 Placer Dome Inc. 19 8,354 5 1,538 2 984 3 934 29 11,810 1,197 1,460
1993 Metalore/Ontex 6 1,546 6 1,546 38 29
1994 Metalore Resources Ltd. 9 1,109 4 1,376
15 2,810 81 65
Metalore/Ontex 2 325 13 7
1995 Metalore Resources Ltd. 5 2,774 5 2,774 44 39
1999 Ontex Resources Ltd. 16 4,738 13 6,706 3 1,295 32 12,738 2,082 2,077
2000 Ontex Resources Ltd. 34 17,120 5 1,564 13 4,792 52 23,476 2,148 2,185
2001 Ontex Resources Ltd. 9 2,523 12 4,530 21 7,053 392 324
2006 Ontex Resources Ltd. 14 3,000 14 3,000 870 900
2007 Ontex Resources Ltd. 7 1,208 7 1,208 384 417
2008 Ontex Resources Ltd. 16 5,638 9 3,823 25 9,461 928 833
2009 Ontex Resources Ltd. 50 23,291 50 23,291 2,575 3,098
2011 Premier 2 1,962 2 1,962 79 88
2012 Premier 3 1,937 3 1,937 431 629
2013 Premier 2 1,393 2 1,393 244 305
2016 GGM 14 6,377 14 6,377 5,152 4,956
Total 377 117,928 121 26,993 81 21,521 3 934 582 167,376 25,424 26,061
NI 43-101 Technical Report Feasibility Study Update Hardrock Project, Ontario, Canada
Section 10 January 2021 Page 10-17
10.2.5 Kailey (“Little Long Lac”)
The description of drilling method, surveying, and core logging procedures described in the previous
sections are also applicable to the Kailey Deposit. A significant amount of historical information was
available and digitised from hard copy records by GGM in 2019 and 2020, although none of this was
verifiable and was not incorporated into the mineral resource estimate. On the more recent drilling
undertaken by Premier is considered as verifiable.
10.2.5.1 Drilling Campaigns
In late 2007, Premier focused their drilling program in the area around the historic Little Long Lac mine.
Eight holes were drilled approximately 200 m southeast of the old mine headframe. All the holes were
orientated N334 and they had as target the undeveloped vein no.9. During the mine was in production, this
mineralized structure was mined-out on levels 2nd, 4th and 16th. The vein is sub-vertical in about 50 m in
strike length, and steeply dips to the west-southwest at around 60 degrees. Six of the eight drilled holes
intercepted the structure returning anomalous gold values. The initial program also enabled to discover
three additional parallel zones to south of the structure vein No.9 which were called veins No.10, No.11 and
No.12.
Premier continued the drilling programs on the Little Long Lac Property area during 2008. The exploration
was concentrated between two zones, the first target aimed to define mineralization on veins No.9, No.10
and No.11. the second was focused on the newly- discovered Kailey Zone. The extensions of the
mineralized veins No.9 and No.10 were expanded down plunge and in-filled area was increased by the
drilling.
The Kailey Zone is a low-grade bulk tonnage target proximal and parallel to the historic Little Long Lac Gold
Mine workings. Drilling in the Kailey Zone has identified an area of mineralization characterized by a
network of randomly oriented quartz-carbonate veins and stringers with traces of disseminated pyrite and
arsenopyrite and visible gold, hosted in an altered arkose (sericite + lesser carbonate).The Kailey Zone has
two parallel horizons (K1 - North and K2 - South) which converge in the central and eastern sections.
In 2011 exploration had a focus on in-fill and step-out drilling proximal to the main resource areas. The
high-grade past producing Little Long Lac. The latest drilling programs has demonstrated that the Kailey
mineralized zone is a shallow and low-grade potential open pit mineral resource.
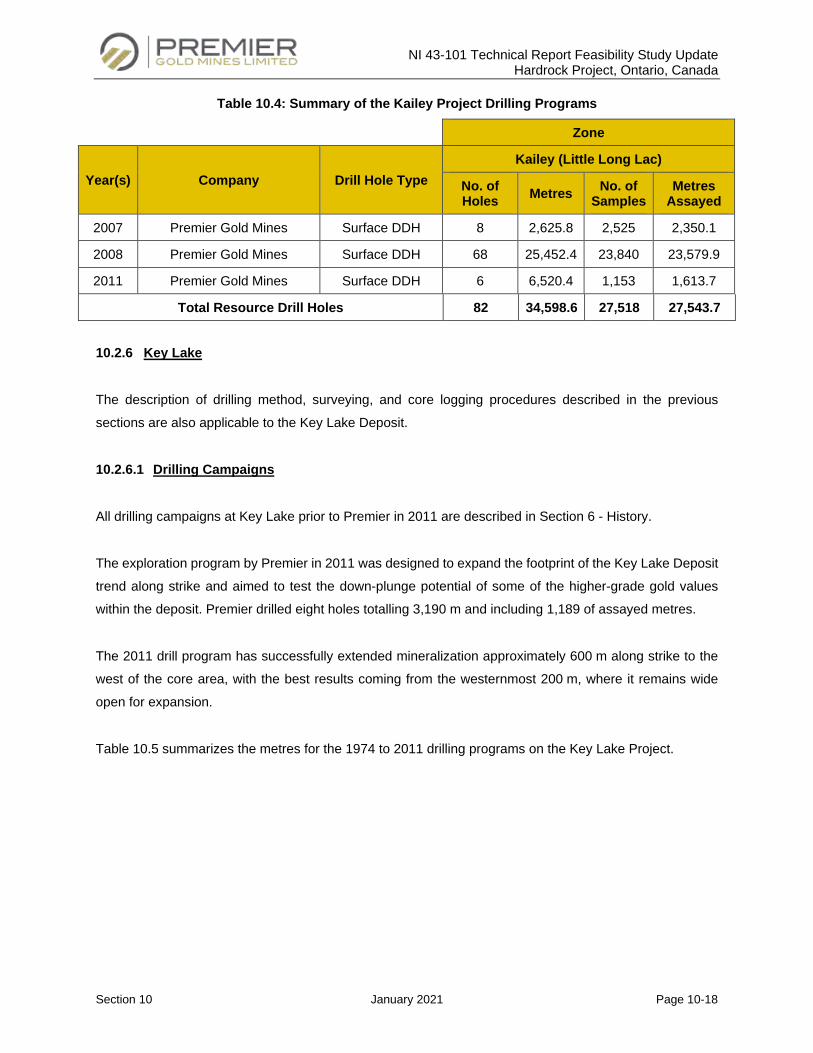
NI 43-101 Technical Report Feasibility Study Update Hardrock Project, Ontario, Canada
Section 10 January 2021 Page 10-18
Table 10.4: Summary of the Kailey Project Drilling Programs
Zone
Year(s) Company Drill Hole Type Kailey (Little Long Lac)
No. of Holes Metres No. of
Samples Metres
Assayed
2007 Premier Gold Mines Surface DDH 8 2,625.8 2,525 2,350.1
2008 Premier Gold Mines Surface DDH 68 25,452.4 23,840 23,579.9
2011 Premier Gold Mines Surface DDH 6 6,520.4 1,153 1,613.7
Total Resource Drill Holes 82 34,598.6 27,518 27,543.7
10.2.6 Key Lake
The description of drilling method, surveying, and core logging procedures described in the previous
sections are also applicable to the Key Lake Deposit.
10.2.6.1 Drilling Campaigns
All drilling campaigns at Key Lake prior to Premier in 2011 are described in Section 6 - History.
The exploration program by Premier in 2011 was designed to expand the footprint of the Key Lake Deposit
trend along strike and aimed to test the down-plunge potential of some of the higher-grade gold values
within the deposit. Premier drilled eight holes totalling 3,190 m and including 1,189 of assayed metres.
The 2011 drill program has successfully extended mineralization approximately 600 m along strike to the
west of the core area, with the best results coming from the westernmost 200 m, where it remains wide
open for expansion.
Table 10.5 summarizes the metres for the 1974 to 2011 drilling programs on the Key Lake Project.
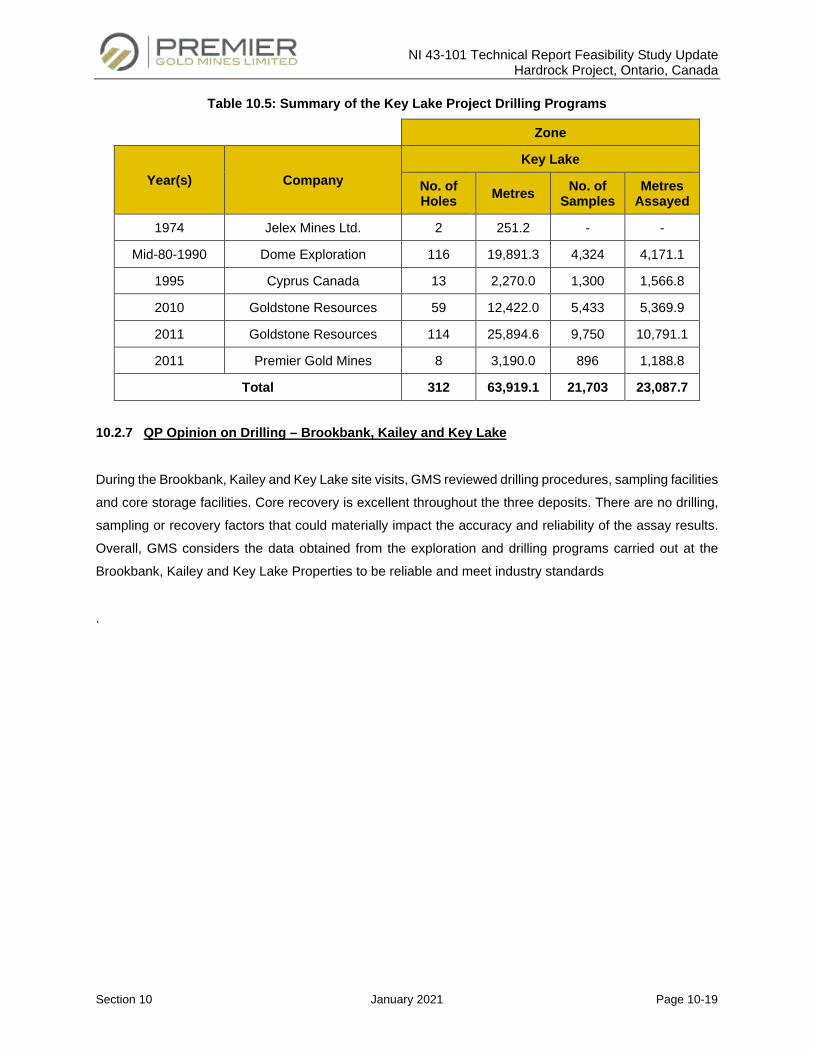
NI 43-101 Technical Report Feasibility Study Update Hardrock Project, Ontario, Canada
Section 10 January 2021 Page 10-19
Table 10.5: Summary of the Key Lake Project Drilling Programs
Zone
Year(s) Company Key Lake
No. of Holes Metres No. of
Samples Metres
Assayed
1974 Jelex Mines Ltd. 2 251.2 - -
Mid-80-1990 Dome Exploration 116 19,891.3 4,324 4,171.1
1995 Cyprus Canada 13 2,270.0 1,300 1,566.8
2010 Goldstone Resources 59 12,422.0 5,433 5,369.9
2011 Goldstone Resources 114 25,894.6 9,750 10,791.1
2011 Premier Gold Mines 8 3,190.0 896 1,188.8
Total 312 63,919.1 21,703 23,087.7
10.2.7 QP Opinion on Drilling – Brookbank, Kailey and Key Lake
During the Brookbank, Kailey and Key Lake site visits, GMS reviewed drilling procedures, sampling facilities
and core storage facilities. Core recovery is excellent throughout the three deposits. There are no drilling,
sampling or recovery factors that could materially impact the accuracy and reliability of the assay results.
Overall, GMS considers the data obtained from the exploration and drilling programs carried out at the
Brookbank, Kailey and Key Lake Properties to be reliable and meet industry standards
.
NI 43-101 Technical Report Feasibility Study Update Hardrock Project, Ontario, Canada
Section 11 January 2021 Page 11-1
SAMPLE PREPARATION, ANALYSES AND SECURITY
The following sections describe Greenstone Gold Mines (“GGM”) sample preparation, analysis, and
security procedures for the reverse circulation grade control (“RCGC”) and diamond drill hole (“DDH”)
drilling programs performed at the Project since 2012. Data pertaining to sampling, analytical, security, and
quality assurance-quality control (“QA/QC”) protocols were supplied to G Mining Services Inc. (“GMS”) from
GGM’s geology team and reviewed accordingly.
11.1 Hardrock
11.1.1 Laboratory Accreditation and Certification
The Geraldton facility belonging to Activation Laboratories Ltd (“Actlabs Geraldton”) was used for the entire
drilling and channelling programs. Actlabs Geraldton has received ISO 9001:2008 certification through
Kiwa International Cert GmbH. Actlabs Geraldton is an independent commercial laboratory.
All re-assaying of batches (pulps) was undertaken at ALS-Chemex in Thunder Bay. ALS-Chemex
laboratory is part of the ALS Global Group and has ISO 9001 certification and ISO/IEC 17025 accreditation
through the Standards Council of Canada. ALS is an independent commercial laboratory.
11.1.2 GGM Sampling and Security
11.1.2.1 RCGC Sampling
GGM samplers assisted NPLH drillers in sampling the reverse circulation (“RC”) drill material. The drill rig
(Figure 11.2) drilled through overburden and recorded the depth at which rock was intersected. The drill
was equipped with an on-board cone splitter that provided two simultaneous samples; a 4 kg sample for
analysis, and a 10 kg metallurgical sample. The sampling interval was 2 m. The geotechnicians attached a
large and small sample bag onto the sample splitter as shown in Figure 11.2. The sample meterage was
recorded, and a sample ticket was placed into each of the sample bags.
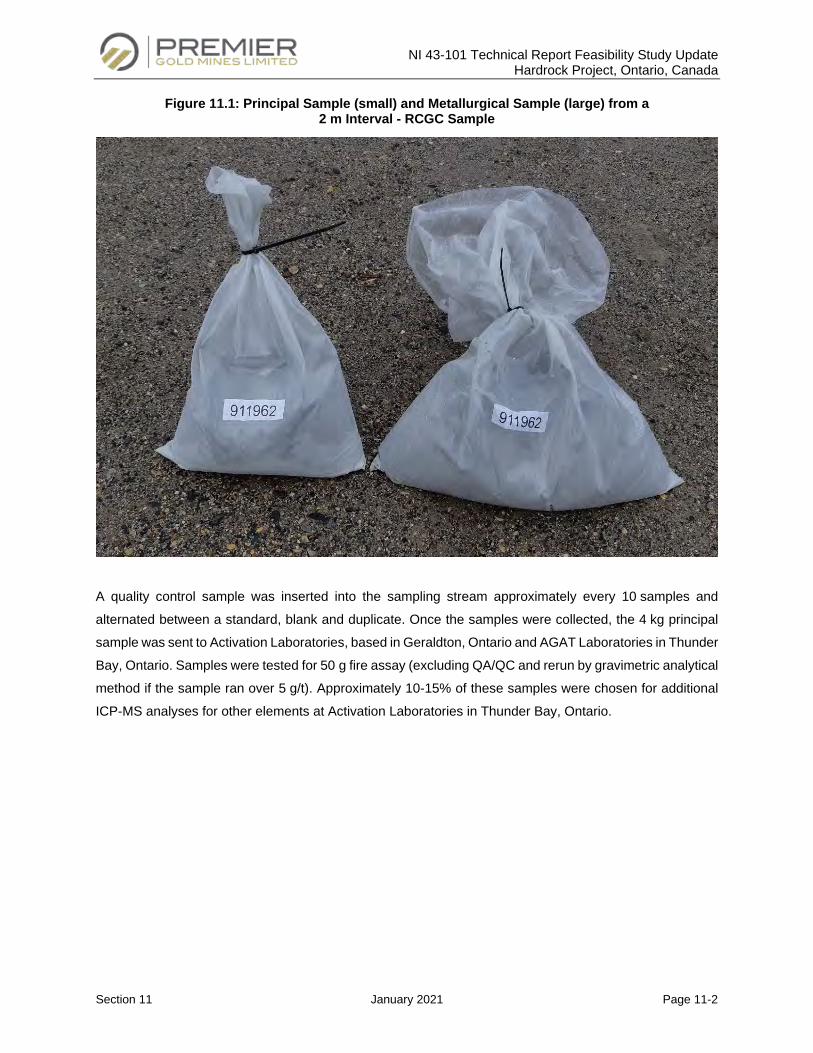
NI 43-101 Technical Report Feasibility Study Update Hardrock Project, Ontario, Canada
Section 11 January 2021 Page 11-2
Figure 11.1: Principal Sample (small) and Metallurgical Sample (large) from a 2 m Interval - RCGC Sample
A quality control sample was inserted into the sampling stream approximately every 10 samples and
alternated between a standard, blank and duplicate. Once the samples were collected, the 4 kg principal
sample was sent to Activation Laboratories, based in Geraldton, Ontario and AGAT Laboratories in Thunder
Bay, Ontario. Samples were tested for 50 g fire assay (excluding QA/QC and rerun by gravimetric analytical
method if the sample ran over 5 g/t). Approximately 10-15% of these samples were chosen for additional
ICP-MS analyses for other elements at Activation Laboratories in Thunder Bay, Ontario.
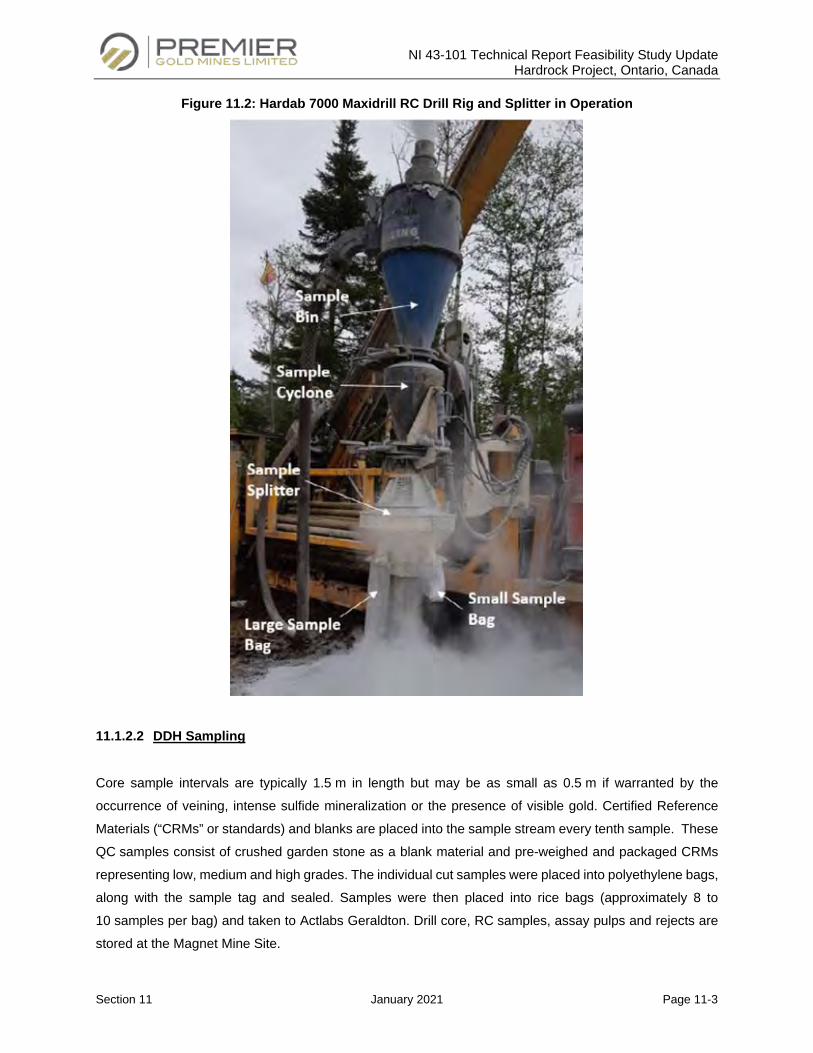
NI 43-101 Technical Report Feasibility Study Update Hardrock Project, Ontario, Canada
Section 11 January 2021 Page 11-3
Figure 11.2: Hardab 7000 Maxidrill RC Drill Rig and Splitter in Operation
11.1.2.2 DDH Sampling
Core sample intervals are typically 1.5 m in length but may be as small as 0.5 m if warranted by the
occurrence of veining, intense sulfide mineralization or the presence of visible gold. Certified Reference
Materials (“CRMs” or standards) and blanks are placed into the sample stream every tenth sample. These
QC samples consist of crushed garden stone as a blank material and pre-weighed and packaged CRMs
representing low, medium and high grades. The individual cut samples were placed into polyethylene bags,
along with the sample tag and sealed. Samples were then placed into rice bags (approximately 8 to
10 samples per bag) and taken to Actlabs Geraldton. Drill core, RC samples, assay pulps and rejects are
stored at the Magnet Mine Site.
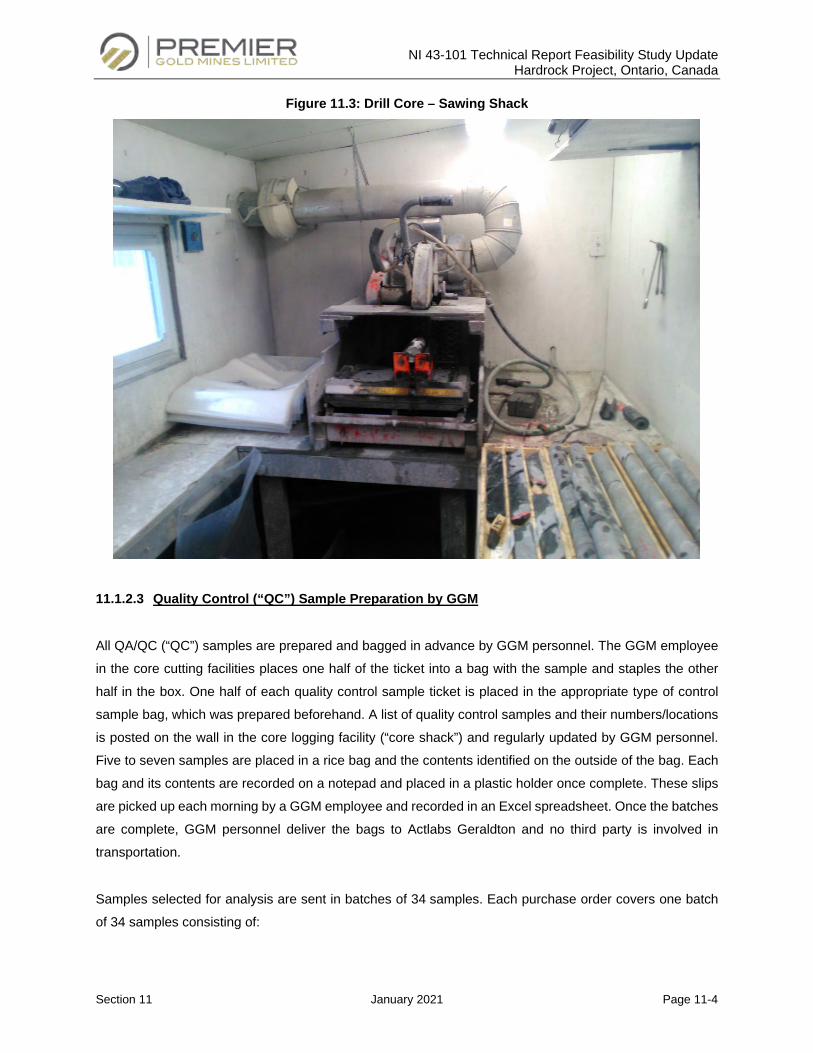
NI 43-101 Technical Report Feasibility Study Update Hardrock Project, Ontario, Canada
Section 11 January 2021 Page 11-4
Figure 11.3: Drill Core – Sawing Shack
11.1.2.3 Quality Control (“QC”) Sample Preparation by GGM
All QA/QC (“QC”) samples are prepared and bagged in advance by GGM personnel. The GGM employee
in the core cutting facilities places one half of the ticket into a bag with the sample and staples the other
half in the box. One half of each quality control sample ticket is placed in the appropriate type of control
sample bag, which was prepared beforehand. A list of quality control samples and their numbers/locations
is posted on the wall in the core logging facility (“core shack”) and regularly updated by GGM personnel.
Five to seven samples are placed in a rice bag and the contents identified on the outside of the bag. Each
bag and its contents are recorded on a notepad and placed in a plastic holder once complete. These slips
are picked up each morning by a GGM employee and recorded in an Excel spreadsheet. Once the batches
are complete, GGM personnel deliver the bags to Actlabs Geraldton and no third party is involved in
transportation.
Samples selected for analysis are sent in batches of 34 samples. Each purchase order covers one batch
of 34 samples consisting of:
NI 43-101 Technical Report Feasibility Study Update Hardrock Project, Ontario, Canada
Section 11 January 2021 Page 11-5
• 30 regular samples;
• 1 field duplicate sample;
• 1 field blank;
• 1 certified reference material (“CRM” or standard) with a low gold value;
• 1 certified reference material (“CRM” or standard) with a high gold value.
As a quality control check, Actlabs Geraldton adds a 35th sample to every field batch received in the form
of a coarse duplicate of the last regular sample (the 30th sample), constituting a second pulp prepared from
the reject. The quality of the reject is monitored to ensure that proper preparation procedures are used
during crushing. For the fusion process, Actlabs Geraldton adds seven additional quality control samples
(two analytical blanks, two certified reference materials and three pulp duplicates), bringing the fusible
batch to a total of 42. The pulp duplicates are necessary to ensure that proper preparation procedures are
used during pulverization.
At Actlabs Geraldton, the maximum furnace charge of 42 samples ensures that GGM samples are not
mixed with others.
11.1.3 Assay Procedure - Sample Preparation and Analysis
11.1.3.1 Fire Assay Sample Preparation (Actlabs Geraldton)
Samples are received at Actlabs Geraldton, sorted and bar-coded. They are then placed in the sample
drying room and dried at 60°C. Any samples that are damaged upon receipt (i.e. punctured sample bag,
loose core) are documented and the client is informed with pictures.
Samples are crushed to 90% passing 10 mesh and split with a Jones riffle, and a 250 g split is pulverized
to 95% passing 150 mesh. Sieve tests are performed on the crusher at the beginning of each day. Sieve
tests are performed on the pulps on the first and fiftieth sample of each work order. If there is a failure, the
samples are re-milled to ensure that they pass. There is a pulp duplicate made every 30th sample in sample
prep and a coarse reject duplicate every 50th. Samples are then sent for fire assay.
11.1.3.2 Metallic Sieve Sample Preparation (Actlabs Geraldton)
All samples containing visible gold are prepared with metallic sieve sample preparation procedures.
NI 43-101 Technical Report Feasibility Study Update Hardrock Project, Ontario, Canada
Section 11 January 2021 Page 11-6
A representative 2,000 g split (Code 1A4-2000) is sieved at 100 mesh (149 microns) with fire assays
performed on the entire +100 mesh and two splits on the -100 mesh fraction. The total amount of sample
and the +100 mesh and -100 mesh fractions are weighed for assay reconciliation. Measured amounts of
cleaner sand are used between samples and saved to test for possible plating out of gold on the mill.
Alternative sieving mesh sizes are available, however, the finer the grind the more likelihood of gold loss
by plating out on the mill.
11.1.3.3 Fire Assay Procedures (Actlabs Geraldton)
The following description for the fire assay procedures was supplied by Actlabs Geraldton. Samples
(50 g each) are sent to the fire assay area numbered and in order (usually 1 to 34+1). A rack of 42 crucibles
is then labelled with an assigned letter code and numbered one to 42. The mixture is placed in a fire clay
crucible. The mixture is then preheated to 850°C, intermediate at 950°C and finished at 1,060°C, with the
entire fusion process lasting sixty minutes. The crucibles are then removed from the assay furnace and the
molten slag (lighter material) is carefully poured from the crucible into a mould, leaving a lead button at the
base of the mould. The lead button is then placed in a preheated cupel which absorbs the lead when
cupelled at 950°C to recover the Ag (doré bead) + Au. The entire Ag doré bead is dissolved in aqua regia
and the gold content is determined by AA (“Atomic Absorption”) finish (1A2-50 code).
On each tray of 42 samples there are two blanks, three sample duplicates and two certified reference
materials, one high and one low (QC = 7 out of 42 samples).
All samples assaying grades over 5.0 g Au/t with AA were re-run with gravimetric finish to ensure accurate
values. After the fire assay procedures, Au is separated from the Ag in the doré bead by parting with nitric
acid. The resulting gold flake is annealed using a torch. The gold flake remaining is weighed gravimetrically
on a microbalance.
11.1.3.4 Fire Assay Procedures with Gravimetric or Atomic Absorption Finish (ALS-Chemex Thunder Bay)
The fire assay technique uses high temperature and flux to “melt” the rock and allows the gold to be
collected. Lead formed from the reduction of litharge is traditionally used as the collecting medium for silver
and gold. The test sample is intimately mixed with a suitable flux that will fuse at high temperature with the
gangue minerals present in the sample to produce a slag that is liquid at the fusion temperature. The
liberated precious metals are scavenged by the molten lead and gravitate to the bottom of the fusion
crucible.
NI 43-101 Technical Report Feasibility Study Update Hardrock Project, Ontario, Canada
Section 11 January 2021 Page 11-7
Upon cooling, the lead button is separated from the slag and processed in a separate furnace for a high
temperature oxidation (cupellation) where the lead is removed, leaving the precious metals behind as a
metallic bead called a prill. Traditionally, this prill was then partially dissolved in nitric acid (parted) to remove
silver and the remaining gold determined by weighing (gravimetry). Alternatively, the prill can be dissolved
in a mixture of hydrochloric and nitric acid (aqua regia) and the concentration determined by spectroscopic
methods (AAS, ICPAES or ICPMS).such as atomic absorption spectroscopy (“AAS”), inductively coupled
plasma atomic emission spectroscopy (“ICPAES”) or inductively coupled plasma mass spectroscopy
(“ICPMS”). The concentration is normally expressed as parts per million (“ppm”), which is equivalent to
grams per tonne (“g/t”).
For the AA finish method, a pulp sample is fused with a mixture of lead oxide, sodium carbonate, borax,
silica and other reagents as required, inquarted with 6 mg of gold-free silver and then cupelled to yield a
precious metal bead. The bead is digested in 0.5 ml dilute nitric acid in the microwave oven. The 0.5 ml
concentrated hydrochloric acid is then added, and the bead is further digested in the microwave at a lower
power setting. The digested solution is cooled, diluted to a total volume of 4 ml with de-mineralized water,
and analyzed by AAS against matrix-matched standards.
For the gravimetric finish method, a pulp sample is fused with a mixture of lead oxide, sodium carbonate,
borax, silica and other reagents in order to produce a lead button. The lead button containing the precious
metals is cupelled to remove the lead. The remaining gold and silver bead is parted in dilute nitric acid,
annealed and weighed as gold. Silver, if requested, is then determined by the difference in weights.
At the ALS-Chemex laboratory, the batch size for all fire assay method is 84 including six internal QC.
Therefore 78 client samples can be done per batch.
The maximum furnace charge of 78 client samples ensures that GGM samples are not mixed with others.
11.1.4 Quality Control Results – 2012 to 2016
Information in this section is sourced from the NI 43-101 Technical Report prepared by GMS on
December 22, 2016.
Table 11.1, Table 11.2 and Table 11.3 were extracted from previous technical reports on the Project prior
to the 2018 and 2019 drilling programs and summarize the CRM results from 2013 to 2015. GMS did not
identify any flaws in the QA/QC results.
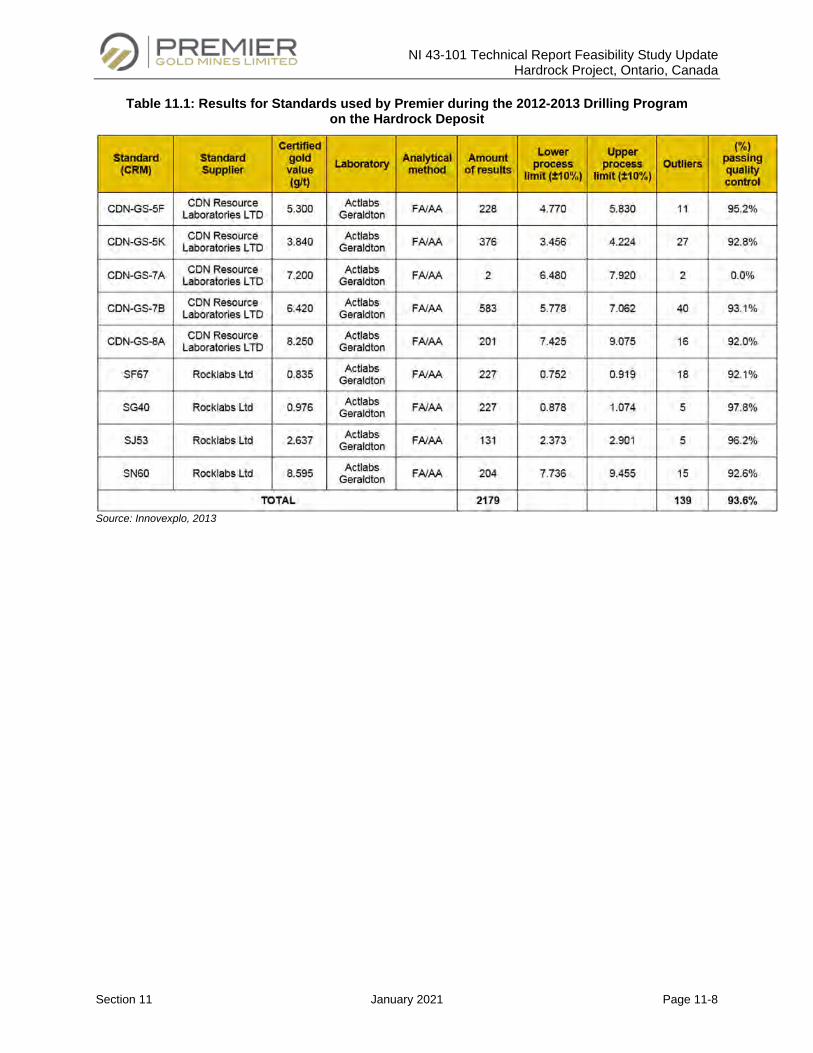
NI 43-101 Technical Report Feasibility Study Update Hardrock Project, Ontario, Canada
Section 11 January 2021 Page 11-8
Table 11.1: Results for Standards used by Premier during the 2012-2013 Drilling Program on the Hardrock Deposit
Source: Innovexplo, 2013
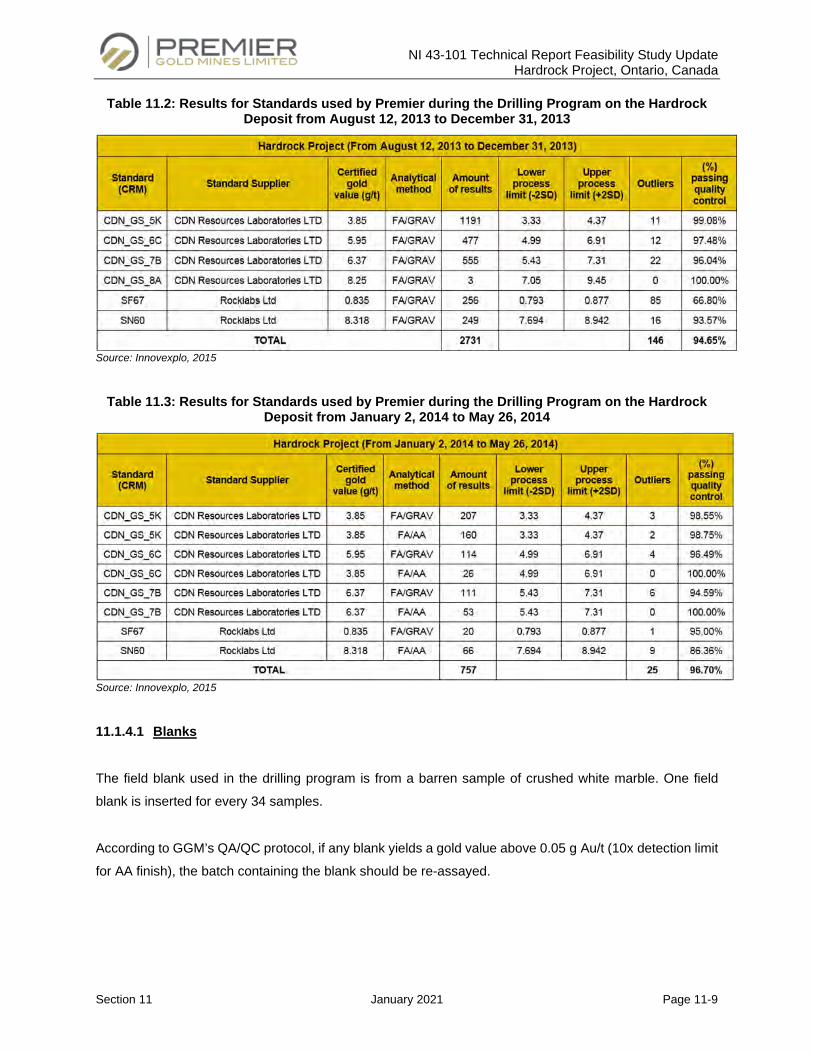
NI 43-101 Technical Report Feasibility Study Update Hardrock Project, Ontario, Canada
Section 11 January 2021 Page 11-9
Table 11.2: Results for Standards used by Premier during the Drilling Program on the Hardrock Deposit from August 12, 2013 to December 31, 2013
Source: Innovexplo, 2015
Table 11.3: Results for Standards used by Premier during the Drilling Program on the Hardrock Deposit from January 2, 2014 to May 26, 2014
Source: Innovexplo, 2015
11.1.4.1 Blanks
The field blank used in the drilling program is from a barren sample of crushed white marble. One field
blank is inserted for every 34 samples.
According to GGM’s QA/QC protocol, if any blank yields a gold value above 0.05 g Au/t (10x detection limit
for AA finish), the batch containing the blank should be re-assayed.
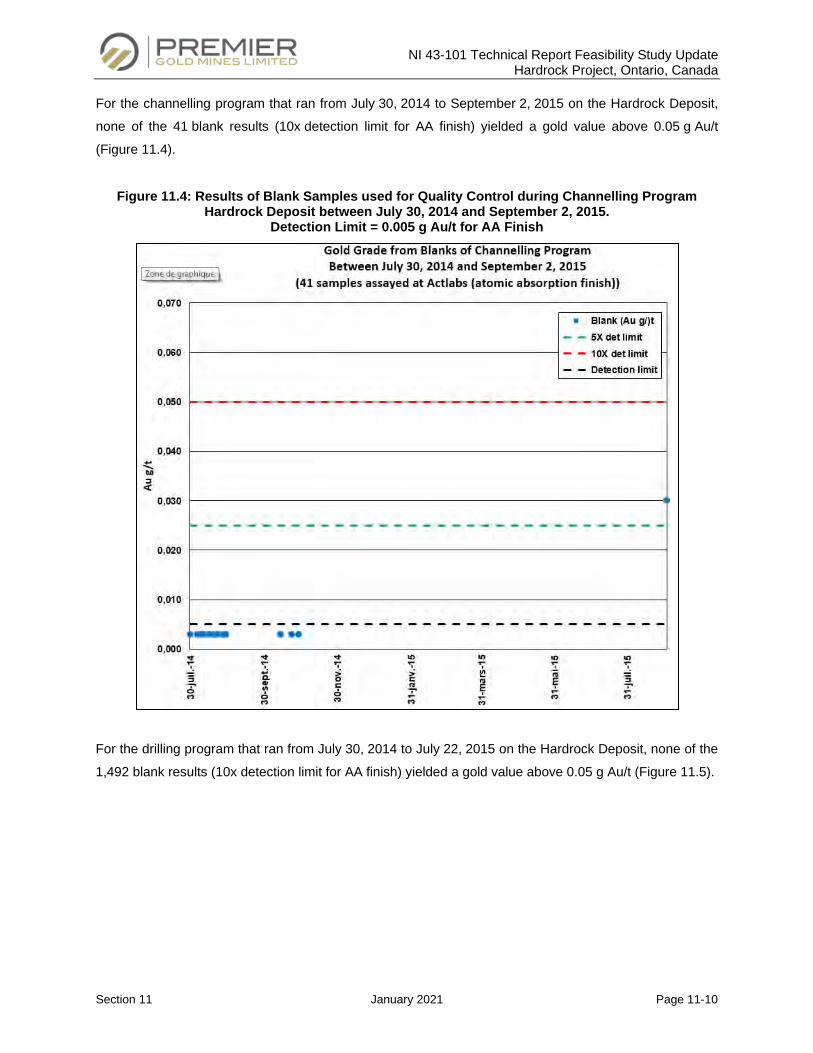
NI 43-101 Technical Report Feasibility Study Update Hardrock Project, Ontario, Canada
Section 11 January 2021 Page 11-10
For the channelling program that ran from July 30, 2014 to September 2, 2015 on the Hardrock Deposit,
none of the 41 blank results (10x detection limit for AA finish) yielded a gold value above 0.05 g Au/t
(Figure 11.4).
Figure 11.4: Results of Blank Samples used for Quality Control during Channelling Program Hardrock Deposit between July 30, 2014 and September 2, 2015.
Detection Limit = 0.005 g Au/t for AA Finish
For the drilling program that ran from July 30, 2014 to July 22, 2015 on the Hardrock Deposit, none of the
1,492 blank results (10x detection limit for AA finish) yielded a gold value above 0.05 g Au/t (Figure 11.5).
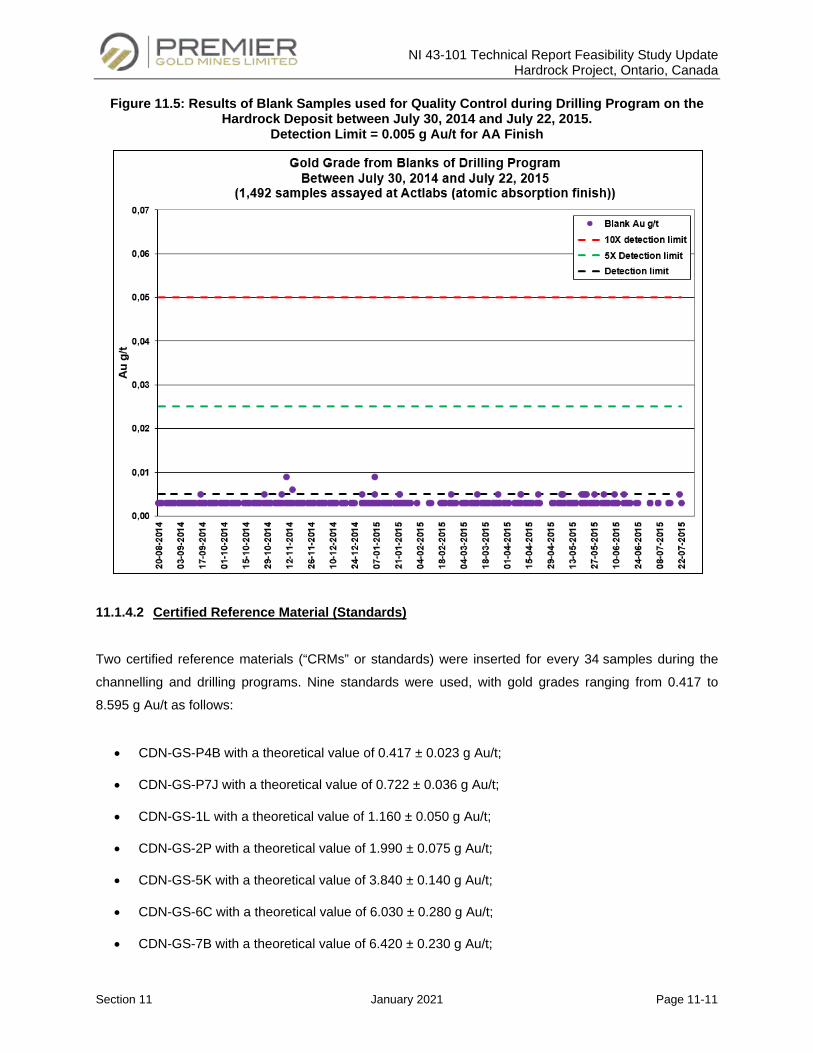
NI 43-101 Technical Report Feasibility Study Update Hardrock Project, Ontario, Canada
Section 11 January 2021 Page 11-11
Figure 11.5: Results of Blank Samples used for Quality Control during Drilling Program on the Hardrock Deposit between July 30, 2014 and July 22, 2015.
Detection Limit = 0.005 g Au/t for AA Finish
11.1.4.2 Certified Reference Material (Standards)
Two certified reference materials (“CRMs” or standards) were inserted for every 34 samples during the
channelling and drilling programs. Nine standards were used, with gold grades ranging from 0.417 to
8.595 g Au/t as follows:
• CDN-GS-P4B with a theoretical value of 0.417 ± 0.023 g Au/t;
• CDN-GS-P7J with a theoretical value of 0.722 ± 0.036 g Au/t;
• CDN-GS-1L with a theoretical value of 1.160 ± 0.050 g Au/t;
• CDN-GS-2P with a theoretical value of 1.990 ± 0.075 g Au/t;
• CDN-GS-5K with a theoretical value of 3.840 ± 0.140 g Au/t;
• CDN-GS-6C with a theoretical value of 6.030 ± 0.280 g Au/t;
• CDN-GS-7B with a theoretical value of 6.420 ± 0.230 g Au/t;
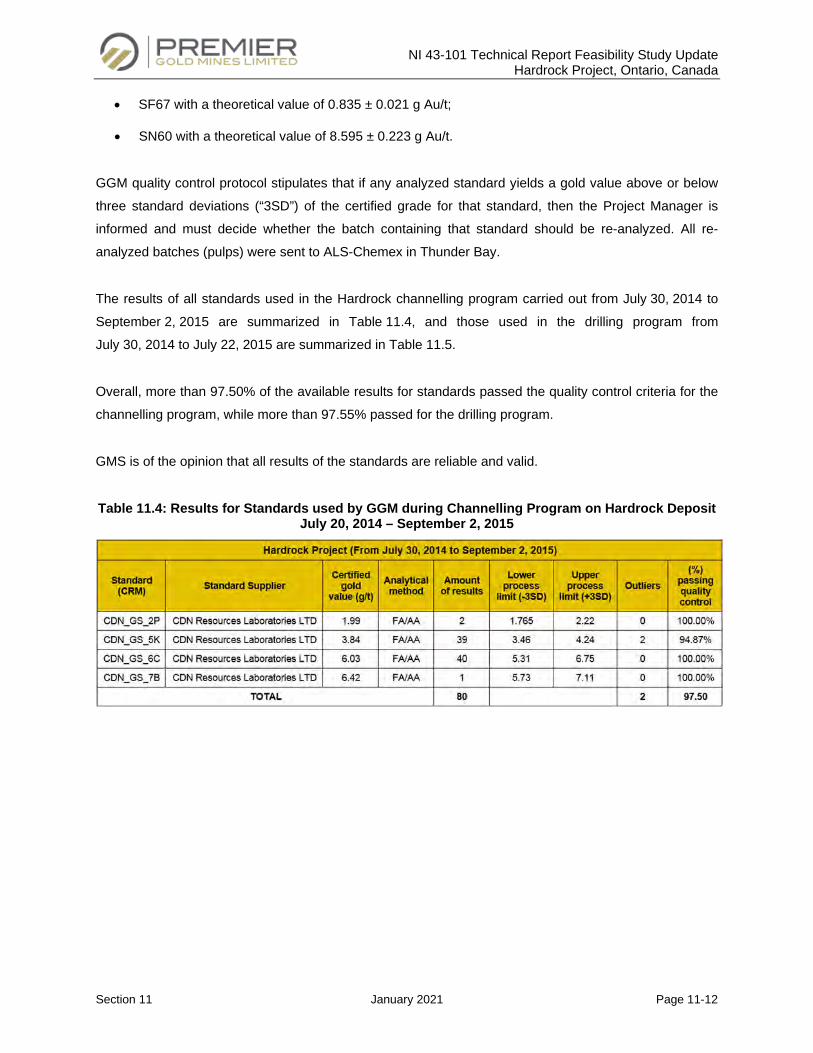
NI 43-101 Technical Report Feasibility Study Update Hardrock Project, Ontario, Canada
Section 11 January 2021 Page 11-12
• SF67 with a theoretical value of 0.835 ± 0.021 g Au/t;
• SN60 with a theoretical value of 8.595 ± 0.223 g Au/t.
GGM quality control protocol stipulates that if any analyzed standard yields a gold value above or below
three standard deviations (“3SD”) of the certified grade for that standard, then the Project Manager is
informed and must decide whether the batch containing that standard should be re-analyzed. All re-
analyzed batches (pulps) were sent to ALS-Chemex in Thunder Bay.
The results of all standards used in the Hardrock channelling program carried out from July 30, 2014 to
September 2, 2015 are summarized in Table 11.4, and those used in the drilling program from
July 30, 2014 to July 22, 2015 are summarized in Table 11.5.
Overall, more than 97.50% of the available results for standards passed the quality control criteria for the
channelling program, while more than 97.55% passed for the drilling program.
GMS is of the opinion that all results of the standards are reliable and valid.
Table 11.4: Results for Standards used by GGM during Channelling Program on Hardrock Deposit July 20, 2014 – September 2, 2015
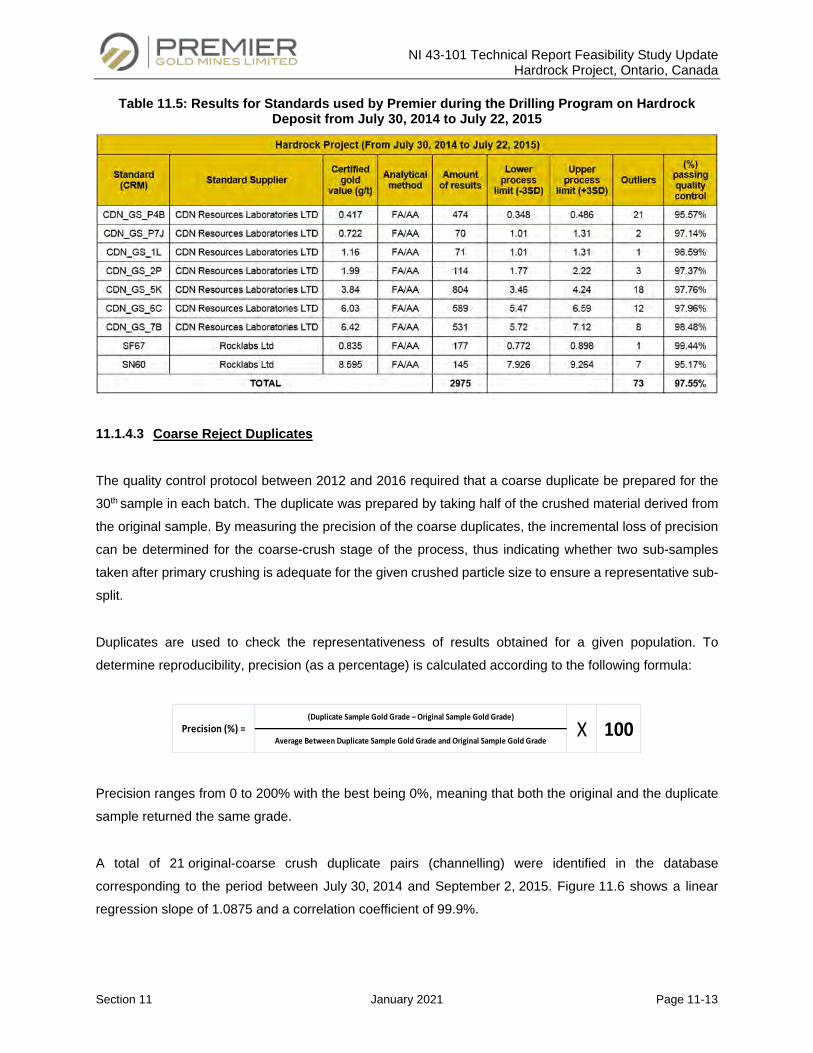
NI 43-101 Technical Report Feasibility Study Update Hardrock Project, Ontario, Canada
Section 11 January 2021 Page 11-13
Table 11.5: Results for Standards used by Premier during the Drilling Program on Hardrock Deposit from July 30, 2014 to July 22, 2015
11.1.4.3 Coarse Reject Duplicates
The quality control protocol between 2012 and 2016 required that a coarse duplicate be prepared for the
30th sample in each batch. The duplicate was prepared by taking half of the crushed material derived from
the original sample. By measuring the precision of the coarse duplicates, the incremental loss of precision
can be determined for the coarse-crush stage of the process, thus indicating whether two sub-samples
taken after primary crushing is adequate for the given crushed particle size to ensure a representative sub-
split.
Duplicates are used to check the representativeness of results obtained for a given population. To
determine reproducibility, precision (as a percentage) is calculated according to the following formula:
Precision ranges from 0 to 200% with the best being 0%, meaning that both the original and the duplicate
sample returned the same grade.
A total of 21 original-coarse crush duplicate pairs (channelling) were identified in the database
corresponding to the period between July 30, 2014 and September 2, 2015. Figure 11.6 shows a linear
regression slope of 1.0875 and a correlation coefficient of 99.9%.
Precision (%) =(Duplicate Sample Gold Grade – Original Sample Gold Grade)
Average Between Duplicate Sample Gold Grade and Original Sample Gold Grade100X
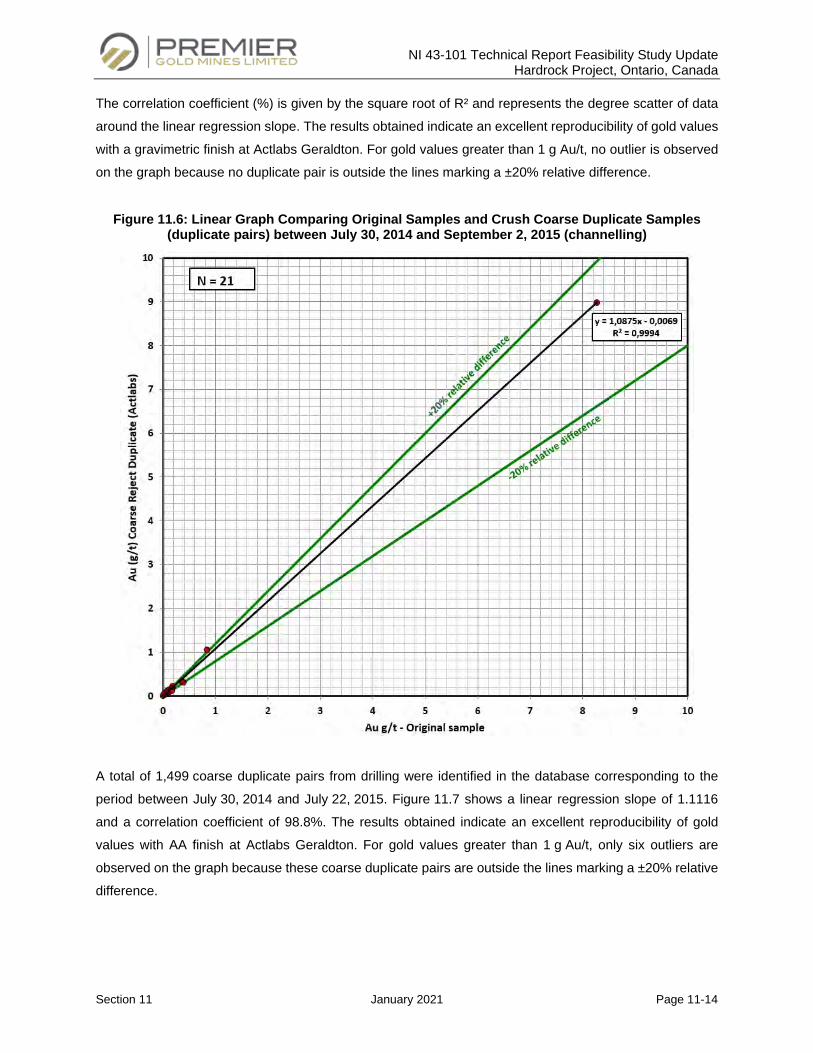
NI 43-101 Technical Report Feasibility Study Update Hardrock Project, Ontario, Canada
Section 11 January 2021 Page 11-14
The correlation coefficient (%) is given by the square root of R² and represents the degree scatter of data
around the linear regression slope. The results obtained indicate an excellent reproducibility of gold values
with a gravimetric finish at Actlabs Geraldton. For gold values greater than 1 g Au/t, no outlier is observed
on the graph because no duplicate pair is outside the lines marking a ±20% relative difference.
Figure 11.6: Linear Graph Comparing Original Samples and Crush Coarse Duplicate Samples (duplicate pairs) between July 30, 2014 and September 2, 2015 (channelling)
A total of 1,499 coarse duplicate pairs from drilling were identified in the database corresponding to the
period between July 30, 2014 and July 22, 2015. Figure 11.7 shows a linear regression slope of 1.1116
and a correlation coefficient of 98.8%. The results obtained indicate an excellent reproducibility of gold
values with AA finish at Actlabs Geraldton. For gold values greater than 1 g Au/t, only six outliers are
observed on the graph because these coarse duplicate pairs are outside the lines marking a ±20% relative
difference.
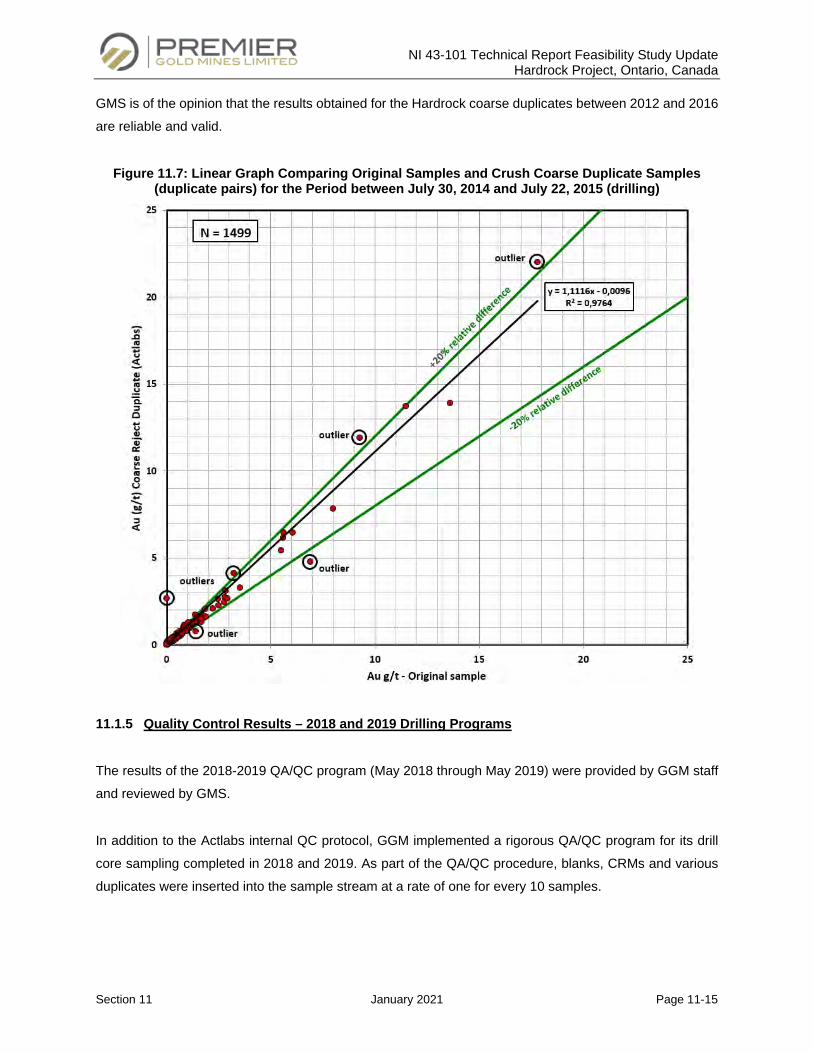
NI 43-101 Technical Report Feasibility Study Update Hardrock Project, Ontario, Canada
Section 11 January 2021 Page 11-15
GMS is of the opinion that the results obtained for the Hardrock coarse duplicates between 2012 and 2016
are reliable and valid.
Figure 11.7: Linear Graph Comparing Original Samples and Crush Coarse Duplicate Samples (duplicate pairs) for the Period between July 30, 2014 and July 22, 2015 (drilling)
11.1.5 Quality Control Results – 2018 and 2019 Drilling Programs
The results of the 2018-2019 QA/QC program (May 2018 through May 2019) were provided by GGM staff
and reviewed by GMS.
In addition to the Actlabs internal QC protocol, GGM implemented a rigorous QA/QC program for its drill
core sampling completed in 2018 and 2019. As part of the QA/QC procedure, blanks, CRMs and various
duplicates were inserted into the sample stream at a rate of one for every 10 samples.
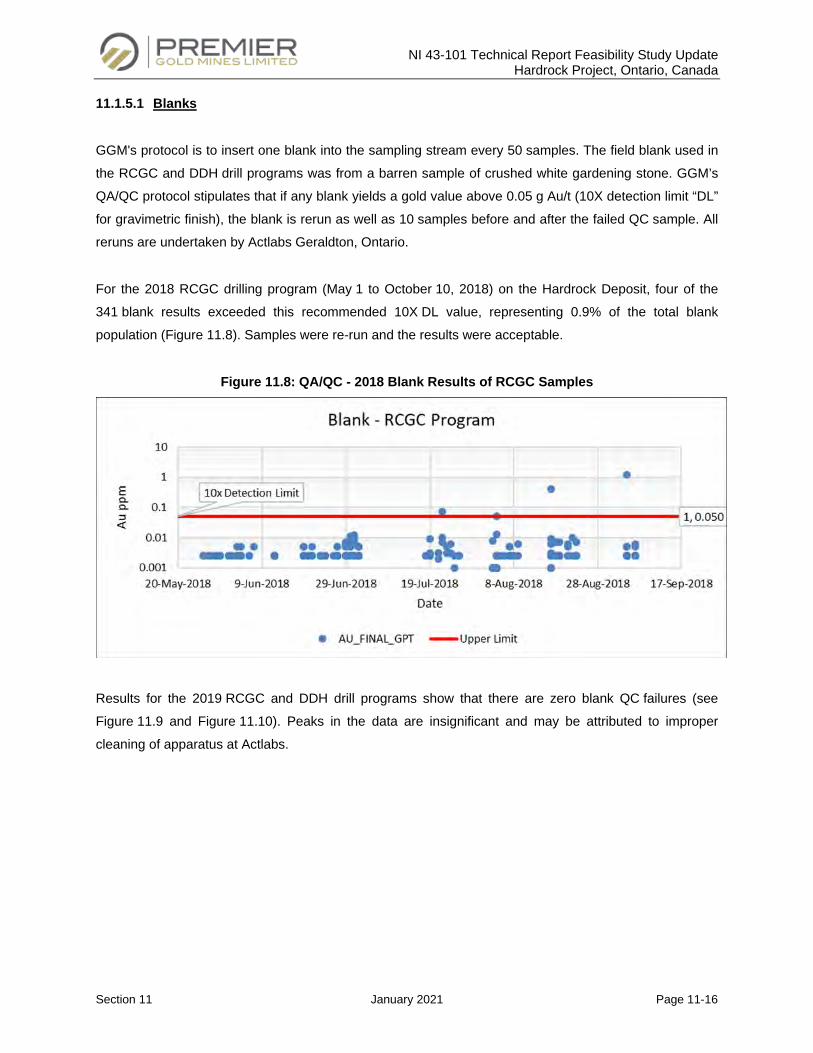
NI 43-101 Technical Report Feasibility Study Update Hardrock Project, Ontario, Canada
Section 11 January 2021 Page 11-16
11.1.5.1 Blanks
GGM's protocol is to insert one blank into the sampling stream every 50 samples. The field blank used in
the RCGC and DDH drill programs was from a barren sample of crushed white gardening stone. GGM’s
QA/QC protocol stipulates that if any blank yields a gold value above 0.05 g Au/t (10X detection limit “DL”
for gravimetric finish), the blank is rerun as well as 10 samples before and after the failed QC sample. All
reruns are undertaken by Actlabs Geraldton, Ontario.
For the 2018 RCGC drilling program (May 1 to October 10, 2018) on the Hardrock Deposit, four of the
341 blank results exceeded this recommended 10X DL value, representing 0.9% of the total blank
population (Figure 11.8). Samples were re-run and the results were acceptable.
Figure 11.8: QA/QC - 2018 Blank Results of RCGC Samples
Results for the 2019 RCGC and DDH drill programs show that there are zero blank QC failures (see
Figure 11.9 and Figure 11.10). Peaks in the data are insignificant and may be attributed to improper
cleaning of apparatus at Actlabs.
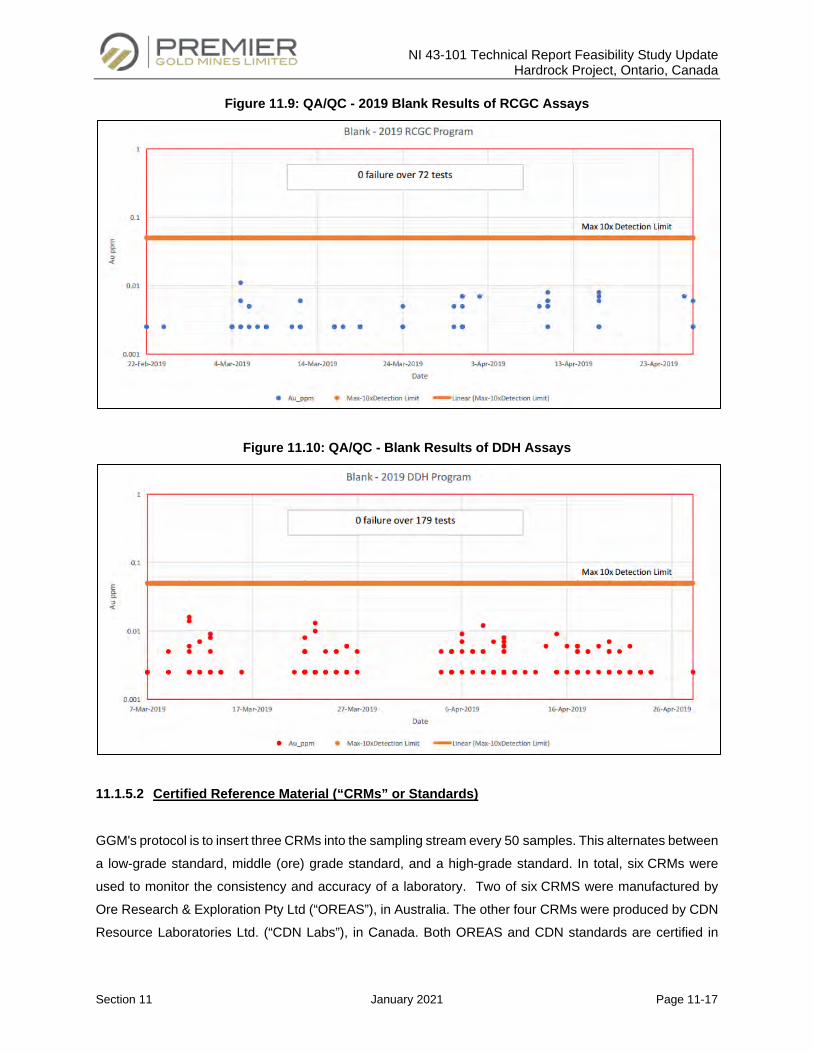
NI 43-101 Technical Report Feasibility Study Update Hardrock Project, Ontario, Canada
Section 11 January 2021 Page 11-17
Figure 11.9: QA/QC - 2019 Blank Results of RCGC Assays
Figure 11.10: QA/QC - Blank Results of DDH Assays
11.1.5.2 Certified Reference Material (“CRMs” or Standards)
GGM's protocol is to insert three CRMs into the sampling stream every 50 samples. This alternates between
a low-grade standard, middle (ore) grade standard, and a high-grade standard. In total, six CRMs were
used to monitor the consistency and accuracy of a laboratory. Two of six CRMS were manufactured by
Ore Research & Exploration Pty Ltd (“OREAS”), in Australia. The other four CRMs were produced by CDN
Resource Laboratories Ltd. (“CDN Labs”), in Canada. Both OREAS and CDN standards are certified in
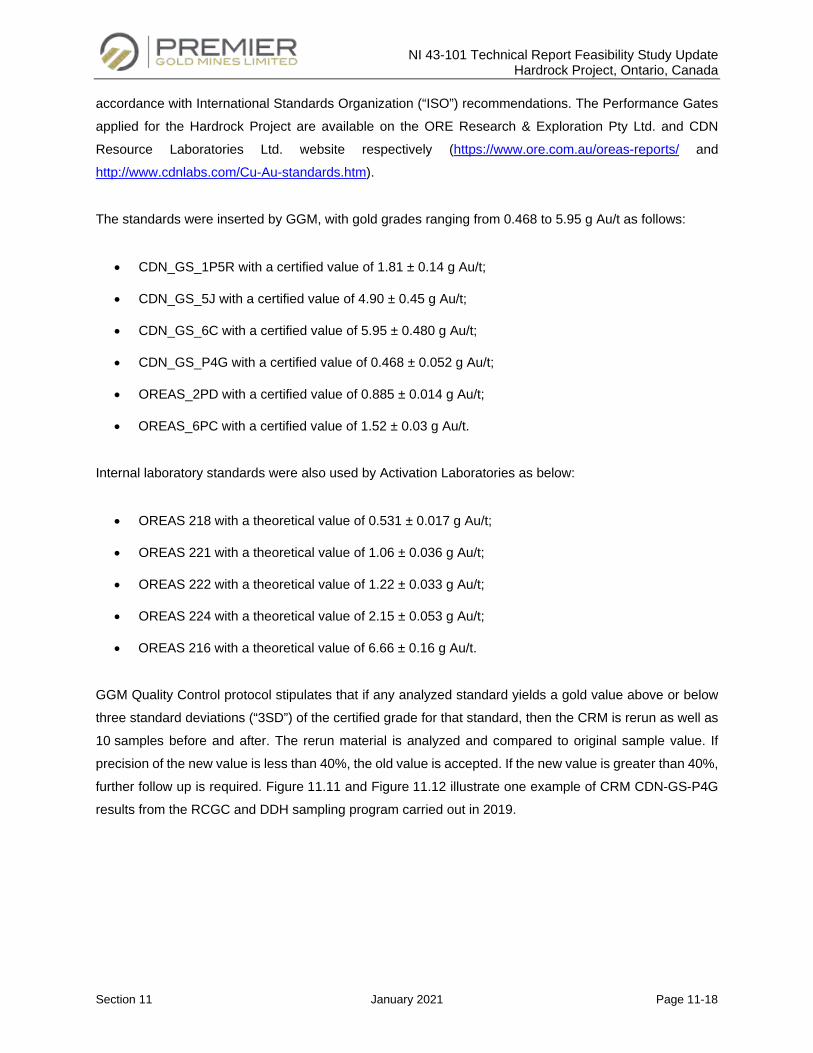
NI 43-101 Technical Report Feasibility Study Update Hardrock Project, Ontario, Canada
Section 11 January 2021 Page 11-18
accordance with International Standards Organization (“ISO”) recommendations. The Performance Gates
applied for the Hardrock Project are available on the ORE Research & Exploration Pty Ltd. and CDN
Resource Laboratories Ltd. website respectively (https://www.ore.com.au/oreas-reports/ and
http://www.cdnlabs.com/Cu-Au-standards.htm).
The standards were inserted by GGM, with gold grades ranging from 0.468 to 5.95 g Au/t as follows:
• CDN_GS_1P5R with a certified value of 1.81 ± 0.14 g Au/t;
• CDN_GS_5J with a certified value of 4.90 ± 0.45 g Au/t;
• CDN_GS_6C with a certified value of 5.95 ± 0.480 g Au/t;
• CDN_GS_P4G with a certified value of 0.468 ± 0.052 g Au/t;
• OREAS_2PD with a certified value of 0.885 ± 0.014 g Au/t;
• OREAS_6PC with a certified value of 1.52 ± 0.03 g Au/t.
Internal laboratory standards were also used by Activation Laboratories as below:
• OREAS 218 with a theoretical value of 0.531 ± 0.017 g Au/t;
• OREAS 221 with a theoretical value of 1.06 ± 0.036 g Au/t;
• OREAS 222 with a theoretical value of 1.22 ± 0.033 g Au/t;
• OREAS 224 with a theoretical value of 2.15 ± 0.053 g Au/t;
• OREAS 216 with a theoretical value of 6.66 ± 0.16 g Au/t.
GGM Quality Control protocol stipulates that if any analyzed standard yields a gold value above or below
three standard deviations (“3SD”) of the certified grade for that standard, then the CRM is rerun as well as
10 samples before and after. The rerun material is analyzed and compared to original sample value. If
precision of the new value is less than 40%, the old value is accepted. If the new value is greater than 40%,
further follow up is required. Figure 11.11 and Figure 11.12 illustrate one example of CRM CDN-GS-P4G
results from the RCGC and DDH sampling program carried out in 2019.
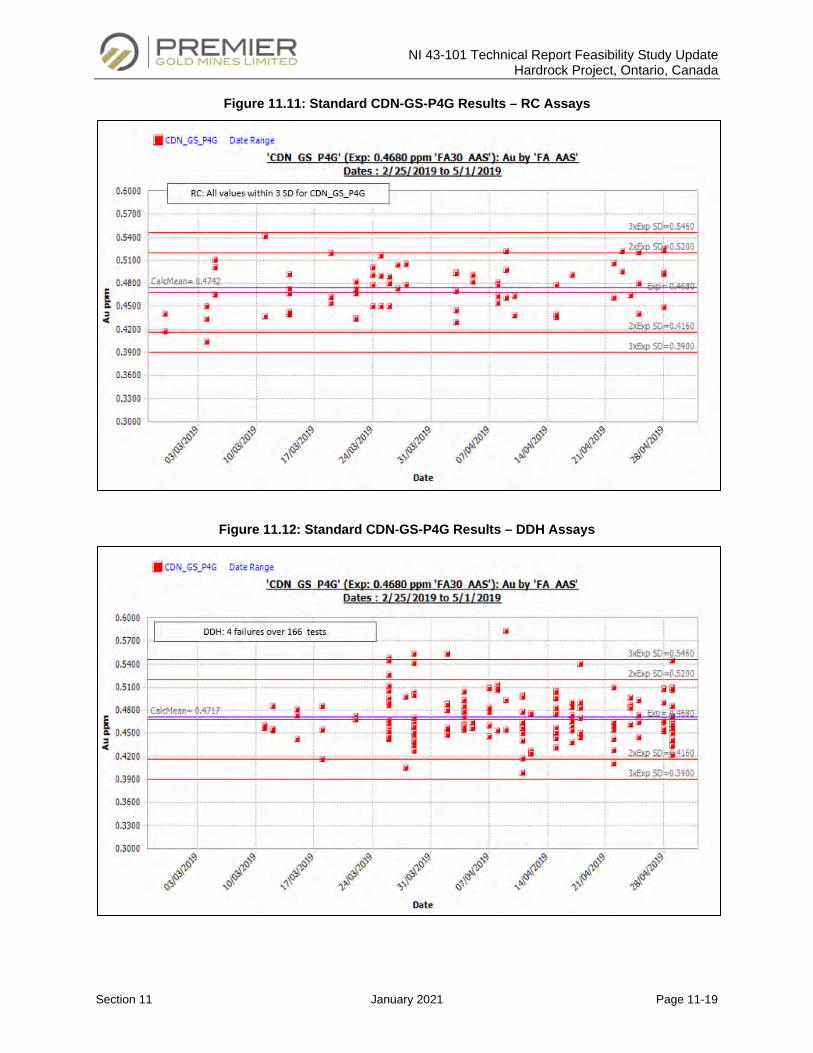
NI 43-101 Technical Report Feasibility Study Update Hardrock Project, Ontario, Canada
Section 11 January 2021 Page 11-19
Figure 11.11: Standard CDN-GS-P4G Results – RC Assays
Figure 11.12: Standard CDN-GS-P4G Results – DDH Assays
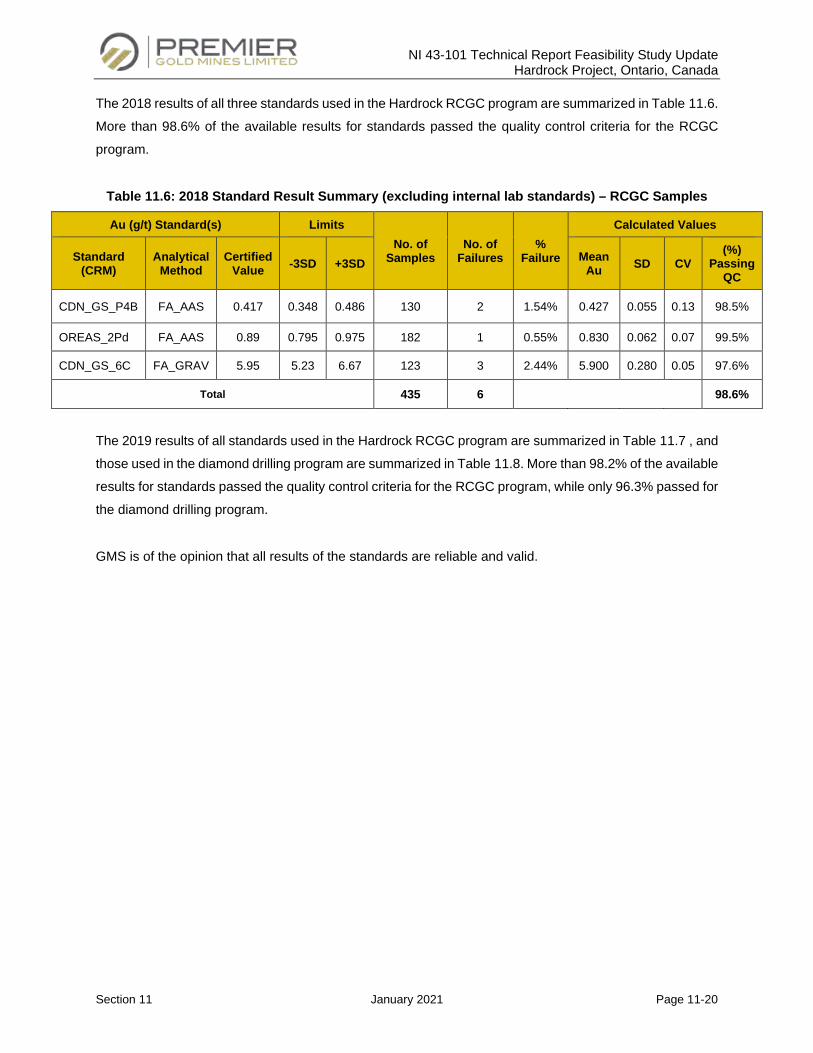
NI 43-101 Technical Report Feasibility Study Update Hardrock Project, Ontario, Canada
Section 11 January 2021 Page 11-20
The 2018 results of all three standards used in the Hardrock RCGC program are summarized in Table 11.6.
More than 98.6% of the available results for standards passed the quality control criteria for the RCGC
program.
Table 11.6: 2018 Standard Result Summary (excluding internal lab standards) – RCGC Samples
Au (g/t) Standard(s) Limits No. of
Samples No. of
Failures %
Failure
Calculated Values
Standard (CRM)
Analytical Method
Certified Value -3SD +3SD Mean
Au SD CV (%)
Passing QC
CDN_GS_P4B FA_AAS 0.417 0.348 0.486 130 2 1.54% 0.427 0.055 0.13 98.5%
OREAS_2Pd FA_AAS 0.89 0.795 0.975 182 1 0.55% 0.830 0.062 0.07 99.5%
CDN_GS_6C FA_GRAV 5.95 5.23 6.67 123 3 2.44% 5.900 0.280 0.05 97.6%
Total 435 6 98.6%
The 2019 results of all standards used in the Hardrock RCGC program are summarized in Table 11.7 , and
those used in the diamond drilling program are summarized in Table 11.8. More than 98.2% of the available
results for standards passed the quality control criteria for the RCGC program, while only 96.3% passed for
the diamond drilling program.
GMS is of the opinion that all results of the standards are reliable and valid.
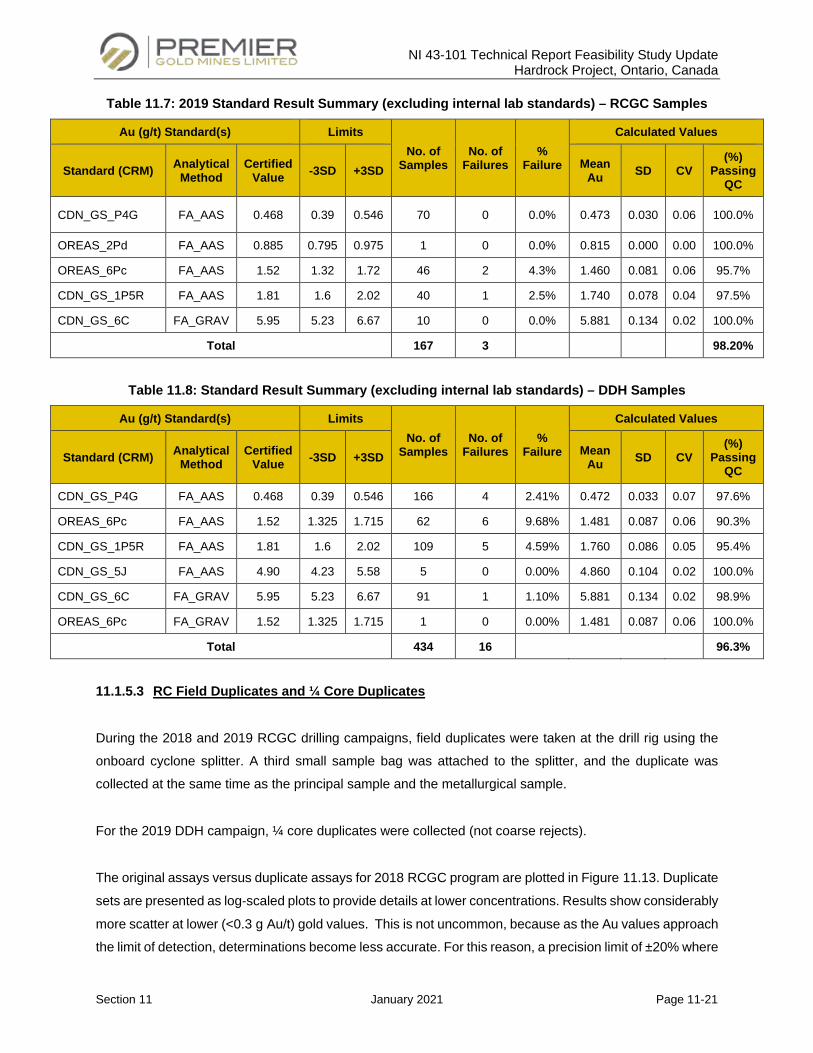
NI 43-101 Technical Report Feasibility Study Update Hardrock Project, Ontario, Canada
Section 11 January 2021 Page 11-21
Table 11.7: 2019 Standard Result Summary (excluding internal lab standards) – RCGC Samples
Au (g/t) Standard(s) Limits No. of
Samples No. of
Failures %
Failure
Calculated Values
Standard (CRM) Analytical Method
Certified Value -3SD +3SD Mean
Au SD CV (%)
Passing QC
CDN_GS_P4G FA_AAS 0.468 0.39 0.546 70 0 0.0% 0.473 0.030 0.06 100.0%
OREAS_2Pd FA_AAS 0.885 0.795 0.975 1 0 0.0% 0.815 0.000 0.00 100.0%
OREAS_6Pc FA_AAS 1.52 1.32 1.72 46 2 4.3% 1.460 0.081 0.06 95.7%
CDN_GS_1P5R FA_AAS 1.81 1.6 2.02 40 1 2.5% 1.740 0.078 0.04 97.5%
CDN_GS_6C FA_GRAV 5.95 5.23 6.67 10 0 0.0% 5.881 0.134 0.02 100.0%
Total 167 3 98.20%
Table 11.8: Standard Result Summary (excluding internal lab standards) – DDH Samples
Au (g/t) Standard(s) Limits No. of
Samples No. of
Failures %
Failure
Calculated Values
Standard (CRM) Analytical Method
Certified Value -3SD +3SD Mean
Au SD CV (%)
Passing QC
CDN_GS_P4G FA_AAS 0.468 0.39 0.546 166 4 2.41% 0.472 0.033 0.07 97.6%
OREAS_6Pc FA_AAS 1.52 1.325 1.715 62 6 9.68% 1.481 0.087 0.06 90.3%
CDN_GS_1P5R FA_AAS 1.81 1.6 2.02 109 5 4.59% 1.760 0.086 0.05 95.4%
CDN_GS_5J FA_AAS 4.90 4.23 5.58 5 0 0.00% 4.860 0.104 0.02 100.0%
CDN_GS_6C FA_GRAV 5.95 5.23 6.67 91 1 1.10% 5.881 0.134 0.02 98.9%
OREAS_6Pc FA_GRAV 1.52 1.325 1.715 1 0 0.00% 1.481 0.087 0.06 100.0%
Total 434 16 96.3%
11.1.5.3 RC Field Duplicates and ¼ Core Duplicates
During the 2018 and 2019 RCGC drilling campaigns, field duplicates were taken at the drill rig using the
onboard cyclone splitter. A third small sample bag was attached to the splitter, and the duplicate was
collected at the same time as the principal sample and the metallurgical sample.
For the 2019 DDH campaign, ¼ core duplicates were collected (not coarse rejects).
The original assays versus duplicate assays for 2018 RCGC program are plotted in Figure 11.13. Duplicate
sets are presented as log‐scaled plots to provide details at lower concentrations. Results show considerably
more scatter at lower (<0.3 g Au/t) gold values. This is not uncommon, because as the Au values approach
the limit of detection, determinations become less accurate. For this reason, a precision limit of ±20% where
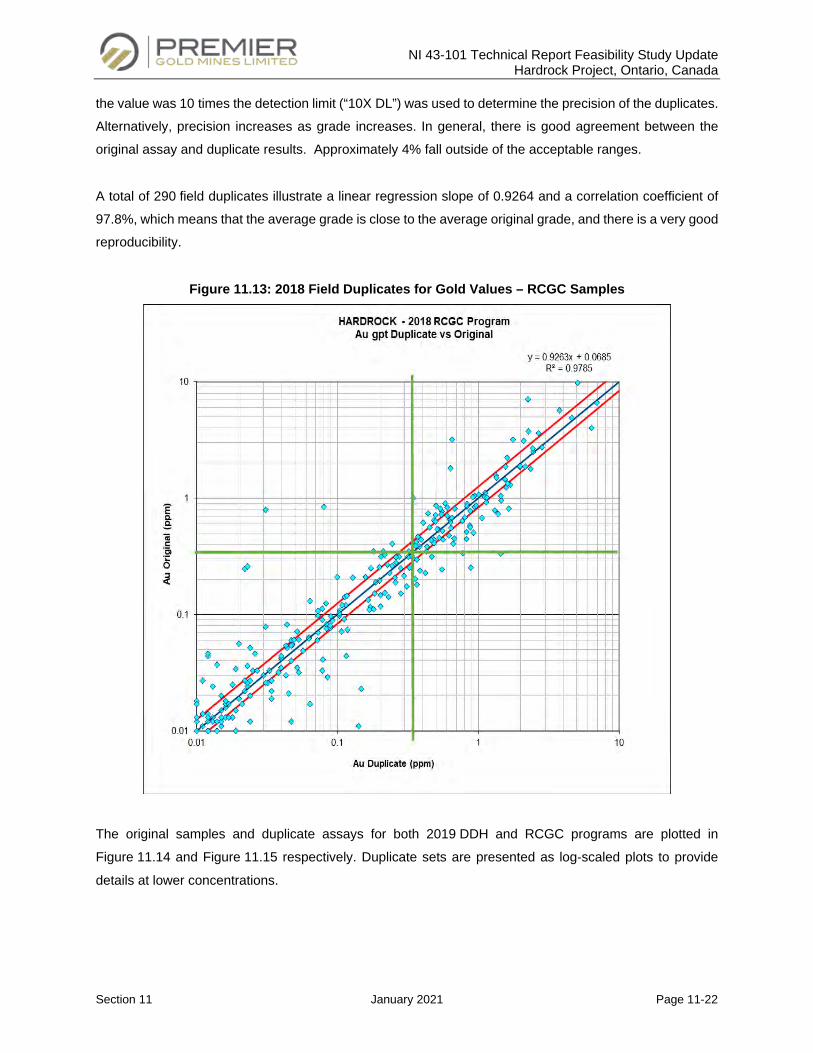
NI 43-101 Technical Report Feasibility Study Update Hardrock Project, Ontario, Canada
Section 11 January 2021 Page 11-22
the value was 10 times the detection limit (“10X DL”) was used to determine the precision of the duplicates.
Alternatively, precision increases as grade increases. In general, there is good agreement between the
original assay and duplicate results. Approximately 4% fall outside of the acceptable ranges.
A total of 290 field duplicates illustrate a linear regression slope of 0.9264 and a correlation coefficient of
97.8%, which means that the average grade is close to the average original grade, and there is a very good
reproducibility.
Figure 11.13: 2018 Field Duplicates for Gold Values – RCGC Samples
The original samples and duplicate assays for both 2019 DDH and RCGC programs are plotted in
Figure 11.14 and Figure 11.15 respectively. Duplicate sets are presented as log‐scaled plots to provide
details at lower concentrations.
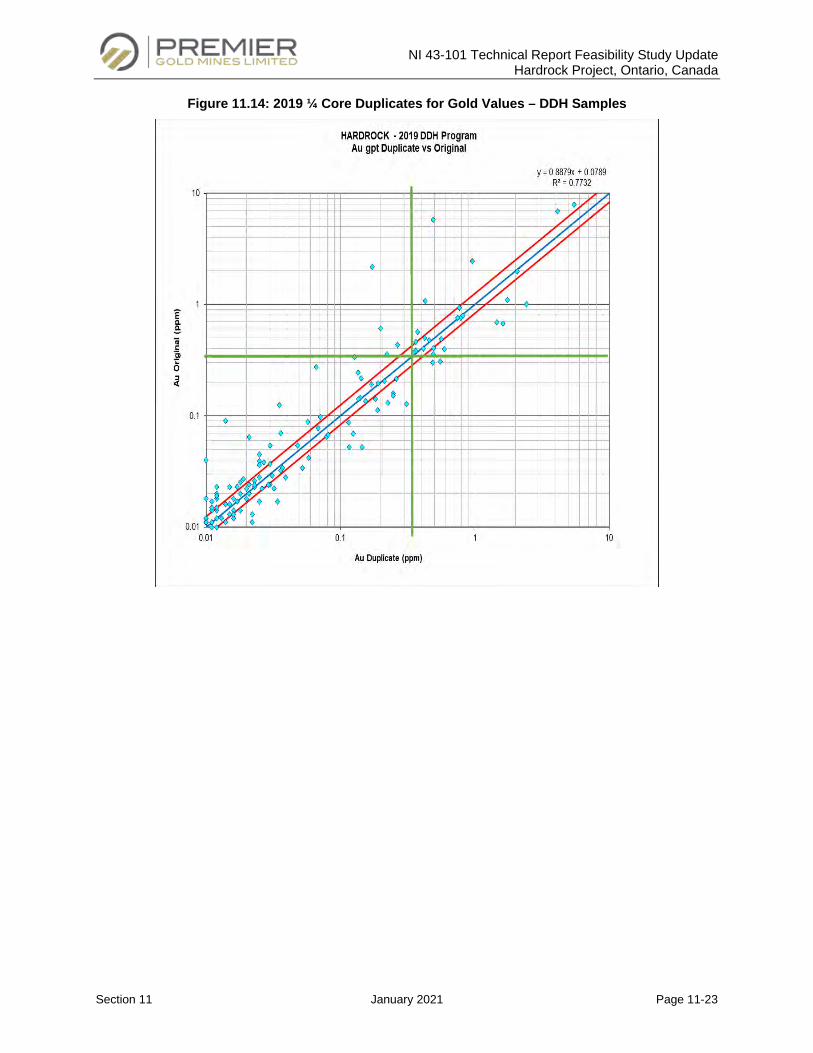
NI 43-101 Technical Report Feasibility Study Update Hardrock Project, Ontario, Canada
Section 11 January 2021 Page 11-23
Figure 11.14: 2019 ¼ Core Duplicates for Gold Values – DDH Samples
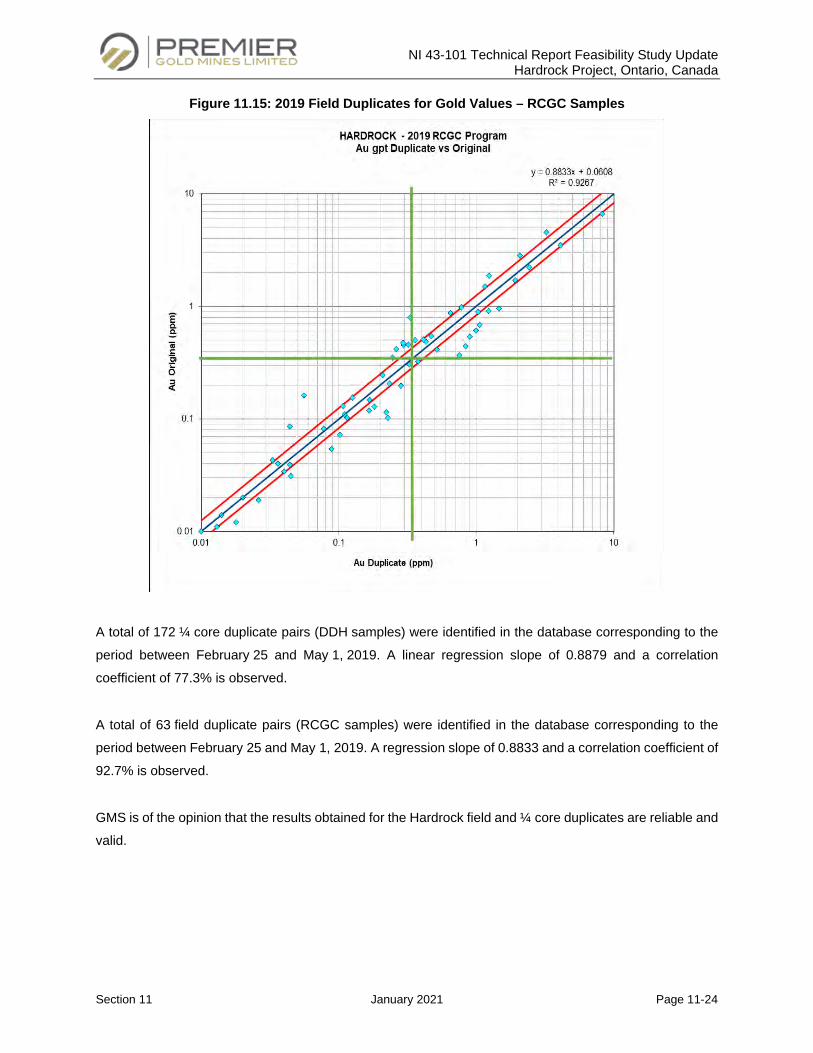
NI 43-101 Technical Report Feasibility Study Update Hardrock Project, Ontario, Canada
Section 11 January 2021 Page 11-24
Figure 11.15: 2019 Field Duplicates for Gold Values – RCGC Samples
A total of 172 ¼ core duplicate pairs (DDH samples) were identified in the database corresponding to the
period between February 25 and May 1, 2019. A linear regression slope of 0.8879 and a correlation
coefficient of 77.3% is observed.
A total of 63 field duplicate pairs (RCGC samples) were identified in the database corresponding to the
period between February 25 and May 1, 2019. A regression slope of 0.8833 and a correlation coefficient of
92.7% is observed.
GMS is of the opinion that the results obtained for the Hardrock field and ¼ core duplicates are reliable and
valid.
NI 43-101 Technical Report Feasibility Study Update Hardrock Project, Ontario, Canada
Section 11 January 2021 Page 11-25
11.1.6 QP Conclusions
A statistical analysis of the QA/QC data provided by GGM did not reveal any significant analytical issues.
GMS is of the opinion that the sample preparation, analysis, QA/QC and security protocols used for the
Hardrock Project follow generally accepted industry standards and that the data is of sufficient quality to be
used for Mineral Resource estimation.
11.2 Brookbank, Kailey and Key Lake Deposits
The following information is based on data provided by GGM and an earlier technical reports prepared by
Scott Wilson RPA in 2009 and GMS in 2016.
11.2.1 Historical Sampling Procedures and QA/QC (Pre-Premier Gold Involvement)
11.2.1.1 Brookbank
Prior to Ontex Resources Ltd. (“Ontex”) fully involvement on the property in October 1998, descriptions of
sampling and gold assaying methodologies are not available. The majority of analyzes focused on gold,
and less often silver, using a fire assay with a gravimetric finish as analytical method. The grade results
were expressed in ounces per ton (until the mid-1990s) and in grams per metric tonne afterward.
During 1999 to 2009 drilling campaigns, Ontex mainly used either the Activation (“Actlabs”) Laboratories
(Geraldton, Ontario) or Swastika Laboratories Ltd. (Swastika, Ontario) for analysis of drill core samples.
Swastika Laboratories Ltd. (“Swastika”) was ISO 9001:2000 registered and accredited by the Standards
Council of Canada.
Replicate samples were assayed at Accurassay Laboratories ("Accurassay") in Thunder Bay, Ontario.
Accurassay is an accredited Laboratory by the Standards Council of Canada and conforms to requirements
of ISO/IEC 17025.
The sample preparation and analysis procedures used by Swastika, which performed all the assaying for
Ontex drilling programs, are summarized as below.
NI 43-101 Technical Report Feasibility Study Update Hardrock Project, Ontario, Canada
Section 11 January 2021 Page 11-26
Sample Preparation and Analyses
11.2.1.1.1.1 Swastika Laboratories Each sample shipment was checked for the count of sample, the condition of the packaging, the integrity
of the sample’s seals, and the customer’s analysis instructions. Any damage, evidence of altering original
batches, and/or missing sample containers are noted and immediately reported.
The following information was derived from the RPA 2009 technical report and describes the Ontex sample
preparation prior to assaying at Swastika Laboratories:
• Depending on the moisture content of the customer sample, the entire sample was either air-dried
or oven-dried in a clean metal pan prior to crushing.
• The entire dried sample was passed through a jaw crusher to arrive at a prepared sample, 80% or
more of which is passing through a ten mesh (1,700 microns) screen. The crushed material was
split successively in a riffle divider to arrive at a subsample of 300 g to 400 g. The subsample was
placed in a labelled envelope for pulverizing.
• The subsample was pulverized in a ring and puck pulverizer to enabling 90% to 95% of the material
to pass through a 100 mesh (150 microns) screen. Methyl hydrate was added to the sample prior to
pulverizing to prevent clumping.
• The pulverized material from the bowl, ring and puck was carefully brushed onto a rubber mat from
which it was poured back into the labelled envelope.
Gold assay procedures were described as follows:
• A one assay 1 kg sample was drawn of pulverized material, weighed and placed into 30 g crucible
containing flux. Crucibles were marked with the customer name, sample number and certificate
number.
• Depending on rock type, varying amounts of flour, silica and borax were added to ensure a proper
fusion from the crucible.
• The crucible containing the sample, flux and other necessary ingredients were fully mixed in a
tumbler prior to fusion in the furnace oven.
• The crucible was placed in the fusion oven and heated until a proper fusion was completed, after
which it was removed, and the contents were transferred into a metal mould for cooling and
solidification.
NI 43-101 Technical Report Feasibility Study Update Hardrock Project, Ontario, Canada
Section 11 January 2021 Page 11-27
• The solidified material was hammered to remove the slag and the lead button was placed in a cupel.
• The cupel including the lead button was placed into a furnace until all the lead had been absorbed
into the cupel.
• The gold bead was removed from the cupel and placed in a porcelain cup containing parting acid
(7:1 concentration of nitric acid and distilled water). The contents were heated in a hot water bath
and the solution was thereafter decanted.
• The bead was dried in a hot water bath and a visual assessment was made to proceed with either
a gravimetric or an atomic absorption spectrometry analytical method.
• Precious metal beads from the cupel furnace were assayed for gold content using AA spectrometry
or gravimetric (“GRAV”) techniques.
• In the AA technique, the gold bead was dissolved in five mm of aqua regia in a porcelain cup and
then cooled at room temperature. The solution was then analyzed by an AA spectrometer to
determine the gold grade results.
• In the gravimetric technique, the gold bead is carefully removed from the porcelain cup and weighed
using a microbalance. The gold calculation is based on a sample amount of 29.166 g. Gravimetric
method ere normally used when the assay result was over 2 g Au/t.
• All grades obtained are reported in either parts per million or grams per tonne.
The internal Quality Control at Swastika Laboratory was carried-out by using in-house or Canmet certified
standards, blanks and by re-assaying at least 10% of all samples. All data are evaluated by supervisor and
additional checks were run on presence of anomalous values.
11.2.1.1.1.2 Accurassay The description below, excerpted from RPA 2009 technical report, discuss the sample preparation and gold
analyses performed on drill core samples at Accurassay Laboratories.
All rock samples were entered into Accurassay’s Information Management System (“LIMS”). The samples
were dried, crushed to approximately eight mesh (2,360 microns) and then a 250 g to 500 g subsample
was taken. The subsample was pulverized to 90% passing 150 mesh (106 microns) and then matted to
ensure homogeneity. To prevent cross contamination, silica sand was used after each sample was
pulverized. The homogeneous sample was then sent for gold analysis with the analytical method required.
NI 43-101 Technical Report Feasibility Study Update Hardrock Project, Ontario, Canada
Section 11 January 2021 Page 11-28
Accurassay gold analysis procedures were described as follows:
• For the analysis of precious metals, the sample is mixed with a lead-based flux and fused for one
hour and fifteen minutes.
• Each sample has a silver solution added to it prior to fusion, producing a precious metal bead after
cupellation.
• The button was placed in a cupelling furnace.
• All the lead was absorbed by the cupel, and a silver bead, which contained any gold was left in the
cupel.
• The cupel was removed from the furnace and cooled, the silver bead is placed in an appropriately
labelled test tube and digested using aqua regia.
• The samples were diluted with one millilitre of distilled deionized water and one millilitre of 1%
digested lanthanum solution. The samples were cooled and mixed to ensure homogeneity of the
solution.
• The samples were analyzed for gold using AA spectroscopy.
• The results for the AA technique were checked by the technician and then forwarded to data entry,
by means of electronic transfer, and a certificate is produced.
• The Laboratory Manager validated the data and the certificates. The results were sent in the client
requested format.
• Accurassay had an internal threshold that automatically sent back samples greater than 30 g Au/t
to be verified by re-assay (assayed in triplicate) to ensure reproducibility.
• Ontex samples grading greater than 30 g Au/t would have been verified by Accurassay internally
but not reported. Gravimetric analysis is offered only by request.
• Accurassay employed an internal quality control system that tracks certified reference materials and
in-house quality assurance standards.
• Accurassay used a combination of reference materials, including reference materials purchased
from CANMET, standards created in-house by Accurassay and tested by round-robin with
laboratories across Canada, and ISO certified calibration standards purchased from suppliers.
11.2.1.1.1.3 Actlabs The details of sample preparation and analysis performed for gold at Actlabs in 2009, are similar to the
description discussed in Subsections 11.1.3.1, 11.1.3.2 and 11.1.3.3.
NI 43-101 Technical Report Feasibility Study Update Hardrock Project, Ontario, Canada
Section 11 January 2021 Page 11-29
Ontex QA/QC Program
11.2.1.1.2.1 Blanks Ontex procedures stipulated that field blanks were inserted immediately after a potential high-grade
intercept. The field blanks were sourced from four different locations:
• An aggregate consisting of landscape limestone purchased from a grocery store in Geraldton,
Ontario;
• Split core consisting of gabbro from a previous Brookbank drill hole that contains no visible sulphide
mineralization;
• Fragments of granite collected from a nearby road cut;
• Certified blanks.
GMS verified the barren material results with the original certificates obtained from GGM exploration team.
Not all the original certificates from Swastika are available for validation. Figure 11.16 illustrates some of
the blanks results analyzed at Swastika during the Ontex drilling program in 2009.
In total, 23 of 41 blanks were available to be corroborated and verified with the original laboratory certificate
and the results show that blanks are below the control limit of 10 times the detection limit. No evidence of
contamination was observed between April to August 2009.
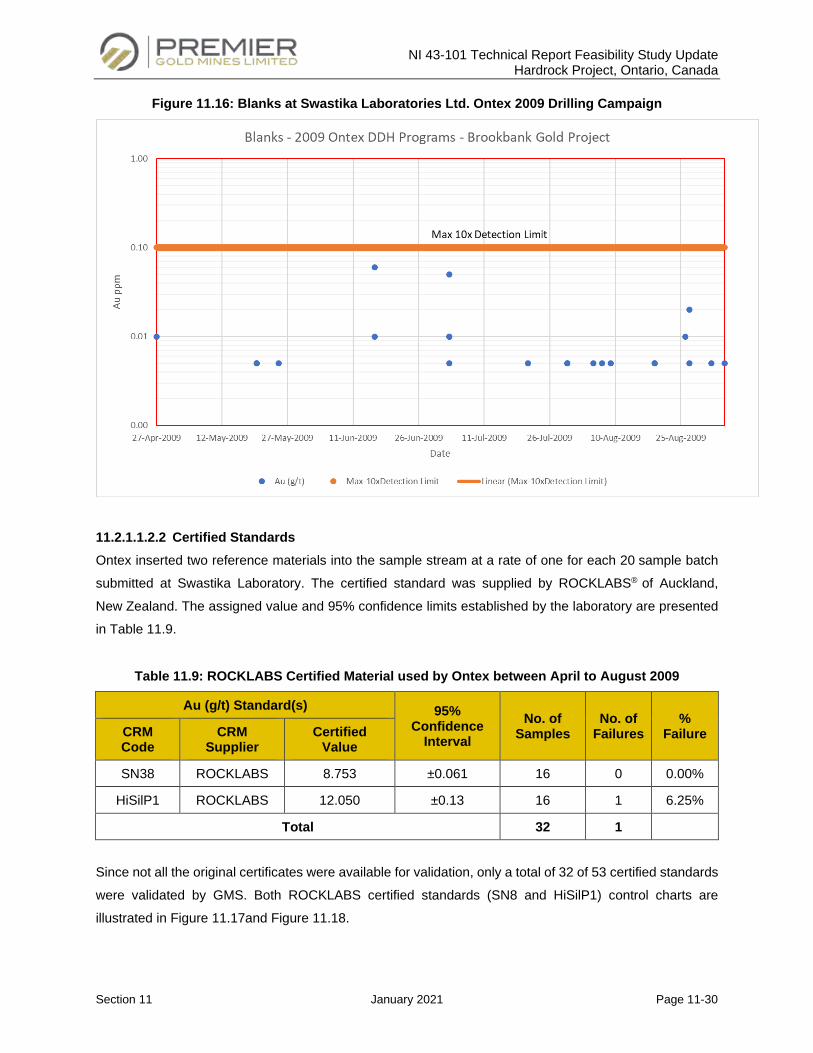
NI 43-101 Technical Report Feasibility Study Update Hardrock Project, Ontario, Canada
Section 11 January 2021 Page 11-30
Figure 11.16: Blanks at Swastika Laboratories Ltd. Ontex 2009 Drilling Campaign
11.2.1.1.2.2 Certified Standards Ontex inserted two reference materials into the sample stream at a rate of one for each 20 sample batch
submitted at Swastika Laboratory. The certified standard was supplied by ROCKLABS® of Auckland,
New Zealand. The assigned value and 95% confidence limits established by the laboratory are presented
in Table 11.9.
Table 11.9: ROCKLABS Certified Material used by Ontex between April to August 2009
Au (g/t) Standard(s) 95% Confidence
Interval No. of
Samples No. of
Failures %
Failure CRM Code
CRM Supplier
Certified Value
SN38 ROCKLABS 8.753 ±0.061 16 0 0.00%
HiSilP1 ROCKLABS 12.050 ±0.13 16 1 6.25%
Total 32 1
Since not all the original certificates were available for validation, only a total of 32 of 53 certified standards
were validated by GMS. Both ROCKLABS certified standards (SN8 and HiSilP1) control charts are
illustrated in Figure 11.17and Figure 11.18.
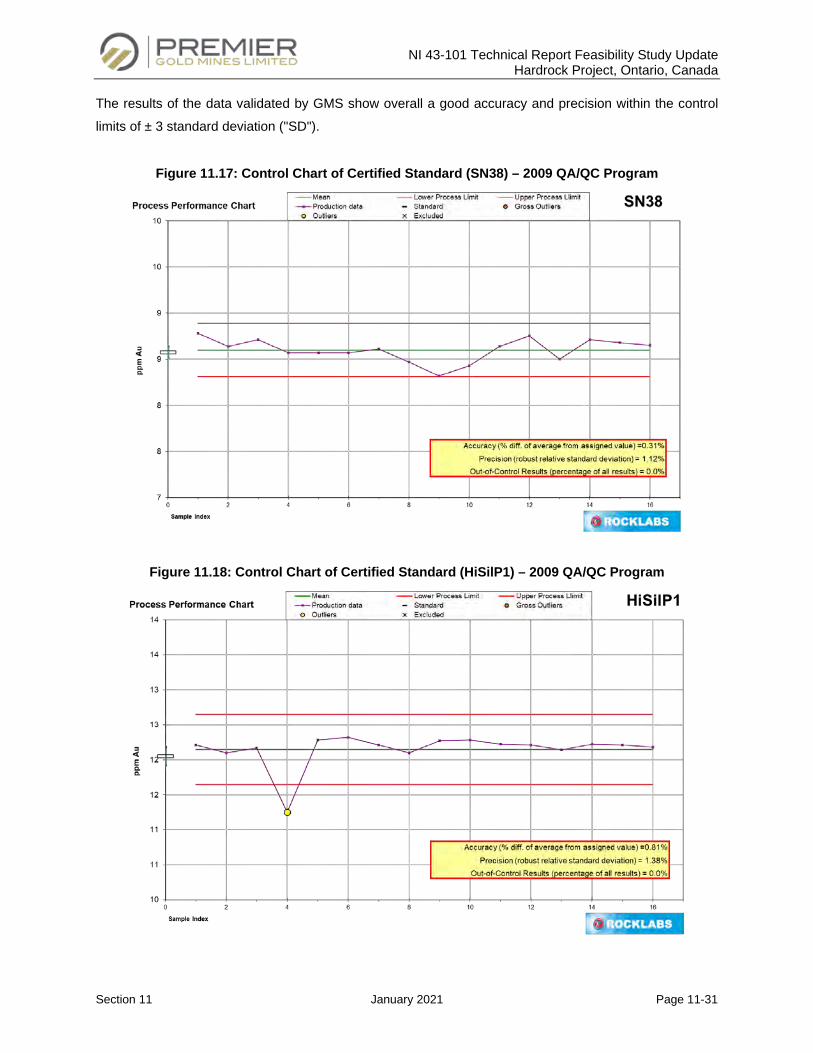
NI 43-101 Technical Report Feasibility Study Update Hardrock Project, Ontario, Canada
Section 11 January 2021 Page 11-31
The results of the data validated by GMS show overall a good accuracy and precision within the control
limits of ± 3 standard deviation ("SD").
Figure 11.17: Control Chart of Certified Standard (SN38) – 2009 QA/QC Program
Figure 11.18: Control Chart of Certified Standard (HiSilP1) – 2009 QA/QC Program
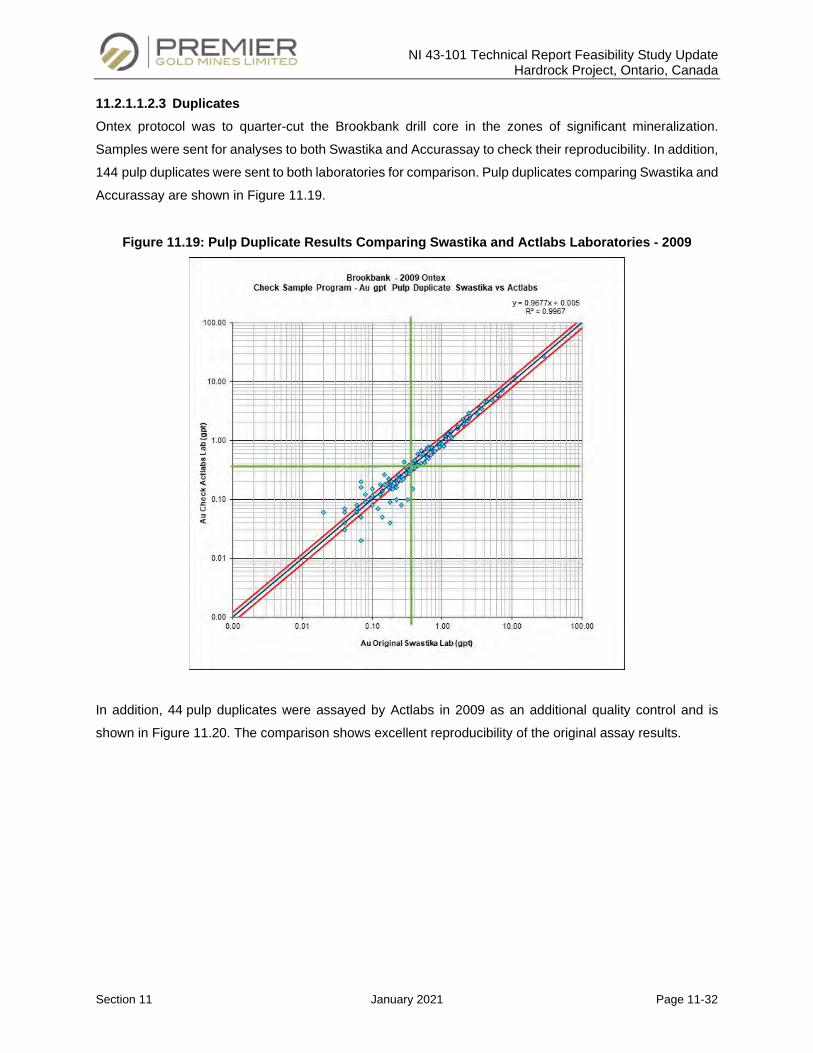
NI 43-101 Technical Report Feasibility Study Update Hardrock Project, Ontario, Canada
Section 11 January 2021 Page 11-32
11.2.1.1.2.3 Duplicates Ontex protocol was to quarter-cut the Brookbank drill core in the zones of significant mineralization.
Samples were sent for analyses to both Swastika and Accurassay to check their reproducibility. In addition,
144 pulp duplicates were sent to both laboratories for comparison. Pulp duplicates comparing Swastika and
Accurassay are shown in Figure 11.19.
Figure 11.19: Pulp Duplicate Results Comparing Swastika and Actlabs Laboratories - 2009
In addition, 44 pulp duplicates were assayed by Actlabs in 2009 as an additional quality control and is
shown in Figure 11.20. The comparison shows excellent reproducibility of the original assay results.
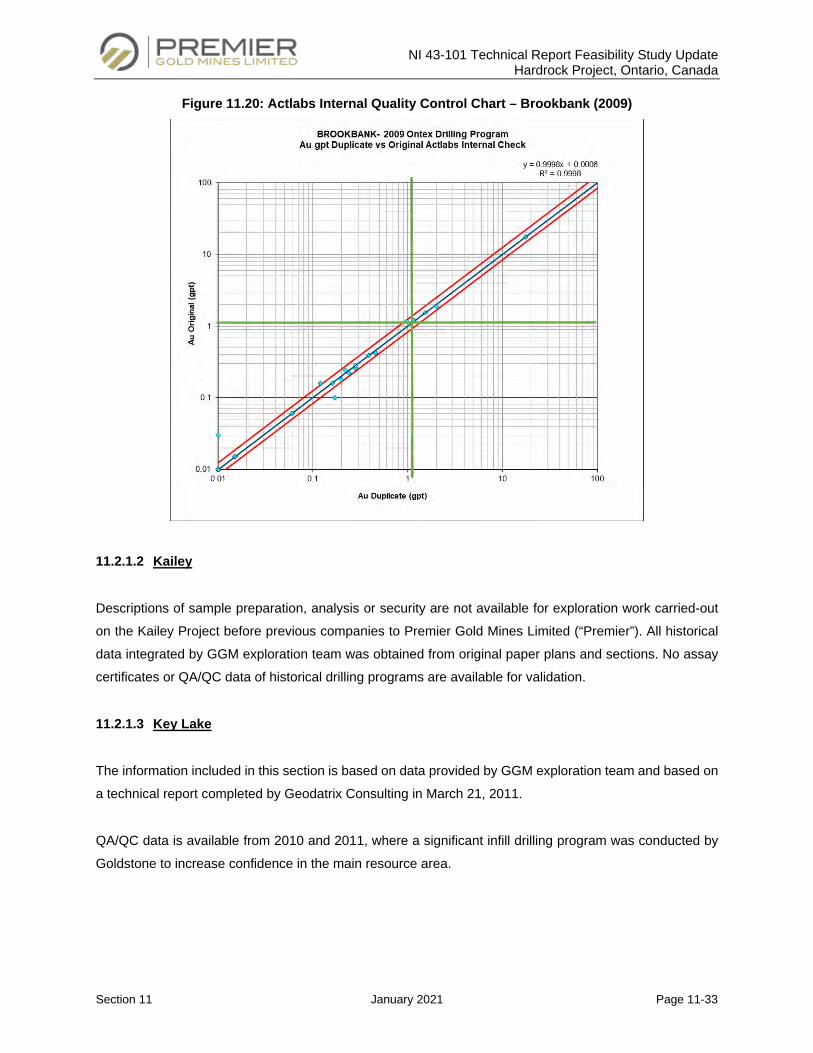
NI 43-101 Technical Report Feasibility Study Update Hardrock Project, Ontario, Canada
Section 11 January 2021 Page 11-33
Figure 11.20: Actlabs Internal Quality Control Chart – Brookbank (2009)
11.2.1.2 Kailey
Descriptions of sample preparation, analysis or security are not available for exploration work carried-out
on the Kailey Project before previous companies to Premier Gold Mines Limited (“Premier”). All historical
data integrated by GGM exploration team was obtained from original paper plans and sections. No assay
certificates or QA/QC data of historical drilling programs are available for validation.
11.2.1.3 Key Lake
The information included in this section is based on data provided by GGM exploration team and based on
a technical report completed by Geodatrix Consulting in March 21, 2011.
QA/QC data is available from 2010 and 2011, where a significant infill drilling program was conducted by
Goldstone to increase confidence in the main resource area.
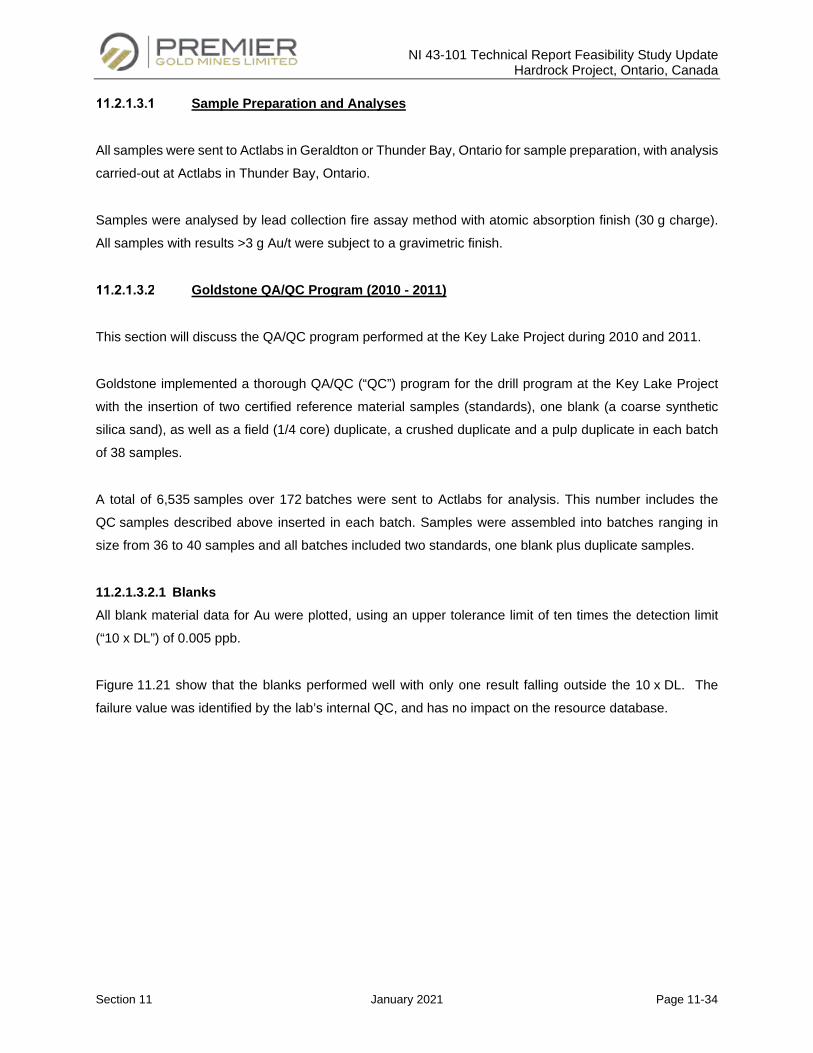
NI 43-101 Technical Report Feasibility Study Update Hardrock Project, Ontario, Canada
Section 11 January 2021 Page 11-34
Sample Preparation and Analyses
All samples were sent to Actlabs in Geraldton or Thunder Bay, Ontario for sample preparation, with analysis
carried-out at Actlabs in Thunder Bay, Ontario.
Samples were analysed by lead collection fire assay method with atomic absorption finish (30 g charge).
All samples with results >3 g Au/t were subject to a gravimetric finish.
Goldstone QA/QC Program (2010 - 2011)
This section will discuss the QA/QC program performed at the Key Lake Project during 2010 and 2011.
Goldstone implemented a thorough QA/QC (“QC”) program for the drill program at the Key Lake Project
with the insertion of two certified reference material samples (standards), one blank (a coarse synthetic
silica sand), as well as a field (1/4 core) duplicate, a crushed duplicate and a pulp duplicate in each batch
of 38 samples.
A total of 6,535 samples over 172 batches were sent to Actlabs for analysis. This number includes the
QC samples described above inserted in each batch. Samples were assembled into batches ranging in
size from 36 to 40 samples and all batches included two standards, one blank plus duplicate samples.
11.2.1.3.2.1 Blanks All blank material data for Au were plotted, using an upper tolerance limit of ten times the detection limit
(“10 x DL”) of 0.005 ppb.
Figure 11.21 show that the blanks performed well with only one result falling outside the 10 x DL. The
failure value was identified by the lab’s internal QC, and has no impact on the resource database.
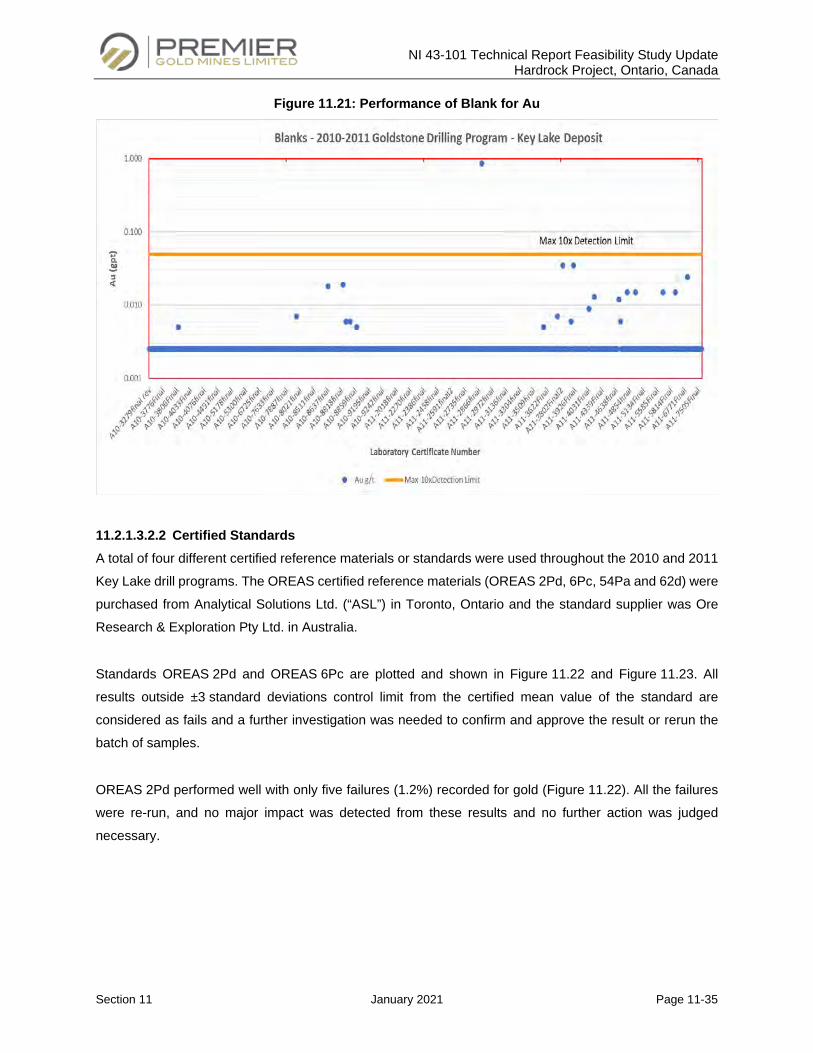
NI 43-101 Technical Report Feasibility Study Update Hardrock Project, Ontario, Canada
Section 11 January 2021 Page 11-35
Figure 11.21: Performance of Blank for Au
11.2.1.3.2.2 Certified Standards A total of four different certified reference materials or standards were used throughout the 2010 and 2011
Key Lake drill programs. The OREAS certified reference materials (OREAS 2Pd, 6Pc, 54Pa and 62d) were
purchased from Analytical Solutions Ltd. (“ASL”) in Toronto, Ontario and the standard supplier was Ore
Research & Exploration Pty Ltd. in Australia.
Standards OREAS 2Pd and OREAS 6Pc are plotted and shown in Figure 11.22 and Figure 11.23. All
results outside ±3 standard deviations control limit from the certified mean value of the standard are
considered as fails and a further investigation was needed to confirm and approve the result or rerun the
batch of samples.
OREAS 2Pd performed well with only five failures (1.2%) recorded for gold (Figure 11.22). All the failures
were re-run, and no major impact was detected from these results and no further action was judged
necessary.
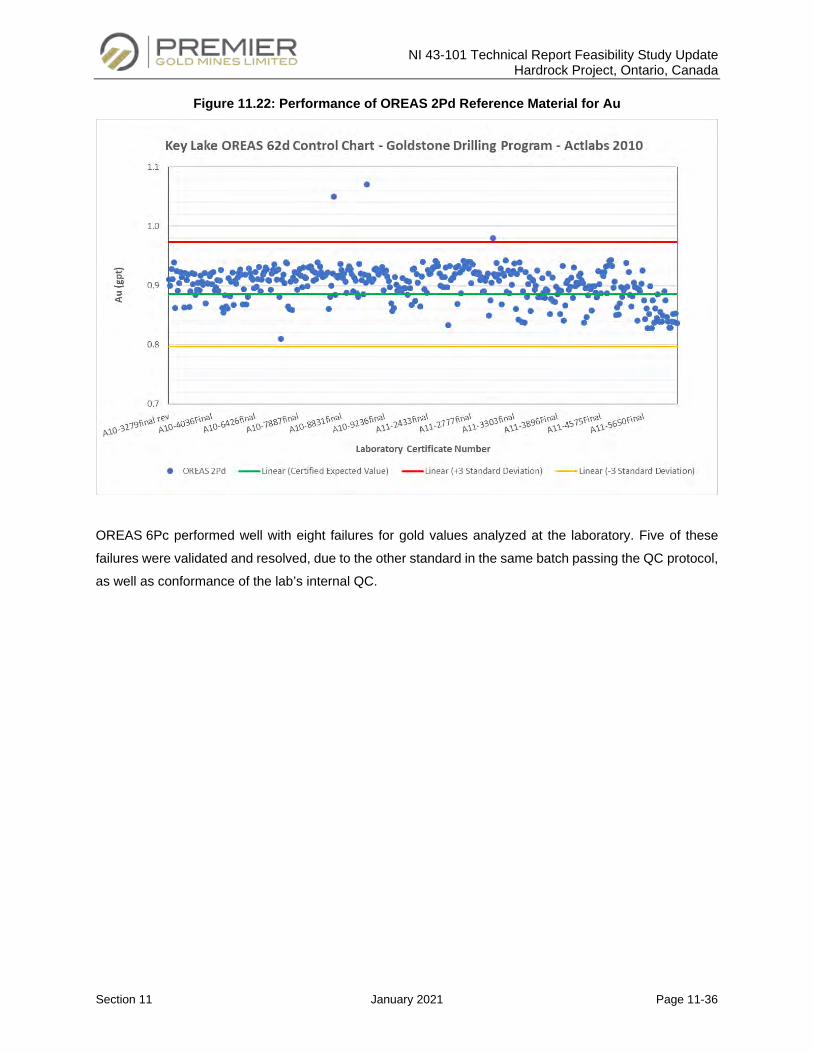
NI 43-101 Technical Report Feasibility Study Update Hardrock Project, Ontario, Canada
Section 11 January 2021 Page 11-36
Figure 11.22: Performance of OREAS 2Pd Reference Material for Au
OREAS 6Pc performed well with eight failures for gold values analyzed at the laboratory. Five of these
failures were validated and resolved, due to the other standard in the same batch passing the QC protocol,
as well as conformance of the lab’s internal QC.
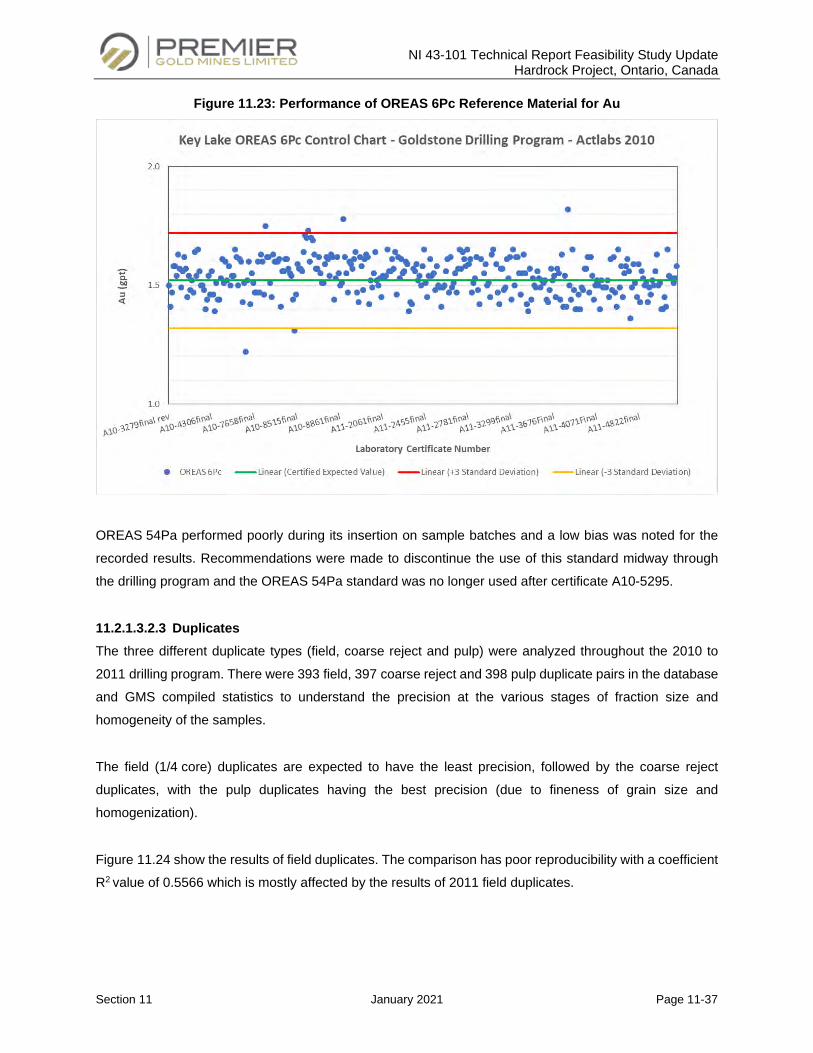
NI 43-101 Technical Report Feasibility Study Update Hardrock Project, Ontario, Canada
Section 11 January 2021 Page 11-37
Figure 11.23: Performance of OREAS 6Pc Reference Material for Au
OREAS 54Pa performed poorly during its insertion on sample batches and a low bias was noted for the
recorded results. Recommendations were made to discontinue the use of this standard midway through
the drilling program and the OREAS 54Pa standard was no longer used after certificate A10-5295.
11.2.1.3.2.3 Duplicates The three different duplicate types (field, coarse reject and pulp) were analyzed throughout the 2010 to
2011 drilling program. There were 393 field, 397 coarse reject and 398 pulp duplicate pairs in the database
and GMS compiled statistics to understand the precision at the various stages of fraction size and
homogeneity of the samples.
The field (1/4 core) duplicates are expected to have the least precision, followed by the coarse reject
duplicates, with the pulp duplicates having the best precision (due to fineness of grain size and
homogenization).
Figure 11.24 show the results of field duplicates. The comparison has poor reproducibility with a coefficient
R2 value of 0.5566 which is mostly affected by the results of 2011 field duplicates.
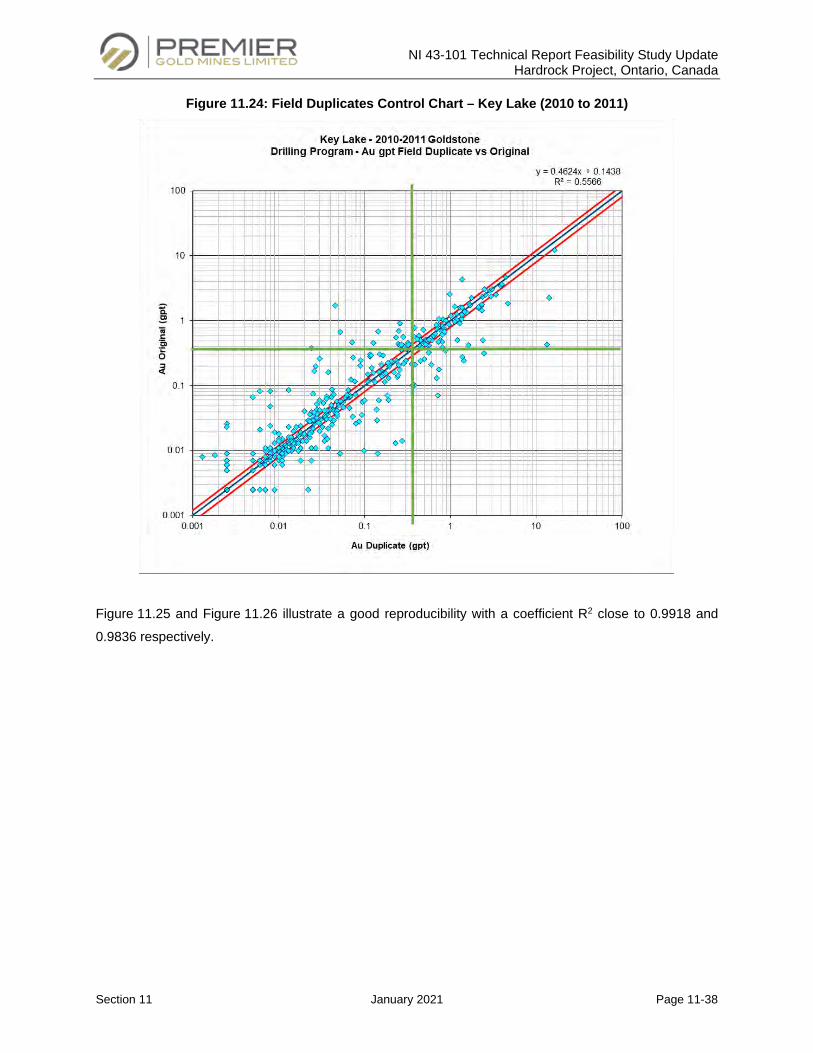
NI 43-101 Technical Report Feasibility Study Update Hardrock Project, Ontario, Canada
Section 11 January 2021 Page 11-38
Figure 11.24: Field Duplicates Control Chart – Key Lake (2010 to 2011)
Figure 11.25 and Figure 11.26 illustrate a good reproducibility with a coefficient R2 close to 0.9918 and
0.9836 respectively.
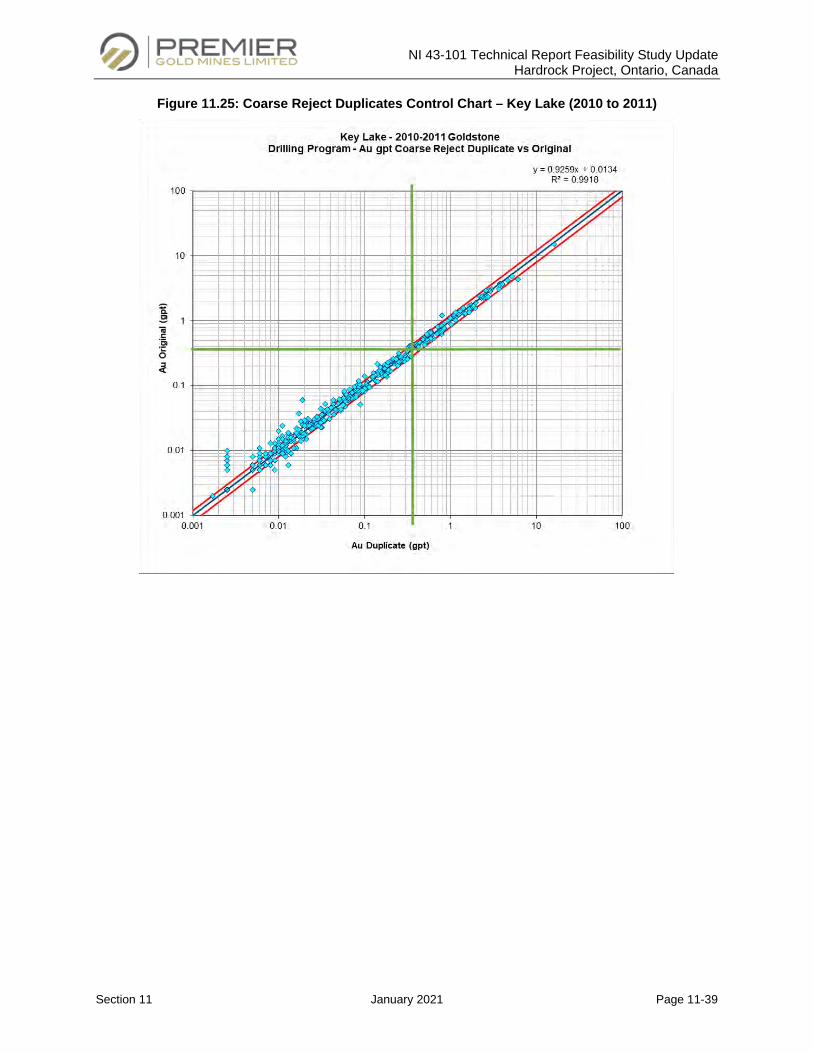
NI 43-101 Technical Report Feasibility Study Update Hardrock Project, Ontario, Canada
Section 11 January 2021 Page 11-39
Figure 11.25: Coarse Reject Duplicates Control Chart – Key Lake (2010 to 2011)
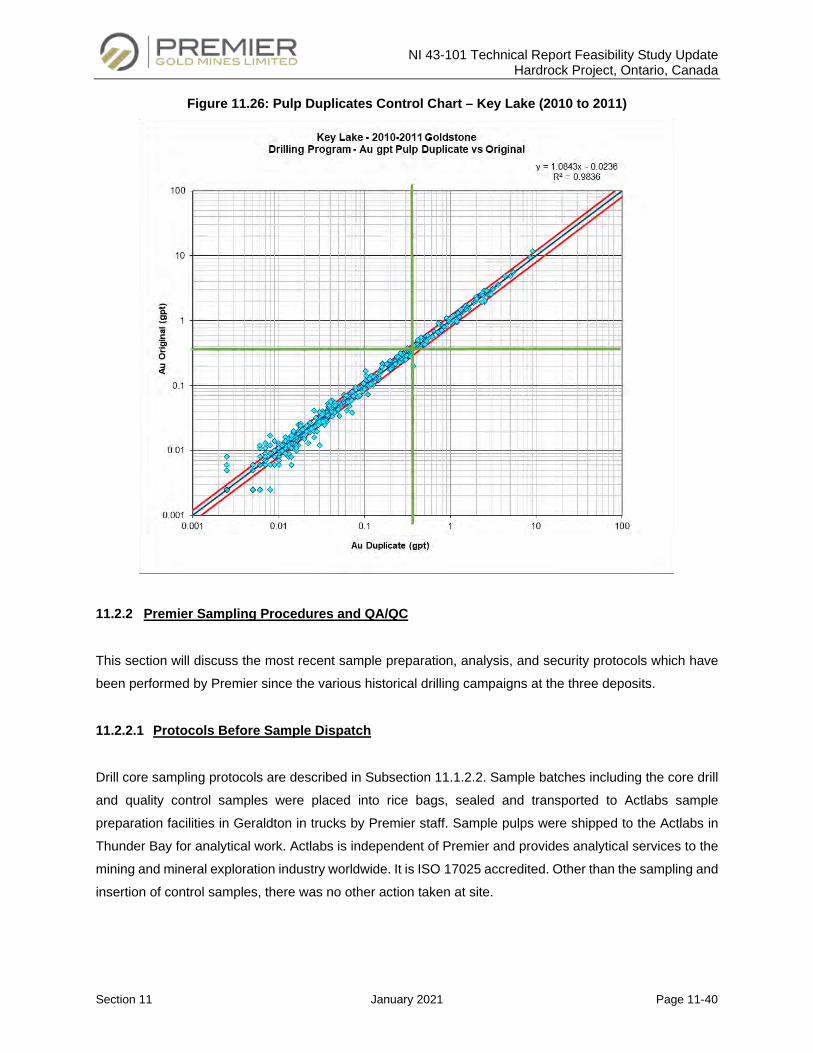
NI 43-101 Technical Report Feasibility Study Update Hardrock Project, Ontario, Canada
Section 11 January 2021 Page 11-40
Figure 11.26: Pulp Duplicates Control Chart – Key Lake (2010 to 2011)
11.2.2 Premier Sampling Procedures and QA/QC
This section will discuss the most recent sample preparation, analysis, and security protocols which have
been performed by Premier since the various historical drilling campaigns at the three deposits.
11.2.2.1 Protocols Before Sample Dispatch
Drill core sampling protocols are described in Subsection 11.1.2.2. Sample batches including the core drill
and quality control samples were placed into rice bags, sealed and transported to Actlabs sample
preparation facilities in Geraldton in trucks by Premier staff. Sample pulps were shipped to the Actlabs in
Thunder Bay for analytical work. Actlabs is independent of Premier and provides analytical services to the
mining and mineral exploration industry worldwide. It is ISO 17025 accredited. Other than the sampling and
insertion of control samples, there was no other action taken at site.
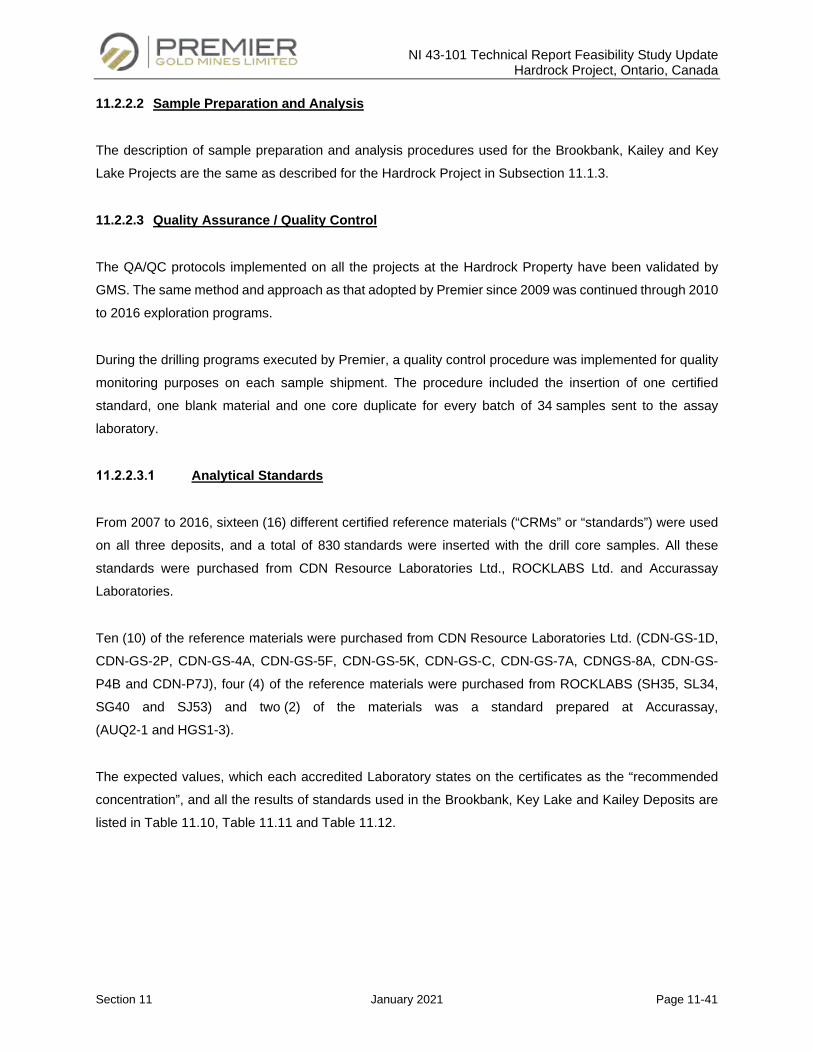
NI 43-101 Technical Report Feasibility Study Update Hardrock Project, Ontario, Canada
Section 11 January 2021 Page 11-41
11.2.2.2 Sample Preparation and Analysis
The description of sample preparation and analysis procedures used for the Brookbank, Kailey and Key
Lake Projects are the same as described for the Hardrock Project in Subsection 11.1.3.
11.2.2.3 Quality Assurance / Quality Control
The QA/QC protocols implemented on all the projects at the Hardrock Property have been validated by
GMS. The same method and approach as that adopted by Premier since 2009 was continued through 2010
to 2016 exploration programs.
During the drilling programs executed by Premier, a quality control procedure was implemented for quality
monitoring purposes on each sample shipment. The procedure included the insertion of one certified
standard, one blank material and one core duplicate for every batch of 34 samples sent to the assay
laboratory.
Analytical Standards
From 2007 to 2016, sixteen (16) different certified reference materials (“CRMs” or “standards”) were used
on all three deposits, and a total of 830 standards were inserted with the drill core samples. All these
standards were purchased from CDN Resource Laboratories Ltd., ROCKLABS Ltd. and Accurassay
Laboratories.
Ten (10) of the reference materials were purchased from CDN Resource Laboratories Ltd. (CDN-GS-1D,
CDN-GS-2P, CDN-GS-4A, CDN-GS-5F, CDN-GS-5K, CDN-GS-C, CDN-GS-7A, CDNGS-8A, CDN-GS-
P4B and CDN-P7J), four (4) of the reference materials were purchased from ROCKLABS (SH35, SL34,
SG40 and SJ53) and two (2) of the materials was a standard prepared at Accurassay,
(AUQ2-1 and HGS1-3).
The expected values, which each accredited Laboratory states on the certificates as the “recommended
concentration”, and all the results of standards used in the Brookbank, Key Lake and Kailey Deposits are
listed in Table 11.10, Table 11.11 and Table 11.12.
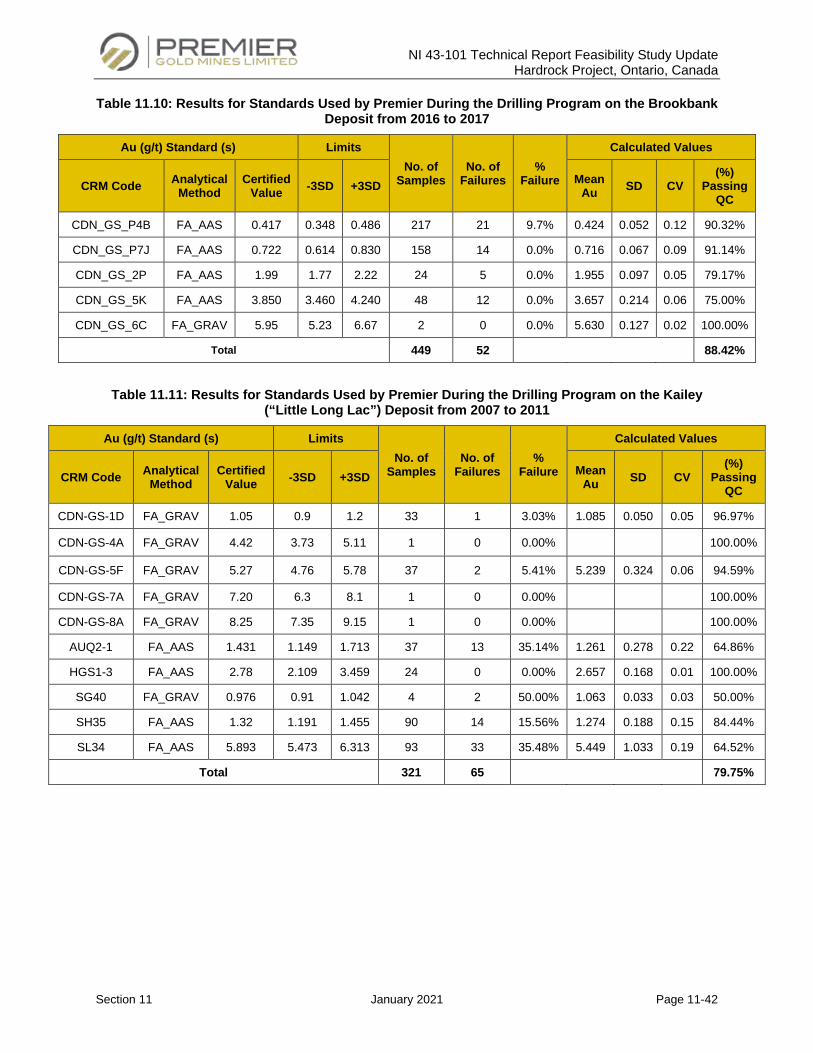
NI 43-101 Technical Report Feasibility Study Update Hardrock Project, Ontario, Canada
Section 11 January 2021 Page 11-42
Table 11.10: Results for Standards Used by Premier During the Drilling Program on the Brookbank Deposit from 2016 to 2017
Au (g/t) Standard (s) Limits No. of
Samples No. of
Failures %
Failure
Calculated Values
CRM Code Analytical Method
Certified Value -3SD +3SD Mean
Au SD CV (%)
Passing QC
CDN_GS_P4B FA_AAS 0.417 0.348 0.486 217 21 9.7% 0.424 0.052 0.12 90.32%
CDN_GS_P7J FA_AAS 0.722 0.614 0.830 158 14 0.0% 0.716 0.067 0.09 91.14%
CDN_GS_2P FA_AAS 1.99 1.77 2.22 24 5 0.0% 1.955 0.097 0.05 79.17%
CDN_GS_5K FA_AAS 3.850 3.460 4.240 48 12 0.0% 3.657 0.214 0.06 75.00%
CDN_GS_6C FA_GRAV 5.95 5.23 6.67 2 0 0.0% 5.630 0.127 0.02 100.00%
Total 449 52 88.42%
Table 11.11: Results for Standards Used by Premier During the Drilling Program on the Kailey (“Little Long Lac”) Deposit from 2007 to 2011
Au (g/t) Standard (s) Limits No. of
Samples No. of
Failures %
Failure
Calculated Values
CRM Code Analytical Method
Certified Value -3SD +3SD Mean
Au SD CV (%)
Passing QC
CDN-GS-1D FA_GRAV 1.05 0.9 1.2 33 1 3.03% 1.085 0.050 0.05 96.97%
CDN-GS-4A FA_GRAV 4.42 3.73 5.11 1 0 0.00% 100.00%
CDN-GS-5F FA_GRAV 5.27 4.76 5.78 37 2 5.41% 5.239 0.324 0.06 94.59%
CDN-GS-7A FA_GRAV 7.20 6.3 8.1 1 0 0.00% 100.00%
CDN-GS-8A FA_GRAV 8.25 7.35 9.15 1 0 0.00% 100.00%
AUQ2-1 FA_AAS 1.431 1.149 1.713 37 13 35.14% 1.261 0.278 0.22 64.86%
HGS1-3 FA_AAS 2.78 2.109 3.459 24 0 0.00% 2.657 0.168 0.01 100.00%
SG40 FA_GRAV 0.976 0.91 1.042 4 2 50.00% 1.063 0.033 0.03 50.00%
SH35 FA_AAS 1.32 1.191 1.455 90 14 15.56% 1.274 0.188 0.15 84.44%
SL34 FA_AAS 5.893 5.473 6.313 93 33 35.48% 5.449 1.033 0.19 64.52%
Total 321 65 79.75%
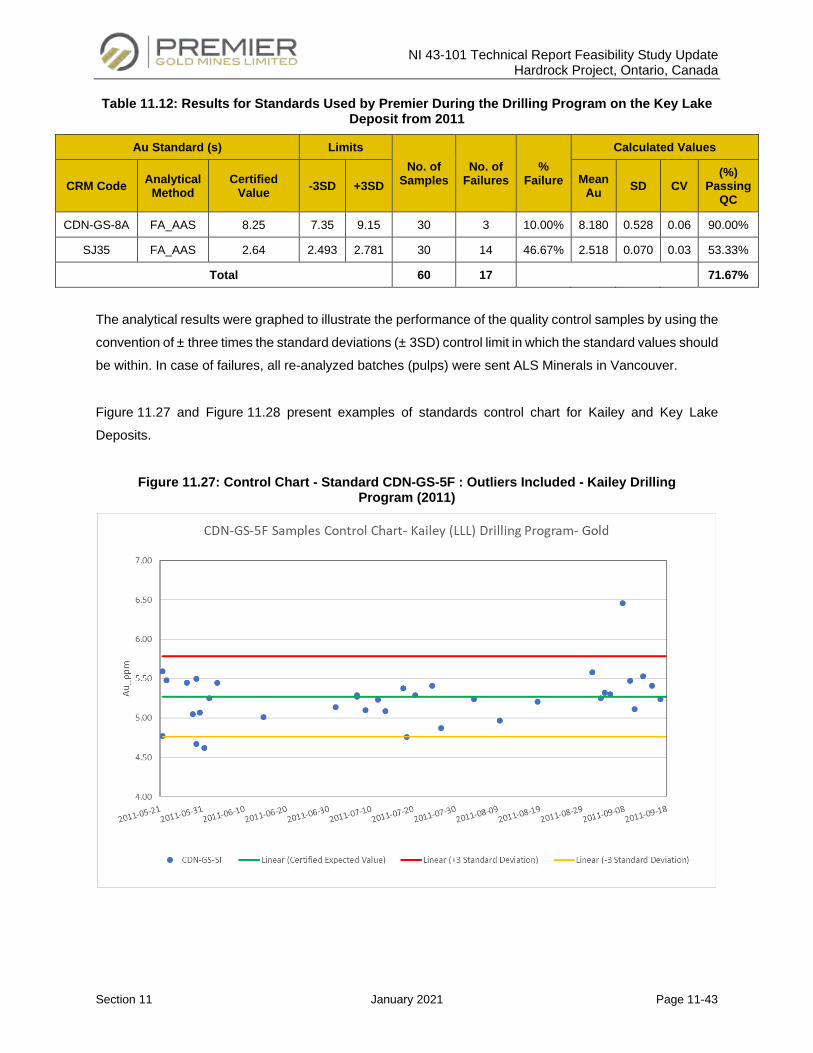
NI 43-101 Technical Report Feasibility Study Update Hardrock Project, Ontario, Canada
Section 11 January 2021 Page 11-43
Table 11.12: Results for Standards Used by Premier During the Drilling Program on the Key Lake Deposit from 2011
Au Standard (s) Limits No. of
Samples No. of
Failures %
Failure
Calculated Values
CRM Code Analytical Method
Certified Value -3SD +3SD Mean
Au SD CV (%)
Passing QC
CDN-GS-8A FA_AAS 8.25 7.35 9.15 30 3 10.00% 8.180 0.528 0.06 90.00%
SJ35 FA_AAS 2.64 2.493 2.781 30 14 46.67% 2.518 0.070 0.03 53.33%
Total 60 17 71.67%
The analytical results were graphed to illustrate the performance of the quality control samples by using the
convention of ± three times the standard deviations (± 3SD) control limit in which the standard values should
be within. In case of failures, all re-analyzed batches (pulps) were sent ALS Minerals in Vancouver.
Figure 11.27 and Figure 11.28 present examples of standards control chart for Kailey and Key Lake
Deposits.
Figure 11.27: Control Chart - Standard CDN-GS-5F : Outliers Included - Kailey Drilling Program (2011)
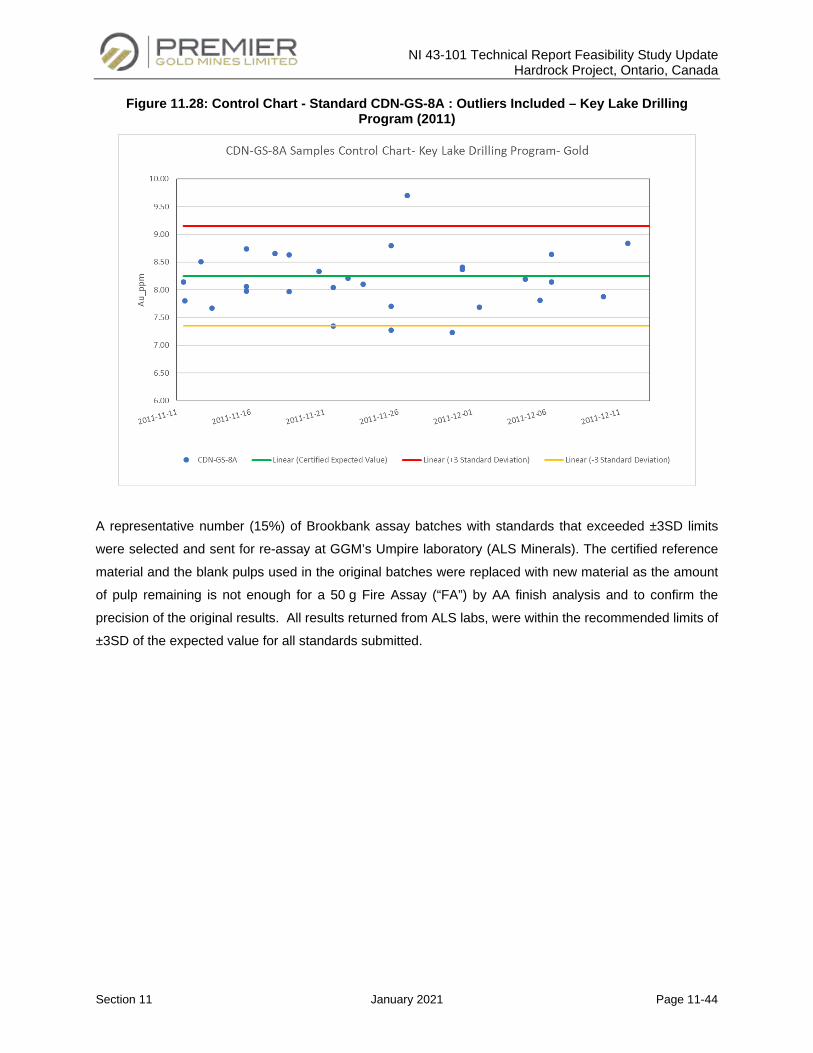
NI 43-101 Technical Report Feasibility Study Update Hardrock Project, Ontario, Canada
Section 11 January 2021 Page 11-44
Figure 11.28: Control Chart - Standard CDN-GS-8A : Outliers Included – Key Lake Drilling Program (2011)
A representative number (15%) of Brookbank assay batches with standards that exceeded ±3SD limits
were selected and sent for re-assay at GGM’s Umpire laboratory (ALS Minerals). The certified reference
material and the blank pulps used in the original batches were replaced with new material as the amount
of pulp remaining is not enough for a 50 g Fire Assay (“FA”) by AA finish analysis and to confirm the
precision of the original results. All results returned from ALS labs, were within the recommended limits of
±3SD of the expected value for all standards submitted.
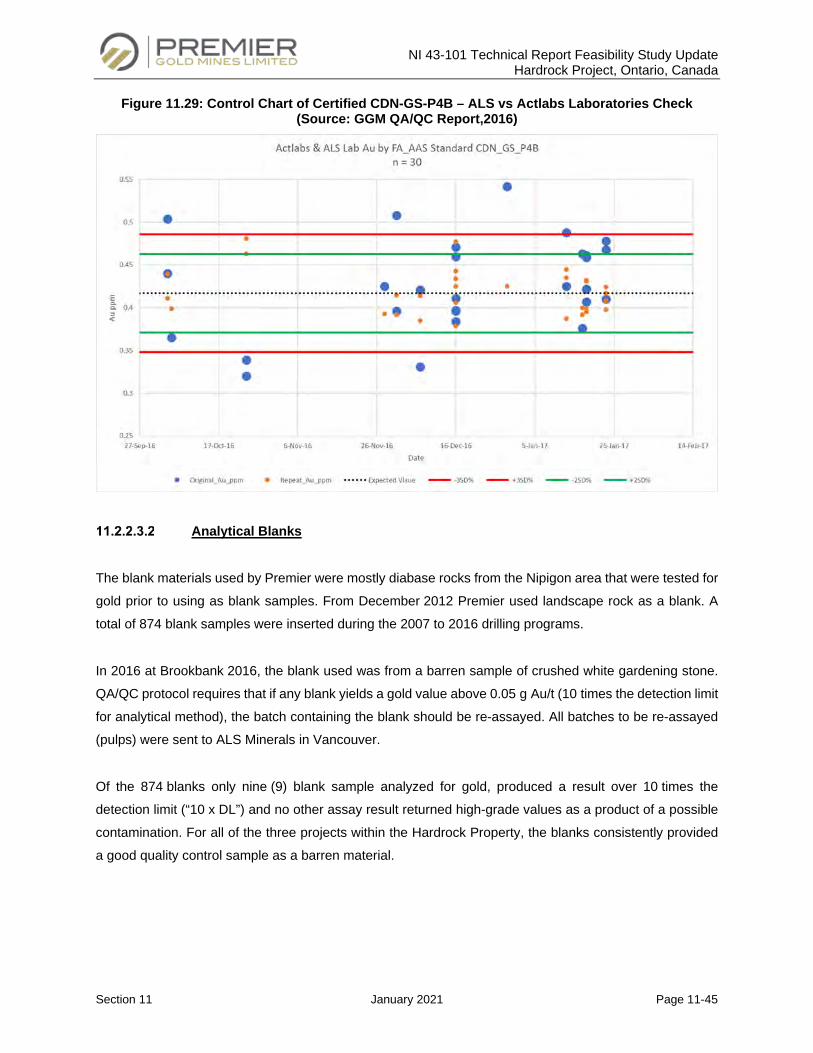
NI 43-101 Technical Report Feasibility Study Update Hardrock Project, Ontario, Canada
Section 11 January 2021 Page 11-45
Figure 11.29: Control Chart of Certified CDN-GS-P4B – ALS vs Actlabs Laboratories Check (Source: GGM QA/QC Report,2016)
Analytical Blanks
The blank materials used by Premier were mostly diabase rocks from the Nipigon area that were tested for
gold prior to using as blank samples. From December 2012 Premier used landscape rock as a blank. A
total of 874 blank samples were inserted during the 2007 to 2016 drilling programs.
In 2016 at Brookbank 2016, the blank used was from a barren sample of crushed white gardening stone.
QA/QC protocol requires that if any blank yields a gold value above 0.05 g Au/t (10 times the detection limit
for analytical method), the batch containing the blank should be re-assayed. All batches to be re-assayed
(pulps) were sent to ALS Minerals in Vancouver.
Of the 874 blanks only nine (9) blank sample analyzed for gold, produced a result over 10 times the
detection limit (“10 x DL”) and no other assay result returned high-grade values as a product of a possible
contamination. For all of the three projects within the Hardrock Property, the blanks consistently provided
a good quality control sample as a barren material.
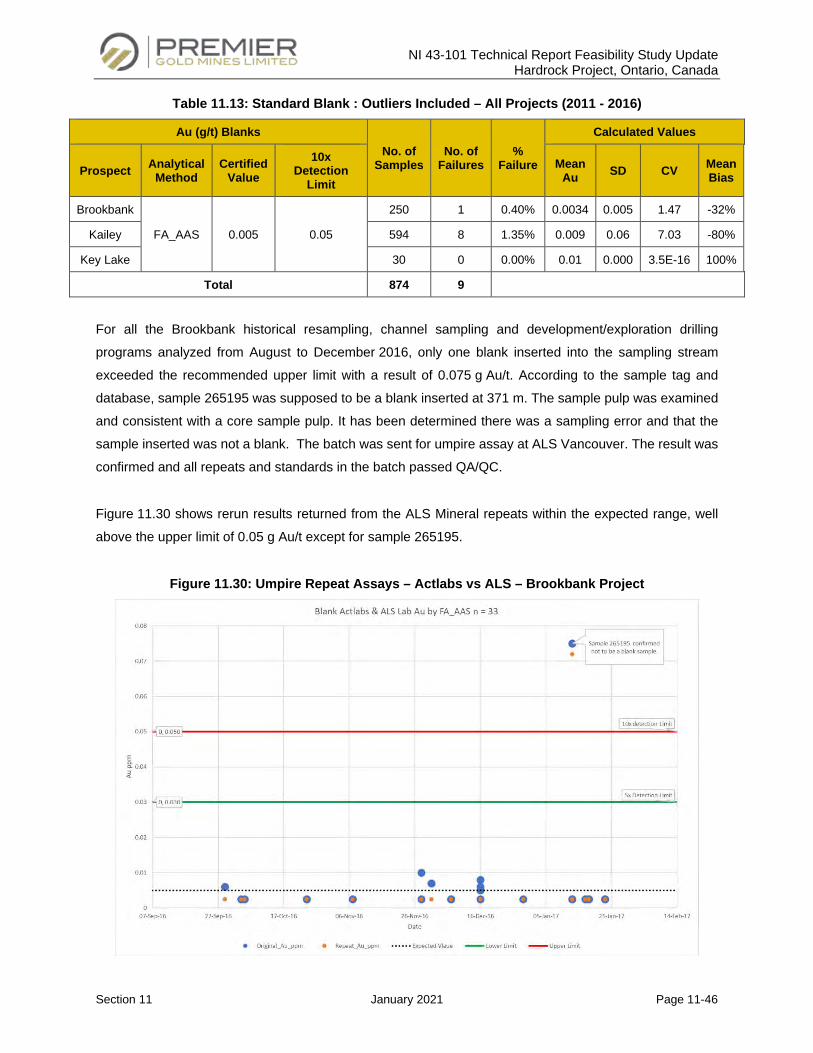
NI 43-101 Technical Report Feasibility Study Update Hardrock Project, Ontario, Canada
Section 11 January 2021 Page 11-46
Table 11.13: Standard Blank : Outliers Included – All Projects (2011 - 2016)
Au (g/t) Blanks No. of
Samples No. of
Failures %
Failure
Calculated Values
Prospect Analytical Method
Certified Value
10x Detection
Limit Mean
Au SD CV Mean Bias
Brookbank
FA_AAS 0.005 0.05
250 1 0.40% 0.0034 0.005 1.47 -32%
Kailey 594 8 1.35% 0.009 0.06 7.03 -80%
Key Lake 30 0 0.00% 0.01 0.000 3.5E-16 100%
Total 874 9
For all the Brookbank historical resampling, channel sampling and development/exploration drilling
programs analyzed from August to December 2016, only one blank inserted into the sampling stream
exceeded the recommended upper limit with a result of 0.075 g Au/t. According to the sample tag and
database, sample 265195 was supposed to be a blank inserted at 371 m. The sample pulp was examined
and consistent with a core sample pulp. It has been determined there was a sampling error and that the
sample inserted was not a blank. The batch was sent for umpire assay at ALS Vancouver. The result was
confirmed and all repeats and standards in the batch passed QA/QC.
Figure 11.30 shows rerun results returned from the ALS Mineral repeats within the expected range, well
above the upper limit of 0.05 g Au/t except for sample 265195.
Figure 11.30: Umpire Repeat Assays – Actlabs vs ALS – Brookbank Project
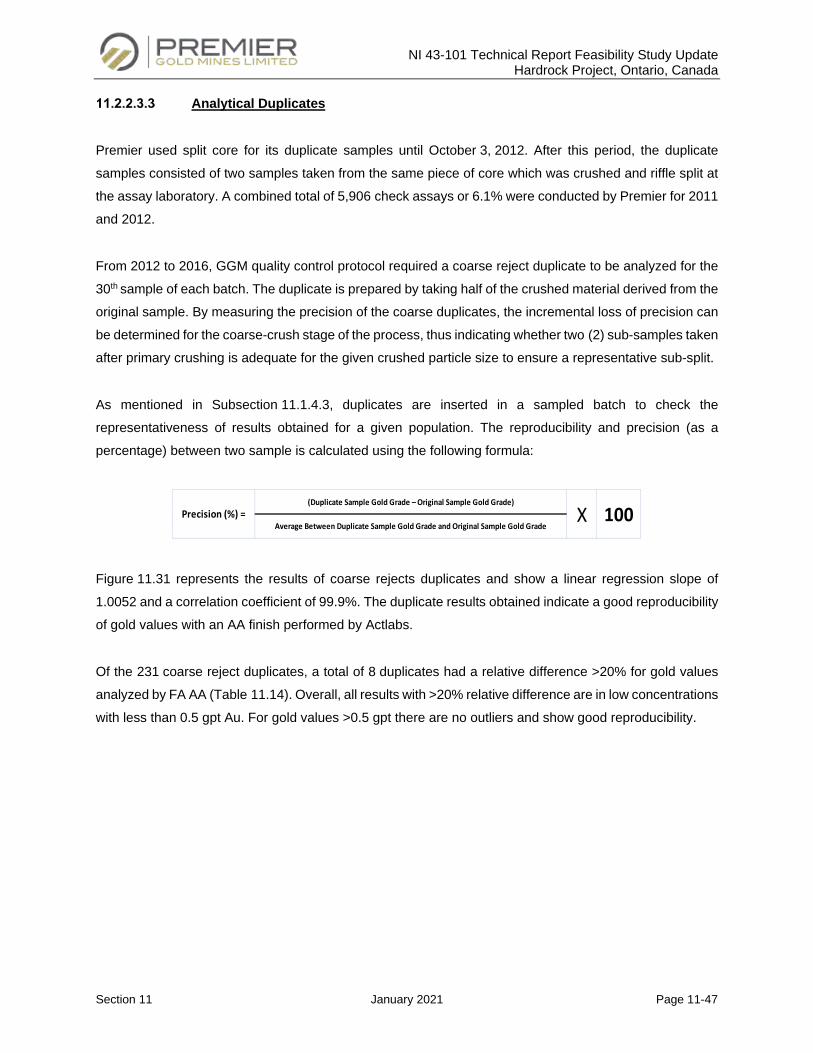
NI 43-101 Technical Report Feasibility Study Update Hardrock Project, Ontario, Canada
Section 11 January 2021 Page 11-47
Analytical Duplicates
Premier used split core for its duplicate samples until October 3, 2012. After this period, the duplicate
samples consisted of two samples taken from the same piece of core which was crushed and riffle split at
the assay laboratory. A combined total of 5,906 check assays or 6.1% were conducted by Premier for 2011
and 2012.
From 2012 to 2016, GGM quality control protocol required a coarse reject duplicate to be analyzed for the
30th sample of each batch. The duplicate is prepared by taking half of the crushed material derived from the
original sample. By measuring the precision of the coarse duplicates, the incremental loss of precision can
be determined for the coarse-crush stage of the process, thus indicating whether two (2) sub-samples taken
after primary crushing is adequate for the given crushed particle size to ensure a representative sub-split.
As mentioned in Subsection 11.1.4.3, duplicates are inserted in a sampled batch to check the
representativeness of results obtained for a given population. The reproducibility and precision (as a
percentage) between two sample is calculated using the following formula:
Figure 11.31 represents the results of coarse rejects duplicates and show a linear regression slope of
1.0052 and a correlation coefficient of 99.9%. The duplicate results obtained indicate a good reproducibility
of gold values with an AA finish performed by Actlabs.
Of the 231 coarse reject duplicates, a total of 8 duplicates had a relative difference >20% for gold values
analyzed by FA AA (Table 11.14). Overall, all results with >20% relative difference are in low concentrations
with less than 0.5 gpt Au. For gold values >0.5 gpt there are no outliers and show good reproducibility.
Precision (%) =(Duplicate Sample Gold Grade – Original Sample Gold Grade)
Average Between Duplicate Sample Gold Grade and Original Sample Gold Grade100X
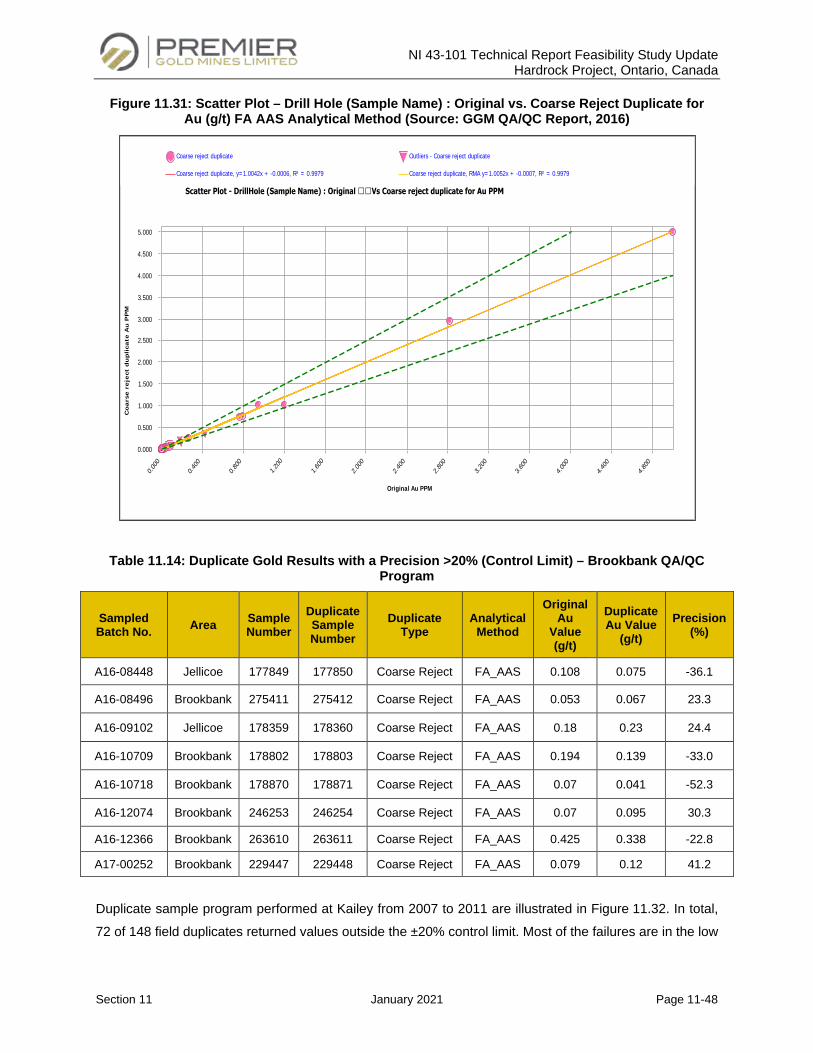
NI 43-101 Technical Report Feasibility Study Update Hardrock Project, Ontario, Canada
Section 11 January 2021 Page 11-48
Figure 11.31: Scatter Plot – Drill Hole (Sample Name) : Original vs. Coarse Reject Duplicate for Au (g/t) FA AAS Analytical Method (Source: GGM QA/QC Report, 2016)
Table 11.14: Duplicate Gold Results with a Precision >20% (Control Limit) – Brookbank QA/QC Program
Sampled Batch No. Area Sample
Number Duplicate Sample Number
Duplicate Type
Analytical Method
Original Au
Value (g/t)
Duplicate Au Value
(g/t) Precision
(%)
A16-08448 Jellicoe 177849 177850 Coarse Reject FA_AAS 0.108 0.075 -36.1
A16-08496 Brookbank 275411 275412 Coarse Reject FA_AAS 0.053 0.067 23.3
A16-09102 Jellicoe 178359 178360 Coarse Reject FA_AAS 0.18 0.23 24.4
A16-10709 Brookbank 178802 178803 Coarse Reject FA_AAS 0.194 0.139 -33.0
A16-10718 Brookbank 178870 178871 Coarse Reject FA_AAS 0.07 0.041 -52.3
A16-12074 Brookbank 246253 246254 Coarse Reject FA_AAS 0.07 0.095 30.3
A16-12366 Brookbank 263610 263611 Coarse Reject FA_AAS 0.425 0.338 -22.8
A17-00252 Brookbank 229447 229448 Coarse Reject FA_AAS 0.079 0.12 41.2
Duplicate sample program performed at Kailey from 2007 to 2011 are illustrated in Figure 11.32. In total,
72 of 148 field duplicates returned values outside the ±20% control limit. Most of the failures are in the low
Coarse reject duplicate Outliers - Coarse reject duplicate
Coarse reject duplicate, y=1.0042x + -0.0006, R² = 0.9979 Coarse reject duplicate, RMA y=1.0052x + -0.0007, R² = 0.9979
0.000
0.500
1.000
1.500
2.000
2.500
3.000
3.500
4.000
4.500
5.000
Co
ars
e r
eje
ct d
up
lica
te A
u P
PM
0.000
0.400
0.800
1.200
1.600
2.000
2.400
2.800
3.200
3.600
4.000
4.400
4.800
Original Au PPM
Scatter Plot - DrillHole (Sample Name) : Original Vs Coarse reject duplicate for Au PPM
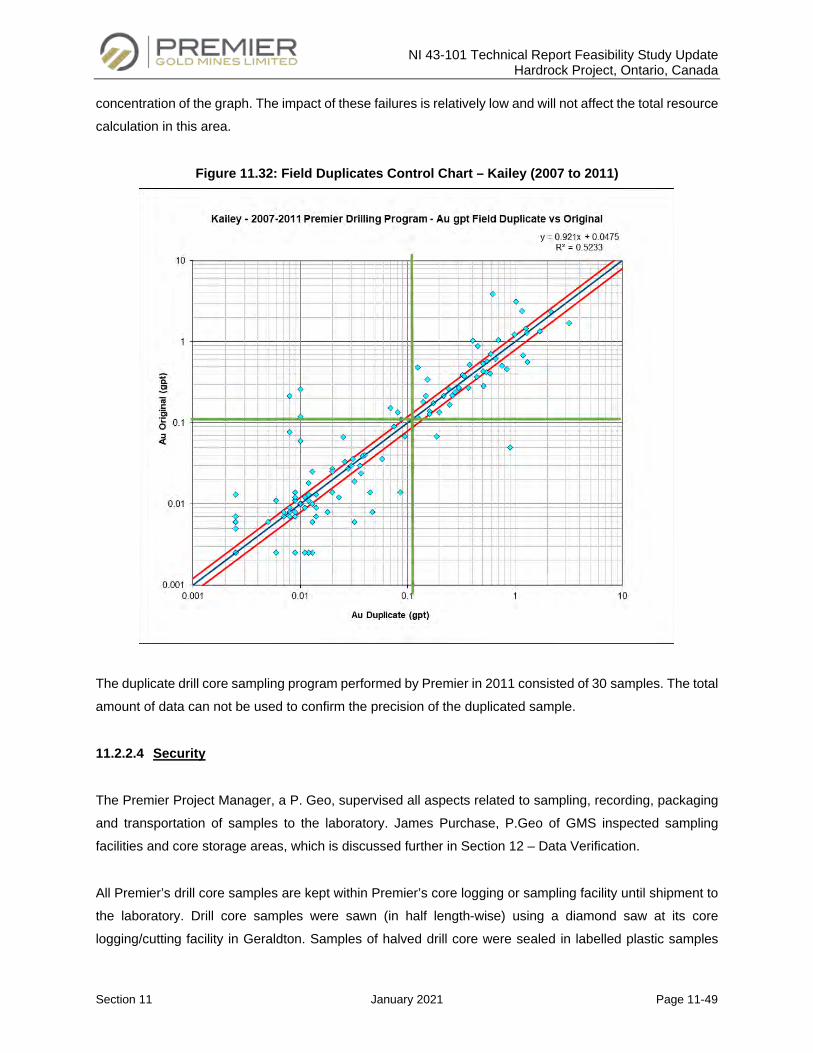
NI 43-101 Technical Report Feasibility Study Update Hardrock Project, Ontario, Canada
Section 11 January 2021 Page 11-49
concentration of the graph. The impact of these failures is relatively low and will not affect the total resource
calculation in this area.
Figure 11.32: Field Duplicates Control Chart – Kailey (2007 to 2011)
The duplicate drill core sampling program performed by Premier in 2011 consisted of 30 samples. The total
amount of data can not be used to confirm the precision of the duplicated sample.
11.2.2.4 Security
The Premier Project Manager, a P. Geo, supervised all aspects related to sampling, recording, packaging
and transportation of samples to the laboratory. James Purchase, P.Geo of GMS inspected sampling
facilities and core storage areas, which is discussed further in Section 12 – Data Verification.
All Premier’s drill core samples are kept within Premier’s core logging or sampling facility until shipment to
the laboratory. Drill core samples were sawn (in half length-wise) using a diamond saw at its core
logging/cutting facility in Geraldton. Samples of halved drill core were sealed in labelled plastic samples
NI 43-101 Technical Report Feasibility Study Update Hardrock Project, Ontario, Canada
Section 11 January 2021 Page 11-50
bags and securely packed for shipping. Bags of samples were then shipped by road transport to the Actlabs
preparation facilities in Geraldton since June 2009. The samples were delivered to the preparation facility
by Premier staff.
11.2.3 QP Conclusions
GMS has reviewed all the information regarding sample preparation, security, and analytical procedures
(QA/QC) used to ensure the accuracy of assays at the Brookbank, Kailey and Key Lake Projects, and
considers that the drilling and assay database are suitable for use in the calculation of a mineral resource.
GMS recommends the following for any future exploration programs:
• Ensure that the insertion into the sample stream rate of CRM (5%), blank material (5%), field (5%),
coarse and pulp (5%) duplicates is achieved.
• Continue to document warnings, failures, and most importantly any remedial action taken;
• If a CRM shows consistent bias at multiple laboratories, this issue needs to be understood and
resolved in a reasonable period of time and if needed replace it with a new CRM.
• Add always the Hole ID number to the QA/QC sample database as a cross check to ensure QA/QC
samples relate to the dataset and the time period in question.
• Increase umpire sample submission rate to around 5% of all samples.
NI 43-101 Technical Report Feasibility Study Update Hardrock Project, Ontario, Canada
Section 12 January 2021 Page 12-1
DATA VERIFICATION
The following section has sourced information from the NI 43-101 Technical Report for the Hardrock,
Brookbank and Key Lake Projects prepared by G Mining Services Inc. (“GMS”, December 22, 2016). As
the 2016 MRE database formed the basis of the 2019 MRE, this information is still valid and has been
included for the sake of completeness. New data verification activities were undertaken for the Brookbank,
Kailey and Key Lake Deposits since the 2016 Technical Report, which are described in Section 12.2.
12.1 Hardrock Data Verification
12.1.1 Data Verification for the 2016 MRE
The diamond drill hole database used for the 2016 Mineral Resource estimate presented herein was
provided by Greenstone Gold Mines (“GGM”) and is referred to as the “GGM database” in this section. A
drilling program in the Hardrock Deposit resource area ended on July 20, 2015, and the database close-out
date for the resource estimate update was established as November 18, 2015. The last hole included in
the database is MM754B. A significant re-sampling program was also completed in 2015 by GGM, including
6,411 new samples from 79 historical diamond drill holes. These were added to the GGM database for the
resource estimate update herein. The 2014-2015 stripping program was also included in the update.
GMS’ data verification included visits to the Hardrock field sites (outcrops and drill collars), as well as to the
logging facilities. It also included an independent re-sampling of selected core intervals and a review of drill
hole collar locations, assays, the QA/QC program, downhole surveys, the information on mined-out areas
and the descriptions of lithologies, alterations and structures. The site visit was completed by Réjean Sirois,
a GMS employee and QP, between August 1st and 4th, 2016.
12.1.1.1 Historical Work
The historical information used in this Report has been taken mainly from reports produced before the
implementation of NI 43-101 Canadian Standards of Disclosure for Mineral Projects. In some cases, these
reports provide little information on sample preparation, analyses or security procedures.
12.1.1.2 GGM Database
GMS was granted access to the certificates of assays for all holes in the latest drilling programs that took
place between May 2014 and July 2015. Assays were verified for 2% of the drill holes from these programs.
NI 43-101 Technical Report Feasibility Study Update Hardrock Project, Ontario, Canada
Section 12 January 2021 Page 12-2
Minor errors of the type normally encountered in a project database were identified and corrected. The final
database is considered to be of good overall quality. GMS considers the GGM database for the Hardrock
Deposit to be valid and reliable.
12.1.1.3 Greenstone Gold Mines Diamond Drilling
The historical surface drill holes collars on the Hardrock Deposit were either professionally surveyed or
surveyed using a Trimble GPS unit without post-processing. However, the 2015 drill hole collars were
surveyed using an RTK system with millimetre precision in all directions, including elevation.
Underground drill holes were compiled by Greenstone Economic Development Corporation (“GEDC”).
However, these holes were excluded from the current resource estimate since the location data is
considered unreliable, and the assay results could not be verified.
Downhole surveys were conducted on the majority of the surface holes. The Gyro and/or Reflex survey
information was verified for 5% of the drill holes from the latest drilling programs. Minor errors were
observed in the downhole surveys and corrections were made to the database. For the 2015 drilling
program, final collar azimuths and dip measurements were collected directly on the casing using an APS
system. Gyro, RTK and APS survey methods were reviewed during the site visit. Figure 12.1 and
Figure 12.2 show the different survey tools and some examples of drill sites that were reviewed during the
site visit.
During the GMS site visit, a total of seven drill hole collars were checked for X-Y accuracy. A handheld
Garmin GPS was used to collect ground survey data, as summarized in Table 12.1. Given the accuracy of
handheld GPS, the results are judged satisfactory by GMS. Figure 12.1 shows some examples of drill hole
collars surveyed during the site visit.
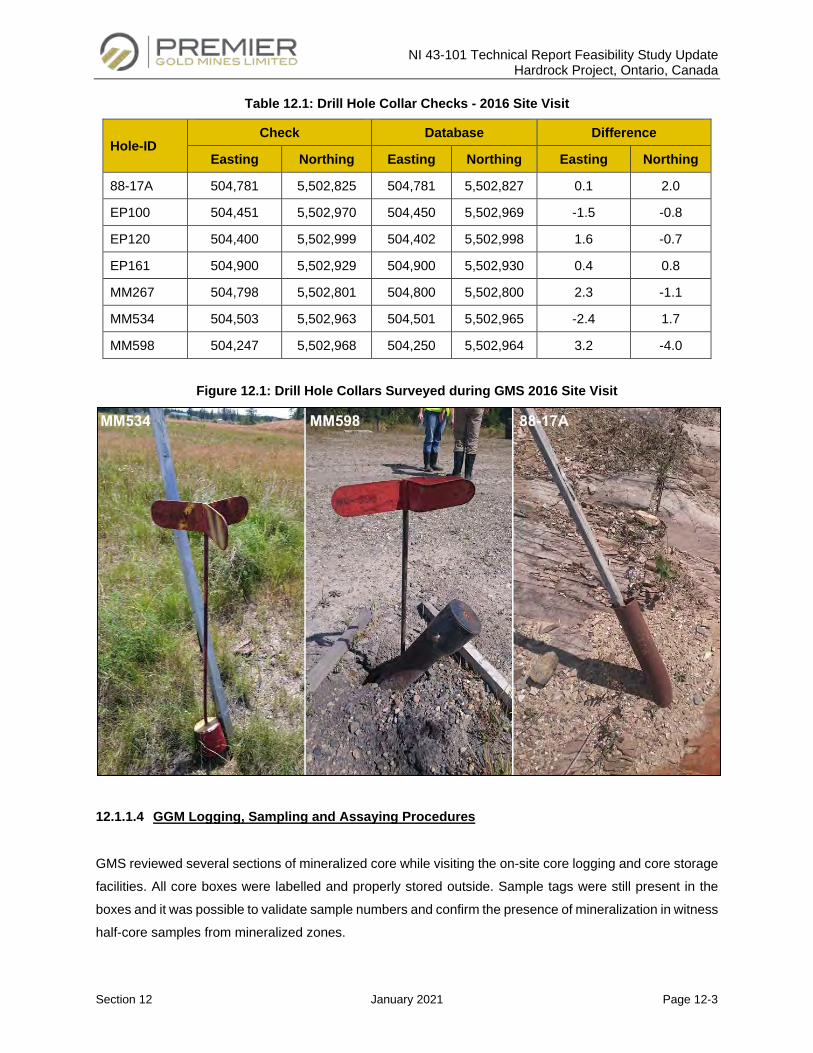
NI 43-101 Technical Report Feasibility Study Update Hardrock Project, Ontario, Canada
Section 12 January 2021 Page 12-3
Table 12.1: Drill Hole Collar Checks - 2016 Site Visit
Hole-ID Check Database Difference
Easting Northing Easting Northing Easting Northing
88-17A 504,781 5,502,825 504,781 5,502,827 0.1 2.0
EP100 504,451 5,502,970 504,450 5,502,969 -1.5 -0.8
EP120 504,400 5,502,999 504,402 5,502,998 1.6 -0.7
EP161 504,900 5,502,929 504,900 5,502,930 0.4 0.8
MM267 504,798 5,502,801 504,800 5,502,800 2.3 -1.1
MM534 504,503 5,502,963 504,501 5,502,965 -2.4 1.7
MM598 504,247 5,502,968 504,250 5,502,964 3.2 -4.0
Figure 12.1: Drill Hole Collars Surveyed during GMS 2016 Site Visit
12.1.1.4 GGM Logging, Sampling and Assaying Procedures
GMS reviewed several sections of mineralized core while visiting the on-site core logging and core storage
facilities. All core boxes were labelled and properly stored outside. Sample tags were still present in the
boxes and it was possible to validate sample numbers and confirm the presence of mineralization in witness
half-core samples from mineralized zones.
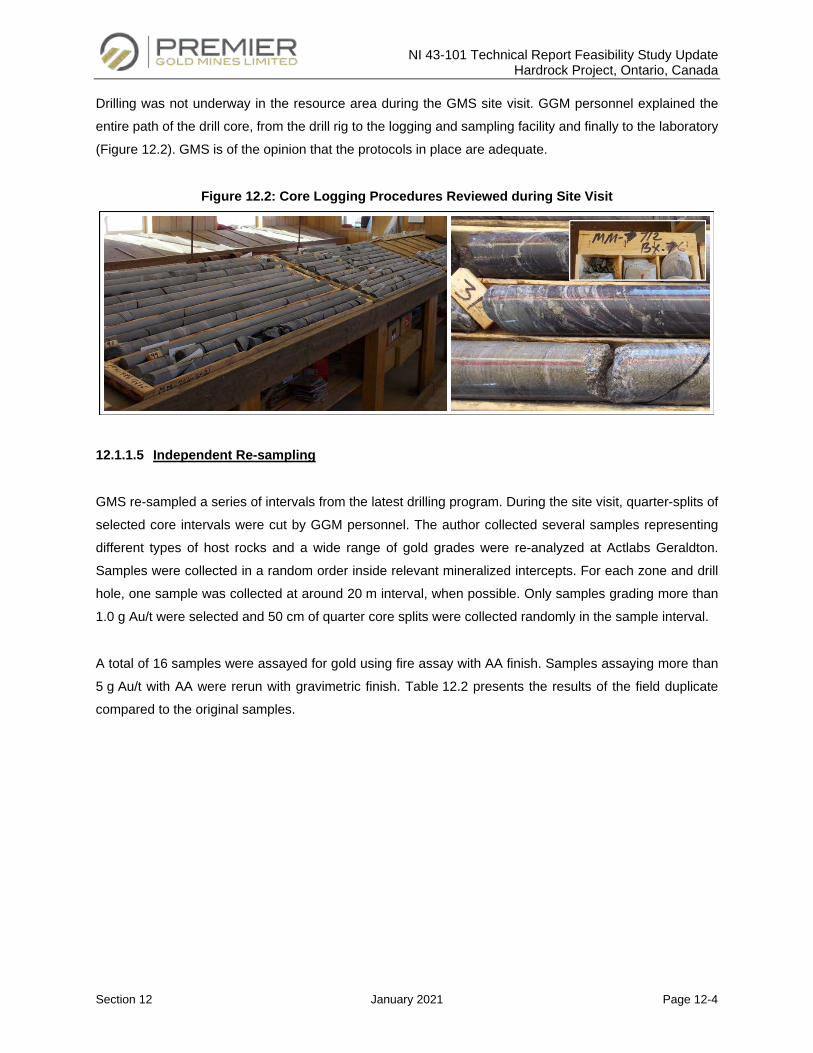
NI 43-101 Technical Report Feasibility Study Update Hardrock Project, Ontario, Canada
Section 12 January 2021 Page 12-4
Drilling was not underway in the resource area during the GMS site visit. GGM personnel explained the
entire path of the drill core, from the drill rig to the logging and sampling facility and finally to the laboratory
(Figure 12.2). GMS is of the opinion that the protocols in place are adequate.
Figure 12.2: Core Logging Procedures Reviewed during Site Visit
12.1.1.5 Independent Re-sampling
GMS re-sampled a series of intervals from the latest drilling program. During the site visit, quarter-splits of
selected core intervals were cut by GGM personnel. The author collected several samples representing
different types of host rocks and a wide range of gold grades were re-analyzed at Actlabs Geraldton.
Samples were collected in a random order inside relevant mineralized intercepts. For each zone and drill
hole, one sample was collected at around 20 m interval, when possible. Only samples grading more than
1.0 g Au/t were selected and 50 cm of quarter core splits were collected randomly in the sample interval.
A total of 16 samples were assayed for gold using fire assay with AA finish. Samples assaying more than
5 g Au/t with AA were rerun with gravimetric finish. Table 12.2 presents the results of the field duplicate
compared to the original samples.
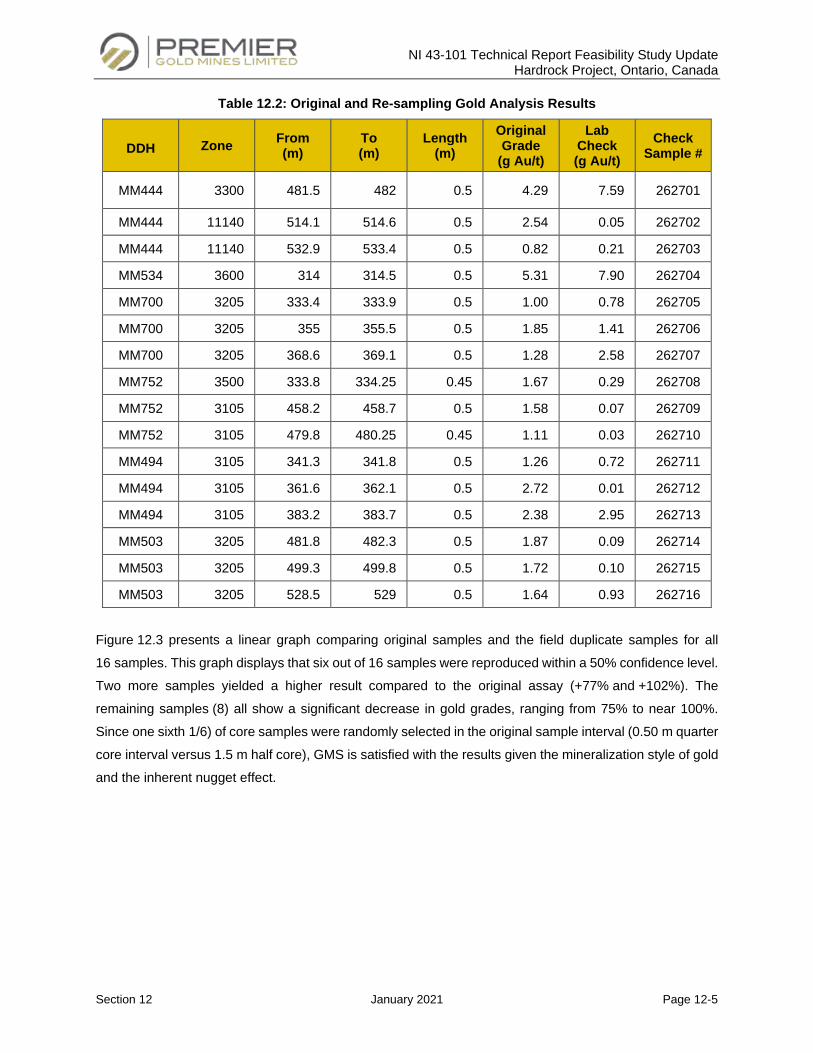
NI 43-101 Technical Report Feasibility Study Update Hardrock Project, Ontario, Canada
Section 12 January 2021 Page 12-5
Table 12.2: Original and Re-sampling Gold Analysis Results
DDH Zone From (m)
To (m)
Length (m)
Original Grade
(g Au/t)
Lab Check (g Au/t)
Check Sample #
MM444 3300 481.5 482 0.5 4.29 7.59 262701
MM444 11140 514.1 514.6 0.5 2.54 0.05 262702
MM444 11140 532.9 533.4 0.5 0.82 0.21 262703
MM534 3600 314 314.5 0.5 5.31 7.90 262704
MM700 3205 333.4 333.9 0.5 1.00 0.78 262705
MM700 3205 355 355.5 0.5 1.85 1.41 262706
MM700 3205 368.6 369.1 0.5 1.28 2.58 262707
MM752 3500 333.8 334.25 0.45 1.67 0.29 262708
MM752 3105 458.2 458.7 0.5 1.58 0.07 262709
MM752 3105 479.8 480.25 0.45 1.11 0.03 262710
MM494 3105 341.3 341.8 0.5 1.26 0.72 262711
MM494 3105 361.6 362.1 0.5 2.72 0.01 262712
MM494 3105 383.2 383.7 0.5 2.38 2.95 262713
MM503 3205 481.8 482.3 0.5 1.87 0.09 262714
MM503 3205 499.3 499.8 0.5 1.72 0.10 262715
MM503 3205 528.5 529 0.5 1.64 0.93 262716
Figure 12.3 presents a linear graph comparing original samples and the field duplicate samples for all
16 samples. This graph displays that six out of 16 samples were reproduced within a 50% confidence level.
Two more samples yielded a higher result compared to the original assay (+77% and +102%). The
remaining samples (8) all show a significant decrease in gold grades, ranging from 75% to near 100%.
Since one sixth 1/6) of core samples were randomly selected in the original sample interval (0.50 m quarter
core interval versus 1.5 m half core), GMS is satisfied with the results given the mineralization style of gold
and the inherent nugget effect.
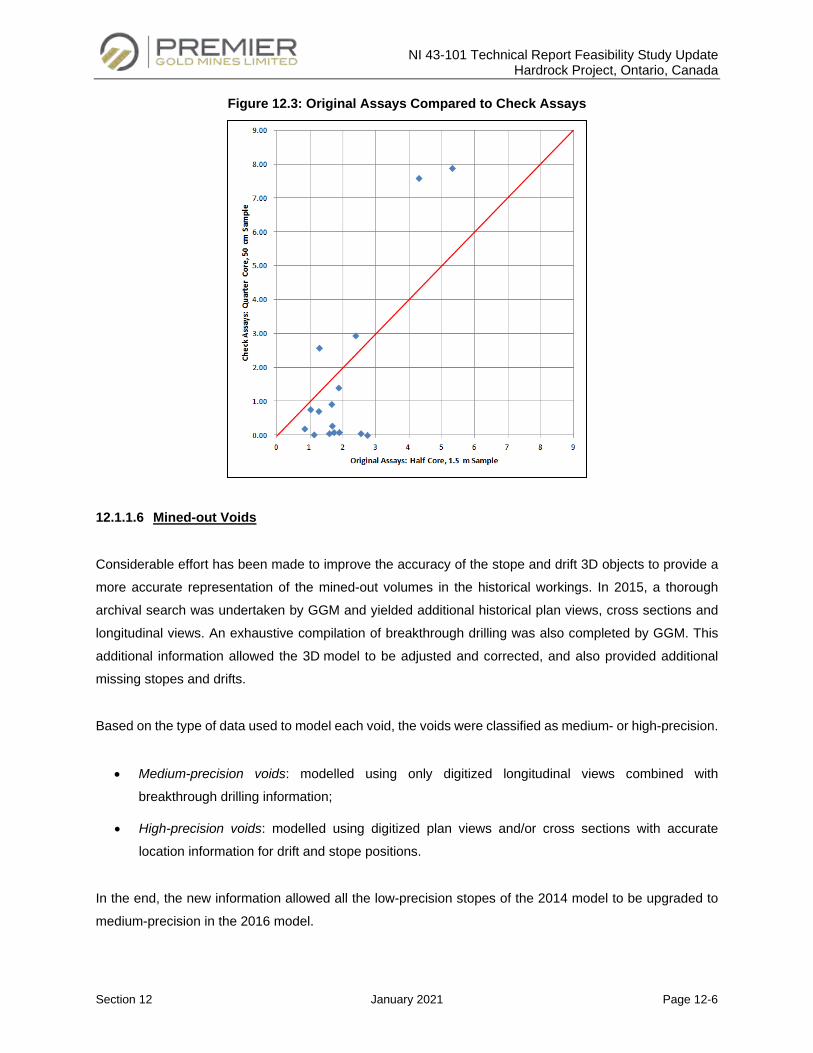
NI 43-101 Technical Report Feasibility Study Update Hardrock Project, Ontario, Canada
Section 12 January 2021 Page 12-6
Figure 12.3: Original Assays Compared to Check Assays
12.1.1.6 Mined-out Voids
Considerable effort has been made to improve the accuracy of the stope and drift 3D objects to provide a
more accurate representation of the mined-out volumes in the historical workings. In 2015, a thorough
archival search was undertaken by GGM and yielded additional historical plan views, cross sections and
longitudinal views. An exhaustive compilation of breakthrough drilling was also completed by GGM. This
additional information allowed the 3D model to be adjusted and corrected, and also provided additional
missing stopes and drifts.
Based on the type of data used to model each void, the voids were classified as medium- or high-precision.
• Medium-precision voids: modelled using only digitized longitudinal views combined with
breakthrough drilling information;
• High-precision voids: modelled using digitized plan views and/or cross sections with accurate
location information for drift and stope positions.
In the end, the new information allowed all the low-precision stopes of the 2014 model to be upgraded to
medium-precision in the 2016 model.
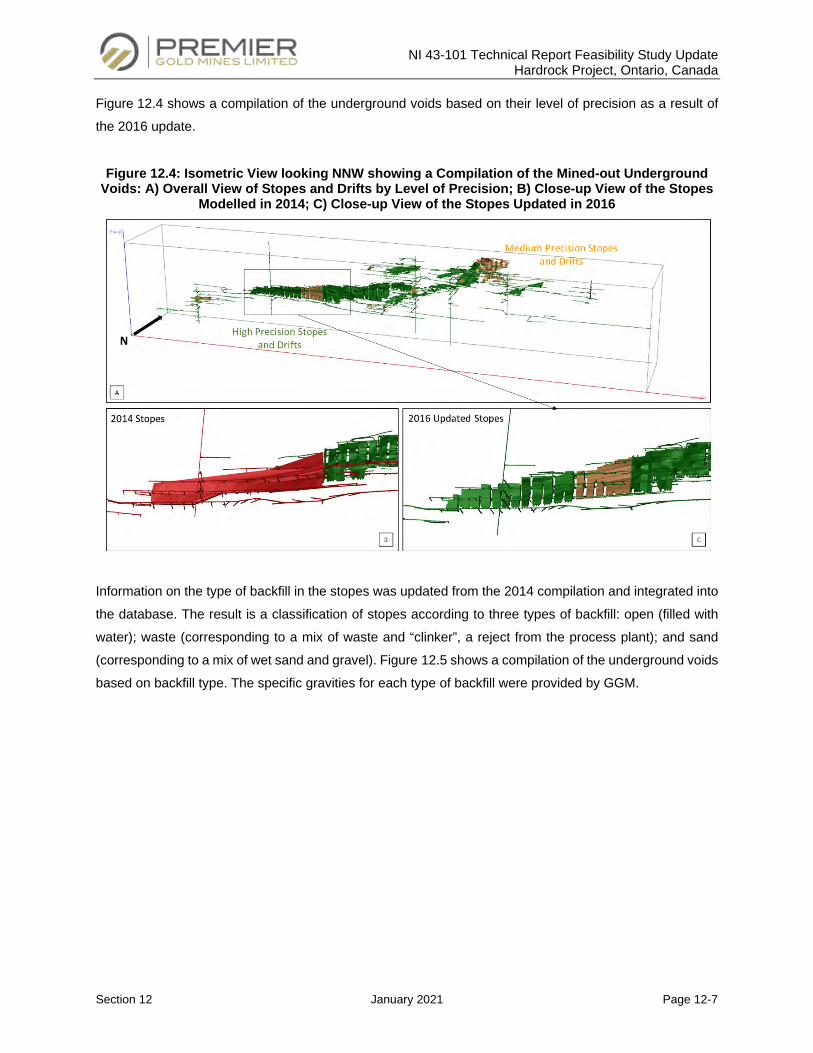
NI 43-101 Technical Report Feasibility Study Update Hardrock Project, Ontario, Canada
Section 12 January 2021 Page 12-7
Figure 12.4 shows a compilation of the underground voids based on their level of precision as a result of
the 2016 update.
Figure 12.4: Isometric View looking NNW showing a Compilation of the Mined-out Underground Voids: A) Overall View of Stopes and Drifts by Level of Precision; B) Close-up View of the Stopes
Modelled in 2014; C) Close-up View of the Stopes Updated in 2016
Information on the type of backfill in the stopes was updated from the 2014 compilation and integrated into
the database. The result is a classification of stopes according to three types of backfill: open (filled with
water); waste (corresponding to a mix of waste and “clinker”, a reject from the process plant); and sand
(corresponding to a mix of wet sand and gravel). Figure 12.5 shows a compilation of the underground voids
based on backfill type. The specific gravities for each type of backfill were provided by GGM.
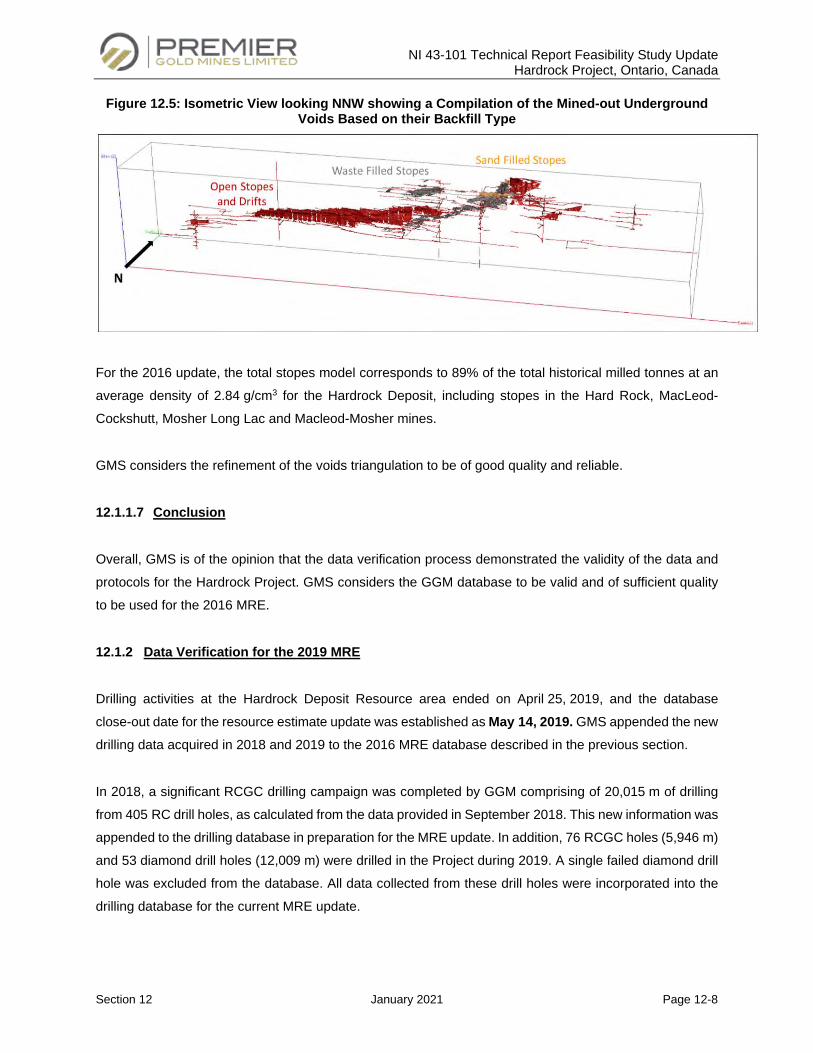
NI 43-101 Technical Report Feasibility Study Update Hardrock Project, Ontario, Canada
Section 12 January 2021 Page 12-8
Figure 12.5: Isometric View looking NNW showing a Compilation of the Mined-out Underground Voids Based on their Backfill Type
For the 2016 update, the total stopes model corresponds to 89% of the total historical milled tonnes at an
average density of 2.84 g/cm3 for the Hardrock Deposit, including stopes in the Hard Rock, MacLeod-
Cockshutt, Mosher Long Lac and Macleod-Mosher mines.
GMS considers the refinement of the voids triangulation to be of good quality and reliable.
12.1.1.7 Conclusion
Overall, GMS is of the opinion that the data verification process demonstrated the validity of the data and
protocols for the Hardrock Project. GMS considers the GGM database to be valid and of sufficient quality
to be used for the 2016 MRE.
12.1.2 Data Verification for the 2019 MRE
Drilling activities at the Hardrock Deposit Resource area ended on April 25, 2019, and the database
close-out date for the resource estimate update was established as May 14, 2019. GMS appended the new
drilling data acquired in 2018 and 2019 to the 2016 MRE database described in the previous section.
In 2018, a significant RCGC drilling campaign was completed by GGM comprising of 20,015 m of drilling
from 405 RC drill holes, as calculated from the data provided in September 2018. This new information was
appended to the drilling database in preparation for the MRE update. In addition, 76 RCGC holes (5,946 m)
and 53 diamond drill holes (12,009 m) were drilled in the Project during 2019. A single failed diamond drill
hole was excluded from the database. All data collected from these drill holes were incorporated into the
drilling database for the current MRE update.
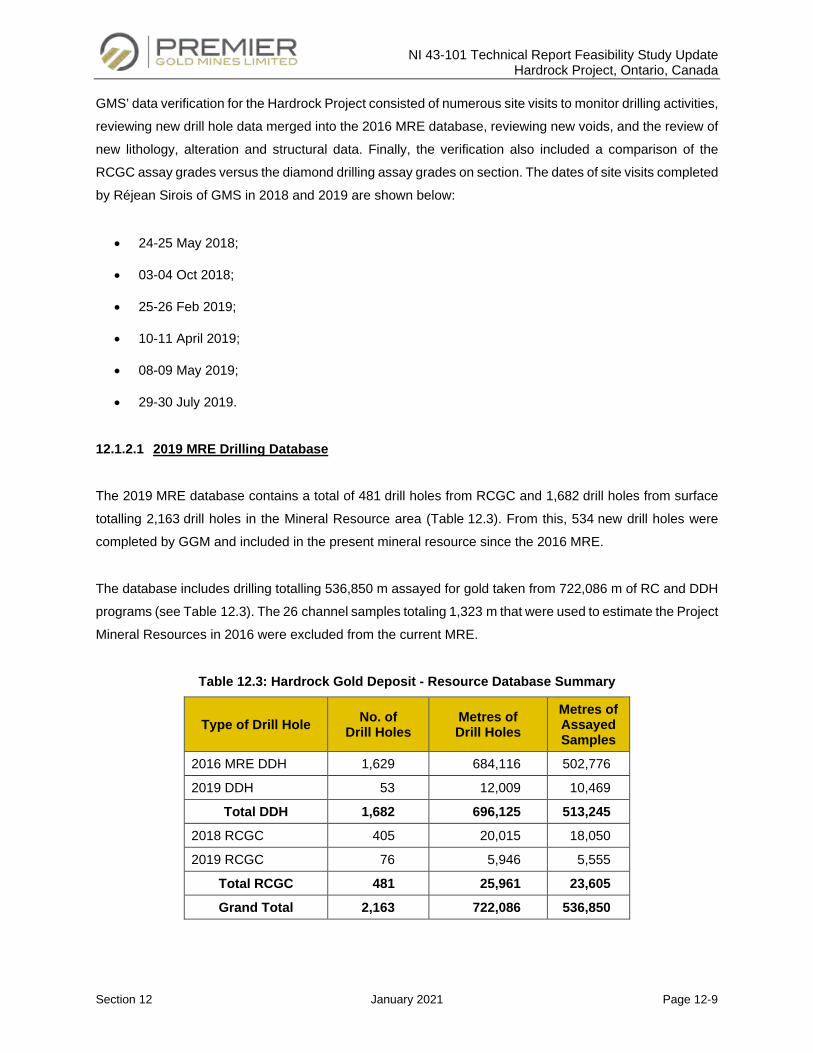
NI 43-101 Technical Report Feasibility Study Update Hardrock Project, Ontario, Canada
Section 12 January 2021 Page 12-9
GMS’ data verification for the Hardrock Project consisted of numerous site visits to monitor drilling activities,
reviewing new drill hole data merged into the 2016 MRE database, reviewing new voids, and the review of
new lithology, alteration and structural data. Finally, the verification also included a comparison of the
RCGC assay grades versus the diamond drilling assay grades on section. The dates of site visits completed
by Réjean Sirois of GMS in 2018 and 2019 are shown below:
• 24-25 May 2018;
• 03-04 Oct 2018;
• 25-26 Feb 2019;
• 10-11 April 2019;
• 08-09 May 2019;
• 29-30 July 2019.
12.1.2.1 2019 MRE Drilling Database
The 2019 MRE database contains a total of 481 drill holes from RCGC and 1,682 drill holes from surface
totalling 2,163 drill holes in the Mineral Resource area (Table 12.3). From this, 534 new drill holes were
completed by GGM and included in the present mineral resource since the 2016 MRE.
The database includes drilling totalling 536,850 m assayed for gold taken from 722,086 m of RC and DDH
programs (see Table 12.3). The 26 channel samples totaling 1,323 m that were used to estimate the Project
Mineral Resources in 2016 were excluded from the current MRE.
Table 12.3: Hardrock Gold Deposit - Resource Database Summary
Type of Drill Hole No. of Drill Holes
Metres of Drill Holes
Metres of Assayed Samples
2016 MRE DDH 1,629 684,116 502,776
2019 DDH 53 12,009 10,469
Total DDH 1,682 696,125 513,245
2018 RCGC 405 20,015 18,050
2019 RCGC 76 5,946 5,555
Total RCGC 481 25,961 23,605
Grand Total 2,163 722,086 536,850
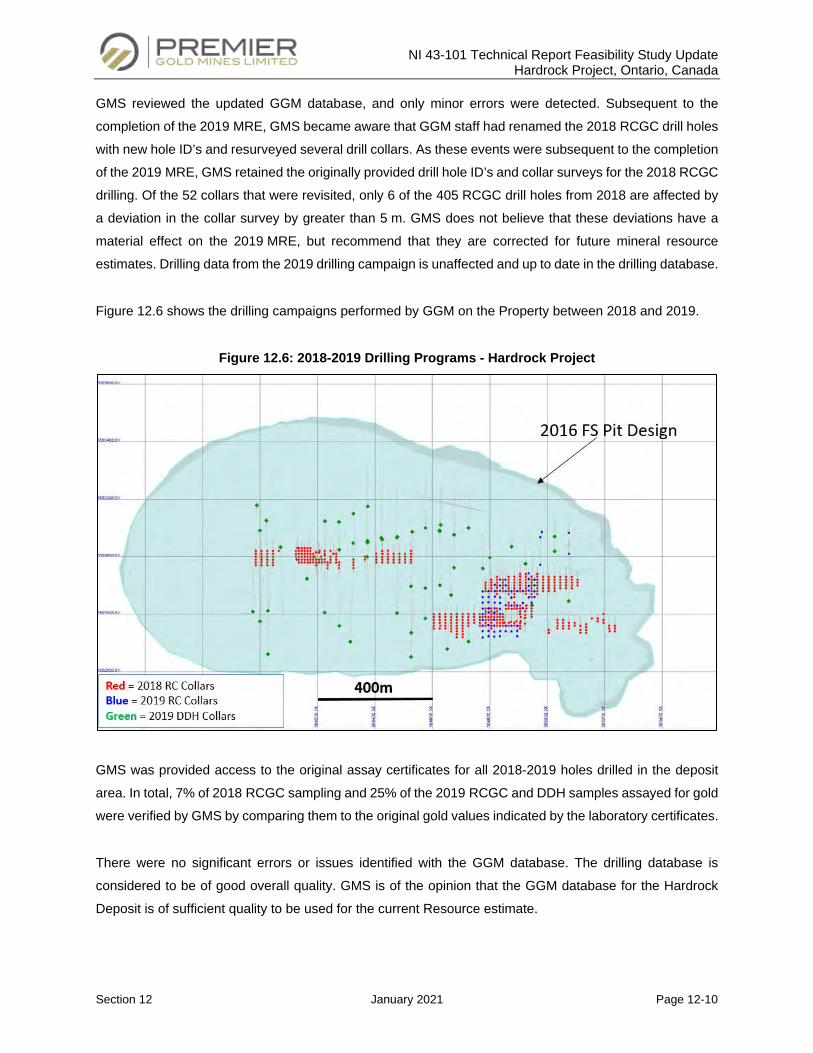
NI 43-101 Technical Report Feasibility Study Update Hardrock Project, Ontario, Canada
Section 12 January 2021 Page 12-10
GMS reviewed the updated GGM database, and only minor errors were detected. Subsequent to the
completion of the 2019 MRE, GMS became aware that GGM staff had renamed the 2018 RCGC drill holes
with new hole ID’s and resurveyed several drill collars. As these events were subsequent to the completion
of the 2019 MRE, GMS retained the originally provided drill hole ID’s and collar surveys for the 2018 RCGC
drilling. Of the 52 collars that were revisited, only 6 of the 405 RCGC drill holes from 2018 are affected by
a deviation in the collar survey by greater than 5 m. GMS does not believe that these deviations have a
material effect on the 2019 MRE, but recommend that they are corrected for future mineral resource
estimates. Drilling data from the 2019 drilling campaign is unaffected and up to date in the drilling database.
Figure 12.6 shows the drilling campaigns performed by GGM on the Property between 2018 and 2019.
Figure 12.6: 2018-2019 Drilling Programs - Hardrock Project
GMS was provided access to the original assay certificates for all 2018-2019 holes drilled in the deposit
area. In total, 7% of 2018 RCGC sampling and 25% of the 2019 RCGC and DDH samples assayed for gold
were verified by GMS by comparing them to the original gold values indicated by the laboratory certificates.
There were no significant errors or issues identified with the GGM database. The drilling database is
considered to be of good overall quality. GMS is of the opinion that the GGM database for the Hardrock
Deposit is of sufficient quality to be used for the current Resource estimate.
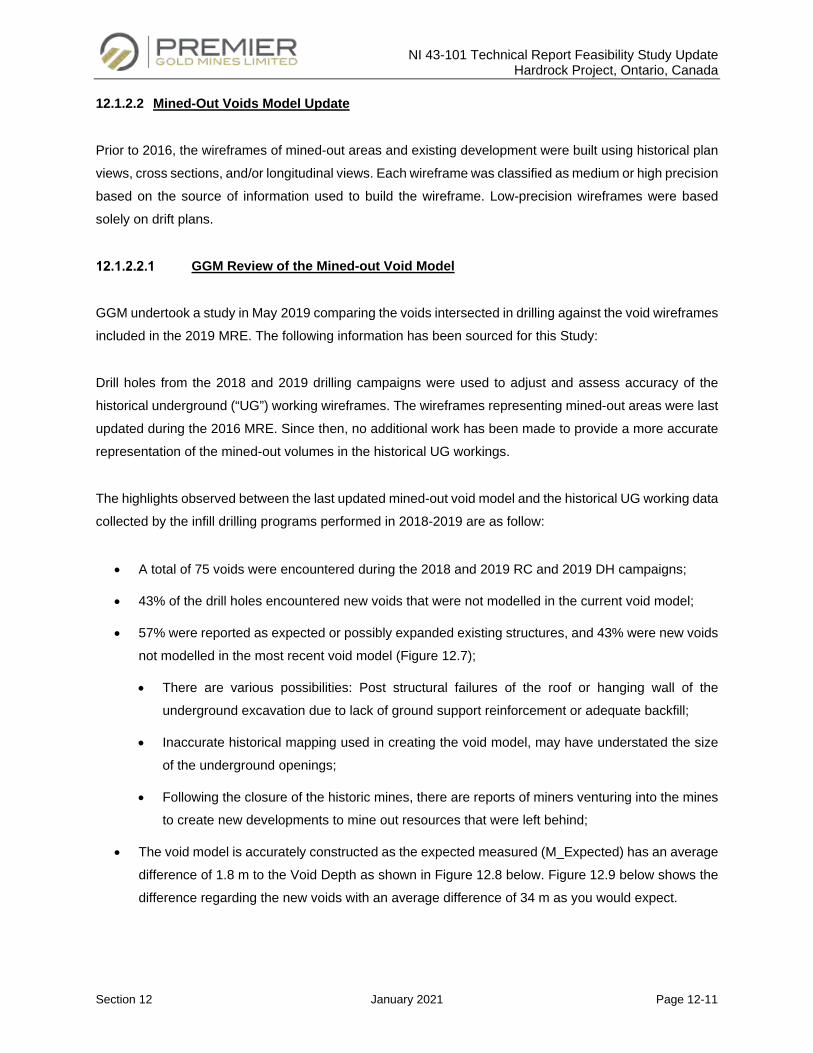
NI 43-101 Technical Report Feasibility Study Update Hardrock Project, Ontario, Canada
Section 12 January 2021 Page 12-11
12.1.2.2 Mined-Out Voids Model Update
Prior to 2016, the wireframes of mined-out areas and existing development were built using historical plan
views, cross sections, and/or longitudinal views. Each wireframe was classified as medium or high precision
based on the source of information used to build the wireframe. Low-precision wireframes were based
solely on drift plans.
GGM Review of the Mined-out Void Model
GGM undertook a study in May 2019 comparing the voids intersected in drilling against the void wireframes
included in the 2019 MRE. The following information has been sourced for this Study:
Drill holes from the 2018 and 2019 drilling campaigns were used to adjust and assess accuracy of the
historical underground (“UG”) working wireframes. The wireframes representing mined-out areas were last
updated during the 2016 MRE. Since then, no additional work has been made to provide a more accurate
representation of the mined-out volumes in the historical UG workings.
The highlights observed between the last updated mined-out void model and the historical UG working data
collected by the infill drilling programs performed in 2018-2019 are as follow:
• A total of 75 voids were encountered during the 2018 and 2019 RC and 2019 DH campaigns;
• 43% of the drill holes encountered new voids that were not modelled in the current void model;
• 57% were reported as expected or possibly expanded existing structures, and 43% were new voids
not modelled in the most recent void model (Figure 12.7);
• There are various possibilities: Post structural failures of the roof or hanging wall of the
underground excavation due to lack of ground support reinforcement or adequate backfill;
• Inaccurate historical mapping used in creating the void model, may have understated the size
of the underground openings;
• Following the closure of the historic mines, there are reports of miners venturing into the mines
to create new developments to mine out resources that were left behind;
• The void model is accurately constructed as the expected measured (M_Expected) has an average
difference of 1.8 m to the Void Depth as shown in Figure 12.8 below. Figure 12.9 below shows the
difference regarding the new voids with an average difference of 34 m as you would expect.
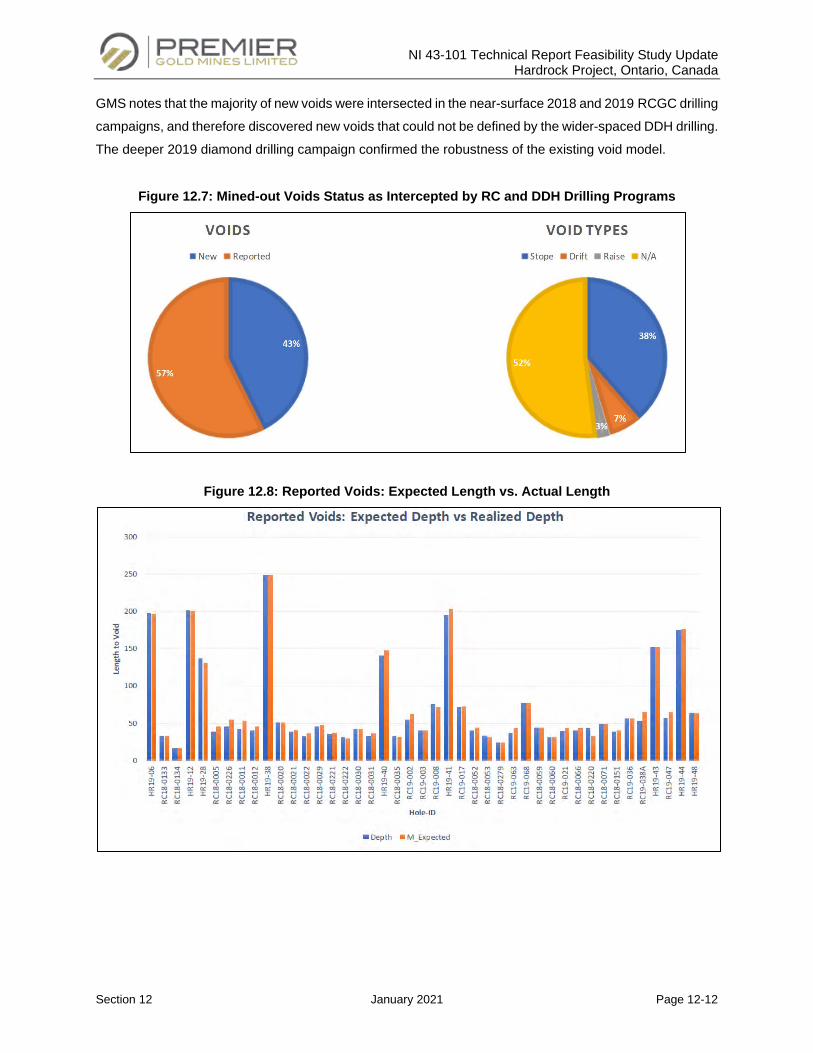
NI 43-101 Technical Report Feasibility Study Update Hardrock Project, Ontario, Canada
Section 12 January 2021 Page 12-12
GMS notes that the majority of new voids were intersected in the near-surface 2018 and 2019 RCGC drilling
campaigns, and therefore discovered new voids that could not be defined by the wider-spaced DDH drilling.
The deeper 2019 diamond drilling campaign confirmed the robustness of the existing void model.
Figure 12.7: Mined-out Voids Status as Intercepted by RC and DDH Drilling Programs
Figure 12.8: Reported Voids: Expected Length vs. Actual Length
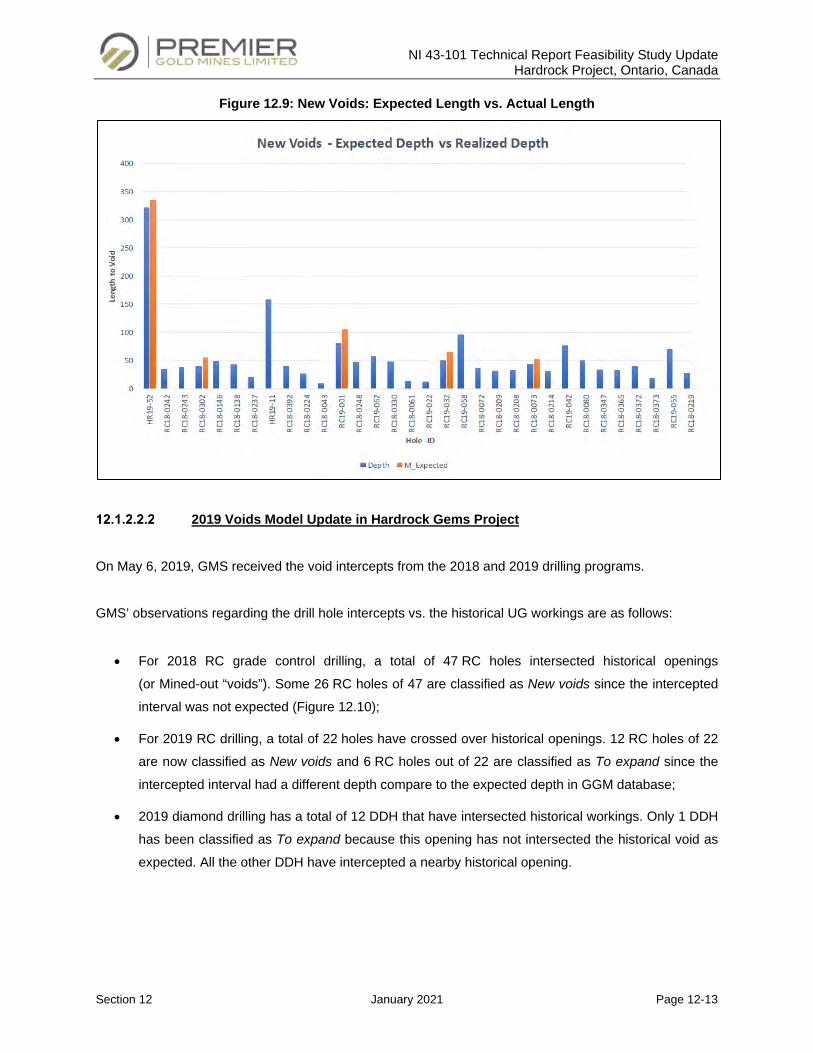
NI 43-101 Technical Report Feasibility Study Update Hardrock Project, Ontario, Canada
Section 12 January 2021 Page 12-13
Figure 12.9: New Voids: Expected Length vs. Actual Length
2019 Voids Model Update in Hardrock Gems Project
On May 6, 2019, GMS received the void intercepts from the 2018 and 2019 drilling programs.
GMS’ observations regarding the drill hole intercepts vs. the historical UG workings are as follows:
• For 2018 RC grade control drilling, a total of 47 RC holes intersected historical openings
(or Mined-out “voids”). Some 26 RC holes of 47 are classified as New voids since the intercepted
interval was not expected (Figure 12.10);
• For 2019 RC drilling, a total of 22 holes have crossed over historical openings. 12 RC holes of 22
are now classified as New voids and 6 RC holes out of 22 are classified as To expand since the
intercepted interval had a different depth compare to the expected depth in GGM database;
• 2019 diamond drilling has a total of 12 DDH that have intersected historical workings. Only 1 DDH
has been classified as To expand because this opening has not intersected the historical void as
expected. All the other DDH have intercepted a nearby historical opening.
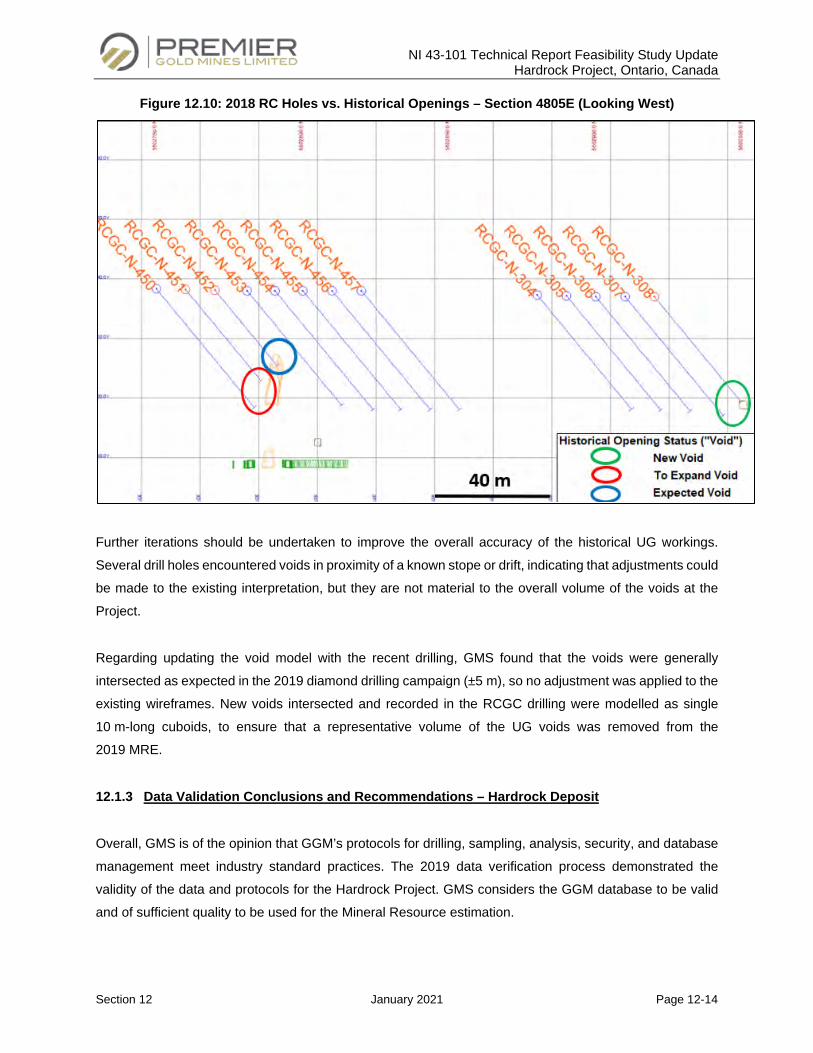
NI 43-101 Technical Report Feasibility Study Update Hardrock Project, Ontario, Canada
Section 12 January 2021 Page 12-14
Figure 12.10: 2018 RC Holes vs. Historical Openings – Section 4805E (Looking West)
Further iterations should be undertaken to improve the overall accuracy of the historical UG workings.
Several drill holes encountered voids in proximity of a known stope or drift, indicating that adjustments could
be made to the existing interpretation, but they are not material to the overall volume of the voids at the
Project.
Regarding updating the void model with the recent drilling, GMS found that the voids were generally
intersected as expected in the 2019 diamond drilling campaign (±5 m), so no adjustment was applied to the
existing wireframes. New voids intersected and recorded in the RCGC drilling were modelled as single
10 m-long cuboids, to ensure that a representative volume of the UG voids was removed from the
2019 MRE.
12.1.3 Data Validation Conclusions and Recommendations – Hardrock Deposit
Overall, GMS is of the opinion that GGM’s protocols for drilling, sampling, analysis, security, and database
management meet industry standard practices. The 2019 data verification process demonstrated the
validity of the data and protocols for the Hardrock Project. GMS considers the GGM database to be valid
and of sufficient quality to be used for the Mineral Resource estimation.
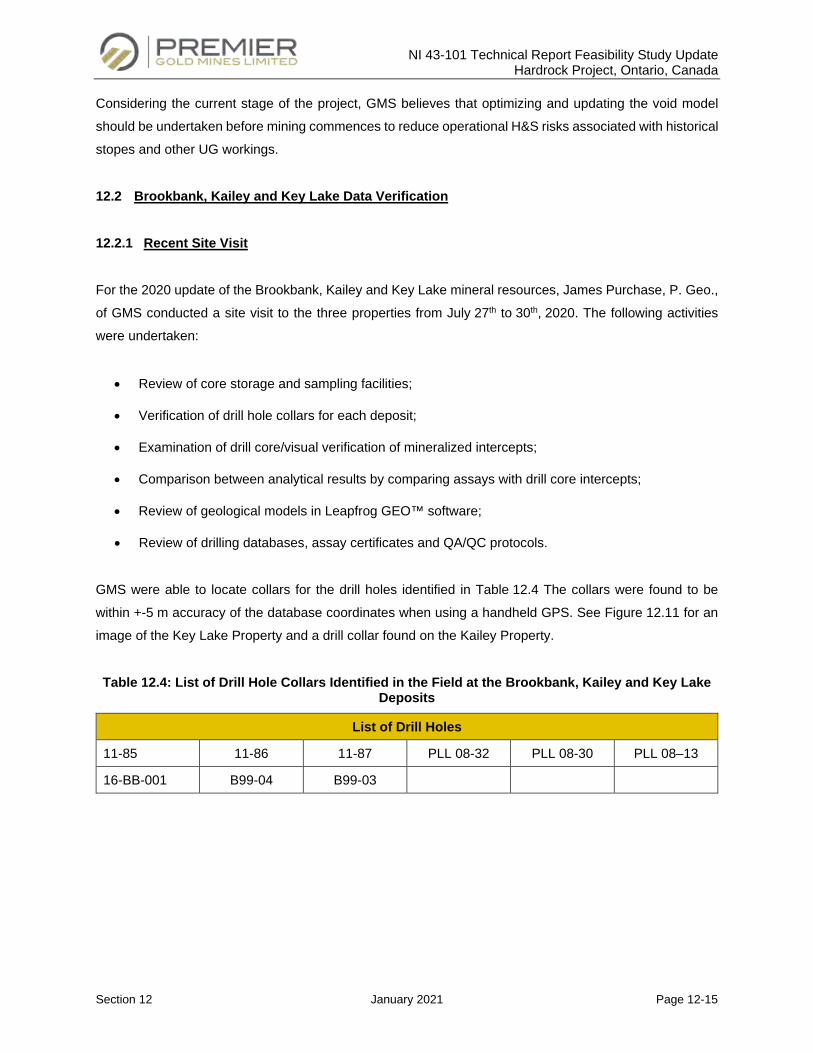
NI 43-101 Technical Report Feasibility Study Update Hardrock Project, Ontario, Canada
Section 12 January 2021 Page 12-15
Considering the current stage of the project, GMS believes that optimizing and updating the void model
should be undertaken before mining commences to reduce operational H&S risks associated with historical
stopes and other UG workings.
12.2 Brookbank, Kailey and Key Lake Data Verification
12.2.1 Recent Site Visit
For the 2020 update of the Brookbank, Kailey and Key Lake mineral resources, James Purchase, P. Geo.,
of GMS conducted a site visit to the three properties from July 27th to 30th, 2020. The following activities
were undertaken:
• Review of core storage and sampling facilities;
• Verification of drill hole collars for each deposit;
• Examination of drill core/visual verification of mineralized intercepts;
• Comparison between analytical results by comparing assays with drill core intercepts;
• Review of geological models in Leapfrog GEO™ software;
• Review of drilling databases, assay certificates and QA/QC protocols.
GMS were able to locate collars for the drill holes identified in Table 12.4 The collars were found to be
within +-5 m accuracy of the database coordinates when using a handheld GPS. See Figure 12.11 for an
image of the Key Lake Property and a drill collar found on the Kailey Property.
Table 12.4: List of Drill Hole Collars Identified in the Field at the Brookbank, Kailey and Key Lake Deposits
List of Drill Holes
11-85 11-86 11-87 PLL 08-32 PLL 08-30 PLL 08–13
16-BB-001 B99-04 B99-03
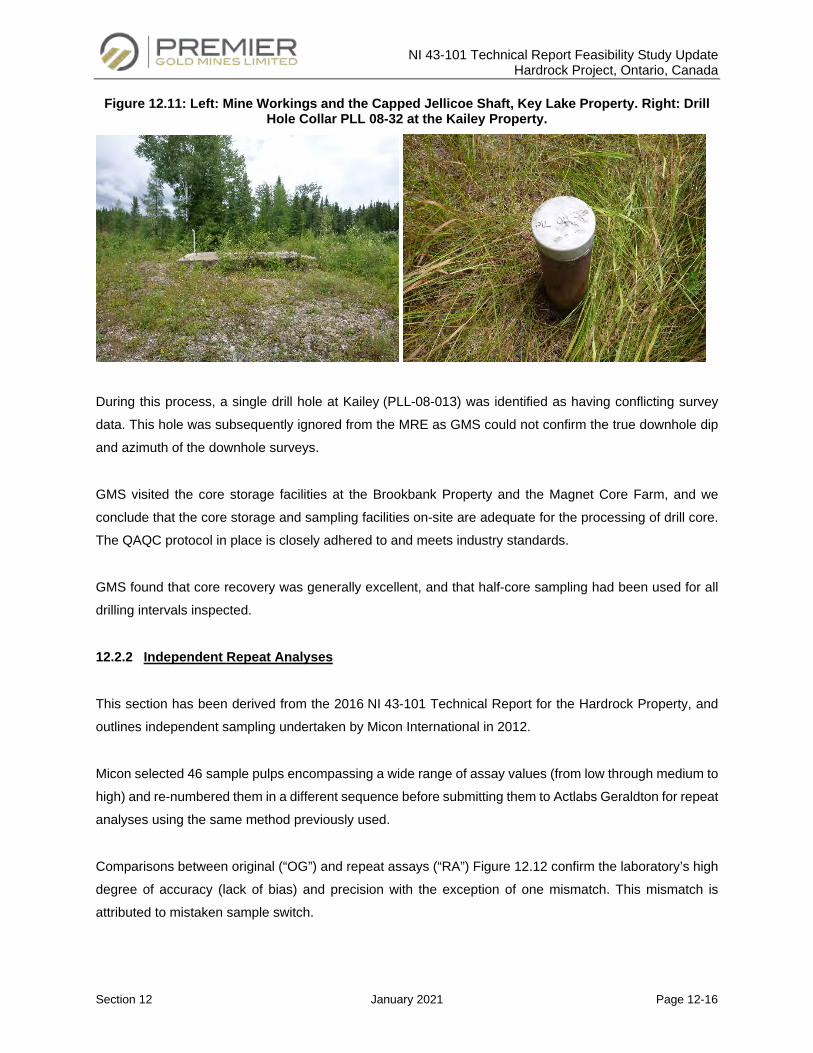
NI 43-101 Technical Report Feasibility Study Update Hardrock Project, Ontario, Canada
Section 12 January 2021 Page 12-16
Figure 12.11: Left: Mine Workings and the Capped Jellicoe Shaft, Key Lake Property. Right: Drill Hole Collar PLL 08-32 at the Kailey Property.
During this process, a single drill hole at Kailey (PLL-08-013) was identified as having conflicting survey
data. This hole was subsequently ignored from the MRE as GMS could not confirm the true downhole dip
and azimuth of the downhole surveys.
GMS visited the core storage facilities at the Brookbank Property and the Magnet Core Farm, and we
conclude that the core storage and sampling facilities on-site are adequate for the processing of drill core.
The QAQC protocol in place is closely adhered to and meets industry standards.
GMS found that core recovery was generally excellent, and that half-core sampling had been used for all
drilling intervals inspected.
12.2.2 Independent Repeat Analyses
This section has been derived from the 2016 NI 43-101 Technical Report for the Hardrock Property, and
outlines independent sampling undertaken by Micon International in 2012.
Micon selected 46 sample pulps encompassing a wide range of assay values (from low through medium to
high) and re-numbered them in a different sequence before submitting them to Actlabs Geraldton for repeat
analyses using the same method previously used.
Comparisons between original (“OG”) and repeat assays (“RA”) Figure 12.12 confirm the laboratory’s high
degree of accuracy (lack of bias) and precision with the exception of one mismatch. This mismatch is
attributed to mistaken sample switch.
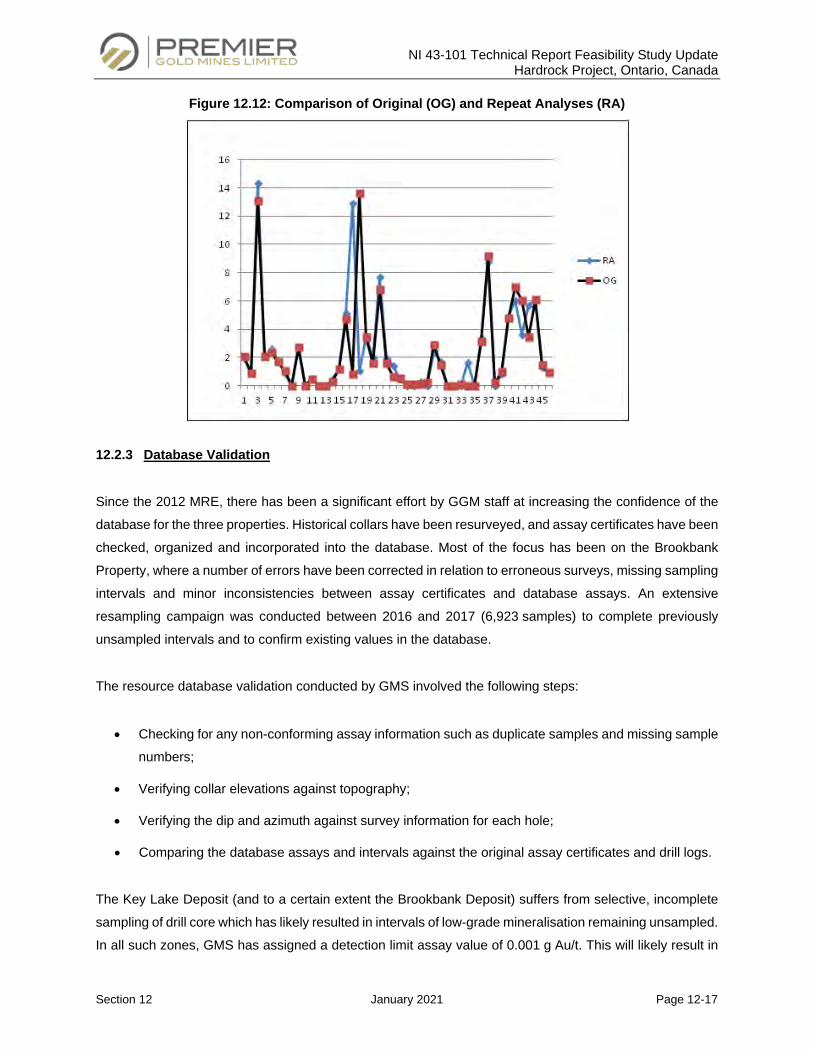
NI 43-101 Technical Report Feasibility Study Update Hardrock Project, Ontario, Canada
Section 12 January 2021 Page 12-17
Figure 12.12: Comparison of Original (OG) and Repeat Analyses (RA)
12.2.3 Database Validation
Since the 2012 MRE, there has been a significant effort by GGM staff at increasing the confidence of the
database for the three properties. Historical collars have been resurveyed, and assay certificates have been
checked, organized and incorporated into the database. Most of the focus has been on the Brookbank
Property, where a number of errors have been corrected in relation to erroneous surveys, missing sampling
intervals and minor inconsistencies between assay certificates and database assays. An extensive
resampling campaign was conducted between 2016 and 2017 (6,923 samples) to complete previously
unsampled intervals and to confirm existing values in the database.
The resource database validation conducted by GMS involved the following steps:
• Checking for any non-conforming assay information such as duplicate samples and missing sample
numbers;
• Verifying collar elevations against topography;
• Verifying the dip and azimuth against survey information for each hole;
• Comparing the database assays and intervals against the original assay certificates and drill logs.
The Key Lake Deposit (and to a certain extent the Brookbank Deposit) suffers from selective, incomplete
sampling of drill core which has likely resulted in intervals of low-grade mineralisation remaining unsampled.
In all such zones, GMS has assigned a detection limit assay value of 0.001 g Au/t. This will likely result in
NI 43-101 Technical Report Feasibility Study Update Hardrock Project, Ontario, Canada
Section 12 January 2021 Page 12-18
an understatement of the ounces, but is industry standard approach when faced with under-sampled drill
core.
In addition, GMS has ignored drilling intervals where underground workings were intersected (flagged as
“breakthroughs” in the lithology logging), rather than applied a 0.001 g/t grade.
12.2.4 Underground Void Models
Historical plans and sections of underground workings have been recently digitized for the Kailey and Key
Lake Deposits, which have resulted in a 3D void model that can be incorporated into the 2020 MRE update.
For Key Lake, the Jellicoe shaft collar was surveyed and all plans and sections were digitised and pinned
to the collar coordinate. At Kailey, underground drifts were digitised from level plans, and the mined vein
was also modelled from a long-section assuming a constant width of 1 m. Unfortunately, no stope
information was available to incorporate into the block model, however GMS did subtract the mined vein
from the MRE. The void models are shown in Figure 12.13.
No underground voids are present at the Brookbank Deposit as no past production has taken place.
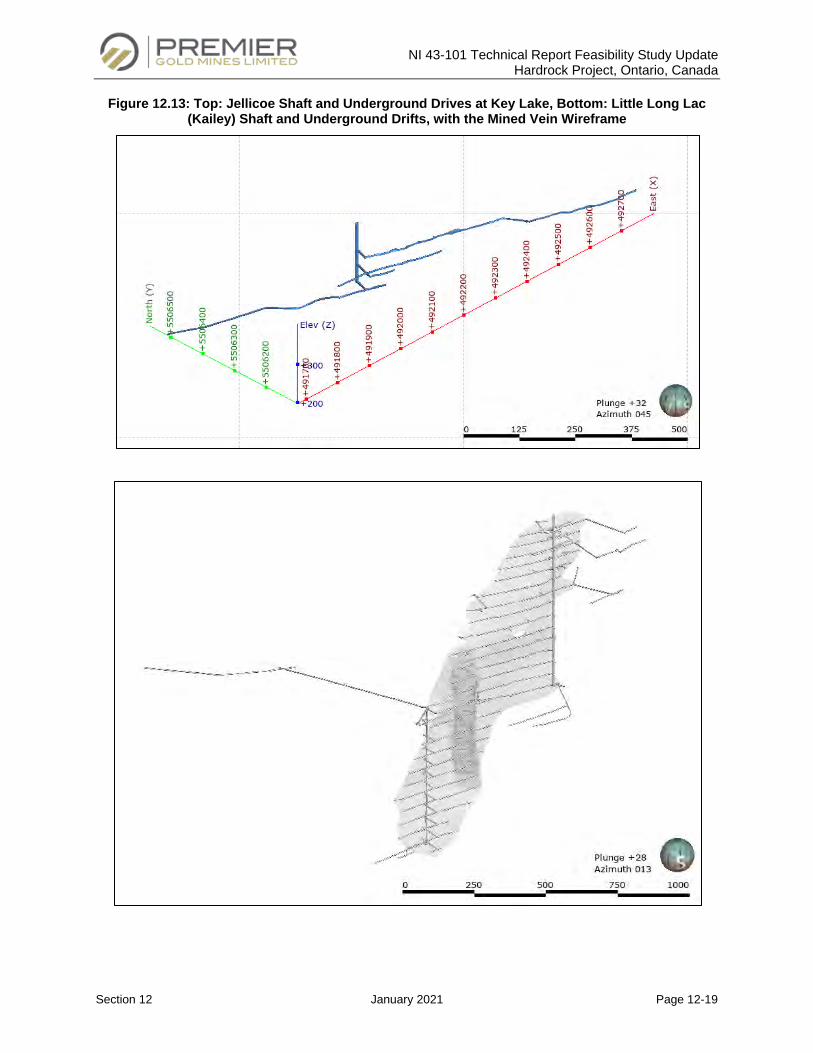
NI 43-101 Technical Report Feasibility Study Update Hardrock Project, Ontario, Canada
Section 12 January 2021 Page 12-19
Figure 12.13: Top: Jellicoe Shaft and Underground Drives at Key Lake, Bottom: Little Long Lac (Kailey) Shaft and Underground Drifts, with the Mined Vein Wireframe
NI 43-101 Technical Report Feasibility Study Update Hardrock Project, Ontario, Canada
Section 12 January 2021 Page 12-20
12.2.5 Data Verification Conclusions and Recommendations – Brookbank, Kailey and Key Lake
Considering the data verification that has been undertaken on the three properties by GMS, and previously
by Micon and Scott Wilson, GMS believes that database generated by GGM is suitable for use in Mineral
Resource estimation. A significant effort has been undertaken since 2012 to increase the confidence in the
drilling database, and the current DataShed database is comprehensive in tracking drilling with validated
collar, surveys and assay certificates.
The insertion of a detection limit value of 0.001 g Au/t for a missing assay may likely lead to an
understatement of the resource grade at Key Lake, but nonetheless it ensures that all intercepts are used
in the estimate and no over-extrapolation of grades occur into unmineralized areas.
12.3 Data Verification for Tailings Management Facility
The site visit revealed the necessity for field investigations to characterize the sub-surface conditions along
the Tailings Management Facility (“TMF”) dam footprint. Geotechnical investigations were undertaken
during 2014, 2015, 2016, 2018 and 2019 which included test pitting, borehole drilling, cone penetration test
and field vane shear tests. Disturbed and undisturbed samples were extracted and tested for various index,
strength parameters in an approved laboratory. The stratigraphic and strength information of the subsurface
units were reviewed, interpreted and utilized in the design of the TMF dams.
Extensive geotechnical investigations in the TMF dam footprint have facilitated the assessment of design
parameters required for the TMF dam design.
NI 43-101 Technical Report Feasibility Study Update Hardrock Project, Ontario, Canada
Section 13 January 2021 Page 13-1
MINERAL PROCESSING AND METALLURGICAL TESTING
This section summarizes all the relevant test work performed on the Hardrock Deposit. It is divided into
three sub-sections: test work completed prior to the Feasibility Study (“FS”), test work performed during the
FS and test work completed during the detailed engineering phase. Only recent reports (from 2011
onwards) are summarized in this section.
13.1 Previous Test Work
Some mineralogy, grindability and gold recovery test work was performed prior to the start of the FS. The
key reports from 2011 to 2013 are summarized in this section. The reference documents are listed below:
• SGS Lakefield Research Limited, An Investigation into Gold Recovery from Hardrock Project Ore,
Final Report-12400-001, March 1, 2011;
• SGS Canada Inc., The Recovery of Gold from the Hardrock Project – Phase 2 Samples, Final
Report-12400-002 -, December 11, 2012;
• McClelland Laboratories, Inc., Whole Ore Cyanidation Testing - Project AF Drill Hole Reject
Composites, MLI Job No. 3817, September 24, 2013;
• SGS Canada Inc., QEM Automated Rapid Mineral Scan, Report 14117-001 – MI6000-OCT13 -,
October 31, 2013.
13.1.1 Gold Recovery Test Work at SGS Lakefield (Phase 1)
Samples were sent to SGS Lakefield Research Limited in March of 2010. Two composites were prepared
and were subjected to head analyses, mineralogy, Bond Work Index determination, gravity separation,
gravity tailings flotation and whole ore, gravity tailings and flotation concentrate cyanidation.
13.1.1.1 Head Assays
Composites 1 and 2 were submitted for gold analysis according to the metallic sieve protocol. Two, 1 kg
samples of each composite were submitted for coarse gold analysis (+/- 106 µm or 150 mesh fractions).
The fine fraction was assayed in duplicate (analysis “a” and “b”). The results are presented in Table 13.1.
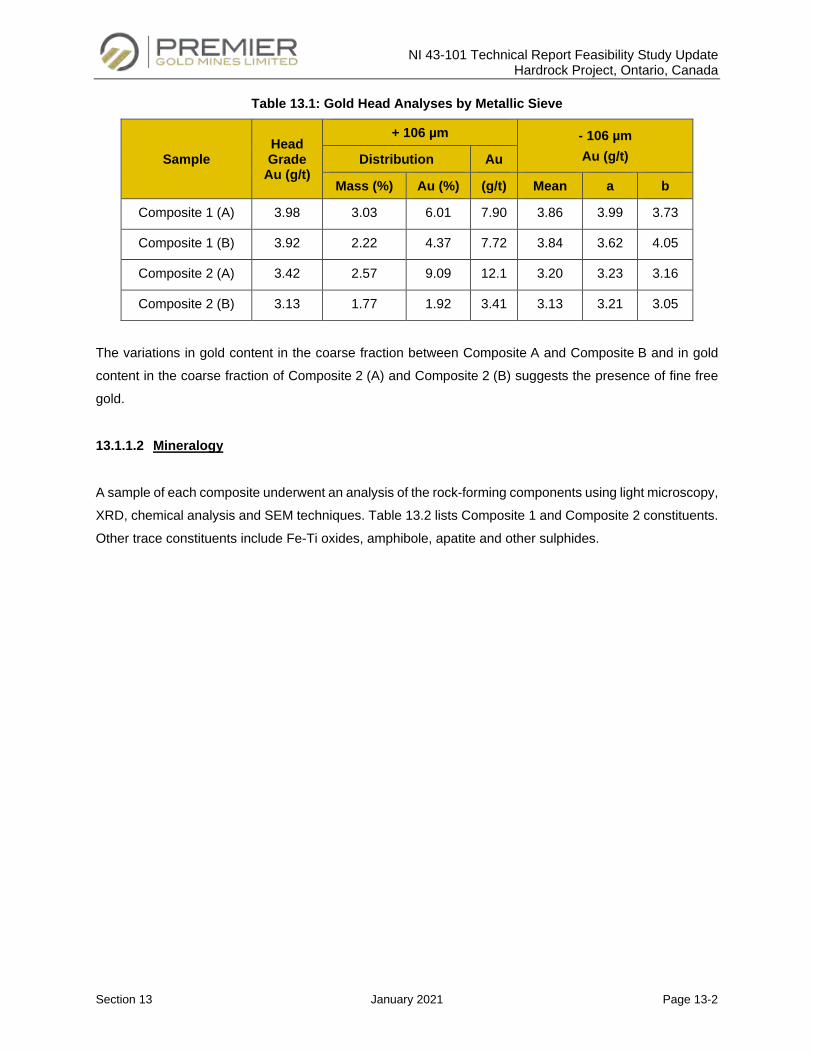
NI 43-101 Technical Report Feasibility Study Update Hardrock Project, Ontario, Canada
Section 13 January 2021 Page 13-2
Table 13.1: Gold Head Analyses by Metallic Sieve
Sample Head Grade
Au (g/t)
+ 106 µm - 106 µm Au (g/t) Distribution Au
Mass (%) Au (%) (g/t) Mean a b
Composite 1 (A) 3.98 3.03 6.01 7.90 3.86 3.99 3.73
Composite 1 (B) 3.92 2.22 4.37 7.72 3.84 3.62 4.05
Composite 2 (A) 3.42 2.57 9.09 12.1 3.20 3.23 3.16
Composite 2 (B) 3.13 1.77 1.92 3.41 3.13 3.21 3.05
The variations in gold content in the coarse fraction between Composite A and Composite B and in gold
content in the coarse fraction of Composite 2 (A) and Composite 2 (B) suggests the presence of fine free
gold.
13.1.1.2 Mineralogy
A sample of each composite underwent an analysis of the rock-forming components using light microscopy,
XRD, chemical analysis and SEM techniques. Table 13.2 lists Composite 1 and Composite 2 constituents.
Other trace constituents include Fe-Ti oxides, amphibole, apatite and other sulphides.
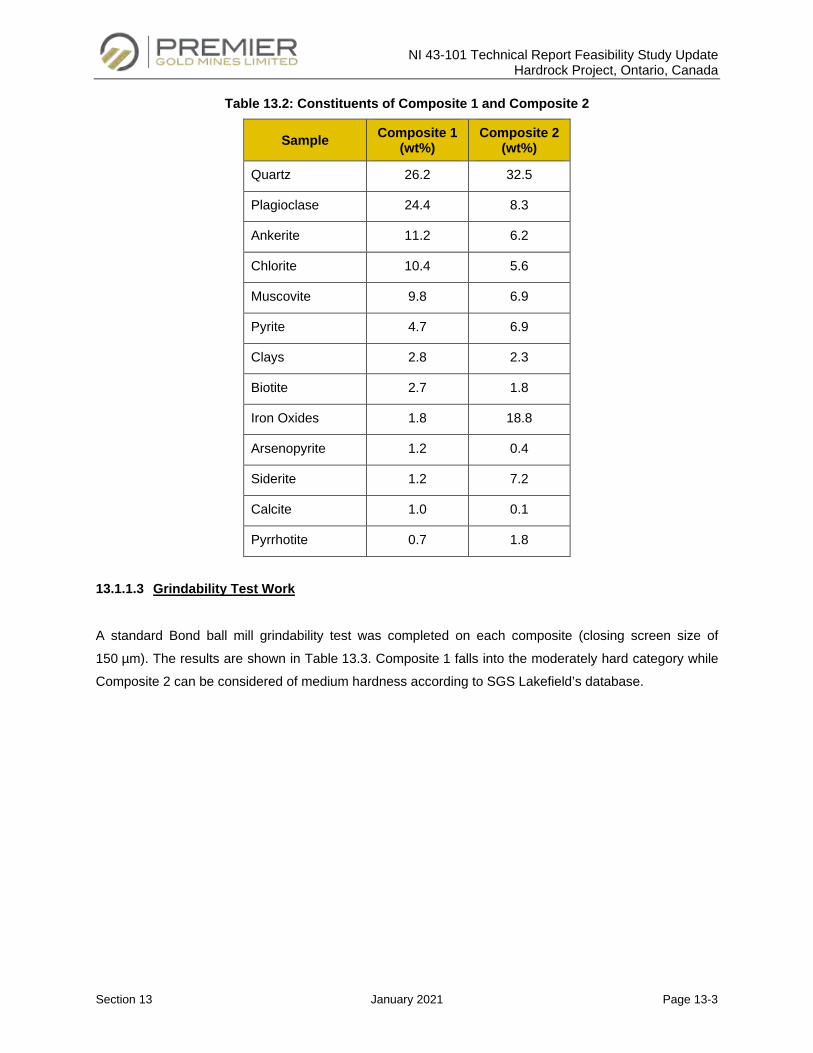
NI 43-101 Technical Report Feasibility Study Update Hardrock Project, Ontario, Canada
Section 13 January 2021 Page 13-3
Table 13.2: Constituents of Composite 1 and Composite 2
Sample Composite 1 (wt%)
Composite 2 (wt%)
Quartz 26.2 32.5
Plagioclase 24.4 8.3
Ankerite 11.2 6.2
Chlorite 10.4 5.6
Muscovite 9.8 6.9
Pyrite 4.7 6.9
Clays 2.8 2.3
Biotite 2.7 1.8
Iron Oxides 1.8 18.8
Arsenopyrite 1.2 0.4
Siderite 1.2 7.2
Calcite 1.0 0.1
Pyrrhotite 0.7 1.8
13.1.1.3 Grindability Test Work
A standard Bond ball mill grindability test was completed on each composite (closing screen size of
150 µm). The results are shown in Table 13.3. Composite 1 falls into the moderately hard category while
Composite 2 can be considered of medium hardness according to SGS Lakefield’s database.
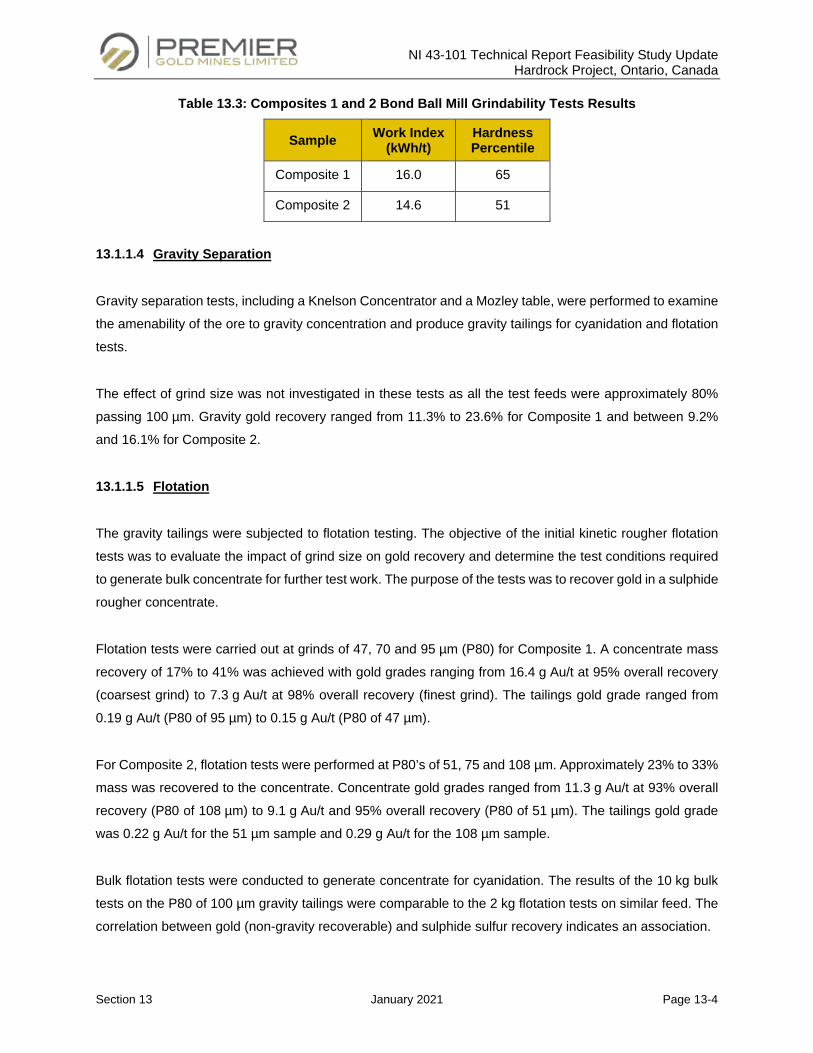
NI 43-101 Technical Report Feasibility Study Update Hardrock Project, Ontario, Canada
Section 13 January 2021 Page 13-4
Table 13.3: Composites 1 and 2 Bond Ball Mill Grindability Tests Results
Sample Work Index (kWh/t)
Hardness Percentile
Composite 1 16.0 65
Composite 2 14.6 51
13.1.1.4 Gravity Separation
Gravity separation tests, including a Knelson Concentrator and a Mozley table, were performed to examine
the amenability of the ore to gravity concentration and produce gravity tailings for cyanidation and flotation
tests.
The effect of grind size was not investigated in these tests as all the test feeds were approximately 80%
passing 100 µm. Gravity gold recovery ranged from 11.3% to 23.6% for Composite 1 and between 9.2%
and 16.1% for Composite 2.
13.1.1.5 Flotation
The gravity tailings were subjected to flotation testing. The objective of the initial kinetic rougher flotation
tests was to evaluate the impact of grind size on gold recovery and determine the test conditions required
to generate bulk concentrate for further test work. The purpose of the tests was to recover gold in a sulphide
rougher concentrate.
Flotation tests were carried out at grinds of 47, 70 and 95 µm (P80) for Composite 1. A concentrate mass
recovery of 17% to 41% was achieved with gold grades ranging from 16.4 g Au/t at 95% overall recovery
(coarsest grind) to 7.3 g Au/t at 98% overall recovery (finest grind). The tailings gold grade ranged from
0.19 g Au/t (P80 of 95 µm) to 0.15 g Au/t (P80 of 47 µm).
For Composite 2, flotation tests were performed at P80’s of 51, 75 and 108 µm. Approximately 23% to 33%
mass was recovered to the concentrate. Concentrate gold grades ranged from 11.3 g Au/t at 93% overall
recovery (P80 of 108 µm) to 9.1 g Au/t and 95% overall recovery (P80 of 51 µm). The tailings gold grade
was 0.22 g Au/t for the 51 µm sample and 0.29 g Au/t for the 108 µm sample.
Bulk flotation tests were conducted to generate concentrate for cyanidation. The results of the 10 kg bulk
tests on the P80 of 100 µm gravity tailings were comparable to the 2 kg flotation tests on similar feed. The
correlation between gold (non-gravity recoverable) and sulphide sulfur recovery indicates an association.
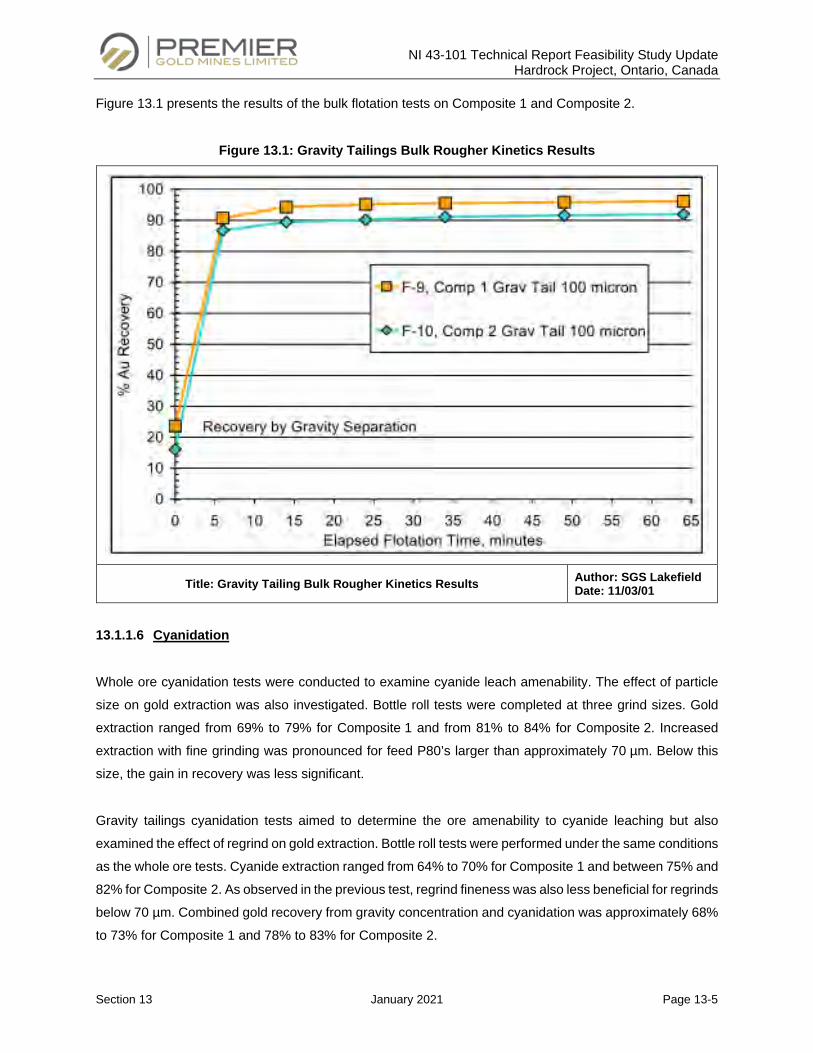
NI 43-101 Technical Report Feasibility Study Update Hardrock Project, Ontario, Canada
Section 13 January 2021 Page 13-5
Figure 13.1 presents the results of the bulk flotation tests on Composite 1 and Composite 2.
Figure 13.1: Gravity Tailings Bulk Rougher Kinetics Results
Title: Gravity Tailing Bulk Rougher Kinetics Results Author: SGS Lakefield Date: 11/03/01
13.1.1.6 Cyanidation
Whole ore cyanidation tests were conducted to examine cyanide leach amenability. The effect of particle
size on gold extraction was also investigated. Bottle roll tests were completed at three grind sizes. Gold
extraction ranged from 69% to 79% for Composite 1 and from 81% to 84% for Composite 2. Increased
extraction with fine grinding was pronounced for feed P80’s larger than approximately 70 µm. Below this
size, the gain in recovery was less significant.
Gravity tailings cyanidation tests aimed to determine the ore amenability to cyanide leaching but also
examined the effect of regrind on gold extraction. Bottle roll tests were performed under the same conditions
as the whole ore tests. Cyanide extraction ranged from 64% to 70% for Composite 1 and between 75% and
82% for Composite 2. As observed in the previous test, regrind fineness was also less beneficial for regrinds
below 70 µm. Combined gold recovery from gravity concentration and cyanidation was approximately 68%
to 73% for Composite 1 and 78% to 83% for Composite 2.
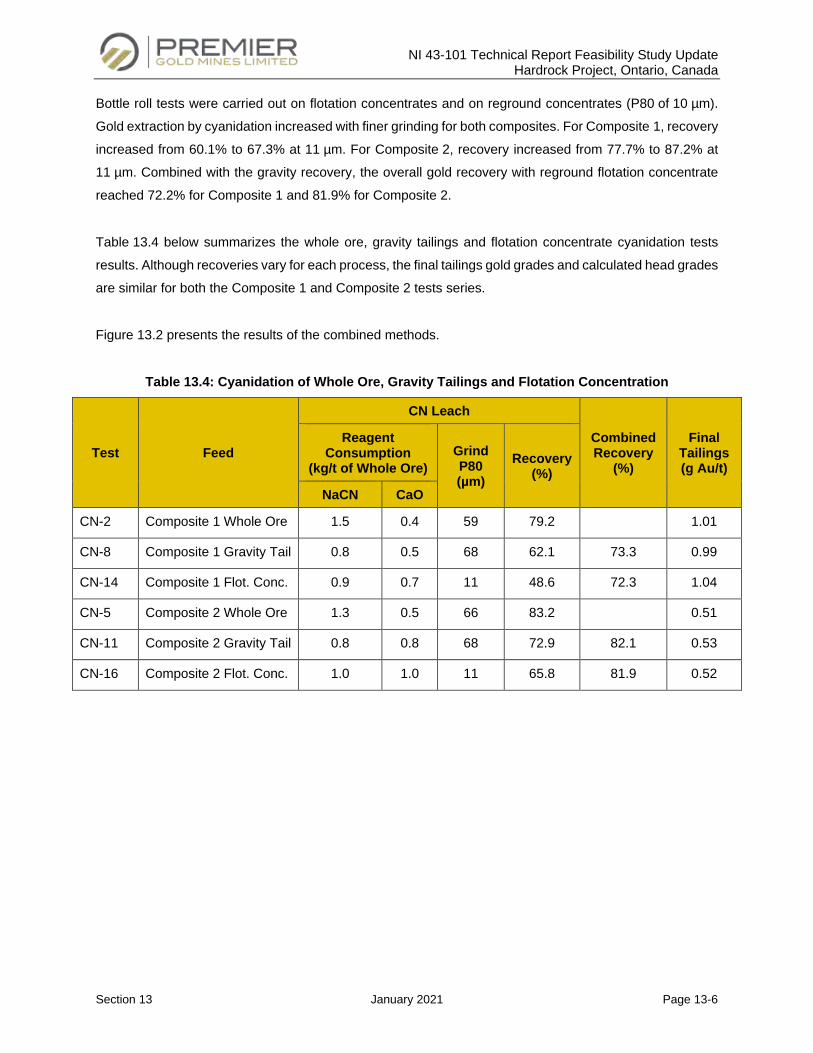
NI 43-101 Technical Report Feasibility Study Update Hardrock Project, Ontario, Canada
Section 13 January 2021 Page 13-6
Bottle roll tests were carried out on flotation concentrates and on reground concentrates (P80 of 10 µm).
Gold extraction by cyanidation increased with finer grinding for both composites. For Composite 1, recovery
increased from 60.1% to 67.3% at 11 µm. For Composite 2, recovery increased from 77.7% to 87.2% at
11 µm. Combined with the gravity recovery, the overall gold recovery with reground flotation concentrate
reached 72.2% for Composite 1 and 81.9% for Composite 2.
Table 13.4 below summarizes the whole ore, gravity tailings and flotation concentrate cyanidation tests
results. Although recoveries vary for each process, the final tailings gold grades and calculated head grades
are similar for both the Composite 1 and Composite 2 tests series.
Figure 13.2 presents the results of the combined methods.
Table 13.4: Cyanidation of Whole Ore, Gravity Tailings and Flotation Concentration
Test Feed
CN Leach
Combined Recovery
(%)
Final Tailings (g Au/t)
Reagent Consumption
(kg/t of Whole Ore) Grind P80 (µm)
Recovery (%)
NaCN CaO
CN-2 Composite 1 Whole Ore 1.5 0.4 59 79.2 1.01
CN-8 Composite 1 Gravity Tail 0.8 0.5 68 62.1 73.3 0.99
CN-14 Composite 1 Flot. Conc. 0.9 0.7 11 48.6 72.3 1.04
CN-5 Composite 2 Whole Ore 1.3 0.5 66 83.2 0.51
CN-11 Composite 2 Gravity Tail 0.8 0.8 68 72.9 82.1 0.53
CN-16 Composite 2 Flot. Conc. 1.0 1.0 11 65.8 81.9 0.52
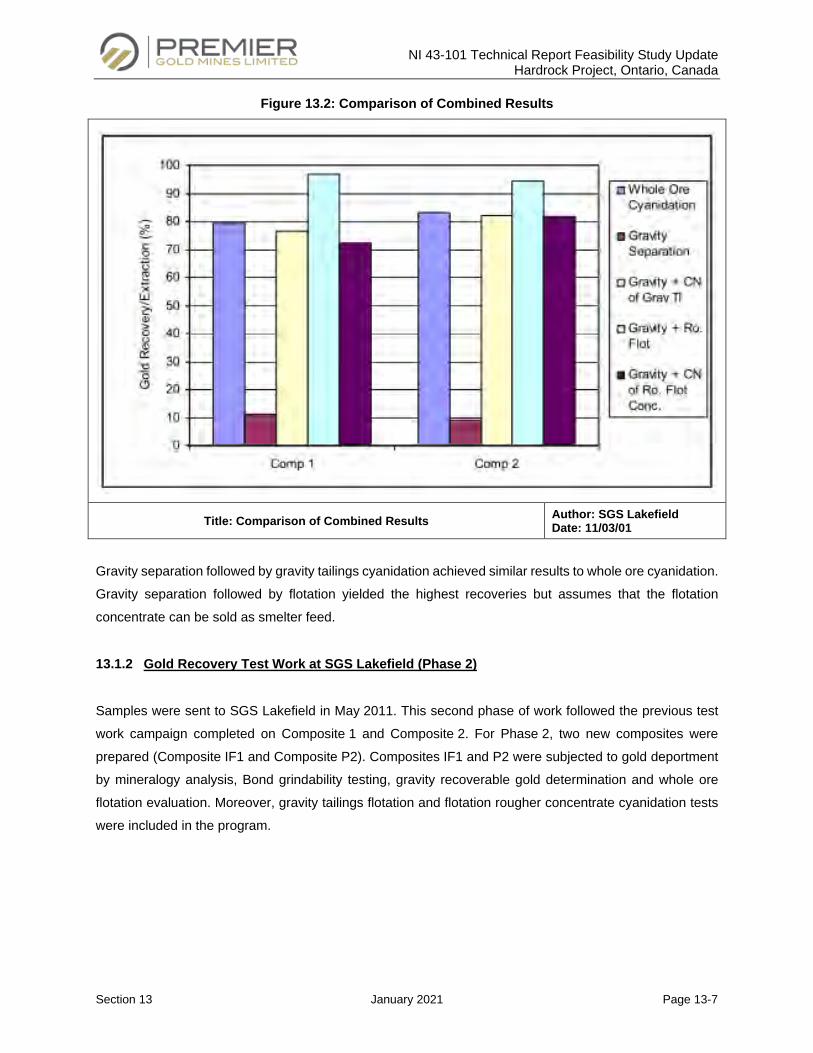
NI 43-101 Technical Report Feasibility Study Update Hardrock Project, Ontario, Canada
Section 13 January 2021 Page 13-7
Figure 13.2: Comparison of Combined Results
Title: Comparison of Combined Results Author: SGS Lakefield Date: 11/03/01
Gravity separation followed by gravity tailings cyanidation achieved similar results to whole ore cyanidation.
Gravity separation followed by flotation yielded the highest recoveries but assumes that the flotation
concentrate can be sold as smelter feed.
13.1.2 Gold Recovery Test Work at SGS Lakefield (Phase 2)
Samples were sent to SGS Lakefield in May 2011. This second phase of work followed the previous test
work campaign completed on Composite 1 and Composite 2. For Phase 2, two new composites were
prepared (Composite IF1 and Composite P2). Composites IF1 and P2 were subjected to gold deportment
by mineralogy analysis, Bond grindability testing, gravity recoverable gold determination and whole ore
flotation evaluation. Moreover, gravity tailings flotation and flotation rougher concentrate cyanidation tests
were included in the program.
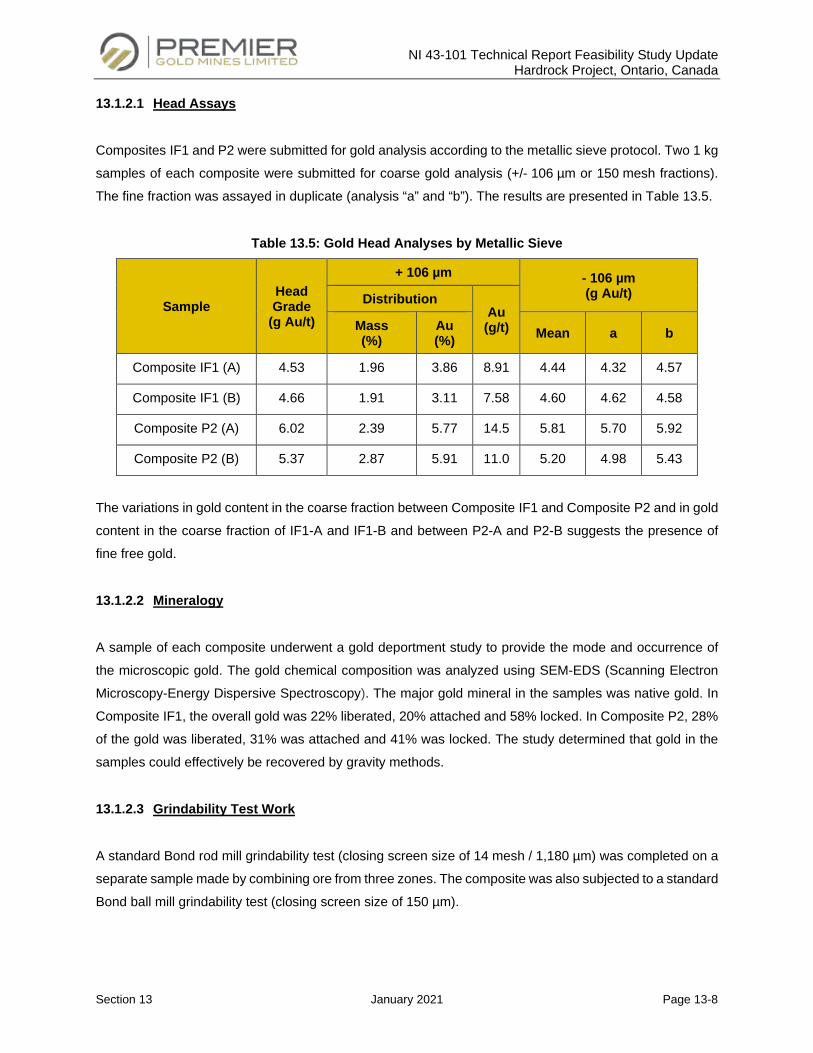
NI 43-101 Technical Report Feasibility Study Update Hardrock Project, Ontario, Canada
Section 13 January 2021 Page 13-8
13.1.2.1 Head Assays
Composites IF1 and P2 were submitted for gold analysis according to the metallic sieve protocol. Two 1 kg
samples of each composite were submitted for coarse gold analysis (+/- 106 µm or 150 mesh fractions).
The fine fraction was assayed in duplicate (analysis “a” and “b”). The results are presented in Table 13.5.
Table 13.5: Gold Head Analyses by Metallic Sieve
Sample Head Grade
(g Au/t)
+ 106 µm - 106 µm (g Au/t) Distribution
Au (g/t) Mass
(%) Au (%) Mean a b
Composite IF1 (A) 4.53 1.96 3.86 8.91 4.44 4.32 4.57
Composite IF1 (B) 4.66 1.91 3.11 7.58 4.60 4.62 4.58
Composite P2 (A) 6.02 2.39 5.77 14.5 5.81 5.70 5.92
Composite P2 (B) 5.37 2.87 5.91 11.0 5.20 4.98 5.43
The variations in gold content in the coarse fraction between Composite IF1 and Composite P2 and in gold
content in the coarse fraction of IF1-A and IF1-B and between P2-A and P2-B suggests the presence of
fine free gold.
13.1.2.2 Mineralogy
A sample of each composite underwent a gold deportment study to provide the mode and occurrence of
the microscopic gold. The gold chemical composition was analyzed using SEM-EDS (Scanning Electron
Microscopy-Energy Dispersive Spectroscopy). The major gold mineral in the samples was native gold. In
Composite IF1, the overall gold was 22% liberated, 20% attached and 58% locked. In Composite P2, 28%
of the gold was liberated, 31% was attached and 41% was locked. The study determined that gold in the
samples could effectively be recovered by gravity methods.
13.1.2.3 Grindability Test Work
A standard Bond rod mill grindability test (closing screen size of 14 mesh / 1,180 µm) was completed on a
separate sample made by combining ore from three zones. The composite was also subjected to a standard
Bond ball mill grindability test (closing screen size of 150 µm).
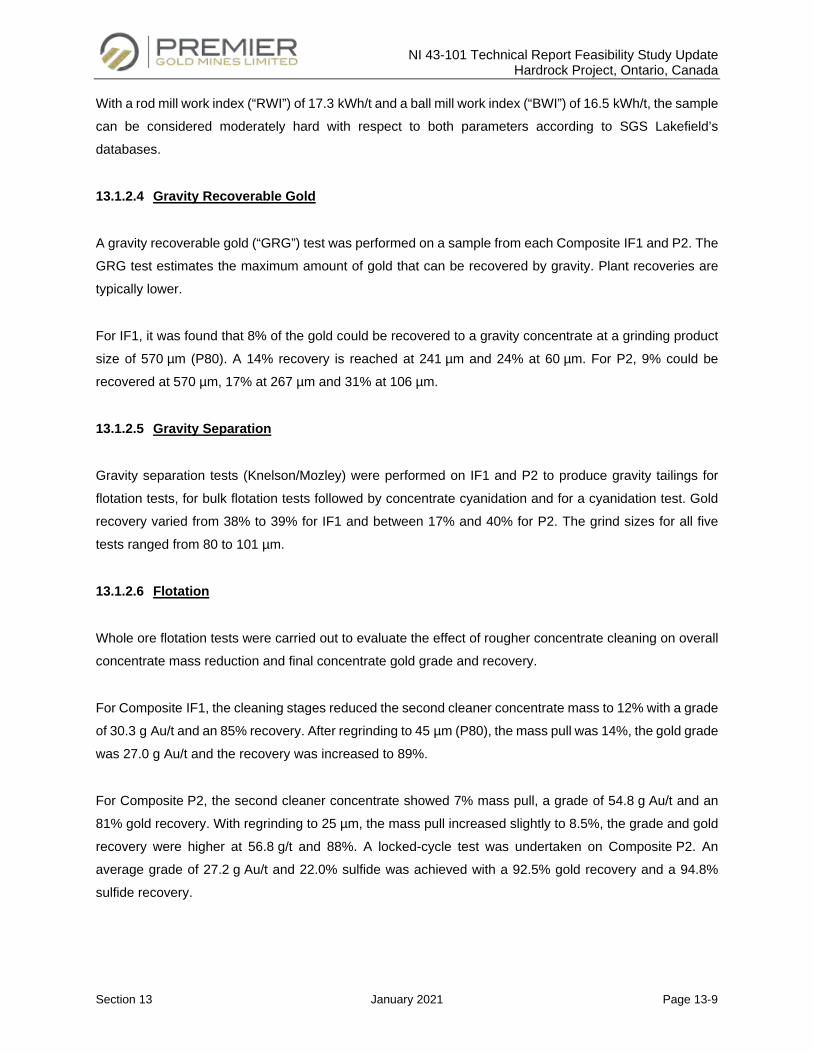
NI 43-101 Technical Report Feasibility Study Update Hardrock Project, Ontario, Canada
Section 13 January 2021 Page 13-9
With a rod mill work index (“RWI”) of 17.3 kWh/t and a ball mill work index (“BWI”) of 16.5 kWh/t, the sample
can be considered moderately hard with respect to both parameters according to SGS Lakefield’s
databases.
13.1.2.4 Gravity Recoverable Gold
A gravity recoverable gold (“GRG”) test was performed on a sample from each Composite IF1 and P2. The
GRG test estimates the maximum amount of gold that can be recovered by gravity. Plant recoveries are
typically lower.
For IF1, it was found that 8% of the gold could be recovered to a gravity concentrate at a grinding product
size of 570 µm (P80). A 14% recovery is reached at 241 µm and 24% at 60 µm. For P2, 9% could be
recovered at 570 µm, 17% at 267 µm and 31% at 106 µm.
13.1.2.5 Gravity Separation
Gravity separation tests (Knelson/Mozley) were performed on IF1 and P2 to produce gravity tailings for
flotation tests, for bulk flotation tests followed by concentrate cyanidation and for a cyanidation test. Gold
recovery varied from 38% to 39% for IF1 and between 17% and 40% for P2. The grind sizes for all five
tests ranged from 80 to 101 µm.
13.1.2.6 Flotation
Whole ore flotation tests were carried out to evaluate the effect of rougher concentrate cleaning on overall
concentrate mass reduction and final concentrate gold grade and recovery.
For Composite IF1, the cleaning stages reduced the second cleaner concentrate mass to 12% with a grade
of 30.3 g Au/t and an 85% recovery. After regrinding to 45 µm (P80), the mass pull was 14%, the gold grade
was 27.0 g Au/t and the recovery was increased to 89%.
For Composite P2, the second cleaner concentrate showed 7% mass pull, a grade of 54.8 g Au/t and an
81% gold recovery. With regrinding to 25 µm, the mass pull increased slightly to 8.5%, the grade and gold
recovery were higher at 56.8 g/t and 88%. A locked-cycle test was undertaken on Composite P2. An
average grade of 27.2 g Au/t and 22.0% sulfide was achieved with a 92.5% gold recovery and a 94.8%
sulfide recovery.
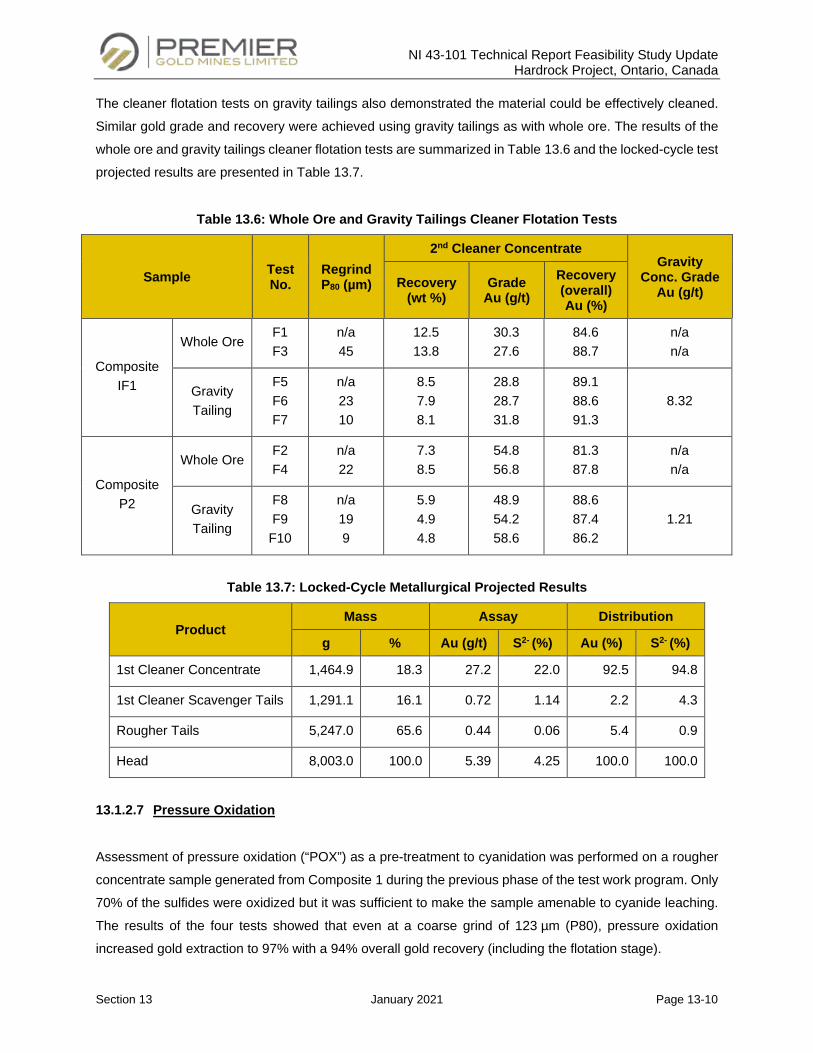
NI 43-101 Technical Report Feasibility Study Update Hardrock Project, Ontario, Canada
Section 13 January 2021 Page 13-10
The cleaner flotation tests on gravity tailings also demonstrated the material could be effectively cleaned.
Similar gold grade and recovery were achieved using gravity tailings as with whole ore. The results of the
whole ore and gravity tailings cleaner flotation tests are summarized in Table 13.6 and the locked-cycle test
projected results are presented in Table 13.7.
Table 13.6: Whole Ore and Gravity Tailings Cleaner Flotation Tests
Sample Test No.
Regrind P80 (µm)
2nd Cleaner Concentrate Gravity
Conc. Grade Au (g/t)
Recovery (wt %)
Grade Au (g/t)
Recovery (overall) Au (%)
Composite IF1
Whole Ore F1 F3
n/a 45
12.5 13.8
30.3 27.6
84.6 88.7
n/a n/a
Gravity Tailing
F5 F6 F7
n/a 23 10
8.5 7.9 8.1
28.8 28.7 31.8
89.1 88.6 91.3
8.32
Composite P2
Whole Ore F2 F4
n/a 22
7.3 8.5
54.8 56.8
81.3 87.8
n/a n/a
Gravity Tailing
F8 F9
F10
n/a 19 9
5.9 4.9 4.8
48.9 54.2 58.6
88.6 87.4 86.2
1.21
Table 13.7: Locked-Cycle Metallurgical Projected Results
Product Mass Assay Distribution
g % Au (g/t) S2- (%) Au (%) S2- (%)
1st Cleaner Concentrate 1,464.9 18.3 27.2 22.0 92.5 94.8
1st Cleaner Scavenger Tails 1,291.1 16.1 0.72 1.14 2.2 4.3
Rougher Tails 5,247.0 65.6 0.44 0.06 5.4 0.9
Head 8,003.0 100.0 5.39 4.25 100.0 100.0
13.1.2.7 Pressure Oxidation
Assessment of pressure oxidation (“POX”) as a pre-treatment to cyanidation was performed on a rougher
concentrate sample generated from Composite 1 during the previous phase of the test work program. Only
70% of the sulfides were oxidized but it was sufficient to make the sample amenable to cyanide leaching.
The results of the four tests showed that even at a coarse grind of 123 µm (P80), pressure oxidation
increased gold extraction to 97% with a 94% overall gold recovery (including the flotation stage).
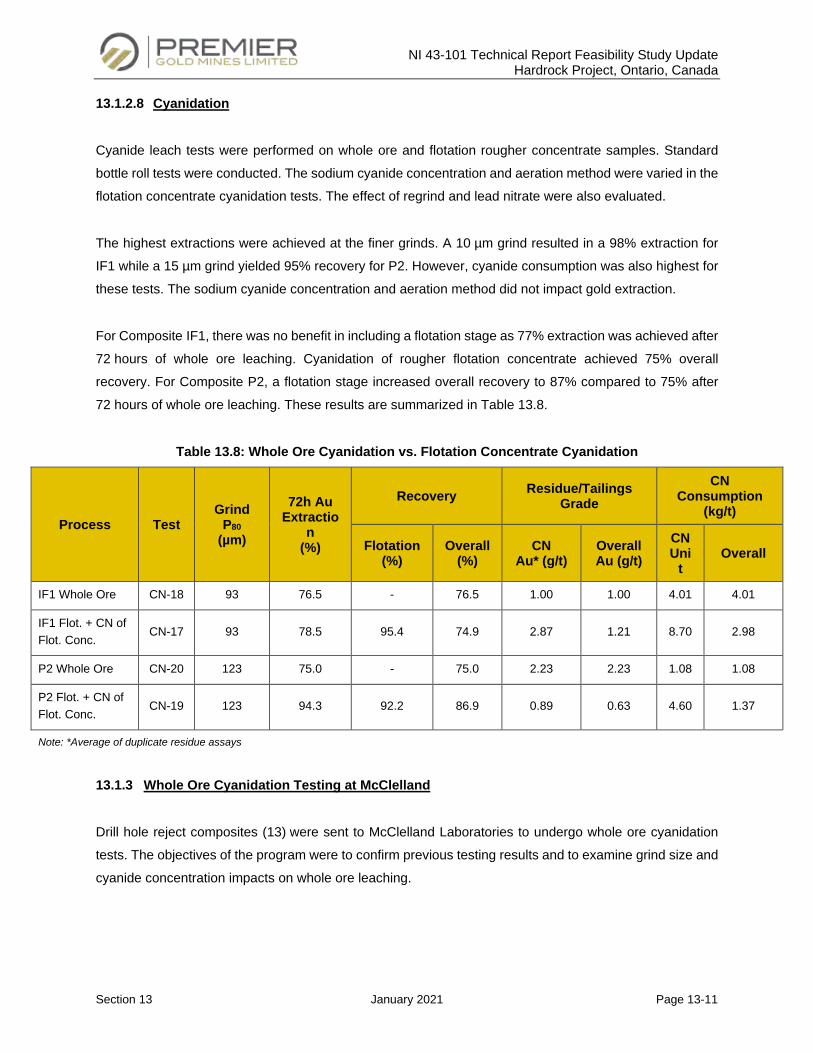
NI 43-101 Technical Report Feasibility Study Update Hardrock Project, Ontario, Canada
Section 13 January 2021 Page 13-11
13.1.2.8 Cyanidation
Cyanide leach tests were performed on whole ore and flotation rougher concentrate samples. Standard
bottle roll tests were conducted. The sodium cyanide concentration and aeration method were varied in the
flotation concentrate cyanidation tests. The effect of regrind and lead nitrate were also evaluated.
The highest extractions were achieved at the finer grinds. A 10 µm grind resulted in a 98% extraction for
IF1 while a 15 µm grind yielded 95% recovery for P2. However, cyanide consumption was also highest for
these tests. The sodium cyanide concentration and aeration method did not impact gold extraction.
For Composite IF1, there was no benefit in including a flotation stage as 77% extraction was achieved after
72 hours of whole ore leaching. Cyanidation of rougher flotation concentrate achieved 75% overall
recovery. For Composite P2, a flotation stage increased overall recovery to 87% compared to 75% after
72 hours of whole ore leaching. These results are summarized in Table 13.8.
Table 13.8: Whole Ore Cyanidation vs. Flotation Concentrate Cyanidation
Process Test Grind
P80 (µm)
72h Au Extractio
n (%)
Recovery Residue/Tailings Grade
CN Consumption
(kg/t)
Flotation (%)
Overall (%)
CN Au* (g/t)
Overall Au (g/t)
CN Uni
t Overall
IF1 Whole Ore CN-18 93 76.5 - 76.5 1.00 1.00 4.01 4.01
IF1 Flot. + CN of Flot. Conc.
CN-17 93 78.5 95.4 74.9 2.87 1.21 8.70 2.98
P2 Whole Ore CN-20 123 75.0 - 75.0 2.23 2.23 1.08 1.08
P2 Flot. + CN of Flot. Conc.
CN-19 123 94.3 92.2 86.9 0.89 0.63 4.60 1.37
Note: *Average of duplicate residue assays
13.1.3 Whole Ore Cyanidation Testing at McClelland
Drill hole reject composites (13) were sent to McClelland Laboratories to undergo whole ore cyanidation
tests. The objectives of the program were to confirm previous testing results and to examine grind size and
cyanide concentration impacts on whole ore leaching.
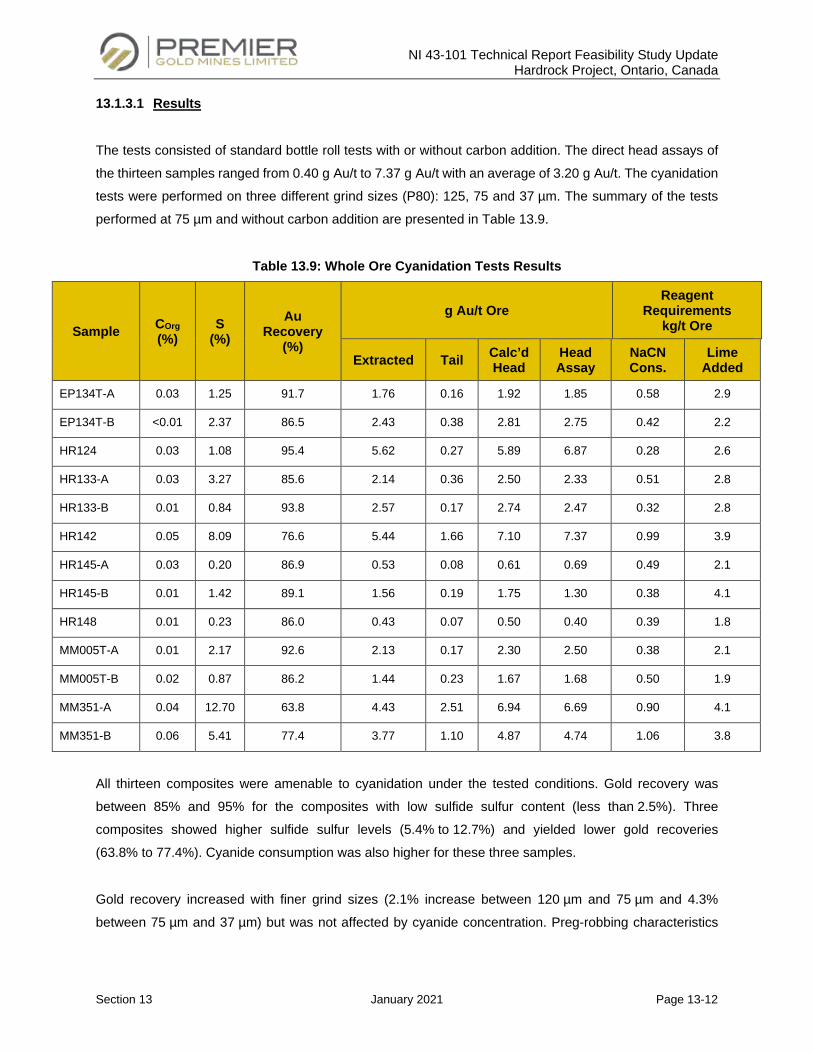
NI 43-101 Technical Report Feasibility Study Update Hardrock Project, Ontario, Canada
Section 13 January 2021 Page 13-12
13.1.3.1 Results
The tests consisted of standard bottle roll tests with or without carbon addition. The direct head assays of
the thirteen samples ranged from 0.40 g Au/t to 7.37 g Au/t with an average of 3.20 g Au/t. The cyanidation
tests were performed on three different grind sizes (P80): 125, 75 and 37 µm. The summary of the tests
performed at 75 µm and without carbon addition are presented in Table 13.9.
Table 13.9: Whole Ore Cyanidation Tests Results
Sample COrg (%)
S (%)
Au Recovery
(%)
g Au/t Ore Reagent
Requirements kg/t Ore
Extracted Tail Calc’dHead
Head Assay
NaCN Cons.
Lime Added
EP134T-A 0.03 1.25 91.7 1.76 0.16 1.92 1.85 0.58 2.9
EP134T-B <0.01 2.37 86.5 2.43 0.38 2.81 2.75 0.42 2.2
HR124 0.03 1.08 95.4 5.62 0.27 5.89 6.87 0.28 2.6
HR133-A 0.03 3.27 85.6 2.14 0.36 2.50 2.33 0.51 2.8
HR133-B 0.01 0.84 93.8 2.57 0.17 2.74 2.47 0.32 2.8
HR142 0.05 8.09 76.6 5.44 1.66 7.10 7.37 0.99 3.9
HR145-A 0.03 0.20 86.9 0.53 0.08 0.61 0.69 0.49 2.1
HR145-B 0.01 1.42 89.1 1.56 0.19 1.75 1.30 0.38 4.1
HR148 0.01 0.23 86.0 0.43 0.07 0.50 0.40 0.39 1.8
MM005T-A 0.01 2.17 92.6 2.13 0.17 2.30 2.50 0.38 2.1
MM005T-B 0.02 0.87 86.2 1.44 0.23 1.67 1.68 0.50 1.9
MM351-A 0.04 12.70 63.8 4.43 2.51 6.94 6.69 0.90 4.1
MM351-B 0.06 5.41 77.4 3.77 1.10 4.87 4.74 1.06 3.8
All thirteen composites were amenable to cyanidation under the tested conditions. Gold recovery was
between 85% and 95% for the composites with low sulfide sulfur content (less than 2.5%). Three
composites showed higher sulfide sulfur levels (5.4% to 12.7%) and yielded lower gold recoveries
(63.8% to 77.4%). Cyanide consumption was also higher for these three samples.
Gold recovery increased with finer grind sizes (2.1% increase between 120 µm and 75 µm and 4.3%
between 75 µm and 37 µm) but was not affected by cyanide concentration. Preg-robbing characteristics
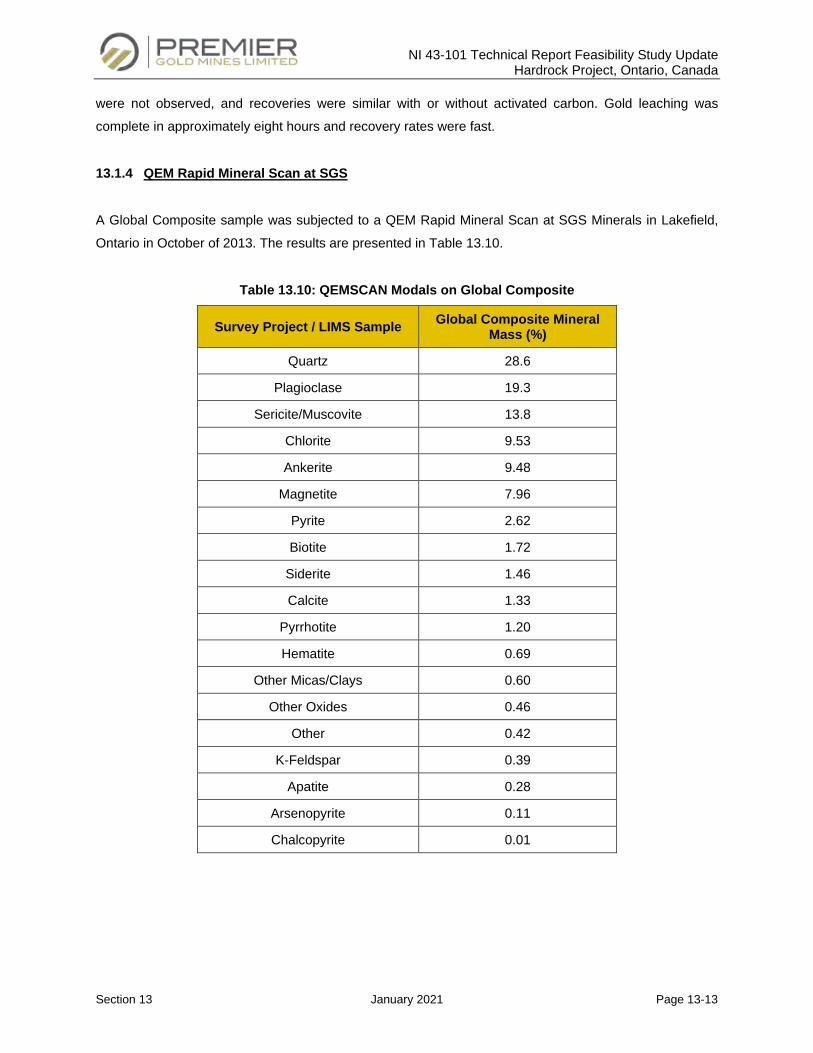
NI 43-101 Technical Report Feasibility Study Update Hardrock Project, Ontario, Canada
Section 13 January 2021 Page 13-13
were not observed, and recoveries were similar with or without activated carbon. Gold leaching was
complete in approximately eight hours and recovery rates were fast.
13.1.4 QEM Rapid Mineral Scan at SGS
A Global Composite sample was subjected to a QEM Rapid Mineral Scan at SGS Minerals in Lakefield,
Ontario in October of 2013. The results are presented in Table 13.10.
Table 13.10: QEMSCAN Modals on Global Composite
Survey Project / LIMS Sample Global Composite Mineral Mass (%)
Quartz 28.6
Plagioclase 19.3
Sericite/Muscovite 13.8
Chlorite 9.53
Ankerite 9.48
Magnetite 7.96
Pyrite 2.62
Biotite 1.72
Siderite 1.46
Calcite 1.33
Pyrrhotite 1.20
Hematite 0.69
Other Micas/Clays 0.60
Other Oxides 0.46
Other 0.42
K-Feldspar 0.39
Apatite 0.28
Arsenopyrite 0.11
Chalcopyrite 0.01
NI 43-101 Technical Report Feasibility Study Update Hardrock Project, Ontario, Canada
Section 13 January 2021 Page 13-14
13.2 Feasibility Study Test Work
This section includes any test work program that was performed during the Preliminary Economic
Assessment (“PEA”) and during the FS. As the FS progressed, additional test work was initiated and is
described here. Primarily, high pressure grinding rolls (“HPGR”) tests were required to confirm the ore
amenability for high pressure grinding, to select the equipment and estimate the operating costs. The key
reports from 2014 and 2015 are summarized in this section. The reference documents are listed below:
• SGS Canada Inc., An Investigation into the Grindability Characteristics of Samples from the
Hardrock Deposit, Report 1 (Grindability)-14117-001, August 26, 2014;
• SGS Canada Inc., An Investigation into The Hardrock Deposit, Final Report-14117-001, October 8,
2014;
• SGS Canada Inc., The HPGR Amenability of Samples from The Hardrock Deposit, Report 2 –
Rev 1- 14117-001, March 6, 2015;
• JKTech Pty Ltd., Revised SMC Test Report, April 2014;
• FLSmidth, Thickening and Rheology Tests on Gold Ore Composite, June 2014.
13.2.1 Grindability Test Work
Dilution samples (5), PQ core samples (3) and core interval samples (53) were submitted for comminution
testing at SGS Canada Inc. in Lakefield, Ontario. In addition, nine variability composites and one Global
Composite sample were prepared using the core samples. The Global Composite is considered most
representative of the run-of-mine during the project’s life. The samples were submitted for JK drop-weight
tests, SMC tests, Bond low-energy impact tests, Bond rod mill and ball mill grindability tests, ModBond tests
and Bond abrasion tests.
13.2.1.1 Grindability Tests Results
The grindability tests results for the Composite samples, the PQ core samples and the Dilution samples
are presented in Table 13.11.
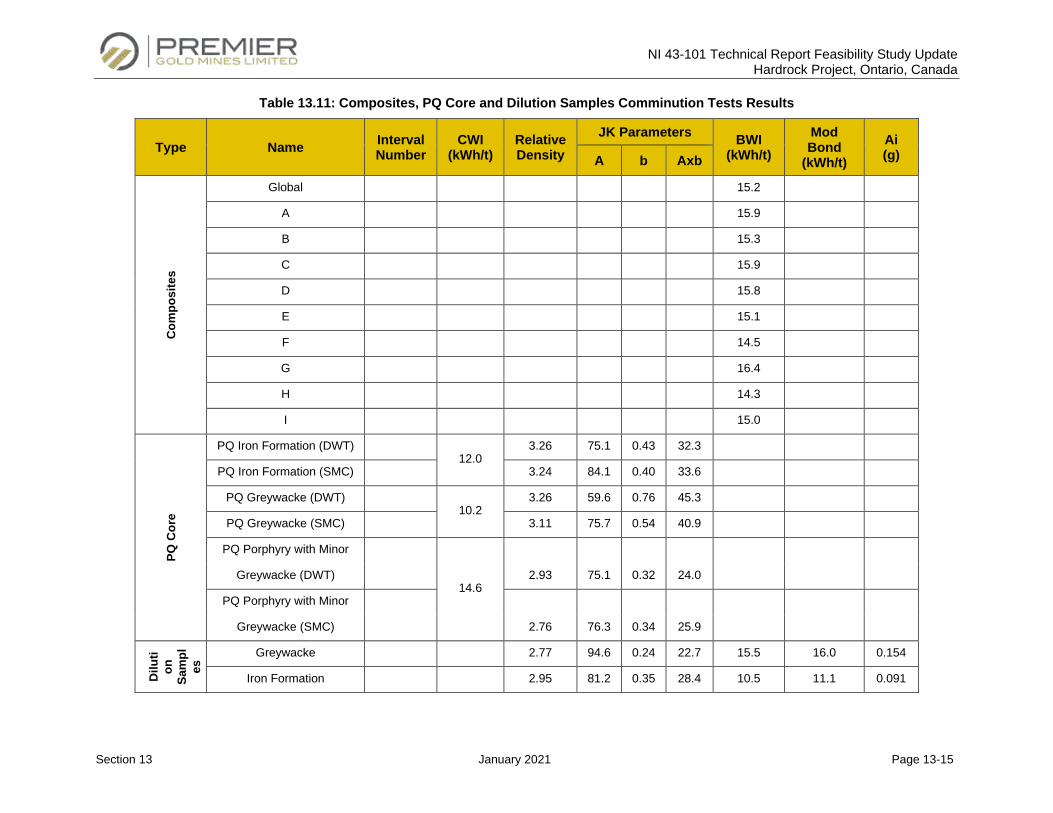
NI 43-101 Technical Report Feasibility Study Update Hardrock Project, Ontario, Canada
Section 13 January 2021 Page 13-15
Table 13.11: Composites, PQ Core and Dilution Samples Comminution Tests Results
Type Name Interval Number
CWI (kWh/t)
Relative Density
JK Parameters BWI (kWh/t)
Mod Bond
(kWh/t) Ai (g) A b Axb
Com
posi
tes
Global 15.2
A 15.9
B 15.3
C 15.9
D 15.8
E 15.1
F 14.5
G 16.4
H 14.3
I 15.0
PQ C
ore
PQ Iron Formation (DWT) 12.0
3.26 75.1 0.43 32.3
PQ Iron Formation (SMC) 3.24 84.1 0.40 33.6
PQ Greywacke (DWT) 10.2
3.26 59.6 0.76 45.3
PQ Greywacke (SMC) 3.11 75.7 0.54 40.9
PQ Porphyry with Minor
Greywacke (DWT) 14.6
2.93 75.1 0.32 24.0
PQ Porphyry with Minor
Greywacke (SMC) 2.76 76.3 0.34 25.9
Dilu
tion
Sa
mpl
es Greywacke 2.77 94.6 0.24 22.7 15.5 16.0 0.154
Iron Formation 2.95 81.2 0.35 28.4 10.5 11.1 0.091
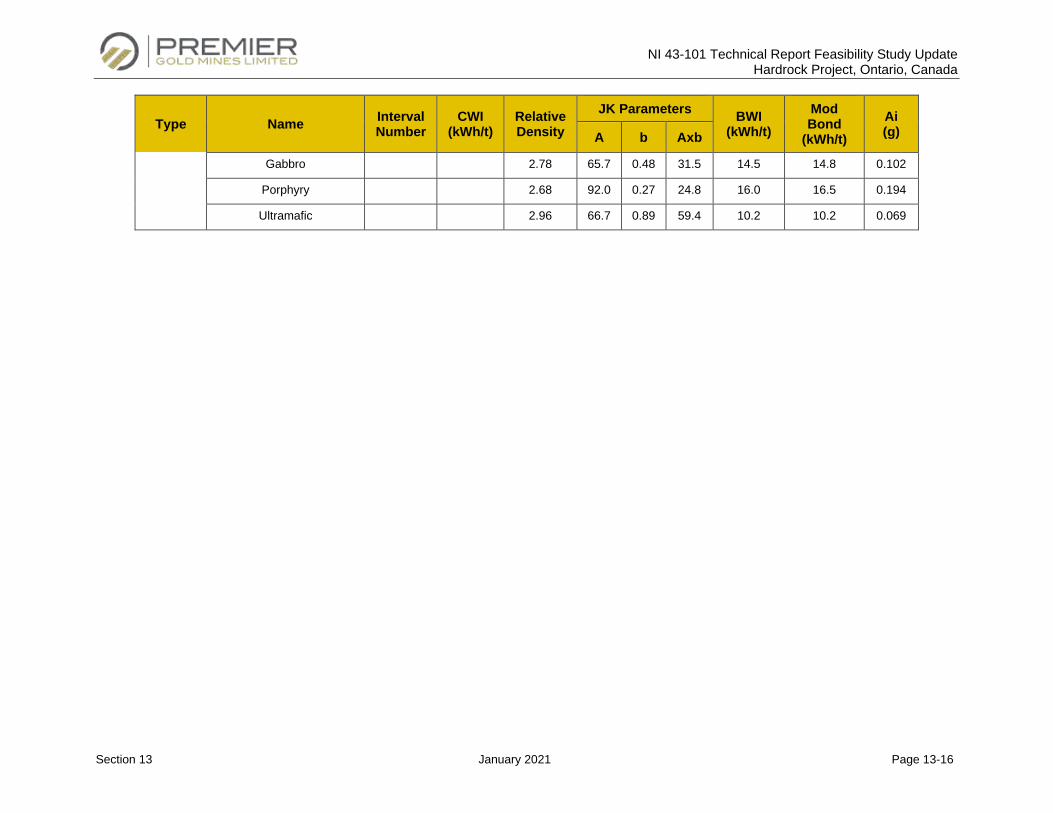
NI 43-101 Technical Report Feasibility Study Update Hardrock Project, Ontario, Canada
Section 13 January 2021 Page 13-16
Type Name Interval Number
CWI (kWh/t)
Relative Density
JK Parameters BWI (kWh/t)
Mod Bond
(kWh/t) Ai (g) A b Axb
Gabbro 2.78 65.7 0.48 31.5 14.5 14.8 0.102
Porphyry 2.68 92.0 0.27 24.8 16.0 16.5 0.194
Ultramafic 2.96 66.7 0.89 59.4 10.2 10.2 0.069
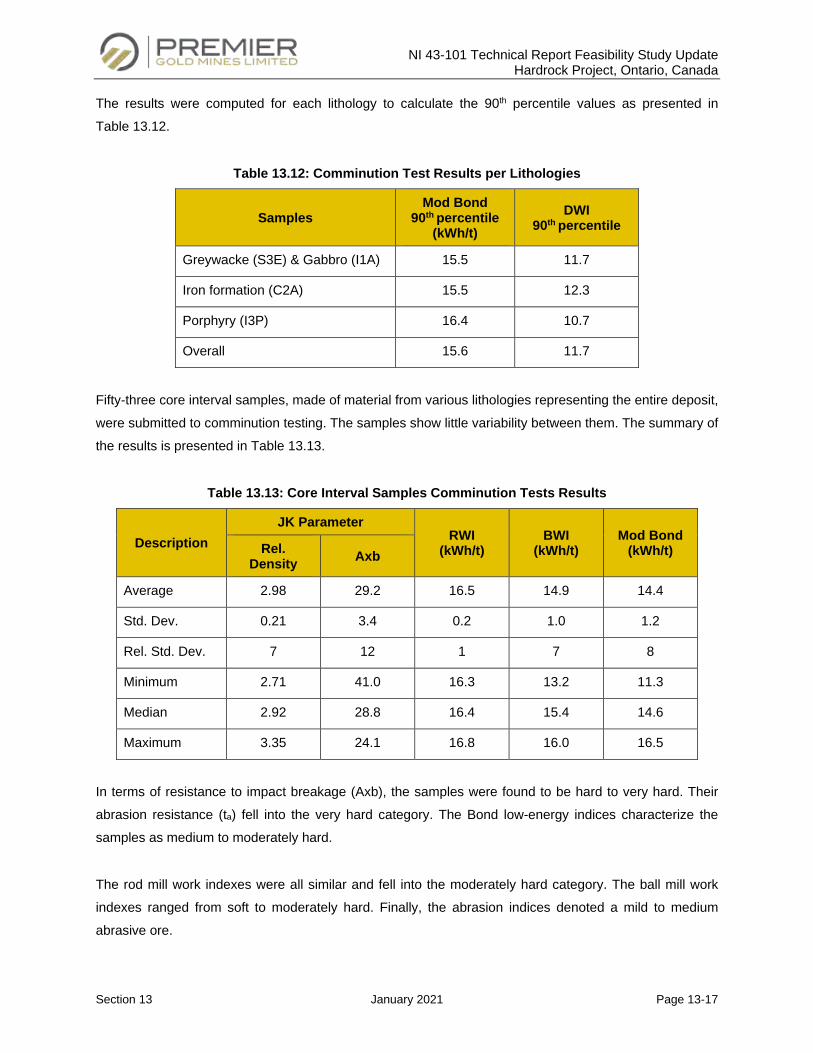
NI 43-101 Technical Report Feasibility Study Update Hardrock Project, Ontario, Canada
Section 13 January 2021 Page 13-17
The results were computed for each lithology to calculate the 90th percentile values as presented in
Table 13.12.
Table 13.12: Comminution Test Results per Lithologies
Samples Mod Bond
90th percentile (kWh/t)
DWI 90th percentile
Greywacke (S3E) & Gabbro (I1A) 15.5 11.7
Iron formation (C2A) 15.5 12.3
Porphyry (I3P) 16.4 10.7
Overall 15.6 11.7
Fifty-three core interval samples, made of material from various lithologies representing the entire deposit,
were submitted to comminution testing. The samples show little variability between them. The summary of
the results is presented in Table 13.13.
Table 13.13: Core Interval Samples Comminution Tests Results
Description JK Parameter
RWI (kWh/t)
BWI (kWh/t)
Mod Bond (kWh/t) Rel.
Density Axb
Average 2.98 29.2 16.5 14.9 14.4
Std. Dev. 0.21 3.4 0.2 1.0 1.2
Rel. Std. Dev. 7 12 1 7 8
Minimum 2.71 41.0 16.3 13.2 11.3
Median 2.92 28.8 16.4 15.4 14.6
Maximum 3.35 24.1 16.8 16.0 16.5
In terms of resistance to impact breakage (Axb), the samples were found to be hard to very hard. Their
abrasion resistance (ta) fell into the very hard category. The Bond low-energy indices characterize the
samples as medium to moderately hard.
The rod mill work indexes were all similar and fell into the moderately hard category. The ball mill work
indexes ranged from soft to moderately hard. Finally, the abrasion indices denoted a mild to medium
abrasive ore.
NI 43-101 Technical Report Feasibility Study Update Hardrock Project, Ontario, Canada
Section 13 January 2021 Page 13-18
13.2.2 Characterization and Recovery Test Work
The samples used for the grindability tests were submitted to head grade determination, mineralogy,
magnetic separation, flotation, gravity separation, cyanidation with cyanide destruction, carbon modelling,
solid-liquid separation and environmental testing. The dilution samples were only assayed for direct head
grade and were not submitted to any metallurgical test work. In addition, six low-grade composites and a
master composite representing the lithological ratios for the first three years of operation were prepared
and tested. The proportion of each lithology in the prepared samples is shown in Table 13.14.
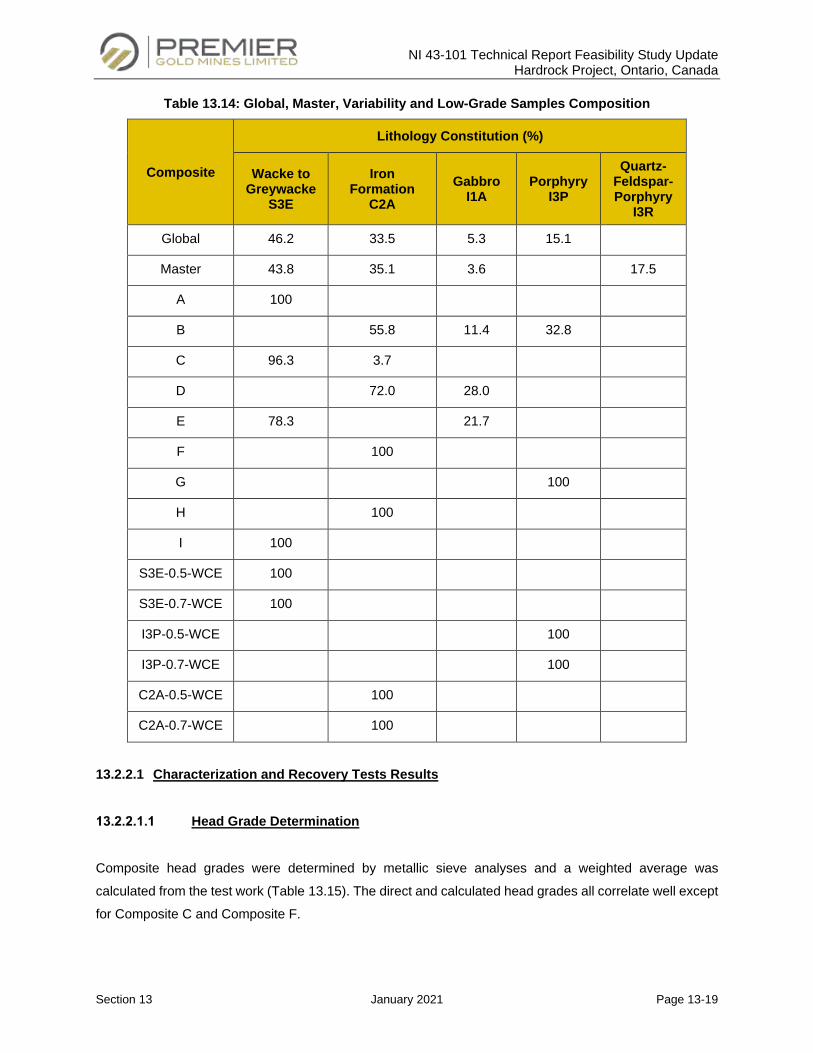
NI 43-101 Technical Report Feasibility Study Update Hardrock Project, Ontario, Canada
Section 13 January 2021 Page 13-19
Table 13.14: Global, Master, Variability and Low-Grade Samples Composition
Composite
Lithology Constitution (%)
Wacke to Greywacke
S3E
Iron Formation
C2A Gabbro
I1A Porphyry
I3P
Quartz-Feldspar-Porphyry
I3R
Global 46.2 33.5 5.3 15.1
Master 43.8 35.1 3.6 17.5
A 100
B 55.8 11.4 32.8
C 96.3 3.7
D 72.0 28.0
E 78.3 21.7
F 100
G 100
H 100
I 100
S3E-0.5-WCE 100
S3E-0.7-WCE 100
I3P-0.5-WCE 100
I3P-0.7-WCE 100
C2A-0.5-WCE 100
C2A-0.7-WCE 100
13.2.2.1 Characterization and Recovery Tests Results
Head Grade Determination
Composite head grades were determined by metallic sieve analyses and a weighted average was
calculated from the test work (Table 13.15). The direct and calculated head grades all correlate well except
for Composite C and Composite F.
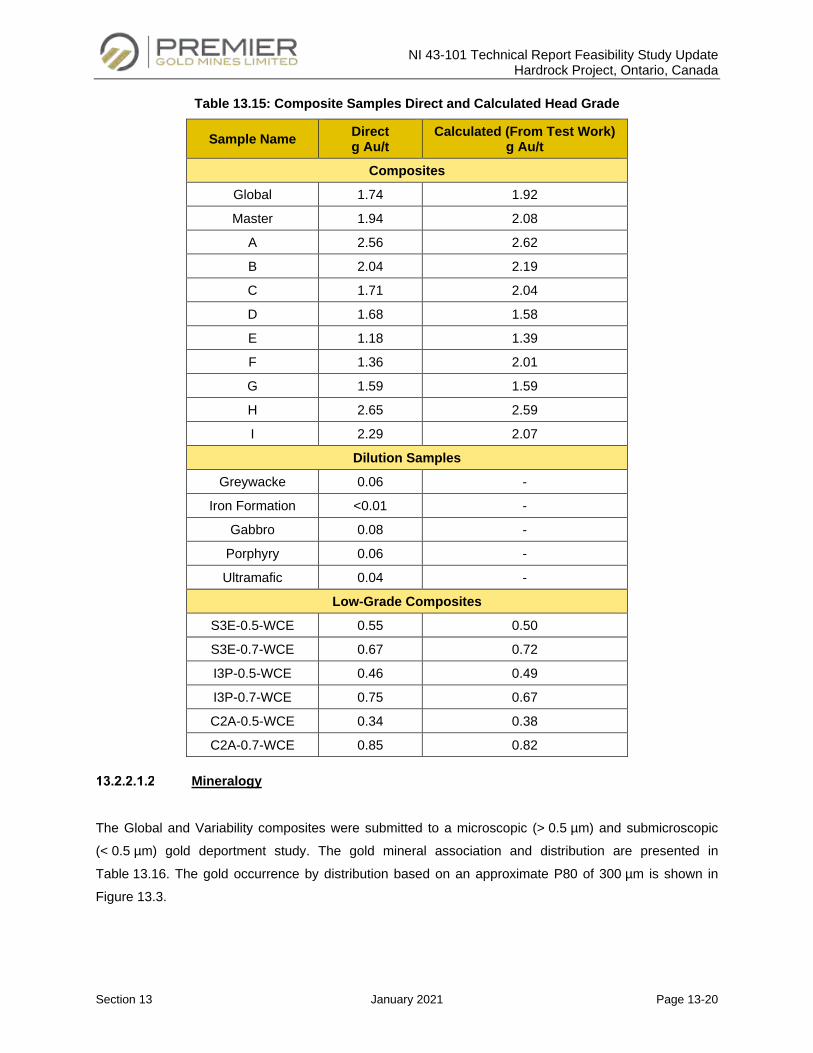
NI 43-101 Technical Report Feasibility Study Update Hardrock Project, Ontario, Canada
Section 13 January 2021 Page 13-20
Table 13.15: Composite Samples Direct and Calculated Head Grade
Sample Name Direct g Au/t
Calculated (From Test Work) g Au/t
Composites
Global 1.74 1.92
Master 1.94 2.08
A 2.56 2.62
B 2.04 2.19
C 1.71 2.04
D 1.68 1.58
E 1.18 1.39
F 1.36 2.01
G 1.59 1.59
H 2.65 2.59
I 2.29 2.07
Dilution Samples
Greywacke 0.06 -
Iron Formation <0.01 -
Gabbro 0.08 -
Porphyry 0.06 -
Ultramafic 0.04 -
Low-Grade Composites
S3E-0.5-WCE 0.55 0.50
S3E-0.7-WCE 0.67 0.72
I3P-0.5-WCE 0.46 0.49
I3P-0.7-WCE 0.75 0.67
C2A-0.5-WCE 0.34 0.38
C2A-0.7-WCE 0.85 0.82
Mineralogy
The Global and Variability composites were submitted to a microscopic (> 0.5 µm) and submicroscopic
(< 0.5 µm) gold deportment study. The gold mineral association and distribution are presented in
Table 13.16. The gold occurrence by distribution based on an approximate P80 of 300 µm is shown in
Figure 13.3.
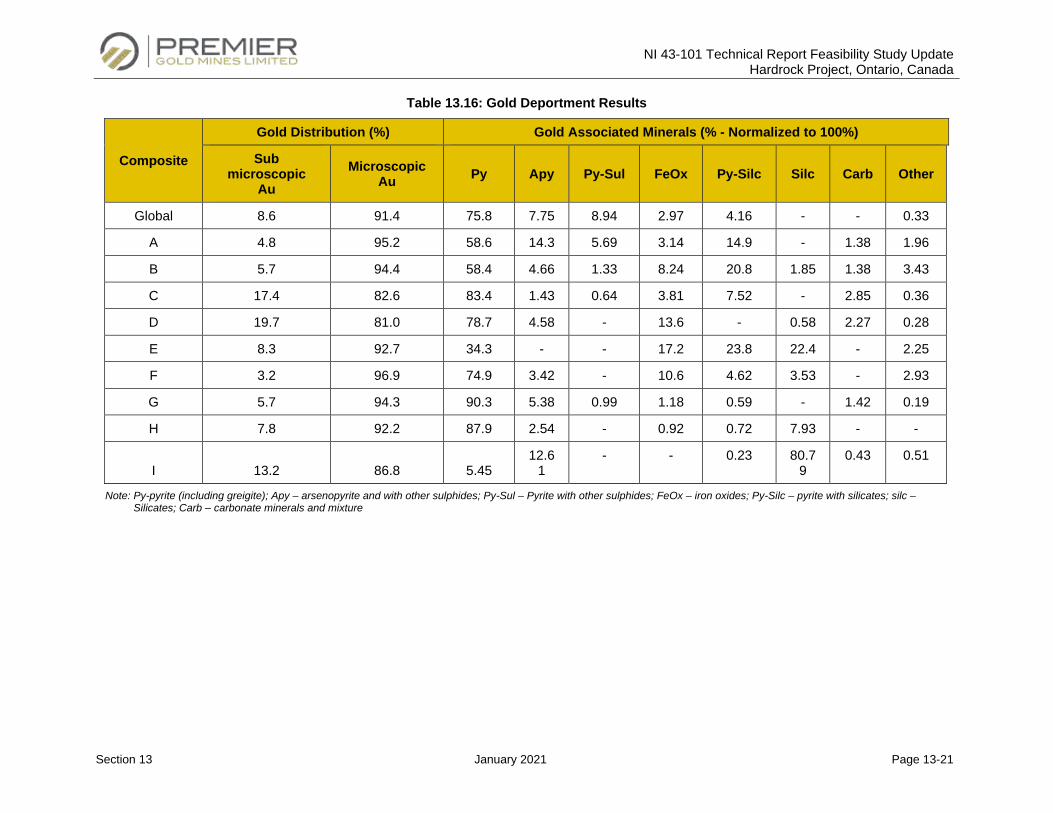
NI 43-101 Technical Report Feasibility Study Update Hardrock Project, Ontario, Canada
Section 13 January 2021 Page 13-21
Table 13.16: Gold Deportment Results
Composite
Gold Distribution (%) Gold Associated Minerals (% - Normalized to 100%)
Sub microscopic
Au Microscopic
Au Py Apy Py-Sul FeOx Py-Silc Silc Carb Other
Global 8.6 91.4 75.8 7.75 8.94 2.97 4.16 - - 0.33
A 4.8 95.2 58.6 14.3 5.69 3.14 14.9 - 1.38 1.96
B 5.7 94.4 58.4 4.66 1.33 8.24 20.8 1.85 1.38 3.43
C 17.4 82.6 83.4 1.43 0.64 3.81 7.52 - 2.85 0.36
D 19.7 81.0 78.7 4.58 - 13.6 - 0.58 2.27 0.28
E 8.3 92.7 34.3 - - 17.2 23.8 22.4 - 2.25
F 3.2 96.9 74.9 3.42 - 10.6 4.62 3.53 - 2.93
G 5.7 94.3 90.3 5.38 0.99 1.18 0.59 - 1.42 0.19
H 7.8 92.2 87.9 2.54 - 0.92 0.72 7.93 - -
I 13.2 86.8 5.45 12.6
1 - - 0.23 80.7
9 0.43 0.51
Note: Py-pyrite (including greigite); Apy – arsenopyrite and with other sulphides; Py-Sul – Pyrite with other sulphides; FeOx – iron oxides; Py-Silc – pyrite with silicates; silc – Silicates; Carb – carbonate minerals and mixture
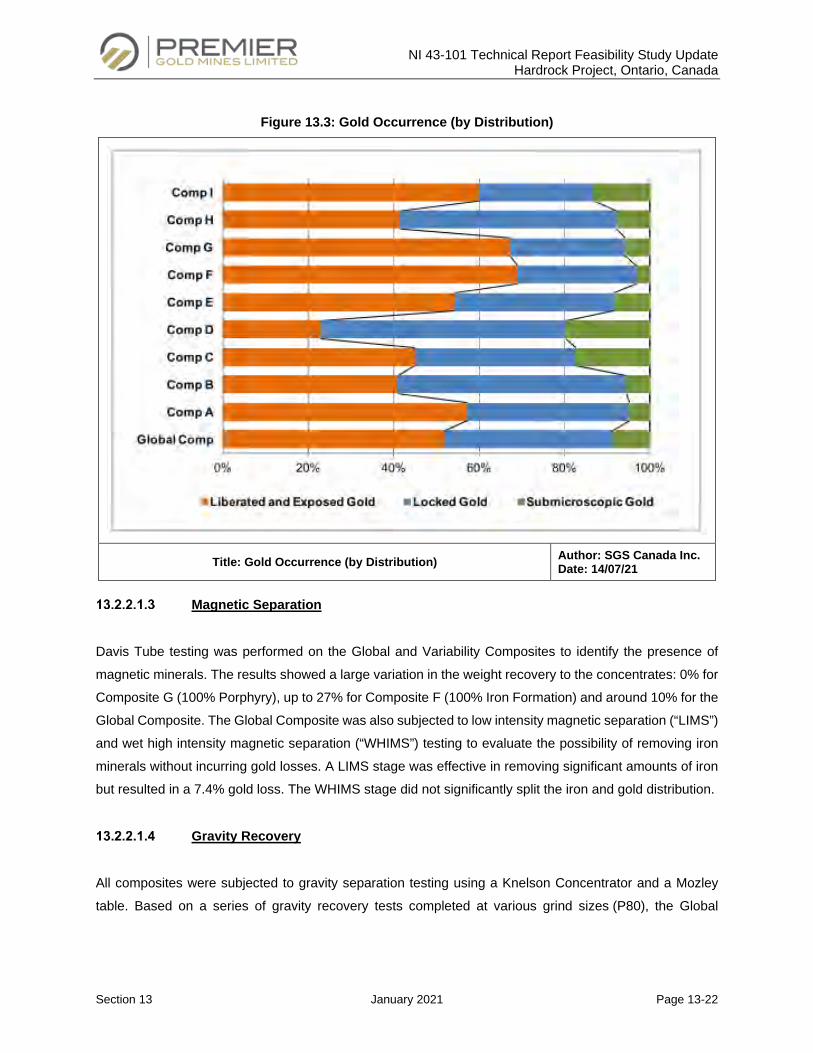
NI 43-101 Technical Report Feasibility Study Update Hardrock Project, Ontario, Canada
Section 13 January 2021 Page 13-22
Figure 13.3: Gold Occurrence (by Distribution)
Title: Gold Occurrence (by Distribution) Author: SGS Canada Inc. Date: 14/07/21
Magnetic Separation
Davis Tube testing was performed on the Global and Variability Composites to identify the presence of
magnetic minerals. The results showed a large variation in the weight recovery to the concentrates: 0% for
Composite G (100% Porphyry), up to 27% for Composite F (100% Iron Formation) and around 10% for the
Global Composite. The Global Composite was also subjected to low intensity magnetic separation (“LIMS”)
and wet high intensity magnetic separation (“WHIMS”) testing to evaluate the possibility of removing iron
minerals without incurring gold losses. A LIMS stage was effective in removing significant amounts of iron
but resulted in a 7.4% gold loss. The WHIMS stage did not significantly split the iron and gold distribution.
Gravity Recovery
All composites were subjected to gravity separation testing using a Knelson Concentrator and a Mozley
table. Based on a series of gravity recovery tests completed at various grind sizes (P80), the Global
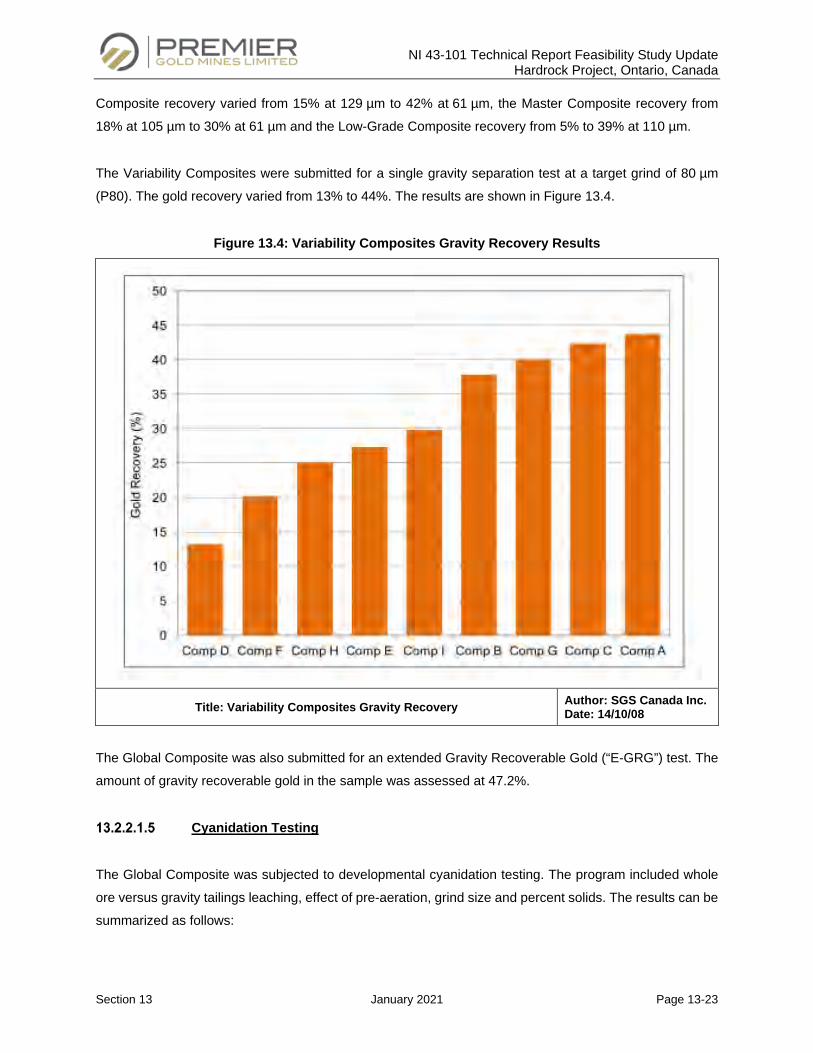
NI 43-101 Technical Report Feasibility Study Update Hardrock Project, Ontario, Canada
Section 13 January 2021 Page 13-23
Composite recovery varied from 15% at 129 µm to 42% at 61 µm, the Master Composite recovery from
18% at 105 µm to 30% at 61 µm and the Low-Grade Composite recovery from 5% to 39% at 110 µm.
The Variability Composites were submitted for a single gravity separation test at a target grind of 80 µm
(P80). The gold recovery varied from 13% to 44%. The results are shown in Figure 13.4.
Figure 13.4: Variability Composites Gravity Recovery Results
Title: Variability Composites Gravity Recovery Author: SGS Canada Inc. Date: 14/10/08
The Global Composite was also submitted for an extended Gravity Recoverable Gold (“E-GRG”) test. The
amount of gravity recoverable gold in the sample was assessed at 47.2%.
Cyanidation Testing
The Global Composite was subjected to developmental cyanidation testing. The program included whole
ore versus gravity tailings leaching, effect of pre-aeration, grind size and percent solids. The results can be
summarized as follows:
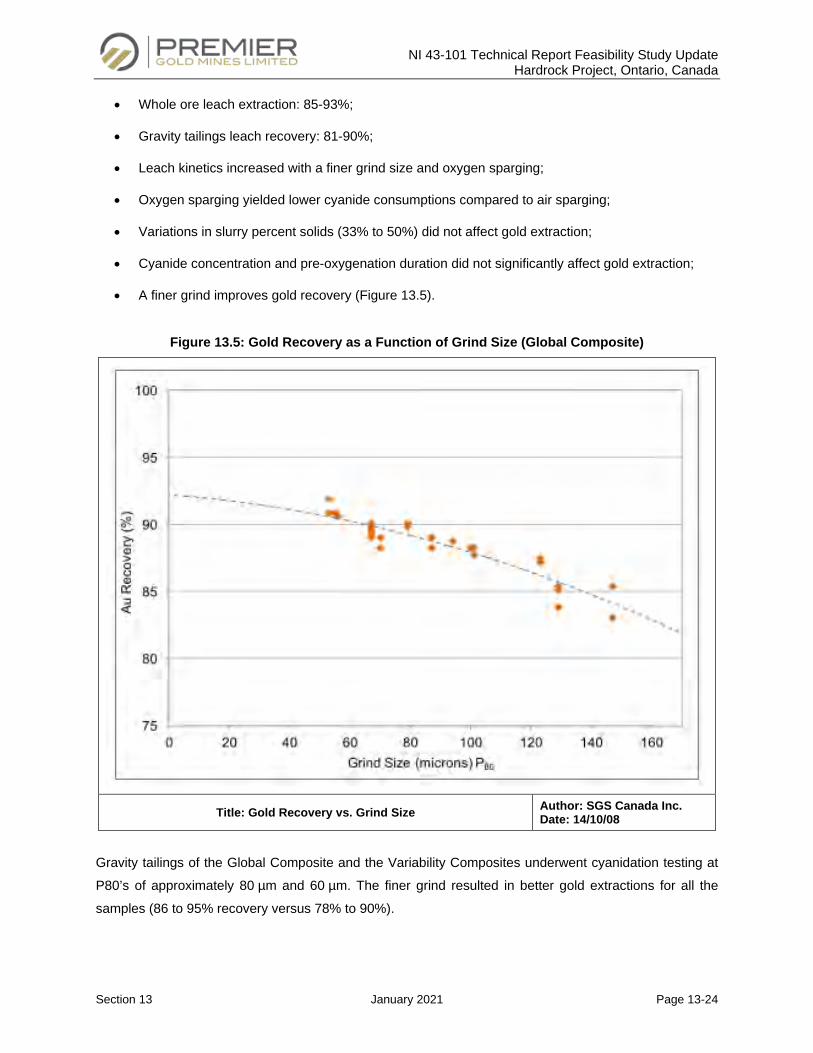
NI 43-101 Technical Report Feasibility Study Update Hardrock Project, Ontario, Canada
Section 13 January 2021 Page 13-24
• Whole ore leach extraction: 85-93%;
• Gravity tailings leach recovery: 81-90%;
• Leach kinetics increased with a finer grind size and oxygen sparging;
• Oxygen sparging yielded lower cyanide consumptions compared to air sparging;
• Variations in slurry percent solids (33% to 50%) did not affect gold extraction;
• Cyanide concentration and pre-oxygenation duration did not significantly affect gold extraction;
• A finer grind improves gold recovery (Figure 13.5).
Figure 13.5: Gold Recovery as a Function of Grind Size (Global Composite)
Title: Gold Recovery vs. Grind Size Author: SGS Canada Inc. Date: 14/10/08
Gravity tailings of the Global Composite and the Variability Composites underwent cyanidation testing at
P80’s of approximately 80 µm and 60 µm. The finer grind resulted in better gold extractions for all the
samples (86 to 95% recovery versus 78% to 90%).
NI 43-101 Technical Report Feasibility Study Update Hardrock Project, Ontario, Canada
Section 13 January 2021 Page 13-25
The Master Composite was submitted to leach optimization testing. The effects of grind size, residence
time, lead nitrate addition, pH and carbon concentration were examined. The grind size had the most impact
on gold extraction while a 2% gold recovery increase was observed when increasing the retention time from
32 to 72 hours. The gold recovery was between 85% and 89%.
The Low-Grade Composites were also submitted to cyanidation testing. Gold recovery and leach kinetics
were improved at finer grind sizes. The gold recovery ranged from 80% to 95%.
The optimized leach conditions defined during the tests are as follows:
• Slurry density: 50% w/w;
• pH: 10.5-11.0;
• Dissolved oxygen: > 15 mg/L;
• Cyanide concentration: 0.5 g/L NaCN (maintained);
• Retention time: 36 hours.
Carbon Circuit Modelling
SGS Canada Inc. uses the semi-empirical models developed by Mintek SA (South Africa’s national mineral
research organization) to simulate Carbon-in-Leach (“CIL”) and Carbon-in-Pulp (“CIP”) circuits. The
approach to CIL and CIP modelling involves conducting batch gold leaching and carbon adsorption tests
with representative samples and commercially available activated carbon. The leach rate is determined
through a classic bottle roll experiment by taking timed samples over a 72-hour period. The gold adsorption
rate is determined by adding carbon to the slurry and again taking samples for 72 hours. Equilibrium
adsorption isotherms are then established.
The Master Composite gravity tailings sample from test G-24 was used for the CIL/CIP modelling. The test
revealed that leaching of the Master Composite Sample was complete after 24 hours. The sample showed
relatively slow adsorption kinetics but very favorable equilibrium loading. The simulation results are
presented in Table 13.17.
NI 43-101 Technical Report Feasibility Study Update Hardrock Project, Ontario, Canada
Section 13 January 2021 Page 13-26
Table 13.17: Leach / CIP Modelling Results
Parameter Value
Number of Leach Tanks 6 @ 4,200 m3 each
Slurry Flow Rate 548 t/h at 55% solids
Number of Adsorption Tanks 6
Slurry Time in Each CIP Tank 0.3 h
Carbon in Each of the 6 Adsorption Tanks 12.6 t
Carbon Concentration in Adsorption Tanks 80 g/L
Gold on Carbon / Gold in Feed 1427
Carbon Advance Rate to Elution / Regeneration 7.9 t/d
Gold on Loaded Carbon 2,310 g/t
Gold on Eluted Carbon 50 g/t
Gold Locked Up on Carbon in Plant 48 kg
Ramp-up Time 11 days
Soluble Gold Losses 0.007 mg/L
Cyanide Destruction
The bulk leach product of the Global and Variability Composites were subjected to a single-stage cyanide
destruction test to determine the samples amenability to detoxification using the SO2/Air process. The
objective of the test was to achieve weak acid dissociable cyanide (CNWAD) levels below 1 mg/L.
The Global and Variability Composites A, B, G and I were the most difficult to treat. A retention time of
120 minutes, 30 to 45 mg/L of copper sulfate and more than 7.0 g of sulfur dioxide per gram of CNWAD were
required to meet the target. Variability Composites D, E and F also required 120 minutes of retention time,
but reagents addition was lower (20 to 30 mg/L of copper sulfate and 5.7 to 6.1 g of sulfur dioxide per gram
of CNWAD). Finally, Variability Composites C and H only required 60 to 90 minutes of retention and 5.5 g of
sulfur dioxide per gram of CNWAD. It was also found that there is a strong relationship between the residual
iron and the total cyanide (CNT). The residence time and copper sulfate addition can be increased to further
reduce total cyanide levels.
A two-stage cyanide destruction test was carried out on the Global Composite. The CNWAD and CNT were
reduced to the targeted 1 mg/L in 90 minutes by adding 45 mg/L of copper sulfate and 7.32 g of sulfur
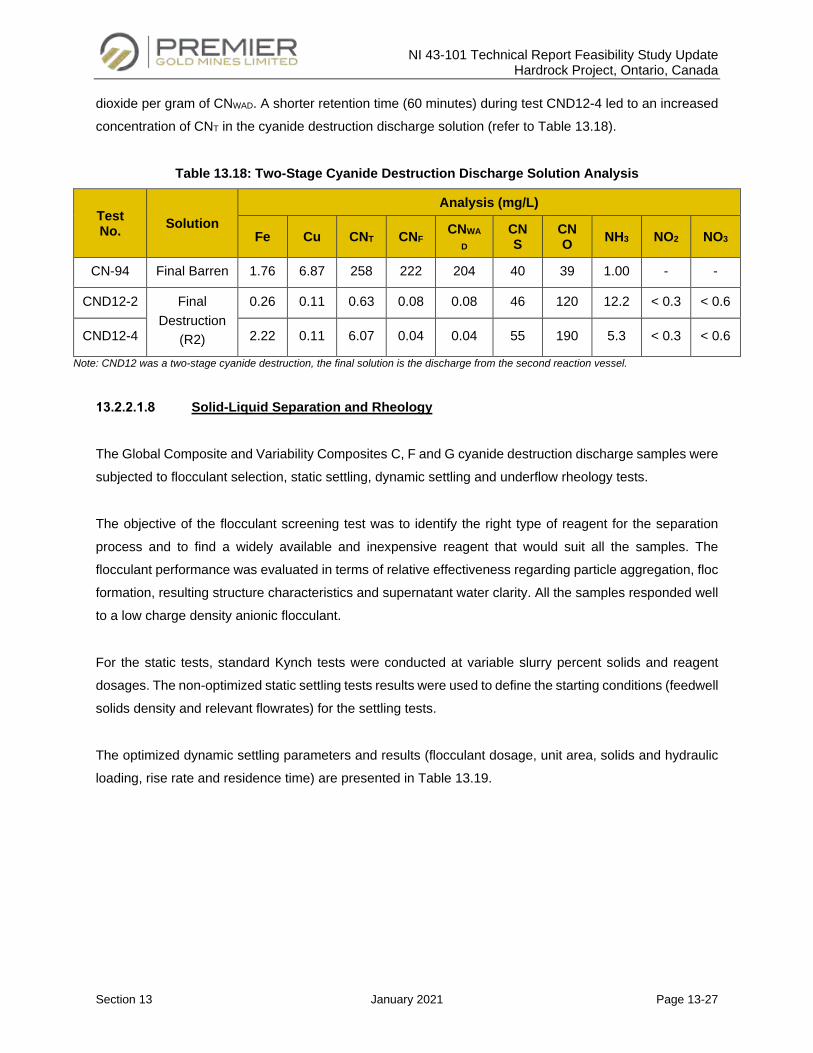
NI 43-101 Technical Report Feasibility Study Update Hardrock Project, Ontario, Canada
Section 13 January 2021 Page 13-27
dioxide per gram of CNWAD. A shorter retention time (60 minutes) during test CND12-4 led to an increased
concentration of CNT in the cyanide destruction discharge solution (refer to Table 13.18).
Table 13.18: Two-Stage Cyanide Destruction Discharge Solution Analysis
Test No. Solution
Analysis (mg/L)
Fe Cu CNT CNF CNWAD
CNS
CNO NH3 NO2 NO3
CN-94 Final Barren 1.76 6.87 258 222 204 40 39 1.00 - -
CND12-2 Final Destruction
(R2)
0.26 0.11 0.63 0.08 0.08 46 120 12.2 < 0.3 < 0.6
CND12-4 2.22 0.11 6.07 0.04 0.04 55 190 5.3 < 0.3 < 0.6
Note: CND12 was a two-stage cyanide destruction, the final solution is the discharge from the second reaction vessel.
Solid-Liquid Separation and Rheology
The Global Composite and Variability Composites C, F and G cyanide destruction discharge samples were
subjected to flocculant selection, static settling, dynamic settling and underflow rheology tests.
The objective of the flocculant screening test was to identify the right type of reagent for the separation
process and to find a widely available and inexpensive reagent that would suit all the samples. The
flocculant performance was evaluated in terms of relative effectiveness regarding particle aggregation, floc
formation, resulting structure characteristics and supernatant water clarity. All the samples responded well
to a low charge density anionic flocculant.
For the static tests, standard Kynch tests were conducted at variable slurry percent solids and reagent
dosages. The non-optimized static settling tests results were used to define the starting conditions (feedwell
solids density and relevant flowrates) for the settling tests.
The optimized dynamic settling parameters and results (flocculant dosage, unit area, solids and hydraulic
loading, rise rate and residence time) are presented in Table 13.19.
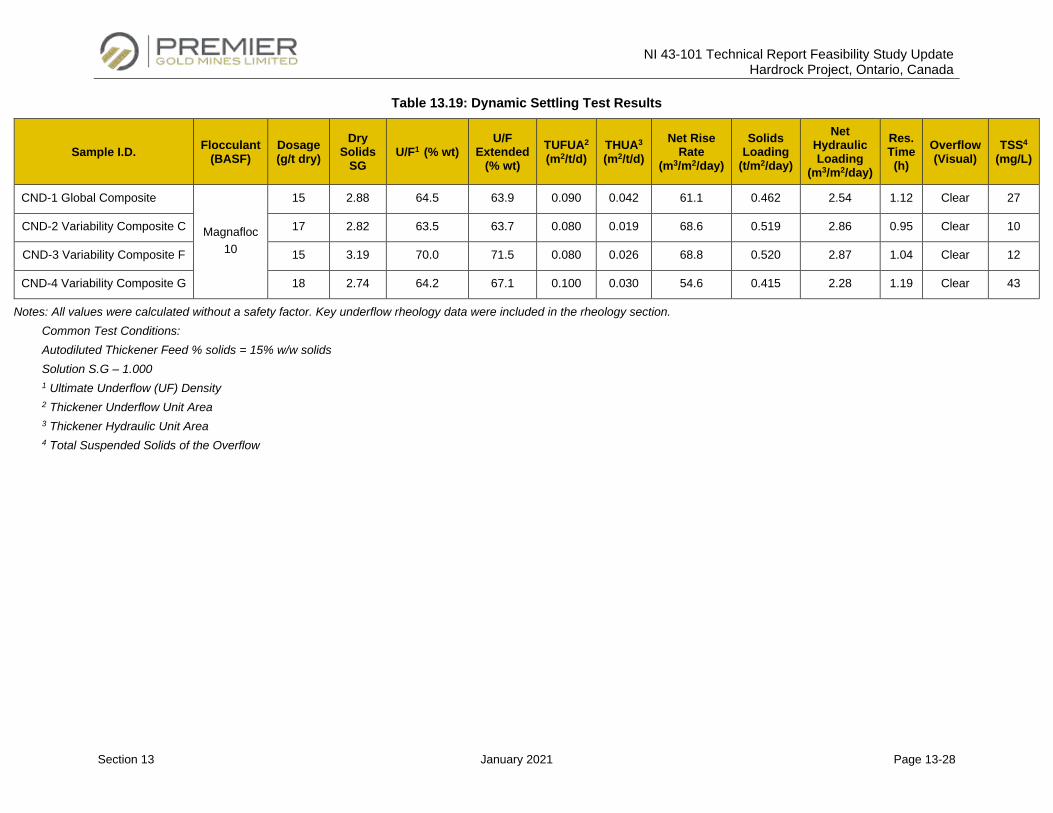
NI 43-101 Technical Report Feasibility Study Update Hardrock Project, Ontario, Canada
Section 13 January 2021 Page 13-28
Table 13.19: Dynamic Settling Test Results
Sample I.D. Flocculant (BASF)
Dosage (g/t dry)
Dry Solids
SG U/F1 (% wt)
U/F Extended
(% wt) TUFUA2
(m2/t/d) THUA3 (m2/t/d)
Net Rise Rate
(m3/m2/day)
Solids Loading
(t/m2/day)
Net Hydraulic Loading
(m3/m2/day)
Res. Time (h)
Overflow (Visual)
TSS4
(mg/L)
CND-1 Global Composite
Magnafloc 10
15 2.88 64.5 63.9 0.090 0.042 61.1 0.462 2.54 1.12 Clear 27
CND-2 Variability Composite C 17 2.82 63.5 63.7 0.080 0.019 68.6 0.519 2.86 0.95 Clear 10
CND-3 Variability Composite F 15 3.19 70.0 71.5 0.080 0.026 68.8 0.520 2.87 1.04 Clear 12
CND-4 Variability Composite G 18 2.74 64.2 67.1 0.100 0.030 54.6 0.415 2.28 1.19 Clear 43
Notes: All values were calculated without a safety factor. Key underflow rheology data were included in the rheology section. Common Test Conditions: Autodiluted Thickener Feed % solids = 15% w/w solids Solution S.G – 1.000 1 Ultimate Underflow (UF) Density 2 Thickener Underflow Unit Area 3 Thickener Hydraulic Unit Area 4 Total Suspended Solids of the Overflow
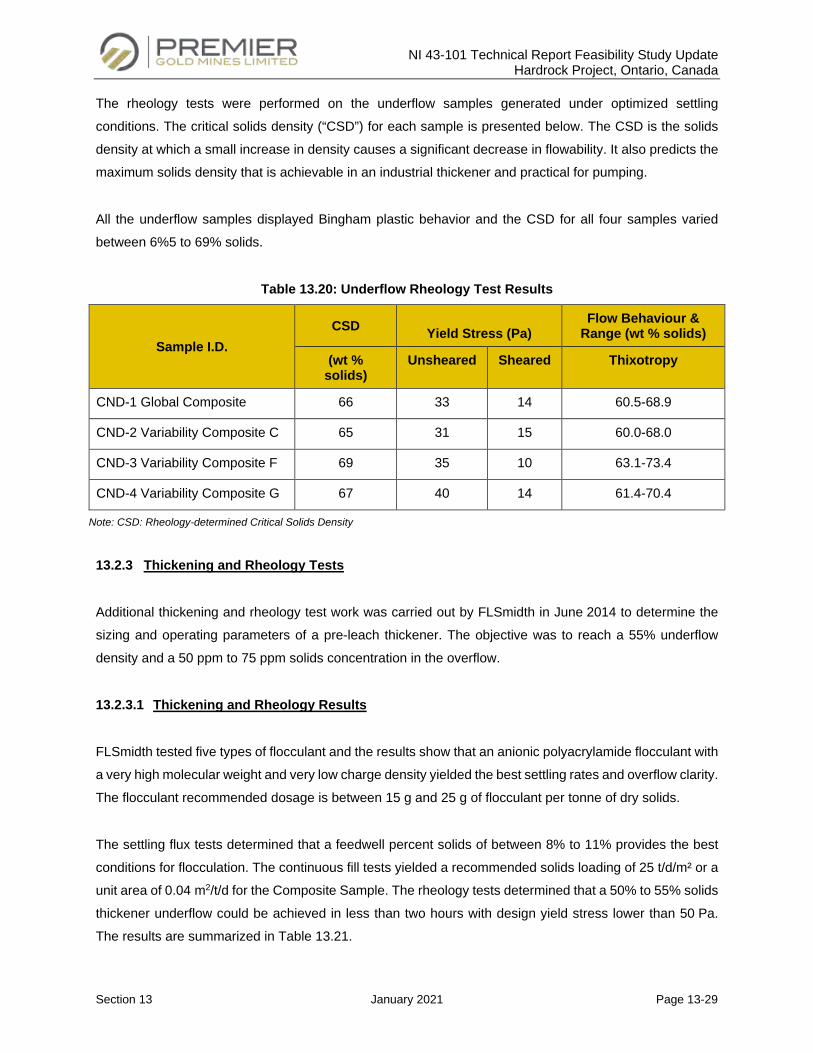
NI 43-101 Technical Report Feasibility Study Update Hardrock Project, Ontario, Canada
Section 13 January 2021 Page 13-29
The rheology tests were performed on the underflow samples generated under optimized settling
conditions. The critical solids density (“CSD”) for each sample is presented below. The CSD is the solids
density at which a small increase in density causes a significant decrease in flowability. It also predicts the
maximum solids density that is achievable in an industrial thickener and practical for pumping.
All the underflow samples displayed Bingham plastic behavior and the CSD for all four samples varied
between 6%5 to 69% solids.
Table 13.20: Underflow Rheology Test Results
Sample I.D. CSD Yield Stress (Pa)
Flow Behaviour & Range (wt % solids)
(wt % solids)
Unsheared Sheared Thixotropy
CND-1 Global Composite 66 33 14 60.5-68.9
CND-2 Variability Composite C 65 31 15 60.0-68.0
CND-3 Variability Composite F 69 35 10 63.1-73.4
CND-4 Variability Composite G 67 40 14 61.4-70.4
Note: CSD: Rheology-determined Critical Solids Density
13.2.3 Thickening and Rheology Tests
Additional thickening and rheology test work was carried out by FLSmidth in June 2014 to determine the
sizing and operating parameters of a pre-leach thickener. The objective was to reach a 55% underflow
density and a 50 ppm to 75 ppm solids concentration in the overflow.
13.2.3.1 Thickening and Rheology Results
FLSmidth tested five types of flocculant and the results show that an anionic polyacrylamide flocculant with
a very high molecular weight and very low charge density yielded the best settling rates and overflow clarity.
The flocculant recommended dosage is between 15 g and 25 g of flocculant per tonne of dry solids.
The settling flux tests determined that a feedwell percent solids of between 8% to 11% provides the best
conditions for flocculation. The continuous fill tests yielded a recommended solids loading of 25 t/d/m² or a
unit area of 0.04 m2/t/d for the Composite Sample. The rheology tests determined that a 50% to 55% solids
thickener underflow could be achieved in less than two hours with design yield stress lower than 50 Pa.
The results are summarized in Table 13.21.
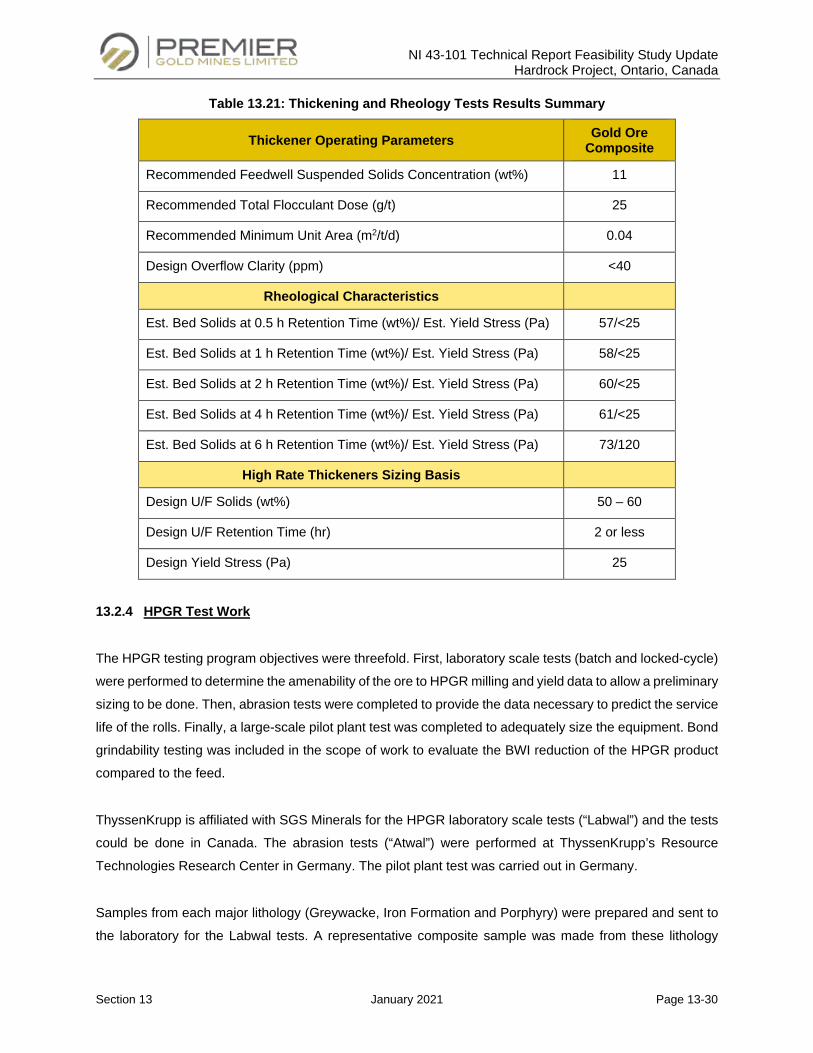
NI 43-101 Technical Report Feasibility Study Update Hardrock Project, Ontario, Canada
Section 13 January 2021 Page 13-30
Table 13.21: Thickening and Rheology Tests Results Summary
Thickener Operating Parameters Gold Ore Composite
Recommended Feedwell Suspended Solids Concentration (wt%) 11
Recommended Total Flocculant Dose (g/t) 25
Recommended Minimum Unit Area (m2/t/d) 0.04
Design Overflow Clarity (ppm) <40
Rheological Characteristics
Est. Bed Solids at 0.5 h Retention Time (wt%)/ Est. Yield Stress (Pa) 57/<25
Est. Bed Solids at 1 h Retention Time (wt%)/ Est. Yield Stress (Pa) 58/<25
Est. Bed Solids at 2 h Retention Time (wt%)/ Est. Yield Stress (Pa) 60/<25
Est. Bed Solids at 4 h Retention Time (wt%)/ Est. Yield Stress (Pa) 61/<25
Est. Bed Solids at 6 h Retention Time (wt%)/ Est. Yield Stress (Pa) 73/120
High Rate Thickeners Sizing Basis
Design U/F Solids (wt%) 50 – 60
Design U/F Retention Time (hr) 2 or less
Design Yield Stress (Pa) 25
13.2.4 HPGR Test Work
The HPGR testing program objectives were threefold. First, laboratory scale tests (batch and locked-cycle)
were performed to determine the amenability of the ore to HPGR milling and yield data to allow a preliminary
sizing to be done. Then, abrasion tests were completed to provide the data necessary to predict the service
life of the rolls. Finally, a large-scale pilot plant test was completed to adequately size the equipment. Bond
grindability testing was included in the scope of work to evaluate the BWI reduction of the HPGR product
compared to the feed.
ThyssenKrupp is affiliated with SGS Minerals for the HPGR laboratory scale tests (“Labwal”) and the tests
could be done in Canada. The abrasion tests (“Atwal”) were performed at ThyssenKrupp’s Resource
Technologies Research Center in Germany. The pilot plant test was carried out in Germany.
Samples from each major lithology (Greywacke, Iron Formation and Porphyry) were prepared and sent to
the laboratory for the Labwal tests. A representative composite sample was made from these lithology
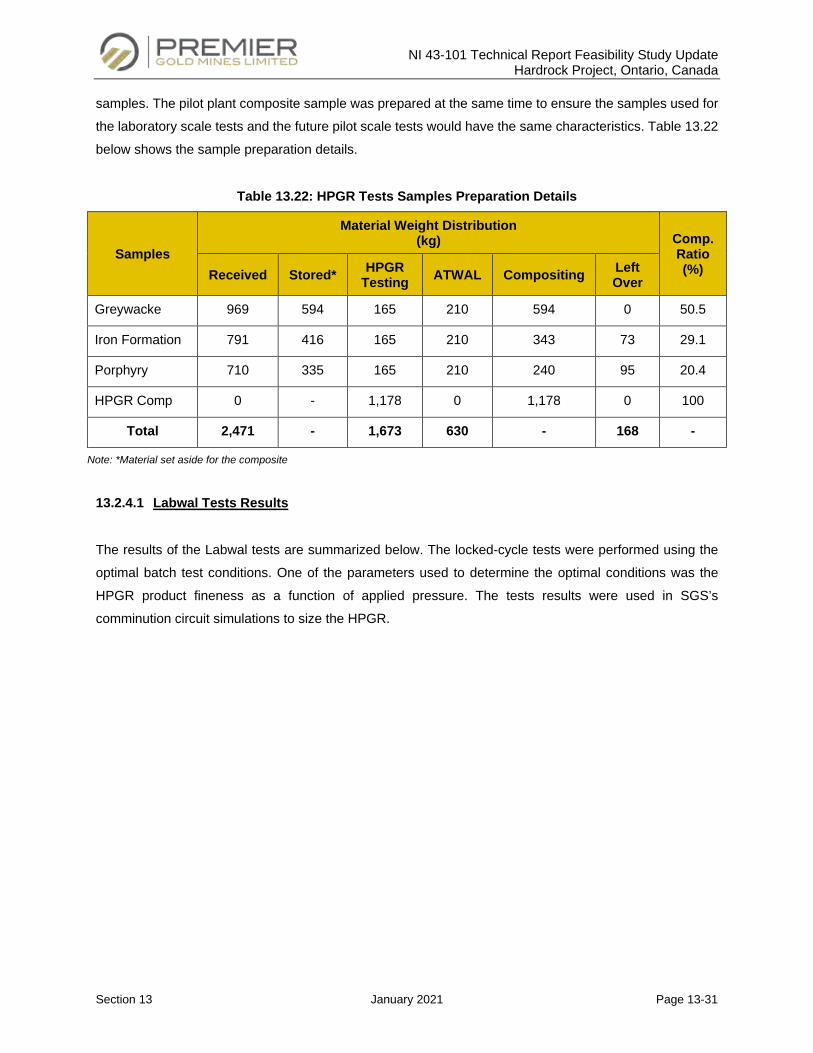
NI 43-101 Technical Report Feasibility Study Update Hardrock Project, Ontario, Canada
Section 13 January 2021 Page 13-31
samples. The pilot plant composite sample was prepared at the same time to ensure the samples used for
the laboratory scale tests and the future pilot scale tests would have the same characteristics. Table 13.22
below shows the sample preparation details.
Table 13.22: HPGR Tests Samples Preparation Details
Samples
Material Weight Distribution (kg) Comp.
Ratio (%) Received Stored* HPGR
Testing ATWAL Compositing Left Over
Greywacke 969 594 165 210 594 0 50.5
Iron Formation 791 416 165 210 343 73 29.1
Porphyry 710 335 165 210 240 95 20.4
HPGR Comp 0 - 1,178 0 1,178 0 100
Total 2,471 - 1,673 630 - 168 -
Note: *Material set aside for the composite
13.2.4.1 Labwal Tests Results
The results of the Labwal tests are summarized below. The locked-cycle tests were performed using the
optimal batch test conditions. One of the parameters used to determine the optimal conditions was the
HPGR product fineness as a function of applied pressure. The tests results were used in SGS’s
comminution circuit simulations to size the HPGR.
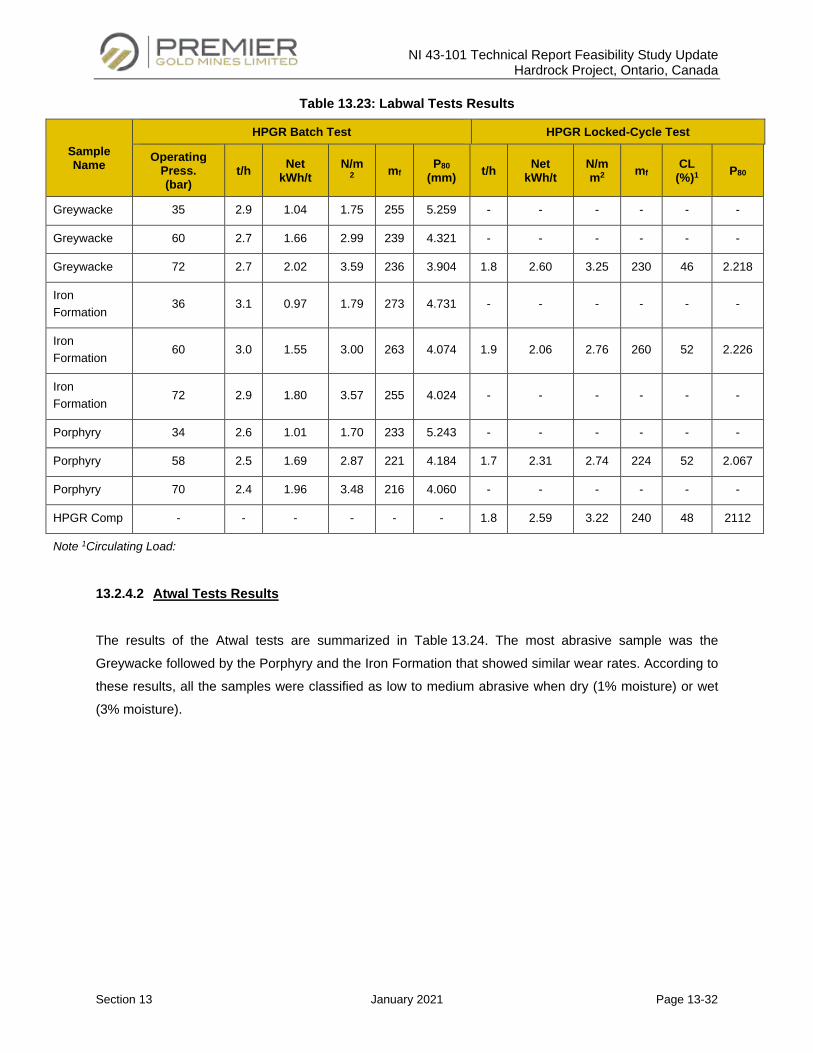
NI 43-101 Technical Report Feasibility Study Update Hardrock Project, Ontario, Canada
Section 13 January 2021 Page 13-32
Table 13.23: Labwal Tests Results
Sample Name
HPGR Batch Test HPGR Locked-Cycle Test
Operating Press. (bar)
t/h Net kWh/t
N/m 2 mf P80
(mm) t/h Net kWh/t
N/mm2 mf CL
(%)1 P80
Greywacke 35 2.9 1.04 1.75 255 5.259 - - - - - -
Greywacke 60 2.7 1.66 2.99 239 4.321 - - - - - -
Greywacke 72 2.7 2.02 3.59 236 3.904 1.8 2.60 3.25 230 46 2.218
Iron Formation
36 3.1 0.97 1.79 273 4.731 - - - - - -
Iron Formation
60 3.0 1.55 3.00 263 4.074 1.9 2.06 2.76 260 52 2.226
Iron Formation
72 2.9 1.80 3.57 255 4.024 - - - - - -
Porphyry 34 2.6 1.01 1.70 233 5.243 - - - - - -
Porphyry 58 2.5 1.69 2.87 221 4.184 1.7 2.31 2.74 224 52 2.067
Porphyry 70 2.4 1.96 3.48 216 4.060 - - - - - -
HPGR Comp - - - - - - 1.8 2.59 3.22 240 48 2112
Note 1Circulating Load:
13.2.4.2 Atwal Tests Results
The results of the Atwal tests are summarized in Table 13.24. The most abrasive sample was the
Greywacke followed by the Porphyry and the Iron Formation that showed similar wear rates. According to
these results, all the samples were classified as low to medium abrasive when dry (1% moisture) or wet
(3% moisture).
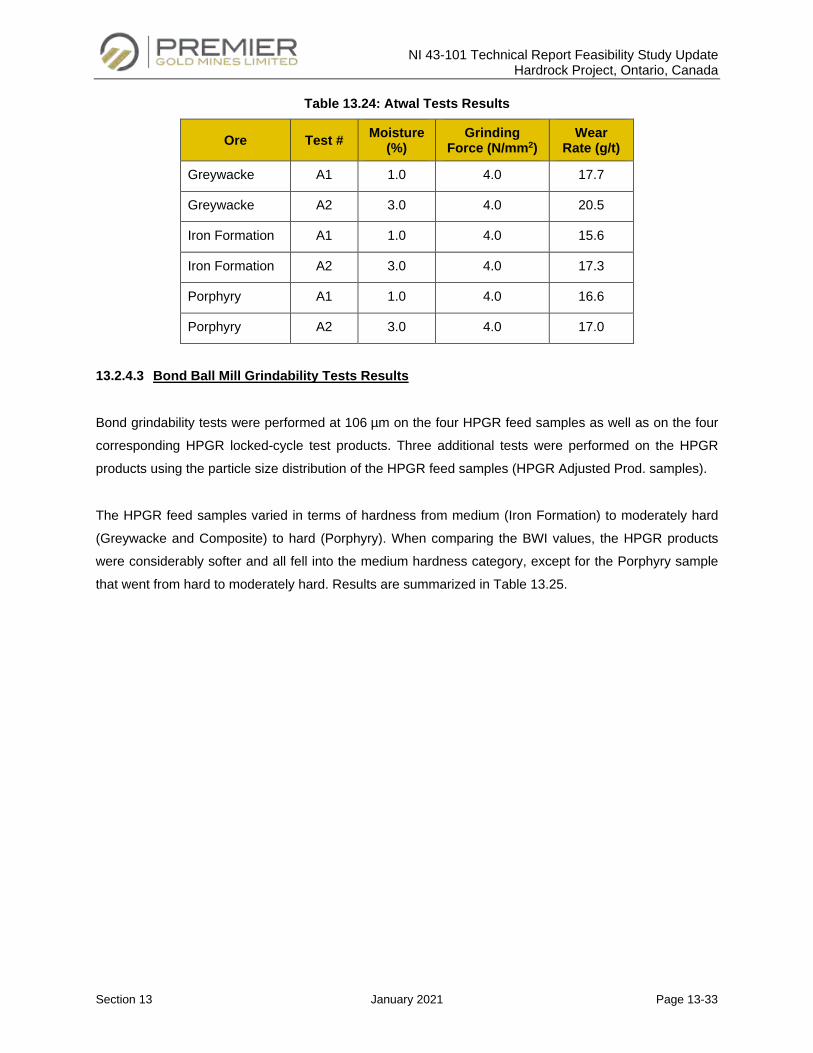
NI 43-101 Technical Report Feasibility Study Update Hardrock Project, Ontario, Canada
Section 13 January 2021 Page 13-33
Table 13.24: Atwal Tests Results
Ore Test # Moisture (%)
Grinding Force (N/mm2)
Wear Rate (g/t)
Greywacke A1 1.0 4.0 17.7
Greywacke A2 3.0 4.0 20.5
Iron Formation A1 1.0 4.0 15.6
Iron Formation A2 3.0 4.0 17.3
Porphyry A1 1.0 4.0 16.6
Porphyry A2 3.0 4.0 17.0
13.2.4.3 Bond Ball Mill Grindability Tests Results
Bond grindability tests were performed at 106 µm on the four HPGR feed samples as well as on the four
corresponding HPGR locked-cycle test products. Three additional tests were performed on the HPGR
products using the particle size distribution of the HPGR feed samples (HPGR Adjusted Prod. samples).
The HPGR feed samples varied in terms of hardness from medium (Iron Formation) to moderately hard
(Greywacke and Composite) to hard (Porphyry). When comparing the BWI values, the HPGR products
were considerably softer and all fell into the medium hardness category, except for the Porphyry sample
that went from hard to moderately hard. Results are summarized in Table 13.25.
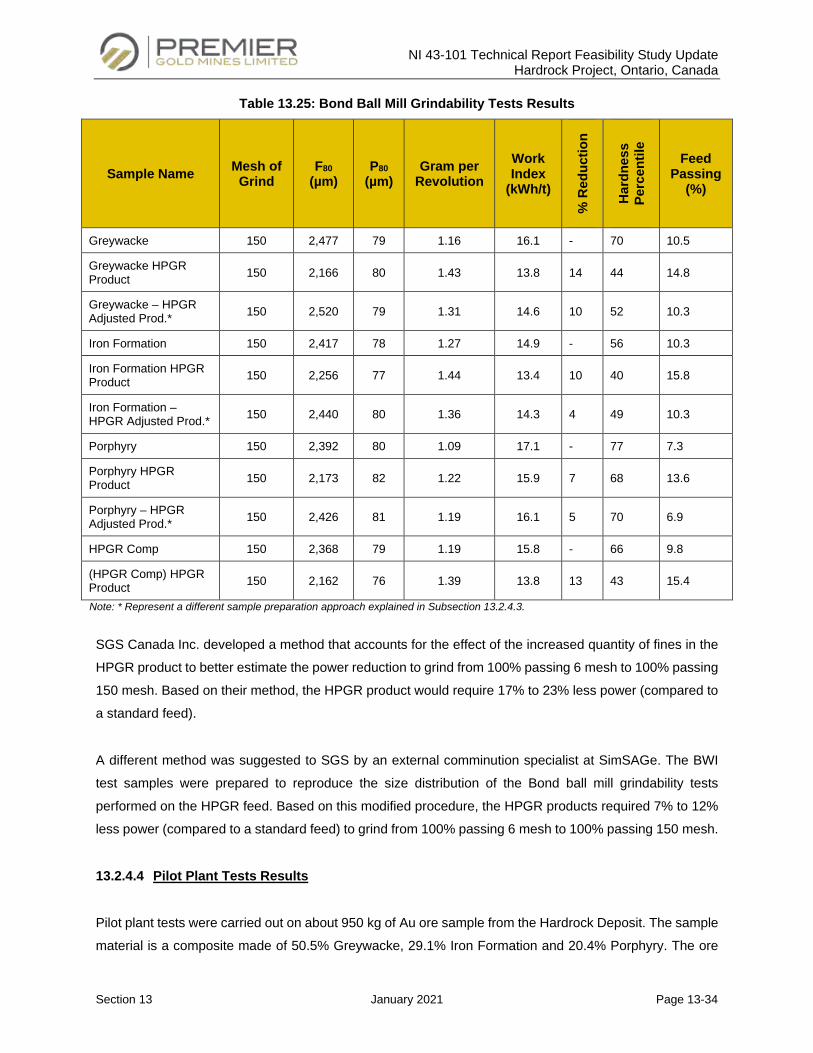
NI 43-101 Technical Report Feasibility Study Update Hardrock Project, Ontario, Canada
Section 13 January 2021 Page 13-34
Table 13.25: Bond Ball Mill Grindability Tests Results
Sample Name Mesh of Grind
F80 (µm)
P80 (µm)
Gram per Revolution
Work Index
(kWh/t)
% R
educ
tion
Har
dnes
s Pe
rcen
tile
Feed Passing
(%)
Greywacke 150 2,477 79 1.16 16.1 - 70 10.5
Greywacke HPGR Product 150 2,166 80 1.43 13.8 14 44 14.8
Greywacke – HPGR Adjusted Prod.* 150 2,520 79 1.31 14.6 10 52 10.3
Iron Formation 150 2,417 78 1.27 14.9 - 56 10.3
Iron Formation HPGR Product 150 2,256 77 1.44 13.4 10 40 15.8
Iron Formation – HPGR Adjusted Prod.* 150 2,440 80 1.36 14.3 4 49 10.3
Porphyry 150 2,392 80 1.09 17.1 - 77 7.3
Porphyry HPGR Product 150 2,173 82 1.22 15.9 7 68 13.6
Porphyry – HPGR Adjusted Prod.* 150 2,426 81 1.19 16.1 5 70 6.9
HPGR Comp 150 2,368 79 1.19 15.8 - 66 9.8
(HPGR Comp) HPGR Product 150 2,162 76 1.39 13.8 13 43 15.4
Note: * Represent a different sample preparation approach explained in Subsection 13.2.4.3.
SGS Canada Inc. developed a method that accounts for the effect of the increased quantity of fines in the
HPGR product to better estimate the power reduction to grind from 100% passing 6 mesh to 100% passing
150 mesh. Based on their method, the HPGR product would require 17% to 23% less power (compared to
a standard feed).
A different method was suggested to SGS by an external comminution specialist at SimSAGe. The BWI
test samples were prepared to reproduce the size distribution of the Bond ball mill grindability tests
performed on the HPGR feed. Based on this modified procedure, the HPGR products required 7% to 12%
less power (compared to a standard feed) to grind from 100% passing 6 mesh to 100% passing 150 mesh.
13.2.4.4 Pilot Plant Tests Results
Pilot plant tests were carried out on about 950 kg of Au ore sample from the Hardrock Deposit. The sample
material is a composite made of 50.5% Greywacke, 29.1% Iron Formation and 20.4% Porphyry. The ore
NI 43-101 Technical Report Feasibility Study Update Hardrock Project, Ontario, Canada
Section 13 January 2021 Page 13-35
sample was provided as drill cores that had been pre-crushed to match the feed size requirements of the
units.
Pilot plant tests were conducted using a semi-industrial high-pressure grinding roll with 0.95 m diameter
rolls, 0.35 m wide. Process data obtained from test work allow the sizing of industrial scale machines. The
objectives in sizing HPGRs are to meet the throughput requirements and to achieve a certain product
fineness. The key parameters are therefore the specific throughput rate and the specific energy
consumption required to obtain the desired comminution result. The specific throughput rate varied between
306 and 320 t s/m3 h; it was slightly dependent on the specific press force. The specific energy consumption
varied between 1.4 and 2.6 kWh/t depending on the applied specific press force.
Bond tests were conducted on a conventionally crushed fresh feed sample from the provided sample as
well as on the HPGR cycle products. The Bond test was conducted using a closing mesh size of 90 µm.
The Bond Work Index was 10% lower after HPGR treatment: 14.73 kWh/t on crushed material compared
to 13.28 kWh/t on HPGR product.
The pilot tests allowed the prediction of the expected industrial size distribution of the HPGR discharge and
of the screen undersize product for a closed-circuit operation. Locked-cycle tests were conducted to
simulate a continuous operation. The circulation factor was consistent in the first three cycles indicating that
the circuit was stabilized. The pilot plant test third cycle size distribution is presented in Figure 13.6.
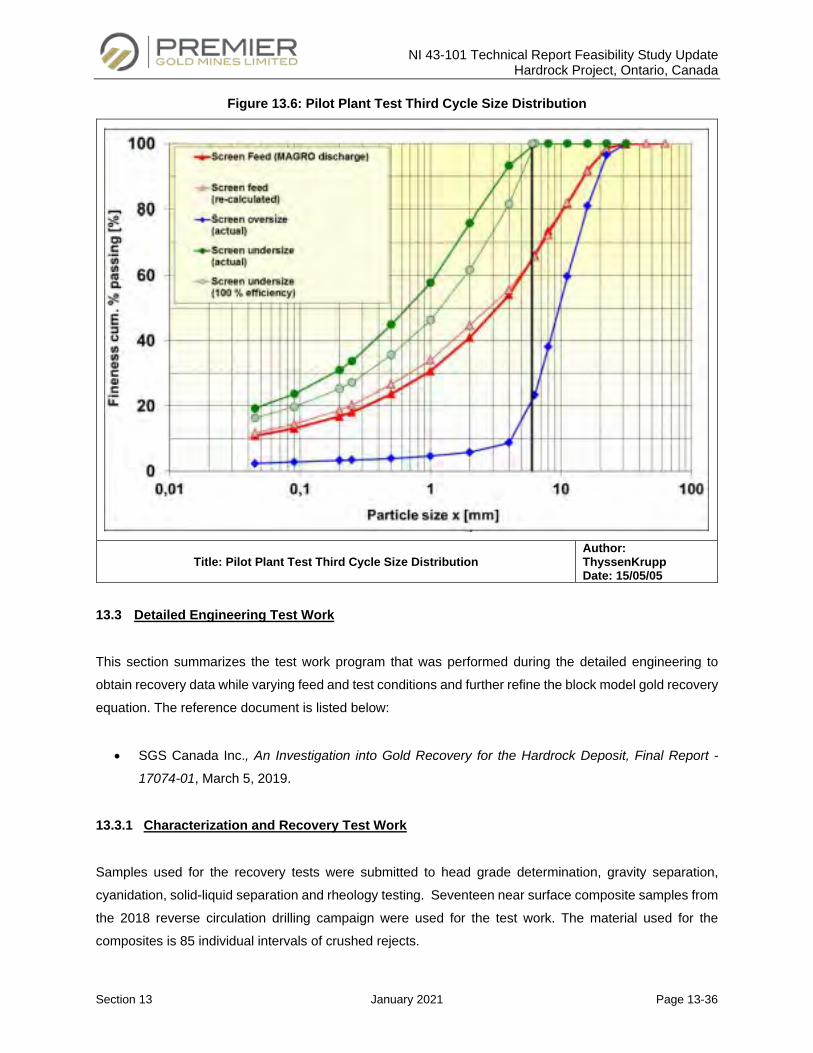
NI 43-101 Technical Report Feasibility Study Update Hardrock Project, Ontario, Canada
Section 13 January 2021 Page 13-36
Figure 13.6: Pilot Plant Test Third Cycle Size Distribution
Title: Pilot Plant Test Third Cycle Size Distribution Author: ThyssenKrupp Date: 15/05/05
13.3 Detailed Engineering Test Work
This section summarizes the test work program that was performed during the detailed engineering to
obtain recovery data while varying feed and test conditions and further refine the block model gold recovery
equation. The reference document is listed below:
• SGS Canada Inc., An Investigation into Gold Recovery for the Hardrock Deposit, Final Report -
17074-01, March 5, 2019.
13.3.1 Characterization and Recovery Test Work
Samples used for the recovery tests were submitted to head grade determination, gravity separation,
cyanidation, solid-liquid separation and rheology testing. Seventeen near surface composite samples from
the 2018 reverse circulation drilling campaign were used for the test work. The material used for the
composites is 85 individual intervals of crushed rejects.
NI 43-101 Technical Report Feasibility Study Update Hardrock Project, Ontario, Canada
Section 13 January 2021 Page 13-37
13.3.1.1 Characterization and Recovery Tests Results
Head Grade Determination
Head characterization included a gold screened metallics protocol, carbon speciation, sulphur speciation,
arsenic individual elemental analysis, and a semi-quantitative Inductively Coupled Plasma (“ICP”) scan
analysis.
The gold head grades of the composites were determined by metallic sieve and a weighted average was
calculated from the test work. Calculated head grades were obtained from the cyanidation leach test results.
The direct and calculated gold head grades correlate well. The gold head grade results are presented in
Table 13.26 as well as the sulphur speciation assays results and arsenic (“As”) results.
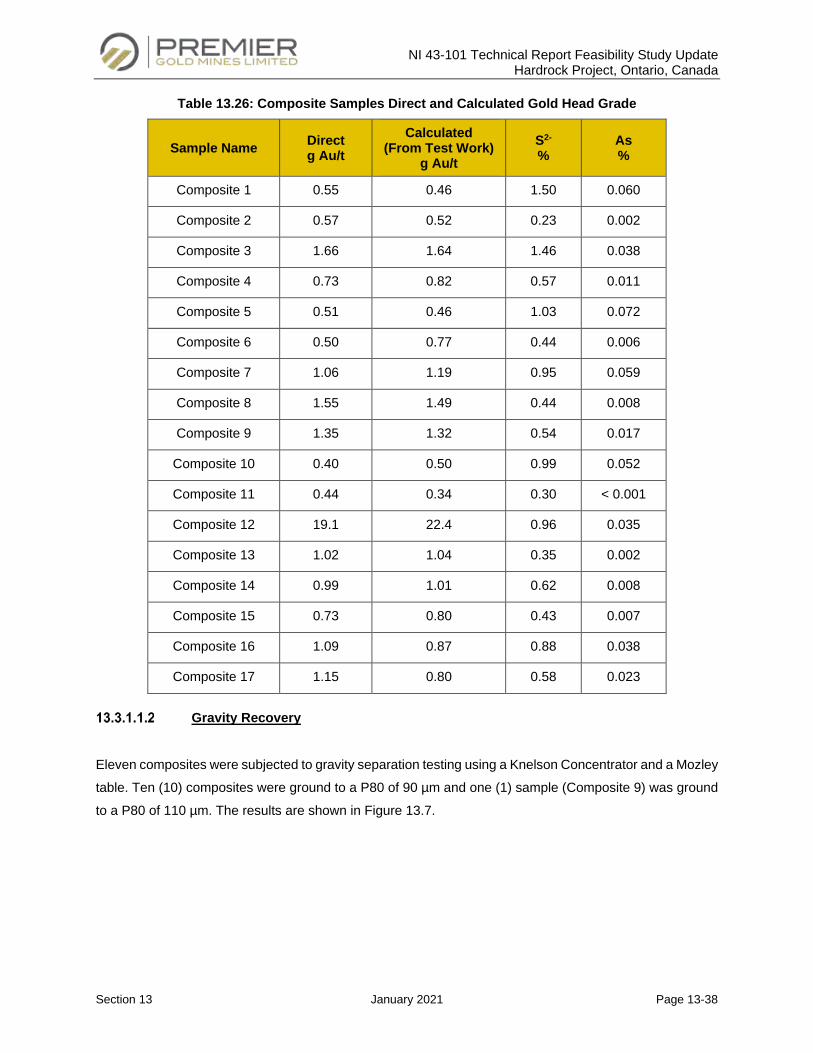
NI 43-101 Technical Report Feasibility Study Update Hardrock Project, Ontario, Canada
Section 13 January 2021 Page 13-38
Table 13.26: Composite Samples Direct and Calculated Gold Head Grade
Sample Name Direct g Au/t
Calculated (From Test Work)
g Au/t S2-
% As %
Composite 1 0.55 0.46 1.50 0.060
Composite 2 0.57 0.52 0.23 0.002
Composite 3 1.66 1.64 1.46 0.038
Composite 4 0.73 0.82 0.57 0.011
Composite 5 0.51 0.46 1.03 0.072
Composite 6 0.50 0.77 0.44 0.006
Composite 7 1.06 1.19 0.95 0.059
Composite 8 1.55 1.49 0.44 0.008
Composite 9 1.35 1.32 0.54 0.017
Composite 10 0.40 0.50 0.99 0.052
Composite 11 0.44 0.34 0.30 < 0.001
Composite 12 19.1 22.4 0.96 0.035
Composite 13 1.02 1.04 0.35 0.002
Composite 14 0.99 1.01 0.62 0.008
Composite 15 0.73 0.80 0.43 0.007
Composite 16 1.09 0.87 0.88 0.038
Composite 17 1.15 0.80 0.58 0.023
Gravity Recovery
Eleven composites were subjected to gravity separation testing using a Knelson Concentrator and a Mozley
table. Ten (10) composites were ground to a P80 of 90 µm and one (1) sample (Composite 9) was ground
to a P80 of 110 µm. The results are shown in Figure 13.7.
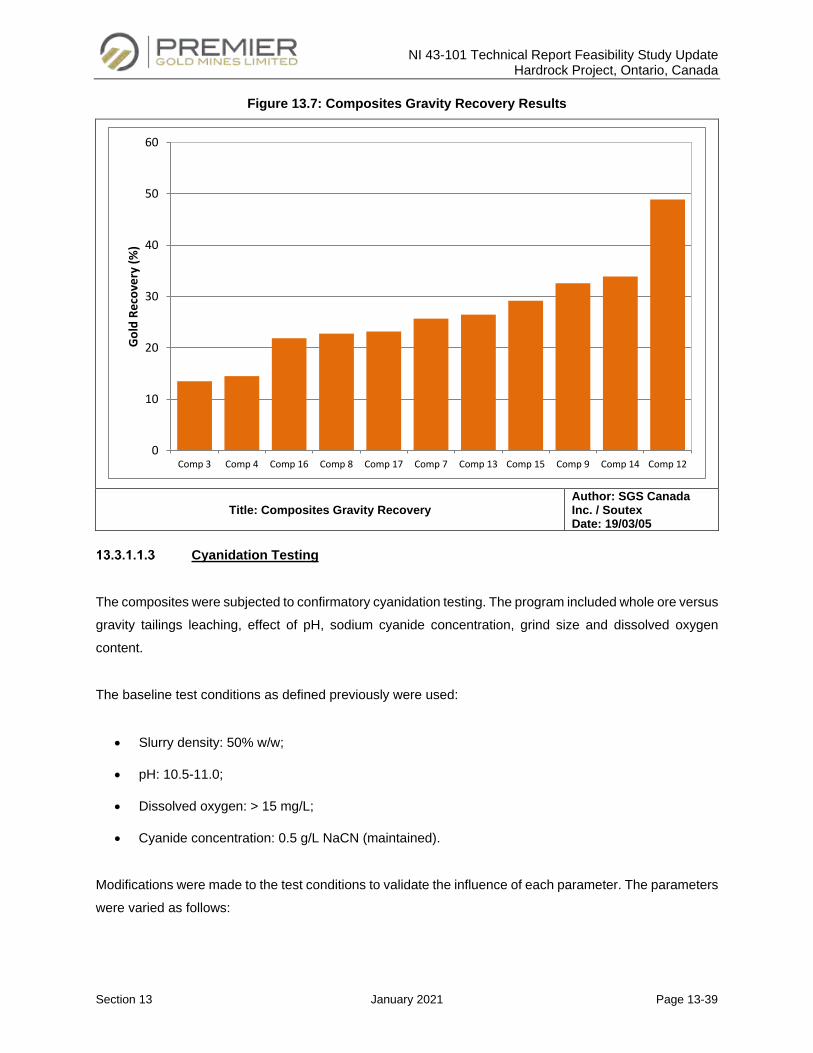
NI 43-101 Technical Report Feasibility Study Update Hardrock Project, Ontario, Canada
Section 13 January 2021 Page 13-39
Figure 13.7: Composites Gravity Recovery Results
Title: Composites Gravity Recovery Author: SGS Canada Inc. / Soutex Date: 19/03/05
Cyanidation Testing
The composites were subjected to confirmatory cyanidation testing. The program included whole ore versus
gravity tailings leaching, effect of pH, sodium cyanide concentration, grind size and dissolved oxygen
content.
The baseline test conditions as defined previously were used:
• Slurry density: 50% w/w;
• pH: 10.5-11.0;
• Dissolved oxygen: > 15 mg/L;
• Cyanide concentration: 0.5 g/L NaCN (maintained).
Modifications were made to the test conditions to validate the influence of each parameter. The parameters
were varied as follows:
0
10
20
30
40
50
60
Comp 3 Comp 4 Comp 16 Comp 8 Comp 17 Comp 7 Comp 13 Comp 15 Comp 9 Comp 14 Comp 12
Gol
d Re
cove
ry (%
)
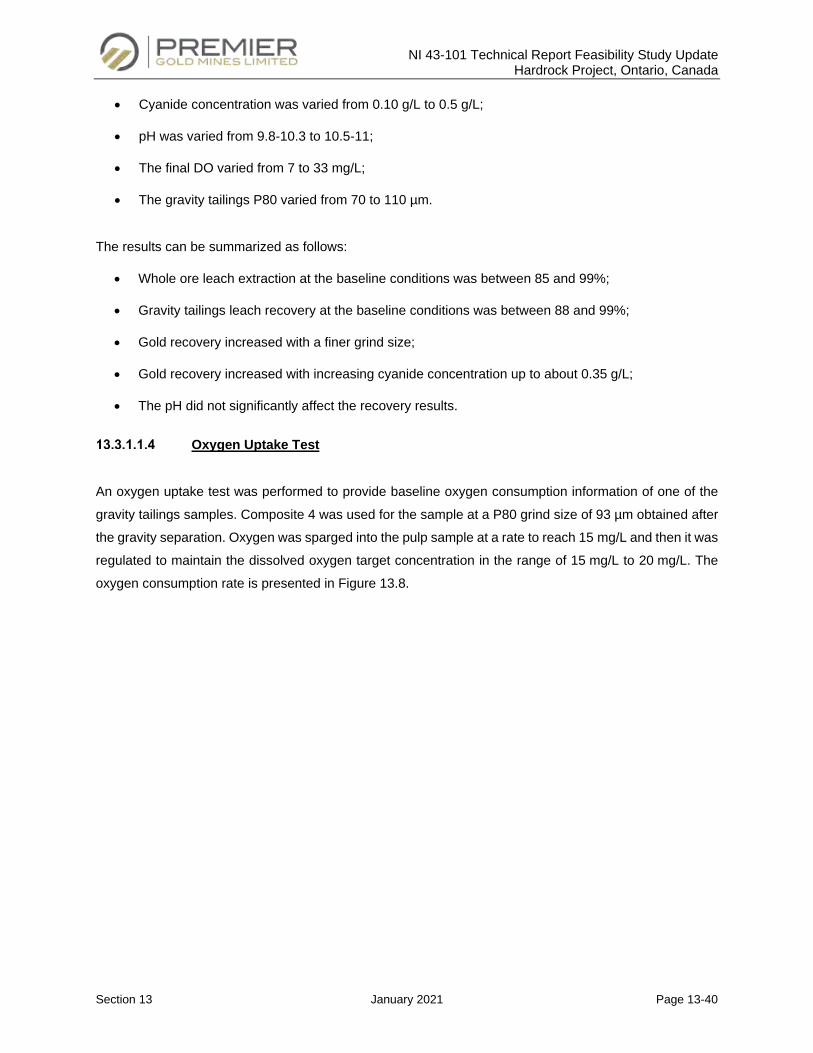
NI 43-101 Technical Report Feasibility Study Update Hardrock Project, Ontario, Canada
Section 13 January 2021 Page 13-40
• Cyanide concentration was varied from 0.10 g/L to 0.5 g/L;
• pH was varied from 9.8-10.3 to 10.5-11;
• The final DO varied from 7 to 33 mg/L;
• The gravity tailings P80 varied from 70 to 110 µm.
The results can be summarized as follows:
• Whole ore leach extraction at the baseline conditions was between 85 and 99%;
• Gravity tailings leach recovery at the baseline conditions was between 88 and 99%;
• Gold recovery increased with a finer grind size;
• Gold recovery increased with increasing cyanide concentration up to about 0.35 g/L;
• The pH did not significantly affect the recovery results.
Oxygen Uptake Test
An oxygen uptake test was performed to provide baseline oxygen consumption information of one of the
gravity tailings samples. Composite 4 was used for the sample at a P80 grind size of 93 µm obtained after
the gravity separation. Oxygen was sparged into the pulp sample at a rate to reach 15 mg/L and then it was
regulated to maintain the dissolved oxygen target concentration in the range of 15 mg/L to 20 mg/L. The
oxygen consumption rate is presented in Figure 13.8.
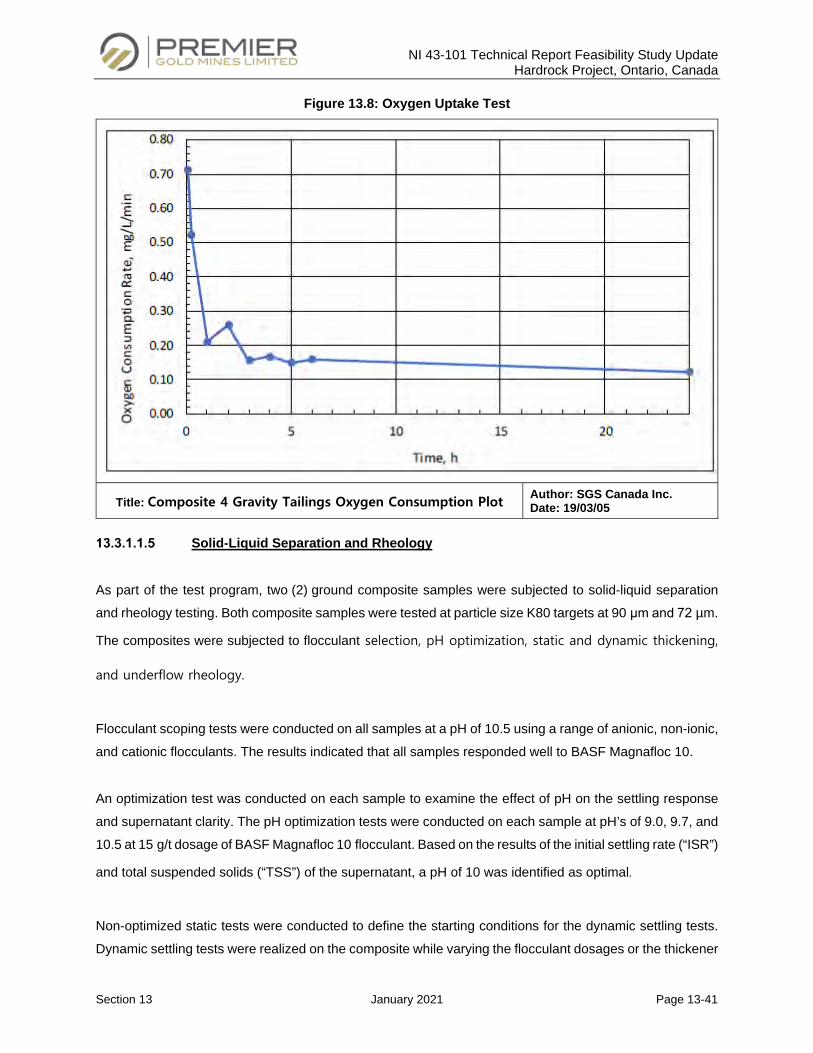
NI 43-101 Technical Report Feasibility Study Update Hardrock Project, Ontario, Canada
Section 13 January 2021 Page 13-41
Figure 13.8: Oxygen Uptake Test
Title: Composite 4 Gravity Tailings Oxygen Consumption Plot Author: SGS Canada Inc. Date: 19/03/05
Solid-Liquid Separation and Rheology
As part of the test program, two (2) ground composite samples were subjected to solid-liquid separation
and rheology testing. Both composite samples were tested at particle size K80 targets at 90 μm and 72 µm.
The composites were subjected to flocculant selection, pH optimization, static and dynamic thickening,
and underflow rheology.
Flocculant scoping tests were conducted on all samples at a pH of 10.5 using a range of anionic, non-ionic,
and cationic flocculants. The results indicated that all samples responded well to BASF Magnafloc 10.
An optimization test was conducted on each sample to examine the effect of pH on the settling response
and supernatant clarity. The pH optimization tests were conducted on each sample at pH’s of 9.0, 9.7, and
10.5 at 15 g/t dosage of BASF Magnafloc 10 flocculant. Based on the results of the initial settling rate (“ISR”)
and total suspended solids (“TSS”) of the supernatant, a pH of 10 was identified as optimal.
Non-optimized static tests were conducted to define the starting conditions for the dynamic settling tests.
Dynamic settling tests were realized on the composite while varying the flocculant dosages or the thickener
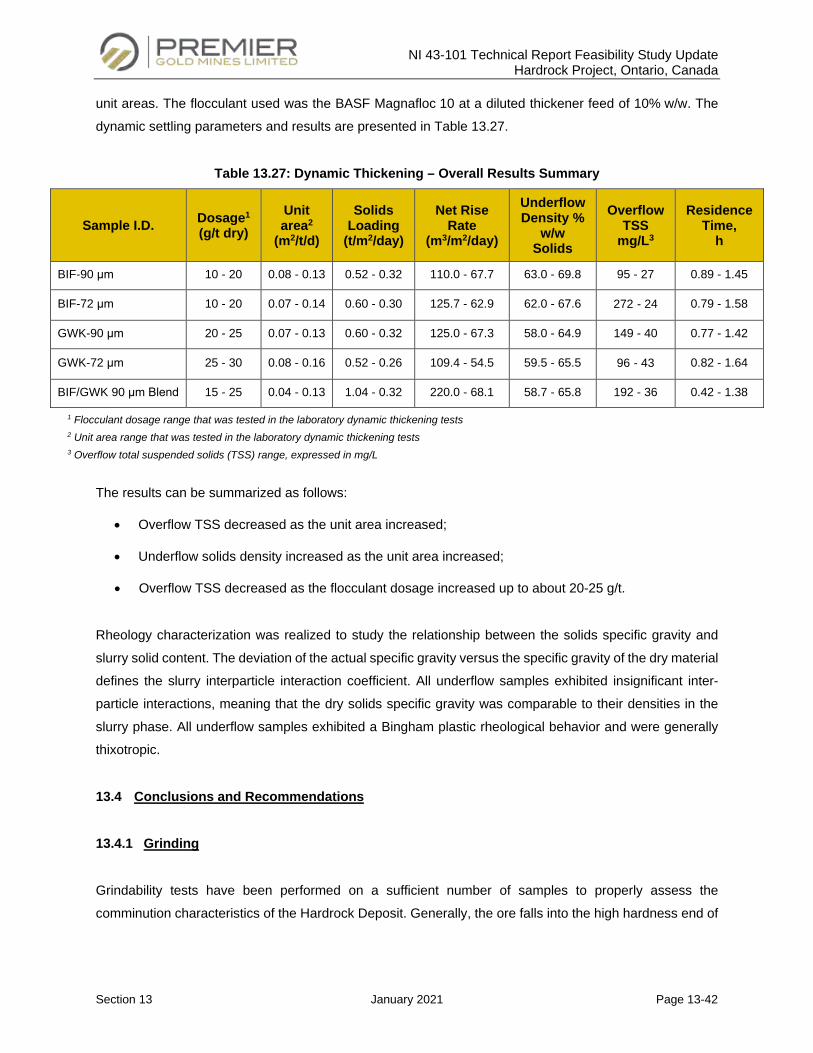
NI 43-101 Technical Report Feasibility Study Update Hardrock Project, Ontario, Canada
Section 13 January 2021 Page 13-42
unit areas. The flocculant used was the BASF Magnafloc 10 at a diluted thickener feed of 10% w/w. The
dynamic settling parameters and results are presented in Table 13.27.
Table 13.27: Dynamic Thickening – Overall Results Summary
Sample I.D. Dosage1
(g/t dry) Unit area2
(m2/t/d)
Solids Loading
(t/m2/day)
Net Rise Rate
(m3/m2/day)
Underflow Density %
w/w Solids
Overflow TSS
mg/L3
Residence Time,
h
BIF-90 μm 10 - 20 0.08 - 0.13 0.52 - 0.32 110.0 - 67.7 63.0 - 69.8 95 - 27 0.89 - 1.45
BIF-72 μm 10 - 20 0.07 - 0.14 0.60 - 0.30 125.7 - 62.9 62.0 - 67.6 272 - 24 0.79 - 1.58
GWK-90 μm 20 - 25 0.07 - 0.13 0.60 - 0.32 125.0 - 67.3 58.0 - 64.9 149 - 40 0.77 - 1.42
GWK-72 μm 25 - 30 0.08 - 0.16 0.52 - 0.26 109.4 - 54.5 59.5 - 65.5 96 - 43 0.82 - 1.64
BIF/GWK 90 μm Blend 15 - 25 0.04 - 0.13 1.04 - 0.32 220.0 - 68.1 58.7 - 65.8 192 - 36 0.42 - 1.38
1 Flocculant dosage range that was tested in the laboratory dynamic thickening tests 2 Unit area range that was tested in the laboratory dynamic thickening tests 3 Overflow total suspended solids (TSS) range, expressed in mg/L
The results can be summarized as follows:
• Overflow TSS decreased as the unit area increased;
• Underflow solids density increased as the unit area increased;
• Overflow TSS decreased as the flocculant dosage increased up to about 20-25 g/t.
Rheology characterization was realized to study the relationship between the solids specific gravity and
slurry solid content. The deviation of the actual specific gravity versus the specific gravity of the dry material
defines the slurry interparticle interaction coefficient. All underflow samples exhibited insignificant inter-
particle interactions, meaning that the dry solids specific gravity was comparable to their densities in the
slurry phase. All underflow samples exhibited a Bingham plastic rheological behavior and were generally
thixotropic.
13.4 Conclusions and Recommendations
13.4.1 Grinding
Grindability tests have been performed on a sufficient number of samples to properly assess the
comminution characteristics of the Hardrock Deposit. Generally, the ore falls into the high hardness end of
NI 43-101 Technical Report Feasibility Study Update Hardrock Project, Ontario, Canada
Section 13 January 2021 Page 13-43
the spectrum. The test data from the various tests need to be manipulated to estimate values that represent
the run-of-mine composition (weighted averages). These results are used as a basis for plant design.
13.4.2 High-Pressure Grinding
The HPGR Labwal tests showed that the Hardrock Deposit is amenable to high pressure grinding and
yielded a net power consumption of 2.6 kWh/t. The abrasion tests determined that the ore falls into the low
to medium abrasiveness categories. Bond ball mill grindability comparative tests done on the HPGR feed
and product revealed that a 7% to 12% power reduction could be expected when grinding a HPGR product.
13.4.3 Magnetic Separation
The magnetic separation tests revealed that a variable amount of magnetic minerals is present in the
different composites and that gold losses associated with the removal of the magnetic fraction can be
significant. The tests also expose the fact that large amounts of gold bearing ore could potentially be
rejected from the process if magnets are installed on relatively fine ore streams.
13.4.4 Gravity Recovery
Gravity recovery tests showed that gravity separation is an efficient method of recovering gold. Cyanidation
of gravity tailings is an economical method of gold recovery and removal of a small portion of gold reduces
cyanide consumption in the leach circuit and carbon circuit requirements.
13.4.5 Flotation
Comparing gold extraction by cyanidation of whole ore with cyanidation of flotation concentrate, there was
no benefit seen by including the flotation stage because the expected recovery with the flotation process
does not demonstrate improvement to the overall metallurgical performance.
13.4.6 Pressure Oxidation
Pressure oxidation as a pre-treatment ahead of cyanidation increased gold extraction to 97% (overall
recovery of 94% including flotation) and compared favourably to cyanidation of finely ground rougher
concentrate. Pressure oxidation, however, is a costly method for increasing gold extraction.
NI 43-101 Technical Report Feasibility Study Update Hardrock Project, Ontario, Canada
Section 13 January 2021 Page 13-44
13.4.7 Cyanidation
The cyanidation tests revealed that overall gold recovery is improved at finer grinds and cyanide
consumption is increased. The optimal leach conditions are defined as follows:
• Slurry density: 50% w/w;
• pH: 10.5-11.0;
• Dissolved oxygen: > 15 mg/L;
• Cyanide concentration: 0.35 g/L NaCN (maintained);
• Retention time: 30 hours.
13.4.8 Cyanide Destruction
The SO2/Air process is effective at reducing cyanide levels to below 1 mg/L in the final tailings. A 90-minute
retention time is required with the addition of 45 mg/L of copper sulfate and 7.32 g of sulfur dioxide per
gram of CNWAD.
13.4.9 Solid-Liquid Separation and Rheology
The pre-leach slurry can be thickened to 55% solids w/w by adding a low charge density anionic flocculant
at a 15 g/t dosage.
13.5 Future Work
Additional tests are recommended to be conducted prior to operations commencing:
• Cyanide destruction optimization test work to confirm the reagents to be used and the operating
conditions. Investigate the possibility of realizing the cyanide destruction and the precipitation of
arsenic in two stages.
NI 43-101 Technical Report Feasibility Study Update Hardrock Project, Ontario, Canada
Section 14 January 2021 Page 14-1
MINERAL RESOURCE ESTIMATES
14.1 Hardrock Mineral Resource Estimate
This Mineral Resource estimate (“MRE”) is an update to the MRE conducted in 2016 prepared by G Mining
Services Inc. (“GMS”) for the Hardrock Project (the “Project”), the results of which were disclosed in National
Instrument 43-101 (“NI 43-101”) Technical Report issued on December 21, 2016.
Completion of the current MRE update involved the assessment of an updated drill hole database, which
included data for an additional 481 reverse circulation (“RC”) and 53 diamond drill holes (“DDH”) completed
since the last MRE, and an updated block model for mine planning purposes.
The 2019 MRE update was produced under the supervision of Mr. Réjean Sirois, P.Eng. of GMS,
Vice President Geology and Resources, an independent “qualified person” (“QP”) as defined in NI 43-101.
Mr. Sirois visited the Project on multiple occasions in 2018 and 2019 to review drilling and sampling
protocols. The effective date of the updated MRE is September 4th, 2019.
A single MRE was prepared from 17 sub-vertical mineralization domains (the “principal domains”) and
remaining mineralization was captured by Leapfrog™ RBF Grade Shells. (the “external grade shells”).
Geovia GEMS™ was used for block modelling and estimation, and Leapfrog GEO™ was used for
wireframing and geological interpretation.
Inverse Distance Cubed (“ID3”) was used to interpolate gold grades (g Au/t) into a block model using the
modelled mineralization domains. Measured, Indicated and Inferred Mineral Resources are reported in the
summary tables in Subsection 14.1.16. The MRE takes into consideration that the Hardrock Gold Deposit
will be mined by both open pit and underground mining methods.
The MRE was prepared in accordance with CIM Standards on Mineral Resources and Reserves (adopted
May 10, 2014) and is reported in accordance with Canadian National Instrument 43-101 - Standards of
Disclosure for Mineral Projects. Classification, or assigning a level of confidence to Mineral Resources, has
been undertaken with strict adherence to CIM Standards on Mineral Resources and Reserves. In the
opinion of GMS, the Resource evaluation reported herein is a reasonable representation of the global
Mineral Resources found in the Hardrock Project at the current level and spacing of sampling.
The MRE includes Inferred Mineral Resources that are normally considered too speculative geologically to
have economic considerations applied to them that would enable them to be categorized as Mineral
Reserves. There is also no certainty that these Inferred Mineral Resources will be converted to the indicated
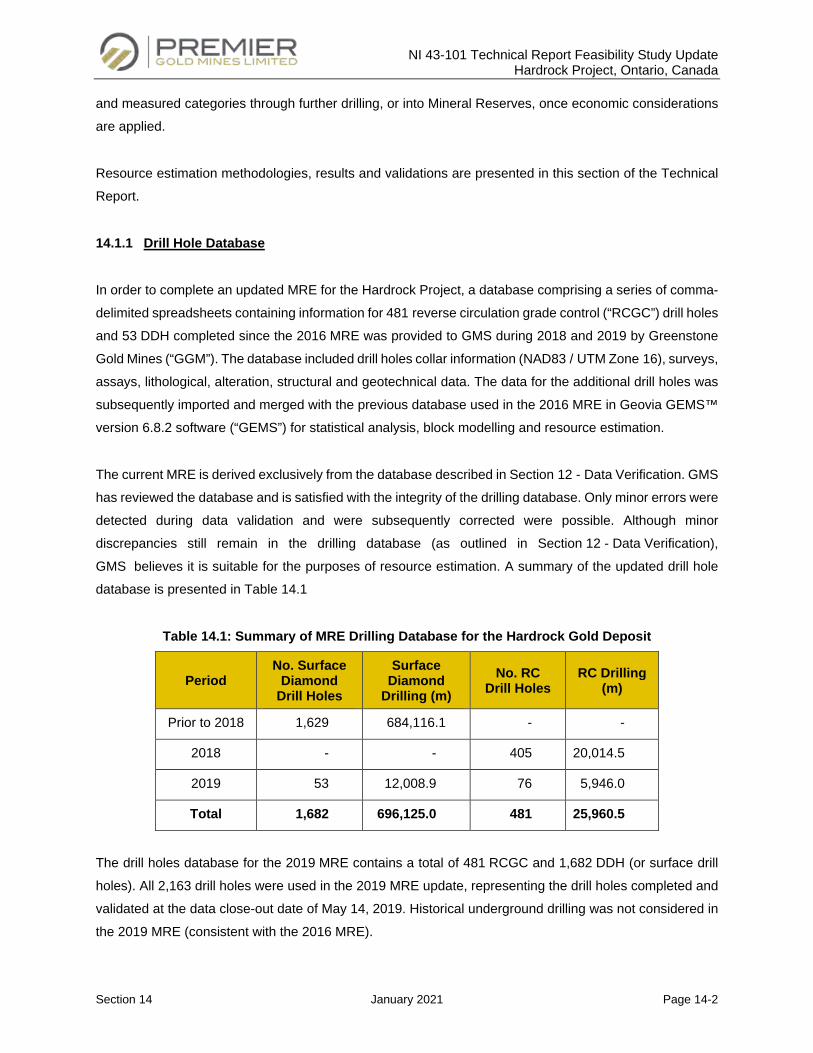
NI 43-101 Technical Report Feasibility Study Update Hardrock Project, Ontario, Canada
Section 14 January 2021 Page 14-2
and measured categories through further drilling, or into Mineral Reserves, once economic considerations
are applied.
Resource estimation methodologies, results and validations are presented in this section of the Technical
Report.
14.1.1 Drill Hole Database
In order to complete an updated MRE for the Hardrock Project, a database comprising a series of comma-
delimited spreadsheets containing information for 481 reverse circulation grade control (“RCGC”) drill holes
and 53 DDH completed since the 2016 MRE was provided to GMS during 2018 and 2019 by Greenstone
Gold Mines (“GGM”). The database included drill holes collar information (NAD83 / UTM Zone 16), surveys,
assays, lithological, alteration, structural and geotechnical data. The data for the additional drill holes was
subsequently imported and merged with the previous database used in the 2016 MRE in Geovia GEMS™
version 6.8.2 software (“GEMS”) for statistical analysis, block modelling and resource estimation.
The current MRE is derived exclusively from the database described in Section 12 - Data Verification. GMS
has reviewed the database and is satisfied with the integrity of the drilling database. Only minor errors were
detected during data validation and were subsequently corrected were possible. Although minor
discrepancies still remain in the drilling database (as outlined in Section 12 - Data Verification),
GMS believes it is suitable for the purposes of resource estimation. A summary of the updated drill hole
database is presented in Table 14.1
Table 14.1: Summary of MRE Drilling Database for the Hardrock Gold Deposit
Period No. Surface
Diamond Drill Holes
Surface Diamond
Drilling (m) No. RC
Drill Holes RC Drilling
(m)
Prior to 2018 1,629 684,116.1 - -
2018 - - 405 20,014.5
2019 53 12,008.9 76 5,946.0
Total 1,682 696,125.0 481 25,960.5
The drill holes database for the 2019 MRE contains a total of 481 RCGC and 1,682 DDH (or surface drill
holes). All 2,163 drill holes were used in the 2019 MRE update, representing the drill holes completed and
validated at the data close-out date of May 14, 2019. Historical underground drilling was not considered in
the 2019 MRE (consistent with the 2016 MRE).
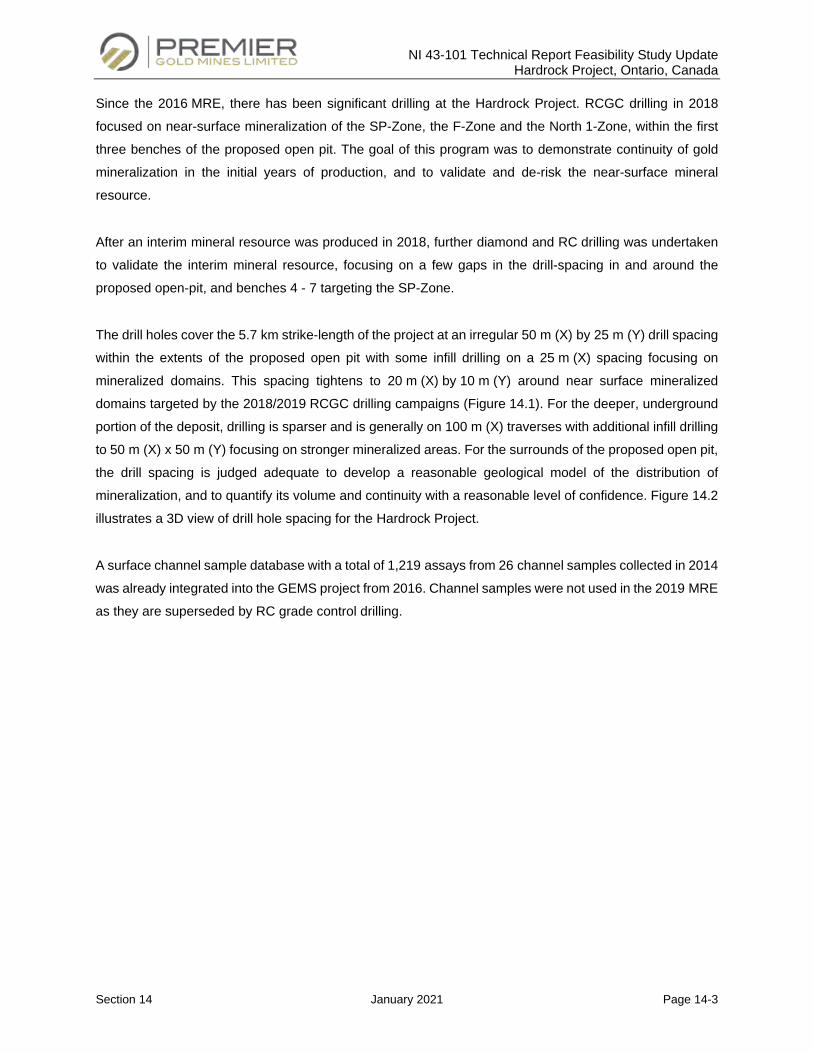
NI 43-101 Technical Report Feasibility Study Update Hardrock Project, Ontario, Canada
Section 14 January 2021 Page 14-3
Since the 2016 MRE, there has been significant drilling at the Hardrock Project. RCGC drilling in 2018
focused on near-surface mineralization of the SP-Zone, the F-Zone and the North 1-Zone, within the first
three benches of the proposed open pit. The goal of this program was to demonstrate continuity of gold
mineralization in the initial years of production, and to validate and de-risk the near-surface mineral
resource.
After an interim mineral resource was produced in 2018, further diamond and RC drilling was undertaken
to validate the interim mineral resource, focusing on a few gaps in the drill-spacing in and around the
proposed open-pit, and benches 4 - 7 targeting the SP-Zone.
The drill holes cover the 5.7 km strike-length of the project at an irregular 50 m (X) by 25 m (Y) drill spacing
within the extents of the proposed open pit with some infill drilling on a 25 m (X) spacing focusing on
mineralized domains. This spacing tightens to 20 m (X) by 10 m (Y) around near surface mineralized
domains targeted by the 2018/2019 RCGC drilling campaigns (Figure 14.1). For the deeper, underground
portion of the deposit, drilling is sparser and is generally on 100 m (X) traverses with additional infill drilling
to 50 m (X) x 50 m (Y) focusing on stronger mineralized areas. For the surrounds of the proposed open pit,
the drill spacing is judged adequate to develop a reasonable geological model of the distribution of
mineralization, and to quantify its volume and continuity with a reasonable level of confidence. Figure 14.2
illustrates a 3D view of drill hole spacing for the Hardrock Project.
A surface channel sample database with a total of 1,219 assays from 26 channel samples collected in 2014
was already integrated into the GEMS project from 2016. Channel samples were not used in the 2019 MRE
as they are superseded by RC grade control drilling.
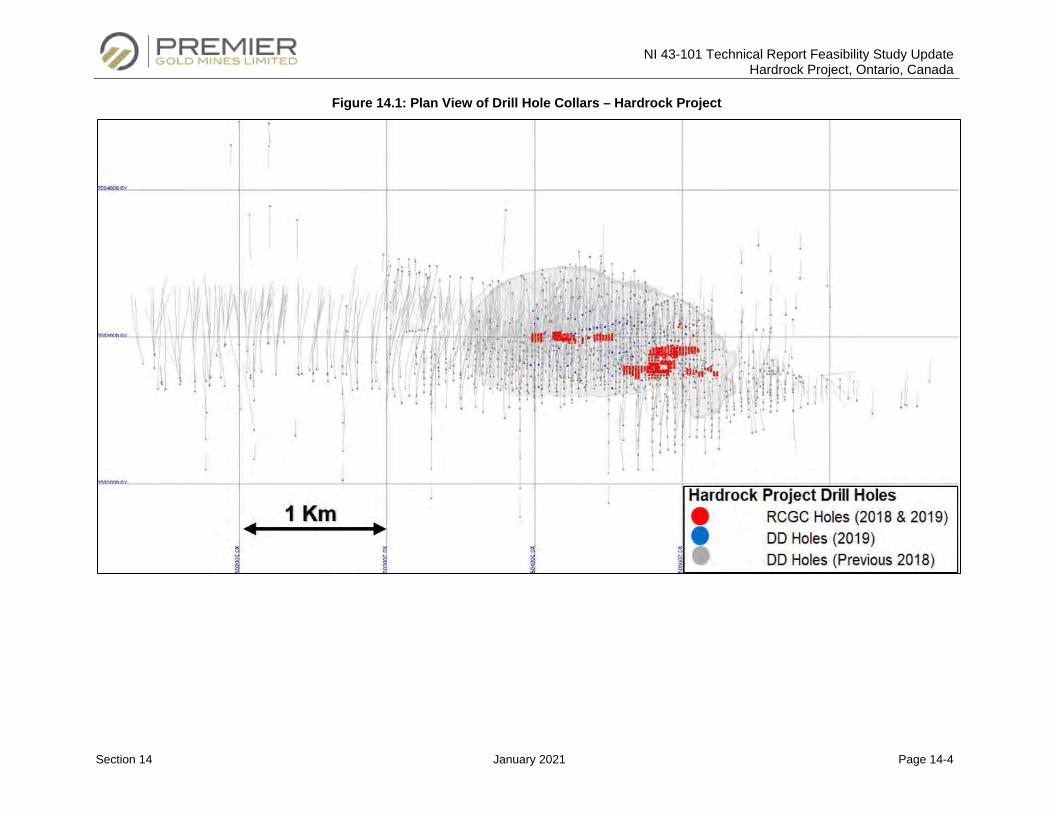
NI 43-101 Technical Report Feasibility Study Update Hardrock Project, Ontario, Canada
Section 14 January 2021 Page 14-4
Figure 14.1: Plan View of Drill Hole Collars – Hardrock Project
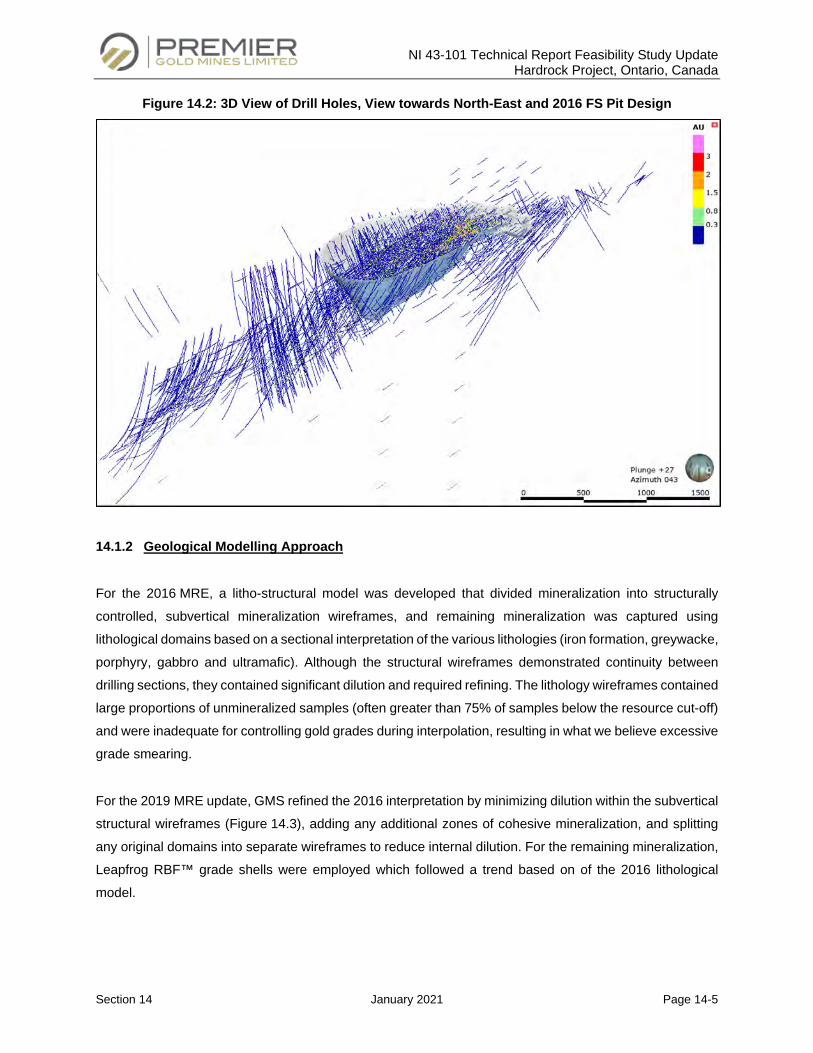
NI 43-101 Technical Report Feasibility Study Update Hardrock Project, Ontario, Canada
Section 14 January 2021 Page 14-5
Figure 14.2: 3D View of Drill Holes, View towards North-East and 2016 FS Pit Design
14.1.2 Geological Modelling Approach
For the 2016 MRE, a litho-structural model was developed that divided mineralization into structurally
controlled, subvertical mineralization wireframes, and remaining mineralization was captured using
lithological domains based on a sectional interpretation of the various lithologies (iron formation, greywacke,
porphyry, gabbro and ultramafic). Although the structural wireframes demonstrated continuity between
drilling sections, they contained significant dilution and required refining. The lithology wireframes contained
large proportions of unmineralized samples (often greater than 75% of samples below the resource cut-off)
and were inadequate for controlling gold grades during interpolation, resulting in what we believe excessive
grade smearing.
For the 2019 MRE update, GMS refined the 2016 interpretation by minimizing dilution within the subvertical
structural wireframes (Figure 14.3), adding any additional zones of cohesive mineralization, and splitting
any original domains into separate wireframes to reduce internal dilution. For the remaining mineralization,
Leapfrog RBF™ grade shells were employed which followed a trend based on of the 2016 lithological
model.
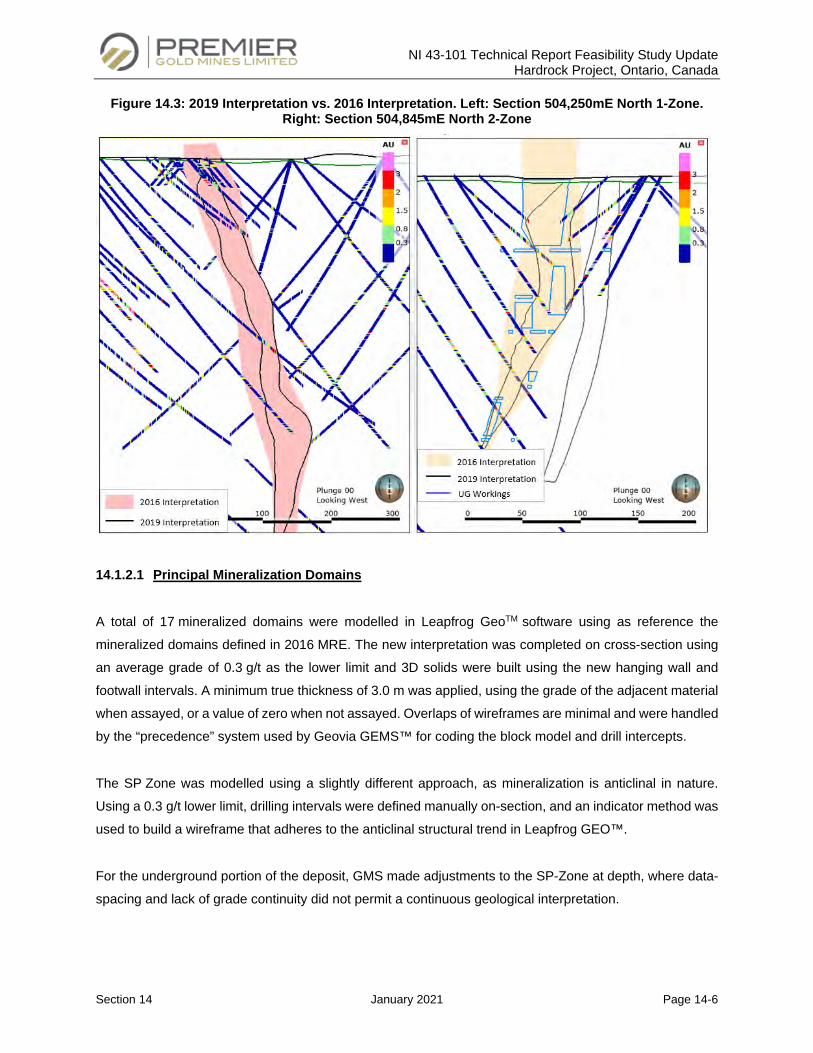
NI 43-101 Technical Report Feasibility Study Update Hardrock Project, Ontario, Canada
Section 14 January 2021 Page 14-6
Figure 14.3: 2019 Interpretation vs. 2016 Interpretation. Left: Section 504,250mE North 1-Zone. Right: Section 504,845mE North 2-Zone
14.1.2.1 Principal Mineralization Domains
A total of 17 mineralized domains were modelled in Leapfrog GeoTM software using as reference the
mineralized domains defined in 2016 MRE. The new interpretation was completed on cross-section using
an average grade of 0.3 g/t as the lower limit and 3D solids were built using the new hanging wall and
footwall intervals. A minimum true thickness of 3.0 m was applied, using the grade of the adjacent material
when assayed, or a value of zero when not assayed. Overlaps of wireframes are minimal and were handled
by the “precedence” system used by Geovia GEMS™ for coding the block model and drill intercepts.
The SP Zone was modelled using a slightly different approach, as mineralization is anticlinal in nature.
Using a 0.3 g/t lower limit, drilling intervals were defined manually on-section, and an indicator method was
used to build a wireframe that adheres to the anticlinal structural trend in Leapfrog GEO™.
For the underground portion of the deposit, GMS made adjustments to the SP-Zone at depth, where data-
spacing and lack of grade continuity did not permit a continuous geological interpretation.
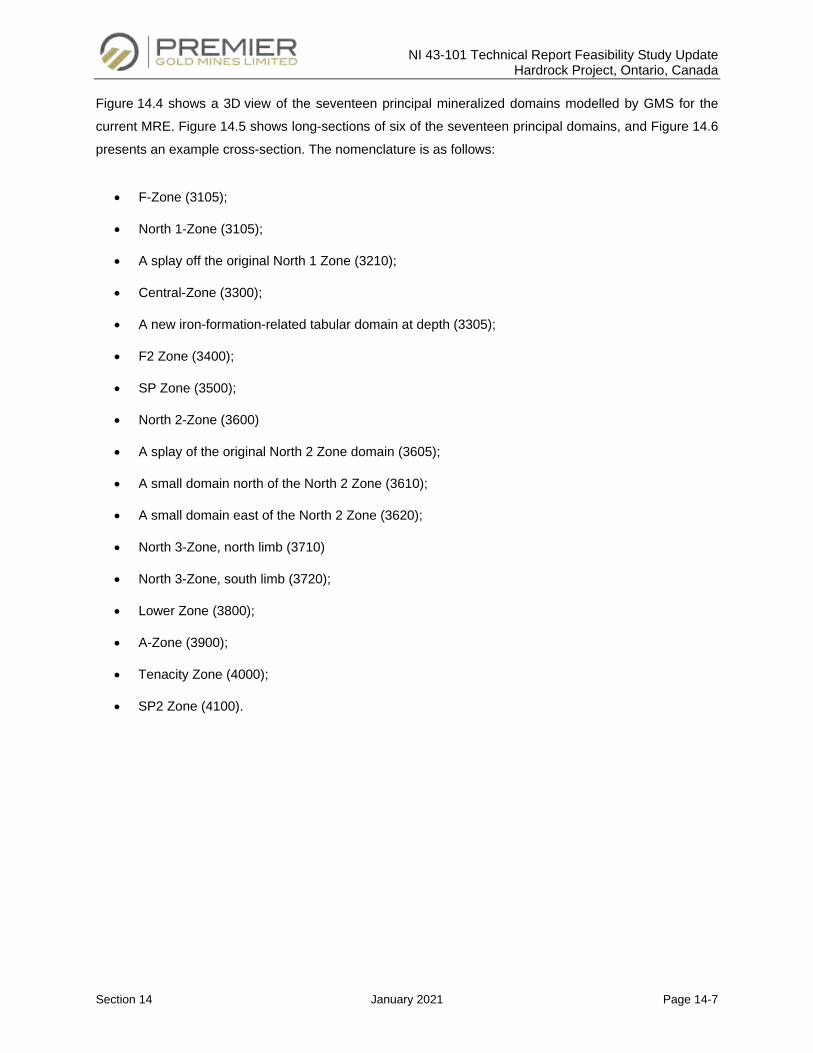
NI 43-101 Technical Report Feasibility Study Update Hardrock Project, Ontario, Canada
Section 14 January 2021 Page 14-7
Figure 14.4 shows a 3D view of the seventeen principal mineralized domains modelled by GMS for the
current MRE. Figure 14.5 shows long-sections of six of the seventeen principal domains, and Figure 14.6
presents an example cross-section. The nomenclature is as follows:
• F-Zone (3105);
• North 1-Zone (3105);
• A splay off the original North 1 Zone (3210);
• Central-Zone (3300);
• A new iron-formation-related tabular domain at depth (3305);
• F2 Zone (3400);
• SP Zone (3500);
• North 2-Zone (3600)
• A splay of the original North 2 Zone domain (3605);
• A small domain north of the North 2 Zone (3610);
• A small domain east of the North 2 Zone (3620);
• North 3-Zone, north limb (3710)
• North 3-Zone, south limb (3720);
• Lower Zone (3800);
• A-Zone (3900);
• Tenacity Zone (4000);
• SP2 Zone (4100).
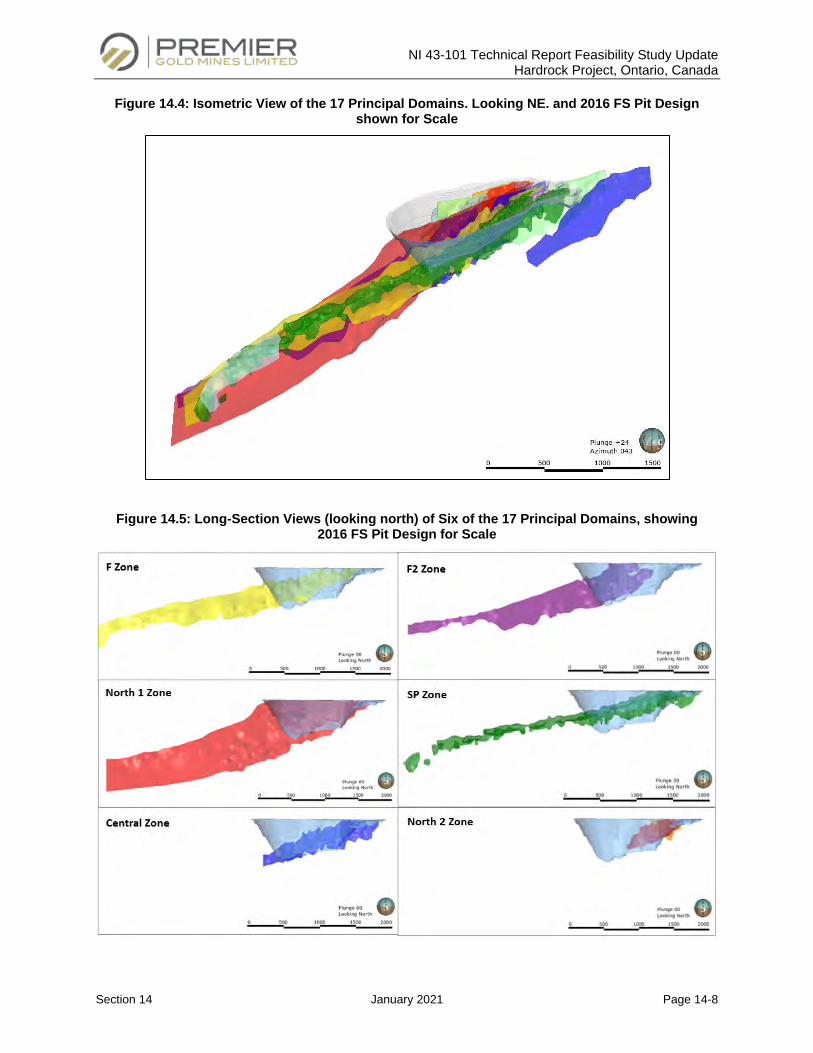
NI 43-101 Technical Report Feasibility Study Update Hardrock Project, Ontario, Canada
Section 14 January 2021 Page 14-8
Figure 14.4: Isometric View of the 17 Principal Domains. Looking NE. and 2016 FS Pit Design shown for Scale
Figure 14.5: Long-Section Views (looking north) of Six of the 17 Principal Domains, showing 2016 FS Pit Design for Scale
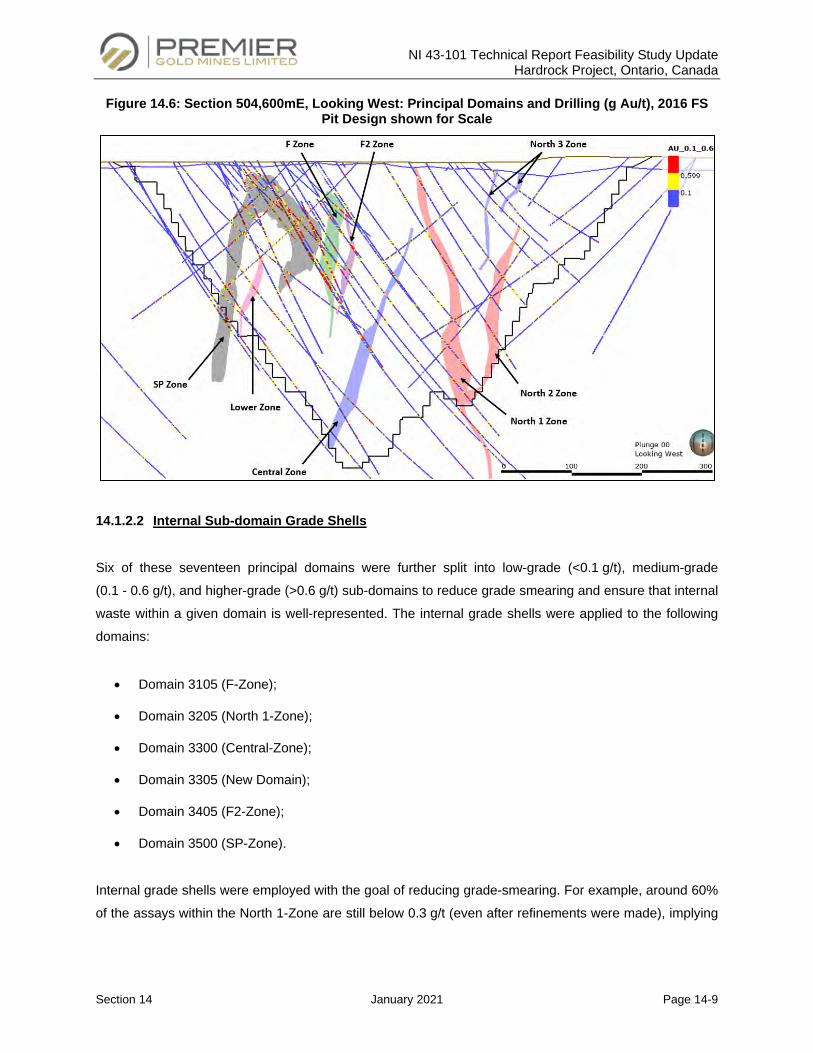
NI 43-101 Technical Report Feasibility Study Update Hardrock Project, Ontario, Canada
Section 14 January 2021 Page 14-9
Figure 14.6: Section 504,600mE, Looking West: Principal Domains and Drilling (g Au/t), 2016 FS Pit Design shown for Scale
14.1.2.2 Internal Sub-domain Grade Shells
Six of these seventeen principal domains were further split into low-grade (<0.1 g/t), medium-grade
(0.1 - 0.6 g/t), and higher-grade (>0.6 g/t) sub-domains to reduce grade smearing and ensure that internal
waste within a given domain is well-represented. The internal grade shells were applied to the following
domains:
• Domain 3105 (F-Zone);
• Domain 3205 (North 1-Zone);
• Domain 3300 (Central-Zone);
• Domain 3305 (New Domain);
• Domain 3405 (F2-Zone);
• Domain 3500 (SP-Zone).
Internal grade shells were employed with the goal of reducing grade-smearing. For example, around 60%
of the assays within the North 1-Zone are still below 0.3 g/t (even after refinements were made), implying
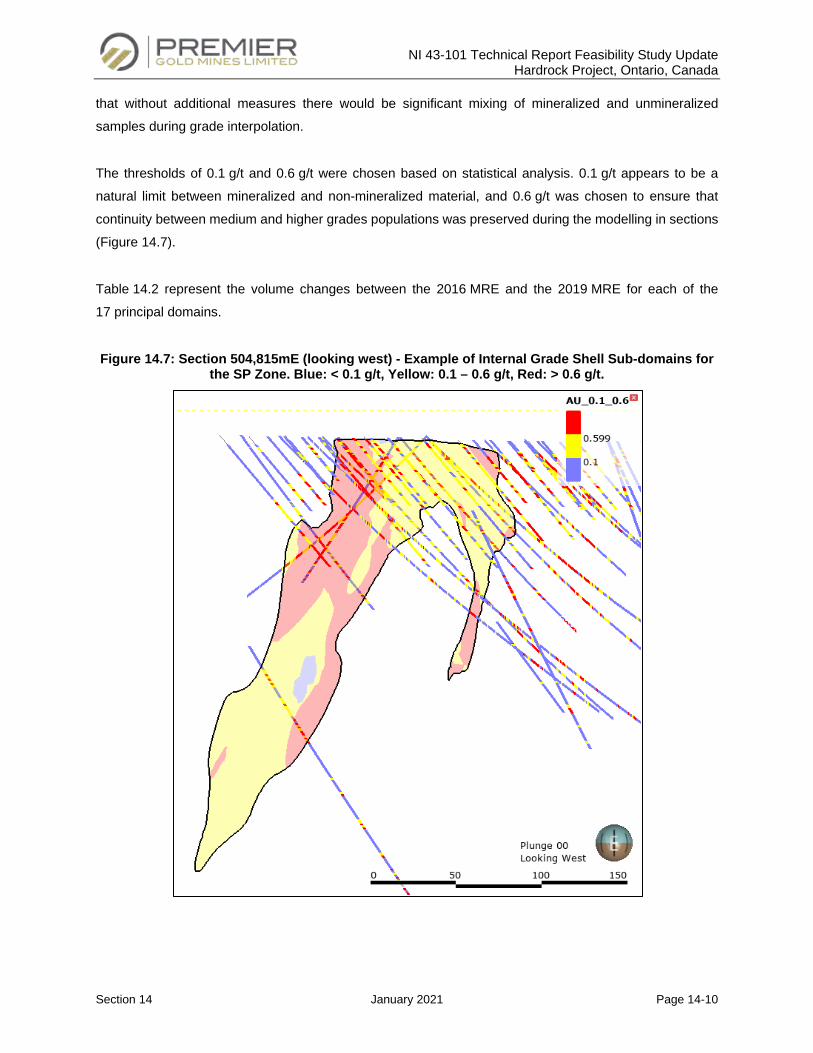
NI 43-101 Technical Report Feasibility Study Update Hardrock Project, Ontario, Canada
Section 14 January 2021 Page 14-10
that without additional measures there would be significant mixing of mineralized and unmineralized
samples during grade interpolation.
The thresholds of 0.1 g/t and 0.6 g/t were chosen based on statistical analysis. 0.1 g/t appears to be a
natural limit between mineralized and non-mineralized material, and 0.6 g/t was chosen to ensure that
continuity between medium and higher grades populations was preserved during the modelling in sections
(Figure 14.7).
Table 14.2 represent the volume changes between the 2016 MRE and the 2019 MRE for each of the
17 principal domains.
Figure 14.7: Section 504,815mE (looking west) - Example of Internal Grade Shell Sub-domains for the SP Zone. Blue: < 0.1 g/t, Yellow: 0.1 – 0.6 g/t, Red: > 0.6 g/t.
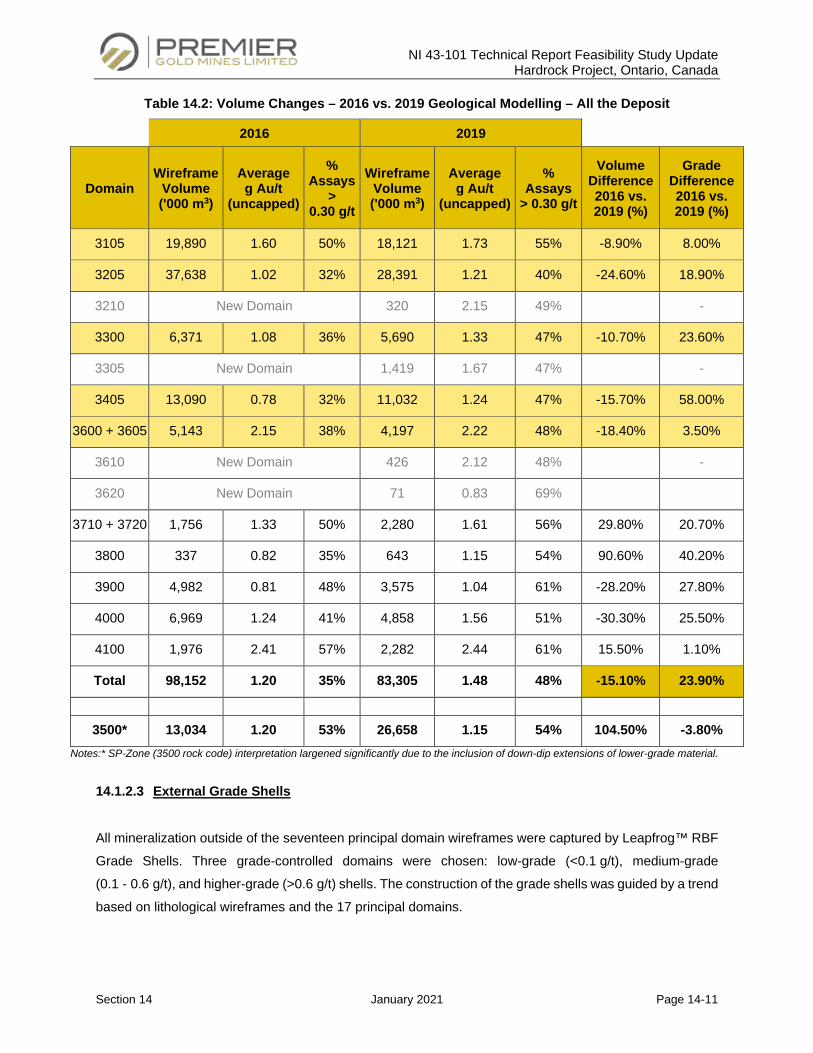
NI 43-101 Technical Report Feasibility Study Update Hardrock Project, Ontario, Canada
Section 14 January 2021 Page 14-11
Table 14.2: Volume Changes – 2016 vs. 2019 Geological Modelling – All the Deposit
2016 2019
Domain Wireframe
Volume ('000 m3)
Average g Au/t
(uncapped)
% Assays
> 0.30 g/t
Wireframe Volume ('000 m3)
Average g Au/t
(uncapped)
% Assays
> 0.30 g/t
Volume Difference 2016 vs. 2019 (%)
Grade Difference 2016 vs. 2019 (%)
3105 19,890 1.60 50% 18,121 1.73 55% -8.90% 8.00%
3205 37,638 1.02 32% 28,391 1.21 40% -24.60% 18.90%
3210 New Domain 320 2.15 49% -
3300 6,371 1.08 36% 5,690 1.33 47% -10.70% 23.60%
3305 New Domain 1,419 1.67 47% -
3405 13,090 0.78 32% 11,032 1.24 47% -15.70% 58.00%
3600 + 3605 5,143 2.15 38% 4,197 2.22 48% -18.40% 3.50%
3610 New Domain 426 2.12 48% -
3620 New Domain 71 0.83 69%
3710 + 3720 1,756 1.33 50% 2,280 1.61 56% 29.80% 20.70%
3800 337 0.82 35% 643 1.15 54% 90.60% 40.20%
3900 4,982 0.81 48% 3,575 1.04 61% -28.20% 27.80%
4000 6,969 1.24 41% 4,858 1.56 51% -30.30% 25.50%
4100 1,976 2.41 57% 2,282 2.44 61% 15.50% 1.10%
Total 98,152 1.20 35% 83,305 1.48 48% -15.10% 23.90%
3500* 13,034 1.20 53% 26,658 1.15 54% 104.50% -3.80% Notes:* SP-Zone (3500 rock code) interpretation largened significantly due to the inclusion of down-dip extensions of lower-grade material.
14.1.2.3 External Grade Shells
All mineralization outside of the seventeen principal domain wireframes were captured by Leapfrog™ RBF
Grade Shells. Three grade-controlled domains were chosen: low-grade (<0.1 g/t), medium-grade
(0.1 - 0.6 g/t), and higher-grade (>0.6 g/t) shells. The construction of the grade shells was guided by a trend
based on lithological wireframes and the 17 principal domains.
NI 43-101 Technical Report Feasibility Study Update Hardrock Project, Ontario, Canada
Section 14 January 2021 Page 14-12
Gold values were temporarily capped to 10 g/t during the construction of the grade shells to reduce the
“leapfrog bubble effect” and to prevent the overestimation of volume in data-sparse areas.
14.1.2.4 Structural Domain Subdivisions
Three external grade shell domains (500, 501 and 506) and two principal domains (SP-Zone and
North 2 Zone) were subdivided into search ellipse sub-domains to guide the search ellipses around the
complex orientations (with soft boundaries). This is discussed in more detail in Subsection 14.1.5.
14.1.2.5 Topographic and Bedrock Surfaces
A topographic surface was generated from LiDAR data provided to GMS. A base of overburden surface
was generated in Leapfrog GEO™ from drill hole lithology information to evaluate the overburden thickness.
Geotechnical drilling information collected in the vicinity of the historic tailings was also provided to GMS to
enable the subdivision of tailings material into organics, tailings and fill. Wireframes were modelled for these
three material types and incorporated into the block modelling process.
14.1.3 Assay Capping and Compositing
14.1.3.1 High-grade Capping
Basic univariate statistics were performed on raw assay datasets grouped by rock code. Assay capping
was undertaken before compositing for each mineralized domain and sub-domain, and capping levels were
chosen primarily using probability plots.
A total of 209 samples were capped using the determined capping limits, which represents a metal loss
factor of 9.2%. Table 14.3 presents a summary of the statistical analysis for each domain for the raw assays.
Figure 14.8 and Figure 14.9 show example probability plots for the high-grade sub-domains of the F-Zone
and North 1-Zone.
14.1.3.2 Arsenic and Sulfur Database
Basic univariate statistics were performed on raw arsenic (As) and sulfur (S) assay datasets grouped by
domain using raw analytical assay data, for a total of 16,144 samples for As and 16,370 samples for S.
Table 14.4 presents a summary of the median analysis and capping values applied on raw As and S
assays for each mineralized domain.
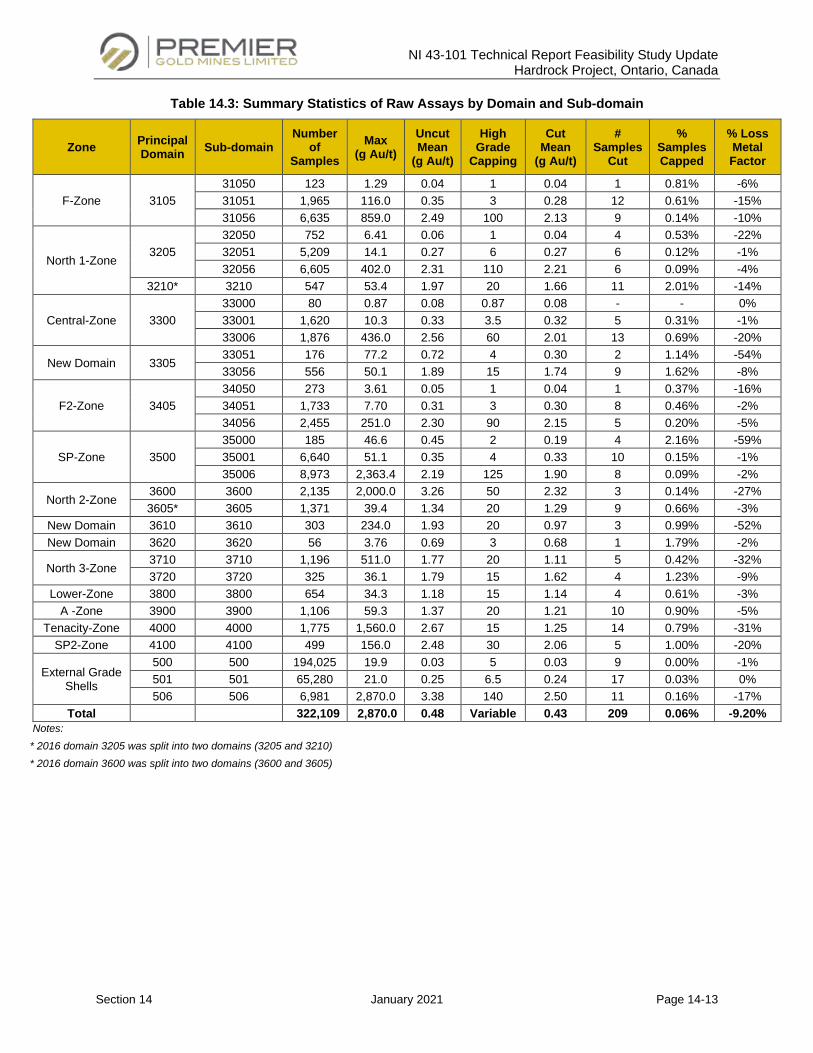
NI 43-101 Technical Report Feasibility Study Update Hardrock Project, Ontario, Canada
Section 14 January 2021 Page 14-13
Table 14.3: Summary Statistics of Raw Assays by Domain and Sub-domain
Zone Principal Domain Sub-domain
Number of
Samples Max
(g Au/t) Uncut Mean
(g Au/t)
High Grade
Capping
Cut Mean
(g Au/t)
# Samples
Cut
% Samples Capped
% Loss Metal Factor
F-Zone 3105 31050 123 1.29 0.04 1 0.04 1 0.81% -6% 31051 1,965 116.0 0.35 3 0.28 12 0.61% -15% 31056 6,635 859.0 2.49 100 2.13 9 0.14% -10%
North 1-Zone 3205
32050 752 6.41 0.06 1 0.04 4 0.53% -22% 32051 5,209 14.1 0.27 6 0.27 6 0.12% -1% 32056 6,605 402.0 2.31 110 2.21 6 0.09% -4%
3210* 3210 547 53.4 1.97 20 1.66 11 2.01% -14%
Central-Zone 3300 33000 80 0.87 0.08 0.87 0.08 - - 0% 33001 1,620 10.3 0.33 3.5 0.32 5 0.31% -1% 33006 1,876 436.0 2.56 60 2.01 13 0.69% -20%
New Domain 3305 33051 176 77.2 0.72 4 0.30 2 1.14% -54% 33056 556 50.1 1.89 15 1.74 9 1.62% -8%
F2-Zone 3405 34050 273 3.61 0.05 1 0.04 1 0.37% -16% 34051 1,733 7.70 0.31 3 0.30 8 0.46% -2% 34056 2,455 251.0 2.30 90 2.15 5 0.20% -5%
SP-Zone 3500 35000 185 46.6 0.45 2 0.19 4 2.16% -59% 35001 6,640 51.1 0.35 4 0.33 10 0.15% -1% 35006 8,973 2,363.4 2.19 125 1.90 8 0.09% -2%
North 2-Zone 3600 3600 2,135 2,000.0 3.26 50 2.32 3 0.14% -27% 3605* 3605 1,371 39.4 1.34 20 1.29 9 0.66% -3%
New Domain 3610 3610 303 234.0 1.93 20 0.97 3 0.99% -52% New Domain 3620 3620 56 3.76 0.69 3 0.68 1 1.79% -2%
North 3-Zone 3710 3710 1,196 511.0 1.77 20 1.11 5 0.42% -32% 3720 3720 325 36.1 1.79 15 1.62 4 1.23% -9%
Lower-Zone 3800 3800 654 34.3 1.18 15 1.14 4 0.61% -3% A -Zone 3900 3900 1,106 59.3 1.37 20 1.21 10 0.90% -5%
Tenacity-Zone 4000 4000 1,775 1,560.0 2.67 15 1.25 14 0.79% -31% SP2-Zone 4100 4100 499 156.0 2.48 30 2.06 5 1.00% -20%
External Grade Shells
500 500 194,025 19.9 0.03 5 0.03 9 0.00% -1% 501 501 65,280 21.0 0.25 6.5 0.24 17 0.03% 0% 506 506 6,981 2,870.0 3.38 140 2.50 11 0.16% -17%
Total 322,109 2,870.0 0.48 Variable 0.43 209 0.06% -9.20% Notes:
* 2016 domain 3205 was split into two domains (3205 and 3210)
* 2016 domain 3600 was split into two domains (3600 and 3605)
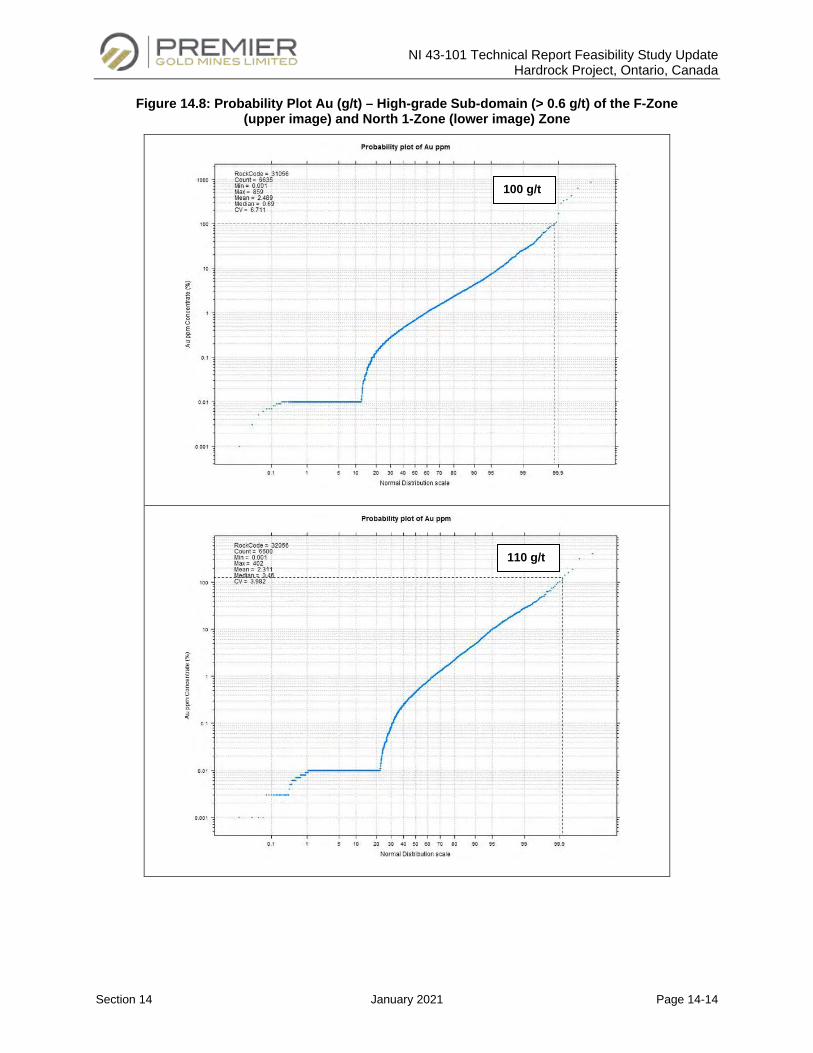
NI 43-101 Technical Report Feasibility Study Update Hardrock Project, Ontario, Canada
Section 14 January 2021 Page 14-14
Figure 14.8: Probability Plot Au (g/t) – High-grade Sub-domain (> 0.6 g/t) of the F-Zone (upper image) and North 1-Zone (lower image) Zone
110 g/t
100 g/t
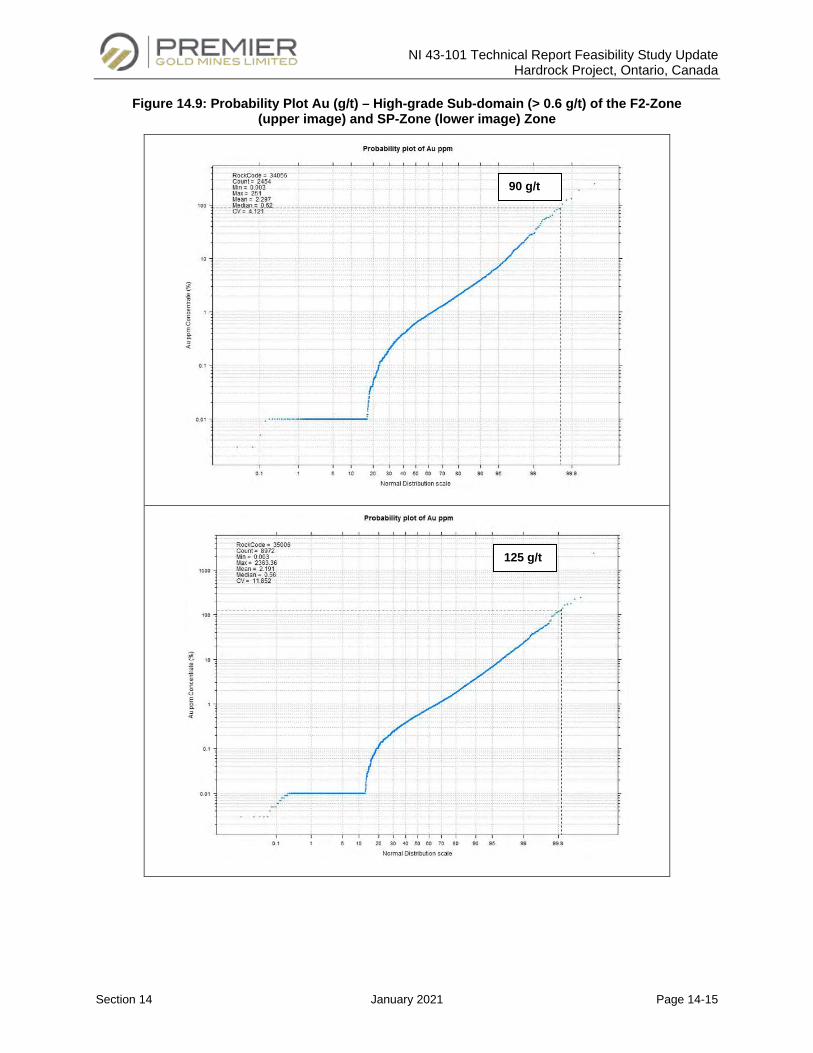
NI 43-101 Technical Report Feasibility Study Update Hardrock Project, Ontario, Canada
Section 14 January 2021 Page 14-15
Figure 14.9: Probability Plot Au (g/t) – High-grade Sub-domain (> 0.6 g/t) of the F2-Zone (upper image) and SP-Zone (lower image) Zone
125 g/t
90 g/t
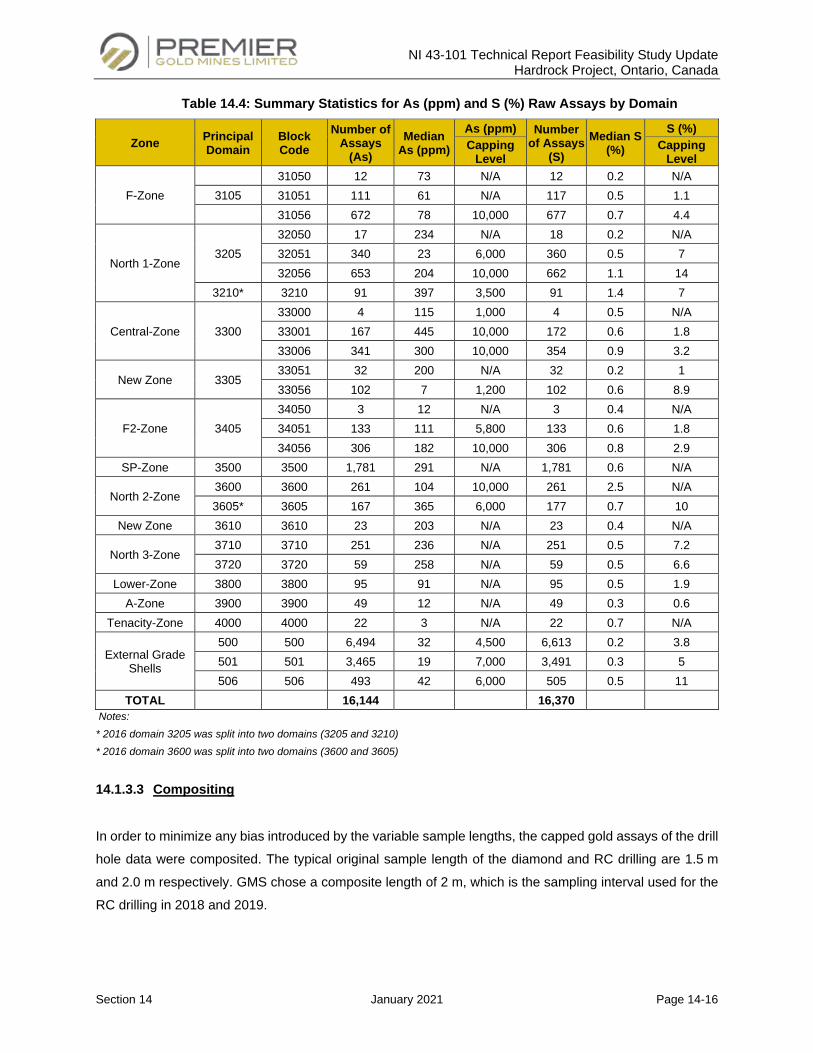
NI 43-101 Technical Report Feasibility Study Update Hardrock Project, Ontario, Canada
Section 14 January 2021 Page 14-16
Table 14.4: Summary Statistics for As (ppm) and S (%) Raw Assays by Domain
Zone Principal Domain
Block Code
Number of Assays
(As) Median
As (ppm) As (ppm) Number
of Assays (S)
Median S (%)
S (%) Capping
Level Capping
Level
F-Zone 31050 12 73 N/A 12 0.2 N/A
3105 31051 111 61 N/A 117 0.5 1.1 31056 672 78 10,000 677 0.7 4.4
North 1-Zone 3205
32050 17 234 N/A 18 0.2 N/A 32051 340 23 6,000 360 0.5 7 32056 653 204 10,000 662 1.1 14
3210* 3210 91 397 3,500 91 1.4 7
Central-Zone 3300 33000 4 115 1,000 4 0.5 N/A 33001 167 445 10,000 172 0.6 1.8 33006 341 300 10,000 354 0.9 3.2
New Zone 3305 33051 32 200 N/A 32 0.2 1 33056 102 7 1,200 102 0.6 8.9
F2-Zone 3405 34050 3 12 N/A 3 0.4 N/A 34051 133 111 5,800 133 0.6 1.8 34056 306 182 10,000 306 0.8 2.9
SP-Zone 3500 3500 1,781 291 N/A 1,781 0.6 N/A
North 2-Zone 3600 3600 261 104 10,000 261 2.5 N/A 3605* 3605 167 365 6,000 177 0.7 10
New Zone 3610 3610 23 203 N/A 23 0.4 N/A
North 3-Zone 3710 3710 251 236 N/A 251 0.5 7.2 3720 3720 59 258 N/A 59 0.5 6.6
Lower-Zone 3800 3800 95 91 N/A 95 0.5 1.9 A-Zone 3900 3900 49 12 N/A 49 0.3 0.6
Tenacity-Zone 4000 4000 22 3 N/A 22 0.7 N/A
External Grade Shells
500 500 6,494 32 4,500 6,613 0.2 3.8 501 501 3,465 19 7,000 3,491 0.3 5 506 506 493 42 6,000 505 0.5 11
TOTAL 16,144 16,370
Notes:
* 2016 domain 3205 was split into two domains (3205 and 3210)
* 2016 domain 3600 was split into two domains (3600 and 3605)
14.1.3.3 Compositing
In order to minimize any bias introduced by the variable sample lengths, the capped gold assays of the drill
hole data were composited. The typical original sample length of the diamond and RC drilling are 1.5 m
and 2.0 m respectively. GMS chose a composite length of 2 m, which is the sampling interval used for the
RC drilling in 2018 and 2019.
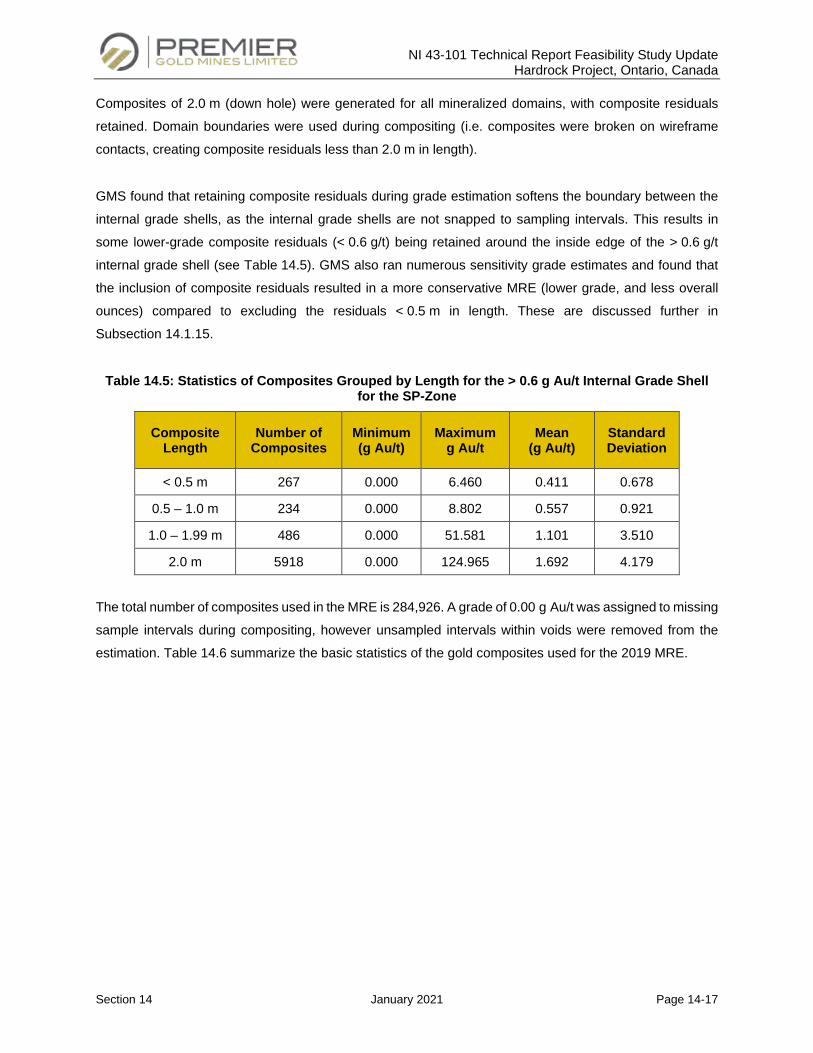
NI 43-101 Technical Report Feasibility Study Update Hardrock Project, Ontario, Canada
Section 14 January 2021 Page 14-17
Composites of 2.0 m (down hole) were generated for all mineralized domains, with composite residuals
retained. Domain boundaries were used during compositing (i.e. composites were broken on wireframe
contacts, creating composite residuals less than 2.0 m in length).
GMS found that retaining composite residuals during grade estimation softens the boundary between the
internal grade shells, as the internal grade shells are not snapped to sampling intervals. This results in
some lower-grade composite residuals (< 0.6 g/t) being retained around the inside edge of the > 0.6 g/t
internal grade shell (see Table 14.5). GMS also ran numerous sensitivity grade estimates and found that
the inclusion of composite residuals resulted in a more conservative MRE (lower grade, and less overall
ounces) compared to excluding the residuals < 0.5 m in length. These are discussed further in
Subsection 14.1.15.
Table 14.5: Statistics of Composites Grouped by Length for the > 0.6 g Au/t Internal Grade Shell for the SP-Zone
Composite Length
Number of Composites
Minimum (g Au/t)
Maximum g Au/t
Mean (g Au/t)
Standard Deviation
< 0.5 m 267 0.000 6.460 0.411 0.678
0.5 – 1.0 m 234 0.000 8.802 0.557 0.921
1.0 – 1.99 m 486 0.000 51.581 1.101 3.510
2.0 m 5918 0.000 124.965 1.692 4.179
The total number of composites used in the MRE is 284,926. A grade of 0.00 g Au/t was assigned to missing
sample intervals during compositing, however unsampled intervals within voids were removed from the
estimation. Table 14.6 summarize the basic statistics of the gold composites used for the 2019 MRE.
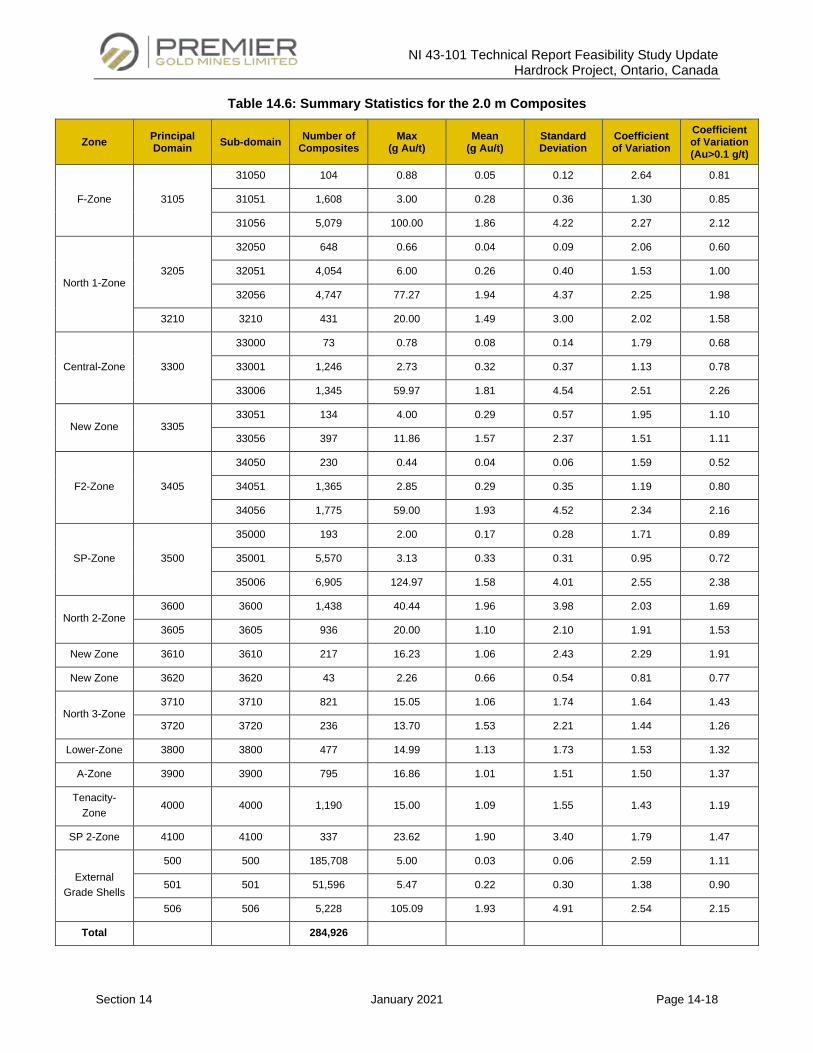
NI 43-101 Technical Report Feasibility Study Update Hardrock Project, Ontario, Canada
Section 14 January 2021 Page 14-18
Table 14.6: Summary Statistics for the 2.0 m Composites
Zone Principal Domain Sub-domain Number of
Composites Max
(g Au/t) Mean
(g Au/t) Standard Deviation
Coefficient of Variation
Coefficient of Variation (Au>0.1 g/t)
F-Zone 3105
31050 104 0.88 0.05 0.12 2.64 0.81
31051 1,608 3.00 0.28 0.36 1.30 0.85
31056 5,079 100.00 1.86 4.22 2.27 2.12
North 1-Zone 3205
32050 648 0.66 0.04 0.09 2.06 0.60
32051 4,054 6.00 0.26 0.40 1.53 1.00
32056 4,747 77.27 1.94 4.37 2.25 1.98
3210 3210 431 20.00 1.49 3.00 2.02 1.58
Central-Zone 3300
33000 73 0.78 0.08 0.14 1.79 0.68
33001 1,246 2.73 0.32 0.37 1.13 0.78
33006 1,345 59.97 1.81 4.54 2.51 2.26
New Zone 3305 33051 134 4.00 0.29 0.57 1.95 1.10
33056 397 11.86 1.57 2.37 1.51 1.11
F2-Zone 3405
34050 230 0.44 0.04 0.06 1.59 0.52
34051 1,365 2.85 0.29 0.35 1.19 0.80
34056 1,775 59.00 1.93 4.52 2.34 2.16
SP-Zone 3500
35000 193 2.00 0.17 0.28 1.71 0.89
35001 5,570 3.13 0.33 0.31 0.95 0.72
35006 6,905 124.97 1.58 4.01 2.55 2.38
North 2-Zone 3600 3600 1,438 40.44 1.96 3.98 2.03 1.69
3605 3605 936 20.00 1.10 2.10 1.91 1.53
New Zone 3610 3610 217 16.23 1.06 2.43 2.29 1.91
New Zone 3620 3620 43 2.26 0.66 0.54 0.81 0.77
North 3-Zone 3710 3710 821 15.05 1.06 1.74 1.64 1.43
3720 3720 236 13.70 1.53 2.21 1.44 1.26
Lower-Zone 3800 3800 477 14.99 1.13 1.73 1.53 1.32
A-Zone 3900 3900 795 16.86 1.01 1.51 1.50 1.37
Tenacity-Zone
4000 4000 1,190 15.00 1.09 1.55 1.43 1.19
SP 2-Zone 4100 4100 337 23.62 1.90 3.40 1.79 1.47
External Grade Shells
500 500 185,708 5.00 0.03 0.06 2.59 1.11
501 501 51,596 5.47 0.22 0.30 1.38 0.90
506 506 5,228 105.09 1.93 4.91 2.54 2.15
Total 284,926
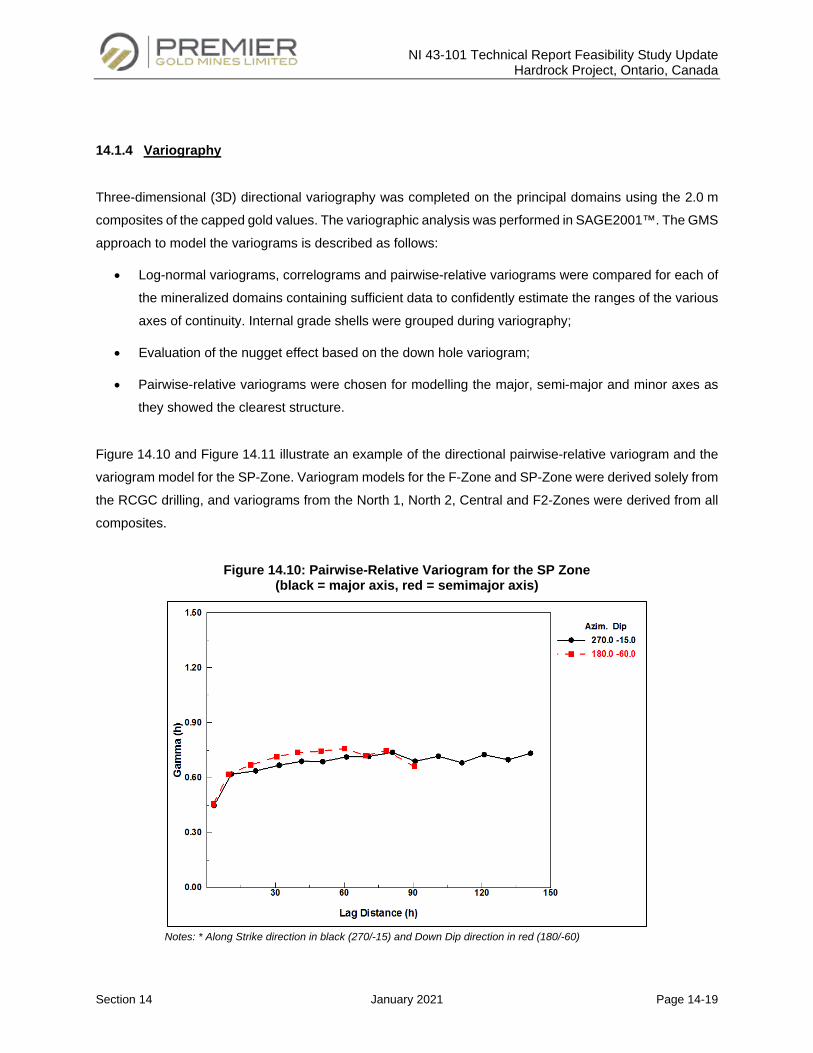
NI 43-101 Technical Report Feasibility Study Update Hardrock Project, Ontario, Canada
Section 14 January 2021 Page 14-19
14.1.4 Variography
Three-dimensional (3D) directional variography was completed on the principal domains using the 2.0 m
composites of the capped gold values. The variographic analysis was performed in SAGE2001™. The GMS
approach to model the variograms is described as follows:
• Log-normal variograms, correlograms and pairwise-relative variograms were compared for each of
the mineralized domains containing sufficient data to confidently estimate the ranges of the various
axes of continuity. Internal grade shells were grouped during variography;
• Evaluation of the nugget effect based on the down hole variogram;
• Pairwise-relative variograms were chosen for modelling the major, semi-major and minor axes as
they showed the clearest structure.
Figure 14.10 and Figure 14.11 illustrate an example of the directional pairwise-relative variogram and the
variogram model for the SP-Zone. Variogram models for the F-Zone and SP-Zone were derived solely from
the RCGC drilling, and variograms from the North 1, North 2, Central and F2-Zones were derived from all
composites.
Figure 14.10: Pairwise-Relative Variogram for the SP Zone (black = major axis, red = semimajor axis)
Notes: * Along Strike direction in black (270/-15) and Down Dip direction in red (180/-60)
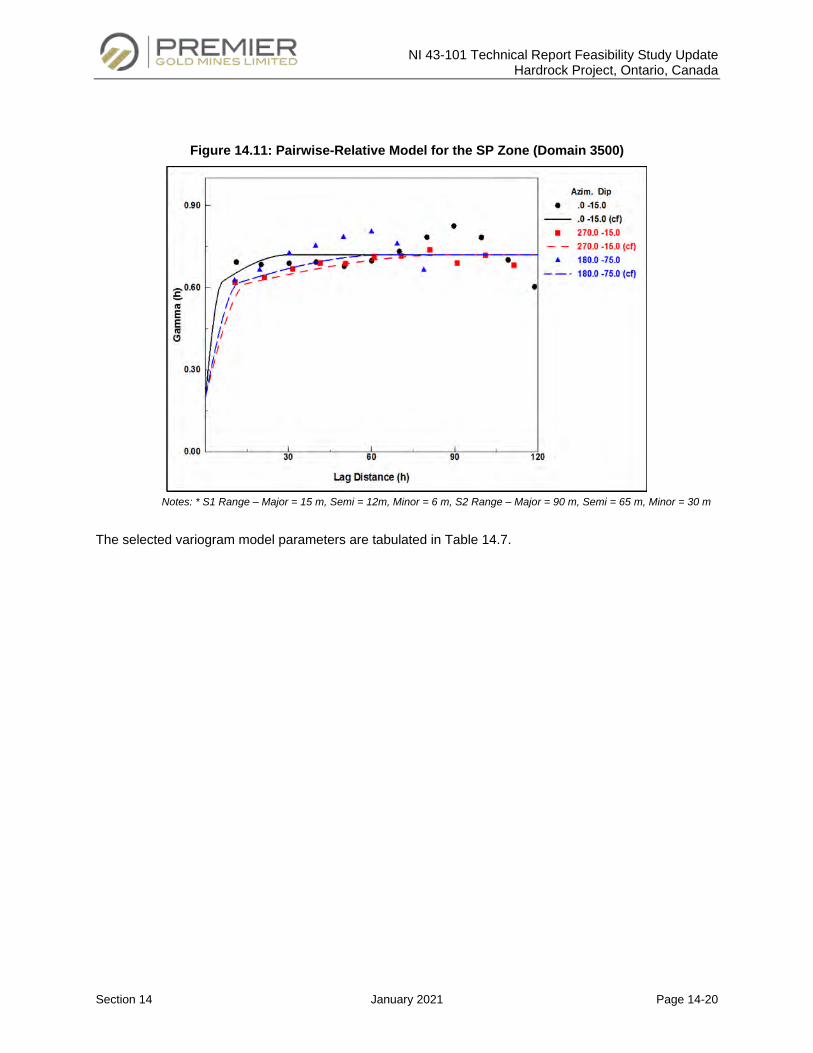
NI 43-101 Technical Report Feasibility Study Update Hardrock Project, Ontario, Canada
Section 14 January 2021 Page 14-20
Figure 14.11: Pairwise-Relative Model for the SP Zone (Domain 3500)
Notes: * S1 Range – Major = 15 m, Semi = 12m, Minor = 6 m, S2 Range – Major = 90 m, Semi = 65 m, Minor = 30 m
The selected variogram model parameters are tabulated in Table 14.7.
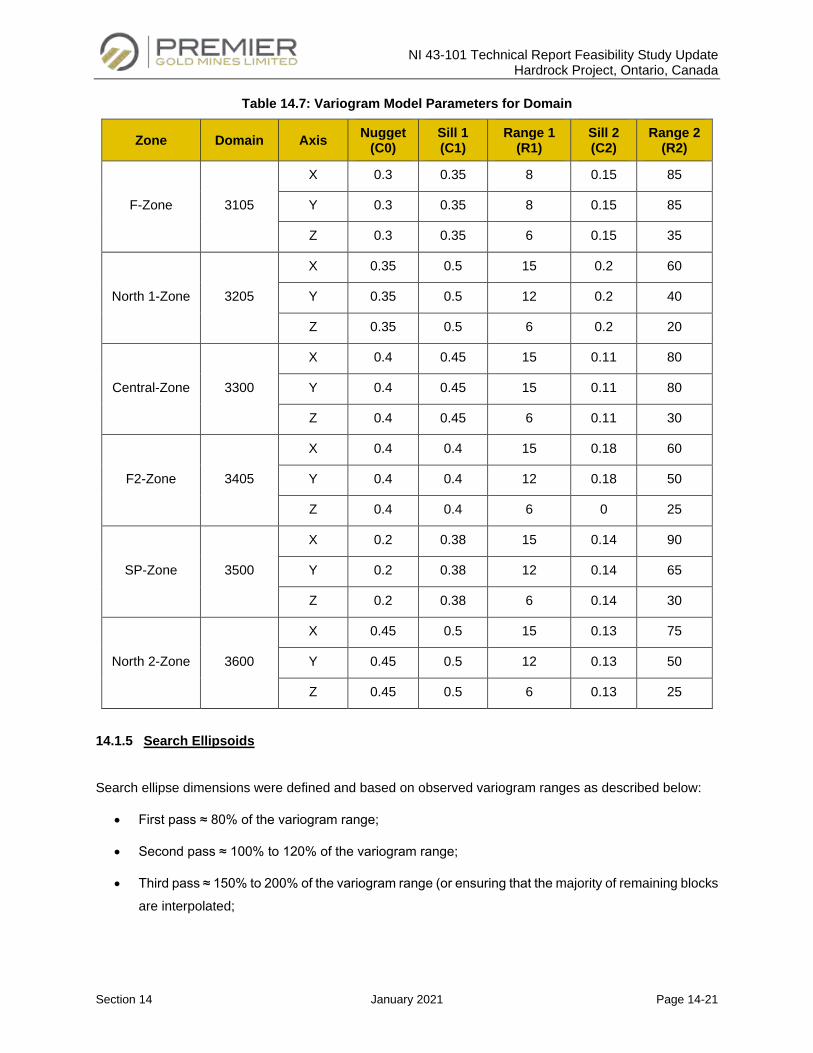
NI 43-101 Technical Report Feasibility Study Update Hardrock Project, Ontario, Canada
Section 14 January 2021 Page 14-21
Table 14.7: Variogram Model Parameters for Domain
Zone Domain Axis Nugget (C0)
Sill 1 (C1)
Range 1 (R1)
Sill 2 (C2)
Range 2 (R2)
F-Zone 3105
X 0.3 0.35 8 0.15 85
Y 0.3 0.35 8 0.15 85
Z 0.3 0.35 6 0.15 35
North 1-Zone 3205
X 0.35 0.5 15 0.2 60
Y 0.35 0.5 12 0.2 40
Z 0.35 0.5 6 0.2 20
Central-Zone 3300
X 0.4 0.45 15 0.11 80
Y 0.4 0.45 15 0.11 80
Z 0.4 0.45 6 0.11 30
F2-Zone 3405
X 0.4 0.4 15 0.18 60
Y 0.4 0.4 12 0.18 50
Z 0.4 0.4 6 0 25
SP-Zone 3500
X 0.2 0.38 15 0.14 90
Y 0.2 0.38 12 0.14 65
Z 0.2 0.38 6 0.14 30
North 2-Zone 3600
X 0.45 0.5 15 0.13 75
Y 0.45 0.5 12 0.13 50
Z 0.45 0.5 6 0.13 25
14.1.5 Search Ellipsoids
Search ellipse dimensions were defined and based on observed variogram ranges as described below:
• First pass ≈ 80% of the variogram range;
• Second pass ≈ 100% to 120% of the variogram range;
• Third pass ≈ 150% to 200% of the variogram range (or ensuring that the majority of remaining blocks
are interpolated;
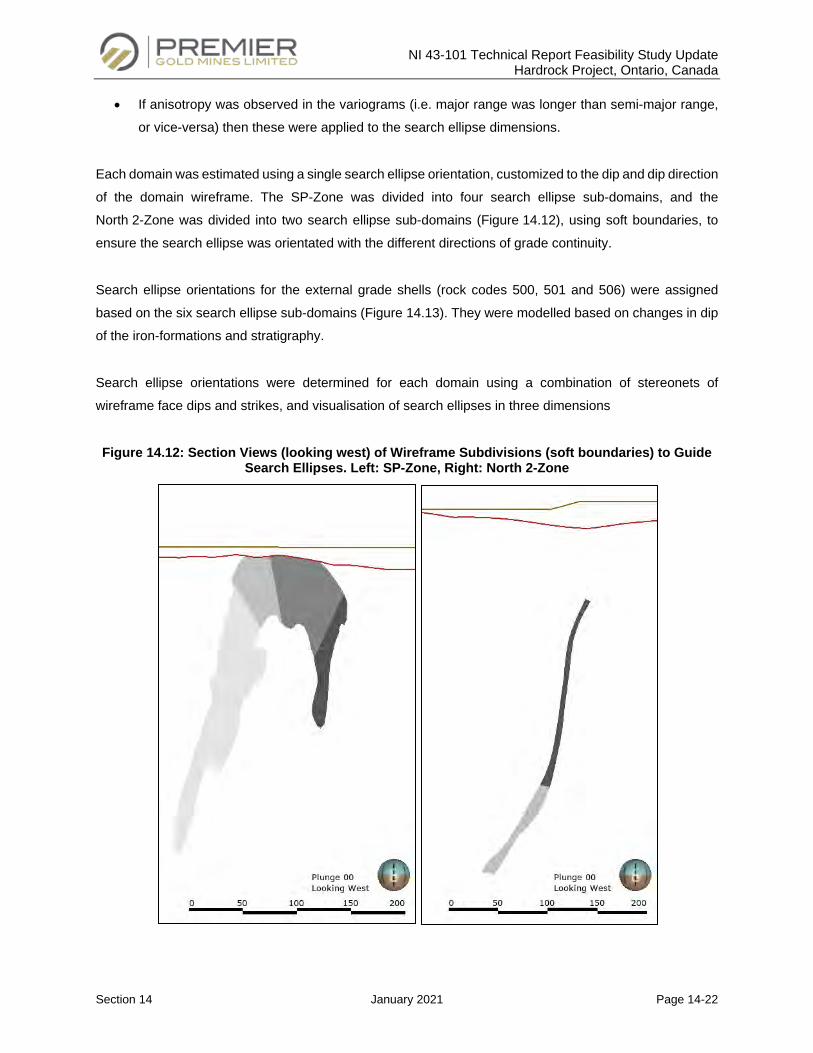
NI 43-101 Technical Report Feasibility Study Update Hardrock Project, Ontario, Canada
Section 14 January 2021 Page 14-22
• If anisotropy was observed in the variograms (i.e. major range was longer than semi-major range,
or vice-versa) then these were applied to the search ellipse dimensions.
Each domain was estimated using a single search ellipse orientation, customized to the dip and dip direction
of the domain wireframe. The SP-Zone was divided into four search ellipse sub-domains, and the
North 2-Zone was divided into two search ellipse sub-domains (Figure 14.12), using soft boundaries, to
ensure the search ellipse was orientated with the different directions of grade continuity.
Search ellipse orientations for the external grade shells (rock codes 500, 501 and 506) were assigned
based on the six search ellipse sub-domains (Figure 14.13). They were modelled based on changes in dip
of the iron-formations and stratigraphy.
Search ellipse orientations were determined for each domain using a combination of stereonets of
wireframe face dips and strikes, and visualisation of search ellipses in three dimensions
Figure 14.12: Section Views (looking west) of Wireframe Subdivisions (soft boundaries) to Guide Search Ellipses. Left: SP-Zone, Right: North 2-Zone
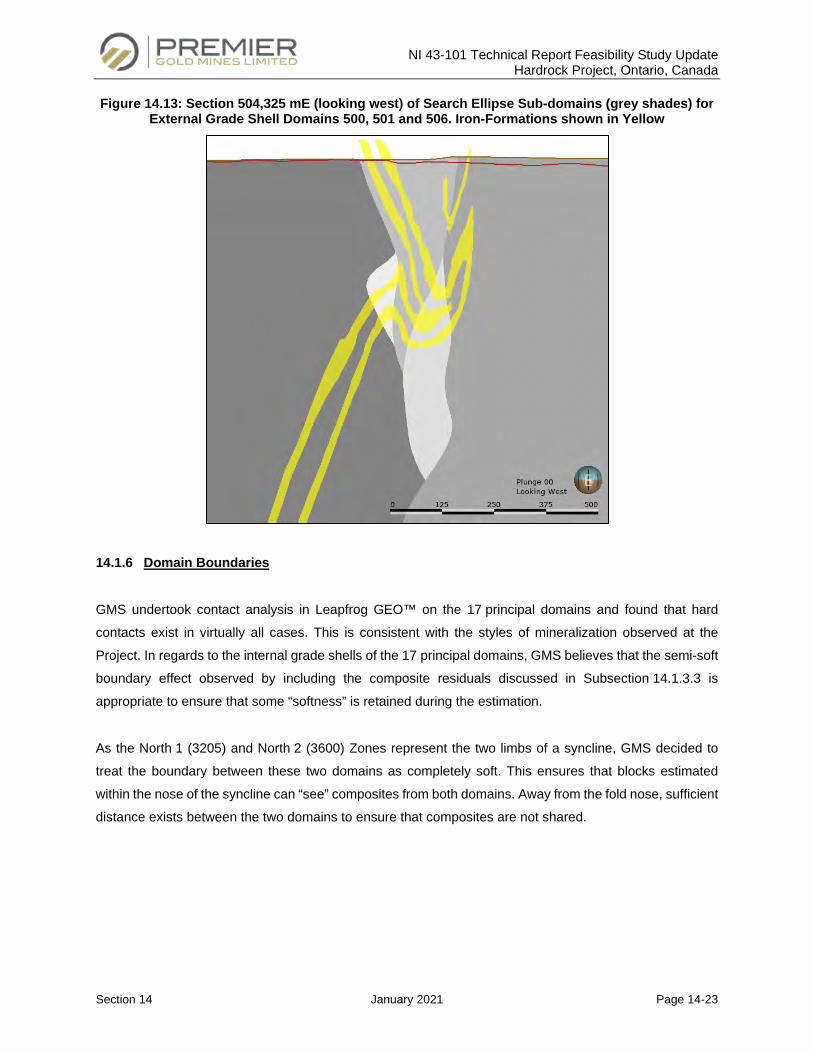
NI 43-101 Technical Report Feasibility Study Update Hardrock Project, Ontario, Canada
Section 14 January 2021 Page 14-23
Figure 14.13: Section 504,325 mE (looking west) of Search Ellipse Sub-domains (grey shades) for External Grade Shell Domains 500, 501 and 506. Iron-Formations shown in Yellow
14.1.6 Domain Boundaries
GMS undertook contact analysis in Leapfrog GEO™ on the 17 principal domains and found that hard
contacts exist in virtually all cases. This is consistent with the styles of mineralization observed at the
Project. In regards to the internal grade shells of the 17 principal domains, GMS believes that the semi-soft
boundary effect observed by including the composite residuals discussed in Subsection 14.1.3.3 is
appropriate to ensure that some “softness” is retained during the estimation.
As the North 1 (3205) and North 2 (3600) Zones represent the two limbs of a syncline, GMS decided to
treat the boundary between these two domains as completely soft. This ensures that blocks estimated
within the nose of the syncline can “see” composites from both domains. Away from the fold nose, sufficient
distance exists between the two domains to ensure that composites are not shared.
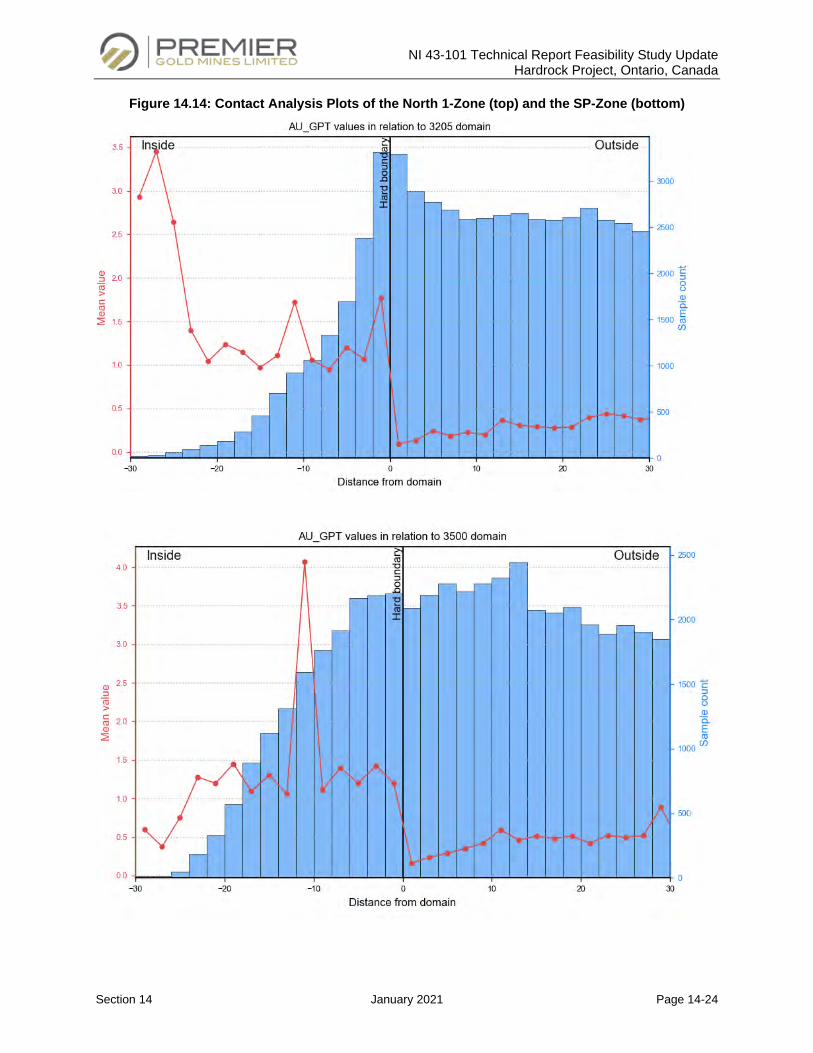
NI 43-101 Technical Report Feasibility Study Update Hardrock Project, Ontario, Canada
Section 14 January 2021 Page 14-24
Figure 14.14: Contact Analysis Plots of the North 1-Zone (top) and the SP-Zone (bottom)
NI 43-101 Technical Report Feasibility Study Update Hardrock Project, Ontario, Canada
Section 14 January 2021 Page 14-25
GMS applied hard boundaries during estimation for all domains apart from the North 1 and the North 2
Zones (as previously mentioned). Soft boundaries were used between the search ellipse sub-domains
(SP-Zone, North 1-Zone and external grade shells). GMS also ran sensitivity grade estimations removing
the internal grade shells for the 17 principal domains, and the results are shown in Subsection 14.1.15.
14.1.7 Treatment of High Grades
In order to control the influence of isolated high-grade composites during grade estimation, GMS used high-
grade restraining (also know as “high-grade restraint” or “transition”). This method involves applying a
second, smaller internal search ellipse to restrict the influence of high-grade composites above a user-
defined value (a “threshold”).
High-grade thresholds were chosen based on probability plots of capped gold grade composites with the
objective of identify remaining outliers that require additional restraining. The size of the search restriction
was determined as follows:
• Downhole variography indicated that the majority of variability is accounted for in the first 5 m in the
sub-horizontal direction;
• Dimensions for the high-grade thresholds were kept consistent for the each of the three passes;
• Anisotropy was applied where necessary;
• High-grade threshold dimensions are generally ½ the first pass dimensions.
In the 17 principal domains, this method was applied only in the second and third estimation passes. The
first pass was deemed sufficiently constrained in terms of search ellipse dimensions and other estimation
parameters to not require high-grade restraining. For the external grade shells, high-grade restraining was
retained for all estimation passes as these zones do not demonstrate sufficient grade continuity between
drill sections and require a more conservative approach.
Table 14.8 summarizes the parameters of the final ellipsoids and threshold dimensions used for
interpolation.
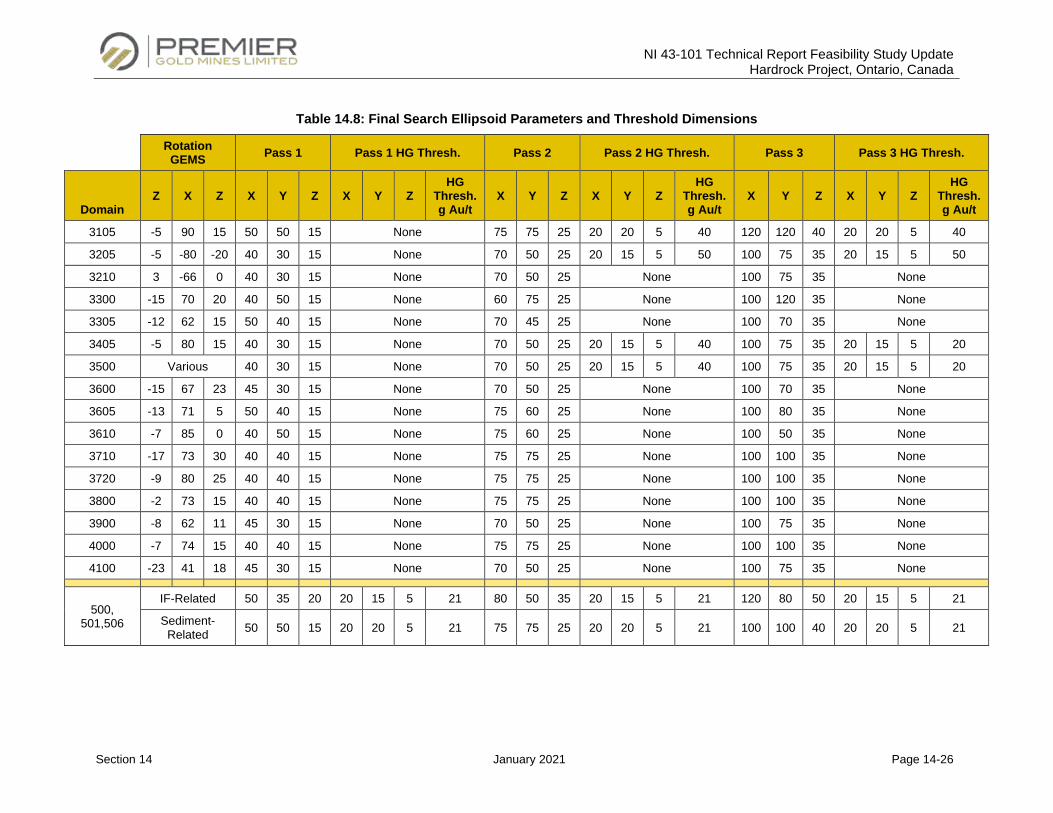
NI 43-101 Technical Report Feasibility Study Update Hardrock Project, Ontario, Canada
Section 14 January 2021 Page 14-26
Table 14.8: Final Search Ellipsoid Parameters and Threshold Dimensions
Rotation GEMS Pass 1 Pass 1 HG Thresh. Pass 2 Pass 2 HG Thresh. Pass 3 Pass 3 HG Thresh.
Domain Z X Z X Y Z X Y Z
HG Thresh. g Au/t
X Y Z X Y Z HG
Thresh. g Au/t
X Y Z X Y Z HG
Thresh. g Au/t
3105 -5 90 15 50 50 15 None 75 75 25 20 20 5 40 120 120 40 20 20 5 40
3205 -5 -80 -20 40 30 15 None 70 50 25 20 15 5 50 100 75 35 20 15 5 50
3210 3 -66 0 40 30 15 None 70 50 25 None 100 75 35 None
3300 -15 70 20 40 50 15 None 60 75 25 None 100 120 35 None
3305 -12 62 15 50 40 15 None 70 45 25 None 100 70 35 None
3405 -5 80 15 40 30 15 None 70 50 25 20 15 5 40 100 75 35 20 15 5 20
3500 Various 40 30 15 None 70 50 25 20 15 5 40 100 75 35 20 15 5 20
3600 -15 67 23 45 30 15 None 70 50 25 None 100 70 35 None
3605 -13 71 5 50 40 15 None 75 60 25 None 100 80 35 None
3610 -7 85 0 40 50 15 None 75 60 25 None 100 50 35 None
3710 -17 73 30 40 40 15 None 75 75 25 None 100 100 35 None
3720 -9 80 25 40 40 15 None 75 75 25 None 100 100 35 None
3800 -2 73 15 40 40 15 None 75 75 25 None 100 100 35 None
3900 -8 62 11 45 30 15 None 70 50 25 None 100 75 35 None
4000 -7 74 15 40 40 15 None 75 75 25 None 100 100 35 None
4100 -23 41 18 45 30 15 None 70 50 25 None 100 75 35 None
500, 501,506
IF-Related 50 35 20 20 15 5 21 80 50 35 20 15 5 21 120 80 50 20 15 5 21
Sediment-Related 50 50 15 20 20 5 21 75 75 25 20 20 5 21 100 100 40 20 20 5 21
NI 43-101 Technical Report Feasibility Study Update Hardrock Project, Ontario, Canada
Section 14 January 2021 Page 14-27
14.1.8 Bulk Density Data
For the 2019 MRE update, a total of 6,937 bulk density measurements were provided by GGM and
integrated into the Project database. Bulk density measurements were taken at the Geraldton core shack
by GGM staff. Statistical analysis of the density data by estimation domain showed that slight differences
exist between mineralized and unmineralized samples within a given domain (based on the internal grade
shells). This could be the result of the varying levels of sulphide associated with mineralization affecting the
overall bulk density.
For the 17 principal domains, GMS assigned the bulk density by estimation domain. For the external grade
shells, bulk density was assigned based on the 2016 lithology interpretation. Median values were used to
reduce the influence of outliers.
A density of 2.00 g/cm3 was assigned to the overburden. A density of 2.05 g/cm3 was assigned to the
tailings, 1.60 g/cm3 to organics and 1.80 g/cm3 to fill material.
GGM completed a study of underground workings in 2016, which were classified by confidence level and
backfill status. Densities ranging from 0.27 g/cm3 up to 2.08 g/cm3 were assigned based on the following
types of backfill: Open (filled with water); Waste (mix of mining waste and reject from the processing plant;
and Sand. These remain unchanged from the 2016 MRE.
GMS is of the opinion that the bulk density databases is of sufficient quality for Mineral Resource estimation
at the Hardrock Deposit.
Table 14.9 presents the bulk density values assigned to the block model.
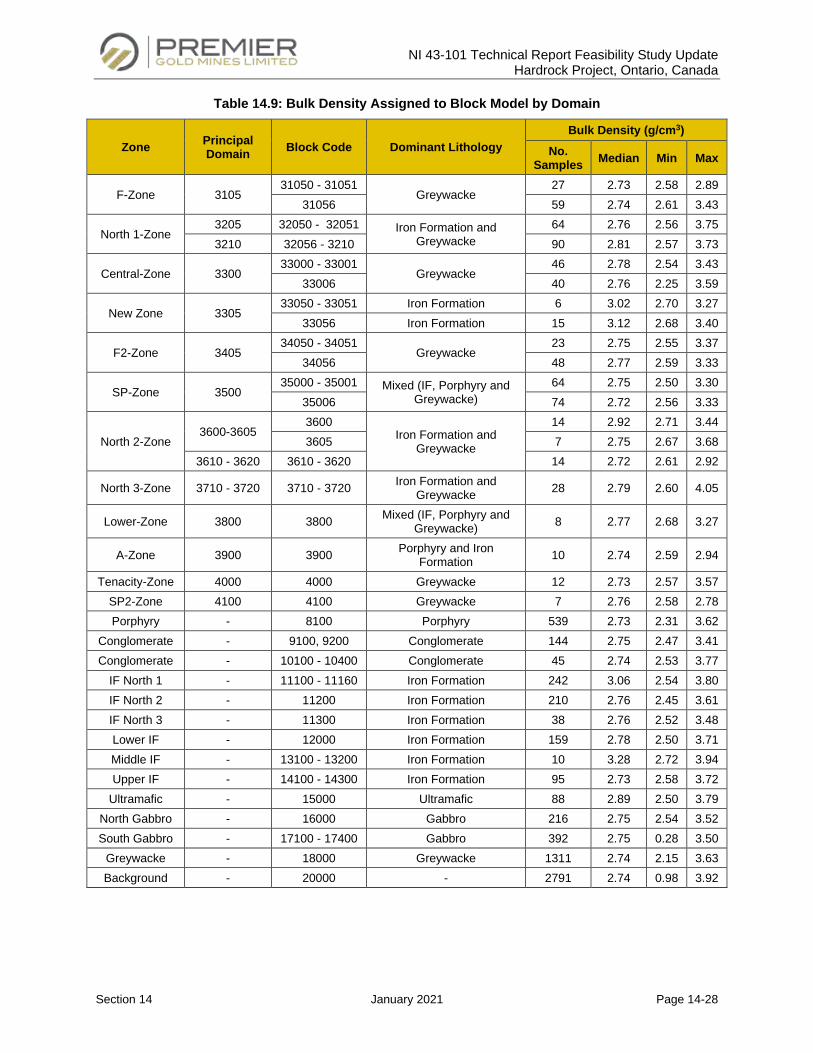
NI 43-101 Technical Report Feasibility Study Update Hardrock Project, Ontario, Canada
Section 14 January 2021 Page 14-28
Table 14.9: Bulk Density Assigned to Block Model by Domain
Zone Principal Domain Block Code Dominant Lithology
Bulk Density (g/cm3) No.
Samples Median Min Max
F-Zone 3105 31050 - 31051
Greywacke 27 2.73 2.58 2.89
31056 59 2.74 2.61 3.43
North 1-Zone 3205 32050 - 32051 Iron Formation and
Greywacke 64 2.76 2.56 3.75
3210 32056 - 3210 90 2.81 2.57 3.73
Central-Zone 3300 33000 - 33001
Greywacke 46 2.78 2.54 3.43
33006 40 2.76 2.25 3.59
New Zone 3305 33050 - 33051 Iron Formation 6 3.02 2.70 3.27
33056 Iron Formation 15 3.12 2.68 3.40
F2-Zone 3405 34050 - 34051
Greywacke 23 2.75 2.55 3.37
34056 48 2.77 2.59 3.33
SP-Zone 3500 35000 - 35001 Mixed (IF, Porphyry and
Greywacke) 64 2.75 2.50 3.30
35006 74 2.72 2.56 3.33
North 2-Zone 3600-3605
3600 Iron Formation and
Greywacke
14 2.92 2.71 3.44 3605 7 2.75 2.67 3.68
3610 - 3620 3610 - 3620 14 2.72 2.61 2.92
North 3-Zone 3710 - 3720 3710 - 3720 Iron Formation and Greywacke 28 2.79 2.60 4.05
Lower-Zone 3800 3800 Mixed (IF, Porphyry and Greywacke) 8 2.77 2.68 3.27
A-Zone 3900 3900 Porphyry and Iron Formation 10 2.74 2.59 2.94
Tenacity-Zone 4000 4000 Greywacke 12 2.73 2.57 3.57 SP2-Zone 4100 4100 Greywacke 7 2.76 2.58 2.78 Porphyry - 8100 Porphyry 539 2.73 2.31 3.62
Conglomerate - 9100, 9200 Conglomerate 144 2.75 2.47 3.41 Conglomerate - 10100 - 10400 Conglomerate 45 2.74 2.53 3.77
IF North 1 - 11100 - 11160 Iron Formation 242 3.06 2.54 3.80 IF North 2 - 11200 Iron Formation 210 2.76 2.45 3.61 IF North 3 - 11300 Iron Formation 38 2.76 2.52 3.48 Lower IF - 12000 Iron Formation 159 2.78 2.50 3.71 Middle IF - 13100 - 13200 Iron Formation 10 3.28 2.72 3.94 Upper IF - 14100 - 14300 Iron Formation 95 2.73 2.58 3.72
Ultramafic - 15000 Ultramafic 88 2.89 2.50 3.79 North Gabbro - 16000 Gabbro 216 2.75 2.54 3.52 South Gabbro - 17100 - 17400 Gabbro 392 2.75 0.28 3.50
Greywacke - 18000 Greywacke 1311 2.74 2.15 3.63 Background - 20000 - 2791 2.74 0.98 3.92
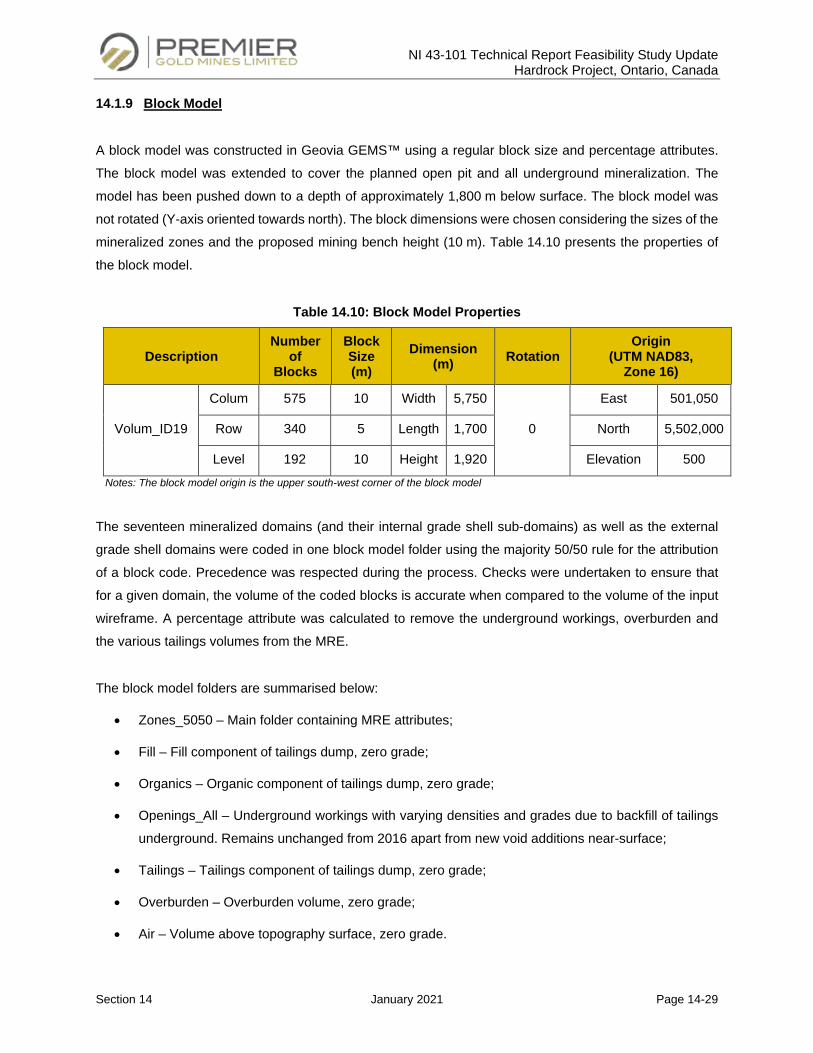
NI 43-101 Technical Report Feasibility Study Update Hardrock Project, Ontario, Canada
Section 14 January 2021 Page 14-29
14.1.9 Block Model
A block model was constructed in Geovia GEMS™ using a regular block size and percentage attributes.
The block model was extended to cover the planned open pit and all underground mineralization. The
model has been pushed down to a depth of approximately 1,800 m below surface. The block model was
not rotated (Y-axis oriented towards north). The block dimensions were chosen considering the sizes of the
mineralized zones and the proposed mining bench height (10 m). Table 14.10 presents the properties of
the block model.
Table 14.10: Block Model Properties
Description Number
of Blocks
Block Size (m)
Dimension (m) Rotation
Origin (UTM NAD83,
Zone 16)
Volum_ID19
Colum 575 10 Width 5,750
0
East 501,050
Row 340 5 Length 1,700 North 5,502,000
Level 192 10 Height 1,920 Elevation 500 Notes: The block model origin is the upper south-west corner of the block model
The seventeen mineralized domains (and their internal grade shell sub-domains) as well as the external
grade shell domains were coded in one block model folder using the majority 50/50 rule for the attribution
of a block code. Precedence was respected during the process. Checks were undertaken to ensure that
for a given domain, the volume of the coded blocks is accurate when compared to the volume of the input
wireframe. A percentage attribute was calculated to remove the underground workings, overburden and
the various tailings volumes from the MRE.
The block model folders are summarised below:
• Zones_5050 – Main folder containing MRE attributes;
• Fill – Fill component of tailings dump, zero grade;
• Organics – Organic component of tailings dump, zero grade;
• Openings_All – Underground workings with varying densities and grades due to backfill of tailings
underground. Remains unchanged from 2016 apart from new void additions near-surface;
• Tailings – Tailings component of tailings dump, zero grade;
• Overburden – Overburden volume, zero grade;
• Air – Volume above topography surface, zero grade.
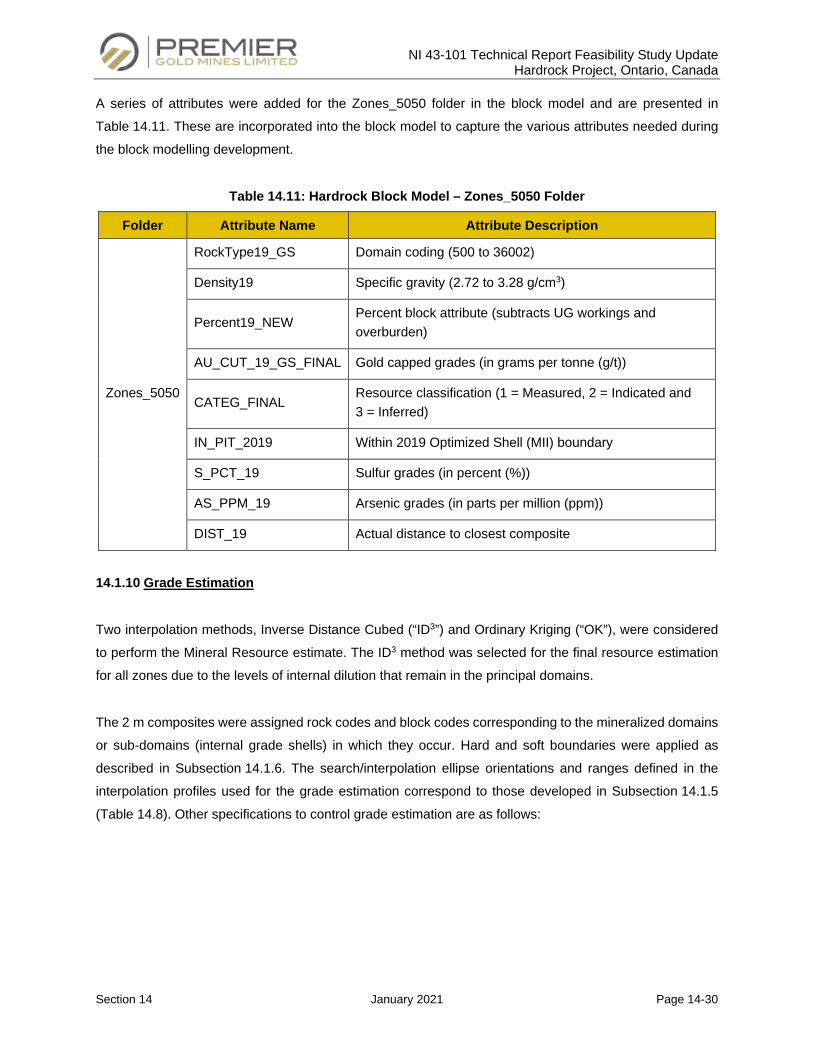
NI 43-101 Technical Report Feasibility Study Update Hardrock Project, Ontario, Canada
Section 14 January 2021 Page 14-30
A series of attributes were added for the Zones_5050 folder in the block model and are presented in
Table 14.11. These are incorporated into the block model to capture the various attributes needed during
the block modelling development.
Table 14.11: Hardrock Block Model – Zones_5050 Folder
Folder Attribute Name Attribute Description
Zones_5050
RockType19_GS Domain coding (500 to 36002)
Density19 Specific gravity (2.72 to 3.28 g/cm3)
Percent19_NEW Percent block attribute (subtracts UG workings and overburden)
AU_CUT_19_GS_FINAL Gold capped grades (in grams per tonne (g/t))
CATEG_FINAL Resource classification (1 = Measured, 2 = Indicated and 3 = Inferred)
IN_PIT_2019 Within 2019 Optimized Shell (MII) boundary
S_PCT_19 Sulfur grades (in percent (%))
AS_PPM_19 Arsenic grades (in parts per million (ppm))
DIST_19 Actual distance to closest composite
14.1.10 Grade Estimation
Two interpolation methods, Inverse Distance Cubed (“ID3”) and Ordinary Kriging (“OK”), were considered
to perform the Mineral Resource estimate. The ID3 method was selected for the final resource estimation
for all zones due to the levels of internal dilution that remain in the principal domains.
The 2 m composites were assigned rock codes and block codes corresponding to the mineralized domains
or sub-domains (internal grade shells) in which they occur. Hard and soft boundaries were applied as
described in Subsection 14.1.6. The search/interpolation ellipse orientations and ranges defined in the
interpolation profiles used for the grade estimation correspond to those developed in Subsection 14.1.5
(Table 14.8). Other specifications to control grade estimation are as follows:
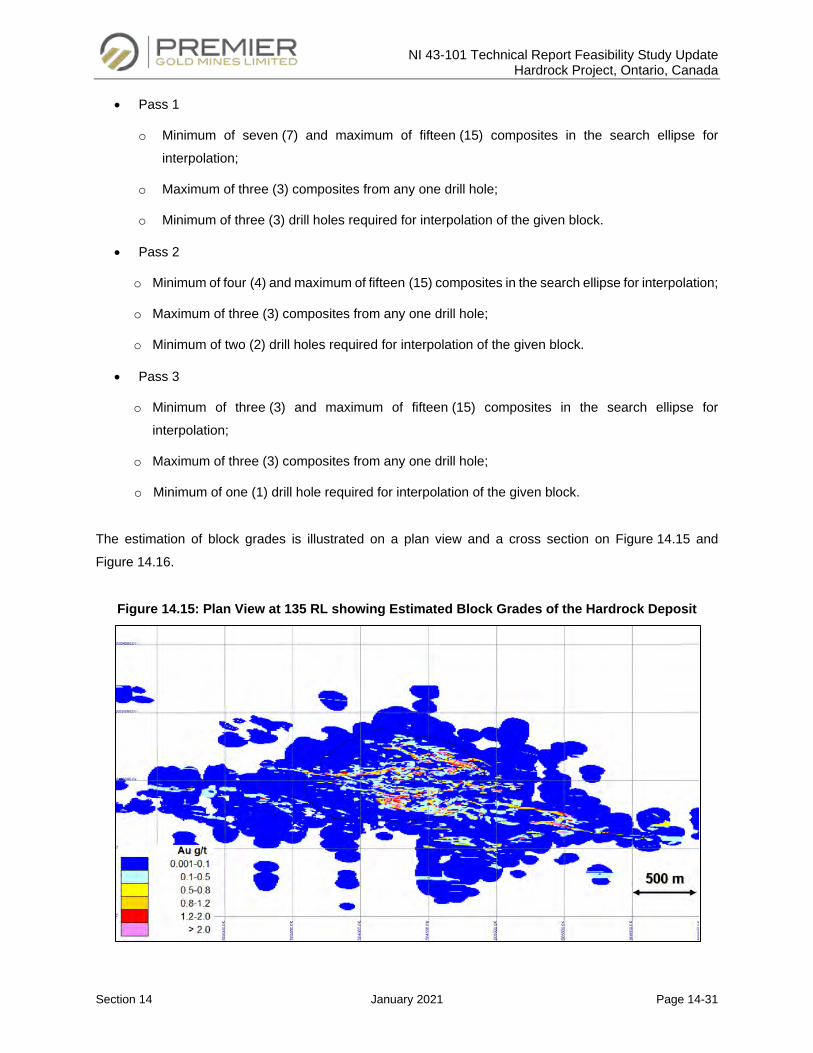
NI 43-101 Technical Report Feasibility Study Update Hardrock Project, Ontario, Canada
Section 14 January 2021 Page 14-31
• Pass 1
o Minimum of seven (7) and maximum of fifteen (15) composites in the search ellipse for
interpolation;
o Maximum of three (3) composites from any one drill hole;
o Minimum of three (3) drill holes required for interpolation of the given block.
• Pass 2
o Minimum of four (4) and maximum of fifteen (15) composites in the search ellipse for interpolation;
o Maximum of three (3) composites from any one drill hole;
o Minimum of two (2) drill holes required for interpolation of the given block.
• Pass 3
o Minimum of three (3) and maximum of fifteen (15) composites in the search ellipse for
interpolation;
o Maximum of three (3) composites from any one drill hole;
o Minimum of one (1) drill hole required for interpolation of the given block.
The estimation of block grades is illustrated on a plan view and a cross section on Figure 14.15 and
Figure 14.16.
Figure 14.15: Plan View at 135 RL showing Estimated Block Grades of the Hardrock Deposit
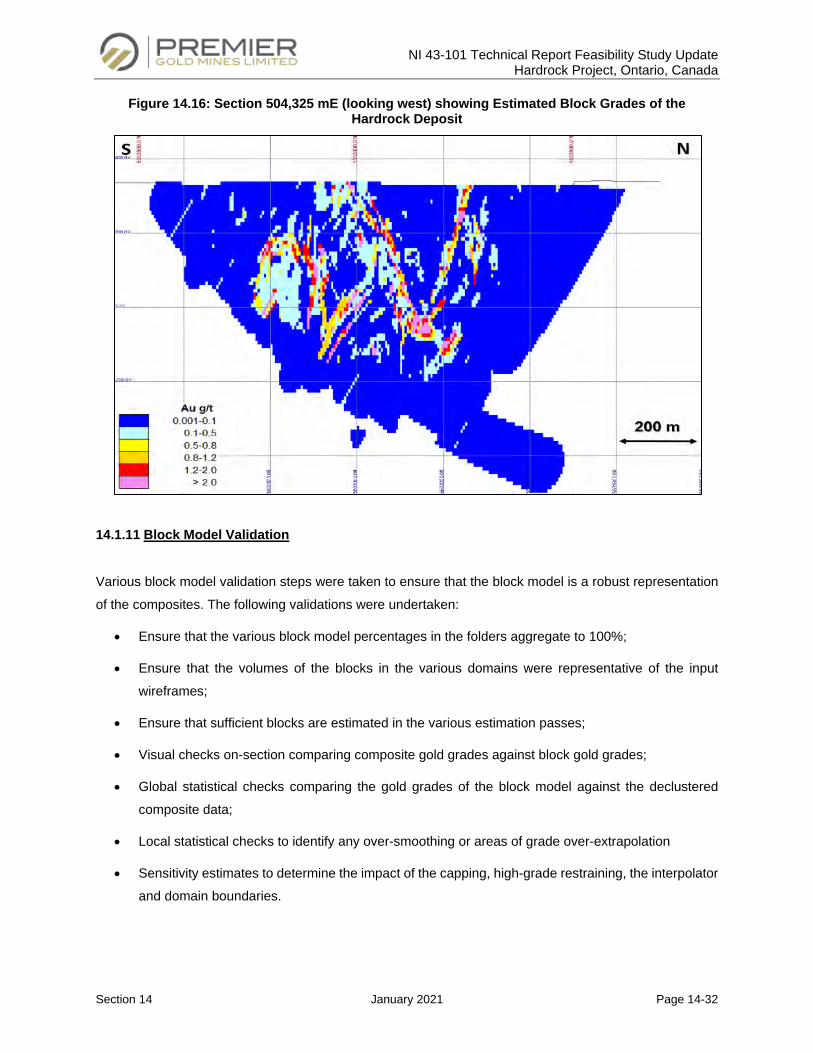
NI 43-101 Technical Report Feasibility Study Update Hardrock Project, Ontario, Canada
Section 14 January 2021 Page 14-32
Figure 14.16: Section 504,325 mE (looking west) showing Estimated Block Grades of the Hardrock Deposit
14.1.11 Block Model Validation
Various block model validation steps were taken to ensure that the block model is a robust representation
of the composites. The following validations were undertaken:
• Ensure that the various block model percentages in the folders aggregate to 100%;
• Ensure that the volumes of the blocks in the various domains were representative of the input
wireframes;
• Ensure that sufficient blocks are estimated in the various estimation passes;
• Visual checks on-section comparing composite gold grades against block gold grades;
• Global statistical checks comparing the gold grades of the block model against the declustered
composite data;
• Local statistical checks to identify any over-smoothing or areas of grade over-extrapolation
• Sensitivity estimates to determine the impact of the capping, high-grade restraining, the interpolator
and domain boundaries.
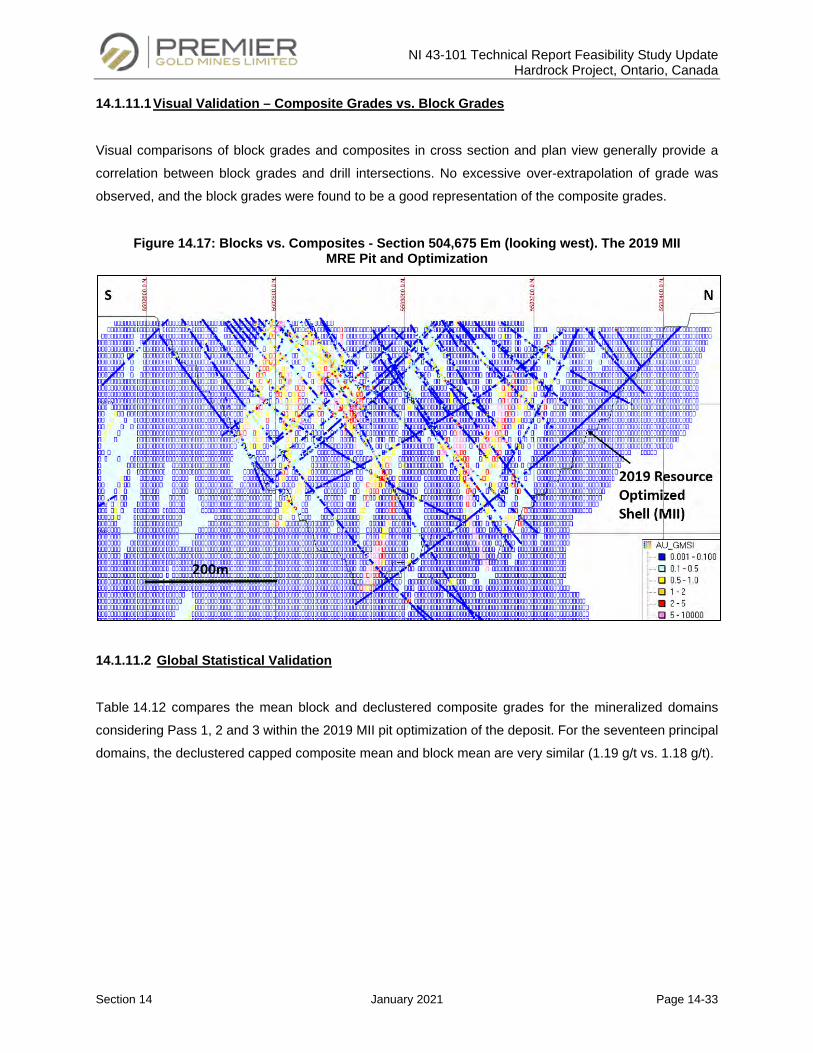
NI 43-101 Technical Report Feasibility Study Update Hardrock Project, Ontario, Canada
Section 14 January 2021 Page 14-33
14.1.11.1 Visual Validation – Composite Grades vs. Block Grades
Visual comparisons of block grades and composites in cross section and plan view generally provide a
correlation between block grades and drill intersections. No excessive over-extrapolation of grade was
observed, and the block grades were found to be a good representation of the composite grades.
Figure 14.17: Blocks vs. Composites - Section 504,675 Em (looking west). The 2019 MII MRE Pit and Optimization
14.1.11.2 Global Statistical Validation
Table 14.12 compares the mean block and declustered composite grades for the mineralized domains
considering Pass 1, 2 and 3 within the 2019 MII pit optimization of the deposit. For the seventeen principal
domains, the declustered capped composite mean and block mean are very similar (1.19 g/t vs. 1.18 g/t).
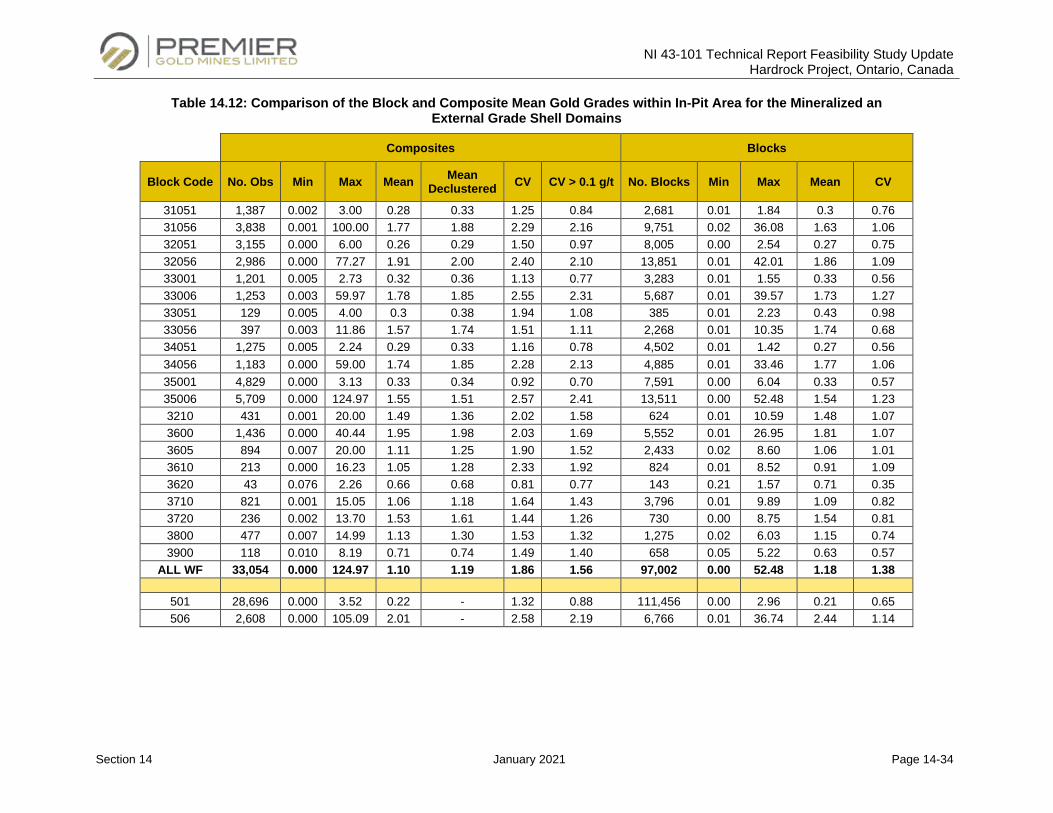
NI 43-101 Technical Report Feasibility Study Update Hardrock Project, Ontario, Canada
Section 14 January 2021 Page 14-34
Table 14.12: Comparison of the Block and Composite Mean Gold Grades within In-Pit Area for the Mineralized an External Grade Shell Domains
Composites Blocks
Block Code No. Obs Min Max Mean Mean Declustered CV CV > 0.1 g/t No. Blocks Min Max Mean CV
31051 1,387 0.002 3.00 0.28 0.33 1.25 0.84 2,681 0.01 1.84 0.3 0.76 31056 3,838 0.001 100.00 1.77 1.88 2.29 2.16 9,751 0.02 36.08 1.63 1.06 32051 3,155 0.000 6.00 0.26 0.29 1.50 0.97 8,005 0.00 2.54 0.27 0.75 32056 2,986 0.000 77.27 1.91 2.00 2.40 2.10 13,851 0.01 42.01 1.86 1.09 33001 1,201 0.005 2.73 0.32 0.36 1.13 0.77 3,283 0.01 1.55 0.33 0.56 33006 1,253 0.003 59.97 1.78 1.85 2.55 2.31 5,687 0.01 39.57 1.73 1.27 33051 129 0.005 4.00 0.3 0.38 1.94 1.08 385 0.01 2.23 0.43 0.98 33056 397 0.003 11.86 1.57 1.74 1.51 1.11 2,268 0.01 10.35 1.74 0.68 34051 1,275 0.005 2.24 0.29 0.33 1.16 0.78 4,502 0.01 1.42 0.27 0.56 34056 1,183 0.000 59.00 1.74 1.85 2.28 2.13 4,885 0.01 33.46 1.77 1.06 35001 4,829 0.000 3.13 0.33 0.34 0.92 0.70 7,591 0.00 6.04 0.33 0.57 35006 5,709 0.000 124.97 1.55 1.51 2.57 2.41 13,511 0.00 52.48 1.54 1.23 3210 431 0.001 20.00 1.49 1.36 2.02 1.58 624 0.01 10.59 1.48 1.07 3600 1,436 0.000 40.44 1.95 1.98 2.03 1.69 5,552 0.01 26.95 1.81 1.07 3605 894 0.007 20.00 1.11 1.25 1.90 1.52 2,433 0.02 8.60 1.06 1.01 3610 213 0.000 16.23 1.05 1.28 2.33 1.92 824 0.01 8.52 0.91 1.09 3620 43 0.076 2.26 0.66 0.68 0.81 0.77 143 0.21 1.57 0.71 0.35 3710 821 0.001 15.05 1.06 1.18 1.64 1.43 3,796 0.01 9.89 1.09 0.82 3720 236 0.002 13.70 1.53 1.61 1.44 1.26 730 0.00 8.75 1.54 0.81 3800 477 0.007 14.99 1.13 1.30 1.53 1.32 1,275 0.02 6.03 1.15 0.74 3900 118 0.010 8.19 0.71 0.74 1.49 1.40 658 0.05 5.22 0.63 0.57
ALL WF 33,054 0.000 124.97 1.10 1.19 1.86 1.56 97,002 0.00 52.48 1.18 1.38
501 28,696 0.000 3.52 0.22 - 1.32 0.88 111,456 0.00 2.96 0.21 0.65 506 2,608 0.000 105.09 2.01 - 2.58 2.19 6,766 0.01 36.74 2.44 1.14
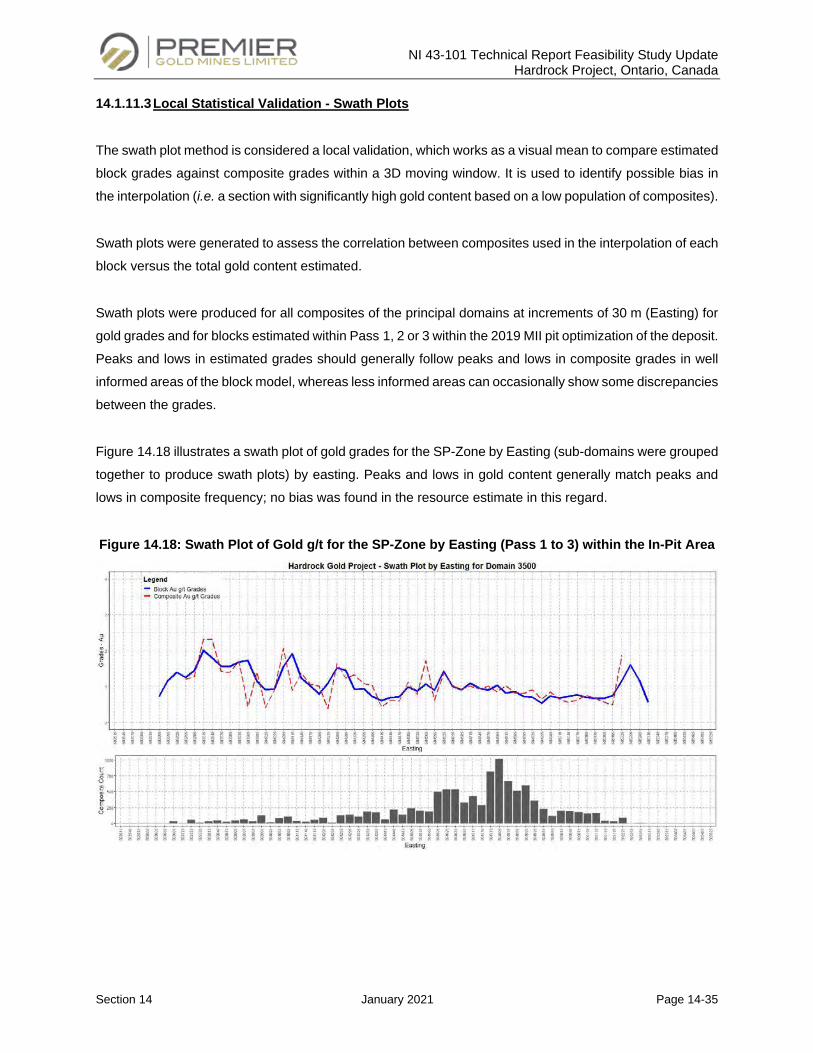
NI 43-101 Technical Report Feasibility Study Update Hardrock Project, Ontario, Canada
Section 14 January 2021 Page 14-35
14.1.11.3 Local Statistical Validation - Swath Plots
The swath plot method is considered a local validation, which works as a visual mean to compare estimated
block grades against composite grades within a 3D moving window. It is used to identify possible bias in
the interpolation (i.e. a section with significantly high gold content based on a low population of composites).
Swath plots were generated to assess the correlation between composites used in the interpolation of each
block versus the total gold content estimated.
Swath plots were produced for all composites of the principal domains at increments of 30 m (Easting) for
gold grades and for blocks estimated within Pass 1, 2 or 3 within the 2019 MII pit optimization of the deposit.
Peaks and lows in estimated grades should generally follow peaks and lows in composite grades in well
informed areas of the block model, whereas less informed areas can occasionally show some discrepancies
between the grades.
Figure 14.18 illustrates a swath plot of gold grades for the SP-Zone by Easting (sub-domains were grouped
together to produce swath plots) by easting. Peaks and lows in gold content generally match peaks and
lows in composite frequency; no bias was found in the resource estimate in this regard.
Figure 14.18: Swath Plot of Gold g/t for the SP-Zone by Easting (Pass 1 to 3) within the In-Pit Area
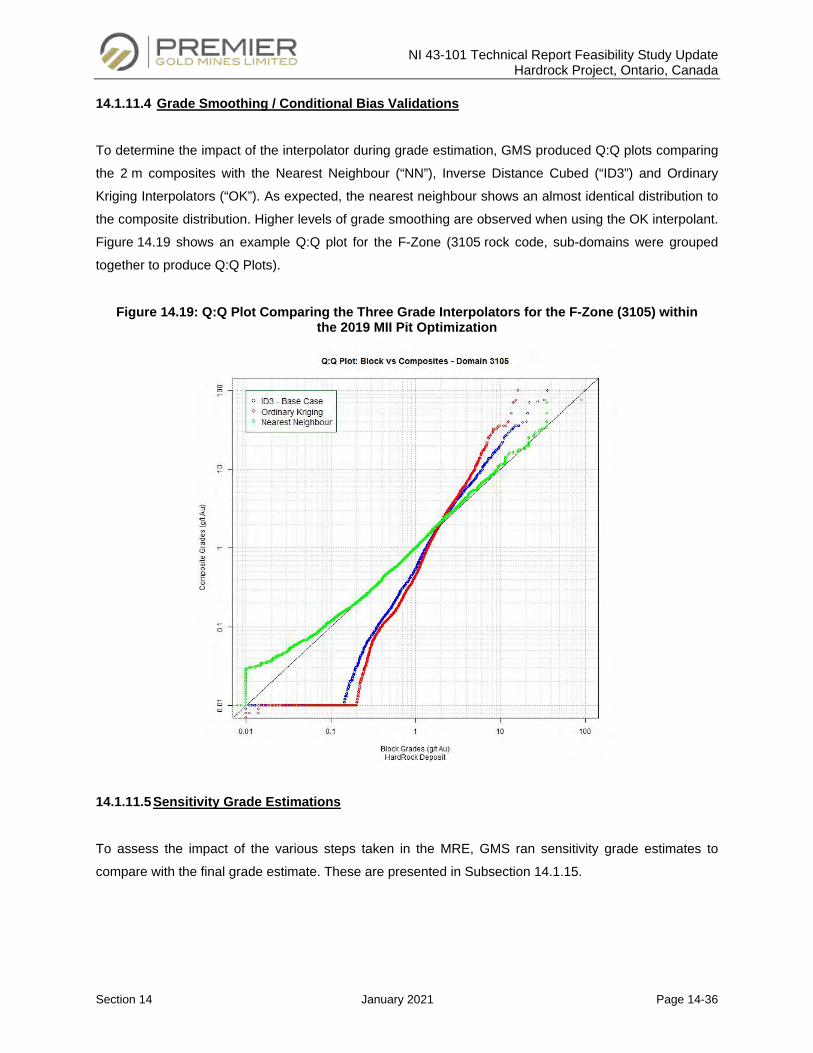
NI 43-101 Technical Report Feasibility Study Update Hardrock Project, Ontario, Canada
Section 14 January 2021 Page 14-36
14.1.11.4 Grade Smoothing / Conditional Bias Validations
To determine the impact of the interpolator during grade estimation, GMS produced Q:Q plots comparing
the 2 m composites with the Nearest Neighbour (“NN”), Inverse Distance Cubed (“ID3”) and Ordinary
Kriging Interpolators (“OK”). As expected, the nearest neighbour shows an almost identical distribution to
the composite distribution. Higher levels of grade smoothing are observed when using the OK interpolant.
Figure 14.19 shows an example Q:Q plot for the F-Zone (3105 rock code, sub-domains were grouped
together to produce Q:Q Plots).
Figure 14.19: Q:Q Plot Comparing the Three Grade Interpolators for the F-Zone (3105) within the 2019 MII Pit Optimization
14.1.11.5 Sensitivity Grade Estimations
To assess the impact of the various steps taken in the MRE, GMS ran sensitivity grade estimates to
compare with the final grade estimate. These are presented in Subsection 14.1.15.
NI 43-101 Technical Report Feasibility Study Update Hardrock Project, Ontario, Canada
Section 14 January 2021 Page 14-37
14.1.11.6 Discussion on Block Model Validation
Globally, the Hardrock block model is a good representation of composite gold grades used in the
estimation. Global statistical validations show no significant over/under-estimation of gold grades. Local
statistical validations illustrate good local correlation between the interpolated blocks compared to the
composite for gold grades, and no overestimation of grades was observed during the validation of estimated
grades for the Hardrock gold deposit.
14.1.12 Mineral Resource Classification
14.1.12.1 Mineral Resource Classification Definition
The resource classification definitions used for this report are those published by the Canadian Institute of
Mining, Metallurgy and Petroleum (“CIM”). The “CIM Definition Standards on Mineral Resources and
Mineral Reserves”, prepared by the CIM Standing Committee on Reserve Definitions and adopted by the
CIM council on May 10, 2014, provides standards for the classification of Mineral Resources and Mineral
Reserve estimates into various categories. The category to which a Resource or Reserve estimate is
assigned depends on the level of confidence in the geological information available on the mineral deposit,
the quality and quantity of data available, the level of detail of the technical and economic information which
has been generated about the deposit and the interpretation of that data and information. Under CIM
Definition Standards:
A “Measured Mineral Resource” is that part of a Mineral Resource for which quantity, grade or quality,
densities, shape, and physical characteristics are estimated with confidence sufficient to allow the
application of modifying factors to support detailed mine planning and final evaluation of the economic
viability of the deposit. Geological evidence is derived from detailed and reliable exploration, sampling and
testing and is sufficient to confirm geological and grade or quality continuity between points of observation.
A Measured Mineral Resource has a higher level of confidence than that applying to either an Indicated
Mineral Resource or an Inferred Mineral Resources. It may be converted to a Proven Mineral Reserve or
to a Probable Mineral Reserve.
An “Indicated Mineral Resource” is that part of a Mineral Resource for which quantity, grade or quality,
densities, shape and physical characteristics are estimated with sufficient confidence to allow the
application of modifying factors in sufficient detail to support mine planning and evaluation of the economic
viability of the deposit. An Indicated Mineral Resource has a lower level of confidence than that applying to
a Measured Mineral Resource and may only be converted to a Probably Mineral Reserve.
NI 43-101 Technical Report Feasibility Study Update Hardrock Project, Ontario, Canada
Section 14 January 2021 Page 14-38
An “Inferred Mineral Resource” has a lower level of confidence than that applying to an Indicated Mineral
Resource and must not be converted to a Mineral Reserve. It is reasonably expected that the majority of
Inferred Mineral Resources could be upgraded to Indicated Mineral Resources with continued exploration.
Due to the uncertainty that may be attached to Inferred Mineral Resources, it cannot be assumed that all
or any part of an Inferred Mineral Resource will be upgraded to an Indicated or Measured Mineral Resource
as a result of continued exploration, Confidence in the estimate is insufficient to allow the meaningful
application of technical economic parameter or to enable an evaluation of economic viability worthy of public
disclosure. Inferred Mineral Resources must be excluded from estimates forming the basis of feasibility or
other economic studies.
14.1.12.2 Resource Classification for the Hardrock Project
Mineral Resource classification of Measured, Indicated and Inferred category was undertaken for any
blocks meeting all the conditions below:
• Measured Mineral Resources are defined as blocks within ~15 m of the 2018 and 2019 RCGC
drilling;
• Indicated Mineral Resources are defined as blocks estimated in Pass 1 or 2, where the distance to
the closest composite is less than 35 m;
• Inferred Mineral Resources are defined as blocks estimated in Pass 3, and blocks estimated in Pass
1 or 2 where the distance to the closest composite is greater than 35 m;
A grooming step was undertaken on the preliminary classification to ensure that the resource category is
coherent for mine planning purposes. GMS is of the opinion that this step was necessary to homogenize
(smooth out) the resource volumes in each category. In addition, any blocks located within the external
grade shell domains (500, 501 or 506) in the Underground Resources (below the 2019 MII pit optimization)
were recategorized to Inferred.
Figure 14.20 to Figure 14.22 show the mineral resource classification, as well as the 2019 Whittle-
optimized pit shell delimiting the In-Pit and Underground Mineral Resources.
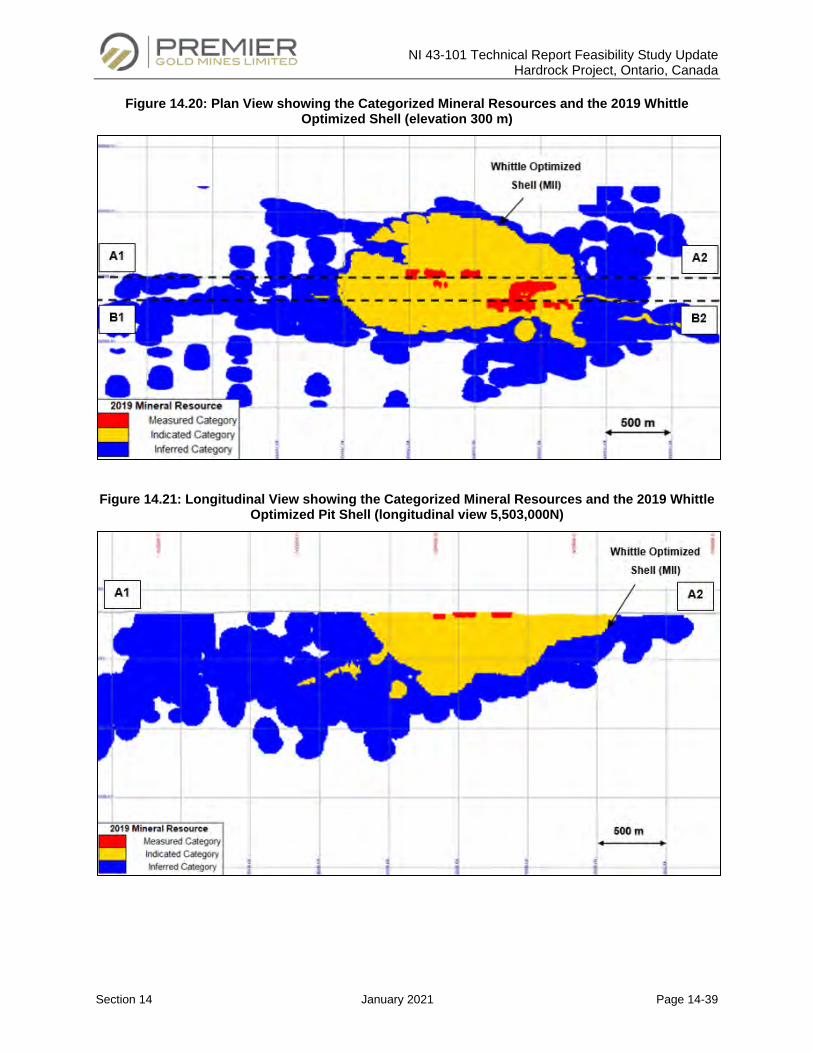
NI 43-101 Technical Report Feasibility Study Update Hardrock Project, Ontario, Canada
Section 14 January 2021 Page 14-39
Figure 14.20: Plan View showing the Categorized Mineral Resources and the 2019 Whittle Optimized Shell (elevation 300 m)
Figure 14.21: Longitudinal View showing the Categorized Mineral Resources and the 2019 Whittle Optimized Pit Shell (longitudinal view 5,503,000N)
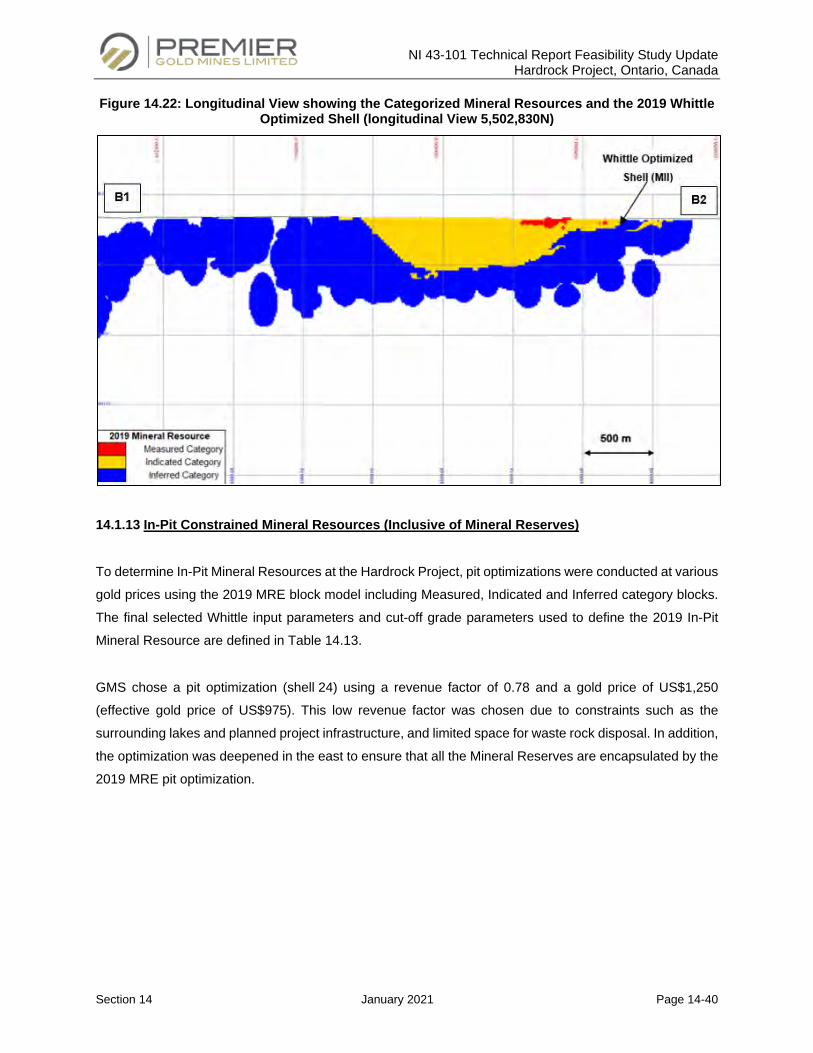
NI 43-101 Technical Report Feasibility Study Update Hardrock Project, Ontario, Canada
Section 14 January 2021 Page 14-40
Figure 14.22: Longitudinal View showing the Categorized Mineral Resources and the 2019 Whittle Optimized Shell (longitudinal View 5,502,830N)
14.1.13 In-Pit Constrained Mineral Resources (Inclusive of Mineral Reserves)
To determine In-Pit Mineral Resources at the Hardrock Project, pit optimizations were conducted at various
gold prices using the 2019 MRE block model including Measured, Indicated and Inferred category blocks.
The final selected Whittle input parameters and cut-off grade parameters used to define the 2019 In-Pit
Mineral Resource are defined in Table 14.13.
GMS chose a pit optimization (shell 24) using a revenue factor of 0.78 and a gold price of US$1,250
(effective gold price of US$975). This low revenue factor was chosen due to constraints such as the
surrounding lakes and planned project infrastructure, and limited space for waste rock disposal. In addition,
the optimization was deepened in the east to ensure that all the Mineral Reserves are encapsulated by the
2019 MRE pit optimization.
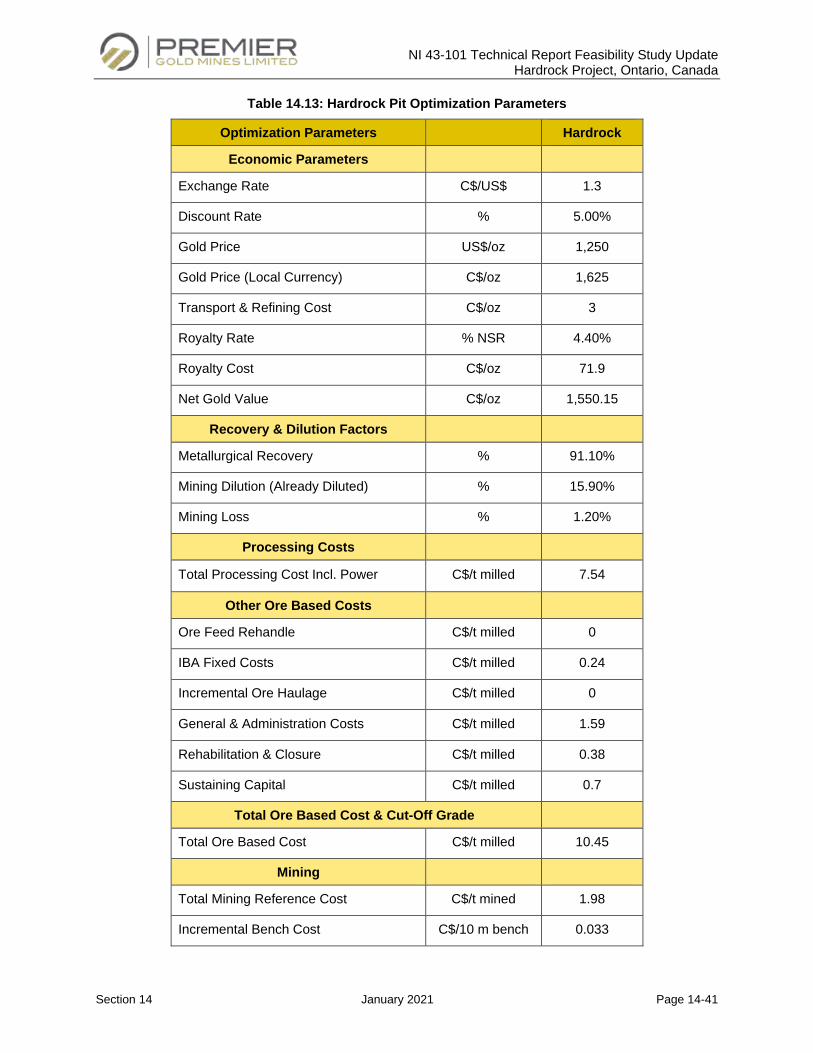
NI 43-101 Technical Report Feasibility Study Update Hardrock Project, Ontario, Canada
Section 14 January 2021 Page 14-41
Table 14.13: Hardrock Pit Optimization Parameters
Optimization Parameters Hardrock
Economic Parameters
Exchange Rate C$/US$ 1.3
Discount Rate % 5.00%
Gold Price US$/oz 1,250
Gold Price (Local Currency) C$/oz 1,625
Transport & Refining Cost C$/oz 3
Royalty Rate % NSR 4.40%
Royalty Cost C$/oz 71.9
Net Gold Value C$/oz 1,550.15
Recovery & Dilution Factors
Metallurgical Recovery % 91.10%
Mining Dilution (Already Diluted) % 15.90%
Mining Loss % 1.20%
Processing Costs
Total Processing Cost Incl. Power C$/t milled 7.54
Other Ore Based Costs
Ore Feed Rehandle C$/t milled 0
IBA Fixed Costs C$/t milled 0.24
Incremental Ore Haulage C$/t milled 0
General & Administration Costs C$/t milled 1.59
Rehabilitation & Closure C$/t milled 0.38
Sustaining Capital C$/t milled 0.7
Total Ore Based Cost & Cut-Off Grade
Total Ore Based Cost C$/t milled 10.45
Mining
Total Mining Reference Cost C$/t mined 1.98
Incremental Bench Cost C$/10 m bench 0.033
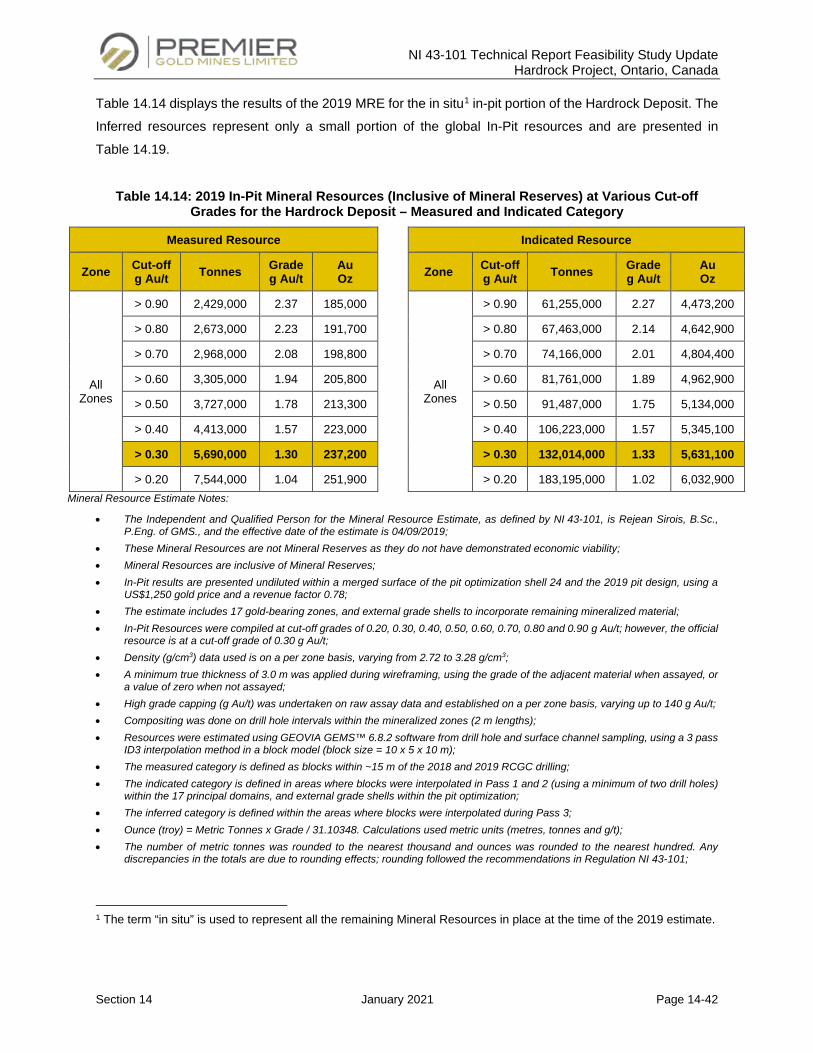
NI 43-101 Technical Report Feasibility Study Update Hardrock Project, Ontario, Canada
Section 14 January 2021 Page 14-42
Table 14.14 displays the results of the 2019 MRE for the in situ1 in-pit portion of the Hardrock Deposit. The
Inferred resources represent only a small portion of the global In-Pit resources and are presented in
Table 14.19.
Table 14.14: 2019 In-Pit Mineral Resources (Inclusive of Mineral Reserves) at Various Cut-off Grades for the Hardrock Deposit – Measured and Indicated Category
Measured Resource Indicated Resource
Zone Cut-off g Au/t Tonnes Grade
g Au/t Au Oz
Zone Cut-off
g Au/t Tonnes Grade g Au/t
Au Oz
All Zones
> 0.90 2,429,000 2.37 185,000
All Zones
> 0.90 61,255,000 2.27 4,473,200
> 0.80 2,673,000 2.23 191,700 > 0.80 67,463,000 2.14 4,642,900
> 0.70 2,968,000 2.08 198,800 > 0.70 74,166,000 2.01 4,804,400
> 0.60 3,305,000 1.94 205,800 > 0.60 81,761,000 1.89 4,962,900
> 0.50 3,727,000 1.78 213,300 > 0.50 91,487,000 1.75 5,134,000
> 0.40 4,413,000 1.57 223,000 > 0.40 106,223,000 1.57 5,345,100
> 0.30 5,690,000 1.30 237,200 > 0.30 132,014,000 1.33 5,631,100
> 0.20 7,544,000 1.04 251,900 > 0.20 183,195,000 1.02 6,032,900 Mineral Resource Estimate Notes:
• The Independent and Qualified Person for the Mineral Resource Estimate, as defined by NI 43-101, is Rejean Sirois, B.Sc., P.Eng. of GMS., and the effective date of the estimate is 04/09/2019;
• These Mineral Resources are not Mineral Reserves as they do not have demonstrated economic viability; • Mineral Resources are inclusive of Mineral Reserves; • In-Pit results are presented undiluted within a merged surface of the pit optimization shell 24 and the 2019 pit design, using a
US$1,250 gold price and a revenue factor 0.78; • The estimate includes 17 gold-bearing zones, and external grade shells to incorporate remaining mineralized material; • In-Pit Resources were compiled at cut-off grades of 0.20, 0.30, 0.40, 0.50, 0.60, 0.70, 0.80 and 0.90 g Au/t; however, the official
resource is at a cut-off grade of 0.30 g Au/t; • Density (g/cm3) data used is on a per zone basis, varying from 2.72 to 3.28 g/cm3; • A minimum true thickness of 3.0 m was applied during wireframing, using the grade of the adjacent material when assayed, or
a value of zero when not assayed; • High grade capping (g Au/t) was undertaken on raw assay data and established on a per zone basis, varying up to 140 g Au/t; • Compositing was done on drill hole intervals within the mineralized zones (2 m lengths); • Resources were estimated using GEOVIA GEMS™ 6.8.2 software from drill hole and surface channel sampling, using a 3 pass
ID3 interpolation method in a block model (block size = 10 x 5 x 10 m); • The measured category is defined as blocks within ~15 m of the 2018 and 2019 RCGC drilling; • The indicated category is defined in areas where blocks were interpolated in Pass 1 and 2 (using a minimum of two drill holes)
within the 17 principal domains, and external grade shells within the pit optimization; • The inferred category is defined within the areas where blocks were interpolated during Pass 3; • Ounce (troy) = Metric Tonnes x Grade / 31.10348. Calculations used metric units (metres, tonnes and g/t); • The number of metric tonnes was rounded to the nearest thousand and ounces was rounded to the nearest hundred. Any
discrepancies in the totals are due to rounding effects; rounding followed the recommendations in Regulation NI 43-101;
1 The term “in situ” is used to represent all the remaining Mineral Resources in place at the time of the 2019 estimate.
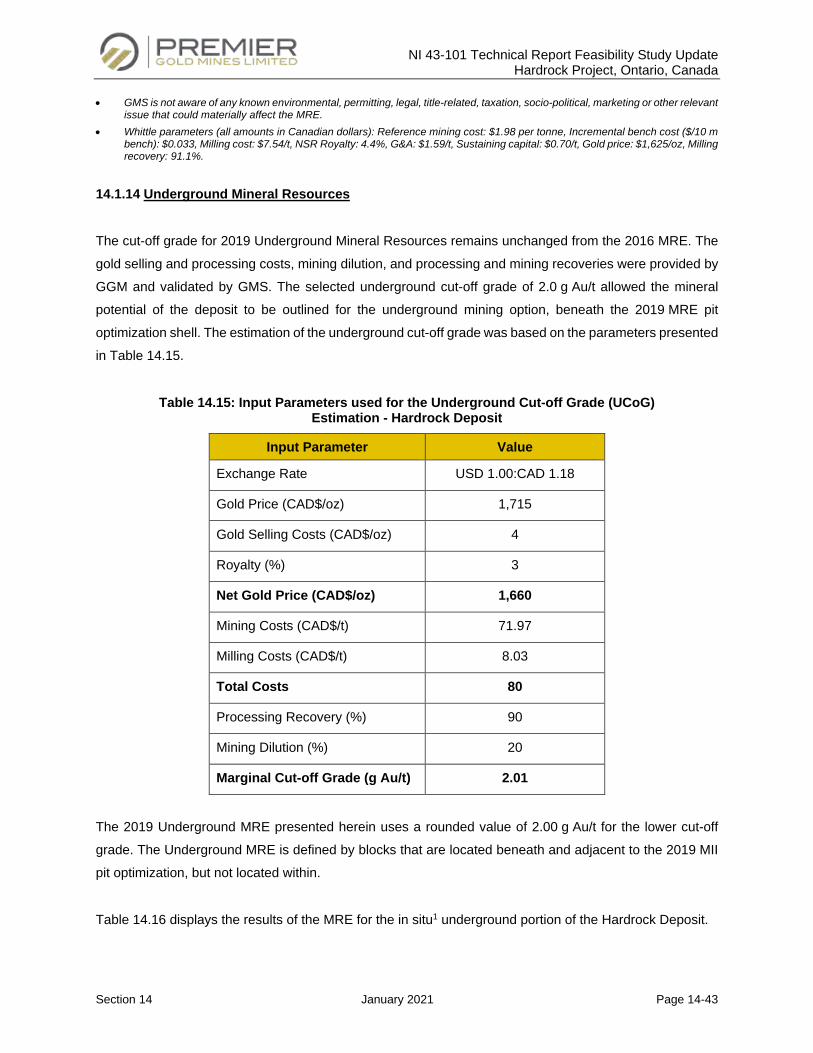
NI 43-101 Technical Report Feasibility Study Update Hardrock Project, Ontario, Canada
Section 14 January 2021 Page 14-43
• GMS is not aware of any known environmental, permitting, legal, title-related, taxation, socio-political, marketing or other relevant issue that could materially affect the MRE.
• Whittle parameters (all amounts in Canadian dollars): Reference mining cost: $1.98 per tonne, Incremental bench cost ($/10 m bench): $0.033, Milling cost: $7.54/t, NSR Royalty: 4.4%, G&A: $1.59/t, Sustaining capital: $0.70/t, Gold price: $1,625/oz, Milling recovery: 91.1%.
14.1.14 Underground Mineral Resources
The cut-off grade for 2019 Underground Mineral Resources remains unchanged from the 2016 MRE. The
gold selling and processing costs, mining dilution, and processing and mining recoveries were provided by
GGM and validated by GMS. The selected underground cut-off grade of 2.0 g Au/t allowed the mineral
potential of the deposit to be outlined for the underground mining option, beneath the 2019 MRE pit
optimization shell. The estimation of the underground cut-off grade was based on the parameters presented
in Table 14.15.
Table 14.15: Input Parameters used for the Underground Cut-off Grade (UCoG) Estimation - Hardrock Deposit
Input Parameter Value
Exchange Rate USD 1.00:CAD 1.18
Gold Price (CAD$/oz) 1,715
Gold Selling Costs (CAD$/oz) 4
Royalty (%) 3
Net Gold Price (CAD$/oz) 1,660
Mining Costs (CAD$/t) 71.97
Milling Costs (CAD$/t) 8.03
Total Costs 80
Processing Recovery (%) 90
Mining Dilution (%) 20
Marginal Cut-off Grade (g Au/t) 2.01
The 2019 Underground MRE presented herein uses a rounded value of 2.00 g Au/t for the lower cut-off
grade. The Underground MRE is defined by blocks that are located beneath and adjacent to the 2019 MII
pit optimization, but not located within.
Table 14.16 displays the results of the MRE for the in situ1 underground portion of the Hardrock Deposit.
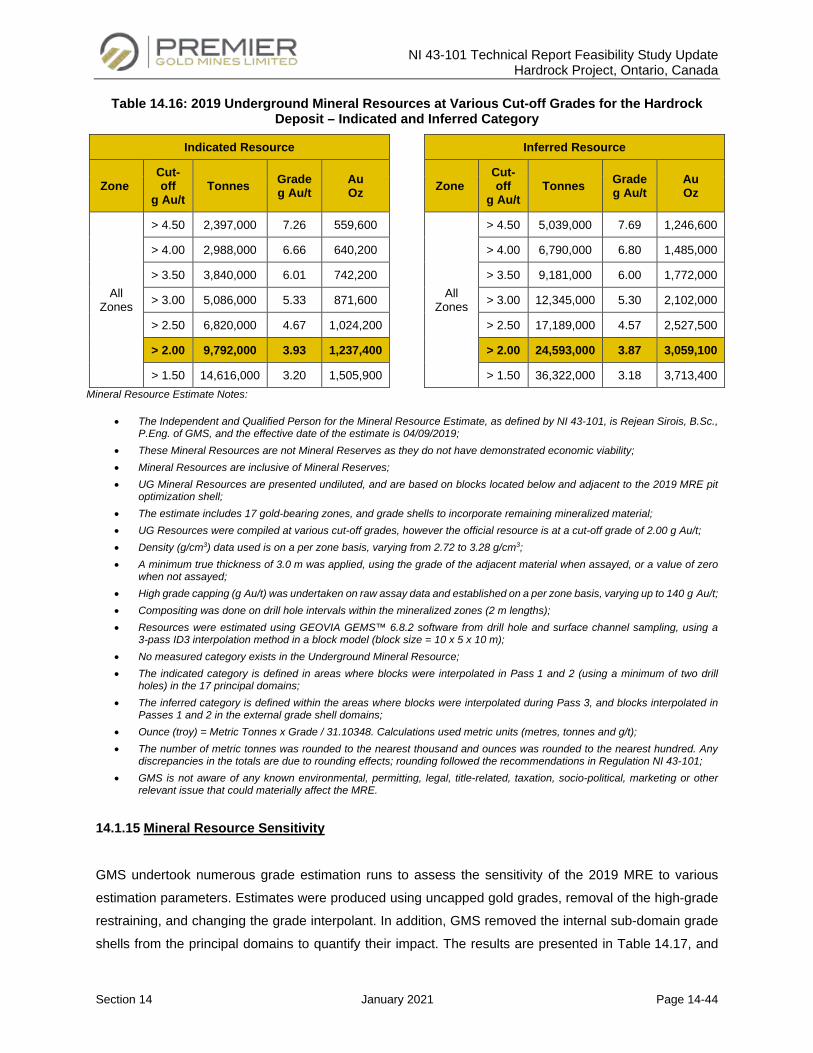
NI 43-101 Technical Report Feasibility Study Update Hardrock Project, Ontario, Canada
Section 14 January 2021 Page 14-44
Table 14.16: 2019 Underground Mineral Resources at Various Cut-off Grades for the Hardrock Deposit – Indicated and Inferred Category
Indicated Resource Inferred Resource
Zone Cut-off
g Au/t Tonnes Grade
g Au/t Au Oz
Zone Cut-off
g Au/t Tonnes Grade
g Au/t Au Oz
All Zones
> 4.50 2,397,000 7.26 559,600
All Zones
> 4.50 5,039,000 7.69 1,246,600
> 4.00 2,988,000 6.66 640,200 > 4.00 6,790,000 6.80 1,485,000
> 3.50 3,840,000 6.01 742,200 > 3.50 9,181,000 6.00 1,772,000
> 3.00 5,086,000 5.33 871,600 > 3.00 12,345,000 5.30 2,102,000
> 2.50 6,820,000 4.67 1,024,200 > 2.50 17,189,000 4.57 2,527,500
> 2.00 9,792,000 3.93 1,237,400 > 2.00 24,593,000 3.87 3,059,100
> 1.50 14,616,000 3.20 1,505,900 > 1.50 36,322,000 3.18 3,713,400 Mineral Resource Estimate Notes:
• The Independent and Qualified Person for the Mineral Resource Estimate, as defined by NI 43-101, is Rejean Sirois, B.Sc., P.Eng. of GMS, and the effective date of the estimate is 04/09/2019;
• These Mineral Resources are not Mineral Reserves as they do not have demonstrated economic viability; • Mineral Resources are inclusive of Mineral Reserves; • UG Mineral Resources are presented undiluted, and are based on blocks located below and adjacent to the 2019 MRE pit
optimization shell; • The estimate includes 17 gold-bearing zones, and grade shells to incorporate remaining mineralized material; • UG Resources were compiled at various cut-off grades, however the official resource is at a cut-off grade of 2.00 g Au/t; • Density (g/cm3) data used is on a per zone basis, varying from 2.72 to 3.28 g/cm3; • A minimum true thickness of 3.0 m was applied, using the grade of the adjacent material when assayed, or a value of zero
when not assayed; • High grade capping (g Au/t) was undertaken on raw assay data and established on a per zone basis, varying up to 140 g Au/t; • Compositing was done on drill hole intervals within the mineralized zones (2 m lengths); • Resources were estimated using GEOVIA GEMS™ 6.8.2 software from drill hole and surface channel sampling, using a
3-pass ID3 interpolation method in a block model (block size = 10 x 5 x 10 m); • No measured category exists in the Underground Mineral Resource; • The indicated category is defined in areas where blocks were interpolated in Pass 1 and 2 (using a minimum of two drill
holes) in the 17 principal domains; • The inferred category is defined within the areas where blocks were interpolated during Pass 3, and blocks interpolated in
Passes 1 and 2 in the external grade shell domains; • Ounce (troy) = Metric Tonnes x Grade / 31.10348. Calculations used metric units (metres, tonnes and g/t); • The number of metric tonnes was rounded to the nearest thousand and ounces was rounded to the nearest hundred. Any
discrepancies in the totals are due to rounding effects; rounding followed the recommendations in Regulation NI 43-101; • GMS is not aware of any known environmental, permitting, legal, title-related, taxation, socio-political, marketing or other
relevant issue that could materially affect the MRE.
14.1.15 Mineral Resource Sensitivity
GMS undertook numerous grade estimation runs to assess the sensitivity of the 2019 MRE to various
estimation parameters. Estimates were produced using uncapped gold grades, removal of the high-grade
restraining, and changing the grade interpolant. In addition, GMS removed the internal sub-domain grade
shells from the principal domains to quantify their impact. The results are presented in Table 14.17, and
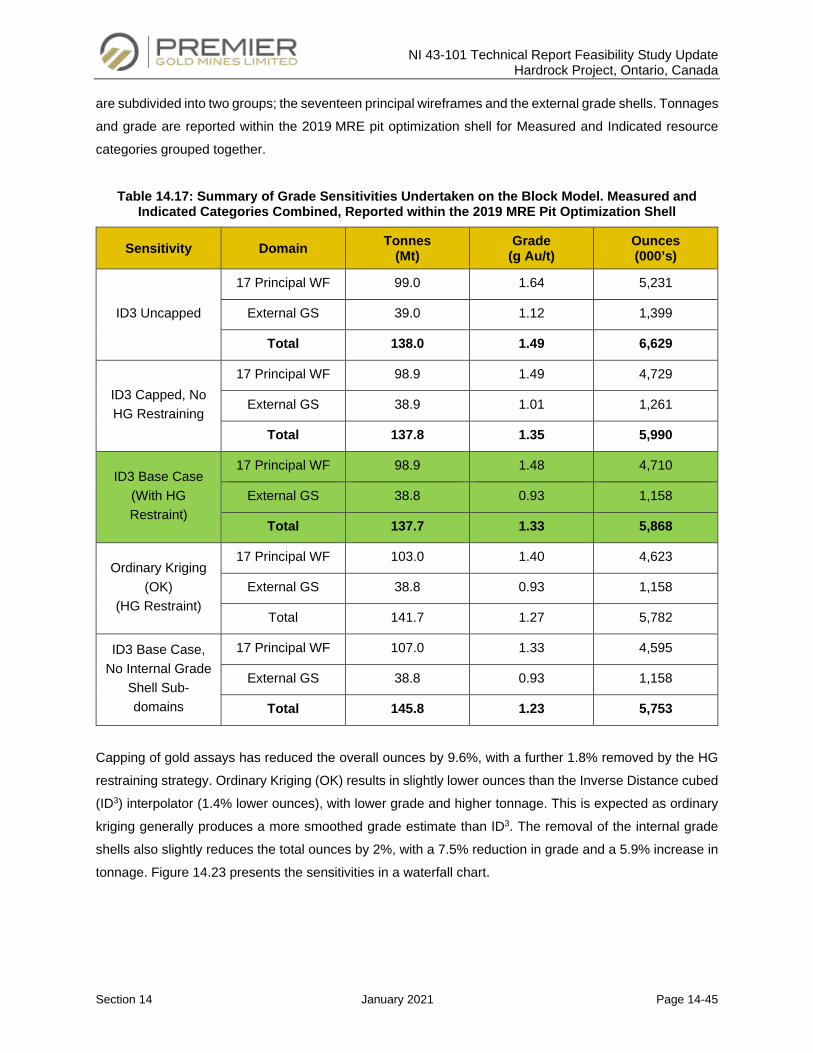
NI 43-101 Technical Report Feasibility Study Update Hardrock Project, Ontario, Canada
Section 14 January 2021 Page 14-45
are subdivided into two groups; the seventeen principal wireframes and the external grade shells. Tonnages
and grade are reported within the 2019 MRE pit optimization shell for Measured and Indicated resource
categories grouped together.
Table 14.17: Summary of Grade Sensitivities Undertaken on the Block Model. Measured and Indicated Categories Combined, Reported within the 2019 MRE Pit Optimization Shell
Sensitivity Domain Tonnes (Mt)
Grade (g Au/t)
Ounces (000’s)
ID3 Uncapped
17 Principal WF 99.0 1.64 5,231
External GS 39.0 1.12 1,399
Total 138.0 1.49 6,629
ID3 Capped, No HG Restraining
17 Principal WF 98.9 1.49 4,729
External GS 38.9 1.01 1,261
Total 137.8 1.35 5,990
ID3 Base Case (With HG Restraint)
17 Principal WF 98.9 1.48 4,710
External GS 38.8 0.93 1,158
Total 137.7 1.33 5,868
Ordinary Kriging (OK)
(HG Restraint)
17 Principal WF 103.0 1.40 4,623
External GS 38.8 0.93 1,158
Total 141.7 1.27 5,782
ID3 Base Case, No Internal Grade
Shell Sub-domains
17 Principal WF 107.0 1.33 4,595
External GS 38.8 0.93 1,158
Total 145.8 1.23 5,753
Capping of gold assays has reduced the overall ounces by 9.6%, with a further 1.8% removed by the HG
restraining strategy. Ordinary Kriging (OK) results in slightly lower ounces than the Inverse Distance cubed
(ID3) interpolator (1.4% lower ounces), with lower grade and higher tonnage. This is expected as ordinary
kriging generally produces a more smoothed grade estimate than ID3. The removal of the internal grade
shells also slightly reduces the total ounces by 2%, with a 7.5% reduction in grade and a 5.9% increase in
tonnage. Figure 14.23 presents the sensitivities in a waterfall chart.
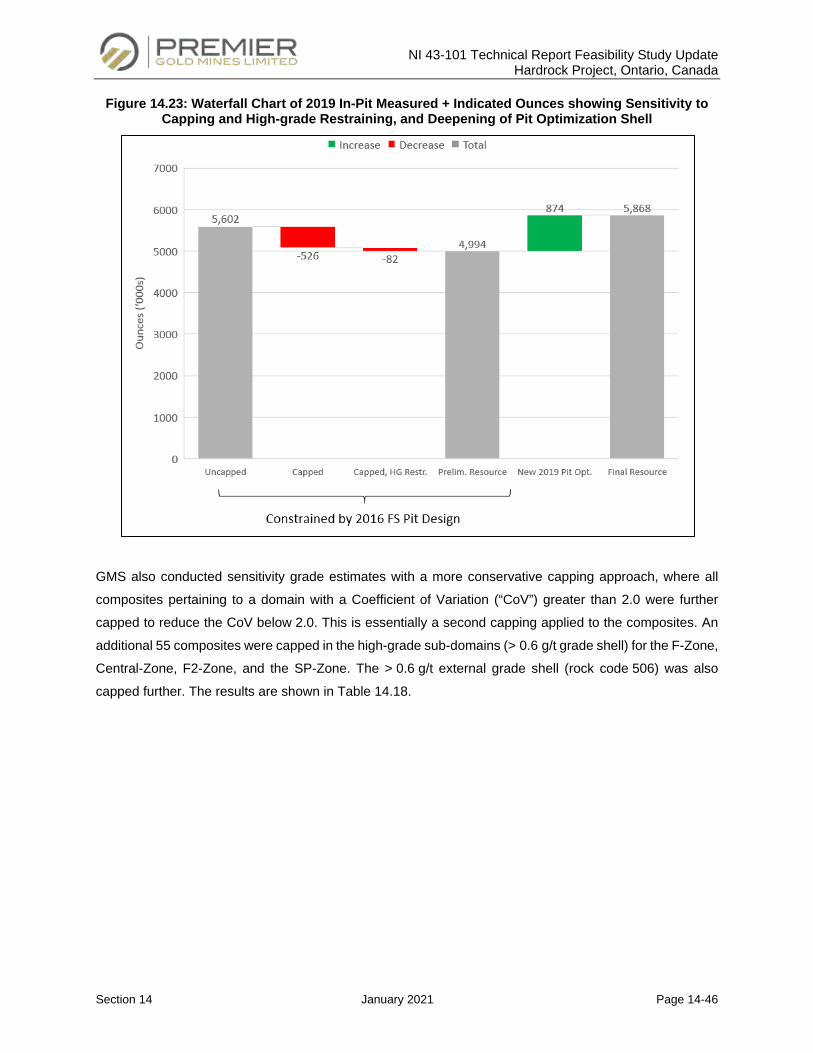
NI 43-101 Technical Report Feasibility Study Update Hardrock Project, Ontario, Canada
Section 14 January 2021 Page 14-46
Figure 14.23: Waterfall Chart of 2019 In-Pit Measured + Indicated Ounces showing Sensitivity to Capping and High-grade Restraining, and Deepening of Pit Optimization Shell
GMS also conducted sensitivity grade estimates with a more conservative capping approach, where all
composites pertaining to a domain with a Coefficient of Variation (“CoV”) greater than 2.0 were further
capped to reduce the CoV below 2.0. This is essentially a second capping applied to the composites. An
additional 55 composites were capped in the high-grade sub-domains (> 0.6 g/t grade shell) for the F-Zone,
Central-Zone, F2-Zone, and the SP-Zone. The > 0.6 g/t external grade shell (rock code 506) was also
capped further. The results are shown in Table 14.18.
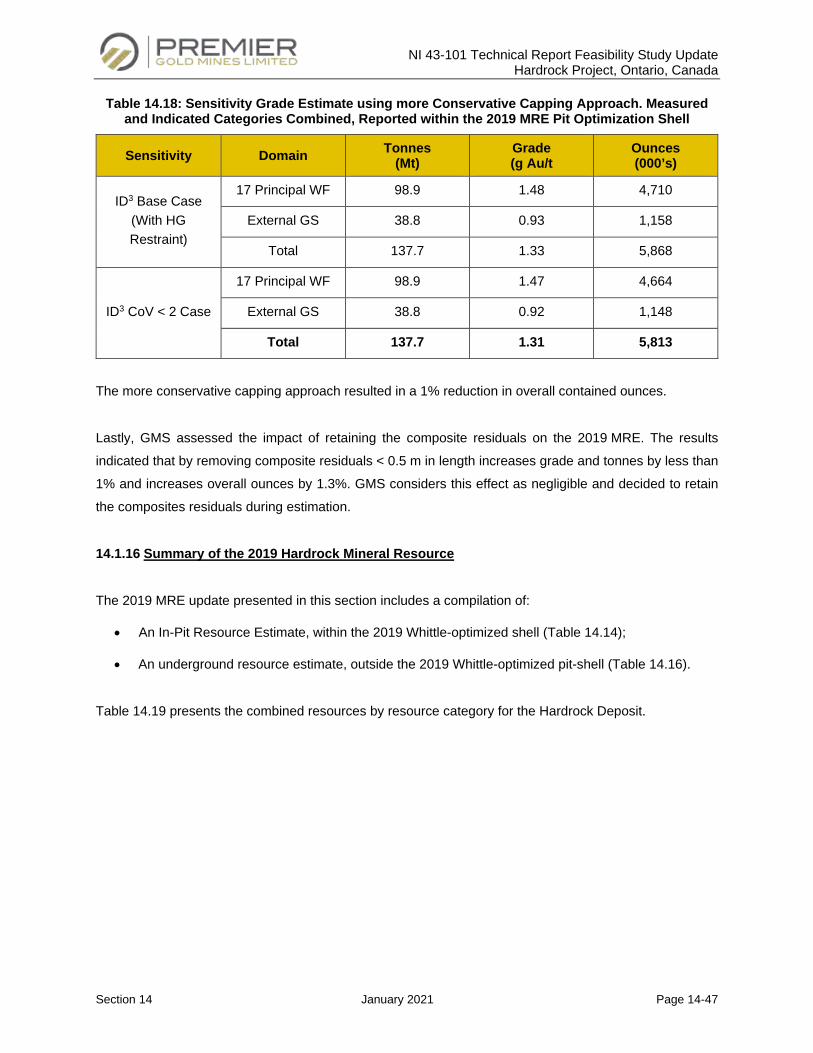
NI 43-101 Technical Report Feasibility Study Update Hardrock Project, Ontario, Canada
Section 14 January 2021 Page 14-47
Table 14.18: Sensitivity Grade Estimate using more Conservative Capping Approach. Measured and Indicated Categories Combined, Reported within the 2019 MRE Pit Optimization Shell
Sensitivity Domain Tonnes (Mt)
Grade (g Au/t
Ounces (000’s)
ID3 Base Case (With HG Restraint)
17 Principal WF 98.9 1.48 4,710
External GS 38.8 0.93 1,158
Total 137.7 1.33 5,868
ID3 CoV < 2 Case
17 Principal WF 98.9 1.47 4,664
External GS 38.8 0.92 1,148
Total 137.7 1.31 5,813
The more conservative capping approach resulted in a 1% reduction in overall contained ounces.
Lastly, GMS assessed the impact of retaining the composite residuals on the 2019 MRE. The results
indicated that by removing composite residuals < 0.5 m in length increases grade and tonnes by less than
1% and increases overall ounces by 1.3%. GMS considers this effect as negligible and decided to retain
the composites residuals during estimation.
14.1.16 Summary of the 2019 Hardrock Mineral Resource
The 2019 MRE update presented in this section includes a compilation of:
• An In-Pit Resource Estimate, within the 2019 Whittle-optimized shell (Table 14.14);
• An underground resource estimate, outside the 2019 Whittle-optimized pit-shell (Table 14.16).
Table 14.19 presents the combined resources by resource category for the Hardrock Deposit.
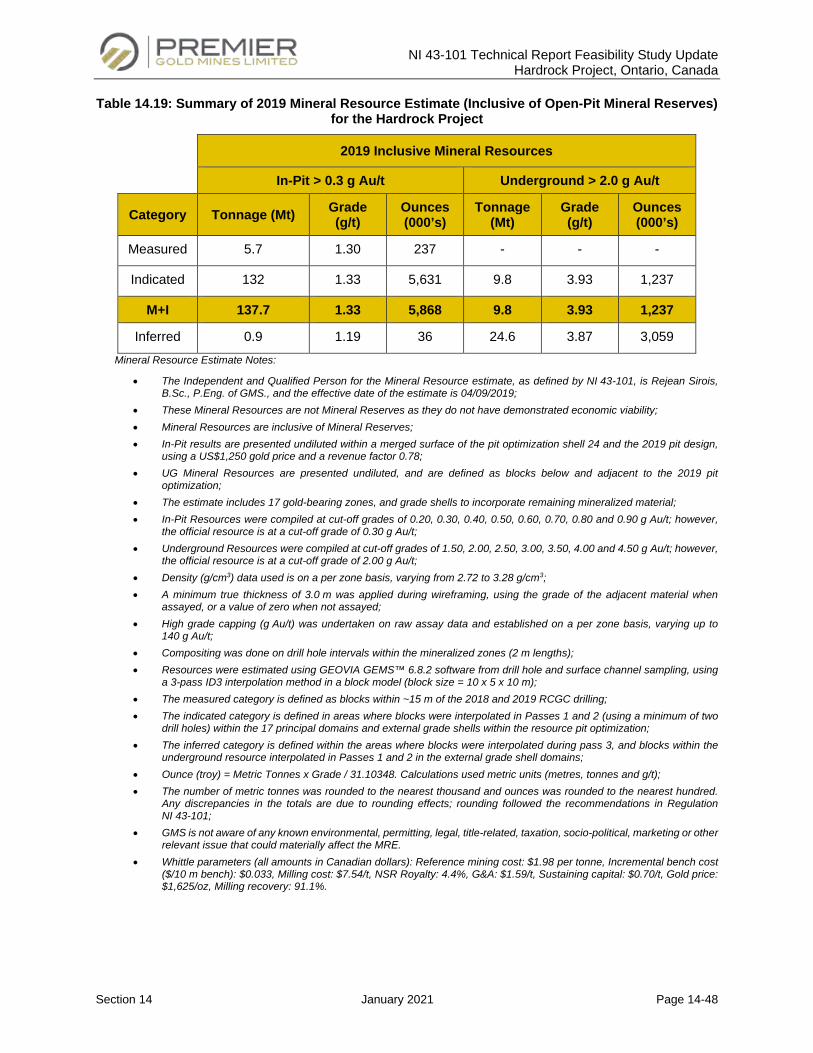
NI 43-101 Technical Report Feasibility Study Update Hardrock Project, Ontario, Canada
Section 14 January 2021 Page 14-48
Table 14.19: Summary of 2019 Mineral Resource Estimate (Inclusive of Open-Pit Mineral Reserves) for the Hardrock Project
2019 Inclusive Mineral Resources
In-Pit > 0.3 g Au/t Underground > 2.0 g Au/t
Category Tonnage (Mt) Grade (g/t)
Ounces (000’s)
Tonnage (Mt)
Grade (g/t)
Ounces (000’s)
Measured 5.7 1.30 237 - - -
Indicated 132 1.33 5,631 9.8 3.93 1,237
M+I 137.7 1.33 5,868 9.8 3.93 1,237
Inferred 0.9 1.19 36 24.6 3.87 3,059 Mineral Resource Estimate Notes:
• The Independent and Qualified Person for the Mineral Resource estimate, as defined by NI 43-101, is Rejean Sirois, B.Sc., P.Eng. of GMS., and the effective date of the estimate is 04/09/2019;
• These Mineral Resources are not Mineral Reserves as they do not have demonstrated economic viability; • Mineral Resources are inclusive of Mineral Reserves; • In-Pit results are presented undiluted within a merged surface of the pit optimization shell 24 and the 2019 pit design,
using a US$1,250 gold price and a revenue factor 0.78; • UG Mineral Resources are presented undiluted, and are defined as blocks below and adjacent to the 2019 pit
optimization; • The estimate includes 17 gold-bearing zones, and grade shells to incorporate remaining mineralized material; • In-Pit Resources were compiled at cut-off grades of 0.20, 0.30, 0.40, 0.50, 0.60, 0.70, 0.80 and 0.90 g Au/t; however,
the official resource is at a cut-off grade of 0.30 g Au/t; • Underground Resources were compiled at cut-off grades of 1.50, 2.00, 2.50, 3.00, 3.50, 4.00 and 4.50 g Au/t; however,
the official resource is at a cut-off grade of 2.00 g Au/t; • Density (g/cm3) data used is on a per zone basis, varying from 2.72 to 3.28 g/cm3; • A minimum true thickness of 3.0 m was applied during wireframing, using the grade of the adjacent material when
assayed, or a value of zero when not assayed; • High grade capping (g Au/t) was undertaken on raw assay data and established on a per zone basis, varying up to
140 g Au/t; • Compositing was done on drill hole intervals within the mineralized zones (2 m lengths); • Resources were estimated using GEOVIA GEMS™ 6.8.2 software from drill hole and surface channel sampling, using
a 3-pass ID3 interpolation method in a block model (block size = 10 x 5 x 10 m); • The measured category is defined as blocks within ~15 m of the 2018 and 2019 RCGC drilling; • The indicated category is defined in areas where blocks were interpolated in Passes 1 and 2 (using a minimum of two
drill holes) within the 17 principal domains and external grade shells within the resource pit optimization; • The inferred category is defined within the areas where blocks were interpolated during pass 3, and blocks within the
underground resource interpolated in Passes 1 and 2 in the external grade shell domains; • Ounce (troy) = Metric Tonnes x Grade / 31.10348. Calculations used metric units (metres, tonnes and g/t); • The number of metric tonnes was rounded to the nearest thousand and ounces was rounded to the nearest hundred.
Any discrepancies in the totals are due to rounding effects; rounding followed the recommendations in Regulation NI 43-101;
• GMS is not aware of any known environmental, permitting, legal, title-related, taxation, socio-political, marketing or other relevant issue that could materially affect the MRE.
• Whittle parameters (all amounts in Canadian dollars): Reference mining cost: $1.98 per tonne, Incremental bench cost ($/10 m bench): $0.033, Milling cost: $7.54/t, NSR Royalty: 4.4%, G&A: $1.59/t, Sustaining capital: $0.70/t, Gold price: $1,625/oz, Milling recovery: 91.1%.
NI 43-101 Technical Report Feasibility Study Update Hardrock Project, Ontario, Canada
Section 14 January 2021 Page 14-49
14.1.17 Comparison with the Previous Estimate
A comparison of the 2019 MRE (In-Pit and Underground) to the 2016 MRE is presented in Table 14.20.
The overall 2019 Combined In-Pit and Underground Measured and Indicated Resources of
7,106,000 ounces of gold for the Hardrock Project represents an 11% increase in total ounces versus the
2016 estimate (at their respective cut-off).
The 2019 In-Pit Measured and Indicated Resources represent a 21% increase in grade, 26% increase in
ounces and 4% increase in tonnes versus In-Pit Measured and Indicated Resources reported in the
2016 FS.
The principal factors contributing to the increase in the current MRE are as follows:
1. The 2019 MRE is constrained by a deeper pit optimization, which incorporates significantly more
resources compared to the 2016 MRE;
2. The reduction of internal dilution within the seventeen principal domains has resulted in a 24%
increase in average grade of assays within these domains (shown in Table 14.2). This has resulted
in a higher grade for the 2019 Mineral Resource;
3. Grade capping was revisited in 2019 (due to the refined wireframes), and new capping thresholds
were chosen. They are usually less restrictive as the capping chosen in 2016;
4. RC grade-control drilling and validation diamond drilling conducted in 2018 and 2019 confirmed
grade continuity, and generally intersected higher-grades than expected in the 2016 block model.
Despite the de-risking drilling programs undertaken in 2018 and 2019 cover a small portion of the
entire resource, both programs imply that higher grade than 2016 block model should be
encountered during the extraction of the resources.
The same gold price was used during the pit optimization process in the 2019 and 2016 estimates, therefore
has not contributed to the upgraded profile of the new mineral resource. The waterfall diagram in
Figure 14.24 summarizes changes in the 2019 MRE update. It is important to note that there is only a 7%
increase in Measured and Indicated ounces (327 KOz) when reporting the 2019 MRE block model in the
2016 pit optimization shell. The majority of the increase in ounces between the 2016 and 2019 MRE’s is a
result of the deepening of the pit optimization shell (874 KOz).
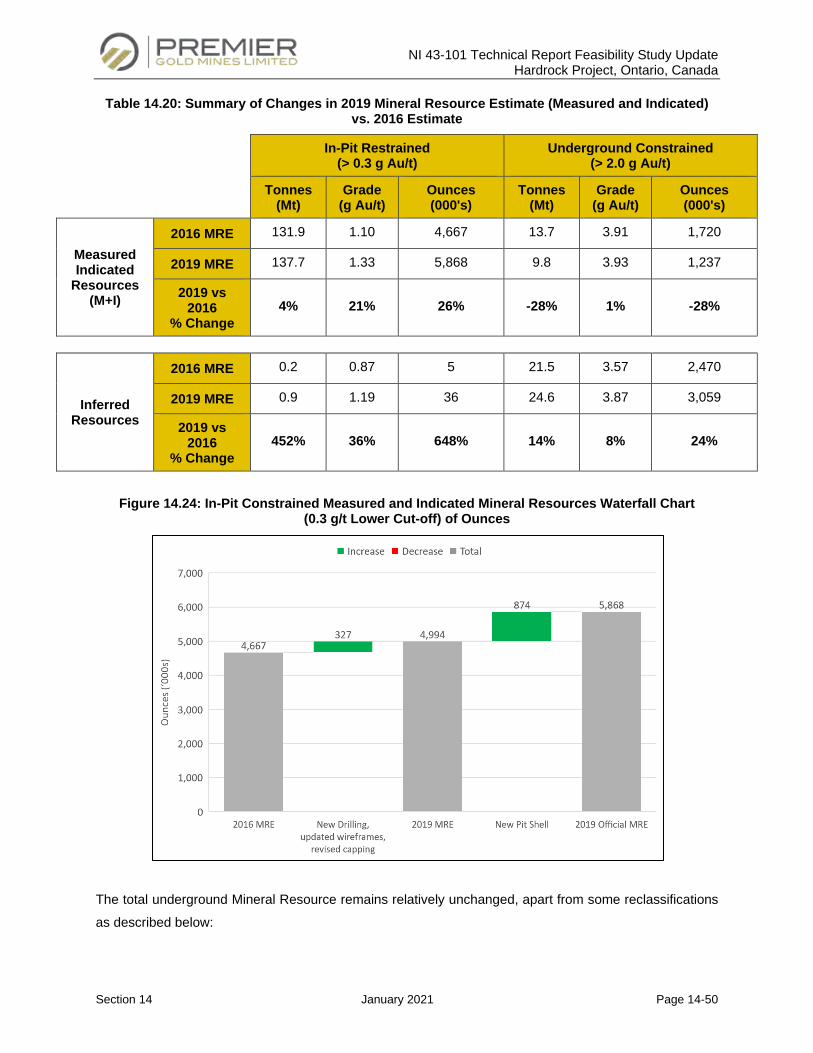
NI 43-101 Technical Report Feasibility Study Update Hardrock Project, Ontario, Canada
Section 14 January 2021 Page 14-50
Table 14.20: Summary of Changes in 2019 Mineral Resource Estimate (Measured and Indicated) vs. 2016 Estimate
In-Pit Restrained (> 0.3 g Au/t)
Underground Constrained (> 2.0 g Au/t)
Tonnes (Mt)
Grade (g Au/t)
Ounces (000's)
Tonnes (Mt)
Grade (g Au/t)
Ounces (000's)
Measured Indicated
Resources (M+I)
2016 MRE 131.9 1.10 4,667 13.7 3.91 1,720
2019 MRE 137.7 1.33 5,868 9.8 3.93 1,237
2019 vs 2016
% Change 4% 21% 26% -28% 1% -28%
Inferred Resources
2016 MRE 0.2 0.87 5 21.5 3.57 2,470
2019 MRE 0.9 1.19 36 24.6 3.87 3,059
2019 vs 2016
% Change 452% 36% 648% 14% 8% 24%
Figure 14.24: In-Pit Constrained Measured and Indicated Mineral Resources Waterfall Chart (0.3 g/t Lower Cut-off) of Ounces
The total underground Mineral Resource remains relatively unchanged, apart from some reclassifications
as described below:
NI 43-101 Technical Report Feasibility Study Update Hardrock Project, Ontario, Canada
Section 14 January 2021 Page 14-51
• 3.9 Mt reduction in Indicated Mineral Resources;
o These blocks were previously estimated within a poorly constrained lithological domain and have
been reclassified into the Inferred Category;
• 3.1 Mt increase in Inferred Mineral Resources;
o All underground blocks within the external grade shell domains (rock codes 500, 501 and 506)
outside of the principal wireframes are reclassified as Inferred;
14.1.18 2019 In-Pit Constrained Mineral Resources (Exclusive of Mineral Reserves)
Premier Gold and Centerra Gold publish their respective Mineral Resources exclusive of Mineral Reserves
(i.e. Mineral Resources are in addition to Mineral Reserves). Table 14.21 presents the 2019
In-Pit Mineral Resources exclusive of Mineral Reserves for Indicated and Inferred categories. When
reporting Mineral Resources as exclusive of Mineral Reserves, no remaining Measured resources exist at
the Hardrock Project.
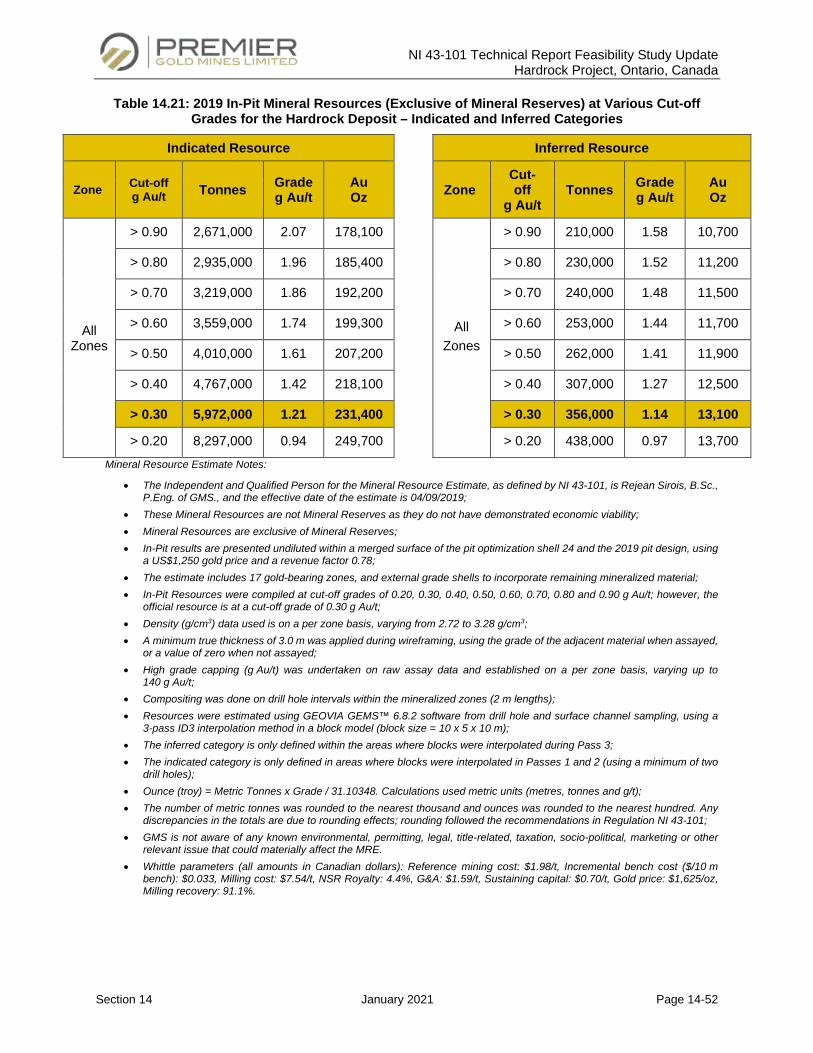
NI 43-101 Technical Report Feasibility Study Update Hardrock Project, Ontario, Canada
Section 14 January 2021 Page 14-52
Table 14.21: 2019 In-Pit Mineral Resources (Exclusive of Mineral Reserves) at Various Cut-off Grades for the Hardrock Deposit – Indicated and Inferred Categories
Indicated Resource Inferred Resource
Zone Cut-off g Au/t Tonnes Grade
g Au/t Au Oz
Zone
Cut-off
g Au/t Tonnes Grade
g Au/t Au Oz
All Zones
> 0.90 2,671,000 2.07 178,100
All Zones
> 0.90 210,000 1.58 10,700
> 0.80 2,935,000 1.96 185,400
> 0.80 230,000 1.52 11,200
> 0.70 3,219,000 1.86 192,200
> 0.70 240,000 1.48 11,500
> 0.60 3,559,000 1.74 199,300
> 0.60 253,000 1.44 11,700
> 0.50 4,010,000 1.61 207,200
> 0.50 262,000 1.41 11,900
> 0.40 4,767,000 1.42 218,100
> 0.40 307,000 1.27 12,500
> 0.30 5,972,000 1.21 231,400 > 0.30 356,000 1.14 13,100
> 0.20 8,297,000 0.94 249,700
> 0.20 438,000 0.97 13,700 Mineral Resource Estimate Notes:
• The Independent and Qualified Person for the Mineral Resource Estimate, as defined by NI 43-101, is Rejean Sirois, B.Sc., P.Eng. of GMS., and the effective date of the estimate is 04/09/2019;
• These Mineral Resources are not Mineral Reserves as they do not have demonstrated economic viability; • Mineral Resources are exclusive of Mineral Reserves; • In-Pit results are presented undiluted within a merged surface of the pit optimization shell 24 and the 2019 pit design, using
a US$1,250 gold price and a revenue factor 0.78; • The estimate includes 17 gold-bearing zones, and external grade shells to incorporate remaining mineralized material; • In-Pit Resources were compiled at cut-off grades of 0.20, 0.30, 0.40, 0.50, 0.60, 0.70, 0.80 and 0.90 g Au/t; however, the
official resource is at a cut-off grade of 0.30 g Au/t; • Density (g/cm3) data used is on a per zone basis, varying from 2.72 to 3.28 g/cm3; • A minimum true thickness of 3.0 m was applied during wireframing, using the grade of the adjacent material when assayed,
or a value of zero when not assayed; • High grade capping (g Au/t) was undertaken on raw assay data and established on a per zone basis, varying up to
140 g Au/t; • Compositing was done on drill hole intervals within the mineralized zones (2 m lengths); • Resources were estimated using GEOVIA GEMS™ 6.8.2 software from drill hole and surface channel sampling, using a
3-pass ID3 interpolation method in a block model (block size = 10 x 5 x 10 m); • The inferred category is only defined within the areas where blocks were interpolated during Pass 3; • The indicated category is only defined in areas where blocks were interpolated in Passes 1 and 2 (using a minimum of two
drill holes); • Ounce (troy) = Metric Tonnes x Grade / 31.10348. Calculations used metric units (metres, tonnes and g/t); • The number of metric tonnes was rounded to the nearest thousand and ounces was rounded to the nearest hundred. Any
discrepancies in the totals are due to rounding effects; rounding followed the recommendations in Regulation NI 43-101; • GMS is not aware of any known environmental, permitting, legal, title-related, taxation, socio-political, marketing or other
relevant issue that could materially affect the MRE. • Whittle parameters (all amounts in Canadian dollars): Reference mining cost: $1.98/t, Incremental bench cost ($/10 m
bench): $0.033, Milling cost: $7.54/t, NSR Royalty: 4.4%, G&A: $1.59/t, Sustaining capital: $0.70/t, Gold price: $1,625/oz, Milling recovery: 91.1%.
NI 43-101 Technical Report Feasibility Study Update Hardrock Project, Ontario, Canada
Section 14 January 2021 Page 14-53
14.1.19 Underground Mineral Resources (Exclusive of Mineral Reserves)
Since no Mineral Reserves are estimated for the underground portion of the Hardrock Deposit, the
2019 Underground Mineral Resources exclusive of Mineral Reserves are identical to Table 14.16.
14.2 Brookbank, Kailey and Key Lake Deposits Mineral Resource Estimates
The Mineral Resource estimate for the Brookbank, Kailey and Key Lake Deposits were prepared by James
Purchase, P. Geo and Director of Geology and Resources at GMS using Leapfrog EDGE™ version 5.1.
The MRE is based on a drilling database for the three deposits provided to GMS on June 26th, 2020. The
effective date of the MRE for the three deposits is September 3rd, 2020.
The previous MRE for the Brookbank, Kailey and Key Lake Deposits was released on January 30th, 2013
by MICON International (effective date of the MRE was December 14th, 2012). Since the last MRE, there
has been a significant advancement in the geological understating of the three deposits, and considerable
work has been undertaken by GGM on data verification and increasing the confidence in the drilling
database.
All data relating to this MRE is expressed in NAD83, UTM Zone 16N.
No Mineral Reserves have been calculated at the Brookbank, Kailey and Key Lake Deposits, so all Mineral
Resources reported in this section can be considered as inclusive of Mineral Reserves.
14.2.1 Brookbank Deposit
The Brookbank Deposit is located around 77 km west of the Hardrock Deposit, and is a greenfield deposit
that has not been subject to any mine development or production in the past. In addition to the Brookbank
Main deposit, there are two smaller deposit named “Foxear” and “Cherbourg” which form part of the same
mineralized system along strike.
14.2.1.1 Drill Hole Database
The Brookbank Deposit (main zone) has been tested by diamond drilling over a strike length of 1,150 m
and down to a vertical depth of 1,100 m. The Brookbank drill hole database includes 688 drill holes totalling
187,901 m, of which 592 drill holes and 152,750 m were drilled within the Brookbank, Foxear and
Cherbourg Deposits.

NI 43-101 Technical Report Feasibility Study Update Hardrock Project, Ontario, Canada
Section 14 January 2021 Page 14-54
The drill holes are on a grid varying from 25 m (close to surface) to 200 m at depth. The main components
of the database are the collar, survey, assay and lithology tables which were validated as described in
Subsection 12.2.
14.2.1.2 Topography
Topography was supplied by GGM in the form of a wireframe with a spatial resolution of 10 m. The
topography matched well with the drill hole collars, with no major discrepancies identified.
14.2.1.3 Geological Modelling Approach
The Brookbank gold deposits comprise the Brookbank Main, the Cherbourg and the Foxear Deposits
(Figure 14.25) that occur at three different localities within the 6.5 km long Brookbank shear zone. The
deposits are located at and / or near the contacts between mafic volcanics and meta-sediments. The
deposits have both structural and lithological controls; however, a second order, sub-vertical plunge and
continuity of mineralization is also apparent within the shear zone. Gold mineralization occurs within multiple
quartz-carbonate stringers, veinlets and/or stockworks that give rise to broad zones of mineralization
varying in width from 1 to 2 m at a depth of about 700 m to up to 20 to 50 m wide at or close to surface.
The Brookbank main deposit has been modelled as two discrete, continuous zones names the footwall
“FW” and hanging wall “HW” veins (Figure 14.26). A minimum true width of 1.5 m and a 2 g Au/t lower cut-
off was applied during modelling. In addition, the wider altered shear zone has been modelled, alongside
the footwall conglomerate and hanging wall metavolcanics lithologies. No overburden surface was
modelled as the overburden is generally thin across the deposit (< 2 m thickness).
The Norander-era drilling (1940’s, N-Series holes) were used in the interpretation but excluded from the
estimation as their collar locations could not be validated with sufficient confidence. In addition, numerous
wedge holes have been drilled at Brookbank (often for metallurgical sampling), and those with no assays
were excluded from the estimation.
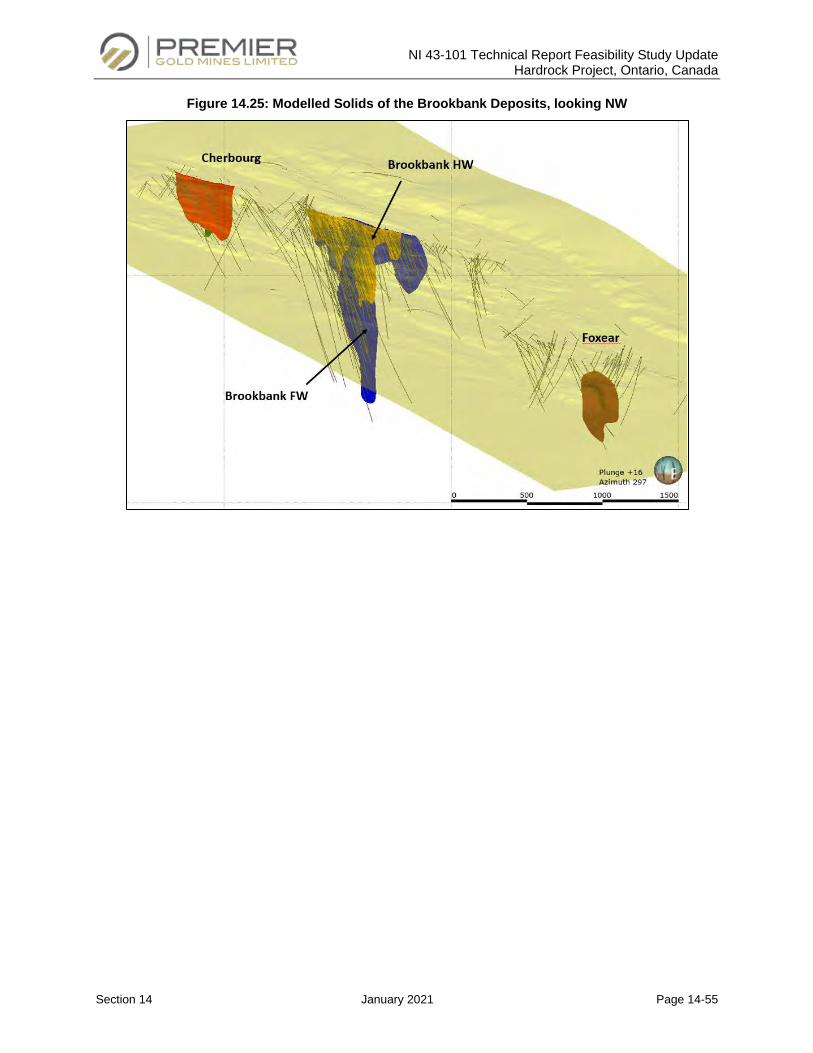
NI 43-101 Technical Report Feasibility Study Update Hardrock Project, Ontario, Canada
Section 14 January 2021 Page 14-55
Figure 14.25: Modelled Solids of the Brookbank Deposits, looking NW
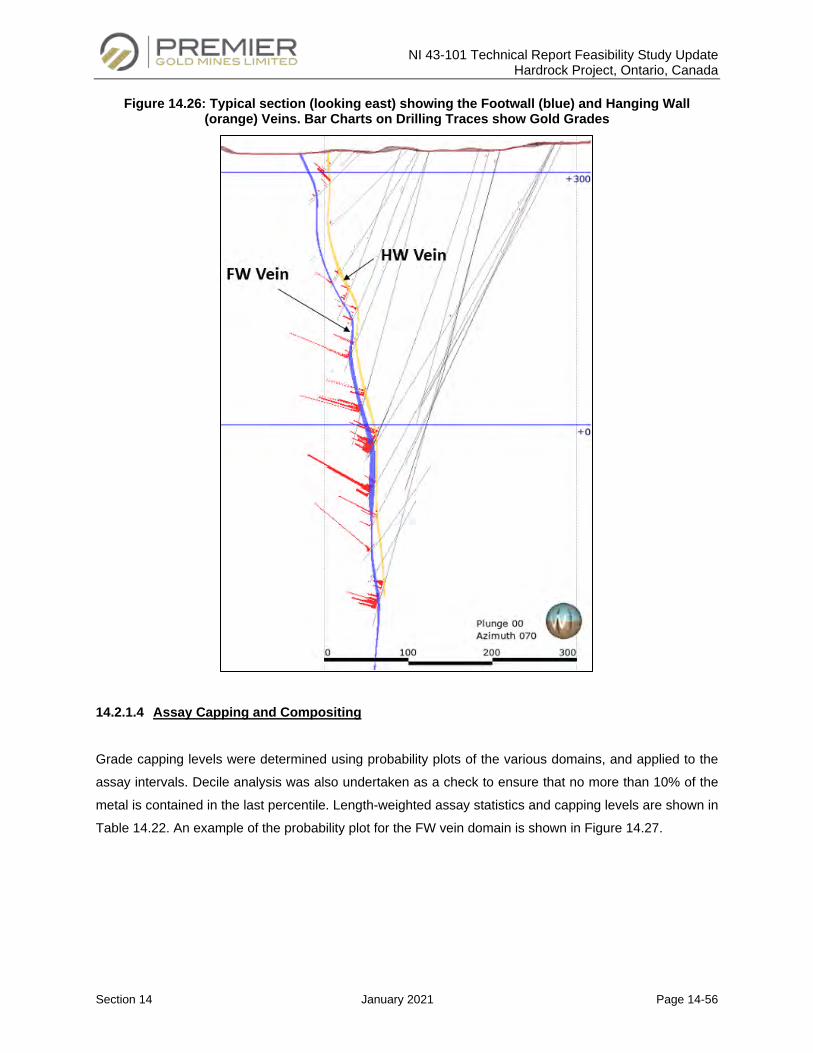
NI 43-101 Technical Report Feasibility Study Update Hardrock Project, Ontario, Canada
Section 14 January 2021 Page 14-56
Figure 14.26: Typical section (looking east) showing the Footwall (blue) and Hanging Wall (orange) Veins. Bar Charts on Drilling Traces show Gold Grades
14.2.1.4 Assay Capping and Compositing
Grade capping levels were determined using probability plots of the various domains, and applied to the
assay intervals. Decile analysis was also undertaken as a check to ensure that no more than 10% of the
metal is contained in the last percentile. Length-weighted assay statistics and capping levels are shown in
Table 14.22. An example of the probability plot for the FW vein domain is shown in Figure 14.27.
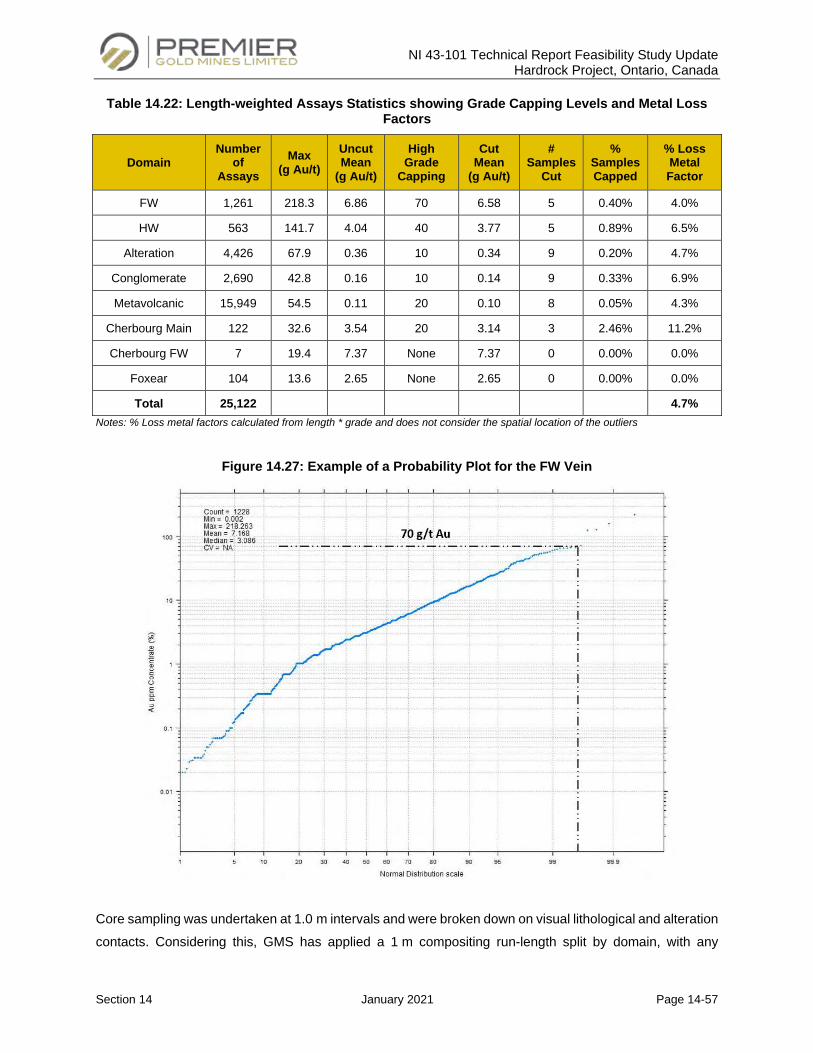
NI 43-101 Technical Report Feasibility Study Update Hardrock Project, Ontario, Canada
Section 14 January 2021 Page 14-57
Table 14.22: Length-weighted Assays Statistics showing Grade Capping Levels and Metal Loss Factors
Domain Number
of Assays
Max (g Au/t)
Uncut Mean
(g Au/t)
High Grade
Capping
Cut Mean
(g Au/t)
# Samples
Cut
% Samples Capped
% Loss Metal Factor
FW 1,261 218.3 6.86 70 6.58 5 0.40% 4.0%
HW 563 141.7 4.04 40 3.77 5 0.89% 6.5%
Alteration 4,426 67.9 0.36 10 0.34 9 0.20% 4.7%
Conglomerate 2,690 42.8 0.16 10 0.14 9 0.33% 6.9%
Metavolcanic 15,949 54.5 0.11 20 0.10 8 0.05% 4.3%
Cherbourg Main 122 32.6 3.54 20 3.14 3 2.46% 11.2%
Cherbourg FW 7 19.4 7.37 None 7.37 0 0.00% 0.0%
Foxear 104 13.6 2.65 None 2.65 0 0.00% 0.0%
Total 25,122 4.7% Notes: % Loss metal factors calculated from length * grade and does not consider the spatial location of the outliers
Figure 14.27: Example of a Probability Plot for the FW Vein
Core sampling was undertaken at 1.0 m intervals and were broken down on visual lithological and alteration
contacts. Considering this, GMS has applied a 1 m compositing run-length split by domain, with any
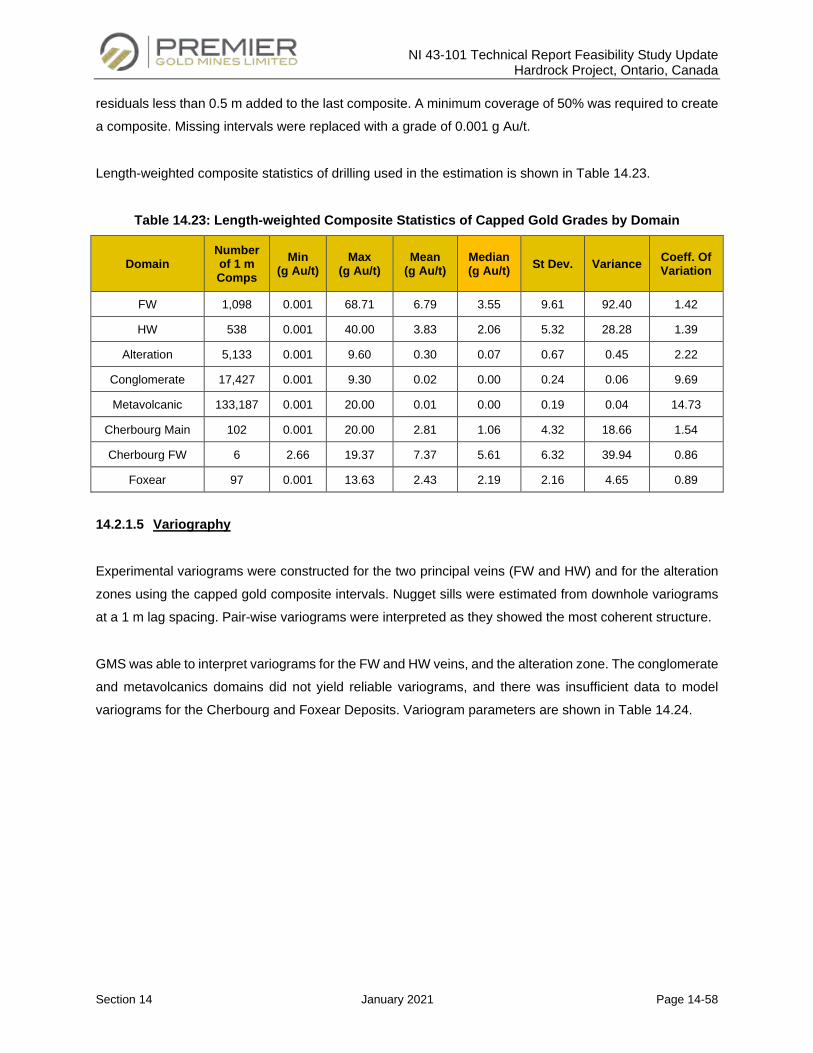
NI 43-101 Technical Report Feasibility Study Update Hardrock Project, Ontario, Canada
Section 14 January 2021 Page 14-58
residuals less than 0.5 m added to the last composite. A minimum coverage of 50% was required to create
a composite. Missing intervals were replaced with a grade of 0.001 g Au/t.
Length-weighted composite statistics of drilling used in the estimation is shown in Table 14.23.
Table 14.23: Length-weighted Composite Statistics of Capped Gold Grades by Domain
Domain Number of 1 m Comps
Min (g Au/t)
Max (g Au/t)
Mean (g Au/t)
Median (g Au/t) St Dev. Variance Coeff. Of
Variation
FW 1,098 0.001 68.71 6.79 3.55 9.61 92.40 1.42
HW 538 0.001 40.00 3.83 2.06 5.32 28.28 1.39
Alteration 5,133 0.001 9.60 0.30 0.07 0.67 0.45 2.22
Conglomerate 17,427 0.001 9.30 0.02 0.00 0.24 0.06 9.69
Metavolcanic 133,187 0.001 20.00 0.01 0.00 0.19 0.04 14.73
Cherbourg Main 102 0.001 20.00 2.81 1.06 4.32 18.66 1.54
Cherbourg FW 6 2.66 19.37 7.37 5.61 6.32 39.94 0.86
Foxear 97 0.001 13.63 2.43 2.19 2.16 4.65 0.89
14.2.1.5 Variography
Experimental variograms were constructed for the two principal veins (FW and HW) and for the alteration
zones using the capped gold composite intervals. Nugget sills were estimated from downhole variograms
at a 1 m lag spacing. Pair-wise variograms were interpreted as they showed the most coherent structure.
GMS was able to interpret variograms for the FW and HW veins, and the alteration zone. The conglomerate
and metavolcanics domains did not yield reliable variograms, and there was insufficient data to model
variograms for the Cherbourg and Foxear Deposits. Variogram parameters are shown in Table 14.24.
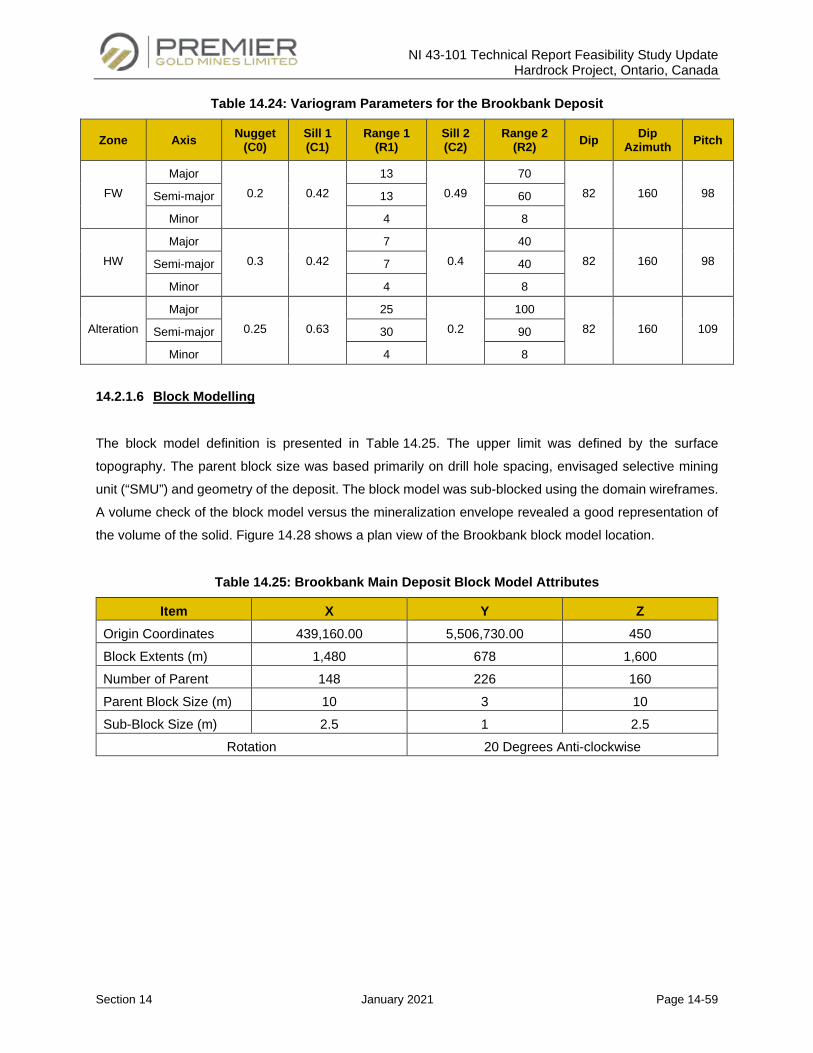
NI 43-101 Technical Report Feasibility Study Update Hardrock Project, Ontario, Canada
Section 14 January 2021 Page 14-59
Table 14.24: Variogram Parameters for the Brookbank Deposit
Zone Axis Nugget (C0)
Sill 1 (C1)
Range 1 (R1)
Sill 2 (C2)
Range 2 (R2) Dip Dip
Azimuth Pitch
FW Major
0.2 0.42 13
0.49 70
82 160 98 Semi-major 13 60
Minor 4 8
HW Major
0.3 0.42 7
0.4 40
82 160 98 Semi-major 7 40
Minor 4 8
Alteration Major
0.25 0.63 25
0.2 100
82 160 109 Semi-major 30 90
Minor 4 8
14.2.1.6 Block Modelling
The block model definition is presented in Table 14.25. The upper limit was defined by the surface
topography. The parent block size was based primarily on drill hole spacing, envisaged selective mining
unit (“SMU”) and geometry of the deposit. The block model was sub-blocked using the domain wireframes.
A volume check of the block model versus the mineralization envelope revealed a good representation of
the volume of the solid. Figure 14.28 shows a plan view of the Brookbank block model location.
Table 14.25: Brookbank Main Deposit Block Model Attributes
Item X Y Z Origin Coordinates 439,160.00 5,506,730.00 450 Block Extents (m) 1,480 678 1,600 Number of Parent
148 226 160
Parent Block Size (m) 10 3 10 Sub-Block Size (m) 2.5 1 2.5
Rotation 20 Degrees Anti-clockwise
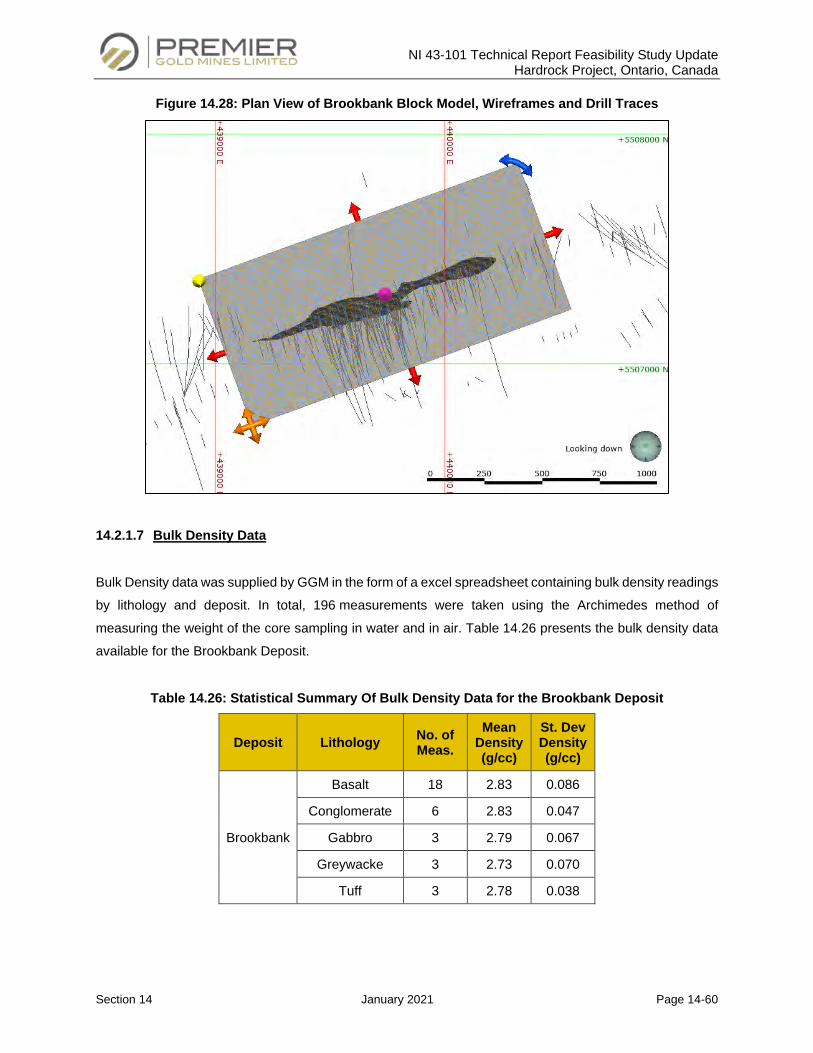
NI 43-101 Technical Report Feasibility Study Update Hardrock Project, Ontario, Canada
Section 14 January 2021 Page 14-60
Figure 14.28: Plan View of Brookbank Block Model, Wireframes and Drill Traces
14.2.1.7 Bulk Density Data
Bulk Density data was supplied by GGM in the form of a excel spreadsheet containing bulk density readings
by lithology and deposit. In total, 196 measurements were taken using the Archimedes method of
measuring the weight of the core sampling in water and in air. Table 14.26 presents the bulk density data
available for the Brookbank Deposit.
Table 14.26: Statistical Summary Of Bulk Density Data for the Brookbank Deposit
Deposit Lithology No. of Meas.
Mean Density (g/cc)
St. Dev Density (g/cc)
Brookbank
Basalt 18 2.83 0.086
Conglomerate 6 2.83 0.047
Gabbro 3 2.79 0.067
Greywacke 3 2.73 0.070
Tuff 3 2.78 0.038
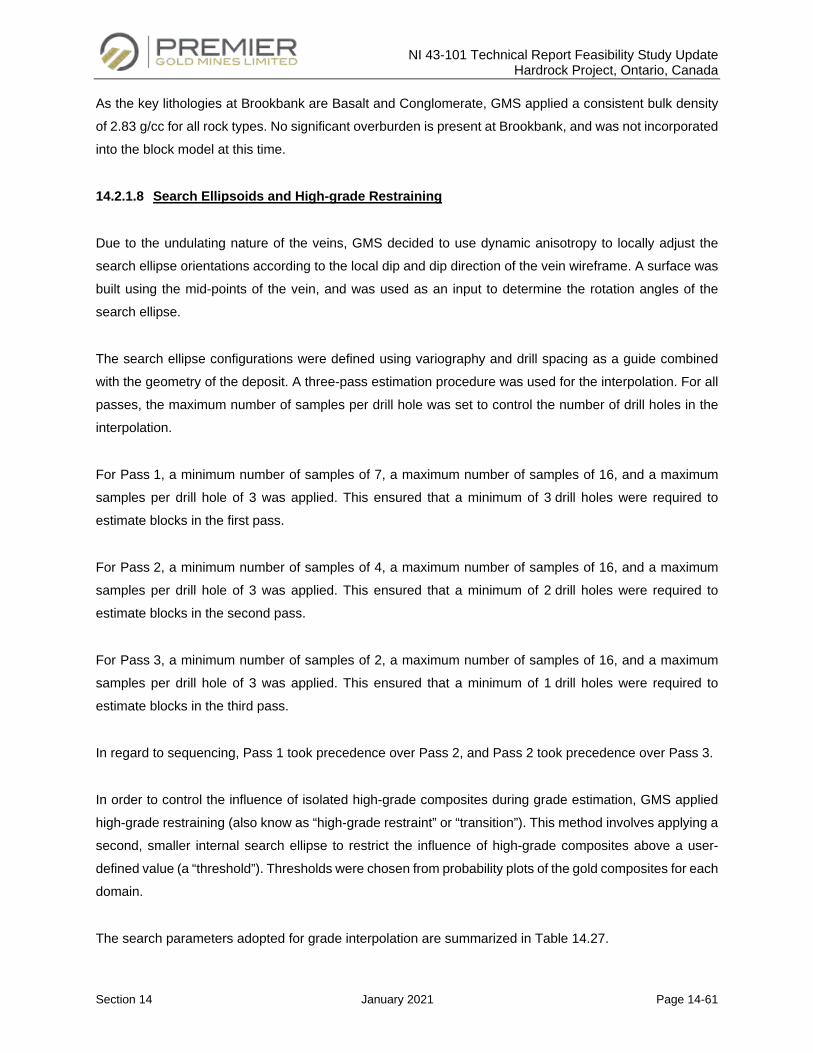
NI 43-101 Technical Report Feasibility Study Update Hardrock Project, Ontario, Canada
Section 14 January 2021 Page 14-61
As the key lithologies at Brookbank are Basalt and Conglomerate, GMS applied a consistent bulk density
of 2.83 g/cc for all rock types. No significant overburden is present at Brookbank, and was not incorporated
into the block model at this time.
14.2.1.8 Search Ellipsoids and High-grade Restraining
Due to the undulating nature of the veins, GMS decided to use dynamic anisotropy to locally adjust the
search ellipse orientations according to the local dip and dip direction of the vein wireframe. A surface was
built using the mid-points of the vein, and was used as an input to determine the rotation angles of the
search ellipse.
The search ellipse configurations were defined using variography and drill spacing as a guide combined
with the geometry of the deposit. A three-pass estimation procedure was used for the interpolation. For all
passes, the maximum number of samples per drill hole was set to control the number of drill holes in the
interpolation.
For Pass 1, a minimum number of samples of 7, a maximum number of samples of 16, and a maximum
samples per drill hole of 3 was applied. This ensured that a minimum of 3 drill holes were required to
estimate blocks in the first pass.
For Pass 2, a minimum number of samples of 4, a maximum number of samples of 16, and a maximum
samples per drill hole of 3 was applied. This ensured that a minimum of 2 drill holes were required to
estimate blocks in the second pass.
For Pass 3, a minimum number of samples of 2, a maximum number of samples of 16, and a maximum
samples per drill hole of 3 was applied. This ensured that a minimum of 1 drill holes were required to
estimate blocks in the third pass.
In regard to sequencing, Pass 1 took precedence over Pass 2, and Pass 2 took precedence over Pass 3.
In order to control the influence of isolated high-grade composites during grade estimation, GMS applied
high-grade restraining (also know as “high-grade restraint” or “transition”). This method involves applying a
second, smaller internal search ellipse to restrict the influence of high-grade composites above a user-
defined value (a “threshold”). Thresholds were chosen from probability plots of the gold composites for each
domain.
The search parameters adopted for grade interpolation are summarized in Table 14.27.
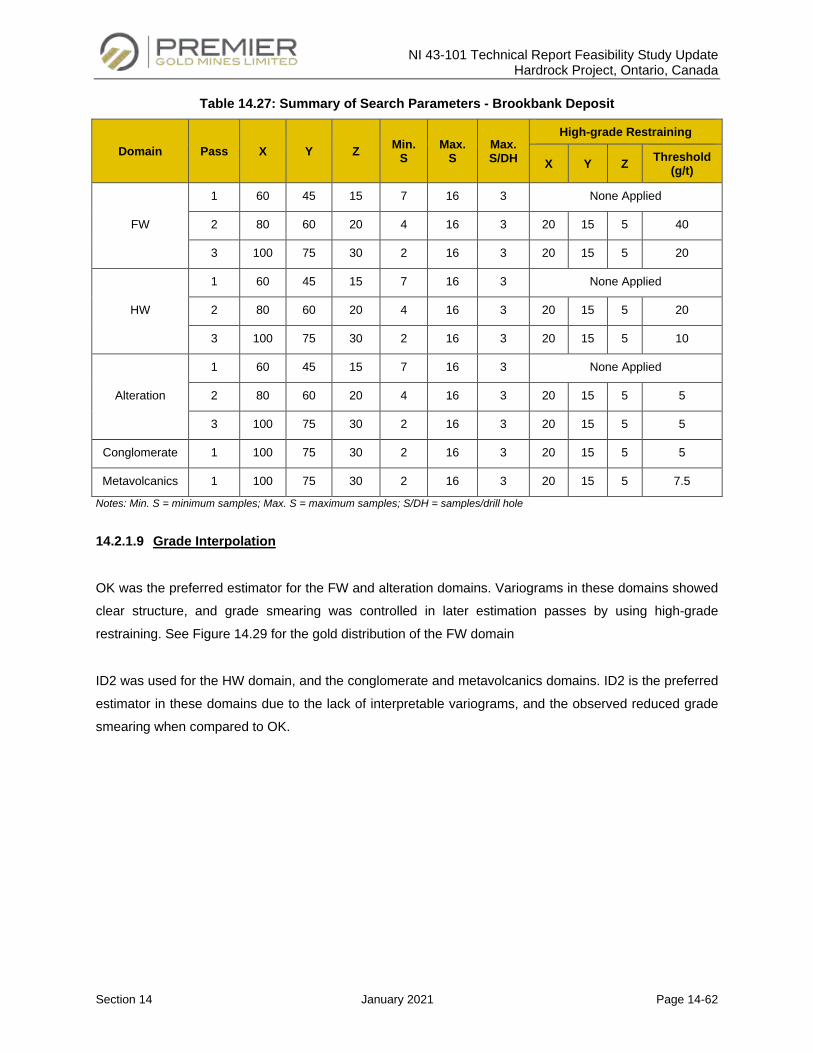
NI 43-101 Technical Report Feasibility Study Update Hardrock Project, Ontario, Canada
Section 14 January 2021 Page 14-62
Table 14.27: Summary of Search Parameters - Brookbank Deposit
Domain Pass X Y Z Min. S
Max. S
Max. S/DH
High-grade Restraining
X Y Z Threshold (g/t)
FW
1 60 45 15 7 16 3 None Applied
2 80 60 20 4 16 3 20 15 5 40
3 100 75 30 2 16 3 20 15 5 20
HW
1 60 45 15 7 16 3 None Applied
2 80 60 20 4 16 3 20 15 5 20
3 100 75 30 2 16 3 20 15 5 10
Alteration
1 60 45 15 7 16 3 None Applied
2 80 60 20 4 16 3 20 15 5 5
3 100 75 30 2 16 3 20 15 5 5
Conglomerate 1 100 75 30 2 16 3 20 15 5 5
Metavolcanics 1 100 75 30 2 16 3 20 15 5 7.5
Notes: Min. S = minimum samples; Max. S = maximum samples; S/DH = samples/drill hole
14.2.1.9 Grade Interpolation
OK was the preferred estimator for the FW and alteration domains. Variograms in these domains showed
clear structure, and grade smearing was controlled in later estimation passes by using high-grade
restraining. See Figure 14.29 for the gold distribution of the FW domain
ID2 was used for the HW domain, and the conglomerate and metavolcanics domains. ID2 is the preferred
estimator in these domains due to the lack of interpretable variograms, and the observed reduced grade
smearing when compared to OK.
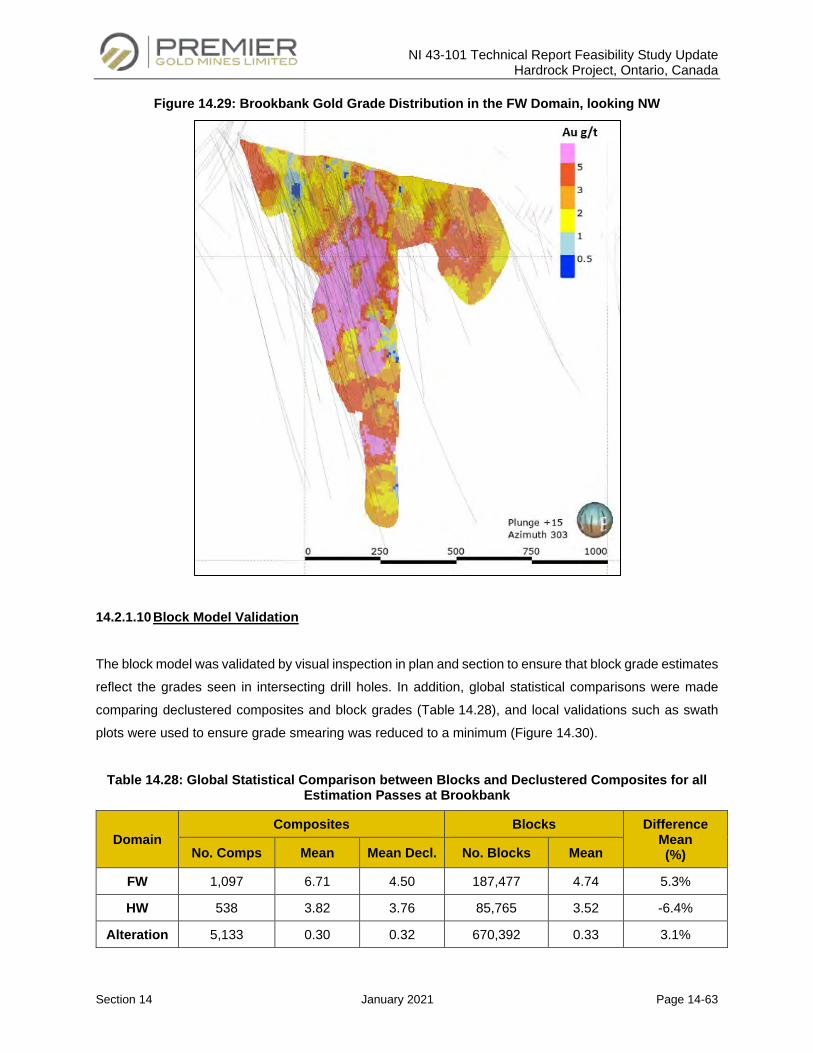
NI 43-101 Technical Report Feasibility Study Update Hardrock Project, Ontario, Canada
Section 14 January 2021 Page 14-63
Figure 14.29: Brookbank Gold Grade Distribution in the FW Domain, looking NW
14.2.1.10 Block Model Validation
The block model was validated by visual inspection in plan and section to ensure that block grade estimates
reflect the grades seen in intersecting drill holes. In addition, global statistical comparisons were made
comparing declustered composites and block grades (Table 14.28), and local validations such as swath
plots were used to ensure grade smearing was reduced to a minimum (Figure 14.30).
Table 14.28: Global Statistical Comparison between Blocks and Declustered Composites for all Estimation Passes at Brookbank
Domain Composites Blocks Difference
Mean (%) No. Comps Mean Mean Decl. No. Blocks Mean
FW 1,097 6.71 4.50 187,477 4.74 5.3%
HW 538 3.82 3.76 85,765 3.52 -6.4%
Alteration 5,133 0.30 0.32 670,392 0.33 3.1%
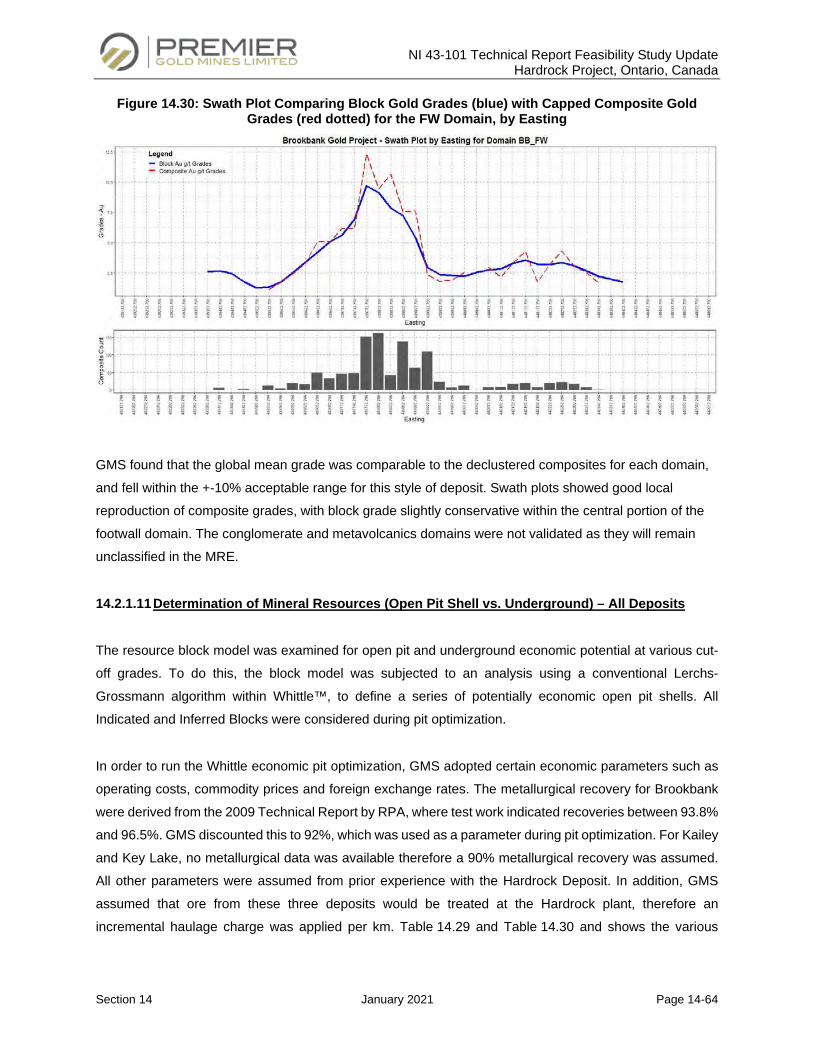
NI 43-101 Technical Report Feasibility Study Update Hardrock Project, Ontario, Canada
Section 14 January 2021 Page 14-64
Figure 14.30: Swath Plot Comparing Block Gold Grades (blue) with Capped Composite Gold Grades (red dotted) for the FW Domain, by Easting
GMS found that the global mean grade was comparable to the declustered composites for each domain,
and fell within the +-10% acceptable range for this style of deposit. Swath plots showed good local
reproduction of composite grades, with block grade slightly conservative within the central portion of the
footwall domain. The conglomerate and metavolcanics domains were not validated as they will remain
unclassified in the MRE.
14.2.1.11 Determination of Mineral Resources (Open Pit Shell vs. Underground) – All Deposits
The resource block model was examined for open pit and underground economic potential at various cut-
off grades. To do this, the block model was subjected to an analysis using a conventional Lerchs-
Grossmann algorithm within Whittle™, to define a series of potentially economic open pit shells. All
Indicated and Inferred Blocks were considered during pit optimization.
In order to run the Whittle economic pit optimization, GMS adopted certain economic parameters such as
operating costs, commodity prices and foreign exchange rates. The metallurgical recovery for Brookbank
were derived from the 2009 Technical Report by RPA, where test work indicated recoveries between 93.8%
and 96.5%. GMS discounted this to 92%, which was used as a parameter during pit optimization. For Kailey
and Key Lake, no metallurgical data was available therefore a 90% metallurgical recovery was assumed.
All other parameters were assumed from prior experience with the Hardrock Deposit. In addition, GMS
assumed that ore from these three deposits would be treated at the Hardrock plant, therefore an
incremental haulage charge was applied per km. Table 14.29 and Table 14.30 and shows the various
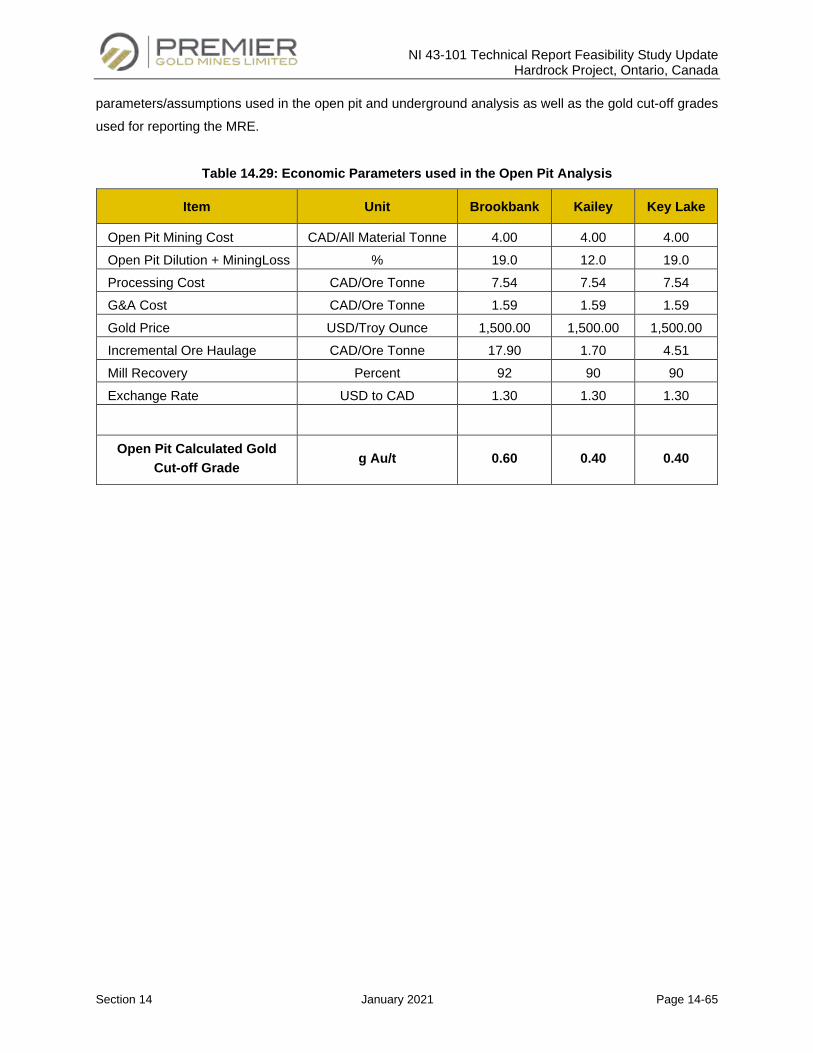
NI 43-101 Technical Report Feasibility Study Update Hardrock Project, Ontario, Canada
Section 14 January 2021 Page 14-65
parameters/assumptions used in the open pit and underground analysis as well as the gold cut-off grades
used for reporting the MRE.
Table 14.29: Economic Parameters used in the Open Pit Analysis
Item Unit Brookbank Kailey Key Lake
Open Pit Mining Cost CAD/All Material Tonne 4.00 4.00 4.00 Open Pit Dilution + MiningLoss % 19.0 12.0 19.0 Processing Cost CAD/Ore Tonne 7.54 7.54 7.54 G&A Cost CAD/Ore Tonne 1.59 1.59 1.59 Gold Price USD/Troy Ounce 1,500.00 1,500.00 1,500.00 Incremental Ore Haulage CAD/Ore Tonne 17.90 1.70 4.51 Mill Recovery Percent 92 90 90 Exchange Rate USD to CAD 1.30 1.30 1.30
Open Pit Calculated Gold Cut-off Grade
g Au/t 0.60 0.40 0.40
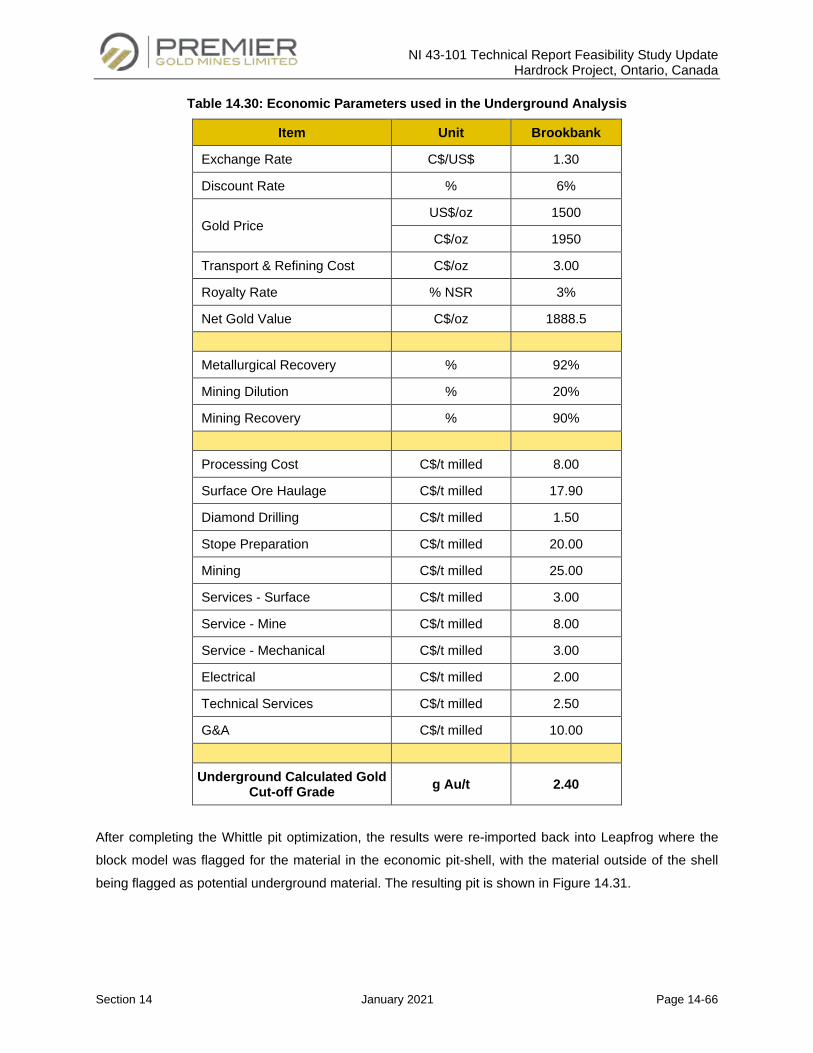
NI 43-101 Technical Report Feasibility Study Update Hardrock Project, Ontario, Canada
Section 14 January 2021 Page 14-66
Table 14.30: Economic Parameters used in the Underground Analysis
Item Unit Brookbank
Exchange Rate C$/US$ 1.30
Discount Rate % 6%
Gold Price US$/oz 1500
C$/oz 1950
Transport & Refining Cost C$/oz 3.00
Royalty Rate % NSR 3%
Net Gold Value C$/oz 1888.5
Metallurgical Recovery % 92%
Mining Dilution % 20%
Mining Recovery % 90%
Processing Cost C$/t milled 8.00
Surface Ore Haulage C$/t milled 17.90
Diamond Drilling C$/t milled 1.50
Stope Preparation C$/t milled 20.00
Mining C$/t milled 25.00
Services - Surface C$/t milled 3.00
Service - Mine C$/t milled 8.00
Service - Mechanical C$/t milled 3.00
Electrical C$/t milled 2.00
Technical Services C$/t milled 2.50
G&A C$/t milled 10.00
Underground Calculated Gold Cut-off Grade g Au/t 2.40
After completing the Whittle pit optimization, the results were re-imported back into Leapfrog where the
block model was flagged for the material in the economic pit-shell, with the material outside of the shell
being flagged as potential underground material. The resulting pit is shown in Figure 14.31.
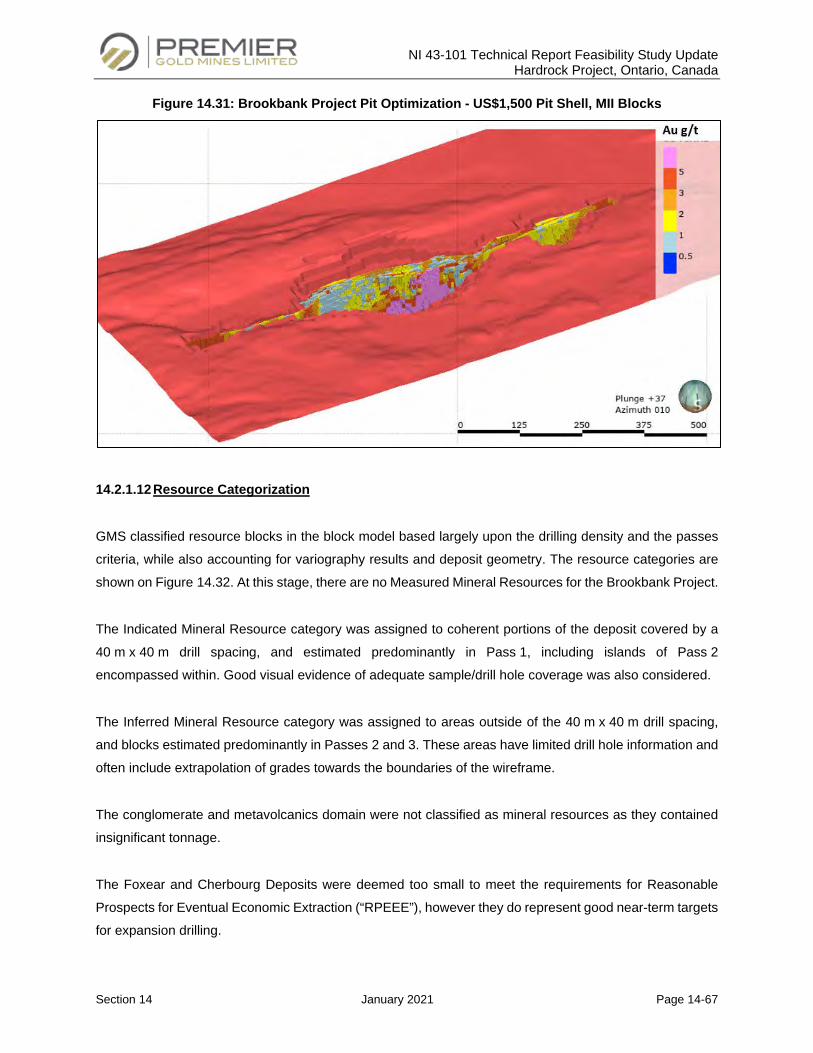
NI 43-101 Technical Report Feasibility Study Update Hardrock Project, Ontario, Canada
Section 14 January 2021 Page 14-67
Figure 14.31: Brookbank Project Pit Optimization - US$1,500 Pit Shell, MII Blocks
14.2.1.12 Resource Categorization
GMS classified resource blocks in the block model based largely upon the drilling density and the passes
criteria, while also accounting for variography results and deposit geometry. The resource categories are
shown on Figure 14.32. At this stage, there are no Measured Mineral Resources for the Brookbank Project.
The Indicated Mineral Resource category was assigned to coherent portions of the deposit covered by a
40 m x 40 m drill spacing, and estimated predominantly in Pass 1, including islands of Pass 2
encompassed within. Good visual evidence of adequate sample/drill hole coverage was also considered.
The Inferred Mineral Resource category was assigned to areas outside of the 40 m x 40 m drill spacing,
and blocks estimated predominantly in Passes 2 and 3. These areas have limited drill hole information and
often include extrapolation of grades towards the boundaries of the wireframe.
The conglomerate and metavolcanics domain were not classified as mineral resources as they contained
insignificant tonnage.
The Foxear and Cherbourg Deposits were deemed too small to meet the requirements for Reasonable
Prospects for Eventual Economic Extraction (“RPEEE”), however they do represent good near-term targets
for expansion drilling.
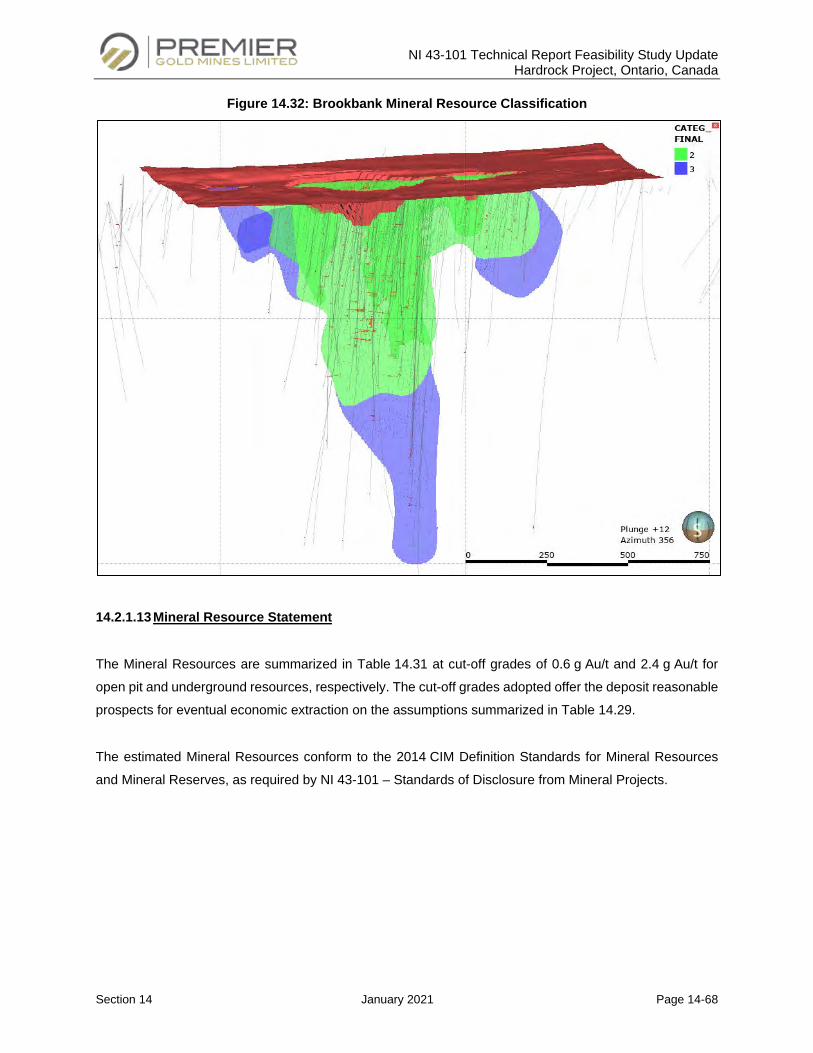
NI 43-101 Technical Report Feasibility Study Update Hardrock Project, Ontario, Canada
Section 14 January 2021 Page 14-68
Figure 14.32: Brookbank Mineral Resource Classification
14.2.1.13 Mineral Resource Statement
The Mineral Resources are summarized in Table 14.31 at cut-off grades of 0.6 g Au/t and 2.4 g Au/t for
open pit and underground resources, respectively. The cut-off grades adopted offer the deposit reasonable
prospects for eventual economic extraction on the assumptions summarized in Table 14.29.
The estimated Mineral Resources conform to the 2014 CIM Definition Standards for Mineral Resources
and Mineral Reserves, as required by NI 43-101 – Standards of Disclosure from Mineral Projects.
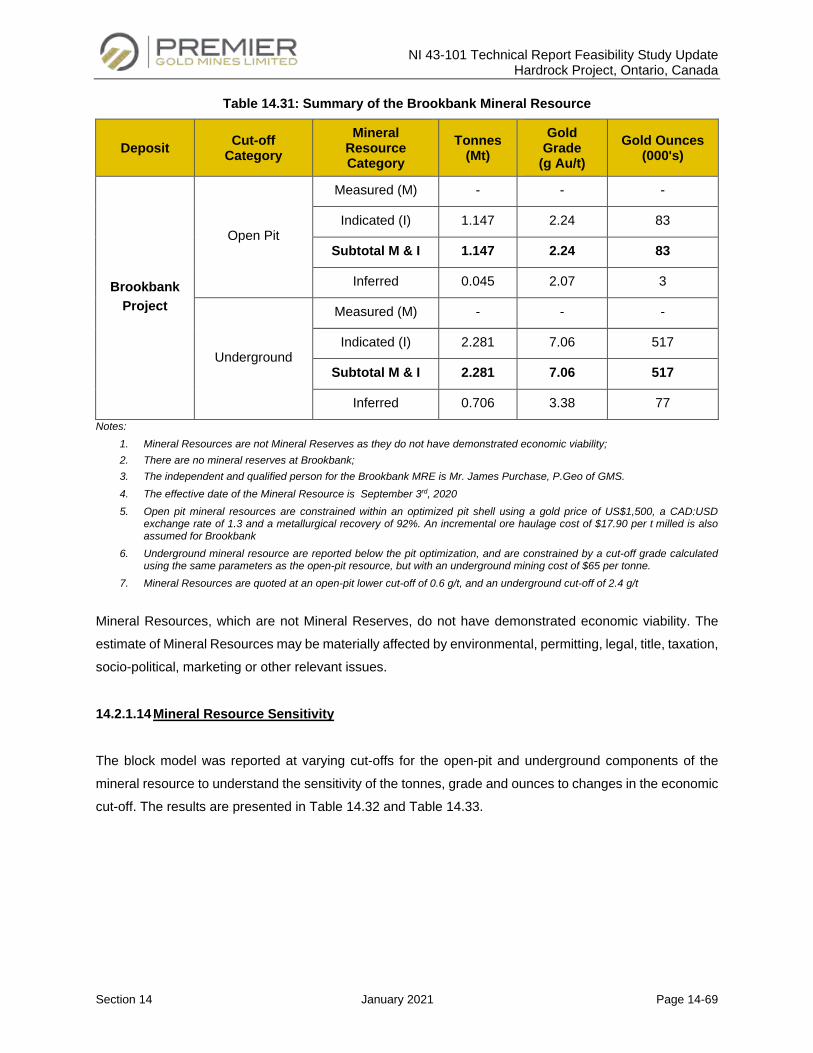
NI 43-101 Technical Report Feasibility Study Update Hardrock Project, Ontario, Canada
Section 14 January 2021 Page 14-69
Table 14.31: Summary of the Brookbank Mineral Resource
Deposit Cut-off Category
Mineral Resource Category
Tonnes (Mt)
Gold Grade
(g Au/t) Gold Ounces
(000's)
Brookbank Project
Open Pit
Measured (M) - - -
Indicated (I) 1.147 2.24 83
Subtotal M & I 1.147 2.24 83
Inferred 0.045 2.07 3
Underground
Measured (M) - - -
Indicated (I) 2.281 7.06 517
Subtotal M & I 2.281 7.06 517
Inferred 0.706 3.38 77 Notes:
1. Mineral Resources are not Mineral Reserves as they do not have demonstrated economic viability; 2. There are no mineral reserves at Brookbank; 3. The independent and qualified person for the Brookbank MRE is Mr. James Purchase, P.Geo of GMS.
4. The effective date of the Mineral Resource is September 3rd, 2020
5. Open pit mineral resources are constrained within an optimized pit shell using a gold price of US$1,500, a CAD:USD exchange rate of 1.3 and a metallurgical recovery of 92%. An incremental ore haulage cost of $17.90 per t milled is also assumed for Brookbank
6. Underground mineral resource are reported below the pit optimization, and are constrained by a cut-off grade calculated using the same parameters as the open-pit resource, but with an underground mining cost of $65 per tonne.
7. Mineral Resources are quoted at an open-pit lower cut-off of 0.6 g/t, and an underground cut-off of 2.4 g/t
Mineral Resources, which are not Mineral Reserves, do not have demonstrated economic viability. The
estimate of Mineral Resources may be materially affected by environmental, permitting, legal, title, taxation,
socio-political, marketing or other relevant issues.
14.2.1.14 Mineral Resource Sensitivity
The block model was reported at varying cut-offs for the open-pit and underground components of the
mineral resource to understand the sensitivity of the tonnes, grade and ounces to changes in the economic
cut-off. The results are presented in Table 14.32 and Table 14.33.
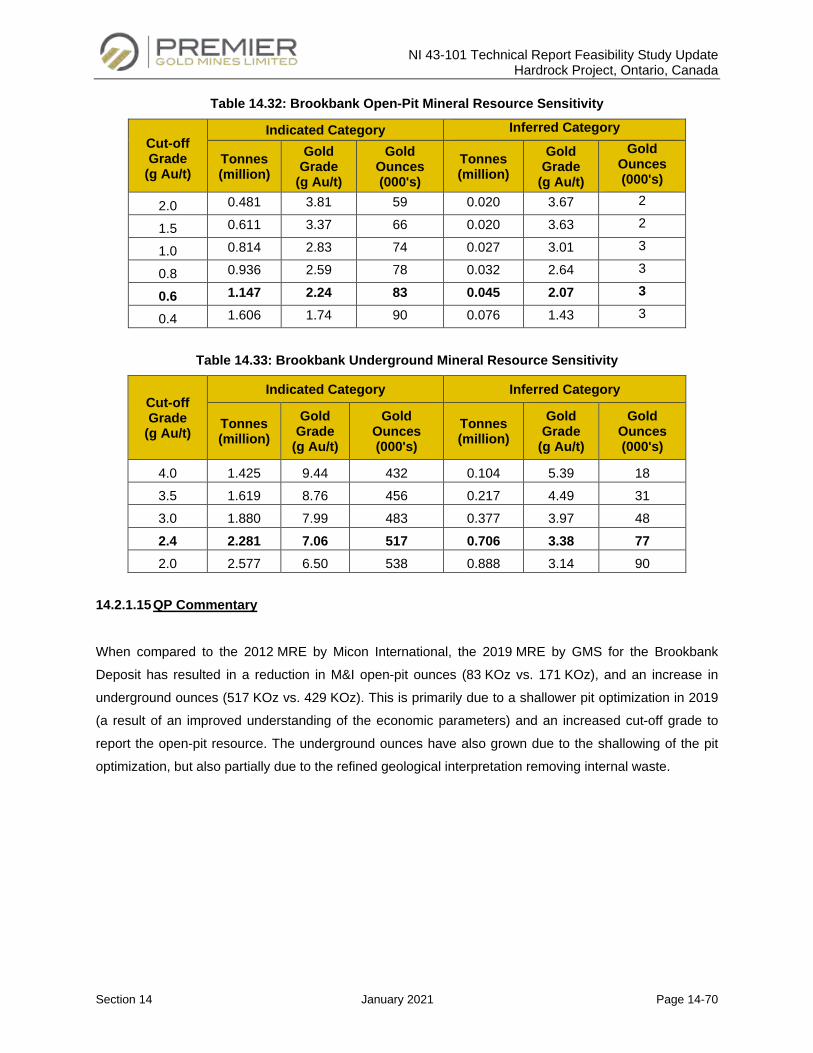
NI 43-101 Technical Report Feasibility Study Update Hardrock Project, Ontario, Canada
Section 14 January 2021 Page 14-70
Table 14.32: Brookbank Open-Pit Mineral Resource Sensitivity
Cut-off Grade
(g Au/t)
Indicated Category Inferred Category
Tonnes (million)
Gold Grade
(g Au/t)
Gold Ounces (000's)
Tonnes (million)
Gold Grade
(g Au/t)
Gold Ounces (000's)
2.0 0.481 3.81 59 0.020 3.67 2
1.5 0.611 3.37 66 0.020 3.63 2
1.0 0.814 2.83 74 0.027 3.01 3
0.8 0.936 2.59 78 0.032 2.64 3
0.6 1.147 2.24 83 0.045 2.07 3
0.4 1.606 1.74 90 0.076 1.43 3
Table 14.33: Brookbank Underground Mineral Resource Sensitivity
Cut-off Grade
(g Au/t)
Indicated Category Inferred Category
Tonnes (million)
Gold Grade
(g Au/t)
Gold Ounces (000's)
Tonnes (million)
Gold Grade
(g Au/t)
Gold Ounces (000's)
4.0 1.425 9.44 432 0.104 5.39 18 3.5 1.619 8.76 456 0.217 4.49 31 3.0 1.880 7.99 483 0.377 3.97 48 2.4 2.281 7.06 517 0.706 3.38 77 2.0 2.577 6.50 538 0.888 3.14 90
14.2.1.15 QP Commentary
When compared to the 2012 MRE by Micon International, the 2019 MRE by GMS for the Brookbank
Deposit has resulted in a reduction in M&I open-pit ounces (83 KOz vs. 171 KOz), and an increase in
underground ounces (517 KOz vs. 429 KOz). This is primarily due to a shallower pit optimization in 2019
(a result of an improved understanding of the economic parameters) and an increased cut-off grade to
report the open-pit resource. The underground ounces have also grown due to the shallowing of the pit
optimization, but also partially due to the refined geological interpretation removing internal waste.
NI 43-101 Technical Report Feasibility Study Update Hardrock Project, Ontario, Canada
Section 14 January 2021 Page 14-71
14.2.2 Key Lake
14.2.2.1 Drill hole Database
The Key Lake Deposit has been tested by diamond drilling over a strike length of 2,300 m and down to a
vertical depth of 300 m. The Key Lake drill hole database includes 312 drill holes totalling 63,919 for which
23,112 m was assayed.
The drill holes are generally on a 50 m grid spacing in the central and eastern portions of the deposit, with
some areas infilled to 25 m. The western portion of the deposit is drilled at 100 m spacing. The main
components of the database are the collar, survey, assay and lithology tables which were validated as
described in Subsection 12.2.
14.2.2.2 Topography
Topography was supplied by GGM in the form of a wireframe with a spatial resolution of 10 m. The
topography matched well with the drill hole collars, with no major discrepancies identified.
14.2.2.3 Geological Modelling Approach
The Key Lake gold deposit is hosted with a package of sediments (greywacke and arkose), iron formations
and narrow porphyry dykes. Mineralization generally follows the regional foliation, aligned with the porphyry
dyke that acts as a marker horizon. The deposit shows both structural and lithological controls, with
mineralization hosted predominantly in the arkosic units and felsic dykes. Only small amount of
mineralization is found in the iron formations. Gold mineralization occurs within multiple quartz-carbonate
stringers and fine sulphide disseminations that results in sub-vertical, erratic zones that are difficult to
interpret.
The Key Lake Deposit has been modelled as twelve discrete, continuous zones named KL-1 to KL-12
(Figure 14.33). The zones are generally wide therefore no minimum mining thickness was considered
during modelling (Figure 14.34). An overburden surface was also modelled from the lithology logging, and
varies between 10 m and 20 m thick above the deposit.
The Dome-era drilling were used in the interpretation but excluded from the estimation as the assays and
drill hole locations could not be verified. Five additional holes were also ignored from the Goldstone-era
drilling due to unusual drill traces and erroneous surveys. These holes are KL-10-007B, KL-10-014, KL-10-
051, KL-11-099 and KL-11-123.
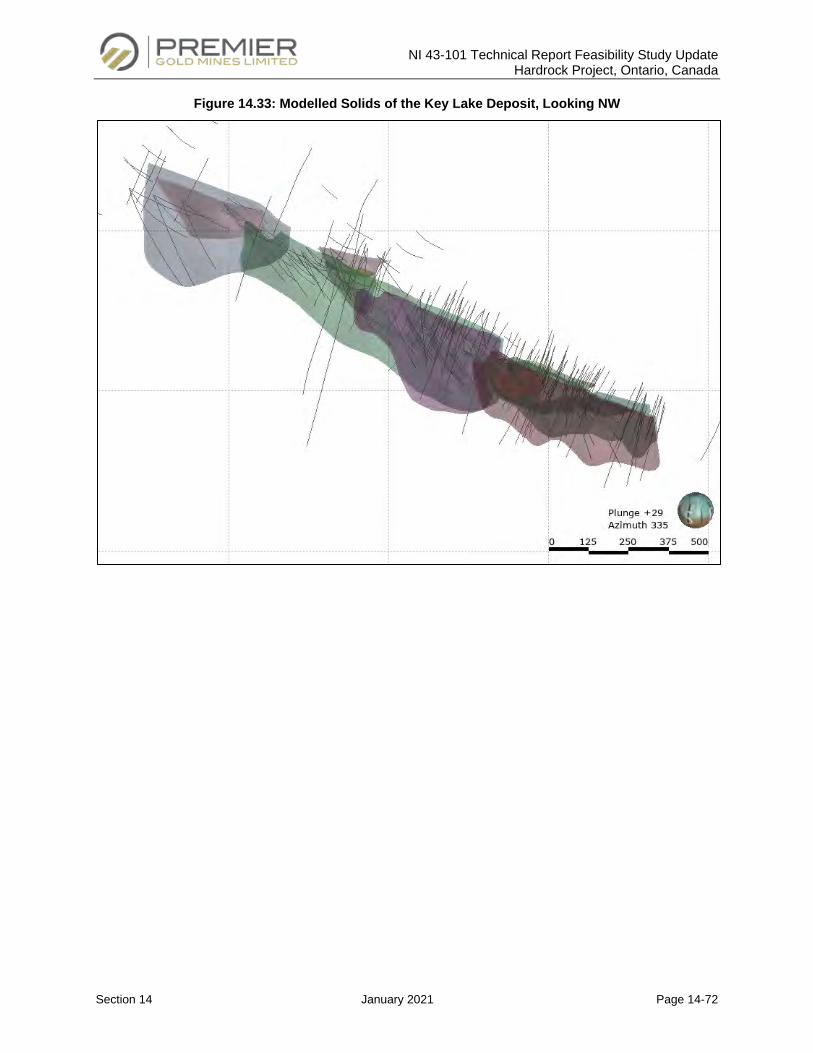
NI 43-101 Technical Report Feasibility Study Update Hardrock Project, Ontario, Canada
Section 14 January 2021 Page 14-72
Figure 14.33: Modelled Solids of the Key Lake Deposit, Looking NW
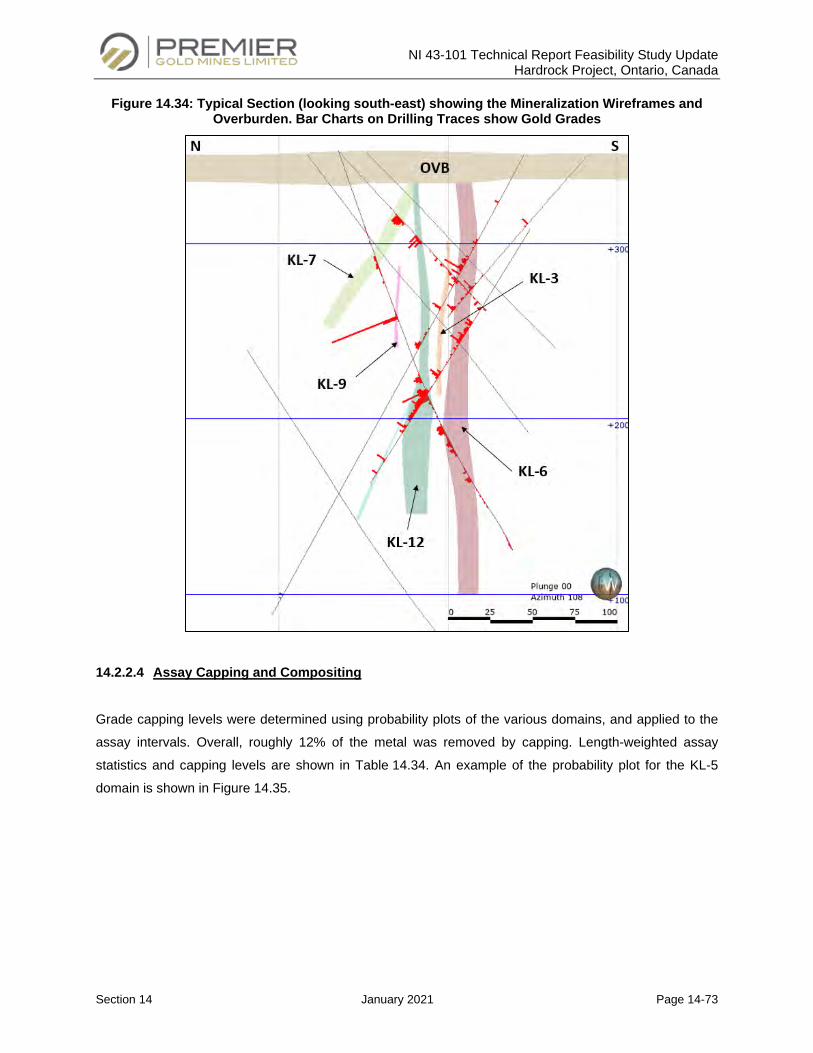
NI 43-101 Technical Report Feasibility Study Update Hardrock Project, Ontario, Canada
Section 14 January 2021 Page 14-73
Figure 14.34: Typical Section (looking south-east) showing the Mineralization Wireframes and Overburden. Bar Charts on Drilling Traces show Gold Grades
14.2.2.4 Assay Capping and Compositing
Grade capping levels were determined using probability plots of the various domains, and applied to the
assay intervals. Overall, roughly 12% of the metal was removed by capping. Length-weighted assay
statistics and capping levels are shown in Table 14.34. An example of the probability plot for the KL-5
domain is shown in Figure 14.35.
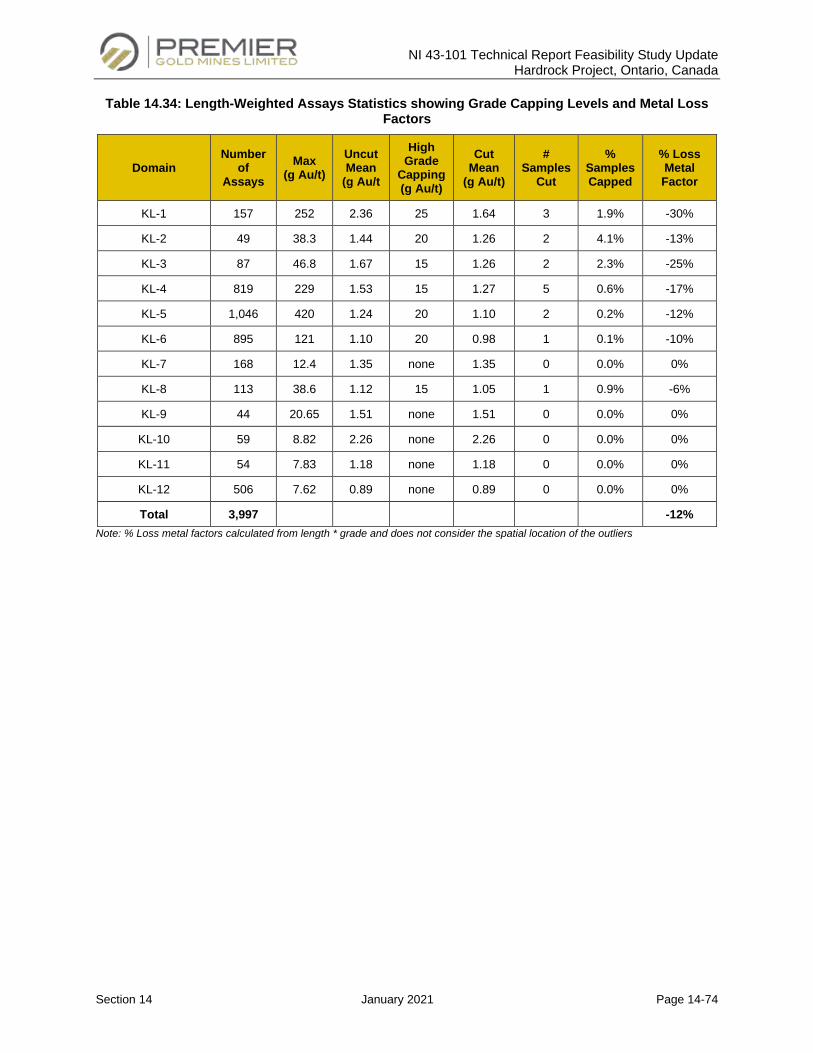
NI 43-101 Technical Report Feasibility Study Update Hardrock Project, Ontario, Canada
Section 14 January 2021 Page 14-74
Table 14.34: Length-Weighted Assays Statistics showing Grade Capping Levels and Metal Loss Factors
Domain Number
of Assays
Max (g Au/t)
Uncut Mean
(g Au/t
High Grade
Capping (g Au/t)
Cut Mean
(g Au/t)
# Samples
Cut
% Samples Capped
% Loss Metal Factor
KL-1 157 252 2.36 25 1.64 3 1.9% -30%
KL-2 49 38.3 1.44 20 1.26 2 4.1% -13%
KL-3 87 46.8 1.67 15 1.26 2 2.3% -25%
KL-4 819 229 1.53 15 1.27 5 0.6% -17%
KL-5 1,046 420 1.24 20 1.10 2 0.2% -12%
KL-6 895 121 1.10 20 0.98 1 0.1% -10%
KL-7 168 12.4 1.35 none 1.35 0 0.0% 0%
KL-8 113 38.6 1.12 15 1.05 1 0.9% -6%
KL-9 44 20.65 1.51 none 1.51 0 0.0% 0%
KL-10 59 8.82 2.26 none 2.26 0 0.0% 0%
KL-11 54 7.83 1.18 none 1.18 0 0.0% 0%
KL-12 506 7.62 0.89 none 0.89 0 0.0% 0%
Total 3,997 -12% Note: % Loss metal factors calculated from length * grade and does not consider the spatial location of the outliers
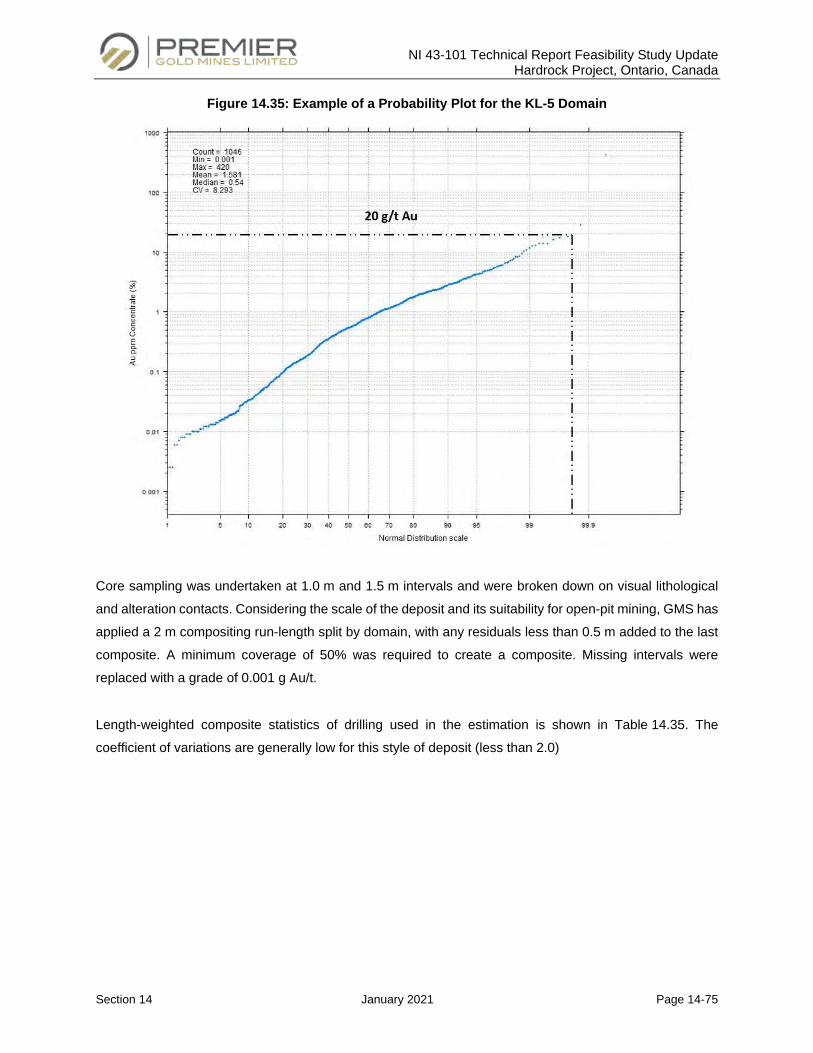
NI 43-101 Technical Report Feasibility Study Update Hardrock Project, Ontario, Canada
Section 14 January 2021 Page 14-75
Figure 14.35: Example of a Probability Plot for the KL-5 Domain
Core sampling was undertaken at 1.0 m and 1.5 m intervals and were broken down on visual lithological
and alteration contacts. Considering the scale of the deposit and its suitability for open-pit mining, GMS has
applied a 2 m compositing run-length split by domain, with any residuals less than 0.5 m added to the last
composite. A minimum coverage of 50% was required to create a composite. Missing intervals were
replaced with a grade of 0.001 g Au/t.
Length-weighted composite statistics of drilling used in the estimation is shown in Table 14.35. The
coefficient of variations are generally low for this style of deposit (less than 2.0)
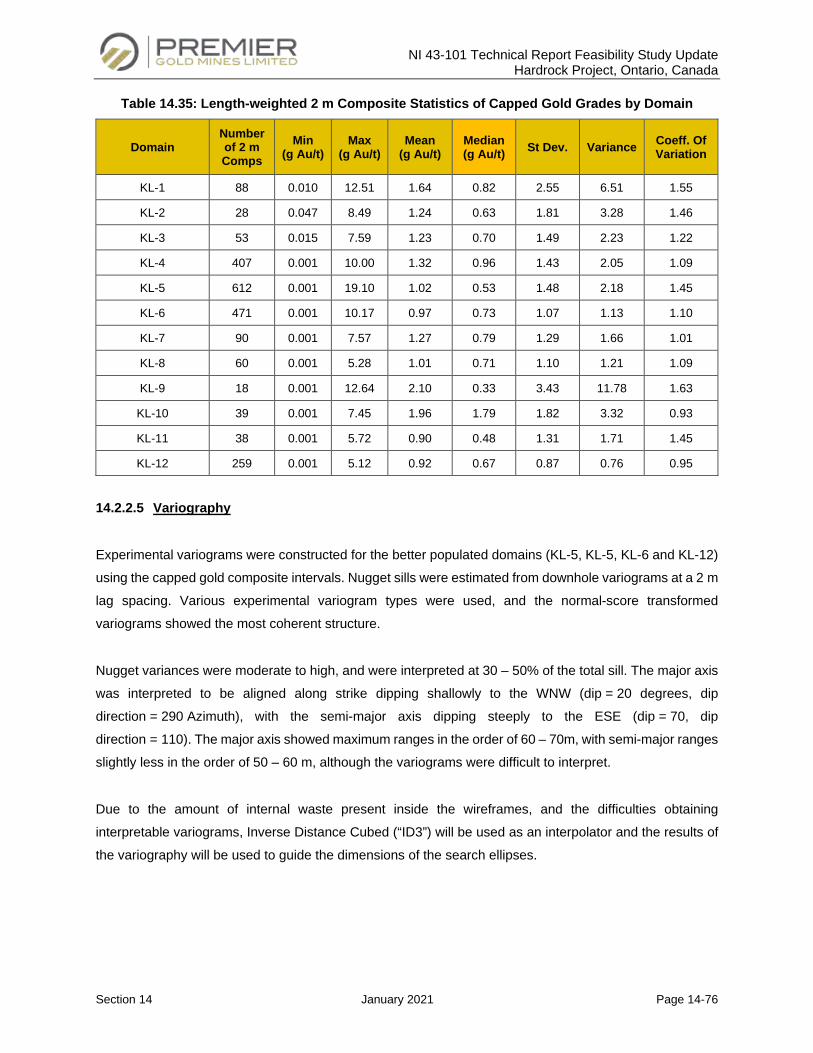
NI 43-101 Technical Report Feasibility Study Update Hardrock Project, Ontario, Canada
Section 14 January 2021 Page 14-76
Table 14.35: Length-weighted 2 m Composite Statistics of Capped Gold Grades by Domain
Domain Number of 2 m Comps
Min (g Au/t)
Max (g Au/t)
Mean (g Au/t)
Median (g Au/t) St Dev. Variance Coeff. Of
Variation
KL-1 88 0.010 12.51 1.64 0.82 2.55 6.51 1.55
KL-2 28 0.047 8.49 1.24 0.63 1.81 3.28 1.46
KL-3 53 0.015 7.59 1.23 0.70 1.49 2.23 1.22
KL-4 407 0.001 10.00 1.32 0.96 1.43 2.05 1.09
KL-5 612 0.001 19.10 1.02 0.53 1.48 2.18 1.45
KL-6 471 0.001 10.17 0.97 0.73 1.07 1.13 1.10
KL-7 90 0.001 7.57 1.27 0.79 1.29 1.66 1.01
KL-8 60 0.001 5.28 1.01 0.71 1.10 1.21 1.09
KL-9 18 0.001 12.64 2.10 0.33 3.43 11.78 1.63
KL-10 39 0.001 7.45 1.96 1.79 1.82 3.32 0.93
KL-11 38 0.001 5.72 0.90 0.48 1.31 1.71 1.45
KL-12 259 0.001 5.12 0.92 0.67 0.87 0.76 0.95
14.2.2.5 Variography
Experimental variograms were constructed for the better populated domains (KL-5, KL-5, KL-6 and KL-12)
using the capped gold composite intervals. Nugget sills were estimated from downhole variograms at a 2 m
lag spacing. Various experimental variogram types were used, and the normal-score transformed
variograms showed the most coherent structure.
Nugget variances were moderate to high, and were interpreted at 30 – 50% of the total sill. The major axis
was interpreted to be aligned along strike dipping shallowly to the WNW (dip = 20 degrees, dip
direction = 290 Azimuth), with the semi-major axis dipping steeply to the ESE (dip = 70, dip
direction = 110). The major axis showed maximum ranges in the order of 60 – 70m, with semi-major ranges
slightly less in the order of 50 – 60 m, although the variograms were difficult to interpret.
Due to the amount of internal waste present inside the wireframes, and the difficulties obtaining
interpretable variograms, Inverse Distance Cubed (“ID3”) will be used as an interpolator and the results of
the variography will be used to guide the dimensions of the search ellipses.
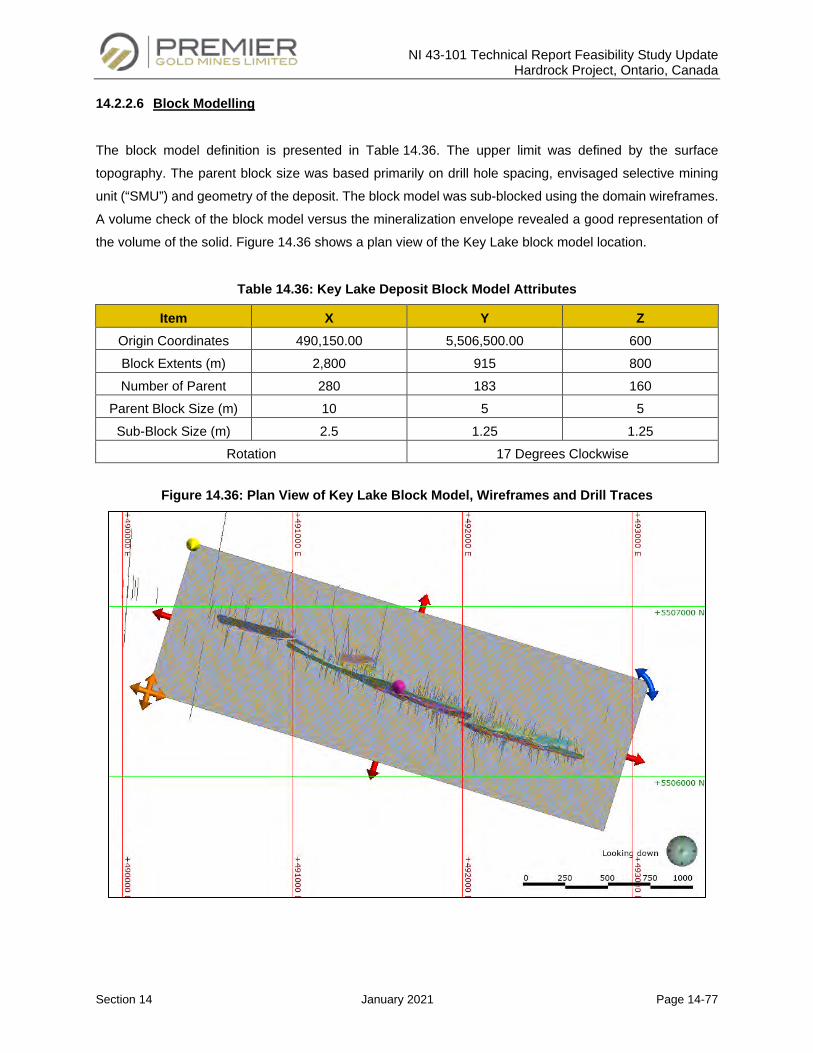
NI 43-101 Technical Report Feasibility Study Update Hardrock Project, Ontario, Canada
Section 14 January 2021 Page 14-77
14.2.2.6 Block Modelling
The block model definition is presented in Table 14.36. The upper limit was defined by the surface
topography. The parent block size was based primarily on drill hole spacing, envisaged selective mining
unit (“SMU”) and geometry of the deposit. The block model was sub-blocked using the domain wireframes.
A volume check of the block model versus the mineralization envelope revealed a good representation of
the volume of the solid. Figure 14.36 shows a plan view of the Key Lake block model location.
Table 14.36: Key Lake Deposit Block Model Attributes
Item X Y Z Origin Coordinates 490,150.00 5,506,500.00 600 Block Extents (m) 2,800 915 800 Number of Parent
280 183 160
Parent Block Size (m) 10 5 5 Sub-Block Size (m) 2.5 1.25 1.25
Rotation 17 Degrees Clockwise
Figure 14.36: Plan View of Key Lake Block Model, Wireframes and Drill Traces
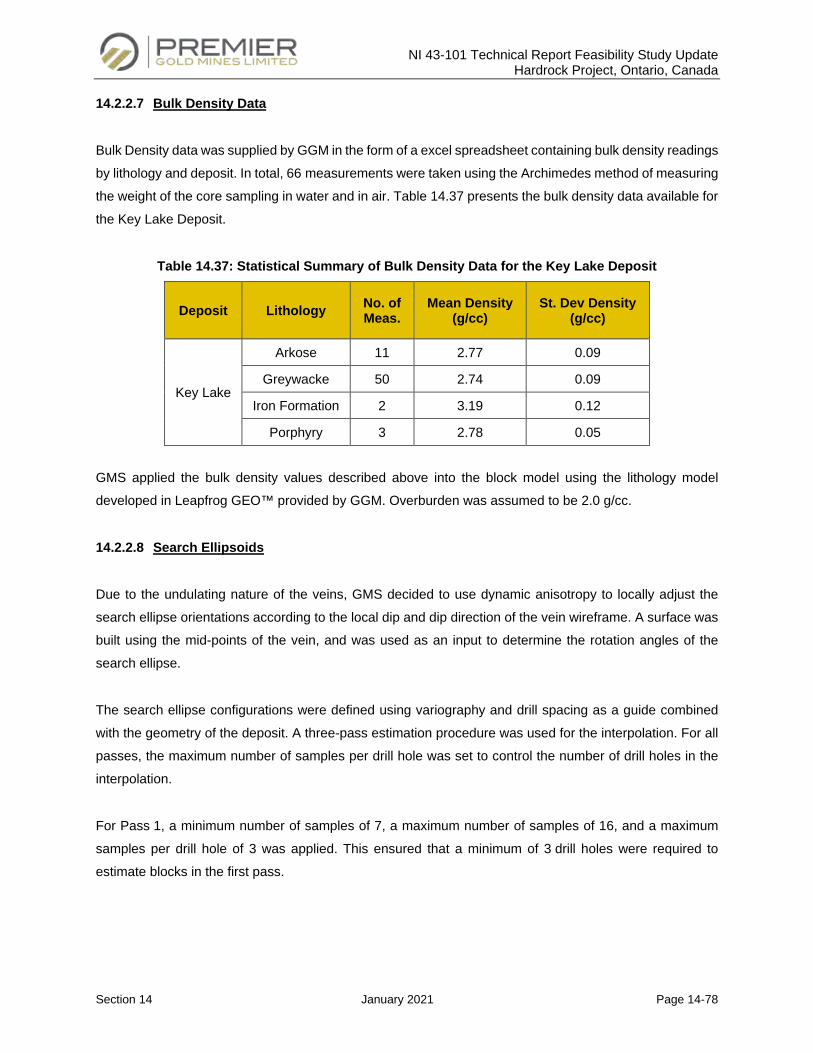
NI 43-101 Technical Report Feasibility Study Update Hardrock Project, Ontario, Canada
Section 14 January 2021 Page 14-78
14.2.2.7 Bulk Density Data
Bulk Density data was supplied by GGM in the form of a excel spreadsheet containing bulk density readings
by lithology and deposit. In total, 66 measurements were taken using the Archimedes method of measuring
the weight of the core sampling in water and in air. Table 14.37 presents the bulk density data available for
the Key Lake Deposit.
Table 14.37: Statistical Summary of Bulk Density Data for the Key Lake Deposit
Deposit Lithology No. of Meas.
Mean Density (g/cc)
St. Dev Density (g/cc)
Key Lake
Arkose 11 2.77 0.09
Greywacke 50 2.74 0.09
Iron Formation 2 3.19 0.12
Porphyry 3 2.78 0.05
GMS applied the bulk density values described above into the block model using the lithology model
developed in Leapfrog GEO™ provided by GGM. Overburden was assumed to be 2.0 g/cc.
14.2.2.8 Search Ellipsoids
Due to the undulating nature of the veins, GMS decided to use dynamic anisotropy to locally adjust the
search ellipse orientations according to the local dip and dip direction of the vein wireframe. A surface was
built using the mid-points of the vein, and was used as an input to determine the rotation angles of the
search ellipse.
The search ellipse configurations were defined using variography and drill spacing as a guide combined
with the geometry of the deposit. A three-pass estimation procedure was used for the interpolation. For all
passes, the maximum number of samples per drill hole was set to control the number of drill holes in the
interpolation.
For Pass 1, a minimum number of samples of 7, a maximum number of samples of 16, and a maximum
samples per drill hole of 3 was applied. This ensured that a minimum of 3 drill holes were required to
estimate blocks in the first pass.
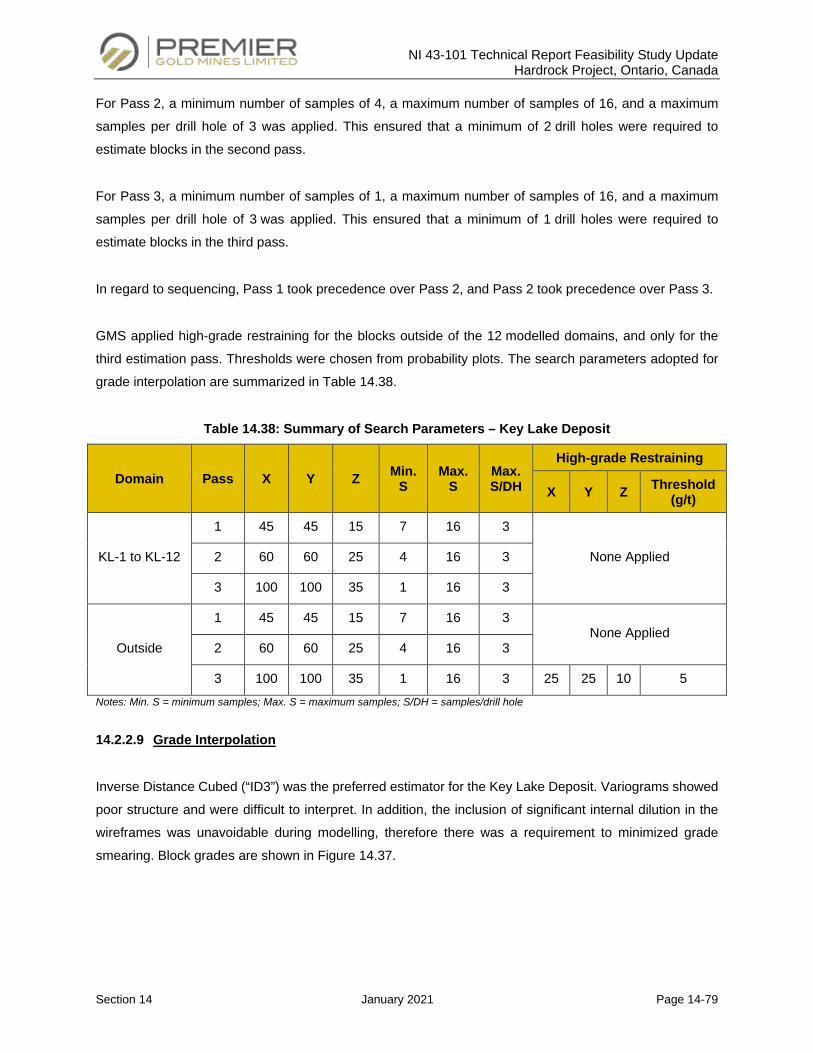
NI 43-101 Technical Report Feasibility Study Update Hardrock Project, Ontario, Canada
Section 14 January 2021 Page 14-79
For Pass 2, a minimum number of samples of 4, a maximum number of samples of 16, and a maximum
samples per drill hole of 3 was applied. This ensured that a minimum of 2 drill holes were required to
estimate blocks in the second pass.
For Pass 3, a minimum number of samples of 1, a maximum number of samples of 16, and a maximum
samples per drill hole of 3 was applied. This ensured that a minimum of 1 drill holes were required to
estimate blocks in the third pass.
In regard to sequencing, Pass 1 took precedence over Pass 2, and Pass 2 took precedence over Pass 3.
GMS applied high-grade restraining for the blocks outside of the 12 modelled domains, and only for the
third estimation pass. Thresholds were chosen from probability plots. The search parameters adopted for
grade interpolation are summarized in Table 14.38.
Table 14.38: Summary of Search Parameters – Key Lake Deposit
Domain Pass X Y Z Min. S
Max. S
Max. S/DH
High-grade Restraining
X Y Z Threshold (g/t)
KL-1 to KL-12
1 45 45 15 7 16 3
None Applied 2 60 60 25 4 16 3
3 100 100 35 1 16 3
Outside
1 45 45 15 7 16 3 None Applied
2 60 60 25 4 16 3
3 100 100 35 1 16 3 25 25 10 5 Notes: Min. S = minimum samples; Max. S = maximum samples; S/DH = samples/drill hole
14.2.2.9 Grade Interpolation
Inverse Distance Cubed (“ID3”) was the preferred estimator for the Key Lake Deposit. Variograms showed
poor structure and were difficult to interpret. In addition, the inclusion of significant internal dilution in the
wireframes was unavoidable during modelling, therefore there was a requirement to minimized grade
smearing. Block grades are shown in Figure 14.37.
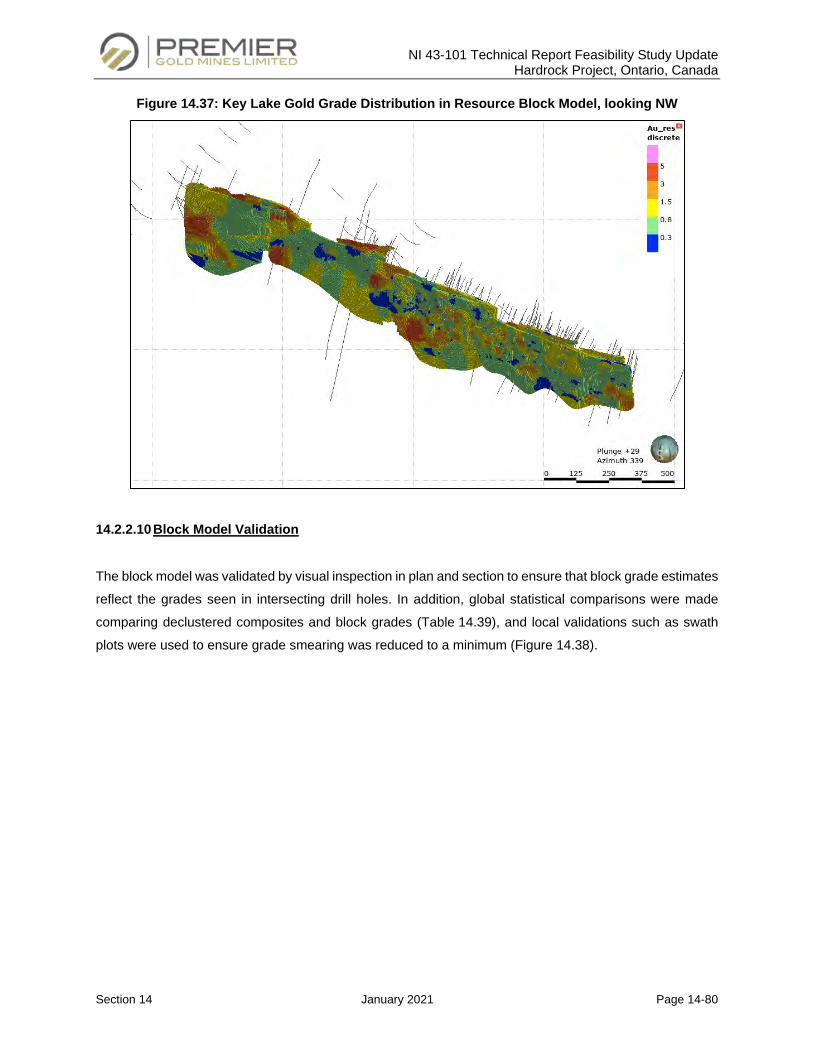
NI 43-101 Technical Report Feasibility Study Update Hardrock Project, Ontario, Canada
Section 14 January 2021 Page 14-80
Figure 14.37: Key Lake Gold Grade Distribution in Resource Block Model, looking NW
14.2.2.10 Block Model Validation
The block model was validated by visual inspection in plan and section to ensure that block grade estimates
reflect the grades seen in intersecting drill holes. In addition, global statistical comparisons were made
comparing declustered composites and block grades (Table 14.39), and local validations such as swath
plots were used to ensure grade smearing was reduced to a minimum (Figure 14.38).
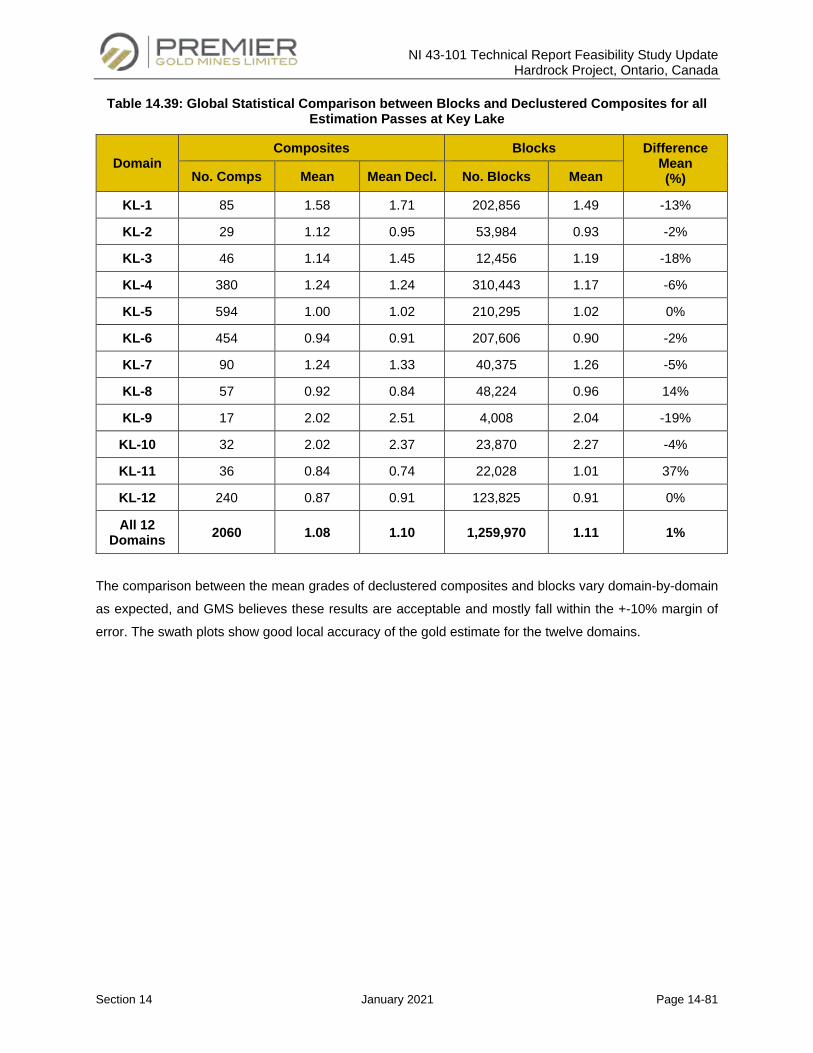
NI 43-101 Technical Report Feasibility Study Update Hardrock Project, Ontario, Canada
Section 14 January 2021 Page 14-81
Table 14.39: Global Statistical Comparison between Blocks and Declustered Composites for all Estimation Passes at Key Lake
Domain Composites Blocks Difference
Mean (%) No. Comps Mean Mean Decl. No. Blocks Mean
KL-1 85 1.58 1.71 202,856 1.49 -13%
KL-2 29 1.12 0.95 53,984 0.93 -2%
KL-3 46 1.14 1.45 12,456 1.19 -18%
KL-4 380 1.24 1.24 310,443 1.17 -6%
KL-5 594 1.00 1.02 210,295 1.02 0%
KL-6 454 0.94 0.91 207,606 0.90 -2%
KL-7 90 1.24 1.33 40,375 1.26 -5%
KL-8 57 0.92 0.84 48,224 0.96 14%
KL-9 17 2.02 2.51 4,008 2.04 -19%
KL-10 32 2.02 2.37 23,870 2.27 -4%
KL-11 36 0.84 0.74 22,028 1.01 37%
KL-12 240 0.87 0.91 123,825 0.91 0%
All 12 Domains 2060 1.08 1.10 1,259,970 1.11 1%
The comparison between the mean grades of declustered composites and blocks vary domain-by-domain
as expected, and GMS believes these results are acceptable and mostly fall within the +-10% margin of
error. The swath plots show good local accuracy of the gold estimate for the twelve domains.
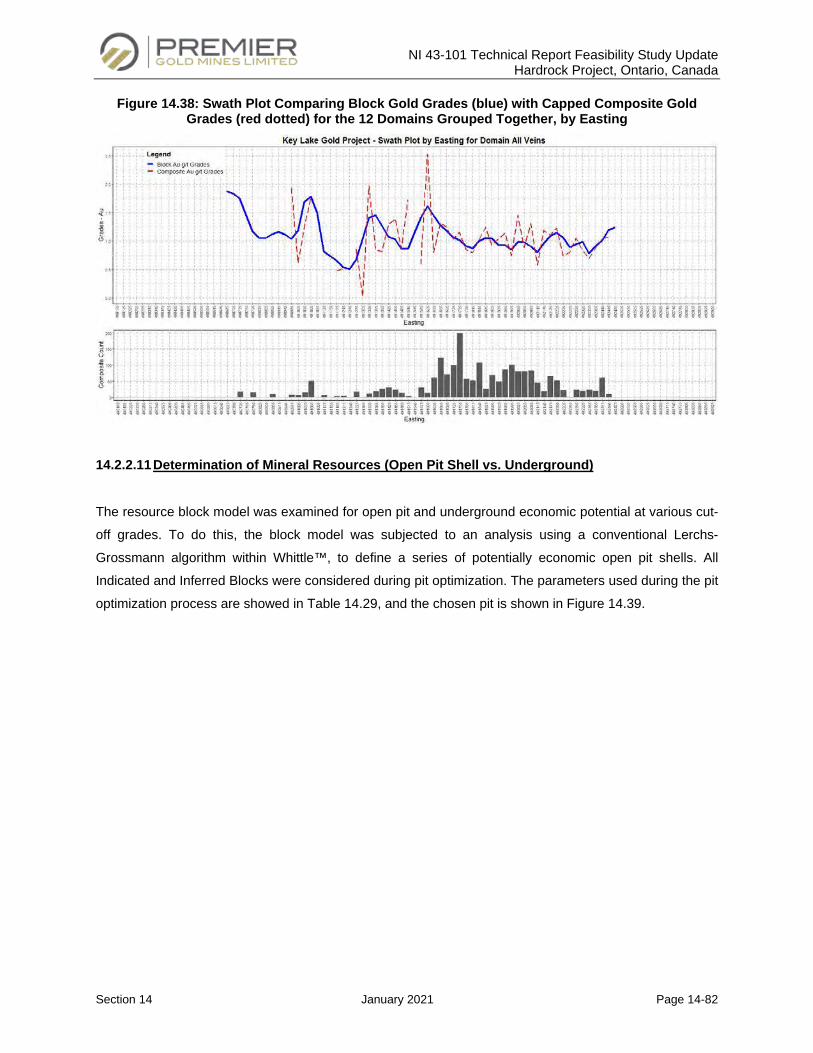
NI 43-101 Technical Report Feasibility Study Update Hardrock Project, Ontario, Canada
Section 14 January 2021 Page 14-82
Figure 14.38: Swath Plot Comparing Block Gold Grades (blue) with Capped Composite Gold Grades (red dotted) for the 12 Domains Grouped Together, by Easting
14.2.2.11 Determination of Mineral Resources (Open Pit Shell vs. Underground)
The resource block model was examined for open pit and underground economic potential at various cut-
off grades. To do this, the block model was subjected to an analysis using a conventional Lerchs-
Grossmann algorithm within Whittle™, to define a series of potentially economic open pit shells. All
Indicated and Inferred Blocks were considered during pit optimization. The parameters used during the pit
optimization process are showed in Table 14.29, and the chosen pit is shown in Figure 14.39.
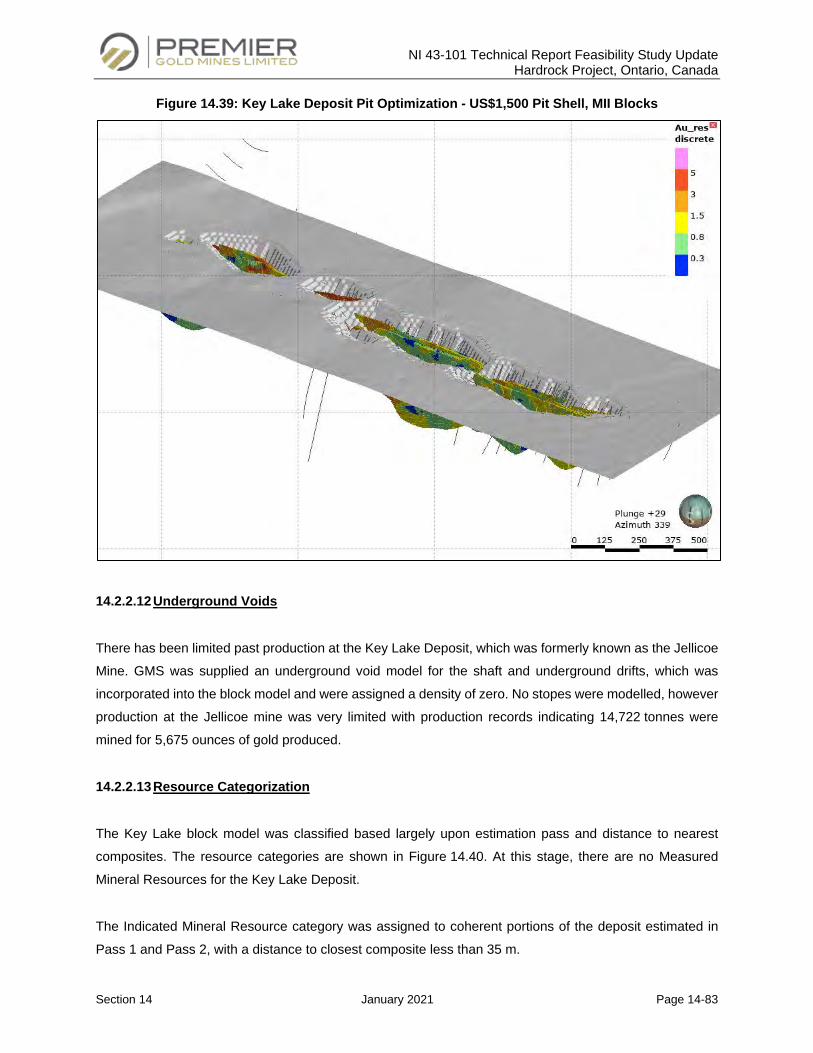
NI 43-101 Technical Report Feasibility Study Update Hardrock Project, Ontario, Canada
Section 14 January 2021 Page 14-83
Figure 14.39: Key Lake Deposit Pit Optimization - US$1,500 Pit Shell, MII Blocks
14.2.2.12 Underground Voids
There has been limited past production at the Key Lake Deposit, which was formerly known as the Jellicoe
Mine. GMS was supplied an underground void model for the shaft and underground drifts, which was
incorporated into the block model and were assigned a density of zero. No stopes were modelled, however
production at the Jellicoe mine was very limited with production records indicating 14,722 tonnes were
mined for 5,675 ounces of gold produced.
14.2.2.13 Resource Categorization
The Key Lake block model was classified based largely upon estimation pass and distance to nearest
composites. The resource categories are shown in Figure 14.40. At this stage, there are no Measured
Mineral Resources for the Key Lake Deposit.
The Indicated Mineral Resource category was assigned to coherent portions of the deposit estimated in
Pass 1 and Pass 2, with a distance to closest composite less than 35 m.
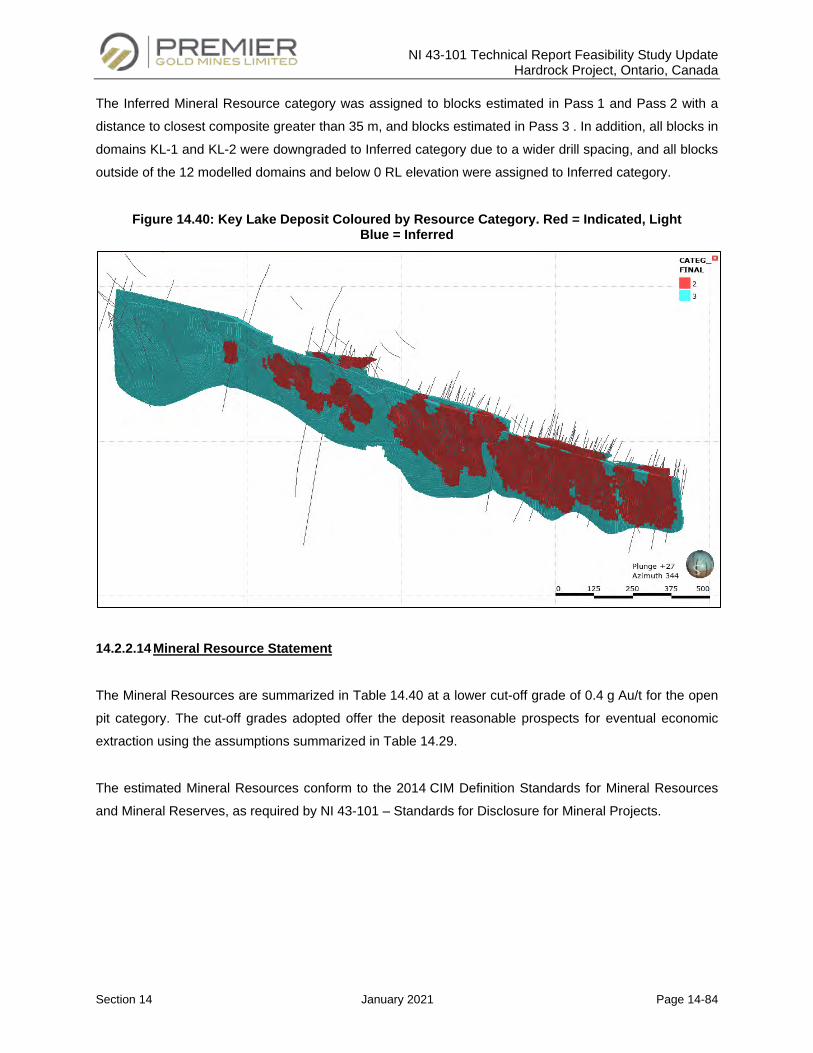
NI 43-101 Technical Report Feasibility Study Update Hardrock Project, Ontario, Canada
Section 14 January 2021 Page 14-84
The Inferred Mineral Resource category was assigned to blocks estimated in Pass 1 and Pass 2 with a
distance to closest composite greater than 35 m, and blocks estimated in Pass 3 . In addition, all blocks in
domains KL-1 and KL-2 were downgraded to Inferred category due to a wider drill spacing, and all blocks
outside of the 12 modelled domains and below 0 RL elevation were assigned to Inferred category.
Figure 14.40: Key Lake Deposit Coloured by Resource Category. Red = Indicated, Light Blue = Inferred
14.2.2.14 Mineral Resource Statement
The Mineral Resources are summarized in Table 14.40 at a lower cut-off grade of 0.4 g Au/t for the open
pit category. The cut-off grades adopted offer the deposit reasonable prospects for eventual economic
extraction using the assumptions summarized in Table 14.29.
The estimated Mineral Resources conform to the 2014 CIM Definition Standards for Mineral Resources
and Mineral Reserves, as required by NI 43-101 – Standards for Disclosure for Mineral Projects.
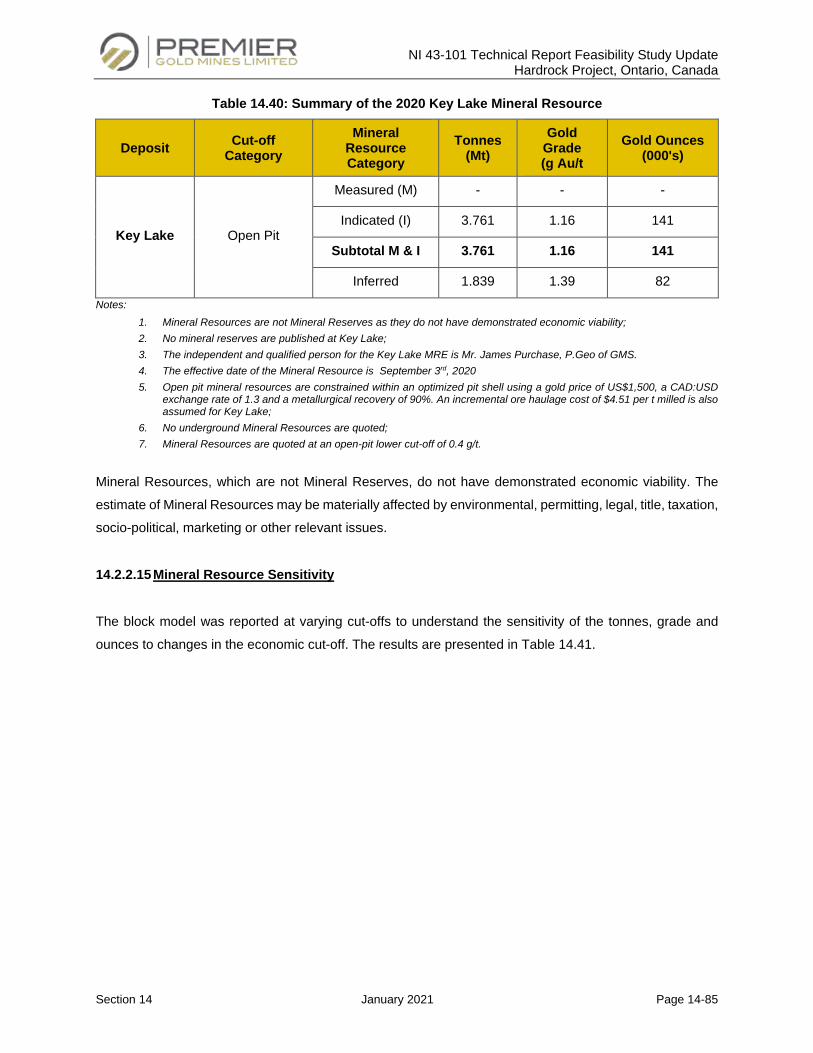
NI 43-101 Technical Report Feasibility Study Update Hardrock Project, Ontario, Canada
Section 14 January 2021 Page 14-85
Table 14.40: Summary of the 2020 Key Lake Mineral Resource
Deposit Cut-off Category
Mineral Resource Category
Tonnes (Mt)
Gold Grade (g Au/t
Gold Ounces (000's)
Key Lake Open Pit
Measured (M) - - -
Indicated (I) 3.761 1.16 141
Subtotal M & I 3.761 1.16 141
Inferred 1.839 1.39 82 Notes:
1. Mineral Resources are not Mineral Reserves as they do not have demonstrated economic viability; 2. No mineral reserves are published at Key Lake; 3. The independent and qualified person for the Key Lake MRE is Mr. James Purchase, P.Geo of GMS. 4. The effective date of the Mineral Resource is September 3rd, 2020 5. Open pit mineral resources are constrained within an optimized pit shell using a gold price of US$1,500, a CAD:USD
exchange rate of 1.3 and a metallurgical recovery of 90%. An incremental ore haulage cost of $4.51 per t milled is also assumed for Key Lake;
6. No underground Mineral Resources are quoted; 7. Mineral Resources are quoted at an open-pit lower cut-off of 0.4 g/t.
Mineral Resources, which are not Mineral Reserves, do not have demonstrated economic viability. The
estimate of Mineral Resources may be materially affected by environmental, permitting, legal, title, taxation,
socio-political, marketing or other relevant issues.
14.2.2.15 Mineral Resource Sensitivity
The block model was reported at varying cut-offs to understand the sensitivity of the tonnes, grade and
ounces to changes in the economic cut-off. The results are presented in Table 14.41.
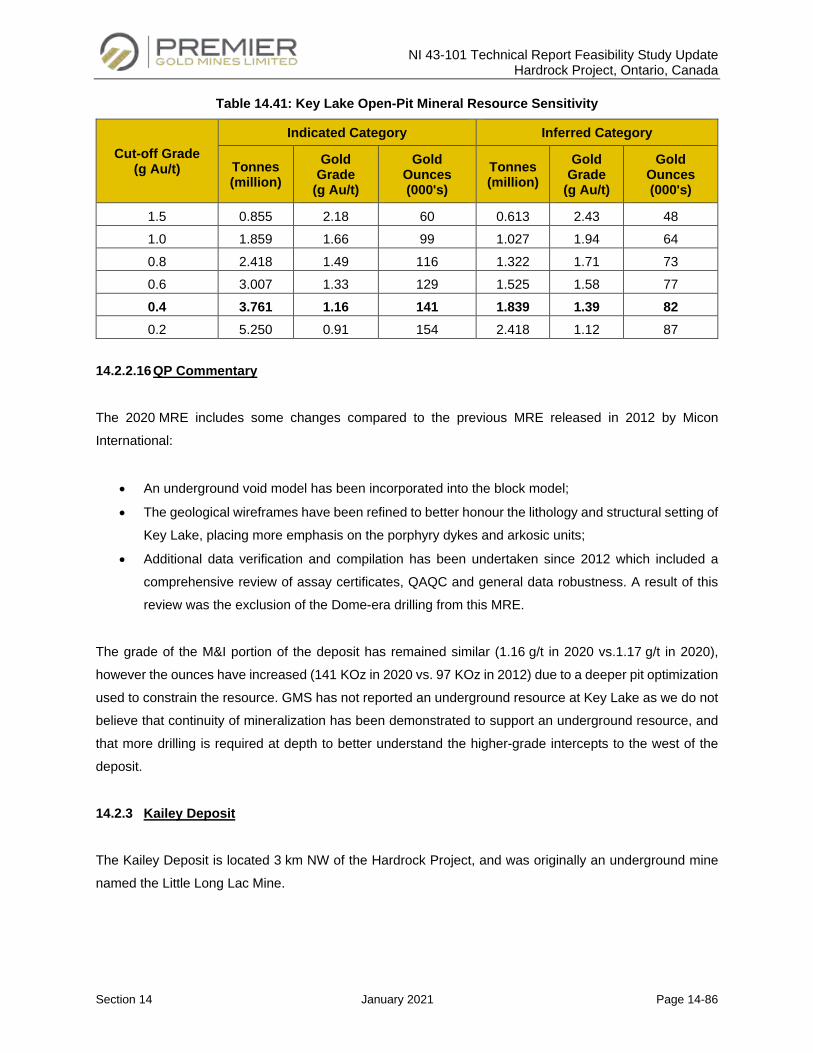
NI 43-101 Technical Report Feasibility Study Update Hardrock Project, Ontario, Canada
Section 14 January 2021 Page 14-86
Table 14.41: Key Lake Open-Pit Mineral Resource Sensitivity
Cut-off Grade (g Au/t)
Indicated Category Inferred Category
Tonnes (million)
Gold Grade
(g Au/t)
Gold Ounces (000's)
Tonnes (million)
Gold Grade
(g Au/t)
Gold Ounces (000's)
1.5 0.855 2.18 60 0.613 2.43 48 1.0 1.859 1.66 99 1.027 1.94 64 0.8 2.418 1.49 116 1.322 1.71 73 0.6 3.007 1.33 129 1.525 1.58 77 0.4 3.761 1.16 141 1.839 1.39 82 0.2 5.250 0.91 154 2.418 1.12 87
14.2.2.16 QP Commentary
The 2020 MRE includes some changes compared to the previous MRE released in 2012 by Micon
International:
• An underground void model has been incorporated into the block model;
• The geological wireframes have been refined to better honour the lithology and structural setting of
Key Lake, placing more emphasis on the porphyry dykes and arkosic units;
• Additional data verification and compilation has been undertaken since 2012 which included a
comprehensive review of assay certificates, QAQC and general data robustness. A result of this
review was the exclusion of the Dome-era drilling from this MRE.
The grade of the M&I portion of the deposit has remained similar (1.16 g/t in 2020 vs.1.17 g/t in 2020),
however the ounces have increased (141 KOz in 2020 vs. 97 KOz in 2012) due to a deeper pit optimization
used to constrain the resource. GMS has not reported an underground resource at Key Lake as we do not
believe that continuity of mineralization has been demonstrated to support an underground resource, and
that more drilling is required at depth to better understand the higher-grade intercepts to the west of the
deposit.
14.2.3 Kailey Deposit
The Kailey Deposit is located 3 km NW of the Hardrock Project, and was originally an underground mine
named the Little Long Lac Mine.
NI 43-101 Technical Report Feasibility Study Update Hardrock Project, Ontario, Canada
Section 14 January 2021 Page 14-87
14.2.3.1 Drill hole Database
The Kailey Deposit has been tested by diamond drilling over a strike length of 800 m and down to a vertical
depth of 500 m. The Kailey drill hole database includes 82 drill holes totalling 34,599 m for which 27,892 m
was assayed.
The drill holes are on an irregular grid spacing of around 50 m to 70 m, and at depth the spacing becomes
80 m to 100 m. Historical drilling data exists on the project digitized from hard copies, however no significant
assays are available and all the historical data is unverifiable.
14.2.3.2 Topography
No detailed topography was available, so GMS constructed a topography using the drill collars. The area
around the historical Little Long Lac Mine is generally flat.
14.2.3.3 Geological Modelling Approach
The Kailey Deposit is hosted with a sedimentary sequence of greywacke and massive arkose units.
Mineralization is constrained to steeply dipping, ENE-striking axial planes of an antiformal-synformal
feature, with fold noses steeply plunging to the WSW. The deposit shows both structural and lithological
controls, with mineralization hosted predominantly within a massive arkosic unit. Only minor amounts of
mineralization is found in the greywacke. High-grade gold mineralization occurs within three discrete
narrow, high-grade veins that were the target of past production activities. Wide, lower-grade Fe-carbonate
and sericite alteration haloes centralized on the axial planes of the folds are also present. Mineralization is
associated with fine sulphide disseminations that are difficult to observed in drill core.
The Kailey Deposit has been modelled as three, wide (20 – 30m), continuous zones named Kailey, Main
and No.9 (Figure 14.41). The zones are generally wide therefore no mining thickness was considered
during modelling (Figure 14.34). An overburden surface was also modelled from the lithology logging, and
varies between 5 m and 20 m thick above the deposit.
Only Premier-era drilling was used during the interpretation and estimation. In addition, drill hole PLL08013
was excluded due to uncertainties surrounding the downhole surveys.
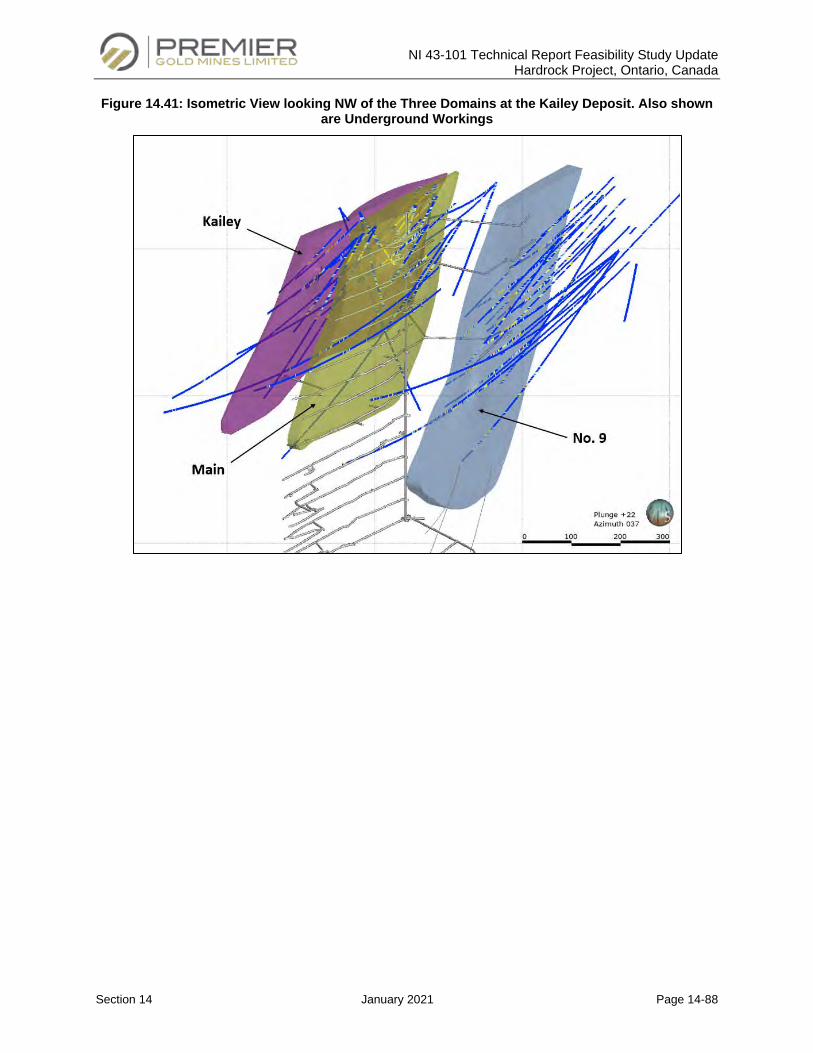
NI 43-101 Technical Report Feasibility Study Update Hardrock Project, Ontario, Canada
Section 14 January 2021 Page 14-88
Figure 14.41: Isometric View looking NW of the Three Domains at the Kailey Deposit. Also shown are Underground Workings
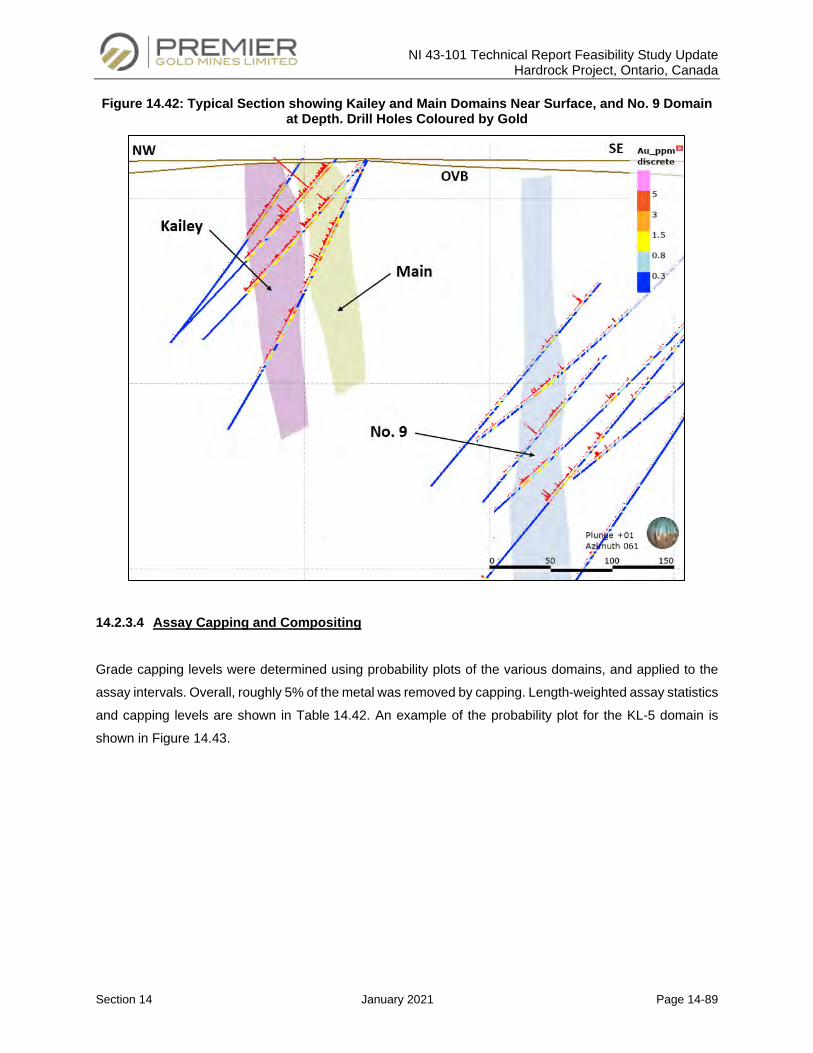
NI 43-101 Technical Report Feasibility Study Update Hardrock Project, Ontario, Canada
Section 14 January 2021 Page 14-89
Figure 14.42: Typical Section showing Kailey and Main Domains Near Surface, and No. 9 Domain at Depth. Drill Holes Coloured by Gold
14.2.3.4 Assay Capping and Compositing
Grade capping levels were determined using probability plots of the various domains, and applied to the
assay intervals. Overall, roughly 5% of the metal was removed by capping. Length-weighted assay statistics
and capping levels are shown in Table 14.42. An example of the probability plot for the KL-5 domain is
shown in Figure 14.43.
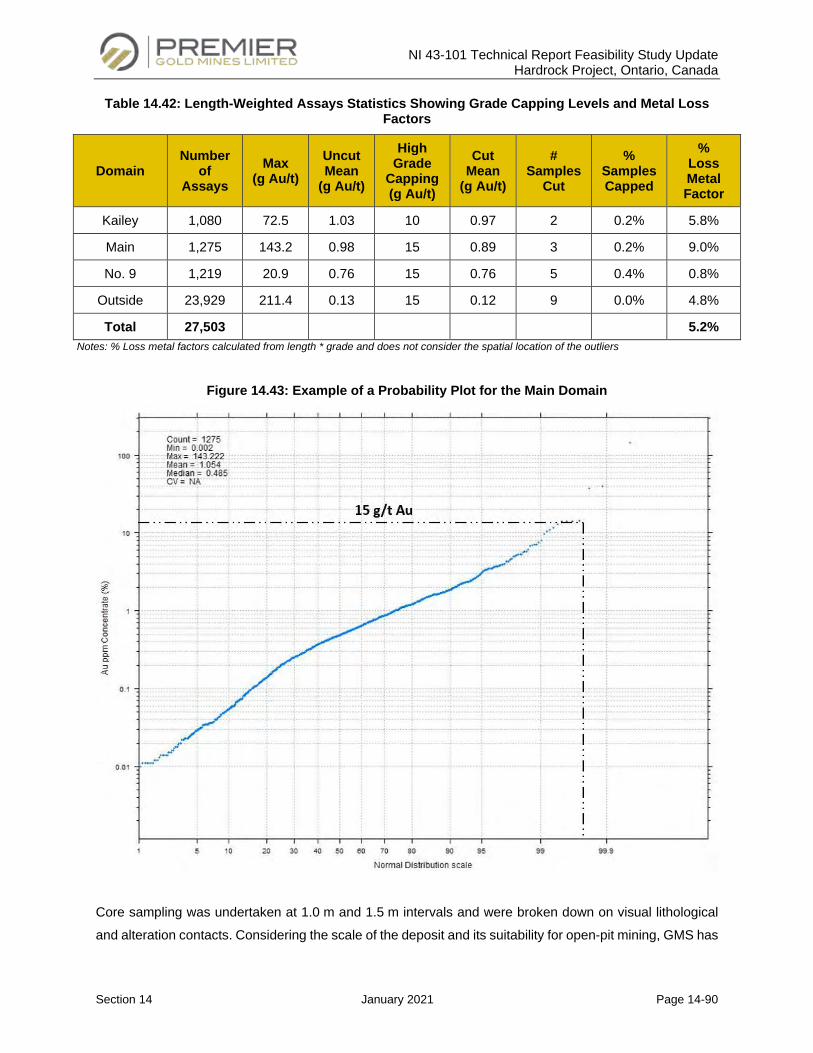
NI 43-101 Technical Report Feasibility Study Update Hardrock Project, Ontario, Canada
Section 14 January 2021 Page 14-90
Table 14.42: Length-Weighted Assays Statistics Showing Grade Capping Levels and Metal Loss Factors
Domain Number
of Assays
Max (g Au/t)
Uncut Mean
(g Au/t)
High Grade
Capping (g Au/t)
Cut Mean
(g Au/t)
# Samples
Cut
% Samples Capped
% Loss Metal Factor
Kailey 1,080 72.5 1.03 10 0.97 2 0.2% 5.8%
Main 1,275 143.2 0.98 15 0.89 3 0.2% 9.0%
No. 9 1,219 20.9 0.76 15 0.76 5 0.4% 0.8%
Outside 23,929 211.4 0.13 15 0.12 9 0.0% 4.8%
Total 27,503 5.2% Notes: % Loss metal factors calculated from length * grade and does not consider the spatial location of the outliers
Figure 14.43: Example of a Probability Plot for the Main Domain
Core sampling was undertaken at 1.0 m and 1.5 m intervals and were broken down on visual lithological
and alteration contacts. Considering the scale of the deposit and its suitability for open-pit mining, GMS has
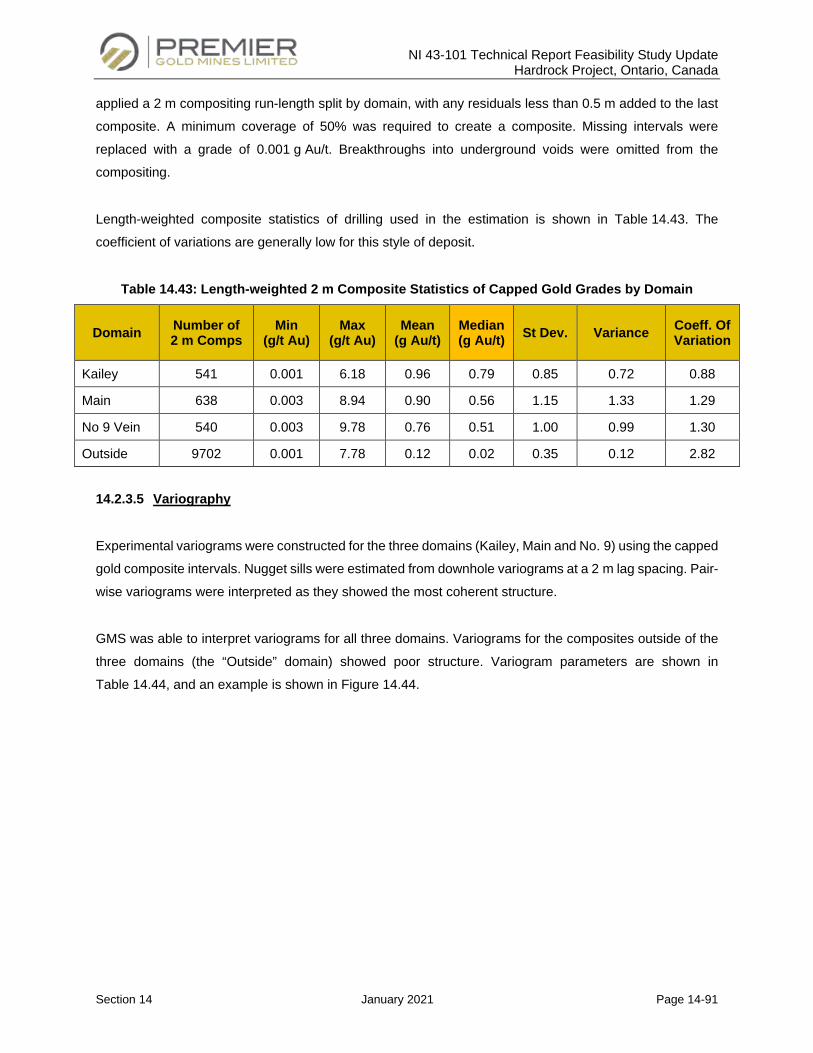
NI 43-101 Technical Report Feasibility Study Update Hardrock Project, Ontario, Canada
Section 14 January 2021 Page 14-91
applied a 2 m compositing run-length split by domain, with any residuals less than 0.5 m added to the last
composite. A minimum coverage of 50% was required to create a composite. Missing intervals were
replaced with a grade of 0.001 g Au/t. Breakthroughs into underground voids were omitted from the
compositing.
Length-weighted composite statistics of drilling used in the estimation is shown in Table 14.43. The
coefficient of variations are generally low for this style of deposit.
Table 14.43: Length-weighted 2 m Composite Statistics of Capped Gold Grades by Domain
Domain Number of 2 m Comps
Min (g/t Au)
Max (g/t Au)
Mean (g Au/t)
Median (g Au/t) St Dev. Variance Coeff. Of
Variation
Kailey 541 0.001 6.18 0.96 0.79 0.85 0.72 0.88
Main 638 0.003 8.94 0.90 0.56 1.15 1.33 1.29
No 9 Vein 540 0.003 9.78 0.76 0.51 1.00 0.99 1.30
Outside 9702 0.001 7.78 0.12 0.02 0.35 0.12 2.82
14.2.3.5 Variography
Experimental variograms were constructed for the three domains (Kailey, Main and No. 9) using the capped
gold composite intervals. Nugget sills were estimated from downhole variograms at a 2 m lag spacing. Pair-
wise variograms were interpreted as they showed the most coherent structure.
GMS was able to interpret variograms for all three domains. Variograms for the composites outside of the
three domains (the “Outside” domain) showed poor structure. Variogram parameters are shown in
Table 14.44, and an example is shown in Figure 14.44.
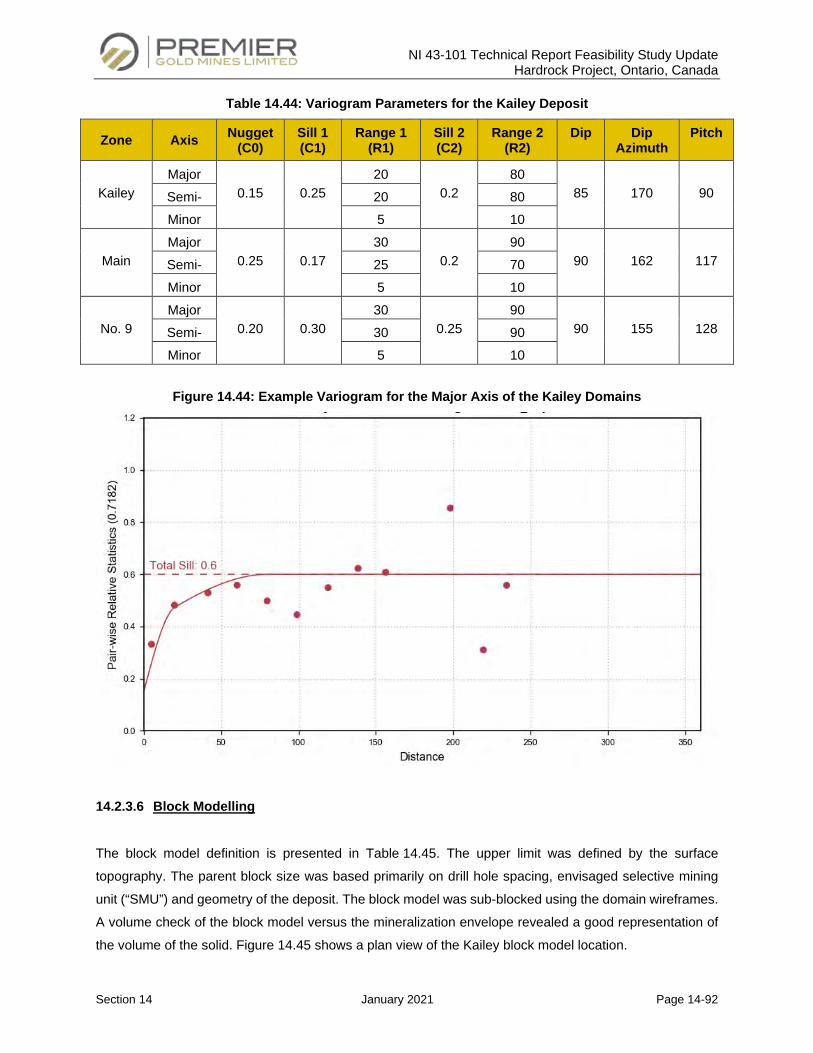
NI 43-101 Technical Report Feasibility Study Update Hardrock Project, Ontario, Canada
Section 14 January 2021 Page 14-92
Table 14.44: Variogram Parameters for the Kailey Deposit
Zone Axis Nugget (C0)
Sill 1 (C1)
Range 1 (R1)
Sill 2 (C2)
Range 2 (R2)
Dip Dip Azimuth
Pitch
Kailey Major
0.15 0.25 20
0.2 80
85 170 90 Semi-
20 80 Minor 5 10
Main Major
0.25 0.17 30
0.2 90
90 162 117 Semi-
25 70 Minor 5 10
No. 9 Major
0.20 0.30 30
0.25 90
90 155 128 Semi-
30 90 Minor 5 10
Figure 14.44: Example Variogram for the Major Axis of the Kailey Domains
14.2.3.6 Block Modelling
The block model definition is presented in Table 14.45. The upper limit was defined by the surface
topography. The parent block size was based primarily on drill hole spacing, envisaged selective mining
unit (“SMU”) and geometry of the deposit. The block model was sub-blocked using the domain wireframes.
A volume check of the block model versus the mineralization envelope revealed a good representation of
the volume of the solid. Figure 14.45 shows a plan view of the Kailey block model location.
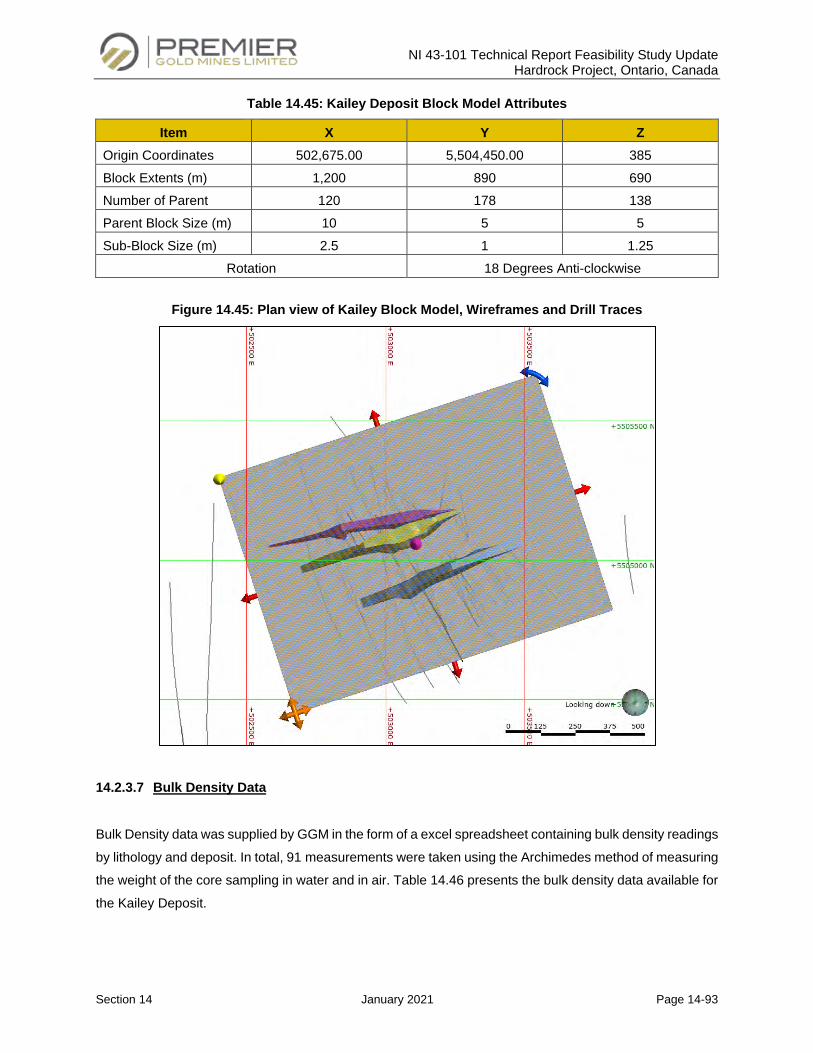
NI 43-101 Technical Report Feasibility Study Update Hardrock Project, Ontario, Canada
Section 14 January 2021 Page 14-93
Table 14.45: Kailey Deposit Block Model Attributes
Item X Y Z Origin Coordinates 502,675.00 5,504,450.00 385 Block Extents (m) 1,200 890 690 Number of Parent
120 178 138
Parent Block Size (m) 10 5 5 Sub-Block Size (m) 2.5 1 1.25
Rotation 18 Degrees Anti-clockwise
Figure 14.45: Plan view of Kailey Block Model, Wireframes and Drill Traces
14.2.3.7 Bulk Density Data
Bulk Density data was supplied by GGM in the form of a excel spreadsheet containing bulk density readings
by lithology and deposit. In total, 91 measurements were taken using the Archimedes method of measuring
the weight of the core sampling in water and in air. Table 14.46 presents the bulk density data available for
the Kailey Deposit.
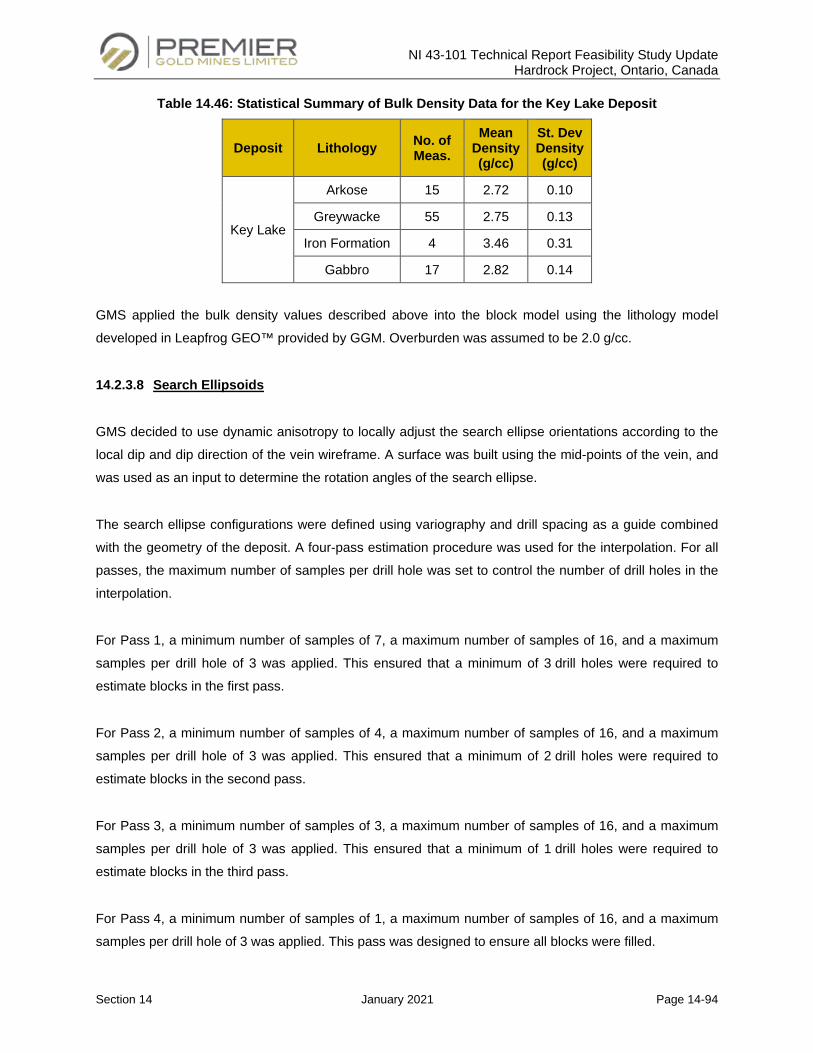
NI 43-101 Technical Report Feasibility Study Update Hardrock Project, Ontario, Canada
Section 14 January 2021 Page 14-94
Table 14.46: Statistical Summary of Bulk Density Data for the Key Lake Deposit
Deposit Lithology No. of Meas.
Mean Density (g/cc)
St. Dev Density (g/cc)
Key Lake
Arkose 15 2.72 0.10
Greywacke 55 2.75 0.13
Iron Formation 4 3.46 0.31
Gabbro 17 2.82 0.14
GMS applied the bulk density values described above into the block model using the lithology model
developed in Leapfrog GEO™ provided by GGM. Overburden was assumed to be 2.0 g/cc.
14.2.3.8 Search Ellipsoids
GMS decided to use dynamic anisotropy to locally adjust the search ellipse orientations according to the
local dip and dip direction of the vein wireframe. A surface was built using the mid-points of the vein, and
was used as an input to determine the rotation angles of the search ellipse.
The search ellipse configurations were defined using variography and drill spacing as a guide combined
with the geometry of the deposit. A four-pass estimation procedure was used for the interpolation. For all
passes, the maximum number of samples per drill hole was set to control the number of drill holes in the
interpolation.
For Pass 1, a minimum number of samples of 7, a maximum number of samples of 16, and a maximum
samples per drill hole of 3 was applied. This ensured that a minimum of 3 drill holes were required to
estimate blocks in the first pass.
For Pass 2, a minimum number of samples of 4, a maximum number of samples of 16, and a maximum
samples per drill hole of 3 was applied. This ensured that a minimum of 2 drill holes were required to
estimate blocks in the second pass.
For Pass 3, a minimum number of samples of 3, a maximum number of samples of 16, and a maximum
samples per drill hole of 3 was applied. This ensured that a minimum of 1 drill holes were required to
estimate blocks in the third pass.
For Pass 4, a minimum number of samples of 1, a maximum number of samples of 16, and a maximum
samples per drill hole of 3 was applied. This pass was designed to ensure all blocks were filled.
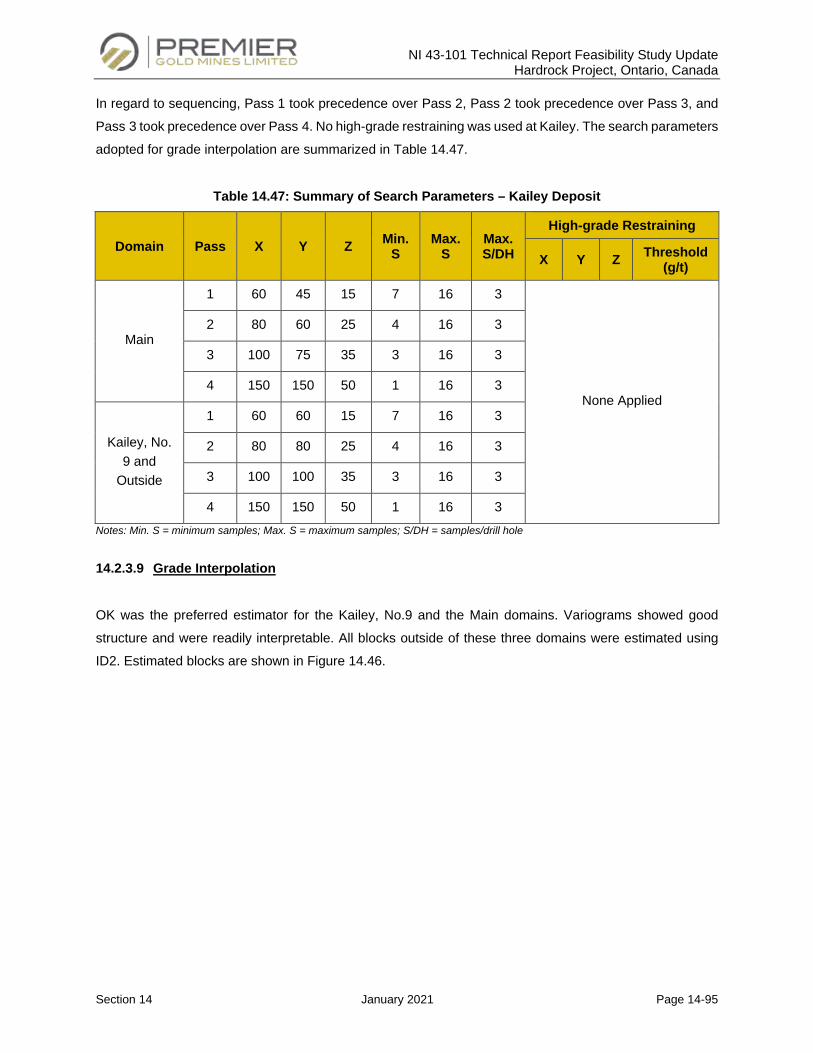
NI 43-101 Technical Report Feasibility Study Update Hardrock Project, Ontario, Canada
Section 14 January 2021 Page 14-95
In regard to sequencing, Pass 1 took precedence over Pass 2, Pass 2 took precedence over Pass 3, and
Pass 3 took precedence over Pass 4. No high-grade restraining was used at Kailey. The search parameters
adopted for grade interpolation are summarized in Table 14.47.
Table 14.47: Summary of Search Parameters – Kailey Deposit
Domain Pass X Y Z Min. S
Max. S
Max. S/DH
High-grade Restraining
X Y Z Threshold (g/t)
Main
1 60 45 15 7 16 3
None Applied
2 80 60 25 4 16 3
3 100 75 35 3 16 3
4 150 150 50 1 16 3
Kailey, No. 9 and
Outside
1 60 60 15 7 16 3
2 80 80 25 4 16 3
3 100 100 35 3 16 3
4 150 150 50 1 16 3 Notes: Min. S = minimum samples; Max. S = maximum samples; S/DH = samples/drill hole
14.2.3.9 Grade Interpolation
OK was the preferred estimator for the Kailey, No.9 and the Main domains. Variograms showed good
structure and were readily interpretable. All blocks outside of these three domains were estimated using
ID2. Estimated blocks are shown in Figure 14.46.
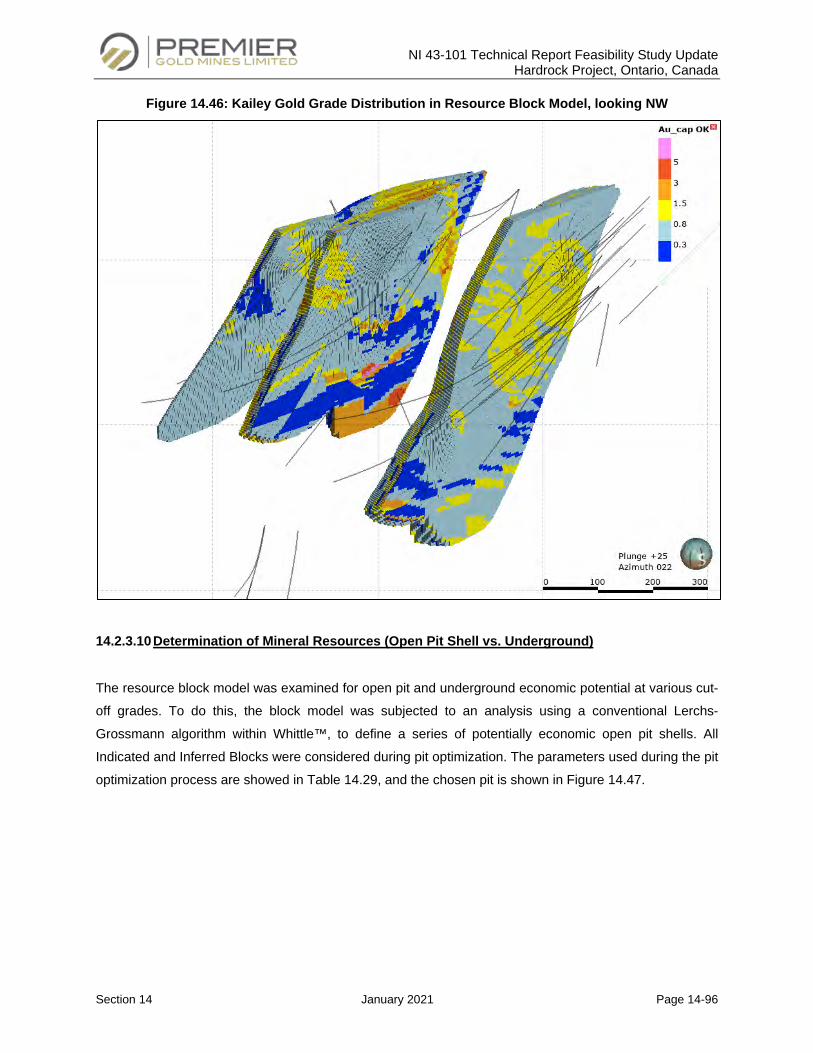
NI 43-101 Technical Report Feasibility Study Update Hardrock Project, Ontario, Canada
Section 14 January 2021 Page 14-96
Figure 14.46: Kailey Gold Grade Distribution in Resource Block Model, looking NW
14.2.3.10 Determination of Mineral Resources (Open Pit Shell vs. Underground)
The resource block model was examined for open pit and underground economic potential at various cut-
off grades. To do this, the block model was subjected to an analysis using a conventional Lerchs-
Grossmann algorithm within Whittle™, to define a series of potentially economic open pit shells. All
Indicated and Inferred Blocks were considered during pit optimization. The parameters used during the pit
optimization process are showed in Table 14.29, and the chosen pit is shown in Figure 14.47.
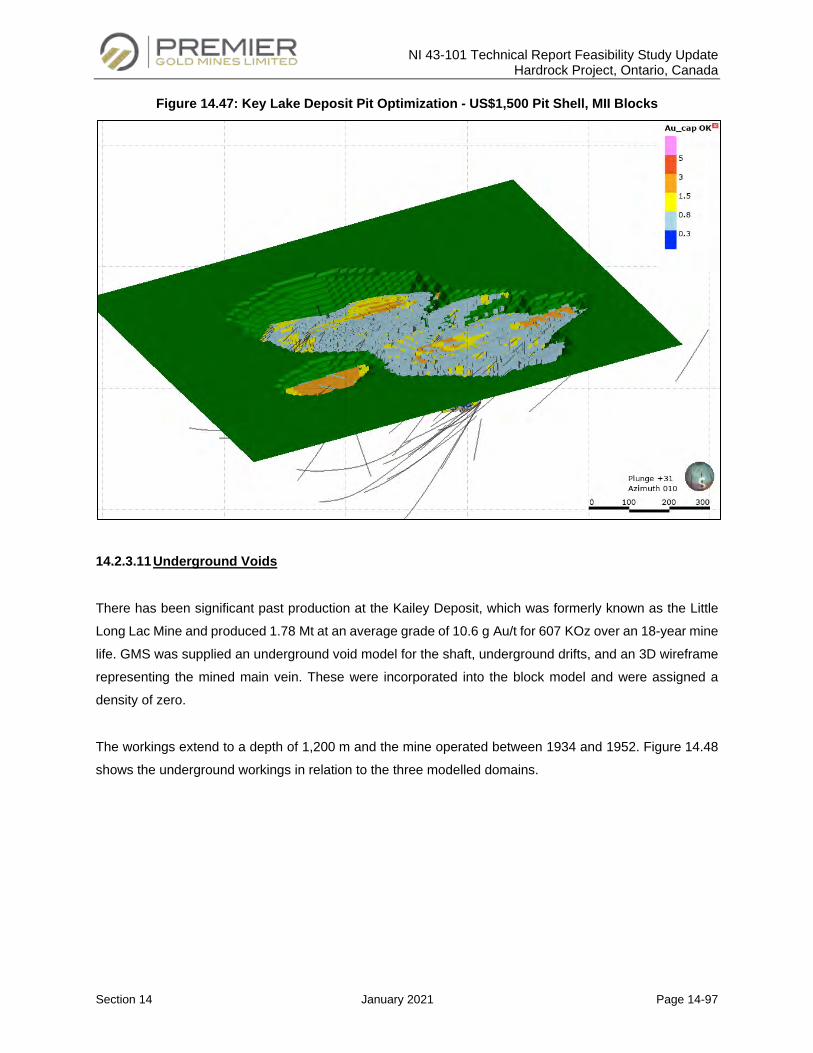
NI 43-101 Technical Report Feasibility Study Update Hardrock Project, Ontario, Canada
Section 14 January 2021 Page 14-97
Figure 14.47: Key Lake Deposit Pit Optimization - US$1,500 Pit Shell, MII Blocks
14.2.3.11 Underground Voids
There has been significant past production at the Kailey Deposit, which was formerly known as the Little
Long Lac Mine and produced 1.78 Mt at an average grade of 10.6 g Au/t for 607 KOz over an 18-year mine
life. GMS was supplied an underground void model for the shaft, underground drifts, and an 3D wireframe
representing the mined main vein. These were incorporated into the block model and were assigned a
density of zero.
The workings extend to a depth of 1,200 m and the mine operated between 1934 and 1952. Figure 14.48
shows the underground workings in relation to the three modelled domains.
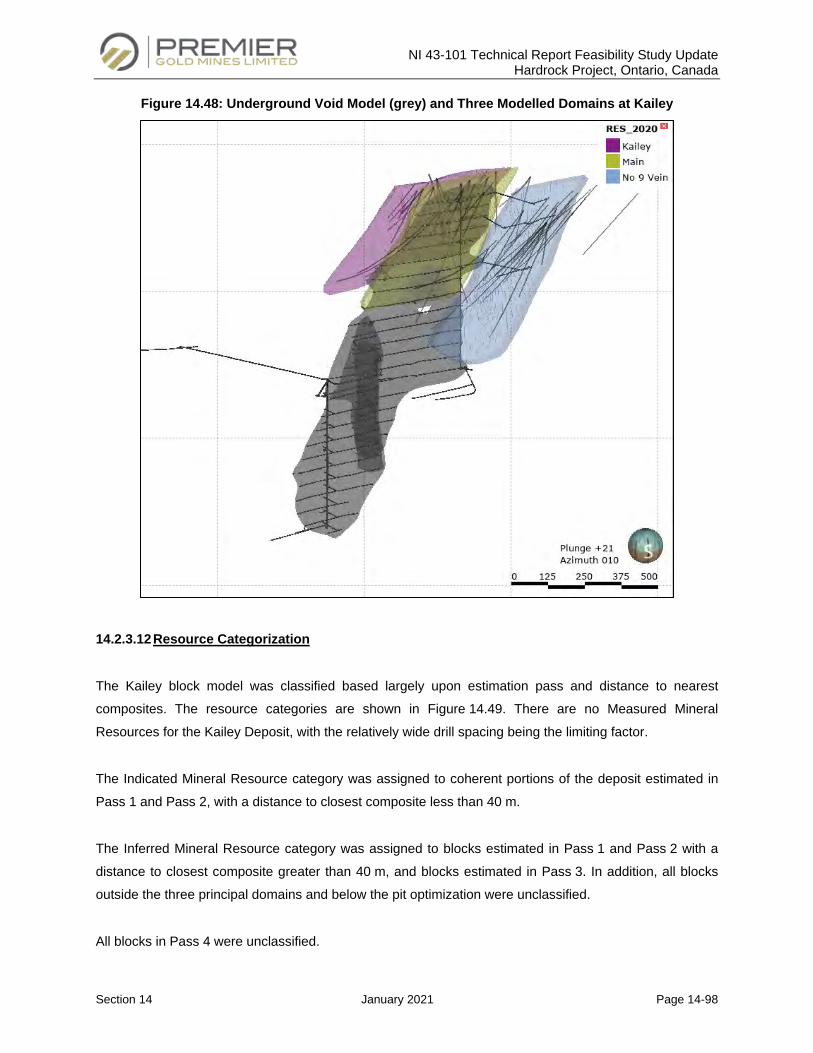
NI 43-101 Technical Report Feasibility Study Update Hardrock Project, Ontario, Canada
Section 14 January 2021 Page 14-98
Figure 14.48: Underground Void Model (grey) and Three Modelled Domains at Kailey
14.2.3.12 Resource Categorization
The Kailey block model was classified based largely upon estimation pass and distance to nearest
composites. The resource categories are shown in Figure 14.49. There are no Measured Mineral
Resources for the Kailey Deposit, with the relatively wide drill spacing being the limiting factor.
The Indicated Mineral Resource category was assigned to coherent portions of the deposit estimated in
Pass 1 and Pass 2, with a distance to closest composite less than 40 m.
The Inferred Mineral Resource category was assigned to blocks estimated in Pass 1 and Pass 2 with a
distance to closest composite greater than 40 m, and blocks estimated in Pass 3. In addition, all blocks
outside the three principal domains and below the pit optimization were unclassified.
All blocks in Pass 4 were unclassified.
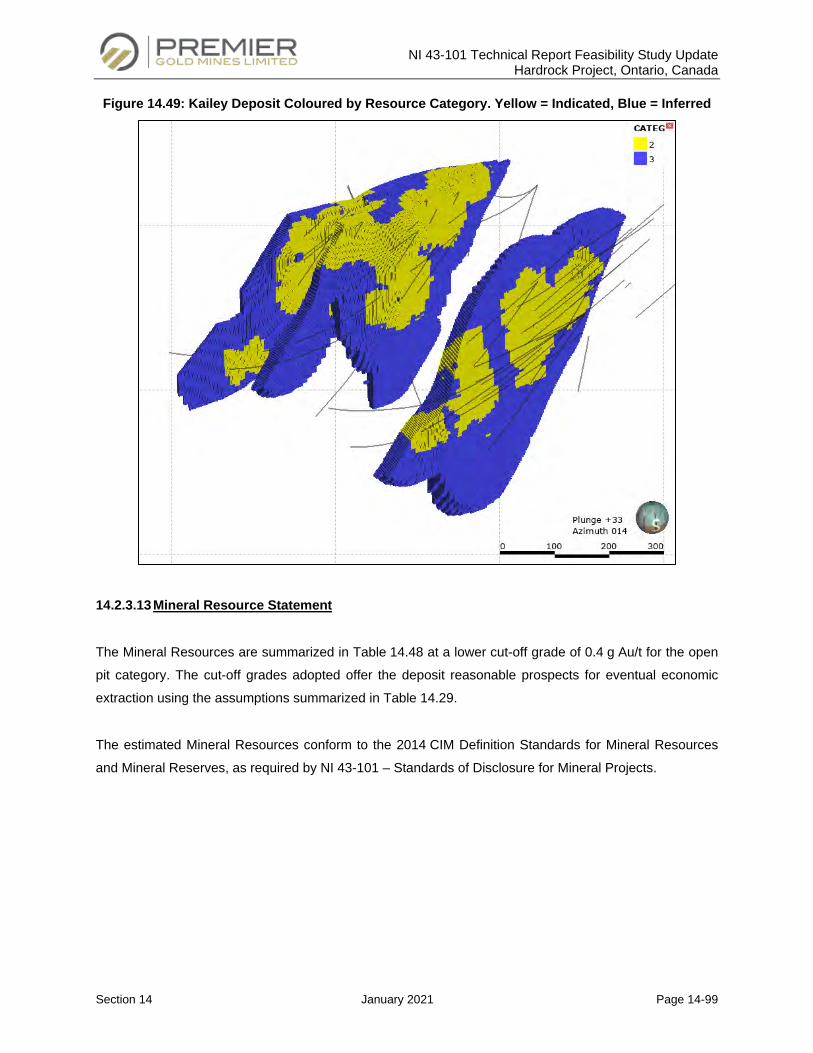
NI 43-101 Technical Report Feasibility Study Update Hardrock Project, Ontario, Canada
Section 14 January 2021 Page 14-99
Figure 14.49: Kailey Deposit Coloured by Resource Category. Yellow = Indicated, Blue = Inferred
14.2.3.13 Mineral Resource Statement
The Mineral Resources are summarized in Table 14.48 at a lower cut-off grade of 0.4 g Au/t for the open
pit category. The cut-off grades adopted offer the deposit reasonable prospects for eventual economic
extraction using the assumptions summarized in Table 14.29.
The estimated Mineral Resources conform to the 2014 CIM Definition Standards for Mineral Resources
and Mineral Reserves, as required by NI 43-101 – Standards of Disclosure for Mineral Projects.
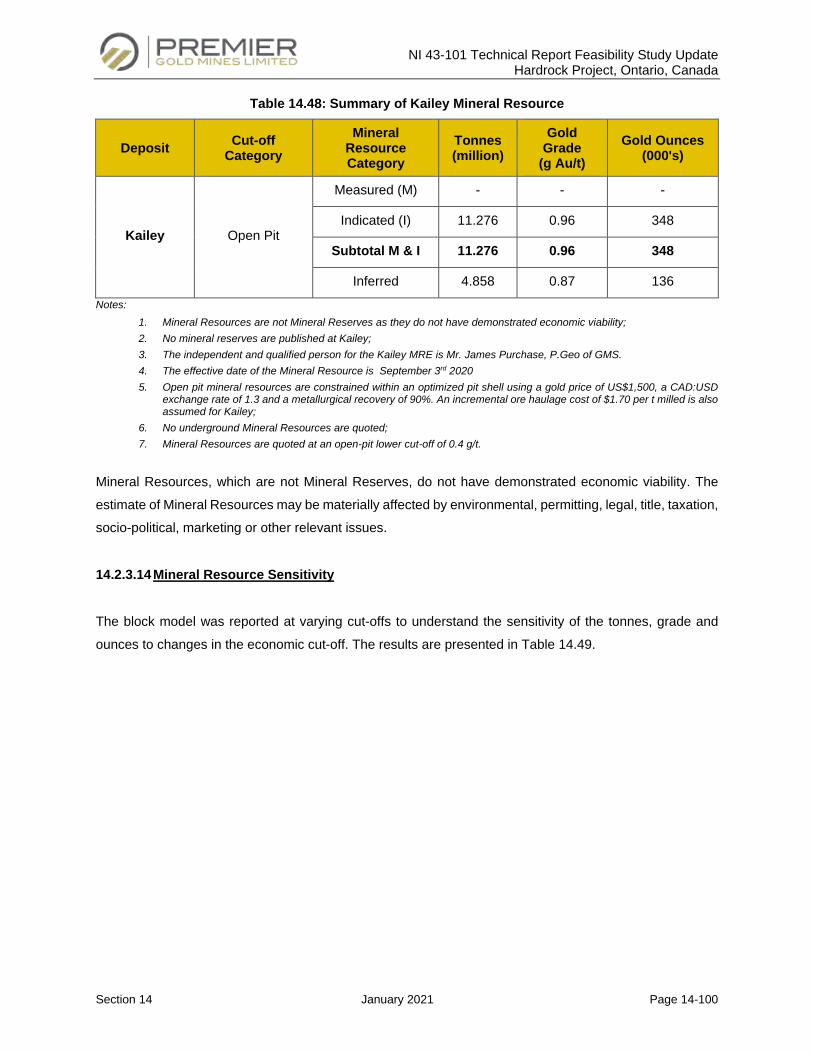
NI 43-101 Technical Report Feasibility Study Update Hardrock Project, Ontario, Canada
Section 14 January 2021 Page 14-100
Table 14.48: Summary of Kailey Mineral Resource
Deposit Cut-off Category
Mineral Resource Category
Tonnes (million)
Gold Grade
(g Au/t) Gold Ounces
(000's)
Kailey Open Pit
Measured (M) - - -
Indicated (I) 11.276 0.96 348
Subtotal M & I 11.276 0.96 348
Inferred 4.858 0.87 136 Notes:
1. Mineral Resources are not Mineral Reserves as they do not have demonstrated economic viability; 2. No mineral reserves are published at Kailey; 3. The independent and qualified person for the Kailey MRE is Mr. James Purchase, P.Geo of GMS. 4. The effective date of the Mineral Resource is September 3rd 2020 5. Open pit mineral resources are constrained within an optimized pit shell using a gold price of US$1,500, a CAD:USD
exchange rate of 1.3 and a metallurgical recovery of 90%. An incremental ore haulage cost of $1.70 per t milled is also assumed for Kailey;
6. No underground Mineral Resources are quoted; 7. Mineral Resources are quoted at an open-pit lower cut-off of 0.4 g/t.
Mineral Resources, which are not Mineral Reserves, do not have demonstrated economic viability. The
estimate of Mineral Resources may be materially affected by environmental, permitting, legal, title, taxation,
socio-political, marketing or other relevant issues.
14.2.3.14 Mineral Resource Sensitivity
The block model was reported at varying cut-offs to understand the sensitivity of the tonnes, grade and
ounces to changes in the economic cut-off. The results are presented in Table 14.49.
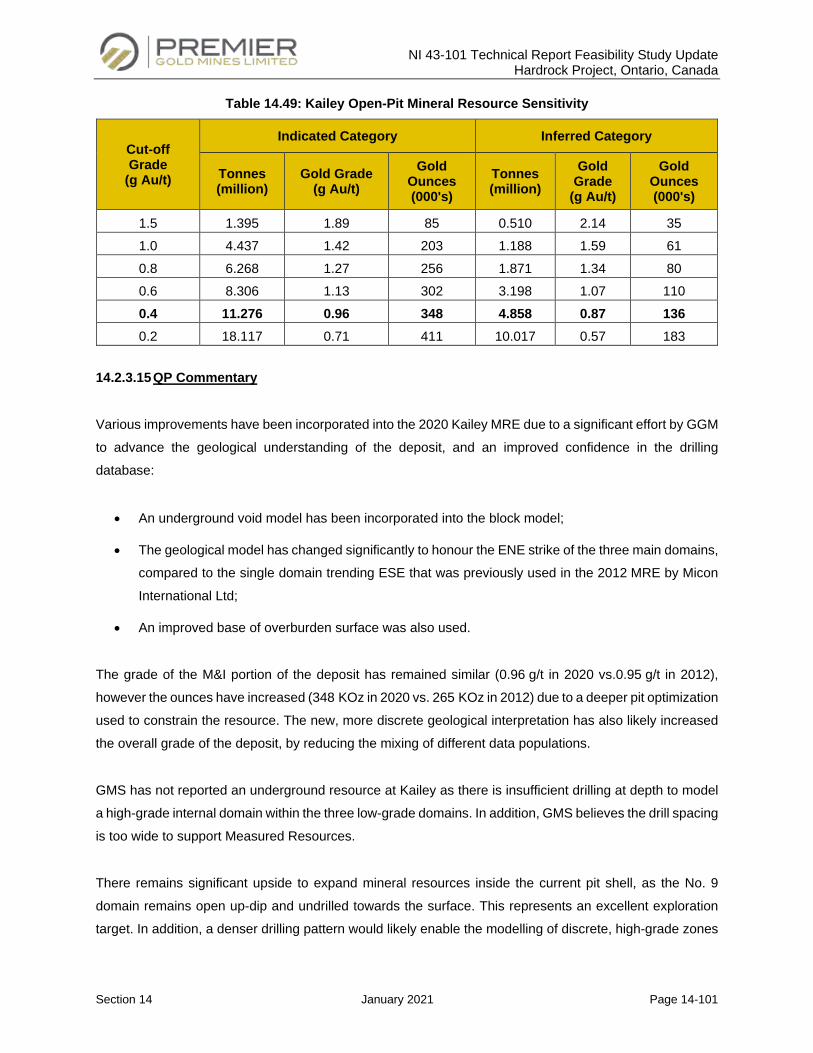
NI 43-101 Technical Report Feasibility Study Update Hardrock Project, Ontario, Canada
Section 14 January 2021 Page 14-101
Table 14.49: Kailey Open-Pit Mineral Resource Sensitivity
Cut-off Grade
(g Au/t)
Indicated Category Inferred Category
Tonnes (million)
Gold Grade (g Au/t)
Gold Ounces (000's)
Tonnes (million)
Gold Grade
(g Au/t)
Gold Ounces (000's)
1.5 1.395 1.89 85 0.510 2.14 35 1.0 4.437 1.42 203 1.188 1.59 61 0.8 6.268 1.27 256 1.871 1.34 80 0.6 8.306 1.13 302 3.198 1.07 110 0.4 11.276 0.96 348 4.858 0.87 136 0.2 18.117 0.71 411 10.017 0.57 183
14.2.3.15 QP Commentary
Various improvements have been incorporated into the 2020 Kailey MRE due to a significant effort by GGM
to advance the geological understanding of the deposit, and an improved confidence in the drilling
database:
• An underground void model has been incorporated into the block model;
• The geological model has changed significantly to honour the ENE strike of the three main domains,
compared to the single domain trending ESE that was previously used in the 2012 MRE by Micon
International Ltd;
• An improved base of overburden surface was also used.
The grade of the M&I portion of the deposit has remained similar (0.96 g/t in 2020 vs.0.95 g/t in 2012),
however the ounces have increased (348 KOz in 2020 vs. 265 KOz in 2012) due to a deeper pit optimization
used to constrain the resource. The new, more discrete geological interpretation has also likely increased
the overall grade of the deposit, by reducing the mixing of different data populations.
GMS has not reported an underground resource at Kailey as there is insufficient drilling at depth to model
a high-grade internal domain within the three low-grade domains. In addition, GMS believes the drill spacing
is too wide to support Measured Resources.
There remains significant upside to expand mineral resources inside the current pit shell, as the No. 9
domain remains open up-dip and undrilled towards the surface. This represents an excellent exploration
target. In addition, a denser drilling pattern would likely enable the modelling of discrete, high-grade zones

NI 43-101 Technical Report Feasibility Study Update Hardrock Project, Ontario, Canada
Section 14 January 2021 Page 14-102
which could result in the declaration of an underground mineral resource. Discrete veins were mined at
Little Long Lac in the past at an average grade of ≈ 10 g Au/t, and there is good potential to discover new
high-grade veins in the axial planes of newly identified folds.
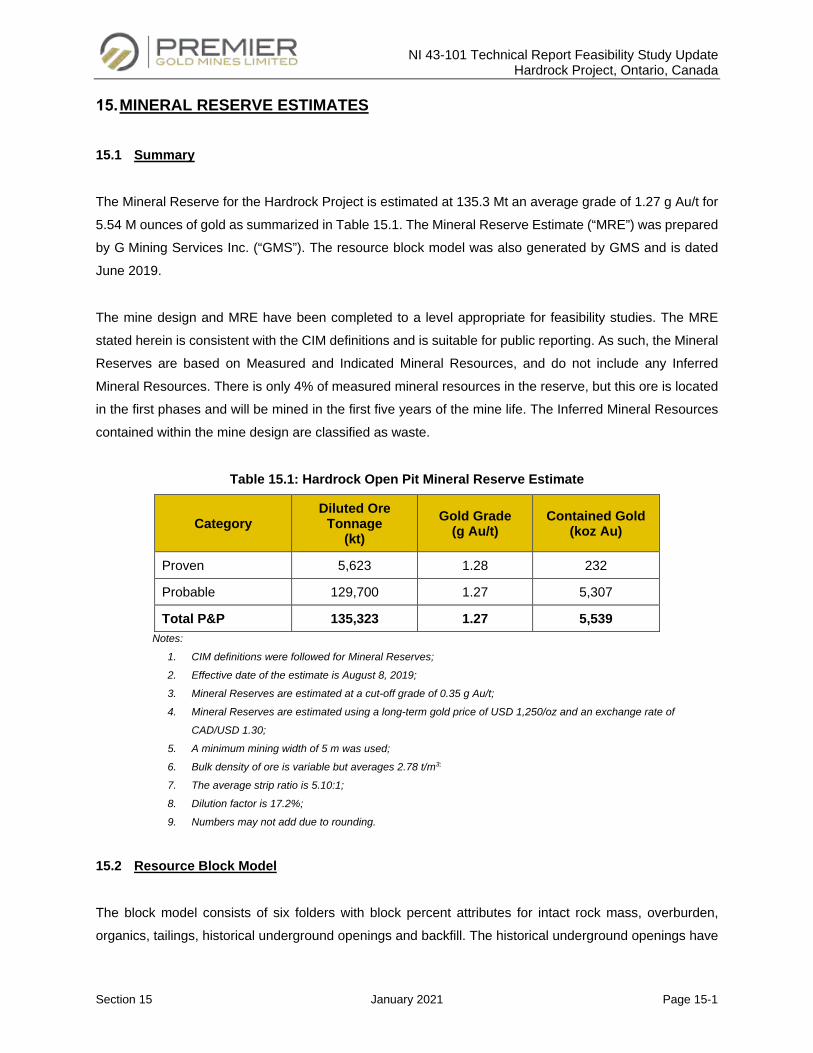
NI 43-101 Technical Report Feasibility Study Update Hardrock Project, Ontario, Canada
Section 15 January 2021 Page 15-1
MINERAL RESERVE ESTIMATES
15.1 Summary
The Mineral Reserve for the Hardrock Project is estimated at 135.3 Mt an average grade of 1.27 g Au/t for
5.54 M ounces of gold as summarized in Table 15.1. The Mineral Reserve Estimate (“MRE”) was prepared
by G Mining Services Inc. (“GMS”). The resource block model was also generated by GMS and is dated
June 2019.
The mine design and MRE have been completed to a level appropriate for feasibility studies. The MRE
stated herein is consistent with the CIM definitions and is suitable for public reporting. As such, the Mineral
Reserves are based on Measured and Indicated Mineral Resources, and do not include any Inferred
Mineral Resources. There is only 4% of measured mineral resources in the reserve, but this ore is located
in the first phases and will be mined in the first five years of the mine life. The Inferred Mineral Resources
contained within the mine design are classified as waste.
Table 15.1: Hardrock Open Pit Mineral Reserve Estimate
Category Diluted Ore
Tonnage (kt)
Gold Grade (g Au/t)
Contained Gold (koz Au)
Proven 5,623 1.28 232
Probable 129,700 1.27 5,307
Total P&P 135,323 1.27 5,539 Notes:
1. CIM definitions were followed for Mineral Reserves;
2. Effective date of the estimate is August 8, 2019;
3. Mineral Reserves are estimated at a cut-off grade of 0.35 g Au/t;
4. Mineral Reserves are estimated using a long-term gold price of USD 1,250/oz and an exchange rate of
CAD/USD 1.30;
5. A minimum mining width of 5 m was used;
6. Bulk density of ore is variable but averages 2.78 t/m3;
7. The average strip ratio is 5.10:1;
8. Dilution factor is 17.2%;
9. Numbers may not add due to rounding.
15.2 Resource Block Model
The block model consists of six folders with block percent attributes for intact rock mass, overburden,
organics, tailings, historical underground openings and backfill. The historical underground openings have
NI 43-101 Technical Report Feasibility Study Update Hardrock Project, Ontario, Canada
Section 15 January 2021 Page 15-2
been modelled and depleted in the block model with backfill densities assigned for stopes backfilled with
sand or rock. Some tailings overlay the pit footprint and have been modelled to allow for their tracking and
management in the material movement plan.
15.3 Pit Optimization
Open pit optimization was conducted to determine the optimal economic shape of the open pit to guide the
pit design process. This task was undertaken using the Whittle software which is based on the Lerchs-
Grossmann algorithm. The method works on a block model of the ore body, and progressively constructs
lists of related blocks that should, or should not, be mined. The method uses the values of the blocks to
define a pit outline that has the highest possible total economic value, subject to the required pit slopes
defined as structure arcs in the software. This section describes all the parameters used to calculate block
values in Whittle.
For this Report, Measured and Indicated Mineral Resource blocks were considered for optimization
purposes and for mineable resource calculations. However, sensitivities were run using the complete
resource.
15.3.1 Pit Slope Geotechnical Assessment
Golder was mandated to produce a feasibility level pit slope design study to support the mine designs. The
conclusions of this study have been used as an input to the pit optimization and design process.
The Golder scope included reviewing geotechnical field investigations carried out by mine design
engineering, carrying out follow-up field investigations and providing feasibility level slope designs for the
open pit.
It has been assessed that the open pit will be developed in a good to very good rock mass where rock mass
failure is not a concern. Historical underground long wall mining has proven the quality of the rock mass.
The mineralization is found in upright sub-vertical axial planes that trend roughly east-west. The fold axes
are shallowly west-plunging.
Potential instability will involve structural controls, the most significant being the foliation control on the
bench face angle and the potential control of flat sets on the bench crest back-break angles. No major faults
have been identified that will adversely daylight on the final pit walls. The locations of the underground
workings and whether they are filled or unfilled are well understood. Risks to safety and pit access due to
these stopes must be mitigated through design and planning at all stages of the Project.
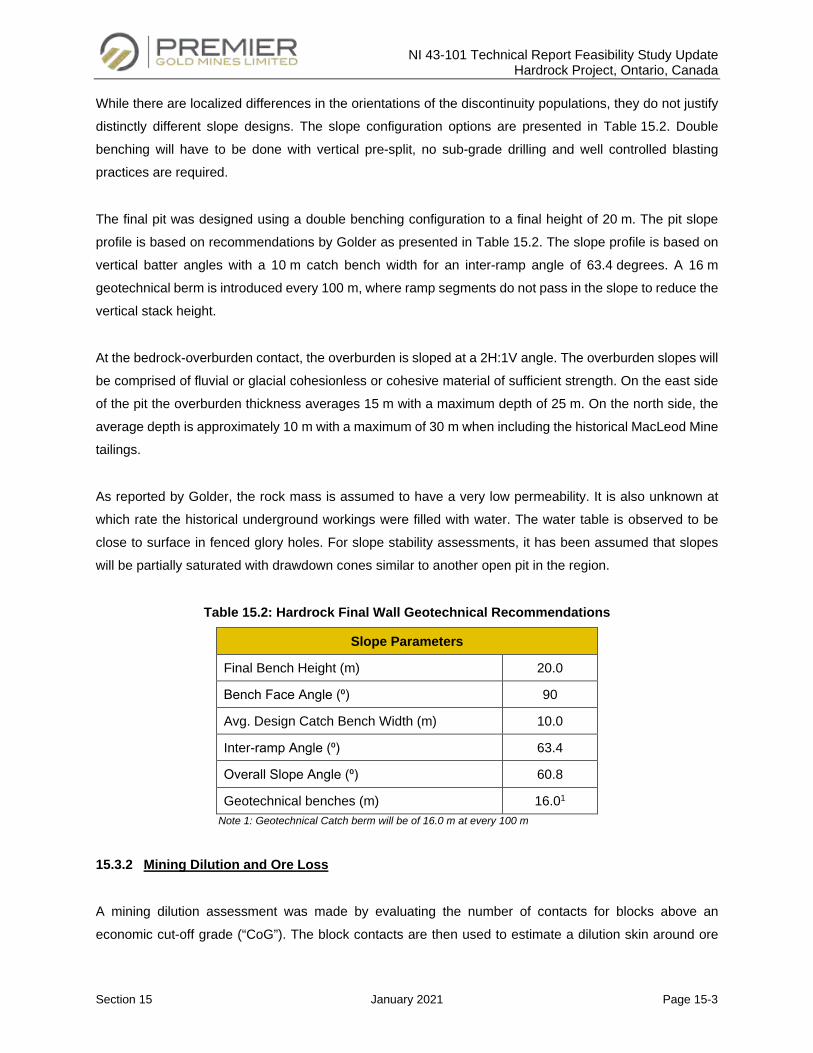
NI 43-101 Technical Report Feasibility Study Update Hardrock Project, Ontario, Canada
Section 15 January 2021 Page 15-3
While there are localized differences in the orientations of the discontinuity populations, they do not justify
distinctly different slope designs. The slope configuration options are presented in Table 15.2. Double
benching will have to be done with vertical pre-split, no sub-grade drilling and well controlled blasting
practices are required.
The final pit was designed using a double benching configuration to a final height of 20 m. The pit slope
profile is based on recommendations by Golder as presented in Table 15.2. The slope profile is based on
vertical batter angles with a 10 m catch bench width for an inter-ramp angle of 63.4 degrees. A 16 m
geotechnical berm is introduced every 100 m, where ramp segments do not pass in the slope to reduce the
vertical stack height.
At the bedrock-overburden contact, the overburden is sloped at a 2H:1V angle. The overburden slopes will
be comprised of fluvial or glacial cohesionless or cohesive material of sufficient strength. On the east side
of the pit the overburden thickness averages 15 m with a maximum depth of 25 m. On the north side, the
average depth is approximately 10 m with a maximum of 30 m when including the historical MacLeod Mine
tailings.
As reported by Golder, the rock mass is assumed to have a very low permeability. It is also unknown at
which rate the historical underground workings were filled with water. The water table is observed to be
close to surface in fenced glory holes. For slope stability assessments, it has been assumed that slopes
will be partially saturated with drawdown cones similar to another open pit in the region.
Table 15.2: Hardrock Final Wall Geotechnical Recommendations
Slope Parameters
Final Bench Height (m) 20.0
Bench Face Angle (⁰) 90
Avg. Design Catch Bench Width (m) 10.0
Inter-ramp Angle (⁰) 63.4
Overall Slope Angle (⁰) 60.8
Geotechnical benches (m) 16.01 Note 1: Geotechnical Catch berm will be of 16.0 m at every 100 m
15.3.2 Mining Dilution and Ore Loss
A mining dilution assessment was made by evaluating the number of contacts for blocks above an
economic cut-off grade (“CoG”). The block contacts are then used to estimate a dilution skin around ore
NI 43-101 Technical Report Feasibility Study Update Hardrock Project, Ontario, Canada
Section 15 January 2021 Page 15-4
blocks to estimate an expected dilution during mining. The dilution skin consists of 0.75 m of material in a
north-south direction (across strike) and 1.0 m in an east-west direction (along strike). The dilution is
therefore specific to the geometry of the ore body and the number of contacts between ore and waste.
For each mineralized block in the resource model diluted grades (Au, As and S) and a new density are
calculated by taking into account the in-situ grades and in-situ density of the surrounding blocks.
15.3.3 Pit Optimization Parameters
A summary of the pit optimization parameters is presented in Table 15.3 for a milling rate of 27 kt/d based
on a long-term gold price of USD 1,250/oz and an exchange rate of CAD/USD 1.30.
The gold selling cost includes a 3% royalty fee plus a transport and refining cost of CAD 3.00/oz. The cost
parameters were estimated based on first principles. The total ore-based cost is estimated at CAD 10.45/t
which includes processing, general and administration costs and a sustaining capital provision.
Unit reference mining costs are used for a “reference mining block” usually located near the pit crest or
surface and are incremented with depth which corresponds to the additional cycle time and thus hauling
cost. The reference mining cost is estimated at CAD 2.05/t with an incremental depth factor of CAD 0.033/t
per 10 m bench.
A physical hard boundary was imposed in the optimization process to prevent the pit from encroaching into
nearby lakes (Figure 15.1). The hard boundary was established to maintain a 30 m buffer zone between
the pit and the lake high water limit which corresponds to the 330 m level contour.
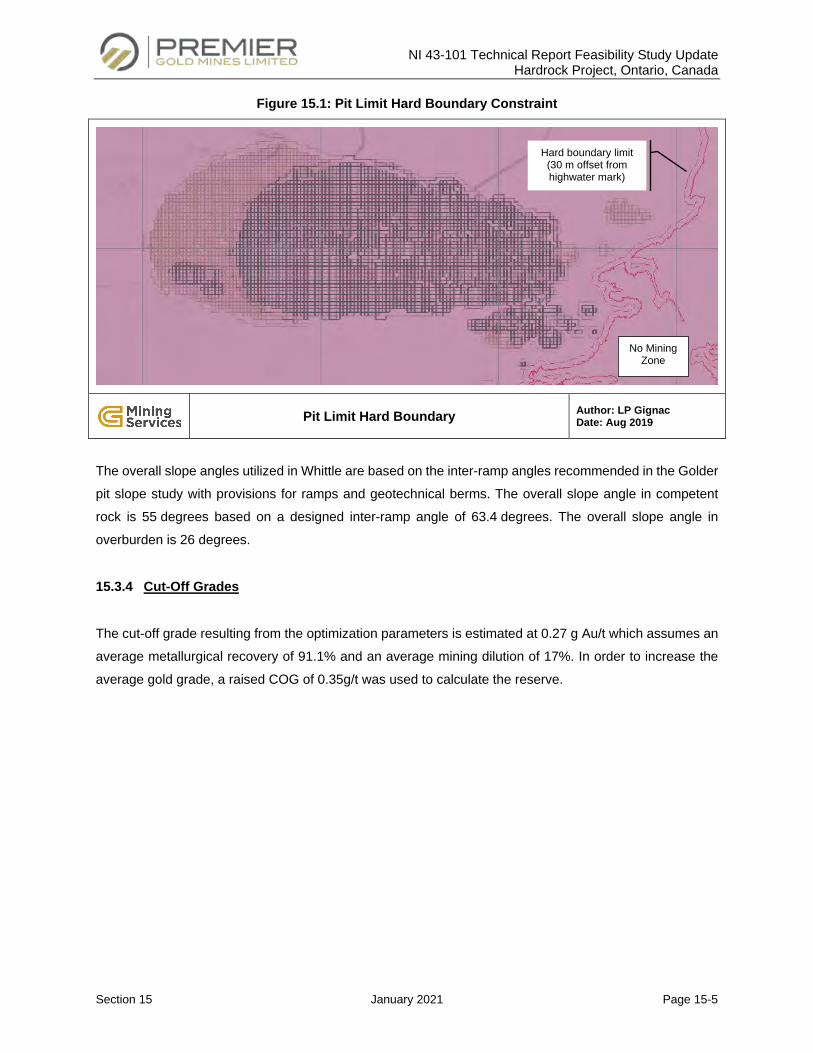
NI 43-101 Technical Report Feasibility Study Update Hardrock Project, Ontario, Canada
Section 15 January 2021 Page 15-5
Figure 15.1: Pit Limit Hard Boundary Constraint
Pit Limit Hard Boundary Author: LP Gignac
Date: Aug 2019
The overall slope angles utilized in Whittle are based on the inter-ramp angles recommended in the Golder
pit slope study with provisions for ramps and geotechnical berms. The overall slope angle in competent
rock is 55 degrees based on a designed inter-ramp angle of 63.4 degrees. The overall slope angle in
overburden is 26 degrees.
15.3.4 Cut-Off Grades
The cut-off grade resulting from the optimization parameters is estimated at 0.27 g Au/t which assumes an
average metallurgical recovery of 91.1% and an average mining dilution of 17%. In order to increase the
average gold grade, a raised COG of 0.35g/t was used to calculate the reserve.
Hard boundary limit (30 m offset from highwater mark)
No Mining Zone
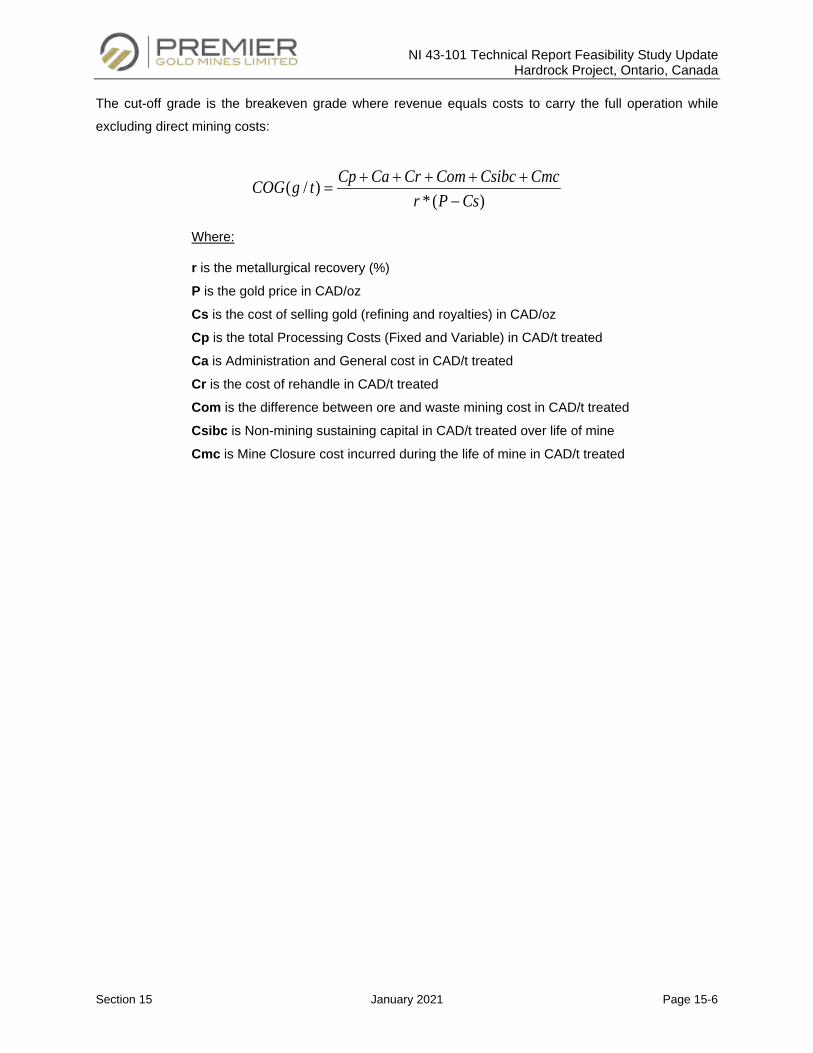
NI 43-101 Technical Report Feasibility Study Update Hardrock Project, Ontario, Canada
Section 15 January 2021 Page 15-6
The cut-off grade is the breakeven grade where revenue equals costs to carry the full operation while
excluding direct mining costs:
)(*)/(
CsPrCmcCsibcComCrCaCptgCOG
−+++++
=
Where:
r is the metallurgical recovery (%)
P is the gold price in CAD/oz
Cs is the cost of selling gold (refining and royalties) in CAD/oz
Cp is the total Processing Costs (Fixed and Variable) in CAD/t treated
Ca is Administration and General cost in CAD/t treated
Cr is the cost of rehandle in CAD/t treated
Com is the difference between ore and waste mining cost in CAD/t treated
Csibc is Non-mining sustaining capital in CAD/t treated over life of mine
Cmc is Mine Closure cost incurred during the life of mine in CAD/t treated
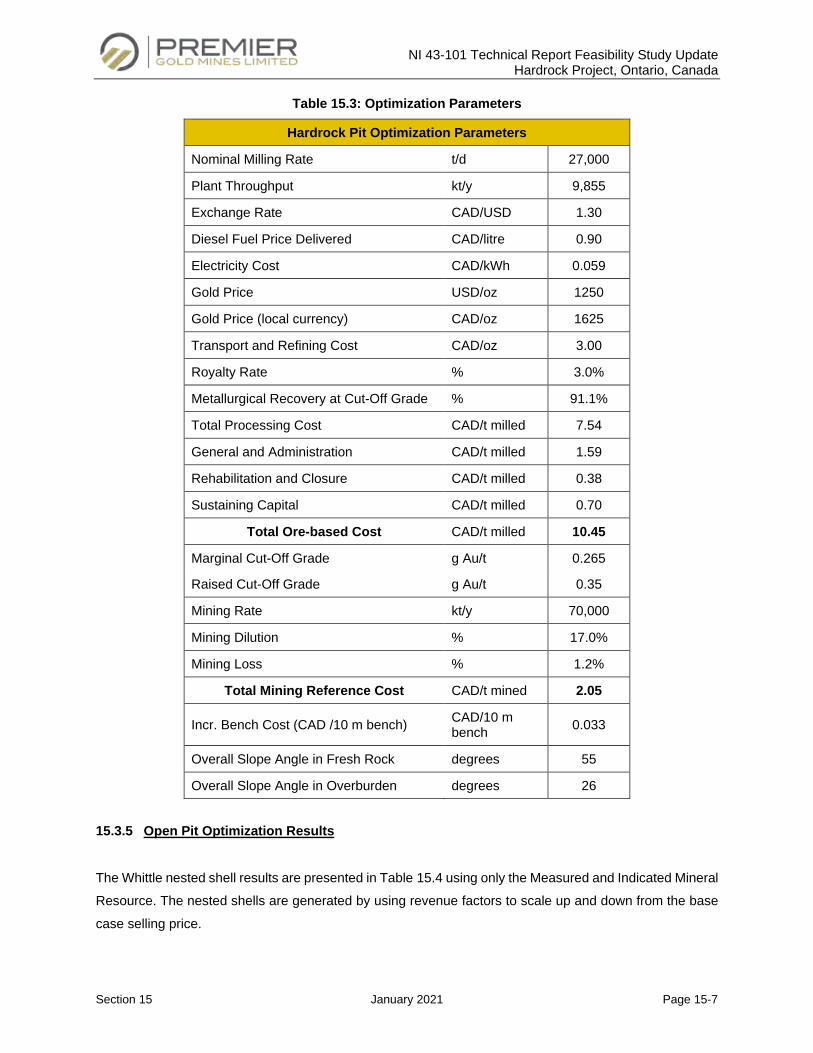
NI 43-101 Technical Report Feasibility Study Update Hardrock Project, Ontario, Canada
Section 15 January 2021 Page 15-7
Table 15.3: Optimization Parameters
Hardrock Pit Optimization Parameters
Nominal Milling Rate t/d 27,000
Plant Throughput kt/y 9,855
Exchange Rate CAD/USD 1.30
Diesel Fuel Price Delivered CAD/litre 0.90
Electricity Cost CAD/kWh 0.059
Gold Price USD/oz 1250
Gold Price (local currency) CAD/oz 1625
Transport and Refining Cost CAD/oz 3.00
Royalty Rate % 3.0%
Metallurgical Recovery at Cut-Off Grade % 91.1%
Total Processing Cost CAD/t milled 7.54
General and Administration CAD/t milled 1.59
Rehabilitation and Closure CAD/t milled 0.38
Sustaining Capital CAD/t milled 0.70
Total Ore-based Cost CAD/t milled 10.45
Marginal Cut-Off Grade g Au/t 0.265
Raised Cut-Off Grade g Au/t 0.35
Mining Rate kt/y 70,000
Mining Dilution % 17.0%
Mining Loss % 1.2%
Total Mining Reference Cost CAD/t mined 2.05
Incr. Bench Cost (CAD /10 m bench) CAD/10 m bench 0.033
Overall Slope Angle in Fresh Rock degrees 55
Overall Slope Angle in Overburden degrees 26
15.3.5 Open Pit Optimization Results
The Whittle nested shell results are presented in Table 15.4 using only the Measured and Indicated Mineral
Resource. The nested shells are generated by using revenue factors to scale up and down from the base
case selling price.
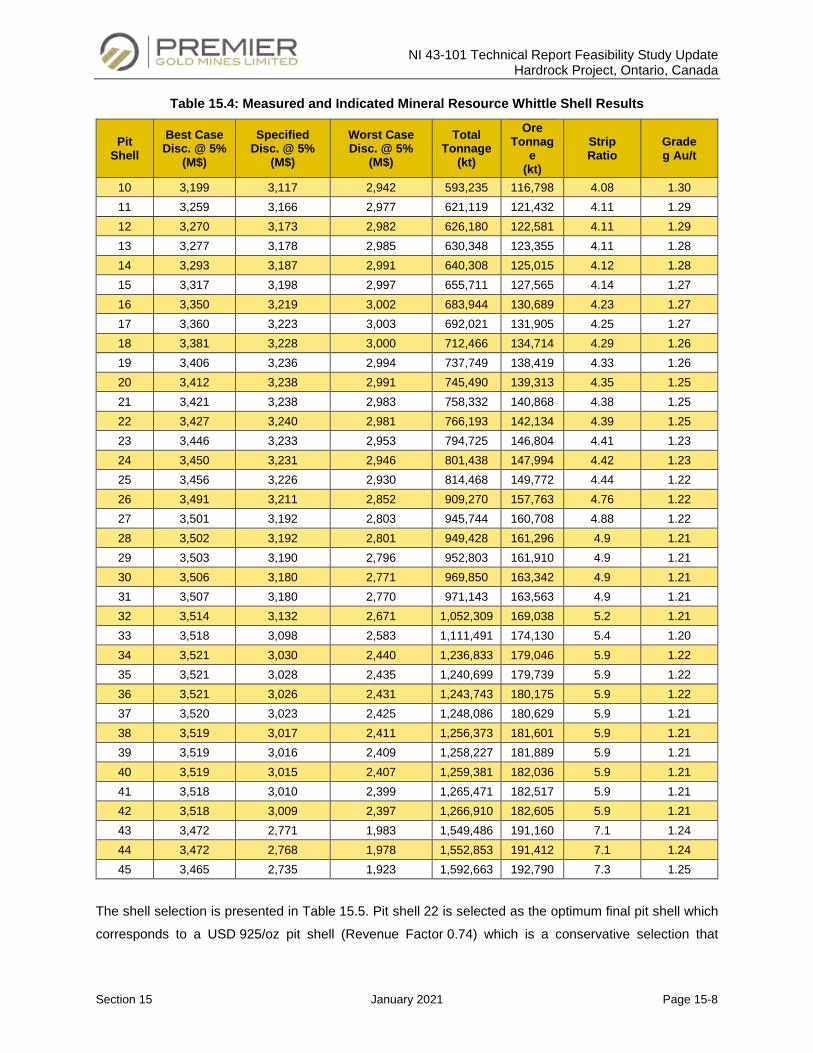
NI 43-101 Technical Report Feasibility Study Update Hardrock Project, Ontario, Canada
Section 15 January 2021 Page 15-8
Table 15.4: Measured and Indicated Mineral Resource Whittle Shell Results
Pit Shell
Best Case Disc. @ 5%
(M$)
Specified Disc. @ 5%
(M$)
Worst Case Disc. @ 5%
(M$)
Total Tonnage
(kt)
Ore Tonnag
e (kt)
Strip Ratio
Grade g Au/t
10 3,199 3,117 2,942 593,235 116,798 4.08 1.30 11 3,259 3,166 2,977 621,119 121,432 4.11 1.29 12 3,270 3,173 2,982 626,180 122,581 4.11 1.29 13 3,277 3,178 2,985 630,348 123,355 4.11 1.28 14 3,293 3,187 2,991 640,308 125,015 4.12 1.28 15 3,317 3,198 2,997 655,711 127,565 4.14 1.27 16 3,350 3,219 3,002 683,944 130,689 4.23 1.27 17 3,360 3,223 3,003 692,021 131,905 4.25 1.27 18 3,381 3,228 3,000 712,466 134,714 4.29 1.26 19 3,406 3,236 2,994 737,749 138,419 4.33 1.26 20 3,412 3,238 2,991 745,490 139,313 4.35 1.25 21 3,421 3,238 2,983 758,332 140,868 4.38 1.25 22 3,427 3,240 2,981 766,193 142,134 4.39 1.25 23 3,446 3,233 2,953 794,725 146,804 4.41 1.23 24 3,450 3,231 2,946 801,438 147,994 4.42 1.23 25 3,456 3,226 2,930 814,468 149,772 4.44 1.22 26 3,491 3,211 2,852 909,270 157,763 4.76 1.22 27 3,501 3,192 2,803 945,744 160,708 4.88 1.22 28 3,502 3,192 2,801 949,428 161,296 4.9 1.21 29 3,503 3,190 2,796 952,803 161,910 4.9 1.21 30 3,506 3,180 2,771 969,850 163,342 4.9 1.21 31 3,507 3,180 2,770 971,143 163,563 4.9 1.21 32 3,514 3,132 2,671 1,052,309 169,038 5.2 1.21 33 3,518 3,098 2,583 1,111,491 174,130 5.4 1.20 34 3,521 3,030 2,440 1,236,833 179,046 5.9 1.22 35 3,521 3,028 2,435 1,240,699 179,739 5.9 1.22 36 3,521 3,026 2,431 1,243,743 180,175 5.9 1.22 37 3,520 3,023 2,425 1,248,086 180,629 5.9 1.21 38 3,519 3,017 2,411 1,256,373 181,601 5.9 1.21 39 3,519 3,016 2,409 1,258,227 181,889 5.9 1.21 40 3,519 3,015 2,407 1,259,381 182,036 5.9 1.21 41 3,518 3,010 2,399 1,265,471 182,517 5.9 1.21 42 3,518 3,009 2,397 1,266,910 182,605 5.9 1.21 43 3,472 2,771 1,983 1,549,486 191,160 7.1 1.24 44 3,472 2,768 1,978 1,552,853 191,412 7.1 1.24 45 3,465 2,735 1,923 1,592,663 192,790 7.3 1.25
The shell selection is presented in Table 15.5. Pit shell 22 is selected as the optimum final pit shell which
corresponds to a USD 925/oz pit shell (Revenue Factor 0.74) which is a conservative selection that
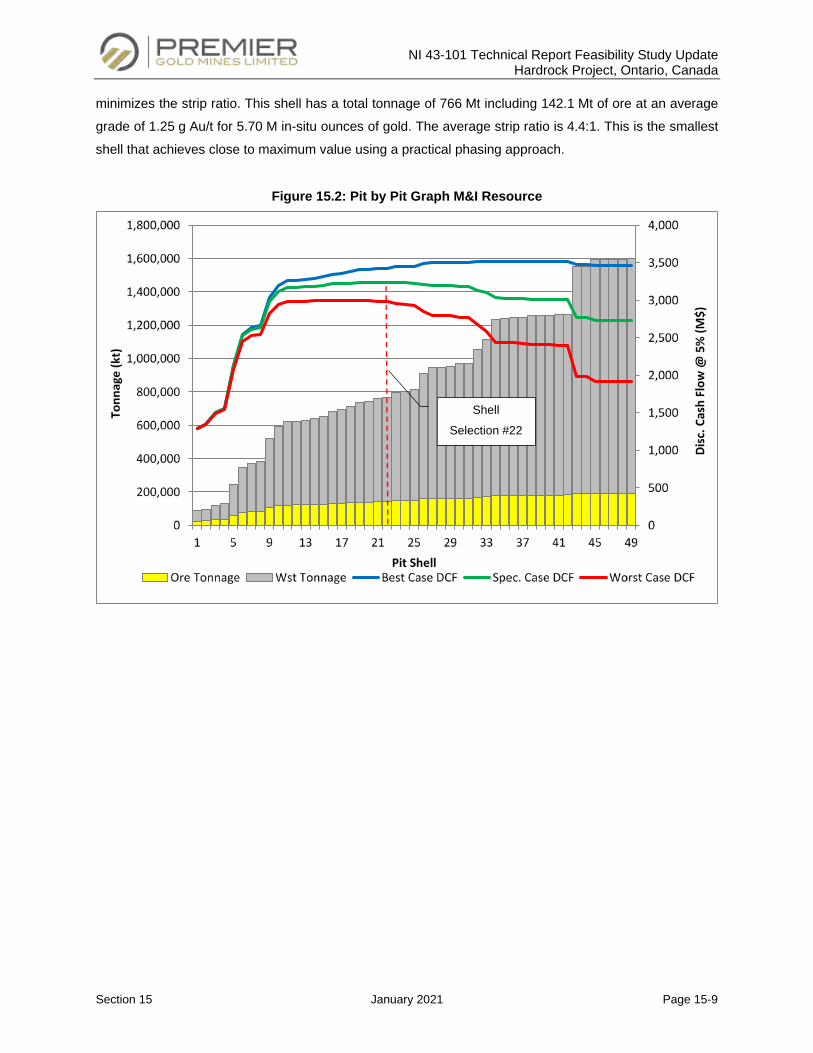
NI 43-101 Technical Report Feasibility Study Update Hardrock Project, Ontario, Canada
Section 15 January 2021 Page 15-9
minimizes the strip ratio. This shell has a total tonnage of 766 Mt including 142.1 Mt of ore at an average
grade of 1.25 g Au/t for 5.70 M in-situ ounces of gold. The average strip ratio is 4.4:1. This is the smallest
shell that achieves close to maximum value using a practical phasing approach.
Figure 15.2: Pit by Pit Graph M&I Resource
Shell
Selection #22
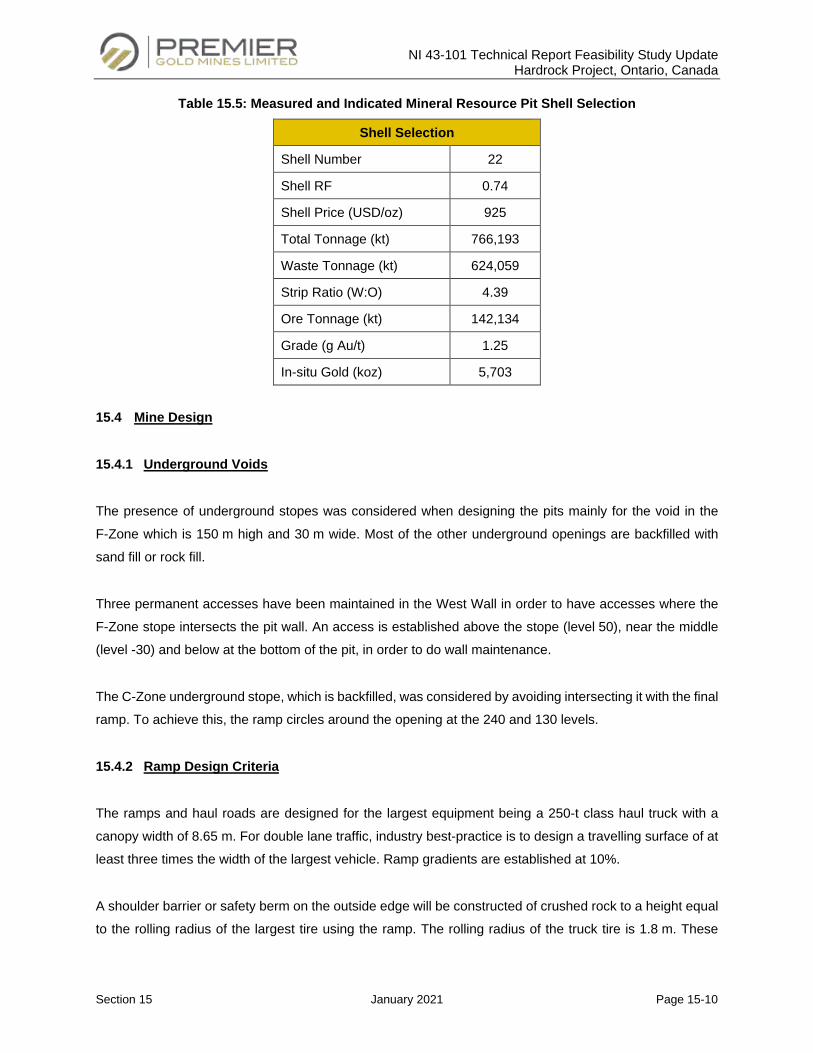
NI 43-101 Technical Report Feasibility Study Update Hardrock Project, Ontario, Canada
Section 15 January 2021 Page 15-10
Table 15.5: Measured and Indicated Mineral Resource Pit Shell Selection
Shell Selection
Shell Number 22
Shell RF 0.74
Shell Price (USD/oz) 925
Total Tonnage (kt) 766,193
Waste Tonnage (kt) 624,059
Strip Ratio (W:O) 4.39
Ore Tonnage (kt) 142,134
Grade (g Au/t) 1.25
In-situ Gold (koz) 5,703
15.4 Mine Design
15.4.1 Underground Voids
The presence of underground stopes was considered when designing the pits mainly for the void in the
F-Zone which is 150 m high and 30 m wide. Most of the other underground openings are backfilled with
sand fill or rock fill.
Three permanent accesses have been maintained in the West Wall in order to have accesses where the
F-Zone stope intersects the pit wall. An access is established above the stope (level 50), near the middle
(level -30) and below at the bottom of the pit, in order to do wall maintenance.
The C-Zone underground stope, which is backfilled, was considered by avoiding intersecting it with the final
ramp. To achieve this, the ramp circles around the opening at the 240 and 130 levels.
15.4.2 Ramp Design Criteria
The ramps and haul roads are designed for the largest equipment being a 250-t class haul truck with a
canopy width of 8.65 m. For double lane traffic, industry best-practice is to design a travelling surface of at
least three times the width of the largest vehicle. Ramp gradients are established at 10%.
A shoulder barrier or safety berm on the outside edge will be constructed of crushed rock to a height equal
to the rolling radius of the largest tire using the ramp. The rolling radius of the truck tire is 1.8 m. These
NI 43-101 Technical Report Feasibility Study Update Hardrock Project, Ontario, Canada
Section 15 January 2021 Page 15-11
shoulder barriers are required wherever a drop-off greater than 3 m exists and will be designed at 1.1H:1V.
A ditch planned on the highwall will capture run-off from the pit wall surface and assure proper drainage of
the running surface. The ditch will be 1.2 m wide. To facilitate drainage of the roadway a 2% cross slope
on the ramp is planned.
The double lane ramp width is 32.0 m wide and the single lane ramp is 18.5 m wide. Single lane ramps are
introduced in the pit bottom when the benches start narrowing and when the mining rates will be significantly
reduced.
15.4.3 Open Pit Mine Design Results
The final pit design is presented in Figure 15.3. The final pit is 1,800 m along strike and 875 m wide and
reaches a depth of 610 m. The final pit design has two exits; one to the east and one to the west, to provide
access to the pushbacks and to shorten haul distances to the crusher and waste dumps. The west ramp
system connects with the east ramp system at a plateau at a depth of 190 m. The ramp system introduces
several switchbacks in several instances to avoid ramps passing through underground openings and to
reduce the overall slope angle.
The west wall is steepest to access ore at depth. The ore is located mostly in the F-Zone. The pit is shallower
on the east side as the mineralization plunges to the West.
There is a satellite pit to the east that is separated from the main pit. This satellite pit is 100 m deep and is
limited to the east by the high-level water mark of the Kenogamisis Lake.
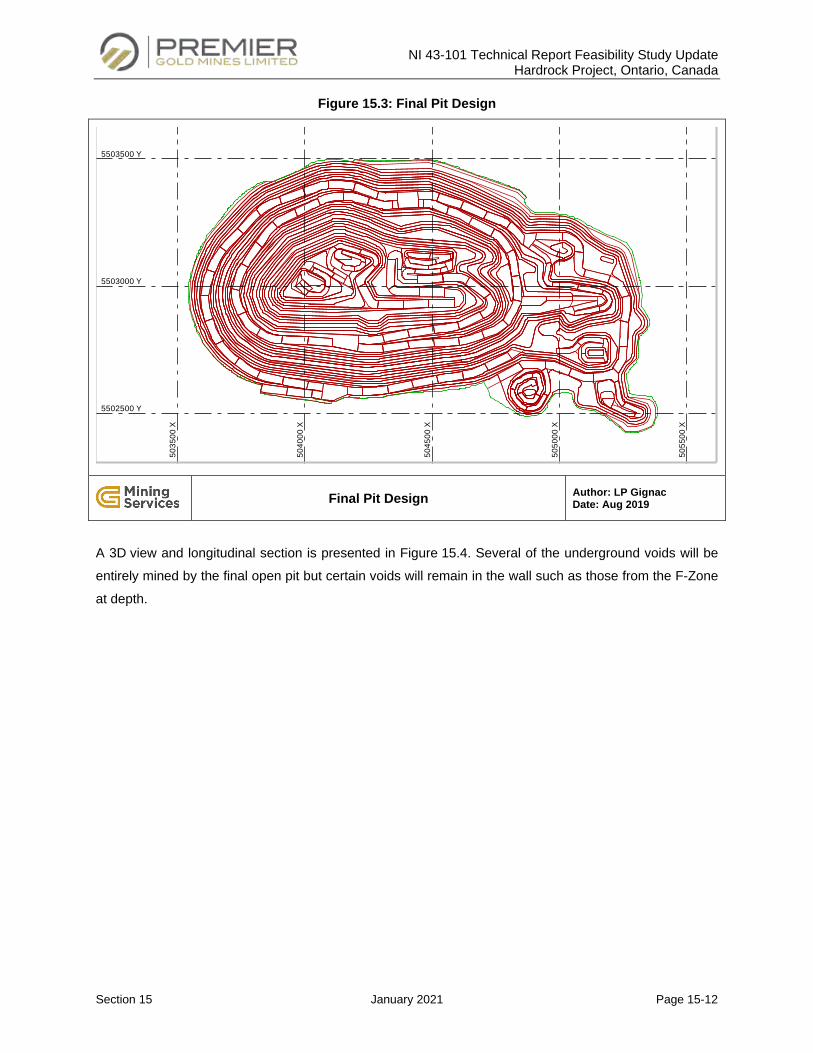
NI 43-101 Technical Report Feasibility Study Update Hardrock Project, Ontario, Canada
Section 15 January 2021 Page 15-12
Figure 15.3: Final Pit Design
Final Pit Design Author: LP Gignac
Date: Aug 2019
A 3D view and longitudinal section is presented in Figure 15.4. Several of the underground voids will be
entirely mined by the final open pit but certain voids will remain in the wall such as those from the F-Zone
at depth.
5035
00 X
5040
00 X
5045
00 X
5050
00 X
5055
00 X
5502500 Y
5503000 Y
5503500 Y
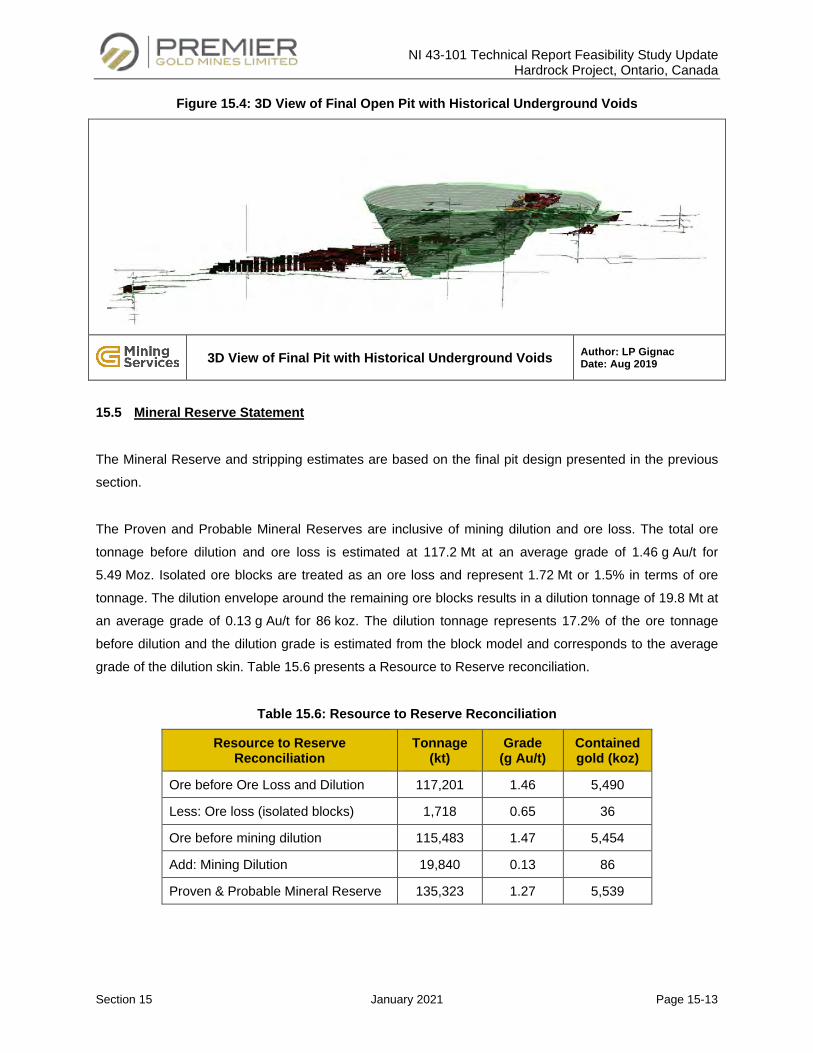
NI 43-101 Technical Report Feasibility Study Update Hardrock Project, Ontario, Canada
Section 15 January 2021 Page 15-13
Figure 15.4: 3D View of Final Open Pit with Historical Underground Voids
3D View of Final Pit with Historical Underground Voids Author: LP Gignac
Date: Aug 2019
15.5 Mineral Reserve Statement
The Mineral Reserve and stripping estimates are based on the final pit design presented in the previous
section.
The Proven and Probable Mineral Reserves are inclusive of mining dilution and ore loss. The total ore
tonnage before dilution and ore loss is estimated at 117.2 Mt at an average grade of 1.46 g Au/t for
5.49 Moz. Isolated ore blocks are treated as an ore loss and represent 1.72 Mt or 1.5% in terms of ore
tonnage. The dilution envelope around the remaining ore blocks results in a dilution tonnage of 19.8 Mt at
an average grade of 0.13 g Au/t for 86 koz. The dilution tonnage represents 17.2% of the ore tonnage
before dilution and the dilution grade is estimated from the block model and corresponds to the average
grade of the dilution skin. Table 15.6 presents a Resource to Reserve reconciliation.
Table 15.6: Resource to Reserve Reconciliation
Resource to Reserve Reconciliation
Tonnage (kt)
Grade (g Au/t)
Contained gold (koz)
Ore before Ore Loss and Dilution 117,201 1.46 5,490
Less: Ore loss (isolated blocks) 1,718 0.65 36
Ore before mining dilution 115,483 1.47 5,454
Add: Mining Dilution 19,840 0.13 86
Proven & Probable Mineral Reserve 135,323 1.27 5,539
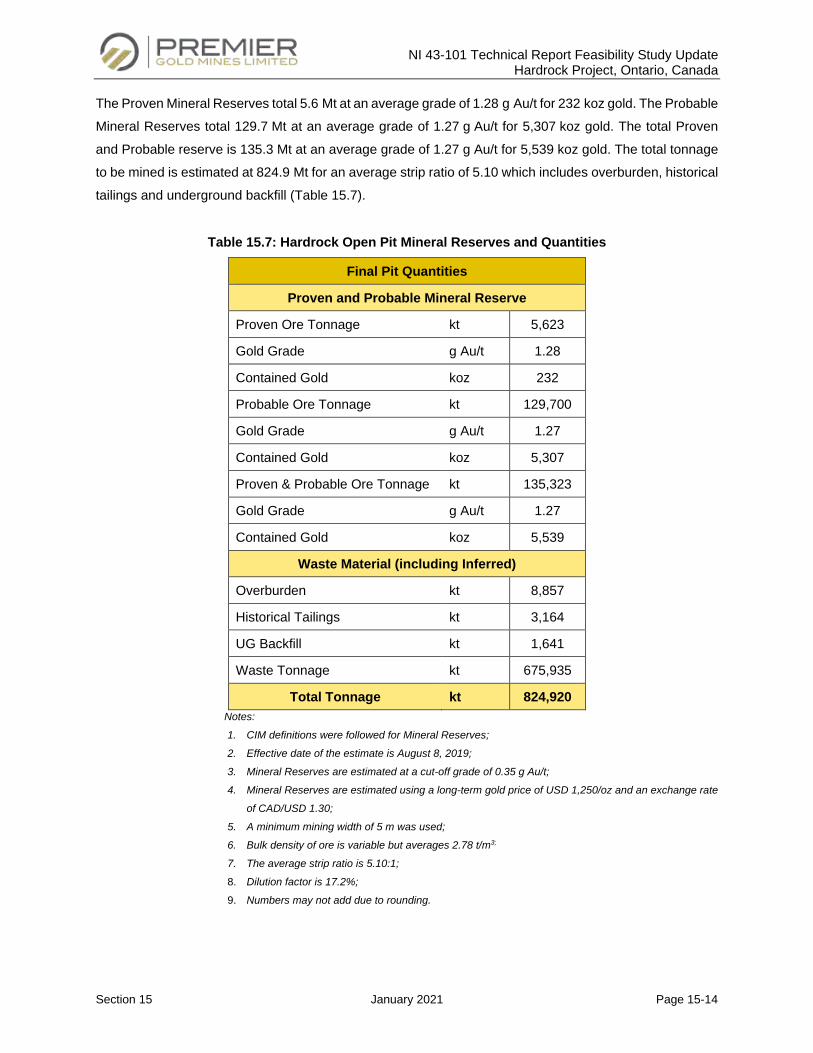
NI 43-101 Technical Report Feasibility Study Update Hardrock Project, Ontario, Canada
Section 15 January 2021 Page 15-14
The Proven Mineral Reserves total 5.6 Mt at an average grade of 1.28 g Au/t for 232 koz gold. The Probable
Mineral Reserves total 129.7 Mt at an average grade of 1.27 g Au/t for 5,307 koz gold. The total Proven
and Probable reserve is 135.3 Mt at an average grade of 1.27 g Au/t for 5,539 koz gold. The total tonnage
to be mined is estimated at 824.9 Mt for an average strip ratio of 5.10 which includes overburden, historical
tailings and underground backfill (Table 15.7).
Table 15.7: Hardrock Open Pit Mineral Reserves and Quantities
Final Pit Quantities
Proven and Probable Mineral Reserve
Proven Ore Tonnage kt 5,623
Gold Grade g Au/t 1.28
Contained Gold koz 232
Probable Ore Tonnage kt 129,700
Gold Grade g Au/t 1.27
Contained Gold koz 5,307
Proven & Probable Ore Tonnage kt 135,323
Gold Grade g Au/t 1.27
Contained Gold koz 5,539
Waste Material (including Inferred)
Overburden kt 8,857
Historical Tailings kt 3,164
UG Backfill kt 1,641
Waste Tonnage kt 675,935
Total Tonnage kt 824,920 Notes:
1. CIM definitions were followed for Mineral Reserves;
2. Effective date of the estimate is August 8, 2019;
3. Mineral Reserves are estimated at a cut-off grade of 0.35 g Au/t;
4. Mineral Reserves are estimated using a long-term gold price of USD 1,250/oz and an exchange rate
of CAD/USD 1.30;
5. A minimum mining width of 5 m was used;
6. Bulk density of ore is variable but averages 2.78 t/m3;
7. The average strip ratio is 5.10:1;
8. Dilution factor is 17.2%; 9. Numbers may not add due to rounding.
NI 43-101 Technical Report Feasibility Study Update Hardrock Project, Ontario, Canada
Section 16 January 2021 Page 16-1
MINING METHODS
16.1 Introduction
The Project consists of developing an open pit that will mine through the historical underground workings
of the MacLeod-Cockshutt and Hard Rock Mines. Furthermore, the proposed open pit location is bisected
by the Trans-Canada Highway 11 and requires a new by-pass and the relocation of various surface
infrastructures.
16.2 Mine Designs
16.2.1 Open Pit Phases
Mining of the Hardrock main pit will occur in five main phases preceded by a starter pit. The content of each
mining phase is summarized in Table 16.1. The objective of pit phasing is to improve the economics of the
Project by feeding the highest grade during the earlier years and/or delaying waste stripping until later
years. The starter pit and Phase 1 are designed to initiate mining before the Trans-Canada Highway is
relocated. With the mineralization plunging westward, the pit phases progressively expand to the west.
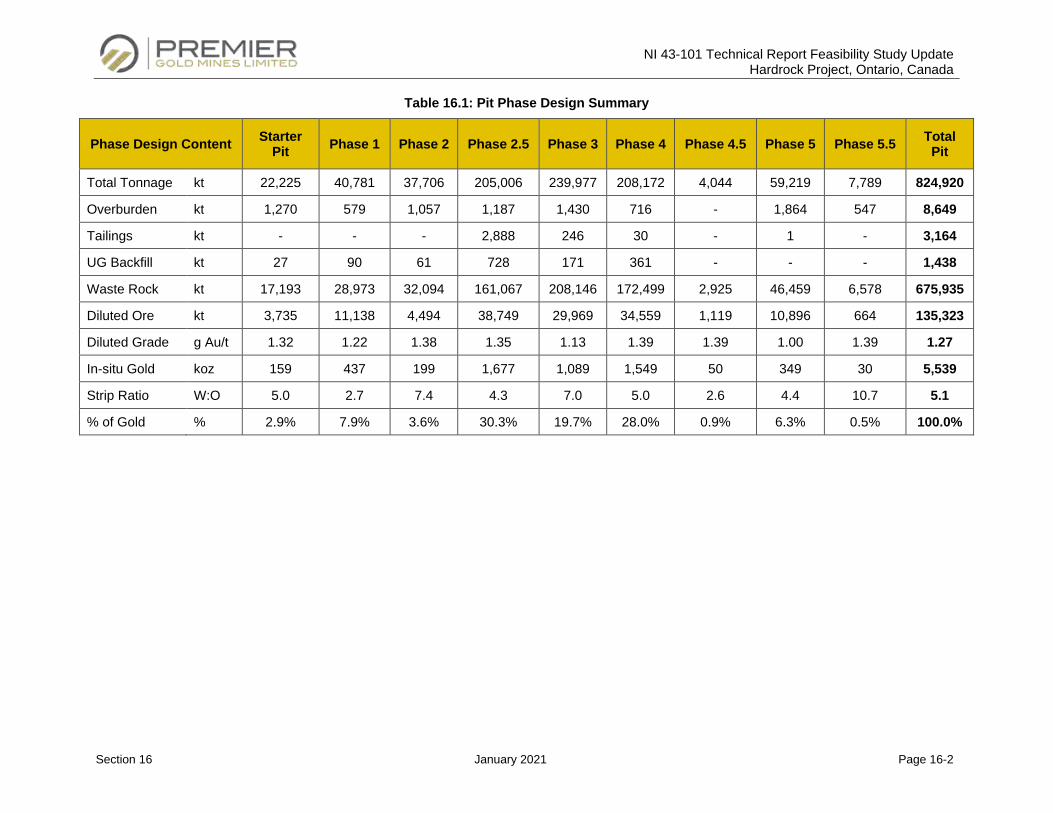
NI 43-101 Technical Report Feasibility Study Update Hardrock Project, Ontario, Canada
Section 16 January 2021 Page 16-2
Table 16.1: Pit Phase Design Summary
Phase Design Content Starter Pit Phase 1 Phase 2 Phase 2.5 Phase 3 Phase 4 Phase 4.5 Phase 5 Phase 5.5 Total
Pit
Total Tonnage kt 22,225 40,781 37,706 205,006 239,977 208,172 4,044 59,219 7,789 824,920
Overburden kt 1,270 579 1,057 1,187 1,430 716 - 1,864 547 8,649
Tailings kt - - - 2,888 246 30 - 1 - 3,164
UG Backfill kt 27 90 61 728 171 361 - - - 1,438
Waste Rock kt 17,193 28,973 32,094 161,067 208,146 172,499 2,925 46,459 6,578 675,935
Diluted Ore kt 3,735 11,138 4,494 38,749 29,969 34,559 1,119 10,896 664 135,323
Diluted Grade g Au/t 1.32 1.22 1.38 1.35 1.13 1.39 1.39 1.00 1.39 1.27
In-situ Gold koz 159 437 199 1,677 1,089 1,549 50 349 30 5,539
Strip Ratio W:O 5.0 2.7 7.4 4.3 7.0 5.0 2.6 4.4 10.7 5.1
% of Gold % 2.9% 7.9% 3.6% 30.3% 19.7% 28.0% 0.9% 6.3% 0.5% 100.0%
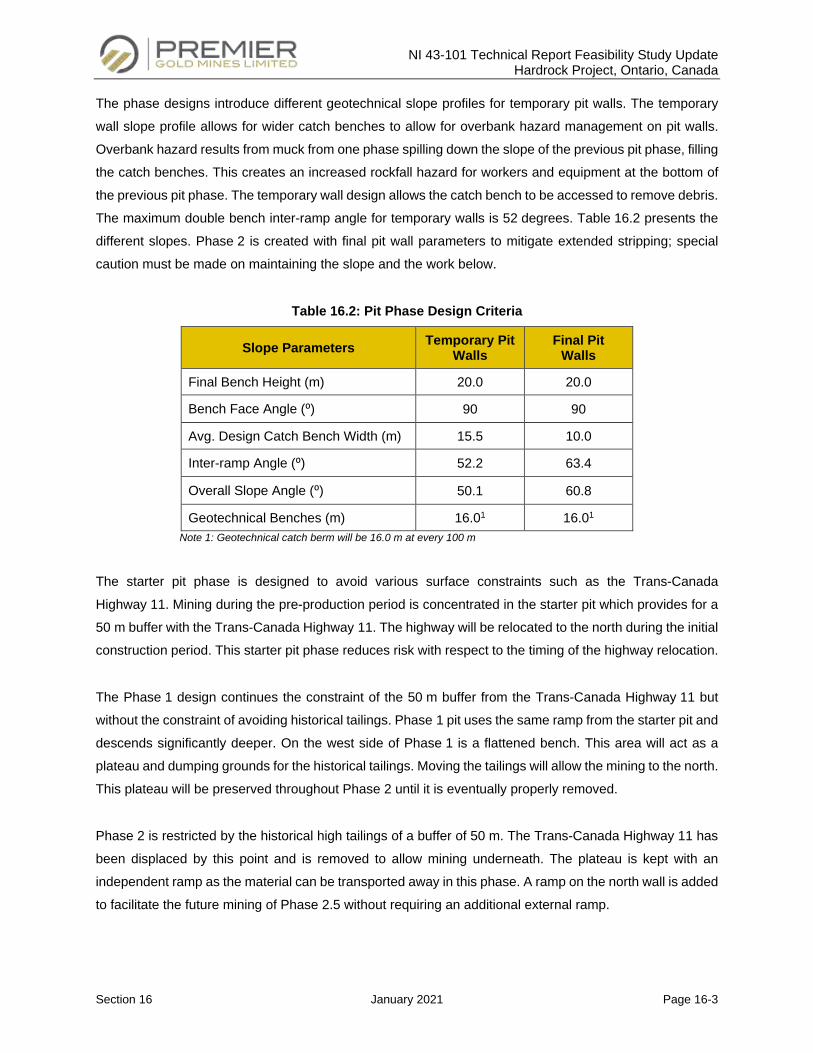
NI 43-101 Technical Report Feasibility Study Update Hardrock Project, Ontario, Canada
Section 16 January 2021 Page 16-3
The phase designs introduce different geotechnical slope profiles for temporary pit walls. The temporary
wall slope profile allows for wider catch benches to allow for overbank hazard management on pit walls.
Overbank hazard results from muck from one phase spilling down the slope of the previous pit phase, filling
the catch benches. This creates an increased rockfall hazard for workers and equipment at the bottom of
the previous pit phase. The temporary wall design allows the catch bench to be accessed to remove debris.
The maximum double bench inter-ramp angle for temporary walls is 52 degrees. Table 16.2 presents the
different slopes. Phase 2 is created with final pit wall parameters to mitigate extended stripping; special
caution must be made on maintaining the slope and the work below.
Table 16.2: Pit Phase Design Criteria
Slope Parameters Temporary Pit Walls
Final Pit Walls
Final Bench Height (m) 20.0 20.0
Bench Face Angle (⁰) 90 90
Avg. Design Catch Bench Width (m) 15.5 10.0
Inter-ramp Angle (⁰) 52.2 63.4
Overall Slope Angle (⁰) 50.1 60.8
Geotechnical Benches (m) 16.01 16.01 Note 1: Geotechnical catch berm will be 16.0 m at every 100 m
The starter pit phase is designed to avoid various surface constraints such as the Trans-Canada
Highway 11. Mining during the pre-production period is concentrated in the starter pit which provides for a
50 m buffer with the Trans-Canada Highway 11. The highway will be relocated to the north during the initial
construction period. This starter pit phase reduces risk with respect to the timing of the highway relocation.
The Phase 1 design continues the constraint of the 50 m buffer from the Trans-Canada Highway 11 but
without the constraint of avoiding historical tailings. Phase 1 pit uses the same ramp from the starter pit and
descends significantly deeper. On the west side of Phase 1 is a flattened bench. This area will act as a
plateau and dumping grounds for the historical tailings. Moving the tailings will allow the mining to the north.
This plateau will be preserved throughout Phase 2 until it is eventually properly removed.
Phase 2 is restricted by the historical high tailings of a buffer of 50 m. The Trans-Canada Highway 11 has
been displaced by this point and is removed to allow mining underneath. The plateau is kept with an
independent ramp as the material can be transported away in this phase. A ramp on the north wall is added
to facilitate the future mining of Phase 2.5 without requiring an additional external ramp.
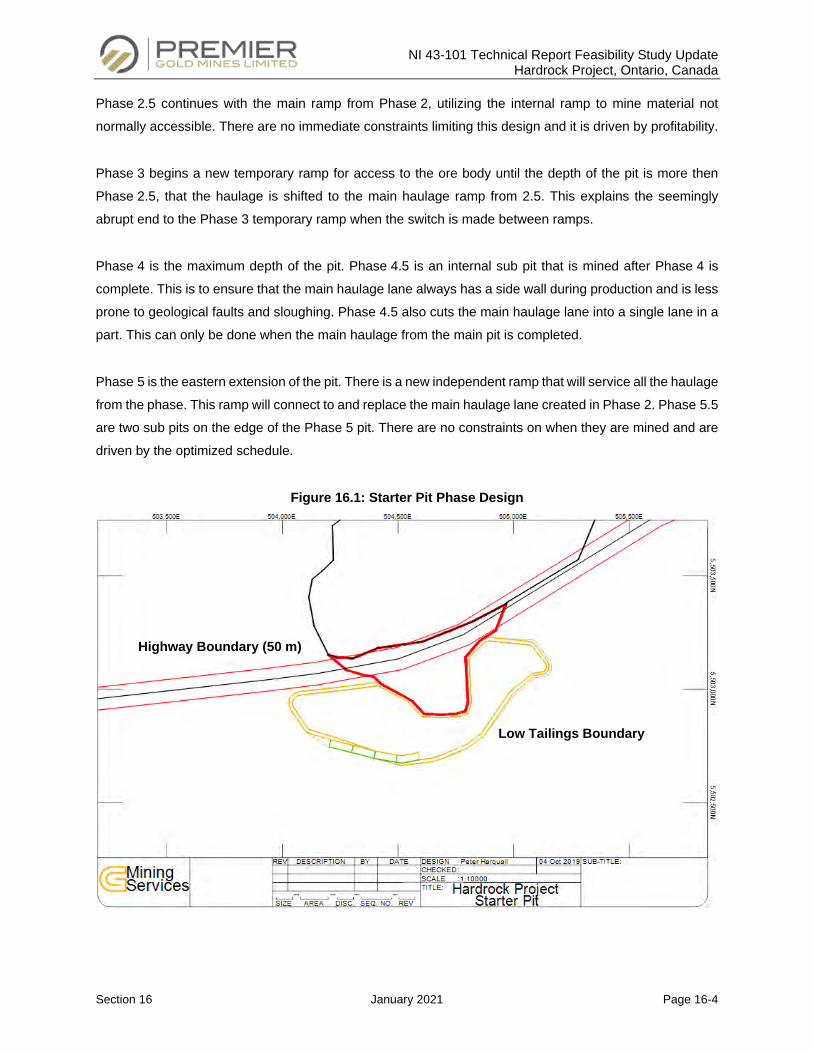
NI 43-101 Technical Report Feasibility Study Update Hardrock Project, Ontario, Canada
Section 16 January 2021 Page 16-4
Phase 2.5 continues with the main ramp from Phase 2, utilizing the internal ramp to mine material not
normally accessible. There are no immediate constraints limiting this design and it is driven by profitability.
Phase 3 begins a new temporary ramp for access to the ore body until the depth of the pit is more then
Phase 2.5, that the haulage is shifted to the main haulage ramp from 2.5. This explains the seemingly
abrupt end to the Phase 3 temporary ramp when the switch is made between ramps.
Phase 4 is the maximum depth of the pit. Phase 4.5 is an internal sub pit that is mined after Phase 4 is
complete. This is to ensure that the main haulage lane always has a side wall during production and is less
prone to geological faults and sloughing. Phase 4.5 also cuts the main haulage lane into a single lane in a
part. This can only be done when the main haulage from the main pit is completed.
Phase 5 is the eastern extension of the pit. There is a new independent ramp that will service all the haulage
from the phase. This ramp will connect to and replace the main haulage lane created in Phase 2. Phase 5.5
are two sub pits on the edge of the Phase 5 pit. There are no constraints on when they are mined and are
driven by the optimized schedule.
Figure 16.1: Starter Pit Phase Design
Highway Boundary (50 m)
Low Tailings Boundary
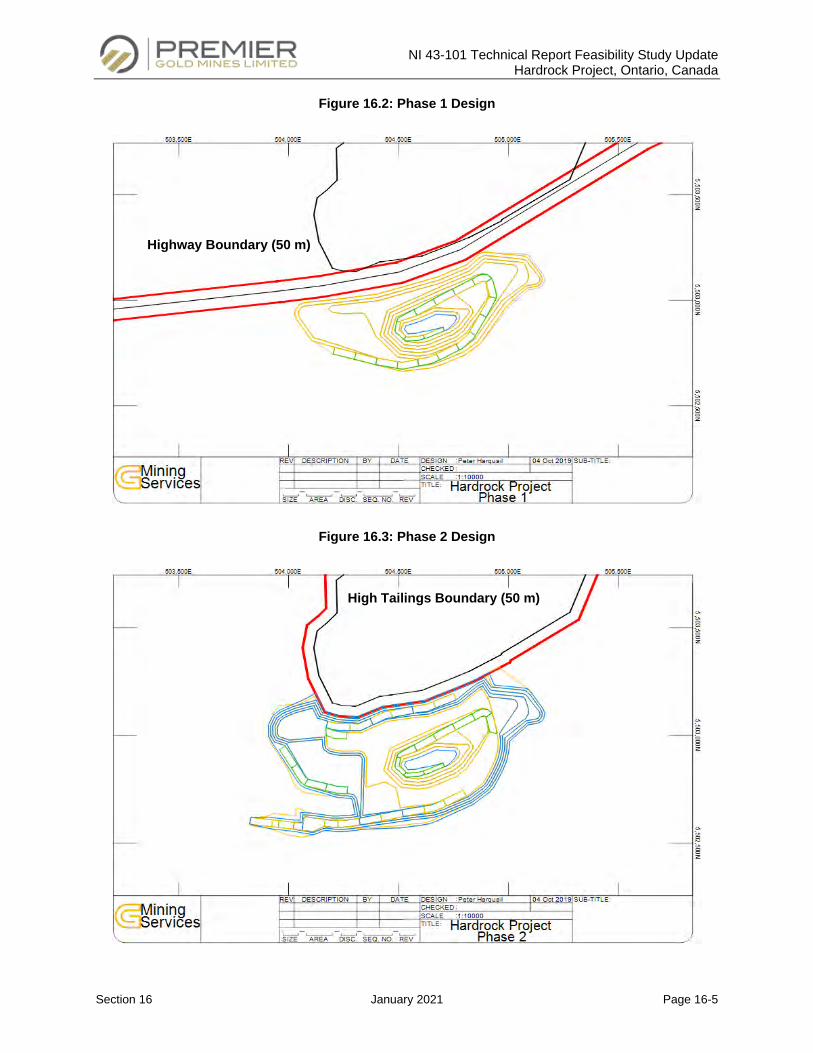
NI 43-101 Technical Report Feasibility Study Update Hardrock Project, Ontario, Canada
Section 16 January 2021 Page 16-5
Figure 16.2: Phase 1 Design
Figure 16.3: Phase 2 Design
Highway Boundary (50 m)
High Tailings Boundary (50 m)
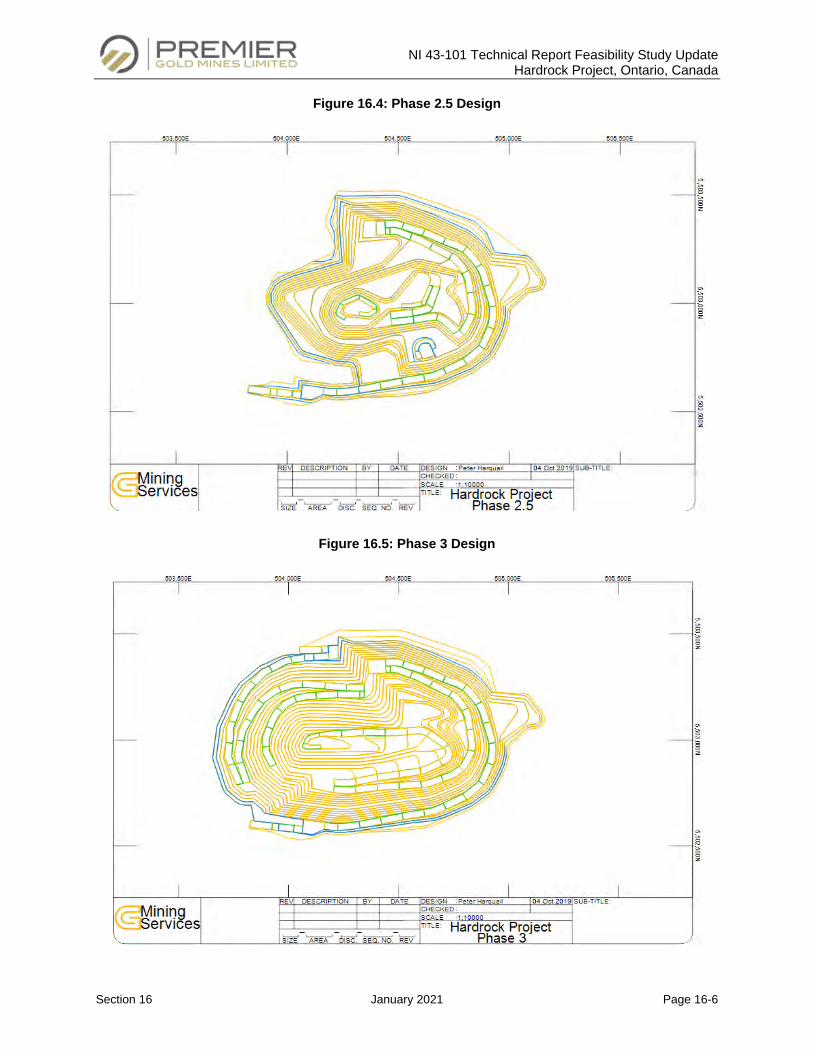
NI 43-101 Technical Report Feasibility Study Update Hardrock Project, Ontario, Canada
Section 16 January 2021 Page 16-6
Figure 16.4: Phase 2.5 Design
Figure 16.5: Phase 3 Design
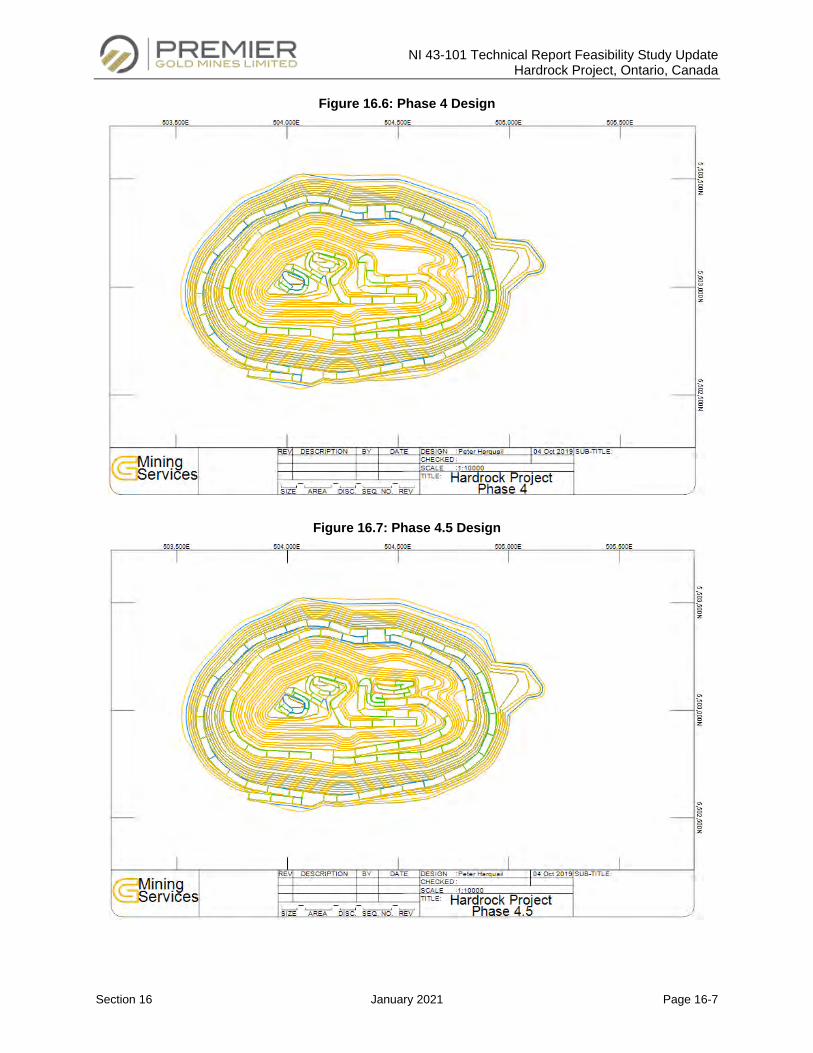
NI 43-101 Technical Report Feasibility Study Update Hardrock Project, Ontario, Canada
Section 16 January 2021 Page 16-7
Figure 16.6: Phase 4 Design
Figure 16.7: Phase 4.5 Design
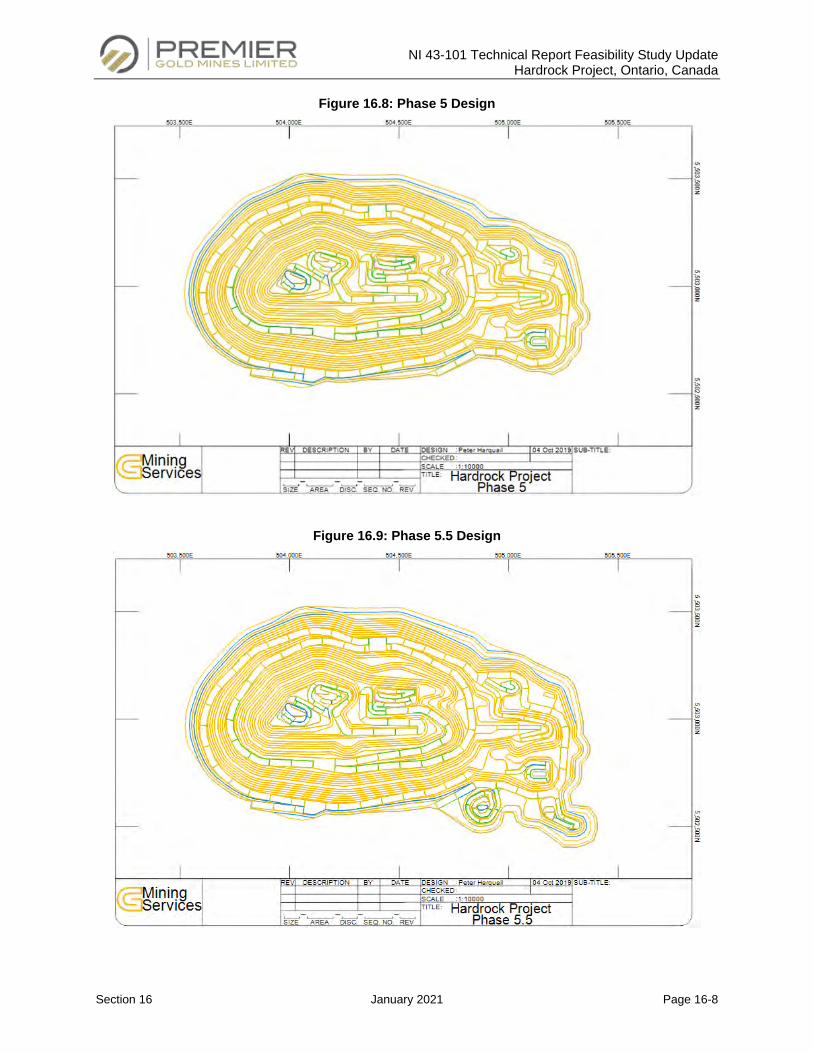
NI 43-101 Technical Report Feasibility Study Update Hardrock Project, Ontario, Canada
Section 16 January 2021 Page 16-8
Figure 16.8: Phase 5 Design
Figure 16.9: Phase 5.5 Design
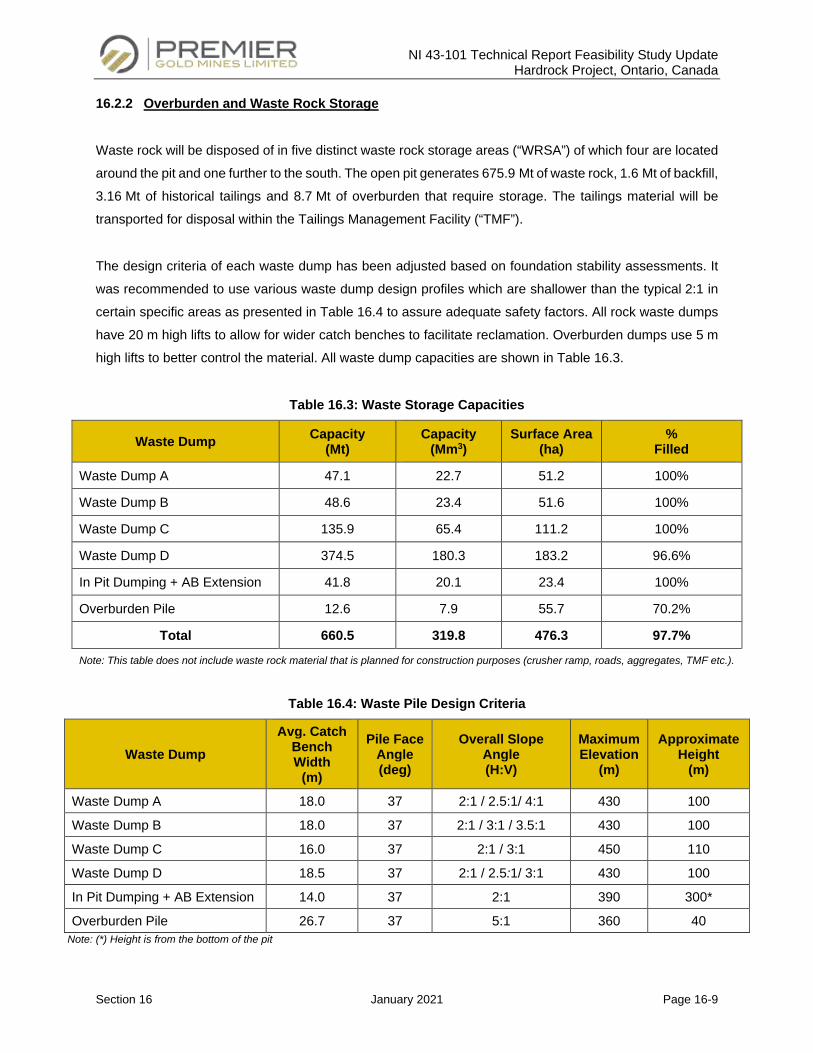
NI 43-101 Technical Report Feasibility Study Update Hardrock Project, Ontario, Canada
Section 16 January 2021 Page 16-9
16.2.2 Overburden and Waste Rock Storage
Waste rock will be disposed of in five distinct waste rock storage areas (“WRSA”) of which four are located
around the pit and one further to the south. The open pit generates 675.9 Mt of waste rock, 1.6 Mt of backfill,
3.16 Mt of historical tailings and 8.7 Mt of overburden that require storage. The tailings material will be
transported for disposal within the Tailings Management Facility (“TMF”).
The design criteria of each waste dump has been adjusted based on foundation stability assessments. It
was recommended to use various waste dump design profiles which are shallower than the typical 2:1 in
certain specific areas as presented in Table 16.4 to assure adequate safety factors. All rock waste dumps
have 20 m high lifts to allow for wider catch benches to facilitate reclamation. Overburden dumps use 5 m
high lifts to better control the material. All waste dump capacities are shown in Table 16.3.
Table 16.3: Waste Storage Capacities
Waste Dump Capacity (Mt)
Capacity (Mm3)
Surface Area (ha)
% Filled
Waste Dump A 47.1 22.7 51.2 100%
Waste Dump B 48.6 23.4 51.6 100%
Waste Dump C 135.9 65.4 111.2 100%
Waste Dump D 374.5 180.3 183.2 96.6%
In Pit Dumping + AB Extension 41.8 20.1 23.4 100%
Overburden Pile 12.6 7.9 55.7 70.2%
Total 660.5 319.8 476.3 97.7%
Note: This table does not include waste rock material that is planned for construction purposes (crusher ramp, roads, aggregates, TMF etc.).
Table 16.4: Waste Pile Design Criteria
Waste Dump Avg. Catch
Bench Width
(m)
Pile Face Angle (deg)
Overall Slope Angle (H:V)
Maximum Elevation
(m)
Approximate Height
(m)
Waste Dump A 18.0 37 2:1 / 2.5:1/ 4:1 430 100
Waste Dump B 18.0 37 2:1 / 3:1 / 3.5:1 430 100
Waste Dump C 16.0 37 2:1 / 3:1 450 110
Waste Dump D 18.5 37 2:1 / 2.5:1/ 3:1 430 100
In Pit Dumping + AB Extension 14.0 37 2:1 390 300*
Overburden Pile 26.7 37 5:1 360 40 Note: (*) Height is from the bottom of the pit
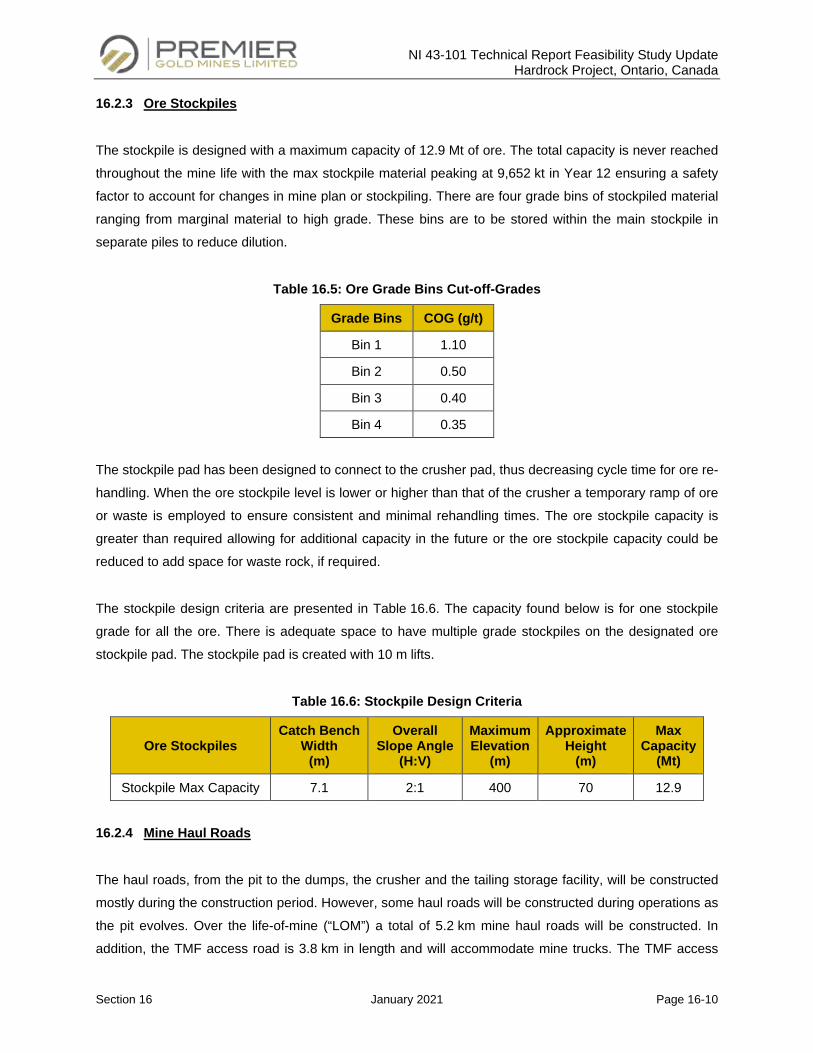
NI 43-101 Technical Report Feasibility Study Update Hardrock Project, Ontario, Canada
Section 16 January 2021 Page 16-10
16.2.3 Ore Stockpiles
The stockpile is designed with a maximum capacity of 12.9 Mt of ore. The total capacity is never reached
throughout the mine life with the max stockpile material peaking at 9,652 kt in Year 12 ensuring a safety
factor to account for changes in mine plan or stockpiling. There are four grade bins of stockpiled material
ranging from marginal material to high grade. These bins are to be stored within the main stockpile in
separate piles to reduce dilution.
Table 16.5: Ore Grade Bins Cut-off-Grades
Grade Bins COG (g/t)
Bin 1 1.10
Bin 2 0.50
Bin 3 0.40
Bin 4 0.35
The stockpile pad has been designed to connect to the crusher pad, thus decreasing cycle time for ore re-
handling. When the ore stockpile level is lower or higher than that of the crusher a temporary ramp of ore
or waste is employed to ensure consistent and minimal rehandling times. The ore stockpile capacity is
greater than required allowing for additional capacity in the future or the ore stockpile capacity could be
reduced to add space for waste rock, if required.
The stockpile design criteria are presented in Table 16.6. The capacity found below is for one stockpile
grade for all the ore. There is adequate space to have multiple grade stockpiles on the designated ore
stockpile pad. The stockpile pad is created with 10 m lifts.
Table 16.6: Stockpile Design Criteria
Ore Stockpiles Catch Bench
Width (m)
Overall Slope Angle
(H:V)
Maximum Elevation
(m)
Approximate Height
(m)
Max Capacity
(Mt)
Stockpile Max Capacity 7.1 2:1 400 70 12.9
16.2.4 Mine Haul Roads
The haul roads, from the pit to the dumps, the crusher and the tailing storage facility, will be constructed
mostly during the construction period. However, some haul roads will be constructed during operations as
the pit evolves. Over the life-of-mine (“LOM”) a total of 5.2 km mine haul roads will be constructed. In
addition, the TMF access road is 3.8 km in length and will accommodate mine trucks. The TMF access
NI 43-101 Technical Report Feasibility Study Update Hardrock Project, Ontario, Canada
Section 16 January 2021 Page 16-11
road will circumvent the ore stockpile to prevent the haulage trucks from climbing and descending the
crusher pad or passing through the processing plant.
16.3 Production Schedule
The mine production schedule is completed on a monthly basis during the pre-production period and first
three months of commercial production. From the second half of the first year of operations to the end of
Year 2, the schedule is developed on a quarterly basis and on an annual basis thereafter. The mine pre-
production is initiated in Year -2 and transitions to commercial operations in Year 1 after commissioning
and achieving a minimum of 60% of nameplate capacity for a period of 30 days. The mine pre-production
period lasts a total of 20 months which is planned to allow for a gradual assembly and commissioning of
mining equipment, training and timely delivery of waste rock for civil works.
The objectives of the LOM plan are to maximize discounted operating cash flow of the Project, subject to
various constraints:
• Limit mining during pre-production;
• Supply best grade ore to the plant and feed to a nominal capacity which ultimately reaches
27,000 t/d (9.86 Mt/y);
• Limit the mining rate to approximately 70 Mt/y;
• Limit the vertical drop-down rate to approximately 8 benches, per phase, per year;
• Limit peak truck requirements;
• Utilize a grade segregation and stockpiling strategy with a maximum stockpile of 9.6 Mt which is
roughly equivalent to one year of milling.
The mining schedule pre-production tonnage is 40.2 Mt over a period of 20 months. Mining will be
conducted on day shift only for a period of four months and on two shifts by the 5th month. The peak mining
rate of approximately 70 Mt is maintained for eight years (Year 2 to Year 9) and then gradually declines as
either sufficient ore for the mill is available or to limit peak truck requirements. The annual mine production,
stockpile inventory, mill production and gold production are presented in Figure 16.10 to Figure 16.13.
Figure 16.14 to Figure 16.17, present the end of period mine infrastructure status at different dates.
The operating strategy is to mill at a finer grind size of P80 of 72 µm in the early months while reaching a
rate of 24 kt/d and to increase the throughput to the targeted rate of 27 kt/d by relaxing the grind size to
P80 of 90µm. During the early ramp-up phase, the plant will operate at a finer grind (72 µm) to achieve a
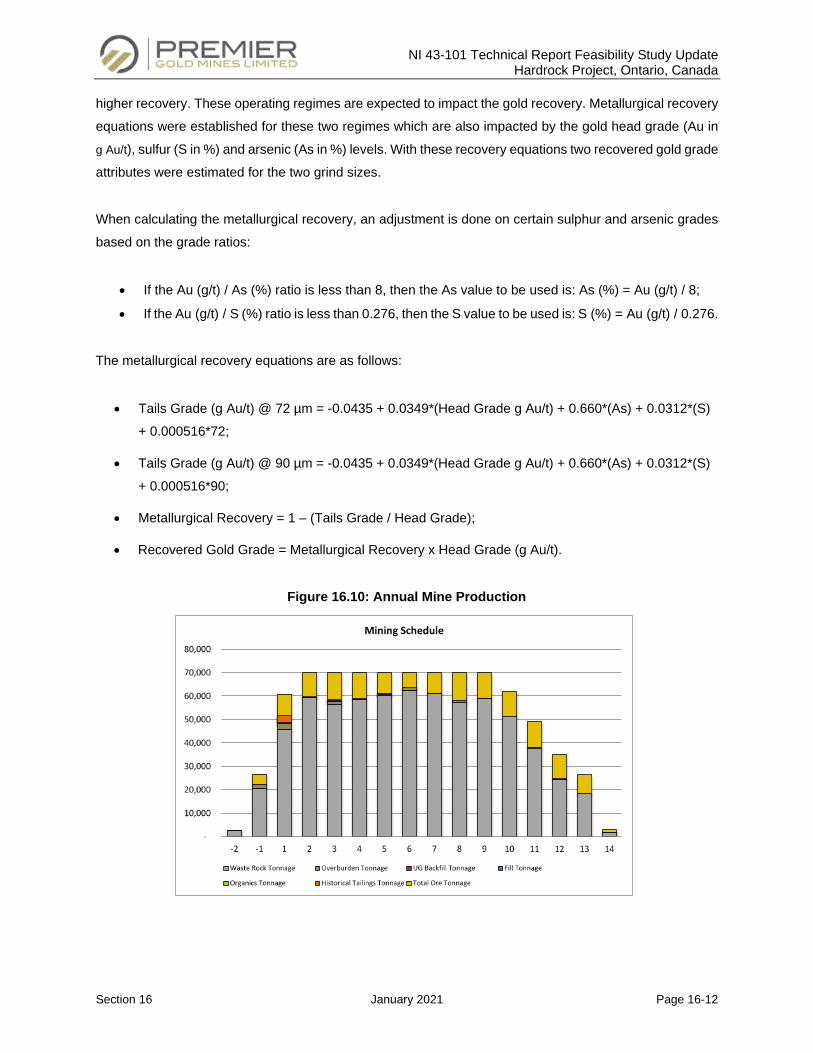
NI 43-101 Technical Report Feasibility Study Update Hardrock Project, Ontario, Canada
Section 16 January 2021 Page 16-12
higher recovery. These operating regimes are expected to impact the gold recovery. Metallurgical recovery
equations were established for these two regimes which are also impacted by the gold head grade (Au in
g Au/t), sulfur (S in %) and arsenic (As in %) levels. With these recovery equations two recovered gold grade
attributes were estimated for the two grind sizes.
When calculating the metallurgical recovery, an adjustment is done on certain sulphur and arsenic grades
based on the grade ratios:
• If the Au (g/t) / As (%) ratio is less than 8, then the As value to be used is: As (%) = Au (g/t) / 8;
• If the Au (g/t) / S (%) ratio is less than 0.276, then the S value to be used is: S (%) = Au (g/t) / 0.276.
The metallurgical recovery equations are as follows:
• Tails Grade (g Au/t) @ 72 µm = -0.0435 + 0.0349*(Head Grade g Au/t) + 0.660*(As) + 0.0312*(S)
+ 0.000516*72;
• Tails Grade (g Au/t) @ 90 µm = -0.0435 + 0.0349*(Head Grade g Au/t) + 0.660*(As) + 0.0312*(S)
+ 0.000516*90;
• Metallurgical Recovery = 1 – (Tails Grade / Head Grade);
• Recovered Gold Grade = Metallurgical Recovery x Head Grade (g Au/t).
Figure 16.10: Annual Mine Production
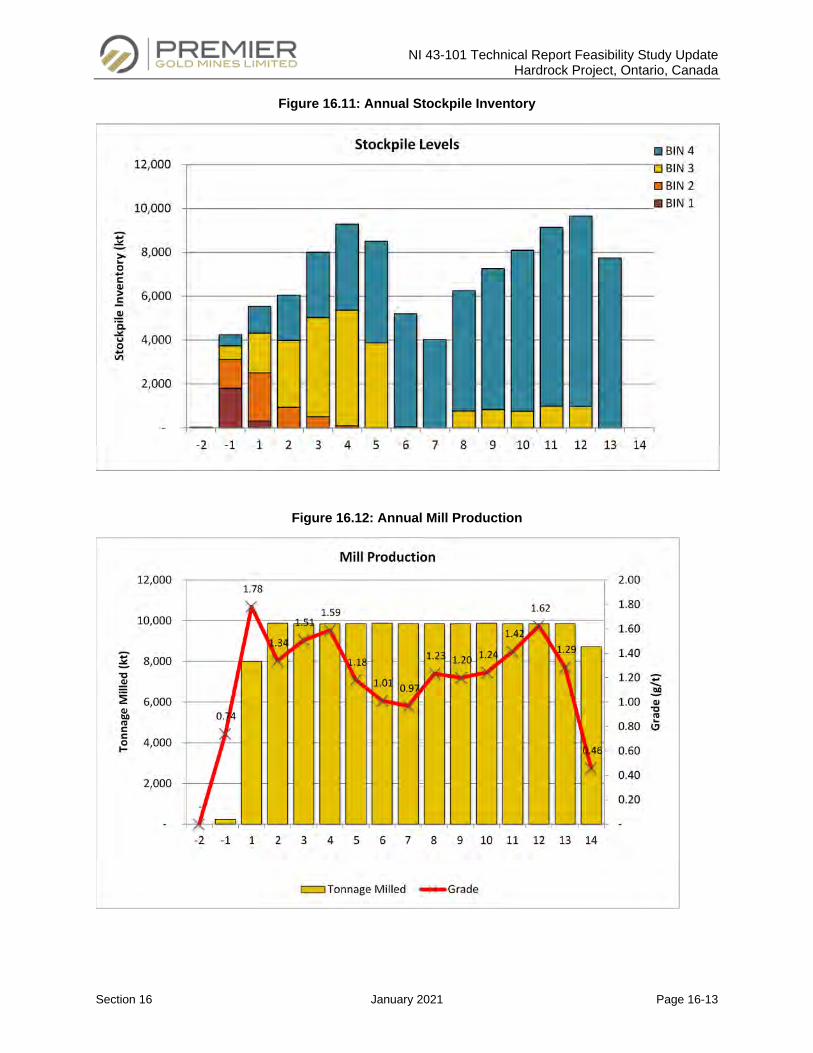
NI 43-101 Technical Report Feasibility Study Update Hardrock Project, Ontario, Canada
Section 16 January 2021 Page 16-13
Figure 16.11: Annual Stockpile Inventory
Figure 16.12: Annual Mill Production
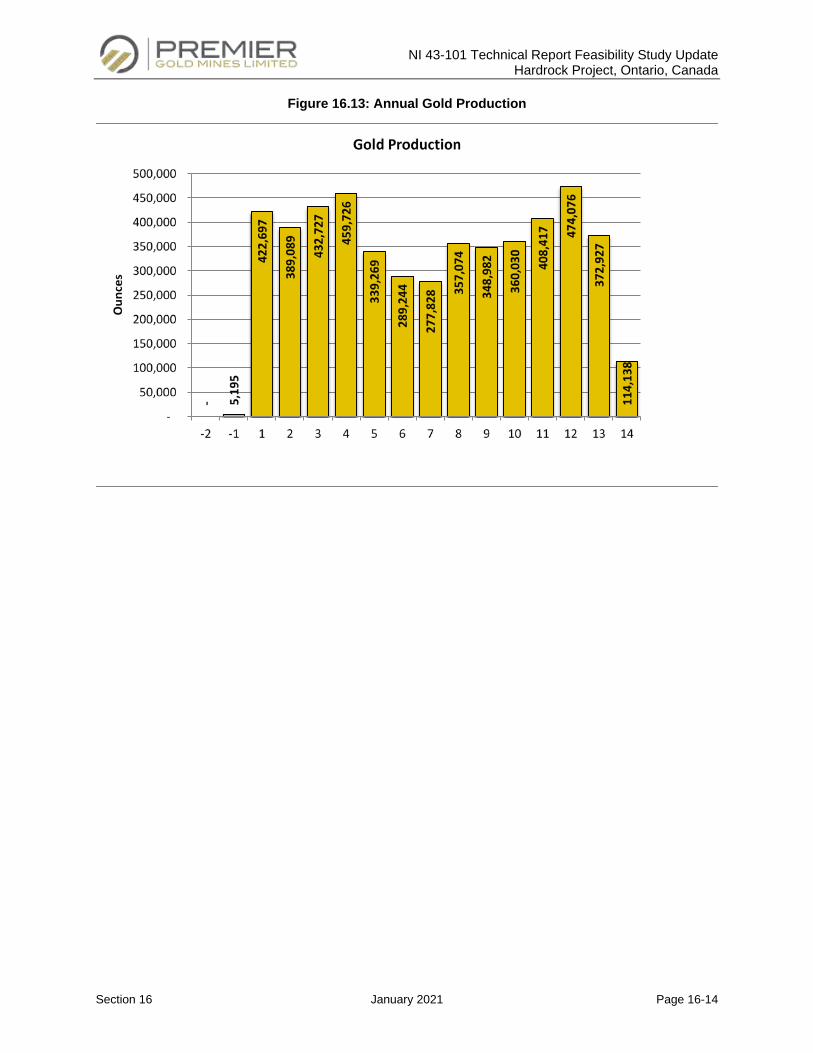
NI 43-101 Technical Report Feasibility Study Update Hardrock Project, Ontario, Canada
Section 16 January 2021 Page 16-14
Figure 16.13: Annual Gold Production
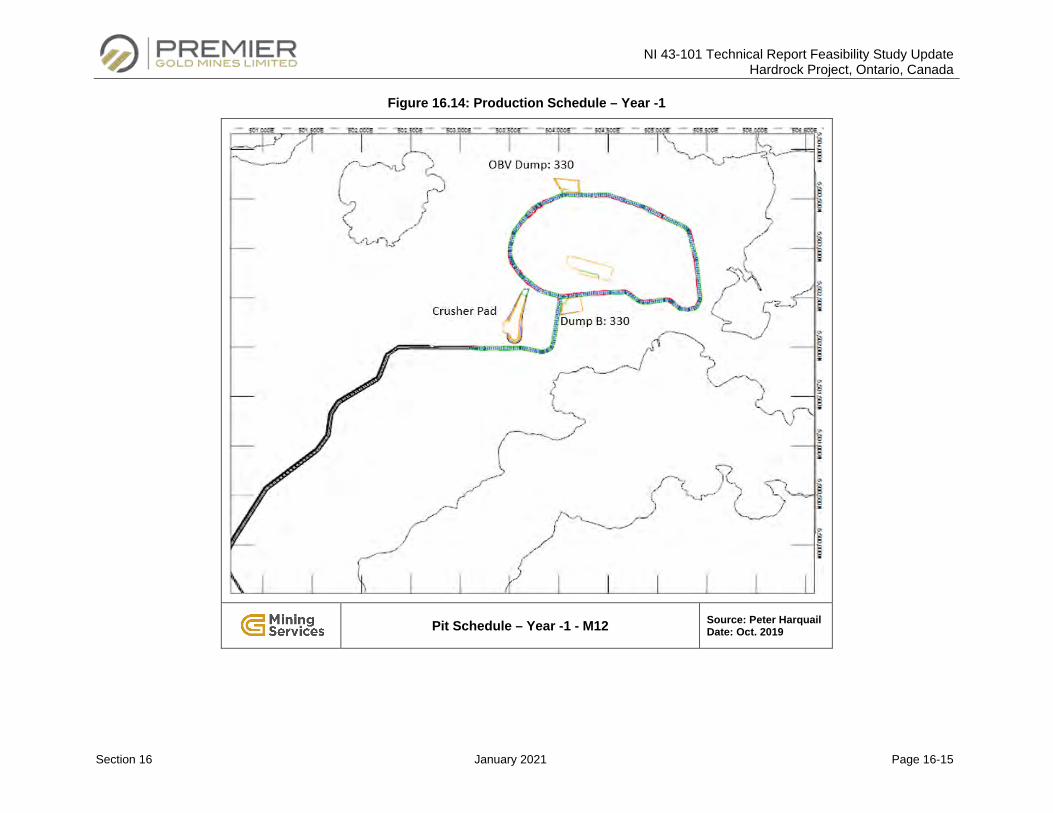
NI 43-101 Technical Report Feasibility Study Update Hardrock Project, Ontario, Canada
Section 16 January 2021 Page 16-15
Figure 16.14: Production Schedule – Year -1
Pit Schedule – Year -1 - M12 Source: Peter Harquail Date: Oct. 2019
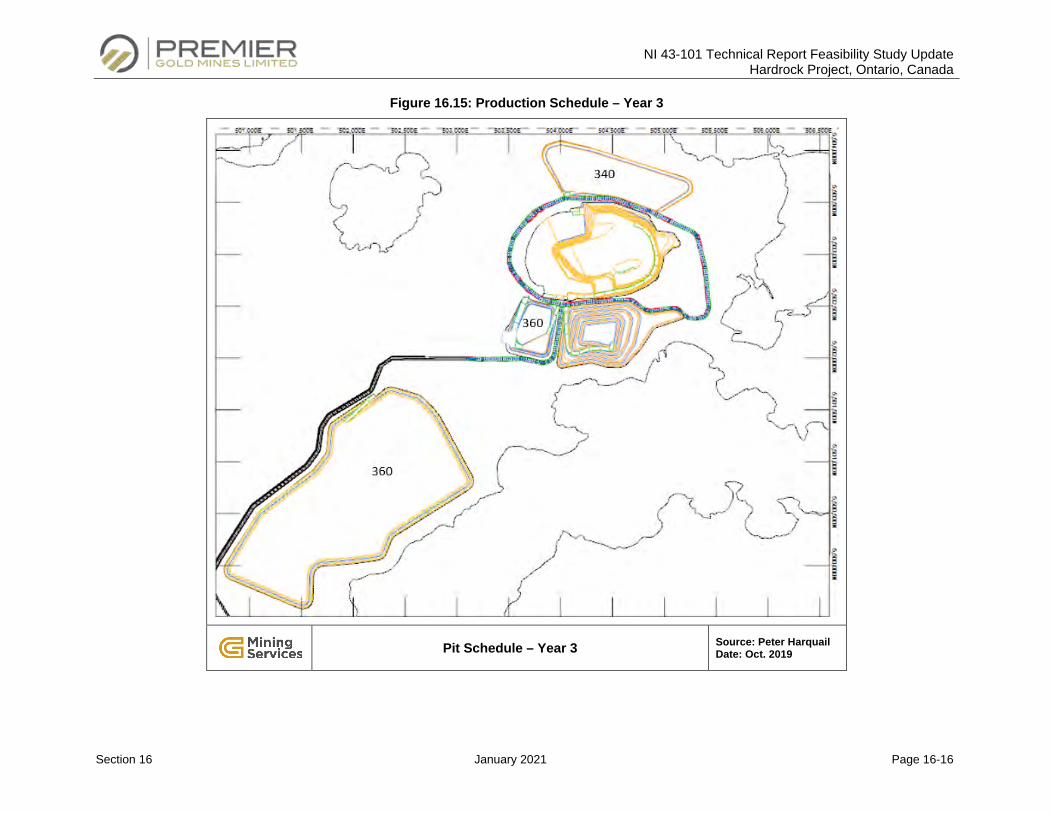
NI 43-101 Technical Report Feasibility Study Update Hardrock Project, Ontario, Canada
Section 16 January 2021 Page 16-16
Figure 16.15: Production Schedule – Year 3
Pit Schedule – Year 3 Source: Peter Harquail Date: Oct. 2019
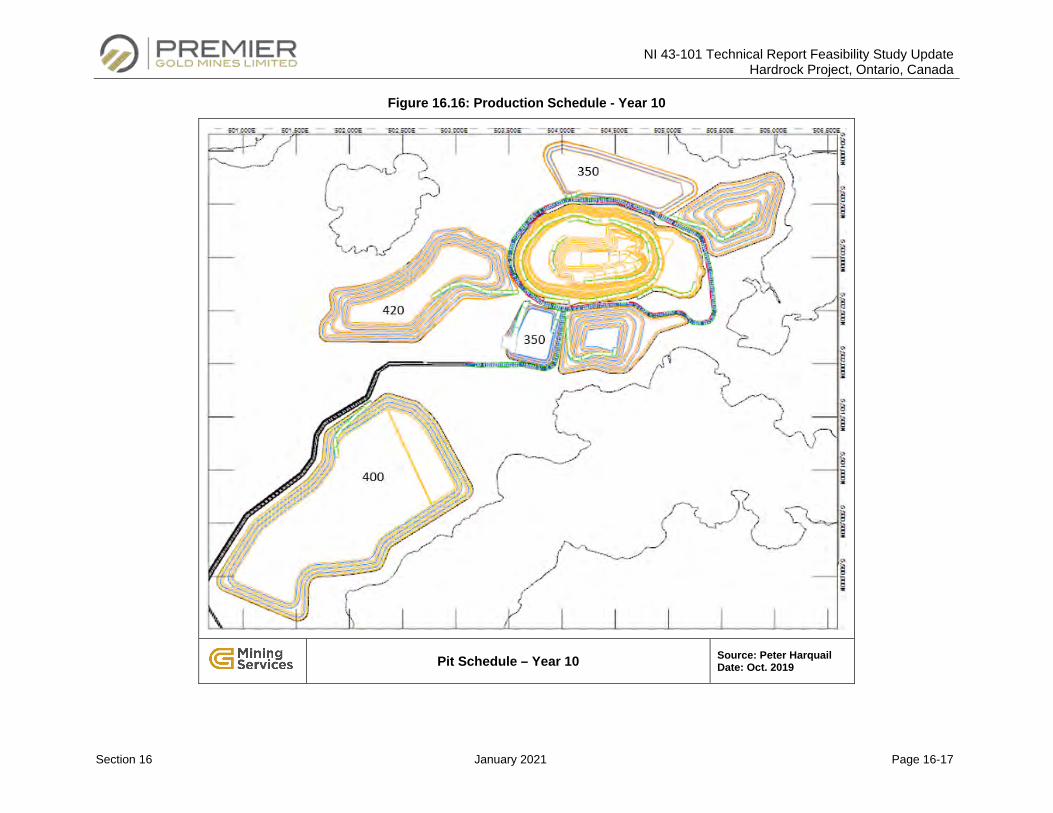
NI 43-101 Technical Report Feasibility Study Update Hardrock Project, Ontario, Canada
Section 16 January 2021 Page 16-17
Figure 16.16: Production Schedule - Year 10
Pit Schedule – Year 10 Source: Peter Harquail Date: Oct. 2019
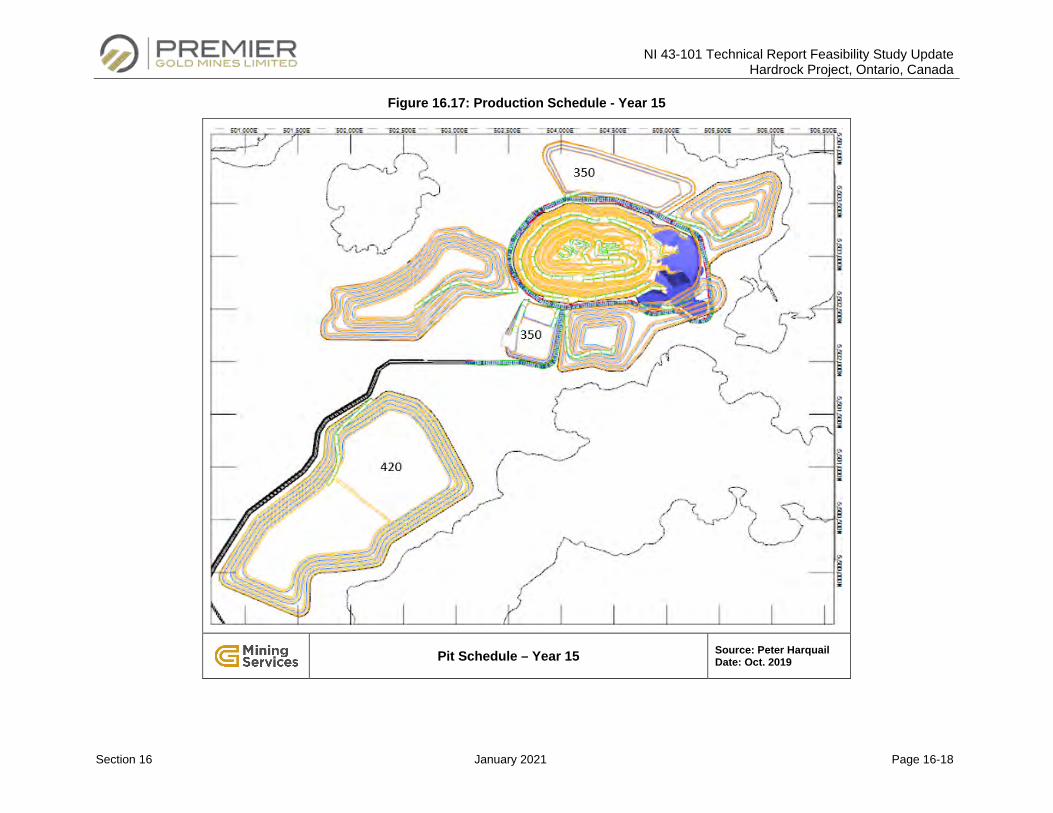
NI 43-101 Technical Report Feasibility Study Update Hardrock Project, Ontario, Canada
Section 16 January 2021 Page 16-18
Figure 16.17: Production Schedule - Year 15
Pit Schedule – Year 15 Source: Peter Harquail Date: Oct. 2019
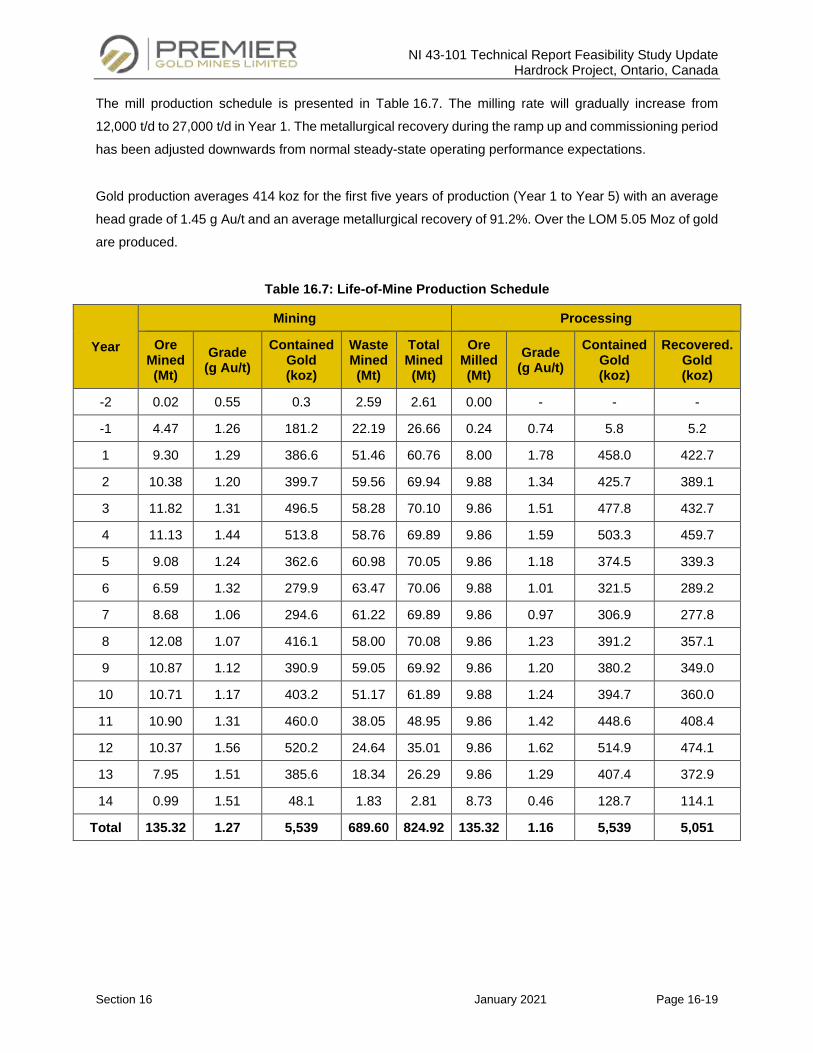
NI 43-101 Technical Report Feasibility Study Update Hardrock Project, Ontario, Canada
Section 16 January 2021 Page 16-19
The mill production schedule is presented in Table 16.7. The milling rate will gradually increase from
12,000 t/d to 27,000 t/d in Year 1. The metallurgical recovery during the ramp up and commissioning period
has been adjusted downwards from normal steady-state operating performance expectations.
Gold production averages 414 koz for the first five years of production (Year 1 to Year 5) with an average
head grade of 1.45 g Au/t and an average metallurgical recovery of 91.2%. Over the LOM 5.05 Moz of gold
are produced.
Table 16.7: Life-of-Mine Production Schedule
Year
Mining Processing
Ore Mined (Mt)
Grade (g Au/t)
Contained Gold (koz)
Waste Mined (Mt)
Total Mined (Mt)
Ore Milled (Mt)
Grade (g Au/t)
Contained Gold (koz)
Recovered. Gold (koz)
-2 0.02 0.55 0.3 2.59 2.61 0.00 - - -
-1 4.47 1.26 181.2 22.19 26.66 0.24 0.74 5.8 5.2
1 9.30 1.29 386.6 51.46 60.76 8.00 1.78 458.0 422.7
2 10.38 1.20 399.7 59.56 69.94 9.88 1.34 425.7 389.1
3 11.82 1.31 496.5 58.28 70.10 9.86 1.51 477.8 432.7
4 11.13 1.44 513.8 58.76 69.89 9.86 1.59 503.3 459.7
5 9.08 1.24 362.6 60.98 70.05 9.86 1.18 374.5 339.3
6 6.59 1.32 279.9 63.47 70.06 9.88 1.01 321.5 289.2
7 8.68 1.06 294.6 61.22 69.89 9.86 0.97 306.9 277.8
8 12.08 1.07 416.1 58.00 70.08 9.86 1.23 391.2 357.1
9 10.87 1.12 390.9 59.05 69.92 9.86 1.20 380.2 349.0
10 10.71 1.17 403.2 51.17 61.89 9.88 1.24 394.7 360.0
11 10.90 1.31 460.0 38.05 48.95 9.86 1.42 448.6 408.4
12 10.37 1.56 520.2 24.64 35.01 9.86 1.62 514.9 474.1
13 7.95 1.51 385.6 18.34 26.29 9.86 1.29 407.4 372.9
14 0.99 1.51 48.1 1.83 2.81 8.73 0.46 128.7 114.1
Total 135.32 1.27 5,539 689.60 824.92 135.32 1.16 5,539 5,051
NI 43-101 Technical Report Feasibility Study Update Hardrock Project, Ontario, Canada
Section 16 January 2021 Page 16-20
16.4 Mine Operations and Equipment Selection
16.4.1 Mine Operations Approach
Mining is to be carried out using conventional open pit techniques with hydraulic shovels, wheel loaders
and mining trucks in a bulk mining approach with 10 m benches. An owner mining open pit operation is
planned with the outsourcing of certain support activities such as explosives manufacturing and blasting
activities.
16.4.2 Production Drilling and Blasting
Drill and blast specifications are established to effectively single pass drill and blast a 10 m bench. For this
bench height, a 203 mm blast hole size is proposed with a 6.0 m x 6.5 m pattern with 1 m of sub-drill. These
drill parameters combined with a high energy bulk emulsion with a density of 1.2 kg/m3 result in a powder
factor of 0.30 kg/t. Blast holes are initiated with NONEL detonators and primed with 450 g boosters. The
bulk emulsion product is a gas sensitized pumped emulsion blend specifically designed for use in wet
blasting applications.
Several rock formations are present in the pit including greywacke, gabbro, porphyry and BIF. The average
rock properties based on testing show a range in hardness between 80 and 175 MPa with a weighted
average hardness estimated at about 100 MPa.
A drilling test was conducted on site on various outcrops in the pit. A total of ten 165 mm test holes for a
total 100 m was completed in three of the main rock formations (Porphyry, Greywacke and Iron Formation).
The penetration rates did not vary significantly between the formations with an instantaneous penetration
rate of 40.2 m/h.
The drilling test results were used to calibrate expected instantaneous penetration rates for the larger
203 mm diameter production blast holes. The average drill productivity for the production rigs is estimated
at 39.1 m/h instantaneous with an overall penetration rate of 24.2 m/h. The overall drilling factor represents
time lost in the cycle when the rig is not drilling such as move time between holes, moves between patterns,
drill bit changes, etc. The average drilling productivity is estimated at 2,364 t/h.
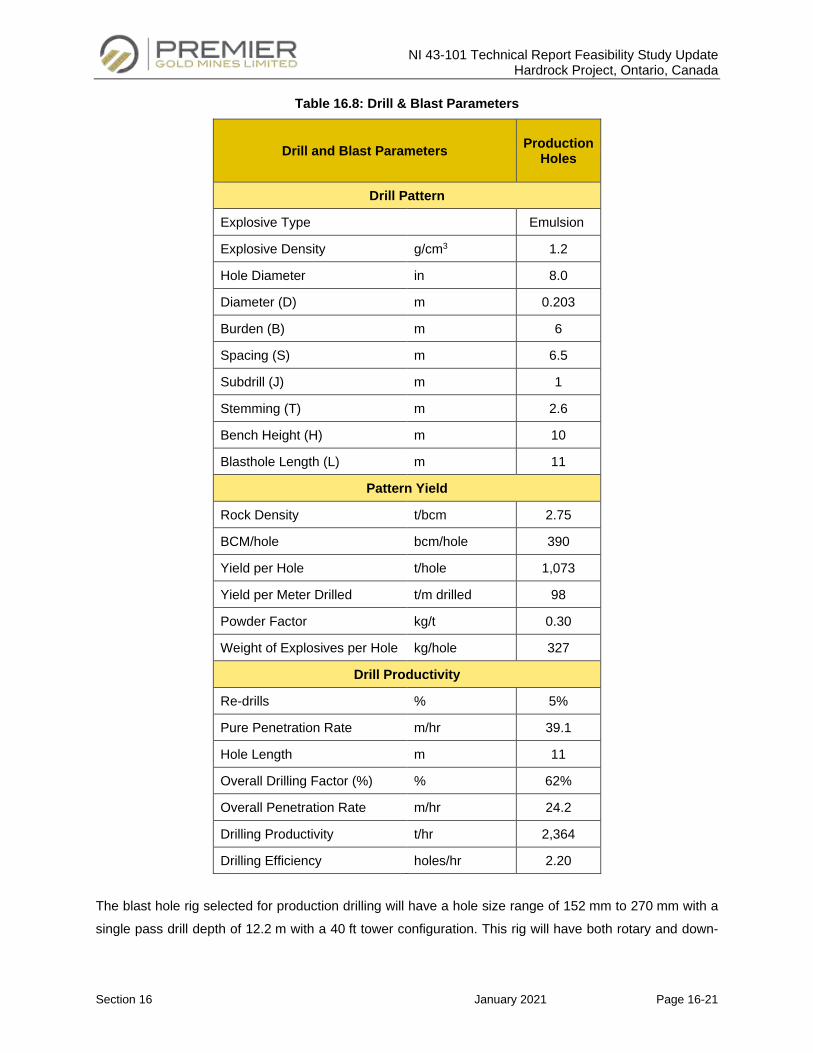
NI 43-101 Technical Report Feasibility Study Update Hardrock Project, Ontario, Canada
Section 16 January 2021 Page 16-21
Table 16.8: Drill & Blast Parameters
Drill and Blast Parameters Production Holes
Drill Pattern
Explosive Type Emulsion
Explosive Density g/cm3 1.2
Hole Diameter in 8.0
Diameter (D) m 0.203
Burden (B) m 6
Spacing (S) m 6.5
Subdrill (J) m 1
Stemming (T) m 2.6
Bench Height (H) m 10
Blasthole Length (L) m 11
Pattern Yield
Rock Density t/bcm 2.75
BCM/hole bcm/hole 390
Yield per Hole t/hole 1,073
Yield per Meter Drilled t/m drilled 98
Powder Factor kg/t 0.30
Weight of Explosives per Hole kg/hole 327
Drill Productivity
Re-drills % 5%
Pure Penetration Rate m/hr 39.1
Hole Length m 11
Overall Drilling Factor (%) % 62%
Overall Penetration Rate m/hr 24.2
Drilling Productivity t/hr 2,364
Drilling Efficiency holes/hr 2.20
The blast hole rig selected for production drilling will have a hole size range of 152 mm to 270 mm with a
single pass drill depth of 12.2 m with a 40 ft tower configuration. This rig will have both rotary and down-
NI 43-101 Technical Report Feasibility Study Update Hardrock Project, Ontario, Canada
Section 16 January 2021 Page 16-22
the-hole (“DTH”) drilling capability. It is expected that DTH drilling mode will be most efficient. With the
selection of the automation package for all units, a ratio of 1 operator per 2 units was assumed.
With the automation package, the drill rigs can be controlled remotely through a remote operator station
(up to 3 drills per one remote station). From the remote station, the operator can initiate a complete
automated drilling cycle, from the initial drilling to the retracting of the drill bit. During that time the operator
can monitor the drilling process or switch to the other drills to either monitor, initiate a drilling cycle or
remotely tram the drill to the next hole location.
The automation of the drilling process not only increases safety, but it also increases productivity as some
time-consuming activities usually performed by the operator are not required anymore.
Blasting activities will be outsourced to an explosives provider who will be responsible for supplying and
delivering explosives in the hole through a shot service contract. The mine engineering department will be
responsible for designing blast patterns and relaying hole information to the drills via the wireless network.
16.4.3 Grade Control
The ore control program will consist of establishing dig limits for the four grade bins and waste in the field
to guide loading unit operators. A high precision system combined with an arm geometry system will allow
shovels to target small dig blocks and perform selective mining. The system will give operators a real-time
view of dig blocks, ore boundaries and other positioning information.
In order to have optimal ore-waste boundaries identification, reverse circulation (“RC”) drilling will target
100% of all ore material and also capture an average of 31% of the total waste in the pit. The first 6 benches
will target more waste rock in order to refine the geological model.
The ore control boundaries will be established by the technical services department based on grade control
information obtained through RC drilling and blast hole sampling with post-blast boundaries adjusted for
blast movement measurements made using a BMM® system. A blast movement monitoring system has
been included in the blasting cost.
The samples collected will be sent to a nearby off-site laboratory for sample preparation and assaying for
the LOM RC samples will be collected on the bench and properly tagged by grade control samplers on
each shift.
NI 43-101 Technical Report Feasibility Study Update Hardrock Project, Ontario, Canada
Section 16 January 2021 Page 16-23
Concurrent to the RC sampling, the production blast hole will target 100% of all ore material and also
capture around 25% of the total waste in the pit (mainly the contact zones with ore).
16.4.4 Pre-Split
Pre-split drill and blast is planned to maximize stable bench faces and to maximize inter-ramp angles along
pit walls as prescribed by the geotechnical pit slope study by Golder. The pre-split consists of a row of
closely-spaced holes along the design excavation limit of interim and final walls. The holes are loaded with
a light charge and detonated simultaneously or in groups separated by short delays. Firing the pre-split row
creates a crack that forms the excavation limit and helps to prevent wall rock damage by venting explosive
gases and reflecting shock waves. As a best-practice, it is recommended that operations restrict production
blasts to within 50 m of an unblasted pre-shear line. Once the pre-split is shot, production blasts will be
taken to within 10 m of the pre-shear and then a trim shot used to clean the face. Pre-split holes spaced
1.5 m apart will be 20 m in length and drilled with a smaller diameter of 127 mm (5 in.).
As presented in Table 16.9, blasting of the pre-split holes will use a special packaged pre-split explosive
internally traced with 5 g/m detonating cord that ensures fast and complete detonation of the decoupled
charge. For this specific application, a 41 mm diameter cartridge, 17 m long will be used which corresponds
to a complete case of 25 kg. This load factor of 1.47 kg/m allows for a targeted charge weight of 0.83 kg/m2
of face.
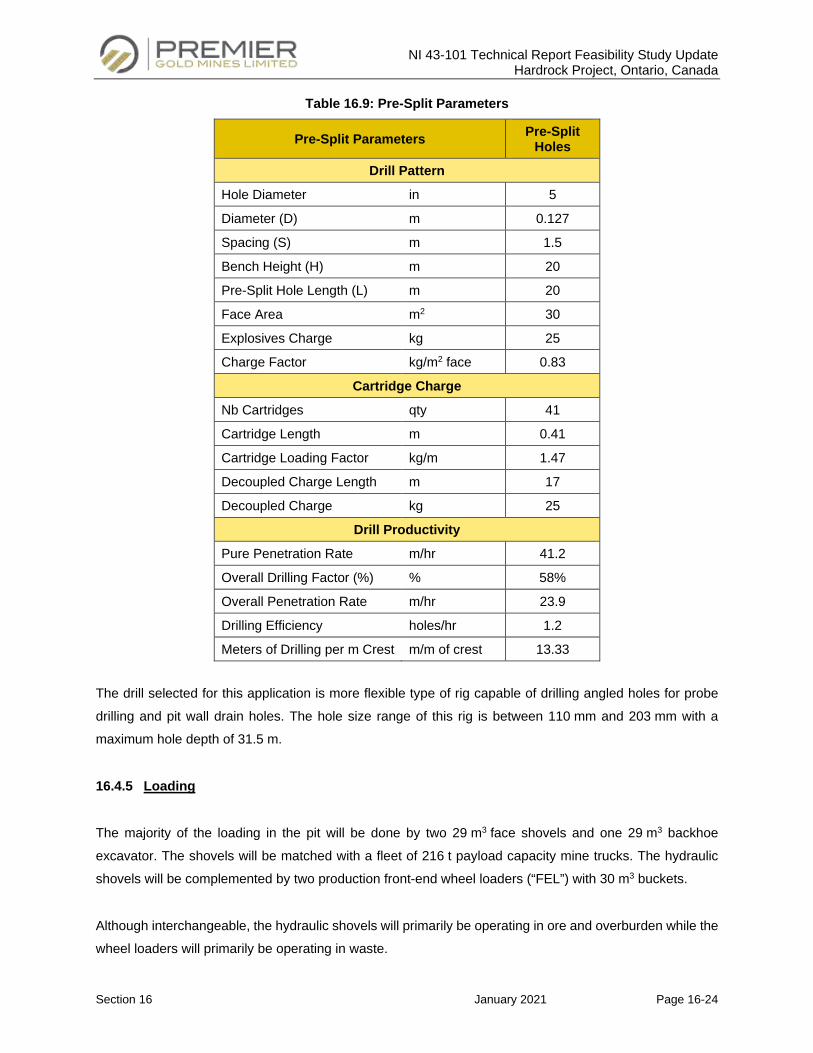
NI 43-101 Technical Report Feasibility Study Update Hardrock Project, Ontario, Canada
Section 16 January 2021 Page 16-24
Table 16.9: Pre-Split Parameters
Pre-Split Parameters Pre-Split Holes
Drill Pattern
Hole Diameter in 5
Diameter (D) m 0.127
Spacing (S) m 1.5
Bench Height (H) m 20
Pre-Split Hole Length (L) m 20
Face Area m2 30
Explosives Charge kg 25
Charge Factor kg/m2 face 0.83
Cartridge Charge
Nb Cartridges qty 41
Cartridge Length m 0.41
Cartridge Loading Factor kg/m 1.47
Decoupled Charge Length m 17
Decoupled Charge kg 25
Drill Productivity
Pure Penetration Rate m/hr 41.2
Overall Drilling Factor (%) % 58%
Overall Penetration Rate m/hr 23.9
Drilling Efficiency holes/hr 1.2
Meters of Drilling per m Crest m/m of crest 13.33
The drill selected for this application is more flexible type of rig capable of drilling angled holes for probe
drilling and pit wall drain holes. The hole size range of this rig is between 110 mm and 203 mm with a
maximum hole depth of 31.5 m.
16.4.5 Loading
The majority of the loading in the pit will be done by two 29 m3 face shovels and one 29 m3 backhoe
excavator. The shovels will be matched with a fleet of 216 t payload capacity mine trucks. The hydraulic
shovels will be complemented by two production front-end wheel loaders (“FEL”) with 30 m3 buckets.
Although interchangeable, the hydraulic shovels will primarily be operating in ore and overburden while the
wheel loaders will primarily be operating in waste.
NI 43-101 Technical Report Feasibility Study Update Hardrock Project, Ontario, Canada
Section 16 January 2021 Page 16-25
The loading productivity assumptions for both types of loading tools in ore, waste and overburden are
presented in Table 16.10.
The two 29 m3 face shovel are expected to achieve a productivity of 3,494 t/h based on a 4-pass match
with the mine trucks and an average load time of 2.70 minutes. The productivity in overburden will decrease
at 1,964 t/hr due to lower density of material and extra pass required for an average load time of
4.10 minutes. The 29 m3 excavator, used for better selectivity, will have a 3,369 t/hr production rate in ore
and waste rock at a cycle time of 2.80 minutes, whereas in overburden the excavator will reach a
productivity of 1,964 t/hr with a loading cycle time of 4.10 minutes.
The wheel loaders are expected to achieve a productivity of 2,950 t/h based on a 4 pass match and an
average load time of 3.2 minutes in ore and waste. The productivity in overburden is estimated at 1,677 t/hr.
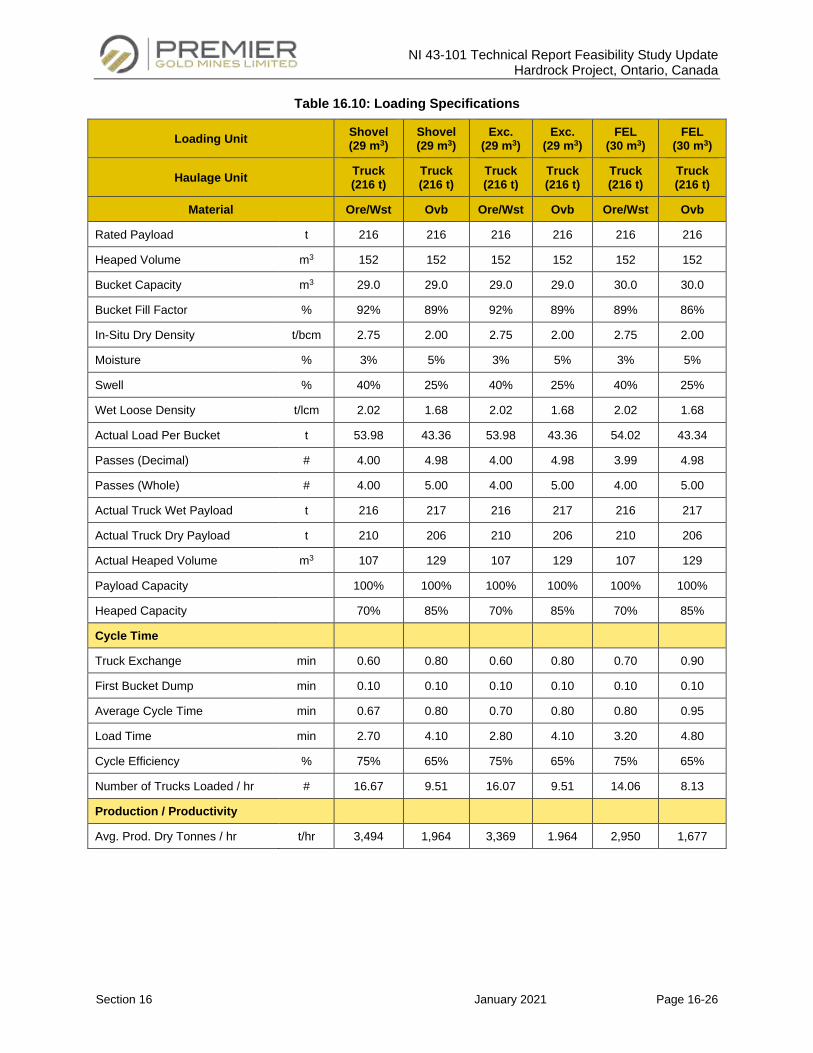
NI 43-101 Technical Report Feasibility Study Update Hardrock Project, Ontario, Canada
Section 16 January 2021 Page 16-26
Table 16.10: Loading Specifications
Loading Unit Shovel (29 m3)
Shovel (29 m3)
Exc. (29 m3)
Exc. (29 m3)
FEL (30 m3)
FEL (30 m3)
Haulage Unit Truck (216 t)
Truck (216 t)
Truck (216 t)
Truck (216 t)
Truck (216 t)
Truck (216 t)
Material Ore/Wst Ovb Ore/Wst Ovb Ore/Wst Ovb
Rated Payload t 216 216 216 216 216 216
Heaped Volume m3 152 152 152 152 152 152
Bucket Capacity m3 29.0 29.0 29.0 29.0 30.0 30.0
Bucket Fill Factor % 92% 89% 92% 89% 89% 86%
In-Situ Dry Density t/bcm 2.75 2.00 2.75 2.00 2.75 2.00
Moisture % 3% 5% 3% 5% 3% 5%
Swell % 40% 25% 40% 25% 40% 25%
Wet Loose Density t/lcm 2.02 1.68 2.02 1.68 2.02 1.68
Actual Load Per Bucket t 53.98 43.36 53.98 43.36 54.02 43.34
Passes (Decimal) # 4.00 4.98 4.00 4.98 3.99 4.98
Passes (Whole) # 4.00 5.00 4.00 5.00 4.00 5.00
Actual Truck Wet Payload t 216 217 216 217 216 217
Actual Truck Dry Payload t 210 206 210 206 210 206
Actual Heaped Volume m3 107 129 107 129 107 129
Payload Capacity 100% 100% 100% 100% 100% 100%
Heaped Capacity 70% 85% 70% 85% 70% 85%
Cycle Time
Truck Exchange min 0.60 0.80 0.60 0.80 0.70 0.90
First Bucket Dump min 0.10 0.10 0.10 0.10 0.10 0.10
Average Cycle Time min 0.67 0.80 0.70 0.80 0.80 0.95
Load Time min 2.70 4.10 2.80 4.10 3.20 4.80
Cycle Efficiency % 75% 65% 75% 65% 75% 65%
Number of Trucks Loaded / hr # 16.67 9.51 16.07 9.51 14.06 8.13
Production / Productivity
Avg. Prod. Dry Tonnes / hr t/hr 3,494 1,964 3,369 1.964 2,950 1,677
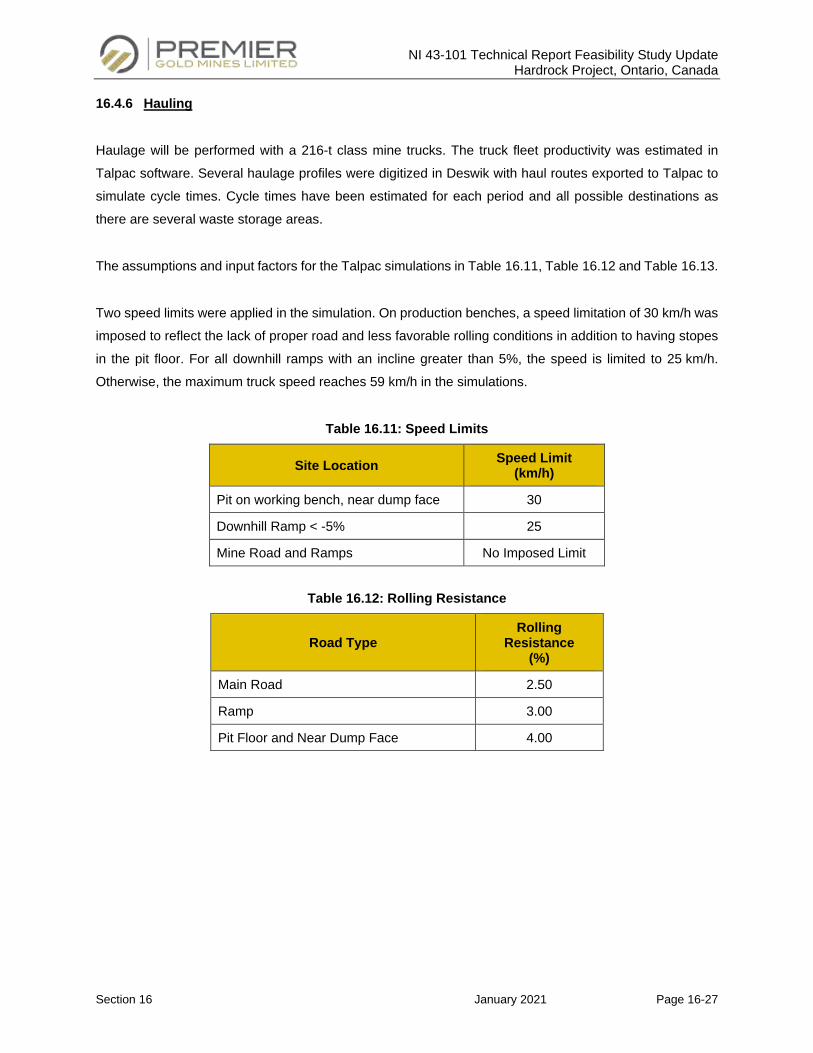
NI 43-101 Technical Report Feasibility Study Update Hardrock Project, Ontario, Canada
Section 16 January 2021 Page 16-27
16.4.6 Hauling
Haulage will be performed with a 216-t class mine trucks. The truck fleet productivity was estimated in
Talpac software. Several haulage profiles were digitized in Deswik with haul routes exported to Talpac to
simulate cycle times. Cycle times have been estimated for each period and all possible destinations as
there are several waste storage areas.
The assumptions and input factors for the Talpac simulations in Table 16.11, Table 16.12 and Table 16.13.
Two speed limits were applied in the simulation. On production benches, a speed limitation of 30 km/h was
imposed to reflect the lack of proper road and less favorable rolling conditions in addition to having stopes
in the pit floor. For all downhill ramps with an incline greater than 5%, the speed is limited to 25 km/h.
Otherwise, the maximum truck speed reaches 59 km/h in the simulations.
Table 16.11: Speed Limits
Site Location Speed Limit (km/h)
Pit on working bench, near dump face 30
Downhill Ramp < -5% 25
Mine Road and Ramps No Imposed Limit
Table 16.12: Rolling Resistance
Road Type Rolling
Resistance (%)
Main Road 2.50
Ramp 3.00
Pit Floor and Near Dump Face 4.00
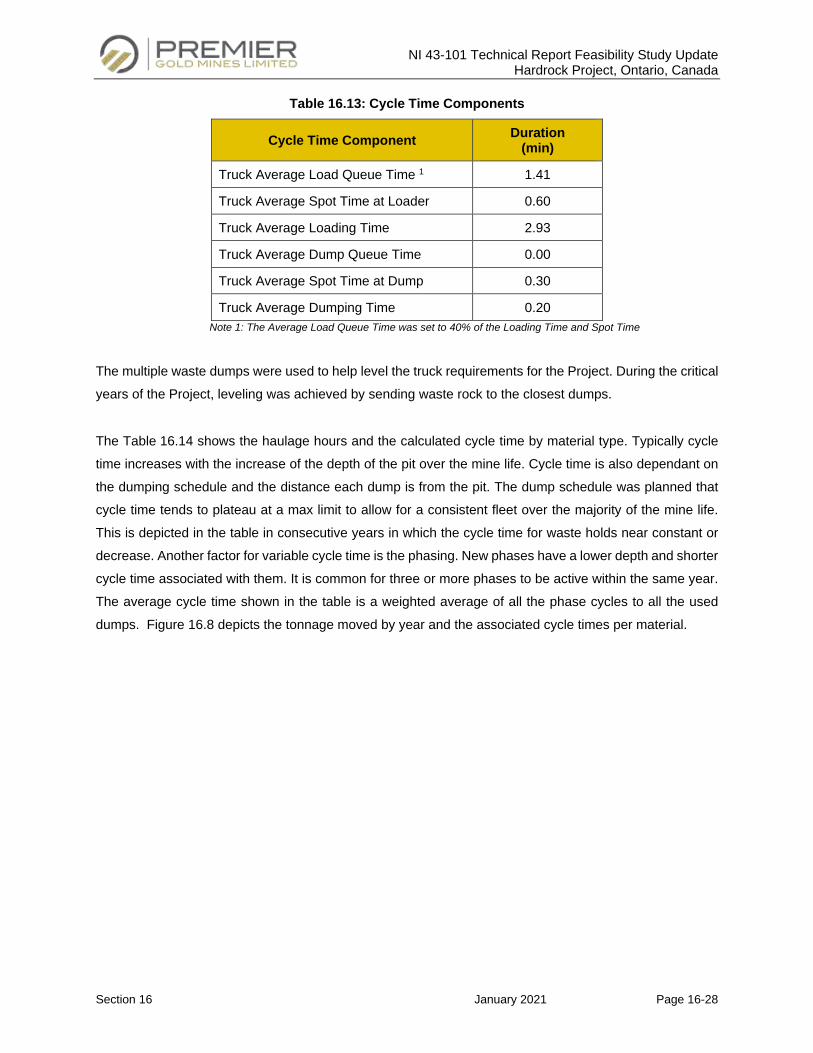
NI 43-101 Technical Report Feasibility Study Update Hardrock Project, Ontario, Canada
Section 16 January 2021 Page 16-28
Table 16.13: Cycle Time Components
Cycle Time Component Duration (min)
Truck Average Load Queue Time 1 1.41
Truck Average Spot Time at Loader 0.60
Truck Average Loading Time 2.93
Truck Average Dump Queue Time 0.00
Truck Average Spot Time at Dump 0.30
Truck Average Dumping Time 0.20 Note 1: The Average Load Queue Time was set to 40% of the Loading Time and Spot Time
The multiple waste dumps were used to help level the truck requirements for the Project. During the critical
years of the Project, leveling was achieved by sending waste rock to the closest dumps.
The Table 16.14 shows the haulage hours and the calculated cycle time by material type. Typically cycle
time increases with the increase of the depth of the pit over the mine life. Cycle time is also dependant on
the dumping schedule and the distance each dump is from the pit. The dump schedule was planned that
cycle time tends to plateau at a max limit to allow for a consistent fleet over the majority of the mine life.
This is depicted in the table in consecutive years in which the cycle time for waste holds near constant or
decrease. Another factor for variable cycle time is the phasing. New phases have a lower depth and shorter
cycle time associated with them. It is common for three or more phases to be active within the same year.
The average cycle time shown in the table is a weighted average of all the phase cycles to all the used
dumps. Figure 16.8 depicts the tonnage moved by year and the associated cycle times per material.
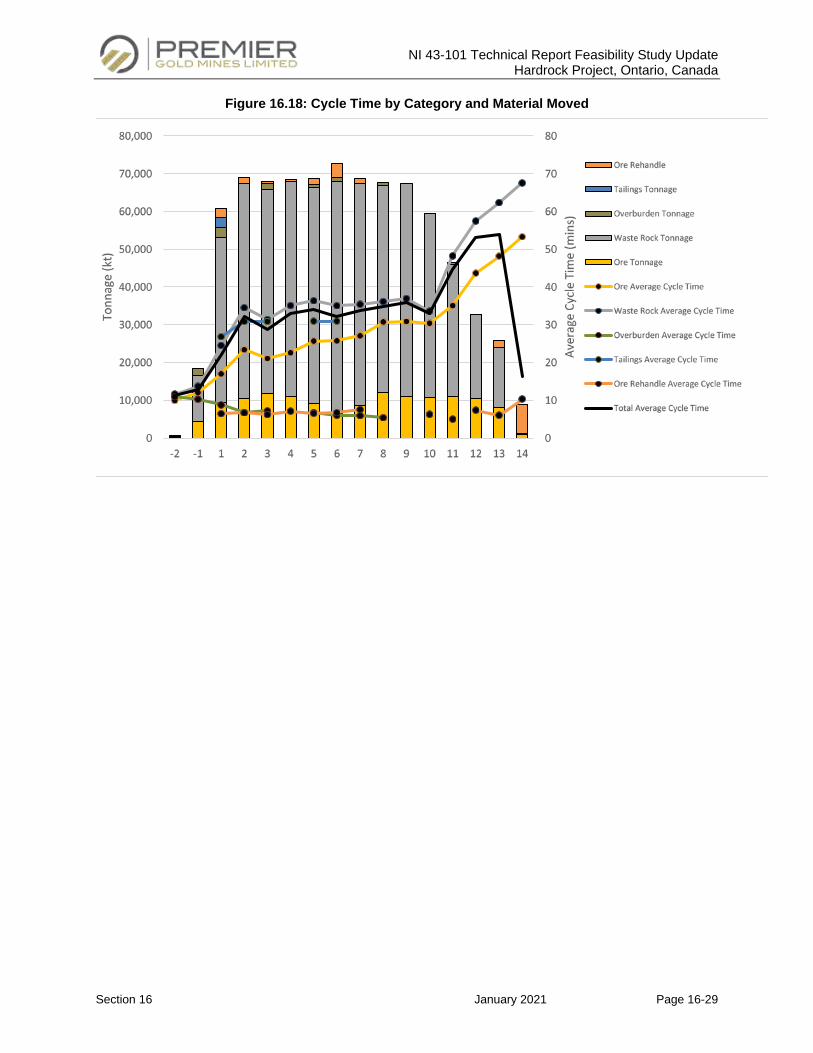
NI 43-101 Technical Report Feasibility Study Update Hardrock Project, Ontario, Canada
Section 16 January 2021 Page 16-29
Figure 16.18: Cycle Time by Category and Material Moved
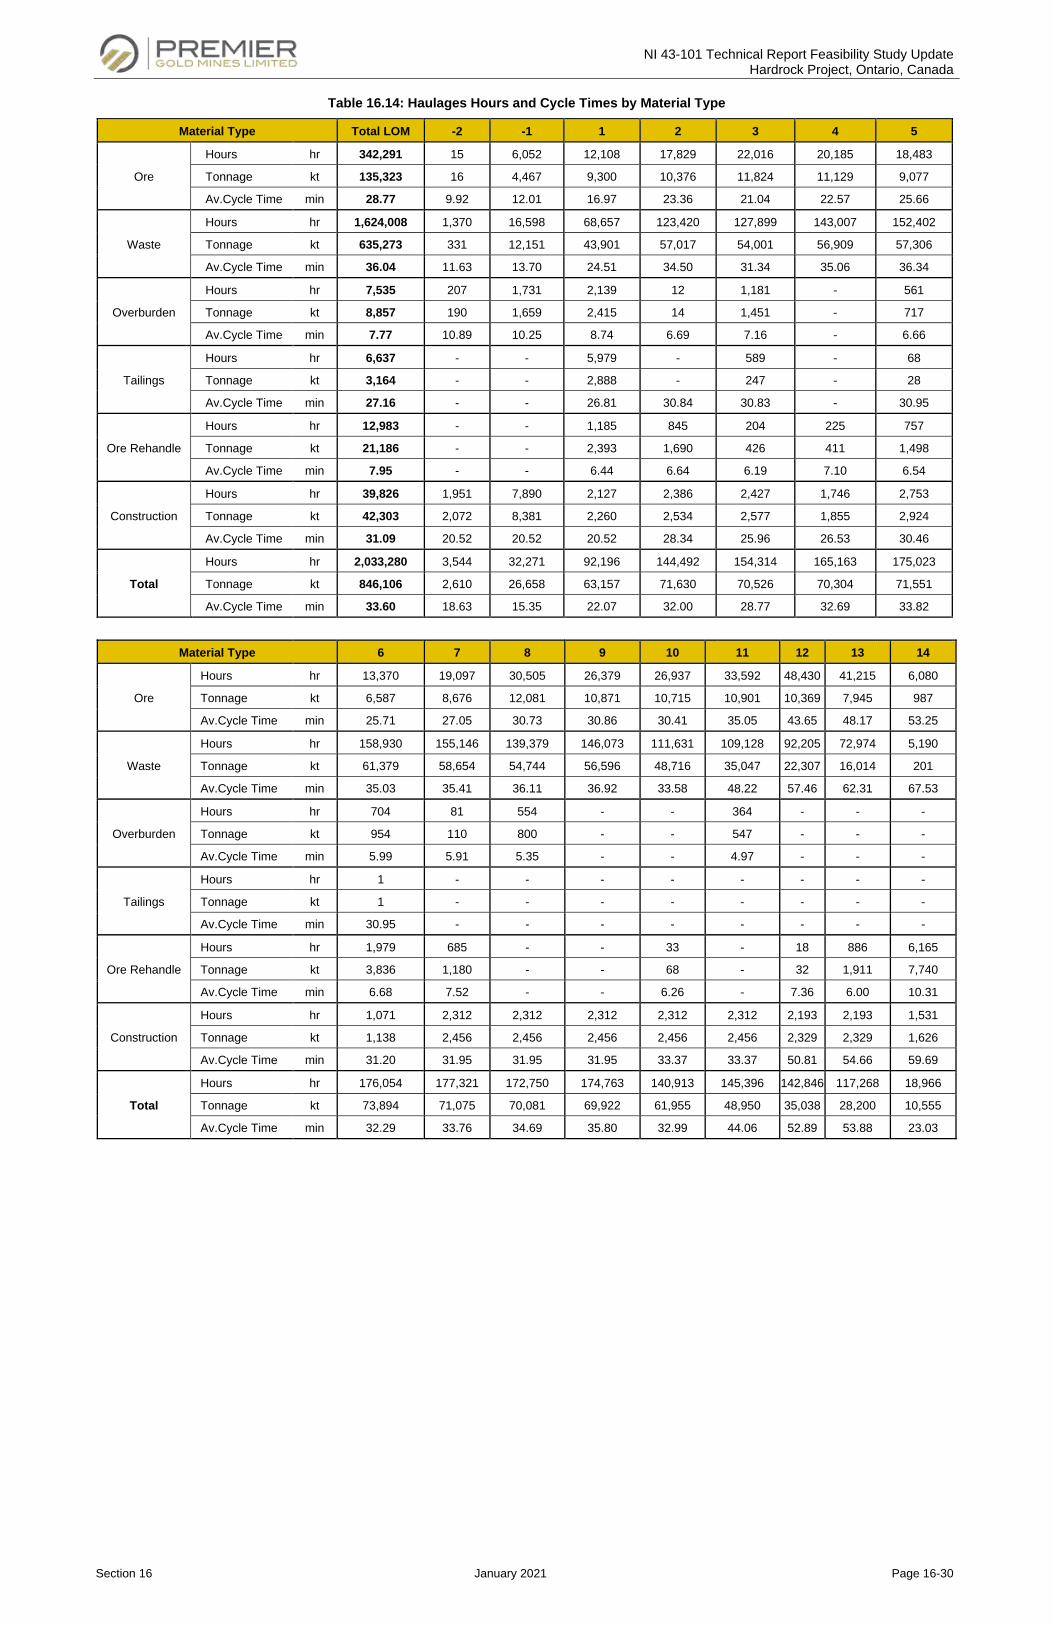
NI 43-101 Technical Report Feasibility Study Update Hardrock Project, Ontario, Canada
Section 16 January 2021 Page 16-30
Table 16.14: Haulages Hours and Cycle Times by Material Type
Material Type Total LOM -2 -1 1 2 3 4 5
Ore
Hours hr 342,291 15 6,052 12,108 17,829 22,016 20,185 18,483
Tonnage kt 135,323 16 4,467 9,300 10,376 11,824 11,129 9,077
Av.Cycle Time min 28.77 9.92 12.01 16.97 23.36 21.04 22.57 25.66
Waste
Hours hr 1,624,008 1,370 16,598 68,657 123,420 127,899 143,007 152,402
Tonnage kt 635,273 331 12,151 43,901 57,017 54,001 56,909 57,306
Av.Cycle Time min 36.04 11.63 13.70 24.51 34.50 31.34 35.06 36.34
Overburden
Hours hr 7,535 207 1,731 2,139 12 1,181 - 561
Tonnage kt 8,857 190 1,659 2,415 14 1,451 - 717
Av.Cycle Time min 7.77 10.89 10.25 8.74 6.69 7.16 - 6.66
Tailings
Hours hr 6,637 - - 5,979 - 589 - 68
Tonnage kt 3,164 - - 2,888 - 247 - 28
Av.Cycle Time min 27.16 - - 26.81 30.84 30.83 - 30.95
Ore Rehandle
Hours hr 12,983 - - 1,185 845 204 225 757
Tonnage kt 21,186 - - 2,393 1,690 426 411 1,498
Av.Cycle Time min 7.95 - - 6.44 6.64 6.19 7.10 6.54
Construction
Hours hr 39,826 1,951 7,890 2,127 2,386 2,427 1,746 2,753
Tonnage kt 42,303 2,072 8,381 2,260 2,534 2,577 1,855 2,924
Av.Cycle Time min 31.09 20.52 20.52 20.52 28.34 25.96 26.53 30.46
Total
Hours hr 2,033,280 3,544 32,271 92,196 144,492 154,314 165,163 175,023
Tonnage kt 846,106 2,610 26,658 63,157 71,630 70,526 70,304 71,551
Av.Cycle Time min 33.60 18.63 15.35 22.07 32.00 28.77 32.69 33.82
Material Type 6 7 8 9 10 11 12 13 14
Ore
Hours hr 13,370 19,097 30,505 26,379 26,937 33,592 48,430 41,215 6,080
Tonnage kt 6,587 8,676 12,081 10,871 10,715 10,901 10,369 7,945 987
Av.Cycle Time min 25.71 27.05 30.73 30.86 30.41 35.05 43.65 48.17 53.25
Waste
Hours hr 158,930 155,146 139,379 146,073 111,631 109,128 92,205 72,974 5,190
Tonnage kt 61,379 58,654 54,744 56,596 48,716 35,047 22,307 16,014 201
Av.Cycle Time min 35.03 35.41 36.11 36.92 33.58 48.22 57.46 62.31 67.53
Overburden
Hours hr 704 81 554 - - 364 - - -
Tonnage kt 954 110 800 - - 547 - - -
Av.Cycle Time min 5.99 5.91 5.35 - - 4.97 - - -
Tailings
Hours hr 1 - - - - - - - -
Tonnage kt 1 - - - - - - - -
Av.Cycle Time min 30.95 - - - - - - - -
Ore Rehandle
Hours hr 1,979 685 - - 33 - 18 886 6,165
Tonnage kt 3,836 1,180 - - 68 - 32 1,911 7,740
Av.Cycle Time min 6.68 7.52 - - 6.26 - 7.36 6.00 10.31
Construction
Hours hr 1,071 2,312 2,312 2,312 2,312 2,312 2,193 2,193 1,531
Tonnage kt 1,138 2,456 2,456 2,456 2,456 2,456 2,329 2,329 1,626
Av.Cycle Time min 31.20 31.95 31.95 31.95 33.37 33.37 50.81 54.66 59.69
Total
Hours hr 176,054 177,321 172,750 174,763 140,913 145,396 142,846 117,268 18,966
Tonnage kt 73,894 71,075 70,081 69,922 61,955 48,950 35,038 28,200 10,555
Av.Cycle Time min 32.29 33.76 34.69 35.80 32.99 44.06 52.89 53.88 23.03
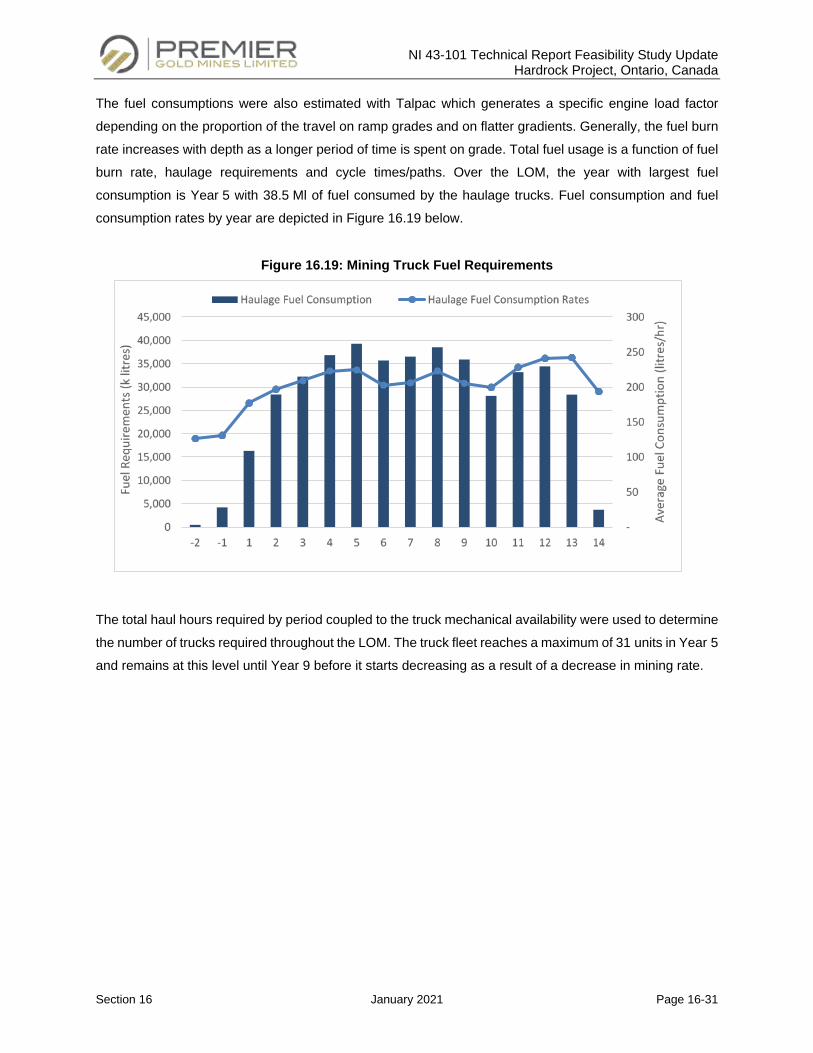
NI 43-101 Technical Report Feasibility Study Update Hardrock Project, Ontario, Canada
Section 16 January 2021 Page 16-31
The fuel consumptions were also estimated with Talpac which generates a specific engine load factor
depending on the proportion of the travel on ramp grades and on flatter gradients. Generally, the fuel burn
rate increases with depth as a longer period of time is spent on grade. Total fuel usage is a function of fuel
burn rate, haulage requirements and cycle times/paths. Over the LOM, the year with largest fuel
consumption is Year 5 with 38.5 Ml of fuel consumed by the haulage trucks. Fuel consumption and fuel
consumption rates by year are depicted in Figure 16.19 below.
Figure 16.19: Mining Truck Fuel Requirements
The total haul hours required by period coupled to the truck mechanical availability were used to determine
the number of trucks required throughout the LOM. The truck fleet reaches a maximum of 31 units in Year 5
and remains at this level until Year 9 before it starts decreasing as a result of a decrease in mining rate.
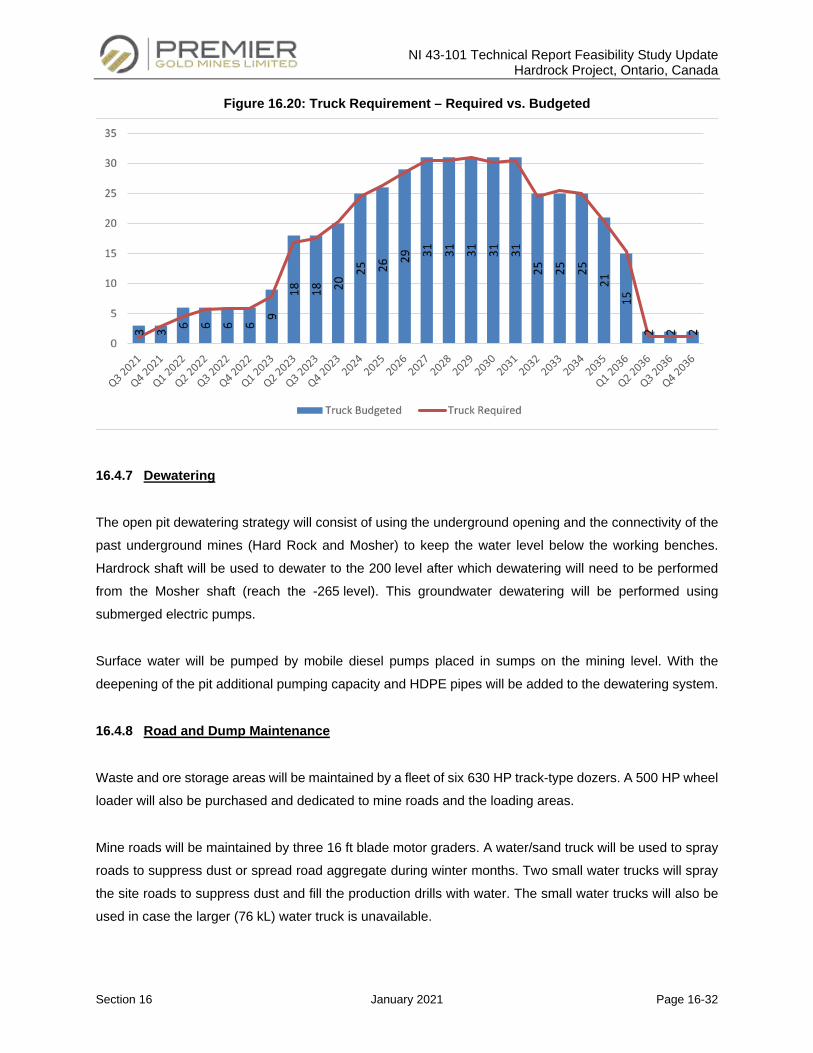
NI 43-101 Technical Report Feasibility Study Update Hardrock Project, Ontario, Canada
Section 16 January 2021 Page 16-32
Figure 16.20: Truck Requirement – Required vs. Budgeted
16.4.7 Dewatering
The open pit dewatering strategy will consist of using the underground opening and the connectivity of the
past underground mines (Hard Rock and Mosher) to keep the water level below the working benches.
Hardrock shaft will be used to dewater to the 200 level after which dewatering will need to be performed
from the Mosher shaft (reach the -265 level). This groundwater dewatering will be performed using
submerged electric pumps.
Surface water will be pumped by mobile diesel pumps placed in sumps on the mining level. With the
deepening of the pit additional pumping capacity and HDPE pipes will be added to the dewatering system.
16.4.8 Road and Dump Maintenance
Waste and ore storage areas will be maintained by a fleet of six 630 HP track-type dozers. A 500 HP wheel
loader will also be purchased and dedicated to mine roads and the loading areas.
Mine roads will be maintained by three 16 ft blade motor graders. A water/sand truck will be used to spray
roads to suppress dust or spread road aggregate during winter months. Two small water trucks will spray
the site roads to suppress dust and fill the production drills with water. The small water trucks will also be
used in case the larger (76 kL) water truck is unavailable.
NI 43-101 Technical Report Feasibility Study Update Hardrock Project, Ontario, Canada
Section 16 January 2021 Page 16-33
16.4.9 Support Equipment
All construction related work, such as berm construction, water ditch cleaning will be done by two
49 t excavators (one of them will be equipped with a hydraulic hammer) and one 90 t excavator for pit wall
scaling.
Four pit buses will transport workers to their assigned workplace and a total of 37 pick-ups will be purchased
for all departments (including Mill and G&A).
Several other equipment purchases are planned to support the mining activities. Part of this list of
equipment are one 60 t crane, 1 boom trucks (28 t crane), one knuckle boom truck (10t), one 250 HP utility
wheel loader for smaller work and a 100t low-boy trailer and tractor for moving the tracked equipment.
16.4.10 Mine Maintenance
The Hardrock Project does not intend to enter into a maintenance and repair contract (“MARC”) for its
mobile equipment fleet. Consequently, the maintenance department has been structured to fully manage
this function, performing maintenance planning and training of employees. However, reliance on dealer and
manufacturer support is planned for the initial 5 years of the project. Support for major components will
however be maintained throughout LOM, such as through component exchange programs.
Tire monitoring, rotation and/or replacement will be outsourced to a contractor permanently installed on
site, providing skilled labor and equipment to perform the job safely and efficiently.
A computerized maintenance management system will be used to manage maintenance and repair
operations. This system will keep up-to-date status, service history and maintenance needs of each
machine while being the source of data for KPIs and cost tracking purposes.
16.4.11 Mine Management and Technical Services
The mine is headed by a Mine Operations Manager who is responsible for the overall management of the
mine. Superintendent positions in operations, maintenance, geology (Chief) and engineering (Chief) report
directly to the Mine Operations Manager.
The operations department is composed of two foremen per crew (eight in total); one foreman for loading
and hauling and another foreman for drilling and blasting. A mine dispatcher is planned on each shift. To
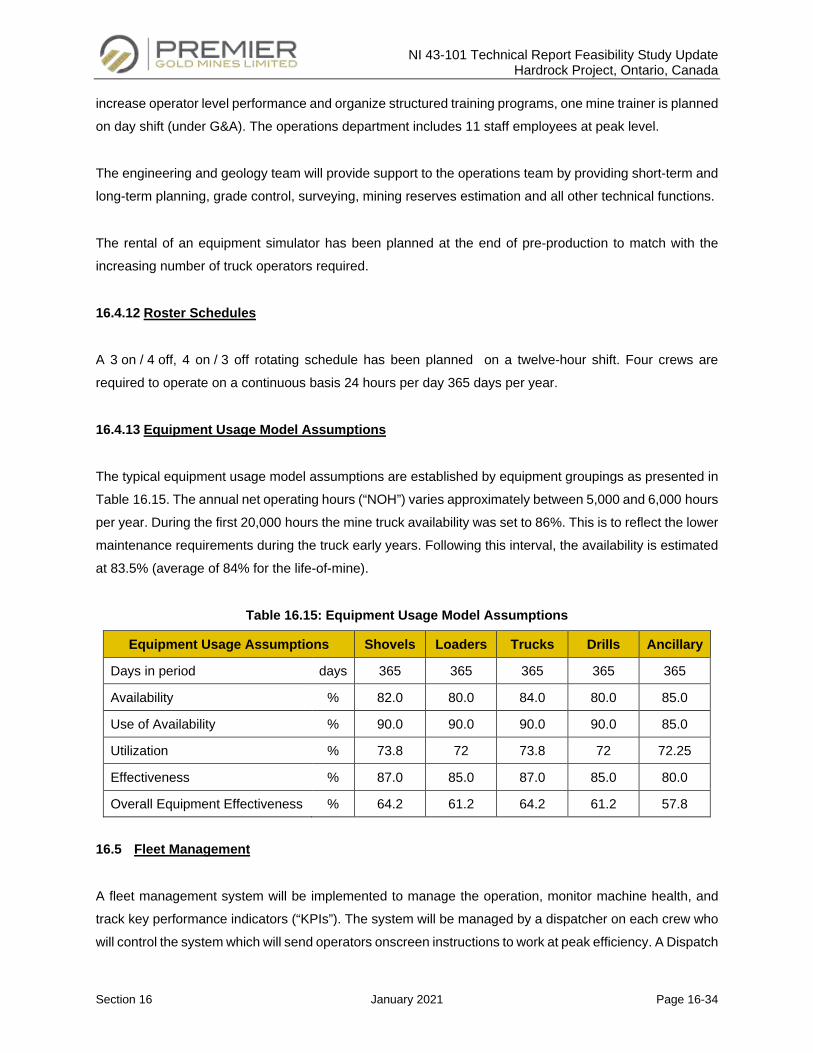
NI 43-101 Technical Report Feasibility Study Update Hardrock Project, Ontario, Canada
Section 16 January 2021 Page 16-34
increase operator level performance and organize structured training programs, one mine trainer is planned
on day shift (under G&A). The operations department includes 11 staff employees at peak level.
The engineering and geology team will provide support to the operations team by providing short-term and
long-term planning, grade control, surveying, mining reserves estimation and all other technical functions.
The rental of an equipment simulator has been planned at the end of pre-production to match with the
increasing number of truck operators required.
16.4.12 Roster Schedules
A 3 on / 4 off, 4 on / 3 off rotating schedule has been planned on a twelve-hour shift. Four crews are
required to operate on a continuous basis 24 hours per day 365 days per year.
16.4.13 Equipment Usage Model Assumptions
The typical equipment usage model assumptions are established by equipment groupings as presented in
Table 16.15. The annual net operating hours (“NOH”) varies approximately between 5,000 and 6,000 hours
per year. During the first 20,000 hours the mine truck availability was set to 86%. This is to reflect the lower
maintenance requirements during the truck early years. Following this interval, the availability is estimated
at 83.5% (average of 84% for the life-of-mine).
Table 16.15: Equipment Usage Model Assumptions
Equipment Usage Assumptions Shovels Loaders Trucks Drills Ancillary
Days in period days 365 365 365 365 365
Availability % 82.0 80.0 84.0 80.0 85.0
Use of Availability % 90.0 90.0 90.0 90.0 85.0
Utilization % 73.8 72 73.8 72 72.25
Effectiveness % 87.0 85.0 87.0 85.0 80.0
Overall Equipment Effectiveness % 64.2 61.2 64.2 61.2 57.8
16.5 Fleet Management
A fleet management system will be implemented to manage the operation, monitor machine health, and
track key performance indicators (“KPIs”). The system will be managed by a dispatcher on each crew who
will control the system which will send operators onscreen instructions to work at peak efficiency. A Dispatch
NI 43-101 Technical Report Feasibility Study Update Hardrock Project, Ontario, Canada
Section 16 January 2021 Page 16-35
system coordinator will be required to assure proper functioning of system hardware and software with
ongoing annual vendor support.
A high-precision global positioning system (“GPS”) for machine guidance is considered to mitigate the
associated risk of working around historic underground workings. This will enable shovel operators to
navigate safely in potentially hazardous areas. In addition to protecting people and equipment, the high
precision system will improve the productivity and bench grade control. The results and usefulness of such
a system have proven to be worthwhile at other mines where past underground mines have been
developed. Similarly, high precision drill navigation systems will be installed on the production drills and
auxiliary drills to guide rigs into position and assure holes are drilled to the correct depth and location.
16.6 Pit Slope Monitoring and Voids Management
16.6.1 Pit Slope Monitoring
Rock mass failure is not considered as a risk due to the high overall rock mass strength. However, slope
movement monitoring is planned for the open pit to gather measurements and confirm assumptions in order
to assure safe working conditions. Initial slope movement monitoring would consist of using prisms read by
manual or automated surveys with at least two permanent total stations established in climate controlled
enclosures to ensure full coverage of the open pit. The initial prism monitoring will provide movement
response data to verify visual observations and if the slope is performing adequately.
Pit wall mapping using routine digital mapping techniques using photogrammetry is recommended. Physical
geological mapping is also recommended to supplement and qualify data derived from photogrammetry.
The slope movement monitoring data will be important for the calibration of numerical models required for
detailed design updates during the mine life. The pit phasing approach will allow for adjustments to the final
design based on observations and knowledge gained with the interim pit phases.
16.6.2 Voids Management
A number of open pit mines in Canada and Western Australia are mining orebodies that have previously
been mined by underground methods. There are hazards with high risk potential when approaching and
then progressively mining through underground workings.
The hazards related to underground workings include:
NI 43-101 Technical Report Feasibility Study Update Hardrock Project, Ontario, Canada
Section 16 January 2021 Page 16-36
• Sudden and unexpected collapse of the open pit floor and/or walls;
• The loss of people and/or equipment into unfilled or partially filled underground workings;
• Loss of explosives from charged blast holes that have filled cavities connected to the blast hole;
• Overcharging blast holes where explosives have filled cavities connected to the blast hole;
• Risk of flyrock from cavities close to the pit floor and adjacent blast holes.
Previous historical underground workings are well documented and available in 3D electronic format. The
workings are not a concern for the overall stability of the final walls. In the pit designs, the ramps were kept
away from the known historical underground openings. Larger berms were designed to create access points
around the bigger underground openings at different heights. As part of detailed design, each stope that
will underlie the pit will require a detailed assessment to determine the best operating practices for safe
mining. The assessment should be initiated at least a year before the pit deepens to a critical proximity.
A boom truck with various attachments have been planned in the OPEX and CAPEX to facilitate some of
the work around the underground openings. A cost for placement of crushed material has also been
budgeted.
16.7 Mine Equipment Requirements
The main factors which influenced the selection of the major mine equipment included the annual
production requirements and optimization of the fleet size.
An extensive analysis was performed to determine the optimal fleet size, equipment type and preferred
suppliers. The requirements of major mining units are presented in Figure 16.21, Table 16.16 presents the
equipment purchase schedule.
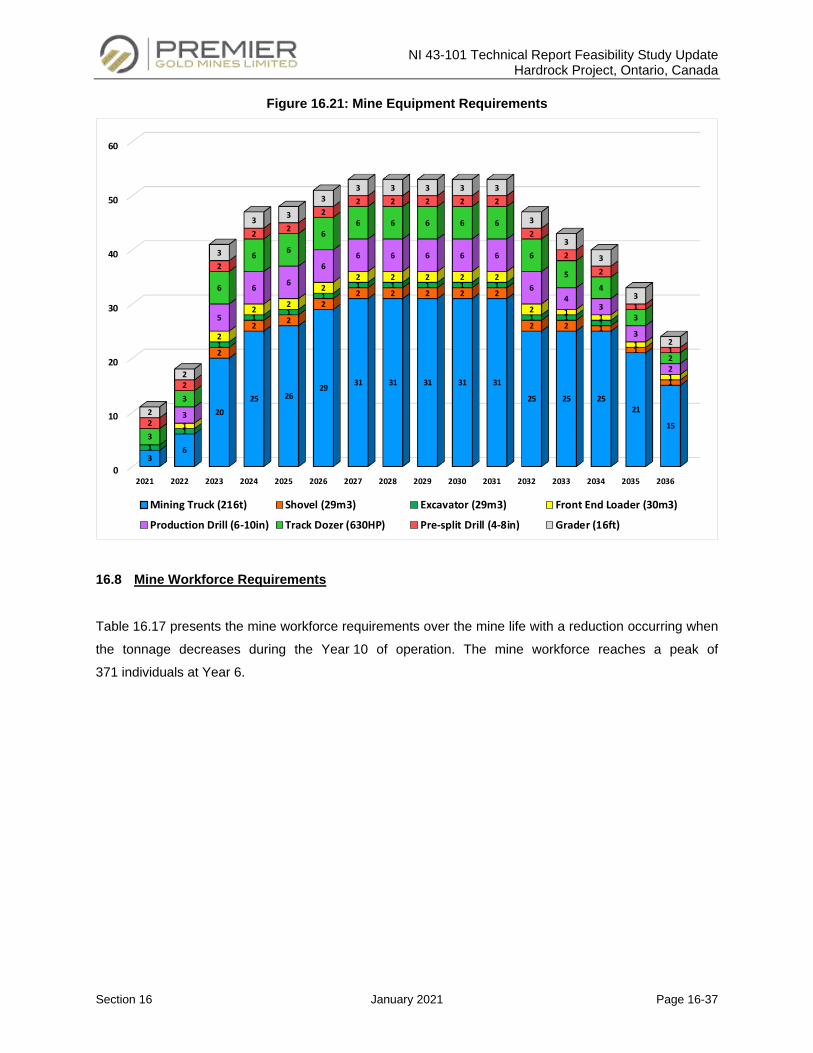
NI 43-101 Technical Report Feasibility Study Update Hardrock Project, Ontario, Canada
Section 16 January 2021 Page 16-37
Figure 16.21: Mine Equipment Requirements
16.8 Mine Workforce Requirements
Table 16.17 presents the mine workforce requirements over the mine life with a reduction occurring when
the tonnage decreases during the Year 10 of operation. The mine workforce reaches a peak of
371 individuals at Year 6.
0
10
20
30
40
50
60
2021 2022 2023 2024 2025 2026 2027 2028 2029 2030 2031 2032 2033 2034 2035 2036
36
2025 26
29 31 31 31 31 31
25 25 2521
15
2
2 2
22 2 2 2 2
2 2 1
1
1
1
1
1
1 1
11 1 1 1 1
1 1 1
1
2
2 2
22 2 2 2 2
2 1 1
1
1
3
5
6 6
66 6 6 6 6
64
3
3
2
3
3
6
6 6
66 6 6 6 6
6
54
3
2
2
2
2
2 2
22 2 2 2 2
2
2
2
1
1
2
2
3
3 3
33 3 3 3 3
3
3
3
3
2
Mining Truck (216t) Shovel (29m3) Excavator (29m3) Front End Loader (30m3)
Production Drill (6-10in) Track Dozer (630HP) Pre-split Drill (4-8in) Grader (16ft)
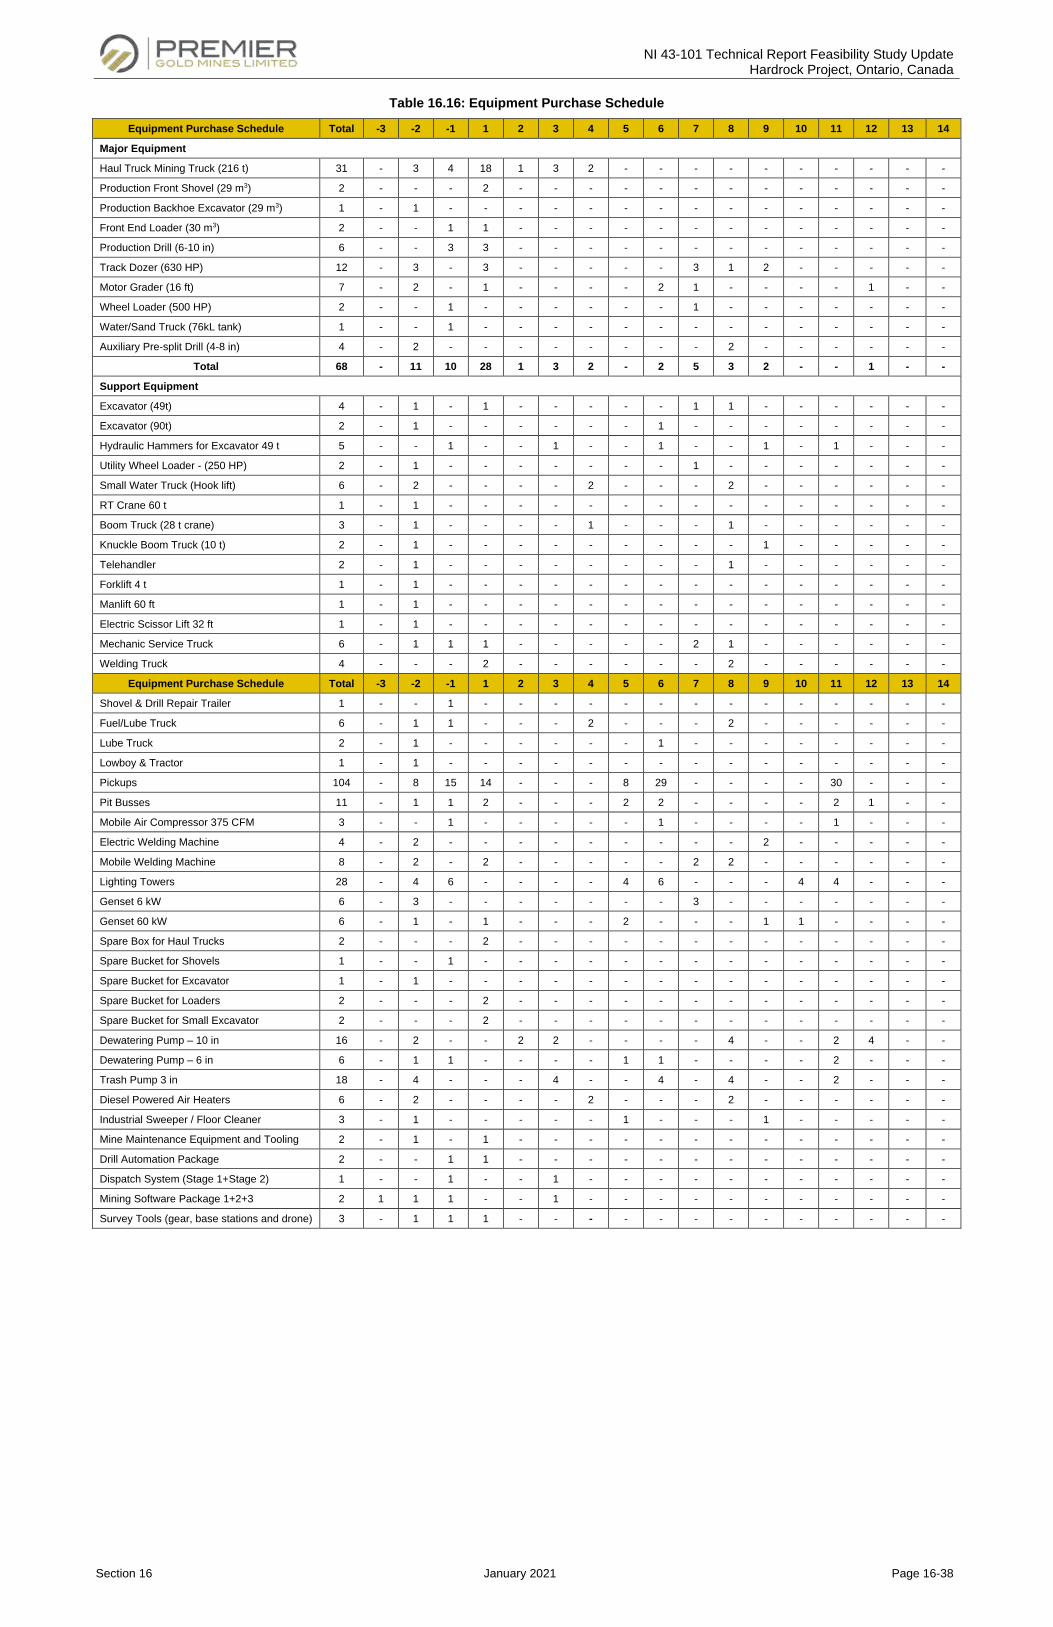
NI 43-101 Technical Report Feasibility Study Update Hardrock Project, Ontario, Canada
Section 16 January 2021 Page 16-38
Table 16.16: Equipment Purchase Schedule
Equipment Purchase Schedule Total -3 -2 -1 1 2 3 4 5 6 7 8 9 10 11 12 13 14
Major Equipment
Haul Truck Mining Truck (216 t) 31 - 3 4 18 1 3 2 - - - - - - - - - -
Production Front Shovel (29 m3) 2 - - - 2 - - - - - - - - - - - - -
Production Backhoe Excavator (29 m3) 1 - 1 - - - - - - - - - - - - - - -
Front End Loader (30 m3) 2 - - 1 1 - - - - - - - - - - - - -
Production Drill (6-10 in) 6 - - 3 3 - - - - - - - - - - - - -
Track Dozer (630 HP) 12 - 3 - 3 - - - - - 3 1 2 - - - - -
Motor Grader (16 ft) 7 - 2 - 1 - - - - 2 1 - - - - 1 - -
Wheel Loader (500 HP) 2 - - 1 - - - - - - 1 - - - - - - -
Water/Sand Truck (76kL tank) 1 - - 1 - - - - - - - - - - - - - -
Auxiliary Pre-split Drill (4-8 in) 4 - 2 - - - - - - - - 2 - - - - - -
Total 68 - 11 10 28 1 3 2 - 2 5 3 2 - - 1 - -
Support Equipment
Excavator (49t) 4 - 1 - 1 - - - - - 1 1 - - - - - -
Excavator (90t) 2 - 1 - - - - - - 1 - - - - - - - -
Hydraulic Hammers for Excavator 49 t 5 - - 1 - - 1 - - 1 - - 1 - 1 - - -
Utility Wheel Loader - (250 HP) 2 - 1 - - - - - - - 1 - - - - - - -
Small Water Truck (Hook lift) 6 - 2 - - - - 2 - - - 2 - - - - - -
RT Crane 60 t 1 - 1 - - - - - - - - - - - - - - -
Boom Truck (28 t crane) 3 - 1 - - - - 1 - - - 1 - - - - - -
Knuckle Boom Truck (10 t) 2 - 1 - - - - - - - - - 1 - - - - -
Telehandler 2 - 1 - - - - - - - - 1 - - - - - -
Forklift 4 t 1 - 1 - - - - - - - - - - - - - - -
Manlift 60 ft 1 - 1 - - - - - - - - - - - - - - -
Electric Scissor Lift 32 ft 1 - 1 - - - - - - - - - - - - - - -
Mechanic Service Truck 6 - 1 1 1 - - - - - 2 1 - - - - - -
Welding Truck 4 - - - 2 - - - - - - 2 - - - - - -
Equipment Purchase Schedule Total -3 -2 -1 1 2 3 4 5 6 7 8 9 10 11 12 13 14
Shovel & Drill Repair Trailer 1 - - 1 - - - - - - - - - - - - - -
Fuel/Lube Truck 6 - 1 1 - - - 2 - - - 2 - - - - - -
Lube Truck 2 - 1 - - - - - - 1 - - - - - - - -
Lowboy & Tractor 1 - 1 - - - - - - - - - - - - - - -
Pickups 104 - 8 15 14 - - - 8 29 - - - - 30 - - -
Pit Busses 11 - 1 1 2 - - - 2 2 - - - - 2 1 - -
Mobile Air Compressor 375 CFM 3 - - 1 - - - - - 1 - - - - 1 - - -
Electric Welding Machine 4 - 2 - - - - - - - - - 2 - - - - -
Mobile Welding Machine 8 - 2 - 2 - - - - - 2 2 - - - - - -
Lighting Towers 28 - 4 6 - - - - 4 6 - - - 4 4 - - -
Genset 6 kW 6 - 3 - - - - - - - 3 - - - - - - -
Genset 60 kW 6 - 1 - 1 - - - 2 - - - 1 1 - - - -
Spare Box for Haul Trucks 2 - - - 2 - - - - - - - - - - - - -
Spare Bucket for Shovels 1 - - 1 - - - - - - - - - - - - - -
Spare Bucket for Excavator 1 - 1 - - - - - - - - - - - - - - -
Spare Bucket for Loaders 2 - - - 2 - - - - - - - - - - - - -
Spare Bucket for Small Excavator 2 - - - 2 - - - - - - - - - - - - -
Dewatering Pump – 10 in 16 - 2 - - 2 2 - - - - 4 - - 2 4 - -
Dewatering Pump – 6 in 6 - 1 1 - - - - 1 1 - - - - 2 - - -
Trash Pump 3 in 18 - 4 - - - 4 - - 4 - 4 - - 2 - - -
Diesel Powered Air Heaters 6 - 2 - - - - 2 - - - 2 - - - - - -
Industrial Sweeper / Floor Cleaner 3 - 1 - - - - - 1 - - - 1 - - - - -
Mine Maintenance Equipment and Tooling 2 - 1 - 1 - - - - - - - - - - - - -
Drill Automation Package 2 - - 1 1 - - - - - - - - - - - - -
Dispatch System (Stage 1+Stage 2) 1 - - 1 - - 1 - - - - - - - - - - -
Mining Software Package 1+2+3 2 1 1 1 - - 1 - - - - - - - - - - -
Survey Tools (gear, base stations and drone) 3 - 1 1 1 - - - - - - - - - - - - -
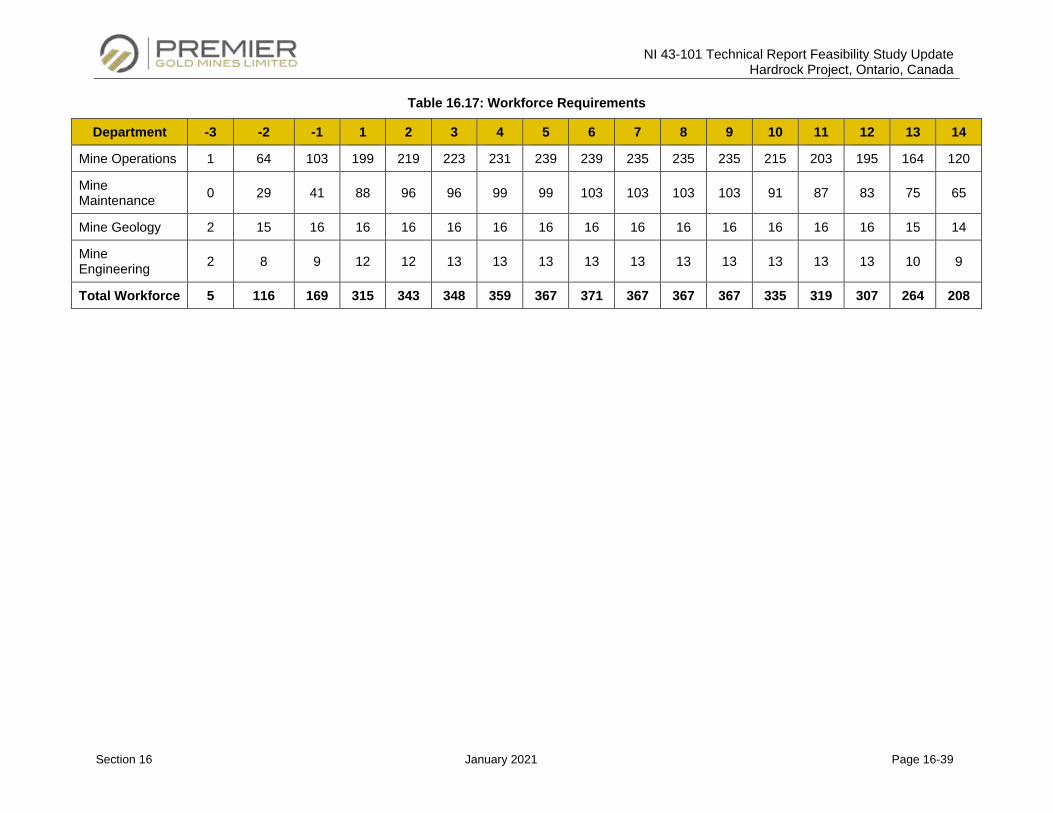
NI 43-101 Technical Report Feasibility Study Update Hardrock Project, Ontario, Canada
Section 16 January 2021 Page 16-39
Table 16.17: Workforce Requirements
Department -3 -2 -1 1 2 3 4 5 6 7 8 9 10 11 12 13 14
Mine Operations 1 64 103 199 219 223 231 239 239 235 235 235 215 203 195 164 120
Mine Maintenance 0 29 41 88 96 96 99 99 103 103 103 103 91 87 83 75 65
Mine Geology 2 15 16 16 16 16 16 16 16 16 16 16 16 16 16 15 14
Mine Engineering 2 8 9 12 12 13 13 13 13 13 13 13 13 13 13 10 9
Total Workforce 5 116 169 315 343 348 359 367 371 367 367 367 335 319 307 264 208
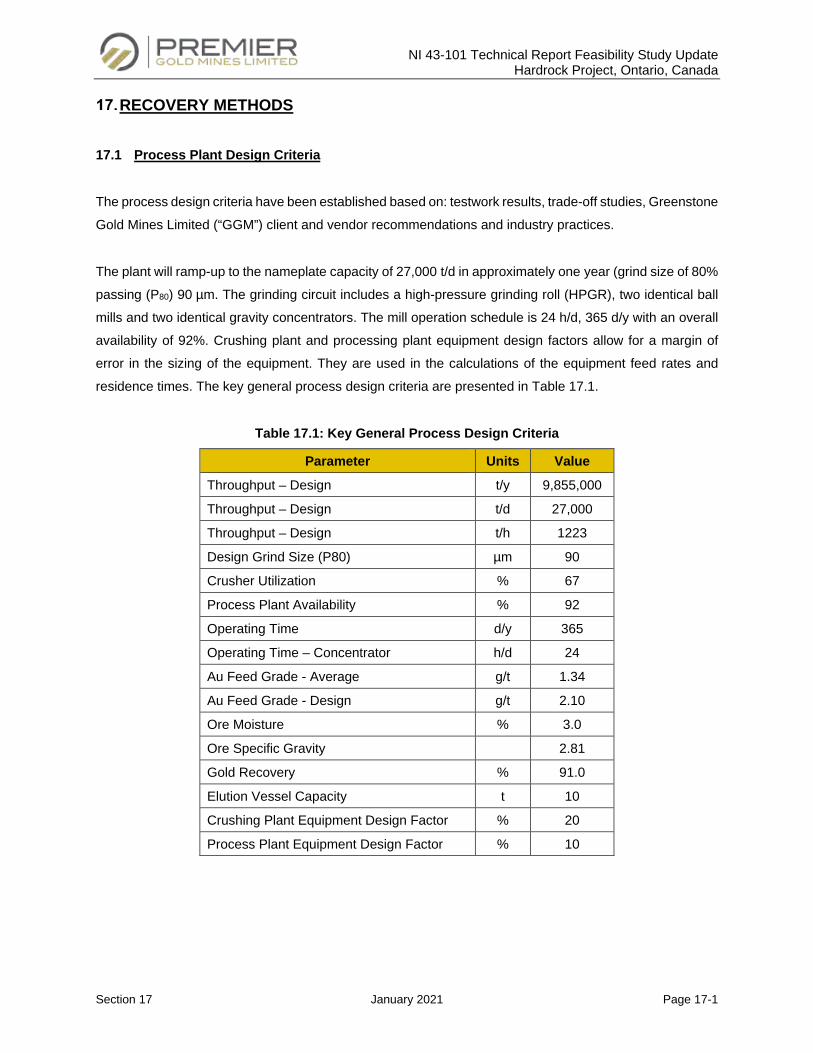
NI 43-101 Technical Report Feasibility Study Update Hardrock Project, Ontario, Canada
Section 17 January 2021 Page 17-1
RECOVERY METHODS
17.1 Process Plant Design Criteria
The process design criteria have been established based on: testwork results, trade-off studies, Greenstone
Gold Mines Limited (“GGM”) client and vendor recommendations and industry practices.
The plant will ramp-up to the nameplate capacity of 27,000 t/d in approximately one year (grind size of 80%
passing (P80) 90 µm. The grinding circuit includes a high-pressure grinding roll (HPGR), two identical ball
mills and two identical gravity concentrators. The mill operation schedule is 24 h/d, 365 d/y with an overall
availability of 92%. Crushing plant and processing plant equipment design factors allow for a margin of
error in the sizing of the equipment. They are used in the calculations of the equipment feed rates and
residence times. The key general process design criteria are presented in Table 17.1.
Table 17.1: Key General Process Design Criteria
Parameter Units Value
Throughput – Design t/y 9,855,000
Throughput – Design t/d 27,000
Throughput – Design t/h 1223
Design Grind Size (P80) µm 90
Crusher Utilization % 67
Process Plant Availability % 92
Operating Time d/y 365
Operating Time – Concentrator h/d 24
Au Feed Grade - Average g/t 1.34
Au Feed Grade - Design g/t 2.10
Ore Moisture % 3.0
Ore Specific Gravity 2.81
Gold Recovery % 91.0
Elution Vessel Capacity t 10
Crushing Plant Equipment Design Factor % 20
Process Plant Equipment Design Factor % 10
NI 43-101 Technical Report Feasibility Study Update Hardrock Project, Ontario, Canada
Section 17 January 2021 Page 17-2
17.1.1 Comminution Design Values
The comminution test work program determined grinding characteristics for the various lithologies. Based
on the run-of-mine expected composition (refer to Table 17.2), the weighted averages were calculated to
establish the plant feed grindability parameters. The results are compiled in Table 17.3. The 75th percentiles
of hardness are used for design purposes to ensure sufficient equipment capacity to handle process
variations.
The ore hardness data available when the ball mill design was selected was measured on the composite
samples made up of a blend of 53 different core intervals originating from different lithologies representing
the entire deposit. The weighted average of the composite samples Bond ball mill work index (BWI)
obtained was 15.5 kWh/t which was used for the design of the ball mills. Modified BWIs, considered as
more accurate for the prediction of the grinding circuit behavior, were also measured on samples from
various lithologies. The overall 75th percentile result obtained for the samples from various lithologies was
15.5 kWh/t. That confirms that the design value of 15.5 kWh/t is satisfactory and conservative. Furthermore,
the variability between the results obtained for each lithology is small, justifying the use of only one value
of BWI to represent the entire deposit for the design of the ball mills. The HPGR also generates microcracks
on the ore particles which typically reduces the power required at the ball mill. The microcrack effect was
not considered when designing the ball mills which provides additional contingency.
Table 17.2: Global Composite Sample Composition
Lithology Units Content
Greywacke (S3E) and Gabbro (I1A) %/ wt 53.2
Iron Formation (C2A) % wt 30.2
Porphyry (I3P) % wt 16.5
Conglomerate (S4) and Ultramafic (I0) % wt 0.1
Total % wt 100.0
NI 43-101 Technical Report Feasibility Study Update Hardrock Project, Ontario, Canada
Section 17 January 2021 Page 17-3
Table 17.3: Comminution Parameters (Weighted Averages)
Comminution Parameters Units Value
Bond Rod Work Index (RWI) (80th percentile) kWh/t 16.8
Standard Bond Ball Mill Work Index (BWI) (75th percentile) kWh/t 15.5
Modified Bond Mill Work Index (BWI) (75th percentile) kWh/t 15.5
Abrasion Index (Ai) (average) g 0.127
Unconfined Compressive Strength (UCS) (80th percentile) MPa 242
Unconfined Compressive Strength (UCS) (range) MPa 206-291
JK Breakage Resistance Number (20th percentile) (Axb) 26.1
JK Abrasion Resistance (10th percentile) (ta) 0.22
HPGR Specific Grinding Force N/mm2 3.2
HPGR Specific Throughput (mf) ts/hm3 240
HPGR Specific Throughput rate (mc) ts/hm3 202
HPGR Specific Power kWs/m3 620
17.1.2 Grind Size Determination
The cyanidation test work established a correlation between grind size and gold recovery whereby a finer
grind results in a higher recovery.
The Global Composite is considered to be the most representative of the run-of-mine over the life-of-mine,
the results of the leach tests on the Global Composite were used to determine the optimal grind size (refer
to Figure 17.1).
The analysis has also been conducted on the results from leach tests on the Variability Composites A to I,
the Master Composite (representing the Feasibility Study mine design for the first three years of operation)
and the Low Grade Composites. Results from these other samples are used to evaluate the impact of ore
variability.
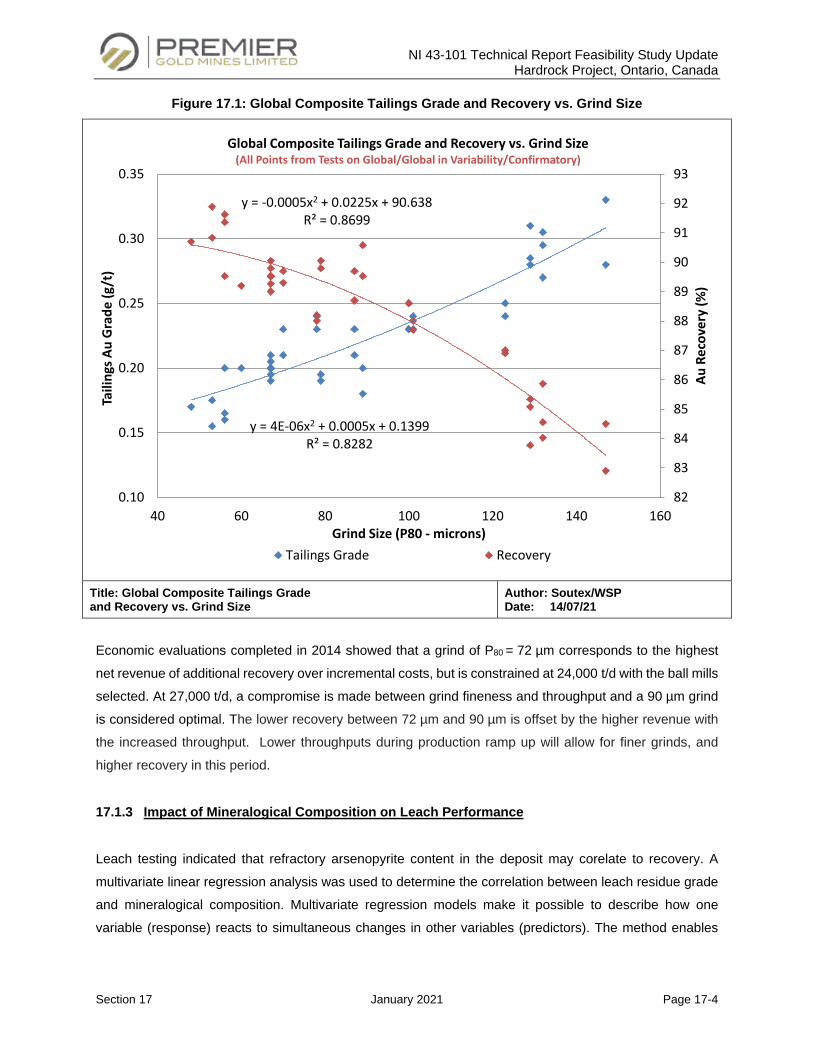
NI 43-101 Technical Report Feasibility Study Update Hardrock Project, Ontario, Canada
Section 17 January 2021 Page 17-4
Figure 17.1: Global Composite Tailings Grade and Recovery vs. Grind Size
Title: Global Composite Tailings Grade and Recovery vs. Grind Size
Author: Soutex/WSP Date: 14/07/21
Economic evaluations completed in 2014 showed that a grind of P80 = 72 µm corresponds to the highest
net revenue of additional recovery over incremental costs, but is constrained at 24,000 t/d with the ball mills
selected. At 27,000 t/d, a compromise is made between grind fineness and throughput and a 90 µm grind
is considered optimal. The lower recovery between 72 µm and 90 µm is offset by the higher revenue with
the increased throughput. Lower throughputs during production ramp up will allow for finer grinds, and
higher recovery in this period.
17.1.3 Impact of Mineralogical Composition on Leach Performance
Leach testing indicated that refractory arsenopyrite content in the deposit may corelate to recovery. A
multivariate linear regression analysis was used to determine the correlation between leach residue grade
and mineralogical composition. Multivariate regression models make it possible to describe how one
variable (response) reacts to simultaneous changes in other variables (predictors). The method enables
y = 4E-06x2 + 0.0005x + 0.1399R² = 0.8282
y = -0.0005x2 + 0.0225x + 90.638R² = 0.8699
82
83
84
85
86
87
88
89
90
91
92
93
0.10
0.15
0.20
0.25
0.30
0.35
40 60 80 100 120 140 160
Au R
ecov
ery
(%)
Taili
ngs A
u G
rade
(g/t
)
Grind Size (P80 - microns)
Global Composite Tailings Grade and Recovery vs. Grind Size(All Points from Tests on Global/Global in Variability/Confirmatory)
Tailings Grade Recovery
NI 43-101 Technical Report Feasibility Study Update Hardrock Project, Ontario, Canada
Section 17 January 2021 Page 17-5
the combined impact of each predictor variable to be quantified on the response variable, which is not
possible via simple regression analysis.
The results of the leach tests conducted during the feasibility study stage, described in Subsection 13.2.2
and the basic engineering stage, described in Subsection 13.3 were used as the basis for the analysis. The
residual gold grade from the leach testwork was found to be highly correlated to the gold, arsenic and sulfur
head sample grades. The strong correlation between the residual gold grade and arsenic and sulfur head
grades suggests that arsenopyrite (FeAsS) contains refractory gold which is not recovered via leaching.
Table 17.4 shows the composites used for the analysis, the number of tests made on each composite and
the head grades. The composites A to I and WCE were produced for the feasibility study testwork
completed in 2014. The composites 1 through 17 were prepared for the basic engineering tests completed
at SGS Lakefield in 2019. The head grade of composite 12 was significantly higher than planned and was
removed from the dataset for the model since it would lead to bias.
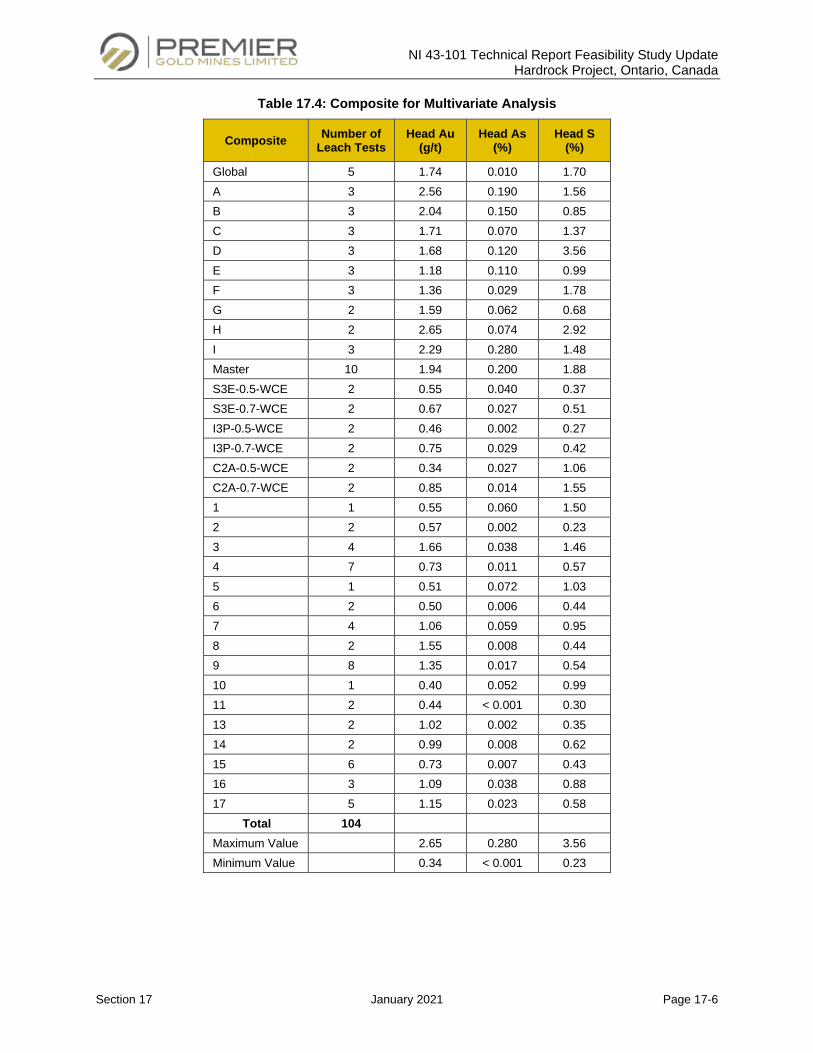
NI 43-101 Technical Report Feasibility Study Update Hardrock Project, Ontario, Canada
Section 17 January 2021 Page 17-6
Table 17.4: Composite for Multivariate Analysis
Composite Number of Leach Tests
Head Au (g/t)
Head As (%)
Head S (%)
Global 5 1.74 0.010 1.70 A 3 2.56 0.190 1.56 B 3 2.04 0.150 0.85 C 3 1.71 0.070 1.37 D 3 1.68 0.120 3.56 E 3 1.18 0.110 0.99 F 3 1.36 0.029 1.78 G 2 1.59 0.062 0.68 H 2 2.65 0.074 2.92 I 3 2.29 0.280 1.48 Master 10 1.94 0.200 1.88 S3E-0.5-WCE 2 0.55 0.040 0.37 S3E-0.7-WCE 2 0.67 0.027 0.51 I3P-0.5-WCE 2 0.46 0.002 0.27 I3P-0.7-WCE 2 0.75 0.029 0.42 C2A-0.5-WCE 2 0.34 0.027 1.06 C2A-0.7-WCE 2 0.85 0.014 1.55 1 1 0.55 0.060 1.50 2 2 0.57 0.002 0.23 3 4 1.66 0.038 1.46 4 7 0.73 0.011 0.57 5 1 0.51 0.072 1.03 6 2 0.50 0.006 0.44 7 4 1.06 0.059 0.95 8 2 1.55 0.008 0.44 9 8 1.35 0.017 0.54 10 1 0.40 0.052 0.99 11 2 0.44 < 0.001 0.30 13 2 1.02 0.002 0.35 14 2 0.99 0.008 0.62 15 6 0.73 0.007 0.43 16 3 1.09 0.038 0.88 17 5 1.15 0.023 0.58
Total 104 Maximum Value 2.65 0.280 3.56 Minimum Value 0.34 < 0.001 0.23
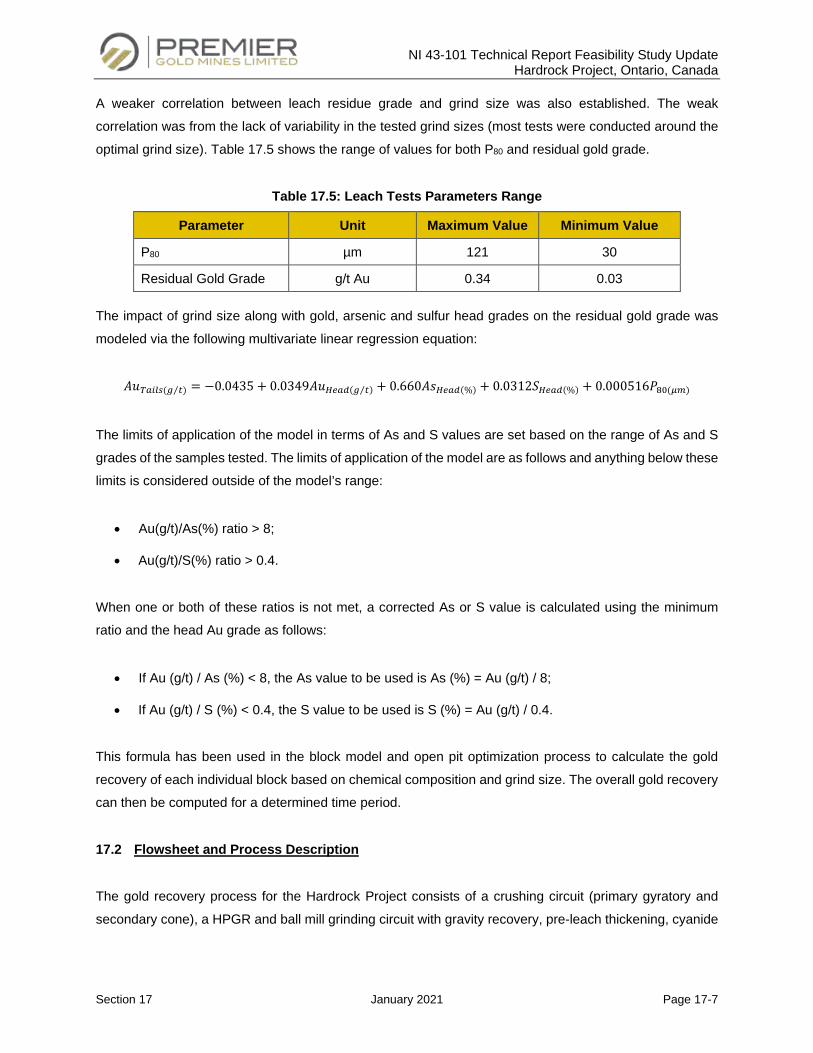
NI 43-101 Technical Report Feasibility Study Update Hardrock Project, Ontario, Canada
Section 17 January 2021 Page 17-7
A weaker correlation between leach residue grade and grind size was also established. The weak
correlation was from the lack of variability in the tested grind sizes (most tests were conducted around the
optimal grind size). Table 17.5 shows the range of values for both P80 and residual gold grade.
Table 17.5: Leach Tests Parameters Range
Parameter Unit Maximum Value Minimum Value
P80 µm 121 30
Residual Gold Grade g/t Au 0.34 0.03
The impact of grind size along with gold, arsenic and sulfur head grades on the residual gold grade was
modeled via the following multivariate linear regression equation:
𝐴𝐴𝐴𝐴𝑇𝑇𝑇𝑇𝑇𝑇𝑇𝑇𝑇𝑇(𝑔𝑔 𝑡𝑡⁄ ) = −0.0435 + 0.0349𝐴𝐴𝐴𝐴𝐻𝐻𝐻𝐻𝑇𝑇𝐻𝐻(𝑔𝑔 𝑡𝑡⁄ ) + 0.660𝐴𝐴𝐴𝐴𝐻𝐻𝐻𝐻𝑇𝑇𝐻𝐻(%) + 0.0312𝑆𝑆𝐻𝐻𝐻𝐻𝑇𝑇𝐻𝐻(%) + 0.000516𝑃𝑃80(𝜇𝜇𝜇𝜇)
The limits of application of the model in terms of As and S values are set based on the range of As and S
grades of the samples tested. The limits of application of the model are as follows and anything below these
limits is considered outside of the model’s range:
• Au(g/t)/As(%) ratio > 8;
• Au(g/t)/S(%) ratio > 0.4.
When one or both of these ratios is not met, a corrected As or S value is calculated using the minimum
ratio and the head Au grade as follows:
• If Au (g/t) / As (%) < 8, the As value to be used is As (%) = Au (g/t) / 8;
• If Au (g/t) / S (%) < 0.4, the S value to be used is S (%) = Au (g/t) / 0.4.
This formula has been used in the block model and open pit optimization process to calculate the gold
recovery of each individual block based on chemical composition and grind size. The overall gold recovery
can then be computed for a determined time period.
17.2 Flowsheet and Process Description
The gold recovery process for the Hardrock Project consists of a crushing circuit (primary gyratory and
secondary cone), a HPGR and ball mill grinding circuit with gravity recovery, pre-leach thickening, cyanide
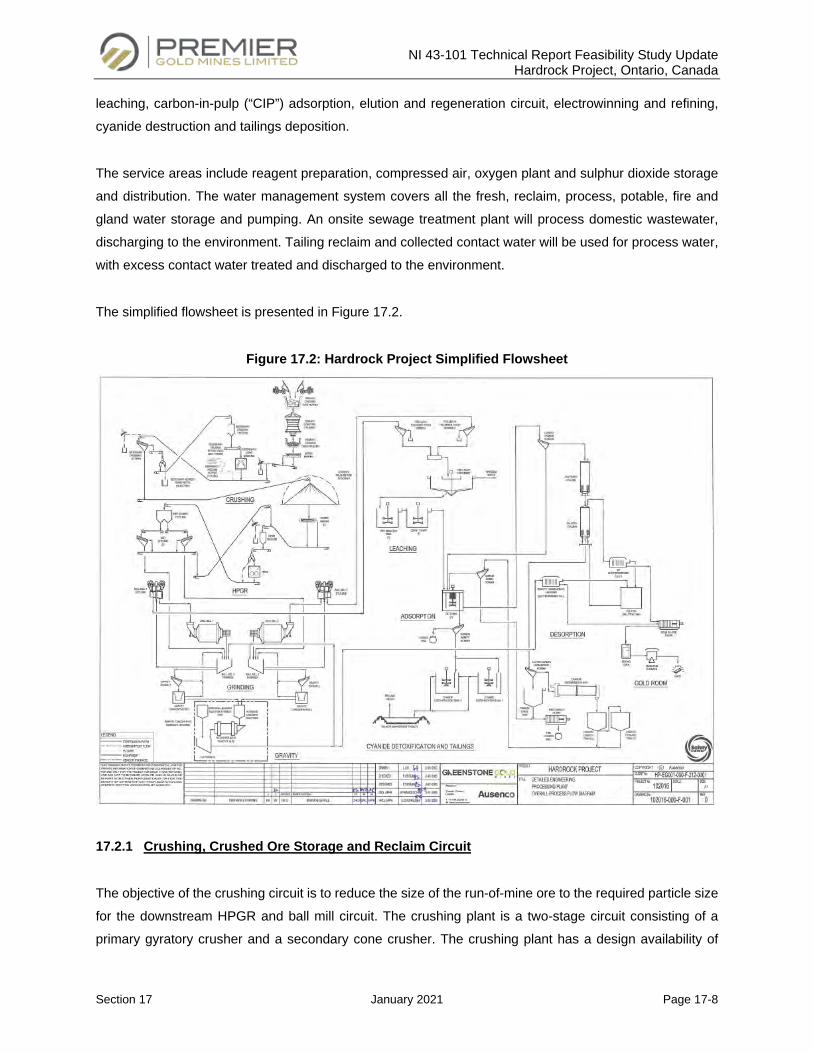
NI 43-101 Technical Report Feasibility Study Update Hardrock Project, Ontario, Canada
Section 17 January 2021 Page 17-8
leaching, carbon-in-pulp (“CIP”) adsorption, elution and regeneration circuit, electrowinning and refining,
cyanide destruction and tailings deposition.
The service areas include reagent preparation, compressed air, oxygen plant and sulphur dioxide storage
and distribution. The water management system covers all the fresh, reclaim, process, potable, fire and
gland water storage and pumping. An onsite sewage treatment plant will process domestic wastewater,
discharging to the environment. Tailing reclaim and collected contact water will be used for process water,
with excess contact water treated and discharged to the environment.
The simplified flowsheet is presented in Figure 17.2.
Figure 17.2: Hardrock Project Simplified Flowsheet
17.2.1 Crushing, Crushed Ore Storage and Reclaim Circuit
The objective of the crushing circuit is to reduce the size of the run-of-mine ore to the required particle size
for the downstream HPGR and ball mill circuit. The crushing plant is a two-stage circuit consisting of a
primary gyratory crusher and a secondary cone crusher. The crushing plant has a design availability of
NI 43-101 Technical Report Feasibility Study Update Hardrock Project, Ontario, Canada
Section 17 January 2021 Page 17-9
67%. A 20% design factor has been selected such that crushing circuit equipment is sized to handle up to
2,025 t/h. The design factor is industry practice, providing extra production capacity to handle processing
fluctuations due to changes in ore feed rate and ore hardness.
17.2.1.1 Primary Crushing
Run-of-mine ore is delivered by mine haulage trucks. The ore is dumped from the truck into a steel dump
pocket that feeds the primary crusher. The pocket has two dump points and a live capacity equivalent to
1.5 times the haul truck payload. A rock breaker will be used to break oversized rocks. The 1,300 mm x
1,800 mm 450 kW gyratory crusher crushes the ore from a 1,000 mm top size (275 mm P80) to a P80 of 120-
160 mm product. The primary crusher operates with an open side setting (“OSS”) of 160 to 200 mm. The
crushed ore falls into a steel discharge pocket with1.6 truckloads capacity and is reclaimed via an apron
feeder. The main discharge and dribbles from the apron feeder are discharged onto the sacrificial conveyor
that feeds the secondary crushing and screening circuit.
The primary crushing area is serviced by a dedicated compressed air system and a 40 t overhead crane.
A dust collection system is installed to control dust emissions. The primary crusher is designed for
maintenance from the top down rather than through the discharge pocket.
An electromagnet and metal detector are installed on the primary crusher sacrificial conveyor to prevent
tramp iron from entering the secondary cone crusher. The ore contains magnetite in sufficient quantities
that would overwhelm a standard magnet. The metal detector is used to detect spikes in magnetic
susceptibility from tramp metal, which will then activate the electromagnet to remove the tramp. This feature
is utilized for all of the tramp removal systems.
17.2.1.2 Secondary Crushing and Screening
The secondary crusher is a 950 kW standard cone crusher with a 45-60 mm closed side setting (“CSS”).
The secondary cone crusher is installed in closed-circuit with a double deck screen to control the top size
feeding the HPGR. Secondary crusher screen undersize is conveyed to the covered crushed ore stockpile.
The 4,250 mm x 8,500 mm double deck secondary crushing screen is fitted with a top deck 75 mm closing
screen opening, and bottom deck with 50 mm closing screen opening. Combined oversize from both decks
is returned to the secondary cone crusher. The crushing circuit produces a final crushed product with a
50 mm top size and a 35 mm P80. Combined screen oversize flows onto the secondary screen oversize
discharge conveyor and transfers to the secondary screen oversize return conveyor which feeds a mass
flow bin with 17 minutes retention time. A second tramp metal electromagnet is installed before the
NI 43-101 Technical Report Feasibility Study Update Hardrock Project, Ontario, Canada
Section 17 January 2021 Page 17-10
secondary screen, and a metal detector-activated flop gate on the screen oversized recycle to protect the
secondary crusher. In case tramp metal is not removed successfully, the secondary crusher retractable
belt feed conveyor is equipped with a metal detector which will retract the chute and deposit the tramp steel
into a separate chute. These measures prevent tramp iron from entering the secondary cone crusher.
There is an allowance for an emergency hopper and feeder installation at the discharge of the secondary
crusher on the secondary screen feed conveyor to reclaim material using a surface loader, if necessary in
the future. The secondary crushing area is serviced by a dedicated air compressor, a 55 t capacity overhead
crane, a dust collector and a sump pump. A dust collection system is installed to control dust emissions.
The screen area is serviced by a 90 t capacity overhead crane that is also used to service the HPGR. The
secondary crushing recirculation and stockpile feed conveyors are equipped with belt scales to monitor
throughput.
17.2.1.3 Crushed Ore Stockpile and Reclaim
The crushing circuit product is stored in a 21,196 t live capacity stockpile which provides 20 hours of
operation. The stockpile is located North of the secondary crushing and the process plants. There is a
single stockpile reclaim tunnel with three apron feeders located in a reinforced concrete tunnel underneath
the stockpile. These apron feeders feed the crushed ore stockpile (“COS”) reclaim conveyor which
discharges into the HPGR feed bin located inside the HPGR building. Cartridge type dust collectors are
installed in the transfer chutes between the apron feeders on the skirt boards of the COS reclaim conveyor.
Spile bar isolating systems are installed on each of the apron feeder reclaim hoppers, to isolate the apron
feeders for maintenance.
The reclaim area is serviced by a dedicated air compressor and a sump pump. A reclaim hopper is installed
on the COS reclaim conveyor to allow the tunnel area to be cleaned using a bobcat. Monorails and hoists
are available in the tunnel to manipulate spile bars and their insertion / extraction tool and for maintenance
purposes. On the COS reclaim conveyor, a scale is installed to control throughput as well as a metal
detector to detect any tramp steel still present.
17.2.2 HPGR/Grinding and Gravity Recovery Circuit
The HPGR/grinding circuit crushes and grinds ore to the optimal grind size to maximize gold recovery in
the leach and carbon-in-pulp circuit. The gravity recovery circuit removes gravity recoverable gold in the
grinding circuit in order to decrease the load on the leach and CIP circuits.
NI 43-101 Technical Report Feasibility Study Update Hardrock Project, Ontario, Canada
Section 17 January 2021 Page 17-11
The grinding and gravity circuit consists of two parallel operating lines each consisting of a wet screen (fed
from one bin - HPGR crushed product), ball mill and gravity concentrator in closed circuit with cyclones.
The gravity products from both concentrators are combined in a single gravity concentrate leaching unit.
At the design plant availability of 92%, the nominal circuit throughput is 1,223 t/h. A 10% design factor is
used for the sizing of the equipment such as pumps, thickener, tanks, etc. The design factor accounts for
the process fluctuations and upsets, ensuring that mill throughput is met.
17.2.2.1 High Pressure Grinding Rolls (HPGR)
A detailed comminution trade-off study recommended a two-stage crushing circuit followed by HPGR and
ball milling circuit over other typical comminution flowsheets such as crushing followed by semi-autogenous
(“SAG”) milling and ball milling, to reduce throughput risk and increase energy efficiency from the high
hardness levels measured in testing.
Wet screen oversize is recycled back to the COS reclaim conveyor, which discharges a blended product
into the HPGR feed bin (mass flow bin equipped with a slide gate for isolation). A belt feeder reclaims ore
from the HPGR feed bin and feeds the HPGR weigh bin, located above the HPGR. Belt feeder speed is
controlled in order to ensure that the weight bin choke-feeds the HPGR. The HPGR is equipped with two,
2,650 kW motors for a total of 5,300 kW. The HPGR roll dimensions are 2.2 m in diameter by 2.0 m in
length and have a rotating speed of 22 rpm. The HPGR discharge falls onto the wet screen feed bin
conveyor and then into the wet screen surge bin feed (mass flow bin equipped with slide gates for isolation)
that divides the HPGR product between two double-deck screens. The HPGR screens are double deck
3,600 mm wide by 7,300 mm long banana type. Process water is added in the pulping box ahead of the
HPGR screens, sprayed on the HPGR screens and added in the HPGR screen undersize chute to reduce
dust emissions and help flake deagglomeration. The top screen panels have 12 mm x 28 mm apertures
and the bottom screen panels have 27 mm x 6 mm apertures. The screen undersize is about 80% passing
3.5 mm and falls into their respective ball mill pump box.
The wet screen surge bin has 17 minutes of retention time. The building is maintained at minimum of 10°C
during cold weather operation. Modeling has shown the bin and its contents are always above freezing
temperature.
The wet screen oversize is recirculated on the wet screen oversize transfer conveyor and the wet screen
oversize return conveyor. The wet screen oversize return conveyor is discharged back on the COS reclaim
conveyor to be crushed again in the HPGR. The HPGR circulating load is expected to be nominally 85%,
with a design value of 110%.
NI 43-101 Technical Report Feasibility Study Update Hardrock Project, Ontario, Canada
Section 17 January 2021 Page 17-12
The HPGR is installed in a dedicated building with the secondary crusher screen while the grinding mills
and HPGR screens are installed in the process plant building. A 90 t capacity overhead crane is installed
to service the HPGR and the secondary screen in the HPGR building and a 5 t capacity overhead crane to
service the COS reclaim conveyor head pulley, electromagnet and HPGR feed bin. A sump pump is also
installed in the HPGR / Secondary Screen area. The wet screen oversize return conveyor is located in a
heated gallery to minimize the risk of freezing during cold weather months. Two dust collection systems
are installed in this building, one for the Secondary Screen and one for the HPGR. In the processing plant
building, a scrubber and a 50 t overhead crane are installed to service the HPGR wet screens area and
grinding area.
17.2.2.2 Grinding
Undersize from each HPGR screen product is discharged to their respective ball mill pump box. Each pump
box is equipped with two slurry pumps, one pump feeding the ball mill cyclones and one feeding the gravity
circuit. Approximately 60% of the fresh feed is pumped to the gravity circuit.
The cyclone overflow P80 ranges from 72 µm to 90 µm. The ball milling circuit recirculating load is estimated
at 300%, with a design value of 350% for pump selection. The cyclones are 600 mm diameter installed in
a radial distributor. There will be seven cyclones operational per mill at a pressure of 105 kPa. Each
distributor also has two installed spare cyclones.
The cyclone overflow feeds the pre-leach thickener trash screen while the underflow (approximately
75% solids) is directed to the ball mill feed chute. Lime is added to the ball mill feed to raise the slurry pH
to between 10 and 11. The grinding mills are twin pinion ball mills equipped with motors totaling 10,500 kW
per mill. Both mills are 6.7 m in diameter (inside liners) by 12.3 m in length (EGL). The ball mills have
discharge trommel screens to remove scats. The ball mill discharge flows into the ball mill pump box where
it is combined with the HPGR discharge slurry and pumped to the cyclones for classification. The plant can
be operated at a lower throughput, by operating only one ball mill and one HPGR screen, slowing the HPGR
RPM to accommodate.
A single liner handler can be used for the liner changes in either ball mill. Each mill has its own ball kibble
for loading 65 mm diameter balls into the mill, lifting frame and inching drive. The hydraulic jacking unit,
including drive powerpack and bolt removal tools are shared between the two mills. A dedicated sump
pump is installed in each ball mill area.
NI 43-101 Technical Report Feasibility Study Update Hardrock Project, Ontario, Canada
Section 17 January 2021 Page 17-13
17.2.2.3 Gravity Concentration
The gravity feed pump transfers a portion of the cyclone feed to the gravity circuit to recover gravity
recoverable gold. Two gravity screens and two gravity concentrators are installed to process the material.
The vibrating gravity feed screen prevents particles coarser than 3.36 mm from entering the gravity
concentrator. The screen oversize flows into the ball mill pumpbox. Screen undersize flows to the gravity
feed chute onto each gravity concentrator. A by-pass line is installed on the gravity feed chute to the gravity
concentrators to operate when the concentrators are transferring concentrate to intensive leaching. After
each cycle, the gold concentrate is flushed from the concentrators and transferred to the gravity concentrate
intensive leaching circuit. The gravity concentrator tailings flow to the ball mill pump box.
Process water is used to flush the concentrate and antiscalant is added to the water stream to avoid scale
build-up. A 5 t overhead crane is installed to service the gravity screens, with each gravity concentrator
having a dedicated monorail.
17.2.2.4 Gravity Concentrate Intensive Leaching
The gravity concentrate from both gravity concentrators is transferred to the single gravity concentrate
intensive leaching circuit. This system is a packaged unit consisting of a feed tank, a drum leach reactor, a
solution storage tank and a transfer pump.
Both the gravity concentrators and gravity concentrate leaching equipment are secured in a fenced area
with controlled access and security cameras (not linked to the process camera network).
The gravity concentrate is leached in the reactor. A 98% dissolution efficiency is expected. The gravity
leach tailings are returned to the ball mill pump box while pregnant solution is fed to a dedicated
electrowinning cell.
17.2.3 Pre-Leach, Leach and Carbon-In-Pulp
The objective of the pre-leach, leach and carbon-in-pulp (“CIP”) circuit is to dissolve gold from the ground
ore, adsorb it onto activated carbon and transfer the loaded carbon to the elution circuit. The circuit is made
up of a pre-leach thickener, a series of leach tanks (one pre-leach and seven leach tanks) followed by
seven CIP tanks.
NI 43-101 Technical Report Feasibility Study Update Hardrock Project, Ontario, Canada
Section 17 January 2021 Page 17-14
17.2.3.1 Pre-Leach Thickening
The cyclone overflow from each ball mill circuit feeds a dedicated trash screen located above the pre-leach
thickener. The screen undersize gravity flow to the pre-leach thickener feed box. Screen oversize is
collected in a bunker which is periodically cleaned out.
The 50 m diameter thickener is located outdoors; the tank underside is cladded and heated. The thickener
increases the slurry density from 35 to 55% solids and recycles water to the grinding circuit. A very high
molecular weight and slightly anionic polyacrylamide flocculant is added at a nominal dosage of 15 g/t and
design dosage of 30 g/t (grams of flocculant per tonne of dry solids) to promote sedimentation. Thickener
underflow is pumped to the leach circuit and sampled prior to leaching.
17.2.3.2 Leach Circuit
The leach circuit consists of one agitated pre-aeration tank and seven agitated leach tanks located
outdoors. All tanks are dimensionally equal (18.6 m D x 23.5 m H) and have the same level of agitation.
Slurry transfers from one tank to the next by overflow through an upcomer. Any tank can be bypassed if
maintenance is necessary. The leach tanks are equipped with 185 kW agitators. The total residence time
in the leach circuit is 28 hours and an additional four hours is available in the pre-aeration tank. Pre-aeration
provides passivation of reactive sulphide minerals, minimizing their impact on cyanide consumption.
Lime is added in the pre-aeration tank, the second and the fourth leach tank to readjust the pH level between
10.5 and 11.0, as required. A 30% sodium cyanide solution is added to leach tanks Nos. 1, 3 and 5 to
ensure an initial concentration of 0.5 g/L NaCN and tapering off as determined by leaching performance. A
cyanide analyzer is installed in the leach circuit to measure cyanide concentrations and control cyanide
addition. Oxygen from the on-site oxygen plant, is injected to reach the targeted 15 mg/L concentration of
dissolved oxygen. The leach discharge flows by gravity to the CIP circuit.
Leach tanks and associated equipment are serviced by mobile crane as required. Drive-through access is
provided along both sizes of the leach containment area, which is hydraulically linked with the pre-leach
thickener containment area.
17.2.3.3 CIP
The leach circuit discharge flows into the CIP launder located above the CIP tanks. The circuit is composed
of seven CIP tanks (six operational) with a total retention time of 1.5 hours. The seventh tank is included to
NI 43-101 Technical Report Feasibility Study Update Hardrock Project, Ontario, Canada
Section 17 January 2021 Page 17-15
ensure the residence time is maintained when one tank is not in operation. The CIP tanks are located
indoors.
The CIP circuit is designed and operated in carrousel mode, which allows the CIP tanks to be installed on
the same level and to be of the same dimensions (7.0 m in diameter by 12.0 m in height). Slurry feed and
discharge positions are rotated to ensure a counter-current movement between slurry and carbon, without
transferring carbon from one tank to another. The slurry passes through all the CIP tanks using the
combined carbon retention screen and agitator mechanism for pumping between tanks. Carbon
concentration is maintained at 50 g/L in each operational tank. After it reaches the last tank, the slurry
gravitates to the carbon safety screen to recover fine carbon particles from the tailings and minimize
associated gold losses.
The carbon safety screen undersize flows into the CIP tailings pump box and is pumped to the cyanide
destruction circuit. The pump box is equipped with two slurry pumps (one in operation and one stand-by).
Each day, the lead CIP tank is taken off-line and 50% of the tank contents is transferred to the loaded
carbon screen via a recessed impeller centrifugal pump. One carbon transfer is planned daily and is done
in two hours. The carbon batch is 10 t. The next day, the remaining 50% tank contents are transferred to
the loaded carbon screen via a recessed impeller centrifugal pump.
The loaded carbon screen is located in the acid wash and elution area. New carbon is added into the circuit
after being screened on the carbon sizing screen located after and below the reactivation kiln and directed
to the correct tank by the carbon distribution box.
17.2.4 Cyanide Destruction and Final Tailings
The cyanide destruction and tailings area comprise the equipment required for tailings detoxification, final
tailings collection and pumping to the Tailings Management Facility (“TMF”).
17.2.4.1 Cyanide Destruction
The cyanide destruction circuit consists of two agitated reactors, operating in parallel. The tailings from the
CIP circuit are pumped to a sampler on top of the cyanide destruction tank where the feed to the circuit is
sampled.
The SO2/air process is used to reduce weak acid dissociable cyanide concentration (CNWAD) in the tailings
slurry to less than 10 mg/L. Liquid SO2 and gaseous oxygen are injected at the bottom of the reactors and
NI 43-101 Technical Report Feasibility Study Update Hardrock Project, Ontario, Canada
Section 17 January 2021 Page 17-16
dispersed by an inverted cone diffuser. Dissolved oxygen is measure in each reactor, with the output used
to control the oxygen addition to maintain a concentration of 4 mg/L. Copper sulfate is used as a catalyst
for the reaction and is added to the slurry in a liquid form at a 20% concentration. About 20 mg/L of Cu ions
are required nominally (40 mg/L design). Lime is added to control the pH of the reaction to approximately
8.5.The CNWAD concentration is measured in the feed and SO2 is added at a ratio between 4.5:1 and 5:1.
The CNWAD concentration is also measured in each reactor to ensure the target of 10 mg/L is achieved.
The residence time required achieve the desired extent for the reaction is 60 minutes. Total retention time
of 138 minutes is provided. If one tank is offline, desired discharge limits can still be met with available
60 minutes retention time in a single tank. Cyanide destruction is carried out at a slurry density of
approximately 55% solids to minimize the volume of water pumped to the TMF.
17.2.4.2 Final Tailings
The cyanide destruction reactors overflow to the tailings pumpbox. The pumpbox also collects various
tailings streams from the process, including sump pumps. Reclaim water is added to the pumpbox when
the plant throughput is low to maintain adequate fluid velocity in the tailings pipeline.
The tailings pumpbox discharge is pumped by two parallel pump trains of three pumps installed in series
(one train in operation and one train on stand-by) pumping the tailings to the TMF.
The tailings pipeline is separated into two sections to fulfill the pressure requirements, with two pumps in
series at the process plant. A leak detection system will be installed on the HDPE pipeline and there will be
a spigotting system at the TMF end to distribute tailings.
17.2.5 Acid Wash, Elution and Carbon Regeneration
The objective of the circuit is to elute or strip adsorbed gold from the carbon into a solution feeding the
electrowinning circuit, where gold is deposited onto cathodes, washed off and smelted. Eluted or stripped
carbon is regenerated and returned to the CIP circuit. Fresh carbon is conditioned and mixed with the
regenerated carbon. The circuit is batch operated with a 10 t capacity.
17.2.5.1 Carbon Acid Wash and Elution
Loaded carbon from the CIP circuit is pumped to the loaded carbon screen located above the acid wash
column. When a carbon batch is transferred, the screen oversize containing the loaded carbon flows into
the acid wash column. Screen undersize gravity flows to the CIP feed launder.
NI 43-101 Technical Report Feasibility Study Update Hardrock Project, Ontario, Canada
Section 17 January 2021 Page 17-17
The acid wash step removes scale and some adsorbed metals that collect onto the activated carbon during
the adsorption process. A dilute hydrochloric acid solution (3% HCl) is circulated through the column to
remove these impurities. The acid wash waste solution is pumped to the cyanide detoxification distribution
box.
The acid washed loaded carbon is transferred to the elution column where adsorbed gold and other metals
are stripped using the pressure Zadra process. A heated diluted caustic (1.0% NaOH) and cyanide
(0.1% NaCN) solution is prepared in the elution solution tank and is circulated through the column to strip
the carbon at a temperature of 140oC. Solution is heated through a natural gas heater. A carbon elution
cycle is completed within eight to twelve hours.
17.2.5.2 Carbon Regeneration
Eluted carbon is transferred to the eluted carbon dewatering screen. The dewatered carbon feeds the
regeneration kiln. The water and the fine carbon that pass through the screen are recovered in the carbon
water tank. The water is reused as transfer water while the carbon fines are filtered using a filter press and
is collected into fine carbon bags.
The natural gas-fired kiln heats the carbon to a temperature of 750°C. At this temperature and under a
slightly oxidizing atmosphere, fouling organics are removed. The reactivated carbon exits the kiln, is
quenched in a tundish and flows over sizing screen where fine carbon is removed to the carbon fines system
and screen oversize is transported into one of four carbon quench tanks (20 t capacity). Newly conditioned
carbon is used to make-up for fine carbon losses and is agitated in a separate tank prior to addition to the
CIP. When required (usually every 2 days), a carbon batch is transferred to the CIP circuit.
17.2.6 Electrowinning and Smelting
Gold from the pregnant solutions (gravity concentrate leaching and elution) is recovered onto the cathodes
in the electrowinning circuit. The electrowinning gold sludge is recovered and smelted into doré bars in the
refinery.
17.2.6.1 Electrowinning
Pregnant solution from the gravity concentrate leaching is pumped to its dedicated electrolyte tank located
in the electrowinning area. The electrolyte solution is circulated between the gravity electrowinning cell and
the electrolyte tank.
NI 43-101 Technical Report Feasibility Study Update Hardrock Project, Ontario, Canada
Section 17 January 2021 Page 17-18
The pregnant solution from the elution circuit is transferred to a flash tank to cool the solution prior to being
split between two electrowinning cells operating in parallel.
Gold sludge is washed from the cell cathodes into the cathode wash pumpbox and is pumped to the plate
and frame sludge filter press. The barren solution from the cells flows by gravity to the elution circulation
tank. The sludge filter filtrate is recirculated to the sludge settling tank and recirculated back to the sludge
filter.
17.2.6.2 Smelting
The gold sludge is dried in the oven in preparation for smelting. Dried sludge is transferred to the mixer
where refining fluxes are added. The mixture of sludge and fluxes is fed to the gas-fired furnace where the
slag material is separated from the gold as the doré bars are poured.
17.2.7 Gas and Reagents
The process plant includes a compressed air system and oxygen supply system as well as various reagents
offloading, preparation and storage equipment.
17.2.7.1 Compressed Air
The compressed air system is composed of three air compressors (two operating, one on stand-by). The
compressed air is stored in two air receivers with an air dryer between them. Compressed air is produced
at 690 kPa. A first distribution loop provides the instrument air while a second delivers compressed air to
the various equipment requiring compressed air (filters, vents, dust suppression systems, etc.).
17.2.7.2 Oxygen (O2)
The oxygen requirements for leaching and cyanide destruction are met by an on-site, over-the-fence
vacuum pressure swing adsorption (“VPSA”) plant. The VPSA plant is a packaged unit installed outside the
plant, adjacent to the leach tanks. Two liquid oxygen tanks (total 100 t or 4 days consumption at design
rate) are also installed on site as a back-up source of oxygen.
17.2.7.3 Cyanide (NaCN)
Cyanide is delivered in isotainers (or equivalent) containing 18 t of solid NaCN briquettes. Up to four
isotainers can be stored in the process plant, providing about nine days of storage at 27,000 t/d plant
NI 43-101 Technical Report Feasibility Study Update Hardrock Project, Ontario, Canada
Section 17 January 2021 Page 17-19
throughput. Water is added to the preparation tank and the solution is circulated between the tank and the
isotainer until complete dissolution of the briquettes. The preparation tank is equipped with an immersion
heater to aid in mixing by warming the mix solution. The water addition is controlled in order to produce a
30% NaCN concentration solution. The live volume of the preparation tank is 57 m3, which is the equivalent
of an isotainer batch.
The storage tank is 57 m3 and contains one mixed isotainer batch; it is equipped with two distribution pumps
(one in operation and one on stand-by). Cyanide solution is distributed to the gravity concentrate leaching
circuit, the leach circuit and the elution circuit.
17.2.7.4 Caustic (NaOH)
Caustic is delivered by 28 t bulk tanker truck, in liquid form at a 50% solution concentration. The solution is
transferred to the storage tank, which can hold the contents of approximately one and a half tanker trucks.
The onsite storage capacity is a live volume of 26 m3 and is sufficient to last about one week at 27,000 t/d
plant throughput. Since the caustic users are all intermittent (cyanide preparation, elution circuit and gravity
concentrate leaching), only one distribution pump is required.
17.2.7.5 Quicklime (CaO)
Pulverized quicklime is received in bulk. It is transferred to a 263 t capacity silo which provides four days of
storage at 27,000 t/d plant throughput. Dry lime is fed to the slaker via a screw feeder. Water is added to
the slaker to produce hydrated lime slurry. The hydrated lime production rate closely matches the
consumption rate to ensure the slaker operates as continuously as possible.
The slaker discharges onto the vibrating grits screen that removes oversize particles from the lime slurry.
The slurry gravity flows into the pumpbox where it is further diluted to produce 20% lime slurry. The lime
pumpbox is equipped with two transfer pumps (one operating, and one stand-by). The transfer pump pumps
to a storage tank from which there are two distribution pumps (one operating, and one stand-by). The lime
distribution header is in closed-loop with the storage tank. Hydrated lime addition points include the ball mill
circuit, the leach circuit and the cyanide destruction circuit.
17.2.7.6 Flocculant
Flocculant is received in a powder form in bulk bags. The bags are unloaded to a hopper and a screw
feeder transfers the flocculant to an eductor to the mix tank to a 0.5% concentration solution. The storage
NI 43-101 Technical Report Feasibility Study Update Hardrock Project, Ontario, Canada
Section 17 January 2021 Page 17-20
tank is located below the mixing tank and the transfer is done via a valve once the mixing is complete. The
flocculant is metered to the thickener by two dosing pumps (one operating, and one stand-by).
17.2.7.7 Hydrochloric Acid (HCl)
Hydrochloric acid is delivered by 22 t bulk tanker trucks as a 33% concentrated solution. It is unloaded to a
storage tank that has the capacity to hold one and a half truck delivery and holds about 12 days storage at
27,000 t/d plant throughput. The HCl is distributed to the acid wash and elution circuit using a single pump.
17.2.7.8 Copper Sulfate (CuSO4·5H2O)
Copper sulfate pentahydrate is received in 500 kg bulk bags. Bulk bags are lifted by hoist into the hopper
equipped with a bag breaker from where it flows to the mixing tank where water is added to make a 20%
concentration solution. The copper sulfate storage tank is located adjacent to the mixing tank and the
transfer is done via a transfer pump once a batch is complete. Both tanks have a live capacity of 19 m3,
about 23 hours storage at 27,000 t/d plant throughput. Two distribution pumps are installed (one operating,
and one stand-by) to transfer copper sulfate to its addition point in the cyanide detoxification distribution
box.
17.2.7.9 Sulphur Dioxide (SO2)
Liquid Sulphur dioxide is delivered by a 30 t bulk tanker truck. It is transferred to two 50 t capacity pressure
vessel storage tanks equipped with a padding air system to maintain the sulphur dioxide in liquid form. The
two storage tanks provide approximately 8 days of storage at 27,000 t/d plant throughput. Sulphur dioxide
is metered to the cyanide detoxification circuit in gas form. A vent system is included in the sulphur dioxide
addition piping to vent any vaporized sulphur dioxide into the cyanide detoxification tanks.
17.2.7.10 Antiscalant
Antiscalant is received in a liquid form in 1 m3 ISO containers. Containers will be directly fitted with pumping
systems from where it is pumped to the process. Antiscalant is added in the gravity concentrators’ water
lines, the elution solution tank, the process water tank and the reclaim water tank.
17.3 Mass and Water Balance
A detailed mass balance was developed for the process plant to track all flows in and out of the process
equipment.
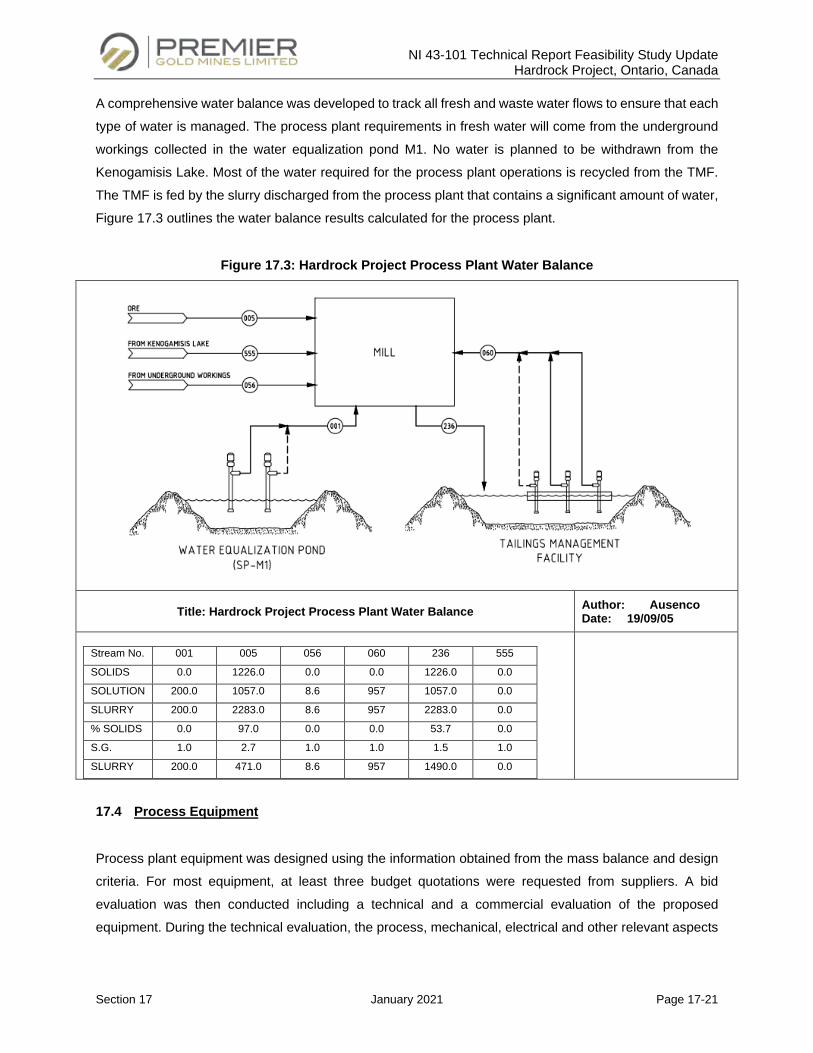
NI 43-101 Technical Report Feasibility Study Update Hardrock Project, Ontario, Canada
Section 17 January 2021 Page 17-21
A comprehensive water balance was developed to track all fresh and waste water flows to ensure that each
type of water is managed. The process plant requirements in fresh water will come from the underground
workings collected in the water equalization pond M1. No water is planned to be withdrawn from the
Kenogamisis Lake. Most of the water required for the process plant operations is recycled from the TMF.
The TMF is fed by the slurry discharged from the process plant that contains a significant amount of water,
Figure 17.3 outlines the water balance results calculated for the process plant.
Figure 17.3: Hardrock Project Process Plant Water Balance
Title: Hardrock Project Process Plant Water Balance Author: Ausenco Date: 19/09/05
Stream No. 001 005 056 060 236 555
SOLIDS
0.0 1226.0 0.0 0.0 1226.0 0.0
SOLUTION
200.0 1057.0 8.6 957 1057.0 0.0
SLURRY
200.0 2283.0 8.6 957 2283.0 0.0
% SOLIDS 0.0 97.0 0.0 0.0 53.7 0.0
S.G.
1.0 2.7 1.0 1.0 1.5 1.0
SLURRY
200.0 471.0 8.6 957 1490.0 0.0
17.4 Process Equipment
Process plant equipment was designed using the information obtained from the mass balance and design
criteria. For most equipment, at least three budget quotations were requested from suppliers. A bid
evaluation was then conducted including a technical and a commercial evaluation of the proposed
equipment. During the technical evaluation, the process, mechanical, electrical and other relevant aspects
NI 43-101 Technical Report Feasibility Study Update Hardrock Project, Ontario, Canada
Section 17 January 2021 Page 17-22
were analyzed to determine if the equipment complied with the specifications. The commercial evaluation,
in turn, was made considering the budget price of the equipment, the transportation cost and the delivery
lead time. The selected bidder was determined for each piece of equipment by combining the technical and
commercial recommendations.
17.5 Cyanide Management
The International Cyanide Management Institute (“ICMI”) was established for the purpose of administering
the "International Cyanide Management Code for the Manufacture, Transport and Use of Cyanide in the
Production of Gold" (ICMI Code), and to develop and provide information on responsible cyanide
management practices and other factors related to cyanide use in the gold mining industry. Throughout the
design of the process plant, ICMI Code requirements were considered, to allow a third party to confirm
compliance if necessary.
17.6 Power Requirements
The power requirement was determined for the process plant using the power demand indicated by the
selected equipment supplier. The annual power consumption for the mill and ancillaries is estimated to be
299.1 GWh at 27,000 t/d.
17.7 Plant Layout
17.7.1 Process Plant Location
The process plant site is located southwest of the open pit. The site main entrance is on the South west
end to allow for a connection to Highway 11. The natural gas power plant location is on the eastern side of
the process plant and other infrastructures in consideration of the prevailing winds.
17.7.2 Building Architecture
All buildings designed for the process plant, including crushing and transfer towers, are planned to be
covered with pre-assembled insulated wall and roof panels to reduce construction time and workforce on
site.
A National Building Code study was conducted to ensure appropriate emergency and safety requirements
are met in terms of design and construction methods (fireproof staircases, etc.). The National Building Code
NI 43-101 Technical Report Feasibility Study Update Hardrock Project, Ontario, Canada
Section 17 January 2021 Page 17-23
study also confirmed that the requirements for the buildings which house workers were met (toilets, wall
composition, travel spaces, office arrangements, etc.).
17.7.3 Heating, Ventilation and Air Conditioning (HVAC)
The mill building, crushing areas, and the ore storage dome tunnel and administration building are heated
with a water/glycol mix system having 50% / 50% proportions to prevent freezing. The glycol mix
temperature will be 85°C for the heating distribution circuit with a 55°C return temperature. The system is
designed to heat the functional spaces and the heating load of the ventilation created by thirteen make-up
air units (5 for the process plant, seven for the crushing, COS and HPGR building and one for the ore
reclaim tunnel).
A primary/secondary system type is selected. This type of system allows a separation of the heat generation
equipment installed in the power plant from the heat distribution equipment in the process plant (circulation
pumps, manifolds expansion tank, pressurized glycol tank, etc.). The estimated capacity of the water/glycol
heating system for the process plant is 33,000,000 BTUH (9,663 kW).
The ventilation system was designed considering the different functions of the areas in the mill building;
four functional areas were created to meet the specific needs. These areas are the following:
• Ventilation, heating and cooling of the mill building work areas;
• Ventilation, heating, and cooling (refrigerant based) of the offices;
• Ventilation and cooling of compressor and other mechanical rooms;
• Cooling of electrical rooms.
17.7.4 Fire Protection
The fire protection water reserve will be in the freshwater tank located at the process plant. A dedicated
portion of this tank is exclusively available for fire protection water, sized according to the largest consumer
building.
Water sprinkler systems will be installed for the administration offices, the electrical and mechanical shops,
as well as the process plant areas that have been identified as a fire hazard (conveyors, hydraulic units,
etc.). Fire protection cabinets containing water hoses and portable extinguishers will also be installed
throughout the plant. The electrical room will be protected by an inert gas system. For unheated conveyor
galleries, fire protection will be provided by dry-pipe sprinkler system.
NI 43-101 Technical Report Feasibility Study Update Hardrock Project, Ontario, Canada
Section 17 January 2021 Page 17-24
17.7.5 Electrical Distribution
Power to Process Plant shall be supplied from onsite Power Plant at 13.8 kV.
The Power Plant will consist of seven gas fired engine generating units in N+2 configuration. With seven
units of 9.7 MW each, the maximum power generation capacity is 48.5 MW, one unit hot standby and one
unit may be in maintenance. The availability of Power Plant will be 100% excluding a major fault at main
supply switchgear or power plant control system failure, both of which are very rare.
Breakers at Power Plant Main Switchgear will supply power (1,200 A) to 13.8 KV/4.16 KV and
13.8 KV/600 V dry type stepdown transformers installed inside modular, pre-fabricated and pre-assembled
Electrical Rooms (E-rooms). The E-rooms will house the medium and low voltage MCCs, lighting & services
transformers, instrumentation transformers, VFDs, soft-starters, etc. to distribute power to the Dry End
equipment including Crushers and HPGR, Ball Mills, Process Plant, etc.
The Power plant will also supply 13.8 kV Overhead Power Lines to outlying pumping stations, shops and
service buildings.
An Isolation Transformer will be provided for overhead line feeders to provide a grounded wye on the
secondary, isolating it from the grounded wye system of power plant for grounding detection and
coordination.
17.7.6 Control System
The process control system will be a dedicated, microprocessor based, scalable, deterministic, control
system with the ability to monitor and control centrally and remotely. It will be a PLC/SCADA solution and
referred to as the Process Control System (“PCS”). Touch screens of 7” size and larger are used for local
operator interface (HMI).
The plant control network architecture will use Ethernet protocol for input/output (“I/O”) control,
Modbus / TCP or Ethernet IP for motor control, switchgear and connection to vendor packages.
Communications between the PLC and HMI, and PLC to PCS will be Ethernet TCP/IP. Communications to
MCC’s and VFD’s will be Ethernet based. PLC’s supplied with package equipment, fully interface with the
PCS, using standard protocols, for the purpose of monitoring and remote control from the PCS operator’s
consoles.
NI 43-101 Technical Report Feasibility Study Update Hardrock Project, Ontario, Canada
Section 17 January 2021 Page 17-25
Remote I/O wiring will be available through project approved terminal blocks. If I/Os need to be powered,
this shall be done through terminal boards with individual fuses. All package Vendors will recommend a list
of monitor and control interface signals for communicating with the Owner's Process Control System, as
well as a list of the hardwired signals required between vendor PLC and plant PCS. Termination points
and/or data link devices will be provided for easy Owner hook-up.
All instruments and control equipment information connected to local PLC’s will be available through a
communication link to the PCS. All controls and alarm switches will be ‘Fail Safe (i.e., an abnormal condition
shall cause a loss in output signal). Upon loss of power, control circuits and alarms will go to the “fail safe”
condition. Solenoid valves and actuating relays will be normally energized and shall de-energize on
protective action or alarm.
NI 43-101 Technical Report Feasibility Study Update Hardrock Project, Ontario, Canada
Section 18 January 2021 Page 18-1
PROJECT INFRASTRUCTURE
18.1 General
This section describes the infrastructure and service facilities required to support the Project’s mining and
processing facilities such as power generation, roads, water and tailings management, camp, mine
equipment maintenance shops (truck shop), warehouses, information technology (“IT”) systems,
laboratories and offices, diesel fuel and the natural gas distribution pipeline.
18.2 Tailings Management
Wood performed specialized geotechnical and hydrologic engineering services for the design of the Tailings
Management Facility (“TMF”) for the Project, including geotechnical site investigations, tailings deposition
planning, and design of the tailings dams and ancillary hydraulic structures.
Tailings impoundment at the TMF is affected by construction of mainly perimeter embankment dams.
Embankment dams will be primarily constructed out of mine rock. The upstream slopes of the dams will be
provided with low permeability compacted glacial till core keyed into relatively low permeability foundation
soils. Where the low permeability foundation units are deeper and/or water table is too close to surface, a
Cement Bentonite slurry wall will be provided keyed into the low permeability foundation soils. The till core
and foundation slurry wall serve as a low permeability element to mitigate dam body and foundation
seepage.
The TMF site was selected based on a balance of environmental, social, economic and operational risk
considerations. Prior to construction of the TMF, Goldfield Creek (“GFC”) will be diverted around the north
side of the ultimate TMF footprint and into a permanent channel designed to provide fisheries
compensation. The TMF is set back from other waterbodies by an environmental buffer width of
approximately 125 m.
The TMF dams have been designed to meet the requirements of the Lakes and Rivers Improvement Act
(MNR, 2011) and the Canadian Dam Association guidelines (CDA, 2014). Filter and transition zones are
provided downstream of the till core and between the foundation soils and rockfill embankment to protect
against piping of fines into the rockfill due to seepage forces. The rockfill embankment is constructed of
geochemically benign mine rock.
Brief descriptions of each component considered during the TMF design are provided in the subsections
below. For detailed information, please refer to the following documents.
NI 43-101 Technical Report Feasibility Study Update Hardrock Project, Ontario, Canada
Section 18 January 2021 Page 18-2
• 2019 Geotechnical Investigation Report for Tailings Management Facility and Construction Material
Borrow Areas – December 2019;
• Goldfield Creek Diversion Dyke Design Report – November 2018;
• Tailings Management Facility Design Report – December 2018;
• Tailings Management Facility Dams Till Core Deformation Analysis – April 2019; and
• Varved Clay Liquefaction Analyses memo- September 2019.
18.2.1 Geotechnical Subsurface Investigations
In the early stages of the Project assessment, geotechnical investigations were carried out in the TMF area
by Stantec for environmental and hydrogeological baseline data. Wood carried out the subsurface
characterization of the TMF dam footprint geotechnical investigations from 2014 to 2019. The investigations
also included search for sand and gravel filter material and glacial till core required for the dam construction.
Generally, the boreholes penetrated 15 m into bedrock before termination. Piezometers/monitoring wells
were installed in the boreholes at various depths to facilitate groundwater monitoring and testing. Standard
Penetration Tests (“SPT”) were carried out in the overburden at regular depth intervals in the boreholes.
Soil samples were collected from the boreholes and test pits. The soil samples were tested in a geotechnical
laboratory for various index properties such as particle size distribution, Atterberg limits and moisture
content, monotonic simple shear, cyclic direct simple shear, consolidation, and direct shear testing were
completed on undisturbed soil samples (extracted using thin wall sampling tubes) of the fine-grained
overburden soils.
Overburden hydraulic conductivity values for soils in the TMF dam footprint were estimated using results
from rising head slug testing on screened intervals of foundation soil from selected piezometer/monitoring
wells. Bedrock hydraulic conductivity values were estimated using rising and falling head and constant head
test methods from continuous single packer testing in bore holes in the TMF area.
The Quaternary stratigraphy at the TMF consists of four major stratigraphic units based on lithology,
depositional environment, and relative stratigraphic position. In order from oldest to most recent these are:
Glacial Till, Glaciofluvial (sand and gravel), Glaciolacustrine (sands, silts, clays), and recent deposits
(Eolian, Organics, Fluvial). Isolated pockets of sand and gravel were also encountered below the glacial till
in the southwest dam close to the downstream toe that were likely deposited prior to the last glaciation.
Glaciolacustrine deposits of silt interbedded with thin clay layers (typically 1 mm to 10 mm in thickness)
were generally encountered underlying the upper sand to silt deposits in the low-lying areas of the
foundations at all dam sections, with the exception of the North Dam. These units are hereby referred to as
NI 43-101 Technical Report Feasibility Study Update Hardrock Project, Ontario, Canada
Section 18 January 2021 Page 18-3
“Varved Clays”. The groundwater table was found to vary from near surface to about 3.5 m below ground
surface in the TMF area. Bedrock encountered was generally good to excellent quality based on RQD
measurements.
18.2.2 Design Criteria
Operation of the Hardrock Mine will result in approximately 140 Million tonnes (“Mt”) of tailings from an
industry standard crush, grind, leach gold extraction process. A cyanide destruction system will be used to
process all water sent to the TMF impoundment area. An allowance for an additional 5 Mt of reclaimed
historical tailings has been made in the design criteria for a total capacity of 145 Mt.
In accordance with LRIA Hazard Potential Classification (“HPC”) the TMF perimeter dams have been
classified as having ‘Very High’ hazard potential. This classification is based on the potential environmental
impacts in the event of a catastrophic failure. The starter dam is designed at 11 m high with the ultimate
dam raised to a maximum section height of 35 m.
Dam design criteria include storage for the Environmental Design Flood (“EDF”) defined as a 100-year
return hydrologic event (24-hour storm or 30 day spring freshet) with no discharge through the spillway. An
emergency spillway will be maintained to safely pass the Inflow Design Flood (“IDF”) consisting of a routed
Probable Maximum Flood (“PMF”) of 24-hour duration. The dams are designed for seismic events of
1:10,000 year (Maximum Credible Earthquake).
Tailings will be deposited in the TMF by conventional tailings slurry method of deposition during Mine
operations. This method provides flexibility for flooding of the deposited material at closure should it be
required to achieve geochemical stability of the tailings. Selection of conventional tailings slurry deposition
method includes spigotting of tailings slurry from the perimeter dams to produce a wide exposed beach,
displacing the tailings pond away from the perimeter dams towards natural ground along the western
perimeter. This is designed to enhance dam stability.
18.2.3 Tailings Characteristics
Particle size distribution tests were conducted on two tailings samples. The tailings samples tested consist
of non-plastic hard rock particles and are predominantly silt and sand sized with approximately 75% to 82%
of the particles by mass finer than 0.075 mm diameter (silt and clay sized), out of which 11% to 16% by
mass are clay sized.
NI 43-101 Technical Report Feasibility Study Update Hardrock Project, Ontario, Canada
Section 18 January 2021 Page 18-4
Tailings geochemistry has been evaluated by Stantec which indicate that less than 10% of the ore is
considered potentially acid generating (“PAG”). This amount will be reduced through oxidization during
processing, estimated at 26%, reducing the overall Acid Rock Drainage (“ARD”) potential for the tailings.
18.2.4 Tailings Deposition Plan
Key tailings operating data include:
• Total tailings production: 140 Mt
• Dry density of deposited tailings: 1.34 t/m3 (for short-term planning)
• Total deposited tailings volume: 105 Mm3
The tailings deposition plan involves spigotting tailings from the crest of the embankment dams to produce
a wide beach to enhance dam safety and minimize seepage under or through the dams. The TMF South
Cell has been designed with capacity to hold the tailings for the first year of operation. The South Cell dams
will be raised annually during the first four operational years. During this initial period of four years, a
temporary diversion channel will be maintained to divert freshwater from the North Cell around the TMF
and reduce the quantity of water to be managed and pumped to the process plant. North Cell dams will be
built during the fourth year of operation to facilitate tailings deposition in the north cell during the fifth year
of operation. Thereafter, tailings deposition will alternate between the North and South Cells with deposition
into the North Cell targeted for early completion to facilitate early reclamation and closure. A key objective
of the deposition plan is to maintain the TMF pond against natural ground on the western side of the TMF.
This design will help to mitigate dam safety risks during operations, reduce dam seepage rates, and
facilitate the ultimate closure design for the TMF.
Figure 18.1 shows the general arrangement of the TMF.
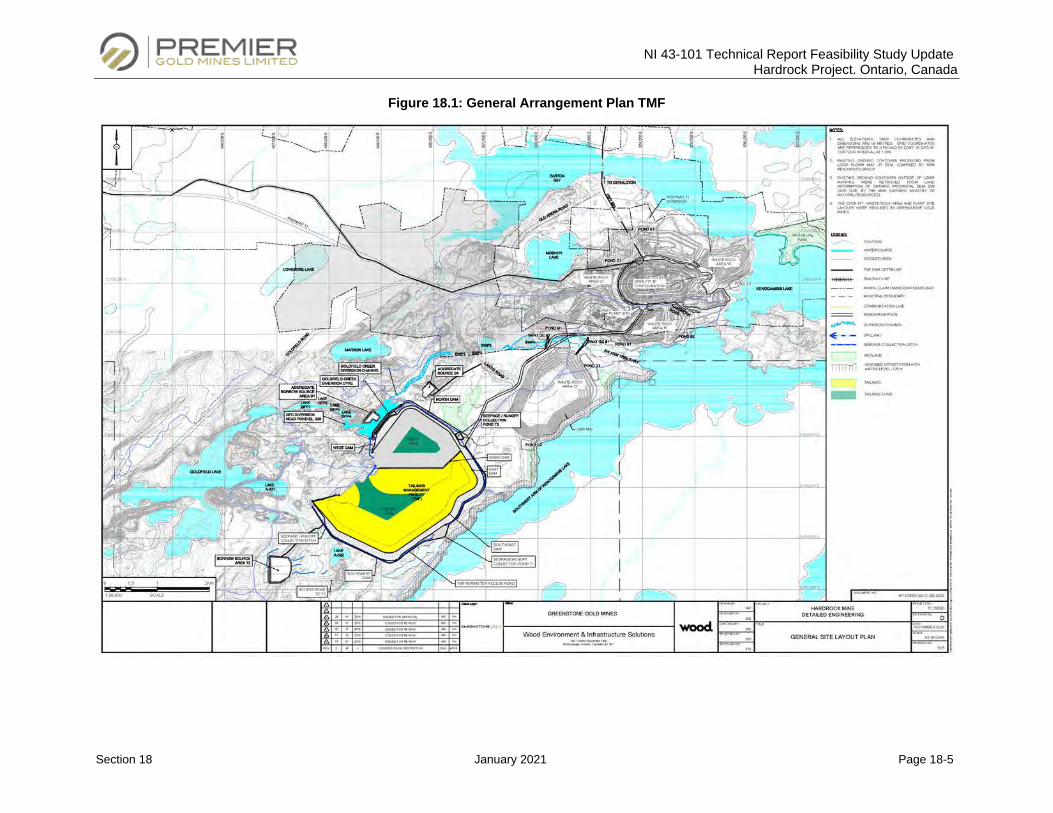
NI 43-101 Technical Report Feasibility Study Update Hardrock Project. Ontario, Canada
Section 18 January 2021 Page 18-5
Figure 18.1: General Arrangement Plan TMF
NI 43-101 Technical Report Feasibility Study Update Hardrock Project, Ontario Canada
Section 18 January 2021 Page 18-6
18.2.5 TMF Water Management
During detailed engineering, a TMF water balance was completed which estimates that the site will have a
positive water balance. Construction of the TMF will be completed in stages to minimize the spread/extent
of the facility. Staged development of the TMF, initially with only one of two cells, will achieve this.
Progressive rehabilitation of the North Cell will take place early in the mine life, thus reducing water
management in the North Cell.
The TMF water balance has been carried out for mill operation on a continuous basis considering
precipitation conditions of 1 in 25 wet year, 1 in 100 wet year, and 1 in 100 dry year. The water balance
indicates that the TMF is expected to supply 92% of the mill makeup water for most of the years of operation.
The balance of 8% is moisture in the ore and freshwater supply required in the mill. Under 1 in 100 dry year
condition, the TMF can supply 65% to 90% of reclaim water to the mill considering the dry years occur in
the initial years of operation. The balance of mill make-up water will be sourced from other ponds within the
project area such as waste rock storage area ponds, and the historical underground workings. The pond
volume expected in the TMF varies from 3 Mm3 for average precipitation conditions to a maximum of 4 Mm3
during 1 in 100 year wet precipitation conditions. The emergency spillway invert levels will be established
at the high-water level corresponding to the EDF event at all stages of operation. This will ensure capacity
to contain the EDF without any discharge to the environment.
During the first four years of operation the South Cell will be used for tailings deposition exclusively. Runoff
in the future North Cell which would have previously reported to GFC will be routed through a temporary
diversion channel to an existing gully to the east leading to Kenogamisis Lake. The remnant GFC runoff
will be separated from the South Cell tailing seepage pond by an inner dam seepage collection dyke built
in the North Cell. From operational Year 5 onwards, connecting transfer spillway channels between the
North and South Cell will allow equalization of pond levels. The mill reclaim pumping system will be located
in South Cell. TMF emergency spillways will be constructed in the North Cell for safe passage of flows from
storm events greater than EDF. The flows will be directed towards the GFC diversion head pond.
18.2.6 TMF Seepage Mitigation and Control
Seepage analyses have been carried out and seepage mitigation measures have been included in the TMF
design. Geotechnical field investigations in the southwest dam identified a thick high permeability layer of
sand/sandy silt overlying low permeability varved clays. To limit seepage, a cement bentonite slurry wall
will be constructed, penetrating the upper sand silts and keyed into the varved clay units.
NI 43-101 Technical Report Feasibility Study Update Hardrock Project, Ontario Canada
Section 18 January 2021 Page 18-7
At the southeast and east dam locations, the thickness of sandy silt units is between 3 and 4 m over the
varved clay units. Excavation of a cut-off trench through this material would be challenging given the depth
of sandy silts and a high, near ground level water table. A cement bentonite slurry wall will be constructed
for these dams. Similar to the Southwest dam, the varved clay units in the valley section of the West dam
are also deep seated under the upper high permeability sand/sandy slit units. Therefore, a cement bentonite
slurry wall has been proposed in parts of West dam. For north dam, parts of West dam and Southwest
dam closer to the abutments a cut-off trench backfilled with compacted till is proposed.
A system of perimeter seepage collection ditches and ponds downstream of the dams will capture seepage
and runoff from the external dam slopes. These perimeter ditches will drain to three seepage collection
ponds located on the perimeter of the TMF namely T1, T2 and T3. The collected seepage will be generally
pumped back into the TMF. In case there is surplus water, which cannot be pumped into the TMF, water
will be treated prior to discharging to the environment.
18.2.7 Dam Design
The following three alternative dam design sections were considered:
• Central low permeability till core abutting compacted waste rock buttresses;
• Compacted waste rock with upstream low permeability liner;
• Compacted waste rock with upstream inclined low permeability till core.
The compacted waste rock with upstream inclined low permeability till core was determined to be the
preferred section. The dams will be downstream raised so that the entire downstream slopes are placed on
a prepared, inspected and approved foundation. Till core deformation analyses has been carried out by
computer modelling and the deformations are noted to be well within the acceptable ranges.
The perimeter dams and inner dam for TMF cell division will be raised in stages depending upon capacity
requirements. Dam foundation preparation, till core, filter construction and approximately 5 m width of mine
rock abutting the till core will be executed by contractors, with the mine rock embankment raised using the
mine fleet.
Stability analyses have been carried out for the TMF perimeter dams under different loading conditions.
This modelling was based on comprehensive characterization of foundation units from geotechnical
investigations during 2018 and 2019. Specific attention was given to the deepest sections of overburden
NI 43-101 Technical Report Feasibility Study Update Hardrock Project, Ontario Canada
Section 18 January 2021 Page 18-8
and critical foundation locations. Varved Clay unit underlying the foundation governed design of the TMF
perimeter dams. Modelling of the final design indicated that all target factors of safety are met.
The dams have been designed considering undrained behavior of varved clay units which require relatively
flatter upstream and downstream slopes with toe stabilizing berms. Post-liquefaction analyses of the
foundation soil units were conducted during design. Overburden characterization based on cone
penetration testing completed in 2015 and 2019 indicated that the varved clay units may liquefy under
seismic loading from the design earthquake. To ensure dam stability under these conditions, longer
downstream toe berms are required. Currently, the starter dams for the south and north cells have been
designed for post-liquefaction conditions. It should be noted that the starter dam configuration designed
for the post-liquefaction scenario involving toe berms is merely additional mine rock placed on the
downstream shell which would otherwise be placed at a later, subsequent stage as a part of dam raising
for intermediate stages of operation.
Liquefaction potential of the varved clays has been subsequently assessed by performing ground response
analyses (SHAKE 2000) to determine the cyclic stress ratio (“CSR”) in the foundation units under the design
earthquake. About 18 cyclic direct simple shear (“CDSS”) tests were carried out on undisturbed varved
clay samples at Carleton University laboratory to estimate the cyclic resistance ratio (CRR) of varved clay
units.
The results of the analyses indicated that the varved clay units have the potential for liquefaction at the dam
toe and the liquefaction zone is limited from the dam toe towards interior up to 1.5 m high rockfill.
Ultimate dams’ stability analyses were updated for the post liquefaction scenario of the varved clays using
post liquefaction strength determined from the CDSS tests. The results indicated that the limited extent of
varved clay liquefaction did not have any impact on the current ultimate dam design sections. Therefore,
no changes are required for the ultimate dam design.
The objectives of dam foundation preparation are to ensure stability of dams and manage seepage through
the foundations. To prevent piping of fine soil particles in the rockfill, foundation filters are provided under
the upstream dam shells, further improving dam stability.
Foundation treatments include removal of organics and unsuitable materials. In deeper overburden areas,
excavation of seepage cut-off trenches complete with cement bentonite slurry walls are designed. Over
fractured bedrock outcrops compacted till will be placed to mitigate seepage.
NI 43-101 Technical Report Feasibility Study Update Hardrock Project, Ontario Canada
Section 18 January 2021 Page 18-9
A TMF Dam inspection and monitoring program will be employed during construction and operation of the
TMF Dams to assess the performance and safety and to verify that actual conditions are consistent with
the design considerations. Instrumentation will include vibrating wire piezometers in foundation units and
till core, inclinometers to measure deformations, surveying of dam crests, and magnetic settlement system
to monitor differential settlements.
18.2.8 TMF Dam Raising Schedule
Figure 18.2 shows the struck-level capacity curve for the TMF with dam raising schedule for each year of
operation.
The crest level of the dam is determined from required tailings capacity. The tailings discharge elevations
at each stage of TMF operation will be 0.3 to 0.5 m below the dam crest at each stage. The emergency
spillway invert level for each stage dam is set based on the storage requirement to contain the EDF. The
emergency spillways will safely pass the PMF with adequate freeboards to the dam crest and till core.
The still water level in tailings pond during passage of PMF will be minimum 2.6 m below the till core level.
Maximum expected wave heights for the design wind condition during PMF will be 1.1 m providing a clear
freeboard of 1.5 m during the passage of PMF.
18.2.9 Closure Considerations
Closure of the TMF involves lowering of the spillways and re-vegetation of the exposed beaches. Runoff
will be directed through overflow spillways constructed in natural ground when deemed suitable for
discharge to the environment.
18.2.10 Construction Borrow Materials
The Till borrow source area has been identified and is located in the high ground south of Goldfield Lake.
Glacial till deposits underlay a thin organics layer (0.1 to 0.5 m thick) and are predominantly fine grained till
varying in composition from silty sand to sandy clayey silt. The till contains trace gravel with cobbles and
boulders. The indicated maximum thicknesses of the identified till borrow area is 21 m.
Two sand and gravel borrow sources have been identified within the Project area. Both borrow areas S1
and S4 are located close to the northern perimeter of the TMF. These gravel borrow sources will be used
for roads around the TMF and some for dam filters. Finally, to complete sand quantities for dam filters other
local borrow pits have been identified and quality and quantities have been confirmed.
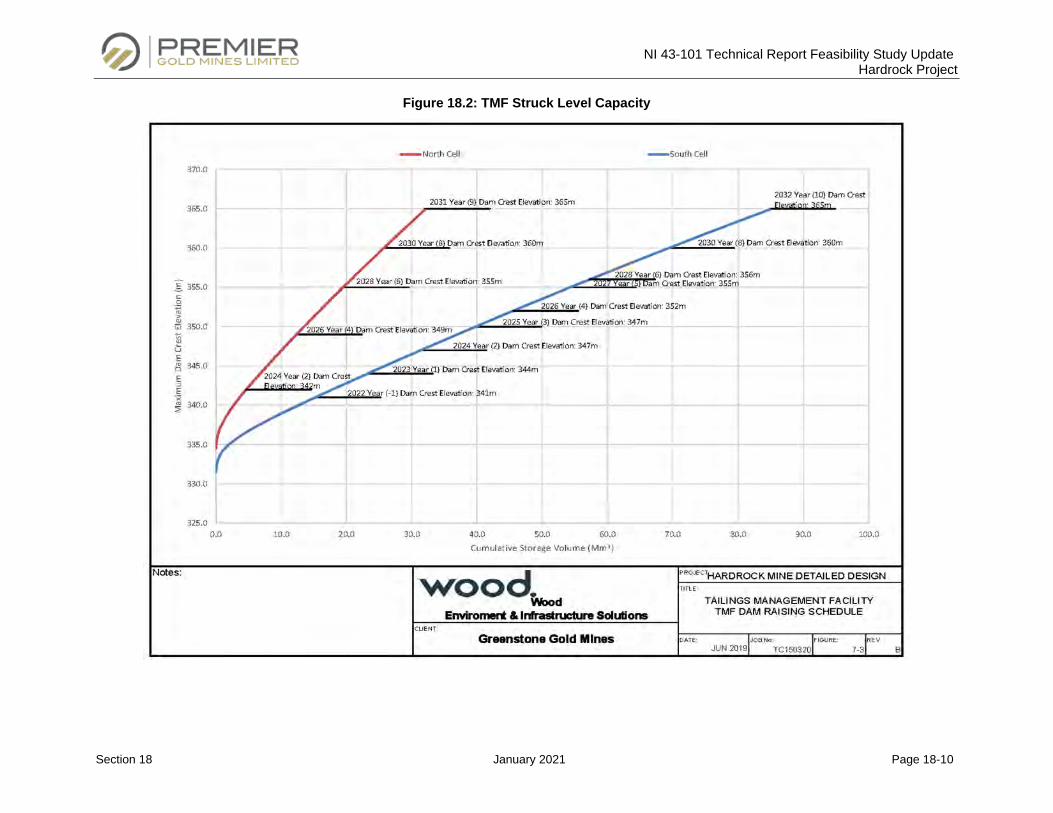
NI 43-101 Technical Report Feasibility Study Update Hardrock Project
Section 18 January 2021 Page 18-10
Figure 18.2: TMF Struck Level Capacity
NI 43-101 Technical Report Feasibility Study Update Hardrock Project
Section 18 January 2021 Page 18-11
18.3 Goldfield Creek Diversion
Wood has provided design and permitting support services for the proposed diversion of Goldfield Creek,
a small watercourse that currently drains through the proposed TMF footprint into the Southwest Arm of
Kenogamisis Lake. Services include geotechnical site investigations, design of the channel components,
design of the access road and haul road crossings, and provincial and federal permitting associated with
the diversion. The diversion alignment was selected based on a balance of environmental, social, economic
and operational risk parameters. The diversion is required to direct flows of the existing Goldfield Creek
away from the proposed TMF area. This will be achieved through a combination of natural channel design
and engineered structures to contain and or direct the natural flows into the existing Southwest Arm
Tributary drainage, which also reports to the Southwest Arm of Kenogamisis Lake.
Section A: A Goldfield Creek Diversion Pond (19.17 hectares) (3) will be developed through construction
of the Goldfield Creek Diversion Dyke (2). The pond will attenuate natural flows from the creek and convey
them into the new diversion channel, Section B.
Section B: A realigned channel, similar to the existing Goldfield Creek, will be developed in an existing
valley feature that measures approximately 1,600 m in length. A low flow meandering channel (4), about
2,600 m long, designed using natural channel design principles will convey flows to the beginning of the
Southwest Arm Tributary.
Section C: The existing Lahti’s Road crossing (5) and the channel downstream of the crossing to the next
pond (SWP3) will be reconstructed to accommodate the increased flows associated with the diversion.
Lahti’s Road crossing will be designed to convey a minimum of a 25-year hydrologic event.
Section D: To accommodate the increased flows, two permanent valley-wide grade controls (6) will be
constructed to create slow-moving ponded water conditions. This will replace the fluvial characteristics of
the watercourse with those of a low energy pond system, thereby minimizing risk of channel erosion. Within
this section, between the two grade controls, a haul road crossing will be constructed to facilitate traffic
between the plant site and the TMF. The haul road crossing has been designed to pass the 100-year
hydrologic event.
Section E: No changes necessary in this area as the channel is under the existing backwater effect of the
lake and is wide enough to accommodate the increased flow.
Figure 18.3 shows the general arrangement of the Goldfield Creek Diversion in relation to the TMF and
other site features. The diversion can be described by discrete sections (A through E) and features
(numbers 1 through 7) as shown in Section A: A Goldfield Creek Diversion Pond (19.17 hectares) (3) will
NI 43-101 Technical Report Feasibility Study Update Hardrock Project
Section 18 January 2021 Page 18-12
be developed through construction of the Goldfield Creek Diversion Dyke (2). The pond will attenuate
natural flows from the creek and convey them into the new diversion channel, Section B.
Section B: A realigned channel, similar to the existing Goldfield Creek, will be developed in an existing
valley feature that measures approximately 1,600 m in length. A low flow meandering channel (4), about
2,600 m long, designed using natural channel design principles will convey flows to the beginning of the
Southwest Arm Tributary.
Section C: The existing Lahti’s Road crossing (5) and the channel downstream of the crossing to the next
pond (SWP3) will be reconstructed to accommodate the increased flows associated with the diversion.
Lahti’s Road crossing will be designed to convey a minimum of a 25-year hydrologic event.
Section D: To accommodate the increased flows, two permanent valley-wide grade controls (6) will be
constructed to create slow-moving ponded water conditions. This will replace the fluvial characteristics of
the watercourse with those of a low energy pond system, thereby minimizing risk of channel erosion. Within
this section, between the two grade controls, a haul road crossing will be constructed to facilitate traffic
between the plant site and the TMF. The haul road crossing has been designed to pass the 100-year
hydrologic event.
Section E: No changes necessary in this area as the channel is under the existing backwater effect of the
lake and is wide enough to accommodate the increased flow.
Figure 18.3, and described as follows:
Section A: A Goldfield Creek Diversion Pond (19.17 hectares) (3) will be developed through construction
of the Goldfield Creek Diversion Dyke (2). The pond will attenuate natural flows from the creek and convey
them into the new diversion channel, Section B.
Section B: A realigned channel, similar to the existing Goldfield Creek, will be developed in an existing
valley feature that measures approximately 1,600 m in length. A low flow meandering channel (4), about
2,600 m long, designed using natural channel design principles will convey flows to the beginning of the
Southwest Arm Tributary.
Section C: The existing Lahti’s Road crossing (5) and the channel downstream of the crossing to the next
pond (SWP3) will be reconstructed to accommodate the increased flows associated with the diversion.
Lahti’s Road crossing will be designed to convey a minimum of a 25-year hydrologic event.
Section D: To accommodate the increased flows, two permanent valley-wide grade controls (6) will be
constructed to create slow-moving ponded water conditions. This will replace the fluvial characteristics of
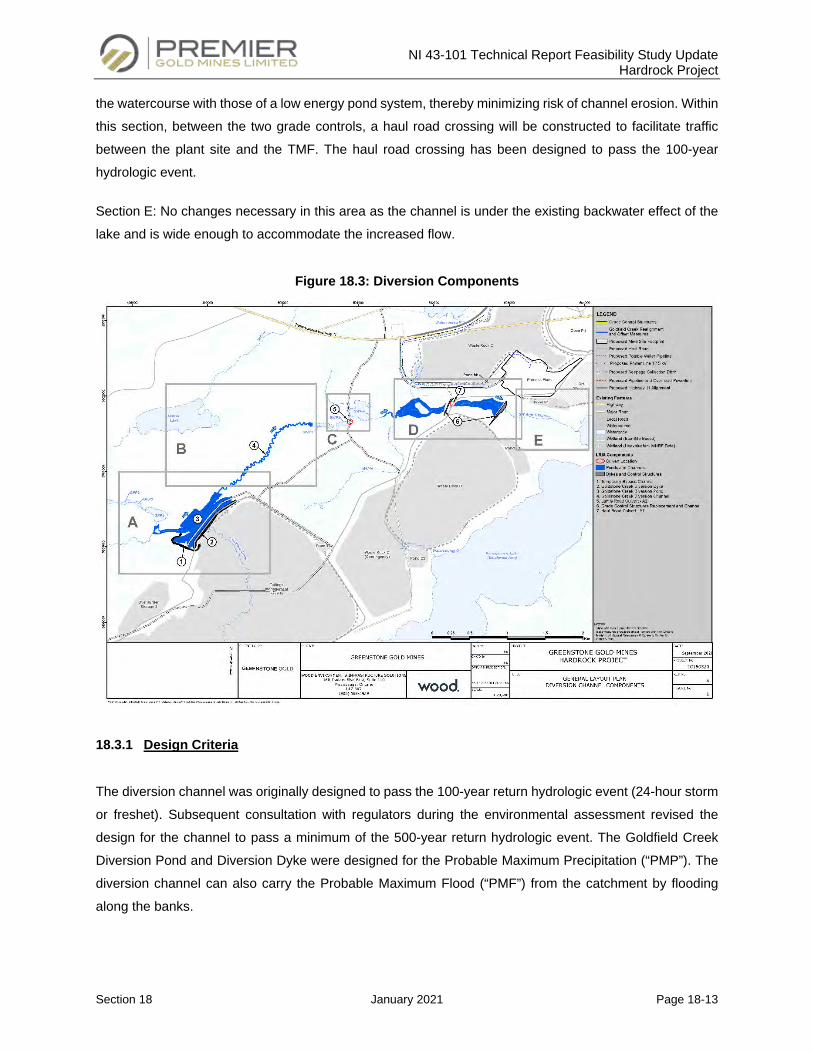
NI 43-101 Technical Report Feasibility Study Update Hardrock Project
Section 18 January 2021 Page 18-13
the watercourse with those of a low energy pond system, thereby minimizing risk of channel erosion. Within
this section, between the two grade controls, a haul road crossing will be constructed to facilitate traffic
between the plant site and the TMF. The haul road crossing has been designed to pass the 100-year
hydrologic event.
Section E: No changes necessary in this area as the channel is under the existing backwater effect of the
lake and is wide enough to accommodate the increased flow.
Figure 18.3: Diversion Components
18.3.1 Design Criteria
The diversion channel was originally designed to pass the 100-year return hydrologic event (24-hour storm
or freshet). Subsequent consultation with regulators during the environmental assessment revised the
design for the channel to pass a minimum of the 500-year return hydrologic event. The Goldfield Creek
Diversion Pond and Diversion Dyke were designed for the Probable Maximum Precipitation (“PMP”). The
diversion channel can also carry the Probable Maximum Flood (“PMF”) from the catchment by flooding
along the banks.
NI 43-101 Technical Report Feasibility Study Update Hardrock Project
Section 18 January 2021 Page 18-14
Road Crossings associated with the Diversion Channel were designed according to risk and purpose
including:
• Lahti’s Road, designed to minimum 25-year event, (local access road);
• Haul Road crossing of the Southwest Arm Tributary, designed to 100-year event, (main haul road
to TMF).
18.3.2 Diversion Design
The Diversion Channel was designed using engineered structures (diversion dyke, grade controls and
crossings) and natural channel design principles based on a 2016 geomorphological analysis of the existing
and proposed channels.
The Goldfield Creek Diversion Pond and Diversion Dyke were designed to a normal operating water level
of 340 masl, and to convey the PMF event without overtopping. The crest level of the diversion dyke has
been set at 342.3 masl. Design features incorporated into the diversion also include ecological values and
habitat characteristics in response to comments from communities and regulators. Detailed descriptions of
the habitat components and ecological features can be found in the Fisheries Act, Paragraph 35(2)(b)
Authorization, Offset Plan and MDMER Schedule 2 Fish Habitat Compensation Plan; (Wood 2019).
18.3.3 Diversion Dyke Design
Geotechnical investigations have been carried out in the GFC diversion components and TMF in 2014,
2015, 2018 and 2019 to understand the subsurface conditions required for the design. The GFC Diversion
Dyke has been designed in accordance with the Lakes and Rivers Improvement Act (LRIA) and Canadian
Dam Association (“CDA”) guidelines. The GFC Diversion Dyke has a “Very High” hazard potential because
of the potential loss of life, loss of fish habitat, and loss of property (economic). Therefore, the dyke is
designed for the most severe flood criteria, being the PMF. The TMF located immediately southeast of the
GFC dyke is designed to contain the EDF corresponding to a 100 year event. A TMF Emergency Spillway
will convey the flows above the EDF event. The GFC diversion pond will receive the overflows from the
TMF Emergency Spillway. All flows will be diverted down the permanent diversion channel to the Southwest
Arm Tributary.
The dyke section is a rockfill dam constructed on a stripped and prepared foundation with a low permeability
inclined till core along the upstream face of the dyke. Graded filters and transition layers are provided
upstream and downstream of the core, as well above the prepared foundation downstream of the core.
Clean, non-acid generating rockfill is designed for construction of the shell downstream of the core. A soil-
NI 43-101 Technical Report Feasibility Study Update Hardrock Project
Section 18 January 2021 Page 18-15
bentonite slurry seepage cut-off wall is planned to penetrate the upper outwash layers of sandy silt/silt and
tied into the low permeability varved clays.
Goldfield Creek Diversion Dyke Design Report of November 2018 provides further details on the diversion
dyke design.
18.3.3 Closure Considerations
The diversion is a permanent realignment of the Goldfield Creek system, and as such will remain in place
at mine closure. However, most road crossings will be removed at or before closure when their project
needs are met. The diversion dyke and valley wide grade controls will be permanent structures.
18.4 Water Management
18.4.1 Administrative Water Services
A tie-in to the municipal network will be constructed to the Project site for potable water to support the
change room, the lunchroom, the various washrooms and showers and the emergency showers.
The wash bay water at the truck shop is required for the mining fleet and will be provided from the water
equalization pond which is principally fed from shaft dewatering activities. The wash bay will be equipped
with filtering system to recirculate most of the water to the wash bay. Sludge will be disposed through the
process plant tailings management system.
18.4.2 Effluents
Two types of effluents will be generated during Project activities: mine effluent and sanitary effluent. The
water quality standards applicable to mine effluent are the Provincial Water Quality Objectives (“PWQOs”)
(MOE, 1994), Ontario Regulation (“O.Reg.”) 560/94-MISA Metal Mine Sector Effluent Criteria, and Federal
Metal Mining Effluent Regulations (“MMER”) Effluent Criteria. The water quality standards applicable to
sanitary effluent are the PWQOs. The Assimilative Capacity Study (Stantec, 2016) conducted for the
Project identified effluent discharge locations and proposed effluent criteria for both mine and sanitary
effluents discharging to the Southwest Arm of Kenogamisis Lake which are protective of the receiving
environment. The proposed effluent criteria meet and exceed MMER and O.Reg. 560/94 criteria at end of
pipe and the PWQOs for all parameters are met within a reasonably small mixing zone in the receiving
waterbody.
NI 43-101 Technical Report Feasibility Study Update Hardrock Project
Section 18 January 2021 Page 18-16
Mine Effluent: All collected mine water is directed through distributed runoff and seepage collection ponds
to the centralized mine water Collection Pond M1, which is designed to provide store for all mine site water
with controlled release to the Southwest Arm of Kenogamisis Lake following treatment in the effluent
treatment plant.
Sanitary Effluent: The Project has two sources of sanitary sewage: the temporary construction camp
located near Barton Bay and the main mine site which includes the offices, process plant and mine
buildings. The temporary construction camp will be connected to the municipal sewage system by
incorporation of a new sewage lift station.
For the plant and mine site buildings, a permanent modular sewage treatment plant will be installed to
accommodate up to 100 persons at any given time.
18.4.3 Site Runoff and Spillage Control
Runoff refers to runoff over ground surfaces as well as seepage to the surface from groundwater/subsurface
sources. Four main sources of site runoff produced by mining operation have been identified:
Runoff from Open Pit: Precipitation on the open pit will be directed to the historical underground workings
associated with the MacLeod-Cockshutt and HardRock mines. The use of the historical underground
workings provides a storage reservoir for open pit seepage and runoff during the mining operation and
allows for flexibility in the water management approach.
Runoff from WRSA and Ore Stockpiles: Runoff from the Waste Rock Storage Areas (“WRSAs”) and ore
stockpiles will be collected in a series of perimeter ditches which will drain by gravity or be pumped to one
of seven local collection ponds and subsequently directed to the centralized Mine Water Collection
Pond M1. The seepage collection ditches and ponds will be designed to the 100 year design event. After
mine closure and WRSA rehabilitation, water will continue to be collected and directed to the open pit to
accelerate the filling of the pit to form a pit lake. Once water quality is acceptable for discharge, the ponds
will be decommissioned, and water directed to the environment.
Runoff from Mill Yard: Surface runoff and contact water from the processing plant, truck shop yard and
ore stockpiles will be collected in perimeter ditches draining to the Collection Pond B1.
Runoff from TMF Dams: The TMF will include a perimeter seepage collection system to collect runoff and
seepage from the perimeter dams. Water from the collection ponds will be pumped back to the TMF for
reuse to meet process plant reclaim demand. The TMF has been designed to contain up to the
Environmental Design Flood with emergency spillways designed for the PMF. The collected seepage will
NI 43-101 Technical Report Feasibility Study Update Hardrock Project
Section 18 January 2021 Page 18-17
be generally pumped back into the TMF. In case there is surplus water, which cannot be pumped into the
TMF, water will be treated prior to discharging to the environment.
18.4.4 Collection Ponds
Selection of collection pond locations was based on a balance of several objectives including the ability to
collect runoff and seepage from the respective WRSAs by gravity flow, constructability and subsurface soil
considerations, and satisfactory environmental protection during operations and into closure. The
requirement to collect the seepage and runoff collection by gravity flow means the ponds are generally
constructed by excavation, with small perimeter berms to provide ample storage to contain runoff from
storm events.
Seepage from the ponds is inhibited through controlling the operating levels such that the pond level is
maintained below the surrounding groundwater level, thus creating hydraulic containment. Pond M1, the
central collection pond, is provided with a geomembrane liner because it requires a higher operating level
to receive pumped flows from the six remote collection ponds and open pit. Pond C2 will be lined with
geomembrane because granular soils in the area mean the hydraulic containment concept is not suitable.
Specific operating volume ranges (live storage) have been set for each pond according to the contributing
catchment area. Storm reserve capacity is provided above the maximum operating water level in each pond
to contain the runoff from a 100-year return Environmental Design Flood (EDF) with no discharge to the
environment. Each of the ponds has a pumping station with sufficient capacity required during normal
operations and following storm events. Table 18.1 summarizes the maximum operating volumes and EDF
storage required in each pond, and the total capacity below the emergency spillway invert.
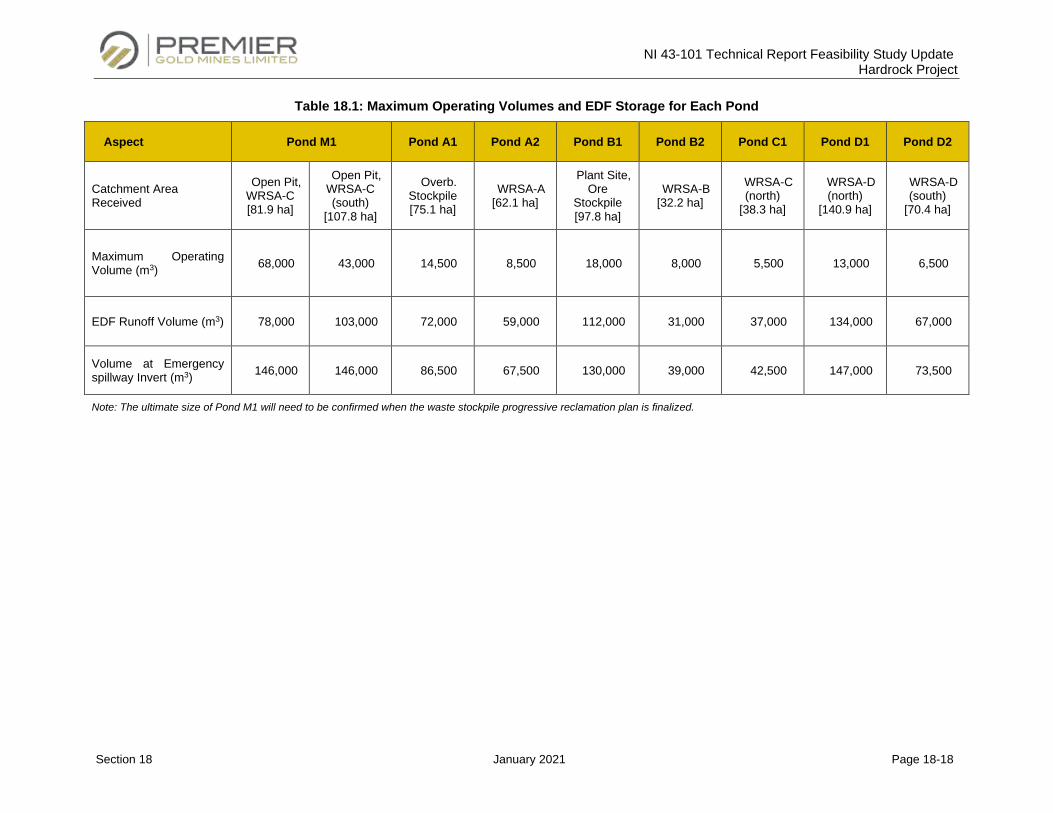
NI 43-101 Technical Report Feasibility Study Update Hardrock Project
Section 18 January 2021 Page 18-18
Table 18.1: Maximum Operating Volumes and EDF Storage for Each Pond
Aspect Pond M1 Pond A1 Pond A2 Pond B1 Pond B2 Pond C1 Pond D1 Pond D2
Catchment Area Received
Open Pit, WRSA-C [81.9 ha]
Open Pit, WRSA-C (south)
[107.8 ha]
Overb. Stockpile [75.1 ha]
WRSA-A [62.1 ha]
Plant Site, Ore
Stockpile [97.8 ha]
WRSA-B [32.2 ha]
WRSA-C (north)
[38.3 ha]
WRSA-D (north)
[140.9 ha]
WRSA-D (south)
[70.4 ha]
Maximum Operating Volume (m3) 68,000 43,000 14,500 8,500 18,000 8,000 5,500 13,000 6,500
EDF Runoff Volume (m3) 78,000 103,000 72,000 59,000 112,000 31,000 37,000 134,000 67,000
Volume at Emergency spillway Invert (m3) 146,000 146,000 86,500 67,500 130,000 39,000 42,500 147,000 73,500
Note: The ultimate size of Pond M1 will need to be confirmed when the waste stockpile progressive reclamation plan is finalized.
NI 43-101 Technical Report Feasibility Study Update Hardrock Project, Ontario, Canada
Section 18 January 2021 Page 18-19
The pond berms have been assigned “significant” Hazard Potential values based on the potential
environmental impacts in the event of a failure. Emergency spillways have been designed to safely pass
the peak flow from a 1,000-year return 24-hour storm of 142 mm precipitation depth.
18.4.5 Effluent Treatment Plant
The effluent treatment plant consists of a series of stages designed to increase water clarity, meet discharge
water quality targets and adjust pH. In the first step, pH of the effluent is adjusted by the addition of acid
and caustic in the first of three metal precipitation reactors. The presence of hydroxide- ions in contact with
residual metal ions results in the formation of insoluble metal hydroxide precipitate.
The next step is pre-coagulation and coagulation where coagulant is added to the second metal
precipitation reactor to assist in decantation and precipitate arsenic from solution. Proper mixing in the last
two metal precipitation reactors ensures a homogenous diffusion of the coagulant in the water. Water is
then transferred to the maturation tank where flocculant and microsand are added. Baffles and efficient
mixing accelerate contact between the flocs, the flocculant and microsand, thereby ensuring the formation
of ballasted flocs. Water is then transferred to a counter-current lamellar settling tank where the ballasted
flocs sink to the bottom forming a sludge and the clarified water is decanted at the surface. The sludge is
drawn out of the clarifier and directed to hydrocyclones to recover the microsand from the sludge. The
microsand exits the hydrocyclone underflow and recycled, while the sludge evacuated at the overflow is
directed to the sludge pumpbox before being transferred to the tailing pumpbox.
To achieve the final effluent discharge quality criterion, the clarified water is further polished in a disc filter.
The clarified water is sent to an intercoagulation tank where coagulant and flocculant are added to help in
the formation of flocs. A final pH adjustment is made by the addition of caustic or acid. After proper mixing
and adequate retention time, the water is filtered to remove the precipitated flocs and obtain the clarified
water that can be sent to the environment.
18.5 Power Supply and Distribution
18.5.1 Power Demand Estimates
The average power demand for the Project was calculated using the Project’s process plant load list
compiled by Ausenco and received by Greenstone Gold Mines (“GGM”). This included the average load
required for the supporting infrastructure, such as the truck shop/warehouse, the administration office, the
sewage treatment plant, etc. Peak power was calculated by considering all the connected nameplate loads
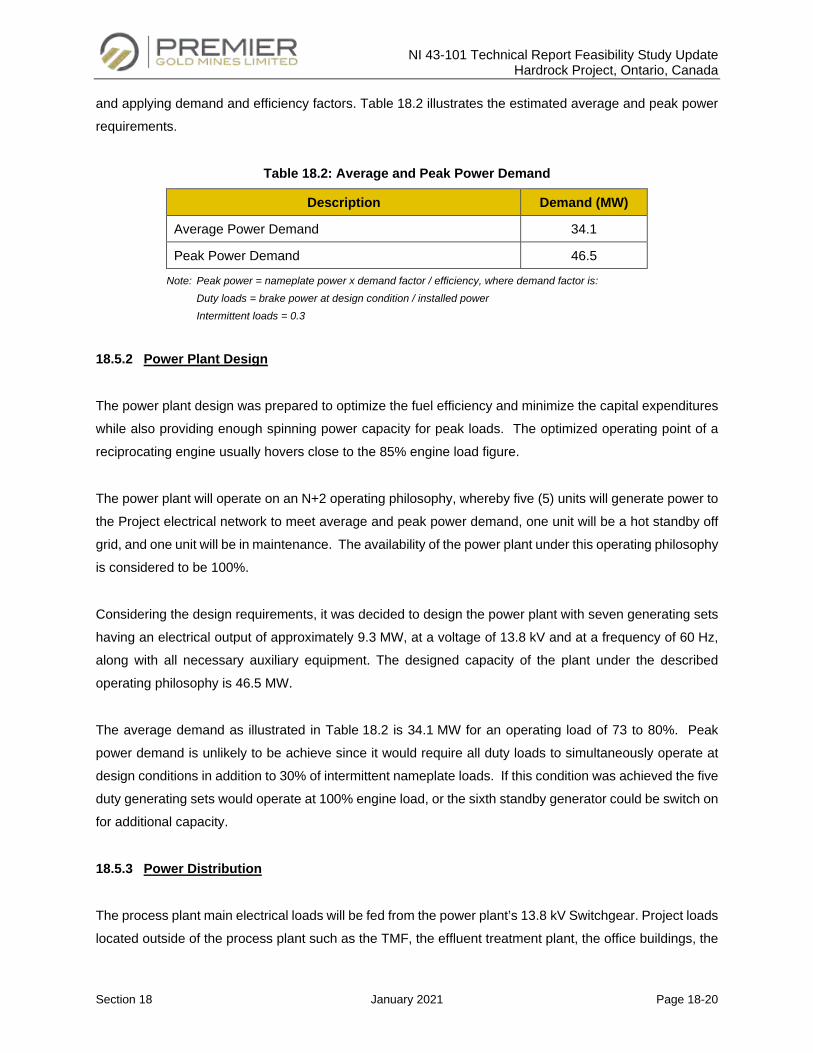
NI 43-101 Technical Report Feasibility Study Update Hardrock Project, Ontario, Canada
Section 18 January 2021 Page 18-20
and applying demand and efficiency factors. Table 18.2 illustrates the estimated average and peak power
requirements.
Table 18.2: Average and Peak Power Demand
Description Demand (MW)
Average Power Demand 34.1
Peak Power Demand 46.5
Note: Peak power = nameplate power x demand factor / efficiency, where demand factor is:
Duty loads = brake power at design condition / installed power
Intermittent loads = 0.3
18.5.2 Power Plant Design
The power plant design was prepared to optimize the fuel efficiency and minimize the capital expenditures
while also providing enough spinning power capacity for peak loads. The optimized operating point of a
reciprocating engine usually hovers close to the 85% engine load figure.
The power plant will operate on an N+2 operating philosophy, whereby five (5) units will generate power to
the Project electrical network to meet average and peak power demand, one unit will be a hot standby off
grid, and one unit will be in maintenance. The availability of the power plant under this operating philosophy
is considered to be 100%.
Considering the design requirements, it was decided to design the power plant with seven generating sets
having an electrical output of approximately 9.3 MW, at a voltage of 13.8 kV and at a frequency of 60 Hz,
along with all necessary auxiliary equipment. The designed capacity of the plant under the described
operating philosophy is 46.5 MW.
The average demand as illustrated in Table 18.2 is 34.1 MW for an operating load of 73 to 80%. Peak
power demand is unlikely to be achieve since it would require all duty loads to simultaneously operate at
design conditions in addition to 30% of intermittent nameplate loads. If this condition was achieved the five
duty generating sets would operate at 100% engine load, or the sixth standby generator could be switch on
for additional capacity.
18.5.3 Power Distribution
The process plant main electrical loads will be fed from the power plant’s 13.8 kV Switchgear. Project loads
located outside of the process plant such as the TMF, the effluent treatment plant, the office buildings, the
NI 43-101 Technical Report Feasibility Study Update Hardrock Project, Ontario, Canada
Section 18 January 2021 Page 18-21
truck shop and warehouse, communication tower, explosive reagent facility and all the various pumping
stations of the Project will be fed through overhead power lines with tie-in points to the Project electrical
network.
18.6 Other Project Infrastructure
18.6.1 Truck Maintenance Shop and Warehouse
The truck shop and warehouse complex will be located on the southwest of the process plant site with
direct access to the mine haul road.
Eight heavy duty maintenance bays will be provided. The truck shop building dimensions are 121 m (L)
by 39 m (W) by 21 m (H) for five bays, and the building is 3.6 m wider for the last three bays. Four bays
(346 m2 each) will mainly service the mining haul trucks. One bay (259 m2) is to be used for smaller support
equipment. One bay (404 m2) will be used to service the big loader, then one more bay (303 m2) will be for
the maintenance of the drill rigs. The last bay (419 m2) will be the wash bay for all mobile equipment. The
concrete slab for tracked equipment will be constructed with embedded rails. Large fabric doors will be
used for the heavy-duty maintenance bays. Three 30/5 t overhead cranes will service the maintenance
bays. Two of these overhead cranes will be synchronized to work in tandem to lift one truck box.
The wash bay (419 m2) will be located on the east end of the truck shop complex. Water cannons and
steam washers will be located on both sides. Water, rocks, sediment and hydrocarbons will be collected in
a settling pond and the water reused.
Compressed air will be provided throughout the maintenance facility. Lubricants will be stored in the truck
shop in a specific enclosed area then distributed to four reel stations.
The main HVAC system will have units in strategic locations to provide heat and air exchange as needed
in all areas of the truck shop/warehouse building. The heat provided to the units will come from the heat
recovery system of the power plant and the glycol loop. The system installed in the wash bay will be
designed to melt frozen chunks of mud on the mine fleet equipment being washed and serviced.
The warehouse (593 m2) is designed on the northwest corner of the truck shop building. Heavy and light-
duty racking will be installed. The warehouse will be used to store consumables and maintenance parts. A
separate room with 116 m2 will be used to store hoses, tools and cribs.
NI 43-101 Technical Report Feasibility Study Update Hardrock Project, Ontario, Canada
Section 18 January 2021 Page 18-22
Office space (265 m2) will be provided on the east side of the warehouse. A lunchroom (102 m2) will be
located on the mezzanine floor. An enclosed storage area (292 m2) with handrails and stair access will be
provided on the second floor.
18.6.2 Reagents Cold Storage Facility
This pre-engineered folding building (669 m2) will be located at the plant site west of the mill building. The
building will be used for process reagent storage and, long-term storage for major spares, and temporary
warehousing during construction. The building is not heated.
18.6.3 Explosives Reagent Facility
This pre-engineered folding building (632 m2) will be located South-East of the process plant site and along
the road giving access to the Kenogamisis Lake. This location of the Site Mixed Emulsion (“SME”) Plant
has been chosen in order to respect the minimum quantity-distance requirements from the infrastructure.
The single storey building will be supported on slab on grade. A temporary facility will be located northeast
of the S4 access road near the two permanent magazines used for detonators, and booster as well as the
storage of any packaged product.
18.6.4 Sewage Treatment Plant
Located at plant site, the sewage treatment plant (“STP”) is made of containerized units (three) that will be
installed over a concrete slab on grade. The STP is expected to treat sewage flows from the average daily
plant site population but will be equipped with an equalization tank able also to handle peak flows at shift
change.
18.6.5 Fuel Supply Storage & Distribution
Fuel will be stored at two sites, the Process Plant and the pit, to serve light vehicles and mine equipment
respectively.
Diesel and gasoline will be stored in double walled tanks at the plant site fuel storage area. Each product
will have a designed storage volume of 50,000 L, and 7,500 L respectively.
Diesel and urea will be stored in double walled tanks at the pit fuel storage area. Each product will have a
designed storage volume of 150,000 and 50,000 L respectively. Liquid urea will be used with diesel fuel to
reduce the NOx emissions of the mine fleet.
NI 43-101 Technical Report Feasibility Study Update Hardrock Project, Ontario, Canada
Section 18 January 2021 Page 18-23
18.6.6 Information Technology and Communications Systems
The Project IT Strategy will be implemented at the start of Construction. The strategy addresses, all aspects
of an IT system required during construction, commissioning, and steady state operations of the Project. It
includes the applications to support the core business functions and supporting technology. Applications
and technology will be phased in as the Project advances.
A site-wide, fibre optic communications network installation will follow the power line installation. Network
cabling will be run between the various buildings for connectivity within the local area network (“LAN”).
Closed Captioned Video (“CCTV”) for security, a wireless connectivity for LAN extensions, and an external
Wide Area Network (“WAN”) for connectivity onto the Internet Web and the Cloud service providers, such
as ERP, email, and office tools such as Microsoft Office 365. Within the LAN will be service to support
printing, telephony, server data and storage management.
As cellular phone coverage in the area is currently inadequate, a 100-metre, guyed cell tower will be erected
south of the plant site and host all cellular, radio and LTE (mine dispatch) system antennas. Boosters and
in-building antennas will be added where and when necessary in the Administration and plant buildings.
Quality of coverage will be assessed throughout the life of mine as stockpiles grow and the Open Pit
deepens with additional repeaters and/or antennas added as necessary.
18.6.7 Roads
The Project benefits from direct access to Trans-Canada Highway 11, approximately 275 km northeast of
Thunder Bay and 600 km west of Timmins/Matheson. A section of Trans-Canada Highway 11 will have to
be deviated and reconstructed to avoid the Hardrock open pit mine.
A new site access road will be constructed off Trans-Canada Highway 11 to the administration, mineral
processing, power generation, and shop facilities.
18.6.8 Assay Laboratory
Assaying requirements will be divided amongst a third party offsite arrangement for sample preparation and
gold assaying, and in-house geochemical lab for digestions and assaying of other elements, and a second
third party offsite laboratory for certified water analysis. Assaying services for the Project will be outsourced.
NI 43-101 Technical Report Feasibility Study Update Hardrock Project, Ontario, Canada
Section 18 January 2021 Page 18-24
18.6.9 Admin Building
The administration offices complex will be located on the southwest side of the process plant building. The
building will house change rooms for both men and women, offices, conference rooms, and a lunchroom
for the office staff. The first aid station will be located on the first floor. It will also house a training room at
the main entrance for site induction sessions and other training.
18.6.10 Fire Protection
The Plant site fire protection system consist of two main loops which serve the wet sprinkler system for the
processing plant (grinding and west plant buildings), HPGR building, crushed ore storage and reclaim
tunnel facility, administration building and truck shop complete with fire cannons. A dry section of the
sprinkler system serves the crushing building (primary and secondary crushers).
A perimeter fire hydrant network is installed around the plant infrastructure and process plant. Fire hydrants
and wet sprinklers servicing the site buildings and effluent treatment plant are connected to the main rings
via buried HDPE pipes.
The plant site fire protection system will be fed from a dedicated fire pumping station located by the process
plant and close to the treated/fire water tank. The system has centrally controlled automatic fire detection
and alarms. The main alarm panel will be located in the administration building in the security office at the
main entrance where there will be a 24-hour presence of security guards.
18.6.11 Security
Access to the processing, power, and administration area will be secured by a remotely operated vehicle
gate, controlled by security guards on 24-hour duty. The processing facilities and truck shop will be
monitored by CCTV surveillance. There will be additional CCTV surveillance of the yard area around the
processing, power and administration areas, including the employee parking area and main gate. The gold
refinery and gravity circuit area will have an additional level of security.
18.7 Infrastructure Relocation and Offsite Infrastructure
The Project is located over or close to existing infrastructure. The plan is to relocate (rebuild or dismantle)
the affected infrastructures.
NI 43-101 Technical Report Feasibility Study Update Hardrock Project, Ontario, Canada
Section 18 January 2021 Page 18-25
18.7.1 Private Properties
The future open pit mine is located over the MacLeod townsite and very close to the Hardrock town site.
GGM has acquired all 65 private properties in the vicinity of the Project. An additional property of the edge
of the Project Development Area is currently being assessed for purchase which would bring the total to
66 private properties acquired.
The Husky Gas Station located at the junction of Highway 11 and Michael Power Boulevard has been
purchased from the current operator and is now closed. This gas station will be removed after the
realignment of Highway 11.
The Surface Rights for nine mining patents owned by Tombill Mines have been acquired in order to allow
the construction of portions of the Highway 11 and Goldfield Creek realignments. The purchase of the
surface rights for an additional three Tombill patents in the Goldfield Creek area are in progress and are
expected to be completed by end of 2019.
18.7.2 Government and Municipal Properties
An Ontario Provincial Police (“OPP”) station is located in the vicinity of the future open pit mine operation
and needs to be relocated. The new proposed location is at the junction of the new Highway 11 and existing
Michael Power Boulevard. GGM plans to buy the existing OPP station when the project is approved for
construction and the new OPP station will be built without any further involvement of GGM.
The municipality’s golf course is located just north of the future open pit mine on land owned by GGM. This
18-hole golf course will be reduced to the original 9-hole course on the west side of Michael Power
Boulevard to accommodate the mine development.
The Geraldton Heritage Interpretive Centre is located over the MacLeod High Tailings area next to the golf
course. The plan is to demolish this infrastructure at the end of the mine pre-production period or during
the first year of operations.
A historical mine headframe was esthetically refurbished to be displayed as a monument at the junction of
the existing Highway 11 and Michael Power Boulevard. The plan is to demolish this headframe toward the
end of the mine pre-production period.
NI 43-101 Technical Report Feasibility Study Update Hardrock Project, Ontario, Canada
Section 18 January 2021 Page 18-26
18.7.3 Relocation of Highway 11 and MTO Patrol Station
Highway 11 passes through the future Hardrock open pit mine and must be relocated to accommodate
mining. Newer segments of Highway 11 (4.7 km) and Michael Power Boulevard (0.6 km) will be
constructed to route traffic to the north of the mining operation. Various stakeholders including the Ontario
Ministry of Transport (“MTO”) and the local community were involved during the detailed design of the
Highway 11 relocation. A portion of the new highway will be over the historic MacLeod tailings. Detailed
geotechnical investigations in this area have been done to finalize the design. The intersection between
Michael Power Boulevard and Highway 11 will be relocated to the west allowing for improved alignment.
Construction will take place over a 2-year period during which minimal interference with existing traffic will
be encountered. Detailed Engineering for the new Highway segments is over 90% completed.
The MTO owns a highway patrol station east of the Hardrock Project which is within the relocated
Highway 11 right of way and must be relocated. A new location has been identified at the west end of the
Project Development Area along Highway 11, opposite the mine entrance. Design of the new Patrol Yard
is complete and included significant involvement from MTO. Upgrades were necessary for the new facility
to align with current standards. Construction of the new MTO Patrol Yard is expected to take place over a
one-year period.
18.7.4 Natural Gas Distribution Pipeline
To supply natural gas required for power generation, a new tap off the TransCanada pipeline (“TCPL”)
Mainline and a new distribution pipeline will be constructed from the Geraldton metering point on the TCPL
Mainline, through the town of Geraldton to the Project site.
Enbridge (previously known as Union Gas), TransCanada’s delivery agent for the Greenstone, Ontario
region, has now completed basic engineering work for this pipeline. The pipeline will have a delivery
pressure of 350 psi to the site metering station, which will be located at the intersection of Highway 11 and
the site’s access road. At the metering station pressure will be reduced to 100 psi for site-wide distribution
to the power plant, process plant, etc. The new Enridge station will be designed for a maximum hourly flow
of 11,000 m3/h.
18.7.5 Relocation of Hydro One Electrical Infrastructure
The electrical infrastructure near the Project will be moved out of the footprint of the Open Pit. GGM and
Hydro One have developed a plan by which the existing 115 kV Longlac Transmission Station (“TS”) will
NI 43-101 Technical Report Feasibility Study Update Hardrock Project, Ontario, Canada
Section 18 January 2021 Page 18-27
be relocated approximately 2.2 km west of its current location, along with the incoming 115 kV power line
and the outgoing 44 kV feeders servicing the municipalities of Geraldton and Longlac, amongst others.
The dismantling of the existing Longlac TS will be carried out only when the new Longlac TS and all feeders
are ready to be energized. GGM will perform the dismantling.
The exiting Hydro One Networks Inc. ("HONI") operating centre that is annexed to the existing substation
will be relocated separately to its own location in Geraldton’s designated industrial area.
18.7.6 Historical Tailings Relocation
The extent and volume of historical tailings has been characterized by others and summarized in the
memorandum by Stantec dated July 9, 2019 titled “Historical Tailings Inventory, Greenstone Gold Mines
Hardrock Project”. In 2016, an Environmental Assessment (“EA”) was completed by Stantec which
identified that only a portion of the historical tailings would be removed as part of the Project development,
with the remaining historical tailings being left in place.
There are two sources of historical tailings; the Hardrock Tailings and the MacLeod Tailings. The volume
of the historical Hardrock tailings to be relocated to the TMF was developed based on a 30 m setback from
the highwater mark of Kenogamisis Lake (as discussed in the EA). The setback was required to protect the
riparian zone and reduce potential effects to fisheries habitat and water quality associated with working in
close proximity to the lake. Approximately 70% of the historical tailings will be relocated to the TMF with an
estimated volume of overlying soil and historical tailings of 330,400 m3. It is anticipated that the historical
Hardrock tailings will be relocated between 2028 and 2031.
Approximately 23% of the historical MacLeod tailings will be removed during construction of the open pit
footprint and relocated to the TMF, with an estimated volume of overlying soil and historical tailings of
2,144,500 m3. The initial historical MacLeod tailings to be mined as part of the starter pit and pit expansion
from mid-2023 to the end of 2024 and be relocated to an engineered cell within the south portion of the
TMF (approximate volume of 1,000,000 m3). The TMF cell is being constructed prior to 2023 specifically
for historical tailings placement as the full TMF will not have been constructed during the early mining
operational stage. To stabilize the historical tailings remaining in place, a buttress will be constructed along
the south edge in the area of the open pit.
A seepage subdrain installed around the north side of the MacLeod High Tailings will facilitate the collection
and pumping of seepage from the historical tailings for treatment before discharge to the environment.
NI 43-101 Technical Report Feasibility Study Update Hardrock Project, Ontario, Canada
Section 18 January 2021 Page 18-28
The removal of the historical MacLeod and Hardrock tailings will be completed using a combination of dozer
pushing and excavation with either front end loaders or excavators. As the excavation will be advanced
below the water table, water management will be required during construction and is anticipated to include
a series of collection ditches and sumps, and potentially the use of well point systems to lower the water
table in advance of the excavation works. Water collected during excavation works will be pumped to the
ETP for treatment prior to discharge to the environment.
18.8 Temporary Construction Infrastructure
18.8.1 Temporary Camp
Due to limited accommodations in the area a temporary camp is required for the construction and pre-
production period to lodge the construction workers. The camp will be located on GGM land approximately
2.5 km north of the process plant site on Old Arena Road near the intersection with Michael Power
Boulevard. The camp will have an average occupancy of approximately 400 persons, with a peak of
approximately 600 persons.
Natural Gas, potable water and power will be organized by GGM and provided to a centrally designated
point on the camp site, after which the contractor will be responsible for its own distribution. The camp will
require the collection and trucking of wastewater to a local disposal/treatment facility for the first few months
of operation until it can be connected to the upgraded municipal system.
A shuttle bus service will be set up to shuttle workers from the temporary camp to the plant site.

NI 43-101 Technical Report Feasibility Study Update Hardrock Project, Ontario, Canada
Section 19 January 2021 Page 19-1
MARKET STUDIES AND CONTRACTS
Neither G Mining Services Inc. nor Premier Gold Mines Limited have conducted a market study in relation
to the gold metal that will be produced from the Project. Gold is freely traded, at prices that are widely
known, so that prospects for sale of any production are virtually assured. Prices are usually quoted in USD
dollars per troy ounce.
The gold doré refining agreement will be negotiated once the Project is approved for construction.
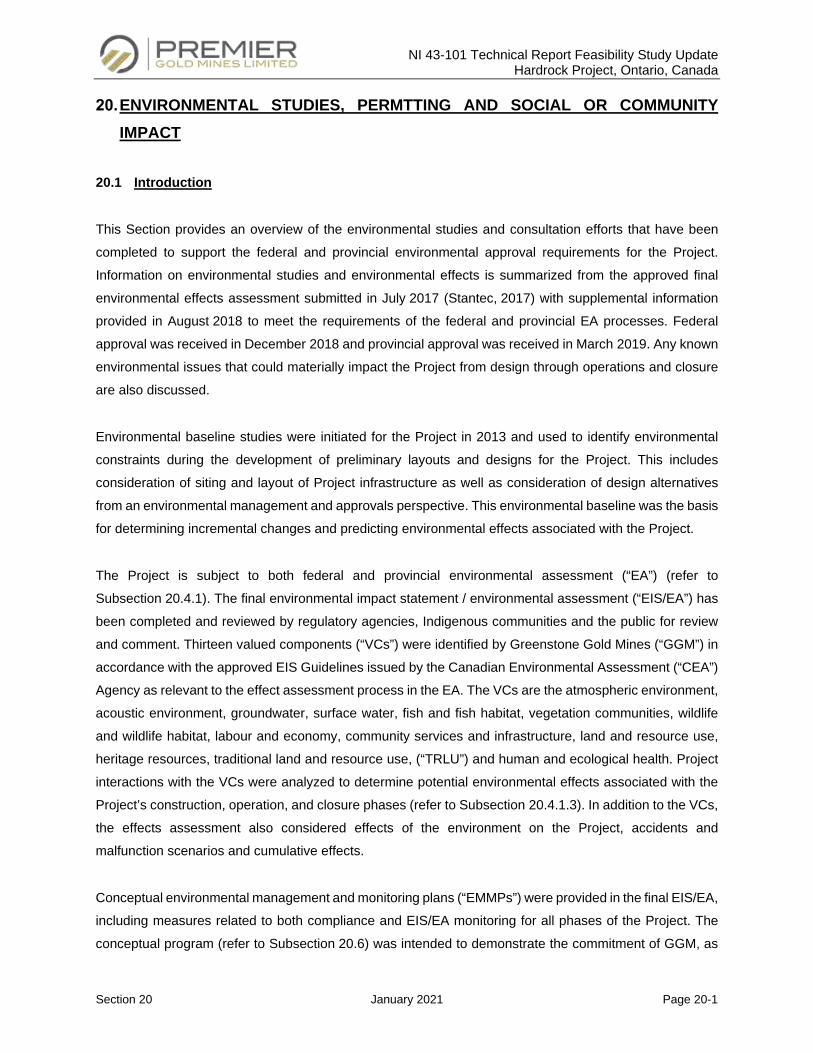
NI 43-101 Technical Report Feasibility Study Update Hardrock Project, Ontario, Canada
Section 20 January 2021 Page 20-1
ENVIRONMENTAL STUDIES, PERMTTING AND SOCIAL OR COMMUNITY IMPACT
20.1 Introduction
This Section provides an overview of the environmental studies and consultation efforts that have been
completed to support the federal and provincial environmental approval requirements for the Project.
Information on environmental studies and environmental effects is summarized from the approved final
environmental effects assessment submitted in July 2017 (Stantec, 2017) with supplemental information
provided in August 2018 to meet the requirements of the federal and provincial EA processes. Federal
approval was received in December 2018 and provincial approval was received in March 2019. Any known
environmental issues that could materially impact the Project from design through operations and closure
are also discussed.
Environmental baseline studies were initiated for the Project in 2013 and used to identify environmental
constraints during the development of preliminary layouts and designs for the Project. This includes
consideration of siting and layout of Project infrastructure as well as consideration of design alternatives
from an environmental management and approvals perspective. This environmental baseline was the basis
for determining incremental changes and predicting environmental effects associated with the Project.
The Project is subject to both federal and provincial environmental assessment (“EA”) (refer to
Subsection 20.4.1). The final environmental impact statement / environmental assessment (“EIS/EA”) has
been completed and reviewed by regulatory agencies, Indigenous communities and the public for review
and comment. Thirteen valued components (“VCs”) were identified by Greenstone Gold Mines (“GGM”) in
accordance with the approved EIS Guidelines issued by the Canadian Environmental Assessment (“CEA”)
Agency as relevant to the effect assessment process in the EA. The VCs are the atmospheric environment,
acoustic environment, groundwater, surface water, fish and fish habitat, vegetation communities, wildlife
and wildlife habitat, labour and economy, community services and infrastructure, land and resource use,
heritage resources, traditional land and resource use, (“TRLU”) and human and ecological health. Project
interactions with the VCs were analyzed to determine potential environmental effects associated with the
Project’s construction, operation, and closure phases (refer to Subsection 20.4.1.3). In addition to the VCs,
the effects assessment also considered effects of the environment on the Project, accidents and
malfunction scenarios and cumulative effects.
Conceptual environmental management and monitoring plans (“EMMPs”) were provided in the final EIS/EA,
including measures related to both compliance and EIS/EA monitoring for all phases of the Project. The
conceptual program (refer to Subsection 20.6) was intended to demonstrate the commitment of GGM, as
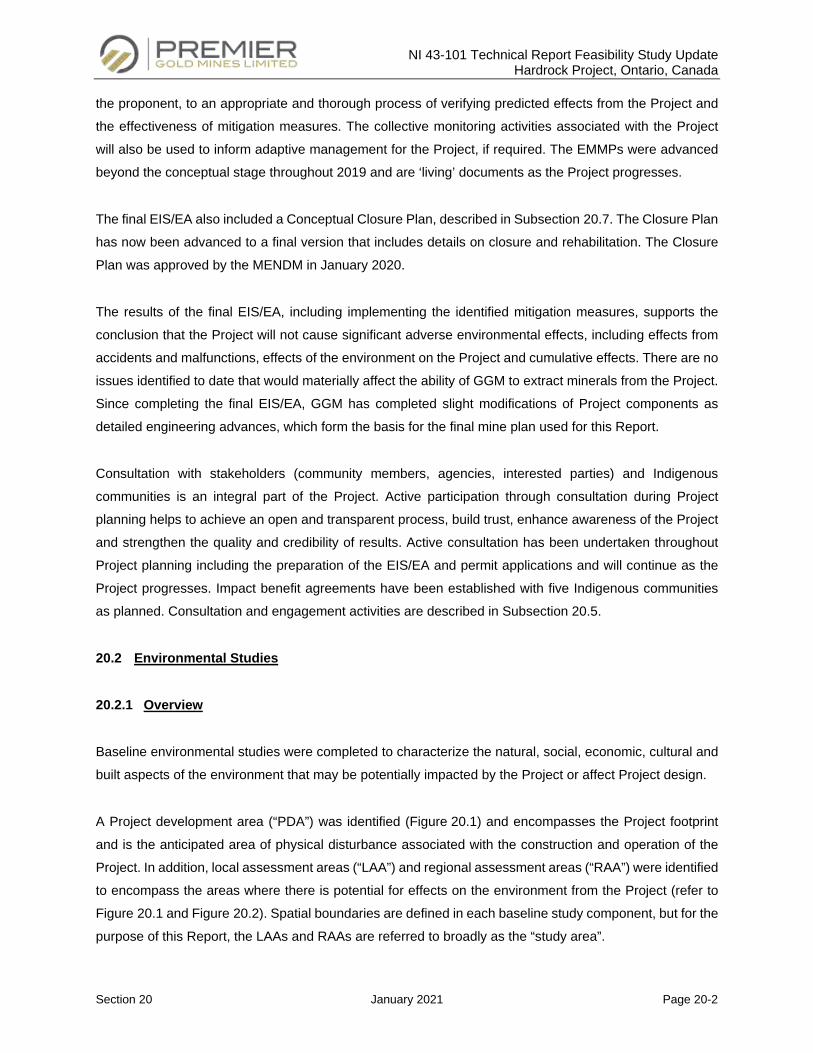
NI 43-101 Technical Report Feasibility Study Update Hardrock Project, Ontario, Canada
Section 20 January 2021 Page 20-2
the proponent, to an appropriate and thorough process of verifying predicted effects from the Project and
the effectiveness of mitigation measures. The collective monitoring activities associated with the Project
will also be used to inform adaptive management for the Project, if required. The EMMPs were advanced
beyond the conceptual stage throughout 2019 and are ‘living’ documents as the Project progresses.
The final EIS/EA also included a Conceptual Closure Plan, described in Subsection 20.7. The Closure Plan
has now been advanced to a final version that includes details on closure and rehabilitation. The Closure
Plan was approved by the MENDM in January 2020.
The results of the final EIS/EA, including implementing the identified mitigation measures, supports the
conclusion that the Project will not cause significant adverse environmental effects, including effects from
accidents and malfunctions, effects of the environment on the Project and cumulative effects. There are no
issues identified to date that would materially affect the ability of GGM to extract minerals from the Project.
Since completing the final EIS/EA, GGM has completed slight modifications of Project components as
detailed engineering advances, which form the basis for the final mine plan used for this Report.
Consultation with stakeholders (community members, agencies, interested parties) and Indigenous
communities is an integral part of the Project. Active participation through consultation during Project
planning helps to achieve an open and transparent process, build trust, enhance awareness of the Project
and strengthen the quality and credibility of results. Active consultation has been undertaken throughout
Project planning including the preparation of the EIS/EA and permit applications and will continue as the
Project progresses. Impact benefit agreements have been established with five Indigenous communities
as planned. Consultation and engagement activities are described in Subsection 20.5.
20.2 Environmental Studies
20.2.1 Overview
Baseline environmental studies were completed to characterize the natural, social, economic, cultural and
built aspects of the environment that may be potentially impacted by the Project or affect Project design.
A Project development area (“PDA”) was identified (Figure 20.1) and encompasses the Project footprint
and is the anticipated area of physical disturbance associated with the construction and operation of the
Project. In addition, local assessment areas (“LAA”) and regional assessment areas (“RAA”) were identified
to encompass the areas where there is potential for effects on the environment from the Project (refer to
Figure 20.1 and Figure 20.2). Spatial boundaries are defined in each baseline study component, but for the
purpose of this Report, the LAAs and RAAs are referred to broadly as the “study area”.
NI 43-101 Technical Report Feasibility Study Update Hardrock Project, Ontario, Canada
Section 20 January 2021 Page 20-3
Figure 20.1: Local Assessment Areas
NI 43-101 Technical Report Feasibility Study Update Hardrock Project, Ontario, Canada
Section 20 January 2021 Page 20-4
Figure 20.2: Regional Assessment Areas
NI 43-101 Technical Report Feasibility Study Update Hardrock Project, Ontario, Canada
Section 20 January 2021 Page 20-5
20.2.2 Geology and Geomorphology
20.2.2.1 Physiography
The Project lies within the Boreal Shield, a Canadian ecozone where the Canadian Shield and the boreal
forest overlap. Precambrian bedrock at or near the surface plays an important role in shaping the
biophysical landscape. Lakes, ponds, and wetlands are abundant in this landscape and drainage patterns
are typically dendritic, with sporadic angular drainage as influenced by bedrock outcrops.
Topography in the study area is relatively flat to gently rolling with ground surface elevations ranging from
375 masl in the western portion of the PDA to 335 masl along the shoreline of Kenogamisis Lake. Lower
lying areas within the PDA are characterized by swamps and ponds with poor drainage throughout the
area. The PDA is bounded to the south, east and north by Kenogamisis Lake, which forms the main
watershed within the study area. Local water features and topography where an important consideration in
the siting and design of key Project components, including the Tailings Management Facility (“TMF”) and
associated watercourse diversions and the WRSAs.
20.2.2.2 Surficial Soils and Geology
The surficial soils and geology in the study area are typical of the Boreal Forest region overlying the pre-
Cambrian shield in northern Ontario. Soils are relatively young, exhibiting less than 10,000 years of
development and consist of organic muck (comprising about 36% of the total area) and well-drained
brunisols over thin bedrock (comprising about 35% of the area), with poorly drained gleysols accounting for
13% of the area. The remaining 16% of the PDA is either developed land or water.
Surficial geology consists of large areas of glacial till, outwash and glaciolacustrine sediments, and
glaciofluvial deposits. Unique to this area is the presence of a high percentage of calcareous (carbonate
rich) substrates. Carbonates are commonly found throughout all modes of soil deposition within the study
area. Till and other discontinuous drift (gravelly silty sand to sandy silt) is mapped in the northern and
western portions of the PDA, generally near the proposed open pit and northern portion of the TMF.
Subaqueous outwash and associated glaciolacustrine sediment (rippled silty fine to very fine sand, silts,
and minor clay as thin interbeds) occur along the eastern portion of the PDA, primarily to the south of the
open pit in the areas of WRSA D and the southern portion of the TMF. Organic deposits such as peat or
muck are present in wetlands and river valleys and are typically between one metre and three metres thick.
Ice contact glaciofluvial sediments (sand and gravel) or thick till (gravelly clayey silt to gravelly sandy silt)
are located along the western boundary of the PDA and correspond to an esker that extends southwest
from Mosher Lake to the eastern reaches of Goldfield Lake.
NI 43-101 Technical Report Feasibility Study Update Hardrock Project, Ontario, Canada
Section 20 January 2021 Page 20-6
20.2.2.3 Bedrock Geology
A detailed description of the bedrock geology and controls on mineralization is presented in
Section 7 - Geological History and Mineralization.
20.2.3 Acid Rock Drainage/Metal Leaching Potential
A comprehensive geochemical testing program was initiated in 2013 to characterize waste rock, ore,
overburden and tailings associated with the Project. Testing included Acid-Base Accounting (“ABA”), Shake
Flask Extraction, total metals and laboratory and field kinetic tests with the field kinetic testing program
continuing through 2019. The geochemical characterization of waste rock derived from the testing is being
used for mine planning and development of a detailed waste rock management plan. The following section
presents a summary of the results of the geochemical testing program up to the end of 2018.
Overall, the ore, waste rock and tailings materials contain relatively low Acid Rock Drainage (“ARD”)
potential but will still require consideration of how to best manage effects from existing Potentially Acid
Generating (“PAG”) material in the design of these Project components. Overburden will not require
management for ARD potential. Measures to mitigate potential effects to water quality due to metal leaching
have been documented in the Water Management and Monitoring Plan for the Project.
20.2.3.1 Overburden
Overburden is classified as non-Potentially Acid Generating (“non-PAG”) material and is unlikely to
generate acidic leachate. The potential for leaching of arsenic, and potentially cobalt and copper, was
identified for soils in the area of the historical MacLeod-Mosher and Hardrock plant sites.
20.2.3.2 Waste Rock
Waste rock sample/block was conservatively classified as PAG if Ctotal/Stotal ratio was below 0.8, which
corresponds to a net potential ratio (“NPR”) of 2. Up to 1.3 weight percent of PAG material was estimated
based on the Ctotal/Stotal ratios obtained from the block model. PAG waste rock is mainly associated with the
sulphide replacement zones. The minimum onset time for ARD conditions is estimated to be 70 years after
exposure to the atmosphere. The relatively low percentage of PAG rock and the long ARD onset time
provides management flexibility for this material. Co-deposition of PAG and non-PAG waste rock has been
identified as the preferred option as outlined in the preliminary Waste Rock Management Plan developed
for the Project.
NI 43-101 Technical Report Feasibility Study Update Hardrock Project, Ontario, Canada
Section 20 January 2021 Page 20-7
The data from the field kinetic tests were demonstrated to be more reflective of actual site conditions than
leaching rates obtained in the laboratory humidity cell data, providing a longer testing period under field
conditions for evaluation of long-term leaching behaviour. Results from field kinetic testing indicate that
average annual concentrations were above the Schedule 4 criteria under the MDMER for arsenic (0.5 mg/l)
in one test (S3-2) containing greywacke and in one test containing mafic intrusives (I1-1). These tests have
rock with elevated arsenic grades above average, 110 and 310 ppm, respectively. The following parameters
were above the Ontario Provincial Water Quality Objectives (“PWQO”) in major rock types:
• Clastic sediments – S (72% of waste rock): the PWQO for arsenic and cobalt and the Interim PWQO
for arsenic, antimony, aluminum, and uranium;
• Intrusive rocks – I (11% of waste rock): the PWQO for arsenic and the Interim PWQO for arsenic,
antimony, and aluminum;
• Chemical sediments – C (17% of waste rock): the Interim PWQO for arsenic and antimony.
Field leaching rates of these elements generally declined between 2014 and 2018 in samples representing
major rock types, indicating a significant reduction in leaching rates over time. Additional laboratory and
field testing are being conducted to investigate relationships of arsenic leaching with other parameters to
support the development of potential waste rock management strategies. Arsenic and metal leaching under
neutral conditions was a key issue evaluated in the final EIS/EA and in the development of the mine plan.
During operation, runoff and seepage from waste rock will be collected and treated prior to discharge to the
environment. At closure, contact water from WRSAs will be diverted to the open pit to expedite filling of the
open pit.
20.2.3.3 Future Tailings
Ore samples and tailings have similar ABA characteristics before and after metallurgical tests. Ore and
tailings also have similar neutralization potential ratio thresholds for ARD classification with PAG tailings
estimated at 9.7% with a minimum ARD onset time for PAG tailings of 12 years based on laboratory
neutralizing potential depletion rates. These rates are expected to be slower under field conditions and
addressed through progressive rehabilitation and closure of the TMF.
In the TMF pond, concentrations of metals and total cyanide are predicted to meet MDMER criteria based
on results of ageing tests. Unionized ammonia, cobalt, copper, arsenic, antimony, silver, and free cyanide
were identified as parameters of potential concern during operation based on comparison with the PWQO.
NI 43-101 Technical Report Feasibility Study Update Hardrock Project, Ontario, Canada
Section 20 January 2021 Page 20-8
Water from the TMF will not discharge directly to the environment and toe seepage will be collected and
pumped back to the TMF pond during operation.
At closure, water and seepage collected in the TMF will be sent to the open pit to help expedite filling of the
open pit. Once the pit lake is filled and water quality meets acceptable criteria for discharge, the TMF
seepage collection facilities will be decommissioned and resulting flows will be directed overland to natural
drainage features including the remaining portion of Goldfield Creek, the Goldfield Creek diversion, and
Watercourse M.
20.2.4 Atmospheric Environment
The Project is located in a rural location of northern Ontario where air quality is primarily influenced by the
Ward of Geraldton and traffic on Highway 11. Measured levels of nitrogen dioxide, sulphur dioxide, and
inhalable particulate matter were below their applicable provincial criteria. The maximum measured
concentrations of total suspended particles and all metals with Ministry of the Environment, Conservation
and Parks (“MECP”) air quality criteria were well below their applicable criteria. The maximum measured
concentrations of all volatile organic compounds with MECP air quality criteria were well below their
applicable criteria except for benzene, which exceeded the MECP annual average ambient air quality
criteria (“AAQC”). Maximum measured polycyclic hydrocarbons (“PAHs”) concentrations were below their
applicable criteria except for benzo(a)pyrene (B(a)P), which exceeded the MECP 24-hour and annual
average AAQCs. The methodology used to develop the background levels is expected to be conservative
and over-estimate actual background levels in the Geraldton area.
20.2.5 Acoustic Environment
The major contributors to baseline acoustical environment were found to be the traffic noise from
Highway 11, Michael Power Boulevard and the natural environment. Baseline sound levels were found to
be dominated by traffic noise during the daytime and natural environment during the nighttime. No “non-
traffic anthropogenic sources” were found to be major contributors to the acoustic environment, and no
tonal or excessive low frequency noise was encountered during field studies. The field observations and
measurements of baseline noise indicate that the receptors area closer to the roads are characteristic of a
Class 2 acoustical environment and the rest of the receptors are with the characteristic of a Class 3
acoustical environment as defined in the MECP NPC-300 guideline.
NI 43-101 Technical Report Feasibility Study Update Hardrock Project, Ontario, Canada
Section 20 January 2021 Page 20-9
20.2.6 Groundwater
Field activities to confirm hydrogeological conditions were completed from 2013 to 2019 and included
borehole drilling and groundwater monitoring well installation, well development, hydraulic response testing,
test pits, drive point piezometer and pressure transducer installation, water level monitoring and
groundwater quality sampling.
The overburden and shallow bedrock are considered to be hydraulically connected. Groundwater levels
are generally found at 1 m to 2 m below ground surface. Groundwater flow is strongly influenced by
topography, which results in localized groundwater flow from topographic highs with groundwater discharge
to wetland areas or surface water features. Overall, the regional groundwater flow within overburden is to
the southeast toward Kenogamisis Lake. Significant water producing fractures or faults were not
encountered during the drilling and testing completed, suggesting that significant water inflow issues from
natural fractures or faults are not expected during open pit development. This is supported by the historical
underground mining that did not identify significant water inflow issues.
Elevated concentrations of hardness, iron, manganese, and colour were consistently observed at the
majority of background monitoring wells in the overburden and bedrock and are typical of groundwater in
Ontario and are reflective of the natural mineralization and geochemical processes in the area. Overburden
and bedrock water quality away from historical mining areas was generally of good quality with parameters
occasionally above the Ontario Drinking Water Quality Standards reflective of location conditions.
There are several historical or existing land uses identified that have contributed to the degradation of water
quality in the Project area. The historical MacLeod and Hardrock tailings contain elevated concentrations
of arsenic and cobalt above the MECP Aquatic Protection Values. The historical Hardrock tailings water
quality is generally similar to the historical MacLeod tailings with the exception of elevated concentrations
of cyanide, cadmium, lead, nickel, and silver above the MECP Aquatic Protection Values and a small area
of the tailings that is considered acid generating (referred to as the reactive tailings). Seepage from the
historical tailings has been identified to affect water quality within Barton Bay and the Central Basin of
Kenogamisis Lake, particularly arsenic concentrations, which are well above the PWQO for groundwater
within the historical tailings.
The historical underground workings associated with the MacLeod-Mosher and Hardrock mines are
currently flooded and will be dewatered prior to and during open pit mining. Water quality associated with
Hardrock Shaft No. 1 had concentrations of cobalt that consistently exceeded the PWQO and
concentrations of chloride, arsenic, copper, iron, and zinc that at times exceeded the PWQO or Interim
PWQO. Water quality associated with the MacLeod-Mosher underground workings was characterized from
NI 43-101 Technical Report Feasibility Study Update Hardrock Project, Ontario, Canada
Section 20 January 2021 Page 20-10
samples collected at Mosher Shaft No. 1. They had concentrations of iron and zinc that consistently
exceeded the PWQO and concentrations of arsenic that consistently exceeded the Interim PWQO. No
discharge from the MacLeod-Mosher underground workings currently occurs.
20.2.7 Soil Quality
Soil investigations in the area of the former MacLeod-Mosher and Hardrock plant sites identified elevated
arsenic concentrations at approximately 65% of the test pits/test holes and antimony and cobalt at
approximately 25% of the test pits/test holes. Various other metals were found to exceed the applicable
standards in approximately 10% of the test pits/test holes. Hydrocarbon impacts were identified associated
with active and former fuelling stations that will be decommissioned as part of the Project as they are located
within the open pit footprint. Hydrocarbon and metal affected soil exceeding applicable criteria will be taken
offsite to an approved facility as applicable under the Environmental Protection Act and Ontario
Regulation 347. Additional soil testing was completed in 2018 to support the development of a Soil
Management Plan and in 2020 to characterize soil quality in areas of mine infrastructure prior to disturbing
the soil as part of construction. A Soil Management Plan is being prepared to provide guidance on the
management of excess soil generated during the development and operation of the Project, including soil
contaminated by historical activities. A Historical Tailings Management and Relocation Plan is being
developed that outlines the management required and sequencing for relocation of historical tailings.
20.2.8 Surface Water
20.2.8.1 Hydrology
The PDA is located in the Kenogamisis River watershed, adjacent to Kenogamisis Lake. The lake is long,
narrow, shallow and consists of four main basins referred to as the Southwest Arm, Barton Bay Basin, the
Central Basin and Outlet Basin. Water levels within Kenogamisis Lake are controlled by the Kenogamisis
Lake Dam, which is operated under the guidance of the Aguasabon River System Water Management
Plan. The normal operating water level range for Kenogamisis Lake is between 329.32 masl and
329.70 masl with two Cautionary Compliance Zones to provide flexibility during winter and spring freshet
conditions.
The Kenogamisis River is the major river in the study area. Its watershed area upstream of the Southwest
Arm of Kenogamisis Lake is 760 km2 and provides approximately 92% of total inflow into the Southwest
Arm of Kenogamisis Lake and 65% of total inflow into the Outlet Basin of Kenogamisis Lake. The flow
regime of the Kenogamisis River is similar to other rivers in the area with high spring flows in April–May and
low flows in summer (July–August) and winter (November–March).
NI 43-101 Technical Report Feasibility Study Update Hardrock Project, Ontario, Canada
Section 20 January 2021 Page 20-11
The two primary permanent watercourses located in the PDA are the Southwest Arm Tributary and
Goldfield Creek. The Southwest Arm Tributary is a second order tributary draining directly to Kenogamisis
Lake. The main branch of this watercourse originates in a wetland that drains eastward for a distance of
approximately 3.3 km before discharging into Kenogamisis Lake. Goldfield Creek is a larger watercourse
with a watershed area of 32 km2. The creek originates at Goldfield Lake and drains in an easterly direction
towards Kenogamisis Lake. Goldfield Creek will be diverted to allow construction of the new TMF and
connected to the Southwest Arm Tributary. Other areas of the PDA drain towards Mosher Lake and Barton
Bay and the Central Basin of Kenogamisis Lake.
20.2.8.2 Surface Water Quality
Baseline water chemistry data were collected monthly or bimonthly from 2013 to 2018 and quarterly since
2018 and compared with historical results spanning almost 40 years of data. Surface water quality was
generally moderately hard (moderately high mineral content), circumneutral in pH (mean values of 6.1 to
8.1), with mean total dissolved solids concentrations in the range of 107 mg/L to 131 mg/L and typical of
northern Ontario lakes. Nutrient levels tended to be low, except for Barton Bay, which is affected by
discharge from the municipal sewage treatment plant. With the exception of arsenic, copper, iron, and lead,
metal concentrations in Kenogamisis Lake were present at levels below the Canadian Water Quality
Guidelines for Freshwater Aquatic Life (“CWQG”) and PWQO. Seasonal and spatial trends were evident in
the data with the lowest concentrations measured during the spring freshet, which increased gradually
through the summer and fall. Barton Bay and the Central Basin of Kenogamisis Lake have the highest
metal concentrations and are attributed to the effects of historical mine operations and sewage treatment
plant discharges in Barton Bay. In lakes and creeks, sampled as unaffected background or reference lakes,
most metals concentrations were below CWQGs and PWQOs.
Historical mining activities have contributed to the degradation of groundwater and surface water quality
within the area of the PDA. An assessment of arsenic loading to Kenogamisis Lake was completed using
a mass balance approach, which provides an accounting of the total arsenic loading on both an individual
basin and overall lake perspective. The mass balance calculations indicate that while a small component
of flow, the discharge of groundwater from historical tailings represents approximately 60% of the total
arsenic load leaving the Outlet Basin, and about 55% of the total load leaving Kenogamisis Lake at the
control dam. By the time water from Barton Basin mixes with water from the Central Basin and Southwest
Arm, mean arsenic concentrations are at 9 µg/L, just above the Interim PWQO of 5 µg/L, with
concentrations remaining similar through the Outlet Basin.
NI 43-101 Technical Report Feasibility Study Update Hardrock Project, Ontario, Canada
Section 20 January 2021 Page 20-12
20.2.9 Fish and Fish Habitat
Characterizing fish and fish habitat in the study area included a review of pre-existing background
information and the completion of field work in 2013, 2014, and 2015. Field work included the collection of
fish habitat, fish community, fish tissue, sediment quality and benthic community data. Lakes within the
study area provide cool water habitat with larger lakes such as Kenogamisis and Goldfield Lake providing
a diversity of aquatic vegetation, cover and substrate types. Larger lakes also provided greater bathymetric
structure (i.e., humps, shoals, flats, etc.).
There was an abundance of potential spawning habitat for Northern Pike and Yellow Perch throughout most
lakes within the study area. Important spawning and feeding habitat for species like Walleye and Lake
Whitefish was documented where the Kenogamisis River and Magnet Creek flow into Kenogamisis Lake.
Important spawning habitat for these species may also be provided by rocky mid-lake shoals in
Kenogamisis Lake and Goldfield Lake.
Moderate sized streams such as Goldfield Creek and its main tributary provided a variety of cover types
and habitats, although riffle habitat was limited throughout the study area. These streams provided an
abundance of potential Northern Pike spawning habitat in adjacent wetlands when they become inundated
in the spring. Despite good cover, fish abundance and species diversity were considered low in the study
area streams. The exception to this was large numbers of small bodied fish that may use lower stream
reaches to spawn.
Shallow, isolated ponds and first order watercourses in the study area likely freeze to the bottom in winter,
limiting fish use in these types of habitat. Highly organic substrates and ice cover may also create anoxic
conditions in these areas, further limiting fish distribution.
More than 6,080 individual fish, consisting of 24 species were captured during baseline studies between
September 2013 and October 2015. No species identified were listed as federal or provincial species at
risk (“SAR”), nor are SAR expected to occur in the study area. Game and sustenance fish species, including
Walleye, Lake Whitefish, Northern Pike, Yellow Perch and Burbot, were present in Kenogamisis and
Goldfield Lakes.
Extensive data on metals in fish tissue from Kenogamisis Lake have been collected by the MECP for more
than 30 years. These data were collected for large bodied fish, primarily sport fish. Mean total arsenic
concentrations in forage fish were higher than in game fish. There is no standard provincial or federal
consumption guideline for arsenic; however, sport fish from the study area did not exceed consumption
guidelines published for other countries. Background concentrations of total mercury in Walleye were above
NI 43-101 Technical Report Feasibility Study Update Hardrock Project, Ontario, Canada
Section 20 January 2021 Page 20-13
the partial restriction guideline for human consumption (0.26 mg/kg). A bioavailability study was completed
and concluded that, while the current elevated levels of arsenic and other metals in water and sediments
of Barton Bay and the Central Basin may lead to bioaccumulation, the end points examined did not indicate
adverse effects on phytoplankton, benthic invertebrates, or fish.
20.2.9.1 Sediment Quality
Sediment samples were collected throughout the study area in 2013 and 2014 to supplement sediment
data collected from Kenogamisis Lake in 2011. Copper and arsenic commonly occur in sulphide-based
minerals and the Geraldton area is rich in such minerals, so some naturally elevated levels of copper,
arsenic and other metals are expected. Arsenic exceeded the MECP Lowest Effect Level (“LEL”) and
Severe Effect Level (“SEL”) at most sampling stations including Lake A-322, Goldfield Lake and Mosher
Lake. Within Kenogamisis Lake, the SEL for arsenic was only exceeded in Barton Bay and in the Central
Basin. Common parameters that exceeded the LEL in the study area were cadmium, chromium, copper,
lead and nickel. Exceedances of the LEL for zinc occurred in individual replicates from the Central Basin
and Barton Bay. Additional sediment sampling was carried out in 2019 targeting a larger sample size and
statistically unbiased sampling in all six sub-basins of Kenogamisis Lake (126 randomly located stations in
all) to obtain a defensible baseline sediment quality dataset prior to construction.
20.2.10 Vegetation Communities
The Project is located along the southern boundary of the Boreal Forest Region, in northern Ontario. Typical
forest cover is a mix between deciduous and coniferous forest cover as well as coniferous swamp;
vegetation communities are predominantly coniferous with deciduous associates. White and black spruce,
tamarack, balsam fir and jack pine are common throughout the area with frequent occurrences of deciduous
vegetation communities and species, including white birch, trembling aspen and balsam poplar.
Anthropogenic disturbances in the Project area have resulted in a variety of vegetation communities,
ranging from open disturbed sites showing early successional growth to mature naturalized deciduous and
coniferous forest communities. In the PDA, ecosites were approximately 40% conifer dominated upland
forest, 10% hardwood dominated forest, 2% mixed forest, 35% swamp and <2% open wetland (marsh, bog,
and fen) communities. The remaining <1% cover was shallow open water. Disturbed ecosite types made
up 11% of the PDA.
A total of 253 species of vascular plants were recorded in the study area, of which 91% (230 species) were
native and 9% (23 species) were not native species. No plant SAR or Species of Conservation Concern
(“SOCC”) were recorded in the study area during botanical inventories and are assumed to not be present
in the study area. No known Provincially Significant Wetlands or provincially rare communities were
NI 43-101 Technical Report Feasibility Study Update Hardrock Project, Ontario, Canada
Section 20 January 2021 Page 20-14
identified in the study area. One sensitive, but not provincially designated as rare, wetland community was
identified adjacent to the northeast limits of the proposed TMF. Although this ecosite community type (B136)
is not listed as a provincially rare vegetation type, it could be considered a sensitive feature due to its size
and potential to support habitat for Taiga alpine butterfly (“SOCC”).
20.2.11 Wildlife and Wildlife Habitat
Field investigations identified a variety of wildlife species in the study area. Fifteen SAR and SOCC were
recorded during baseline surveys for the Project. Of these, eight are confirmed to be either resident or
breeding within the vicinity of the Project: barn swallow, bald eagle, Canada warbler, eastern wood-pewee,
common nighthawk, northern myotis, little brown myotis and taiga alpine butterfly.
The analysis of results identified a number of terrestrial features and associated wildlife habitat for SAR and
SOCC within the study area. The following habitat for SAR and SOCC were identified in the LAA during
baseline field investigations:
• Breeding habitat for Canada warbler (SAR) and eastern wood-pewee (SOCC);
• Potential breeding habitat for common nighthawk (SAR);
• Barn swallow (SAR) nests and foraging habitat;
• Bald eagle (SOCC) nests and foraging habitat;
• American white pelican (SAR) stopover and foraging habitat on Kenogamisis Lake;
• Category 3 habitat (MNR 2013b) for woodland caribou (SAR);
• Potential natural bat (SAR) maternity roost habitat;
• Potential anthropogenic bat (SAR) maternity roost habitat;
• Significant Wildlife Habitat (SWH) for waterfowl nesting;
• SWH for moose late winter cover;
• SWH for turtle overwintering;
• SWH for amphibian breeding; and,
• SWH for Taiga alpine butterfly (SOCC).

NI 43-101 Technical Report Feasibility Study Update Hardrock Project, Ontario, Canada
Section 20 January 2021 Page 20-15
20.2.12 Labour and Economy
Between 2006 and 2011, the population of Ontario increased by approximately 5% while the populations
of the Thunder Bay District and the Municipality of Greenstone decreased by approximately 2% and 4%,
respectively. Available population projections indicate that the municipality will continue to see population
decline, with an estimated population of 4,618 residents in 2018 and 4,480 residents in 2023.
The Northwestern Ontario economic region includes the Districts of Thunder Bay, Rainy River and Kenora.
Spatially, this is the largest economic region in the province, while also having the smallest population of
all Ontario economic regions. Mining is a key component of the economy in Northwestern Ontario with over
80 active exploration projects during 2012, as well as six operational mines.
Key industries providing employment locally in the Municipality of Greenstone include trades; transport and
equipment operations; processing, manufacturing and utilities; agriculture and resource-based industries,
including mining and forestry. Baseline economic conditions indicate that the Greenstone economy has
been in decline, with the number of people in the labour force decreasing by 11% between 2006 and 2011,
and the unemployment rate increasing by two percentage points. In comparison, the size of the labour force
in the District of Thunder Bay decreased by 4% over the same period, while the Ontario labour force
increased by 4%. Within the Municipality of Greenstone, there are higher rates of unemployment in
Indigenous communities than in non-Indigenous communities.
The Thunder Bay District is expected to experience a shortage of skilled workers for mining projects,
primarily because there is a lack of younger people with appropriate skills coming into the regional labour
market. Increased recruitment and retention challenges are also anticipated as competition for workers
increases.
20.2.13 Community Services and Infrastructure
The Town of Geraldton, centrally located in the Municipality of Greenstone, is the service support centre
for the surrounding region including government services (MNRF/Regional Fire Management), Medical
Services (District Hospital), financial services and retail. Overall, the Project is located relatively close to
existing municipal and provincial services, including water and wastewater, waste, transportation, power,
recreational and emergency services. Key local community services and infrastructure in the study area
include:
• Municipal features, including a park, public boat launches and public beaches, among other urban
land uses;
NI 43-101 Technical Report Feasibility Study Update Hardrock Project, Ontario, Canada
Section 20 January 2021 Page 20-16
• Kenogamisis Golf Club;
• MacLeod and Hard Rock townsites;
• Hydro One infrastructure, including a substation and power lines;
• Discover Geraldton Interpretive Centre;
• Highway 11 and Michael Power Boulevard;
• Gas station;
• MacLeod-Cockshutt Mining Headframe; and,
• Ontario Provincial Police station.
Some municipal services and infrastructure have been reported to be at or near capacity, including
wastewater systems and solid waste facilities. Greenstone is designated as an underserviced area by the
Ministry of Health and Long-term Care, which allows the community to access incentive funds for the
recruitment and retention of family physicians. Primarily though, it means that the existing community is
underserviced by health care professionals. Meanwhile, due to population decline, there has been a surplus
of housing in some communities in the Municipality of Greenstone and there are some underdeveloped
designated residential areas to accommodate larger-scale future growth in the Project vicinity, including in
Beardmore, Longlac, Nakina and Geraldton.
20.2.14 Land and Resource Use
Land and resource use has been shaped by mining and forestry activity. In the early 1930s, the region
became known for gold mining; however, extraction ceased during the 1970s leaving forestry as the main
industry and land use in the region. Today, the most extensive land uses in the area are forestry, mineral
exploration, hunting, trapping and fishing. Land and resource use areas and facilities in the local area
include:
• MacLeod Provincial Park, which includes a campground, walking trail, cross-country skiing trails
and public beach;
• Ward of Geraldton, which includes a municipal park, public boat launches and public beaches,
among other urban land uses;
• Barton Bay Wildlife Trail;
• Public access points from Lahtis Road;
• Crown land campsite;
NI 43-101 Technical Report Feasibility Study Update Hardrock Project, Ontario, Canada
Section 20 January 2021 Page 20-17
• One guide outfitter within the LAA (Kenogamisis Lake Resort);
• Snowmobile trails;
• Navigation routes;
• Planned forest harvest areas and forest access roads;
• Trapline areas (two in the PDA: GE021, GE022);
• Bear Management Areas (two in the PDA: GE-21A-032, GE-21A-027); and,
• Bait Harvesting Areas (four in the PDA: NI5035, NI5036, NI5027, NI5028).
20.2.15 Heritage Resources
20.2.15.1 Archaeology Resources
A Stage 1 Archaeological Assessment was completed for the Project to compile all available information
about the known and potential archaeological heritage resources within the study area and to provide
specific direction for the protection, management or recovery of these resources. A Stage 2 assessment
was subsequently completed for areas of archaeological potential, including areas near water sources,
transportation routes, and townsites. The Stage 2 assessment concluded that no archaeological resources
were found in the PDA with no further archaeological assessments recommended.
20.2.15.2 Architectural/Historical Resources
A Cultural Heritage Evaluation Report has been completed to screen for resources of potential cultural
heritage value or interest (“CHVI”), as defined by Ontario Regulation 9/06. Twenty-nine heritage resources
were identified on properties which may be affected by the Project, the vast majority in residential
developments constructed by mining companies. Of these, 18 were determined to be situated within the
PDA.
20.2.16 Traditional Land and Resource Use (TLRU)
TLRU includes traditional activities, sites, and resources identified by Indigenous communities. Project
engagement activities and the review of Project-specific traditional knowledge (“TK”) studies, land use
survey results, and existing literature have confirmed the potential for Project effects on TLRU. One
gathering site (a former family settlement) was identified immediately north of the PDA. Campsites, cabins,
and sacred sites were also identified in the regional assessment area but not within the PDA. Traditional
activities (e.g. hunting, fishing and trapping) also occur in the PDA, LAA, and RAA.
NI 43-101 Technical Report Feasibility Study Update Hardrock Project, Ontario, Canada
Section 20 January 2021 Page 20-18
Project-specific TK studies were completed by Métis Nation of Ontario, Eabametoong First Nation,
Animbiigoo Zaagi’igan Anishinaabek, Ginoogaming First Nation, LL #58 First Nation, and Aroland First
Nation. These studies provide information on the community values associated with the PDA and inform
decision-making on the Project. A review of the information provided by these Indigenous communities, as
well as secondary sources and consultation, informed the identification of potential Project effects on TLRU.
20.3 Environmental Constraints
The Project is located within an area bounded by Kenogamisis Lake to the north, south and east, with
wetland and low-lying areas and associated surface water features to the west. These constraints have
been incorporated into the design of the Project, which has focused on minimizing the environmental
footprint of the Project while respecting environmental features and required setbacks.
GGM currently owns or has purchase agreements or purchase arrangements in principal with all property
owners in the Project Development Area. These include provincial infrastructure related to the MTO patrol
yard, Hydro One transmission and distribution power lines and associated substation, OPP station, the
Discover Geraldton Interpretive Centre, properties within the MacLeod and Hard Rock townsites and Dan’s
General Store (Husky Gas Station). An environmental screening report has been completed by TBTE
(TBTE, 2015) for the proposed Highway 11 realignment, which included the MTO patrol yard, Mosher portal
area, historical MacLeod tailings and the MacLeod Mine landfill. A soil management plan is available and
will be implemented during construction. The potential for soil and groundwater impacts were identified at
the MTO patrol yard based on typical land use; however, comprehensive investigations have not been
completed at this time. Modified Phase 1/2 Environmental Site Assessments (TBTE, 2015) were completed
for a former gas station property (former Larry’s Esso) and the current gas station property located at the
intersections of Highway 11 and Michael Power Boulevard. Soil impacts associated with petroleum
hydrocarbons and arsenic and groundwater impacts associated with petroleum hydrocarbons were
identified. A Soil Management Plan is being prepared to provide guidance on the management of excess
soil generated during the development and operation of the Project.
Historical mining activities have contributed to the degradation of groundwater and surface water quality
within the area of the PDA, particularly with respect to the historical tailings. As discussed in
Subsection 20.4.1.3.4, it is anticipated that the Project will result in an improvement in water quality within
Kenogamisis Lake, having a positive effect on arsenic and iron concentrations due to the reduction in
groundwater discharge associated with the historical MacLeod and Hardrock tailings. This will be achieved
through removal of a portion of the historical tailings for placement within the newly constructed TMF,
installation of seepage collection around the historical tailings as part of the berm and buttress construction
to address long term physical stability, improved cover design for the remaining historical tailings and
NI 43-101 Technical Report Feasibility Study Update Hardrock Project, Ontario, Canada
Section 20 January 2021 Page 20-19
changes in groundwater flow during operations that will allow impacted groundwater to be captured within
the open pit and treated prior to discharge.
Historical mine openings exist within the PDA and are currently capped or secure. The condition of the caps
and security of the existing mine openings have been evaluated with respect to the requirements of
O. Reg. 240/00 during preparation and upgrades will be completed as required during closure. For the
majority of the mine openings, they will be removed during development of the Project and, as a result, a
limited number of openings will remain at closure.
Nine provincial SAR or their habitats have the potential to occur on site: American white pelican (Pelecanus
erythrorhynchos), bald eagle (Haliaeetus leucocephalus), bank swallow (Riparia riparia), barn swallow
(Hirundo rustica), common nighthawk (Chordeiles minor), eastern whip-poor-will (Caprimulgus vociferous),
little brown myotis (Myotis lucifugus), northern myotis (Myotis septentrionalis), and woodland caribou
(Rangifer tarandus caribou). These species and their habitats are protected by the Endangered Species
Act, 2007 with authorizations being provided by MNRF as required during permitting to develop these lands.
GGM will submit applications for the appropriate authorizations to the MECP prior to Project development
(refer to Subsection 20.4.2).
Development of the Project will alter existing activities and facilities within the PDA, including the MacLeod-
Cockshutt Mining Headframe, the Discover Geraldton Interpretive Centre and the Kenogamisis Golf Club.
An agreement has been signed between the Municipality and GGM to support the Municipality’s future
plans with respect to the removal of these facilities.
MacLeod Provincial Park is located 350 m east of the PDA. There are no other provincially or federally
protected areas such as national parks, protected areas, ecological reserves, or conservation reserves near
the Project. There are no Areas of Natural and Scientific Interest, or evaluated Provincially Significant
Wetlands within or near to the Project site. One sensitive, but not provincially designated, rare, fen
community was identified immediately adjacent to the PDA. There are no areas of archaeological resources
identified through baseline studies at the Project site.
NI 43-101 Technical Report Feasibility Study Update Hardrock Project, Ontario, Canada
Section 20 January 2021 Page 20-20
20.4 Environmental Approval Requirements
20.4.1 Environmental Assessment
20.4.1.1 Overview
Federal EA is regulated under the Canadian Environmental Assessment Act 2012 (“CEAA 2012”) and is
administered by the CEA Agency. Under CEAA 2012, “designated” projects included in the Regulations
Designating Physical Activities require a federal EA. The Hardrock Project has been confirmed as a
Designated Project and a federal EA was implemented in accordance with the approved EIS Guidelines
issued to GGM by the CEA Agency on August 5, 2014, with subsequent amendments on February 11, 2016
to include consideration of greenhouse gas emissions and February 12, 2016 related to changes in the list
of Indigenous communities with which GGM is expected to engage.
Under Ontario’s Environmental Assessment Act (“EAA”), mining development projects are not subject to
provincial individual EA requirements because they are carried out by private sector proponents. GGM
entered into a Voluntary Agreement with the MECP to make the entire Project subject to a single individual
EA process in accordance with the approved Terms of Reference (“ToR”) received from the province. A
final ToR was submitted to the MECP on January 2, 2015, and an editorial amendment submitted on
March 31, 2015 for completion of the provincial individual EA under the EAA. The final ToR was approved
with amendments on June 24, 2015; it provided the framework for the individual EA and outlined key steps
and requirements to undertake an EA process and prepare an EA report compliant with the EAA.
GGM completed a coordinated EA to address both federal and provincial EA requirements through a single
process, which resulted in the filling of a single body of information (EIS/EA document) that addressed both
provincial and federal EA processes. The final EIS/EA was submitted to the CEA Agency, MECP,
Indigenous communities and public in July 2017. GGM completed consultation events with the regulatory
agencies as well as the Indigenous communities and local community to present the final EIS/EA and solicit
input and comments. Following receipt of all comments on the final EIS/EA, a supplemental information
package was published in August 2018. Federal approval of the EIS/EA was received in December 2018
and provincial approval was received in March 2019. GGM is now advancing other environmental approvals
required for the Project as described in Subsection 20.4.2.
20.4.1.2 Consultation
Consultation is a key component of both federal and provincial EA processes to engage interested parties
to identify and address concerns with Project planning and implementation. Consultation with government,
NI 43-101 Technical Report Feasibility Study Update Hardrock Project, Ontario, Canada
Section 20 January 2021 Page 20-21
Indigenous communities and the public has been ongoing since before the formal start of the EA processes,
and has included opportunities to review Project information and provide input at key stages in EA
development. GGM’s consultation program reflects the requirements of the federal EIS Guidelines and
approved provincial ToR. Refer to Subsection 20.5 for further details regarding consultation and
engagement activities undertaken in support of the Project.
20.4.1.3 Preliminary Effects Assessment
The methods that were used to conduct the environmental effects assessment were designed to meet the
combined requirements of CEAA 2012 and the EAA. These methods are based on a structured approach
that, particularly:
• Considers the federal and provincial regulatory requirements for the assessment of environmental
effects as defined by CEAA 2012 and the EAA, with specific consideration of the requirements of
the ToR and EIS Guidelines;
• Considers the issues raised by the public, Indigenous communities and other stakeholders during
consultation and engagement activities conducted to date;
• Focuses on issues of greatest concern that arise from the above considerations;
• Considers existing environmental conditions of the area, particularly historical activities and resulting
environmental effects that might have affected baseline conditions;
• Integrates engineering design and programs for mitigation and monitoring into a comprehensive
environmental planning and management process that will be applied during the design and
implementation of the Project;
• Considers the Project in a careful and precautionary manner, to avoid significant adverse
environmental effects.
The environmental effects assessment methods addressed both Project-related and cumulative
environmental effects based on the Project description at the completion of the final EIS/EA. Project-related
environmental effects and cumulative environmental effects are assessed using a standardized
methodological framework for each VC. Two conditions must be met to initiate an assessment of cumulative
effects on a VC: firstly, the Project is assessed as having adverse residual environmental effect on a VC;
and secondly, the adverse residual effects from the Project overlap spatially or temporally with residual
effects of other physical activities on a VC. Cumulative environmental effects are assessed to determine
whether they could be significant, and to consider the contribution of the Project to them.
NI 43-101 Technical Report Feasibility Study Update Hardrock Project, Ontario, Canada
Section 20 January 2021 Page 20-22
The following sections present a summary of the environmental effects assessment, proposed mitigations
and determination of significance for each VC from the final EIS/EA.
Atmospheric Environment
The potential environmental effects of the Project on the atmospheric environment include change in
ambient air quality, climate change and change in lighting. As part of the assessment, mitigation measures
were identified that will be applied to the Project to avoid or reduce effects.
For construction, operation and closure, mitigation measures include: implementing a fugitive dust best
management plan; using dust suppressants; maintaining vehicles, implementing a ‘no idling’ policy to
reduce emissions; applying speed limits to reduce dust from vehicles travelling on gravel roads; minimizing
of haul routes to reduce vehicles use, locating portable lighting equipment where, to the extent feasible, it
is not visible at nearby receptors; and the use of directional light fixtures to avoid the transmission of light
outside of the PDA.
During operation, additional mitigation measures will include: equipping primary and secondary crushers
with a dust collection system; enclosing the mill feed storage area; using scrubbers on grinding operations
and the induction furnace; managing fugitive dust emissions; limiting off-site light effects through the use of
downlighting; and implementing a greenhouse gas (“GHG”) management plan to minimize and track GHG
emissions. In addition, new mobile equipment onsite will meet applicable Transport Canada off-road vehicle
emission requirements.
With mitigation in place, air quality emissions resulting from construction and closure are expected to be
temporary and within applicable regulatory objectives, standards and guidelines. Overall, the Project’s
contribution to total Canadian annual GHG emissions would be up to 0.04% (based on 2014 GHG emission
levels). Short-term GHG emissions from equipment are expected during construction and closure. During
operation, the Project is expected to emit no more than 264 kt of CO2e per year.
The Project baseline conditions were characterized as being rural (characterized by low district brightness)
regarding lighting. The change in ambient lighting outside the Project boundary during operation is expected
to be within guidelines for rural areas.
Residual adverse environmental effects on the atmospheric environment were determined to be not
significant.
NI 43-101 Technical Report Feasibility Study Update Hardrock Project, Ontario, Canada
Section 20 January 2021 Page 20-23
Acoustic Environment
The potential environmental effects of the Project on the acoustic environment include change in noise and
change in vibration levels. As part of the assessment, mitigation measures were identified that will be
applied to the Project to mitigate effects.
During construction and closure, major construction activities will be scheduled during daytime hours
(e.g. 07:00 to 19:00), where possible, to avoid impact during sensitive nighttime periods. Other noise
mitigation measures include installing muffler systems for the combustion exhausts, properly maintaining
equipment, and implementing a complaint procedure to address any noise complaints should they arise.
Preliminary blast design will meet the MECP’s criteria for noise and vibration and all blasting will occur
during the daytime.
During the operation phase, mitigation measures include selecting quieter equipment and/or designing
acoustical enclosures and louvres to limit overall noise emissions and equipping generator inlets, radiator
exhausts and combustion and exhaust stacks in the powerhouse with silencers.
With mitigation measures in place, predicted sound levels are expected to meet regulatory requirements at
all Points of Reception and Points of Interest. The magnitude of vibration effects from Project-related
activities is not predicted to exceed applicable guideline criteria and thresholds.
Residual environmental effects on the acoustic environment were determined to be not significant.
Groundwater
The potential environmental effects of the Project on the groundwater include change in groundwater levels
and/or flow and change in groundwater quality. As part of the assessment, mitigation measures were
identified that will be applied to the Project to avoid or reduce effects.
Mitigation measures for groundwater quantity and flow include: using standard management practices
throughout the Project, including drainage control and excavation and open pit dewatering; limiting the
construction footprint (i.e., PDA) to the extent possible to reduce the potential for reductions in groundwater
recharge and limit the number of watersheds overprinted by the PDA; Use standard construction methods,
such as seepage cut-off collars, where trenches extend below the water table to mitigate preferential flow
paths; return water generated from historical underground dewatering (with treatment at the ETP as
required) to Kenogamisis Lake during operation to offset a reduction in groundwater discharge and
NI 43-101 Technical Report Feasibility Study Update Hardrock Project, Ontario, Canada
Section 20 January 2021 Page 20-24
considering accelerating open pit filling at closure to re-establish groundwater levels to near pre-mining
conditions as quickly as possible.
Mitigation measures for groundwater levels and flow include: implementing progressive rehabilitation
(placement of vegetated soil cover) to reduce infiltration into the WRSAs and TMF; designing the WRSAs
to increase the amount of runoff and reduce the amount of infiltration through the WRSAs; removing
approximately 22% of the historical MacLeod tailings and 77% of the historical Hardrock tailings as well as
contaminated soil from historical process plant areas; installation of a subsurface seepage collection system
around a portion of the base of the historical MacLeod high tailings to collect seepage and groundwater
recharge from the tailings; enhancing the cover over the remaining historical MacLeod high tailings;
constructing runoff and seepage collection ditches and ponds around the overburden storage area, ore
stockpile, WRSAs and the TMF; and implementation of cyanide detoxification technology to reduce cyanide
concentrations and precipitate metals at the process plant, resulting in an improvement in water quality
within the TMF.
Regarding groundwater levels and flow, the water table will be lowered in the local area due to dewatering
of the open pit, however, there are no groundwater supply users within the area affected and the lands are
owned or under lease by GGM. Groundwater quality is predicted to meet regulatory criteria at the point of
discharge. In addition, there will be an overall reduction in loading to surface water features as a result of
the removal of a portion of the historical tailings and changes in groundwater flow resulting in a positive
change. Arsenic loading from groundwater discharge to surface water bodies is predicted to decrease by
99% during operations and 59% during closure.
Residual adverse environmental effects on groundwater were determined to be not significant.
Surface Water
The potential environmental effects of the Project on the surface water include change in surface water
quantity and change in surface water quality. As part of the assessment, mitigation measures were
identified that will be applied to the Project to avoid or reduce effects.
Mitigation measures related to surface water quantity and quality include, but are not limited to: limiting the
Project footprint to the extent practicable to reduce contact water volumes and management requirements;
maintaining existing drainage patterns with the use of culverts; maintaining access roads to improve water
flow, reduce erosion and manage vegetation growth; inspecting culverts periodically and removing
accumulated material and debris; designing the Goldfield Creek diversion channel to convey the peak flow;
implementing progressive rehabilitation to reduce infiltration into the WRSAs and TMF; improving water
NI 43-101 Technical Report Feasibility Study Update Hardrock Project, Ontario, Canada
Section 20 January 2021 Page 20-25
quality within the TMF through cyanide detoxification; designing water management and storage
infrastructure to control peak discharges to surface water; reusing contact water to reduce freshwater
intake, effluent treatment and discharge requirements and treating effluent prior to discharge; and
implementing progressive water management over the life of the mine including development of drainage
controls for areas only prior to the development and expansion of these features.
Regarding water quantity, changes in drainage patterns, including from the Goldfield Creek diversion, will
be contained within the LAA with flow continuing to the Southwest Arm, there will be limited changes to
flows in Kenogamisis Lake and the flow will be within the range of background variability. With the design
and mitigation for the Goldfield Creek diversion, a significant effect on water quantity is not predicted from
the Project.
Regarding water quality, mine effluent discharge is predicted to meet baseline concentrations or PWQO
within a relatively small mixing zone that does not extend beyond the Southwest Arm of Kenogamisis Lake.
The removal and capping of historical MacLeod and Hardrock tailings and the subsequent reductions in
groundwater discharge due to the Project are predicted to result in a decrease in arsenic concentrations in
Barton Bay, Central Basin and Kenogamisis Lake Outlet Basin during operation. Overall, the Project is
anticipated to result in an improvement in water quality within Kenogamisis Lake, having a positive effect
on arsenic, sulphate and iron concentrations in Barton Bay, and a positive effect on arsenic in Central Basin
and Outlet Basin due to the reduction in groundwater discharge associated with the historical MacLeod and
Hardrock tailings.
Residual adverse environmental effects on surface water were determined to be not significant.
Fish and Fish Habitat
The potential environmental effects of the Project on fish and fish habitat include lethal and sub-lethal
effects on fish, permanent alteration of fish habitat and loss of fish habitat. As part of the assessment,
mitigation measures were identified that will be applied to the Project to avoid or reduce effects.
Mitigation measures for fish and fish habitat include, but are not limited to: project design (i.e. avoiding
sensitive fish habitats where reasonably feasible); managing construction effects on fish by working “in the
dry” by isolating work areas; performing fish salvages to transfer fish from work areas, and complying with
in-water timing restrictions; implementing an offsetting plan for impacts to fish that cannot be fully mitigated;
developing and implementing effluent discharge criteria; and designing water intake and effluent outfalls to
prevent entrainment or impingement of fish. GGM will implement a Spill Prevention and Response Plan,
NI 43-101 Technical Report Feasibility Study Update Hardrock Project, Ontario, Canada
Section 20 January 2021 Page 20-26
Aquatics Effects Management and Monitoring Plan and follow DFO guidelines for the use of explosives
near water.
Fish mortality can be avoided during all phases of the Project such that there is no substantive residual
effect on fish mortality. The Project has been designed to reduce the potential for causing fish mortality
through avoidance and mitigation measures. Alteration of fish habitat will result from changes to flow and
drainage. Project designs have reduced effects on local waterbodies such that significant effects on fish
and fish habitat are not anticipated. Effects on sustainability and productivity of fish habitat within the local
area are not anticipated. Approximately 6.58 ha fish habitat will be lost or permanently altered, much of
which consist of marginal or degraded habitat (e.g. ephemeral watercourses, artificial ponds and roadside
ditches). The creation of new fish habitat in conjunction with the diversion of Goldfield Creek will offset the
potential effects on fish and fish habitat.
Residual adverse environmental effects on fish and fish habitat were determined to be not significant.
Vegetation Communities
The potential environmental effects of the Project on vegetation communities include change in abundance
of vegetation communities, change in function, connectivity and quality of vegetation communities and
change in abundance of plant species of interest. As part of the assessment, mitigation measures were
identified that will be applied to the Project to avoid or reduce effects.
The primary mitigation for vegetation communities is progressive rehabilitation of the PDA which will
commence at the end of construction. In addition, GGM will implement a Biodiversity Management and
Monitoring Plan designed to mitigate adverse effects on vegetation and wetlands during construction and
operation, including timely restoration of affected vegetation communities, control of invasive species and
protection of sensitive species. Other mitigation measures include those implemented to reduce effects
from dust and sedimentation and effects on groundwater drawdown or surface water supply to mitigate
effects on wetlands. In addition, where there is interest, GGM will provide opportunities to local communities
for harvesting of plants for traditional purposes prior to construction.
With regard to change in abundance of vegetation communities although it was estimate that the removal
of approximately 1,133 ha of upland vegetation communities and 810 ha of wetland vegetation communities
in the PDA will be required, given that the community types that will be removed are generally common and
widespread in the RAA, the loss of the community types in the PDA is not predicted to jeopardize the long-
term viability of the community types.
NI 43-101 Technical Report Feasibility Study Update Hardrock Project, Ontario, Canada
Section 20 January 2021 Page 20-27
With regard to change in function, connectivity and quality of vegetation communities, changes in surface
water flow/drainage, dust deposition, the introduction of invasive species, fragmentation and groundwater
drawdown may affect vegetation and wetland communities; however it is not expected to threaten the long-
term viability of a vegetation community type in the regional area.
With regard to change in the abundance of plant species of interest, clearing of vegetation during
construction will result in the removal of plant species of interest to Indigenous communities; however, plant
species in the PDA are common species throughout the region and there is potential to incorporate plant
species of interest to Indigenous communities during rehabilitation, where use and establishment of these
species is appropriate and technically feasible. No plant SAR or SOCC were recorded in the PDA.
Residual adverse environmental effects on vegetation communities were determined to be not significant.
Wildlife and Wildlife Habitat
The potential environmental effects of the Project on wildlife and wildlife habitat include change in wildlife
habitat, change in mortality risk and change in movement. As part of the assessment, mitigation measures
were identified that will be applied to the Project to avoid or reduce effects.
Mitigation of potential Project effects on wildlife and wildlife habitat will be accomplished through the
implementation of a Biodiversity Management and Monitoring Plan and the progressive restoration of
vegetation communities and wildlife habitat. GGM will obtain any required authorizations under the
Endangered Species Act and adhere to applicable timing windows. Additionally, mitigation measures
proposed for other VCs (e.g. vegetation communities) or as part of other environmental management and
monitoring plans (e.g. noise) will either directly or indirectly reduce effects on wildlife.
Effects on SAR and significant wildlife habitat are not predicted to affect the sustainability of wildlife within
the region and will be partially reversible following closure. In addition, indirect effects from habitat
avoidance due to sensory disturbance will be reversed following the completion of active closure activities.
Project effects will not result in the irreversible loss of critical habitat for a species listed on Schedule 1 of
the Species at Risk Act.
With regard to change in wildlife mortality risk, with the implementation of mitigation measures, the residual
adverse effect on wildlife mortality is predicted to be within the normal variability of baseline conditions and
is not expected to affect the long-term persistence or viability of wildlife within the region Project effects will
not result in the permanent, irreversible loss of a species listed on Schedule 1 of the Species at Risk Act or
listed as threatened or endangered under Endangered Species Act.
NI 43-101 Technical Report Feasibility Study Update Hardrock Project, Ontario, Canada
Section 20 January 2021 Page 20-28
While the Project will affect existing wildlife movement in the local area, the effects will be limited spatially
and temporally and new wildlife movement patterns are predicted to be established in response to
rehabilitation within the PDA.
Residual adverse environmental effects on wildlife and wildlife habitat were determined to be not significant.
Labour and Economy
The potential environmental effects of the Project on labour and economy include changes in both. As part
of the assessment, mitigation measures were identified that will be applied to the Project to avoid or reduce
effects.
It is expected that the Project will result in positive effects on labour by employing local and Indigenous
workers and reducing the unemployment rate in the local area. These positive effects do not require
mitigation, but GGM commits to implementing various mechanisms for enhancing Project benefits through
construction and operation such as: posting job qualifications and identifying available training programs
and providers so that local and Indigenous residents can acquire the necessary skills and qualify for
potential employment; working with local and Indigenous businesses to enhance the opportunity to
participate in the supply of goods and services for construction and operation; working with the affected
local communities to develop training programs oriented to operational needs; and implement the Project’s
labour and training framework, which includes partnerships with Indigenous communities and education
institutes, information sharing (e.g. skills databases) and employment preparation and training. During
closure, GGM will establish a skills inventory to be retained for active closure, support re-training to establish
transferable skills, provide opportunities for voluntary redundancies during ramp-down (e.g. early
retirement), provide redundancy payments, and provide job search assistance. Standard mitigation
measures related to the loss of timber by salvaging merchantable timber in accordance with provincial
requirements will be implemented. GGM will continue to communicate with the enhanced Forest Resource
Licence holder to obtain an Overlapping Agreement and to harvest the trees under their pulp mill license.
GGM has consulted with the municipality and developed an agreement to mitigate potential adverse effects
on tourism resulting from the removal of existing structures, in particular the Kenogamisis Golf Club,
MacLeod-Cockshutt Mining Headframe and the Discover Geraldton Interpretive Centre.
The overall Project effect on labour and economy is positive given the direct, indirect and induced benefits
of Project expenditures. The Project will result an increase in the size of the labour force and reductions in
the unemployment rate. The Project is also anticipated to result in increases in household incomes,
increased opportunities for local and Indigenous businesses and contributions to municipal taxes.
NI 43-101 Technical Report Feasibility Study Update Hardrock Project, Ontario, Canada
Section 20 January 2021 Page 20-29
Residual adverse environmental effects on labour and economy were determined to be not significant.
Community Services and Infrastructure
The potential environmental effects of the Project on community services and infrastructure include change
in capacity of housing and accommodations, change in capacity of municipal and provincial services and
infrastructure, and change in capacity of transportation services and infrastructure. As part of the
assessment, mitigation measures were identified that will be applied to the Project to avoid or reduce
effects.
The mitigation measure for housing and accommodation is the use of a temporary camp to accommodate
the peak number of construction workers. Mitigation measures for municipal and provincial services and
infrastructure include maintaining communication with relevant agencies and organizations to provide
information and identify and address potential Project-related implications for services and infrastructure,
and to support responsible organizations in planning for, adapting to, or benefitting from Project-related
changes in demand. GGM will offer its employees an Employee Assistance Program and require pre-
employment physicals. Project workforce education to encourage healthy lifestyle choices, sensitivity
training and strict enforcement of GGM’s health and safety policies will also help mitigate potential adverse
social effects. Mine rescue vehicles and trained First Responders will be available at the Project site and
new employees will be required to take mandatory safety orientations. Employees will be trained in fuel
handling, equipment maintenance, fire prevention and response measures. The Project site will be
controlled through security measures.
Mitigation for recreation and entertainment services and infrastructure includes providing the temporary
camp with dining services and a basic recreational area to accommodate the peak number of construction
workers. GGM will maintain the Kenogamisis Golf Club clubhouse and the front nine holes and act in
accordance with the agreement developed with the municipality regarding future plans for the MacLeod-
Cockshutt Mining Headframe, the Discover Geraldton Interpretive Centre and the golf course. Further
mitigation measures for provincial and municipal services and infrastructure include providing notice to the
local school board regarding scheduling and human resources planning for the school board to prepare for
the enrollment of additional students. To mitigate effects on local infrastructure and utilities, GGM will bus
construction workers to and from the temporary camp to limit Project-related traffic, use an on-site natural
gas-fueled power plant and electrical/recovered heat distribution system to supply heat and power for
Project operation and have Project-dedicated sewage treatment facilities. Throughout the Project, GGM
will schedule arrivals/departures of employee traffic to occur earlier than the existing observed a.m. peak
hour for local traffic and later than the existing observed p.m. peak hour as well as schedule alternating
work shifts so that all workers do not arrive in and leave the area at the same time to limit Project-related
NI 43-101 Technical Report Feasibility Study Update Hardrock Project, Ontario, Canada
Section 20 January 2021 Page 20-30
demands on both highway and air services and infrastructure. A third-party sewage disposal contractor will
provide portable washroom facilities during early construction until the STP and sewage discharge line is
set up and during active closure when facilities are decommissioned.
Residual adverse environmental effects on community services and infrastructure were determined to be
not significant.
Land and Resource Use
The potential environmental effects of the Project on land and resource use include change in recreational
land and resource use, change in commercially based land and resource use and change in navigation. As
part of the assessment, mitigation measures were identified that will be applied to the Project to avoid or
reduce effects.
Mitigation measures to reduce adverse effects on recreational land and resource use include: initiating
revegetation as soon as practical after Project components are no longer needed; providing in-kind support
to assist Greenstone Snowmobile Club in improving the existing trail to Longlac; where possible in
accessible areas (e.g. along cleared rights-of-way), leaving trees and other vegetation in place to buffer the
view of Project components, reducing the change in viewshed and muffling nuisance noise; siting the
majority of Project components so as to achieve a 120 m setback for the surface rights reservation area on
claim to lease lands and a 30 m high water mark setback for patent lands (existing vegetation will remain
in these areas); removing construction-related buildings, access roads and laydown areas following
construction; and implementing progressive rehabilitation works, including stabilization and rehabilitation
of aggregate source areas, the north cell of the TMF, plateaus and benches of WRSAs A, B, and C and the
overburden storage areas. Rehabilitation will be designed to meet desired end land uses, end land uses
will be identified in the Closure Plan, in consultation with agencies, stakeholders and Indigenous
communities, as the Project progresses. Mitigation measures related to the atmospheric environment
(Subsection 20.4.1.3.1, acoustic environment (Subsection 20.4.1.3.2, fish and fish habitat
(Subsection 20.4.1.3.5) and wildlife and wildlife habitat (Subsection 20.4.1.3.7) are also considered related
to land and resource use.
In addition to the mitigation measures listed above for recreational land and resource use, to mitigate
potential effects on commercially based land and resource use, GGM will maintain access to mining claims
located on the peninsula east of the PDA.
To mitigate potential adverse effects on navigation, GGM will use established watercourse crossings and
avoid obstructions to navigation; undertake construction activities in a way to prevent debris from flowing
NI 43-101 Technical Report Feasibility Study Update Hardrock Project, Ontario, Canada
Section 20 January 2021 Page 20-31
into a navigable waterbody; and implement the mitigation measures related to surface water quantity (refer
to Subsection 20.4.1.3.4).
GGM will continue to meet with affected tenure holders on a regular basis (i.e. semi-annually) to discuss
issues and concerns and to provide Project updates as well as continue discussions regarding
accommodation for lost trapping areas with trapline licence holders. GGM will continue to consult with
MNRF and the eFRL holder to address, to the extent possible, access to the PDA and the harvest of Crown
timber that will be removed as part of site preparation. Timber removal will be completed in accordance
with the Crown Forest Sustainability Act and Crown Timber Act and GGM will seek a Release of Tree
Reservation under the Public Lands Act to remove trees on patent lands which have timber rights reserved
to the Crown. The Project will be designed to use established watercourse crossings and avoid obstructions
to navigation, and signs will be posted at locations around the perimeter of the PDA to alert local land and
resource users of the presence of the Project and its components to alert boaters of the treated effluent
discharge location. GGM is committed to maintaining alternate access within the PDA to the Southwest
Arm of Kenogamisis Lake during construction and operation. Rehabilitation will be designed to meet desired
end land uses, end land uses will be identified in the Closure Plan, in consultation with agencies,
stakeholders and Indigenous communities, as the Project progresses.
The area where residual effects will occur has been disturbed by previous mining and forestry activities;
however, there will be access restrictions to the PDA. Navigation between Kenogamisis Lake and Goldfield
Lake will be maintained and land and resource use are expected to continue at current levels in the regional
area where there is an abundance of trails, and wildlife resources for hunting, trapping, fishing, guide
outfitting and bait harvesting.
Residual adverse environmental effects on land and resource use were determined to be not significant.
Heritage Resources
The potential environmental effects of the Project on heritage resources include change in archaeological
resources and change to architectural and/or historical resources. As part of the assessment, mitigation
measures were identified that will be applied to the Project to avoid or reduce effects.
Effects on archaeological resources will be avoided since archaeological assessment programs were
conducted in areas of archaeological potential prior to ground disturbance activities. In the event of the
unexpected discovery of additional archaeological resources, mitigation measures include: ceasing
construction or operation within a 20 m radius and contacting relevant authorities prior to the
implementation of procedures and mitigation if an archaeological resource is discovered; a licensed
NI 43-101 Technical Report Feasibility Study Update Hardrock Project, Ontario, Canada
Section 20 January 2021 Page 20-32
archaeologist will be retained by GGM and further archaeological assessment will be conducted with the
involvement of Indigenous communities; key construction and operation staff will be trained in the
recognition of basic archaeological artifacts such as Aboriginal material culture (e.g., clay ceramics, lithic
artifacts, and faunal remains), and Euro-Canadian material culture (e.g. refined ceramics, glassware,
construction debris, and personal effects) in case a potential archaeological resource is found during Project
construction and operation; and GGM will work collaboratively with Indigenous communities to develop a
protocol for communications should previously undocumented archaeological resources be discovered. If
human remains are encountered, GGM will stop work immediately and contact the police or coroner,
Registrar or Deputy Registrar of the Cemeteries Regulation section of the Ontario Ministry of Government
and Consumer Services, as well as the Archaeology Program Unit of the Ministry of Tourism, Culture and
Sport.
The mitigation strategies to be used for architectural/historical resources include implementing a 60 m
buffer zone to isolate Cultural Heritage Resource 1 from Project activities; commemorating past occupation
and past mining activity, involving the associated architectural and/or historical resources, by creating a
record of activities/resources; and detailed documentation (i.e. creating a public record of the structure or
structures, which provides researchers and the general public with a land use history, construction details
and photographic record of the resource) and salvage (i.e. recovering architectural or historical resources)
where retention or relocation are not feasible.
No residual effects on archaeological resources and Euro-Canadian architectural and/or historical
resources for all phases of the Project are anticipated. Consequently, no residual adverse effects carried
forward for the determination of significance.
Traditional Land and Resource Use (“TLRU”)
The potential environmental effects of the Project on TLRU include change to availability of plant species
and access to plant harvesting sites and activities; change to availability of fish species and access to
fishing areas and activities; change to availability of hunted and trapped species and access to hunting and
trapping areas and activities; and change to cultural or spiritual practices, sites or areas. As part of the
assessment, mitigation measures were identified that will be applied to the Project to avoid or reduce
effects.
Potential environmental effects on TLRU were determined based on the Project specific TK studies, Project
engagement activities, past project experience and literature review. Other valued component assessments
provided additional relevant information regarding effects on resources, and aspects of the biophysical and
socio-economic environment that may affect TLRU.
NI 43-101 Technical Report Feasibility Study Update Hardrock Project, Ontario, Canada
Section 20 January 2021 Page 20-33
To mitigate potential adverse effects, the mitigation measures identified under groundwater, surface water,
wildlife and wildlife habitat, land and resource use, fish and fish habitat, and vegetation communities will be
applied to avoid or limit effects on components of the environment related to TLRU. Where there is interest,
GGM will provide opportunities to local communities for harvesting of plants for traditional purposes prior
to construction. GGM will work with Indigenous community representatives in detailed recording and
mapping of spiritual or cultural sites, a decision is then made about the relative importance of the site and,
if warranted, how to maintain and control access. Through Project design the length and location of roads
have been considered in order to reduce potential access restrictions. A Pipe Ceremony will be held prior
to commencement of construction under the direction of local Indigenous communities.
It is predicted that residual effects on TLRU are limited to reduced access to the PDA for the pursuit of
traditional activities. However, with the historical impacts through much of the PDA, the reduced access is
not anticipated to be an issue and while access to the PDA will be limited for the lifetime of the Project,
TLRU sites and areas within the local assessment area will continue to be accessible.
Based on the findings of the biophysical and socio-economic assessments related to TLRU (i.e., vegetation
communities, fish and fish habitat, wildlife and wildlife habitat, heritage resources, land and resource use,
and human and ecological health) and the characterization of effects to known and assumed TLRU sites
and areas, it is predicted that the ability of Indigenous communities to maintain current use of lands and
resources for traditional purposes outside of the PDA will be retained.
Residual adverse environmental effects on TLRU are determined to be not significant.
Human and Ecological Health
The potential environmental effects of the Project on human and ecological health include change in human
health and change in ecological health. Project emissions include releases into the terrestrial, aquatic and
atmospheric environment. As part of the assessment, mitigation measures were identified that will be
applied to the Project to avoid or reduce effects.
Several mitigation measures incorporated in the Project to eliminate or reduce environmental effects of the
Project will also serve to address human and ecological health effects. These mitigation measures include,
but are not limited to, the use of dust suppressants, dust collectors and protective covers, implementation
of a Water Management and Monitoring Plan, industrial health and hygiene programs and progressive
rehabilitation that address pathways related to water.
NI 43-101 Technical Report Feasibility Study Update Hardrock Project, Ontario, Canada
Section 20 January 2021 Page 20-34
The human health and ecological risk assessments identified negligible risks from exposure (i.e., inhalation
and ingestion) of Project-related emissions. With the implementation of the planned mitigation measures
for air and surface water, the potential increase in health risk as a result of the Project is negligible. As such,
adverse health effects are not expected and, correspondingly, a change to human or ecological health is
not expected.
20.4.1.4 Cumulative Effects Assessment
Based on the characterization of the residual cumulative effects (i.e., after mitigation has been applied) of
the Project, in combination with the effects associated with other future projects in the regional assessment
area, no significant residual adverse cumulative effects are predicted as a result of the Project.
20.4.2 Permits or Approvals to Obtain
A range of other permits and approvals are required for mining activities and operations through numerous
federal, provincial and municipal authorities. Many of these approvals are in the process of being advanced
in consultation with regulatory agencies. A list of federal, provincial and municipal permits, licences and/or
authorizations required for the Project is provided below in Table 20.1.
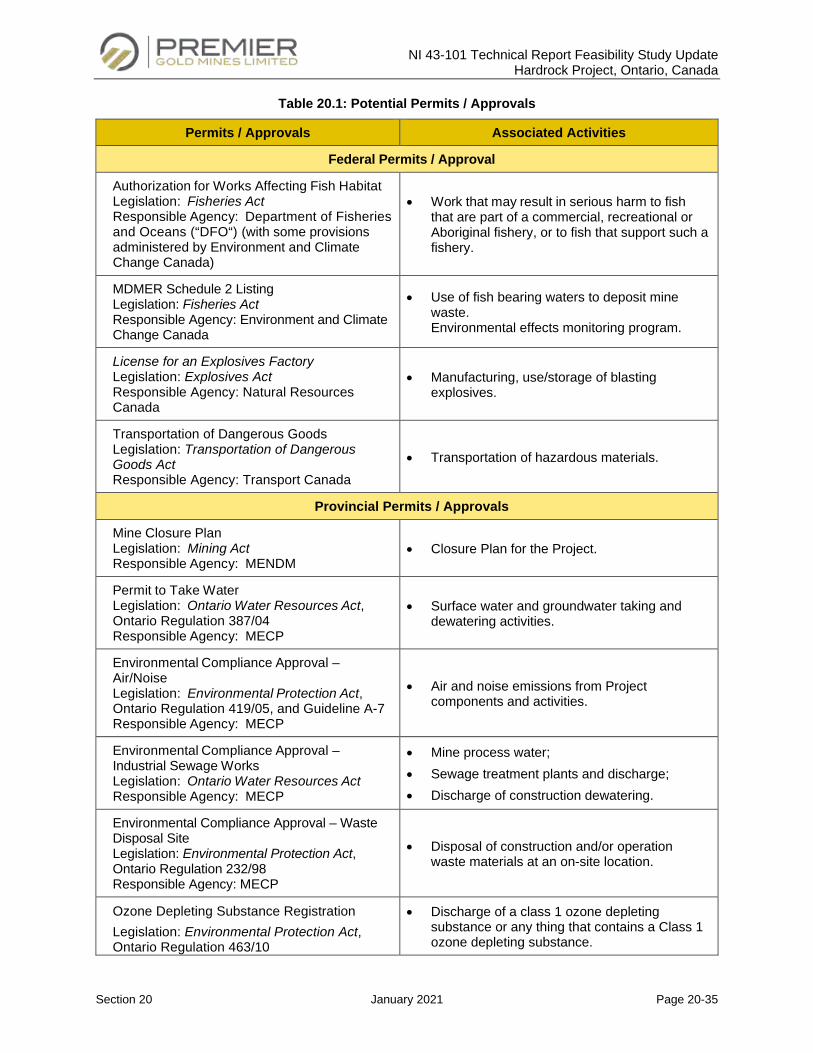
NI 43-101 Technical Report Feasibility Study Update Hardrock Project, Ontario, Canada
Section 20 January 2021 Page 20-35
Table 20.1: Potential Permits / Approvals
Permits / Approvals Associated Activities
Federal Permits / Approval
Authorization for Works Affecting Fish Habitat Legislation: Fisheries Act Responsible Agency: Department of Fisheries and Oceans (“DFO“) (with some provisions administered by Environment and Climate Change Canada)
• Work that may result in serious harm to fish that are part of a commercial, recreational or Aboriginal fishery, or to fish that support such a fishery.
MDMER Schedule 2 Listing Legislation: Fisheries Act Responsible Agency: Environment and Climate Change Canada
• Use of fish bearing waters to deposit mine waste. Environmental effects monitoring program.
License for an Explosives Factory Legislation: Explosives Act Responsible Agency: Natural Resources Canada
• Manufacturing, use/storage of blasting explosives.
Transportation of Dangerous Goods Legislation: Transportation of Dangerous Goods Act Responsible Agency: Transport Canada
• Transportation of hazardous materials.
Provincial Permits / Approvals
Mine Closure Plan Legislation: Mining Act Responsible Agency: MENDM
• Closure Plan for the Project.
Permit to Take Water Legislation: Ontario Water Resources Act, Ontario Regulation 387/04 Responsible Agency: MECP
• Surface water and groundwater taking and dewatering activities.
Environmental Compliance Approval – Air/Noise Legislation: Environmental Protection Act, Ontario Regulation 419/05, and Guideline A-7 Responsible Agency: MECP
• Air and noise emissions from Project components and activities.
Environmental Compliance Approval – Industrial Sewage Works Legislation: Ontario Water Resources Act Responsible Agency: MECP
• Mine process water; • Sewage treatment plants and discharge; • Discharge of construction dewatering.
Environmental Compliance Approval – Waste Disposal Site Legislation: Environmental Protection Act, Ontario Regulation 232/98 Responsible Agency: MECP
• Disposal of construction and/or operation waste materials at an on-site location.
Ozone Depleting Substance Registration Legislation: Environmental Protection Act, Ontario Regulation 463/10
• Discharge of a class 1 ozone depleting substance or any thing that contains a Class 1 ozone depleting substance.
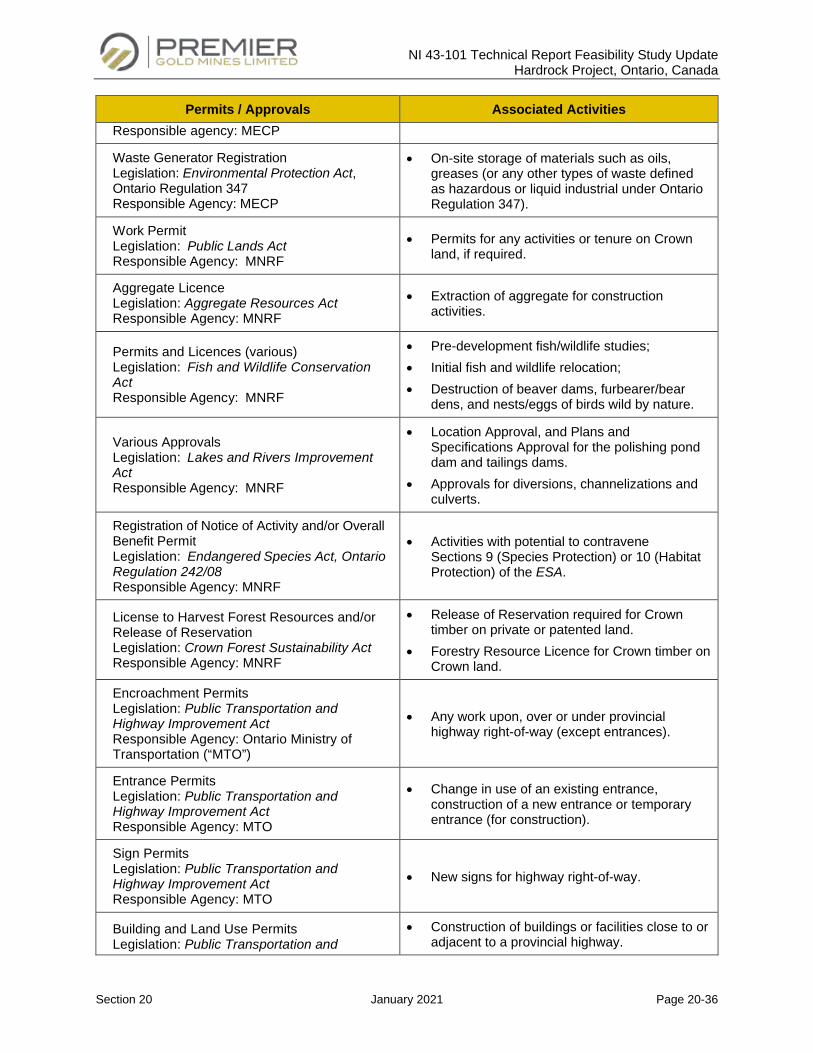
NI 43-101 Technical Report Feasibility Study Update Hardrock Project, Ontario, Canada
Section 20 January 2021 Page 20-36
Permits / Approvals Associated Activities Responsible agency: MECP
Waste Generator Registration Legislation: Environmental Protection Act, Ontario Regulation 347 Responsible Agency: MECP
• On-site storage of materials such as oils, greases (or any other types of waste defined as hazardous or liquid industrial under Ontario Regulation 347).
Work Permit Legislation: Public Lands Act Responsible Agency: MNRF
• Permits for any activities or tenure on Crown land, if required.
Aggregate Licence Legislation: Aggregate Resources Act Responsible Agency: MNRF
• Extraction of aggregate for construction activities.
Permits and Licences (various) Legislation: Fish and Wildlife Conservation Act Responsible Agency: MNRF
• Pre-development fish/wildlife studies; • Initial fish and wildlife relocation; • Destruction of beaver dams, furbearer/bear
dens, and nests/eggs of birds wild by nature.
Various Approvals Legislation: Lakes and Rivers Improvement Act Responsible Agency: MNRF
• Location Approval, and Plans and Specifications Approval for the polishing pond dam and tailings dams.
• Approvals for diversions, channelizations and culverts.
Registration of Notice of Activity and/or Overall Benefit Permit Legislation: Endangered Species Act, Ontario Regulation 242/08 Responsible Agency: MNRF
• Activities with potential to contravene Sections 9 (Species Protection) or 10 (Habitat Protection) of the ESA.
License to Harvest Forest Resources and/or Release of Reservation Legislation: Crown Forest Sustainability Act Responsible Agency: MNRF
• Release of Reservation required for Crown timber on private or patented land.
• Forestry Resource Licence for Crown timber on Crown land.
Encroachment Permits Legislation: Public Transportation and Highway Improvement Act Responsible Agency: Ontario Ministry of Transportation (“MTO”)
• Any work upon, over or under provincial highway right-of-way (except entrances).
Entrance Permits Legislation: Public Transportation and Highway Improvement Act Responsible Agency: MTO
• Change in use of an existing entrance, construction of a new entrance or temporary entrance (for construction).
Sign Permits Legislation: Public Transportation and Highway Improvement Act Responsible Agency: MTO
• New signs for highway right-of-way.
Building and Land Use Permits Legislation: Public Transportation and
• Construction of buildings or facilities close to or adjacent to a provincial highway.
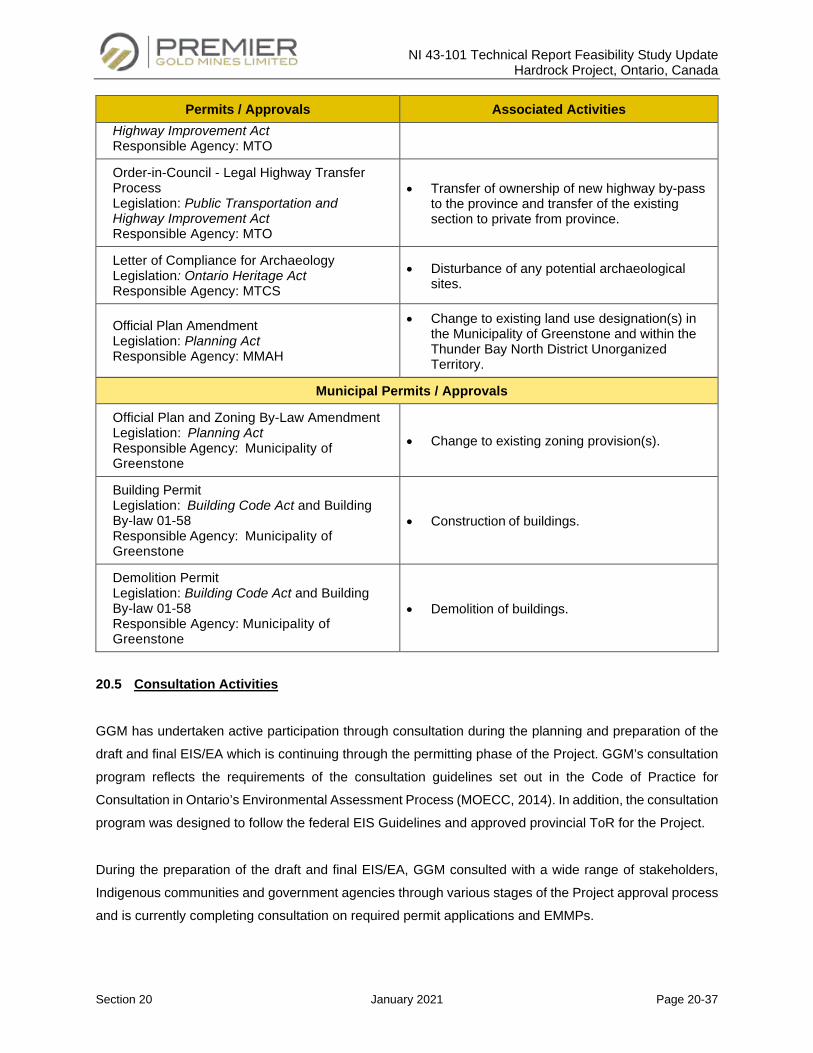
NI 43-101 Technical Report Feasibility Study Update Hardrock Project, Ontario, Canada
Section 20 January 2021 Page 20-37
Permits / Approvals Associated Activities Highway Improvement Act Responsible Agency: MTO
Order-in-Council - Legal Highway Transfer Process Legislation: Public Transportation and Highway Improvement Act Responsible Agency: MTO
• Transfer of ownership of new highway by-pass to the province and transfer of the existing section to private from province.
Letter of Compliance for Archaeology Legislation: Ontario Heritage Act Responsible Agency: MTCS
• Disturbance of any potential archaeological sites.
Official Plan Amendment Legislation: Planning Act Responsible Agency: MMAH
• Change to existing land use designation(s) in the Municipality of Greenstone and within the Thunder Bay North District Unorganized Territory.
Municipal Permits / Approvals
Official Plan and Zoning By-Law Amendment Legislation: Planning Act Responsible Agency: Municipality of Greenstone
• Change to existing zoning provision(s).
Building Permit Legislation: Building Code Act and Building By-law 01-58 Responsible Agency: Municipality of Greenstone
• Construction of buildings.
Demolition Permit Legislation: Building Code Act and Building By-law 01-58 Responsible Agency: Municipality of Greenstone
• Demolition of buildings.
20.5 Consultation Activities
GGM has undertaken active participation through consultation during the planning and preparation of the
draft and final EIS/EA which is continuing through the permitting phase of the Project. GGM’s consultation
program reflects the requirements of the consultation guidelines set out in the Code of Practice for
Consultation in Ontario’s Environmental Assessment Process (MOECC, 2014). In addition, the consultation
program was designed to follow the federal EIS Guidelines and approved provincial ToR for the Project.
During the preparation of the draft and final EIS/EA, GGM consulted with a wide range of stakeholders,
Indigenous communities and government agencies through various stages of the Project approval process
and is currently completing consultation on required permit applications and EMMPs.
NI 43-101 Technical Report Feasibility Study Update Hardrock Project, Ontario, Canada
Section 20 January 2021 Page 20-38
20.5.1 Indigenous Engagement
Through the federal EIS Guidelines and subsequent correspondence with the CEA Agency, GGM was
provided direction to consult and engage with: Aroland First Nation (AFN), Ginoogaming First Nation (GFN),
Long Lake #58 First Nation (LLFN), the Métis Nation of Ontario (MNO) and Animbiigoo Zaagi'igan
Anishinaabek (AZA) as part of the EA.
Provincially, the MECP identified that three communities hold or claim Aboriginal or treaty rights that may
be adversely impacted by the Project (AFN, GFN and LLFN), and that it was delegating aspects of
consultation to GGM. MECP also indicated that in addition to GGM’s consultation obligations and delegation
of procedural aspects with the Indigenous communities identified above, MECP also requires engagement
with people or groups who may have an interest in the Project. These communities included:
• AZA;
• Biigtigong Nishnaabeg;
• Biinjitiwaabik Zaaging Anishinaabek (BZA);
• Bingwi Neyaashi Anishinaabek (BNA);
• Constance Lake First Nation;
• Eabametoong First Nation;
• Greenstone Métis Council;
• Marten Falls First Nation;
• Pays Plat First Nation;
• Red Sky Métis First Nation.
Indigenous Environmental Review Teams were formed during the EA process and numerous meetings
took place with review teams as well as individual community meetings. Comments from communities were
received during the EA process on environmental baseline, alternative methods, comparative analysis
results and effects/mitigation and were incorporated into the final EIS/EA. Concerns/issues identified by
each community will continue to be discussed and addressed as the Project progresses. GGM is working
with Indigenous communities, and their technical review consultants, to address comments on various
permit applications and EMMPs.
NI 43-101 Technical Report Feasibility Study Update Hardrock Project, Ontario, Canada
Section 20 January 2021 Page 20-39
20.5.2 Summary of Influence of Consultation and Engagement on the Project
Since the initiation of the EA process, consultation has been carried out related to key aspects of the Project,
including baseline studies, the identification and evaluation of alternatives, assessment of environmental
effects and the overall design of the Project. GGM has considered the interests and questions of
stakeholders, government agencies and Indigenous communities that were identified through consultation
and incorporated this information as appropriate into the EA documentation to better reflect existing
conditions, regulatory mandates, the selection of Project alternatives, the assessment of environmental
effects, the identification of mitigation measures and other components of the assessment. A summary of
the key changes/refinements made to the final EIS/EA based on the results of consultation are provided in
Table 20.2. GGM will continue its ongoing engagement with interested parties throughout the permitting
process and into construction, operation and closure of the Project.
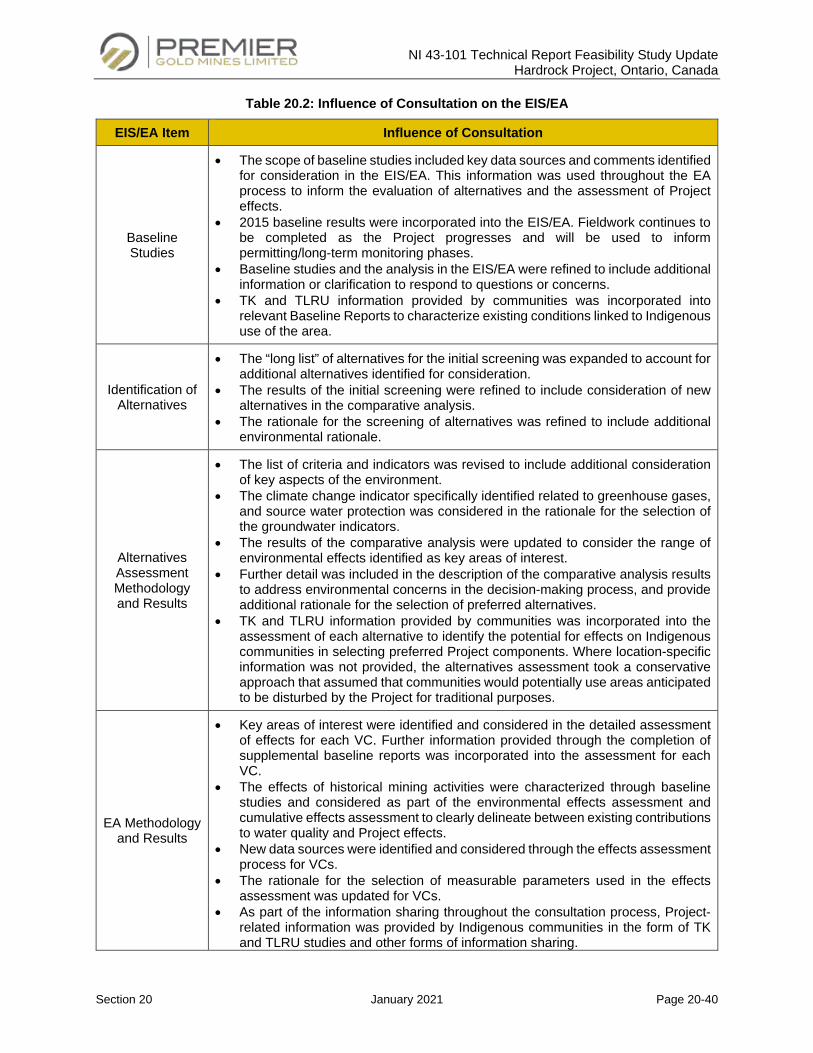
NI 43-101 Technical Report Feasibility Study Update Hardrock Project, Ontario, Canada
Section 20 January 2021 Page 20-40
Table 20.2: Influence of Consultation on the EIS/EA
EIS/EA Item Influence of Consultation
Baseline Studies
• The scope of baseline studies included key data sources and comments identified for consideration in the EIS/EA. This information was used throughout the EA process to inform the evaluation of alternatives and the assessment of Project effects.
• 2015 baseline results were incorporated into the EIS/EA. Fieldwork continues to be completed as the Project progresses and will be used to inform permitting/long-term monitoring phases.
• Baseline studies and the analysis in the EIS/EA were refined to include additional information or clarification to respond to questions or concerns.
• TK and TLRU information provided by communities was incorporated into relevant Baseline Reports to characterize existing conditions linked to Indigenous use of the area.
Identification of Alternatives
• The “long list” of alternatives for the initial screening was expanded to account for additional alternatives identified for consideration.
• The results of the initial screening were refined to include consideration of new alternatives in the comparative analysis.
• The rationale for the screening of alternatives was refined to include additional environmental rationale.
Alternatives Assessment Methodology and Results
• The list of criteria and indicators was revised to include additional consideration of key aspects of the environment.
• The climate change indicator specifically identified related to greenhouse gases, and source water protection was considered in the rationale for the selection of the groundwater indicators.
• The results of the comparative analysis were updated to consider the range of environmental effects identified as key areas of interest.
• Further detail was included in the description of the comparative analysis results to address environmental concerns in the decision-making process, and provide additional rationale for the selection of preferred alternatives.
• TK and TLRU information provided by communities was incorporated into the assessment of each alternative to identify the potential for effects on Indigenous communities in selecting preferred Project components. Where location-specific information was not provided, the alternatives assessment took a conservative approach that assumed that communities would potentially use areas anticipated to be disturbed by the Project for traditional purposes.
EA Methodology and Results
• Key areas of interest were identified and considered in the detailed assessment of effects for each VC. Further information provided through the completion of supplemental baseline reports was incorporated into the assessment for each VC.
• The effects of historical mining activities were characterized through baseline studies and considered as part of the environmental effects assessment and cumulative effects assessment to clearly delineate between existing contributions to water quality and Project effects.
• New data sources were identified and considered through the effects assessment process for VCs.
• The rationale for the selection of measurable parameters used in the effects assessment was updated for VCs.
• As part of the information sharing throughout the consultation process, Project-related information was provided by Indigenous communities in the form of TK and TLRU studies and other forms of information sharing.
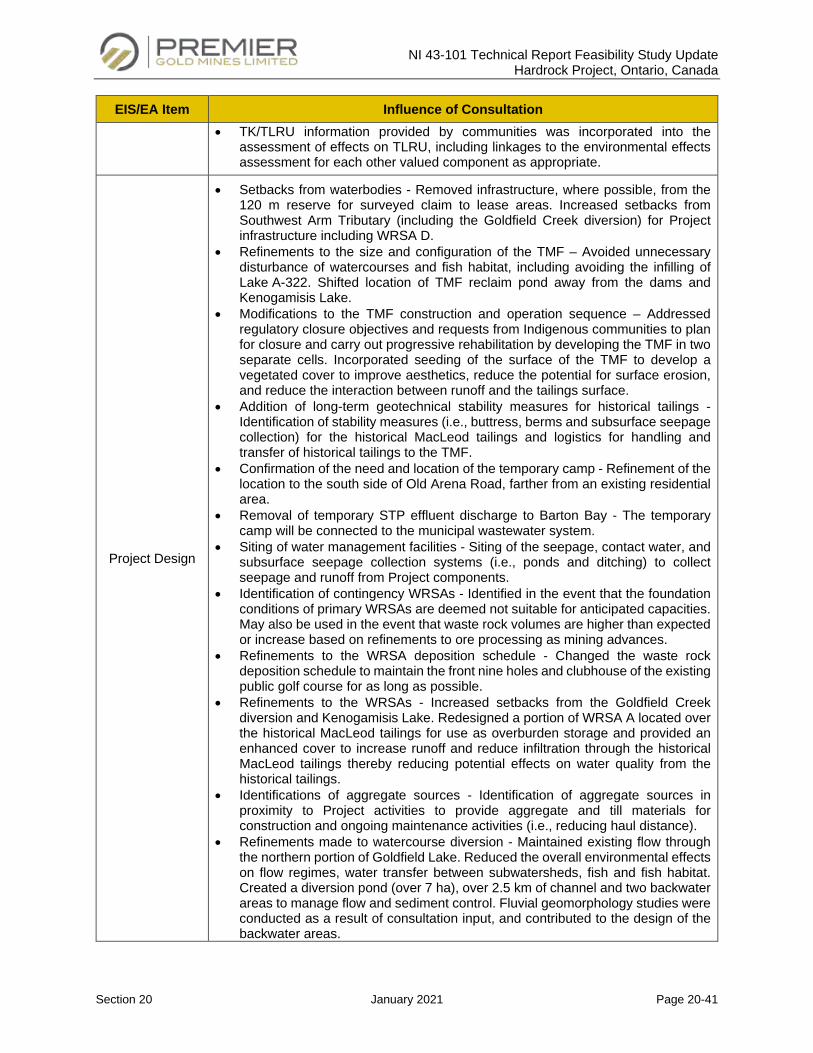
NI 43-101 Technical Report Feasibility Study Update Hardrock Project, Ontario, Canada
Section 20 January 2021 Page 20-41
EIS/EA Item Influence of Consultation • TK/TLRU information provided by communities was incorporated into the
assessment of effects on TLRU, including linkages to the environmental effects assessment for each other valued component as appropriate.
Project Design
• Setbacks from waterbodies - Removed infrastructure, where possible, from the 120 m reserve for surveyed claim to lease areas. Increased setbacks from Southwest Arm Tributary (including the Goldfield Creek diversion) for Project infrastructure including WRSA D.
• Refinements to the size and configuration of the TMF – Avoided unnecessary disturbance of watercourses and fish habitat, including avoiding the infilling of Lake A-322. Shifted location of TMF reclaim pond away from the dams and Kenogamisis Lake.
• Modifications to the TMF construction and operation sequence – Addressed regulatory closure objectives and requests from Indigenous communities to plan for closure and carry out progressive rehabilitation by developing the TMF in two separate cells. Incorporated seeding of the surface of the TMF to develop a vegetated cover to improve aesthetics, reduce the potential for surface erosion, and reduce the interaction between runoff and the tailings surface.
• Addition of long-term geotechnical stability measures for historical tailings - Identification of stability measures (i.e., buttress, berms and subsurface seepage collection) for the historical MacLeod tailings and logistics for handling and transfer of historical tailings to the TMF.
• Confirmation of the need and location of the temporary camp - Refinement of the location to the south side of Old Arena Road, farther from an existing residential area.
• Removal of temporary STP effluent discharge to Barton Bay - The temporary camp will be connected to the municipal wastewater system.
• Siting of water management facilities - Siting of the seepage, contact water, and subsurface seepage collection systems (i.e., ponds and ditching) to collect seepage and runoff from Project components.
• Identification of contingency WRSAs - Identified in the event that the foundation conditions of primary WRSAs are deemed not suitable for anticipated capacities. May also be used in the event that waste rock volumes are higher than expected or increase based on refinements to ore processing as mining advances.
• Refinements to the WRSA deposition schedule - Changed the waste rock deposition schedule to maintain the front nine holes and clubhouse of the existing public golf course for as long as possible.
• Refinements to the WRSAs - Increased setbacks from the Goldfield Creek diversion and Kenogamisis Lake. Redesigned a portion of WRSA A located over the historical MacLeod tailings for use as overburden storage and provided an enhanced cover to increase runoff and reduce infiltration through the historical MacLeod tailings thereby reducing potential effects on water quality from the historical tailings.
• Identifications of aggregate sources - Identification of aggregate sources in proximity to Project activities to provide aggregate and till materials for construction and ongoing maintenance activities (i.e., reducing haul distance).
• Refinements made to watercourse diversion - Maintained existing flow through the northern portion of Goldfield Lake. Reduced the overall environmental effects on flow regimes, water transfer between subwatersheds, fish and fish habitat. Created a diversion pond (over 7 ha), over 2.5 km of channel and two backwater areas to manage flow and sediment control. Fluvial geomorphology studies were conducted as a result of consultation input, and contributed to the design of the backwater areas.
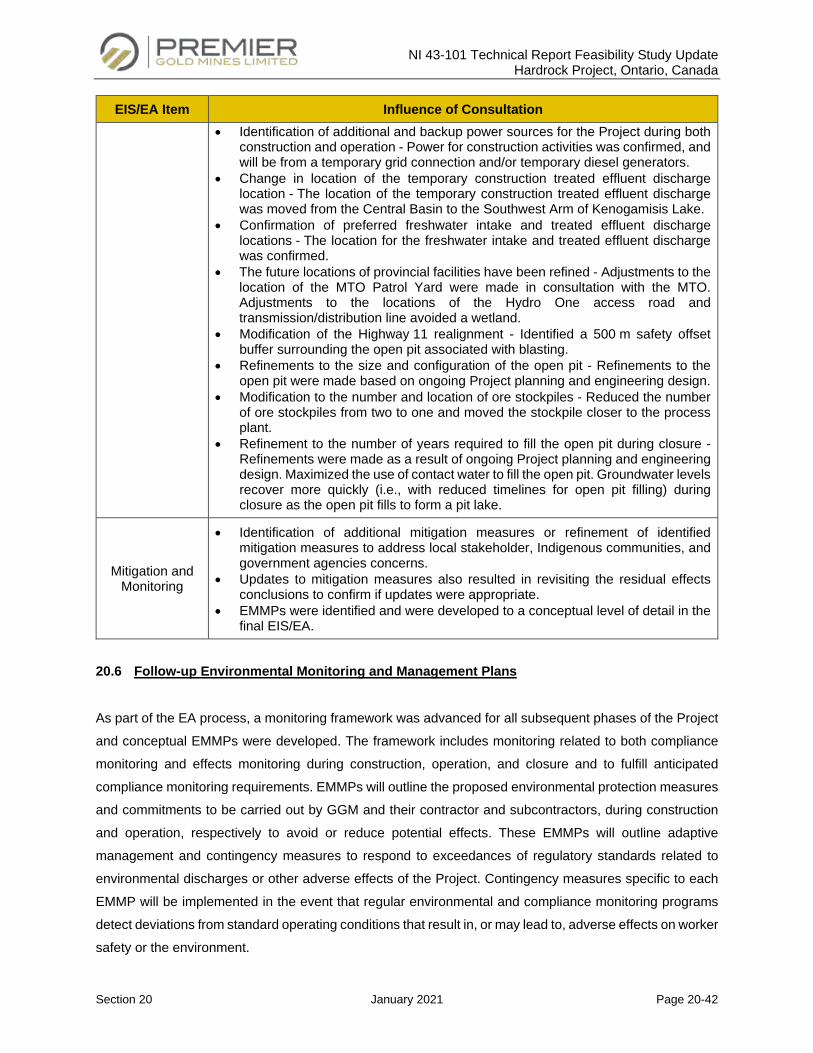
NI 43-101 Technical Report Feasibility Study Update Hardrock Project, Ontario, Canada
Section 20 January 2021 Page 20-42
EIS/EA Item Influence of Consultation • Identification of additional and backup power sources for the Project during both
construction and operation - Power for construction activities was confirmed, and will be from a temporary grid connection and/or temporary diesel generators.
• Change in location of the temporary construction treated effluent discharge location - The location of the temporary construction treated effluent discharge was moved from the Central Basin to the Southwest Arm of Kenogamisis Lake.
• Confirmation of preferred freshwater intake and treated effluent discharge locations - The location for the freshwater intake and treated effluent discharge was confirmed.
• The future locations of provincial facilities have been refined - Adjustments to the location of the MTO Patrol Yard were made in consultation with the MTO. Adjustments to the locations of the Hydro One access road and transmission/distribution line avoided a wetland.
• Modification of the Highway 11 realignment - Identified a 500 m safety offset buffer surrounding the open pit associated with blasting.
• Refinements to the size and configuration of the open pit - Refinements to the open pit were made based on ongoing Project planning and engineering design.
• Modification to the number and location of ore stockpiles - Reduced the number of ore stockpiles from two to one and moved the stockpile closer to the process plant.
• Refinement to the number of years required to fill the open pit during closure - Refinements were made as a result of ongoing Project planning and engineering design. Maximized the use of contact water to fill the open pit. Groundwater levels recover more quickly (i.e., with reduced timelines for open pit filling) during closure as the open pit fills to form a pit lake.
Mitigation and Monitoring
• Identification of additional mitigation measures or refinement of identified mitigation measures to address local stakeholder, Indigenous communities, and government agencies concerns.
• Updates to mitigation measures also resulted in revisiting the residual effects conclusions to confirm if updates were appropriate.
• EMMPs were identified and were developed to a conceptual level of detail in the final EIS/EA.
20.6 Follow-up Environmental Monitoring and Management Plans
As part of the EA process, a monitoring framework was advanced for all subsequent phases of the Project
and conceptual EMMPs were developed. The framework includes monitoring related to both compliance
monitoring and effects monitoring during construction, operation, and closure and to fulfill anticipated
compliance monitoring requirements. EMMPs will outline the proposed environmental protection measures
and commitments to be carried out by GGM and their contractor and subcontractors, during construction
and operation, respectively to avoid or reduce potential effects. These EMMPs will outline adaptive
management and contingency measures to respond to exceedances of regulatory standards related to
environmental discharges or other adverse effects of the Project. Contingency measures specific to each
EMMP will be implemented in the event that regular environmental and compliance monitoring programs
detect deviations from standard operating conditions that result in, or may lead to, adverse effects on worker
safety or the environment.

NI 43-101 Technical Report Feasibility Study Update Hardrock Project, Ontario, Canada
Section 20 January 2021 Page 20-43
GGM is currently advancing the development of the EMMPs and expects the following list of plans to be
required:
• Air Quality Management and Monitoring Plan;
• Aquatic Management and Monitoring Plan;
• Archaeological and Heritage Resources Management Plan;
• Biodiversity Management and Monitoring Plan;
• Construction Environmental Management Plan;
• Communications Plan;
• Current Use of Land for Traditional Peoples Plan;
• Emergency Response Plan;
• Spill Response and Contingency Plan;
• Erosion and Sediment Control Plan;
• Explosive and Blasting Management Plan;
• Health and Socio-Economic Conditions of Indigenous Peoples Monitoring Plan;
• Historical Tailings Management and Relocation Plan;
• Noise and Vibration Management and Monitoring Plan;
• Sanitary Sewage Management & Contingency Plan;
• Soil Management Plan;
• Waste Management Plan;
• Waste Rock Management Plan;
• Water Management and Monitoring Plan.
Upon completion of permitting, refinements to the follow-up and monitoring programs will incorporate
outcomes of the approval processes, and refinements will be considered throughout the Project. Program
plans are iterative by nature and the monitoring activities associated with the Project will be used to inform
adaptive management, which is a process for continuously improving environmental management
practices.
20.7 Closure, Decommissioning and Reclamation
Before mining operations can begin, MENDM requires that a Closure Plan with Financial Assurance be
submitted and approved under the Mining Act R.S.O. 1990, Chapter M.14 (amended by S.O. 2010, 18. 23);
Part VII under the Act, O. Reg. 240/00 as amended, and Schedule 1 and 2, Mine Rehabilitation Code of
Ontario.
NI 43-101 Technical Report Feasibility Study Update Hardrock Project, Ontario, Canada
Section 20 January 2021 Page 20-44
A Closure Plan has been developed and includes details on closure including progressive rehabilitation,
rehabilitation measures, monitoring and expected site conditions following closure. At the end of mining
operations, the main features requiring closure will include the main open pit, water management and
drainage systems, WRSAs, TMF, site access roads and buildings and associated infrastructure. After the
closure activities have been carried out, a post-closure monitoring program will be carried out to verify that
the closure objectives and criteria have been met and confirm that the Project can proceed to final close
out under the Mining Act.
The main elements of the Closure Plan include progressive rehabilitation during Project operation for certain
components, and final closure measures following the end of mine operations. When practical, areas that
are no longer required may be rehabilitated during mining operations. These activities, known as
progressive rehabilitation, contribute to the overall rehabilitation efforts that would otherwise be carried out
at closure, or efforts carried out in support of the closure activities (e.g. field trials). Once the mine advances
from the development stage to the operational stage, progressive rehabilitation activities can commence,
as applicable. Progressive rehabilitation opportunities may include:
• Removal of construction-related buildings, laydown areas, and access roads;
• Stabilization and re-vegetation of WRSAs, where practical;
• Rehabilitation of the north cell of the TMF, upon completion of deposition anticipated after Year 11,
consisting of a vegetated soil cover with runoff from the cell directed to the south cell, or to the
environment once water quality meets acceptable regulatory requirements;
• Rehabilitation of aggregate sources once they are no longer required;
• Backfilling the eastern extension of the open pit with waste rock;
• Removal of hazardous and non-hazardous waste materials from the site on a regular basis, where
possible.
While progressive rehabilitation activities will be carried out throughout the mine life, the majority of
rehabilitation work will take place once mining has been completed. The following list summarizes the main
activities associated with closure:
• Infrastructure, equipment and mining materials (including buildings, pipelines, site lighting and
security, service water supply, water management facilities and petroleum products) will be
removed.
NI 43-101 Technical Report Feasibility Study Update Hardrock Project, Ontario, Canada
Section 20 January 2021 Page 20-45
• Some facilities (e.g. access roads and the effluent treatment plant) may be required for the proper
care and maintenance of the site during closure and will be removed/rehabilitated once they are no
longer required during closure.
• The open pit will be filled with water, creating a pit lake.
• The WRSAs and TMF will be stabilized (chemically and physically) and the top surfaces and
benches covered with a soil cover to facilitate vegetation growth. The TMF will be fully revegetated.
• In preparation for revegetation efforts, the ground surface will be prepared by scarification or ripping
of compact surfaces, amending soil to support vegetative growth, and implementing erosion
protection measures to protect the soil cover until vegetation is established.
• The majority of the closure measures will be implemented over a five-year period after the cessation
of mining and ore processing activities; however, rehabilitation of the open pit will take significantly
longer due to the time required to fill the open pit with water. To expedite the filling of the open pit,
water will be pumped into the open pit from the TMF, contact water collection ponds and from the
Southwest Arm of Kenogamisis Lake. The site can be considered to be in a state of post-closure
when the site has been shown to be stable and able to meet the closure criteria.
The overall objective of closure is to return the site to a chemically and physically stable state which is self-
sustaining and supports the desired future land uses. The landscape will be revegetated using locally
available, non-invasive plant species to encourage the return of wildlife and fish species to the area. Most
access restrictions will be lifted after closure; however, a boulder fence will be erected around the open pit
to restrict access for safety purposes. It is anticipated that recreational activities such as hunting, hiking,
snowmobiling and other passive activities, as well as economic uses such as forestry, would be permitted.
Monitoring will be completed to assess the physical, chemical and biological stability of the Project and
confirm that closure objectives have been met and when the Project has reached a condition suitable for
moving to closed out status as defined under the Mining Act. The site will be monitored by GGM according
to a set schedule to verify the site is performing as expected and that effluent criteria are being met. This
includes the monitoring of effluent water quality (surface and groundwater), aquatic and terrestrial
environments, and physical stability (embankments and the open pit slopes).
The Closure Plan and all technical details, including the cost estimate for Financial Assurance have been
approved by MENDM in January 2020. As the Project progresses, it is anticipated that subsequent Closure
Plan Amendments will be required to capture any proposed changes to the Project and rehabilitation
methods.
NI 43-101 Technical Report Feasibility Study Update Hardrock Project, Ontario, Canada
Section 21 January 2021 Page 21-1
CAPITAL AND OPERATING COSTS
21.1 Capital Expenditures
21.1.1 Responsibility Matrix
Greenstone Gold Mines Limited (“GGM”) is responsible for the overall coordination, compilation,
documentation and quality control of the initial capital cost (“CAPEX”) estimate. Estimating responsibilities
were assigned at the Work Breakdown Schedule (“WBS”) level to various contributors. Responsibility for
providing inputs were as follows:
• Ausenco Engineering Canada Inc. (”Ausenco”) – quantities for the process plant and supporting
infrastructure (except as otherwise noted); firm and budgetary Request for Proposal (“RFP”)
processes for major equipment and certain supply/install contracts and equipment, material and
labor costs for piping, HVAC, underground utilities and fire protection;
• Wood Canada Limited (“Wood”) – quantities for the TMF and Goldfield Creek diversion, and the
estimate for the fish habitat compensation;
• TBT Engineering Limited (“TBT”) – quantities and firm price RFP processes for the re-alignment of
Highway 11 and the relocation of the MTO Patrol Station;
• SLR Consulting (“SLR”) – scope and quantities for mine waste stockpiles water management ponds
and ditches and Macleod high tailings seepage collection subdrain;
• Enbridge Gas Inc. (“Enbridge”) – quantities and cost estimates for the natural gas pipeline from the
TransCanada Pipeline Mainline to the power plant and site natural gas distribution header;
• FNX Innov (“FNX”) – quantities and cost estimates for the Hydro One Geraldton Transmission
Station and 115 kV power lines;
• G Mining Services Inc. (“GMS”) – quantities and cost estimates for the mine mobile equipment and
mining cost and overall review of the CAPEX;
• Greenstone Gold Mines (“GGM”) – quantities for earthworks other than noted above, direct labor
rates, labor hours for concrete, structural and mechanical installations, site communications and IT
costs, quantities and cost estimates for the construction indirects, infrastructure relocation budgets
(except as otherwise noted), and Owner’s general and administration cost. GGM also maintains the
overall estimate database and libraries.
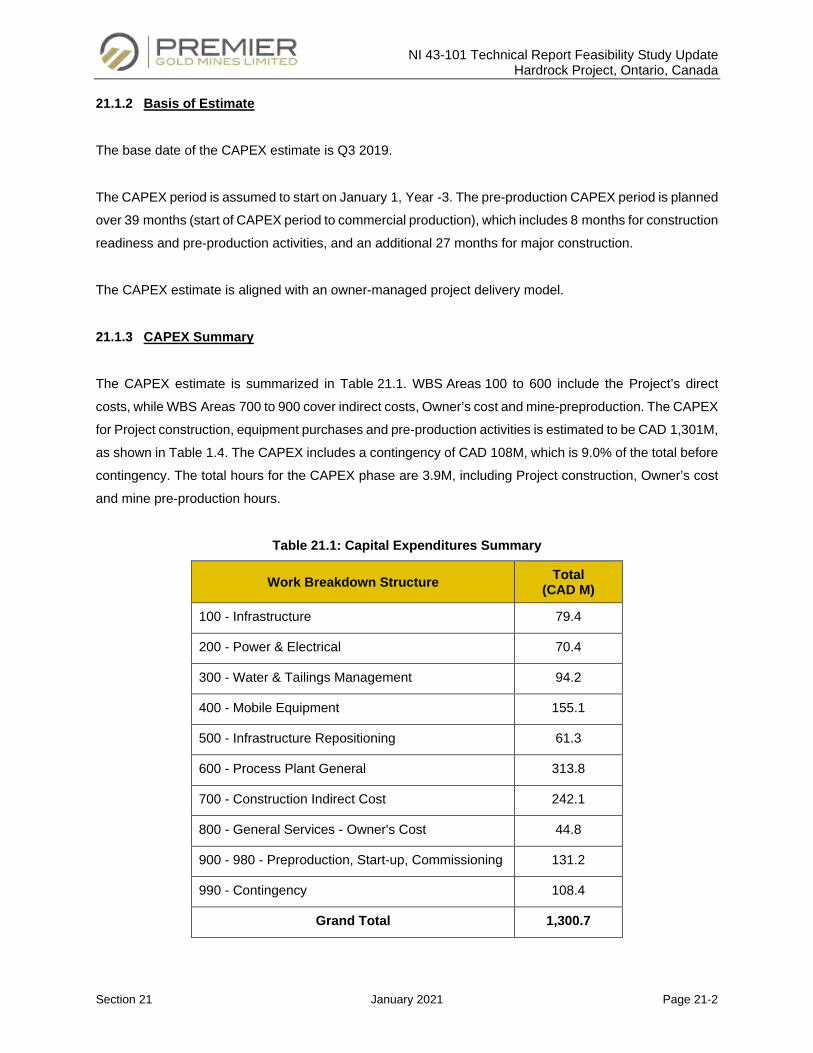
NI 43-101 Technical Report Feasibility Study Update Hardrock Project, Ontario, Canada
Section 21 January 2021 Page 21-2
21.1.2 Basis of Estimate
The base date of the CAPEX estimate is Q3 2019.
The CAPEX period is assumed to start on January 1, Year -3. The pre-production CAPEX period is planned
over 39 months (start of CAPEX period to commercial production), which includes 8 months for construction
readiness and pre-production activities, and an additional 27 months for major construction.
The CAPEX estimate is aligned with an owner-managed project delivery model.
21.1.3 CAPEX Summary
The CAPEX estimate is summarized in Table 21.1. WBS Areas 100 to 600 include the Project’s direct
costs, while WBS Areas 700 to 900 cover indirect costs, Owner’s cost and mine-preproduction. The CAPEX
for Project construction, equipment purchases and pre-production activities is estimated to be CAD 1,301M,
as shown in Table 1.4. The CAPEX includes a contingency of CAD 108M, which is 9.0% of the total before
contingency. The total hours for the CAPEX phase are 3.9M, including Project construction, Owner’s cost
and mine pre-production hours.
Table 21.1: Capital Expenditures Summary
Work Breakdown Structure Total (CAD M)
100 - Infrastructure 79.4
200 - Power & Electrical 70.4
300 - Water & Tailings Management 94.2
400 - Mobile Equipment 155.1
500 - Infrastructure Repositioning 61.3
600 - Process Plant General 313.8
700 - Construction Indirect Cost 242.1
800 - General Services - Owner's Cost 44.8
900 - 980 - Preproduction, Start-up, Commissioning 131.2
990 - Contingency 108.4
Grand Total 1,300.7
NI 43-101 Technical Report Feasibility Study Update Hardrock Project, Ontario, Canada
Section 21 January 2021 Page 21-3
21.1.3.1 Direct Costs
The engineering consultants who completed the detailed engineering (or advanced basic engineering in
certain cases) were responsible for calculating the material take off estimates for their respective areas.
Appropriate waste allowances were included. Firm price RFP processes were completed for the majority of
process plant equipment, the power plant equipment, the temporary and permanent effluent treatment
plants, the sewage treatment plant and the mine mobile equipment fleet. Where vendor data was required
for detailed engineering, a Letter of Intent has been issued. The remaining equipment and material costs
were based on budgetary bid processes, quotes, consultant’s historical data and in-house databases, or
benchmarked from a previous project.
Labour unit rates were developed from first principles based on budgetary quotations from fourteen general
contractors located in Northern Ontario or Western Quebec, consistent with the type and size of contractors
that will form the bidders list for these installation activities. The direct installation hours were based on a
combination of firm price proposals, budgetary quotes and updated feasibility study estimates,
benchmarked against previous projects and reviewed by experienced construction personnel. Firm price
RFP processes were completed for the Tailings Management Facility (“TMF”), Goldfield Creek and
Highway 11 relocation. A productivity factor adjustment to account for items that are not incorporated in the
base installation hours was developed and applied to the relevant trades.
Estimates related to certain offsite infrastructure or infrastructure relocations were either provided by the
relevant agency or developed by specialized engineering consultants. This includes the Enbridge natural
gas pipelines, the Hydro One Substation relocation and the connection to the Municipal network for potable
water.
The CAPEX estimate for WBS 100 - Infrastructure is summarized in Table 21.2. The CAPEX for the
temporary camp WBS Area 140 represents the cost of site preparation only, as the rental for the camp
buildings is captured in WBS Area 740. Support facilities include the site administration building, the
explosives reagents storage, and the temporary explosives storage. The predominant cost in
WBS Area 170 is the natural gas tap and pipeline to the power plant, and also includes the diesel fuel
storage and distribution systems for the mine fleet refueling. WBS Area 180 includes the recycling and
waste management facilities.
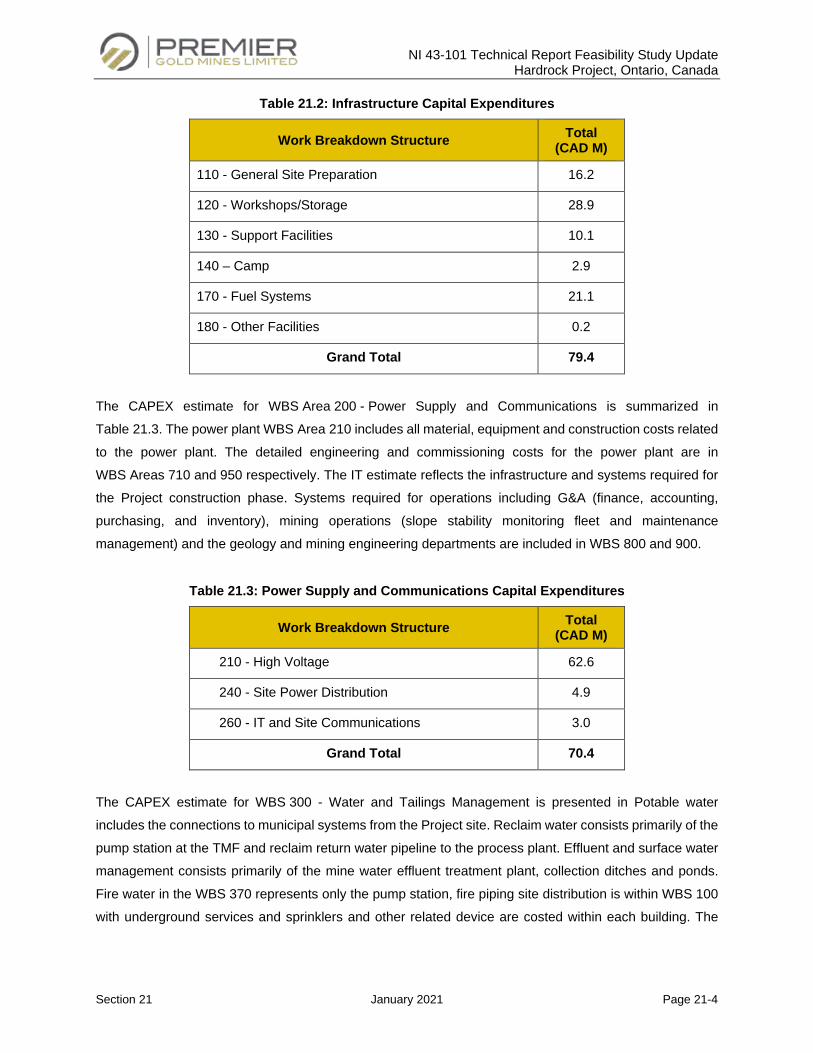
NI 43-101 Technical Report Feasibility Study Update Hardrock Project, Ontario, Canada
Section 21 January 2021 Page 21-4
Table 21.2: Infrastructure Capital Expenditures
Work Breakdown Structure Total (CAD M)
110 - General Site Preparation 16.2
120 - Workshops/Storage 28.9
130 - Support Facilities 10.1
140 – Camp 2.9
170 - Fuel Systems 21.1
180 - Other Facilities 0.2
Grand Total 79.4
The CAPEX estimate for WBS Area 200 - Power Supply and Communications is summarized in
Table 21.3. The power plant WBS Area 210 includes all material, equipment and construction costs related
to the power plant. The detailed engineering and commissioning costs for the power plant are in
WBS Areas 710 and 950 respectively. The IT estimate reflects the infrastructure and systems required for
the Project construction phase. Systems required for operations including G&A (finance, accounting,
purchasing, and inventory), mining operations (slope stability monitoring fleet and maintenance
management) and the geology and mining engineering departments are included in WBS 800 and 900.
Table 21.3: Power Supply and Communications Capital Expenditures
Work Breakdown Structure Total (CAD M)
210 - High Voltage 62.6
240 - Site Power Distribution 4.9
260 - IT and Site Communications 3.0
Grand Total 70.4
The CAPEX estimate for WBS 300 - Water and Tailings Management is presented in Potable water
includes the connections to municipal systems from the Project site. Reclaim water consists primarily of the
pump station at the TMF and reclaim return water pipeline to the process plant. Effluent and surface water
management consists primarily of the mine water effluent treatment plant, collection ditches and ponds.
Fire water in the WBS 370 represents only the pump station, fire piping site distribution is within WBS 100
with underground services and sprinklers and other related device are costed within each building. The
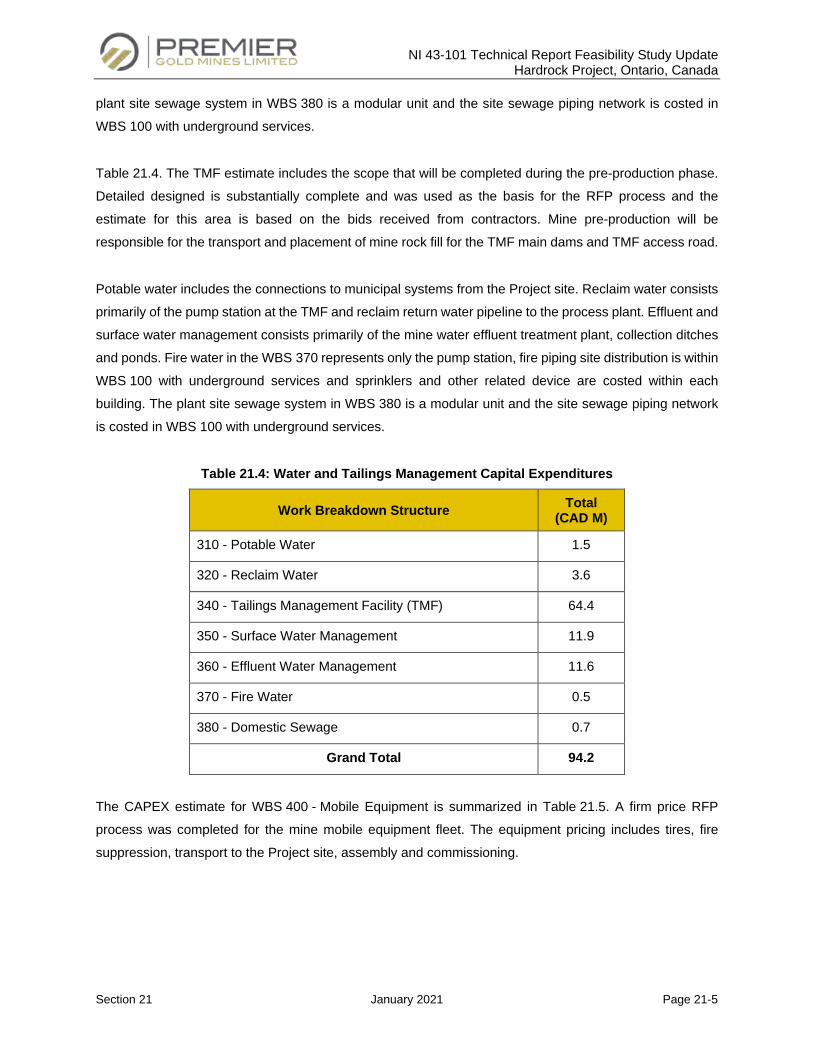
NI 43-101 Technical Report Feasibility Study Update Hardrock Project, Ontario, Canada
Section 21 January 2021 Page 21-5
plant site sewage system in WBS 380 is a modular unit and the site sewage piping network is costed in
WBS 100 with underground services.
Table 21.4. The TMF estimate includes the scope that will be completed during the pre-production phase.
Detailed designed is substantially complete and was used as the basis for the RFP process and the
estimate for this area is based on the bids received from contractors. Mine pre-production will be
responsible for the transport and placement of mine rock fill for the TMF main dams and TMF access road.
Potable water includes the connections to municipal systems from the Project site. Reclaim water consists
primarily of the pump station at the TMF and reclaim return water pipeline to the process plant. Effluent and
surface water management consists primarily of the mine water effluent treatment plant, collection ditches
and ponds. Fire water in the WBS 370 represents only the pump station, fire piping site distribution is within
WBS 100 with underground services and sprinklers and other related device are costed within each
building. The plant site sewage system in WBS 380 is a modular unit and the site sewage piping network
is costed in WBS 100 with underground services.
Table 21.4: Water and Tailings Management Capital Expenditures
Work Breakdown Structure Total (CAD M)
310 - Potable Water 1.5
320 - Reclaim Water 3.6
340 - Tailings Management Facility (TMF) 64.4
350 - Surface Water Management 11.9
360 - Effluent Water Management 11.6
370 - Fire Water 0.5
380 - Domestic Sewage 0.7
Grand Total 94.2
The CAPEX estimate for WBS 400 - Mobile Equipment is summarized in Table 21.5. A firm price RFP
process was completed for the mine mobile equipment fleet. The equipment pricing includes tires, fire
suppression, transport to the Project site, assembly and commissioning.
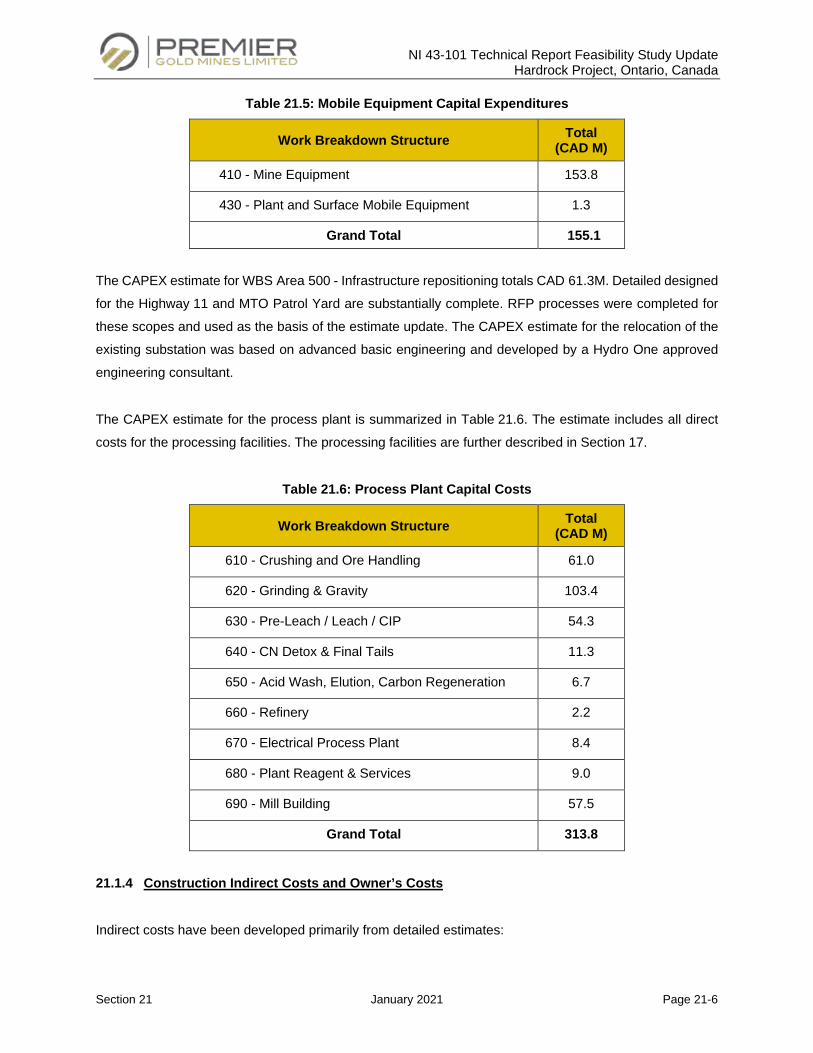
NI 43-101 Technical Report Feasibility Study Update Hardrock Project, Ontario, Canada
Section 21 January 2021 Page 21-6
Table 21.5: Mobile Equipment Capital Expenditures
Work Breakdown Structure Total (CAD M)
410 - Mine Equipment 153.8
430 - Plant and Surface Mobile Equipment 1.3
Grand Total 155.1
The CAPEX estimate for WBS Area 500 - Infrastructure repositioning totals CAD 61.3M. Detailed designed
for the Highway 11 and MTO Patrol Yard are substantially complete. RFP processes were completed for
these scopes and used as the basis of the estimate update. The CAPEX estimate for the relocation of the
existing substation was based on advanced basic engineering and developed by a Hydro One approved
engineering consultant.
The CAPEX estimate for the process plant is summarized in Table 21.6. The estimate includes all direct
costs for the processing facilities. The processing facilities are further described in Section 17.
Table 21.6: Process Plant Capital Costs
Work Breakdown Structure Total (CAD M)
610 - Crushing and Ore Handling 61.0
620 - Grinding & Gravity 103.4
630 - Pre-Leach / Leach / CIP 54.3
640 - CN Detox & Final Tails 11.3
650 - Acid Wash, Elution, Carbon Regeneration 6.7
660 - Refinery 2.2
670 - Electrical Process Plant 8.4
680 - Plant Reagent & Services 9.0
690 - Mill Building 57.5
Grand Total 313.8
21.1.4 Construction Indirect Costs and Owner’s Costs
Indirect costs have been developed primarily from detailed estimates:
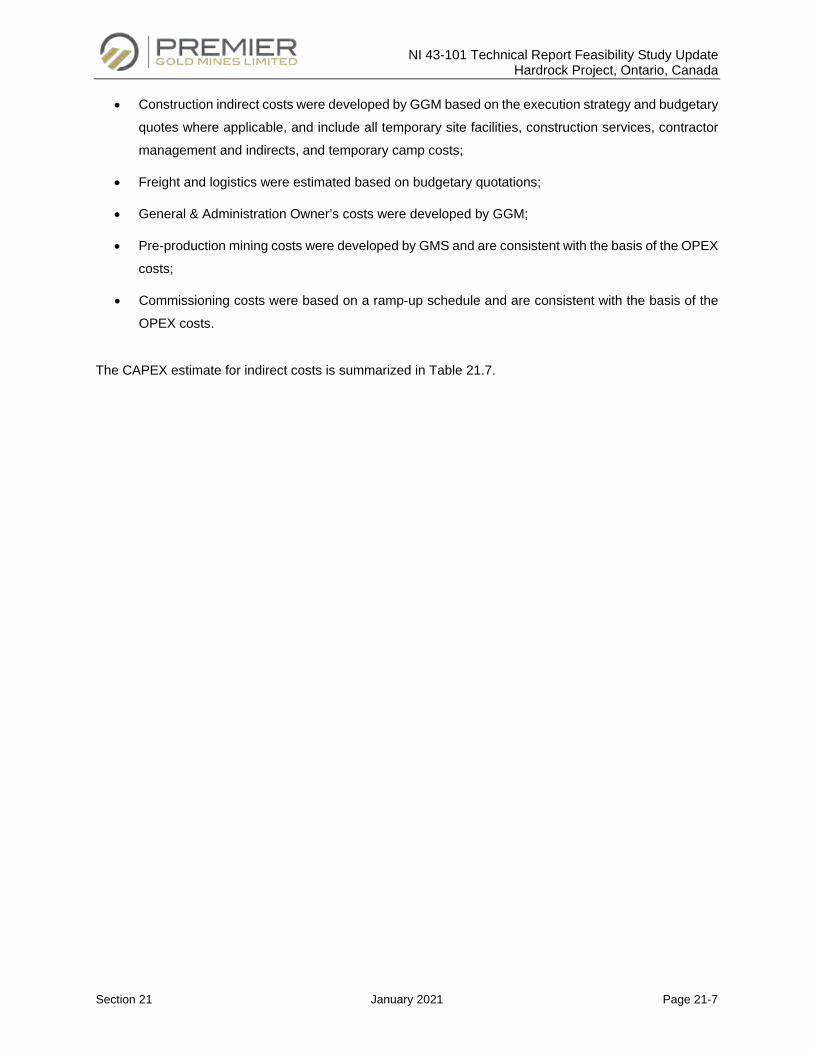
NI 43-101 Technical Report Feasibility Study Update Hardrock Project, Ontario, Canada
Section 21 January 2021 Page 21-7
• Construction indirect costs were developed by GGM based on the execution strategy and budgetary
quotes where applicable, and include all temporary site facilities, construction services, contractor
management and indirects, and temporary camp costs;
• Freight and logistics were estimated based on budgetary quotations;
• General & Administration Owner’s costs were developed by GGM;
• Pre-production mining costs were developed by GMS and are consistent with the basis of the OPEX
costs;
• Commissioning costs were based on a ramp-up schedule and are consistent with the basis of the
OPEX costs.
The CAPEX estimate for indirect costs is summarized in Table 21.7.
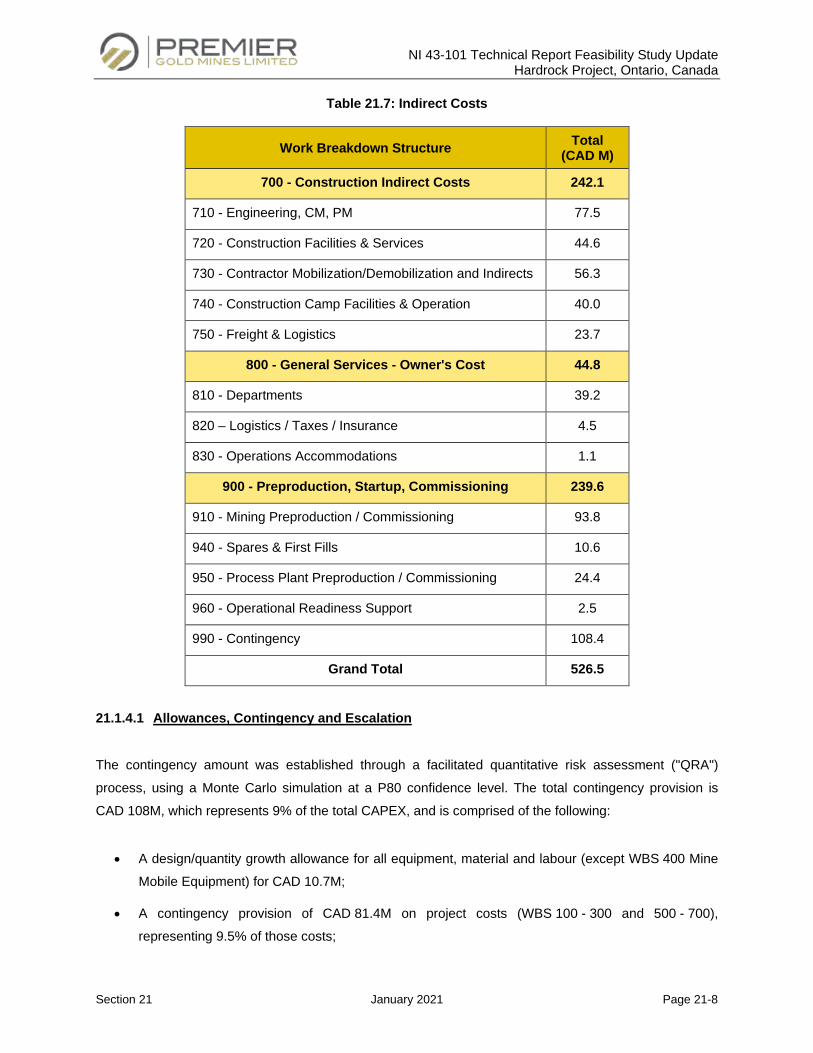
NI 43-101 Technical Report Feasibility Study Update Hardrock Project, Ontario, Canada
Section 21 January 2021 Page 21-8
Table 21.7: Indirect Costs
Work Breakdown Structure Total (CAD M)
700 - Construction Indirect Costs 242.1
710 - Engineering, CM, PM 77.5
720 - Construction Facilities & Services 44.6
730 - Contractor Mobilization/Demobilization and Indirects 56.3
740 - Construction Camp Facilities & Operation 40.0
750 - Freight & Logistics 23.7
800 - General Services - Owner's Cost 44.8
810 - Departments 39.2
820 – Logistics / Taxes / Insurance 4.5
830 - Operations Accommodations 1.1
900 - Preproduction, Startup, Commissioning 239.6
910 - Mining Preproduction / Commissioning 93.8
940 - Spares & First Fills 10.6
950 - Process Plant Preproduction / Commissioning 24.4
960 - Operational Readiness Support 2.5
990 - Contingency 108.4
Grand Total 526.5
21.1.4.1 Allowances, Contingency and Escalation
The contingency amount was established through a facilitated quantitative risk assessment ("QRA")
process, using a Monte Carlo simulation at a P80 confidence level. The total contingency provision is
CAD 108M, which represents 9% of the total CAPEX, and is comprised of the following:
• A design/quantity growth allowance for all equipment, material and labour (except WBS 400 Mine
Mobile Equipment) for CAD 10.7M;
• A contingency provision of CAD 81.4M on project costs (WBS 100 - 300 and 500 - 700),
representing 9.5% of those costs;
NI 43-101 Technical Report Feasibility Study Update Hardrock Project, Ontario, Canada
Section 21 January 2021 Page 21-9
• A contingency provision of CAD 3.9M on mine mobile equipment (WBS 100 400), representing 2.5%
of those costs;
• A contingency provision of CAD 12.4M on Owner’s Cost and Mine Pre-production
(WBS 800 and 900), representing 7% of those costs.
There is no provision for escalation in the CAPEX.
21.1.5 Sustaining Capital
Sustaining capital is presented in Table 21.8
Sustaining capital for the mine includes additional equipment purchases for a total of CAD 156.8M. Major
equipment repairs are capitalized which represent CAD 165.8M over the LOM. The sustaining capital
estimate also includes the remaining mining construction civil works for ditches, ponds and dump shear
keys totalling CAD 2.8M.
Major dam raises for the TMF are accounted for in sustaining capital, a total of CAD 85.2M over two major
work periods: Year 2-3 and Year 7-9 of mine operations. This work would be done by the mine operations
team.
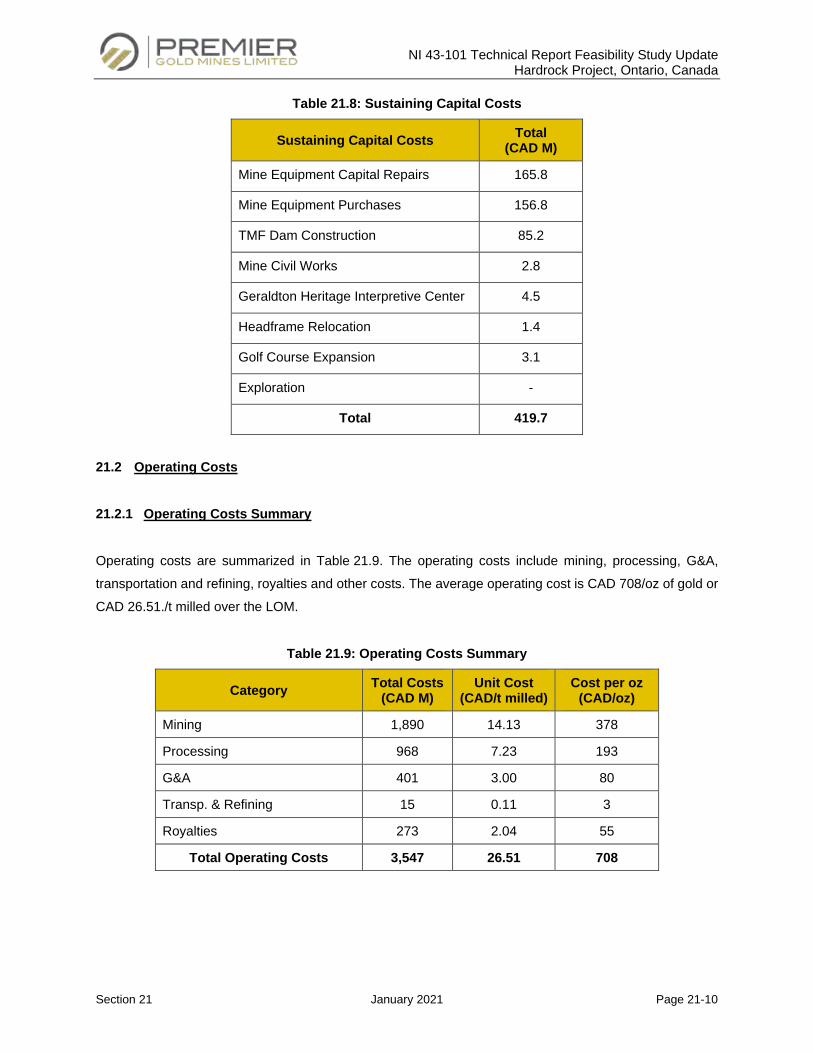
NI 43-101 Technical Report Feasibility Study Update Hardrock Project, Ontario, Canada
Section 21 January 2021 Page 21-10
Table 21.8: Sustaining Capital Costs
Sustaining Capital Costs Total (CAD M)
Mine Equipment Capital Repairs 165.8
Mine Equipment Purchases 156.8
TMF Dam Construction 85.2
Mine Civil Works 2.8
Geraldton Heritage Interpretive Center 4.5
Headframe Relocation 1.4
Golf Course Expansion 3.1
Exploration -
Total 419.7
21.2 Operating Costs
21.2.1 Operating Costs Summary
Operating costs are summarized in Table 21.9. The operating costs include mining, processing, G&A,
transportation and refining, royalties and other costs. The average operating cost is CAD 708/oz of gold or
CAD 26.51./t milled over the LOM.
Table 21.9: Operating Costs Summary
Category Total Costs (CAD M)
Unit Cost (CAD/t milled)
Cost per oz (CAD/oz)
Mining 1,890 14.13 378
Processing 968 7.23 193
G&A 401 3.00 80
Transp. & Refining 15 0.11 3
Royalties 273 2.04 55
Total Operating Costs 3,547 26.51 708
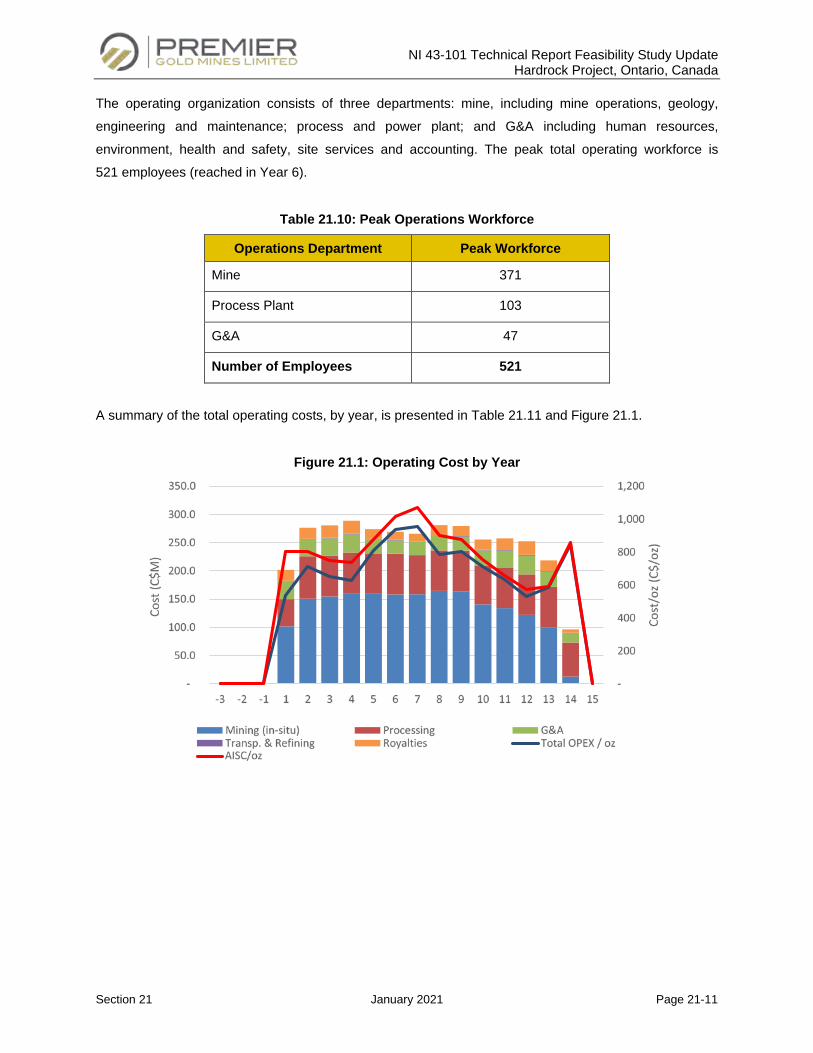
NI 43-101 Technical Report Feasibility Study Update Hardrock Project, Ontario, Canada
Section 21 January 2021 Page 21-11
The operating organization consists of three departments: mine, including mine operations, geology,
engineering and maintenance; process and power plant; and G&A including human resources,
environment, health and safety, site services and accounting. The peak total operating workforce is
521 employees (reached in Year 6).
Table 21.10: Peak Operations Workforce
Operations Department Peak Workforce
Mine 371
Process Plant 103
G&A 47
Number of Employees 521
A summary of the total operating costs, by year, is presented in Table 21.11 and Figure 21.1.
Figure 21.1: Operating Cost by Year
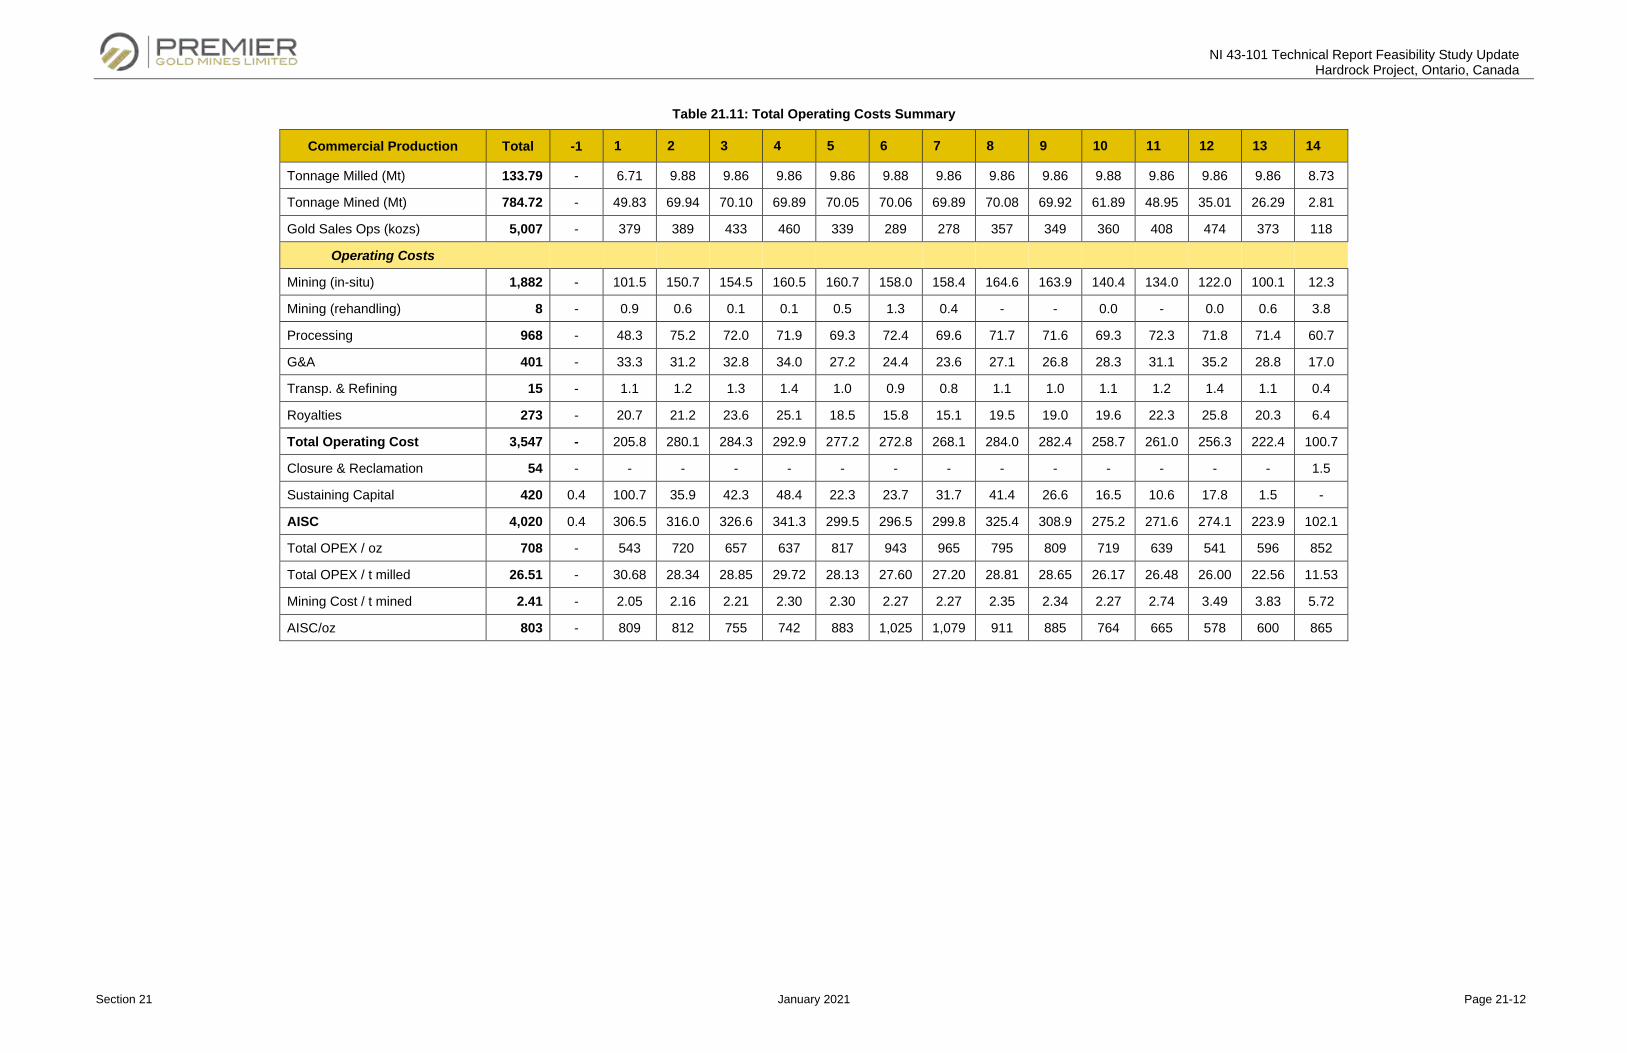
NI 43-101 Technical Report Feasibility Study Update Hardrock Project, Ontario, Canada
Section 21 January 2021 Page 21-12
Table 21.11: Total Operating Costs Summary
Commercial Production Total -1 1 2 3 4 5 6 7 8 9 10 11 12 13 14
Tonnage Milled (Mt) 133.79 - 6.71 9.88 9.86 9.86 9.86 9.88 9.86 9.86 9.86 9.88 9.86 9.86 9.86 8.73
Tonnage Mined (Mt) 784.72 - 49.83 69.94 70.10 69.89 70.05 70.06 69.89 70.08 69.92 61.89 48.95 35.01 26.29 2.81
Gold Sales Ops (kozs) 5,007 - 379 389 433 460 339 289 278 357 349 360 408 474 373 118
Operating Costs Mining (in-situ) 1,882 - 101.5 150.7 154.5 160.5 160.7 158.0 158.4 164.6 163.9 140.4 134.0 122.0 100.1 12.3
Mining (rehandling) 8 - 0.9 0.6 0.1 0.1 0.5 1.3 0.4 - - 0.0 - 0.0 0.6 3.8
Processing 968 - 48.3 75.2 72.0 71.9 69.3 72.4 69.6 71.7 71.6 69.3 72.3 71.8 71.4 60.7
G&A 401 - 33.3 31.2 32.8 34.0 27.2 24.4 23.6 27.1 26.8 28.3 31.1 35.2 28.8 17.0
Transp. & Refining 15 - 1.1 1.2 1.3 1.4 1.0 0.9 0.8 1.1 1.0 1.1 1.2 1.4 1.1 0.4
Royalties 273 - 20.7 21.2 23.6 25.1 18.5 15.8 15.1 19.5 19.0 19.6 22.3 25.8 20.3 6.4
Total Operating Cost 3,547 - 205.8 280.1 284.3 292.9 277.2 272.8 268.1 284.0 282.4 258.7 261.0 256.3 222.4 100.7
Closure & Reclamation 54 - - - - - - - - - - - - - - 1.5
Sustaining Capital 420 0.4 100.7 35.9 42.3 48.4 22.3 23.7 31.7 41.4 26.6 16.5 10.6 17.8 1.5 -
AISC 4,020 0.4 306.5 316.0 326.6 341.3 299.5 296.5 299.8 325.4 308.9 275.2 271.6 274.1 223.9 102.1
Total OPEX / oz 708 - 543 720 657 637 817 943 965 795 809 719 639 541 596 852
Total OPEX / t milled 26.51 - 30.68 28.34 28.85 29.72 28.13 27.60 27.20 28.81 28.65 26.17 26.48 26.00 22.56 11.53
Mining Cost / t mined 2.41 - 2.05 2.16 2.21 2.30 2.30 2.27 2.27 2.35 2.34 2.27 2.74 3.49 3.83 5.72
AISC/oz 803 - 809 812 755 742 883 1,025 1,079 911 885 764 665 578 600 865
NI 43-101 Technical Report Feasibility Study Update Hardrock Project, Ontario, Canada
Section 21 January 2021 Page 21-13
21.3 Mining Costs
Table 21.12 presents the breakdown of mining costs, by department, while Table 21.13 presents the major
cost drivers for the mine department.
The mine operating costs are estimated from first principles for all mine activities. Equipment hours required
to meet production needs of the LOM plan are based on productivity factors or equipment simulations. Each
piece of equipment has an hourly operating cost which includes operating and maintenance labour, fuel
and lube, maintenance parts, tires (if required) and ground engaging tools (if required). A formal RFP
process has been completed for the mine equipment and associated operating costs, fuel, tires, explosives
and accessories, etc.
The average mining cost during operations is estimated at CAD 2.41/t mined including re-handling costs.
The mining costs are lower than average during the early years and increase with increased haulage
distances and pit deepening, in the later years. This operating cost estimate excludes capital repairs which
treated as sustaining capital.
Haulage is the major mining cost activity representing 41% of total costs followed by blasting (12%), loading
(9%) and drilling (7%). Some haulage costs have been back charged to the TMF dam construction as this
represents incremental haulage. Loading and haulage for stockpile re-handling is also captured as a
separate activity cost.
Fuel is the dominant cost, by element, representing 31% of total costs, followed by salaries (27%),
maintenance parts (14%) and bulk explosives (12%).
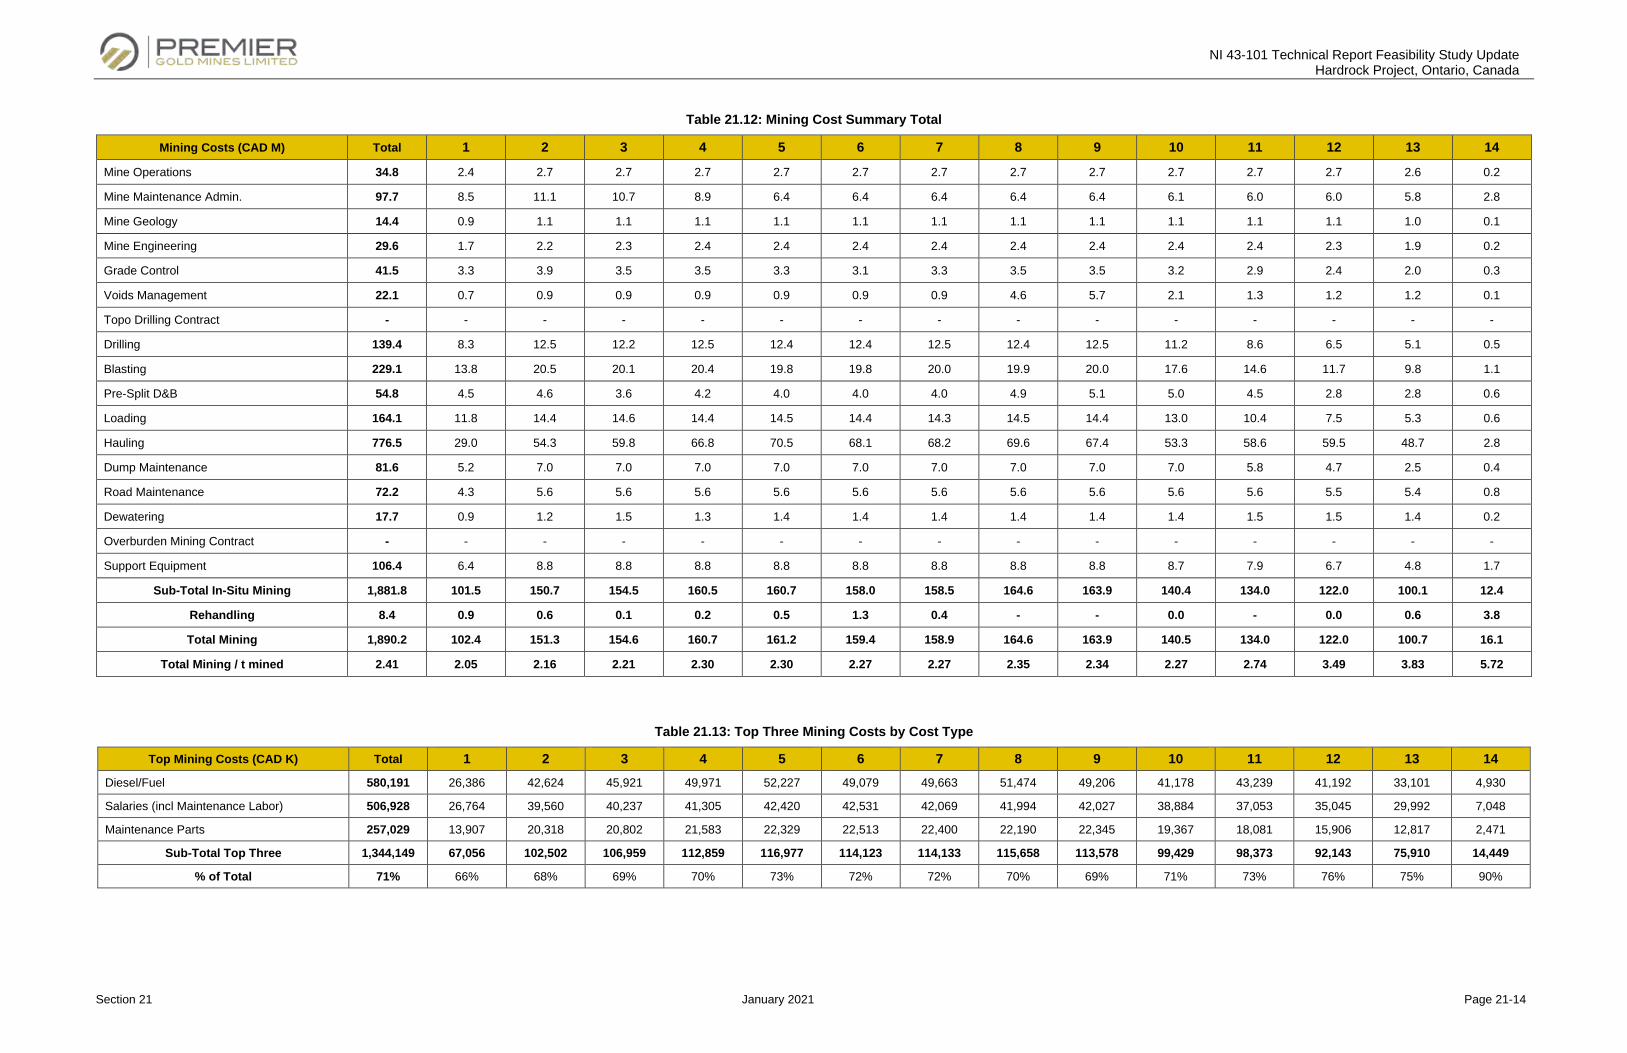
NI 43-101 Technical Report Feasibility Study Update Hardrock Project, Ontario, Canada
Section 21 January 2021 Page 21-14
Table 21.12: Mining Cost Summary Total
Mining Costs (CAD M) Total 1 2 3 4 5 6 7 8 9 10 11 12 13 14
Mine Operations 34.8 2.4 2.7 2.7 2.7 2.7 2.7 2.7 2.7 2.7 2.7 2.7 2.7 2.6 0.2
Mine Maintenance Admin. 97.7 8.5 11.1 10.7 8.9 6.4 6.4 6.4 6.4 6.4 6.1 6.0 6.0 5.8 2.8
Mine Geology 14.4 0.9 1.1 1.1 1.1 1.1 1.1 1.1 1.1 1.1 1.1 1.1 1.1 1.0 0.1
Mine Engineering 29.6 1.7 2.2 2.3 2.4 2.4 2.4 2.4 2.4 2.4 2.4 2.4 2.3 1.9 0.2
Grade Control 41.5 3.3 3.9 3.5 3.5 3.3 3.1 3.3 3.5 3.5 3.2 2.9 2.4 2.0 0.3
Voids Management 22.1 0.7 0.9 0.9 0.9 0.9 0.9 0.9 4.6 5.7 2.1 1.3 1.2 1.2 0.1
Topo Drilling Contract - - - - - - - - - - - - - - -
Drilling 139.4 8.3 12.5 12.2 12.5 12.4 12.4 12.5 12.4 12.5 11.2 8.6 6.5 5.1 0.5
Blasting 229.1 13.8 20.5 20.1 20.4 19.8 19.8 20.0 19.9 20.0 17.6 14.6 11.7 9.8 1.1
Pre-Split D&B 54.8 4.5 4.6 3.6 4.2 4.0 4.0 4.0 4.9 5.1 5.0 4.5 2.8 2.8 0.6
Loading 164.1 11.8 14.4 14.6 14.4 14.5 14.4 14.3 14.5 14.4 13.0 10.4 7.5 5.3 0.6
Hauling 776.5 29.0 54.3 59.8 66.8 70.5 68.1 68.2 69.6 67.4 53.3 58.6 59.5 48.7 2.8
Dump Maintenance 81.6 5.2 7.0 7.0 7.0 7.0 7.0 7.0 7.0 7.0 7.0 5.8 4.7 2.5 0.4
Road Maintenance 72.2 4.3 5.6 5.6 5.6 5.6 5.6 5.6 5.6 5.6 5.6 5.6 5.5 5.4 0.8
Dewatering 17.7 0.9 1.2 1.5 1.3 1.4 1.4 1.4 1.4 1.4 1.4 1.5 1.5 1.4 0.2
Overburden Mining Contract - - - - - - - - - - - - - - -
Support Equipment 106.4 6.4 8.8 8.8 8.8 8.8 8.8 8.8 8.8 8.8 8.7 7.9 6.7 4.8 1.7
Sub-Total In-Situ Mining 1,881.8 101.5 150.7 154.5 160.5 160.7 158.0 158.5 164.6 163.9 140.4 134.0 122.0 100.1 12.4
Rehandling 8.4 0.9 0.6 0.1 0.2 0.5 1.3 0.4 - - 0.0 - 0.0 0.6 3.8
Total Mining 1,890.2 102.4 151.3 154.6 160.7 161.2 159.4 158.9 164.6 163.9 140.5 134.0 122.0 100.7 16.1
Total Mining / t mined 2.41 2.05 2.16 2.21 2.30 2.30 2.27 2.27 2.35 2.34 2.27 2.74 3.49 3.83 5.72
Table 21.13: Top Three Mining Costs by Cost Type
Top Mining Costs (CAD K) Total 1 2 3 4 5 6 7 8 9 10 11 12 13 14 Diesel/Fuel 580,191 26,386 42,624 45,921 49,971 52,227 49,079 49,663 51,474 49,206 41,178 43,239 41,192 33,101 4,930
Salaries (incl Maintenance Labor) 506,928 26,764 39,560 40,237 41,305 42,420 42,531 42,069 41,994 42,027 38,884 37,053 35,045 29,992 7,048
Maintenance Parts 257,029 13,907 20,318 20,802 21,583 22,329 22,513 22,400 22,190 22,345 19,367 18,081 15,906 12,817 2,471
Sub-Total Top Three 1,344,149 67,056 102,502 106,959 112,859 116,977 114,123 114,133 115,658 113,578 99,429 98,373 92,143 75,910 14,449
% of Total 71% 66% 68% 69% 70% 73% 72% 72% 70% 69% 71% 73% 76% 75% 90%
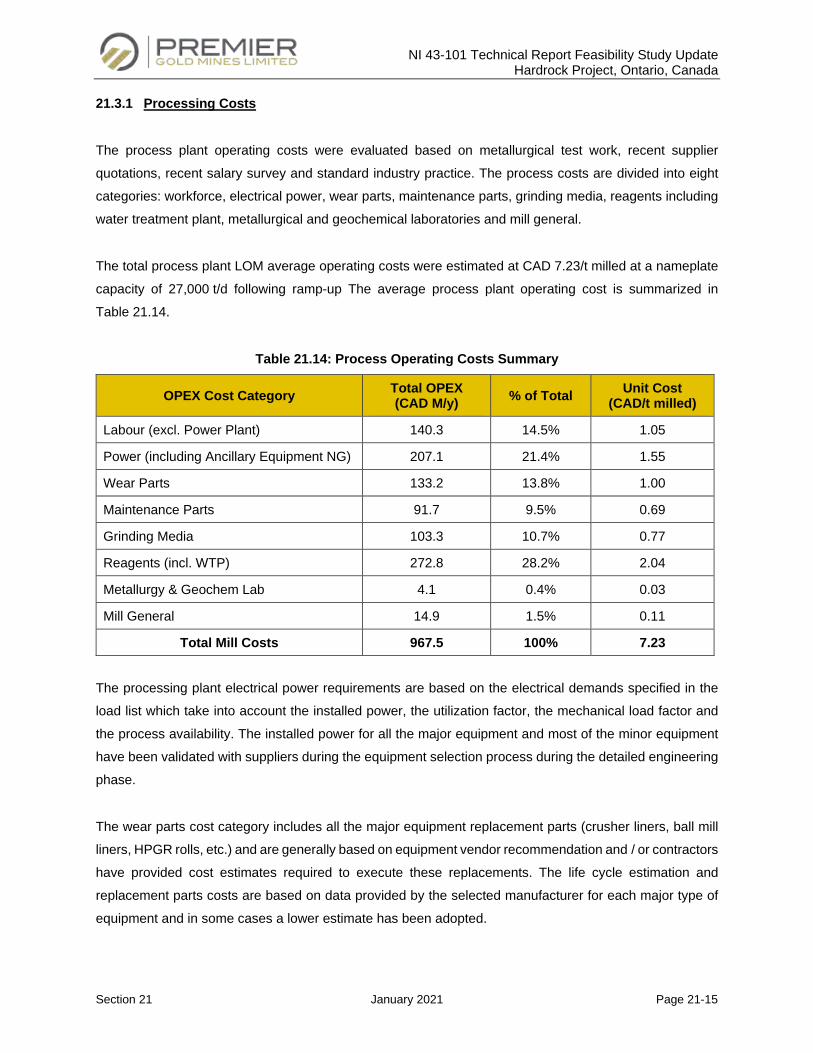
NI 43-101 Technical Report Feasibility Study Update Hardrock Project, Ontario, Canada
Section 21 January 2021 Page 21-15
21.3.1 Processing Costs
The process plant operating costs were evaluated based on metallurgical test work, recent supplier
quotations, recent salary survey and standard industry practice. The process costs are divided into eight
categories: workforce, electrical power, wear parts, maintenance parts, grinding media, reagents including
water treatment plant, metallurgical and geochemical laboratories and mill general.
The total process plant LOM average operating costs were estimated at CAD 7.23/t milled at a nameplate
capacity of 27,000 t/d following ramp-up The average process plant operating cost is summarized in
Table 21.14.
Table 21.14: Process Operating Costs Summary
OPEX Cost Category Total OPEX (CAD M/y) % of Total Unit Cost
(CAD/t milled)
Labour (excl. Power Plant) 140.3 14.5% 1.05
Power (including Ancillary Equipment NG) 207.1 21.4% 1.55
Wear Parts 133.2 13.8% 1.00
Maintenance Parts 91.7 9.5% 0.69
Grinding Media 103.3 10.7% 0.77
Reagents (incl. WTP) 272.8 28.2% 2.04
Metallurgy & Geochem Lab 4.1 0.4% 0.03
Mill General 14.9 1.5% 0.11
Total Mill Costs 967.5 100% 7.23
The processing plant electrical power requirements are based on the electrical demands specified in the
load list which take into account the installed power, the utilization factor, the mechanical load factor and
the process availability. The installed power for all the major equipment and most of the minor equipment
have been validated with suppliers during the equipment selection process during the detailed engineering
phase.
The wear parts cost category includes all the major equipment replacement parts (crusher liners, ball mill
liners, HPGR rolls, etc.) and are generally based on equipment vendor recommendation and / or contractors
have provided cost estimates required to execute these replacements. The life cycle estimation and
replacement parts costs are based on data provided by the selected manufacturer for each major type of
equipment and in some cases a lower estimate has been adopted.
NI 43-101 Technical Report Feasibility Study Update Hardrock Project, Ontario, Canada
Section 21 January 2021 Page 21-16
The maintenance parts cost category includes all the minor normal operation replacement parts such as
pump casings, screen decks, chute liners, conveyor belts, etc. Year 1 operational spares have been
included, where possible, based on selected equipment packages to obtain a higher level of accuracy. For
equipment that has not been selected and general maintenance requirements, these costs are calculated
to represent 3.5% of the total mechanical equipment costs.
Grinding media consumption is based on the ore abrasion index and is calculated at CAD 0.039 kg/kWh.
The ball mill power consumption and grinding media costs are used to evaluate an annual grinding media
cost.
Most reagents consumption data is derived from test work. For some low consumption reagents, such as
antiscalant and refining flux, the requirements have been estimated based on similar projects. For all
reagents (except low consumption) a formal RFP process has been completed and the selected vendor
pricing is included in the plant cost model.
Oxygen is produced on site by a vacuum swing absorption (“VSA”) plant with liquid storage in tanks as
back-up. The plant is built, owned, and operated by a third party. A fixed monthly fee is associated with this
service. Where possible, reagents will arrive in bulk containers with appropriate on-site unloading and
storage facilities
Sample preparation for mining and plant samples for gold assaying will be carried out by a third party facility.
The geochemical lab will carry out pulp digestions and analysis for all other geochemical requirements
except certified water analysis. The metallurgical lab will consist of conducting bottle roll test work and other
investigations by the metallurgical department.
A mill general category is included to cover miscellaneous costs such tool purchase, dozer usage,
equipment rental, consulting and other costs.
The power cost of site generated power was derived from three major components: 1) forecasted energy
price (natural gas); 2) workforce required to operate and maintain the power plant; and 3) maintenance
costs over the LOM. The total unit power cost is estimated at CAD 0.049/kWh.
The natural gas price used for power requirements was evaluated at CAD 3.89/GJ. With annualized power
demands, this represents CAD 0.033/kWh.

NI 43-101 Technical Report Feasibility Study Update Hardrock Project, Ontario, Canada
Section 21 January 2021 Page 21-17
21.3.2 General and Administration Costs
The G&A costs, by year, are summarized in Table 21.15 and peak at CAD 18.3M per year. The labour
costs for G&A represent 31% of the total G&A budget. The G&A costs reflect the operating model which
assumes a locally sourced workforce with no camp related costs.
The average G&A costs over the LOM were estimated at CAD 3.00/t milled.
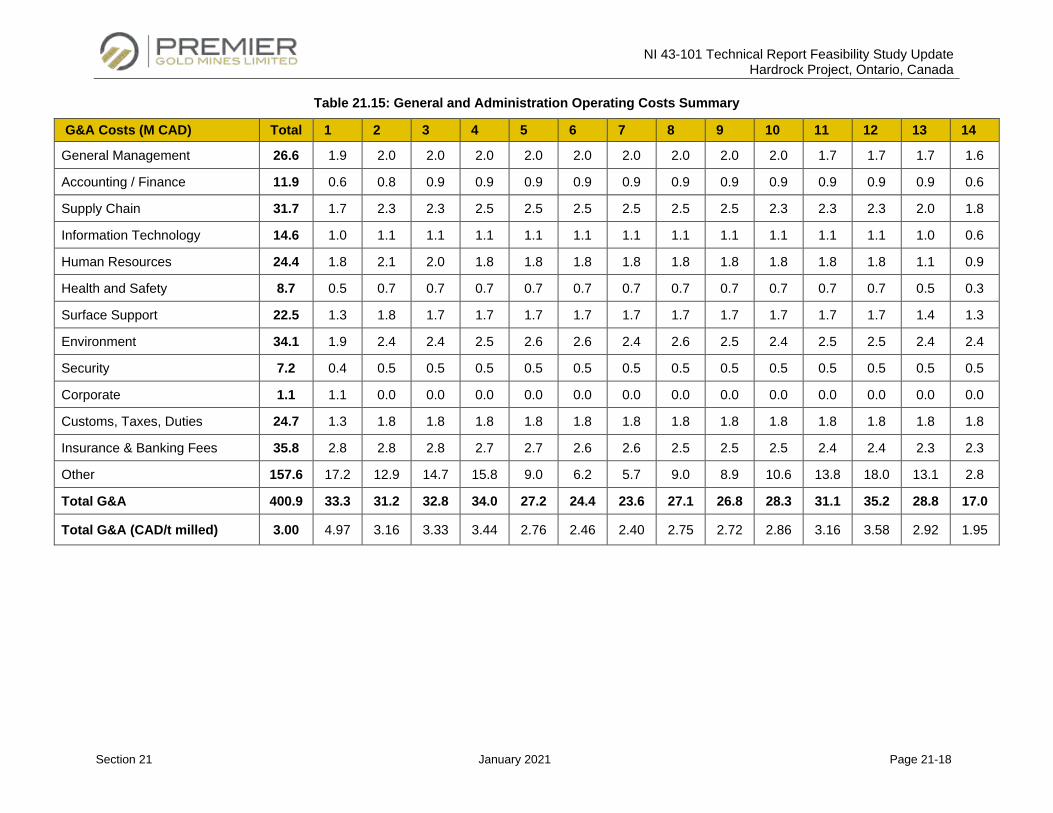
NI 43-101 Technical Report Feasibility Study Update Hardrock Project, Ontario, Canada
Section 21 January 2021 Page 21-18
Table 21.15: General and Administration Operating Costs Summary
G&A Costs (M CAD) Total 1 2 3 4 5 6 7 8 9 10 11 12 13 14
General Management 26.6 1.9 2.0 2.0 2.0 2.0 2.0 2.0 2.0 2.0 2.0 1.7 1.7 1.7 1.6
Accounting / Finance 11.9 0.6 0.8 0.9 0.9 0.9 0.9 0.9 0.9 0.9 0.9 0.9 0.9 0.9 0.6
Supply Chain 31.7 1.7 2.3 2.3 2.5 2.5 2.5 2.5 2.5 2.5 2.3 2.3 2.3 2.0 1.8
Information Technology 14.6 1.0 1.1 1.1 1.1 1.1 1.1 1.1 1.1 1.1 1.1 1.1 1.1 1.0 0.6
Human Resources 24.4 1.8 2.1 2.0 1.8 1.8 1.8 1.8 1.8 1.8 1.8 1.8 1.8 1.1 0.9
Health and Safety 8.7 0.5 0.7 0.7 0.7 0.7 0.7 0.7 0.7 0.7 0.7 0.7 0.7 0.5 0.3
Surface Support 22.5 1.3 1.8 1.7 1.7 1.7 1.7 1.7 1.7 1.7 1.7 1.7 1.7 1.4 1.3
Environment 34.1 1.9 2.4 2.4 2.5 2.6 2.6 2.4 2.6 2.5 2.4 2.5 2.5 2.4 2.4
Security 7.2 0.4 0.5 0.5 0.5 0.5 0.5 0.5 0.5 0.5 0.5 0.5 0.5 0.5 0.5
Corporate 1.1 1.1 0.0 0.0 0.0 0.0 0.0 0.0 0.0 0.0 0.0 0.0 0.0 0.0 0.0
Customs, Taxes, Duties 24.7 1.3 1.8 1.8 1.8 1.8 1.8 1.8 1.8 1.8 1.8 1.8 1.8 1.8 1.8
Insurance & Banking Fees 35.8 2.8 2.8 2.8 2.7 2.7 2.6 2.6 2.5 2.5 2.5 2.4 2.4 2.3 2.3
Other 157.6 17.2 12.9 14.7 15.8 9.0 6.2 5.7 9.0 8.9 10.6 13.8 18.0 13.1 2.8
Total G&A 400.9 33.3 31.2 32.8 34.0 27.2 24.4 23.6 27.1 26.8 28.3 31.1 35.2 28.8 17.0
Total G&A (CAD/t milled) 3.00 4.97 3.16 3.33 3.44 2.76 2.46 2.40 2.75 2.72 2.86 3.16 3.58 2.92 1.95
NI 43-101 Technical Report Feasibility Study Update Hardrock Project, Ontario, Canada
Section 22 January 2021 Page 22-1
ECONOMIC ANALYSIS
This section presents all elements of the economic model which principally consist of metal production and
revenues, royalty agreements, operating costs, capital costs, sustaining capital, salvage value, closure and
reclamation costs, taxation and net Project cash flow.
The economic analysis is carried out in real terms (i.e. without inflation factors) in Q4 2019 Canadian dollars
without any project or equipment financing assumptions. The economic results are calculated as of the
beginning of Year -3, which corresponds to the start of the 39 months pre-production CAPEX phase,
including engineering and procurement, with all prior costs treated as sunk costs but considered for the
purposes of taxation calculations. The economic results such as the net present value (“NPV”) and internal
rate of return (“IRR”) are calculated on an annual basis.
22.1 Assumptions
The key assumptions influencing the economics of the Project include:
• Gold price in USD/oz;
• Canadian dollar to United States dollar exchange rate (“CAD/USD”);
• Diesel price in CAD/L;
• Natural gas price for power generation.
22.1.1 Gold Price
The base case gold price selected for the economic evaluation is USD 1,400/oz. This price assumption is
supported by independent forecasts and consensus pricing.
22.1.2 Exchange Rates
The base case Canadian dollar exchange rate for economic evaluation is CAD/USD 1.30. Most operating
costs are estimated in Canadian dollars with the US dollar denominated gold revenue converted to
Canadian dollars.
The Euro exchange rate assumption is CAD/EUR 1.47, which is relevant in purchasing some mining and
power plant equipment sourced from Europe.
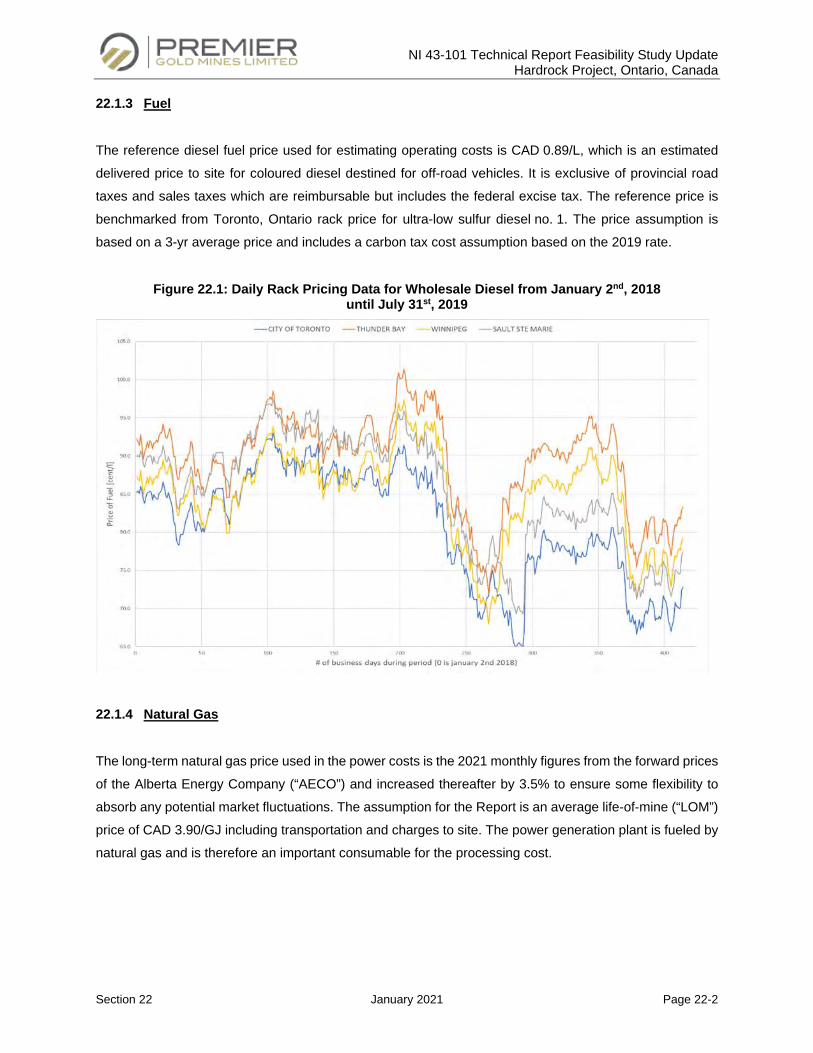
NI 43-101 Technical Report Feasibility Study Update Hardrock Project, Ontario, Canada
Section 22 January 2021 Page 22-2
22.1.3 Fuel
The reference diesel fuel price used for estimating operating costs is CAD 0.89/L, which is an estimated
delivered price to site for coloured diesel destined for off-road vehicles. It is exclusive of provincial road
taxes and sales taxes which are reimbursable but includes the federal excise tax. The reference price is
benchmarked from Toronto, Ontario rack price for ultra-low sulfur diesel no. 1. The price assumption is
based on a 3-yr average price and includes a carbon tax cost assumption based on the 2019 rate.
Figure 22.1: Daily Rack Pricing Data for Wholesale Diesel from January 2nd, 2018 until July 31st, 2019
22.1.4 Natural Gas
The long-term natural gas price used in the power costs is the 2021 monthly figures from the forward prices
of the Alberta Energy Company (“AECO”) and increased thereafter by 3.5% to ensure some flexibility to
absorb any potential market fluctuations. The assumption for the Report is an average life-of-mine (“LOM”)
price of CAD 3.90/GJ including transportation and charges to site. The power generation plant is fueled by
natural gas and is therefore an important consumable for the processing cost.
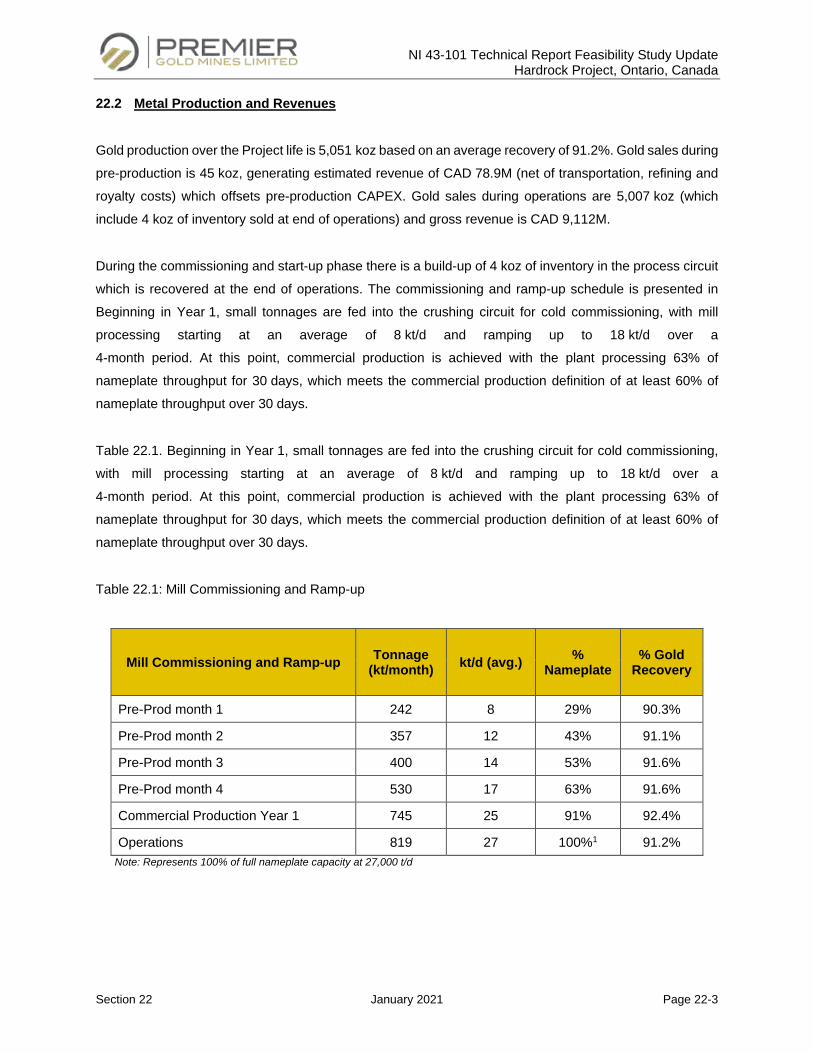
NI 43-101 Technical Report Feasibility Study Update Hardrock Project, Ontario, Canada
Section 22 January 2021 Page 22-3
22.2 Metal Production and Revenues
Gold production over the Project life is 5,051 koz based on an average recovery of 91.2%. Gold sales during
pre-production is 45 koz, generating estimated revenue of CAD 78.9M (net of transportation, refining and
royalty costs) which offsets pre-production CAPEX. Gold sales during operations are 5,007 koz (which
include 4 koz of inventory sold at end of operations) and gross revenue is CAD 9,112M.
During the commissioning and start-up phase there is a build-up of 4 koz of inventory in the process circuit
which is recovered at the end of operations. The commissioning and ramp-up schedule is presented in
Beginning in Year 1, small tonnages are fed into the crushing circuit for cold commissioning, with mill
processing starting at an average of 8 kt/d and ramping up to 18 kt/d over a
4-month period. At this point, commercial production is achieved with the plant processing 63% of
nameplate throughput for 30 days, which meets the commercial production definition of at least 60% of
nameplate throughput over 30 days.
Table 22.1. Beginning in Year 1, small tonnages are fed into the crushing circuit for cold commissioning,
with mill processing starting at an average of 8 kt/d and ramping up to 18 kt/d over a
4-month period. At this point, commercial production is achieved with the plant processing 63% of
nameplate throughput for 30 days, which meets the commercial production definition of at least 60% of
nameplate throughput over 30 days.
Table 22.1: Mill Commissioning and Ramp-up
Mill Commissioning and Ramp-up Tonnage (kt/month) kt/d (avg.) %
Nameplate % Gold
Recovery
Pre-Prod month 1 242 8 29% 90.3%
Pre-Prod month 2 357 12 43% 91.1%
Pre-Prod month 3 400 14 53% 91.6%
Pre-Prod month 4 530 17 63% 91.6%
Commercial Production Year 1 745 25 91% 92.4%
Operations 819 27 100%1 91.2% Note: Represents 100% of full nameplate capacity at 27,000 t/d
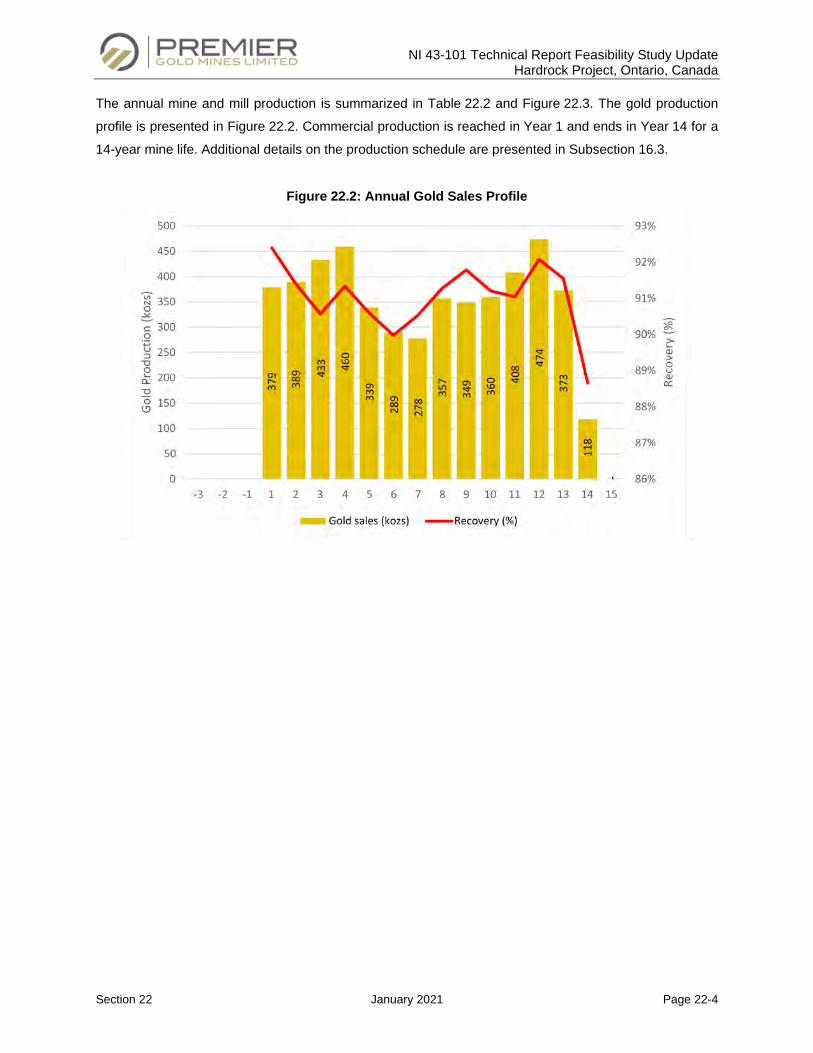
NI 43-101 Technical Report Feasibility Study Update Hardrock Project, Ontario, Canada
Section 22 January 2021 Page 22-4
The annual mine and mill production is summarized in Table 22.2 and Figure 22.3. The gold production
profile is presented in Figure 22.2. Commercial production is reached in Year 1 and ends in Year 14 for a
14-year mine life. Additional details on the production schedule are presented in Subsection 16.3.
Figure 22.2: Annual Gold Sales Profile
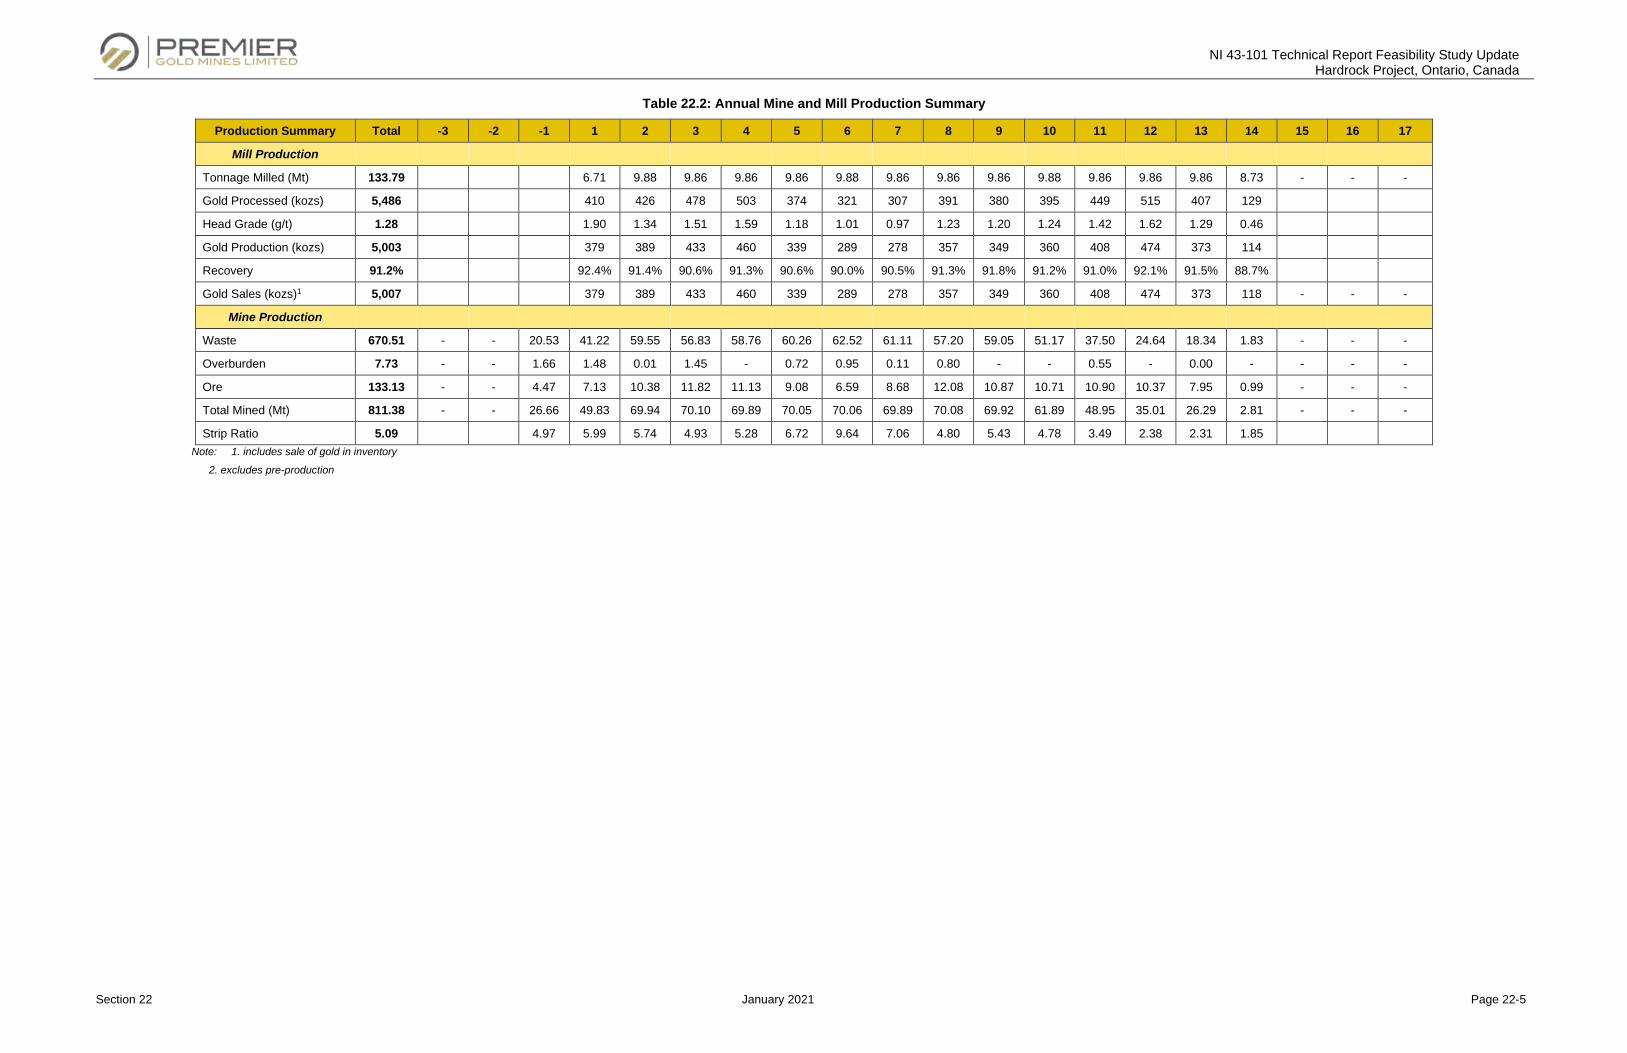
NI 43-101 Technical Report Feasibility Study Update Hardrock Project, Ontario, Canada
Section 22 January 2021 Page 22-5
Table 22.2: Annual Mine and Mill Production Summary
Production Summary Total -3 -2 -1 1 2 3 4 5 6 7 8 9 10 11 12 13 14 15 16 17
Mill Production
Tonnage Milled (Mt) 133.79 6.71 9.88 9.86 9.86 9.86 9.88 9.86 9.86 9.86 9.88 9.86 9.86 9.86 8.73 - - -
Gold Processed (kozs) 5,486 410 426 478 503 374 321 307 391 380 395 449 515 407 129
Head Grade (g/t) 1.28 1.90 1.34 1.51 1.59 1.18 1.01 0.97 1.23 1.20 1.24 1.42 1.62 1.29 0.46
Gold Production (kozs) 5,003 379 389 433 460 339 289 278 357 349 360 408 474 373 114
Recovery 91.2% 92.4% 91.4% 90.6% 91.3% 90.6% 90.0% 90.5% 91.3% 91.8% 91.2% 91.0% 92.1% 91.5% 88.7%
Gold Sales (kozs)1 5,007 379 389 433 460 339 289 278 357 349 360 408 474 373 118 - - -
Mine Production
Waste 670.51 - - 20.53 41.22 59.55 56.83 58.76 60.26 62.52 61.11 57.20 59.05 51.17 37.50 24.64 18.34 1.83 - - -
Overburden 7.73 - - 1.66 1.48 0.01 1.45 - 0.72 0.95 0.11 0.80 - - 0.55 - 0.00 - - - -
Ore 133.13 - - 4.47 7.13 10.38 11.82 11.13 9.08 6.59 8.68 12.08 10.87 10.71 10.90 10.37 7.95 0.99 - - -
Total Mined (Mt) 811.38 - - 26.66 49.83 69.94 70.10 69.89 70.05 70.06 69.89 70.08 69.92 61.89 48.95 35.01 26.29 2.81 - - -
Strip Ratio 5.09 4.97 5.99 5.74 4.93 5.28 6.72 9.64 7.06 4.80 5.43 4.78 3.49 2.38 2.31 1.85
Note: 1. includes sale of gold in inventory
2. excludes pre-production
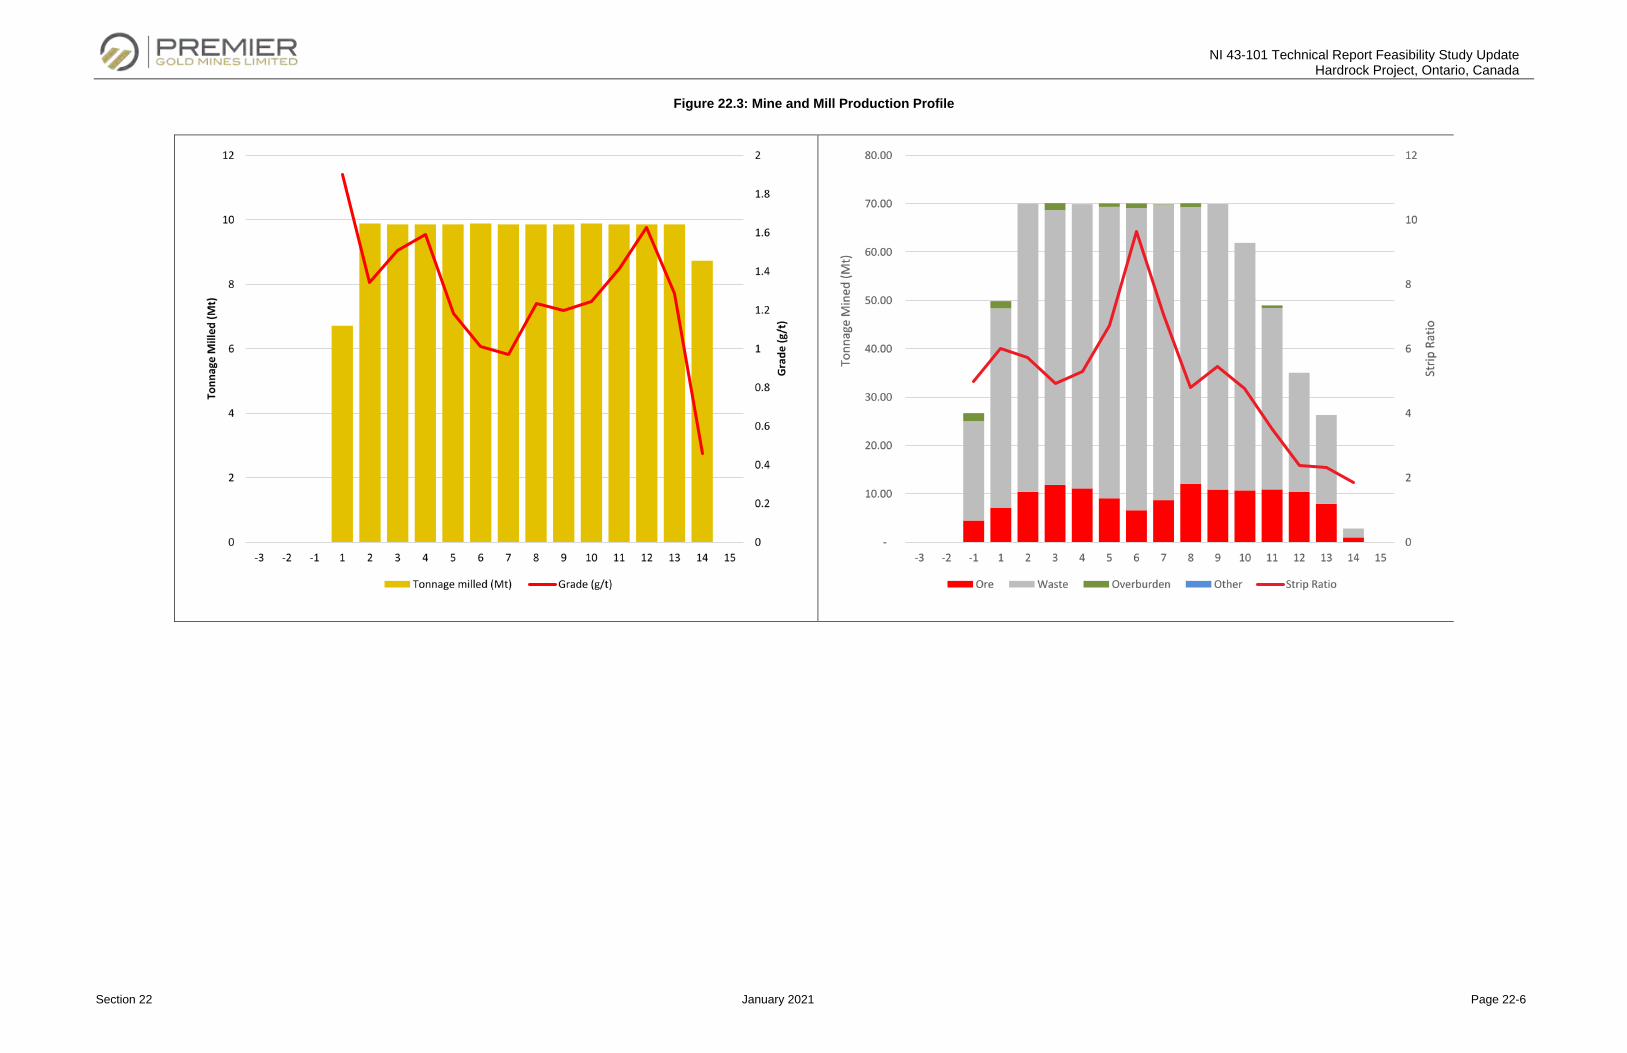
NI 43-101 Technical Report Feasibility Study Update Hardrock Project, Ontario, Canada
Section 22 January 2021 Page 22-6
Figure 22.3: Mine and Mill Production Profile
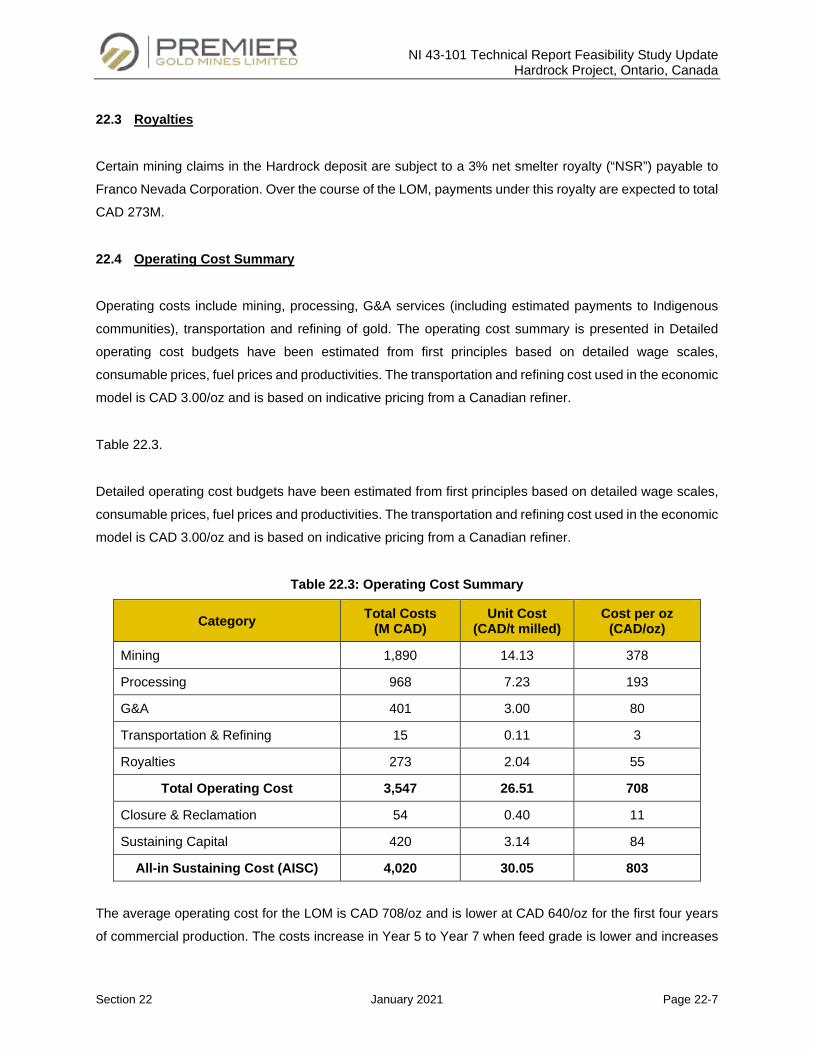
NI 43-101 Technical Report Feasibility Study Update Hardrock Project, Ontario, Canada
Section 22 January 2021 Page 22-7
22.3 Royalties
Certain mining claims in the Hardrock deposit are subject to a 3% net smelter royalty (“NSR”) payable to
Franco Nevada Corporation. Over the course of the LOM, payments under this royalty are expected to total
CAD 273M.
22.4 Operating Cost Summary
Operating costs include mining, processing, G&A services (including estimated payments to Indigenous
communities), transportation and refining of gold. The operating cost summary is presented in Detailed
operating cost budgets have been estimated from first principles based on detailed wage scales,
consumable prices, fuel prices and productivities. The transportation and refining cost used in the economic
model is CAD 3.00/oz and is based on indicative pricing from a Canadian refiner.
Table 22.3.
Detailed operating cost budgets have been estimated from first principles based on detailed wage scales,
consumable prices, fuel prices and productivities. The transportation and refining cost used in the economic
model is CAD 3.00/oz and is based on indicative pricing from a Canadian refiner.
Table 22.3: Operating Cost Summary
Category Total Costs (M CAD)
Unit Cost (CAD/t milled)
Cost per oz (CAD/oz)
Mining 1,890 14.13 378
Processing 968 7.23 193
G&A 401 3.00 80
Transportation & Refining 15 0.11 3
Royalties 273 2.04 55
Total Operating Cost 3,547 26.51 708
Closure & Reclamation 54 0.40 11
Sustaining Capital 420 3.14 84
All-in Sustaining Cost (AISC) 4,020 30.05 803
The average operating cost for the LOM is CAD 708/oz and is lower at CAD 640/oz for the first four years
of commercial production. The costs increase in Year 5 to Year 7 when feed grade is lower and increases
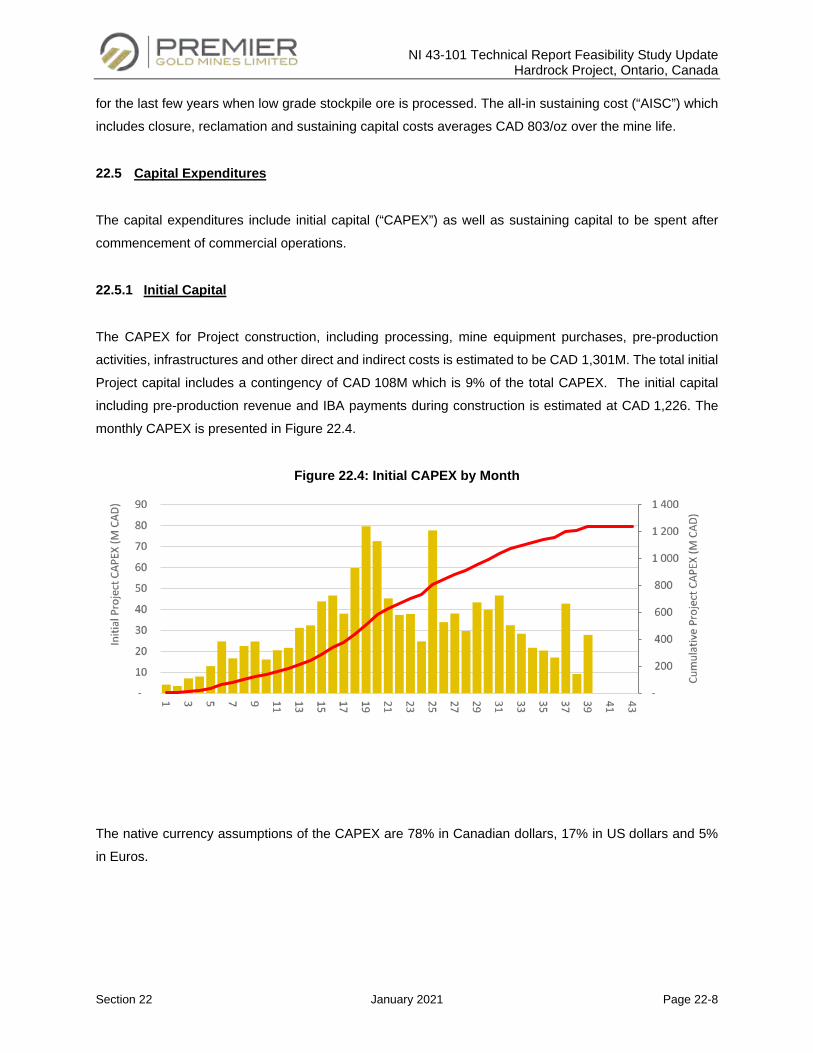
NI 43-101 Technical Report Feasibility Study Update Hardrock Project, Ontario, Canada
Section 22 January 2021 Page 22-8
for the last few years when low grade stockpile ore is processed. The all-in sustaining cost (“AISC”) which
includes closure, reclamation and sustaining capital costs averages CAD 803/oz over the mine life.
22.5 Capital Expenditures
The capital expenditures include initial capital (“CAPEX”) as well as sustaining capital to be spent after
commencement of commercial operations.
22.5.1 Initial Capital
The CAPEX for Project construction, including processing, mine equipment purchases, pre-production
activities, infrastructures and other direct and indirect costs is estimated to be CAD 1,301M. The total initial
Project capital includes a contingency of CAD 108M which is 9% of the total CAPEX. The initial capital
including pre-production revenue and IBA payments during construction is estimated at CAD 1,226. The
monthly CAPEX is presented in Figure 22.4.
Figure 22.4: Initial CAPEX by Month
The native currency assumptions of the CAPEX are 78% in Canadian dollars, 17% in US dollars and 5%
in Euros.
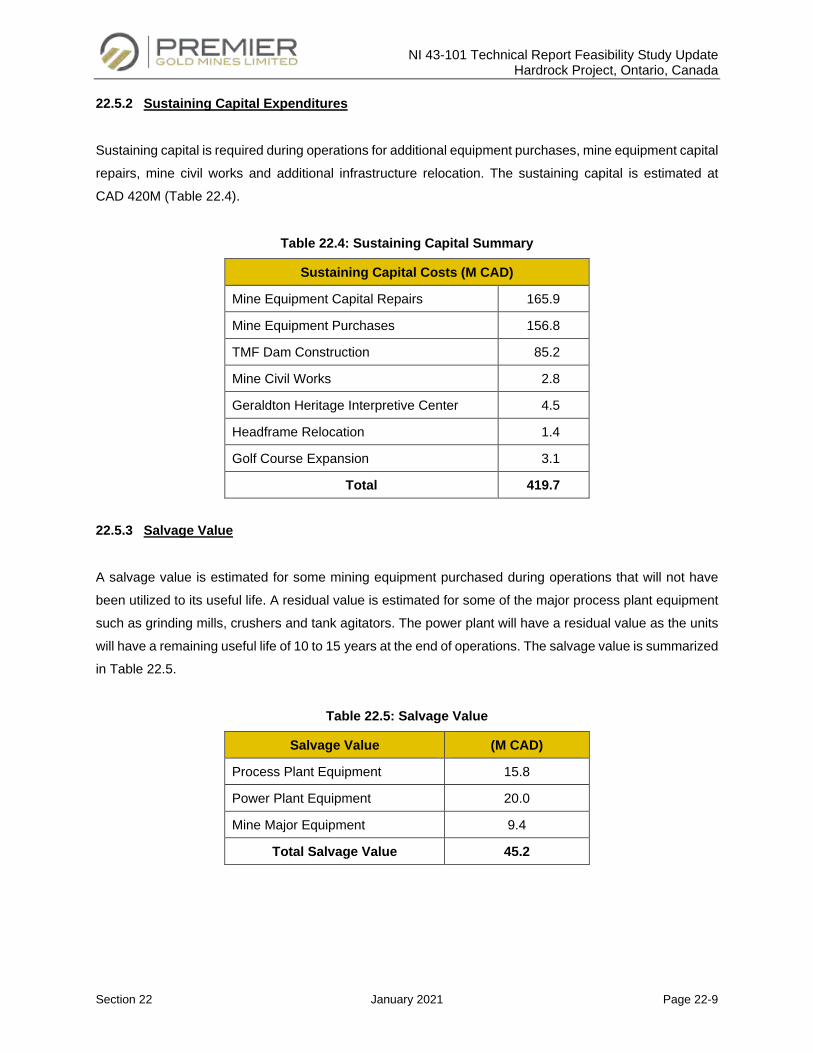
NI 43-101 Technical Report Feasibility Study Update Hardrock Project, Ontario, Canada
Section 22 January 2021 Page 22-9
22.5.2 Sustaining Capital Expenditures
Sustaining capital is required during operations for additional equipment purchases, mine equipment capital
repairs, mine civil works and additional infrastructure relocation. The sustaining capital is estimated at
CAD 420M (Table 22.4).
Table 22.4: Sustaining Capital Summary
Sustaining Capital Costs (M CAD)
Mine Equipment Capital Repairs 165.9
Mine Equipment Purchases 156.8
TMF Dam Construction 85.2
Mine Civil Works 2.8
Geraldton Heritage Interpretive Center 4.5
Headframe Relocation 1.4
Golf Course Expansion 3.1
Total 419.7
22.5.3 Salvage Value
A salvage value is estimated for some mining equipment purchased during operations that will not have
been utilized to its useful life. A residual value is estimated for some of the major process plant equipment
such as grinding mills, crushers and tank agitators. The power plant will have a residual value as the units
will have a remaining useful life of 10 to 15 years at the end of operations. The salvage value is summarized
in Table 22.5.
Table 22.5: Salvage Value
Salvage Value (M CAD)
Process Plant Equipment 15.8
Power Plant Equipment 20.0
Mine Major Equipment 9.4
Total Salvage Value 45.2
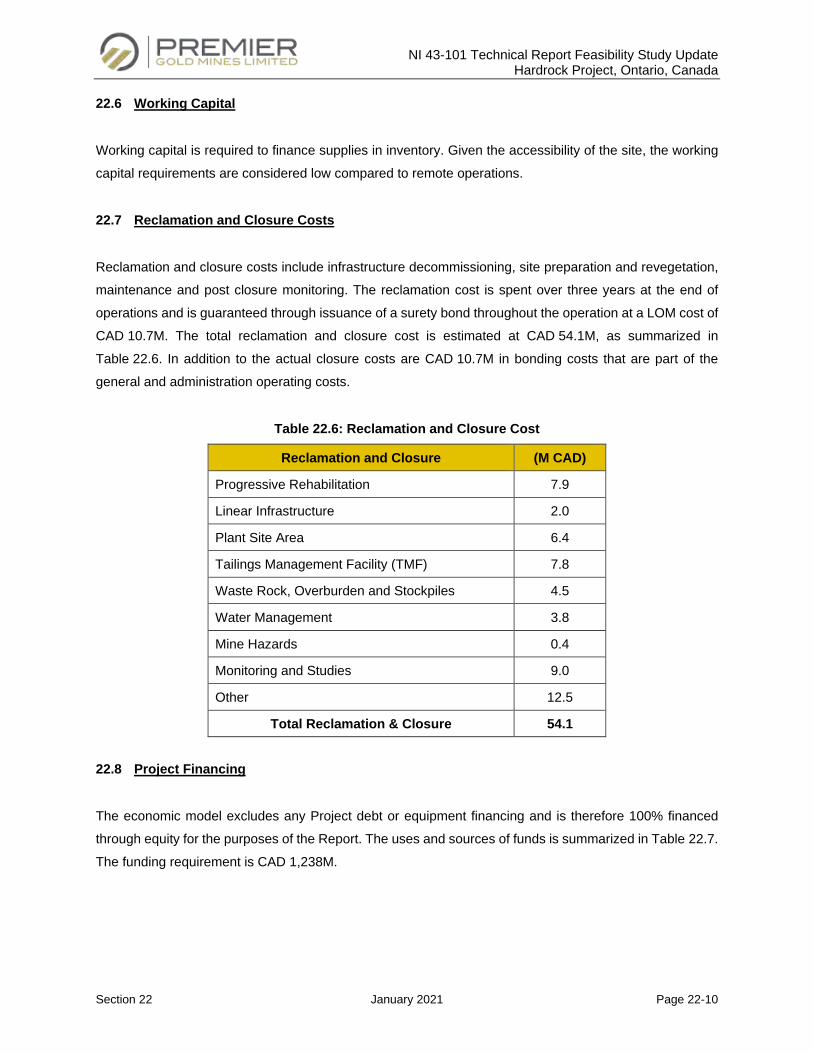
NI 43-101 Technical Report Feasibility Study Update Hardrock Project, Ontario, Canada
Section 22 January 2021 Page 22-10
22.6 Working Capital
Working capital is required to finance supplies in inventory. Given the accessibility of the site, the working
capital requirements are considered low compared to remote operations.
22.7 Reclamation and Closure Costs
Reclamation and closure costs include infrastructure decommissioning, site preparation and revegetation,
maintenance and post closure monitoring. The reclamation cost is spent over three years at the end of
operations and is guaranteed through issuance of a surety bond throughout the operation at a LOM cost of
CAD 10.7M. The total reclamation and closure cost is estimated at CAD 54.1M, as summarized in
Table 22.6. In addition to the actual closure costs are CAD 10.7M in bonding costs that are part of the
general and administration operating costs.
Table 22.6: Reclamation and Closure Cost
Reclamation and Closure (M CAD)
Progressive Rehabilitation 7.9
Linear Infrastructure 2.0
Plant Site Area 6.4
Tailings Management Facility (TMF) 7.8
Waste Rock, Overburden and Stockpiles 4.5
Water Management 3.8
Mine Hazards 0.4
Monitoring and Studies 9.0
Other 12.5
Total Reclamation & Closure 54.1
22.8 Project Financing
The economic model excludes any Project debt or equipment financing and is therefore 100% financed
through equity for the purposes of the Report. The uses and sources of funds is summarized in Table 22.7.
The funding requirement is CAD 1,238M.
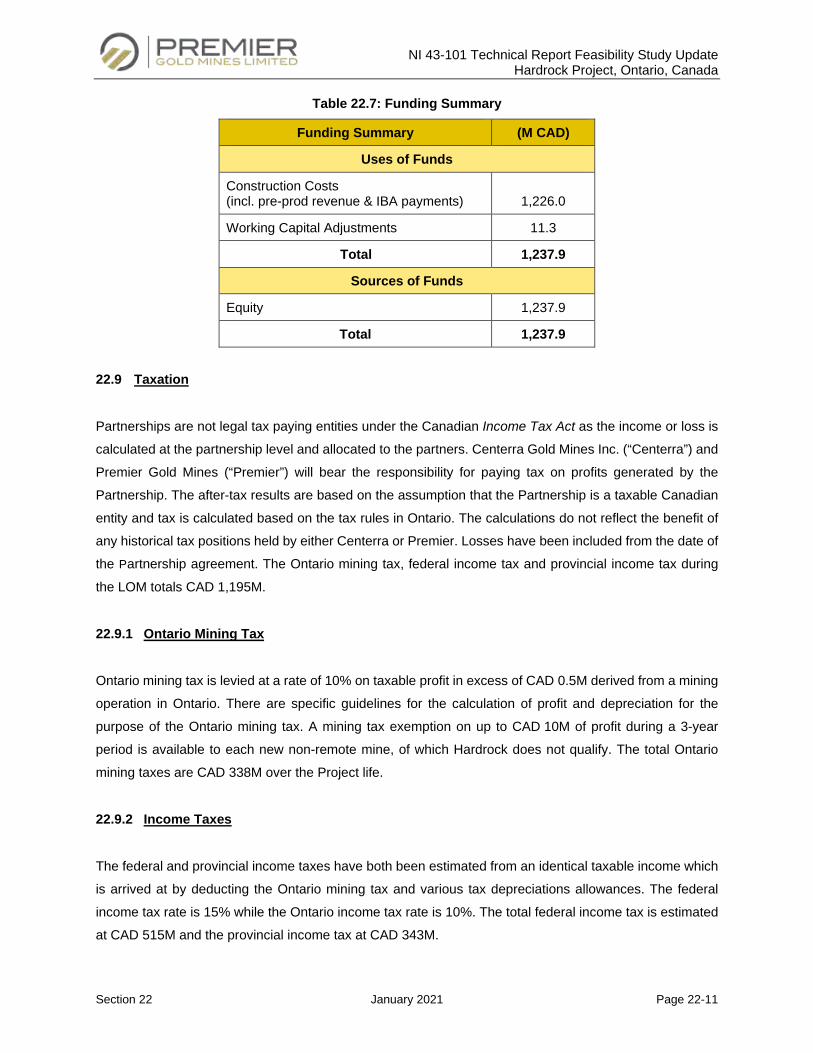
NI 43-101 Technical Report Feasibility Study Update Hardrock Project, Ontario, Canada
Section 22 January 2021 Page 22-11
Table 22.7: Funding Summary
Funding Summary (M CAD)
Uses of Funds
Construction Costs (incl. pre-prod revenue & IBA payments) 1,226.0
Working Capital Adjustments 11.3
Total 1,237.9
Sources of Funds
Equity 1,237.9
Total 1,237.9
22.9 Taxation
Partnerships are not legal tax paying entities under the Canadian Income Tax Act as the income or loss is
calculated at the partnership level and allocated to the partners. Centerra Gold Mines Inc. (“Centerra”) and
Premier Gold Mines (“Premier”) will bear the responsibility for paying tax on profits generated by the
Partnership. The after-tax results are based on the assumption that the Partnership is a taxable Canadian
entity and tax is calculated based on the tax rules in Ontario. The calculations do not reflect the benefit of
any historical tax positions held by either Centerra or Premier. Losses have been included from the date of
the Partnership agreement. The Ontario mining tax, federal income tax and provincial income tax during
the LOM totals CAD 1,195M.
22.9.1 Ontario Mining Tax
Ontario mining tax is levied at a rate of 10% on taxable profit in excess of CAD 0.5M derived from a mining
operation in Ontario. There are specific guidelines for the calculation of profit and depreciation for the
purpose of the Ontario mining tax. A mining tax exemption on up to CAD 10M of profit during a 3-year
period is available to each new non-remote mine, of which Hardrock does not qualify. The total Ontario
mining taxes are CAD 338M over the Project life.
22.9.2 Income Taxes
The federal and provincial income taxes have both been estimated from an identical taxable income which
is arrived at by deducting the Ontario mining tax and various tax depreciations allowances. The federal
income tax rate is 15% while the Ontario income tax rate is 10%. The total federal income tax is estimated
at CAD 515M and the provincial income tax at CAD 343M.
NI 43-101 Technical Report Feasibility Study Update Hardrock Project, Ontario, Canada
Section 22 January 2021 Page 22-12
22.10 Economic Results
The main economic metrics used to evaluate the Project consist of net undiscounted after-tax cash flow,
net discounted after-tax cash flow or NPV, IRR and payback period. The discount rate used to evaluate the
present value of the Project corresponds to the weighted average cost of capital. The discount rate
represents the required rate of return that an investor would expect based on the risks inherent in achieving
the expected future cash flows.
A 5% discount rate is commonly used for gold projects located in a developed and stable mining jurisdiction.
The relative country and project risk are assessed as low for the Hardrock Project. Sensitivities have been
presented at various discount rates ranging from 5 to 8% (Table 22.9).
A summary of the Project economic results is presented in Table 22.8 and the annual Project cash flows
are presented in Table 22.11. The total after-tax cash flow over the Project life is CAD 2,716M and after-
tax NPV 5% is CAD 1,364M. The after-tax Project cash flow results in a 3.2-year payback period from the
commencement of commercial operations with an after-tax IRR of 20.1%.
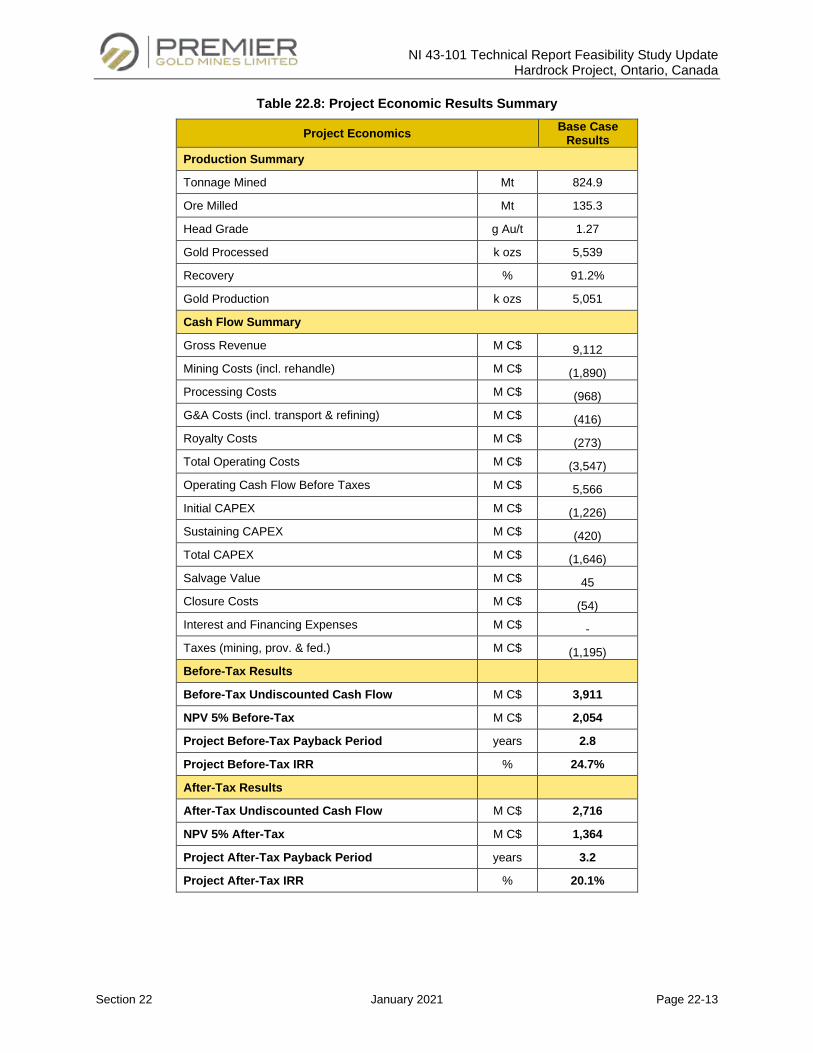
NI 43-101 Technical Report Feasibility Study Update Hardrock Project, Ontario, Canada
Section 22 January 2021 Page 22-13
Table 22.8: Project Economic Results Summary
Project Economics Base Case Results
Production Summary
Tonnage Mined Mt 824.9
Ore Milled Mt 135.3
Head Grade g Au/t 1.27
Gold Processed k ozs 5,539
Recovery % 91.2%
Gold Production k ozs 5,051
Cash Flow Summary
Gross Revenue M C$ 9,112 Mining Costs (incl. rehandle) M C$ (1,890) Processing Costs M C$ (968) G&A Costs (incl. transport & refining) M C$ (416) Royalty Costs M C$ (273) Total Operating Costs M C$ (3,547) Operating Cash Flow Before Taxes M C$ 5,566 Initial CAPEX M C$ (1,226) Sustaining CAPEX M C$ (420) Total CAPEX M C$ (1,646) Salvage Value M C$ 45 Closure Costs M C$ (54) Interest and Financing Expenses M C$ - Taxes (mining, prov. & fed.) M C$ (1,195) Before-Tax Results
Before-Tax Undiscounted Cash Flow M C$ 3,911
NPV 5% Before-Tax M C$ 2,054
Project Before-Tax Payback Period years 2.8
Project Before-Tax IRR % 24.7%
After-Tax Results
After-Tax Undiscounted Cash Flow M C$ 2,716
NPV 5% After-Tax M C$ 1,364
Project After-Tax Payback Period years 3.2
Project After-Tax IRR % 20.1%
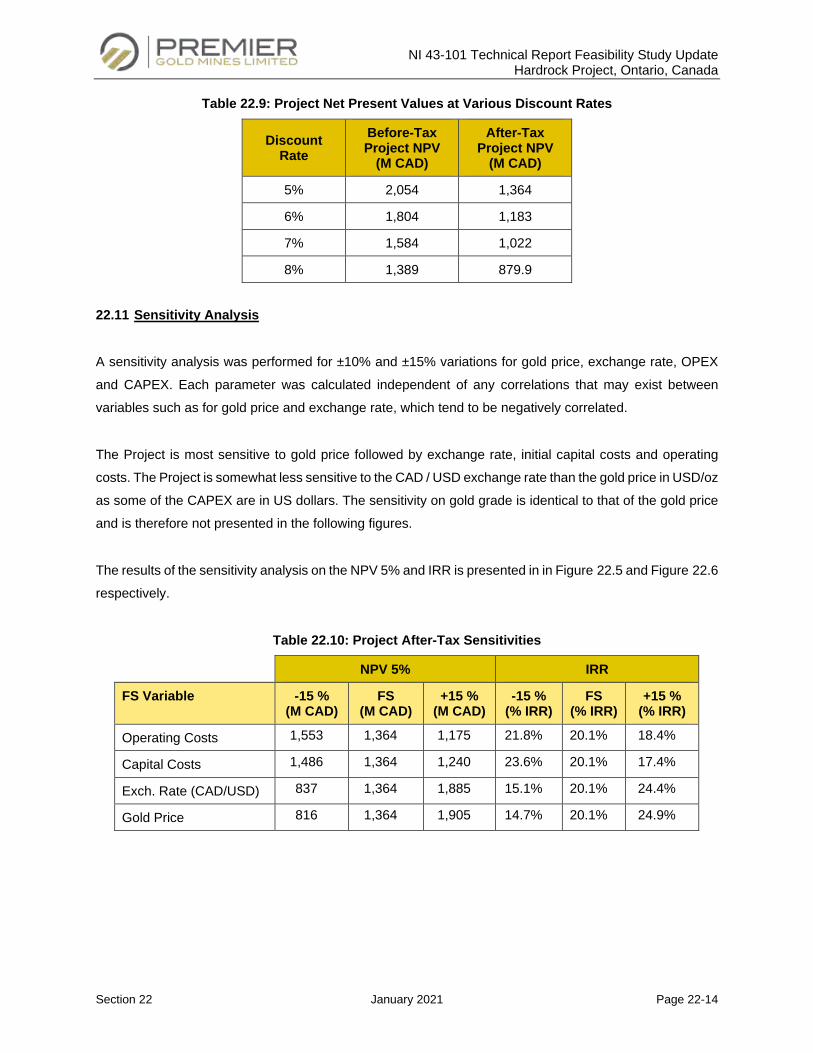
NI 43-101 Technical Report Feasibility Study Update Hardrock Project, Ontario, Canada
Section 22 January 2021 Page 22-14
Table 22.9: Project Net Present Values at Various Discount Rates
Discount Rate
Before-Tax Project NPV
(M CAD)
After-Tax Project NPV
(M CAD)
5% 2,054 1,364
6% 1,804 1,183
7% 1,584 1,022
8% 1,389 879.9
22.11 Sensitivity Analysis
A sensitivity analysis was performed for ±10% and ±15% variations for gold price, exchange rate, OPEX
and CAPEX. Each parameter was calculated independent of any correlations that may exist between
variables such as for gold price and exchange rate, which tend to be negatively correlated.
The Project is most sensitive to gold price followed by exchange rate, initial capital costs and operating
costs. The Project is somewhat less sensitive to the CAD / USD exchange rate than the gold price in USD/oz
as some of the CAPEX are in US dollars. The sensitivity on gold grade is identical to that of the gold price
and is therefore not presented in the following figures.
The results of the sensitivity analysis on the NPV 5% and IRR is presented in in Figure 22.5 and Figure 22.6
respectively.
Table 22.10: Project After-Tax Sensitivities
NPV 5% IRR
FS Variable -15 % (M CAD)
FS (M CAD)
+15 % (M CAD)
-15 % (% IRR)
FS (% IRR)
+15 % (% IRR)
Operating Costs 1,553 1,364 1,175 21.8% 20.1% 18.4%
Capital Costs 1,486 1,364 1,240 23.6% 20.1% 17.4%
Exch. Rate (CAD/USD) 837 1,364 1,885 15.1% 20.1% 24.4%
Gold Price 816 1,364 1,905 14.7% 20.1% 24.9%
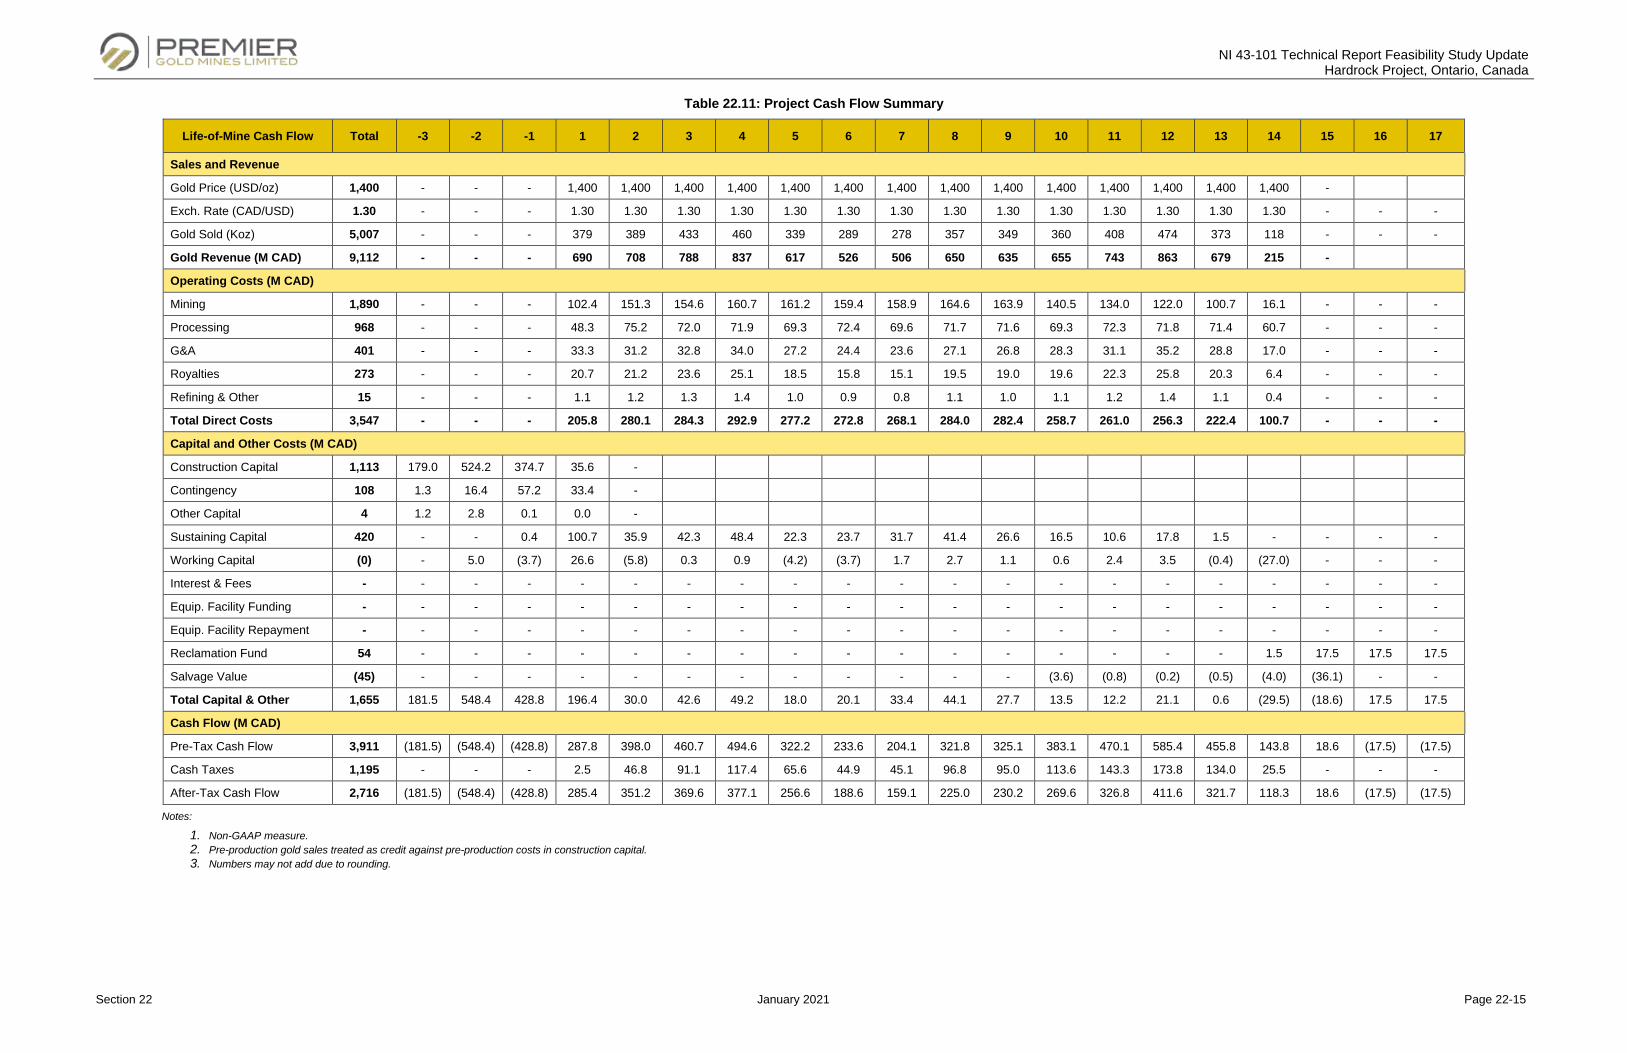
NI 43-101 Technical Report Feasibility Study Update Hardrock Project, Ontario, Canada
Section 22 January 2021 Page 22-15
Table 22.11: Project Cash Flow Summary
Life-of-Mine Cash Flow Total -3 -2 -1 1 2 3 4 5 6 7 8 9 10 11 12 13 14 15 16 17
Sales and Revenue
Gold Price (USD/oz) 1,400 - - - 1,400 1,400 1,400 1,400 1,400 1,400 1,400 1,400 1,400 1,400 1,400 1,400 1,400 1,400 -
Exch. Rate (CAD/USD) 1.30 - - - 1.30 1.30 1.30 1.30 1.30 1.30 1.30 1.30 1.30 1.30 1.30 1.30 1.30 1.30 - - -
Gold Sold (Koz) 5,007 - - - 379 389 433 460 339 289 278 357 349 360 408 474 373 118 - - -
Gold Revenue (M CAD) 9,112 - - - 690 708 788 837 617 526 506 650 635 655 743 863 679 215 -
Operating Costs (M CAD)
Mining 1,890 - - - 102.4 151.3 154.6 160.7 161.2 159.4 158.9 164.6 163.9 140.5 134.0 122.0 100.7 16.1 - - -
Processing 968 - - - 48.3 75.2 72.0 71.9 69.3 72.4 69.6 71.7 71.6 69.3 72.3 71.8 71.4 60.7 - - -
G&A 401 - - - 33.3 31.2 32.8 34.0 27.2 24.4 23.6 27.1 26.8 28.3 31.1 35.2 28.8 17.0 - - -
Royalties 273 - - - 20.7 21.2 23.6 25.1 18.5 15.8 15.1 19.5 19.0 19.6 22.3 25.8 20.3 6.4 - - -
Refining & Other 15 - - - 1.1 1.2 1.3 1.4 1.0 0.9 0.8 1.1 1.0 1.1 1.2 1.4 1.1 0.4 - - -
Total Direct Costs 3,547 - - - 205.8 280.1 284.3 292.9 277.2 272.8 268.1 284.0 282.4 258.7 261.0 256.3 222.4 100.7 - - -
Capital and Other Costs (M CAD)
Construction Capital 1,113 179.0 524.2 374.7 35.6 -
Contingency 108 1.3 16.4 57.2 33.4 -
Other Capital 4 1.2 2.8 0.1 0.0 -
Sustaining Capital 420 - - 0.4 100.7 35.9 42.3 48.4 22.3 23.7 31.7 41.4 26.6 16.5 10.6 17.8 1.5 - - - -
Working Capital (0) - 5.0 (3.7) 26.6 (5.8) 0.3 0.9 (4.2) (3.7) 1.7 2.7 1.1 0.6 2.4 3.5 (0.4) (27.0) - - -
Interest & Fees - - - - - - - - - - - - - - - - - - - - -
Equip. Facility Funding - - - - - - - - - - - - - - - - - - - - -
Equip. Facility Repayment - - - - - - - - - - - - - - - - - - - - -
Reclamation Fund 54 - - - - - - - - - - - - - - - - 1.5 17.5 17.5 17.5
Salvage Value (45) - - - - - - - - - - - - (3.6) (0.8) (0.2) (0.5) (4.0) (36.1) - -
Total Capital & Other 1,655 181.5 548.4 428.8 196.4 30.0 42.6 49.2 18.0 20.1 33.4 44.1 27.7 13.5 12.2 21.1 0.6 (29.5) (18.6) 17.5 17.5
Cash Flow (M CAD)
Pre-Tax Cash Flow 3,911 (181.5) (548.4) (428.8) 287.8 398.0 460.7 494.6 322.2 233.6 204.1 321.8 325.1 383.1 470.1 585.4 455.8 143.8 18.6 (17.5) (17.5)
Cash Taxes 1,195 - - - 2.5 46.8 91.1 117.4 65.6 44.9 45.1 96.8 95.0 113.6 143.3 173.8 134.0 25.5 - - -
After-Tax Cash Flow 2,716 (181.5) (548.4) (428.8) 285.4 351.2 369.6 377.1 256.6 188.6 159.1 225.0 230.2 269.6 326.8 411.6 321.7 118.3 18.6 (17.5) (17.5)
Notes:
1. Non-GAAP measure. 2. Pre-production gold sales treated as credit against pre-production costs in construction capital. 3. Numbers may not add due to rounding.
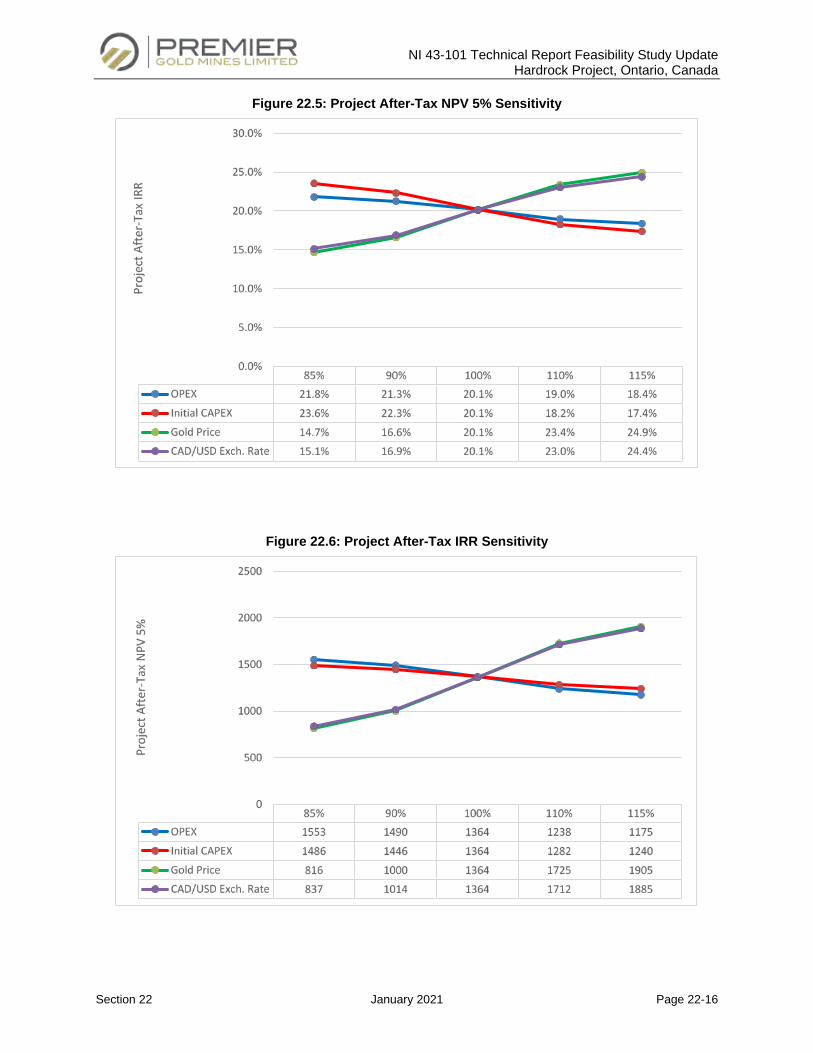
NI 43-101 Technical Report Feasibility Study Update Hardrock Project, Ontario, Canada
Section 22 January 2021 Page 22-16
Figure 22.5: Project After-Tax NPV 5% Sensitivity
Figure 22.6: Project After-Tax IRR Sensitivity
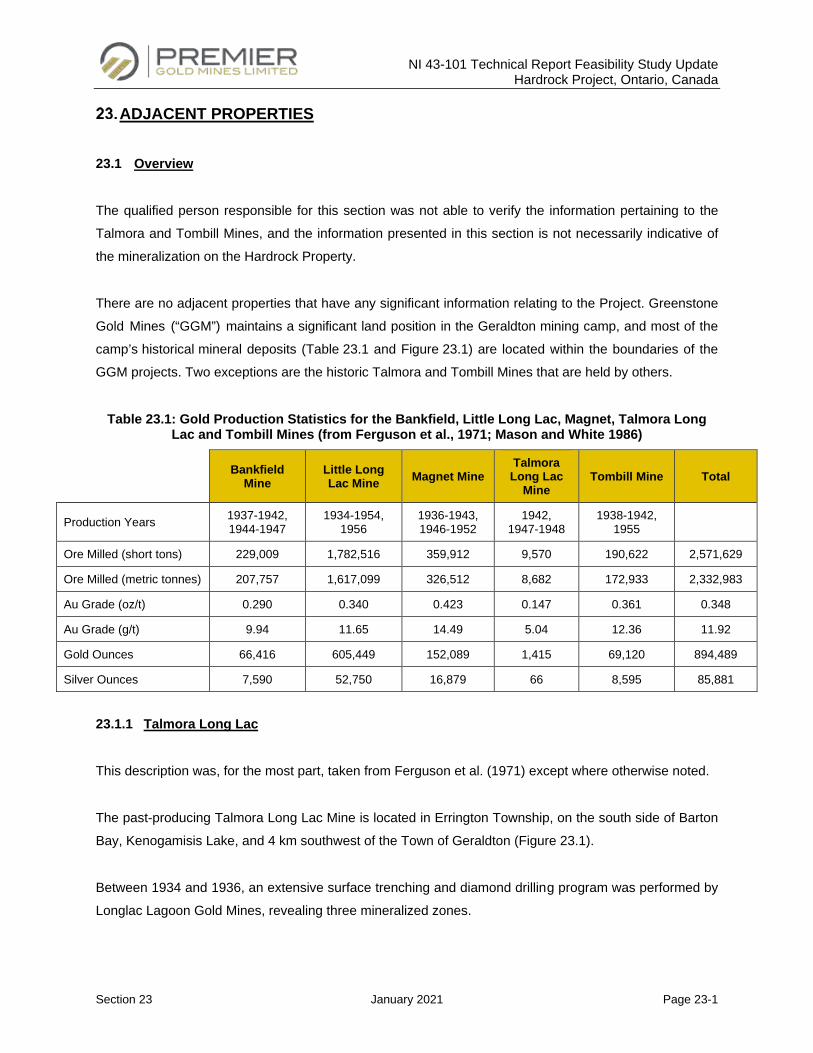
NI 43-101 Technical Report Feasibility Study Update Hardrock Project, Ontario, Canada
Section 23 January 2021 Page 23-1
ADJACENT PROPERTIES
23.1 Overview
The qualified person responsible for this section was not able to verify the information pertaining to the
Talmora and Tombill Mines, and the information presented in this section is not necessarily indicative of
the mineralization on the Hardrock Property.
There are no adjacent properties that have any significant information relating to the Project. Greenstone
Gold Mines (“GGM”) maintains a significant land position in the Geraldton mining camp, and most of the
camp’s historical mineral deposits (Table 23.1 and Figure 23.1) are located within the boundaries of the
GGM projects. Two exceptions are the historic Talmora and Tombill Mines that are held by others.
Table 23.1: Gold Production Statistics for the Bankfield, Little Long Lac, Magnet, Talmora Long Lac and Tombill Mines (from Ferguson et al., 1971; Mason and White 1986)
Bankfield Mine
Little Long Lac Mine Magnet Mine
Talmora Long Lac
Mine Tombill Mine Total
Production Years 1937-1942, 1944-1947
1934-1954, 1956
1936-1943, 1946-1952
1942, 1947-1948
1938-1942, 1955
Ore Milled (short tons) 229,009 1,782,516 359,912 9,570 190,622 2,571,629
Ore Milled (metric tonnes) 207,757 1,617,099 326,512 8,682 172,933 2,332,983
Au Grade (oz/t) 0.290 0.340 0.423 0.147 0.361 0.348
Au Grade (g/t) 9.94 11.65 14.49 5.04 12.36 11.92
Gold Ounces 66,416 605,449 152,089 1,415 69,120 894,489
Silver Ounces 7,590 52,750 16,879 66 8,595 85,881
23.1.1 Talmora Long Lac
This description was, for the most part, taken from Ferguson et al. (1971) except where otherwise noted.
The past-producing Talmora Long Lac Mine is located in Errington Township, on the south side of Barton
Bay, Kenogamisis Lake, and 4 km southwest of the Town of Geraldton (Figure 23.1).
Between 1934 and 1936, an extensive surface trenching and diamond drilling program was performed by
Longlac Lagoon Gold Mines, revealing three mineralized zones.
NI 43-101 Technical Report Feasibility Study Update Hardrock Project, Ontario, Canada
Section 23 January 2021 Page 23-2
Between 1938 and 1940, a shaft was sunk to a depth of 544 ft (165.8 m) with levels at 195 ft (59.4 m),
315 ft (96.0 m) and 515 ft (157.0 m) on which 4,796 ft (1,461.8 m) of drifting and 1,038 ft (316.4 m) of
cross-cutting were done. Diamond drilling done included 400 ft (121.9 m) from surface and 2,449 ft
(746.5 m) in four underground holes. All the work was performed by Elmos Gold Mines Ltd.
Between 1940 and 1942, trenching, stripping and two underground diamond drill holes (“DDH”) totalling
234 ft were carried out by Tombill Gold Mines Ltd. A small 50 t mill was constructed on the mine site
during winter of 1941-1942. Underground work resumed in March 1942, and during the summer, 1,017 oz of
gold and 36.5 oz of silver were produced from 3,947 t of sorted material. Due to the unfavourable wartime
conditions, operations were suspended in November of the same year.
Between 1947 and 1948, Talmora Longlac Gold Mines Ltd. completed 1,663 ft (506.9 m) of drifting and
670 ft (204.2 m) of crosscutting. Diamond drilling comprised of four surface holes totalling 139 ft (42.4 m)
and 91 underground holes totalling 10,776 ft (3,284.5 m). From the start of milling on September 15, 1947
until the cessation of operations on March 31, 1948, a total of 398.5 oz of gold and 30 oz of silver were
produced from 5,623 t of hoisted material, for an average grade of 0.07 oz Au/t.
At the time operations were suspended, it was estimated that about 12,000 t with an average grade of
0.37 oz Au/t remained in the mine (Pye, 1951). These “reserves” are historical in nature and should not be
relied upon. It is unlikely they conform to current National Instrument 43-101 criteria or to CIM Definitions
Standards and they have not been verified to determine their relevance or reliability.
In 1968, some geophysical work was carried out by Tombill Mines Ltd.
The geology of the mine consists of greywackes with interbeds of iron formation intruded by a diorite mass,
folded into a westerly-plunging anticline (Pye, 1951). A felsic intrusive occurs as a sill-like mass on the
south limb. Two steeply dipping diabase dykes up to 30 m wide cross the anticline in a northerly direction.
Shear zones striking N060° to N080° and dipping 45° near the diorite-greywacke contact contain quartz
lenses averaging less than 30 cm thicknesses. The main sulfides are pyrite and arsenopyrite.
.
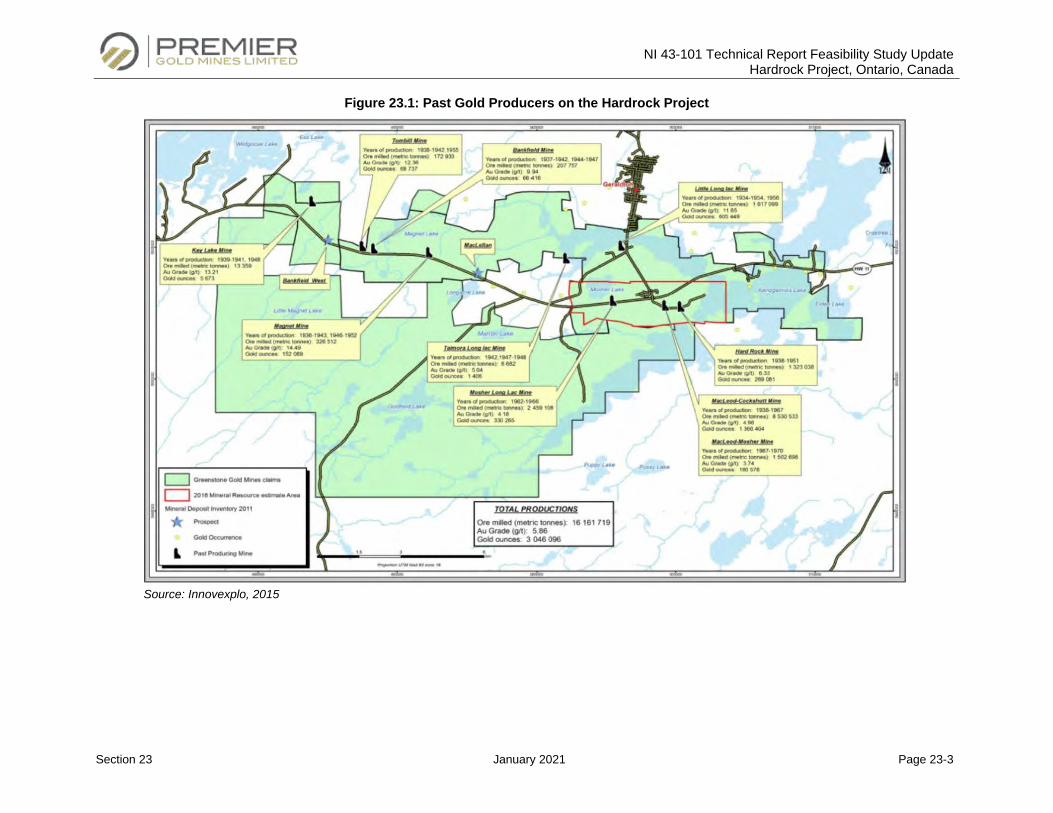
NI 43-101 Technical Report Feasibility Study Update Hardrock Project, Ontario, Canada
Section 23 January 2021 Page 23-3
Figure 23.1: Past Gold Producers on the Hardrock Project
Source: Innovexplo, 2015
NI 43-101 Technical Report Feasibility Study Update Hardrock Project, Ontario, Canada
Section 23 January 2021 Page 23-4
23.1.2 Little Long Lac Mine (Past Producer)
This description was, for the most part, taken from Ferguson et al. (1971) except where otherwise noted.
The past-producing Little Long Lac Mine is located in the southeastern part of Errington Township, extends
eastwards into Ashmore Township and is bounded to the north by Kenogamisis Lake. The Little Long Lac
Mine is located about 2 km south of Geraldton (Figure 23.1).
Between 1933 and 1953, a shaft was sunk to a depth of 2,318 ft (706.5 m) with levels at 200 ft (61.0 m),
300 ft (91.4 m), 445 ft (135.6 m), 570 ft (173.7 m), 695 ft (211.8 m), 850 ft (259.1 m), 1,000 ft (304.8 m),
1,152 ft (351.1 m), 1,300 ft (396.2 m), 1,450 ft (442.0 m), 1,600 ft (487.7 m), 1,750 ft (533.4 m), 1,900 ft
(579.1 m), 2,050 ft (624.8 m) and 2,200 ft (670.6 m). From level 2,200, a winze was sunk to a depth of
3,952 ft (1,204.6 m), with levels at 2,405 ft (733.0 m), 2,558 ft (779.7 m), 2,711 ft (826.3 m), 2,864 ft
(872.9 m), 3,013 ft (918.4 m), 3,159 ft (962.9 m), 3,309 ft (1,008.6 m), 3,459 ft (1,054.3 m), 3,609 ft
(1,100.0 m), 3,759 ft (1,145.7 m) and 3,920 ft (1,194.8 m). Drifting totalled 37,370 ft (11,390.4 m) and
crosscutting 10,596 ft (3,229.7 m). Diamond drilling undertaken from surface totalled 105,626 ft
(32,194.8 m), and underground drilling totalled 101,558 ft (30,954.9 m). A 150-ton mill was installed, and a
small mill for scheelite production was added later. The work was performed by Little Long Lac Gold
Mines Ltd.
From 1934 to 1954 and in 1956, a total of 605,409 oz of gold and 52,750 oz of silver were produced from
1,780,516 t of hoisted material. The average gold recovery was 0.34 oz/t of ore milled.
Between 1967 and 1968, Little Long Lac Gold Mines Ltd drilled a total of 5,000 ft (1,524 m) to test the iron
formation.
The geology of the mine consists of arenaceous metasediments with interbeds of iron formation and some
mafic intrusive rocks that have been folded into a synclinal structure striking N272° (Pye, 1951). The
deposits occur within the fracture zones of massive quartz greywacke on the drag-folded north limb of the
syncline. The Main vein zone is 3 to 4 ft wide (0.9 to 1.2 m), strikes approximately N075°, dips 80°, and
consists of two parallel veins 2 to 6 in wide (5 to 15 cm). Some mineralization was also extracted from the
lower grade 09 vein zone located about 600 ft (183 m) to the south of the Main zone; this zone is about 2 ft
wide (60 cm), strikes N065°, dips 85°, and contains scheelite. The metallic constituents of quartz veins,
which rarely make up more than 2 or 3% of the mineralization, include arsenopyrite, pyrite, pyrrhotite,
sphalerite, chalcopyrite, galena and gold.
NI 43-101 Technical Report Feasibility Study Update Hardrock Project, Ontario, Canada
Section 23 January 2021 Page 23-5
23.1.3 Magnet Consolidated Mine (Past-Producer)
This description was, for the most part, taken from Ferguson et al. (1971) except where otherwise noted.
The past producing Magnet Consolidated Mine is located in the southwest part of Errington Township,
about 8 km southwest of the Town of Geraldton (Figure 23.1).
The discovery of native gold on a small island in the southern part of Magnet Lake in 1931 initiated an
intensive search for gold in the area. Between 1934 and 1936, trenching was performed by Magnet Lake
Gold Mines and 24,641 ft of diamond drilling were carried out by Wells Mines Ltd. Drilling uncovering three
mineralized zones, two of which, now known as the Magnet and Wells vein zones, showed considerable
promise. In order to explore these zones jointly underground, the two companies amalgamated in 1936 to
form the present Magnet Consolidated Mines Limited (Mason and White, 1986).
Between 1936 and 1940, a shaft was sunk to a depth of 1,115 ft (339.9 m) with levels at 203 ft (61.9 m),
328 ft (100.0 m), 480 ft (146.3 m), 630 ft (192.0 m), 780 ft (237.7 m), 930 ft (283.5 m) and 1,080 ft (329.2 m)
on which 11,181 ft (3,408.0 m) of drifting and 1,943 ft (592.2 m) of crosscutting was done. A total of
13 underground DDH totalling 1,665 ft (507.5 m) was completed. A 100-ton amalgamation- floatation mill
was built.
Between 1940 and 1952, the shaft was continued to a depth of 1,772 ft (540.1 m), with additional levels at
1,230 ft (374.9 m), 1,380 ft (420.6 m), 1,555 ft (474.0 m) and 1,730 ft (527.3 m). An inclined winze 228 ft
long (69.5 m) was constructed between levels 9, 10 and 11. A winze was sunk 931 ft (283.8 m) from the
1,730 ft level to a total depth of 2,640 ft (804.7 m) with levels at 1,884 ft (574.2 m), 2,037 ft (620.9 m),
2,160 ft (658.4 m), 2,312 ft (704.7 m), 2,460 ft (749.8 m) and 2,610 ft (795.5 m). Drifting totalled 19,585 ft
(5,969.5 m) and crosscutting 2,944 ft (897.3 m). The company drilled seven surface DDH for a total of
4,029 ft (1,228.0 m) and 265 underground holes for a total of 43,054 ft (113,122.9 m).
From 1938 to 1943 and from 1946 to 1952, 152,089 oz of gold and 16,879 oz of silver were produced from
359,912 t of hoisted material. Average gold recovery was 0.42 oz/t.
The geology of the mine consists of metasediments, mostly greywacke with interbeds of iron formation and
conglomerate, striking N290° and dipping 75 to 80°. Intrusive rocks consist of dykes and sill-like masses of
diorite and porphyry and younger diabase dykes cutting across the formations (Pye, 1951). The two
deposits, raking N300 to N315°, consist of lenticular quartz veins and accompanying veinlets predominantly
in sheared greywacke. The Magnet vein zone, with an average strike of N285° and a near-vertical dip, was
NI 43-101 Technical Report Feasibility Study Update Hardrock Project, Ontario, Canada
Section 23 January 2021 Page 23-6
developed over a maximum length of about 1,300 ft (396.2 m). The leaner North zone, 50 to 100 ft (15.2 to
30.5 m) to the north, strikes N280° and dips vertically.
The deposits at the Magnet mine consist chiefly of quartz with small amounts of carbonate and subordinate
sulfides. The metallic constituents, which seldom constitute more than 5% of the mineralization, are
arsenopyrite, pyrite, pyrrhotite, chalcopyrite, sphalerite, galena and gold (Mason and White,1986).
23.1.4 Bankfield Mine (Past-Producer)
This description was, for the most part, taken from Ferguson et al. (1971) except where otherwise noted.
The past producing Bankfield Mine is located near the southwest part of Magnet Lake in the west-central
part of the Errington Township and extends into Lindsley Township. This historical mine is situated about
10 km west-southwest of the Town of Geraldton (Figure 23.1).
The property was originally staked in October 1931 by T. A. Johnson and Robert Wells when they
discovered gold-bearing quartz occupying a shear zone cutting a small reef in the southern part of Magnet
Lake. Subsequent to this discovery, a mineralized zone was found by surface exploration about 1,000 ft
(304.8 m) southwest of the lake. Surface-trenching and diamond drilling indicated sufficient material to merit
development by underground methods.
Between 1934 and 1936, a shaft was sunk to a depth of 552 ft (168.2 m) with levels at 150 ft (45.7 m),
250 ft (83.8 m) and 525 ft (160.0 m). Drifting totalled 2,468 ft (752.2 m) and crosscutting 781 ft (240.6 m).
Underground diamond drilling totalled 1,416 ft (431.6 m) and drilling from surface totalled 2,237 ft (431.6 m)
during this period. Work was performed by Bankfield Gold Mines Ltd.
Between 1935 and 1942, a winze (located in Lindsley Township) was sunk from the 525 ft level to a depth
of 1,297 ft (395.3 m) from the surface with levels at 779 ft (237.4 m), 900 ft (274.3 m), 1,025 ft (312.4 m),
1,150 ft (350.5 m) and 1,275 ft (388.6m). Sub-levels were established at 275, 400, 1,025 and 1,150 ft.
Drifting totalled 14,516 ft (4,424.5 m) and crosscutting 7,832 ft (2,387.2 m). Diamond drilling included
132 underground holes totalling 21,628 ft (6,592.2 m), six surface holes totalling 2,328 ft (709.6 m) and
10,145 ft (3,092.2 m) of unspecified drilling. A 100-ton cyanide mill was constructed. The work was
performed by Bankfield Consolidated Mines Ltd.
From 1937 to 1942 and from 1944 to 1947, a total of 66,417 oz of gold and 7,590 oz of silver were produced
from 231,009 t of hoisted material. The average gold recovery was 0.29 oz/t.
NI 43-101 Technical Report Feasibility Study Update Hardrock Project, Ontario, Canada
Section 23 January 2021 Page 23-7
The geology of the mine consists of greywacke with bands of conglomerate, slate and iron formation striking
N290 to 300° and dipping 75 to 80° (Pye, 1951). The rocks have been intruded by diorite and quartz
porphyry, and ultimately by a 200 ft (61.0 m) wide diabase dyke which runs parallel to a strike fault near the
mine workings. The main mineralized horizon, consisting of a sheared, brecciated and highly silicified zone,
occurs near a contact between the sediments and a porphyry-diorite mass. It strikes N275 to N288°, dips
70 to 78°, has an average width of 7 ft (2.1 m) and is, including its extension into the adjacent Tombill
Property, 2,000 ft long (609.6 m). The deposits at the Bankfield Mine consists mainly of sheared and
silicified greywacke and porphyry, mineralized with sulfides and small amounts of gold, and are cut by
numerous "opalescent" grey quartz veins. The reported metallic minerals are arsenopyrite, pyrite,
pyrrhotite, sphalerite, chalcopyrite, galena and ilmenite.
23.1.5 Tombill Mine (Past-Producer)
This description was, for the most part, taken from Ferguson et al. (1971) except where otherwise noted.
The past producing Tombill Mine is located in the east-central part of Lindsley Township, about 10 km west-
southwest of the Town of Geraldton (Figure 23.1).
Between 1935 and 1942, a shaft was sunk to a depth of 630 ft (192.0 m), with levels at 215 ft (65.5 m),
400 ft (121.9 m) and 600 ft (182.9 m) on which 3,762 ft (1,146.7 m) of drifting and 4,442 ft (135.9 m) of
crosscutting were done. Diamond drilling comprised more than 12 surface holes totalling 15,570 ft
(4,745.7 m) and 63 underground holes totalling 4,406 ft (1,342.9 m). A mill with a 100-ton capacity was
erected, and was later increased to 150 t. All work was carried out by Tombill Gold Mines Ltd. In 1940, an
agreement was reached allowing Bankfield Consolidated Mines Ltd to explore and develop a block below
the 500-ft level.
From 1938 to 1942 and in 1955 (mill clean-up), a total of 69,120 oz of gold and 8,595 oz of silver were
produced from 190,622 t of hoisted material. Average gold recovery was 0.36 oz/t. The geology of the mine
consists of metasediments and felsic intrusive rocks along a sheared and fractured contact where
mineralized zones developed. Associated minerals are pyrite, arsenopyrite and pyrrhotite.
23.1.6 Gold Potential of the Other Historical Mines
The information presented on historical gold mines near the Hardrock Project was obtained through the
literature and not verified by GGM. The presence of significant mineralization on these adjacent historical
mines is not necessarily indicative of similar mineralization at the Hardrock Project.
NI 43-101 Technical Report Feasibility Study Update Hardrock Project, Ontario, Canada
Section 24 January 2021 Page 24-1
OTHER RELEVANT DATA AND INFORMATION
24.1 Project Execution and Organization
The Hardrock Project team is responsible to deliver all temporary and permanent infrastructure required to
provide a fully operational mine capable of sustainably processing 27,000 t/d.
The Project will be executed using an “Owner-managed” project delivery model. Engineering and a portion
of procurement will be outsourced, while construction and commissioning for the Project will be managed
directly by the Owner. The execution strategy incorporates the key elements required for successful project
development, including health and safety, environment, community relations, Indigenous relations,
planning, project controls, document control, risk management, construction management and quality
management.
The Hardrock Project team will manage health and safety, engineering, procurement and contracts,
construction, and pre-commissioning, as well as overall Project management services during the Project.
Greenstone Gold Mines (“GGM”) operations will provide environmental management, Indigenous relations,
community relations and certain site services to support to the Project team during construction. Overall
responsibility for the site and facilities will transition to Operations at the start of hot commissioning of the
mill.
An Independent Tailings Management Review Board (“ITRB”) has been established for the Project. The
purpose of the ITRB is to review and advise on the design, construction, operation, performance and
closure planning for the TMF, and it will be in place through to closure.
The Project team will peak at 75 people during the construction execution phase. The Project organization
chart is shown in Figure 24.1.
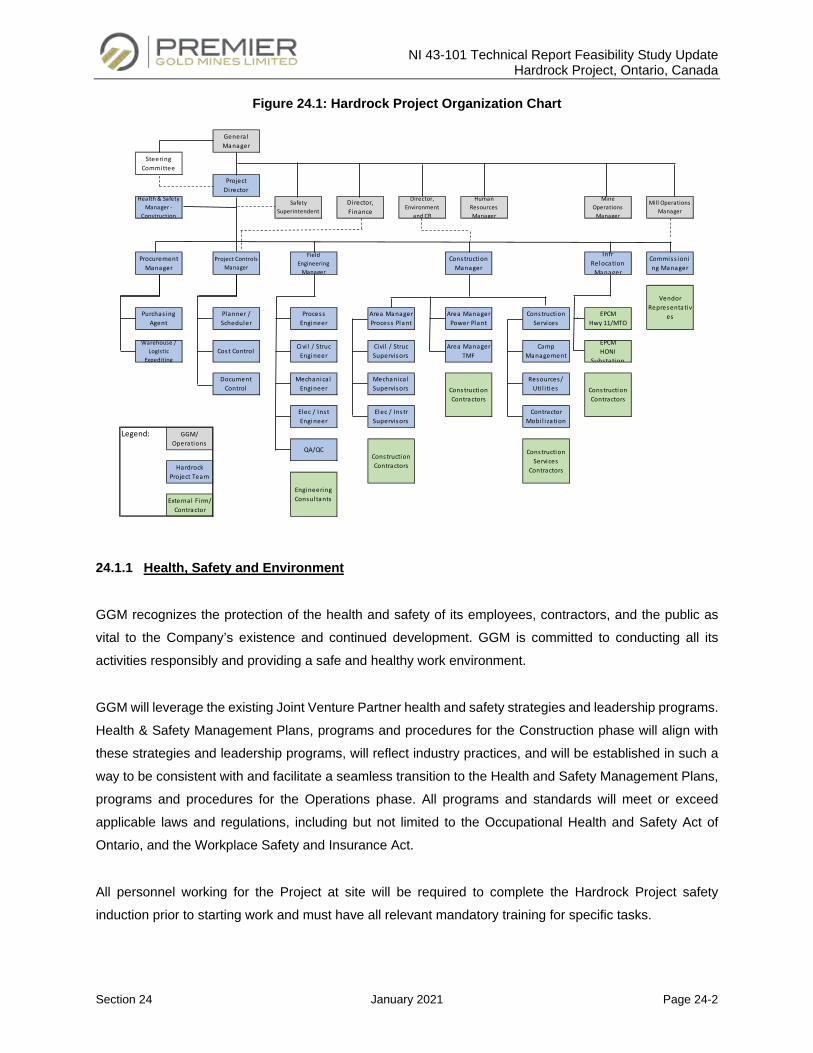
NI 43-101 Technical Report Feasibility Study Update Hardrock Project, Ontario, Canada
Section 24 January 2021 Page 24-2
Figure 24.1: Hardrock Project Organization Chart
24.1.1 Health, Safety and Environment
GGM recognizes the protection of the health and safety of its employees, contractors, and the public as
vital to the Company’s existence and continued development. GGM is committed to conducting all its
activities responsibly and providing a safe and healthy work environment.
GGM will leverage the existing Joint Venture Partner health and safety strategies and leadership programs.
Health & Safety Management Plans, programs and procedures for the Construction phase will align with
these strategies and leadership programs, will reflect industry practices, and will be established in such a
way to be consistent with and facilitate a seamless transition to the Health and Safety Management Plans,
programs and procedures for the Operations phase. All programs and standards will meet or exceed
applicable laws and regulations, including but not limited to the Occupational Health and Safety Act of
Ontario, and the Workplace Safety and Insurance Act.
All personnel working for the Project at site will be required to complete the Hardrock Project safety
induction prior to starting work and must have all relevant mandatory training for specific tasks.
Legend:
Warehouse / Logistic
ExpeditingCost Control
EPCM HONI
Substation
Construction Contractors
Construction Contractors
Commiss ioning Manager
Vendor Representativ
esEPCM Hwy 11/MTO
QA/QCConstruction Contractors
Construction Services
Contractors
Engineering Consul tants
Elec / Inst Engineer
Elec / Instr Supervisors
Contractor Mobi l i zation
Construction Services
Civi l / Struc Engineer
Civi l / Struc Supervisors
Area Manager TMF
Camp Management
Mechanica l Engineer
Mechanica l Supervisors
Resources/ Uti l i ties
Director, Environment
and CR
Human Resources Manager
Purchas ing Agent
Planner / Scheduler
Process Engineer
Area Manager Process Plant
Area Manager Power Plant
Document Control
Mill Operations Manager
Genera l Manager
Steering Committee
Project Di rector
Mine Operations
Manager
Procurement Manager
Project Controls Manager
Field Engineering
Manager
Construction Manager
Infr Relocation
Manager
Health & Safety Manager -
Construction
Safety Superintendent
Director, Finance
GGM/ Operations
Hardrock Project Team
External Fi rm/ Contractor
NI 43-101 Technical Report Feasibility Study Update Hardrock Project, Ontario, Canada
Section 24 January 2021 Page 24-3
All environmental management and monitoring requirements during construction are the responsibility of
the Operations Team, working in close collaboration with the Project Director and Construction Manager.
Environmental Management and Monitoring Plans (“EMMPs”) are being updated to support the permitting
phase. The EMMPS include Project phase requirements, which will be consolidated into the Environmental
Construction Management Plan and the relevant procedures. The plans and procedures will include
management and monitoring, risk and hazard assessment and mitigation, contractor requirements,
environmental incident reporting, investigation and follow-up, and reporting.
GGM’s Emergency Response Plan will evolve as the Project moves from the detailed engineering phase
with limited site activities to full construction execution and operations. Ambulance services are available
in the area and a hospital is located in Geraldton, a few kilometres from the site. During the Project phase,
a nurse will be on-site to provide first aid. The Project will rely on local volunteer fire fighting services.
24.1.2 Indigenous Relations
The Operations team is accountable for all activities related to Indigenous relations and community relations
during the Project phase. The Project team will support the Operations Team in fulfilling the commitments
GGM has made with respect to Indigenous business opportunities, employment and training. This will help
ensure all neighboring Indigenous and local communities will share in the opportunities and benefits of the
Project.
In particular, the procurement and contracting processes for the Project phase will consider and reflect both
the specific commitments in GGM’s Long terms Relationship Agreements (“LTRAs”) with Indigenous
communities, as well as GGM’s overall objective to deliver long-lasting socio-economic benefits for
Indigenous and local communities.
GGM will work to ensure that contractors and suppliers contribute to the positive socio-economic benefits
of the Project. Prospective contractors and suppliers will be encouraged to consider how they can
incorporate socio-economic considerations, including employment, workforce development and skills
training within their proposals. Contractors will also be required to submit an Indigenous Participation plan
as part of their proposal package. When evaluating proposals, GGM will consider the potential socio-
economic benefits for Indigenous communities.
GGM will continue on-going consultation and engagement with Indigenous and local community members
who reside within the geographical area influenced by the Project during all phases of the Project.
NI 43-101 Technical Report Feasibility Study Update Hardrock Project, Ontario, Canada
Section 24 January 2021 Page 24-4
24.1.3 Engineering and Procurement Management
Detailed engineering has been outsourced to third party engineering providers. The mine design will also
be outsourced during the initial phases of the Project and will be brought in-house once the operations mine
department is established.
The detailed engineering scope has been divided into primary work packages. All detailed engineering
packages have been awarded. In the case of the Hydro One relocation of the Power Lines and the Enbridge
Natural Gas Pipeline, this engineering is being performed by the stakeholder/owner of the infrastructure.
The engineering and installation of these facilities will be a cost to the Project.
Procurement and contracting activities include pre-qualification and selection of vendors, sourcing of
equipment and bulk materials, expediting of goods and documentation deliverables, inspection surveillance
of equipment and materials, transportation, logistics, and warehousing, field procurement, materials
management during construction, as well as the contracting of all necessary engineering, consulting,
construction or installation services.
24.1.4 Construction Management
The Project will be construction driven, and the construction management team will work with planning and
engineering to influence the structure and timing of engineering deliverables, and to confirm the match of
equipment and fabrication dates with required “on-site” dates. The master Project schedule will drive the
work planning on site, and priority will generally be given to the critical path activities.
Labour relations strategies and plans will be implemented for construction. Construction will be on a
7-day / 10-hour schedule, except for start-up which will be on a 7-day / 24-hour schedule. The planned
rotation is 14 days on site / 7 days leave for all Project team staff and contractors. A temporary camp will
be installed a few kilometres outside of the mine site and close to Geraldton.
The dismantling, relocation and/or reconstruction of existing facilities will be managed by the construction
management team in close collaboration with the local community and facilities owner. Certain other
properties will be handled through compensation rather than being rebuilt.
Pre-commissioning activities will include final inspections and adjustment of equipment before it is tested
and the testing of equipment and components of the plant in an energized state to ensure that the
equipment can be handed over to the commissioning team in an acceptable operating condition for process
commissioning. Operations representatives will be actively involved in the pre-commissioning process.
NI 43-101 Technical Report Feasibility Study Update Hardrock Project, Ontario, Canada
Section 24 January 2021 Page 24-5
24.1.5 Operational Readiness, Commissioning and Ramp-up Strategy
The GGM Operations team will be accountable for all hot commissioning activities with the support and
involvement of the Project team. A commissioning, handover and transition plan will be developed jointly
with construction and operations teams for each facility.
The ramp-up period to commercial production is expected to take approximately six months (including two
months of crushing commissioning activities). The pre-production phase of the Project is considered
complete once commercial production is achieved which is defined as achieving 60% of the design
throughput over a period of 30 days.
An operational readiness plan (“ORP”) has been prepared for the entire mine site with a emphasis in the
mine and plant areas given the large requirements for staffing and training in these areas. The ORP
describes the philosophy and the additional short-term resources that are needed to quickly ramp-up to
nameplate capacity. The ORP will be further elaborated to detail out the high-level plan that has been
developed.
24.1.6 Risk Management
GGM’s risk identification, assessment and mitigation processes will continue to be applied throughout the
detailed engineering, construction, operation, and closure phases.
24.1.7 Quality Assurance and Quality Control
Quality Assurance and Quality Control (“QA/QC”) will be applied to all levels of the Project. All designs will
conform to the codes and standards applicable for the province, and applicable acts and regulations.
Engineering consultants and construction contractors will be responsible for their own quality control as
specified in the terms and conditions of their contracts. Certain quality control work will be performed by
third parties during execution.
The Project team will be responsible for ensuring that contractors follow their quality control programs,
through the implementation of a comprehensive quality assurance program. Third parties will be used
as required for on-site testing and laboratory analysis.
NI 43-101 Technical Report Feasibility Study Update Hardrock Project, Ontario, Canada
Section 24 January 2021 Page 24-6
24.1.8 Project Controls
Project controls will be implemented to provide Project management and other stakeholders with
transparent and timely information on project progress, performance and variances. This information will
be used to assist management in setting priorities and making decisions that will support the delivery of the
Project on time and on budget. Project controls includes planning and scheduling, progressing, cost control,
change management, estimating, forecasting, earned value analysis and reporting. Robust change
management processes will be in place to identify, mitigate and manage change. The schedule is structured
to identify the critical path and link all activities. Measurement of physical progress, quantities and hours
against the baseline will be a key component of the schedule updates.
24.2 Project Schedule
The Project executive summary schedule is shown in Figure 24.2. Detailed engineering will be completed
ahead of construction ramp-up and is not on the critical path. Procurement is aligned with the required on-
site dates and construction activities to meet schedule requirements, Concrete and structural steel have
generally been scheduled for the non-winter months.
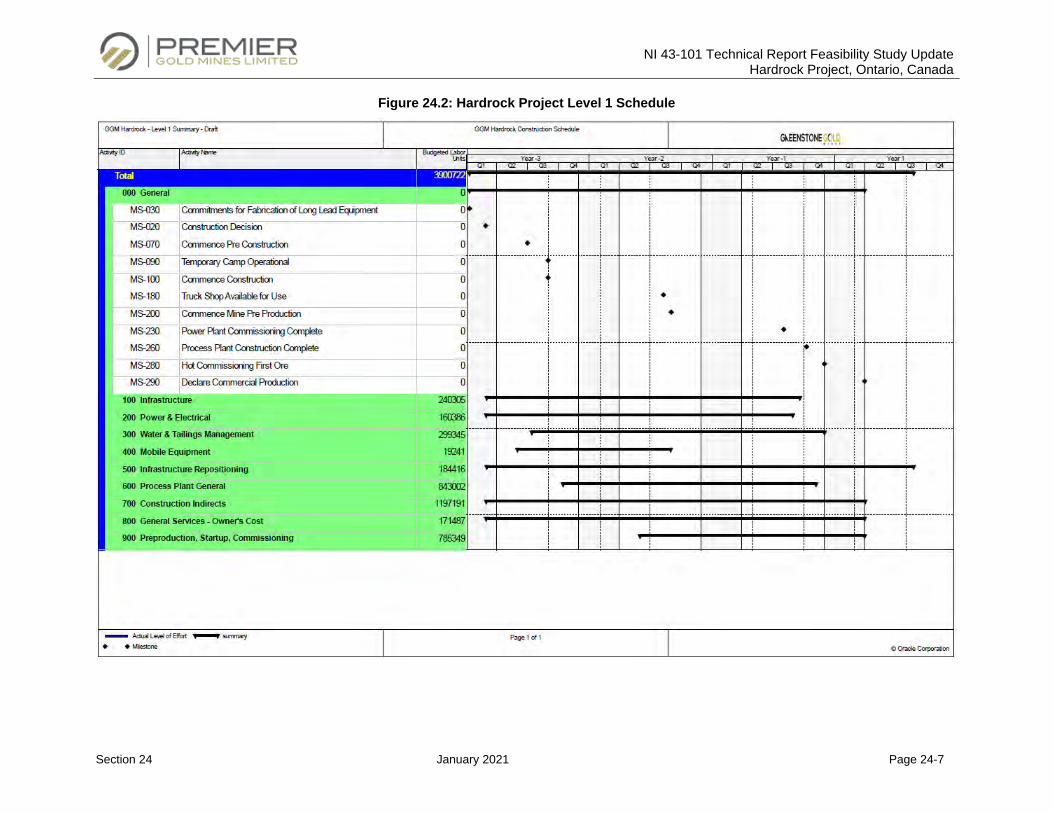
NI 43-101 Technical Report Feasibility Study Update Hardrock Project, Ontario, Canada
Section 24 January 2021 Page 24-7
Figure 24.2: Hardrock Project Level 1 Schedule
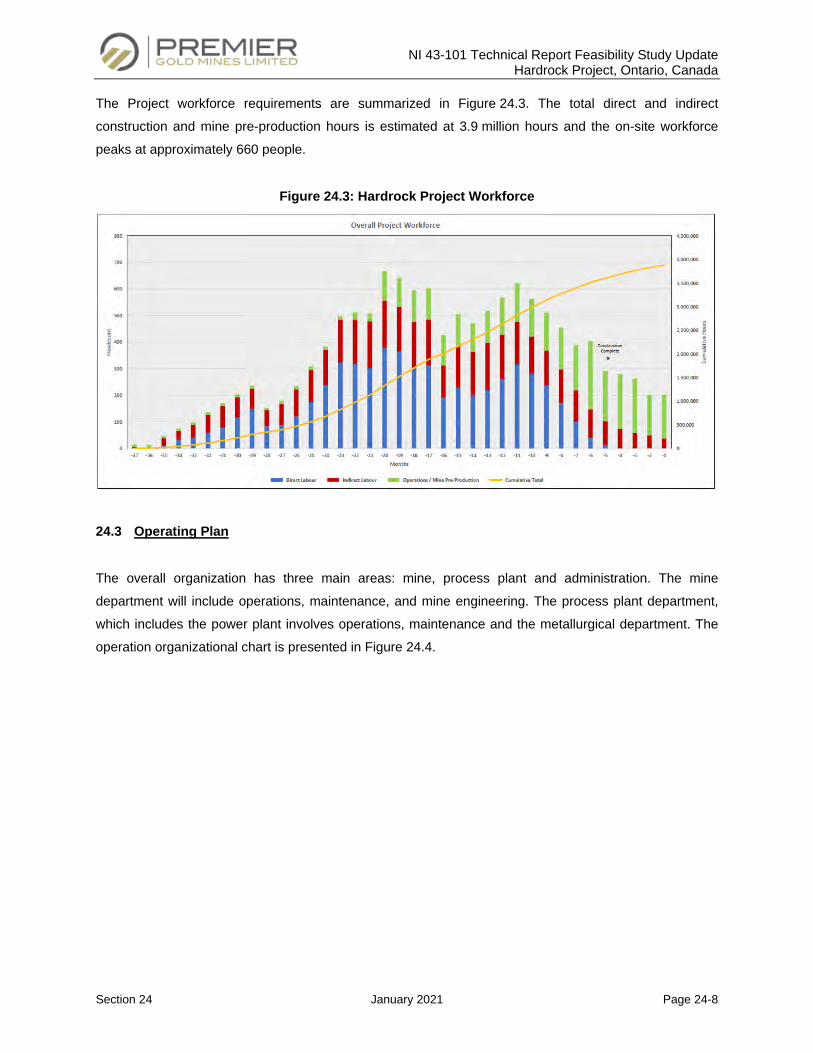
NI 43-101 Technical Report Feasibility Study Update Hardrock Project, Ontario, Canada
Section 24 January 2021 Page 24-8
The Project workforce requirements are summarized in Figure 24.3. The total direct and indirect
construction and mine pre-production hours is estimated at 3.9 million hours and the on-site workforce
peaks at approximately 660 people.
Figure 24.3: Hardrock Project Workforce
24.3 Operating Plan
The overall organization has three main areas: mine, process plant and administration. The mine
department will include operations, maintenance, and mine engineering. The process plant department,
which includes the power plant involves operations, maintenance and the metallurgical department. The
operation organizational chart is presented in Figure 24.4.
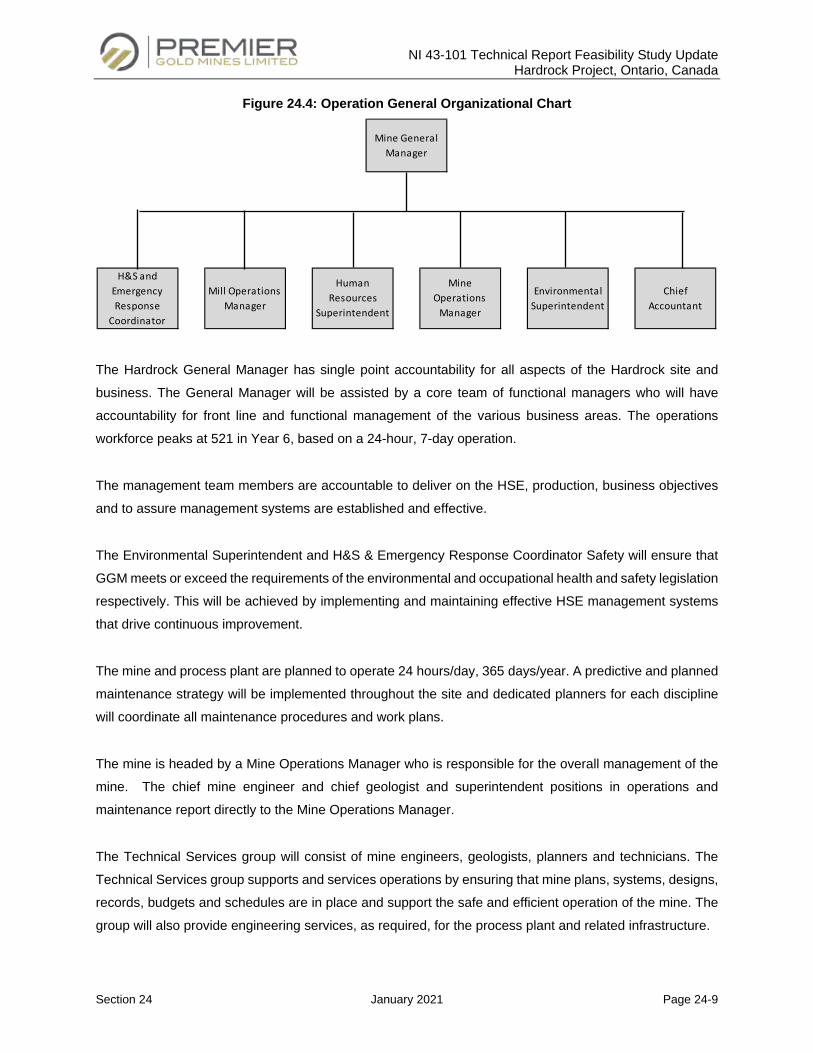
NI 43-101 Technical Report Feasibility Study Update Hardrock Project, Ontario, Canada
Section 24 January 2021 Page 24-9
Figure 24.4: Operation General Organizational Chart
The Hardrock General Manager has single point accountability for all aspects of the Hardrock site and
business. The General Manager will be assisted by a core team of functional managers who will have
accountability for front line and functional management of the various business areas. The operations
workforce peaks at 521 in Year 6, based on a 24-hour, 7-day operation.
The management team members are accountable to deliver on the HSE, production, business objectives
and to assure management systems are established and effective.
The Environmental Superintendent and H&S & Emergency Response Coordinator Safety will ensure that
GGM meets or exceed the requirements of the environmental and occupational health and safety legislation
respectively. This will be achieved by implementing and maintaining effective HSE management systems
that drive continuous improvement.
The mine and process plant are planned to operate 24 hours/day, 365 days/year. A predictive and planned
maintenance strategy will be implemented throughout the site and dedicated planners for each discipline
will coordinate all maintenance procedures and work plans.
The mine is headed by a Mine Operations Manager who is responsible for the overall management of the
mine. The chief mine engineer and chief geologist and superintendent positions in operations and
maintenance report directly to the Mine Operations Manager.
The Technical Services group will consist of mine engineers, geologists, planners and technicians. The
Technical Services group supports and services operations by ensuring that mine plans, systems, designs,
records, budgets and schedules are in place and support the safe and efficient operation of the mine. The
group will also provide engineering services, as required, for the process plant and related infrastructure.
Mine General Manager
Environmental Superintendent
Chief Accountant
H&S and Emergency Response
Coordinator
Mill Operations Manager
Human Resources
Superintendent
Mine Operations
Manager
NI 43-101 Technical Report Feasibility Study Update Hardrock Project, Ontario, Canada
Section 24 January 2021 Page 24-10
The process plant, power plant, tailings area, and water management and treatment are the responsibility
of the Mill Operations Manager. The mill operations superintendent, mill maintenance superintendent and
chief metallurgist report directly to the Mill Operations Manager.
Primary and secondary crushing are ahead of the process plant stockpile area and will require dedicated
operation and maintenance teams as the manipulations and overall maintenance aspects of the large
machines are time intensive. A lower planned availability, as well as appropriate maintenance workforce,
is planned for these systems.
To achieve industry standard plant on-line time, planned shutdowns will be a focus area as the high-
pressure grind rolls, wet screens, grinding mills and miscellaneous conveying and feeding systems are
interconnected. Plant shutdowns will be managed internally with external contracted assistance as required
(workforce and specialized technical people).
The site accounting team reports to the chief accountant. The accounting department is responsible for
budgeting, processing, measuring and reporting business results, in an efficient, accurate and timely
manner.
A procurement system will be in place and will consist of market research, operation requirements planning,
suppliers’ management, purchasing and order controlling.
A warehouse management system and logistics system will be set-up that will ensure that each operating
unit will be supplied with the required parts, products and consumables.
The information technology (“IT”) department is primarily responsible for standardizing, operating and
managing the IT systems, applications and infrastructure required by the business. This includes
management of business information systems, communication infrastructure, data security and integrity.
Gold balance, bullion preparation, sale to clients as well as sales contract management will be under the
supervision of the Mill Operations Manager. The Chief Accountant will be accountable for sales and revenue
reporting, as well as gold security and general auditing practices.
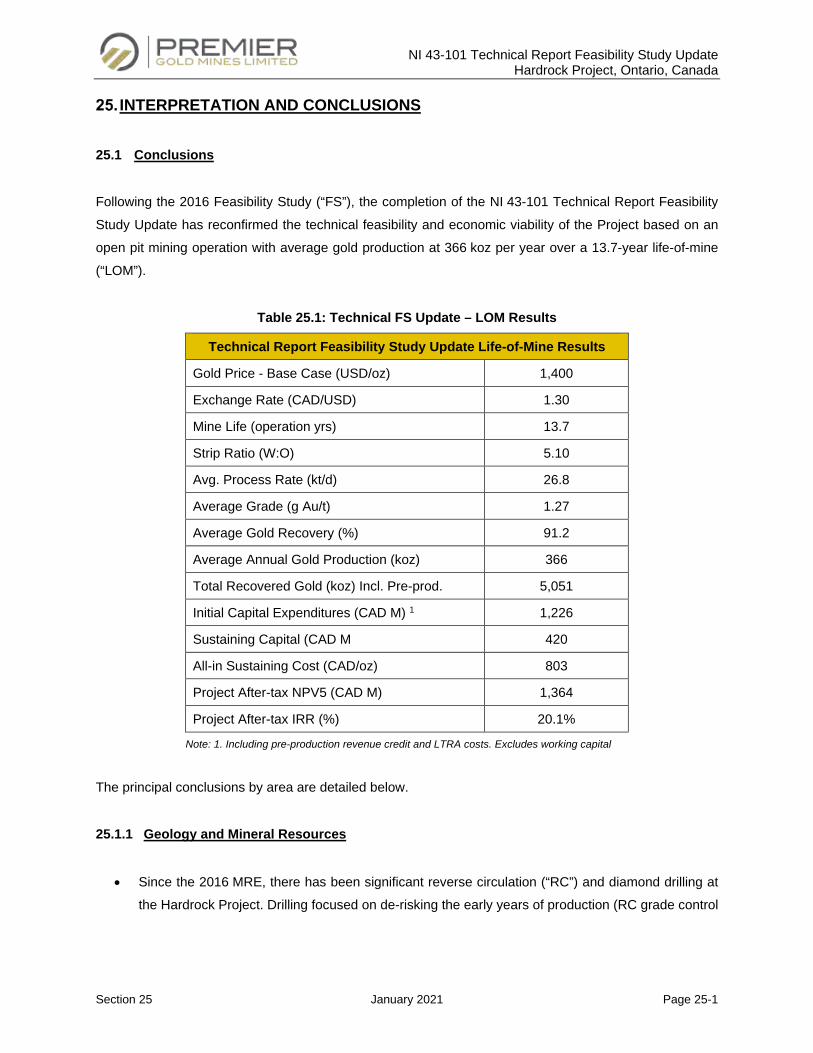
NI 43-101 Technical Report Feasibility Study Update Hardrock Project, Ontario, Canada
Section 25 January 2021 Page 25-1
INTERPRETATION AND CONCLUSIONS
25.1 Conclusions
Following the 2016 Feasibility Study (“FS”), the completion of the NI 43-101 Technical Report Feasibility
Study Update has reconfirmed the technical feasibility and economic viability of the Project based on an
open pit mining operation with average gold production at 366 koz per year over a 13.7-year life-of-mine
(“LOM”).
Table 25.1: Technical FS Update – LOM Results
Technical Report Feasibility Study Update Life-of-Mine Results
Gold Price - Base Case (USD/oz) 1,400
Exchange Rate (CAD/USD) 1.30
Mine Life (operation yrs) 13.7
Strip Ratio (W:O) 5.10
Avg. Process Rate (kt/d) 26.8
Average Grade (g Au/t) 1.27
Average Gold Recovery (%) 91.2
Average Annual Gold Production (koz) 366
Total Recovered Gold (koz) Incl. Pre-prod. 5,051
Initial Capital Expenditures (CAD M) 1 1,226
Sustaining Capital (CAD M 420
All-in Sustaining Cost (CAD/oz) 803
Project After-tax NPV5 (CAD M) 1,364
Project After-tax IRR (%) 20.1%
Note: 1. Including pre-production revenue credit and LTRA costs. Excludes working capital
The principal conclusions by area are detailed below.
25.1.1 Geology and Mineral Resources
• Since the 2016 MRE, there has been significant reverse circulation (“RC”) and diamond drilling at
the Hardrock Project. Drilling focused on de-risking the early years of production (RC grade control
NI 43-101 Technical Report Feasibility Study Update Hardrock Project, Ontario, Canada
Section 25 January 2021 Page 25-2
targeting the first 3 benches of production), in-filling gaps in the drill pattern and validating the new
mineralisation interpretation.
• Cut-off grades of 0.30 g Au/t for the in-pit resource and 2.00 g Au/t for the underground resource
are appropriate for reporting Mineral Resources for the Project.
• At a cut-off grade of 0.30 g Au/t, the in-pit Measured and Indicated Mineral Resources are estimated
to be 137.7 Mt grading 1.33 g Au/t for 5.9 Moz of gold, inclusive of mineral reserves. In-pit Inferred
Mineral Resources are estimated to be 0.9 Mt grading 1.19 g Au/t for 36 koz of gold.
• At a cut-off grade of 2.00 g Au/t, the underground Indicated Mineral Resources are estimated to be
9.8 Mt grading 3.93 g Au/t for 1.2 Moz of gold. Underground Inferred Mineral Resources are
estimated to be 24.6 Mt grading 3.87 g Au/t for 3.1 Moz of gold.
• Definitions for Mineral Resource categories used in this report are consistent with the 2014 CIM
definitions and prepared in accordance with NI 43-101.
• Since the 2012 Brookbank MRE by Micon International Ltd., more diamond drilling and resampling
of drill core has occurred warranting an update to the MRE in 2020. Drilling focused on delineating
the high-grade core of the deposit. No additional drilling has been undertaken at Key Lake or Kailey
since 2012, however there has been significant advancements in the geological understanding of
the orebodies since 2012.
• A cut-off grade of 0.40 g Au/t for the in-pit resource at Kailey and Key Lake was chosen, and
0.6 g Au/t cut-off was chosen for Brookbank, due to the distance from the envisaged Hardrock
processing facility.
• A cut-off grade of 2.4 g Au/t was chosen for underground resources at Brookbank and is considered
appropriate for reporting Mineral Resource for the Project.
• The Brookbank deposit consists of in-pit Indicated Mineral Resources of 1.147 Mt @ 2.24 g Au/t for
83 KOz of gold, and Inferred Mineral Resources of 0.045 Mt @ 2.07 g Au/t for 3 KOz of gold. The
underground Indicated Mineral Resource is stated at 2.281 Mt @ 7.06 g Au/t for 517 KOz of gold,
and Inferred Mineral Resources of 0.706 Mt @ 3.38 g Au/t for 77 KOz of gold.
• The Key Lake deposit consists of in-pit Indicated Mineral Resources of 3.761 Mt @ 1.16 g Au/t for
141 KOz of gold, and Inferred Mineral Resources of 1.836 Mt @ 1.39 g Au/t for 82 KOz of gold. No
underground Mineral Resources are reported at Key Lake.
• The Kailey deposit consists of in-pit Indicated Mineral Resources of 11.276 Mt @ 0.96 g Au/t for
348 KOz of gold, and Inferred Mineral Resources of 4.858 Mt @ 0.87 g Au/t for 136 KOz of gold.
No underground Mineral Resources are reported at Kailey.
NI 43-101 Technical Report Feasibility Study Update Hardrock Project, Ontario, Canada
Section 25 January 2021 Page 25-3
25.1.2 Mining and Mineral Reserves
• The mine design and Mineral Reserve estimate have been completed.
• At a cut-off grade of 0.35 g Au/t, the Proven Mineral Reserves total 5.6 Mt at an average grade of
1.28 g Au/t for 232 k in-situ ounces of gold. The Probable Mineral Reserves total 129.7 Mt at an
average grade of 1.27 g Au/t for 5,307 k in-situ ounces of gold. The total Proven and Probable
reserve is 135.3 Mt at an average grade of 1.27 g Au/t for 5,539 k in-situ ounces of gold.
• The mining activities will occur over a period of 12.9-years (from start of commercial production to
end of in-pit mining activities) excluding the pre-production period.
• The open pit generates 689.6 Mt of overburden and waste rock (inclusive of historic tailings and
underground backfill) for a strip ratio of 5.1:1.
• The Mineral Reserve estimate stated herein is consistent with CIM definitions. The Mineral Reserves
are based on Measured and Indicated Mineral Resources, and do not include any Inferred Mineral
Resources.
25.1.3 Metallurgical Testing and Mineral Processing
• The process design criteria have been established based on test results, Owner and vendor
recommendations and on industry practices.
• Processing options for the Project were selected based on the results of this testwork and are
well known technologies currently used in the mining industry.
• Trade-off studies have determined that the ore processing plant should be sized at 27,000 t/d
and using standard proven technology for crushing, grinding, thickening, leaching, CIP and gold
recovery.
• The gold recovery process for the Project consists of a crushing circuit, a HPGR / ball mill
grinding circuit, pre-leach thickening and cyanide leaching; CIP circuit, carbon elution and
regeneration; electrowinning and gold refining; cyanide destruction and tailings disposal. The
process plant is designed to operate at a throughput of 27,000 t/d.
• The overall gold recovery is 91.2% and is based upon metallurgical testing completed
comprising of composite samples representing the full (global) deposit, early production years,
lithological zones, low grade and near surface areas. The results demonstrate that the ore is
amenable to gold recovery via cyanidation. Gold recovery is correlated to grind size, gold,
sulphur and arsenic head grade. Block models have been created and each is assigned a gold
recovery based upon the block attributes and the target grind size.
NI 43-101 Technical Report Feasibility Study Update Hardrock Project, Ontario, Canada
Section 25 January 2021 Page 25-4
25.1.4 Infrastructure
• Existing infrastructure within the footprint of the property limits will need to be relocated or purchased
and dismantled. The most significant relocation is that of the TransCanada Highway 11. All private
properties within the project area have been purchased.
• Power availability from the existing grid is deemed insufficient and not reliable. Construction of a
65 MW natural gas-fired power plant is planned, with a designed capacity of 46.5 MW.
• As with the other main infrastructure, the administration building, truck shop, reagent storage and
explosives plant and tailings management facility have been sized to support the mine and process
operation.
• The historical seepage collection system and mine site collection ponds have been sized to handle
normal flows with surface capacity for containing a 100-year return flood without discharge to the
environment.
• Goldfield Creek (“GFC”), which currently traverses through the Tailings Management Facility
(“TMF”) footprint will be permanently diverted towards northeast to Kenogamisis Lake. The
permanent GFC diversion channel design meets the fish offset guidelines. The GFC diversion dyke
required for the diversion is designed in accordance with CDA and LRIA guidelines.
• The TMF has been designed in accordance with LRIA and CDA guidelines. The stability of the dams
meets the target factors of safety required as per CDA. Tailings deposition plans have been
developed in such a way that the wide tailings beaches abut the perimeter rock fill dams and pond
being pushed to the west abutting natural ground.
• Seepage and runoff form TMF will be pumped back to the TMF. In case there is surplus water, which
cannot be pumped into the TMF, water will be treated prior to discharging to the environment
25.1.5 Environmental Considerations
• The EIS/EA received Federal approval on December 13, 2018 and Provincial approval on
March 12, 2019. The EIS/EA, including implementing the identified mitigation measures, supports
the conclusion that the Project will not cause significant adverse environmental effects, including
effects from accidents and malfunctions, effects of the environment on the Project and cumulative
effects.
• Conceptual environmental management and monitoring plans (“EMMPs”) were provided in the final
EIS/EA and include measures related to both compliance and EIS/EA monitoring for all phases of
the Project. The collective monitoring activities associated with the Project will also be used to inform
NI 43-101 Technical Report Feasibility Study Update Hardrock Project, Ontario, Canada
Section 25 January 2021 Page 25-5
adaptive management for the Project, as required. The management and monitoring requirements
have been incorporated into Project plans and budgets.
• Active consultation with stakeholders (community members, agencies and interested parties) and
Indigenous communities has been undertaken throughout Project planning and will continue as the
Project progresses.
• Greenstone Gold Mines (“GGM”) has established Long Term Relationship Agreements ("LTRAs")
with the five local Indigenous communities. The agreements establish increased clarity regarding
GGM’s ability to develop the Project and the Indigenous communities’ opportunity to benefit from
future mining opportunities in the region, including the potential to extend the life of the Project.
25.1.6 Capital and Operating Costs
• The CAPEX estimate was based on material take-offs from advanced detailed engineering in most
areas (50% to 90%), and firm price bids for the majority of process plant, power plant equipment,
and the mine mobile equipment fleet. A QRA session was held to establish the contingency for the
capex update.
• The initial CAPEX for Project construction, including processing, mine equipment purchases and
pre-production activities, infrastructure and other direct and indirect costs, is estimated to be
CAD 1,301M (before pre-production revenue and LTRA costs). The total initial capital includes a
contingency of CAD 108M, which is 9.0% of the total CAPEX.
• Sustaining capital required during operations for additional equipment purchases, mine equipment
capital repairs, mine civil works, TMF dam raises and additional infrastructure relocation is estimated
at CAD 420M.
• A salvage value of CAD 45M is estimated for some mining and processing equipment and the power
plant that will not have been utilized to their useful life.
• The total reclamation and closure cost are estimated to be CAD 54M.
• The average operating cost is CAD 708/oz Au or CAD 26.51/t milled over the LOM. The all-in
sustaining cost (“AISC”) which includes closure, reclamation and sustaining capital costs average
CAD 803/oz Au over the mine life.
NI 43-101 Technical Report Feasibility Study Update Hardrock Project, Ontario, Canada
Section 25 January 2021 Page 25-6
25.2 Risks and Opportunities
25.2.1 Risks
GGM’s risk identification and assessment process is iterative and has been applied throughout the FS and
Detailed Engineering phases. Through a series of risk assessment sessions, risks are identified in relation
to Project objectives and the internal and external context at the time of each assessment and are
summarized into the Hardrock Project Corporate Risk Register. The risk evaluation process uses a 5 x 5
Impact and Likelihood matrix to rate risks at the enterprise level. A broad range of Project risk areas
(technical, environmental, community, financial, health and safety, etc.) are assessed in order to provide a
business or enterprise level perspective. Risk assessments by department or discipline are undertaken at
the appropriate stages. Various standard engineering risk assessment processes, such as HAZOPs and
Failure Mode and Effects Analysis (“FMEA”) are undertaken during the detailed engineering phase.
Standard health & safety risk assessment processes will be implemented for the construction phase.
Risk treatment plans are developed for each risk in order to reduce the risk’s probability of occurring and/
or impact to an acceptable or practical level. Certain risk mitigation activities were completed as planned
during the current project phase, while other actions are planned for construction, operations or closure
phases as appropriate. These mitigation plans are incorporated in the project execution plans and where
required in the CAPEX and OPEX budgets.
25.2.2 Discussion of Risks
The following is a discussion of the key risks for the Project with summaries of the related controls and risk
mitigation strategies.
25.2.2.1 People
Ensuring that the right people are available at the right time, and the continuity of key positions is critical to
ensure that the construction can be executed and delivered on schedule and budget to achieve the planned
ramp-up. Comprehensive mitigation measures to ensure a smooth execution of the project have been
considered and incorporated into Project plans. Initial work on developing and fostering the desired GGM
culture is in progress. An overall project delivery strategy based on an “Owner Managed” model has been
established and staffing plans have been established. Engineering and selected procurement activities will
be outsourced. During construction, work will rely on the use of experienced contractors. Preliminary
relocation, compensation and retention strategies and policies have been developed and are reflected in
NI 43-101 Technical Report Feasibility Study Update Hardrock Project, Ontario, Canada
Section 25 January 2021 Page 25-7
the capital and operating cost estimates. Work is underway to develop the training programs that will be
required to ensure LTRA commitments will be met.
25.2.2.2 Gold Production
Gold production will depend on a number of factors such as accuracy of the resource and diluted models
(tonnes and grade), mill throughput and recovery.
Significant drilling has occurred since the 2016 FS to improve the drill density of the early mining phases
and to validate the updated resource model particularly within the 5 year pit extents. The recent drilling has
confirmed that the block model is a good predictor of the expected gold grade. The resource model has
been peer reviewed. The resource grade of the new resource model has been verified in two recent drilling
campaigns; however, actual results may vary as the deposit is mined particularly beyond the 5 years pit
extents. Similarly, although the 2019 diamond drilling campaign intersected very close to the 2018
modelled wireframes, resource tonnages may be different than expected. As the open pit is developed in
the early years, an improved understanding of the geology, structures and reconciliations will lead to an
updated and improved resource model.
The expected milling on-line time is 92% and is based upon on a good plant design and the execution of
good operating and maintenance practices. An online simulation study was carried out following the FS
and supported this figure. Some challenges may include the operation of the primary crusher, secondary
screen and crusher as one system prior to feeding the stockpile storage area which may place additional
demands and require additional flexibility on the mining operation to maintain an adequate coarse ore
stockpile level to minimize ore shortages. The throughput may be mitigated from the HPGR process which
will generate microcracks and reduce the grinding power necessary to achieve the targeted grind size and
tonnage if the ball mills were the bottleneck.
Arsenic and sulphur models have been created and the results are available for each ore block within the
block model to estimate the expected gold recovery from a multivariable regression analysis based on grind
size, arsenic, sulphur, and gold head grades. The metallurgical regression analysis was based on the
metallurgical testwork results obtained. The metallurgical testing and subsequent regression analysis does
not cover the full spectrum of the ore expected to be processed particularly when low ratio material (gold
to arsenic or gold to sulphur) is processed and metallurgical performance may be lower than expected.
During operations, on-going optimization of the metallurgical performance will be carried out via leach
testwork and throughput vs grind size tradeoffs will be evaluated on a regular basis in conjunction with
anticipated gains from the HPGR circuit due to microcracking.
NI 43-101 Technical Report Feasibility Study Update Hardrock Project, Ontario, Canada
Section 25 January 2021 Page 25-8
25.2.2.3 Permitting
With ongoing constraints in the public sector, GGM is monitoring the risk of agencies not meeting
reasonable or the mandatory timeframe for permitting approvals. Consultation with Indigenous communities
and agencies is undertaken on all key permit applications prior to submission to facilitate the approval
timeframes.
25.2.2.4 Tailings Management Facility
Risks identified in relation to the TMF are reviewed for all phases of work including design, permitting,
construction and operations. The TMF design is based on significant geotechnical drilling and
hydrogeological field work, which were completed to support the design basis. Various dam construction
risks assessments were made with a more conservative core upstream design chosen. A detailed risk
assessment was undertaken by Wood on the preferred alternative to understand the impact of extreme
weather resulting in too much or too little water in the TMF.
A detailed Tailings Facility Construction Management Plan, including a quality assurance/quality control
program, will be developed and implemented for construction. A dam deposition plan and a dam raising
schedule has been developed to ensure capacity for the mill tailings during operations.
An Independent Tailings Review Board (“ITRB”) was established at the start of the detailed engineering
phase to provide oversight during the lifecycle of the TMF. The purpose of the ITRB is to review and advise
on the design, construction, operation, performance, and closure planning for the TMF. Recommendations
from the ITRB have been incorporated into the detailed design of the TMF. Consultation with stakeholders
has been occurring and will continue throughout permitting process.
25.2.2.5 Project Cost Estimate
The CAPEX estimate was updated in 2019 based on material take-offs from advanced detailed engineering
(50 to 90%) for the process plant, TMF, Goldfield Creek and Highway 11 realignment. The CAPEX update
for the majority of process plant, power plant equipment, effluent treatment plant, sewage treatment plant
and mine mobile equipment fleet was based on firm price bid process, and in many cases Letters of Intent
have been issued, pending a Construction Decision. Budgetary bids, quotes, estimating databases and
historical data have been used for the remainder of the capex update. A Quantitative Risk Assessment
(“QRA”) session was held to establish the contingency for the CAPEX update. The Project execution
philosophy and plans are aligned with the CAPEX, and strategies and plans are in place to ensure a highly
NI 43-101 Technical Report Feasibility Study Update Hardrock Project, Ontario, Canada
Section 25 January 2021 Page 25-9
experienced team is hired and retained to deliver on the plan. Robust planning, cost control, and change
management processes are in place and will be scaled for the construction execution phase.
25.2.2.6 Accidents and Incidents
Ensuring the right systems and people are in place to manage health, safety and environmental risks is of
paramount importance to GGM. The expectation is that everybody leaves the site the same way they
arrived is one of GGM’s core values. The Hardrock project will develop a health and safety management
plan and will comply with the Occupational Health and Safety Act of Ontario (R.R.R 1990, Regulation 854)
and all other health and safety regulations for mines operating in Ontario. All procedures and training will
be carried out in compliance to the regulations. Area managers are accountable to ensure that procedures
meet or exceed minimum standards for protecting the health and safety of all personnel. Compliance to
the policies and procedures is the responsibility of every individual and not solely that of the health and
safety department.
Draft environmental management plans (17) covering environmental management requirements have been
prepared and are in the process of being finalized.
25.2.2.7 Pit Wall Failure
A sound comprehensive Pit Slope Management Program will be put in place by the Hardrock geotechnical
engineering department to manage risks attributable to potential movement of the exposed rock faces.
Rock mass failure is considered a low risk at Hardrock due to the high overall rock mass strength. Design
elements have included a temporary wall slope profile that allows for wider catch benches to manage
overbank hazards. The final design of the pit will evolve through the mine life considering information
collected during the interim pit phases. Slope movement monitoring is also planned.
25.2.2.8 Stability of Historical Tailings
Geotechnical investigations and a stability analysis of the MacLeod High Tailings (“MHT”) have been
completed to assess the risk of overloading the historical tailings. Infrastructure already exists on these
historical tailing with no incidents reported. As a result of these investigations and analysis, a stability
buttress was added, in order to protect the integrity of the new highway and to prevent any further
contamination to the lake. The buttress has been designed to hold the historical tailings in place in case of
an earthquake that could potentially liquefy the historical tailing under the highway. The buttress will be
constructed using mine rock along the north section of the MHT. The majority of the remaining perimeter
NI 43-101 Technical Report Feasibility Study Update Hardrock Project, Ontario, Canada
Section 25 January 2021 Page 25-10
of the MHT is adjacent to the waste rock dump or the mine haul road, providing stability. The final stability
analysis based on the buttress design has concluded that required stability will be achieved.
Proper mining practices will be implemented when mining proximal to the historical tailings, especially
focusing on controlling the vibrations attributable to blasting activities. An emphasis will be placed on
avoiding the exposure of historical tailings faces for a long period of time. A rock dam will be put in place
following the advancement of the excavation.
GGM is also pursuing the optimization of geotechnical concepts with specialized consultants aimed at
improving future practices when dealing with historical tailings.
25.2.2.9 Relocation of Infrastructure
The Project requires a variety of existing infrastructure to be relocated in order to accommodate the
proposed pit and plant site. Accordingly, there are risks associated with such proposed relocation. For
example, there is a risk associated with delays in obtaining permits or a refusal in granting permits for the
Highway 11 realignment work as a section of the realignment must be constructed over existing historical
tailings. Detailed design and geotechnical investigations for this work have been completed. A mobile water
treatment system will be in place during construction to treat any contact water. An engineering company
familiar with the highway-related technical and regulatory processes in northwestern Ontario has been
engaged to undertake the work and lead the permitting process.
Preliminary engineering has been completed by Enbridge for their segment of the natural gas pipeline.
Discussions are well advanced with Hydro One for the relocation of their transformer station.
25.2.2.10 Water Management
The Project is surrounded on three sides by lakes and is cross-cut by small streams. There are several
risks associated with construction activities and the use, treatment and discharge of water during operations
and closure. These risks and associated treatment plans are as follows:
• Groundwater modelling and laboratory testing have been undertaken to understand the risk of
unacceptable contaminants such as arsenic seeping from the TMF, historical tailings, and waste
rock storage areas. Design elements include seepage collection ditches, temporary water treatment
during construction and collections ponds that allow for water to be recycled to the plant during
operations to ensure the required water quality objectives are met. Arsenic loading has been
modelled.
NI 43-101 Technical Report Feasibility Study Update Hardrock Project, Ontario, Canada
Section 25 January 2021 Page 25-11
• Federal permits for Schedule 2 of the MMER, and Section 35 for the Department of Fisheries and
Oceans Canada and Environment Canada (“DFO”) have been submitted to federal agencies. The
DFO has accepted the Goldfield Creek compensation strategy prior to the application submission.
Environment Canada has indicated that they will recommend a streamlined approval approach,
which will reduce the Schedule 2 approval process by six to eight months. The DFO Section 35
Offsetting for Goldfield Creek authorization is expected to be received in Q4 2019.
• The risks related to water ingress into the open pit is deemed to be manageable as the historical
dewatering rate was reasonable and the permeability of the rock is low as determined by
geotechnical work. Pit dewatering is planned to be a minimum 20 m below the lowest mining bench
elevation.
• The operation will be relying on water collected from underground workings, open pit and collection
from surface drainage as its main source of fresh water which given the overall requirement to
discharge water from the permanent water treatment plant should not pose a risk to a water deficit
situation. The water balance will be managed closely and the operation has sufficient flexibility to
minimize water related impacts.
• The treated water from the effluent treatment plant is required to meet certain water discharge
criteria established for the Project which includes ammonia. The ammonia losses in the pit, due to
the use of explosives, could exceed the expected levels and require an ammonia removal step in
the water treatment plant. During the mining pre-production period, ammonia levels will be
monitored closely.
25.2.3 Opportunities
There are a few remaining opportunities to improve overall Project economics and sustainability.
• Revenue-related potential opportunities:
• The use of the Hardrock process plant and TMF for the future processing of gold from other
GGM properties including the Hardrock underground resource and the regional exploration to
improve the LOM average grade and/or extend the LOM. The Indigenous Agreements include
agreed financial benefits for the Hardrock Underground.
• The Project is permitted for 30,000 tpd providing the opportunity to increase throughput, post
ramp-up through optimization. Additional throughput may be achieved through the milling circuit
as a result of microcracks generated from the high-pressure grinding rolls; not accounted for in
the throughput rate estimate. There is also a potential opportunity to use the Hardrock process
plant and TMF to process some portion of the existing surface historic tailings in order to recover
NI 43-101 Technical Report Feasibility Study Update Hardrock Project, Ontario, Canada
Section 25 January 2021 Page 25-12
gold, generate revenue, and also potentially mitigate environmental liabilities related to
sulphides, arsenic and other contaminants.
• Connecting the natural gas power plant to the grid and selling spare power generation to the
grid during times of shutdowns or excess capacity.
• Connecting the natural gas power plant to the grid and selling spare power generation to the
grid during times of shutdowns or excess capacity.
• OPEX related potential opportunities:
• Consider the possibility of a potential blend of LNG and diesel as a fuel source is possible for
the mine haul trucks. Currently, the mine fleet uses 100% diesel.
• Utilize new, commercially available technologies/autonomous haulage to increase operational
effectiveness and reduce costs (Year 3+).
• Optimize remote assisted drilling to its full potential. While the base case includes remote
assisted drilling, additional benefits can be achieved via labour mine productivity improvements.
• Investigate the availability of high-quality second-hand mining equipment.
• CAPEX related potential opportunities:
• Pursue possible improvements in the TMF deposition plan and dam raise schedule, and the
elimination of certain temporary structures in the initial construction in order to improve initial
CAPEX.
• Complete the ramp-up to commercial production one month earlier than planned.
• Consider the possibility of equipment leasing to reduce upfront capital while protecting overall
project economics.
• Actively pursue government financial assistance for certain existing infrastructure relocations.
NI 43-101 Technical Report Feasibility Study Update Hardrock Project, Ontario, Canada
Section 26 January 2021 Page 26-1
RECOMMENDATIONS
26.1 Hardrock Project Recommendations
After the completion of the 2016 Hardrock Project Feasibility Study, Greenstone Gold Mines (“GGM”)
successfully completed work plans in 2017 and 2018 to further de-risk the project. Federal approval of the
Environmental Assessment was received in December 2018 and Provincial approval was received in
March 2019. Permitting work has advanced, and after thorough consultation with the affected Indigenous
communities and agencies, all pre-construction permit applications have been submitted. All permits
required for construction were submitted. The forecast approval timelines support the planned construction
schedule. GGM has now signed agreements with the local Indigenous communities, and implementation
of these agreements is underway. The Independent Tailings Review Board (“ITRB”) was implemented in
2017 to provide advice and guidance during the Tailings Management Facility (“TMF”) detailed engineering
phase and extensive TMF geotechnical programs have been completed. Conceptual construction
execution plans were developed for the TMF, Goldfield Creek and Highway 11 and the construction
schedule for these facilities has been de-risked. The 2018 and 2019 drilling programs were successful and
provided the basis for improved resource and reserve estimates.
The scope of the Technical Report Feasibility Study Update included updating the resource and reserve
models, revising the mine plan, advancing detailed engineering in higher risk areas and completing firm
price bid processes for all major process and power plant equipment, effluent and sewage treatment plants
and the mine mobile equipment fleet. This work formed the basis of the capital cost, operating cost and
project economic update.
The Technical Report Feasibility Study Update has reconfirmed the technical feasibility of the Project and
significantly improved the economic results.
The list of preliminary recommendations that follows was prepared by GGM and G Mining Services Inc.
(“GMS”) and reflects recommendations for subsequent phases of work, including completion of the detailed
engineering phase, the construction phase and the operations phase. The cost of addressing each of these
recommendations are generally within the scope of Project CAPEX, sustaining capital, closure costs and
OPEX outlined in this Report.
26.1.1 Exploration and Geology
• Revalidate collar coordinates from the 2018 RC drilling campaign at Hardrock before the
commencement of mining activities.
NI 43-101 Technical Report Feasibility Study Update Hardrock Project, Ontario, Canada
Section 26 January 2021 Page 26-2
• Incorporate underground drill holes at Hardrock (not included in Mineral Resource) and adjust
mineralization interpretation to produce a more locally accurate block model for internal purposes.
• Update the level of definition of the PAG (potentially acid generating) and non-PAG model.
• Undertake metallurgical test-work for the Kailey Deposit to confirm metallurgical recoveries
assumed in the MRE.
• Retake core duplicates of existing Metalore-era drill core at Brookbank to confirm historical results
where QA/QC protocols were lacking. Compile and digitise all QA/QC data for the Ontex-era drilling
pre-2009 (present in drill logs and assay certificates).
• Resample drill core at Key Lake to increase the overall sample coverage and to overcome the effects
of undersampling in the past.
• Undertake further resource definition drilling at Kailey, targeting the No.9 Zone near surface to
convert existing Inferred to Indicated category, and to discover new ounces in the existing pit shell.
• Undertake a scoping study at Brookbank to understand if it could be a potential source of higher-
grade plant feed for the overall Hardrock operation.
Table 26.1: Costs Associated with Exploration & Geology-Related Recommendations
Activity Cost (CAD)
Metallurgical Test Work at Kailey (drilling, sampling, metallurgy) 300,000
Resampling of Drill Core at Brookbank and Key Lake 50,000 Expansion Drilling at Kailey 400,000 Scoping Study at Brookbank 150,000
26.1.2 Detailed Engineering Phase
• Review specific sections of waste rock storage designs C and D based on the latest geotechnical
stability analysis produced by Wood in September 2019.
• Review specific sections of the overburden storage design based on the latest geotechnical stability
analysis produced by Wood in August 2019.
• Conduct additional pit slope geotechnical work such as detailed review of variation in structural
fabric orientation to identify possible localized sub-domains with stronger controls on achievable
bench face angles; and conduct sensitivity analyses on slope saturation and lower effective shear
strength. Additional laboratory testing such as triaxial testing and intact shear strength of foliation is
recommended.
NI 43-101 Technical Report Feasibility Study Update Hardrock Project, Ontario, Canada
Section 27 January 2021 Page 27-1
REFERENCES
SECTION 1 - SUMMARY
CDA, Technical Bulletin: Application of Dam Safety Guidelines to Mining Dams, Canadian Dam Association,
2014.
MNR, Technical Bulletin, Geotechnical Design and Factors of Safety, Ontario Ministry of Natural
Resources, August 2011.
SECTION 4 - PROPERTY DESCRIPTIONS AND LOCATIONS
Brousseau, K., Poirier, S., Pelletier, C., St-Laurent, M., Barret, J., Hatton, M., Fournier, J., Murahwi, C.,
Technical Report on the Trans-Canada Property (according to National Instrument 43-101 and Form 43-
101F1), Report prepared by InnovExplo Inc. for Centerra Gold Inc. and Premier Gold Mines Limited, 2015.
SECTION 6 - HISTORY
Blakley, I.and Moreton, C., Technical Report on the Brookbank Gold Deposit, Bearmore-Geraldton Area,
Northern Ontario, Canada, Report prepared by Scott Wilson Roscoe Postle Associates Inc. (Scott Wilson
“RPA”) for Ontex Resources Ltd. (“Ontex”), 2009.
Brousseau, K., Poirier, S., Pelletier, C., St-Laurent, M., Barrett, J., Hatton, M., Fournier, J. and Murahwi, C.
Z., Technical Report and Mineral Resource Estimate update for the Hardrock Deposit (according to National
Instrument 43-101 and Form 43-101F1), Report prepared by InnovExplo Inc. for Premier Gold Mines
Limited, 2014.
Brousseau, K., Turcotte, B. and Richard, P.-L., Technical Report and Mineral Resource Estimate for the
Hardrock Deposit (compliant with National Instrument 43-101 and Form 43-101F1), Report addressed to
Premier Gold Mines Limited. Report prepared by InnovExplo Inc., 2013.
Bruce, E. L., Little Long Lac Gold Area, Ontario Department of Mines, 44th Annual Report, Part 3, 60 pages,
1935.
Ferguson, S. A., Groen, H. A. and Haynes, R., Gold Deposits of Ontario: Part 1 Districts of Algoma,
Cochrane, Kenora, Rainy River, and Thunder Bay, Ontario Division of Mines, MRC13, 1971.
NI 43-101 Technical Report Feasibility Study Update Hardrock Project, Ontario, Canada
Section 27 January 2021 Page 27-2
Gray, R. S., 1994 Exploration Program Geraldton Project, Ashmore and Errington Townships, Ontario,
42 E 10, Asarco Exploration Company of Canada Limited. AFRI File: 42E10NW2008, 1994.
Mason, J. K. and White, G. K., Gold Occurrences, Prospects, and Deposits of the Beardmore-Geraldton
Area, Districts of Thunder Bay and Cochrane, Ontario Geological Survey, Open File Report 5630, 1986.
Murahwi, C. Z., Shoemaker, S. Jr. and Gowans, R., Technical Report on the Updated Mineral Resource
Estimates for the Hardrock Gold Property, Geraldton, Ontario, Canada, NI 43-101 Report prepared for
Premier Gold Mines Limited and Roxmark Mines Limited by Micon International Limited, 2011.
Murahwi, C. Z., Lewis, W. J. and San Martin, A. J., Technical Report on the Mineral Resource Estimates
for the Hardrock, Brookbank and Key Lake Projects, Trans-Canada Property, Beardmore-Geraldton area,
northern Ontario, Canada, NI 43-101 Report prepared for Premier Gold Mines Limited by Micon
International Limited, 2013.
Soni, A. and Steed, C. M., Crown Pillar Stability Assessment at Hard Rock Gold Mine, Geraldton, Report
summited to Lac Properties Inc by Golder Associates Ltd, 2002.
St-Laurent, M., Barett, J. C., Poirier, S., Brousseau, K., Fournier, J., Pelletier, C., Hatton, M. and Murahwi,
C. Z., Trans-Canada Property Hardrock and Brookbank Projects Preliminary Economic Assessment,
NI 43- 101 Technical Report, Report prepared for Premier Gold Mines Ltd., and presented by Stantec
Consulting Ltd., 2014.
Reddick, J, Srivastava, M. and Armstrong, T., Technical Report on Resource Estimates for the Hard Rock
Area, Hardrock Property, northern Ontario, NI 43-101 Report prepared for Premier Gold Mines Limited by
Reddick Consulting Inc., 2010.
Telesnicki, M. J. and Steed, C. M., Crown Pillar Stability assessment of the F-Zone Crown Pillar at the
Macleod-Cockshutt property, Geraldton, Report summited to Lac Properties Inc. by Golder Associates Ltd.,
2007.
Mason and White, Beardmore-Geraldton Resident Geologist’s District 1995. In Report of Activities 1995
Resident Geologists. Edited by C. L. Baker, J. A. Fyon, D. G. Laderoute, and J. W. Newsome, Ontario
Geological Survey, Open File Report 5943, p. 3-23, 1996
NI 43-101 Technical Report Feasibility Study Update Hardrock Project, Ontario, Canada
Section 27 January 2021 Page 27-3
SECTION 7 - GEOLOGICAL SETTING AND MINERALIZATION
Burk, R., GGM Key Lake Exploration Targets_07-2019, Internal Powerpoint presentation.
Burk, R., GGM_Little Long Lac Exploration Targets_ 07_2019_RBurk_V2, Internal Powerpoint
presentation.
Anglin, C. D., Geology, Structure and Geochemistry of Gold Mineralization in the Geraldton Area,
Northwestern Ontario, MSc thesis, Memorial University of Newfoundland, St. John’s, NL, 1987.
Reddick, J., Srivastava, M., and Armstrong, T. 2010. Technical Report on the Resource Estimates for the
Hard Rock Area, Hardrock Property, Northern Ontario. Prepared for Premier Gold Mines Limited.
Anglin, C. D., Franklin, J. M., Loveridge, W. D., Hunt, P. A. and Osterburg, S. A., Use a zircon U-Pb ages
of felsic intrusive and extrusive rocks in eastern Wabigoon Subprovince, Ontario to place constraints on
base metal and gold mineralization. In Radiogenic Age and Isotopic Studies: Report 2, Geological Survey
of Canada, Paper 88-2, pp. 109-115, 1988.
Blackburn, C. E., John, G. W., Aver, J. and Davis, D. W., Wabigoon Subprovince, In Geology of Ontario,
Ontario Geology Survey (ed.) P. C. Thurston, H. R., H. R. Williams, R. H. Sutcliffe, and G. M. Scott. Special
volume 4, pt. 1, pp. 303-381, 1991.
Card, K. D., and Poulsen, K. H., Geology and mineral deposits of the Superior Province of the Canadian
Shield; Chapter 2, In Geology of Precambrian Superior and Grenville Provinces and Precambrian Fossils
in North America, (co-ord.) S. Lucas, Geological Survey of Canada, Geology of Canada, no 7, pp. 13-194,
1998.
DeWolfe, J. C., Lafrance, B. and Stott, GH. M., Geology of the shear-hosted Brookbank gold prospect in
the Beardmore-Geraldton belt, Wabigoon Subprovince, Ontario, Canadian Journal of Earth Sciences, v.
44, pp. 925-946, 2007.
Horwood, H. C. and Pye, E. G., Geology of Ashmore Township; Ontario Department of Mines, Annual
Report, 1951, v.60, pt.5, 105 p, 1955.
Lafrance, B., DeWolfe, J. C. and Stott, G. M., A structural reappraisal of the Beardmore-Geraldton Belt at
the southern boundary of the Wabigoon Subprovince, Ontario, and implication for gold mineralization,
Canadian Journal of Earth Sciences, v.41, pp.217-235, 2004.
NI 43-101 Technical Report Feasibility Study Update Hardrock Project, Ontario, Canada
Section 27 January 2021 Page 27-4
Lafrance, B., Tóth, Z., Dubé, B. and Mercier-Langevin, P., Targeted Geoscience Initiative 4. Lode gold
deposits in ancient deformed and metamorphosed terranes: Geological setting of banded iron formation-
hosted gold mineralization in the Geraldton area, northern Ontario, In Summary of Field Work and Other
Activities 2012, Ontario Geological Survey, Open File Report 6280, pp.48-1 to 48-10, 2012.
Lavigne, M.J., Distribution of gold with respect to lithologies, metamorphic facies and strain state in the
Beardmore-Geraldton greenstone belt; Ontario Geological Survey, Open File Report 6241, 2009.
Macdonald, A. J., The Geraldton Gold Camp: The Role of Banded Iron Formation, Ontario Geological
Survey, Open File Report 5694, 1988.
Pye, E. G., Geology of Errington Township, Little Long Lac area, Ontario Department of Mines, Annual
Report, 1951, v.60, pt.6, 1952.
Smyk et al., Geology and Gold Mineralization of The Beardmore-Geraldton Greenstone Belt. In; Hollings,
P. (Ed.), Institute of Lake Superior Geology Proceedings, 51st Annual Meeting, Nipigon, Ontario, part 2 –
Field trip guidebook, c.51, part 2, 3-40, 2005.
Tóth, Z., Lafrance, B., Dubé, B., Mercier-Langevin, P. and McNicoll, V.J., Targeted Geoscience Initiative 4.
Lode gold deposits in ancient deformed and metamorphosed terranes: Geological mapping and structural
re-appraisal of the banded iron formation-hosted gold mineralization in the Geraldton area, Ontario, In
Summary of Field Work and Other Activities 2013, Ontario Geological Survey, Open File Report 6290,
pp.58-1 to 58-14, 2013.
Tóth, Z., Lafrance, B., Dubé, B., McNicoll, V.J. and Mercier-Langevin, P., Stratigraphic and structural setting
of banded-iron-formation-hosted gold mineralisation in the Geraldton area, Ontario, Geological Association
of Canada, Mineralogical Association of Canada, Fredericton 2014, Joint Annual Meeting, Program with
Abstracts, v.37, pp.272-273, 2014a.
Tóth, Z., Lafrance, B., Dubé, B., Mercier-Langevin, P. and McNicoll, V. J., Targeted Geoscience Initiative 4.
Lode Gold Deposits in Ancient Deformed and Metamorphosed Terranes: Relative Chronology Between
Hydrothermal Activity, Gold Mineralization and Deformation Events in the Geraldton Area, Northwestern
Ontario, In Summary of Field Work and Other Activities 2014, Ontario Geological Survey, Open File Report
6300, pp.40-1 to 40-10, 2014b.
NI 43-101 Technical Report Feasibility Study Update Hardrock Project, Ontario, Canada
Section 27 January 2021 Page 27-5
SECTION 8 - DEPOSIT TYPES
Dubé, B., Poulsen K. H. and Guha, J., The effects of layer anisotropy on auriferous shear zones: The
Norbeau mine, Quebec, Economic Geology, v. 84, pp. 871-878, 1989.
Dubé, B., O’Brien, S. and Dunning, G. R., Gold deposits in deformed terranes: examples of epithermal and
quartz-carbonate shear-zone-related gold systems in the Newfoundland Appalachians and their
implications for exploration, In North Atlantic Symposium, St-John’s, NF, Canada. Extended abstracts
volume, May 27-30, 2001, pp. 31-35, 2001.
Hodgson, C. J., The structure of shear-related, vein-type gold deposits: A review, Ore Geology Reviews,
v. 4, pp. 635-678, 1989.
Horwood and Pye, Geology of Ashmore Township, Ontario Department of Mines, Vol LX, Part V, 1951).
Kerswill, J. A., Models for iron-formation-hosted gold deposits, In Kirkham, R. V., Sinclair, W. D., Thorpe,
R. I. and Duke, J. M., eds., Mineral Deposit Modeling: Geological Association of Canada, Special Paper40,
pp.171-199, 1993.
Poulsen, K. H., Robert, F. and Dubé, B., Geological classification of Canadian gold deposits, Geological
Survey of Canada, Bulletin 540, 2000.
Robert, F., Structural setting and control of gold-quartz veins of the Val d'Or area, southeastern Abitibi
subprovince, in Ho, S. E., Robert, F. and Groves, D. I., eds., Gold and Base-Metal Mineralization in the
Abitibi subprovince, Canada, with Emphasis on the Quebec Segment, University of Western Australia,
Short Course Notes, v. 24, pp. 167-210, 1990.
Robert, F., Poulsen, K. H. and Dubé, B., Structural analysis of lode gold deposits in deformed terranes and
its application, Geological Survey of Canada, Short course notes, Open File Report 2850, 1994.
Robert, F. and Poulsen, K. H., Vein formation and deformation in greenstone gold deposits, in
Richards, J. P., and Tosdal, R. M., eds., Structural Controls on Ore Genesis: Society of Economic
Geologists, Reviews in Economic Geology, v. 14, pp. 111-155, 2001.
Dubé and Gosselin, Greenstone-Hosted Quartz-Carbonate Vein Deposits, 2007
Macdonald, Iron Formation-Gold Association: Evidence from Geraldton Area p. 75-82 in The Geology of
NI 43-101 Technical Report Feasibility Study Update Hardrock Project, Ontario, Canada
Section 27 January 2021 Page 27-6
Gold in Ontario, edited by A. C. Colvine, Ontario Geological Survey, Miscellaneous Paper 110, 278p.
1983b.
SECTION 10 - DRILLING
Leduchowski, D., Assessment Report on the 2016 Drilling Program, Brookbank Project, , Beardmore Area,
Thunder Bay Mining Division, prepared by Greenstone Gold Mines GP Inc., 2016.
SECTION 11 - SAMPLE PREPARATION, ANALYSES AND SECURITY
Barry, J., 2010 Quality Control Report for holes KL-10-01 up to and including KL-10-56, for the Key Lake
Project, Geraldton-Beardmore Camp, Ontario, prepared by Geodatrix Consulting, 2011.
SECTION 13 - MINERAL PROCESSING AND METALLURGICAL TESTING
SGS Lakefield Research Limited, An Investigation into Gold Recovery From Hardrock Project Ore, Final
Report-12400-001, March 1, 2011.
SGS Canada Inc., The Recovery of Gold from the Hardrock Project - Phase 2 Samples, Final Report -
12400-002, December 11, 2012.
McClelland Laboratories, Inc., Whole Ore Cyanidation Testing - Project AF Drill Hole Reject Composites,
MLI Job No. 3817, September 24, 2013.
SGS Canada Inc., QEM Automated Rapid Mineral Scan, Report 14117-001 – MI6000-OCT13 -,
October 31, 2013.
SGS Canada Inc., An Investigation into the Grindability Characteristics of Samples from the Hardrock
Deposit, Report 1 (Grindability)-14117-001, August 26, 2014.
SGS Canada Inc., An Investigation into The Hardrock Deposit, Final Report-14117-001, October 8, 2014.
SGS Canada Inc., The HPGR Amenability of Samples From The Hardrock Deposit, Report 2 –
Rev 1-14117-001, March 6, 2015.
JKTech Pty Ltd., Revised SMC Test Report, April 2014.
NI 43-101 Technical Report Feasibility Study Update Hardrock Project, Ontario, Canada
Section 27 January 2021 Page 27-7
FLSmidth, Thickening and Rheology Tests on Gold Ore Composite, June 2014.
SGS Canada Inc., An Investigation into Gold Recovery for the Hardrock Deposit, Final Report -17074-01,
March 5, 2019
SECTION 15 - MINERAL RESERVE ESTIMATES
Golder Associates – Hardrock Mine Open Pit Feasibility Level Slope Design Recommendations, Report
1401595_2016_Rev.4, September 8, 2016.
CIM – CIM Definition Standards for Mineral Resources and Mineral Reserves, May 10, 2014.
SECTION 16 - MINING METHODS
WOOD, Waste Rock Areas Stability Update – WRA A, B, C and D, August 15, 2019.
SECTION 18 - PROJECT INFRASTRUCTURE
Amec Foster Wheeler, Hardrock Mine Feasibility Study, Geraldton, Ontario - Geotechnical Investigations
for Tailings Management Facility and Waste Rock Areas, Final report (Project No. TC140307) submitted to
Premier Gold Mines Limited, 2015b.
WOOD, Technical Report: Geotechnical Investigation Report for Tailings Management Facility and
Construction Material Borrow Areas, November 2018
WOOD, Technical Report: Goldfield Creek Diversion Dyke Design Report, November 2018
WOOD, Technical Report: Tailings Management Facility Dams Till Core Deformation Analysis, April 2019
WOOD, Fisheries Act, Paragraph 35(2)(b) Authorization, Offset Plan and MDMER Schedule 2 Fish Habitat
Compensation Plan, 2019
Stantec Consulting Ltd, Technical Memo: Historical Tailings Inventory, Greenstone Gold Mines Hardrock
Project, July 2019
NI 43-101 Technical Report Feasibility Study Update Hardrock Project, Ontario, Canada
Section 27 January 2021 Page 27-8
SECTION 20 - ENVIRONMENTAL STUDIES, PERMITTING AND SOCIAL OR COMMUNITY IMPACT
Stantec, Environmental Impact Statement / Environmental Assessment. Stantec Consulting Ltd Hardrock
Project, July 2017.
Stantec, Supplemental 2015 Stage 2 Archeological Assessment of Additional Lands – Hardrock Project,
December 17, 2015
Stantec, Environment Baseline Data Report – Hardrock Project: Stage 1 Archeological Assessment,
March 21, 2014