Embed Size (px)
Citation preview
Mr John Rajala, P.E.Mr Ken Jones, P.E.Mr Peter Montano, P.E.Mr Tom Garagan, P.Geo.Prepared by:
B2Gold Corp.Prepared for:
MaliNI 43-101 TECHNICAL REPORT
FEKOLA GOLD MINE
Effective date:26 March 2019

B2Gold Corp. 595 Burrard St #3100, Vancouver, BC V7X 1J1, Canada
Tel: +1 604-681-8371
www.b2gold.com
CERTIFICATE OF QUALIFIED PERSON
I, Tom Garagan, P.Geo, am employed as the Senior Vice President, Exploration with B2Gold Corp. (“B2Gold”), which has its head offices at 595 Burrard St #3100, Vancouver, BC V7X 1J1, Canada.
This certificate applies to the technical report titled “Fekola Gold Mine, Mali, NI 43-101 Technical Report”, that has an effective date of 26 March, 2019 (the “technical report”).
I am a member of the Association of Professional Engineers and Geoscientists of British Columbia, and of the Association of Professional Engineers, Geologists and Geophysicists of Alberta. I graduated from the University of Ottawa with a Bachelor of Science (Honours) degree in Geological Sciences in 1980.
I have practiced my profession for 39 years. In this time I have been directly involved in generating and managing exploration activities, and in the collection, supervision and review of geological, mineralization, exploration and drilling data; geological models; sampling, sample preparation, assaying and other resource-estimation related analyses; assessment of quality assurance-quality control data and databases; and supervision of mineral resource estimates.
As a result of my experience and qualifications, I am a Qualified Person as defined in National Instrument 43–101 Standards of Disclosure for Mineral Projects (NI 43–101).
I visited the Fekola Gold Mine most recently from 22–24 May 2018, and 2–6 February, 2018.
I am responsible for Sections 1.1 to 1.8, 1.10, 1.11, 1.22.2, 1.24; Section 2; Section 3; Section 4; Section 5; Section 6; Section 7; Section 8; Section 9; Section 10; Section 11; Section 12; Section 14; Section 23; Section 24.3.4 as pertains to the estimate of the subset of the Mineral Resource estimate used in the 2019 PEA mine plan; Sections 25.1, 25.2, 25.3, 25.4, 25.6; Sections 26.1, 26.2.1, 26.2.2, 26.3; and Section 27 of the technical report.
I am not independent of B2Gold as independence is described by Section 1.5 of NI 43–101.
I have been involved with the Fekola Gold Mine since B2Gold acquired the project in 2014. I have co-authored the following technical reports:
• Garagan, T., Montano, P., Lytle, W., Jones, K., Hunter, S. and Morgan, D., 2015: NI 43-101 Technical Report Feasibility Study on the Fekola Gold Project in Mali: technical report prepared by B2Gold and Lycopodium Minerals Pty Ltd for B2Gold, effective date 30 June, 2015;
• Garagan, T., Lytle, W., Johnson, N., Kaye, C., Tschabrun, D., Wiid, G., and Coetzee, S., 2014: Fekola Gold Project, Mali, NI 43-101 Technical Report on Preliminary Economic Assessment: technical report prepared by B2Gold, MPR Geological Consultants Pty Ltd, Mine and Quarry Engineering Services Inc, and Epoch Resources Pty Ltd for B2Gold, effective date 3 June, 2014
I have read NI 43–101 and the sections of the technical report for which I am responsible have been prepared in compliance with that Instrument.

B2Gold Corp. 595 Burrard St #3100, Vancouver, BC V7X 1J1, Canada
Tel: +1 604-681-8371
www.b2gold.com
As of the effective date of the technical report, to the best of my knowledge, information and belief, the sections of the technical report for which I am responsible contain all scientific and technical information that is required to be disclosed to make the technical report not misleading.
Dated: 10 May, 2019.
(Signed) “Tom Garagan” Tom Garagan, P.Geo.
B2Gold Corp. 595 Burrard St #3100, Vancouver, BC V7X 1J1, Canada
Tel: +1 604-681-8371
www.b2gold.com
CERTIFICATE OF QUALIFIED PERSON
I, Peter Montano, P.E., am employed as the Project Director with B2Gold Corp. (“B2Gold”), which has its head offices at 595 Burrard St #3100, Vancouver, BC V7X 1J1, Canada.
This certificate applies to the technical report titled “Fekola Gold Mine, Mali, NI 43-101 Technical Report”, that has an effective date of 26 March, 2019 (the “technical report”).
I am a registered Professional Engineer (#42745, Colorado, USA). I graduated from the Colorado School of Mines in 2004 with a B.Sc. in engineering and a B.Sc. in economics.
I have been directly involved in the design, construction, and operation of gold projects in Nicaragua, Namibia, and Mali and have participated in and contributed to projects and studies of gold and coal projects in Venezuela, El Salvador, Australia, and The Philippines.
As a result of my experience and qualifications, I am a Qualified Person as defined in National Instrument 43–101 Standards of Disclosure for Mineral Projects (NI 43–101).
I visited the Fekola Gold Mine most recently from 8–14 April, 2019.
I am responsible for Sections 1.1, 1.2, 1.12, 1.13, 1.14, 1.16, 1.18, 1.19 (excepting process-related information), 1.20 (excepting process-related information), 1.21, 1.22.1, 1.22.3, 1.22.5, 1.22.6, 1.22.8, 1.22.9, 1.22.10, 1.23, 1.24; Section 2; Section 3; Section 15; Section 16; Section 18, Sections 19.2, 19.3, 19.4, Section 21 (excepting process-related costs); Section 22; Sections 24.1, 24.2, 24.3 (excepting the estimate of the subset of mineral resource estimate used in the 2019 PEA mine plan), 24.5, 24.6 (excepting 24.6.1), 24.8 (excepting process-related costs), 24.9, 24.10; Sections 25.1, 25.7, 25.8, 25.10, 25.12, 25.13, 25.14, 25.15, 25.16.1, 25.16.3, 25.16.5, 25.16.6, 25.16.7, 25.16.8, 25.17; Sections 26.1, 26.2.3, 26.2.4; and Section 27 of the technical report.
I am not independent of B2Gold as independence is described by Section 1.5 of NI 43–101.
I have been involved with the Fekola Gold Mine since B2Gold acquired the project in 2014. I have previously co-authored the following technical report:
• Garagan, T., Montano, P., Lytle, W., Jones, K., Hunter, S. and Morgan, D., 2015: NI 43-101 Technical Report Feasibility Study on the Fekola Gold Project in Mali: technical report prepared by B2Gold and Lycopodium Minerals Pty Ltd for B2Gold, effective date 30 June, 2015
I have read NI 43–101 and the sections of the technical report for which I am responsible have been prepared in compliance with that Instrument.

B2Gold Corp. 595 Burrard St #3100, Vancouver, BC V7X 1J1, Canada
Tel: +1 604-681-8371
www.b2gold.com
As of the effective date of the technical report, to the best of my knowledge, information and belief, the sections of the technical report for which I am responsible contain all scientific and technical information that is required to be disclosed to make the technical report not misleading.
Dated: 10 May, 2019
(Signed) “Peter Montano” Peter Montano, P.E.
B2Gold Corp. 595 Burrard St #3100, Vancouver, BC V7X 1J1, Canada
Tel: +1 604-681-8371
www.b2gold.com
CERTIFICATE OF QUALIFIED PERSON
I, Ken Jones, P.E., am employed as the Environmental, Health, Safety and Permitting Manager with B2Gold Corp. (“B2Gold”), which has its head offices at 595 Burrard St #3100, Vancouver, BC V7X 1J1, Canada.
This certificate applies to the technical report titled “Fekola Gold Mine, Mali, NI 43-101 Technical Report”, that has an effective date of 26 March, 2019 (the “technical report”).
I am a registered Professional Engineer (#42718, Colorado, USA). I graduated from the University of Iowa in 2001 with a B. Sc. in Chemical Engineering. I have practiced my profession for over 15 years. I have developed, conducted and/or directed environmental and social studies including baseline investigations; materials geochemical characterization; hydrologic, air and noise modeling; closure planning and costing; and environmental and social impact assessment for hard rock mining projects in over a dozen countries in North and South America, Africa and Asia. I have developed, implemented and maintained programs for engineering and administrative compliance regarding international environmental, health and safety regulations and best practices at gold projects in Nicaragua, Namibia, the Philippines and Mali.
As a result of my experience and qualifications, I am a Qualified Person as defined in National Instrument 43–101 Standards of Disclosure for Mineral Projects (NI 43–101).
I visited the Fekola Gold Mine most recently from 7–16 February and 8–20 August, 2018 and 24 February–6 March, 2019.
I am responsible for Sections 1.1, 1.2, 1.17, 1.22.7; Section 2; Section 20; Section 24.7; Sections 25.1, 25.11, 25.16.4; and Section 27 of the technical report.
I am not independent of B2Gold as independence is described by Section 1.5 of NI 43–101.
I have been involved with the Fekola Gold Mine since B2Gold acquired the project in 2014. I have co-authored the following technical report:
• Garagan, T., Montano, P., Lytle, W., Jones, K., Hunter, S. and Morgan, D., 2015: NI 43-101 Technical Report Feasibility Study on the Fekola Gold Project in Mali: technical report prepared by B2Gold and Lycopodium Minerals Pty Ltd for B2Gold, effective date 30 June, 2015;
I have read NI 43–101 and the sections of the technical report for which I am responsible have been prepared in compliance with that Instrument.
As of the effective date of the technical report, to the best of my knowledge, information and belief, the sections of the technical report for which I am responsible contain all scientific and technical information that is required to be disclosed to make the technical report not misleading.
Dated: 10 May, 2019
(Signed) “Ken Jones”
Ken Jones, P.E.

B2Gold Corp. 595 Burrard St #3100, Vancouver, BC V7X 1J1, Canada
Tel: +1 604-681-8371
www.b2gold.com
CERTIFICATE OF QUALIFIED PERSON
I, John Rajala, P.E., am employed as the Vice President, Metallurgy with B2Gold Corp. (“B2Gold”), which has its head offices at 595 Burrard St #3100, Vancouver, BC V7X 1J1, Canada.
This certificate applies to the technical report titled “Fekola Gold Mine, Mali, NI 43-101 Technical Report”, that has an effective date of 26 March, 2019 (the “technical report”).
I am a registered professional engineer in the state of Washington (No. 43299) and have a B.S. and M.S in metallurgical engineering from Michigan Technological University (1976) and the University of Nevada – Mackay School of Mines (1981), respectively.
I have practiced my profession for 41 years, during which I have been directly involved in the operations and management of mineral processing plants for gold and base metals, and in process plant design and commissioning of projects located in Africa, Asia, North, Central and South America.
As a result of my experience and qualifications, I am a Qualified Person as defined in National Instrument 43–101 Standards of Disclosure for Mineral Projects (“NI 43–101”).
I visited the Fekola Gold Mine most recently from February 27 to March 6, 2019.
I am responsible for Sections 1.1, 1.2, 1.9, 1.15, 1.18, 1.19, 1.20, 1.22.4, 1.22.8, 1.22.9; Section 2; Section 13; Section 17; Section 19.1; Sections 21.2.1 to 21.2.3, 21.2.5, 21.2.8, 21.3.1, 21.3.3, 21.3.6; Sections 24.4, 24.6.1, 24.8 (process-related costs only); Sections 25.1, 25.5, 25.9, 25.16.2, 25.16.6, 25.16.7, and Section 27 of the technical report.
I am not independent of B2Gold as independence is described by Section 1.5 of NI 43–101.
I have been involved with the Fekola Gold Mine since B2Gold acquired the project in 2014. I was responsible for the metallurgical test work, flowsheet development and engineering/design and start-up/commissioning of the Fekola process plant.
I have read NI 43–101 and the sections of the technical report for which I am responsible have been prepared in compliance with that Instrument.
As of the effective date of the technical report, to the best of my knowledge, information and belief, the sections of the technical report for which I am responsible contain all scientific and technical information that is required to be disclosed to make the technical report not misleading.
Dated: 10 May 2019
(Signed) “John Rajala” John Rajala, P.E. TBA 2019
CAUTIONARY NOTE REGARDING FORWARD-LOOKING INFORMATION
This NI 43-101 Technical Report (the “Technical Report”) contains “forward-looking information” and “forward-looking statements” (collectively “forward-looking statements”) within the meaning of applicable Canadian and United States securities legislation, including, without limitation: projections; forecasts; estimates; schedules; plans; designs; and other statements regarding future or estimated financial and operational performance events, gold production and sales, revenues and cash flows, capital and operating costs and budgets; estimated ore grades, throughput and processing; statements regarding anticipated exploration, drilling, development, construction, permitting; and including, without limitation: the objectives, strategies, intentions, expectations, production, cost, capital and exploration expenditure guidance, recovery estimates, and the estimated economics of the Fekola Mine and the potential for expansion thereat; the results of the 2019 Fekola PEA, including the production and life of mine estimates, the capital cost and operating cost estimates, the financial projections, estimates and results, and other results of the economic analyses contained therein; processing facilities and events that may affect B2Gold’s operations, including projected power requirements and other project infrastructure, equipment and materials requirements; anticipated cash flows from the Fekola Mine and related liquidity requirements; the anticipated effect of external factors on revenue and/or mining activities, such as commodity prices and metal price assumptions, estimation of Mineral Reserves and Mineral Resources, mine life projections, reclamation costs, economic outlook, government regulation of mining operations and the entering into of major contracts required for development and/or operations; potential environmental, physical, social and economic impacts and plans, measures, and requirements to address such impacts; and other expectations regarding community relations and social licence to operate. All statements in this Technical Report that address events or developments that B2Gold expects to occur in the future are forward-looking statements. Forward-looking statements are statements that are not historical facts and are generally, although not always, identified by words such as “expect”, “plan”, “anticipate”, “project”, “target”, “potential”, “schedule”, “forecast”, “budget”, “estimate”, “intend” or “believe” and similar expressions or their negative connotations, or that events or conditions “will”, “would”, “may”, “could”, “should” or “might” occur. All such forward-looking statements are based on the opinions and estimates of B2Gold’s management as of the date such statements are made. All of the forward-looking statements in this Technical Report are qualified by this cautionary note. Forward-looking statements are not, and cannot be, a guarantee of future results or events. Forward-looking statements are based on, among other things, opinions, assumptions, estimates and analyses that, while considered reasonable at the date the forward-looking statements is provided, inherently are subject to significant risks, uncertainties, contingencies and other factors that may cause actual results and events to be materially different from those expressed or implied by the forward-looking statements. The material factors or assumptions that B2Gold identified and were applied by B2Gold in drawing conclusions or making forecasts or projections set out in the forward-looking statements include, but are not limited to: the factors identified in Sections 1.10, 1.11, 14 and 25 (and the tables identified thereunder) of this Technical Report, which may affect the Mineral Resource estimate; the forward-looking statements and factors identified in Sections 1.12, 1.13, 15 and 25 (and the tables identified thereunder) of this Technical Report which may affect the Mineral Reserve estimate; the metallurgical recovery assumptions identified in Section 13 of this Technical Report; the assumptions identified in Table 14-3 of this Technical Report as being used in evaluating prospects for eventual economic extraction; the assumptions identified in Section 15.5 of this Technical Report as forming the basis for converting Mineral Resources to Mineral Reserves, as well as the assumptions identified in Section 16; the assumptions relating to the production schedule in Section 16.8, including Table 16-2; the design and equipment assumptions identified in Table 17-1, Figure 17-1 and Sections 17.2 and 17.3 of this Technical Report; the assumptions related to the 2019 Fekola PEA identified in Sections 1.22, 24 and 25, including Table 1-9, Section 1.22.3, Section 1.22.6, Section 1.22.10, Table 24-3, Section 24.3.6, Section 24.3.7, Section 23.3.8, Section 24.4.3, Table 24-5, Section 24.6.1, Section 24.6.2, Section 24.7.2, Section 24.9.1, Section 24.9.2, Section 24.9.3 Section 25.16.4 and Section 25.16.5; the general assumptions identified in Sections 1.14, 1.16, 1.19, 1.20, 16, 21 and 25 of this Technical Report, as well as the tables included therein; dilution and mining recovery assumptions; assumptions regarding
stockpiles; the success of mining, processing, exploration and development activities; the accuracy of geological, mining and metallurgical estimates; anticipated metals prices and the costs of production; no significant unanticipated operational or technical difficulties; the execution of B2Gold’s business and growth strategies, including the success of B2Gold’s strategic investments and initiatives; the availability of additional financing, if needed; the availability of personnel for exploration, development, and operational projects and ongoing employee relations; maintaining good relations with the communities surrounding the Fekola Mine; no significant unanticipated events or changes relating to regulatory, environmental, health and safety matters; no contests over title to B2Gold’s properties; no significant unanticipated litigation; certain tax matters; and no significant and continuing adverse changes in general economic conditions or conditions in the financial markets (including commodity prices and foreign exchange rates). The risks, uncertainties, contingencies and other factors that may cause actual results to differ materially from those expressed or implied by the forward-looking statements may include, but are not limited to, risks generally associated with the mining industry, such as economic factors (including future commodity prices, currency fluctuations, energy prices and general cost escalation), uncertainties related to the continued development and operation of the Fekola Mine, dependence on key personnel and employee relations; risks related to political or social unrest or change; operational risks and hazards, including unanticipated environmental, industrial and geological events and developments and the inability to insure against all risks; failure of plant, equipment, processes, transportation and other infrastructure to operate as anticipated; compliance with government and environmental regulations, including permitting requirements and anti-bribery legislation; depletion of Mineral Reserves; volatile financial markets that may affect B2Gold’s ability to obtain additional financing on acceptable terms; the failure to obtain required approvals or clearances from government authorities on a timely basis; uncertainties related to the geology, continuity, grade and estimates of Mineral Reserves and Mineral Resources, and the potential for variations in grade and recovery rates; uncertain costs of reclamation activities, and the final outcome thereof; tax refunds; hedging transactions; as well as other factors identified and as described in more detail under the heading “Risk Factors” in B2Gold’s most recent Annual Information Form and B2Gold’s other filings with Canadian securities regulators and the U.S. Securities and Exchange Commission, which may be viewed at www.sedar.com and www.sec.gov, respectively. The list is not exhaustive of the factors that may affect B2Gold’s forward-looking statements. There can be no assurance that such statements will prove to be accurate, and actual results, performance or achievements could differ materially from those expressed in, or implied by, these forward-looking statements. Accordingly, no assurance can be given that any events anticipated by the forward-looking statements will transpire or occur, or if any of them do, what benefits or liabilities B2Gold will derive therefrom. B2Gold’s forward looking statements reflect current expectations regarding future events and operating performance and speak only as of the date hereof and B2Gold does not assume any obligation to update forward-looking statements if circumstances or management's beliefs, expectations or opinions should change other than as required by applicable law. For the reasons set forth above, undue reliance should not be placed on forward-looking statements.
Fekola Gold Mine Mali
NI 43-101 Technical Report
May 2019 TOC i
C O N T E N T S
1.0 SUMMARY ............................................................................................................... 1-1 1.1 Introduction ................................................................................................... 1-1 1.2 Terms of Reference ...................................................................................... 1-1 1.3 Project Setting .............................................................................................. 1-1 1.4 Mineral Tenure, Surface Rights, Water Rights, Royalties and Agreements . 1-2 1.5 Geology and Mineralization .......................................................................... 1-3 1.6 History .......................................................................................................... 1-4 1.7 Drilling and Sampling .................................................................................... 1-5 1.8 Data Verification ........................................................................................... 1-7 1.9 Metallurgical Testwork .................................................................................. 1-7 1.10 Mineral Resource Estimation ........................................................................ 1-9
1.10.1 Fekola ............................................................................................... 1-9 1.10.2 Anaconda ........................................................................................ 1-10
1.11 Mineral Resource Statement ...................................................................... 1-11 1.12 Mineral Reserve Estimation ........................................................................ 1-13 1.13 Mineral Reserve Statement ........................................................................ 1-13 1.14 Mining Methods .......................................................................................... 1-15 1.15 Recovery Methods ...................................................................................... 1-16 1.16 Project Infrastructure .................................................................................. 1-17 1.17 Environmental, Permitting and Social Considerations ................................ 1-17
1.17.1 Environmental Considerations ........................................................ 1-18 1.17.2 Closure and Reclamation Planning ................................................ 1-18 1.17.3 Permitting Considerations ............................................................... 1-19 1.17.4 Social Considerations ..................................................................... 1-19
1.18 Markets and Contracts ............................................................................... 1-19 1.19 Capital Cost Estimates ............................................................................... 1-20 1.20 Operating Cost Estimates ........................................................................... 1-20 1.21 Economic Analysis ..................................................................................... 1-20 1.22 2019 Preliminary Economic Assessment ................................................... 1-21
1.22.1 2019 PEA Introduction .................................................................... 1-21 1.22.2 Mineral Resource Subset within the 2019 PEA Mine Plan ............. 1-21 1.22.3 2019 PEA Mine Plan ....................................................................... 1-23 1.22.4 2019 PEA Recovery Methods ......................................................... 1-24 1.22.5 2019 PEA Project Infrastructure ..................................................... 1-24 1.22.6 2019 PEA Market Studies and Contracts ....................................... 1-25 1.22.7 2019 PEA Environmental, Permitting and Social Considerations ... 1-25 1.22.8 2019 PEA Capital Costs ................................................................. 1-27
Fekola Gold Mine Mali
NI 43-101 Technical Report
May 2019 TOC ii
1.22.9 2019 PEA Operating Costs ............................................................. 1-28 1.22.10 2019 PEA Economic Analysis ..................................................... 1-28
1.23 Interpretation and Conclusions ................................................................... 1-31 1.24 Recommendations ...................................................................................... 1-31
2.0 INTRODUCTION ...................................................................................................... 2-1 2.1 Introduction ................................................................................................... 2-1 2.2 Terms of Reference ...................................................................................... 2-1 2.3 Qualified Persons ......................................................................................... 2-3 2.4 Site Visits and Scope of Personal Inspection ............................................... 2-3 2.5 Effective Dates ............................................................................................. 2-3 2.6 Information Sources and References ........................................................... 2-4 2.7 Previous Technical Reports .......................................................................... 2-4
3.0 RELIANCE ON OTHER EXPERTS .......................................................................... 3-1
4.0 PROPERTY DESCRIPTION AND LOCATION ........................................................ 4-1 4.1 Introduction ................................................................................................... 4-1 4.2 Property and Title in Mali .............................................................................. 4-1
4.2.1 Mineral Title ...................................................................................... 4-1 4.2.2 State Participation ............................................................................. 4-3 4.2.3 Surface Rights .................................................................................. 4-3 4.2.4 Environmental ................................................................................... 4-4 4.2.5 Water ................................................................................................ 4-4 4.2.6 Taxation ............................................................................................ 4-4 4.2.7 Royalties ........................................................................................... 4-5 4.2.8 Fraser Institute Survey ...................................................................... 4-5
4.3 Project Ownership ........................................................................................ 4-6 4.4 Agreements .................................................................................................. 4-6 4.5 Establishment Convention ............................................................................ 4-7 4.6 Mineral Tenure ............................................................................................. 4-7 4.7 Surface Rights .............................................................................................. 4-9 4.8 Water Rights ................................................................................................. 4-9 4.9 Royalties and Encumbrances ..................................................................... 4-10 4.10 No-Go Zone ................................................................................................ 4-10 4.11 Permitting Considerations .......................................................................... 4-10 4.12 Environmental Considerations .................................................................... 4-10 4.13 Social License Considerations ................................................................... 4-10 4.14 Comments on Property Description and Location ...................................... 4-10
5.0 ACCESSIBILITY, CLIMATE, LOCAL RESOURCES, INFRASTRUCTURE, AND PHYSIOGRAPHY ..................................................................................................... 5-1 5.1 Accessibility .................................................................................................. 5-1
Fekola Gold Mine Mali
NI 43-101 Technical Report
May 2019 TOC iii
5.2 Climate ......................................................................................................... 5-1 5.3 Local Resources and Infrastructure .............................................................. 5-1 5.4 Physiography ................................................................................................ 5-1 5.5 Comments on Sufficiency of Surface Rights ................................................ 5-2
6.0 HISTORY ................................................................................................................. 6-1 6.1 Exploration History ....................................................................................... 6-1 6.2 Production .................................................................................................... 6-1
7.0 GEOLOGICAL SETTING AND MINERALIZATION ................................................. 7-1 7.1 Regional Geology ......................................................................................... 7-1 7.2 Project Geology ............................................................................................ 7-3
7.2.1 Lithologies ......................................................................................... 7-3 7.2.2 Weathering ....................................................................................... 7-3 7.2.3 Alteration ........................................................................................... 7-3 7.2.4 Structure ........................................................................................... 7-6
7.3 Fekola ........................................................................................................... 7-6 7.4 Anaconda ..................................................................................................... 7-7 7.5 Prospects/Exploration Targets ..................................................................... 7-7 7.6 Comments on Geological Setting and Mineralization ................................... 7-7
8.0 DEPOSIT TYPES ..................................................................................................... 8-1 8.1 Deposit Model ............................................................................................... 8-1 8.2 Comments on Deposit Types ....................................................................... 8-2
9.0 EXPLORATION ........................................................................................................ 9-1 9.1 Introduction ................................................................................................... 9-1 9.2 Grids and Surveys ........................................................................................ 9-1 9.3 Geological Mapping ...................................................................................... 9-1 9.4 Geochemistry ............................................................................................... 9-1 9.5 Geophysics ................................................................................................... 9-2 9.6 Pits and Trenches ......................................................................................... 9-2 9.7 Petrology, Mineralogy, and Research Studies ............................................. 9-8 9.8 Exploration Potential ..................................................................................... 9-8 9.9 Comments on Exploration ............................................................................ 9-9
10.0 DRILLING ............................................................................................................... 10-1 10.1 Introduction ................................................................................................. 10-1 10.2 Legacy Drilling ............................................................................................ 10-1 10.3 Drill Methods ............................................................................................... 10-6
10.3.1 Contractors ..................................................................................... 10-6 10.3.2 Auger, Rotary Air Blast and Aircore ................................................ 10-6 10.3.3 Reverse Circulation ........................................................................ 10-6
Fekola Gold Mine Mali
NI 43-101 Technical Report
May 2019 TOC iv
10.3.4 Core Drilling .................................................................................... 10-6 10.4 Logging Procedures ................................................................................... 10-7 10.5 Recovery .................................................................................................... 10-8 10.6 Collar Surveys ............................................................................................ 10-8 10.7 Downhole Surveys ...................................................................................... 10-8 10.8 Condemnation, Geotechnical and Hydrological Drilling ............................. 10-9 10.9 Metallurgical Drilling ................................................................................... 10-9 10.10 Grade Control ........................................................................................... 10-12 10.11 Sample Length/True Thickness ................................................................ 10-12 10.12 Drilling since Fekola Database Close-out Date ........................................ 10-12 10.13 Comments on Drilling ............................................................................... 10-13
11.0 SAMPLE PREPARATION, ANALYSES, AND SECURITY .................................... 11-1 11.1 Legacy Programs ....................................................................................... 11-1 11.2 Sampling Methods ...................................................................................... 11-1
11.2.1 RC and Aircore ............................................................................... 11-1 11.2.2 Core ................................................................................................ 11-2
11.3 Metallurgical Samples ................................................................................ 11-2 11.4 Density Determinations .............................................................................. 11-3 11.5 Analytical and Test Laboratories ................................................................ 11-3 11.6 Sample Preparation and Analysis .............................................................. 11-4 11.7 Quality Assurance and Quality Control ....................................................... 11-4
11.7.1 Standards ....................................................................................... 11-5 11.7.2 Blanks ............................................................................................. 11-5 11.7.3 Duplicate Samples .......................................................................... 11-5 11.7.4 Magnetic Susceptibility ................................................................... 11-6 11.7.5 Density ............................................................................................ 11-6
11.8 Databases .................................................................................................. 11-7 11.9 Sample Security ......................................................................................... 11-8 11.10 Comments on Sample Preparation, Analyses and Security ....................... 11-8
12.0 DATA VERIFICATION ............................................................................................ 12-1 12.1 Data Checks ............................................................................................... 12-1
12.1.1 Data Entry ....................................................................................... 12-1 12.1.2 QA/QC ............................................................................................ 12-1 12.1.3 Results ............................................................................................ 12-3
12.2 Laboratory Inspections ............................................................................... 12-3 12.3 Geological Model Checks ........................................................................... 12-3 12.4 October 2018 Fekola Mineral Resource Estimate Data Support ................ 12-3
12.4.1 Field Duplicates .............................................................................. 12-3 12.4.2 Blanks ............................................................................................. 12-4
Fekola Gold Mine Mali
NI 43-101 Technical Report
May 2019 TOC v
12.4.3 Standards (CRMs) .......................................................................... 12-4 12.5 QP Verification ............................................................................................ 12-4 12.6 Comments on Data Verification .................................................................. 12-5
13.0 MINERAL PROCESSING AND METALLURGICAL TESTING .............................. 13-1 13.1 Introduction ................................................................................................. 13-1 13.2 Metallurgical Testwork ................................................................................ 13-1
13.2.1 Fekola ............................................................................................. 13-1 13.2.2 Fekola North Extension .................................................................. 13-5 13.2.3 Anaconda ........................................................................................ 13-6
13.3 Recovery Estimates .................................................................................... 13-8 13.3.1 Fekola ............................................................................................. 13-8 13.3.2 Fekola North Extension .................................................................. 13-9 13.3.3 Anaconda ...................................................................................... 13-10
13.4 Metallurgical Variability ............................................................................. 13-10 13.5 Deleterious Elements ............................................................................... 13-10 13.6 Comments on Mineral Processing and Metallurgical Testing ................... 13-10
14.0 MINERAL RESOURCE ESTIMATES ..................................................................... 14-1 14.1 Fekola ......................................................................................................... 14-1
14.1.1 Introduction ..................................................................................... 14-1 14.1.2 Exploratory Data Analysis ............................................................... 14-1 14.1.3 Geological Models .......................................................................... 14-1 14.1.4 Density Assignment ........................................................................ 14-4 14.1.5 Grade Capping/Outlier Restrictions ................................................ 14-4 14.1.6 Composites ..................................................................................... 14-4 14.1.7 Variography .................................................................................... 14-5 14.1.8 Estimation/Interpolation Methods ................................................... 14-5 14.1.9 Block Model Validation ................................................................... 14-6 14.1.10 Classification of Mineral Resources ............................................ 14-7 14.1.11 Reasonable Prospects of Eventual Economic Extraction ........... 14-7
14.2 Anaconda ................................................................................................... 14-8 14.2.1 Introduction ..................................................................................... 14-8 14.2.2 Geological Models .......................................................................... 14-8 14.2.3 Density Assignment ........................................................................ 14-8 14.2.4 Grade Capping/Outlier Restrictions ................................................ 14-8 14.2.5 Estimation/Interpolation Methods ................................................... 14-9 14.2.6 Block Model Validation ................................................................... 14-9 14.2.7 Classification of Mineral Resources ................................................ 14-9 14.2.8 Reasonable Prospects of Eventual Economic Extraction ............... 14-9
14.3 Mineral Resource Statement ...................................................................... 14-9
Fekola Gold Mine Mali
NI 43-101 Technical Report
May 2019 TOC vi
14.4 Factors That May Affect the Mineral Resource Estimate ......................... 14-12 14.5 Comments on Mineral Resources ............................................................ 14-12
15.0 MINERAL RESERVE ESTIMATES ........................................................................ 15-1 15.1 Introduction ................................................................................................. 15-1 15.2 Mineral Reserves Statement ...................................................................... 15-1 15.3 Factors that May Affect the Mineral Reserves ............................................ 15-1 15.4 Block Model Review ................................................................................... 15-2 15.5 Pit Optimization .......................................................................................... 15-2
15.5.1 Base Mining Cost Estimate ............................................................. 15-4 15.5.2 Processing Costs ............................................................................ 15-4 15.5.3 Gold Price, Royalty and Discounting .............................................. 15-4 15.5.4 Process Recovery and Cut-Off Grades .......................................... 15-5
15.6 Comments on Mineral Reserves ................................................................ 15-5
16.0 MINING METHODS ............................................................................................... 16-1 16.1 Overview ..................................................................................................... 16-1 16.2 Geotechnical Considerations ...................................................................... 16-1 16.3 Hydrogeological Considerations ................................................................. 16-2 16.4 Open Pit Design ......................................................................................... 16-2 16.5 Road and Ramp Design Criteria ................................................................. 16-6 16.6 Waste Storage Facility Design Criteria ....................................................... 16-6 16.7 Operational Cut-off Grades ........................................................................ 16-6 16.8 Production Schedule .................................................................................. 16-7 16.9 Blasting and Explosives ............................................................................ 16-10 16.10 Grade Control ........................................................................................... 16-11 16.11 Mining Equipment ..................................................................................... 16-11 16.12 Personnel ................................................................................................. 16-11 16.13 Comments on Mining Methods ................................................................. 16-11
17.0 RECOVERY METHODS ........................................................................................ 17-1 17.1 Introduction ................................................................................................. 17-1 17.2 Process Flowsheet ..................................................................................... 17-1 17.3 Plant Design ............................................................................................... 17-3
17.3.1 Ore Receiving and Crushing ........................................................... 17-5 17.3.2 Crushed Ore Stockpile .................................................................... 17-5 17.3.3 Grinding and Classification ............................................................. 17-5 17.3.4 Pebble Crushing ............................................................................. 17-6 17.3.5 Leach Thickening ............................................................................ 17-6 17.3.6 Carbon in Columns Circuit .............................................................. 17-7 17.3.7 Leach Circuit ................................................................................... 17-7 17.3.8 Carbon in Pulp Circuit ..................................................................... 17-7
Fekola Gold Mine Mali
NI 43-101 Technical Report
May 2019 TOC vii
17.3.9 Acid Wash, Elution, Electrowinning and Gold Room ...................... 17-8 17.3.10 Carbon Regeneration .................................................................. 17-8 17.3.11 Cyanide Destruction .................................................................... 17-8 17.3.12 Tailings Thickening and Disposal ............................................... 17-8
17.4 Plant Control System .................................................................................. 17-9 17.5 Energy, Water, and Process Materials Requirements ................................ 17-9
17.5.1 Power .............................................................................................. 17-9 17.5.2 Water .............................................................................................. 17-9 17.5.3 Process Materials ........................................................................... 17-9
17.6 Comments on Recovery Methods ............................................................ 17-10
18.0 PROJECT INFRASTRUCTURE ............................................................................. 18-1 18.1 Introduction ................................................................................................. 18-1 18.2 Road and Logistics ..................................................................................... 18-1 18.3 Stockpiles ................................................................................................... 18-3 18.4 Waste Storage Facilities ............................................................................. 18-3 18.5 Tailings Storage Facilities ........................................................................... 18-3
18.5.1 Overview ......................................................................................... 18-3 18.5.2 Design Considerations .................................................................... 18-3
18.6 Water Management .................................................................................... 18-5 18.7 Camps and Accommodation ...................................................................... 18-5 18.8 Power and Electrical ................................................................................... 18-7 18.9 Fuel ............................................................................................................. 18-7 18.10 Water Supply .............................................................................................. 18-7 18.11 Comments on Infrastructure ....................................................................... 18-7
19.0 MARKET STUDIES AND CONTRACTS ................................................................ 19-1 19.1 Market Studies ............................................................................................ 19-1 19.2 Commodity Price Projections ..................................................................... 19-1 19.3 Contracts .................................................................................................... 19-1 19.4 Comments on Market Studies and Contracts ............................................. 19-1
20.0 ENVIRONMENTAL STUDIES, PERMITTING, AND SOCIAL OR COMMUNITY IMPACT .................................................................................................................. 20-2 20.1 Introduction ................................................................................................. 20-2 20.2 Environmental Impact Assessment Process .............................................. 20-2 20.3 Summary of Environmental and Social Setting .......................................... 20-3
20.3.1 Physical Setting .............................................................................. 20-3 20.3.2 Biological Setting ............................................................................ 20-7 20.3.3 Social Setting .................................................................................. 20-9
20.4 Summary of Key Environmental and Social Potential Impacts ................. 20-12 20.4.1 Air Quality ..................................................................................... 20-13
Fekola Gold Mine Mali
NI 43-101 Technical Report
May 2019 TOC viii
20.4.2 Hydrology, Hydrogeology and Water Quality ................................ 20-14 20.4.3 Biodiversity ................................................................................... 20-17 20.4.4 Access to Land Resources ........................................................... 20-19 20.4.5 Social Services/Infrastructure ....................................................... 20-21
20.5 Environmental and Social Management and Monitoring Plans ................ 20-23 20.5.1 Environmental Monitoring Plan ..................................................... 20-23 20.5.2 Water Management Plan .............................................................. 20-24 20.5.3 Waste Management Plan ............................................................. 20-24 20.5.4 Rehabilitation and Preliminary Mine Closure Plan ........................ 20-24 20.5.5 Emergency Preparedness and Response Plan ............................ 20-25 20.5.6 Biodiversity Action Plan ................................................................ 20-25 20.5.7 Stakeholder Engagement Plan ..................................................... 20-25 20.5.8 Community Development Plan ..................................................... 20-26
20.6 Closure Plan ............................................................................................. 20-26 20.7 Permitting ................................................................................................. 20-27
20.7.1 Environmental Permit ................................................................... 20-27 20.7.2 Environmental Permit for Access Road ........................................ 20-28 20.7.3 Mining Permit ................................................................................ 20-29 20.7.4 Approval of Community Development Plan .................................. 20-29 20.7.5 Approval of Mine Closure Plan ..................................................... 20-29 20.7.6 Additional Permits and Authorizations .......................................... 20-29
21.0 CAPITAL AND OPERATING COSTS .................................................................... 21-1 21.1 Introduction ................................................................................................. 21-1 21.2 Capital Cost Estimates ............................................................................... 21-1
21.2.1 Basis of Estimate ............................................................................ 21-1 21.2.2 Labour Assumptions ....................................................................... 21-1 21.2.3 Contingency .................................................................................... 21-1 21.2.4 Mine Capital Costs .......................................................................... 21-1 21.2.5 Process Capital Costs .................................................................... 21-2 21.2.6 General and Administrative Capital Costs ...................................... 21-2 21.2.7 Closure Costs ................................................................................. 21-2 21.2.8 Capital Cost Summary .................................................................... 21-2
21.3 Operating Cost Estimates ........................................................................... 21-2 21.3.1 Basis of Estimate ............................................................................ 21-2 21.3.2 Mine Operating Costs ..................................................................... 21-2 21.3.3 Process Operating Costs ................................................................ 21-3 21.3.4 Infrastructure Operating Costs ........................................................ 21-3 21.3.5 General and Administrative Operating Costs ................................. 21-4 21.3.6 Operating Cost Summary ............................................................... 21-4
21.4 Comments on Capital and Operating Costs ............................................... 21-4
Fekola Gold Mine Mali
NI 43-101 Technical Report
May 2019 TOC ix
22.0 ECONOMIC ANALYSIS ......................................................................................... 22-1
23.0 ADJACENT PROPERTIES .................................................................................... 23-1
24.0 OTHER RELEVANT DATA AND INFORMATION ................................................. 24-1 24.1 2019 PEA Introduction ................................................................................ 24-1 24.2 Mineral Reserve Estimates ......................................................................... 24-1 24.3 2019 PEA Mining Methods ......................................................................... 24-1
24.3.1 Overview ......................................................................................... 24-1 24.3.2 Geotechnical Considerations .......................................................... 24-2 24.3.3 Hydrogeological Considerations ..................................................... 24-4 24.3.4 Open Pit Design .............................................................................. 24-4 24.3.5 Road and Ramp Design Criteria ..................................................... 24-8 24.3.6 Waste Rock Storage Facility Design Criteria .................................. 24-8 24.3.7 Operational Cut-off Grades ............................................................. 24-9 24.3.8 Production Schedule ....................................................................... 24-9 24.3.9 Blasting and Explosives ................................................................ 24-12 24.3.10 Grade Control ........................................................................... 24-13 24.3.11 Mining Equipment ..................................................................... 24-13
24.4 2019 PEA Recovery Methods .................................................................. 24-13 24.4.1 Introduction ................................................................................... 24-13 24.4.2 Testwork Supporting Planned Expansion in 2019 PEA ................ 24-13 24.4.3 Process Flowsheet ....................................................................... 24-14 24.4.4 Plant Design ................................................................................. 24-18 24.4.5 Tailings Thickening and Disposal ................................................. 24-24 24.4.6 Plant Control System .................................................................... 24-24 24.4.7 Energy, Water, and Process Materials Requirements .................. 24-24
24.5 2019 PEA Project Infrastructure ............................................................... 24-25 24.5.1 Introduction ................................................................................... 24-25 24.5.2 Road and Logistics ....................................................................... 24-26 24.5.3 Stockpiles ..................................................................................... 24-28 24.5.4 Waste Storage Facilities ............................................................... 24-28 24.5.5 Tailings Storage Facilities ............................................................. 24-28 24.5.6 Water Management ...................................................................... 24-31 24.5.7 Camps and Accommodation ......................................................... 24-31 24.5.8 Power and Electrical ..................................................................... 24-32 24.5.9 Fuel ............................................................................................... 24-32 24.5.10 Water Supply ............................................................................ 24-32
24.6 2019 PEA Market Studies and Contracts ................................................. 24-32 24.6.1 Market Studies .............................................................................. 24-32 24.6.2 Commodity Price Projections ........................................................ 24-32
Fekola Gold Mine Mali
NI 43-101 Technical Report
May 2019 TOC x
24.6.3 Contracts ...................................................................................... 24-33 24.6.4 Comments on Market Studies and Contracts ............................... 24-33
24.7 Environmental Studies, Permitting, and Social or Community Impact ..... 24-33 24.7.1 Introduction ................................................................................... 24-33 24.7.2 Environmental Impact Assessment and Permitting Process ........ 24-33 24.7.3 Environmental and Social Setting ................................................. 24-34 24.7.4 Key Environmental and Social Potential Impacts ......................... 24-41 24.7.5 Closure ......................................................................................... 24-42 24.7.6 Permitting ...................................................................................... 24-43
24.8 2019 PEA Capital and Operating Costs ................................................... 24-46 24.8.1 Capital Costs ................................................................................ 24-46 24.8.2 Operating Costs ............................................................................ 24-49
24.9 2019 PEA Economic Analysis .................................................................. 24-50 24.9.1 Caution Statements ...................................................................... 24-50 24.9.2 Methodology Used ........................................................................ 24-51 24.9.3 Financial Model Parameters ......................................................... 24-52 24.9.4 Financial Results .......................................................................... 24-53 24.9.5 Sensitivity Analysis ....................................................................... 24-54
24.10 Comments on 2019 PEA .......................................................................... 24-54
25.0 INTERPRETATION AND CONCLUSIONS ............................................................ 25-1 25.1 Introduction ................................................................................................. 25-1 25.2 Mineral Tenure, Surface Rights, Water Rights, Royalties/Agreements ...... 25-1 25.3 Geology and Mineralization ........................................................................ 25-1 25.4 Exploration, Drilling and Analytical Data Collection in Support of Mineral
Resource Estimation .................................................................................. 25-2 25.5 Metallurgical Testwork ................................................................................ 25-2 25.6 Mineral Resource Estimates ....................................................................... 25-3 25.7 Mineral Reserve Estimates ......................................................................... 25-3 25.8 Mine Plan .................................................................................................... 25-4 25.9 Recovery Plan ............................................................................................ 25-4 25.10 Infrastructure .............................................................................................. 25-4 25.11 Environmental, Permitting and Social Considerations ................................ 25-5 25.12 Markets and Contracts ............................................................................... 25-5 25.13 Capital Cost Estimates ............................................................................... 25-6 25.14 Operating Cost Estimates ........................................................................... 25-6 25.15 Economic Analysis in Support of Mineral Reserve Estimation ................... 25-6 25.16 2019 PEA ................................................................................................... 25-6
25.16.1 2019 PEA Mine Plan ................................................................... 25-7 25.16.2 2019 PEA Recovery Plan ........................................................... 25-7 25.16.3 2019 PEA Infrastructure .............................................................. 25-7
Fekola Gold Mine Mali
NI 43-101 Technical Report
May 2019 TOC xi
25.16.4 2019 PEA Environmental, Permitting and Social Considerations . 25-8
25.16.5 2019 PEA Markets and Contracts ............................................... 25-8 25.16.6 2019 PEA Capital Cost Estimates .............................................. 25-9 25.16.7 2019 PEA Operating Cost Estimates .......................................... 25-9 25.16.8 2019 PEA Economic Analysis ..................................................... 25-9
25.17 Conclusions .............................................................................................. 25-10
26.0 RECOMMENDATIONS .......................................................................................... 26-1 26.1 Introduction ................................................................................................. 26-1 26.2 Drill Programs and Optimization Studies .................................................... 26-1
26.2.1 Fekola ............................................................................................. 26-1 26.2.2 Anaconda ........................................................................................ 26-1 26.2.3 Geotechnical Drilling ....................................................................... 26-1 26.2.4 Optimization Studies ....................................................................... 26-2
26.3 Mineral Resource Estimation ...................................................................... 26-2
27.0 REFERENCES ....................................................................................................... 27-1
T A B L E S
Table 1-1: Conceptual Pit Shell Parameters, Fekola ..................................................................... 1-11 Table 1-2: Indicated Mineral Resource Statement ......................................................................... 1-12 Table 1-3: Inferred Mineral Resource Statement ........................................................................... 1-12 Table 1-4: Pit Optimization Parameters ......................................................................................... 1-14 Table 1-5: Probable Mineral Reserves Statement ......................................................................... 1-14 Table 1-6: LOM Capital Cost Estimate ........................................................................................... 1-21 Table 1-7: LOM Operating Costs.................................................................................................... 1-21 Table 1-8: Subset of Mineral Resource Estimate Used in the 2019 PEA Mine Plan ..................... 1-22 Table 1-9: 2019 PEA Conceptual Pit Shell Mining Parameters ..................................................... 1-22 Table 1-10: 2019 PEA Capital Cost Estimate Summary .................................................................. 1-28 Table 1-11: 2019 PEA Operating Cost Estimate Summary ............................................................. 1-29 Table 1-12: 2019 PEA Financial Analysis Summary ........................................................................ 1-32 Table 1-13: Sensitivity Analysis (pre-tax NPV, $ M) ......................................................................... 1-33 Table 4-1: Mining Titles .................................................................................................................... 4-2 Table 6-1: Exploration History .......................................................................................................... 6-2 Table 6-2: Production History ........................................................................................................... 6-4 Table 7-1: Deposit Lithologies .......................................................................................................... 7-4 Table 9-1: Geochemical Sampling ................................................................................................... 9-3 Table 9-2: Geophysical Survey Programs ........................................................................................ 9-5 Table 10-1: Drill Summary Table (all drilling) ................................................................................... 10-2 Table 10-2: Drill Campaigns by Year (all drilling) ............................................................................. 10-2 Table 10-3: 2018 Fekola Resource Drilling ...................................................................................... 10-4 Table 10-4: 2017 Anaconda Resource Drilling ................................................................................. 10-4
Fekola Gold Mine Mali
NI 43-101 Technical Report
May 2019 TOC xii
Table 11-1: Assay Population by Laboratory ................................................................................... 11-4 Table 11-2: QA/QC Insertion Frequency Summary ......................................................................... 11-5 Table 13-1: Completed Metallurgical Testwork, 2015 Feasibility Study ........................................... 13-2 Table 13-2: Testwork Results Summary, 2015 Feasibility Study ..................................................... 13-3 Table 13-3: Completed Metallurgical Testwork, 2018 Fekola North Extension Program ................ 13-7 Table 13-4: Testwork Results Summary, 2018 Fekola North Extension Program ........................... 13-7 Table 14-1: Capping Levels and Metal Reduction by Mineralization Domain .................................. 14-5 Table 14-2: Gold Grade Estimation Plan .......................................................................................... 14-6 Table 14-3: Conceptual Pit Shell Parameters, Fekola ..................................................................... 14-8 Table 14-4: Anaconda Grade Estimation Plan ............................................................................... 14-10 Table 14-5: Indicated Mineral Resource Statement ....................................................................... 14-11 Table 14-6: Inferred Mineral Resource Statement ......................................................................... 14-11 Table 15-1: Mineral Reserves Statement ......................................................................................... 15-2 Table 15-2: Pit Optimization Parameters ......................................................................................... 15-5 Table 16-1: Pit Slope Design Parameters ........................................................................................ 16-4 Table 16-2: LOM Production Schedule Summary ............................................................................ 16-8 Table 16-3: Equipment Requirements ............................................................................................ 16-12 Table 17-1: Key Design Parameters ................................................................................................ 17-4 Table 20-1: Specialist Studies Commissioned as part of the 2013 ESIS ........................................ 20-4 Table 20-2: Specialist Studies Commissioned as part of the 2015 ESIA Update ............................ 20-4 Table 20-3: Specialist Studies Commissioned since the 2015 ESIA Update .................................. 20-5 Table 20-4: Summary of Key Additional Permits and Authorizations Required ............................. 20-30 Table 21-1: LOM Capital Cost Estimate ........................................................................................... 21-3 Table 21-2: Mine Operating Costs.................................................................................................... 21-3 Table 21-3: Process Operating Costs .............................................................................................. 21-4 Table 21-4: LOM Operating Costs.................................................................................................... 21-5 Table 24-1: Pit Slope Design Parameters ........................................................................................ 24-4 Table 24-2: Subset of Mineral Resource Estimate Used in the 2019 PEA Mine Plan ..................... 24-5 Table 24-3: 2019 PEA Conceptual Pit Shell Mining Parameters ..................................................... 24-6 Table 24-4: Equipment Requirements, 2019 PEA ......................................................................... 24-14 Table 24-5: Key Process Design Criteria ....................................................................................... 24-16 Table 24-6: Proposed Design Changes in 2019 PEA .................................................................... 24-19 Table 24-7: Summary of Key Additional Permits and Authorizations Required ............................. 24-47 Table 24-8: 2019 PEA Capital Cost Estimate Summary ................................................................ 24-48 Table 24-9: 2019 PEA Operating Cost Estimate Summary ........................................................... 24-50 Table 24-10:2019 PEA Financial Analysis Summary ...................................................................... 24-55 Table 24-11:Cash Flow Analysis ..................................................................................................... 24-56 Table 24-12:Sensitivity Analysis (pre-tax NPV, $ M) ....................................................................... 24-57
F I G U R E S
Figure 1-1: Sensitivity Analysis (pre-tax NPV, $ M) ......................................................................... 1-33 Figure 2-1: Location Plan ................................................................................................................... 2-2 Figure 4-1: Mineral Tenure Location Map ......................................................................................... 4-8 Figure 7-1: Regional Geology Map .................................................................................................... 7-2 Figure 7-2: Fekola Geology Map ....................................................................................................... 7-5
Fekola Gold Mine Mali
NI 43-101 Technical Report
May 2019 TOC xiii
Figure 7-3: Fekola Composite Long Section ..................................................................................... 7-8 Figure 7-4: Fekola Cross Section A-Aʹ .............................................................................................. 7-9 Figure 7-5: Fekola North Extension Cross Section B-Bʹ .................................................................. 7-10 Figure 9-1: Soil Geochemical Sampling Plan .................................................................................... 9-4 Figure 9-2: Gradient Array IP Plan .................................................................................................... 9-6 Figure 9-3: Airborne Magnetic Survey (enhanced first vertical derivative) ........................................ 9-7 Figure 10-1: Drill Collar Location Plan ............................................................................................... 10-3 Figure 10-2: Fekola Drill Collar Location Plan ................................................................................... 10-5 Figure 10-3: Geotechnical, Hydrological and Condemnation Drill Hole Location Plan ................... 10-10 Figure 10-4: Metallurgical Sample Locations Schematic Long Section .......................................... 10-11 Figure 13-1: Gold Extraction Model, Fekola ...................................................................................... 13-9 Figure 13-2: Gold Residue Grade Model, Fekola North Extension ................................................. 13-10 Figure 14-1: Cross Section Mineralization Zone Interpretation ......................................................... 14-3 Figure 15-1: Fekola Pit Design .......................................................................................................... 15-3 Figure 16-1: Pit Slope Design Sectors .............................................................................................. 16-3 Figure 16-2: Mineral Reserve Ultimate Pit Layout ............................................................................. 16-5 Figure 16-3: LOM Material Movement by Year Forecast (tonnes mined) ......................................... 16-8 Figure 16-4: LOM Process Feed Forecast (tonnes processed) ........................................................ 16-9 Figure 16-5: LOM Grade Forecast (g/t Au) ........................................................................................ 16-9 Figure 17-1: Process Flowsheet ........................................................................................................ 17-2 Figure 18-1: Infrastructure Layout Plan ............................................................................................. 18-2 Figure 18-2: Final TSF Layout Plan ................................................................................................... 18-6 Figure 20-1: Local Drainage Map of the Fekola Mine Area and Médinandi Exploitation Licence
Surrounds ...................................................................................................................... 20-6 Figure 20-2: Proximity Map of Villages in the Area Surrounding the Project .................................. 20-10 Figure 24-1: Pit Slope Design Sectors .............................................................................................. 24-3 Figure 24-2: 2019 Pit Phase Design .................................................................................................. 24-7 Figure 24-3: LOM Material Movement by Year Forecast (tonnes mined) ....................................... 24-10 Figure 24-4: LOM Process Feed Forecast (tonnes processed) ...................................................... 24-11 Figure 24-5: LOM Grade Forecast (g/t Au) ...................................................................................... 24-11 Figure 24-6: Process Flowsheet ...................................................................................................... 24-15 Figure 24-7: 2019 PEA Proposed Infrastructure Layout Plan ......................................................... 24-27 Figure 24-8: Final TSF Layout Plan ................................................................................................. 24-30 Figure 24-9: Local Drainage Map of the Fekola Mine Area and Médinandi Exploitation Licence
Surrounds .................................................................................................................... 24-35 Figure 24-10: Proximity Map of Villages in the Area Surrounding the Project ............................. 24-39 Figure 24-11: Capital Cost of Tailings Dam per Cumulative Volume .......................................... 24-48 Figure 24-12: Sensitivity Analysis (pre-tax NPV, $ M) ................................................................. 24-57
Fekola Gold Mine Mali
NI 43-101 Technical Report
May 2019 Page 1-1
1.0 SUMMARY
1.1 Introduction
Mr. Tom Garagan, P.Geo., Mr. Peter Montano, P.E., Mr. John Rajala, P.E. and Mr. Ken Jones, P.E., collectively the Qualified Persons (QPs) prepared an NI 43-101 Technical Report (the Report) on the Fekola Gold Mine (Fekola Mine) for B2Gold Corp. (B2Gold). The Fekola Mine is located west of the capital Bamako in the République de Mali (State of Mali or Mali).
1.2 Terms of Reference
The Report was prepared to support disclosures in the B2Gold news release dated 26 March, 2019, entitled “B2Gold Corp. Announces Very Positive Results from the Expansion Study Preliminary Economic Analysis for the Fekola Mine in Mali (owned 80% B2Gold: 20% State of Mali)”.
This Report provides updated information on the current operation of the Fekola Mine, including an updated Mineral Resource and Mineral Reserve estimate.
The Report also provides a summary of a preliminary economic assessment (PEA) completed in support of a potential mine expansion (the 2019 PEA). The 2019 PEA has no impact on the Mineral Reserves and the key assumptions and parameters supporting the Mineral Reserves. The Mineral Reserves are considered to remain current and valid in light of the key assumptions and parameters used in the 2019 PEA.
The term “Project” is used in reference to the overall mineral tenure holdings.
Units used in the report are metric units unless otherwise noted. Monetary units are in United States dollars (US$) unless otherwise stated. Mineral Resources and Mineral Reserves are classified using the 2014 edition of the Canadian Institute of Mining and Metallurgy (CIM) Definition Standards for Mineral Resources and Mineral Reserves (the 2014 CIM Definition Standards).
1.3 Project Setting
The Fekola Mine is located on the border between Mali and Senegal, about 210 km south of Kayes and approximately 40 km south of the city of Kéniéba. Access is either from Dakar or from Bamako by road. From Bamako, it is approximately 480 road km along the Millennium Highway from Bamako to Kéniéba and then a further 40 road km on unsealed roads to the Fekola Mine.
The main mine access is via air. B2Gold has constructed a purpose-built gravel airstrip adjacent the mine, and operates two planes with regularly-scheduled flights from Bamako to the mine site.
Fekola Gold Mine Mali
NI 43-101 Technical Report
May 2019 Page 1-2
The Project is located in a sub-tropical climate area, with relatively high and uniform temperatures and distinct seasons; wet season (July to September) and the dry season (October to June). Mining activities are conducted year-round. Exploration activities are minimal during the period from July to September, due to the rains.
The site is characterized by various laterite plateaus that rise approximately 30–40 m above the surrounding landscape. Overall Project elevation ranges from about 125–140 m above sea level. A number of drainage lines dissect the property and drain from east to west. The predominant vegetation is tropical savannah.
There is sufficient surface area for the open pit, waste rock storage facilities (WRSFs), plant, tailings storage facility (TSF), associated infrastructure and other operational requirements for the planned life-of-mine (LOM) and mine plan (LOMP) discussed in this Report.
1.4 Mineral Tenure, Surface Rights, Water Rights, Royalties and Agreements
The Project consists of three mining concessions, totalling 137 km2:
• Médinandi exploitation license: 75 km2 mining lease, granted 13 February 2014 for a 30-year period; renewable for successive 10-year periods until the mineral reserves within the license area are exhausted. The State of Mali holds a 20% interest in Fekola S.A., and B2Gold holds the remaining 80% interest;
• Menankoto Sud exploration permit: 52 km2 exploration permit, granted on 4 February 2014 and is in its second renewal period with an expiry date of 20 February, 2021. The exploration permit is held in the name of Menankoto SARL, where B2Gold holds a 95% interest and a Malian company, Societe d’Ingeneirie Informatique et Exploitation SARL (S2IEM), holds 5%;
• Bantako Nord prospecting authorization: 10 km2 prospecting authorization granted on 27 November 2018 and valid until 26 November 2021, renewable once for a three-year period. The prospecting authorization is held by Dampan Ressources, where B2Gold holds a 90% interest and a Malian company, Dioula Ressources SARL holds 10%.
All mineral titles issued after February 2012 are governed by the 2012 Mining Code and related 2012 Decrees. In August 2017, B2Gold finalized certain additional agreements with the State of Mali including the Fekola Shareholders Agreement, the Share Purchase Agreement and an amendment to the Fekola Convention to address and clarify certain issues under the 2012 Mining Code. B2Gold signed the Fekola Convention in March 2017 in the form required under the 2012 Mining Code that relates to, among other things, the ownership, permitting, reclamation bond requirements, development, operation and taxation applicable to the Fekola Mine with the State of Mali. The Fekola Convention, as amended, governs the procedural and economic parameters pursuant
Fekola Gold Mine Mali
NI 43-101 Technical Report
May 2019 Page 1-3
to which B2Gold operates the Fekola Mine. In August 2017, B2Gold finalized and signed an amendment to the Fekola Convention to address and clarify certain issues under the 2012 Mining Code. The Establishment Convention will expire when the Médinandi Exploitation License expires.
Gold and other precious metals are levied under the 2012 Mining Code at a 3% royalty rate. There is also an additional 3% tax on gold production. The settlement for the purchase on a 10% minority interest held by ZTS Traore in the Fekola project included an additional 1.65% royalty, which is due to ZTS. The ZTS royalty is only payable on production from the Médinandi exploitation license.
Malian law provides for private individuals and companies to own surface rights under a formal titling and registration system, but in the Project area there are no private surface owners. However, the State of Mali owns all surface rights in the Fekola Mine area, and no surface rights have been registered to a private entity.
Four permits were granted on 30 May 2017 by the Governor of Kayes Province relating to water abstraction, storage and discharge. There are sufficient water rights for the LOMP.
1.5 Geology and Mineralization
The Fekola deposit is an example of a disseminated orogenic gold deposit.
The Fekola Mine is hosted within an inlier of Birimian rocks of the West African craton, termed the Kédougou–Kéniéba Inlier (KKI), located on the border of eastern Senegal, western Mali and northern Guinea. The KKI is a greenstone belt characterized by sequences of approximately north–south-trending volcanic and sedimentary rocks, intruded at various stages by gabbroic suites and calc-alkaline granitoids. The major greenstone units include the Mako, Dialé–Daléma, Falémé and Kofi Series rocks. Two main crustal-scale structures; the Main Transcurrent Zone (MTZ) in the west and the Senegal-Malia shear zone system (SMSZ) in the east, bisect the KKI. The Kofi Series hosts significant gold mineralization on the eastern side of the Senegal–Mali Shear Zone and is the primary host to mineralization in the Project area.
Kofi Series lithologies consist of phyllite, thinly-bedded calcareous siltstone-mudstone, marble, mass flow deposits (conglomerate), metapelite and diorite sills cut by quartz–feldspar porphyry dykes and breccia zones. The units have been metamorphosed to greenschist facies.
Three deformation events and corresponding foliation developments control the orientation of folding, shearing and subsequent geometries of gold-bearing zones in the Project area.
Pervasive and texturally-destructive dolomite ± albite ± tourmaline alteration is spatially associated with mineralization.
Fekola Gold Mine Mali
NI 43-101 Technical Report
May 2019 Page 1-4
The Fekola deposit, including the Fekola North Extension has been outlined along strike for 3,280 m, can be as much as 200 m in width and extends based on current drilling to at least 440 m depth. Gold mineralization at Fekola is dominantly hosted within bedrock and occurs with fine-grained disseminated pyrite, commonly in association with high strain zones and fold hinges. High-grade mineralization is concentrated in a high-grade shoot (>2 g/t Au) that plunges shallowly to the north–northwest at 14°.
The Fekola deposit remains open along strike and down plunge. Work conducted in 2017–2019 identified narrow zones of hanging wall mineralization. Future exploration efforts will be designed to test for new plunging high-grade zones along strike to the north of the Fekola deposit where narrower intersections have been encountered at shallow depths, and north-plunging mineralization south of the current pit limits, occurring as stacked lodes.
Anaconda is a collective term for the Anaconda, Adder, Cobra, Cascabel, Mamba and Boomslang satellite deposits that are situated about 20 km north of the Fekola Mine. The combined Anaconda–Adder saprolite zone extends over 4,500 m along strike and up to 500 m wide at Anaconda and up to 200 m wide at Adder. Within these zones, mineralized saprolite varies from 2 to > 40 m thick, averaging 13.5 m true thickness. Saprolite hosted gold mineralization at Anaconda forms flat-lying to shallow-dipping lenses. At Anaconda, limited deeper drilling has identified zones of bedrock mineralization requiring follow up drilling. In addition, a number of geophysical anomalies, in particular untested IP chargeability features, require drill testing.
1.6 History
Exploration prior to B2Gold’s Project interest was conducted by Société Nationale de Recherches et d’Exploitation des Ressources Minières de Mali (Sonarem), Bureau de Recherches Géologiques et Minières (BRGM), the Guefest Company (Guefest), Western African Gold and Exploration S.A. (WAG), Randgold Resources Ltd. (Randgold), Colonial Resources Limited (Colonial Resources), Central African Gold plc (Central African), Songhoi Resources Sàrl (Songhoi) and Papillon Resources Limited (Papillon). Activities included geological reconnaissance, interpretation of Landsat and aeromagnetic data, regional geological and regolith mapping, ground induced polarization (IP) geophysical surveys, airborne magnetic and electromagnetic (EM) surveys, soil, rock, and termite geochemical sampling, trenching, auger, rotary air-blast (RAB), air core, reverse circulation (RC) and core drilling, mineral resource estimates, and preliminary mining studies.
B2Gold acquired Papillon in 2014, and has completed geological mapping, geochemical sampling, ground (gravimetric, IP and magnetic) and airborne geophysical surveys, Mineral Resource and Mineral Reserve estimates, a feasibility study (the 2015 feasibility study), and supporting geotechnical, hydrogeological, and environmental studies. Mine construction was completed in 2017, and the first gold was poured in October, 2017.
Fekola Gold Mine Mali
NI 43-101 Technical Report
May 2019 Page 1-5
The plant throughput was expanded from the 4 Mt/a envisaged in the 2015 feasibility study to a nameplate 5 Mt/a as constructed. In 2018, as a result of comminution studies, the throughput rate was expanded, with no plant modifications, to 5.5 Mt/a and the plant was confirmed to be able to process 6 Mt/a with no modifications to existing plant and equipment. B2Gold conducted internal mining studies using potential expansions to 7.5 Mt/a and 10 Mt/a; the 7.5 Mt/a scenario became basis for the 2019 PEA expansion scenario using the Mineral Resources estimated at Fekola.
1.7 Drilling and Sampling
Within the Project database are 2,836 auger drill holes (22,759 m), 1,166 rotary air blast (RAB) drill holes (24,064 m), 3,321 aircore drill holes (141,978 m), 2,365 reverse circulation (RC) drill holes (273,547 m), 165 holes pre-collared with RC collar and completed with a core tail (RC–core) drill holes (62,334 m), and 481 core drill holes (100,488 m). These figures include 78 RC water holes (11,913 m), 137 geotechnical holes (10,115 m) and 304 sterilization holes (17,753 m).
Core, RC–core and RC drilling supports Mineral Resource estimates at Fekola; the Anaconda estimate is supported by aircore, RC, and core drilling.
Drill holes are geologically logged for primary lithology, alteration, mineralization, oxidation boundaries, sample quality, veining, texture, fabric, presence of key minerals, grain size, pyrite form and percentage, alteration, breccia units, and structures and foliation. All core is photographed, and magnetic susceptibility readings are collected. Standard geotechnical logging on exploration and infill drill core records core recovery, fracture frequency, and rock quality designation (RQD). Core is oriented for structural data collection.
The average core recovery is 98.15% for holes completed within the Fekola deposit area. There does not appear to be a direct relationship between core recovery and gold grade.
Drill collars for exploration drill holes are normally surveyed using a hand-held global positioning system (GPS) instrument. In the mine area, drill hole collars are picked up using a digital GPS (DGPS).
Depending on ground conditions, and the purpose of the drill hole, RC holes are typically surveyed at 30–50 m intervals down hole, using a Reflex down hole surveying instrument. If the hole begins to deviate, it is surveyed at closer intervals. Surveys for core holes are performed using a Reflex downhole survey (EZ-Track) instrument, with measurements taken at 30–50 m intervals down hole.
Most of the drill holes at Fekola are drilled at -50 to -55° to the east (N90 E) which intersects the main mineralized zone at a high angle. The higher-grade mineralization strikes approximately north–south, is steeply-dipping at 70–80° to the west, and plunges
Fekola Gold Mine Mali
NI 43-101 Technical Report
May 2019 Page 1-6
shallowly to the north. In general, true thicknesses are 70–80% of the sampled length. Anaconda drilling is mostly drilled at -60º (to the east) to -90º which intersects higher grade mineralization at a high angle. In general, true thicknesses are 90–100% of the sampled length.
A total of 298 holes (25,979 m) have been drilled to 31 March 2019, after the database close out date for resource estimation. Of this total, there are 237 aircore holes (10,154 m), 29 core holes (6,741 m), 22 RC–core holes (7,681 m), and 10 RC holes (1,403 m). The aircore holes were drilled for condemnation purposes and 15 of the core holes (2,401 m) were drilled for geotechnical purposes. Of this total, 48 core/RC drill holes are within the resource model area, and 33 drill holes have lithological and assay data available. The information was compared to the existing block model. The QP is of the opinion that although the newer drilling within the resource model will change the grades locally, overall the new drilling should have a minimal effect on the average grade of the model.
In the opinion of the QP, the quantity and quality of the logged geological data, collar, and downhole survey data collected in the exploration and infill drill programs are sufficient to support Mineral Resource and Mineral Reserve estimation and mine planning.
In programs from 2012–2017, aircore and RC samples were collected at the drill rig, typically at 1 m intervals, through a conventional cyclone into plastic bags, then transported to either the Fekola or Menankoto sample yards. Core sampling is generally to 1 m intervals, but is bounded by geological considerations with a minimum sampling width of >0.2 m.
There are 16,129 density measurements available to support the Mineral Resource estimate for Fekola, and 8,970 density determinations for Anaconda. Rock density is determined by water immersion (Archimedes) methodology on whole or half core. Saprolite samples are wrapped in cling wrap.
With the exception of the Fekola Mine laboratory, the analytical laboratories used to date for the Project are independent commercial laboratories. Laboratories used include SGS Kayes, Mali (2011–2013); SGS Bamako, Mali (2013 to date); Bureau Veritas, Abidjan, Cote D’Ivoire (2017–2018); Fekola Mine laboratory (2017 to date). SGS Morila is used as an umpire laboratory. SGS Bamako holds ISO17025 accreditation. The SGS Kayes and SGS Morila laboratories operated a quality system that SGS considered to be in line with ISO17025 requirements. B2Gold was advised that the Bureau Veritas Abidjan laboratory is currently operating to the guidelines of ISO9001 and ISO17025 protocols. The Fekola Mine laboratory is not accredited.
Fekola Gold Mine Mali
NI 43-101 Technical Report
May 2019 Page 1-7
1.8 Data Verification
Data from drill logs, surface sampling logs, magnetic susceptibility meters, and density measurement logs are verified during database upload. QA/QC data are reviewed on a continuous basis as data arrives from the assay laboratories. The findings summarised and published on a monthly basis. Actions arising from the report are implemented and reviewed the following month. Examination of the QA/QC sample data indicates satisfactory performance of field sampling protocols and assay laboratories providing acceptable levels of precision and accuracy.
Prior to conducting Mineral Resource estimates, the modellers and estimators review the geological models, undertake exploratory data analysis, and perform comparisons of grade in drill holes and adjacent blocks, final block model resource with previous resource models, and final grade estimation model with different estimation techniques.
As part of site visits from 2014–2018, the QP has personally verified a portion of the data supporting the estimates, including: RC drilling and sampling procedures at the rig during drilling; core drilling at various drills and the core retrieval and handling procedures; core logging and markup procedures and protocols; core photography procedures and quality; core cutting and sampling procedures; core storage and security; SG measurement and SG QA/QC procedures; sample shipping and chain of custody procedures; data entry and data verification procedures; and accuracy of geological interpretations and grade interpretations on section and plan, and in geological models.
The QP is of the opinion that the data are considered acceptable to support Mineral Resource and Mineral Reserve estimates, and can be used for mine planning purposes.
1.9 Metallurgical Testwork
Metallurgical testwork in support of plant design was completed as part of the 2015 feasibility study on the Fekola deposit primarily by SGS Lakefield, with support from Jenike & Johanson, Metso, SGS Beckley, Dawson Metallurgical Laboratory, Process Research Ortech, and FLSmidth. Testwork comprised mineralogy, comminution, gravity concentration, grind/recovery, preg-robbing assessment, whole ore leach optimisation, whole ore cyanidation of variability samples at optimized leach conditions, bulk cyanidation, cyanide destruction, oxygen uptake, carbon modelling, slurry rheology, thickening and flocculation, and materials handling.
Overall, the testwork program indicated that:
• The Fekola deposit is classified as hard to very hard competency with above average grinding energy requirements and is moderate to highly abrasive. The mill feed material is amenable to primary crushing followed by a SAG mill and ball mill with pebble crushing (SABC);
Fekola Gold Mine Mali
NI 43-101 Technical Report
May 2019 Page 1-8
• Fekola material is predominantly 'free-milling', not 'preg robbing' and is amenable to gold extraction by conventional cyanidation;
• A gravity separation circuit was not warranted for the Fekola deposit. Instead, a carbon column adsorption circuit is included to recover dissolved gold leached in the grinding circuit to facilitate early recovery of gold, particularly during high gold head grade periods;
• The optimum leaching conditions identified are 24 hr cyanidation with 350 ppm NaCN, initial lead nitrate addition of 100 g/t, pH 10.3 to 10.5, dissolved oxygen levels of ~15 ppm and a pulp density of 45% solids (w/w). The addition of lead nitrate and dissolved oxygen levels of 15 ppm is found to be beneficial in leach kinetics and overall recovery. Lime and cyanide addition rates are moderate;
• The mill feed material typically yields good recoveries (87–97%). Testwork results show a logarithmic relationship between the measured gold head grade and resulting gold extraction under optimised leach conditions at a grind size of 74 µm;
• Based on the absence of any preg robbing characteristics and very good adsorption properties, a CIP circuit is selected for the Fekola process flowsheet;
• The cyanidation tailings respond well to cyanide destruction treatment using the SO2/air process;
• The mill feed material has a thickener specific settling rate of 0.03 m2/t/d for both the leach and tailings thickener duties.
In 2018, a similar set of testwork to that conducted for the 2015 feasibility study on the Fekola deposit was completed on selected Fekola North Extension drill core samples. The primary laboratory conducting the tests was SGS Lakefield. In general, the samples tested were classified as hard to very hard with medium to abrasive properties. Fekola North Extension mill feed material has similar comminution properties to the original Fekola results. The existing comminution circuit is suitable for the Fekola North Extension material. The response of the Fekola North Extension metallurgical variability samples to a whole ore cyanidation flowsheet using the current Fekola plant leach conditions indicated that the existing leaching circuit conditions are suitable for the Fekola North Extension area mineralization.
Metallurgical testwork on samples from the Anaconda deposit is underway, with SGS Lakefield the primary laboratory. Planned tests will include a similar testwork suite to those conducted during the 2015 feasibility study on the Fekola deposit.
Based on the metallurgical testwork, at a gold head grade of 2.50 g/t Au, the estimated gold extraction for the Fekola deposit is 93.7%. After predicting the gold residue grade for a gold head grade of 2.50 g/t Au, the estimated gold extraction is 93.6% for the
Fekola Gold Mine Mali
NI 43-101 Technical Report
May 2019 Page 1-9
Fekola North Extension material. Preliminary recovery data from the ongoing Anaconda testwork indicates a gold recovery of about 95% in the saprolite material.
No deleterious elements are known from the processing perspective.
1.10 Mineral Resource Estimation
1.10.1 Fekola
The Mineral Resource model for the Fekola deposit was updated by B2Gold in October 2018 to include new drilling completed since the previous resource model done in August 2016, provide an updated model for the 2019 PEA, and to provide a model of the deposit for future mine production. The model is a Datamine subcell model with reblocking to 5 x 10 x 5 m for Mineral Resource reporting and reblocking to 5 x 20 x 10 m for mine planning and Mineral Reserve reporting.
Models constructed include lithology, structure, pyrite, mineralization and weathering. Densities were applied to the block model by mineralization domain for fresh rock and range from 2.74–2.81 t/m3. Densities for overburden, gravels, saprolite and saprock range from 1.6–2.2 t/m3. A down-hole composite length of 2 m was chosen based on the mining method and bench/flitch height. Outlier gold grades were capped in some domains. Variograms (correlograms) were run on 2 m capped composites and modelled for each mineralization domain separately and all domains combined to evaluate spatial continuity and trends of gold mineralization.
Mineralization domain wireframes were coded to subcells (minimum 2.5 x 5 x 2.5 m) with mineralization domains serving as hard boundaries for grade estimation. Gold grades were estimated into blocks using 2 m capped composites for each domain. Simplified overall orientation zones were used to control the dynamic anisotropic search. Ordinary kriged (OK) and nearest neighbor (NN) grades were estimated into blocks, with Mineral Resources reported from the OK estimate.
The block grade estimates were validated using a combination of visual inspection, comparison of global block statistics for NN and OK models, swath plots to review potential local biases in the estimates, change of support comparisons, and comparison to grade control model results.
Resource classification was assigned based on the following:
• Measured: No blocks assigned as Measured;
• Indicated: 50 x 50 m drill spacing; block with estimated grade using a minimum of two drill holes within 50 m and a minimum of one drill hole within 27.5 m;
• Inferred: 100 x 100 m drill spacing; block with estimated grade using a minimum of two drill holes within 97.5 m and a minimum of one drill hole within 50 m.
Fekola Gold Mine Mali
NI 43-101 Technical Report
May 2019 Page 1-10
Table 1-1 shows the parameters used in the conceptual pit shell constraining the Mineral Resource estimate.
Based on these costs and assumptions, the break-even cut-off grade is 0.49 g/t Au. Mineral Resources potentially amenable to open pit mining are stated above a cut-off of 0.6 g/t Au.
1.10.2 Anaconda
The Anaconda Mineral Resource includes the Anaconda, Adder, Cobra, Cascabel, Mamba and Boomslang zones which occur as flat-lying to slightly dipping mineralized zones within saprolite and saprock.
Models constructed include regolith and mineralization. The average dry densities used for tonnage and contained metal estimates are 2.07 t/m3 for laterite, 1.44 t/m3 for saprolite and 1.90 t/m3 for saprock. Outlier gold grades were capped. Regolith (weathering intensity) and mineralization zone wireframes were coded to the block model using a minimum subcell size of 5 x 5 x 1 m.
Gold grades were estimated with OK using 2 m capped composites. ID2 and NN estimates were run as checks. Mineralization domains were used as hard boundaries for grade estimation. Dynamic anisotropic searching was used to control the directions of the search ellipses.
The block model estimates were checked against input composite data visually on screen and on paper plots. Additional checks completed include swath plots, and comparison of original and declustered composites versus kriged block model results by domain.
No Measured or Indicated Mineral Resources were classified. Inferred Mineral Resources are supported by a nominal drill hole spacing of 80 m x 80 m; however, 90% of the reported resource has been drilled to a tighter 40 m x 40 m drill spacing.
Mineral Resources are reported within a conceptual L–G pit shell assuming a gold price of US$1400/oz., gold recovery of 95%, mining cost of US$1.75/t, processing cost of US$8.10/t mill feed, general and administrative (G&A) cost of US$2.75/t mill feed, and 35º pit slope angles.
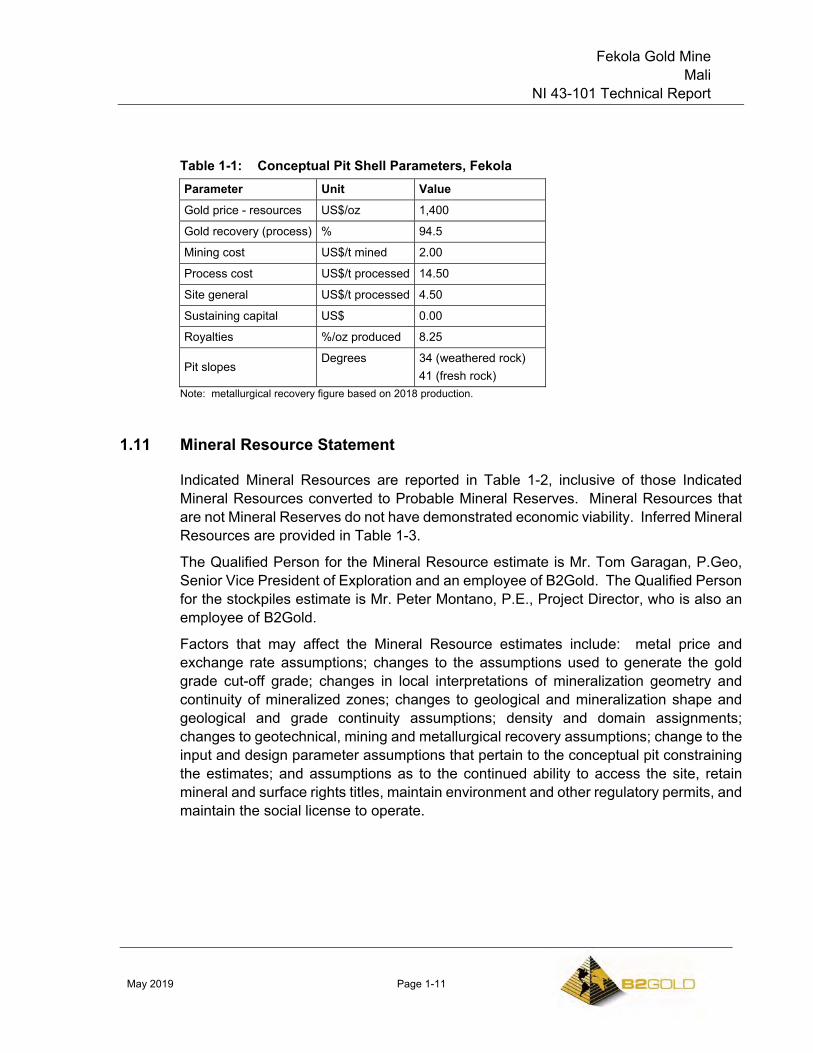
Fekola Gold Mine Mali
NI 43-101 Technical Report
May 2019 Page 1-11
Table 1-1: Conceptual Pit Shell Parameters, Fekola Parameter Unit Value Gold price - resources US$/oz 1,400
Gold recovery (process) % 94.5
Mining cost US$/t mined 2.00
Process cost US$/t processed 14.50
Site general US$/t processed 4.50
Sustaining capital US$ 0.00
Royalties %/oz produced 8.25
Pit slopes Degrees 34 (weathered rock)
41 (fresh rock) Note: metallurgical recovery figure based on 2018 production.
1.11 Mineral Resource Statement
Indicated Mineral Resources are reported in Table 1-2, inclusive of those Indicated Mineral Resources converted to Probable Mineral Reserves. Mineral Resources that are not Mineral Reserves do not have demonstrated economic viability. Inferred Mineral Resources are provided in Table 1-3.
The Qualified Person for the Mineral Resource estimate is Mr. Tom Garagan, P.Geo, Senior Vice President of Exploration and an employee of B2Gold. The Qualified Person for the stockpiles estimate is Mr. Peter Montano, P.E., Project Director, who is also an employee of B2Gold.
Factors that may affect the Mineral Resource estimates include: metal price and exchange rate assumptions; changes to the assumptions used to generate the gold grade cut-off grade; changes in local interpretations of mineralization geometry and continuity of mineralized zones; changes to geological and mineralization shape and geological and grade continuity assumptions; density and domain assignments; changes to geotechnical, mining and metallurgical recovery assumptions; change to the input and design parameter assumptions that pertain to the conceptual pit constraining the estimates; and assumptions as to the continued ability to access the site, retain mineral and surface rights titles, maintain environment and other regulatory permits, and maintain the social license to operate.
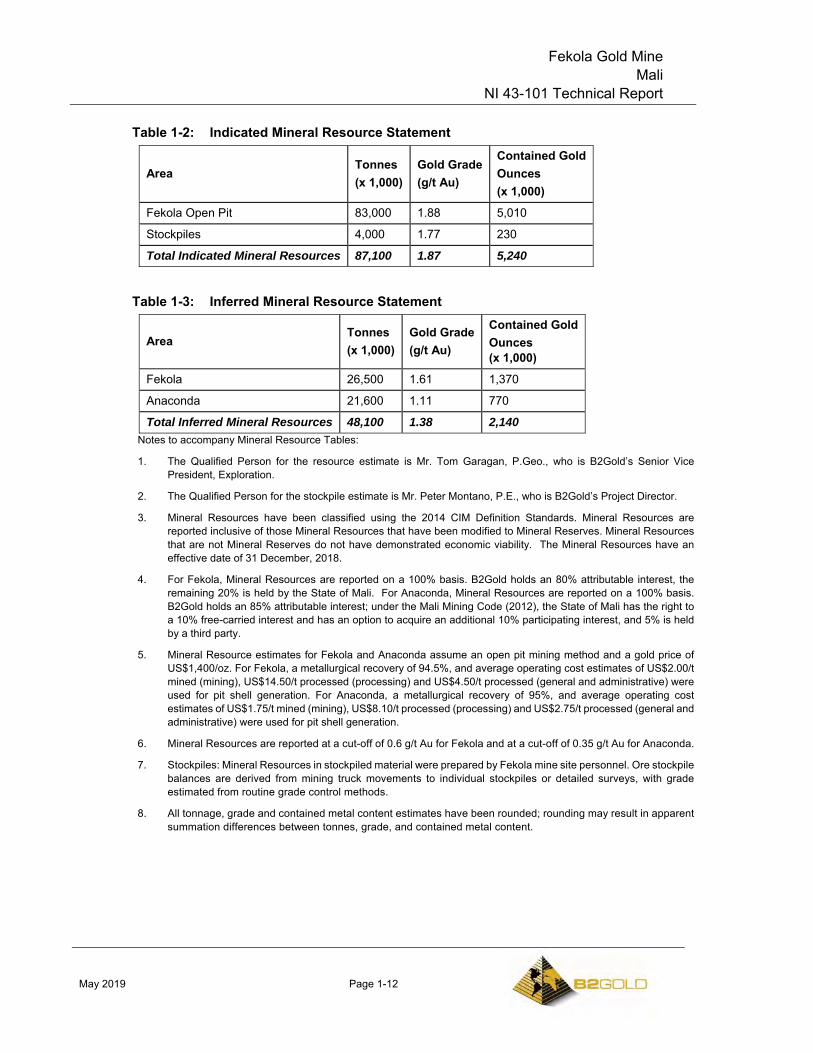
Fekola Gold Mine Mali
NI 43-101 Technical Report
May 2019 Page 1-12
Table 1-2: Indicated Mineral Resource Statement
Area Tonnes (x 1,000)
Gold Grade (g/t Au)
Contained Gold Ounces (x 1,000)
Fekola Open Pit 83,000 1.88 5,010
Stockpiles 4,000 1.77 230
Total Indicated Mineral Resources 87,100 1.87 5,240
Table 1-3: Inferred Mineral Resource Statement
Area Tonnes (x 1,000)
Gold Grade (g/t Au)
Contained Gold Ounces (x 1,000)
Fekola 26,500 1.61 1,370
Anaconda 21,600 1.11 770
Total Inferred Mineral Resources 48,100 1.38 2,140 Notes to accompany Mineral Resource Tables:
1. The Qualified Person for the resource estimate is Mr. Tom Garagan, P.Geo., who is B2Gold’s Senior Vice President, Exploration.
2. The Qualified Person for the stockpile estimate is Mr. Peter Montano, P.E., who is B2Gold’s Project Director.
3. Mineral Resources have been classified using the 2014 CIM Definition Standards. Mineral Resources are reported inclusive of those Mineral Resources that have been modified to Mineral Reserves. Mineral Resources that are not Mineral Reserves do not have demonstrated economic viability. The Mineral Resources have an effective date of 31 December, 2018.
4. For Fekola, Mineral Resources are reported on a 100% basis. B2Gold holds an 80% attributable interest, the remaining 20% is held by the State of Mali. For Anaconda, Mineral Resources are reported on a 100% basis. B2Gold holds an 85% attributable interest; under the Mali Mining Code (2012), the State of Mali has the right to a 10% free-carried interest and has an option to acquire an additional 10% participating interest, and 5% is held by a third party.
5. Mineral Resource estimates for Fekola and Anaconda assume an open pit mining method and a gold price of US$1,400/oz. For Fekola, a metallurgical recovery of 94.5%, and average operating cost estimates of US$2.00/t mined (mining), US$14.50/t processed (processing) and US$4.50/t processed (general and administrative) were used for pit shell generation. For Anaconda, a metallurgical recovery of 95%, and average operating cost estimates of US$1.75/t mined (mining), US$8.10/t processed (processing) and US$2.75/t processed (general and administrative) were used for pit shell generation.
6. Mineral Resources are reported at a cut-off of 0.6 g/t Au for Fekola and at a cut-off of 0.35 g/t Au for Anaconda.
7. Stockpiles: Mineral Resources in stockpiled material were prepared by Fekola mine site personnel. Ore stockpile balances are derived from mining truck movements to individual stockpiles or detailed surveys, with grade estimated from routine grade control methods.
8. All tonnage, grade and contained metal content estimates have been rounded; rounding may result in apparent summation differences between tonnes, grade, and contained metal content.
Fekola Gold Mine Mali
NI 43-101 Technical Report
May 2019 Page 1-13
1.12 Mineral Reserve Estimation
Mineral Reserve estimates assume open pit mining methods. Indicated Mineral Resources within the final pit design limits were converted to Probable Mineral Reserves.
The mining cost estimates were derived from the 2019 budget, 2018 life-of-mine (LOM) plan (LOMP), and feasibility mining equipment productivity and cost estimates. The estimates were compared to cost data for similar projects. The equipment ownership costs were included in the estimates for pit optimisation purposes, considering the relatively long mine life compared to the life cycle of the equipment.
Pit optimisations were carried out using Whittle Four-X pit optimisation software. The sequence of pit shells obtained from optimisations were analysed to define a practical mining sequence for the pit stage designs.
A gold price of US$1,250/oz Au was used in the pit optimisations and the calculation of the break-even cut-off grade for reserves reporting (Table 1-4). Taxes and royalties include a 3% net revenue tax, 3% gross gold revenue special tax, 0.6% product value stamp duty, and 1.65% net revenue royalty totaling $112.29/oz Au. The operating cash flows were discounted at 5% per annum to calculate the indicative NPV values for the comparison of optimal pit shells and production schedule options. The assumed metallurgical recovery for the life of mine was assumed to be 94% for pit optimization and production scheduling.
1.13 Mineral Reserve Statement
The Mineral Reserve estimate for the Project reported within the ultimate pit design is presented in Table 1-5. The Qualified Person for the estimate is Mr. Peter Montano, P.E., Project Director, who is also an employee of B2Gold. The estimate has an effective date of 31 December, 2018.
Factors that may affect the Mineral Reserve estimates include: changes to the gold price assumptions; changes to pit slope and geotechnical assumptions; unforeseen dilution; changes to hydrogeological and pit dewatering assumptions; changes to inputs to capital and operating cost estimates; changes to operating cost assumptions used in the constraining pit shell; changes to pit designs from those currently envisaged; stockpiling assumptions as to the amount and grade of stockpile material required to maintain operations during the wet season; assumptions used when evaluating the potential economics of Phase 7 of the Fekola pit; changes to modifying factor assumptions, including environmental, permitting and social licence to operate.
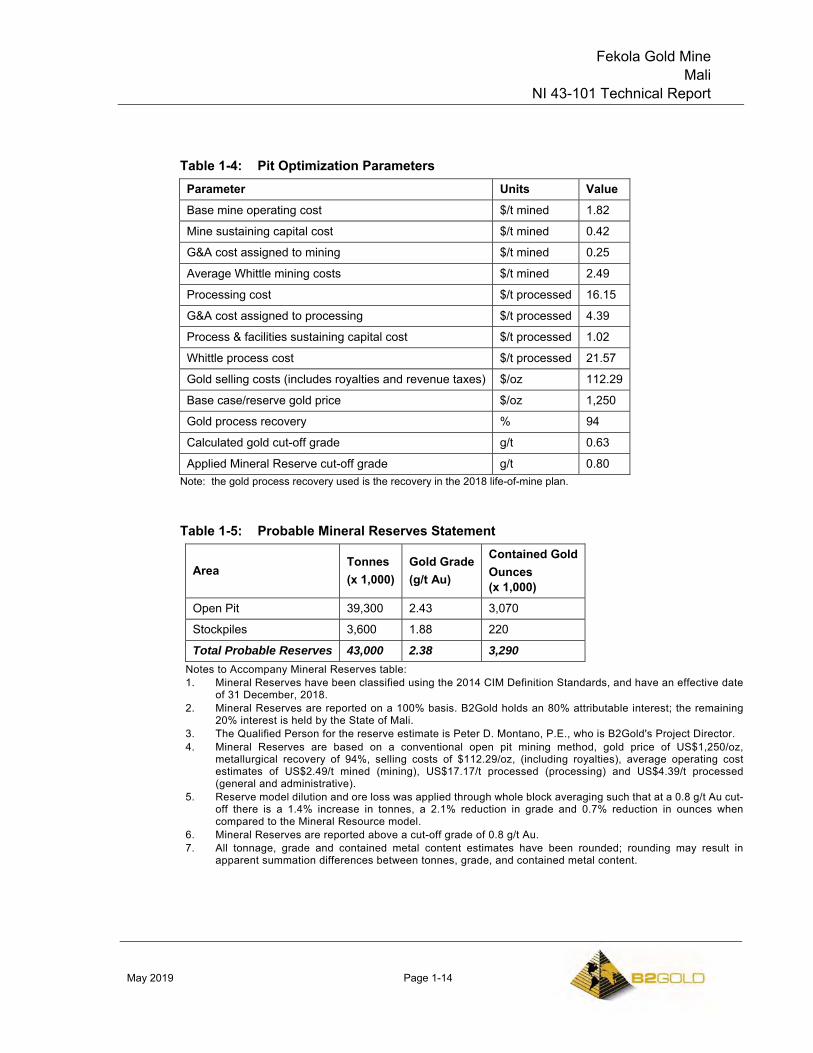
Fekola Gold Mine Mali
NI 43-101 Technical Report
May 2019 Page 1-14
Table 1-4: Pit Optimization Parameters Parameter Units Value Base mine operating cost $/t mined 1.82
Mine sustaining capital cost $/t mined 0.42
G&A cost assigned to mining $/t mined 0.25
Average Whittle mining costs $/t mined 2.49
Processing cost $/t processed 16.15
G&A cost assigned to processing $/t processed 4.39
Process & facilities sustaining capital cost $/t processed 1.02
Whittle process cost $/t processed 21.57
Gold selling costs (includes royalties and revenue taxes) $/oz 112.29
Base case/reserve gold price $/oz 1,250
Gold process recovery % 94
Calculated gold cut-off grade g/t 0.63
Applied Mineral Reserve cut-off grade g/t 0.80 Note: the gold process recovery used is the recovery in the 2018 life-of-mine plan.
Table 1-5: Probable Mineral Reserves Statement
Area Tonnes (x 1,000)
Gold Grade (g/t Au)
Contained Gold Ounces (x 1,000)
Open Pit 39,300 2.43 3,070
Stockpiles 3,600 1.88 220
Total Probable Reserves 43,000 2.38 3,290 Notes to Accompany Mineral Reserves table: 1. Mineral Reserves have been classified using the 2014 CIM Definition Standards, and have an effective date
of 31 December, 2018. 2. Mineral Reserves are reported on a 100% basis. B2Gold holds an 80% attributable interest; the remaining
20% interest is held by the State of Mali. 3. The Qualified Person for the reserve estimate is Peter D. Montano, P.E., who is B2Gold's Project Director. 4. Mineral Reserves are based on a conventional open pit mining method, gold price of US$1,250/oz,
metallurgical recovery of 94%, selling costs of $112.29/oz, (including royalties), average operating cost estimates of US$2.49/t mined (mining), US$17.17/t processed (processing) and US$4.39/t processed (general and administrative).
5. Reserve model dilution and ore loss was applied through whole block averaging such that at a 0.8 g/t Au cut-off there is a 1.4% increase in tonnes, a 2.1% reduction in grade and 0.7% reduction in ounces when compared to the Mineral Resource model.
6. Mineral Reserves are reported above a cut-off grade of 0.8 g/t Au. 7. All tonnage, grade and contained metal content estimates have been rounded; rounding may result in
apparent summation differences between tonnes, grade, and contained metal content.
Fekola Gold Mine Mali
NI 43-101 Technical Report
May 2019 Page 1-15
1.14 Mining Methods
The mining operations use conventional open pit mining methods and equipment, using Owner-operator mining equipment and labour. Mining is based on a phased approach with stockpiling to bring high-grade forward and provide operational flexibility.
The geotechnical appraisal and pit slope recommendations for the study were provided by George, Orr and Associates. More detailed geotechnical studies are in progress, with results expected by the end of 2019. Zones of highly fractured rock (termed "broken core zones") occur in the hanging wall and footwall of the Fekola Fault. The overall slope angles vary from 40–45° around the pit rim, depending mainly on the extent and location of the broken core zones.
The current operations have encountered minor to moderate seasonal inflows from pit walls at the base of the colluvial and lateritized zone and significant inflows at the base of pit starting at roughly the zero elevation. The pit floor responds well to dewatering.
The base case mine production schedule involves the movement of a total 35 Mt/a of ore and waste to sustain processing of 5.5 Mt/a of high-grade ore while stockpiling as much as 7 Mt of low-grade mineralization (below the 0.8 g/t Au Mineral Reserve cut-off but above the 0.6 g/t Au Mineral Resource cut-off) and 8.4 Mt of currently sub-economic mineralization. The 0.8 g/t Au mill feed and Mineral Reserve cut-off grade was determined based mining production capacity and processing throughput. The total tonnes mined annually are slightly over 35 Mt/a through 2024, then mine production tails off in the last 1.5 years as the pre-stripping of the last pit stages is completed. The processed grade over the remaining life of mine is slightly lower than mined grade due to existing low-grade stockpiles.
A staged pit development strategy was the key in the production schedules to defer the waste mining requirements and bring forward the mining of high-grade ore. The 320 m deep ultimate pit is planned for development in a sequence of seven phases. The design of the future pit stages during the operations, especially the last two stages, can be adjusted progressively depending on the operational experience, exposed ground conditions and changes in economic conditions.
The mine design is based on cutback widths of 200–250 m, minimum mining width of 25 m, nominal road and ramp widths of 27 m and a ramp gradient of up to 10%.
The mining operations are scheduled to work 365 days in a year, with decreased production targets during the rainy season.
The processing plant is scheduled to operate 24 hours continuously except for planned maintenance periods. The mill feed ore is transported from open pits to the ROM pad for direct tipping or stockpiling. Although the crusher design allows for direct truck tipping, mining cost estimates assume 80% of the ROM ore will be rehandled due to
Fekola Gold Mine Mali
NI 43-101 Technical Report
May 2019 Page 1-16
variations in mine production. The stockpiled ore is loaded to the crusher with a front-end loader (Cat 990, 992, or similar). Approximately three to four week’s ore supply is maintained on the ROM pad to control the gold grades and ore types.
Waste rock storage facility (WRSF) design is based on 10 m vertical lifts with 18º faces and 5 m berms, with facility location considerations based on minimising haulage, surface water drainage and area availability.
The total mine life is eight years to support 10 years of processing (including 2019).
Truck numbers increase from 24 currently in operation to a peak of 34 as the haul distances increase with development of deeper cutbacks. The excavator numbers will increase by one, from four to five, during the mine life. The ancillary equipment numbers will peak in 2021 when three phases are in production, mining reaches the lower levels of the pit, and waste dumping faces advance horizontally and vertically.
1.15 Recovery Methods
The metallurgical testwork results and information in the 2015 feasibility study provided the data to finalize the process design criteria and the Fekola mill flowsheet. The process recovery uses conventional designs and equipment.
The nameplate plant throughput capacity is 5 Mt/a. Based on a grinding circuit survey and updated comminution model completed in 2018 and actual 2018 production, B2Gold evaluated plant throughput capacity increases using the existing plant and equipment. This indicated that a throughput rate of 5.5 Mt/a should be the basis of the 2018 LOMP that supports the Mineral Reserves. With further evaluation, it became apparent that the plant could operate with even higher throughput rates, and that the Fekola mill has the capacity to operate at a 6 Mt/a throughput rate on the mill feed materials envisaged in the LOMP.
The process flowsheet consists of the following: single stage primary crushing; grinding circuit consisting of a semi-autogenous grind (SAG)–ball mill/pebble crusher circuit (SABC) type; carbon columns (CIC); leach circuit; cyanide destruction; tailings disposal; acid wash and elution; electrowinning and gold room; carbon regeneration; reagents make-up and distribution; air services and plant water service.
The average annual LOM projected power requirement for the process plant is 250,000 MW. The process plant uses process water, reclaim water, fresh water, treated water, gland water and potable water. Process water predominantly consists of leach thickener overflow and reclaim water make-up. Reclaim water predominantly consists of tailings thickener overflow, decant return water from the TSF and fresh water make-up. Fresh water for potable water use is sourced from dedicated potable water bores. Reagents are conventional for gold operations.
Fekola Gold Mine Mali
NI 43-101 Technical Report
May 2019 Page 1-17
1.16 Project Infrastructure
Surface infrastructure to support operations is in place, and includes: one open pit; processing facilities (grinding and leaching facilities, along with management and engineering offices, change house, workshop, warehouse, and assay laboratory facilities); mine facilities (management and engineering offices, change house, EMV and light vehicle workshops, wash bay, warehouse, explosives magazine, crusher, mine access gate house, return water pump house); administration buildings (facilities for overall site management, safety inductions, and general and administrative functions); accommodation camp; WRSFs; TSF; water management facilities: stormwater and water storage dams, diversions, culverts; landfill facility; power generation facility; fuel storage facilities (heavy fuel oil (HFO) and diesel).
The TSF was constructed using downstream construction techniques, based on a design by Knight Piésold Pty. Ltd., Perth, Australia. The TSF was designed to contain 62 Mt of tailings at a deposition rate of 5.0 Mt/a. Review of the as-built and operating parameters of the TSF is on-going, to evaluate the storage capacity at the currently higher throughput rate than nameplate plant design. A decant tower system was constructed to pump return water to the return water pond. A decant tower system was constructed to pump return water to the return water pond. The TSF, site water storage ponds, and surface water control structures were designed to control 100-year storm events (varying duration; 24-hr, 72-hr dry annual rainfall and wet annual rainfall).
The Fekola Mine is located in an existing natural drainage course, with an upstream catchment of 9 km2. The site surface water management system is designed to prevent runoff from events up to and inclusive of a one-in-100-year recurrence interval storm event from entering the pit. Water management structures include a settling pond, diversion channels, a freshwater storage pond, and sediment control structures.
Power for the Fekola Mine is generated by a dedicated power station that is a combination of HFO and diesel-fuelled generators located adjacent to the process plant. The power plant has been sized to accommodate a maximum demand power draw of 29.4 MW. Studies are in progress to evaluate the potential for adding a solar power facility.
1.17 Environmental, Permitting and Social Considerations
An Environmental and Social Impact Assessment (ESIA) was originally completed for the Fekola Mine in 2013 (2013 Environmental and Social Impact Statement (2013 ESIS)). This 2013 ESIS was approved by the Ministry of Environment and Sanitation on 29 April 2013.
In 2015, B2Gold completed an update of the ESIA (2015 ESIA Update) that filled gaps identified in the 2013 ESIS, reflected optimization improvement and modifications to the
Fekola Gold Mine Mali
NI 43-101 Technical Report
May 2019 Page 1-18
Project design, assessed these improvements and modifications for their potential impacts against baseline conditions in the Project area, and aligned the assessment with international standards including the International Finance Corporation (IFC) environmental and social performance standards. Potential impacts were assessed for the various aspects characterized in the environmental and social baseline investigations. Key areas included air quality; water; biodiversity; access to land resources; livelihood and employment; and social services/infrastructure. Wherever possible, environmental and social impacts were iteratively avoided or reduced throughout the 2015 ESIA Update process by making changes to the Project design (e.g. movement of a road to avoid a key environmental feature).
1.17.1 Environmental Considerations
An Environmental and Social Management Plan was developed as part of the 2013 ESIS. This Environmental and Social Management Plan has been updated to account for optimization and modification of the Project and a corresponding Environmental and Social Management and Monitoring Plan (ESMMP) was developed as part of the 2015 ESIA Update. This ESMMP is supported by a number of individual Management Plans, including:
• Environmental Monitoring Plan;
• Water Management Plan;
• Waste Management Plan;
• Rehabilitation and Preliminary Mine Closure Plan;
• Emergency Preparedness and Response Plan;
• Biodiversity Action Plan;
• Biodiversity Monitoring Plan;
• Stakeholder Engagement Plan;
• Community Development Plan.
1.17.2 Closure and Reclamation Planning
B2Gold’s overall objective for mine closure is to prevent or minimise adverse long-term environmental, physical, social and economic impacts for the greater Project area and to create stable landforms that provide self-sustaining natural ecosystems within the Project development area.
B2Gold prepares and annually updates the Asset Retirement Obligation cost estimate for the Fekola Mine. The estimated Asset Retirement Obligation cost estimate as of 31 December 2018 is approximately $32.1 M. This estimate was generated subsequent
Fekola Gold Mine Mali
NI 43-101 Technical Report
May 2019 Page 1-19
to the development of the total reclamation and closure capital cost estimate of $28.7 M that was used in the 2018 LOMP.
The 2012 Mining Code requires mining companies to post financial security for costs associated with the mine reclamation and long-term protection of the environment relating to potential impacts from the Project. B2Gold has reached an agreement with the Malian government to fund an escrow account based on a production basis (i.e. per tonne of material processed), and there will be an accompanying escrow agreement on how and when the funds can be used or released based on the site’s evolving reclamation status and environmental liability.
1.17.3 Permitting Considerations
Various permits and authorizations were required for the Project. Key permits include the site environmental permit, environmental permit for the access road, mining permit, approval of a Community Development Plan, and approval of a Mine Closure Plan. There are about another 21 major permits that have been obtained in support of operations.
1.17.4 Social Considerations
The communities in the Project area rely on land resources to make a subsistence living, primarily via small scale farming and/or artisanal mining activities. The community most significantly impacted is the village of Old Fadougou.
Although the relocation of the village was not a requirement of the Mine Construction Permit or the approved EIA, extensive engagement with government and community stakeholders led to a decision to proceed with a resettlement project. The resettlement process started in 2015 with the initial baseline collection (socio-economic and asset surveys), and has been implemented in compliance with the Malian law and in line with international best practices. Signing of agreements and compensations have started in January 2019 and are currently ongoing. New Fadougou village construction has been completed and the physical relocation of the families and businesses started in April 2019.
1.18 Markets and Contracts
Fekola is an operating mine producing a readily-saleable commodity in the form of doré. The doré is exported to the Metalor refinery in Switzerland.
Commodity prices used in Mineral Resource and Mineral Reserve estimates are set by B2Gold corporately. The current gold price provided for Mineral Reserve estimation is $1,250/oz, and $1,400/oz for Mineral Resource estimation.
Fekola Gold Mine Mali
NI 43-101 Technical Report
May 2019 Page 1-20
Major contracts include fuel supply, blasting explosives and accessories, and grade control drilling. Contracts are negotiated and renewed as needed. Contract terms are within industry norms and typical of similar contracts in Mali that B2Gold is familiar with.
The QP has reviewed commodity pricing assumptions, marketing assumptions and the current major contract areas, and considers the information acceptable for use in estimating Mineral Reserves and in the economic analysis that supports the Mineral Reserves.
1.19 Capital Cost Estimates
Fekola is a steady-state operation. Capital costs largely comprise mining and processing equipment and rebuilds, TSF construction, small projects, and other costs for mining, processing, and site general. Capital costs are split into sustaining capital where the costs are supporting the existing LOMP, and non-sustaining capital where the cost is for a long-term structure or external project which does not necessarily depend on the mine plan (e.g. TSF raises).
The capital cost estimate for the LOMP is included as Table 1-6.
1.20 Operating Cost Estimates
Operating costs for Fekola are based on actual costs seen during operations at site and are projected through the LOMP.
Infrastructure and other distributable costs such as power, light vehicles, maintenance, and fuel, are distributed through the mining, processing, and site general costs as applicable.
The operating cost estimate for the LOMP is included as Table 1-7 on a $/t processed basis. The mining costs are $2.03/t mined.
1.21 Economic Analysis
B2Gold is using the provision for producing issuers, whereby producing issuers may exclude the information required under Item 22 for technical reports on properties currently in production and where no material production expansion is planned.
Mineral Reserve declaration is supported by a positive cash flow.
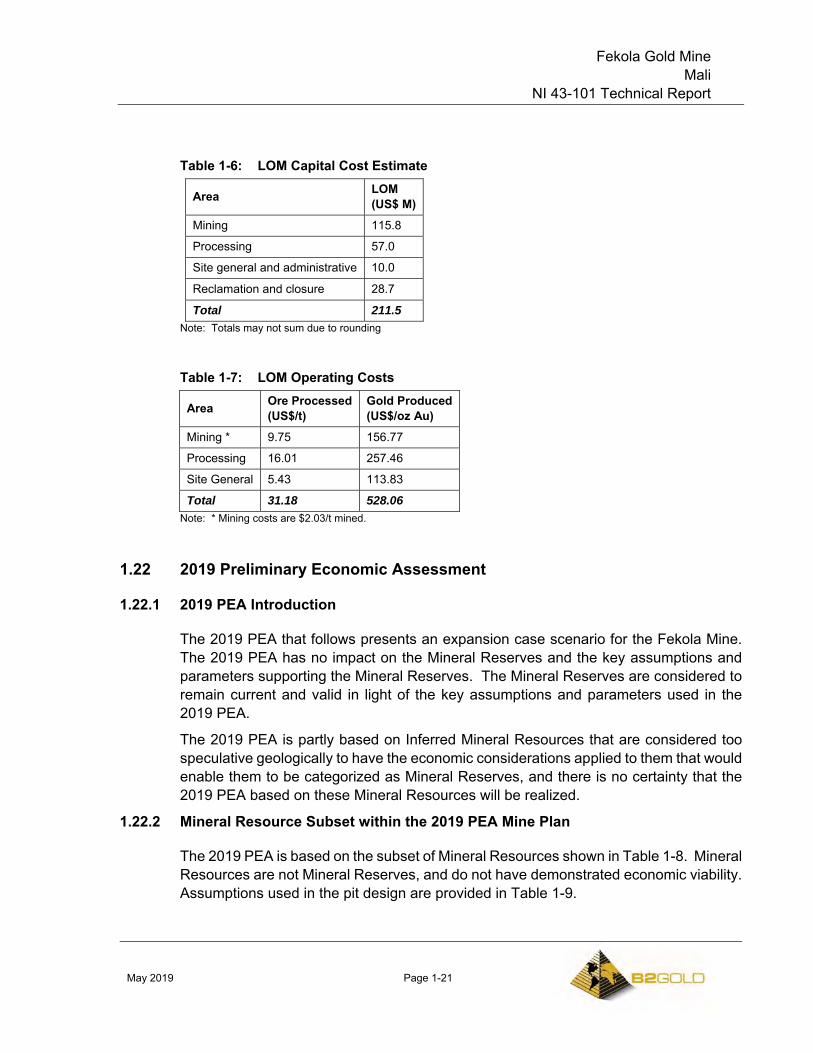
Fekola Gold Mine Mali
NI 43-101 Technical Report
May 2019 Page 1-21
Table 1-6: LOM Capital Cost Estimate
Area LOM (US$ M)
Mining 115.8
Processing 57.0
Site general and administrative 10.0
Reclamation and closure 28.7
Total 211.5 Note: Totals may not sum due to rounding
Table 1-7: LOM Operating Costs
Area Ore Processed (US$/t)
Gold Produced (US$/oz Au)
Mining * 9.75 156.77
Processing 16.01 257.46
Site General 5.43 113.83
Total 31.18 528.06 Note: * Mining costs are $2.03/t mined.
1.22 2019 Preliminary Economic Assessment
1.22.1 2019 PEA Introduction
The 2019 PEA that follows presents an expansion case scenario for the Fekola Mine. The 2019 PEA has no impact on the Mineral Reserves and the key assumptions and parameters supporting the Mineral Reserves. The Mineral Reserves are considered to remain current and valid in light of the key assumptions and parameters used in the 2019 PEA.
The 2019 PEA is partly based on Inferred Mineral Resources that are considered too speculative geologically to have the economic considerations applied to them that would enable them to be categorized as Mineral Reserves, and there is no certainty that the 2019 PEA based on these Mineral Resources will be realized.
1.22.2 Mineral Resource Subset within the 2019 PEA Mine Plan
The 2019 PEA is based on the subset of Mineral Resources shown in Table 1-8. Mineral Resources are not Mineral Reserves, and do not have demonstrated economic viability. Assumptions used in the pit design are provided in Table 1-9.
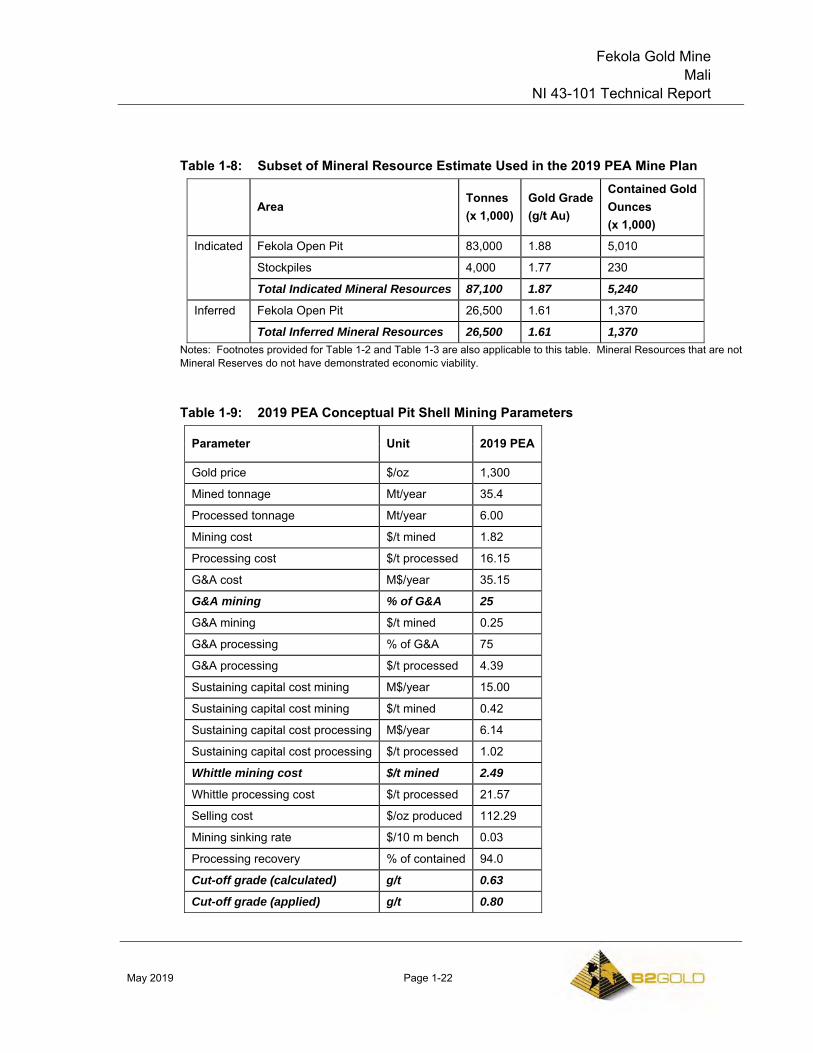
Fekola Gold Mine Mali
NI 43-101 Technical Report
May 2019 Page 1-22
Table 1-8: Subset of Mineral Resource Estimate Used in the 2019 PEA Mine Plan
Area Tonnes (x 1,000)
Gold Grade (g/t Au)
Contained Gold Ounces (x 1,000)
Indicated Fekola Open Pit 83,000 1.88 5,010
Stockpiles 4,000 1.77 230
Total Indicated Mineral Resources 87,100 1.87 5,240
Inferred Fekola Open Pit 26,500 1.61 1,370
Total Inferred Mineral Resources 26,500 1.61 1,370 Notes: Footnotes provided for Table 1-2 and Table 1-3 are also applicable to this table. Mineral Resources that are not Mineral Reserves do not have demonstrated economic viability.
Table 1-9: 2019 PEA Conceptual Pit Shell Mining Parameters
Parameter Unit 2019 PEA
Gold price $/oz 1,300
Mined tonnage Mt/year 35.4
Processed tonnage Mt/year 6.00
Mining cost $/t mined 1.82
Processing cost $/t processed 16.15
G&A cost M$/year 35.15
G&A mining % of G&A 25
G&A mining $/t mined 0.25
G&A processing % of G&A 75
G&A processing $/t processed 4.39
Sustaining capital cost mining M$/year 15.00
Sustaining capital cost mining $/t mined 0.42
Sustaining capital cost processing M$/year 6.14
Sustaining capital cost processing $/t processed 1.02
Whittle mining cost $/t mined 2.49
Whittle processing cost $/t processed 21.57
Selling cost $/oz produced 112.29
Mining sinking rate $/10 m bench 0.03
Processing recovery % of contained 94.0
Cut-off grade (calculated) g/t 0.63
Cut-off grade (applied) g/t 0.80
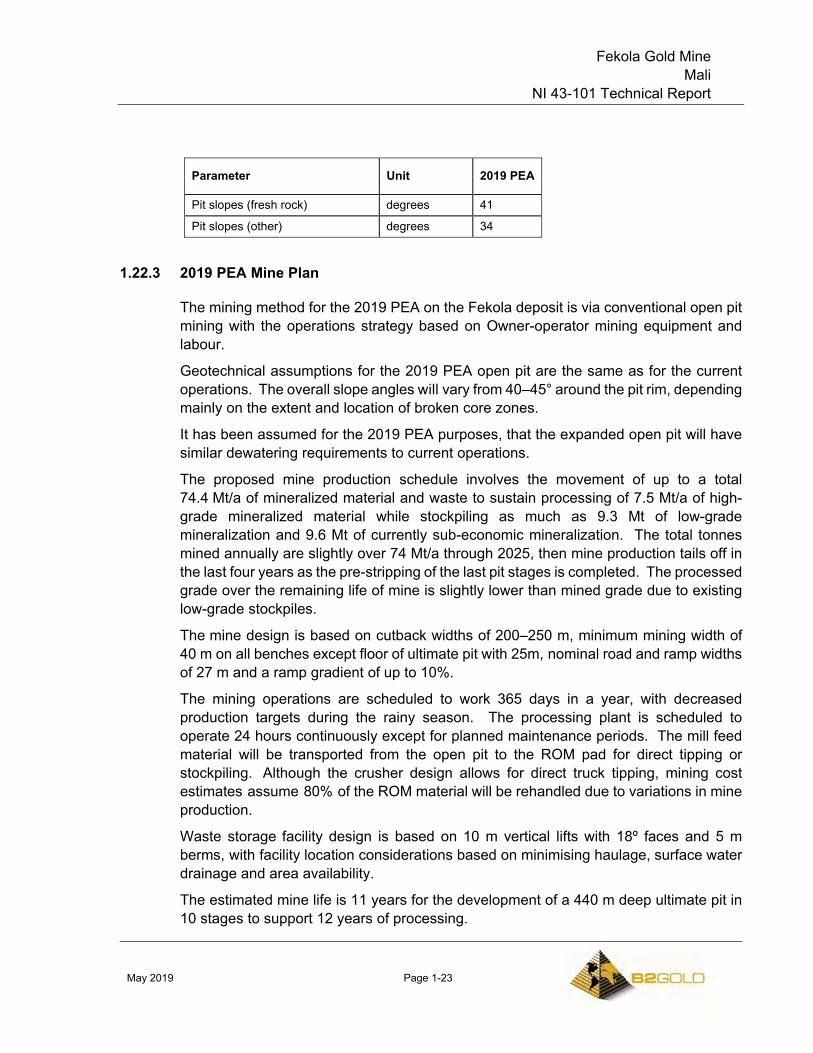
Fekola Gold Mine Mali
NI 43-101 Technical Report
May 2019 Page 1-23
Parameter Unit 2019 PEA
Pit slopes (fresh rock) degrees 41
Pit slopes (other) degrees 34
1.22.3 2019 PEA Mine Plan
The mining method for the 2019 PEA on the Fekola deposit is via conventional open pit mining with the operations strategy based on Owner-operator mining equipment and labour.
Geotechnical assumptions for the 2019 PEA open pit are the same as for the current operations. The overall slope angles will vary from 40–45° around the pit rim, depending mainly on the extent and location of broken core zones.
It has been assumed for the 2019 PEA purposes, that the expanded open pit will have similar dewatering requirements to current operations.
The proposed mine production schedule involves the movement of up to a total 74.4 Mt/a of mineralized material and waste to sustain processing of 7.5 Mt/a of high-grade mineralized material while stockpiling as much as 9.3 Mt of low-grade mineralization and 9.6 Mt of currently sub-economic mineralization. The total tonnes mined annually are slightly over 74 Mt/a through 2025, then mine production tails off in the last four years as the pre-stripping of the last pit stages is completed. The processed grade over the remaining life of mine is slightly lower than mined grade due to existing low-grade stockpiles.
The mine design is based on cutback widths of 200–250 m, minimum mining width of 40 m on all benches except floor of ultimate pit with 25m, nominal road and ramp widths of 27 m and a ramp gradient of up to 10%.
The mining operations are scheduled to work 365 days in a year, with decreased production targets during the rainy season. The processing plant is scheduled to operate 24 hours continuously except for planned maintenance periods. The mill feed material will be transported from the open pit to the ROM pad for direct tipping or stockpiling. Although the crusher design allows for direct truck tipping, mining cost estimates assume 80% of the ROM material will be rehandled due to variations in mine production.
Waste storage facility design is based on 10 m vertical lifts with 18º faces and 5 m berms, with facility location considerations based on minimising haulage, surface water drainage and area availability.
The estimated mine life is 11 years for the development of a 440 m deep ultimate pit in 10 stages to support 12 years of processing.
Fekola Gold Mine Mali
NI 43-101 Technical Report
May 2019 Page 1-24
At peak, a fleet of eight excavators and 48 trucks will be required to support the 2019 PEA operations.
1.22.4 2019 PEA Recovery Methods
The process plant at Fekola is based on a robust metallurgical flowsheet designed for optimum recovery with minimum operating costs. The flowsheet is based upon unit operations that are well proven in industry. Following grinding and optimization tests completed in 2018, the plant is currently able to operate at a 6 Mt/a throughput rate with no changes to the plant or equipment. The 2019 PEA envisages a plant throughput expansion to 7.5 Mt/a.
The process flowsheet will consist of the following: single stage primary crushing; grinding circuit consisting of a semi-autogenous grind (SAG)–ball mill/pebble crusher circuit (SABC) type; carbon columns (CIC); leach circuit; cyanide destruction; tailings disposal; acid wash and elution; electrowinning and gold room; carbon regeneration; reagents make-up and distribution; air services and plant water service.
The average annual LOM projected power requirement for the process plant is estimated to be 306,000 MW. The process plant will use process water, reclaim water, fresh water, treated water, gland water and potable water. Process water will predominantly consist of leach thickener overflow and reclaim water make-up. Reclaim water will consist of tailings thickener overflow, decant return water from the TSF and fresh water make-up. Fresh water for potable water use may be sourced from dedicated potable water bores. Reagents will be conventional for gold operations.
1.22.5 2019 PEA Project Infrastructure
Surface infrastructure to support the current operations is in place, and includes: one open pit; processing facilities (grinding and leaching facilities, along with management and engineering offices, change house, workshop, warehouse, and assay laboratory facilities); mine facilities (management and engineering offices, change house, EMV and light vehicle workshops, wash bay, warehouse, explosives magazine, crusher, mine access gate house, return water pump house); administration buildings (facilities for overall site management, safety inductions, and general and administrative functions); accommodation camp; WRSFs; TSF; water management facilities: stormwater and water storage dams, diversions, culverts; landfill facility; power generation facility; fuel storage facilities (HFO and diesel).
The 2019 PEA will require expansion of the EMV and light vehicle workshops, and the mine laboratory. An additional WRSF will be needed, as will a second TSF.
The TSF was constructed using downstream construction techniques, based on a design by Knight Piésold Pty. Ltd., Perth, Australia. The TSF was designed to contain 62 Mt of tailings at a deposition rate of 5.0 Mt/a. Review of the as-built and operating
Fekola Gold Mine Mali
NI 43-101 Technical Report
May 2019 Page 1-25
parameters of the TSF is on-going, to evaluate the storage capacity at the currently higher throughput rate than nameplate plant design. A decant tower system was constructed to pump return water to the return water pond. A decant tower system was constructed to pump return water to the return water pond. The TSF, site water storage ponds, and surface water control structures were designed to control 100-year storm events (varying duration; 24-hr, 72-hr dry annual rainfall and wet annual rainfall).
Additional tailings storage capacity will be required for the proposed processed tonnage. The 2019 PEA mine plan will process a total of 83.9 Mt. This exceeds the design capacity of 62 Mt of the existing TSF. A valley to the north of the existing TSF has been identified as a potential TSF location for operations starting in 2026 through 2030, and B2Gold is studying alternative tailings storage options including tailings and waste rock co-disposal.
The Fekola Mine is located in an existing natural drainage course, with an upstream catchment of 9 km2. The site surface water management system is designed to prevent runoff from events up to and inclusive of a one-in-100-year recurrence interval storm event from entering the pit. Water management structures include a settling pond, diversion channels, a freshwater storage pond, and sediment control structures. Water management structures will be extended to cover the additional infrastructure contemplated in the 2019 PEA, including the additional WRSF and TSF.
Power for the Fekola Mine is generated by a dedicated power station that is a combination of HFO and diesel-fuelled generators located adjacent to the process plant. The power plant has been sized to accommodate a maximum demand power draw of 29.4 MW, and this will be sufficient for the 2019 PEA. Studies are in progress to evaluate the potential for adding a solar power facility.
1.22.6 2019 PEA Market Studies and Contracts
The 2019 PEA assumes that doré will continue to be exported to the Metalor refinery in Switzerland.
Commodity prices used in Mineral Resource estimates are set by B2Gold corporately. The current gold price provided for Mineral Resource estimation is $1,400/oz. The 2019 PEA assumed a gold price of $1,300/oz Au.
Major contracts are likely to include fuel supply, blasting explosives and accessories, and grade control drilling. Contracts will be negotiated and renewed as needed. Contract terms are expected to be within industry norms and typical of similar contracts in Mali that B2Gold is familiar with.
1.22.7 2019 PEA Environmental, Permitting and Social Considerations
The current regulatory and permitting structure and status, the environmental and social setting and the environmental and social management of potential impacts identified in
Fekola Gold Mine Mali
NI 43-101 Technical Report
May 2019 Page 1-26
the 2018 LOMP are also applicable to the proposed Fekola Mine expansion in the 2019 PEA. Information relating to environmental studies, permitting, and social or community impact remain substantially the same for the 2019 PEA.
Environmental Considerations
An Environmental and Social Impact Assessment (ESIA) was originally completed for the Fekola Mine in 2013 (2013 Environmental and Social Impact Statement (2013 ESIS)). This 2013 ESIS was approved by the Ministry of Environment and Sanitation on 29 April 2013.
An Environmental and Social Management Plan was developed as part of the 2013 ESIS. This Environmental and Social Management Plan has been updated to account for optimization and modification of the Project and a corresponding ESMMP was developed as part of the 2015 ESIA Update. This ESMMP is supported by a number of individual Management Plans.
B2Gold’s self-screening assessment did not identify environmental or social fatal flaws due to the Fekola Mine expansion as outlined in the 2019 PEA; however, additional study (e.g., surface hydrology, hydrogeology, mine materials geochemical characterization) is required to fully understand the potential environmental and social impacts. Any identified potential negative impacts will need to be managed to ensure that they are reduced to acceptable levels. Necessary mitigation and management measures will be incorporated into the Fekola Mine environmental and social management plans.
Closure and Reclamation Planning
B2Gold’s overall objective for mine closure is to prevent or minimise adverse long-term environmental, physical, social and economic impacts for the greater Project area and to create stable landforms that provide self-sustaining natural ecosystems within the Project development area.
B2Gold prepares and annually updates the Asset Retirement Obligation cost estimate for the Fekola Mine. The estimated Asset Retirement Obligation cost estimate as of 31 December 2018 is approximately US$32.1 M. This estimate was generated subsequent to the development of the total reclamation and closure capital cost estimate of $28.7 M that was used in the 2019 PEA.
The closure cost assumptions used for the 2019 PEA are the same costs as used in the 2018 LOMP. Closure planning would be required to incorporate the changes in the 2019 PEA, including increased footprints for the open pit, WRSFs and TSFs. While additional closure study and planning is required and additional closure costs would be incurred if the expansion were carried out; it is currently not anticipated that the Fekola Mine expansion would significantly alter the closure concepts for the Fekola Mine or its major
Fekola Gold Mine Mali
NI 43-101 Technical Report
May 2019 Page 1-27
facilities. Closure costs will likely increase from that used in the 2019 PEA when final mine plans and infrastructure designs have been completed.
Permitting Considerations
The proposed changes to the Fekola Mine as a result of the proposed Fekola Mine expansion in the 2019 PEA would require the completion and submittal of an Environmental Notice to regulatory authorities (i.e., DNACPN) to assess the potential impacts from the expansion. If approved, a separate environmental permit would be issued for the Fekola Mine expansion; this permit would likely include various environmental and/or social permit conditions.
There may be other required permits or authorizations or required modifications to existing permits or authorizations. B2Gold assumes that all requisite approvals and permits for the expansion will be obtained. While it is believed that such approvals and permits can be obtained on a timely basis and on acceptable terms, there is no certainty that this will be the case.
Social Considerations
The communities in the Project area rely on land resources to make a subsistence living, primarily via small scale farming and/or artisanal mining activities. The Fekola Mine expansion, however, is not expected to have a significant additional impact (beyond the current anticipated and mitigated potential impacts of the Fekola Mine operation) on land resource access.
B2Gold has engaged with the community and government and commenced with the resettlement project of the villagers of Old Fadougou. Signing of agreements and compensations have started in January 2019 and are currently ongoing. New Fadougou village construction has been completed and the physical relocation of families and businesses started in April 2019. The resettlement of the village of Old Fadougou greatly reduces or eliminates potential negative impacts to the villagers.
1.22.8 2019 PEA Capital Costs
Capital cost estimates have been factored from the 2018 LOMP and have an estimated accuracy of ±35%. The main capital costs associated with the 2019 PEA are a mine fleet expansion, and a process plant expansion.
The capital cost estimate for the 2019 PEA is summarized in Table 1-10.
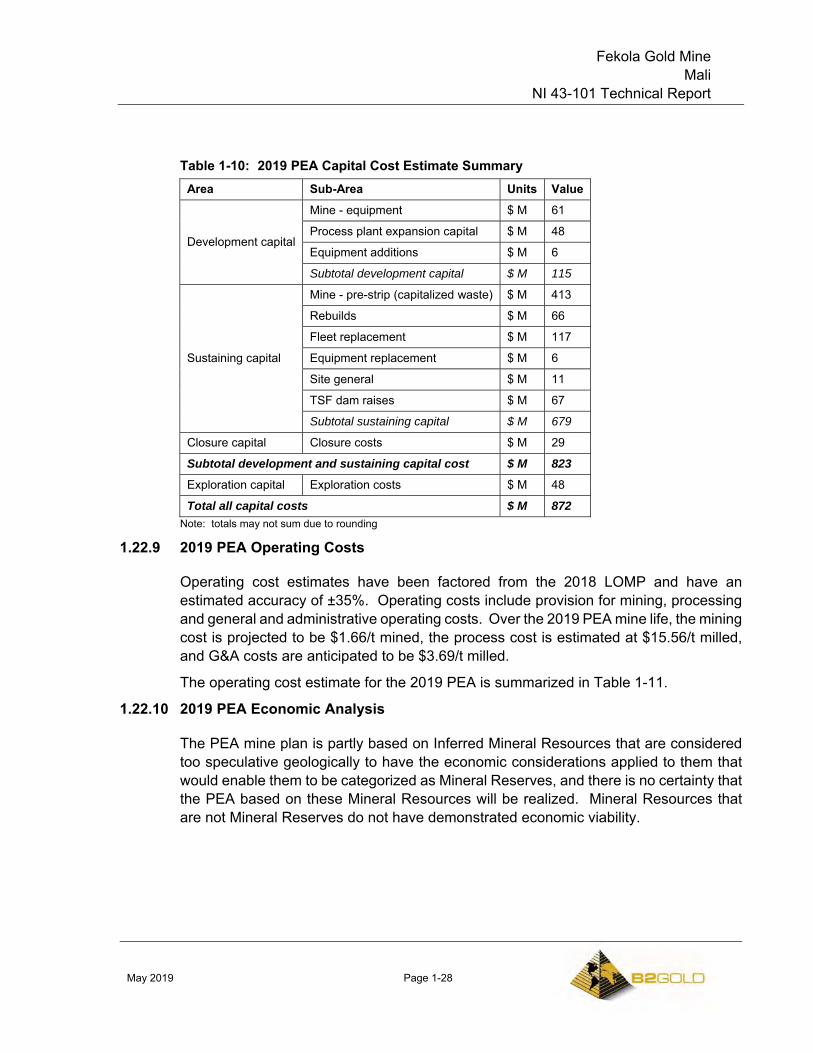
Fekola Gold Mine Mali
NI 43-101 Technical Report
May 2019 Page 1-28
Table 1-10: 2019 PEA Capital Cost Estimate Summary Area Sub-Area Units Value
Development capital
Mine - equipment $ M 61
Process plant expansion capital $ M 48
Equipment additions $ M 6
Subtotal development capital $ M 115
Sustaining capital
Mine - pre-strip (capitalized waste) $ M 413
Rebuilds $ M 66
Fleet replacement $ M 117
Equipment replacement $ M 6
Site general $ M 11
TSF dam raises $ M 67
Subtotal sustaining capital $ M 679
Closure capital Closure costs $ M 29
Subtotal development and sustaining capital cost $ M 823
Exploration capital Exploration costs $ M 48
Total all capital costs $ M 872 Note: totals may not sum due to rounding
1.22.9 2019 PEA Operating Costs
Operating cost estimates have been factored from the 2018 LOMP and have an estimated accuracy of ±35%. Operating costs include provision for mining, processing and general and administrative operating costs. Over the 2019 PEA mine life, the mining cost is projected to be $1.66/t mined, the process cost is estimated at $15.56/t milled, and G&A costs are anticipated to be $3.69/t milled.
The operating cost estimate for the 2019 PEA is summarized in Table 1-11.
1.22.10 2019 PEA Economic Analysis
The PEA mine plan is partly based on Inferred Mineral Resources that are considered too speculative geologically to have the economic considerations applied to them that would enable them to be categorized as Mineral Reserves, and there is no certainty that the PEA based on these Mineral Resources will be realized. Mineral Resources that are not Mineral Reserves do not have demonstrated economic viability.
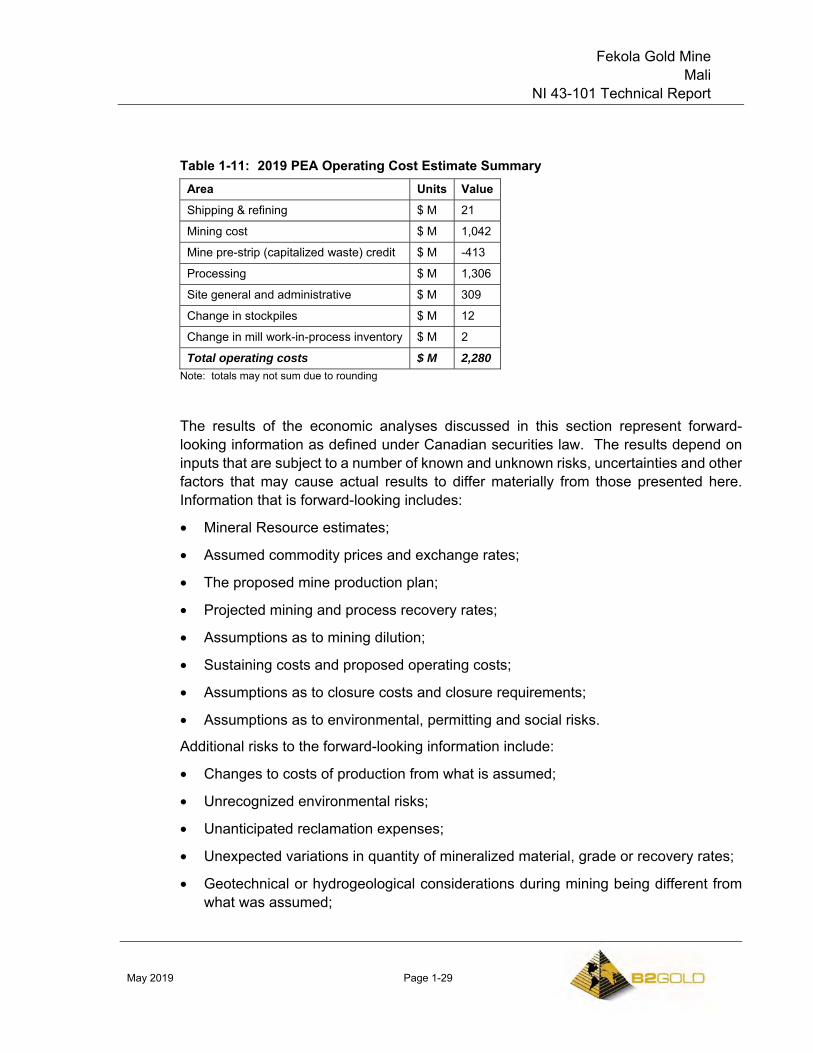
Fekola Gold Mine Mali
NI 43-101 Technical Report
May 2019 Page 1-29
Table 1-11: 2019 PEA Operating Cost Estimate Summary Area Units Value Shipping & refining $ M 21
Mining cost $ M 1,042
Mine pre-strip (capitalized waste) credit $ M -413
Processing $ M 1,306
Site general and administrative $ M 309
Change in stockpiles $ M 12
Change in mill work-in-process inventory $ M 2
Total operating costs $ M 2,280 Note: totals may not sum due to rounding
The results of the economic analyses discussed in this section represent forward- looking information as defined under Canadian securities law. The results depend on inputs that are subject to a number of known and unknown risks, uncertainties and other factors that may cause actual results to differ materially from those presented here. Information that is forward-looking includes:
• Mineral Resource estimates;
• Assumed commodity prices and exchange rates;
• The proposed mine production plan;
• Projected mining and process recovery rates;
• Assumptions as to mining dilution;
• Sustaining costs and proposed operating costs;
• Assumptions as to closure costs and closure requirements;
• Assumptions as to environmental, permitting and social risks.
Additional risks to the forward-looking information include:
• Changes to costs of production from what is assumed;
• Unrecognized environmental risks;
• Unanticipated reclamation expenses;
• Unexpected variations in quantity of mineralized material, grade or recovery rates;
• Geotechnical or hydrogeological considerations during mining being different from what was assumed;
Fekola Gold Mine Mali
NI 43-101 Technical Report
May 2019 Page 1-30
• Failure of mining methods to operate as anticipated;
• Failure of plant, equipment or processes to operate as anticipated;
• Changes to assumptions as to the availability of electrical power, and the power rates used in the operating cost estimates and financial analysis;
• Ability to maintain the social licence to operate;
• Accidents, labour disputes and other risks of the mining industry;
• Changes to interest rates;
• Changes to tax rates.
The production schedules and financial analysis annualized cash flow table are presented with conceptual years shown. Years shown in these tables are for illustrative purposes only. Additional mining, technical, and engineering studies are planned to support potential conversion of some or all of the Mineral Resources to Mineral Reserves, which may alter the assumptions as discussed in the 2019 PEA and this Report, and may result in changes to the calendar timelines presented.
The Project has been valued using a discounted cash flow (DCF) approach. Estimates have been prepared for all the individual elements of cash revenue and cash expenditures for ongoing operations. Capital cost estimates have been prepared for initial development and construction of the Project, in addition to ongoing operations (sustaining capital). 2019 was defined as the first year of initial capital expenditure, and cash flows are assumed to occur at the beginning of each period. The resulting net annual cash flows are discounted back to the date of valuation of start-of-year 2019, because the actual starting calendar year has not been determined. The currency used to document the cash flow is US$Q1 2019, considering that the estimation was developed during the first quarter of 2019. A discount rate of 5% was assumed.
Royalties and stamp duties included in the economic model are:
• 3% ISCP rate;
• 3% ad valorem tax on gold and other precious metals;
• 1.65% royalty to ZTS;
• 0.6% stamp duty.
The overall projected royalty and stamp duty payment is 8.25%.
Corporate income tax in Mali is 30% under the 2012 Mining Code. For exploitation license holders, there is a 15-year period from the start of production where the corporate income tax is reduced to 25%. The 2012 Mining Code has a provision that exploitation license holders have a three-year value-added tax (VAT) and other customs
Fekola Gold Mine Mali
NI 43-101 Technical Report
May 2019 Page 1-31
and duties exemption period commencing from the start of commercial production (December 2017). Beyond the exemption period, VAT and duties have been included in the capital and operating costs as appropriate.
The base case economic analysis assumes 100% equity financing and is reported on a 100% project ownership basis. B2Gold holds an 80% interest in the Médinandi Exploitation License and the State of Mali holds a 20% interest.
The pre-tax cumulative cash flow is estimated at $2,808 M. The post-tax cash flow cumulative cash flow is $2,150 M. The post-tax cash flow using a 5% discount rate is $1,674 M.
IRR and payback for the 2019 PEA are not presented because with 100% financing, neither is applicable; and because the cash flow is positive in all years of the 2019 PEA process plan.
Table 1-12 is a summary of the key financial metrics.
A sensitivity analysis was performed taking into account variations in metal prices, metal grades processed, operating costs and capital costs (Figure 1-1 and Table 1-13). The 2019 PEA shows the project envisaged is most sensitive to, from most to least, to variations in gold price, grade processed, operating costs, and then capital costs.
1.23 Interpretation and Conclusions
An economic analysis was performed in support of estimation of the Mineral Reserves; this indicated a positive cash flow using the assumptions detailed in this Report.
Using the assumptions set out for the 2019 PEA in Section 24 of this Report, the project envisaged shows a positive cash flow in all years of planned operation.
1.24 Recommendations
Two work programs are proposed. One work program consists of drill programs (infill drilling at Fekola and Fekola North; RC drilling, supplemented by additional core and auger drilling at Anaconda; and geotechnical drilling designed to ensure geotechnical parameters are sufficient to support Mineral Reserve estimates, safe mining practices, and support the pit designs as the pit grows deeper and expands to the north), and engineering optimization studies (collectively about $18.8 M to complete). The second work program will use information from the completed drill programs to update Mineral Resource estimates (about $0.05 M to complete).
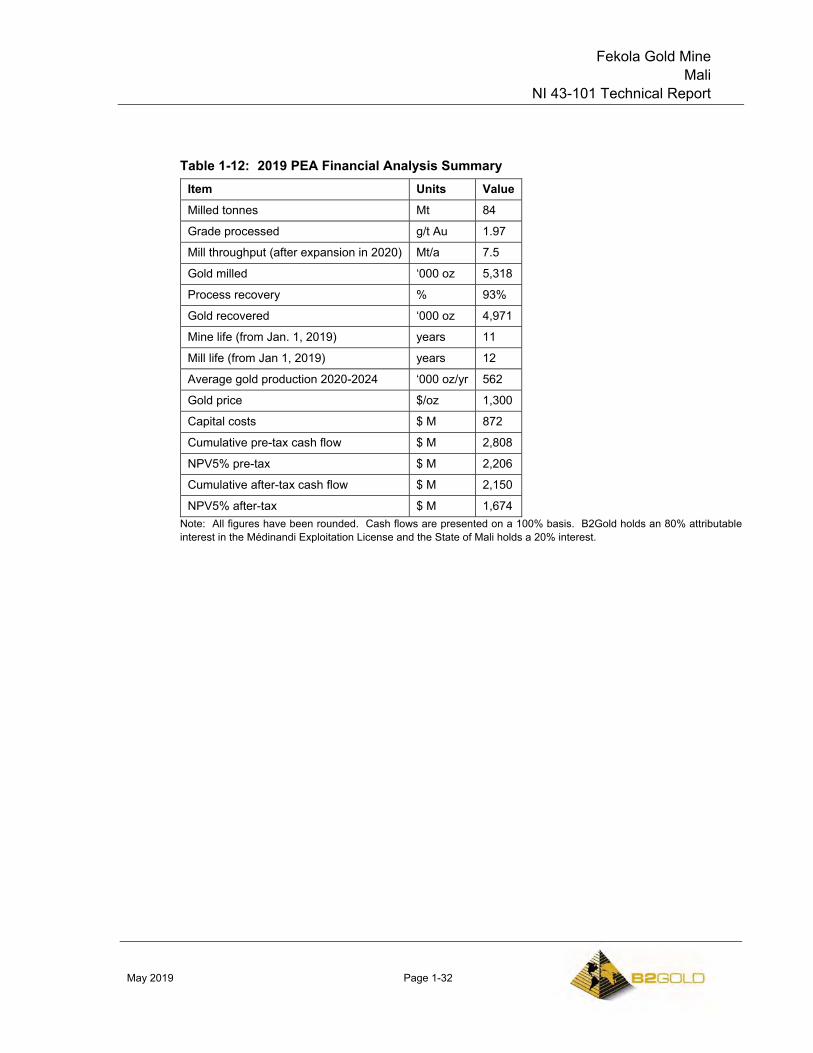
Fekola Gold Mine Mali
NI 43-101 Technical Report
May 2019 Page 1-32
Table 1-12: 2019 PEA Financial Analysis Summary Item Units Value Milled tonnes Mt 84
Grade processed g/t Au 1.97
Mill throughput (after expansion in 2020) Mt/a 7.5
Gold milled ‘000 oz 5,318
Process recovery % 93%
Gold recovered ‘000 oz 4,971
Mine life (from Jan. 1, 2019) years 11
Mill life (from Jan 1, 2019) years 12
Average gold production 2020-2024 ‘000 oz/yr 562
Gold price $/oz 1,300
Capital costs $ M 872
Cumulative pre-tax cash flow $ M 2,808
NPV5% pre-tax $ M 2,206
Cumulative after-tax cash flow $ M 2,150
NPV5% after-tax $ M 1,674 Note: All figures have been rounded. Cash flows are presented on a 100% basis. B2Gold holds an 80% attributable interest in the Médinandi Exploitation License and the State of Mali holds a 20% interest.
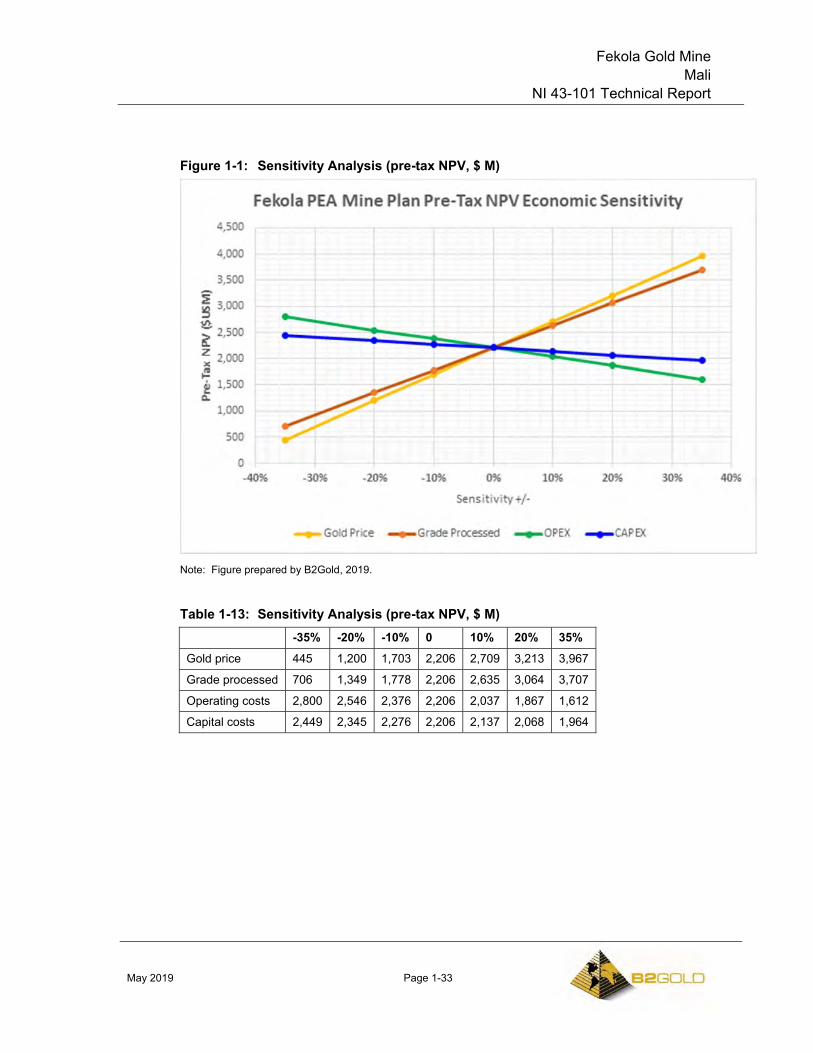
Fekola Gold Mine Mali
NI 43-101 Technical Report
May 2019 Page 1-33
Figure 1-1: Sensitivity Analysis (pre-tax NPV, $ M)
Note: Figure prepared by B2Gold, 2019.
Table 1-13: Sensitivity Analysis (pre-tax NPV, $ M) -35% -20% -10% 0 10% 20% 35%
Gold price 445 1,200 1,703 2,206 2,709 3,213 3,967
Grade processed 706 1,349 1,778 2,206 2,635 3,064 3,707
Operating costs 2,800 2,546 2,376 2,206 2,037 1,867 1,612
Capital costs 2,449 2,345 2,276 2,206 2,137 2,068 1,964
Fekola Gold Mine Mali
NI 43-101 Technical Report
May 2019 Page 2-1
2.0 INTRODUCTION
2.1 Introduction
Mr. Tom Garagan, P.Geo., Mr. Peter Montano, P.E., Mr. John Rajala, P.E. and Mr. Ken Jones, P.E., collectively the Qualified Persons (QPs) prepared an NI 43-101 Technical Report (the Report) on the Fekola Gold Mine (Fekola Mine) for B2Gold Corp. (B2Gold). The Fekola Mine is located west of the capital Bamako in the République de Mali (State of Mali or Mali; Figure 2-1).
2.2 Terms of Reference
The Report was prepared to support disclosures in the B2Gold news release dated 26 March, 2019, entitled “B2Gold Corp. Announces Very Positive Results from the Expansion Study Preliminary Economic Analysis for the Fekola Mine in Mali (owned 80% B2Gold: 20% State of Mali)”.
This Report provides updated information on the current operation of the Fekola Mine, including an updated Mineral Resource and Mineral Reserve estimate.
The Report also provides a summary of a preliminary economic assessment (PEA) completed in support of a potential mine expansion (the 2019 PEA). The 2019 PEA has no impact on the Mineral Reserves and the key assumptions and parameters supporting the Mineral Reserves. The Mineral Reserves are considered to remain current and valid in light of the key assumptions and parameters used in the 2019 PEA.
The term “Project” is used in reference to the overall mineral tenure holdings.
Units used in the report are metric units unless otherwise noted. Monetary units are in United States dollars (US$) unless otherwise stated. The currency in Mali is the Communauté Financière Africaine Franc (CFAF). Mineral Resources and Mineral Reserves are reported in accordance with the Canadian Institute of Mining, Metallurgy and Petroleum (CIM) Definition Standards for Mineral Resources and Mineral Reserves (May 2014; the 2014 CIM Definition Standards) and the CIM Estimation of Mineral Resources and Mineral Reserves Best Practice Guidelines (November 2003; 2003 CIM Best Practice Guidelines).
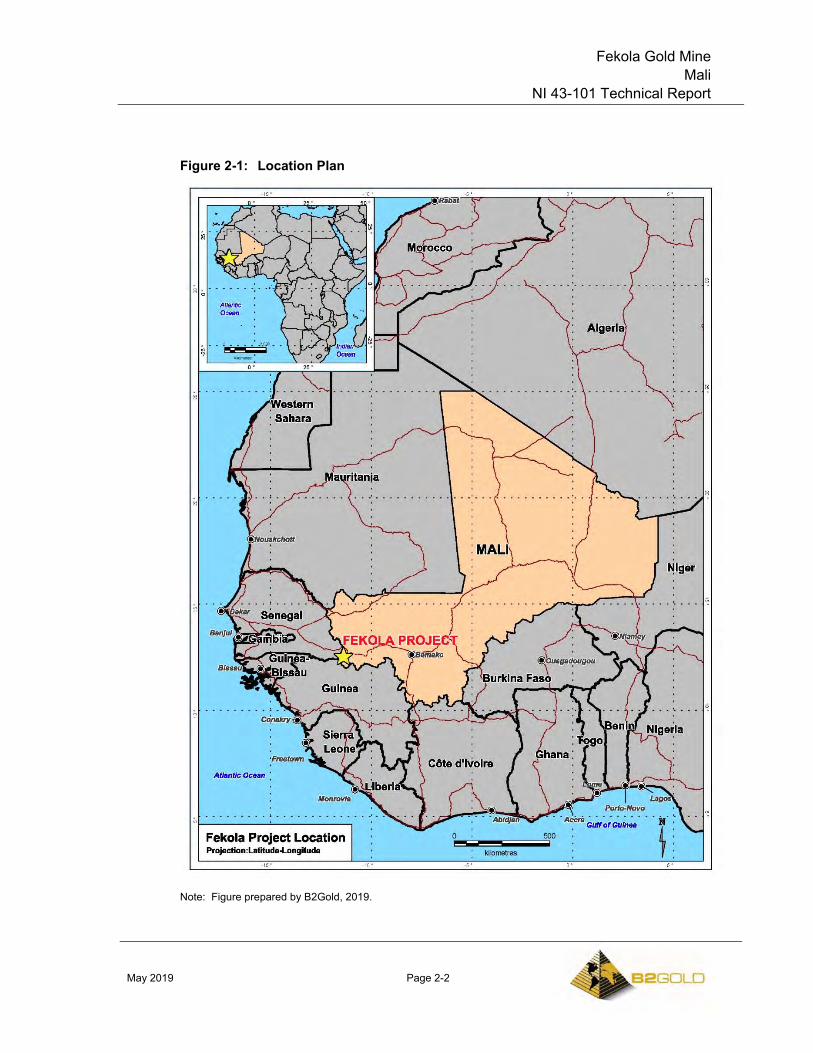
Fekola Gold Mine Mali
NI 43-101 Technical Report
May 2019 Page 2-2
Figure 2-1: Location Plan
Note: Figure prepared by B2Gold, 2019.
Fekola Gold Mine Mali
NI 43-101 Technical Report
May 2019 Page 2-3
2.3 Qualified Persons
The following serve as the qualified persons for this Technical Report as defined in National Instrument 43-101, Standards of Disclosure for Mineral Projects, and in compliance with Form 43-101F1:
• Mr. Tom Garagan, P.Geo.;
• Mr. Peter Montano, P.E.;
• Mr. John Rajala, P.E.;
• Mr. Ken Jones, P.E.
2.4 Site Visits and Scope of Personal Inspection
Mr. Tom Garagan has visited the mining operations on a number of occasions. His most recent site visits were from 22–24 May 2018, and 2–6 February, 2018. During the visits he inspected selected drill core, the open pit mining operations, toured the mill facilities, viewed infrastructure, and discussed aspects of geology, exploration and mining practices with site staff.
Mr. Peter Montano has visited the site numerous times, most recently from 8–14 April, 2019. During these visits Mr. Montano visited the active mining areas including the open pit, waste rock storage facilities (WRSFs), ore stockpiles, and run-of-mine (ROM) pad.
Mr. John Rajala has visited the mining operations on a number of occasions, most recently from February 27–March 6, 2019. During the most recent site visit, Mr. Rajala inspected the process plant, reviewed the current process plant operation and mill expansion plans with the management and metallurgical groups, and reviewed ongoing site projects. He also toured the tailings storage facility (TSF).
Mr. Ken Jones visited the Fekola operation from 7–16 February and 8–20 August, 2018 and 24 February–6 March, 2019. During the site visits, Mr. Jones viewed the TSF, WRSFs, ancillary facilities and surrounding area, and discussed with staff improvements to the health, safety and environmental management systems and performance including audits by external experts. Mr. Jones also provided review and direction in support of technical study in such areas as progressive rehabilitation, surface water management, and mine materials geochemistry. Mr. Jones also provided input into the development of the asset retirement obligation estimate.
2.5 Effective Dates
There are a number of effective dates pertinent to the Report, as follows:
• Database close-out date: September 30, 2018;
Fekola Gold Mine Mali
NI 43-101 Technical Report
May 2019 Page 2-4
• Effective date of the Mineral Resource estimate for Fekola: 31 December, 2018;
• Effective date of the Mineral Resource estimate for Anaconda: 31 December, 2018;
• Effective date of the latest information on ongoing drill programs: 31 March, 2019;
• Effective date of the Mineral Reserve estimates: 31 December, 2018;
• Effective date of the financial analysis supporting the 2019 PEA: 26 March, 2019.
The overall Report effective date is taken to be 26 March, 2019 and is based on the effective date of the financial analysis supporting the 2019 PEA.
2.6 Information Sources and References
Reports and documents listed in Section 3 and Section 27 of this Report were used to support preparation of the Report. Additional information was provided by B2Gold personnel as requested. Supplemental information was also provided to the QPs by third-party consultants retained by B2Gold in their areas of expertise.
Information pertaining to surface rights, royalties, environmental, permitting and social considerations, marketing and taxation were sourced from B2Gold experts in those fields as required.
2.7 Previous Technical Reports
B2Gold has previously filed the following technical reports on the Project:
• Garagan, T., Montano, P., Lytle, W., Jones, K., Hunter, S. and Morgan, D., 2015: NI 43-101 Technical Report Feasibility Study on the Fekola Gold Project in Mali: technical report prepared by B2Gold and Lycopodium Minerals Pty Ltd for B2Gold, effective date 30 June, 2015
• Garagan, T., Lytle, W., Johnson, N., Kaye, C., Tschabrun, D., Wiid, G., and Coetzee, S., 2014: Fekola Gold Project, Mali, NI 43-101 Technical Report on Preliminary Economic Assessment: technical report prepared by B2Gold, MPR Geological Consultants Pty Ltd, Mine and Quarry Engineering Services Inc, and Epoch Resources Pty Ltd for B2Gold, effective date 3 June, 2014.
Fekola Gold Mine Mali
NI 43-101 Technical Report
May 2019 Page 3-1
3.0 RELIANCE ON OTHER EXPERTS
This section is not relevant to this Report.
Fekola Gold Mine Mali
NI 43-101 Technical Report
May 2019 Page 4-1
4.0 PROPERTY DESCRIPTION AND LOCATION
4.1 Introduction
The Fekola Mine is located on the border between Mali and Senegal, about 210 km south of Kayes and approximately 40 km south of the city of Kéniéba. The mine is situated at UTM-WGS84 1,387,300 N, 242,200 E.
4.2 Property and Title in Mali
4.2.1 Mineral Title
All new mineral titles issued after February 2012 are governed by the 2012 Mining Code and related 2012 Decrees:
• Law No 2012-015 of 27 February, 2012, relating to the 2012 Mining Code;
• Decree No 2012-311/P-RM of 21 June, 2012, pertaining to the application of the 2012 Mining Code;
• Decree No 2012-490/PM-RM of 7 September, 2012, pertaining to the approval of the model prospecting, exploration, and mining agreement to be entered into between mineral title applicants and the State of Mali;
• Decree No 2012-717/PM-RM of 20 December, 2012, pertaining to the operating and management of a fund to finance exploration, training, and promotion of mining activities.
The 2012 Mining Code and related 2012 Decrees are in force and have superseded the pre-existing 1999 Mining Code and related 1999 Decrees. However, some aspects are still governed by the 1999 mining legislation for existing titles.
The State owns all of the mineral rights and the Mines Minister has the final responsibility for the administration of mining activity, although the Minister is assisted by, and delegates certain powers to, the Direction Nationale de la Geologies et des Mines (DNGM).
The Mining Code defines six types of mining titles (Table 4-1). Title holders must pay fixed fees for the grant, assignment, transfer, and renewal of mining titles, as well as annual surface rights. These fees are set out in the 2012 Mining Regulations.
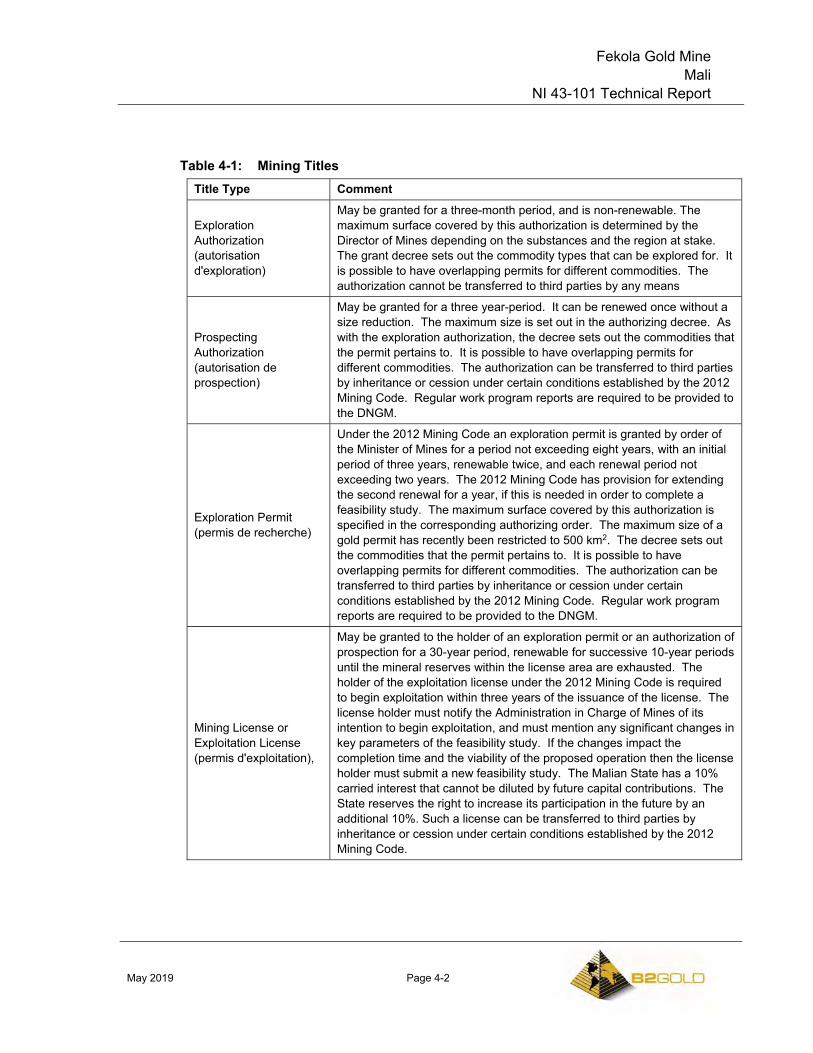
Fekola Gold Mine Mali
NI 43-101 Technical Report
May 2019 Page 4-2
Table 4-1: Mining Titles Title Type Comment
Exploration Authorization (autorisation d'exploration)
May be granted for a three-month period, and is non-renewable. The maximum surface covered by this authorization is determined by the Director of Mines depending on the substances and the region at stake. The grant decree sets out the commodity types that can be explored for. It is possible to have overlapping permits for different commodities. The authorization cannot be transferred to third parties by any means
Prospecting Authorization (autorisation de prospection)
May be granted for a three year-period. It can be renewed once without a size reduction. The maximum size is set out in the authorizing decree. As with the exploration authorization, the decree sets out the commodities that the permit pertains to. It is possible to have overlapping permits for different commodities. The authorization can be transferred to third parties by inheritance or cession under certain conditions established by the 2012 Mining Code. Regular work program reports are required to be provided to the DNGM.
Exploration Permit (permis de recherche)
Under the 2012 Mining Code an exploration permit is granted by order of the Minister of Mines for a period not exceeding eight years, with an initial period of three years, renewable twice, and each renewal period not exceeding two years. The 2012 Mining Code has provision for extending the second renewal for a year, if this is needed in order to complete a feasibility study. The maximum surface covered by this authorization is specified in the corresponding authorizing order. The maximum size of a gold permit has recently been restricted to 500 km2. The decree sets out the commodities that the permit pertains to. It is possible to have overlapping permits for different commodities. The authorization can be transferred to third parties by inheritance or cession under certain conditions established by the 2012 Mining Code. Regular work program reports are required to be provided to the DNGM.
Mining License or Exploitation License (permis d'exploitation),
May be granted to the holder of an exploration permit or an authorization of prospection for a 30-year period, renewable for successive 10-year periods until the mineral reserves within the license area are exhausted. The holder of the exploitation license under the 2012 Mining Code is required to begin exploitation within three years of the issuance of the license. The license holder must notify the Administration in Charge of Mines of its intention to begin exploitation, and must mention any significant changes in key parameters of the feasibility study. If the changes impact the completion time and the viability of the proposed operation then the license holder must submit a new feasibility study. The Malian State has a 10% carried interest that cannot be diluted by future capital contributions. The State reserves the right to increase its participation in the future by an additional 10%. Such a license can be transferred to third parties by inheritance or cession under certain conditions established by the 2012 Mining Code.
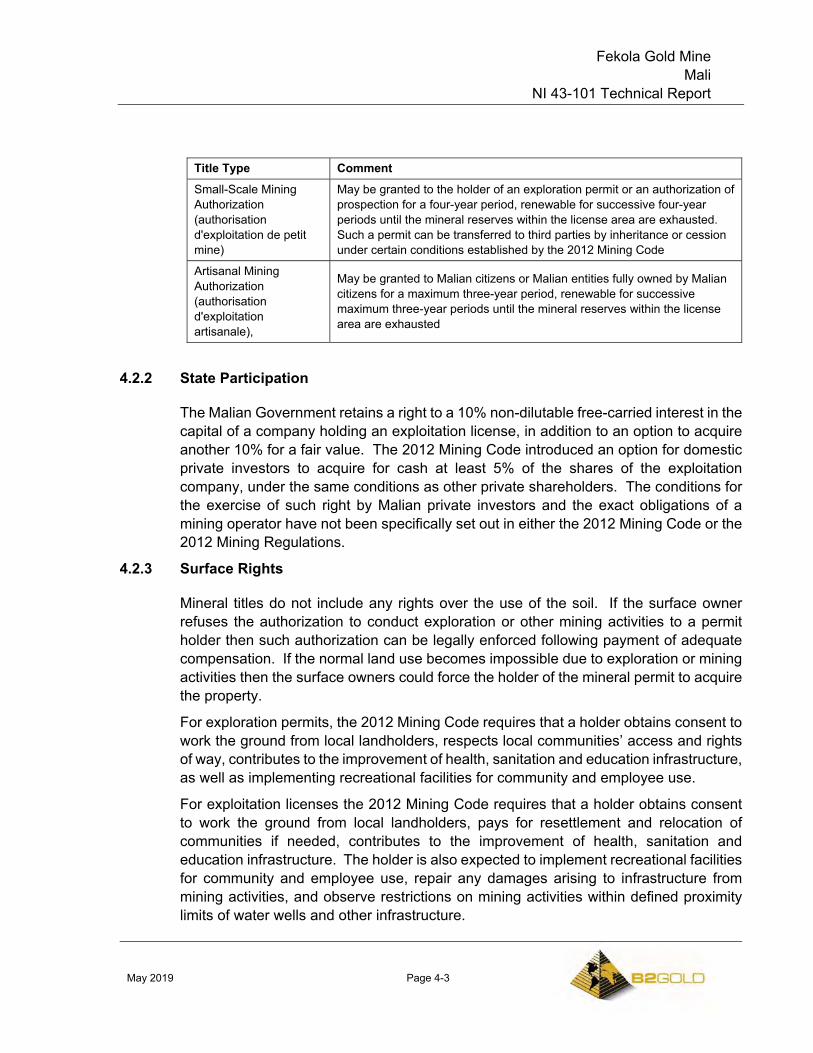
Fekola Gold Mine Mali
NI 43-101 Technical Report
May 2019 Page 4-3
Title Type Comment Small-Scale Mining Authorization (authorisation d'exploitation de petit mine)
May be granted to the holder of an exploration permit or an authorization of prospection for a four-year period, renewable for successive four-year periods until the mineral reserves within the license area are exhausted. Such a permit can be transferred to third parties by inheritance or cession under certain conditions established by the 2012 Mining Code
Artisanal Mining Authorization (authorisation d'exploitation artisanale),
May be granted to Malian citizens or Malian entities fully owned by Malian citizens for a maximum three-year period, renewable for successive maximum three-year periods until the mineral reserves within the license area are exhausted
4.2.2 State Participation
The Malian Government retains a right to a 10% non-dilutable free-carried interest in the capital of a company holding an exploitation license, in addition to an option to acquire another 10% for a fair value. The 2012 Mining Code introduced an option for domestic private investors to acquire for cash at least 5% of the shares of the exploitation company, under the same conditions as other private shareholders. The conditions for the exercise of such right by Malian private investors and the exact obligations of a mining operator have not been specifically set out in either the 2012 Mining Code or the 2012 Mining Regulations.
4.2.3 Surface Rights
Mineral titles do not include any rights over the use of the soil. If the surface owner refuses the authorization to conduct exploration or other mining activities to a permit holder then such authorization can be legally enforced following payment of adequate compensation. If the normal land use becomes impossible due to exploration or mining activities then the surface owners could force the holder of the mineral permit to acquire the property.
For exploration permits, the 2012 Mining Code requires that a holder obtains consent to work the ground from local landholders, respects local communities’ access and rights of way, contributes to the improvement of health, sanitation and education infrastructure, as well as implementing recreational facilities for community and employee use.
For exploitation licenses the 2012 Mining Code requires that a holder obtains consent to work the ground from local landholders, pays for resettlement and relocation of communities if needed, contributes to the improvement of health, sanitation and education infrastructure. The holder is also expected to implement recreational facilities for community and employee use, repair any damages arising to infrastructure from mining activities, and observe restrictions on mining activities within defined proximity limits of water wells and other infrastructure.
Fekola Gold Mine Mali
NI 43-101 Technical Report
May 2019 Page 4-4
4.2.4 Environmental
Under the 2012 Mining Code, the holder of an exploitation license is subject to the conditions specified in an associated Environmental Permit based on an environmental and social impact assessment.
A Rehabilitation and Mine Closure Plan is submitted as part of the application for the exploitation licence application. Rehabilitation and security work specified in the Plan must be guaranteed by funds held in a US dollar escrow account opened with an internationally-recognized bank. Amendment No 1 of the Fekola Establishment Convention dated 2 March 2017 specifies how the escrow fund will be funded initially by Fekola SA. Funding is based on units of production basis at an initial rate of US$0.502/t for 49.17 Mt processed, which equates to a maximum amount of US$24.7 M, in accordance with the most recently-submitted Rehabilitation and Mine Closure Plan for the Fekola Mine, dated September 2015 (refer to Section 20.7 for discussion of the most recently-estimated closure costs). The Rehabilitation and Mine Closure Plan provided by the 2012 Mining Code must be updated every five years. Upon approval of such amended plan, if the extent of the project changes due to exploration success, technical efficiencies, commercial or other factors, then the units of production funding rate per tonne processed and the cumulative amount to be funded over the mine life in the escrow account shall be adjusted to reflect the new cumulative amount stipulated in the revised Rehabilitation and Mine Closure Plan. Any amount funding the escrow account will be tax deductible as at the date of its transfer to the escrow account for income tax (or any equivalent tax) purposes. The funds can only be used during the term for reclamation and closure purposes.
The 2012 Mining Code imposes continued civil liability on the holder of an exploitation license in respect of damages or accidents caused by old equipment, even after the closure of the mine and issuance of an environmental discharge.
There is also a requirement that the license holder reports annually on the effect of mining activities on the use of the land, the environment and the health of the population.
4.2.5 Water
Legislation relating to access to water resources is governed by Law No. 02-006 of 31 January 2002 pertaining to the water code. The Interministerial Order No. 07- 1099/MMEE–MEA–MA–MEP–MATCL–SG, dated 4 May 2007, sets the conditions for using water resources.
4.2.6 Taxation
Capital gains taxes are 10% on transfer of mining titles to third parties under the 2012 Mining Code.
Fekola Gold Mine Mali
NI 43-101 Technical Report
May 2019 Page 4-5
If no capital gains are payable, then a tax that is equivalent to 2% of the costs of works performed (for research permits and prospection authorizations) and 1% of the value of the project as per a completed feasibility study (for exploitation licenses and exploitation authorizations) is payable upon the assignment of the project to a third party.
Value added tax (VAT) is payable in Mali; however, the 2012 Mining Code has a provision that exploitation license holders have a three-year VAT exemption period.
The Industrial and Commercial Profits tax (IBIC-IS) or company tax is 30%. For exploitation license holders, there is a 15-year period from the start of production where the corporate income tax is reduced to 25%.
Holders of an exploitation license that produce, in one year, more than 10% of the expected quantity fixed in the annual production program approved by their shareholders’ general assembly are liable for additional taxes. This consists of standard taxes and rights applying to operations and results relating to overproduction.
A special tax on certain products (Impôt Spécial sur Certains Produits or ISCP), based on turnover exclusive of VAT, also applies and is based on the Mining Group assignment. For a gold project, the applicable ISCP rate in force upon enactment of the 2012 Mining Code is 3%.
4.2.7 Royalties
The 2012 Mining Code introduced an ad valorem tax applicable to all substances, the taxable basis of which is the square-mine value (valeur carreau mine) of extracted substances, exported or not, minus intermediary fees and expenses. The tax rate is based on specified Mining Groups.
Gold and other precious metals are levied at a 3% royalty rate.
4.2.8 Fraser Institute Survey
B2Gold has used the Investment Attractiveness Index from the 2018 Fraser Institute Annual Survey of Mining Companies report (the Fraser Institute survey) as a credible source for the assessment of the overall political risk facing an exploration or mining project in Mali.
B2Gold has relied on the Fraser Institute survey because it is globally regarded as an independent report-card style assessment to governments on how attractive their policies are from the point of view of an exploration manager or mining company, and forms a proxy for the assessment by industry of political risk in Mali from the mining perspective.
The Fraser Institute annual survey is an attempt to assess how mineral endowments and public policy factors such as taxation and regulatory uncertainty affect exploration investment.
Fekola Gold Mine Mali
NI 43-101 Technical Report
May 2019 Page 4-6
Overall, Mali ranked 50 out of 83 jurisdictions in the attractiveness index survey in 2018; 63 out of 831 in the policy perception index; and 38 out of 83 in the best practices mineral potential index.
4.3 Project Ownership
The Médinandi Exploitation License, which hosts the Fekola Mine, was initially held in the name of Songhoi Resources SARL (Songhoi). B2Gold initially acquired a 90% interest in Songhoi through the acquisition of Papillon Resources Pty. Ltd. (Papillon) in October 2014 and purchased the remaining 10% non-controlling interest in Songhoi held by Mani SARL through a subsequent transaction in January 2015.
Fekola S.A., the Malian exploitation company, was incorporated on March 17, 2016 and merged with Songhoi in December 2016. As required under the 2012 Mining Code, B2Gold contributed a 10% free carried non-dilutable interest in Fekola S.A. to the State of Mali. Under the 2012 Mining Code, the State of Mali also had the option to purchase an additional 10% participating interest in Fekola S.A., which it exercised. As a result, the State of Mali holds a 20% interest in Fekola S.A., and B2Gold holds the remaining 80% interest.
Fekola S.A. is a limited liability company (société anonyme) that is duly incorporated with the Trade and Property Credit Register (Registre du Commerce et du Crédit Mobilier or RCCM) and validly exists under the laws of Mali. The company’s purpose is to conduct exploration and mining activities in Mali and overseas. The company is managed by a general manager (directeur général), and one or more deputy general managers (directeur general adjoints), under the direction of a board of directors with five directors appointed by B2Gold and two by the State of Mali.
The exploration permit (Menankoto Sud) is held by Menankoto SARL, where B2Gold holds a 95% interest and a Malian company, Societe d’Ingeneirie Informatique et Exploitation SARL (S2IEM), holds 5%.
The prospecting authorization (Bantako Nord) is held by Dampan Ressources, where B2Gold holds a 90% interest and a Malian company, Dioula Ressources SARL holds 10%.
4.4 Agreements
In August 2017, B2Gold finalized certain additional agreements with the State of Mali including the Fekola Shareholders Agreement, the Share Purchase Agreement and an amendment to the Fekola Convention to address and clarify certain issues under the 2012 Mining Code.
The Fekola Convention, as amended, governs the procedural and economic parameters pursuant to which B2Gold operates the Fekola Mine.
Fekola Gold Mine Mali
NI 43-101 Technical Report
May 2019 Page 4-7
The Fekola Shareholders Agreement and the Share Purchase Agreement for the purchase of the additional 10% of Fekola S.A. were signed by the relevant Malian government ministers in August 2017. The participation of the State of Mali in Fekola S.A. for a total of 20% was approved by the Malian Council of Ministers Mali, through an ordinance and a decree of the Council of Ministers, signed by the President of Mali in August 2018.
In light of such approval, B2Gold transferred ownership of 20% of Fekola S.A. to the State of Mali. The first non-participating 10% of the State of Mali's ownership entitles it to an annual priority dividend equivalent to 10% of calendar net income of Fekola S.A. The second fully participating 10% of the State of Mali's interest entitles it to ordinary dividends payable on the same basis as any ordinary dividends declared and payable to B2Gold for 80% interest.
4.5 Establishment Convention
B2Gold signed the Fekola Convention in March 2017 in the form required under the 2012 Mining Code that relates to, among other things, the ownership, permitting, reclamation bond requirements, development, operation and taxation applicable to the Fekola Mine with the State of Mali.
In August 2017, B2Gold finalized and signed an amendment to the Fekola Convention to address and clarify certain issues under the 2012 Mining Code.
The Establishment Convention will expire when the Médinandi Exploitation License expires.
4.6 Mineral Tenure
The Project consists of three mining tenements, totalling 137 km2.
A 75 km2 mining lease (the Médinandi Exploitation License; Figure 4-1) was granted over the former Médinandi Exploration Permit area on 13 February 2014, under permit number 0070/PM-RM. The requirements to maintain the license included construction of the mine as planned, which has occurred. In addition, there are requirements for payment of certain nominal annual fees and filing of various standard reports.
B2Gold-affiliated companies hold one exploration permit (Menankoto Sud) and one prospecting authorization (Bantako Nord) within close proximity to the Médinandi tenement (refer to Figure 4-1). Menankoto Sud and Bantako Nord are held by Menankoto SARL and Dampan Ressources SARL respectively (refer to Section 4.3).
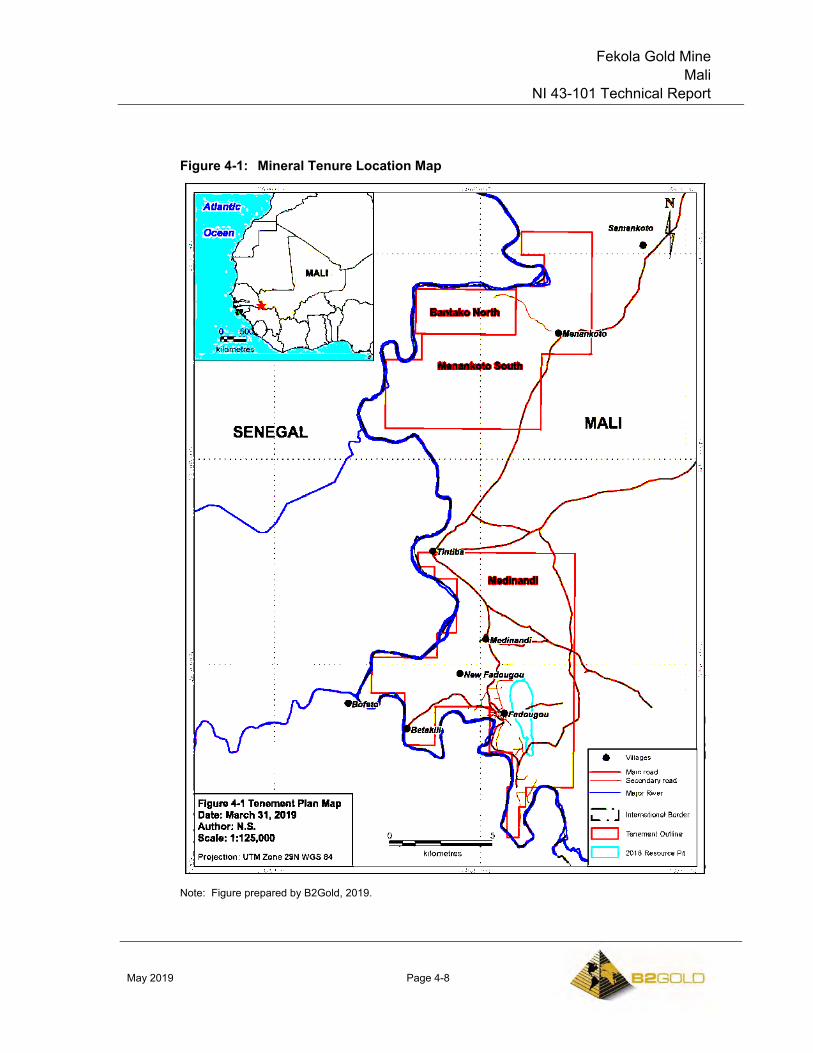
Fekola Gold Mine Mali
NI 43-101 Technical Report
May 2019 Page 4-8
Figure 4-1: Mineral Tenure Location Map
Note: Figure prepared by B2Gold, 2019.
Fekola Gold Mine Mali
NI 43-101 Technical Report
May 2019 Page 4-9
The Menankoto Sud exploration permit is 52 km2 in area and is located approximately 13 km to the north of the Médinandi Exploitation License. The permit was granted on 4 February 2014, and has been renewed twice, with the current expiry date being 20 February 2021. Minimum expenditures are required to maintain the permit, and comprise CFAF 65.4 M in Year 1, CFAF 210.5 M in Year 2, and CFAF 287 M in Year 3, for a total required expenditure commitment of CFAF 562.9 M. The minimum expenditures for the first period have been met and the permit has been renewed.
The Bantako Nord prospecting authorization is 10 km2 in area and is located north and immediately adjacent to the Menankoto Sud exploration License. The prospecting authorization was granted on 27 November 2018 and is valid until 26 November 2021, renewable once for a three-year period. Minimum expenditures are required to maintain the prospecting authorization, and comprise CFAF 29 M in Year 1, CFAF 70 M in Year 2, and CFAF 174 M in Year 3, for a total required expenditure commitment of CFAF 273 M.
B2Gold has additional tenure holdings in Mali, which are at a grassroots exploration stage. These tenements are not considered part of the Project as defined due to their distance from the Médinandi Exploitation License; the distances being such that there is no likelihood of shared infrastructure with the Fekola Mine.
4.7 Surface Rights
Malian law provides for private individuals and companies to own surface rights under a formal titling and registration system, but in the Project area there are no private surface owners. However, the State of Mali owns all surface rights in the Fekola Mine area, and no surface rights have been registered to a private entity.
Subsistence farmers typically use the land under a customary use and lineage system where no formal title has been registered but the land is allowed to be used. This recognition is only tacit and the Malian Government can appropriate the land as it sees fit.
4.8 Water Rights
The following permits were granted on 30 May 2017 by the Governor of Kayes Province relating to water abstraction, storage and discharge:
• Declaration 0710: Authorization to pump water from drill holes for processing and potable uses;
• Declaration 0711: Authorization to pump water from the Falémé River;
• Declaration 0712: Approval and authorization of the water storage dams;
• Declaration 0714: Approval and authorization of water diversion canal.
Fekola Gold Mine Mali
NI 43-101 Technical Report
May 2019 Page 4-10
The permits are valid for the life of the mine.
4.9 Royalties and Encumbrances
Royalties payable to the State of Mali are outlined in Section 4.2.7.
The settlement for the purchase on a 10% minority interest held by ZTS Traore in the Fekola project included an additional 1.65% royalty, which is due to ZTS. This royalty is only payable on the Médinandi exploitation licence area.
4.10 No-Go Zone
A “No-go Zone” with an area of 23.5 km2 was negotiated by B2Gold’s predecessor company Papillion, and compensated to the local community, culminating in decree number 13-008/PCK dated 11 March 2013 being issued by the Prefect of the Kéniéba Cercle. The No-go Zone precludes farming, house construction and artisanal mining in the compensated area for the duration of the Médinandi Exploitation License.
4.11 Permitting Considerations
Permitting considerations for operations are discussed in Section 20.
4.12 Environmental Considerations
Environmental considerations for operations are discussed in Section 20.
4.13 Social License Considerations
Social licence considerations for operations are discussed in Section 20.
4.14 Comments on Property Description and Location
Environmental liabilities associated with the Project are those expected to be associated with an operating open pit mine in Mali. To the extent known, there are no other significant factors and risks that may affect access, title, or the right or ability to perform work on the Project that have not been discussed in this Report.
Fekola Gold Mine Mali
NI 43-101 Technical Report
May 2019 Page 5-1
5.0 ACCESSIBILITY, CLIMATE, LOCAL RESOURCES, INFRASTRUCTURE, AND PHYSIOGRAPHY
5.1 Accessibility
The Fekola Mine is located within the Kayes Region, in southwestern Mali, on the western border of Mali with Senegal. The mining operation is situated about 210 km south of Kayes and about 40 km south of the city of Kéniéba.
Access to the project site is by road from Dakar, Senegal or Bamako, Mali. From Bamako, it is approximately 480 road km along the Millennium Highway to Kéniéba and from Dakar it is approximately 1,100 km by road to Kéniéba. From Kéniéba, it is 40 km on unsealed roads to the Fekola Mine.
The main mine access is via air. B2Gold has constructed a purpose-built gravel airstrip adjacent the mine. B2Gold operates two planes, with regularly scheduled flights from Bamako to the mine site.
5.2 Climate
The Project is located in a sub-tropical climate area, with relatively high and uniform temperatures and distinct seasons; wet season (July to September) and the dry season (October to June). There is a large variability in average annual rainfall. The mean total annual rainfall measured at Kéniéba Station, located 38 km north of the Project, was 1,086 mm over 44 years. A meteorological station within the Fekola Camp has shown a close correlation to the data from Kéniéba.
The temperatures in the region vary by season, with a mean annual temperature of approximately 28°C.
Mining activities are conducted year-round. Exploration activities are minimal during the period from July to September, due to the rains.
5.3 Local Resources and Infrastructure
Infrastructure that has been constructed to support mining activities is discussed in Section 18.
5.4 Physiography
The site is characterized by relatively flat laterite plateaus that rise approximately 30–40 m above the surrounding landscape, and generally drain to the west. At the edge of the laterite plateaus, the topography is relatively steep in comparison to the general site topography. Overall Project elevation ranges from 125–140 m above sea level.
Fekola Gold Mine Mali
NI 43-101 Technical Report
May 2019 Page 5-2
A number of drainage lines dissect the Project area and drain from east to west. The Falémé River flows in a northerly direction, although it displays river meanders in the area where the Fekola deposit is located.
The predominant vegetation is tropical savannah.
5.5 Comments on Sufficiency of Surface Rights
The mining license provides the license holder with exclusive access and use of the Project area. This does not give the license holder ownership of the land, but does make the land available for construction, operational and infrastructure needs.
The State of Mali owns all surface rights in the Fekola Mine area, and no surface rights have been registered to a private entity. Surface rights have been made available to the operation.
There is sufficient surface area for the open pit, waste rock storage facilities, plant, tailings storage facilities, associated infrastructure and other operational requirements for the planned life-of-mine and mine plan discussed in this Report, and for the 2019 PEA scenario discussed in Section 24 of the Report.
Fekola Gold Mine Mali
NI 43-101 Technical Report
May 2019 Page 6-1
6.0 HISTORY
6.1 Exploration History
A summary of the exploration history is provided in Table 6-1.
6.2 Production
There is no known commercial production from the Fekola area prior to B2Gold.
B2Gold declared commercial production from the Fekola open pit in November, 2017. Production to 31 December, 2018 is summarized in Table 6-2.
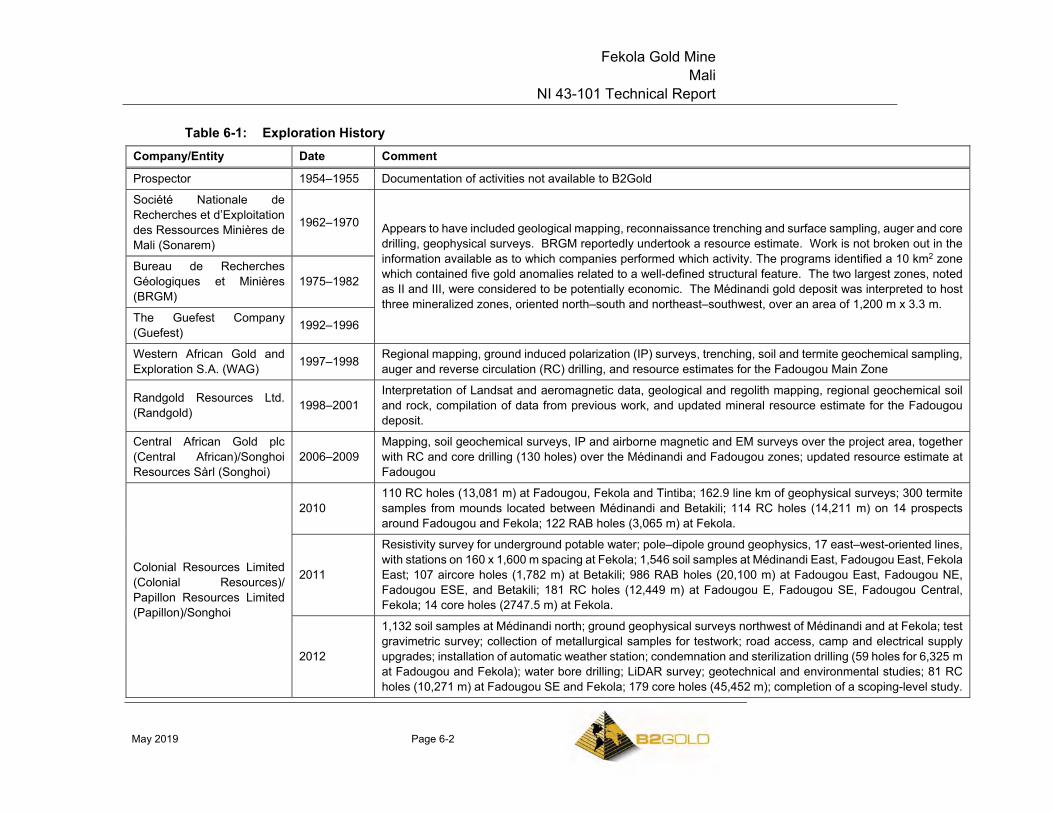
Fekola Gold Mine Mali
NI 43-101 Technical Report
May 2019 Page 6-2
Table 6-1: Exploration History Company/Entity Date Comment
Prospector 1954–1955 Documentation of activities not available to B2Gold
Société Nationale de Recherches et d’Exploitation des Ressources Minières de Mali (Sonarem)
1962–1970 Appears to have included geological mapping, reconnaissance trenching and surface sampling, auger and core drilling, geophysical surveys. BRGM reportedly undertook a resource estimate. Work is not broken out in the information available as to which companies performed which activity. The programs identified a 10 km2 zone which contained five gold anomalies related to a well-defined structural feature. The two largest zones, noted as II and III, were considered to be potentially economic. The Médinandi gold deposit was interpreted to host three mineralized zones, oriented north–south and northeast–southwest, over an area of 1,200 m x 3.3 m.
Bureau de Recherches Géologiques et Minières (BRGM)
1975–1982
The Guefest Company (Guefest) 1992–1996
Western African Gold and Exploration S.A. (WAG) 1997–1998 Regional mapping, ground induced polarization (IP) surveys, trenching, soil and termite geochemical sampling,
auger and reverse circulation (RC) drilling, and resource estimates for the Fadougou Main Zone
Randgold Resources Ltd. (Randgold) 1998–2001
Interpretation of Landsat and aeromagnetic data, geological and regolith mapping, regional geochemical soil and rock, compilation of data from previous work, and updated mineral resource estimate for the Fadougou deposit.
Central African Gold plc (Central African)/Songhoi Resources Sàrl (Songhoi)
2006–2009 Mapping, soil geochemical surveys, IP and airborne magnetic and EM surveys over the project area, together with RC and core drilling (130 holes) over the Médinandi and Fadougou zones; updated resource estimate at Fadougou
Colonial Resources Limited (Colonial Resources)/ Papillon Resources Limited (Papillon)/Songhoi
2010 110 RC holes (13,081 m) at Fadougou, Fekola and Tintiba; 162.9 line km of geophysical surveys; 300 termite samples from mounds located between Médinandi and Betakili; 114 RC holes (14,211 m) on 14 prospects around Fadougou and Fekola; 122 RAB holes (3,065 m) at Fekola.
2011
Resistivity survey for underground potable water; pole–dipole ground geophysics, 17 east–west-oriented lines, with stations on 160 x 1,600 m spacing at Fekola; 1,546 soil samples at Médinandi East, Fadougou East, Fekola East; 107 aircore holes (1,782 m) at Betakili; 986 RAB holes (20,100 m) at Fadougou East, Fadougou NE, Fadougou ESE, and Betakili; 181 RC holes (12,449 m) at Fadougou E, Fadougou SE, Fadougou Central, Fekola; 14 core holes (2747.5 m) at Fekola.
2012
1,132 soil samples at Médinandi north; ground geophysical surveys northwest of Médinandi and at Fekola; test gravimetric survey; collection of metallurgical samples for testwork; road access, camp and electrical supply upgrades; installation of automatic weather station; condemnation and sterilization drilling (59 holes for 6,325 m at Fadougou and Fekola); water bore drilling; LiDAR survey; geotechnical and environmental studies; 81 RC holes (10,271 m) at Fadougou SE and Fekola; 179 core holes (45,452 m); completion of a scoping-level study.
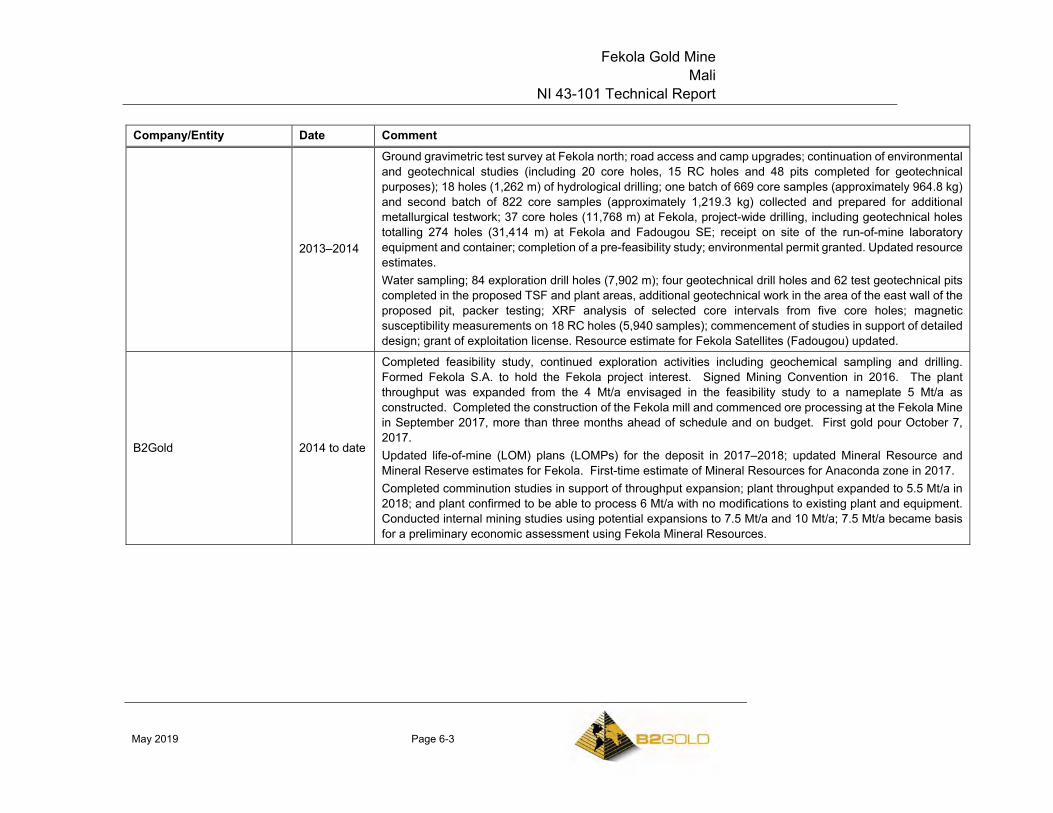
Fekola Gold Mine Mali
NI 43-101 Technical Report
May 2019 Page 6-3
Company/Entity Date Comment
2013–2014
Ground gravimetric test survey at Fekola north; road access and camp upgrades; continuation of environmental and geotechnical studies (including 20 core holes, 15 RC holes and 48 pits completed for geotechnical purposes); 18 holes (1,262 m) of hydrological drilling; one batch of 669 core samples (approximately 964.8 kg) and second batch of 822 core samples (approximately 1,219.3 kg) collected and prepared for additional metallurgical testwork; 37 core holes (11,768 m) at Fekola, project-wide drilling, including geotechnical holes totalling 274 holes (31,414 m) at Fekola and Fadougou SE; receipt on site of the run-of-mine laboratory equipment and container; completion of a pre-feasibility study; environmental permit granted. Updated resource estimates. Water sampling; 84 exploration drill holes (7,902 m); four geotechnical drill holes and 62 test geotechnical pits completed in the proposed TSF and plant areas, additional geotechnical work in the area of the east wall of the proposed pit, packer testing; XRF analysis of selected core intervals from five core holes; magnetic susceptibility measurements on 18 RC holes (5,940 samples); commencement of studies in support of detailed design; grant of exploitation license. Resource estimate for Fekola Satellites (Fadougou) updated.
B2Gold 2014 to date
Completed feasibility study, continued exploration activities including geochemical sampling and drilling. Formed Fekola S.A. to hold the Fekola project interest. Signed Mining Convention in 2016. The plant throughput was expanded from the 4 Mt/a envisaged in the feasibility study to a nameplate 5 Mt/a as constructed. Completed the construction of the Fekola mill and commenced ore processing at the Fekola Mine in September 2017, more than three months ahead of schedule and on budget. First gold pour October 7, 2017. Updated life-of-mine (LOM) plans (LOMPs) for the deposit in 2017–2018; updated Mineral Resource and Mineral Reserve estimates for Fekola. First-time estimate of Mineral Resources for Anaconda zone in 2017. Completed comminution studies in support of throughput expansion; plant throughput expanded to 5.5 Mt/a in 2018; and plant confirmed to be able to process 6 Mt/a with no modifications to existing plant and equipment. Conducted internal mining studies using potential expansions to 7.5 Mt/a and 10 Mt/a; 7.5 Mt/a became basis for a preliminary economic assessment using Fekola Mineral Resources.
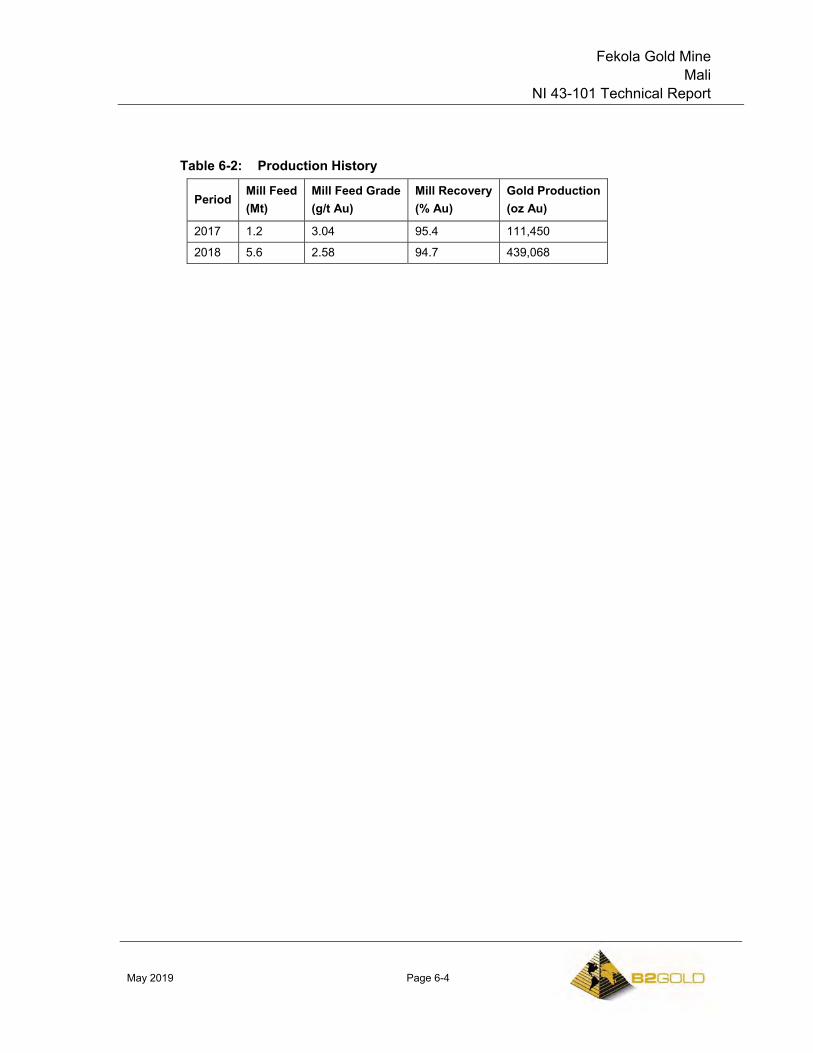
Fekola Gold Mine Mali
NI 43-101 Technical Report
May 2019 Page 6-4
Table 6-2: Production History
Period Mill Feed (Mt)
Mill Feed Grade (g/t Au)
Mill Recovery (% Au)
Gold Production (oz Au)
2017 1.2 3.04 95.4 111,450
2018 5.6 2.58 94.7 439,068
Fekola Gold Mine Mali
NI 43-101 Technical Report
May 2019 Page 7-1
7.0 GEOLOGICAL SETTING AND MINERALIZATION
7.1 Regional Geology
The Fekola Mine is hosted within an Inlier of Birimian (2,200 to 2,050 Ma) rocks of the West African craton, located on the border of eastern Senegal, western Mali and northern Guinea (Figure 7-1). The inlier is unconformably overlain to the north, east and south by Neoproterozoic (1,000 to 540 Ma) cliff-forming, flat-lying sandstones of the Taoudeni basin (Masurel et al., 2017) and bound to the west by the Hercynian (320 to 270 Ma) Mauritanide orogenic belt.
This window into the underlying Birimian rocks is termed the Kédougou–Kéniéba Inlier (KKI). The KKI is a greenstone belt characterized by sequences of approximately north–south-trending volcanic and sedimentary rocks, intruded at various stages by gabbroic suites and calc-alkaline granitoids (Diene et al., 2015). Two main crustal-scale structures; the Main Transcurrent Zone (MTZ) in the west and the Senegal–Mali shear zone system (SMSZ) in the east bisect the KKI (refer to Figure 7-1). These shear zones define the boundaries between the Mako, Dialé–Daléma, Falémé and Kofi Series rocks (Bassot, 1987).
The Mako Series (tholeiitic basalt, andesite lavas, with intercalated volcanic agglomerates and banded tuffs) and the Dialé–Daléma Series (sandstone and siltstone with intercalated calc-alkaline ashfall and lapilli tuffs) are separated by the northeast trending MTZ (Gueye et al., 2008). Immediately east of the Dialé–Daléma Series are two slivers of the Falémé Series, composed of carbonate-rich sedimentary rocks, minor basalts and andesites, rare rhyolites, and syn-tectonic granitoids (Hirdes and Davis, 2002).
The Falémé Series is bounded to the east by the SMSZ, which separates the Falémé Series from the Kofi Series sediments. The Kofi Series is composed of sandstones, argillites and platform carbonates intruded by S-type, peraluminous biotite-bearing granites (Lawrence et al, 2013). The Kofi Series hosts significant gold mineralization on the eastern side of the SMSZ and is the host to mineralization at Fekola. Fekola and all the historic and currently-producing large-scale gold mines on the Malian side of the KKI are adjacent to, on a splay off, or a parallel structure to the SMSZ.
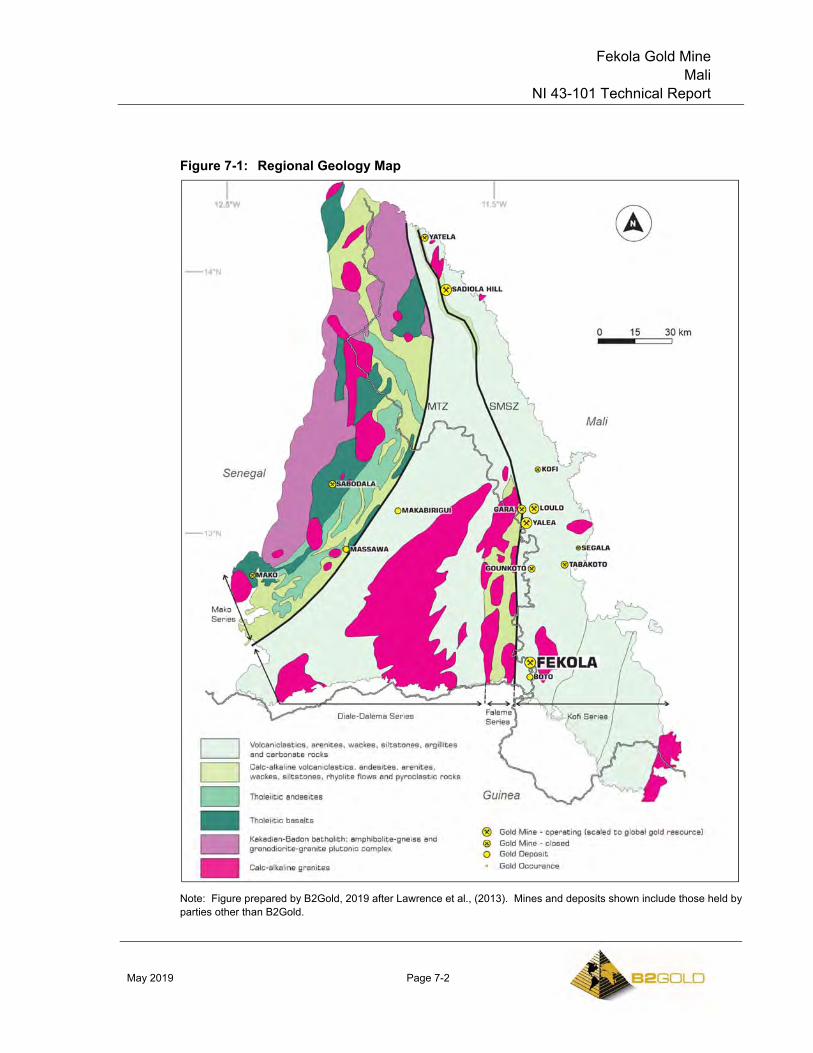
Fekola Gold Mine Mali
NI 43-101 Technical Report
May 2019 Page 7-2
Figure 7-1: Regional Geology Map
Note: Figure prepared by B2Gold, 2019 after Lawrence et al., (2013). Mines and deposits shown include those held by parties other than B2Gold.
Fekola Gold Mine Mali
NI 43-101 Technical Report
May 2019 Page 7-3
7.2 Project Geology
7.2.1 Lithologies
The Project area is hosted in a sequence of turbiditic sediments, volcanic rocks and igneous intrusions of the Kofi series that have been regionally metamorphosed to greenschist facies. The lithologies consist of phyllite, thinly-bedded calcareous siltstone-mudstone, marble, mass flow deposits (conglomerate), metapelite with diorite sills, cut by quartz-feldspar porphyry dykes and late cross cutting breccia zones.
The major lithologies are summarized from oldest to youngest in Table 7-1, and shown in map view in Figure 7-2
.
7.2.2 Weathering
The Fekola mine and Fekola North Extension are covered by a variable weathered regolith profile that varies from 15 to 45 m thick. The bulk of the regolith above the deposit contains transported unconsolidated pebbles and cobbles laid down by a paleo river channel. In these areas, the top of the weathering profile typically consists of a 1 m thick soil horizon underlain by a mottled clay zone composed of iron-rich and grey clays. This mottled clay zone grades downwards into the alluvial polymictic paleo-channel unit that is set in a clay matrix, then into bedrock. In some areas, the paleo-channel forms a lens encapsulated within saprolite above and saprock below.
The complete regolith profile is preserved in two small areas to the southeast and the northeast above Fekola. The profile in these areas consists of soil, underlain by laterite, then a mottled clay zone, then a residual regolith profile that can rapidly transition from saprolite to saprock to fresh rock with increasing depth.
7.2.3 Alteration
Pervasive and texturally-destructive dolomite ± albite ± tourmaline alteration is spatially associated with mineralization. The alteration overprints siltstone and mudstone fragments and the matrix of the breccia unit and it accompanies gold mineralization. Hematite alteration is present in the hanging wall and footwall phyllite unit near the contact between the footwall phyllite and mineralized banded siltstone–mudstone, diorite and breccias.
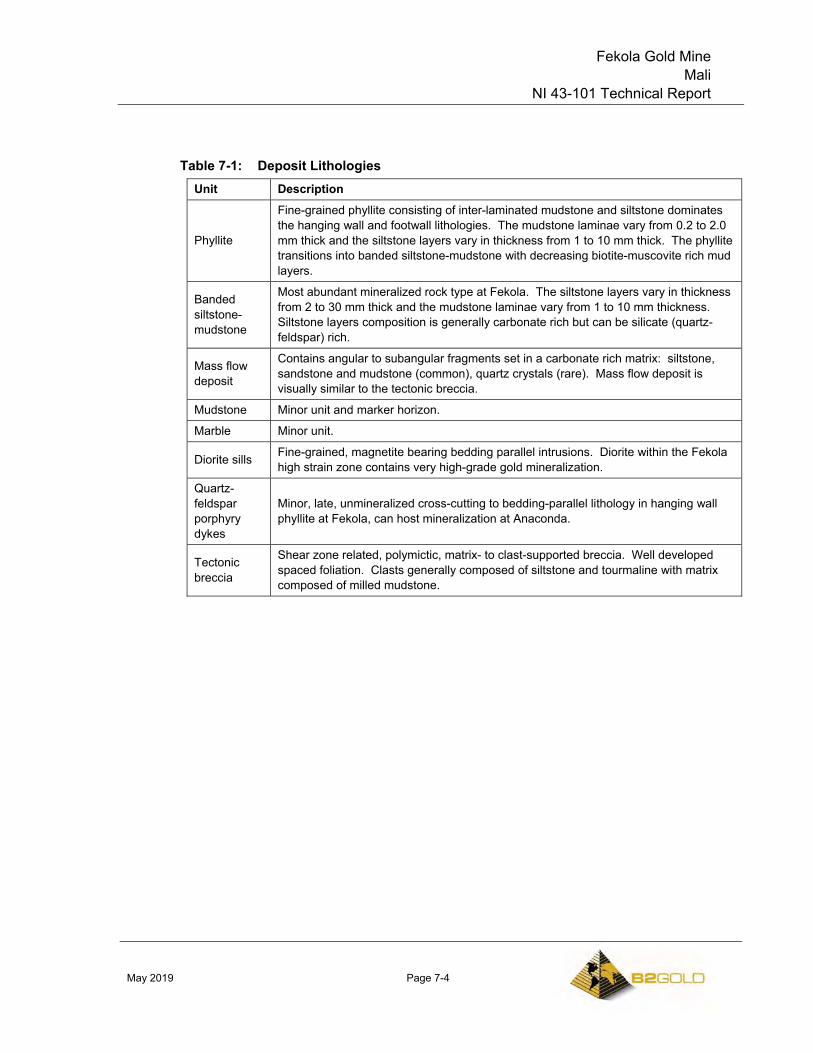
Fekola Gold Mine Mali
NI 43-101 Technical Report
May 2019 Page 7-4
Table 7-1: Deposit Lithologies Unit Description
Phyllite
Fine-grained phyllite consisting of inter-laminated mudstone and siltstone dominates the hanging wall and footwall lithologies. The mudstone laminae vary from 0.2 to 2.0 mm thick and the siltstone layers vary in thickness from 1 to 10 mm thick. The phyllite transitions into banded siltstone-mudstone with decreasing biotite-muscovite rich mud layers.
Banded siltstone-mudstone
Most abundant mineralized rock type at Fekola. The siltstone layers vary in thickness from 2 to 30 mm thick and the mudstone laminae vary from 1 to 10 mm thickness. Siltstone layers composition is generally carbonate rich but can be silicate (quartz-feldspar) rich.
Mass flow deposit
Contains angular to subangular fragments set in a carbonate rich matrix: siltstone, sandstone and mudstone (common), quartz crystals (rare). Mass flow deposit is visually similar to the tectonic breccia.
Mudstone Minor unit and marker horizon.
Marble Minor unit.
Diorite sills Fine-grained, magnetite bearing bedding parallel intrusions. Diorite within the Fekola high strain zone contains very high-grade gold mineralization.
Quartz-feldspar porphyry dykes
Minor, late, unmineralized cross-cutting to bedding-parallel lithology in hanging wall phyllite at Fekola, can host mineralization at Anaconda.
Tectonic breccia
Shear zone related, polymictic, matrix- to clast-supported breccia. Well developed spaced foliation. Clasts generally composed of siltstone and tourmaline with matrix composed of milled mudstone.
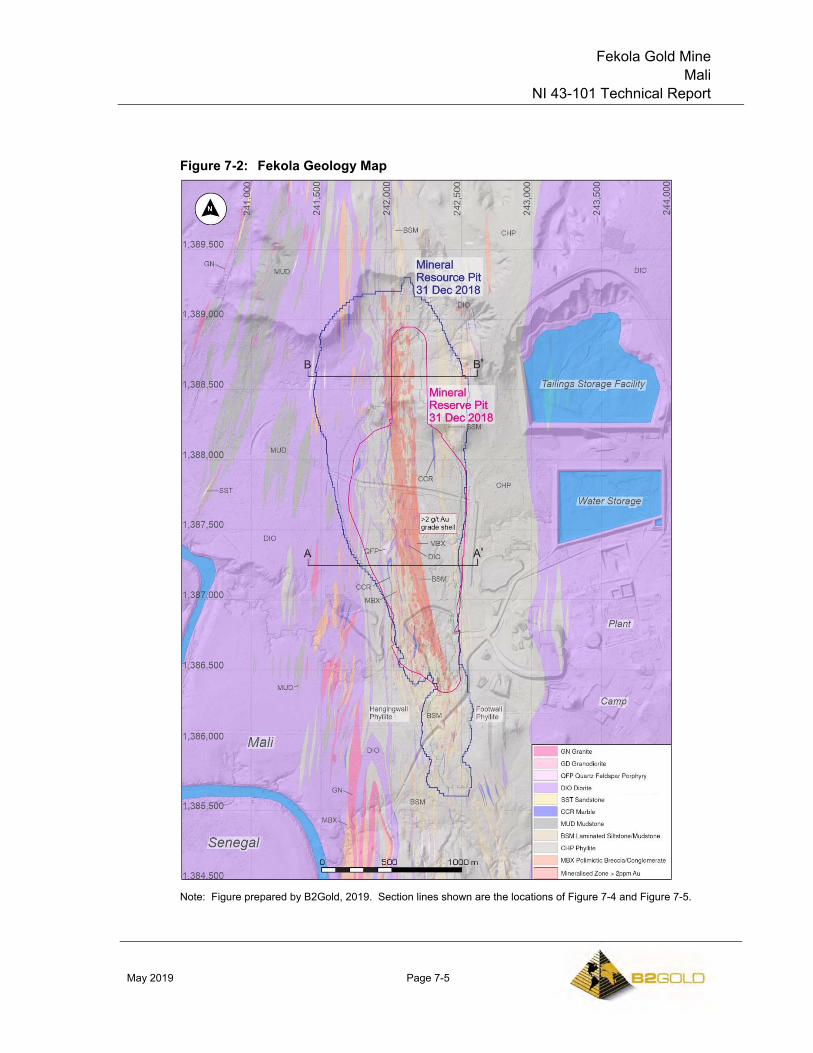
Fekola Gold Mine Mali
NI 43-101 Technical Report
May 2019 Page 7-5
Figure 7-2: Fekola Geology Map
Note: Figure prepared by B2Gold, 2019. Section lines shown are the locations of Figure 7-4 and Figure 7-5.
Fekola Gold Mine Mali
NI 43-101 Technical Report
May 2019 Page 7-6
7.2.4 Structure
Three deformation events and corresponding foliation developments control the orientation of folding, shearing and subsequent geometries of gold-bearing zones. These three deformation events formed, from oldest to youngest, north–northeast-, north–northwest- and north-trending mineralization orientations.
The high-grade Fekola shoot plunges at 14° towards 341° from the base of the paleochannel (124 mRL) at 1,386,330 mN, over 1,170 m of strike length. North of this locality, mineralization becomes more tightly constrained into a south-striking and steeply (at -66°) west-dipping zone above the footwall phyllite contact. Mineralization continues northwards for an additional 1,720 m strike length to 1,389,220 mN, based on drilling data available as of March 31, 2019.
High-grade zones are controlled by the intersection of sub-parallel, steeply west-dipping zones of high-strain and moderately west-dipping bedding, that forms part of a larger east-verging fold. The hinges of tight, asymmetric minor folds can preferentially exhibit intense replacement-type mineralization. The lineation formed by the intersection of high strain zones and bedding is a significant control on the long axis of mineralization and is repeated at all scales throughout the Fekola Mine and the Fekola North Extension. This intersection lineation may be colinear with the predominant plunge of fold axes within the host stratigraphy (Rhys, 2015). The main high-grade shoot spatially corresponds to a marked change in attitude, or flexure, along the deposit footwall contact between banded siltstone–mudstone and phyllite.
The Fekola stratigraphy and mineralization is cut by two principal sets of late brittle faults. The first, the Fekola Fault is a late, north–northwest-trending, west-dipping fault zone with apparent normal (extensional), dip-slip shear sense located at, or near the contact between mineralized banded siltstone-mudstone stratigraphy and footwall phyllite. Minimal displacement is attributed to the Fekola Fault.
The second generation of late brittle structures is characterized by east–west-striking, sub-vertical to steeply north- and south-dipping small-scale faults with carbonate (calcite-dominated) infill. These centimeter-scale structures are regularly spaced and generally exhibit a dextral (north side to the east) sense of displacement. Offset across these late small-scale faults is minimal.
7.3 Fekola
The Fekola deposit, including the Fekola North Extension has been outlined along strike for 3,280 m, can be as much as 200 m in width and extends based on current drilling to at least 440 m depth. The deposit remains open along strike and down plunge.
Gold mineralization at Fekola is dominantly (97%) hosted within fresh, non-oxidized rock and is intimately associated with fine-grained disseminated pyrite. High-grade gold
Fekola Gold Mine Mali
NI 43-101 Technical Report
May 2019 Page 7-7
(>2 g/t Au) mineralization is focused in a shoot-like geometry that plunges approximately 14° to the north–northwest in the Fekola deposit. Mineralization exhibits a more planar and north trending attitude in the Fekola North Extension, wherein the higher-grade shoot exhibits a more sub-horizontal aspect. Gold mineralization is associated with syn-metamorphic hydrothermal alteration. Fekola and the Fekola North extension are overprinted and geometrically controlled by a north-trending, steeply west-dipping zone of high-strain deformation, termed the Fekola High Strain Zone.
The grain-size of gold at Fekola ranges between 3.3–12.9 µm. In high-grade composites, gold is associated with silicate minerals and pyrite. In low-grade composites gold is invariably associated with pyrite (Zhou and Downing, 2015).
Figure 7-3 is a schematic vertical longitudinal section through Fekola and the Fekola North Extension.
Figure 7-4 and Figure 7-5 are schematic vertical cross sections through the Fekola Shoot and Fekola North Extension areas. The figure locations are indicated on Figure 7-2.
7.4 Anaconda
Anaconda is a collective term for the Anaconda, Adder, Cobra, Cascabel, Mamba and Boomslang satellite deposits that are situated about 20 km north of the Fekola Mine.
The combined Anaconda–Adder saprolite zone extends over 4,500 m along strike and up to 500 m wide at Anaconda and up to 200 m wide at Adder. Within these zones, mineralized saprolite varies from 2 to >40 m thick, averaging 13.5 m true thickness.
Mineralization occurs as flat-lying to slightly dipping mineralized zones within saprolite and saprock. Mineralization can locally be traced into bedrock.
7.5 Prospects/Exploration Targets
Prospects are discussed in Section 9.
7.6 Comments on Geological Setting and Mineralization
The understanding of the Project geology and mineralization is sufficient to support Mineral Resource and Mineral Reserve estimation and mine planning.
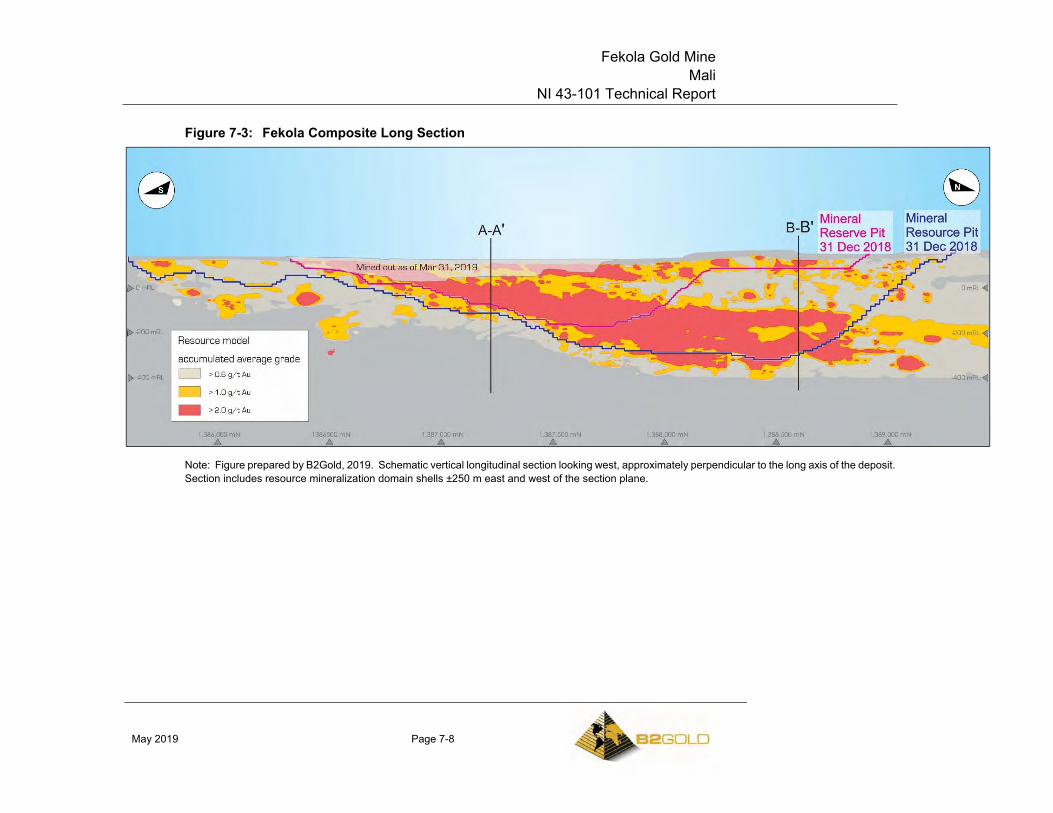
Fekola Gold Mine Mali
NI 43-101 Technical Report
May 2019 Page 7-8
Figure 7-3: Fekola Composite Long Section
Note: Figure prepared by B2Gold, 2019. Schematic vertical longitudinal section looking west, approximately perpendicular to the long axis of the deposit. Section includes resource mineralization domain shells ±250 m east and west of the section plane.
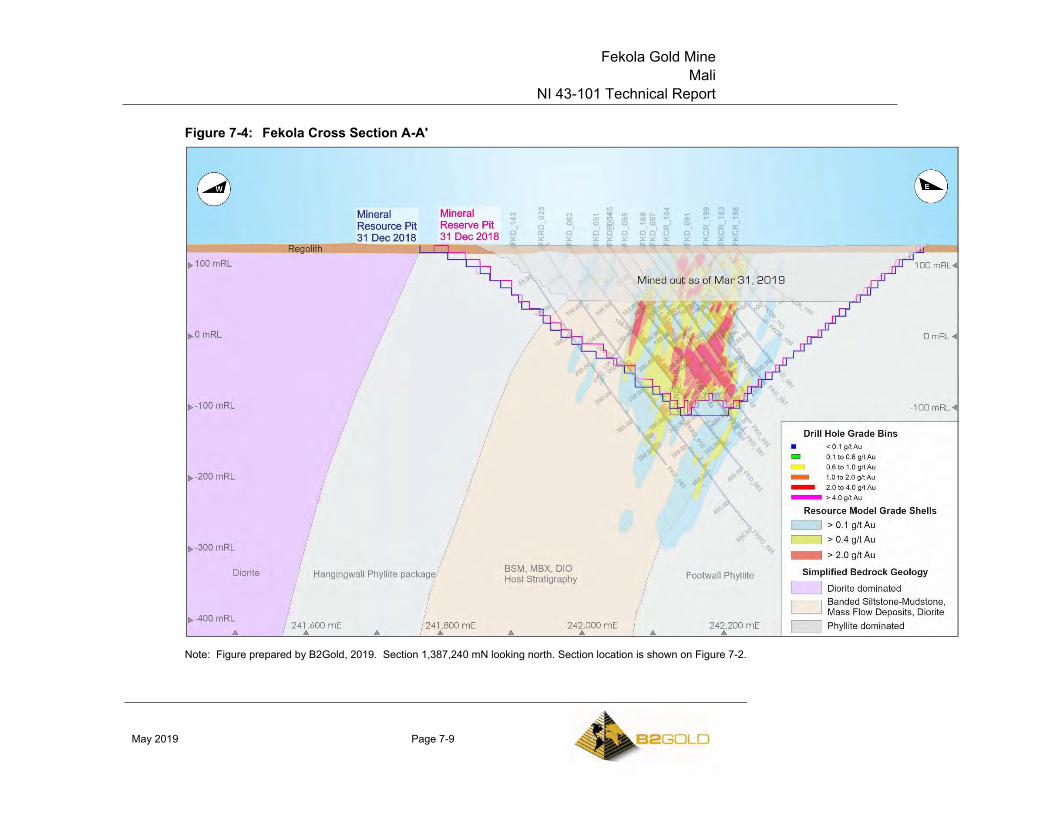
Fekola Gold Mine Mali
NI 43-101 Technical Report
May 2019 Page 7-9
Figure 7-4: Fekola Cross Section A-Aʹ
Note: Figure prepared by B2Gold, 2019. Section 1,387,240 mN looking north. Section location is shown on Figure 7-2.
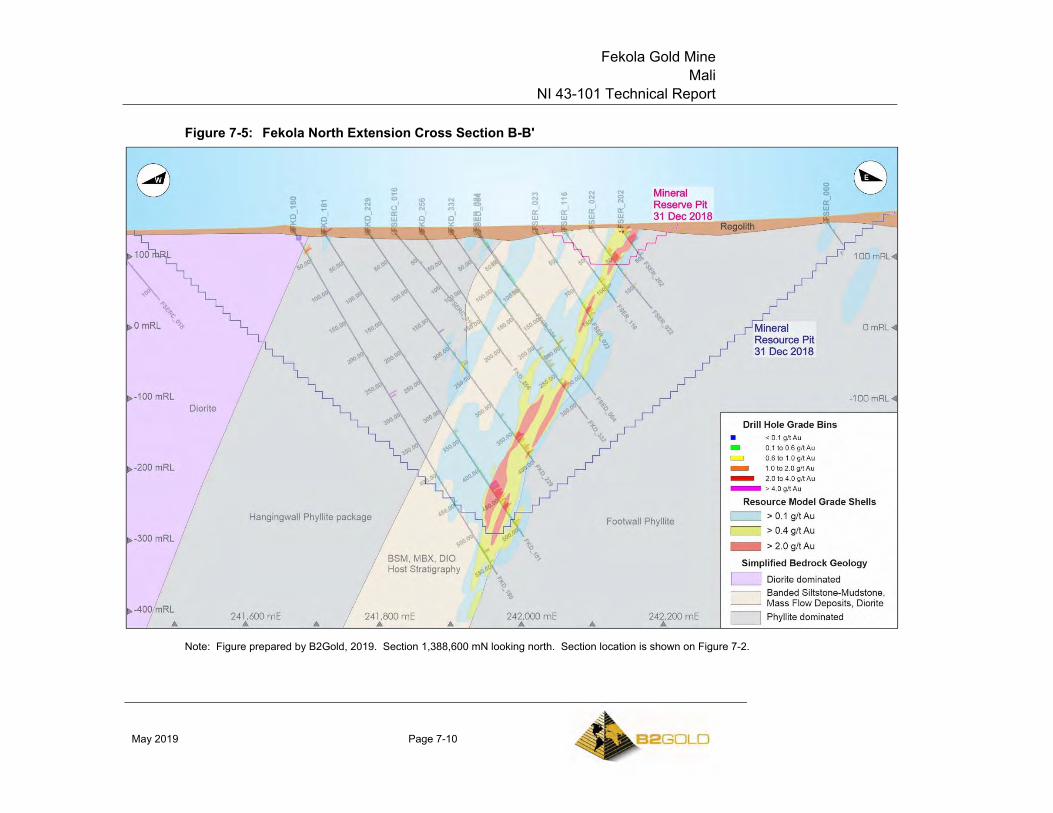
Fekola Gold Mine Mali
NI 43-101 Technical Report
May 2019 Page 7-10
Figure 7-5: Fekola North Extension Cross Section B-Bʹ
Note: Figure prepared by B2Gold, 2019. Section 1,388,600 mN looking north. Section location is shown on Figure 7-2.
Fekola Gold Mine Mali
NI 43-101 Technical Report
May 2019 Page 8-1
8.0 DEPOSIT TYPES
8.1 Deposit Model
Fekola is classified as a disseminated orogenic gold deposit as defined by Gebre-Mariam et al. (1995), Groves et al. (1998), Goldfarb et al. (2001, 2005).
Orogenic gold deposits occur in variably deformed metamorphic terranes formed during Middle Achaean to younger Precambrian, and continuously throughout the Phanerozoic. The host geological environments are typically volcano–plutonic or clastic sedimentary terranes, but gold deposits can be hosted by any rock type. There is a consistent spatial and temporal association with granitoids of a variety of compositions. Host rocks are metamorphosed to greenschist facies, but locally can achieve amphibolite or granulite facies conditions.
Global examples of these deposits include Muruntau (Uzbekistan), Golden Mile (Australia), Hollinger–McIntyre–Moneta (Canada), Homestake (USA), and Obuasi (Ghana).
Gold mineralization occurs adjacent to first-order, deep-crustal shear zones. These first order faults, which can be hundreds of kilometers long, partitioned into high strain zones kilometers wide and show complex structural histories. Economic mineralization typically formed as vein fill of second- and third-order shears and faults, particularly at jogs or changes in strike. Mineralization styles vary from stockwork and breccia in brittle regimes, through laminated crack-seal veins and sigmoidal vein arrays in brittle-ductile conditions, to replacement- and disseminated-type orebodies in deeper, ductile environments. These conditions can be related to crustal depth or strain rate.
Mineralization is structurally late, syn- to post-peak metamorphic. Quartz is the primary constituent of veins, with lesser carbonate and sulphide minerals. Minor accessory albite, chlorite, white mica (fuchsite in ultramafic host rocks), tourmaline, and scheelite can accompany the veins and disseminated styles. Carbonates include calcite, dolomite, and ankerite. Sulphide minerals can include pyrite, pyrrhotite, chalcopyrite, galena, sphalerite and arsenopyrite. Gold is usually associated with sulphide minerals and can be refractory or free. In volcano–plutonic settings, pyrite and pyrrhotite are the most common sulphide minerals in greenschist- and amphibolite-grade host rocks, respectively. Arsenopyrite can be the predominant sulphide mineral in mineralization hosted by sedimentary rocks. Gold to silver ratios typically range from 5:1 to 10:1 and, less commonly, the ratios can reach 1:1. Most orogenic gold deposits contain 2–5% sulphide minerals and >900 gold fineness.
Alteration intensity is related to distance from the hydrothermal fluid source and typically displays a zoned pattern. Scale, intensity and mineralogy of the alteration are functions of wall rock composition, crustal level and mineralizing fluid composition. The main
Fekola Gold Mine Mali
NI 43-101 Technical Report
May 2019 Page 8-2
alteration minerals typically include carbonate (calcite, dolomite, and ankerite), sulphides (pyrite, pyrrhotite or arsenopyrite), alkali-rich silicate minerals (sericite, fuchsite, albite, and less commonly, K-feldspar, biotite, paragonite), chlorite, and quartz.
The larger examples of orogenic deposits are generally 2 km to 10 km long, up to 1 km wide, and can persist over greater than 2.5 km vertical extents.
8.2 Comments on Deposit Types
Fekola has the following characteristics of a disseminated orogenic gold deposit:
• Very late to post-peak metamorphic timing;
• Located in a metamorphosed belt in lower greenschist facies rocks near a crustal scale shear zone;
• Complex overprinting deformation history;
• Ductile and transitional brittle-ductile structural regime;
• Accessory albite, dolomite and tourmaline alteration minerals with typical sulphide minerals including pyrite and chalcopyrite;
• Gold associated with 2–5% pyrite and has a high fineness;
• Extensive strike length and down-plunge continuity.
The local setting of the Fekola deposit is reasonably understood.
In the QP’s opinion an exploration model that uses an orogenic deposit model is reasonable as a regional targeting tool.
Fekola Gold Mine Mali
NI 43-101 Technical Report
May 2019 Page 9-1
9.0 EXPLORATION
9.1 Introduction
Initial exploration in the Project area consisted of a combination of regolith mapping, soil geochemistry and geophysical surveys due to the regolith cover and limited outcrop. Where warranted, initial exploration was followed up with drilling.
9.2 Grids and Surveys
The most recent light detection and ranging (LiDAR) survey was conducted in April 2017. The projection used was UTM 29N, WGS84 with orthometric heights transformed using the EGM2008 geoidal model. Deliverables from this survey included ortho-rectified aerial image tiles with a 10 cm pixel resolution and thinned ground and non-ground LiDAR points in ASCII format.
All drill hole locations are surveyed with a Leica 1230 differential global positioning system (DGPS) instrument.
9.3 Geological Mapping
Geological mapping covers the entire Project area with maps produced at scales varying from 1:5,000 to 1:100,000, and relying on a compilation of (sparse) outcrop mapping, geophysics, and surface projection from drill holes. Mapping shows the Fekola deposit is hosted by a thinly bedded siltstone–mudstone, interlayered with sedimentary and tectonic breccia. This host stratigraphy is up to 250 m thick in the deposit area and traverses the Médinandi Exploitation License from south to north. Mafic dykes and sills intrude the sequence. The host rocks are tightly folded and cut by an anastomosing network of ductile shear zones. The sedimentary sequence is bounded to the east and west by mafic intrusive rocks. Felsic intrusive rocks occur to the east and northwest of the Médinandi Exploitation License.
9.4 Geochemistry
Soil geochemistry has proven to be an effective exploration tool in the search for gold mineralization in areas where there are residual soils. Soil sampling has broadly outlined anomalous areas for follow up. In areas of more complex regolith, particularly where there are transported laterite, alluvial gravels and silt, the interpretation of soil geochemistry results can be ambiguous due to masking or suppression of potentially anomalous areas. For example, the Fekola deposit is largely blind to soil geochemistry as transported paleo-channel gravels and laterite cover a substantial portion of the deposit.
Fekola Gold Mine Mali
NI 43-101 Technical Report
May 2019 Page 9-2
Soil geochemical survey sample collection is from small pits excavated to 60 cm below surface on 80 m x 160 m spaced grid lines.
Starting in 2015, B2Gold has used auger drilling on a 200 m x 200 m offset grid pattern to sample the top of saprolite in order to obtain consistent and unambiguous samples.
Termite mound and rock chip and grab sampling has also been performed delivering inconclusive results.
A summary of the work completed is provided in Table 9-1 and sample locations in Figure 9-1.
9.5 Geophysics
Airborne and gravity geophysical surveys have been completed as indicated in Table 9-2.
The data have been used to develop the broad lithological and structural framework for the Project area; however, no direct and distinct signature for the Fekola deposit is currently recognised within any of the geophysical datasets. The most useful dataset acquired is the gradient array IP data (Figure 9-2), which provides a good contrast between lithological units, as well as resolving Project-scale structure. Gravimetric methods define a marked density gradient between the mineralized siltstone–mudstone unit and the unmineralized footwall phyllite.
The general lack of magnetite and low contrast between lithologies within the system reduces the efficacy of the airborne magnetic data (Figure 9-3). In addition, a lack of conductors within the lithological package hosting Fekola mineralization has limited the effectiveness of the broad bandwidth electromagnetic system used.
9.6 Pits and Trenches
Some pitting and trenching excavations were undertaken over the Médinandi exploitation license during the legacy campaigns. At Fadougou East, six trenches for 123 m were excavated in 2008 and one trench, 150 m in length, was excavated by Songhoi in June 2010, at Fadougou Northwest.
A total of 102 pits were excavated during 2013–2014 as part of the geotechnical appraisal of the planned Fekola plant and tailings storage facility (TSF) area.
Five pits were excavated in 2016 for independent checking of saprolite density determinations done on drill core.
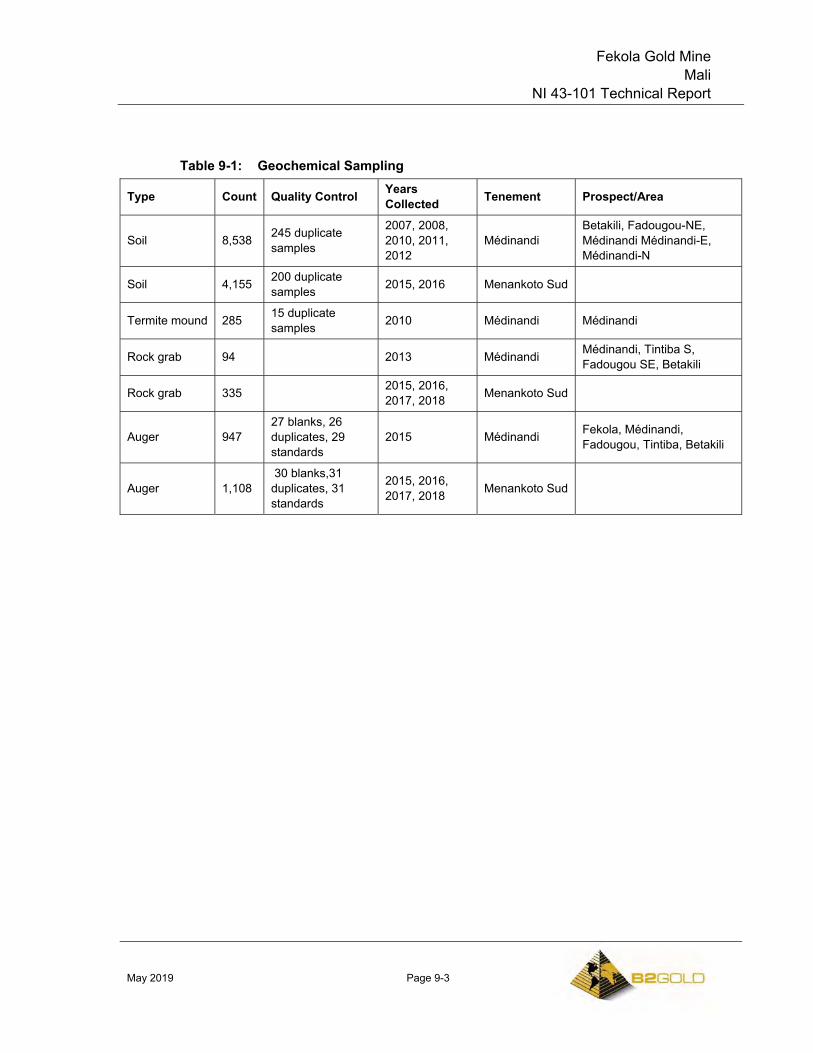
Fekola Gold Mine Mali
NI 43-101 Technical Report
May 2019 Page 9-3
Table 9-1: Geochemical Sampling
Type Count Quality Control Years Collected Tenement Prospect/Area
Soil 8,538 245 duplicate samples
2007, 2008, 2010, 2011, 2012
Médinandi Betakili, Fadougou-NE, Médinandi Médinandi-E, Médinandi-N
Soil 4,155 200 duplicate samples 2015, 2016 Menankoto Sud
Termite mound 285 15 duplicate samples 2010 Médinandi Médinandi
Rock grab 94 2013 Médinandi Médinandi, Tintiba S, Fadougou SE, Betakili
Rock grab 335 2015, 2016, 2017, 2018 Menankoto Sud
Auger 947 27 blanks, 26 duplicates, 29 standards
2015 Médinandi Fekola, Médinandi, Fadougou, Tintiba, Betakili
Auger 1,108 30 blanks,31 duplicates, 31 standards
2015, 2016, 2017, 2018 Menankoto Sud
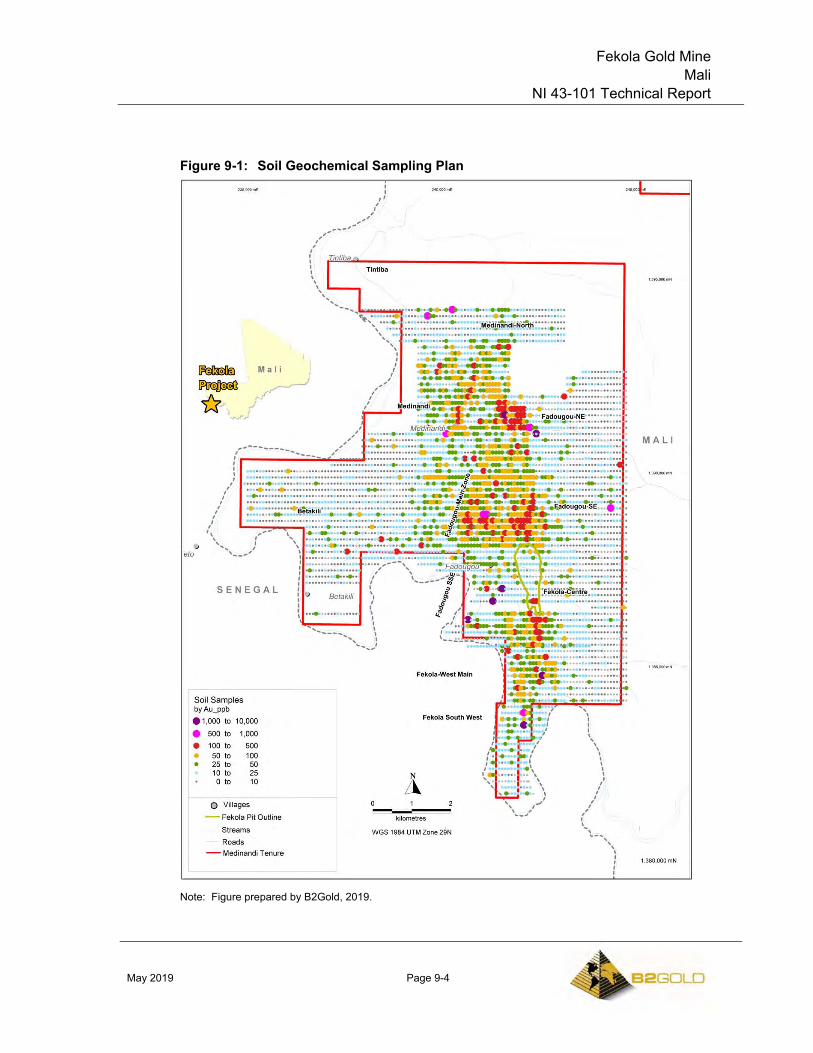
Fekola Gold Mine Mali
NI 43-101 Technical Report
May 2019 Page 9-4
Figure 9-1: Soil Geochemical Sampling Plan
Note: Figure prepared by B2Gold, 2019.
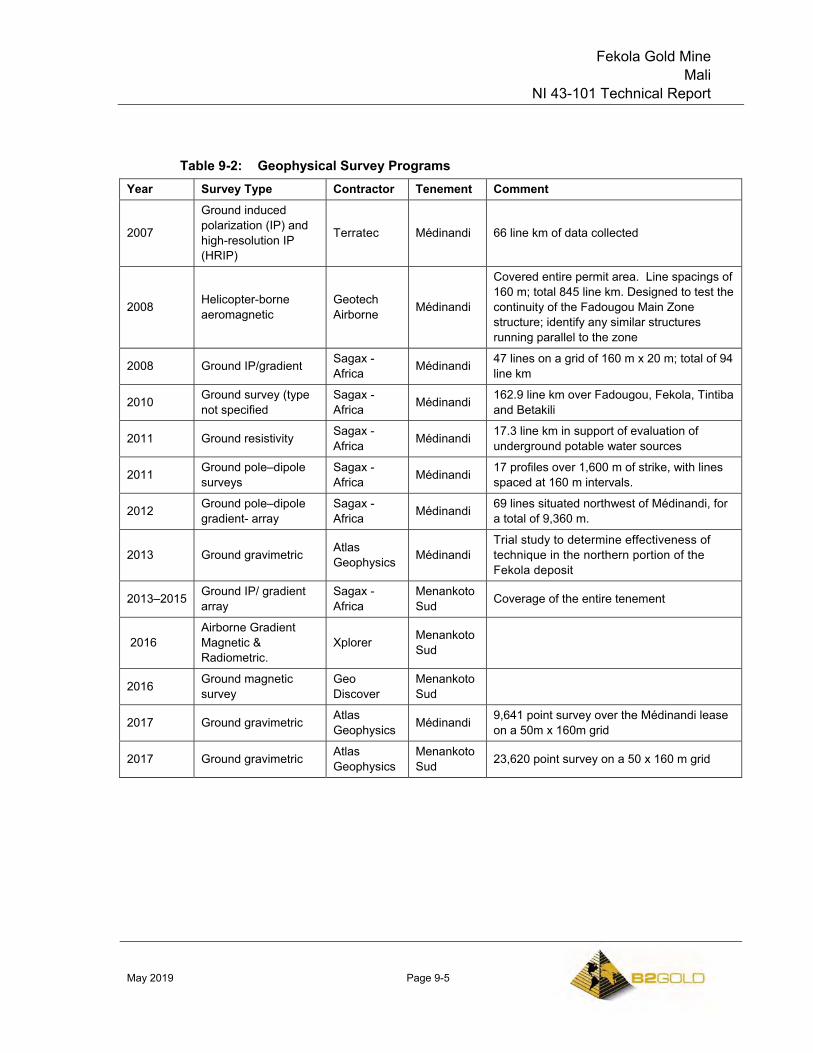
Fekola Gold Mine Mali
NI 43-101 Technical Report
May 2019 Page 9-5
Table 9-2: Geophysical Survey Programs Year Survey Type Contractor Tenement Comment
2007
Ground induced polarization (IP) and high-resolution IP (HRIP)
Terratec Médinandi 66 line km of data collected
2008 Helicopter-borne aeromagnetic
Geotech Airborne Médinandi
Covered entire permit area. Line spacings of 160 m; total 845 line km. Designed to test the continuity of the Fadougou Main Zone structure; identify any similar structures running parallel to the zone
2008 Ground IP/gradient Sagax - Africa Médinandi 47 lines on a grid of 160 m x 20 m; total of 94
line km
2010 Ground survey (type not specified
Sagax - Africa Médinandi 162.9 line km over Fadougou, Fekola, Tintiba
and Betakili
2011 Ground resistivity Sagax - Africa Médinandi 17.3 line km in support of evaluation of
underground potable water sources
2011 Ground pole–dipole surveys
Sagax - Africa Médinandi 17 profiles over 1,600 m of strike, with lines
spaced at 160 m intervals.
2012 Ground pole–dipole gradient- array
Sagax - Africa Médinandi 69 lines situated northwest of Médinandi, for
a total of 9,360 m.
2013 Ground gravimetric Atlas Geophysics Médinandi
Trial study to determine effectiveness of technique in the northern portion of the Fekola deposit
2013–2015 Ground IP/ gradient array
Sagax - Africa
Menankoto Sud Coverage of the entire tenement
2016 Airborne Gradient Magnetic & Radiometric.
Xplorer Menankoto Sud
2016 Ground magnetic survey
Geo Discover
Menankoto Sud
2017 Ground gravimetric Atlas Geophysics Médinandi 9,641 point survey over the Médinandi lease
on a 50m x 160m grid
2017 Ground gravimetric Atlas Geophysics
Menankoto Sud 23,620 point survey on a 50 x 160 m grid
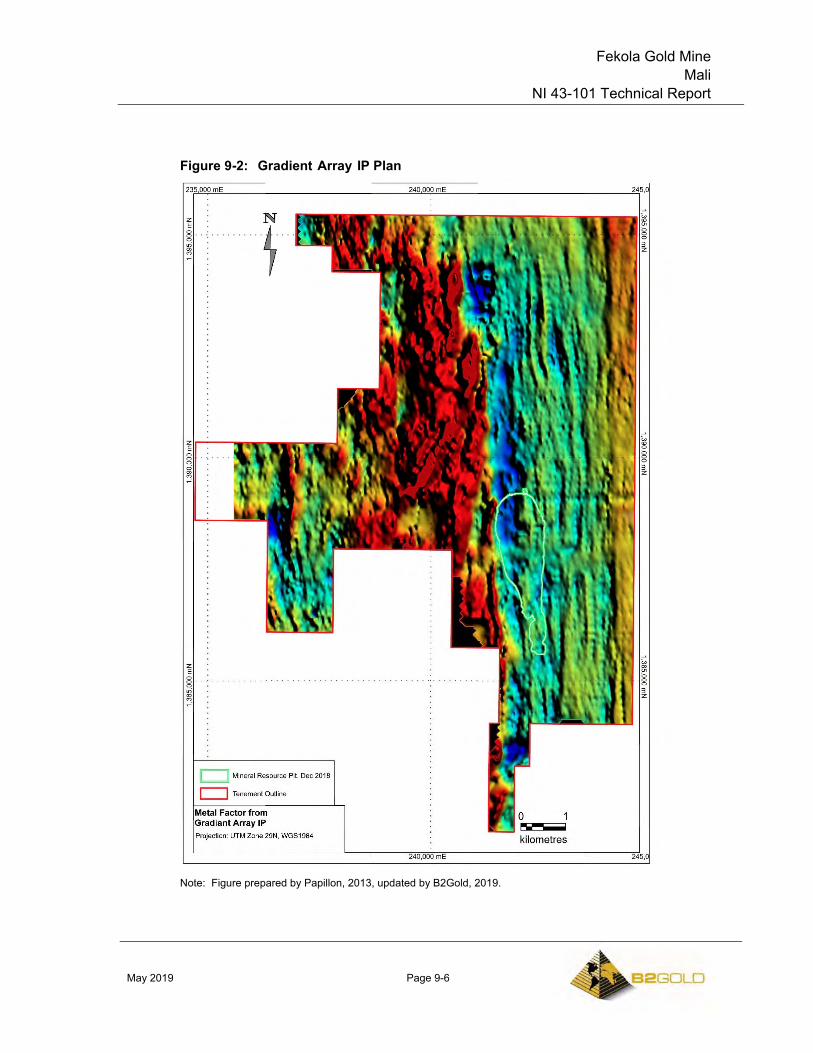
Fekola Gold Mine Mali
NI 43-101 Technical Report
May 2019 Page 9-6
Figure 9-2: Gradient Array IP Plan
Note: Figure prepared by Papillon, 2013, updated by B2Gold, 2019.
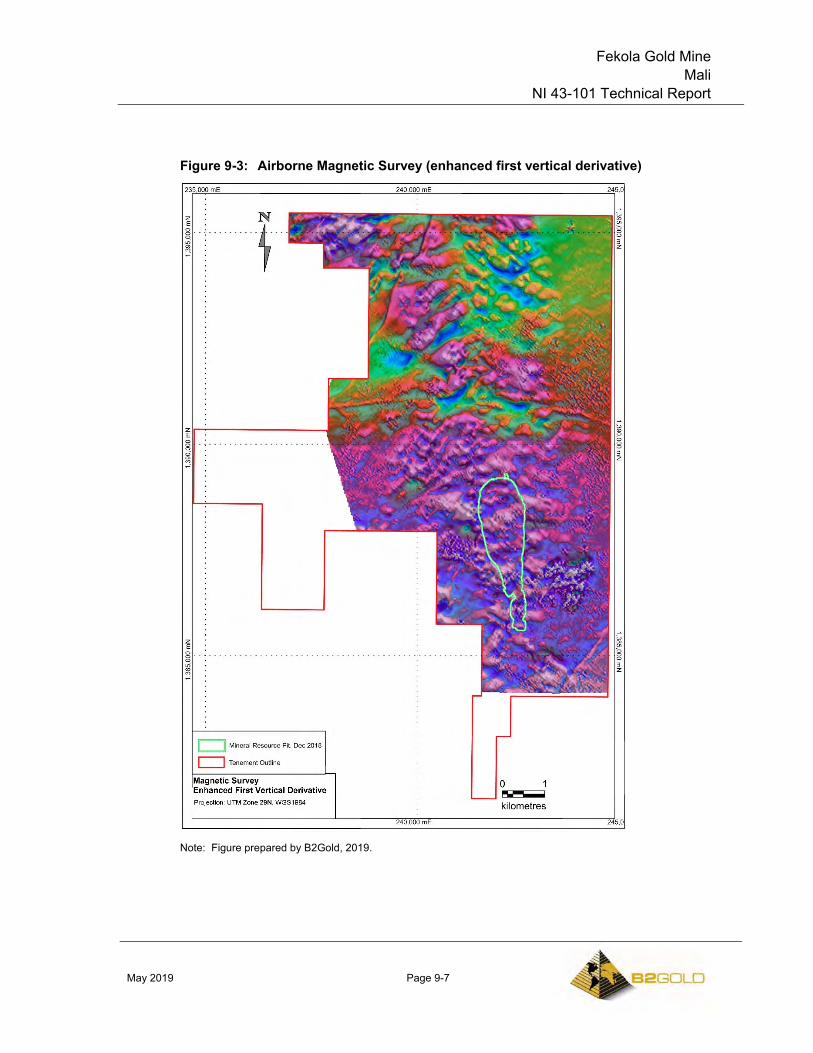
Fekola Gold Mine Mali
NI 43-101 Technical Report
May 2019 Page 9-7
Figure 9-3: Airborne Magnetic Survey (enhanced first vertical derivative)
Note: Figure prepared by B2Gold, 2019.
Fekola Gold Mine Mali
NI 43-101 Technical Report
May 2019 Page 9-8
9.7 Petrology, Mineralogy, and Research Studies
Several petrographic descriptions have been completed in support of better lithological and mineralogical descriptions for the Fekola deposit mineralization and host rocks.
In 2012, prior to much of the infill drilling on the Fekola deposit, Dr. Eva Schandl described a suite of 40 thin sections from the deposit to provide information on the lithologies, mineralogy, and hydrothermal alteration.
Pathfinder Exploration undertook a number of detailed petrographic analyses on thin section materials, corroborated with portable infrared mineral analyser (PIMA) analyses on selected samples. Descriptions were provided of the major constituents of each sample, and a suggested protolith described.
In 2015, 16 samples were collected from Fekola (Ross, 2015) for a petrographic study completed as part of a structural study (Rhys, 2015). Results of this work suggest that shear zones associated with gold mineralization comprise fine-grained tectonically laminated dolomite or ferroan-dolomite with variable quantities of albite, sericite/muscovite, quartz, chlorite, biotite, pyrite and tourmaline. Additionally, the gradational contacts and relict textures preserved in the shear zones suggest they overprint primary mass flow breccia, banded siltstone–mudstone and diorite implying the mineral assemblages formed through alteration and syntectonic fluid flow along these structures.
A total of 15 samples were collected in 2017 from the Anaconda prospect (Ross, 2017). Results indicated that most of the rock units were directly comparable to those hosting the Fekola gold deposit and had undergone similar alteration. It was determined that gold mineralization is related to dominant carbonate–pyrite alteration partially overprinting albite, occurring late in shear zone development. Ten rock samples from the Anaconda prospect were submitted for petrographic characterization (Mason, 2017). The presence of sulphides in these rocks suggests they were subject to hydrothermal alteration by S–As-bearing fluids during the regional metamorphic event.
During 2018, 20 samples from the Fekola deposit were collected for petrographic examination (Mason, 2018). Laminated sediments were identified as forming the protolith in most samples.
9.8 Exploration Potential
The Fekola deposit has been extended down plunge of the main high-grade shoot by drilling carried out during 2017–2019. Narrow zones of hanging wall mineralization have also been defined by this work. Future exploration efforts will be designed to test potential for:
Fekola Gold Mine Mali
NI 43-101 Technical Report
May 2019 Page 9-9
• New plunging high-grade zones along strike to the north of the Fekola deposit where narrower intersections have been encountered at shallow depths;
• New north-plunging mineralization south of the current pit limits, occurring as stacked lodes.
• Mineralization in the Cardinal structures located west of the operating mine and the Fekola South area where previous wide-spaced drilling has shown potential for additional mineralization below the main Fekola mineralized body.
At Anaconda exploration focus to date has been on defining saprolite mineralization. Limited deeper drilling has identified zones of bedrock mineralization requiring follow up drilling. In addition, a number of geophysical anomalies, in particular untested IP chargeability features, require drill testing.
9.9 Comments on Exploration
Exploration completed to date is appropriate and has been adapted to the local regolith development. The program identified the Fekola deposit.
The early-stage exploration programs in the Project area have been superseded by drilling and mining data (at Fekola).
Exploration targets include new high-grade shoots in the Fekola area, and deeper drilling at Anaconda targeting bedrock mineralization.
Fekola Gold Mine Mali
NI 43-101 Technical Report
May 2019 Page 10-1
10.0 DRILLING
10.1 Introduction
Table 10-1 summarizes the Project drilling to 31 March, 2019. Within the database are 2,836 auger drill holes (22,759 m), 1,166 rotary air blast (RAB) drill holes (24,064 m), 3,321 aircore drill holes (141,978 m), 2,365 reverse circulation (RC) drill holes (273,547 m), 165 holes pre-collared with RC collar and completed with a core tail (RC–core) drill holes (62,334 m), and 481 core drill holes (100,488 m). These figures include 78 RC water holes (11,913 m), 137 geotechnical holes (10,115 m) and 304 condemnation holes (17,753 m).
Table 10-1 and Table 10-2 summarize the drill campaigns.
Drilling as of 31 March, 2019, for Médinandi, includes 187,276 m of RC (1,622 drill holes), 59,318 m of RC–core (153 drill holes), and 85,524 m of core (336 drill holes), of which 61% is HQ and 32% is NQ-sized core. Figure 10-1 shows the collar locations.
Drilling that supports the Mineral Resource estimate for the Fekola deposit was completed from January 2007 to September 30, 2018. Within the immediate area of the Mineral Resource estimate, there are a total of 1,000 drill holes (194,406 m) including 239 core holes (70,438 m), 572 RC holes (72,219 m), 129 holes RC pre-collared and completed with core (50,650 m), and 60 aircore drill holes (1,099 m). Aircore drill holes were used for regolith models only.
The Mineral Resource estimate drill hole database cut-off date for the Anaconda deposit is March 22, 2017. Drilling includes 1,571 aircore drill holes (64,245 m), 265 RC holes (31,717 m), five RC pre-collared and completed with core holes (1,044 m), and 107 diamond drill core holes (7,677 m), and for a total of 1,948 drill holes (104,682 m of drilling).
Drill tables are provided for Fekola and Anaconda in Table 10-3 and Table 10-4 respectively. The collar locations plans are shown in Figure 10-2.
10.2 Legacy Drilling
Colonial Resources (2010) indicated that the Randgold drilling was performed by West African Drilling Services, based out of Bamako. Most of the drilling was on the Fadougou Main Zone and Fadougou NE. Very limited information is available on the logging and surveying practices used prior to 2010. This legacy drilling accounts for a very small percentage of the Project drilling.
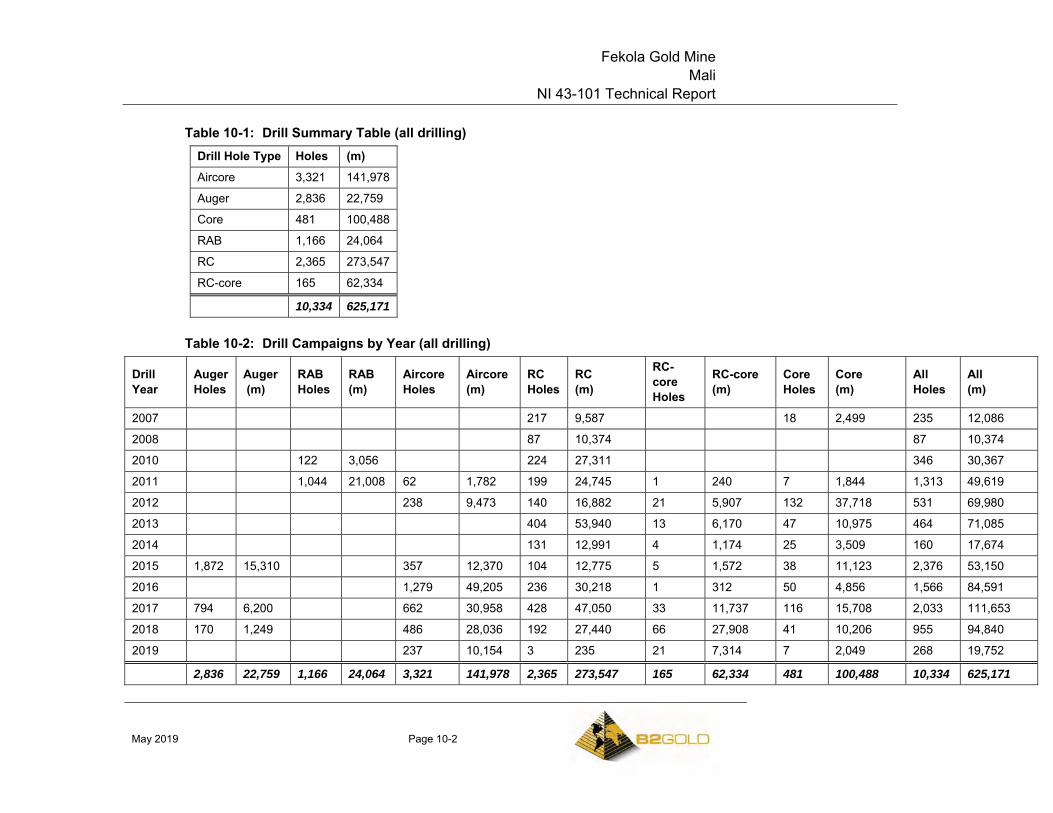
Fekola Gold Mine Mali
NI 43-101 Technical Report
May 2019 Page 10-2
Table 10-1: Drill Summary Table (all drilling) Drill Hole Type Holes (m) Aircore 3,321 141,978
Auger 2,836 22,759
Core 481 100,488
RAB 1,166 24,064
RC 2,365 273,547
RC-core 165 62,334 10,334 625,171
Table 10-2: Drill Campaigns by Year (all drilling)
Drill Year
Auger Holes
Auger (m)
RAB Holes
RAB (m)
Aircore Holes
Aircore (m)
RC Holes
RC (m)
RC-core Holes
RC-core (m)
Core Holes
Core (m)
All Holes
All (m)
2007 217 9,587 18 2,499 235 12,086
2008 87 10,374 87 10,374
2010 122 3,056 224 27,311 346 30,367
2011 1,044 21,008 62 1,782 199 24,745 1 240 7 1,844 1,313 49,619
2012 238 9,473 140 16,882 21 5,907 132 37,718 531 69,980
2013 404 53,940 13 6,170 47 10,975 464 71,085
2014 131 12,991 4 1,174 25 3,509 160 17,674
2015 1,872 15,310 357 12,370 104 12,775 5 1,572 38 11,123 2,376 53,150
2016 1,279 49,205 236 30,218 1 312 50 4,856 1,566 84,591
2017 794 6,200 662 30,958 428 47,050 33 11,737 116 15,708 2,033 111,653
2018 170 1,249 486 28,036 192 27,440 66 27,908 41 10,206 955 94,840
2019 237 10,154 3 235 21 7,314 7 2,049 268 19,752 2,836 22,759 1,166 24,064 3,321 141,978 2,365 273,547 165 62,334 481 100,488 10,334 625,171
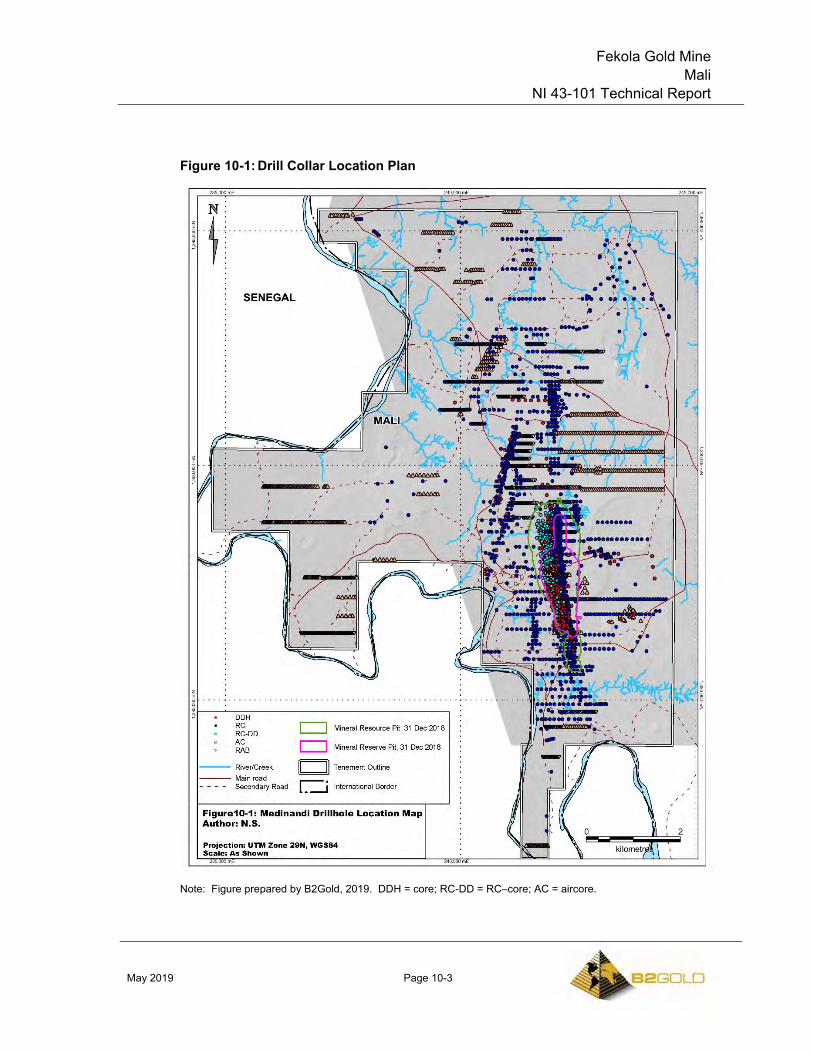
Fekola Gold Mine Mali
NI 43-101 Technical Report
May 2019 Page 10-3
Figure 10-1: Drill Collar Location Plan
Note: Figure prepared by B2Gold, 2019. DDH = core; RC-DD = RC–core; AC = aircore.
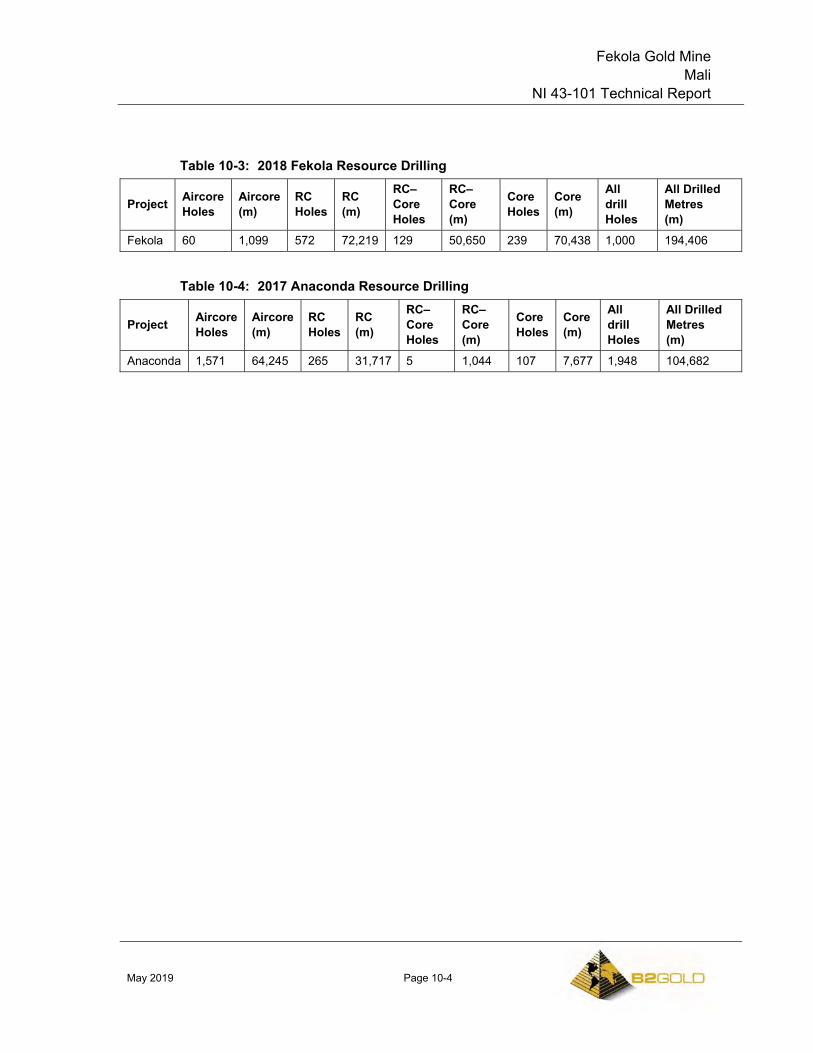
Fekola Gold Mine Mali
NI 43-101 Technical Report
May 2019 Page 10-4
Table 10-3: 2018 Fekola Resource Drilling
Project Aircore Holes
Aircore (m)
RC Holes
RC (m)
RC–Core Holes
RC–Core (m)
Core Holes
Core (m)
All drill Holes
All Drilled Metres (m)
Fekola 60 1,099 572 72,219 129 50,650 239 70,438 1,000 194,406
Table 10-4: 2017 Anaconda Resource Drilling
Project Aircore Holes
Aircore (m)
RC Holes
RC (m)
RC–Core Holes
RC–Core (m)
Core Holes
Core (m)
All drill Holes
All Drilled Metres (m)
Anaconda 1,571 64,245 265 31,717 5 1,044 107 7,677 1,948 104,682
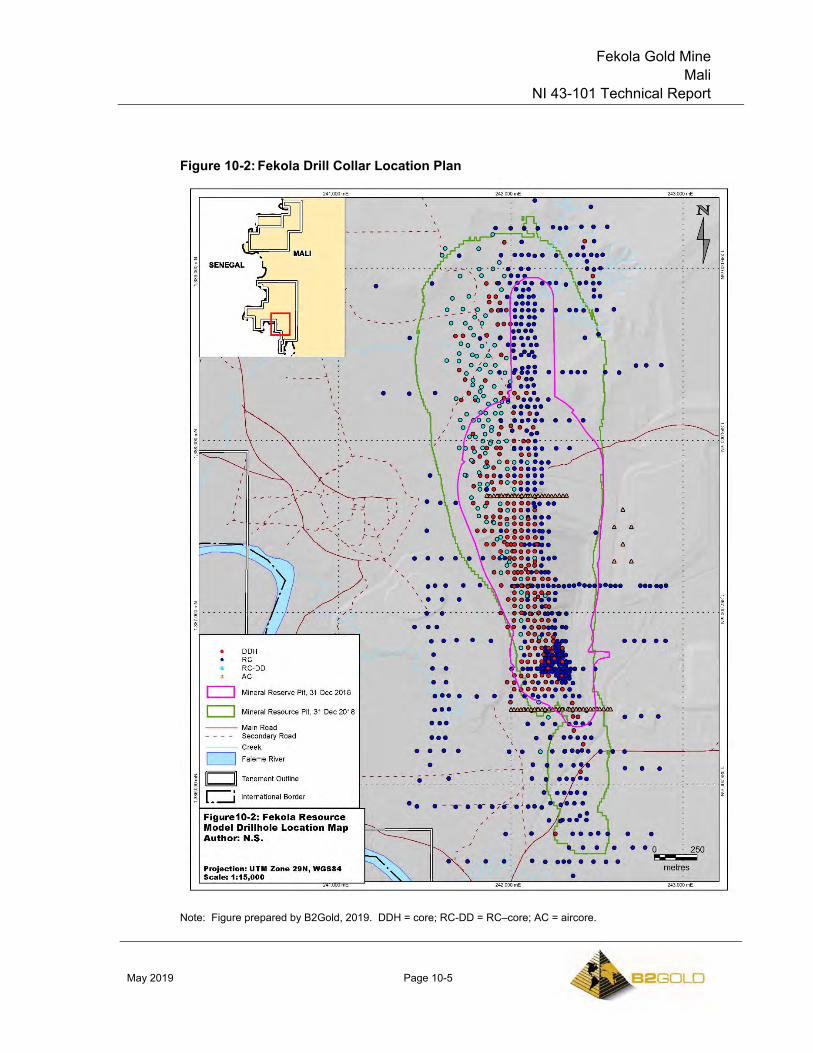
Fekola Gold Mine Mali
NI 43-101 Technical Report
May 2019 Page 10-5
Figure 10-2: Fekola Drill Collar Location Plan
Note: Figure prepared by B2Gold, 2019. DDH = core; RC-DD = RC–core; AC = aircore.
Fekola Gold Mine Mali
NI 43-101 Technical Report
May 2019 Page 10-6
10.3 Drill Methods
10.3.1 Contractors
Boart Longyear, Forage FTE Drilling, AMCO Drilling and African Mining Services (AMS) have provided drill rigs during the Papillon/B2Gold drill campaigns, with AMS currently providing the majority of drilling services.
10.3.2 Auger, Rotary Air Blast and Aircore
Exploration drilling has employed auger, RAB and aircore methods as a first-pass evaluation of gold-in-soil anomalies.
10.3.3 Reverse Circulation
RC drilling used face sampling hammer techniques rather than conventional RC methods where possible. Bit size during the 2015 to 2019 programs was mainly 140 mm with 119 mm, 124 mm, and 127 mm bits occasionally used. The bit size used depended on the ground conditions and the progress of the hole. The sample weights at Fekola using these bit sizes are between 35 kg and 50 kg for a 1 m sample. Sample weights are routinely recorded to compare sample recovery against the theoretical weight of the interval.
A drill collar casing is used in the first 6 m of the drill hole to stop cave in and maintain good workable access to the drill hole.
During some programs at Fekola, significant water was encountered during drilling at approximately 40 to 60 m depth.
RC chips are stored in lidded, plastic chip trays, and are kept in a shipping container at the Fekola Exploration core yard.
10.3.4 Core Drilling
A significant number of core holes from recent programs were pre-collared with RC. Typically, the changeover to core occurs at depths of around 90 m, but has been anywhere from between 40–250 m, depending on depth to mineralization.
Drilling difficulties have been encountered when penetrating the transported alluvial gravel that sits above the in situ weathered rock. When the paleo-channel gravels are encountered, standard practice is to case the hole with removable steel casing to just beyond the gravel layer. Drill holes may also “lift” from their planned inclination due to rock conditions at depth. Periodically, there are also issues with “drifting” of holes from their planned azimuth. This situation is mitigated by decreasing rotation speed.
Fekola Gold Mine Mali
NI 43-101 Technical Report
May 2019 Page 10-7
Drill sizes include PQ (85 mm core diameter), HQ (63.5 mm) and NQ core (47.6 mm). PQ core is typically used from the surface down to a few metres into hard rock in areas known to be clay-rich, with paleochannel, and for metallurgical and geotechnical purposes. HQ3 core (triple tube method) is used in areas of broken ground for good recovery of core. HQ2 is used in areas of more competent ground.
Transportation of the core from the site to the sample yard is the geologist’s responsibility. Lids are used on core boxes if travelling a large distance or over rough ground.
Drill core is stacked in steel or plastic core trays by individual hole, off the ground on wooden runners under roofed, open-sided sheds within a securely fenced core storage facility.
10.4 Logging Procedures
A geological legend has been progressively developed for the Project area incorporating advances in understanding of the Fekola deposit and regional geology. It is used for core, drill chip and surface mapping. The lithological rock types covered in the geological code include surface (regolith), sedimentary, igneous, and altered rock, metamorphic and tectonic lithologies. Logging definitions and standards are regularly reviewed for appropriateness for Fekola.
Logging of RC chips is completed at the drill rig. The basic geological log includes: primary lithology; alteration; mineralization; degree of oxidation; sample quality; depth of water inflow (estimation of rates); sample moisture content; veining; texture; fabric; presence of key minerals; sulphide grain size (from grain size chart); and areas of slow or hard drilling are marked onto the drill logs for geotechnical purposes.
Geological logging of core is performed in a similar manner to the RC logging, and particular attention is paid during logging to the following:
• Pyrite form and percentage;
• Alteration;
• Lithology;
• Structures and foliation.
The core is marked up with orientation lines at the rig by a technician, then brought back to the core yard where it is logged by a geologist, labelled with sample numbers and cut lines drawn.
The core is photographed at the core yard under controlled conditions so that photographs are consistent in quality. Core is typically photographed both wet and dry,
Fekola Gold Mine Mali
NI 43-101 Technical Report
May 2019 Page 10-8
prior to the core being sawed in half, sampled and bagged. For geotechnical cored holes the re-assembled runs are also photographed at the rig prior to transport.
Standard geotechnical logging on exploration and infill drill core collects information on fracture frequency and rock quality designation (RQD). Core is oriented for structural data collection, and both goniometer and “rocket launcher”-type orientation devices are used. The structural geology logging sheet is used to record linear and planar structural features observed within the hole as either point data, or as broad structural zones. Features recorded include veining, layering, foliation, faulting, lithological contacts, joints, and lineations.
The measuring of magnetic susceptibility (magsus) is one of the final stages of the logging process and takes place once the geological structural logging is completed. Readings are taken every meter from start of hole to end of hole.
10.5 Recovery
The average core recovery is 98.15% for holes completed within the Fekola deposit area. There does not appear to be a direct relationship between core recovery and gold grade.
10.6 Collar Surveys
There is a base station on the Fekola Mine that is used as a reference for all surveys undertaken on the Project. Throughout the Project area there are survey reference points that are used as a known reference for the collar surveys. These are included into the round of surveying when surveying new drill collars.
Drill collars for exploration drill holes are normally surveyed at the outset using a hand-held GPS instrument.
In the mine area, drill hole collars are surveyed upon completion using a DGPS, which has an accuracy of ± 10 cm.
10.7 Downhole Surveys
Depending on ground conditions, and the purpose of the drill hole, RC holes are typically surveyed at 30–50 m intervals down hole, using a Reflex down hole surveying instrument. If the hole begins to deviate, it is surveyed at closer intervals.
Surveys for core holes are performed using a Reflex downhole survey (EZ-Track) instrument, with measurements taken at 30–50 m intervals down hole. As with the RC drilling, if the hole begins to deviate from the planned path, it can be surveyed at the end of each rod. Deviation is constantly monitored and if there is significant deviation, the hole may be abandoned and a re-drill undertaken nearby.
Fekola Gold Mine Mali
NI 43-101 Technical Report
May 2019 Page 10-9
All core (except for zones of broken ground) is oriented with a Reflex EZ-ORI tool, which identifies the in-situ position of the core and allows for measurement of directional properties of the rock (bedding, foliation, and strain fields).
10.8 Condemnation, Geotechnical and Hydrological Drilling
Condemnation drilling in the areas planned for infrastructure was undertaken, and consisted of 304 drill holes (17,753 m).
A total of 137 geotechnical drill holes (10,115 m) were completed using wire line triple tube drilling, typically starting at the ground surface using PQ sized tooling and telescoping down to HQ size core around 230 m depth. Drill hole locations and orientations targeted interpreted structural features and the final pit slopes, to complement information previously collected within the mineralized zones. The following parameters were routinely recorded as part of the geotechnical logging: rock type and geotechnical description; total core recovery (TCR); RQD; fracture frequency; weathering/alteration; discontinuity type; discontinuity orientation; discontinuity properties; and joint condition rating (Jcon). Geotechnical logging was carried out for each drill run or for separate geotechnical intervals within a drill run. Bieniawski’s rock mass rating (RMR 6) was used to assess the overall quality of the rock to be exposed in the proposed open pit. All geotechnical rock unit types were tested using uniaxial (unconfined) compressive strength (UCS) and tri-axial methods.
Water bore drilling has been undertaken to support mining and milling operations, consisting of 78 drill holes (11,913 m).
Drill collar locations are shown in Figure 10-3.
10.9 Metallurgical Drilling
B2Gold conducted two phases of metallurgical testwork. The first phase was completed in 2014–2015 in support of the 2015 feasibility study, and the second phase was in 2018 on material from the Fekola North area.
The locations of the metallurgical drill holes used in testwork that supports the plant design are provided in Figure 10-4.
Metallurgical testwork has been performed on drill core and coarse reject samples (see discussion in Section 13).
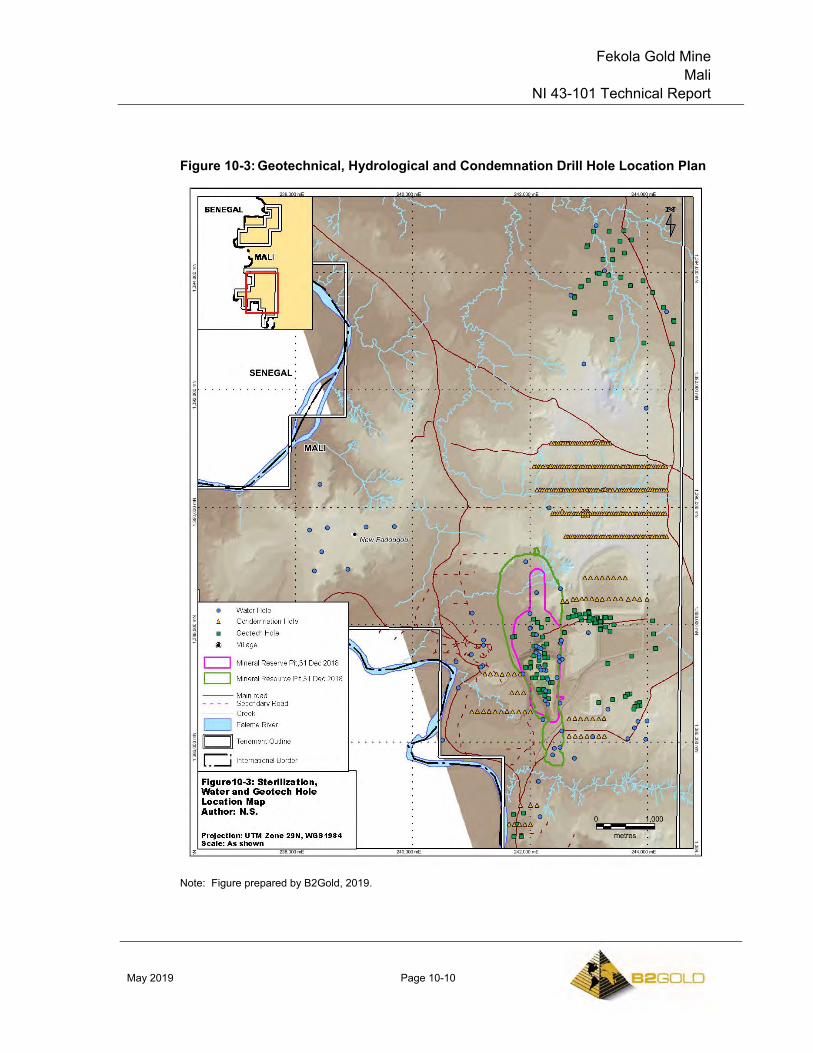
Fekola Gold Mine Mali
NI 43-101 Technical Report
May 2019 Page 10-10
Figure 10-3: Geotechnical, Hydrological and Condemnation Drill Hole Location Plan
Note: Figure prepared by B2Gold, 2019.
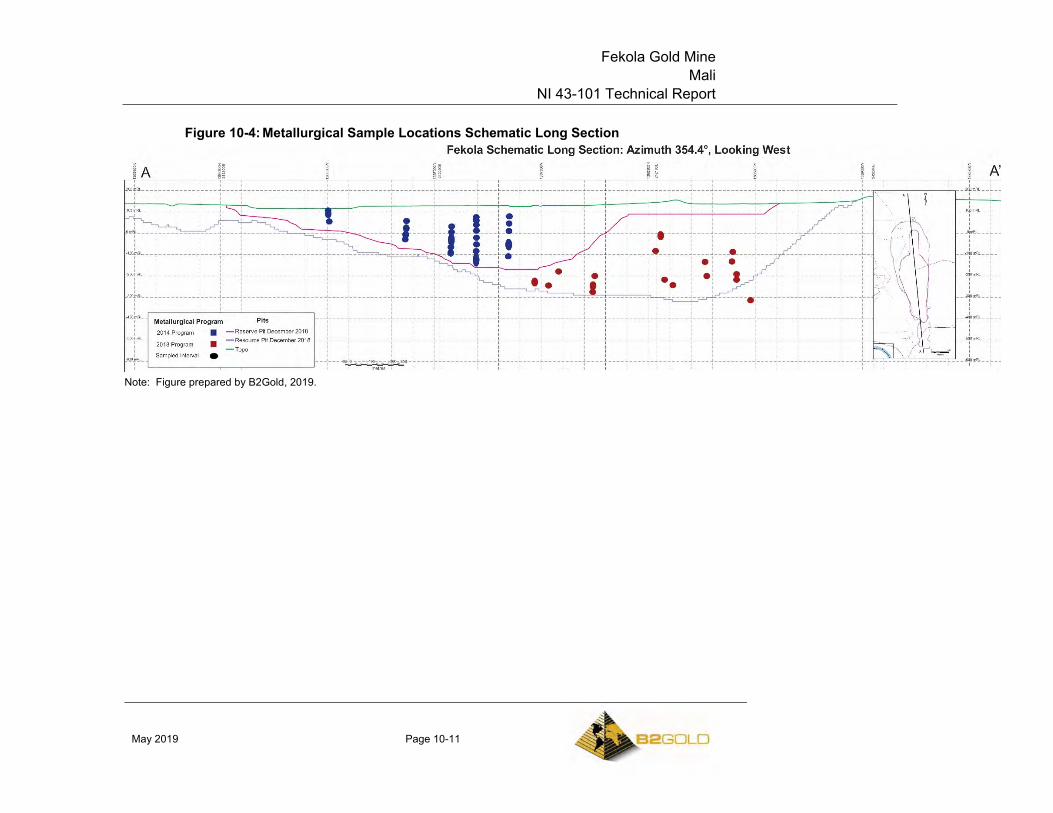
Fekola Gold Mine Mali
NI 43-101 Technical Report
May 2019 Page 10-11
Figure 10-4: Metallurgical Sample Locations Schematic Long Section
Note: Figure prepared by B2Gold, 2019.
Fekola Gold Mine Mali
NI 43-101 Technical Report
May 2019 Page 10-12
10.10 Grade Control
Grade control drilling is accomplished during two 12-hour daily shifts. Drilling is primarily accomplished with a company-owned and operated Schramm T450GT drill. Drilling of large campaigns is accelerated by the addition of a contractor-owned and operated RC drill in order to achieve operational requirements.
Drilling programs are laid out on a regular grid program with 6.50 x 15 m spacing. Hole depth typically is 36 m (three benches). On occasion, deeper strategic drilling is completed to define larger-scale grade boundaries in advance for medium-term forecasting purposes.
Field-based QA/QC is accomplished by weighing the sample interval recovered and comparing this weight to the expected theoretical weight for that interval.
10.11 Sample Length/True Thickness
Most of the drill holes at Fekola are drilled at -50 to -55° to the east (N90 E) which intersects the main mineralized zone at a high angle. The higher-grade mineralization strikes approximately north–south, is steeply-dipping at 70–80° to the west, and plunges shallowly to the north. In general, true thicknesses are 70–80% of the sampled length.
Anaconda drilling is mostly drilled at -60º (to the east) to -90º which intersects higher grade mineralization at a high angle. In general, true thicknesses are 90–100% of the sampled length.
Figure 7-4 and Figure 7-5 in Section 7 and Figure 14-1 in Section 14 provide examples of the drill orientations in relation to mineralization.
10.12 Drilling since Fekola Database Close-out Date
A total of 298 holes (25,979 m) have been drilled to 31 March 2019, after the database close out date for resource estimation. Of this total, there are 237 aircore holes (10,154 m), 29 core holes (6,741 m), 22 RC–core holes (7,681 m), and 10 RC holes (1,403 m). The aircore holes were drilled for condemnation purposes and 15 of the core holes (2,401 m) were drilled for geotechnical purposes.
Of this total, 48 core/RC drill holes are within the resource model area, and 33 drill holes have lithological and assay data available. The information was compared to the existing block model. The QP is of the opinion that although the newer drilling within the resource model will change the grades locally, overall the new drilling should have a minimal effect on the average grade of the model.
Fekola Gold Mine Mali
NI 43-101 Technical Report
May 2019 Page 10-13
10.13 Comments on Drilling
In the opinion of the QP, the quantity and quality of the logged geological data, collar, and downhole survey data collected in the exploration and infill drill programs are sufficient to support Mineral Resource and Mineral Reserve estimation and mine planning as follows:
• Core and RC logging meets industry standards for gold exploration;
• Collar surveys have been performed using industry standard instrumentation;
• Downhole surveys were performed using industry standard instrumentation;
• Recovery data from core and RC drill programs are acceptable;
• Drill orientations are generally appropriate for the mineralization style and the orientation of mineralization for the bulk of the deposit area;
• Drilling has generally been done at regularly-spaced intervals and is considered representative of the deposit. Drilling was not specifically targeted to the high-grade portions of the deposit, rather, a relatively consistent drill spacing was completed.
Fekola Gold Mine Mali
NI 43-101 Technical Report
May 2019 Page 11-1
11.0 SAMPLE PREPARATION, ANALYSES, AND SECURITY
11.1 Legacy Programs
The only information on sampling available is for the Central African programs and is summarized below. The information is sourced from Colonial Resources, (2010).
The standard sample length for core, RC and trench samples was stated to be 1 m. This was adjusted as appropriate for lithological contacts, structures, or alteration boundaries.
Core was split, and one-half retained in core trays. The other half was labelled and despatched for analysis. RC samples were split three times in a riffle splitter, with one quarter of the sample sent for analysis, and the remainder retained.
All Central African samples were bagged into large rice bags by Central African staff, and sealed. Transport of samples to the laboratory was also performed by Central African staff.
Laboratories used during the Central African campaigns were ALS Chemex in Bamako, and Analabs, Kayes (now owned and operated by SGS).
Chip and core samples were dried, crushed, milled and fire assayed at Analabs. No information is available as to preparation protocols or analytical detection limits.
Blanks were inserted in the Central African program at a rate of 1:50, using river sand material. Duplicates were also inserted at 50 sample intervals. Standards were not used by Central African; instead the program relied on insertion of the laboratory’s own standards.
Data generated by the Central African campaigns were uploaded into a Target drill hole database. Target is proprietary database software marketed by Geosoft for use with ArcGIS software.
11.2 Sampling Methods
11.2.1 RC and Aircore
In programs from 2012–2017, samples were collected at the drill rig, typically at 1 m intervals, through a conventional cyclone into plastic bags, then transported to either the Fekola or Anaconda sample yards. Samples were checked to ensure all samples listed on the field sheet (field sample weight sheet) were received and in the correct order. Wet samples were dried.
Samples were split to target weights using a riffle splitter or large single-pass splitter, and weighed dry. The sample was then placed in a plastic bag with sample ID written on the bag and on stapled ticket inside the bag. Prior to transport to the laboratory,
Fekola Gold Mine Mali
NI 43-101 Technical Report
May 2019 Page 11-2
quality assurance and quality control (QA/QC) samples in the form of blanks and standard reference materials (SRMs) were inserted in the sample batch.
The remaining witness or reject sample was collected in a rice bag with “hole ID” and “From To” written on the bag. The same information was included on a ticket with a second ticket with “sample ID”, and placed into the bag. These samples were retained for up to 12 months, as a semi-permanent record of the original sample for that interval in case any repeat analytical work was required.
During 2018–2019, a rotary splitter was used to collect RC and aircore samples. It uses a rotating distributor to guide the flow of sample over three sample cutters. This produces three separate representative samples, primary and duplicate samples from the two side ports, and a third sample for logging from the front port. The primary and duplicate sample cutters are set to produce the same percentage cut adjustable from 3–15 %. The witness sample falls from the large center chute and is collected in a bag. After each meter drilled, the laboratory primary from the primary sample chute and the laboratory duplicate sample from the duplicate sample chute were collected. The sample to be logged was collected from the logging sample chute.
Witness samples were collected at the rig splitter and the information “hole ID” and “From To” was written on the bag. The same information was included on a ticket, and a second ticket with “sample ID” information, and both tickets were placed inside the sample bag. These samples are retained for up to 12 months, as a semi-permanent record of the original sample for that interval in case any repeat analytical work was required.
11.2.2 Core
A cutting line is marked on the core to ensure representative sampling of mineralized structures. The start and end of each sample interval is marked, either on the core or on a marker block in the core tray. Core is marked on the left-hand side of the cutting line. Sampling is generally to 1 m intervals, but bounded by geological considerations with a minimum sampling width of >0.2 m.
A cutting sheet is prepared that assigns a sample number to each sample interval. The cutting sheet includes sample numbers for blanks, field duplicates and SRMs. Sample bags are prepared using a pre-labelled sample bag, sealed and weighed. The QA/QC samples are inserted using a pre-set QA/QC insert procedure.
11.3 Metallurgical Samples
Metallurgical samples were primarily derived from HQ core.
Fekola Gold Mine Mali
NI 43-101 Technical Report
May 2019 Page 11-3
11.4 Density Determinations
Rock density is determined by water immersion (Archimedes) methodology on whole or half core. Saprolite samples are wrapped in cling wrap saprolite samples are wrapped in cling wrap.
As of March 31, 2019, there are 20,050 original density determinations related to the Médinandi area. Of these, 16,129 are related to the resource update drilling. As of March 31, 2019, there are 8,970 original density determinations that relate to the Anaconda area.
11.5 Analytical and Test Laboratories
Table 11-1 presents the assay population source by laboratory.
With the exception of the Fekola Mine laboratory, the analytical laboratories used to date for the Project are independent commercial laboratories.
From January 2011 to June 2013, the primary laboratory was SGS Kayes, in Mali. The SGS Kayes facility was closed in mid-2013, and samples were subsequently sent to SGS Bamako in Mali from November 2013.
With increased sample volumes, Bureau Veritas in Abidjan, Cote D’Ivoire served as an alternate primary laboratory between July 2017 and July 2018. The Fekola Mine laboratory has also been used as an alternate primary laboratory since mid-June 2017.
SGS Bamako and the Fekola Mine laboratory currently serve as the primary laboratories.
SGS Morila in southern Mali has been used as a secondary laboratory. Primary samples were sent there periodically, and SGS Morila has also occasionally been used for umpire (check) sampling. Bureau Veritas Abidjan has been used as an umpire laboratory for SGS Bamako analyses and SGS Bamako has been used as an umpire laboratory for Bureau Veritas Abidjan and Fekola Mine laboratory analyses.
SGS advised that SGS Bamako is currently ISO17025 accredited. The SGS Kayes and SGS Morila laboratories operated a quality system that SGS considered to be in line with ISO17025 requirements.
B2Gold was advised that the Bureau Veritas Abidjan laboratory is currently operating to the guidelines of ISO9001 and ISO17025 protocols in accordance with procedures specified within the Bureau Veritas group. B2Gold was informed that laboratory is currently working on the documentation required to formally have ISO certification in place.
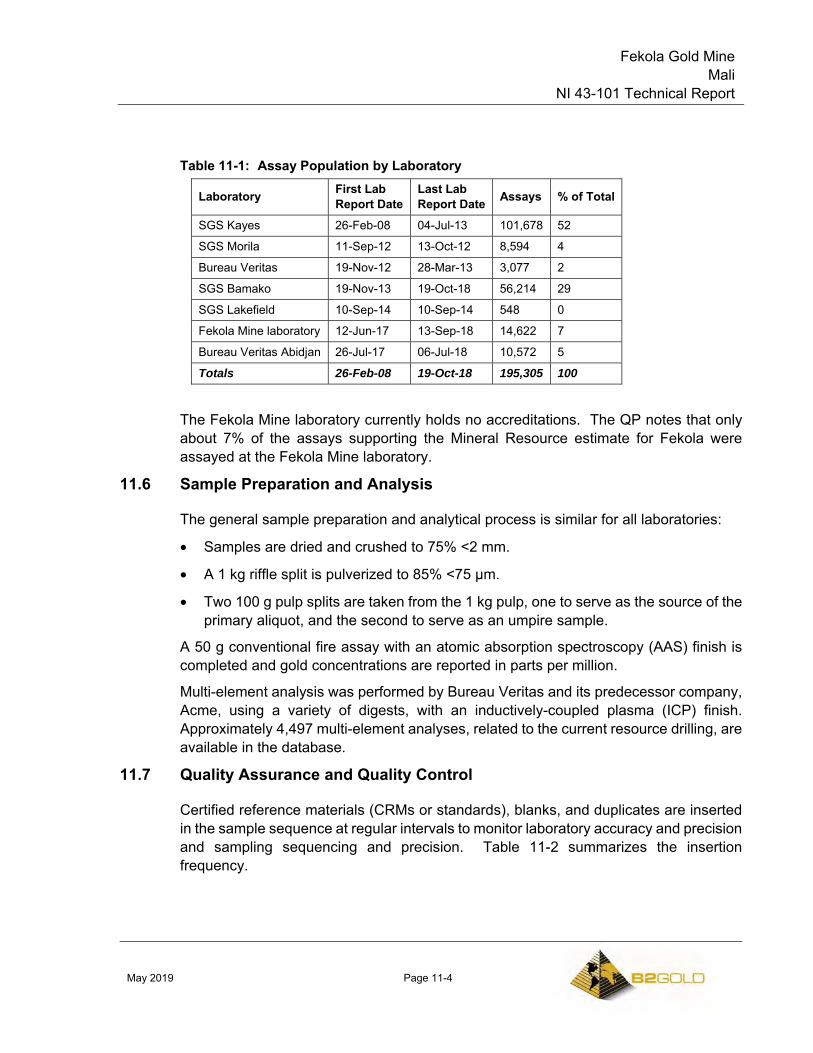
Fekola Gold Mine Mali
NI 43-101 Technical Report
May 2019 Page 11-4
Table 11-1: Assay Population by Laboratory
Laboratory First Lab Report Date
Last Lab Report Date Assays % of Total
SGS Kayes 26-Feb-08 04-Jul-13 101,678 52
SGS Morila 11-Sep-12 13-Oct-12 8,594 4
Bureau Veritas 19-Nov-12 28-Mar-13 3,077 2
SGS Bamako 19-Nov-13 19-Oct-18 56,214 29
SGS Lakefield 10-Sep-14 10-Sep-14 548 0
Fekola Mine laboratory 12-Jun-17 13-Sep-18 14,622 7
Bureau Veritas Abidjan 26-Jul-17 06-Jul-18 10,572 5
Totals 26-Feb-08 19-Oct-18 195,305 100
The Fekola Mine laboratory currently holds no accreditations. The QP notes that only about 7% of the assays supporting the Mineral Resource estimate for Fekola were assayed at the Fekola Mine laboratory.
11.6 Sample Preparation and Analysis
The general sample preparation and analytical process is similar for all laboratories:
• Samples are dried and crushed to 75% <2 mm.
• A 1 kg riffle split is pulverized to 85% <75 µm.
• Two 100 g pulp splits are taken from the 1 kg pulp, one to serve as the source of the primary aliquot, and the second to serve as an umpire sample.
A 50 g conventional fire assay with an atomic absorption spectroscopy (AAS) finish is completed and gold concentrations are reported in parts per million.
Multi-element analysis was performed by Bureau Veritas and its predecessor company, Acme, using a variety of digests, with an inductively-coupled plasma (ICP) finish. Approximately 4,497 multi-element analyses, related to the current resource drilling, are available in the database.
11.7 Quality Assurance and Quality Control
Certified reference materials (CRMs or standards), blanks, and duplicates are inserted in the sample sequence at regular intervals to monitor laboratory accuracy and precision and sampling sequencing and precision. Table 11-2 summarizes the insertion frequency.
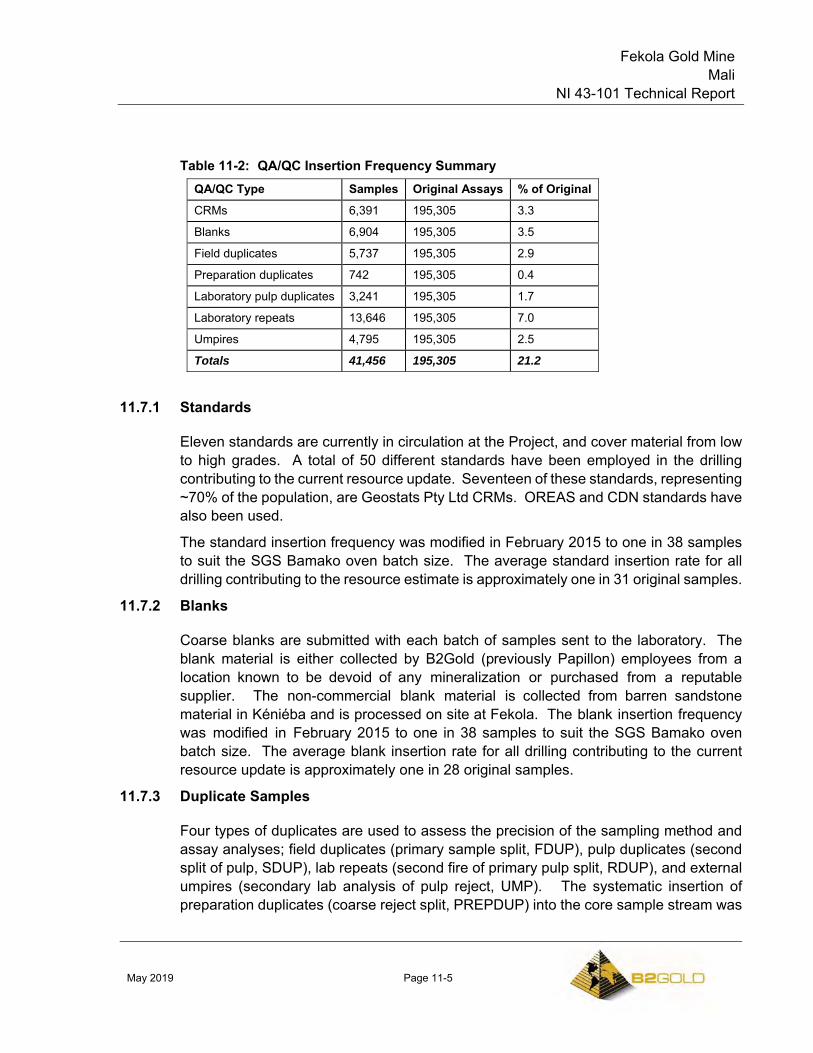
Fekola Gold Mine Mali
NI 43-101 Technical Report
May 2019 Page 11-5
Table 11-2: QA/QC Insertion Frequency Summary QA/QC Type Samples Original Assays % of Original
CRMs 6,391 195,305 3.3
Blanks 6,904 195,305 3.5
Field duplicates 5,737 195,305 2.9
Preparation duplicates 742 195,305 0.4
Laboratory pulp duplicates 3,241 195,305 1.7
Laboratory repeats 13,646 195,305 7.0
Umpires 4,795 195,305 2.5
Totals 41,456 195,305 21.2
11.7.1 Standards
Eleven standards are currently in circulation at the Project, and cover material from low to high grades. A total of 50 different standards have been employed in the drilling contributing to the current resource update. Seventeen of these standards, representing ~70% of the population, are Geostats Pty Ltd CRMs. OREAS and CDN standards have also been used.
The standard insertion frequency was modified in February 2015 to one in 38 samples to suit the SGS Bamako oven batch size. The average standard insertion rate for all drilling contributing to the resource estimate is approximately one in 31 original samples.
11.7.2 Blanks
Coarse blanks are submitted with each batch of samples sent to the laboratory. The blank material is either collected by B2Gold (previously Papillon) employees from a location known to be devoid of any mineralization or purchased from a reputable supplier. The non-commercial blank material is collected from barren sandstone material in Kéniéba and is processed on site at Fekola. The blank insertion frequency was modified in February 2015 to one in 38 samples to suit the SGS Bamako oven batch size. The average blank insertion rate for all drilling contributing to the current resource update is approximately one in 28 original samples.
11.7.3 Duplicate Samples
Four types of duplicates are used to assess the precision of the sampling method and assay analyses; field duplicates (primary sample split, FDUP), pulp duplicates (second split of pulp, SDUP), lab repeats (second fire of primary pulp split, RDUP), and external umpires (secondary lab analysis of pulp reject, UMP). The systematic insertion of preparation duplicates (coarse reject split, PREPDUP) into the core sample stream was
Fekola Gold Mine Mali
NI 43-101 Technical Report
May 2019 Page 11-6
implemented in February 2015. Prior to February 2015, preparation duplicates were only taken from the metallurgical test hole FK_MET05.
Field duplicates have been inserted at a frequency of one duplicate every 33 samples. The duplicate is collected from the second split at the RC chip splitter or from quartered core. Core field duplicate insertion frequency was halved in February 2015 with the implementation of core preparation duplicates. The average field duplicate insertion rate is approximately one in 34 original samples.
The average preparation duplicate insertion rate is approximately one in 263 original samples.
Pulp duplicates and laboratory repeats are reported at a minimum frequency of one in 76 samples (one per oven batch). The actual insertion frequency greatly exceeds the minimum (~2 in 76 and ~5 in 76 respectively). The actual average laboratory pulp duplicate insertion rate for all drilling is approximately one in 60 original samples. The actual average laboratory repeat rate is approximately one in 14 original samples.
Umpire assays are available for about 2.5% of the assays, with a focus on samples yielding original assays >0.25 g/t Au.
11.7.4 Magnetic Susceptibility
Magnetic susceptibility is measured with a Terraplus/Georadis KT-10 magnetic susceptibility meter. A section of core with known magnetic susceptibility is used at the start of the drill hole and at the end of the drill hole. Two readings are taken from the core with known values on both sides. A duplicate reading is taken every 1:10 samples. The QA/QC data are periodically reviewed. There are 109,178 magnetic susceptibility readings within the database related to drill holes supporting the Mineral Resource estimate.
11.7.5 Density
A core piece with known weight is used for reference sample readings that are taken at the start of the process and every 25th reading to ensure standard operating procedures are being followed, and weighing scales are being managed correctly. Duplicate density readings are taken every 10th sample in the drill hole.
B2Gold (following Papillon) uses the water immersion method on drill core as a standard procedure for measuring density. Measurements are done on air dried whole core samples, typically 10–20 cm long. Sample frequency by Papillon was one sample per 20–30 m, this was increased to one sample per 5 m under B2Gold.
Fekola Gold Mine Mali
NI 43-101 Technical Report
May 2019 Page 11-7
Bulk density is measured by weighing the sample in air and water, and using the formula:
Mair / (Mair-Mwater) = d
Where, Mair = mass of the sample in air in grams;
water = mass of the sample in water in grams.
Density measurements for saprolite drill samples use a similar procedure to that used on more competent samples. For saprolite samples, two density measurements are usually done, one before drying and a second after drying. Samples are wrapped in cling wrap for water immersion weighing. Samples are typically air dried although oven drying is sometimes used during the wet season.
11.8 Databases
Prior to January of 2015 the project drill hole database was managed remotely by IoGlobal in Perth, WA. The transition to onsite/in-house database management was completed in January 2015 by B2Gold employees. The database is currently managed onsite in the B2Gold standard database format. The data flow has not changed substantially except for the elimination of the remote hosting.
As with the IoGlobal system, all field data at Fekola is initially captured on paper. Data entry personnel enter the data into a series of Excel templates with extensive pick-lists and validation rules. The drill geologist checks the digital file against the paper original and signs off on a printed copy of the captured data. The data are imported into Micromine for a first-stage validation. This stage checks that drill hole collars are plotting in the correct locations and that loaded drill hole data is complete. This process is overseen by the database manager. The original paper capture forms are filed by drill hole.
Assay data is imported as text upon receipt from the laboratory, retaining the original laboratory codes. Text is translated to numeric values within the database. Assay results are not associated with samples until the results have been QA/QC vetted. Assay results for blanks and standards are compared with expected results via queries in the database. After QA/QC validation assays are assigned a Passing (1) or Failing (3) priority. Failed assays are excluded from database exports.
Export subsets are generated by macros within the database. These files are created and published to an online file transfer portal after any significant change within the database.
The database includes QA/QC reporting utilities to facilitate tracking standard and blank performance, duplicate precision, and analytical bias. QA/QC data is reviewed on a continuous basis as data is imported into the database. Comprehensive QA/QC reports are generated by the local database manager and reviewed by senior staff each month.
Fekola Gold Mine Mali
NI 43-101 Technical Report
May 2019 Page 11-8
B2Gold’s International Database Manager also monitors database and QA/QC activities.
The entire database is backed up to an online file transfer portal twice weekly. These backups are downloaded and stored on the B2Gold file server in Vancouver on a regular basis.
Digital photos are stored on the site server and identified by drilling method and drill hole ID. Each drill hole is photographed wet and dry, and the picture is named with drill hole ID and interval. Digital images are backed up to a separate location to the primary database.
11.9 Sample Security
Sample security measures include moving RC samples and core from the drill site to the sample yard at the end of each drill shift and tracking of sample shipments using industry-standard procedures. B2Gold is of the opinion that core storage is secure because the area is remote, access is strictly controlled and a B2/Gold or Papillon representative has always been present.
11.10 Comments on Sample Preparation, Analyses and Security
In the opinion of the QPs:
• Sample collection, preparation, analysis and security for RC and core drill programs are in line with industry-standard methods for gold deposits;
• Drill programs included insertion of blank, duplicate, and standard reference material samples;
• QA/QC methods are practiced during magnetic susceptibility and specific gravity measurement programs, which are industry leading practices.
• QA/QC program results do not indicate any problems with the analytical programs (refer to discussion in Section 12);
• Data is subject to validation, which includes checks on surveys, collar co-ordinates, lithology data, and assay data. The checks are appropriate, and consistent with industry standards (refer to discussion in Section 12);
• All core and RC chips have been catalogued and stored in designated areas.
The QP is of the opinion that the quality of the gold analytical data is sufficiently reliable to support Mineral Resource estimation without limitations on Mineral Resource confidence categories.
Fekola Gold Mine Mali
NI 43-101 Technical Report
May 2019 Page 12-1
12.0 DATA VERIFICATION
12.1 Data Checks
12.1.1 Data Entry
Project data is entered or downloaded from various sources (drill logs, surface sampling logs, magnetic susceptibility meters, density measurement logs) into Excel spreadsheets.
The responsible geologist enters the drill hole data into Micromine for first pass validation for first-pass checking of collar locations and completeness of downhole data.
All data collected for each drill hole is entered into a series of separate templates for collar, structure, lithology, survey etc. for upload to the B2Gold Access Database.
The templates are checked by the database Manager prior to upload.
12.1.2 QA/QC
QA/QC data are reviewed on a continuous basis as data arrives from the assay laboratories. The findings are summarised and published on a monthly basis. Actions arising from the report are implemented and reviewed the following month.
The B2Gold QA/QC validation rules include:
• A standard analysis more than three standard deviations (SD) from the expected value constitutes a failure (3SDHIGH or 3SDLOW).
• A standard analysis between two and three standard deviations from the expected value generates a warning (WARNHIGH or WARNLOW).
• Two sequential standards more than 2SD from the expected value on the same side of the expected value constitute a bias failure. (BIASHIGH, BIASLOW).
The published standard deviation of artificial standards is often very small (as a percentage of the expected value). B2Gold employs limits based on the published standard deviation or 3.33% of the expected value whichever is greater. This practice is based on the verbal advice of Dr. Barry W. Smee, Ph.D., P.Geo. (Smee and Associates Consulting Ltd). The published standard deviation has been employed for the majority (17 of 19) of the standards employed by Papillon. AUSK_1 (35 instances) and Si54 (16 instances) use a calculated SD of 3.33%.
Blank analyses generate warnings at five times the method detection limit and failures when they exceed 10 times the method detection limit.
The treatment of failures is similar to that previously employed by Papillon. The failure is evaluated in context of the surrounding samples and standards to determine if the
Fekola Gold Mine Mali
NI 43-101 Technical Report
May 2019 Page 12-2
failure is possibly the result of a standard or blank misidentification or if the failure is possibly the result of a laboratory mix up of samples or sample numbers. Sample weights, assays, and Z-scores (deviation of the analysis from the expected value in terms of number of standard deviations) are all used to aid this type of evaluation.
If it is not possible to determine, with reasonable certainty, that the failure is the result of a standard substitution error or a sample mix-up, either in the submittal or at the lab, re-analyses of all or part of the batch may be requested.
In cases where the failure is within a sequence of low grade/insignificant results the project manager may elect to accept the original certificate, regardless of the failure, on the basis that it will not significantly affect any resource data.
QA/QC data are reviewed on a continuous basis as data is imported into the database. Comprehensive QA/QC reports are generated by the site database manager and reviewed by senior staff on a monthly basis. B2Gold’s International Database Manager also monitors database and QA/QC activities.
Monthly QA/QC reports include:
• A summary of the samples shipped and analyses received during the period with a statement of turnaround time;
• Standard and Blank performance summaries by month, year, and standard type;
• Standard analysis bias summaries by grade bin;
• Individual standard performance tracking plots. Standard assays are tracked over time for each standard. Separate plots are generated for initial values, including failures, and final accepted values. These plots permit evaluation of precision, accuracy, and bias trends for individual standards;
• Blank performance tracking plots: blank assays are tracked over time. Separate plots are generated for initial values, including failures, and final accepted values. These plots permit identification and evaluation of anomalous trends in blank assay performance;
• Duplicate scatterplots: scatterplots are presented for field duplicates (primary sample split, FDUP), preparation duplicates (coarse reject split, PREPDUP), pulp duplicates (second split of pulp, SDUP), and laboratory repeats (second fire of primary pulp split, RDUP);
• Thompson–Howarth plots are generated for all duplicate types;
• Umpire samples are sent to a third-party laboratory for check analysis on a quarterly basis.
Fekola Gold Mine Mali
NI 43-101 Technical Report
May 2019 Page 12-3
12.1.3 Results
Examination of the QA/QC sample data indicates satisfactory performance of field sampling protocols and assay laboratories providing acceptable levels of precision and accuracy.
12.2 Laboratory Inspections
Laboratory visits monitor:
• Sample receiving and laboratory information management system (LIMS) system;
• Sample preparation (drying, crushing, pulverizing and splitting etc.);
• Quality control (instrument maintenance, instrument calibration and control samples, quality control charts etc.);
• Operating conditions;
• Sample blending prior to analysis;
• Overall view of analytical procedures from start to finish.
12.3 Geological Model Checks
Prior to conducting Mineral Resource estimates, the modellers and estimators undertake the following checks:
• Geological interpretation of the model wireframes relative to drill hole data for regolith surfaces, structural models, lithology model, and mineralization wireframes on section and plan;
• Exploratory data analysis to determine capping levels, composite lengths and geologic model tagging;
• Comparison of grade in drill holes and adjacent blocks in model;
• Comparison of final block model resource with previous resource models;
• Comparison of final grade estimation model with different techniques of estimation.
12.4 October 2018 Fekola Mineral Resource Estimate Data Support
12.4.1 Field Duplicates
The drill hole database used to generate the current resource update contains first duplicate analysis for 6,710 samples, or approximately one duplicate for every 29 original assays. The means of the original and duplicate assay pairs are very similar,
Fekola Gold Mine Mali
NI 43-101 Technical Report
May 2019 Page 12-4
0.81 g/t Au versus 0.80 g/t Au suggesting sample extraction and analytical errors are very low.
12.4.2 Blanks
Insertion of blank material is part of the routine QA/QC protocol and the 6,904 samples available equate to an insertion frequency of 1:28. Of this population, six blank assays generated warnings and one blank failed. The very low frequency of blank failures suggests that the laboratories are working cleanly with few sample mix-ups.
12.4.3 Standards (CRMs)
Standard bias is monitored on an ongoing basis. There is no significant continuous analytical bias apparent in the standard analyses.
12.5 QP Verification
During numerous site visits from 2014 to 2018, the QP personally inspected:
• RC drilling and sampling procedures at the rig during drilling;
• Diamond drilling at various drills and the core retrieval and handling procedures;
• RC sample splitting procedures;
• Core metre and low line marking and geotechnical assessment procedures;
• Core logging procedures, protocols and geological control;
• Core photography procedures and quality;
• Core cutting and sampling procedures;
• Core storage and security;
• SG measurement and SG QA/QC procedures;
• Sample shipping and chain of custody procedures;
• Data entry and data verification procedures;
• Spot inspections of data filing and organization;
• Database management procedures;
• Accuracy of geological interpretations and grade interpretations on section and plan, and in geological models.
Fekola Gold Mine Mali
NI 43-101 Technical Report
May 2019 Page 12-5
12.6 Comments on Data Verification
The checks performed by B2Gold staff, including the continuous QA/QC checks conducted by the database administrator and Project geologists on the assay data and geological data are in line with or above industry standards for data verification. These checks have identified no material issues with the data or the Project database.
The 2014 and 2015 technical reports (refer to Section 2.7) included a review of data verification. No material issues with the data or the Project database were identified at that time.
As part of site visits from 2014–2018, the QP has personally verified a portion of the data supporting the estimates (refer to Section 12.5). As a result of the data verification, the QP concludes that the Project data and database are acceptable for use in Mineral Resource and Mineral Reserve estimation, and can be used to support mine planning.
Fekola Gold Mine Mali
NI 43-101 Technical Report
May 2019 Page 13-1
13.0 MINERAL PROCESSING AND METALLURGICAL TESTING
13.1 Introduction
Initial metallurgical testing was undertaken by Papillon. However, none of this testwork was used in plant design. The plant design is supported by testwork commissioned by B2Gold, and primarily performed at SGS Lakefield in Ontario, Canada in 2014–2015. A round of testwork was performed on material from Fekola North in 2018 to determine amenability of treatment through the current plant.
13.2 Metallurgical Testwork
13.2.1 Fekola
Locations of samples supporting feasibility-level metallurgical testwork were provided in Figure 10-4. Metallurgical and comminution tests were based on three metallurgical and three comminution domain samples, and 18 metallurgical variability and comminution variability samples. Domains were established as:
• High Grade (HG): 2.0–5.0 g/t Au;
• Hanging Wall (HW): 1.0–2.0 g/t Au;
• Low Grade (LG): 0.6–1.0 g/t Au;
A summary of testwork completed at the time of the 2015 Feasibility Study is provided in Table 13-1. Results are summarized in Table 13-2. Overall, the testwork program indicated that:
• The Fekola deposit is classified as hard to very hard competency with above average grinding energy requirements and is moderate to highly abrasive. The mill feed material is amenable to primary crushing followed by a SAG mill and ball mill with pebble crushing (SABC);
• Fekola mill feed material is predominantly 'free-milling', not 'preg robbing' and is amenable to gold extraction by conventional cyanidation;
• A gravity separation circuit was not warranted for the Fekola deposit. Instead, a carbon column adsorption circuit is included to recover dissolved gold leached in the grinding circuit to facilitate early recovery of gold, particularly during high gold head grade periods;
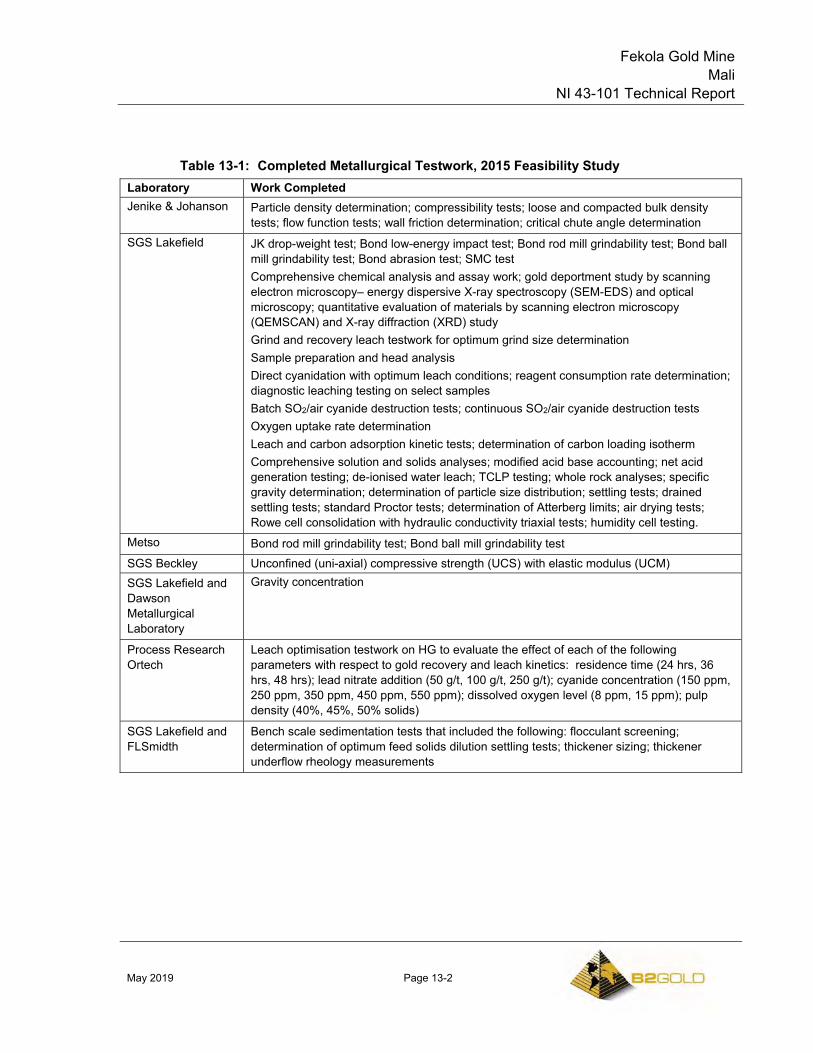
Fekola Gold Mine Mali
NI 43-101 Technical Report
May 2019 Page 13-2
Table 13-1: Completed Metallurgical Testwork, 2015 Feasibility Study Laboratory Work Completed Jenike & Johanson Particle density determination; compressibility tests; loose and compacted bulk density
tests; flow function tests; wall friction determination; critical chute angle determination SGS Lakefield JK drop-weight test; Bond low-energy impact test; Bond rod mill grindability test; Bond ball
mill grindability test; Bond abrasion test; SMC test Comprehensive chemical analysis and assay work; gold deportment study by scanning electron microscopy– energy dispersive X-ray spectroscopy (SEM-EDS) and optical microscopy; quantitative evaluation of materials by scanning electron microscopy (QEMSCAN) and X-ray diffraction (XRD) study Grind and recovery leach testwork for optimum grind size determination Sample preparation and head analysis Direct cyanidation with optimum leach conditions; reagent consumption rate determination; diagnostic leaching testing on select samples Batch SO2/air cyanide destruction tests; continuous SO2/air cyanide destruction tests Oxygen uptake rate determination Leach and carbon adsorption kinetic tests; determination of carbon loading isotherm Comprehensive solution and solids analyses; modified acid base accounting; net acid generation testing; de-ionised water leach; TCLP testing; whole rock analyses; specific gravity determination; determination of particle size distribution; settling tests; drained settling tests; standard Proctor tests; determination of Atterberg limits; air drying tests; Rowe cell consolidation with hydraulic conductivity triaxial tests; humidity cell testing.
Metso Bond rod mill grindability test; Bond ball mill grindability test SGS Beckley Unconfined (uni-axial) compressive strength (UCS) with elastic modulus (UCM) SGS Lakefield and Dawson Metallurgical Laboratory
Gravity concentration
Process Research Ortech
Leach optimisation testwork on HG to evaluate the effect of each of the following parameters with respect to gold recovery and leach kinetics: residence time (24 hrs, 36 hrs, 48 hrs); lead nitrate addition (50 g/t, 100 g/t, 250 g/t); cyanide concentration (150 ppm, 250 ppm, 350 ppm, 450 ppm, 550 ppm); dissolved oxygen level (8 ppm, 15 ppm); pulp density (40%, 45%, 50% solids)
SGS Lakefield and FLSmidth
Bench scale sedimentation tests that included the following: flocculant screening; determination of optimum feed solids dilution settling tests; thickener sizing; thickener underflow rheology measurements
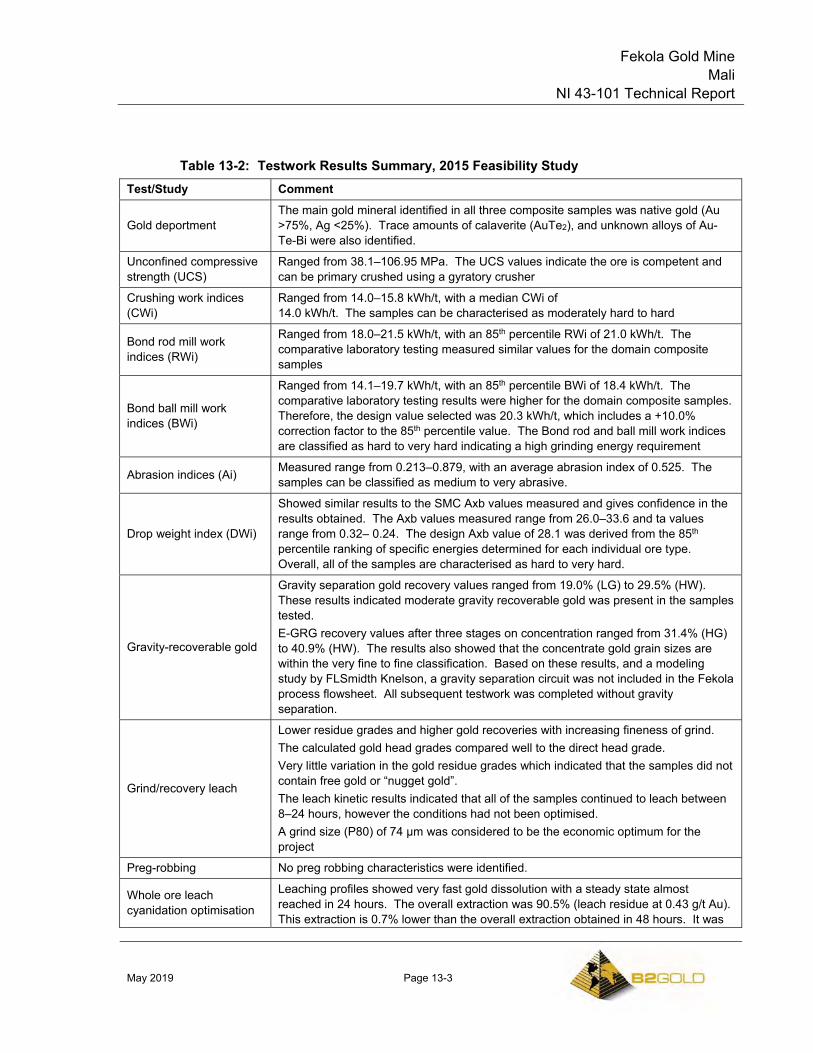
Fekola Gold Mine Mali
NI 43-101 Technical Report
May 2019 Page 13-3
Table 13-2: Testwork Results Summary, 2015 Feasibility Study Test/Study Comment
Gold deportment The main gold mineral identified in all three composite samples was native gold (Au >75%, Ag <25%). Trace amounts of calaverite (AuTe2), and unknown alloys of Au-Te-Bi were also identified.
Unconfined compressive strength (UCS)
Ranged from 38.1–106.95 MPa. The UCS values indicate the ore is competent and can be primary crushed using a gyratory crusher
Crushing work indices (CWi)
Ranged from 14.0–15.8 kWh/t, with a median CWi of 14.0 kWh/t. The samples can be characterised as moderately hard to hard
Bond rod mill work indices (RWi)
Ranged from 18.0–21.5 kWh/t, with an 85th percentile RWi of 21.0 kWh/t. The comparative laboratory testing measured similar values for the domain composite samples
Bond ball mill work indices (BWi)
Ranged from 14.1–19.7 kWh/t, with an 85th percentile BWi of 18.4 kWh/t. The comparative laboratory testing results were higher for the domain composite samples. Therefore, the design value selected was 20.3 kWh/t, which includes a +10.0% correction factor to the 85th percentile value. The Bond rod and ball mill work indices are classified as hard to very hard indicating a high grinding energy requirement
Abrasion indices (Ai) Measured range from 0.213–0.879, with an average abrasion index of 0.525. The samples can be classified as medium to very abrasive.
Drop weight index (DWi)
Showed similar results to the SMC Axb values measured and gives confidence in the results obtained. The Axb values measured range from 26.0–33.6 and ta values range from 0.32– 0.24. The design Axb value of 28.1 was derived from the 85th percentile ranking of specific energies determined for each individual ore type. Overall, all of the samples are characterised as hard to very hard.
Gravity-recoverable gold
Gravity separation gold recovery values ranged from 19.0% (LG) to 29.5% (HW). These results indicated moderate gravity recoverable gold was present in the samples tested. E-GRG recovery values after three stages on concentration ranged from 31.4% (HG) to 40.9% (HW). The results also showed that the concentrate gold grain sizes are within the very fine to fine classification. Based on these results, and a modeling study by FLSmidth Knelson, a gravity separation circuit was not included in the Fekola process flowsheet. All subsequent testwork was completed without gravity separation.
Grind/recovery leach
Lower residue grades and higher gold recoveries with increasing fineness of grind. The calculated gold head grades compared well to the direct head grade. Very little variation in the gold residue grades which indicated that the samples did not contain free gold or “nugget gold”. The leach kinetic results indicated that all of the samples continued to leach between 8–24 hours, however the conditions had not been optimised. A grind size (P80) of 74 µm was considered to be the economic optimum for the project
Preg-robbing No preg robbing characteristics were identified.
Whole ore leach cyanidation optimisation
Leaching profiles showed very fast gold dissolution with a steady state almost reached in 24 hours. The overall extraction was 90.5% (leach residue at 0.43 g/t Au). This extraction is 0.7% lower than the overall extraction obtained in 48 hours. It was
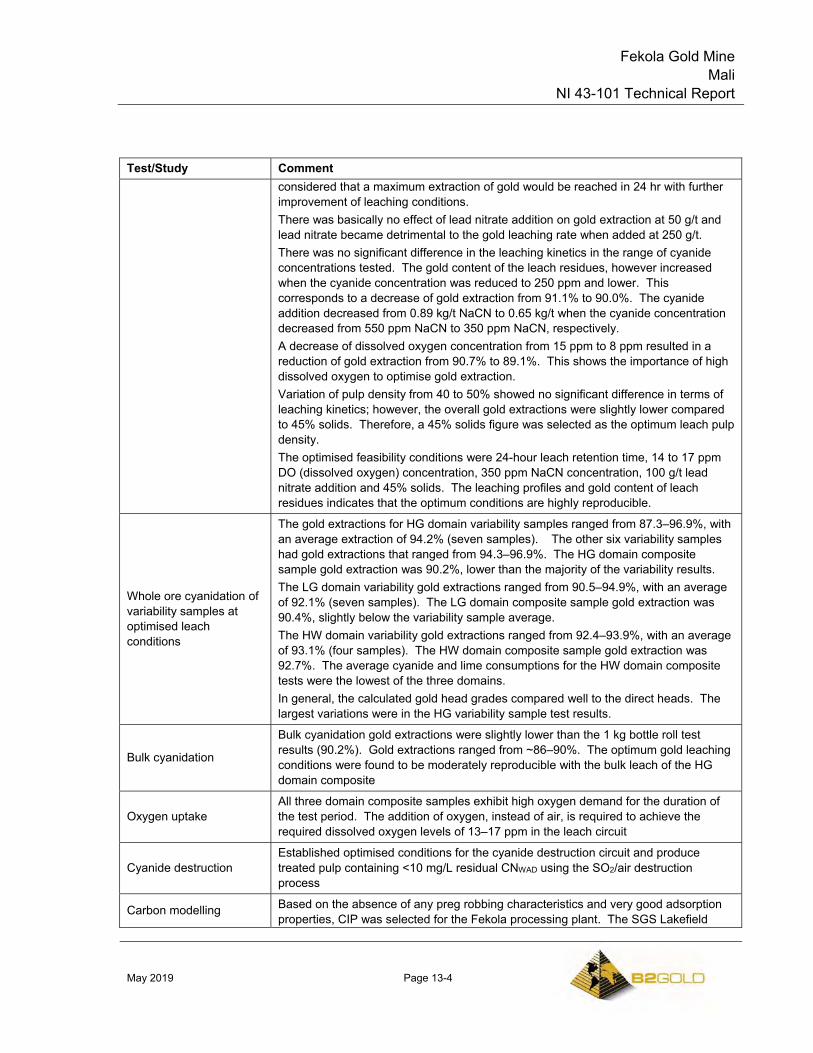
Fekola Gold Mine Mali
NI 43-101 Technical Report
May 2019 Page 13-4
Test/Study Comment considered that a maximum extraction of gold would be reached in 24 hr with further improvement of leaching conditions. There was basically no effect of lead nitrate addition on gold extraction at 50 g/t and lead nitrate became detrimental to the gold leaching rate when added at 250 g/t. There was no significant difference in the leaching kinetics in the range of cyanide concentrations tested. The gold content of the leach residues, however increased when the cyanide concentration was reduced to 250 ppm and lower. This corresponds to a decrease of gold extraction from 91.1% to 90.0%. The cyanide addition decreased from 0.89 kg/t NaCN to 0.65 kg/t when the cyanide concentration decreased from 550 ppm NaCN to 350 ppm NaCN, respectively. A decrease of dissolved oxygen concentration from 15 ppm to 8 ppm resulted in a reduction of gold extraction from 90.7% to 89.1%. This shows the importance of high dissolved oxygen to optimise gold extraction. Variation of pulp density from 40 to 50% showed no significant difference in terms of leaching kinetics; however, the overall gold extractions were slightly lower compared to 45% solids. Therefore, a 45% solids figure was selected as the optimum leach pulp density. The optimised feasibility conditions were 24-hour leach retention time, 14 to 17 ppm DO (dissolved oxygen) concentration, 350 ppm NaCN concentration, 100 g/t lead nitrate addition and 45% solids. The leaching profiles and gold content of leach residues indicates that the optimum conditions are highly reproducible.
Whole ore cyanidation of variability samples at optimised leach conditions
The gold extractions for HG domain variability samples ranged from 87.3–96.9%, with an average extraction of 94.2% (seven samples). The other six variability samples had gold extractions that ranged from 94.3–96.9%. The HG domain composite sample gold extraction was 90.2%, lower than the majority of the variability results. The LG domain variability gold extractions ranged from 90.5–94.9%, with an average of 92.1% (seven samples). The LG domain composite sample gold extraction was 90.4%, slightly below the variability sample average. The HW domain variability gold extractions ranged from 92.4–93.9%, with an average of 93.1% (four samples). The HW domain composite sample gold extraction was 92.7%. The average cyanide and lime consumptions for the HW domain composite tests were the lowest of the three domains. In general, the calculated gold head grades compared well to the direct heads. The largest variations were in the HG variability sample test results.
Bulk cyanidation
Bulk cyanidation gold extractions were slightly lower than the 1 kg bottle roll test results (90.2%). Gold extractions ranged from ~86–90%. The optimum gold leaching conditions were found to be moderately reproducible with the bulk leach of the HG domain composite
Oxygen uptake All three domain composite samples exhibit high oxygen demand for the duration of the test period. The addition of oxygen, instead of air, is required to achieve the required dissolved oxygen levels of 13–17 ppm in the leach circuit
Cyanide destruction Established optimised conditions for the cyanide destruction circuit and produce treated pulp containing <10 mg/L residual CNWAD using the SO2/air destruction process
Carbon modelling Based on the absence of any preg robbing characteristics and very good adsorption properties, CIP was selected for the Fekola processing plant. The SGS Lakefield
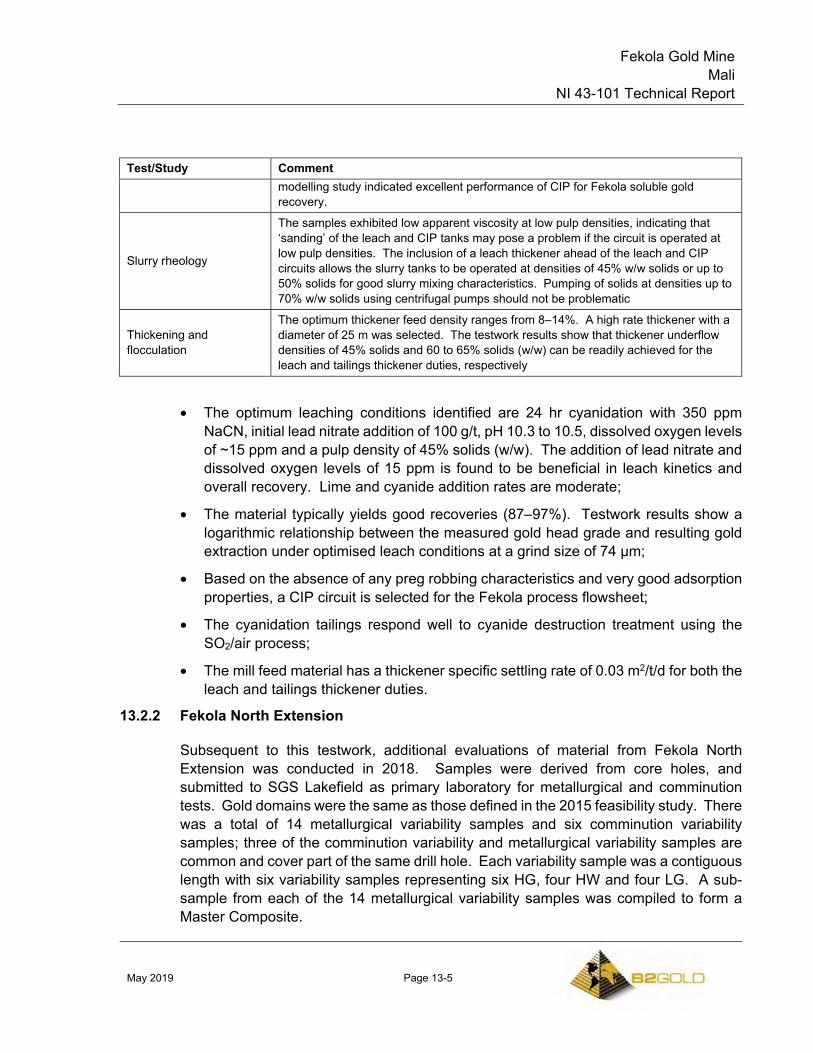
Fekola Gold Mine Mali
NI 43-101 Technical Report
May 2019 Page 13-5
Test/Study Comment modelling study indicated excellent performance of CIP for Fekola soluble gold recovery.
Slurry rheology
The samples exhibited low apparent viscosity at low pulp densities, indicating that ‘sanding’ of the leach and CIP tanks may pose a problem if the circuit is operated at low pulp densities. The inclusion of a leach thickener ahead of the leach and CIP circuits allows the slurry tanks to be operated at densities of 45% w/w solids or up to 50% solids for good slurry mixing characteristics. Pumping of solids at densities up to 70% w/w solids using centrifugal pumps should not be problematic
Thickening and flocculation
The optimum thickener feed density ranges from 8–14%. A high rate thickener with a diameter of 25 m was selected. The testwork results show that thickener underflow densities of 45% solids and 60 to 65% solids (w/w) can be readily achieved for the leach and tailings thickener duties, respectively
• The optimum leaching conditions identified are 24 hr cyanidation with 350 ppm NaCN, initial lead nitrate addition of 100 g/t, pH 10.3 to 10.5, dissolved oxygen levels of ~15 ppm and a pulp density of 45% solids (w/w). The addition of lead nitrate and dissolved oxygen levels of 15 ppm is found to be beneficial in leach kinetics and overall recovery. Lime and cyanide addition rates are moderate;
• The material typically yields good recoveries (87–97%). Testwork results show a logarithmic relationship between the measured gold head grade and resulting gold extraction under optimised leach conditions at a grind size of 74 µm;
• Based on the absence of any preg robbing characteristics and very good adsorption properties, a CIP circuit is selected for the Fekola process flowsheet;
• The cyanidation tailings respond well to cyanide destruction treatment using the SO2/air process;
• The mill feed material has a thickener specific settling rate of 0.03 m2/t/d for both the leach and tailings thickener duties.
13.2.2 Fekola North Extension
Subsequent to this testwork, additional evaluations of material from Fekola North Extension was conducted in 2018. Samples were derived from core holes, and submitted to SGS Lakefield as primary laboratory for metallurgical and comminution tests. Gold domains were the same as those defined in the 2015 feasibility study. There was a total of 14 metallurgical variability samples and six comminution variability samples; three of the comminution variability and metallurgical variability samples are common and cover part of the same drill hole. Each variability sample was a contiguous length with six variability samples representing six HG, four HW and four LG. A sub-sample from each of the 14 metallurgical variability samples was compiled to form a Master Composite.
Fekola Gold Mine Mali
NI 43-101 Technical Report
May 2019 Page 13-6
A summary of testwork completed is provided in Table 13-3. Testwork results are summarized in Table 13-4.
In general, the samples tested are classified as hard to very hard with medium to abrasive properties. Fekola North Extension material has similar comminution properties to the original Fekola results. The existing comminution circuit is suitable for the Fekola North material. The response of the Fekola North Extension metallurgical variability samples to a whole-ore cyanidation flowsheet using the current Fekola plant leach conditions indicated that the existing leaching circuit conditions are suitable for the Fekola North Extension mill feed material.
The current Fekola plant leaching conditions identified are 24 hr cyanidation with 350 ppm NaCN, initial lead nitrate addition of 100 g/t, pH 10.3–10.5, dissolved oxygen levels of ~15 ppm and a pulp density of 49% solids (w/w) are suitable for Fekola North Extension material. Lime and cyanide addition rates are similar and continue to be moderate. Fekola North Extension mill feed material has similar thickening specific settling rates of 0.24 and 0.25 m2/t/d for both the leach and tailings thickener duties.
The average gold extraction for the 14 metallurgical variability samples under existing plant conditions was 91.4%. The variability samples represented a grade range from 0.74–4.34 Au g/t. Testwork shows a polynomial relationship between the measured gold head grade and gold residue grade under optimised leach conditions at a grind size of 74 µm.
13.2.3 Anaconda
Metallurgical testwork on samples from the Anaconda deposit is underway, with SGS Lakefield the primary laboratory. Planned tests will include a similar testwork suite to those conducted during the 2015 feasibility study on the Fekola deposit.
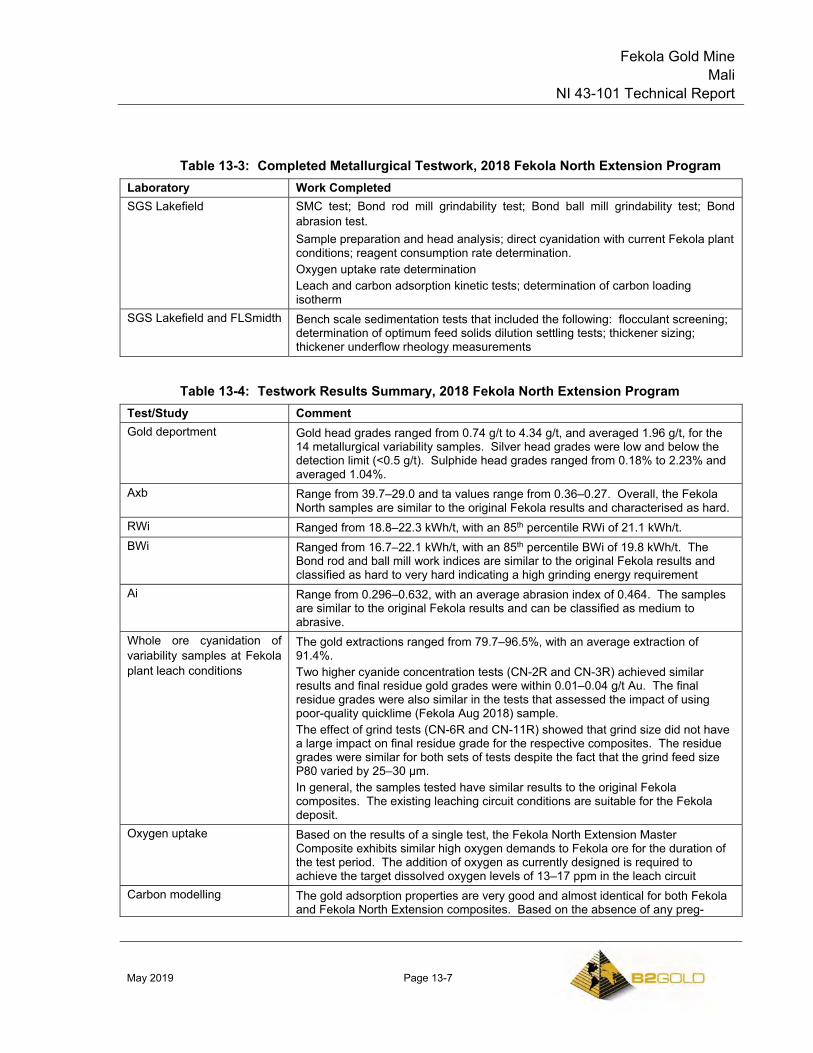
Fekola Gold Mine Mali
NI 43-101 Technical Report
May 2019 Page 13-7
Table 13-3: Completed Metallurgical Testwork, 2018 Fekola North Extension Program Laboratory Work Completed SGS Lakefield SMC test; Bond rod mill grindability test; Bond ball mill grindability test; Bond
abrasion test. Sample preparation and head analysis; direct cyanidation with current Fekola plant conditions; reagent consumption rate determination. Oxygen uptake rate determination Leach and carbon adsorption kinetic tests; determination of carbon loading isotherm
SGS Lakefield and FLSmidth Bench scale sedimentation tests that included the following: flocculant screening; determination of optimum feed solids dilution settling tests; thickener sizing; thickener underflow rheology measurements
Table 13-4: Testwork Results Summary, 2018 Fekola North Extension Program Test/Study Comment Gold deportment Gold head grades ranged from 0.74 g/t to 4.34 g/t, and averaged 1.96 g/t, for the
14 metallurgical variability samples. Silver head grades were low and below the detection limit (<0.5 g/t). Sulphide head grades ranged from 0.18% to 2.23% and averaged 1.04%.
Axb Range from 39.7–29.0 and ta values range from 0.36–0.27. Overall, the Fekola North samples are similar to the original Fekola results and characterised as hard.
RWi Ranged from 18.8–22.3 kWh/t, with an 85th percentile RWi of 21.1 kWh/t. BWi Ranged from 16.7–22.1 kWh/t, with an 85th percentile BWi of 19.8 kWh/t. The
Bond rod and ball mill work indices are similar to the original Fekola results and classified as hard to very hard indicating a high grinding energy requirement
Ai Range from 0.296–0.632, with an average abrasion index of 0.464. The samples are similar to the original Fekola results and can be classified as medium to abrasive.
Whole ore cyanidation of variability samples at Fekola plant leach conditions
The gold extractions ranged from 79.7–96.5%, with an average extraction of 91.4%. Two higher cyanide concentration tests (CN-2R and CN-3R) achieved similar results and final residue gold grades were within 0.01–0.04 g/t Au. The final residue grades were also similar in the tests that assessed the impact of using poor-quality quicklime (Fekola Aug 2018) sample. The effect of grind tests (CN-6R and CN-11R) showed that grind size did not have a large impact on final residue grade for the respective composites. The residue grades were similar for both sets of tests despite the fact that the grind feed size P80 varied by 25–30 µm. In general, the samples tested have similar results to the original Fekola composites. The existing leaching circuit conditions are suitable for the Fekola deposit.
Oxygen uptake Based on the results of a single test, the Fekola North Extension Master Composite exhibits similar high oxygen demands to Fekola ore for the duration of the test period. The addition of oxygen as currently designed is required to achieve the target dissolved oxygen levels of 13–17 ppm in the leach circuit
Carbon modelling The gold adsorption properties are very good and almost identical for both Fekola and Fekola North Extension composites. Based on the absence of any preg-
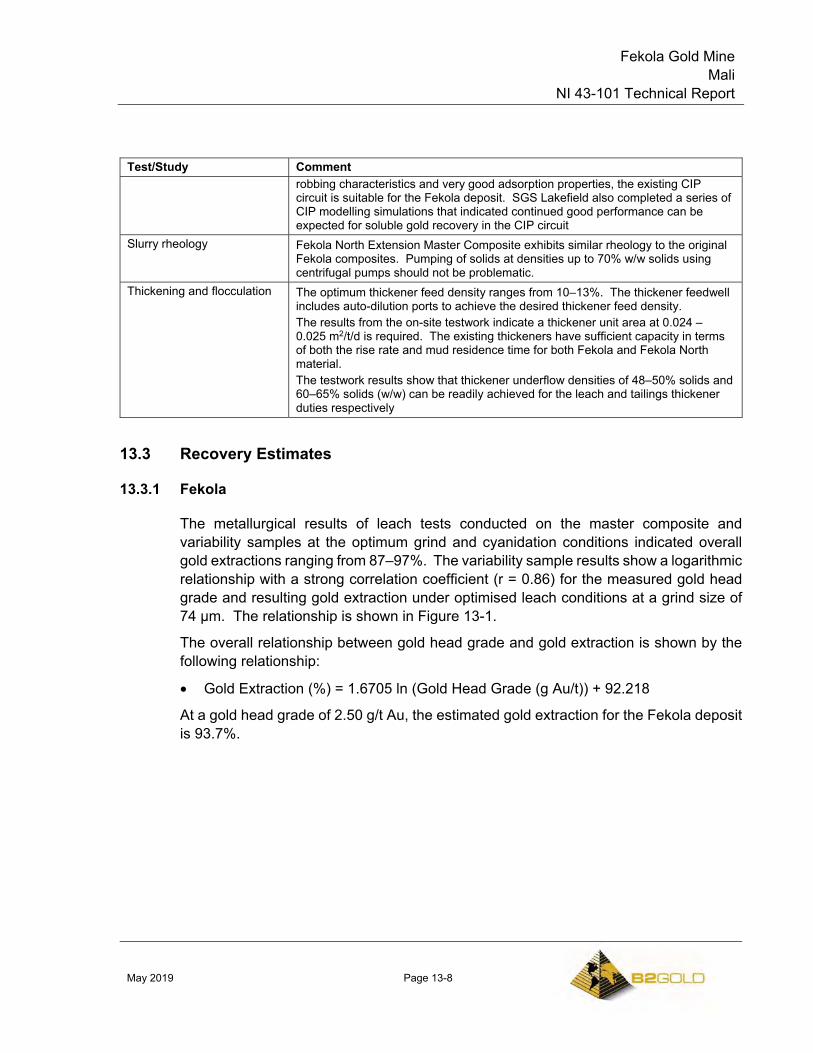
Fekola Gold Mine Mali
NI 43-101 Technical Report
May 2019 Page 13-8
Test/Study Comment robbing characteristics and very good adsorption properties, the existing CIP circuit is suitable for the Fekola deposit. SGS Lakefield also completed a series of CIP modelling simulations that indicated continued good performance can be expected for soluble gold recovery in the CIP circuit
Slurry rheology Fekola North Extension Master Composite exhibits similar rheology to the original Fekola composites. Pumping of solids at densities up to 70% w/w solids using centrifugal pumps should not be problematic.
Thickening and flocculation The optimum thickener feed density ranges from 10–13%. The thickener feedwell includes auto-dilution ports to achieve the desired thickener feed density. The results from the on-site testwork indicate a thickener unit area at 0.024 – 0.025 m2/t/d is required. The existing thickeners have sufficient capacity in terms of both the rise rate and mud residence time for both Fekola and Fekola North material. The testwork results show that thickener underflow densities of 48–50% solids and 60–65% solids (w/w) can be readily achieved for the leach and tailings thickener duties respectively
13.3 Recovery Estimates
13.3.1 Fekola
The metallurgical results of leach tests conducted on the master composite and variability samples at the optimum grind and cyanidation conditions indicated overall gold extractions ranging from 87–97%. The variability sample results show a logarithmic relationship with a strong correlation coefficient (r = 0.86) for the measured gold head grade and resulting gold extraction under optimised leach conditions at a grind size of 74 µm. The relationship is shown in Figure 13-1.
The overall relationship between gold head grade and gold extraction is shown by the following relationship:
• Gold Extraction (%) = 1.6705 ln (Gold Head Grade (g Au/t)) + 92.218
At a gold head grade of 2.50 g/t Au, the estimated gold extraction for the Fekola deposit is 93.7%.
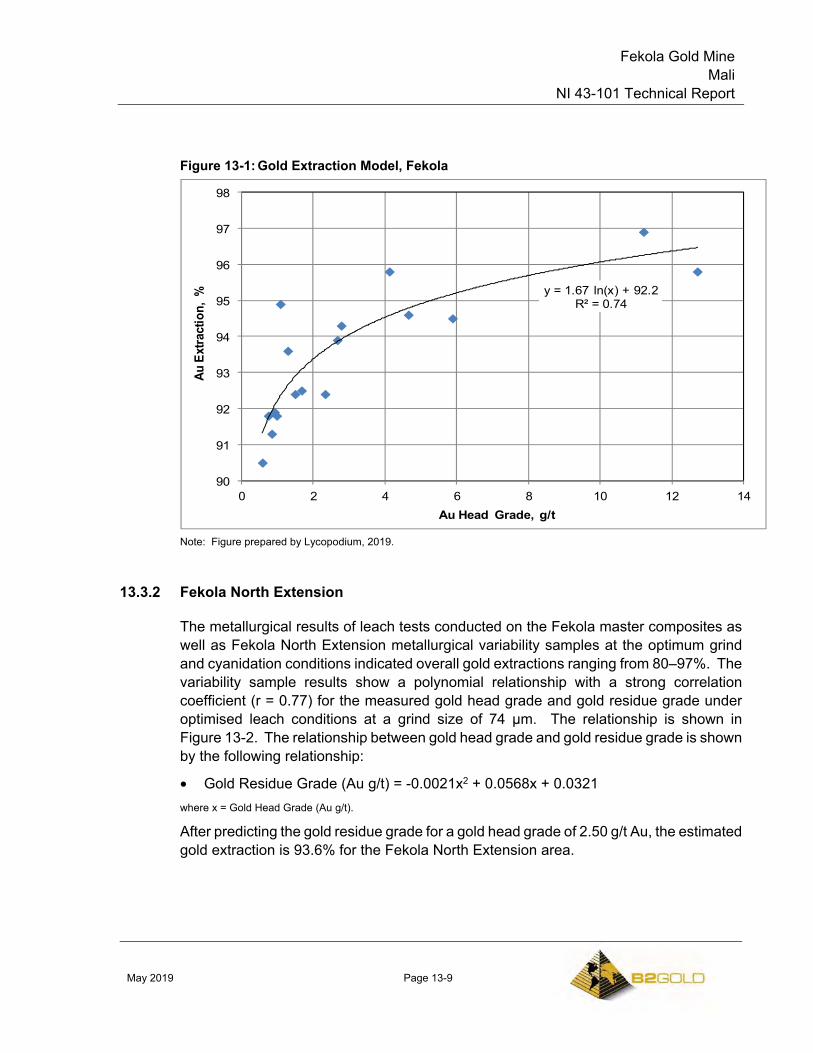
Fekola Gold Mine Mali
NI 43-101 Technical Report
May 2019 Page 13-9
Figure 13-1: Gold Extraction Model, Fekola
Note: Figure prepared by Lycopodium, 2019.
13.3.2 Fekola North Extension
The metallurgical results of leach tests conducted on the Fekola master composites as well as Fekola North Extension metallurgical variability samples at the optimum grind and cyanidation conditions indicated overall gold extractions ranging from 80–97%. The variability sample results show a polynomial relationship with a strong correlation coefficient (r = 0.77) for the measured gold head grade and gold residue grade under optimised leach conditions at a grind size of 74 µm. The relationship is shown in Figure 13-2. The relationship between gold head grade and gold residue grade is shown by the following relationship:
• Gold Residue Grade (Au g/t) = -0.0021x2 + 0.0568x + 0.0321 where x = Gold Head Grade (Au g/t).
After predicting the gold residue grade for a gold head grade of 2.50 g/t Au, the estimated gold extraction is 93.6% for the Fekola North Extension area.
y = 1.67 ln(x) + 92.2R² = 0.74
90
91
92
93
94
95
96
97
98
0 2 4 6 8 10 12 14
Au E
xtra
ctio
n, %
Au Head Grade, g/t
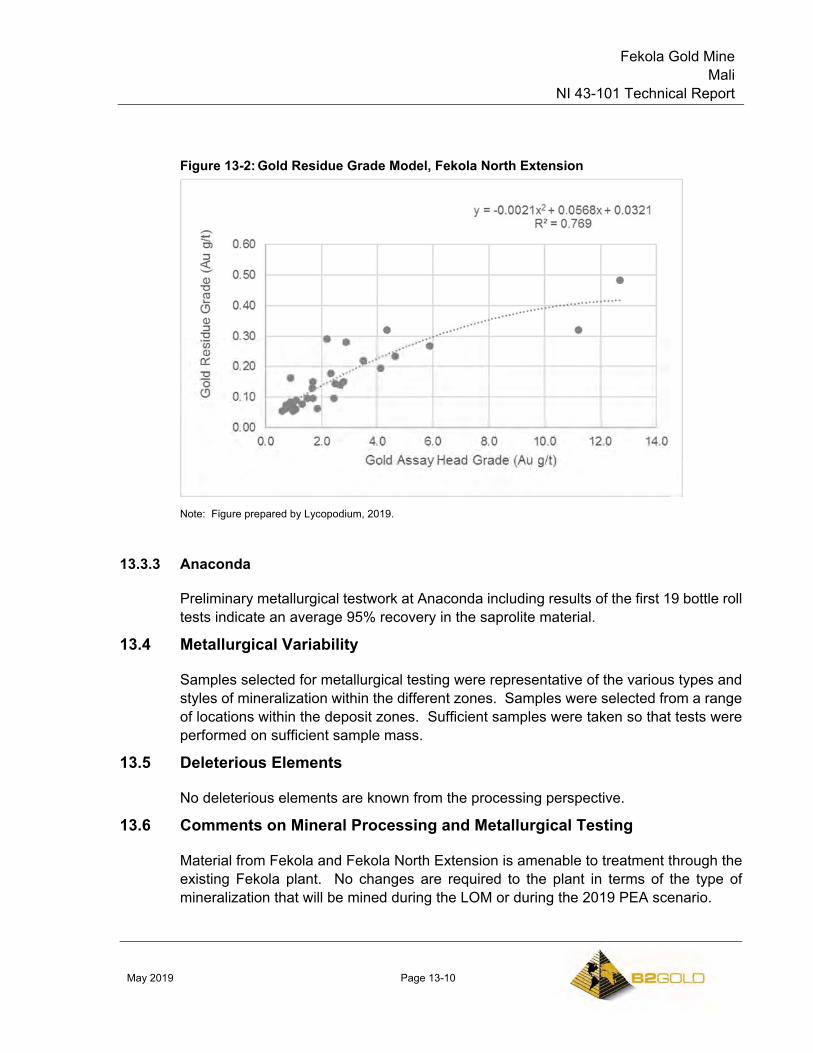
Fekola Gold Mine Mali
NI 43-101 Technical Report
May 2019 Page 13-10
Figure 13-2: Gold Residue Grade Model, Fekola North Extension
Note: Figure prepared by Lycopodium, 2019.
13.3.3 Anaconda
Preliminary metallurgical testwork at Anaconda including results of the first 19 bottle roll tests indicate an average 95% recovery in the saprolite material.
13.4 Metallurgical Variability
Samples selected for metallurgical testing were representative of the various types and styles of mineralization within the different zones. Samples were selected from a range of locations within the deposit zones. Sufficient samples were taken so that tests were performed on sufficient sample mass.
13.5 Deleterious Elements
No deleterious elements are known from the processing perspective.
13.6 Comments on Mineral Processing and Metallurgical Testing
Material from Fekola and Fekola North Extension is amenable to treatment through the existing Fekola plant. No changes are required to the plant in terms of the type of mineralization that will be mined during the LOM or during the 2019 PEA scenario.

Fekola Gold Mine Mali
NI 43-101 Technical Report
May 2019 Page 13-11
The metallurgical recovery forecast for material from Fekola and Fekola North Extension is an average of about 93.6%. No deleterious elements are known from the processing perspective.
Fekola Gold Mine Mali
NI 43-101 Technical Report
May 2019 Page 14-1
14.0 MINERAL RESOURCE ESTIMATES
14.1 Fekola
14.1.1 Introduction
The Mineral Resource model for the Fekola deposit was updated by B2Gold in October 2018 to include new drilling completed since the previous resource model done in August 2016, provide an updated model for the 2019 PEA, and to provide a model of the deposit for future mine production.
Geological and structural logging and assay results from 940 RC, core and RC with core tail drill holes totaling 193,307 m were used as the basis of the three-dimensional (3D) models of regolith, lithology, structure, mineralization zones and gold grade estimates. An additional 60 aircore drill holes (1,099 m) were used in the modeling of the regolith surfaces.
The block model dimensions extend 1,380 x 3,880 x 660 m (east x north x vertical). The model is a Datamine subcell model with reblocking to 5 x 10 x 5 m for Mineral Resource reporting and reblocking to 5 x 20 x 10 m for mine planning and Mineral Reserve reporting.
The drill hole data cut-off for this model was September 30, 2018 with the resource model completed on October 22, 2018. Mineral Resources are reported with an effective date of December 31, 2018.
14.1.2 Exploratory Data Analysis
Statistics were completed on gold assays by logged pyrite content, shearing intensity, alteration mineralogy, lithology, vein types, structure, texture, grain size and sulphide content. The statistical results confirm the field observations that an increase in pyrite content, increase in shearing intensity and alteration are the strongest identified controls on gold mineralization.
14.1.3 Geological Models
Structural, pyrite, mineralization domains and regolith interpretations (as 3D solids or surfaces) were updated for the October 2018 resource model. Lithology was modeled with a focus on the footwall-phyllite contact with banded siltstone–mudstone. Drilling results available at the database cut-off date, re-logging of older drill samples, and additional shear and structural logging were used in the updated models.
The final 3D models are a result of an iterative process of building a preliminary structural model followed by lithological, pyrite intensity and shear zone models. Certain marker lithologies and pyrite zonation supported modification of the structural model. Structural
Fekola Gold Mine Mali
NI 43-101 Technical Report
May 2019 Page 14-2
logging of exploration drill core, along with structural and mineralization zone trends from pit mapping and grade control data were used in the interpretations.
Lithology Model
The main lithological units including banded siltstone-mudstone, mass flow breccia, footwall-phyllite, diorite and marble were interpreted on a series of two-dimensional (2D) sections by the Fekola site exploration geologists. These interpretations, in conjunction with an extensive re-logging program that was focused on the footwall-phyllite/banded siltstone–mudstone contact, were using as the basis of the 3D lithology model.
The footwall-phyllite/banded siltstone–mudstone contact is an important contact with respect to structural and mineralization controls. The contact runs nearly parallel to the main Fekola Fault and Fekola High Strain Zone. Mineralization transitions from high grade to un-mineralized in distances as small as 10 m, when crossing this contact into un-altered footwall-phyllite.
At the deposit scale, grouped lithological units exhibit asymmetric, east-verging folds with local structural thickening of individual units at fold hinges and corresponding attenuation along fold limbs.
Structural Modeling
Starting in 2015, RC and core drill holes were re-logged for intensity of shearing and associated alteration. This work included capturing additional bedding, shearing, and linear orientation data from diamond drill holes. Those measurements were used to build 3D form surfaces in Leapfrog software of both folding and shearing planes. These structural form surfaces suggest overprinting shearing created tighter folding in the Fekola North Extension relative to the more open folds in the main Fekola deposit area and Fekola South.
Pyrite Model
3D models of percent pyrite >3% and >4% were built. The >3% pyrite model closely matches the >0.4 g/t Au mineralized domains.
Mineralization Domains
Mineralization domains at nominal grade thresholds of 0.1 g/t (code=101), 0.4 g/t (104), and 2.0 g/t (120) were modeled as 3D solids. The main controls on the geometry of the mineralization domains were derived from the linear and planar elements of the structural model. Figure 14-1 shows a cross section of the structural model and mineralization zones within the Fekola deposit.
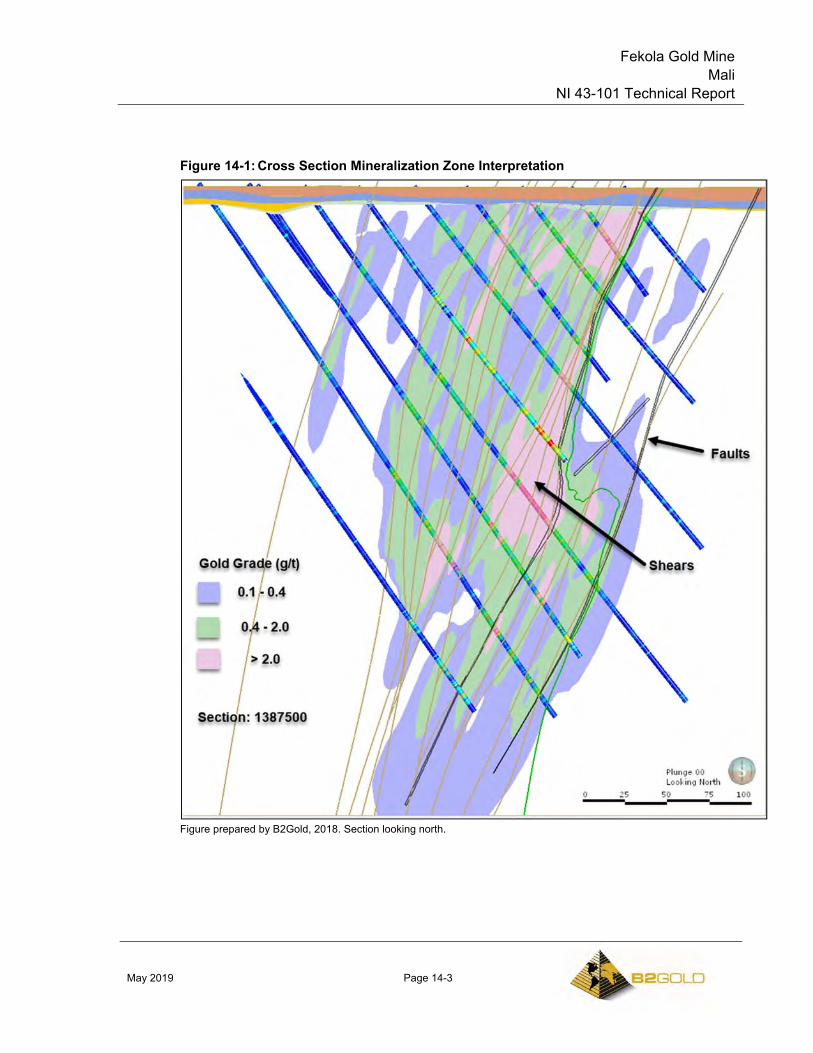
Fekola Gold Mine Mali
NI 43-101 Technical Report
May 2019 Page 14-3
Figure 14-1: Cross Section Mineralization Zone Interpretation
Figure prepared by B2Gold, 2018. Section looking north.
Fekola Gold Mine Mali
NI 43-101 Technical Report
May 2019 Page 14-4
Weathering Domains – Regolith Models
A major campaign of regolith re-logging was completed prior to the October 2018 block model. Surfaces at the base of each of the following were built: overburden (includes laterite), saprolite and saprock. A separate solid wireframe (not surface) for the gravel unit was constructed. The fresh rock model includes all unweathered rock types, and the majority of the mineralization.
14.1.4 Density Assignment
Densities were applied to the block model by mineralization domain for fresh rock and range from 2.74–2.81 t/m3. Higher-grade mineralization domains have slightly higher density. These densities are based on water-immersion density measurements done at the Fekola exploration site.
Densities for overburden, gravels, saprolite and saprock range from 1.6–2.2 t/m3 and are based on a combination of project-wide measurements and reasonable assumptions by material type.
14.1.5 Grade Capping/Outlier Restrictions
Gold grade statistics by mineralization domain show the average grade is higher for the higher-grade domains and the variability for each zone is relatively low. Average gold grades by distance from the mineralization domain contact were plotted on contacts plots. All plots show a 2–3 m transitional increase (or decrease, depending on direction) in grade when moving away from the contact, and do not display a sharp, distinct change in grade.
Capping levels were primarily determined from assay distributions on lognormal probability plots and spatial review of the data. Assays above the capping thresholds are distributed throughout the higher-grade portions of the deposit with no discrete high-grade pods. Assay capping levels are shown in Table 14-1.
Uncapped and capped assay gold grade statistics show that all domains, even before capping, have low variability.
14.1.6 Composites
A down-hole composite length of 2 m was chosen based on the mining method and bench/flitch height. A new composite was started at mineralization domain changes. Composite lengths vary a small amount to avoid small “residual” composites at the end of intervals. Assay grades were capped prior to compositing. Statistics on capped 2 m gold grade composites by mineralization domain show all domains indicate a low level of grade variability.
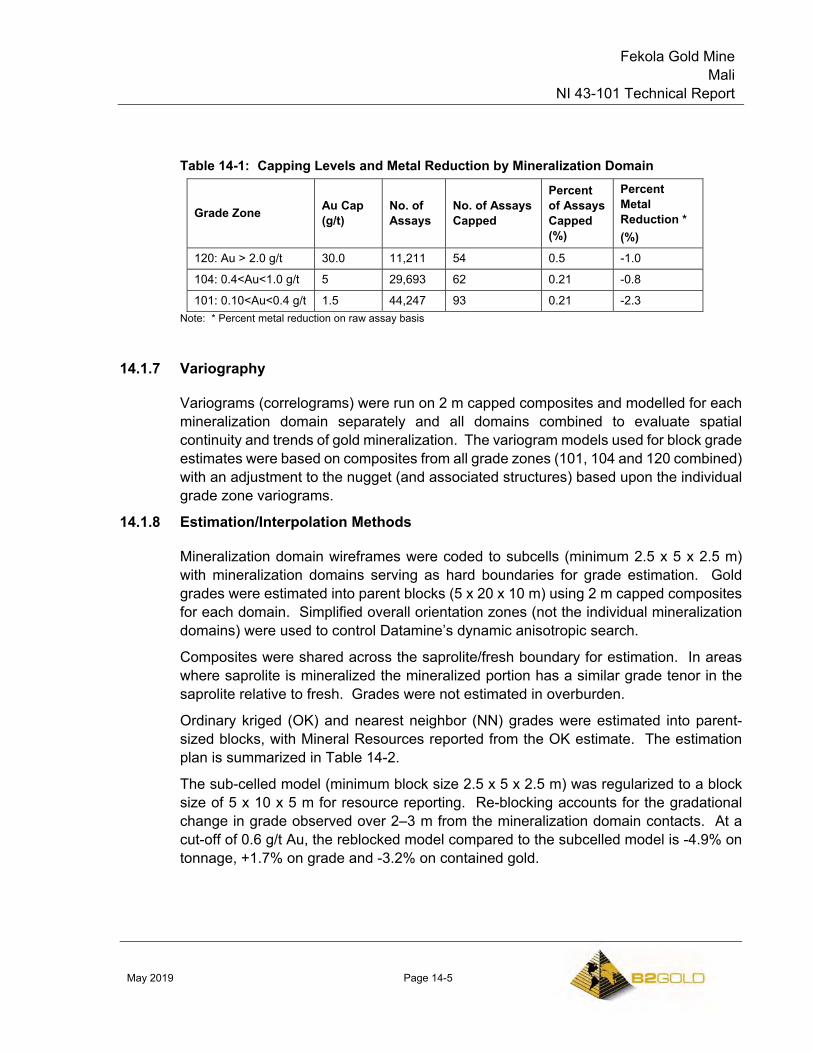
Fekola Gold Mine Mali
NI 43-101 Technical Report
May 2019 Page 14-5
Table 14-1: Capping Levels and Metal Reduction by Mineralization Domain
Grade Zone Au Cap (g/t)
No. of Assays
No. of Assays Capped
Percent of Assays Capped (%)
Percent Metal Reduction * (%)
120: Au > 2.0 g/t 30.0 11,211 54 0.5 -1.0
104: 0.4<Au<1.0 g/t 5 29,693 62 0.21 -0.8
101: 0.10<Au<0.4 g/t 1.5 44,247 93 0.21 -2.3 Note: * Percent metal reduction on raw assay basis
14.1.7 Variography
Variograms (correlograms) were run on 2 m capped composites and modelled for each mineralization domain separately and all domains combined to evaluate spatial continuity and trends of gold mineralization. The variogram models used for block grade estimates were based on composites from all grade zones (101, 104 and 120 combined) with an adjustment to the nugget (and associated structures) based upon the individual grade zone variograms.
14.1.8 Estimation/Interpolation Methods
Mineralization domain wireframes were coded to subcells (minimum 2.5 x 5 x 2.5 m) with mineralization domains serving as hard boundaries for grade estimation. Gold grades were estimated into parent blocks (5 x 20 x 10 m) using 2 m capped composites for each domain. Simplified overall orientation zones (not the individual mineralization domains) were used to control Datamine’s dynamic anisotropic search.
Composites were shared across the saprolite/fresh boundary for estimation. In areas where saprolite is mineralized the mineralized portion has a similar grade tenor in the saprolite relative to fresh. Grades were not estimated in overburden.
Ordinary kriged (OK) and nearest neighbor (NN) grades were estimated into parent-sized blocks, with Mineral Resources reported from the OK estimate. The estimation plan is summarized in Table 14-2.
The sub-celled model (minimum block size 2.5 x 5 x 2.5 m) was regularized to a block size of 5 x 10 x 5 m for resource reporting. Re-blocking accounts for the gradational change in grade observed over 2–3 m from the mineralization domain contacts. At a cut-off of 0.6 g/t Au, the reblocked model compared to the subcelled model is -4.9% on tonnage, +1.7% on grade and -3.2% on contained gold.
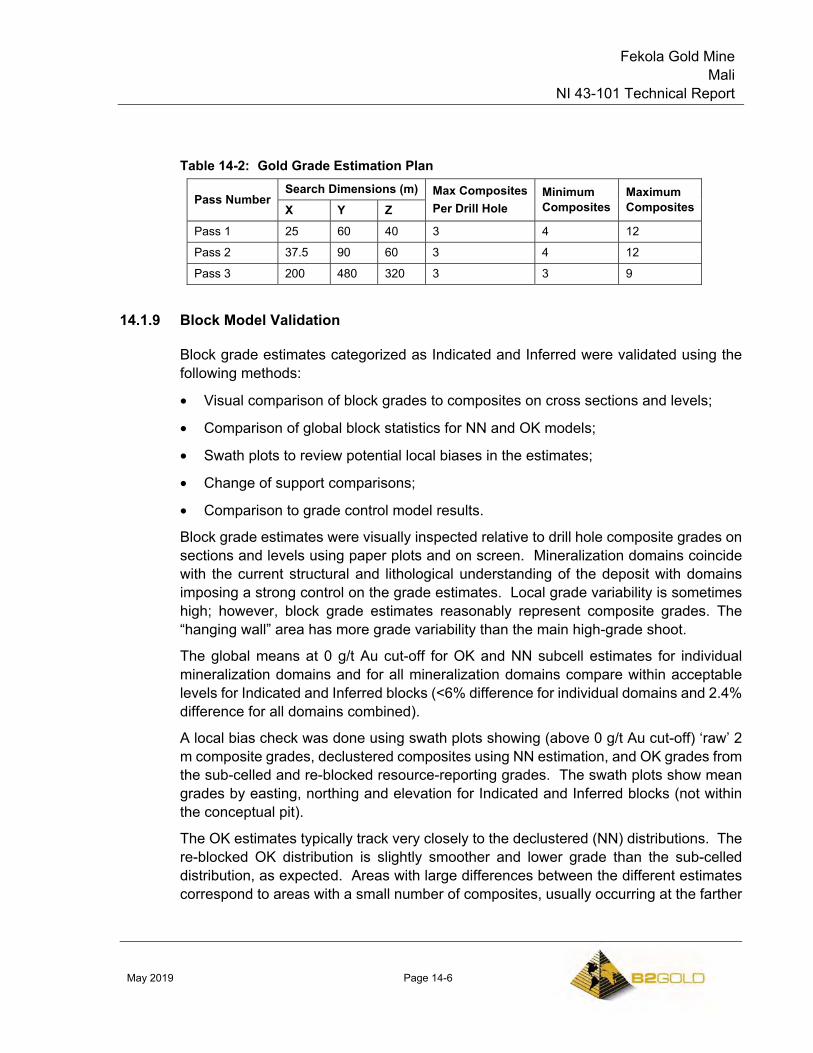
Fekola Gold Mine Mali
NI 43-101 Technical Report
May 2019 Page 14-6
Table 14-2: Gold Grade Estimation Plan
Pass Number Search Dimensions (m) Max Composites
Per Drill Hole Minimum Composites
Maximum Composites X Y Z
Pass 1 25 60 40 3 4 12
Pass 2 37.5 90 60 3 4 12
Pass 3 200 480 320 3 3 9
14.1.9 Block Model Validation
Block grade estimates categorized as Indicated and Inferred were validated using the following methods:
• Visual comparison of block grades to composites on cross sections and levels;
• Comparison of global block statistics for NN and OK models;
• Swath plots to review potential local biases in the estimates;
• Change of support comparisons;
• Comparison to grade control model results.
Block grade estimates were visually inspected relative to drill hole composite grades on sections and levels using paper plots and on screen. Mineralization domains coincide with the current structural and lithological understanding of the deposit with domains imposing a strong control on the grade estimates. Local grade variability is sometimes high; however, block grade estimates reasonably represent composite grades. The “hanging wall” area has more grade variability than the main high-grade shoot.
The global means at 0 g/t Au cut-off for OK and NN subcell estimates for individual mineralization domains and for all mineralization domains compare within acceptable levels for Indicated and Inferred blocks (<6% difference for individual domains and 2.4% difference for all domains combined).
A local bias check was done using swath plots showing (above 0 g/t Au cut-off) ‘raw’ 2 m composite grades, declustered composites using NN estimation, and OK grades from the sub-celled and re-blocked resource-reporting grades. The swath plots show mean grades by easting, northing and elevation for Indicated and Inferred blocks (not within the conceptual pit).
The OK estimates typically track very closely to the declustered (NN) distributions. The re-blocked OK distribution is slightly smoother and lower grade than the sub-celled distribution, as expected. Areas with large differences between the different estimates correspond to areas with a small number of composites, usually occurring at the farther
Fekola Gold Mine Mali
NI 43-101 Technical Report
May 2019 Page 14-7
extents of the deposit where drill density is lower, and blocks are more likely to be in the Inferred category.
The OK estimate (Indicated plus Inferred blocks within the $1400 resource pit) was compared to the change of support (COS) estimate for a selective mining unit (SMU) size of 5 x 10 x 5 m using Hermitian transformation in Supervisor software. For the 120 (Au >2.0 g/t) and 104 (Au 0.4–2.0 g/t) zones, the OK estimates compared to the SMU distributions are within 6% on tonnage, gold grade and contained metal for gold cut-offs between 0.2–0.8 g/t Au. The comparison of OK to SMU estimates for the 101 (0.1–0.4 g/t Au) zones show much larger percent differences than the higher-grade zones but most of this is below the economic cut-off.
Grade control polygon reports provided by the mine, from start of mining in 2017 until September 2018 were compared to the Mineral Reserve block model. Over this period, the October 2018 model was +1% on tonnage, +1.3% on gold grade and +1.8% on contained ounces.
14.1.10 Classification of Mineral Resources
Resource classification was assigned to parent blocks (5 x 20 x 10 m) based on the following:
• Measured: No blocks assigned as Measured;
• Indicated: 50 x 50 m drill spacing;
• Implementation: block with estimated grade using a minimum of two drill holes within 50 m and a minimum of one drill hole within 27.5 m;
• Inferred: 100 x 100 m drill spacing;
• Implementation: block with estimated grade using a minimum of two drill holes within 97.5 m and a minimum of one drill hole within 50 m.
An Indicated boundary wireframe was used to convert isolated Indicated blocks to Inferred to maintain continuity of blocks. This boundary was built linking sectional strings to generate a wireframe surface. Any Indicated blocks below this surface were converted to Inferred.
14.1.11 Reasonable Prospects of Eventual Economic Extraction
Mineral Resources considered potentially amenable to open pit mining methods were constrained within a conceptual Lerchs–Grossmann (L–G) pit shell using the parameters in Table 14-3. Based on these costs and assumptions, the break-even cut-off grade is 0.49 g/t Au. Mineral Resources potentially amenable to open pit mining are stated above a cut-off of 0.6 g/t Au.
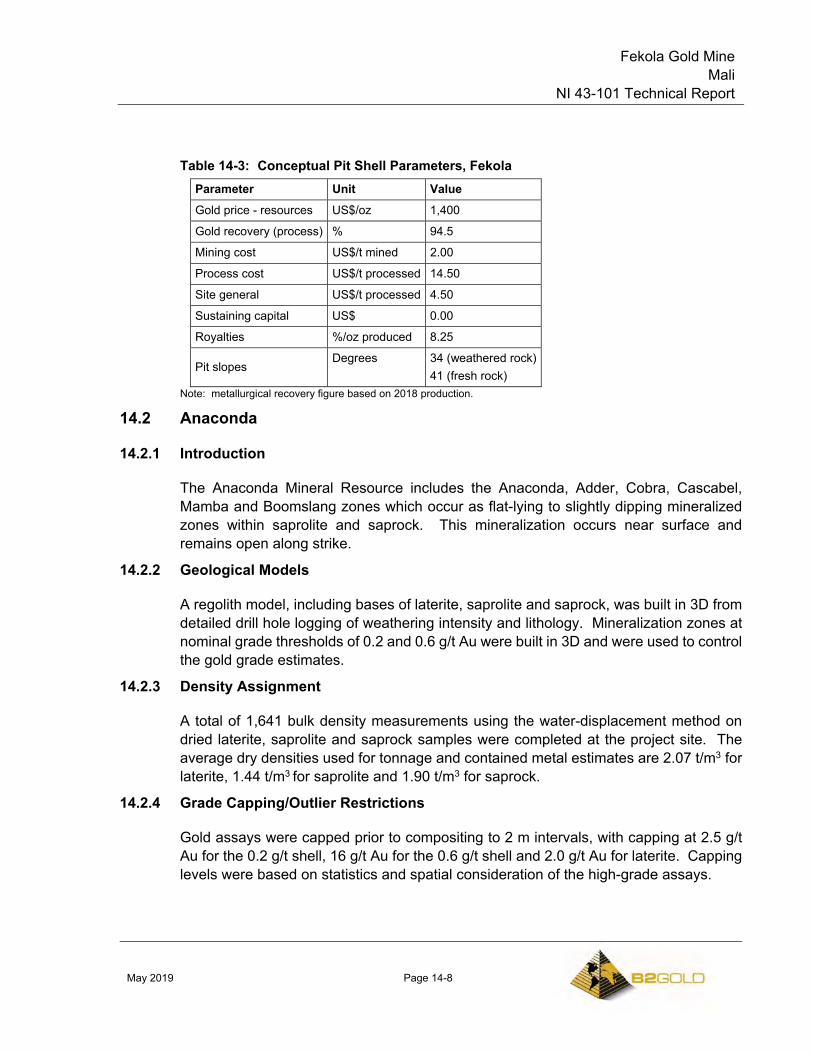
Fekola Gold Mine Mali
NI 43-101 Technical Report
May 2019 Page 14-8
Table 14-3: Conceptual Pit Shell Parameters, Fekola Parameter Unit Value Gold price - resources US$/oz 1,400
Gold recovery (process) % 94.5
Mining cost US$/t mined 2.00
Process cost US$/t processed 14.50
Site general US$/t processed 4.50
Sustaining capital US$ 0.00
Royalties %/oz produced 8.25
Pit slopes Degrees 34 (weathered rock)
41 (fresh rock) Note: metallurgical recovery figure based on 2018 production.
14.2 Anaconda
14.2.1 Introduction
The Anaconda Mineral Resource includes the Anaconda, Adder, Cobra, Cascabel, Mamba and Boomslang zones which occur as flat-lying to slightly dipping mineralized zones within saprolite and saprock. This mineralization occurs near surface and remains open along strike.
14.2.2 Geological Models
A regolith model, including bases of laterite, saprolite and saprock, was built in 3D from detailed drill hole logging of weathering intensity and lithology. Mineralization zones at nominal grade thresholds of 0.2 and 0.6 g/t Au were built in 3D and were used to control the gold grade estimates.
14.2.3 Density Assignment
A total of 1,641 bulk density measurements using the water-displacement method on dried laterite, saprolite and saprock samples were completed at the project site. The average dry densities used for tonnage and contained metal estimates are 2.07 t/m3 for laterite, 1.44 t/m3 for saprolite and 1.90 t/m3 for saprock.
14.2.4 Grade Capping/Outlier Restrictions
Gold assays were capped prior to compositing to 2 m intervals, with capping at 2.5 g/t Au for the 0.2 g/t shell, 16 g/t Au for the 0.6 g/t shell and 2.0 g/t Au for laterite. Capping levels were based on statistics and spatial consideration of the high-grade assays.
Fekola Gold Mine Mali
NI 43-101 Technical Report
May 2019 Page 14-9
14.2.5 Estimation/Interpolation Methods
Regolith (weathering intensity) and mineralization zone wireframes were coded to the block model using a minimum subcell size of 5 x 5 x 1 m.
Gold grades were estimated into parent blocks (20 x 20 x 2 m) with OK using 2 m capped composites. ID2 and NN estimates were run as checks. Mineralization domains were used as hard boundaries for grade estimation. Dynamic anisotropic searching in Datamine was used to control the directions of the search ellipses. Search distances and the general estimation plan are shown on Table 14-4.
14.2.6 Block Model Validation
The block model estimates were checked against input composite data visually on screen and on paper plots. Additional checks completed include swath plots, and comparison of original and declustered composites versus kriged block model results by domain.
14.2.7 Classification of Mineral Resources
No Measured or Indicated Mineral Resources were classified.
Inferred Mineral Resources are supported by a nominal drill hole spacing of 80 m x 80 m; however, 90% of the reported resource has been drilled to a tighter 40 m x 40 m drill spacing.
14.2.8 Reasonable Prospects of Eventual Economic Extraction
Mineral Resources are reported within a conceptual L–G pit shell assuming a gold price of US$1400/oz., gold recovery of 95%, mining cost of US$1.75/t, processing cost of US$8.10/t mill feed, general and administrative (G&A) cost of US$2.75/t mill feed, and 35º pit slope angles.
14.3 Mineral Resource Statement
Indicated Mineral Resources are reported in Table 14-5, inclusive of those Indicated Mineral Resources converted to Probable Mineral Reserves. Mineral Resources that are not Mineral Reserves do not have demonstrated economic viability. Inferred Mineral Resources are provided in Table 14-6.
The Qualified Person for the Mineral Resource estimate is Mr. Tom Garagan, P.Geo, Senior Vice President of Exploration and an employee of B2Gold. The Qualified Person for the stockpiles estimate is Mr. Peter Montano, P.E., Project Director, who is also an employee of B2Gold.
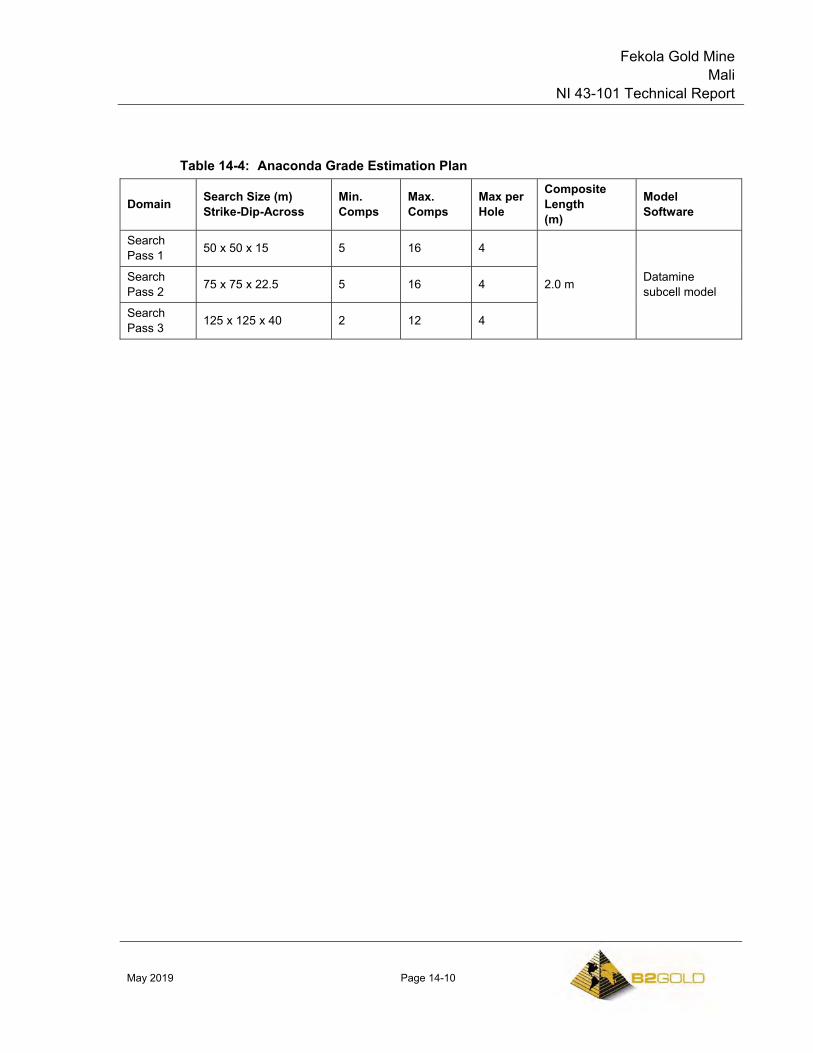
Fekola Gold Mine Mali
NI 43-101 Technical Report
May 2019 Page 14-10
Table 14-4: Anaconda Grade Estimation Plan
Domain Search Size (m) Strike-Dip-Across
Min. Comps
Max. Comps
Max per Hole
Composite Length (m)
Model Software
Search Pass 1 50 x 50 x 15 5 16 4
2.0 m Datamine subcell model
Search Pass 2 75 x 75 x 22.5 5 16 4
Search Pass 3 125 x 125 x 40 2 12 4
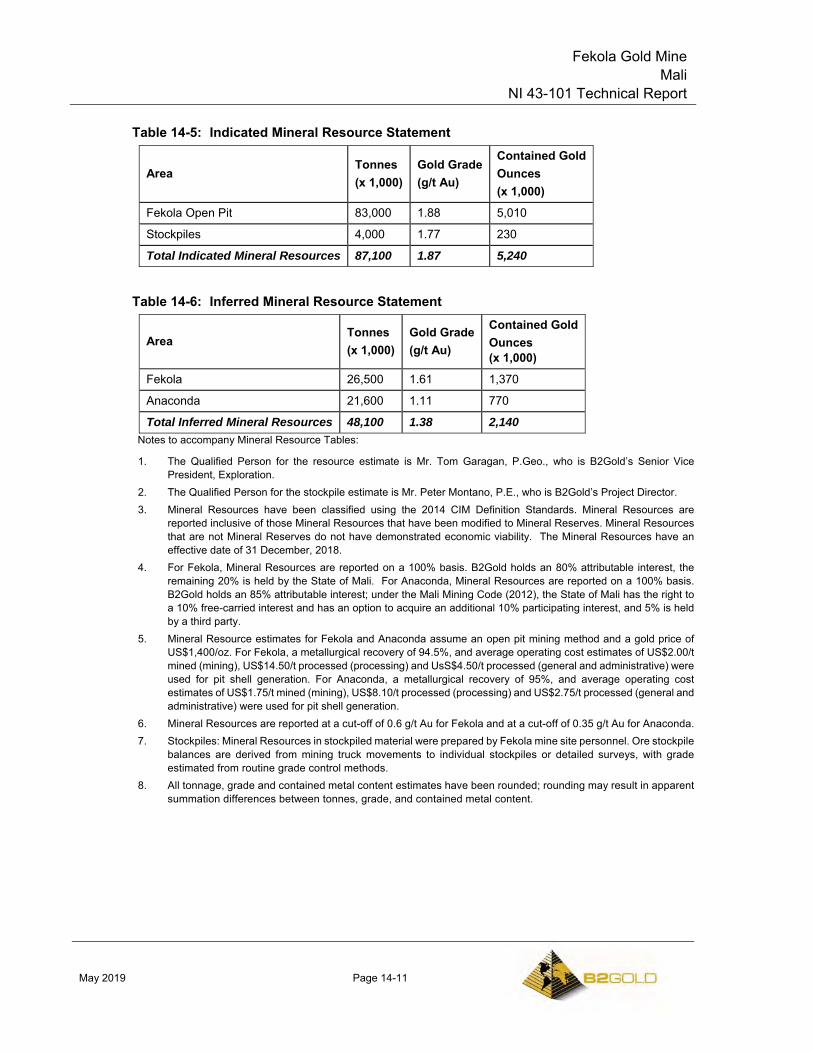
Fekola Gold Mine Mali
NI 43-101 Technical Report
May 2019 Page 14-11
Table 14-5: Indicated Mineral Resource Statement
Area Tonnes (x 1,000)
Gold Grade (g/t Au)
Contained Gold Ounces (x 1,000)
Fekola Open Pit 83,000 1.88 5,010
Stockpiles 4,000 1.77 230
Total Indicated Mineral Resources 87,100 1.87 5,240
Table 14-6: Inferred Mineral Resource Statement
Area Tonnes (x 1,000)
Gold Grade (g/t Au)
Contained Gold Ounces (x 1,000)
Fekola 26,500 1.61 1,370
Anaconda 21,600 1.11 770
Total Inferred Mineral Resources 48,100 1.38 2,140 Notes to accompany Mineral Resource Tables:
1. The Qualified Person for the resource estimate is Mr. Tom Garagan, P.Geo., who is B2Gold’s Senior Vice President, Exploration.
2. The Qualified Person for the stockpile estimate is Mr. Peter Montano, P.E., who is B2Gold’s Project Director. 3. Mineral Resources have been classified using the 2014 CIM Definition Standards. Mineral Resources are
reported inclusive of those Mineral Resources that have been modified to Mineral Reserves. Mineral Resources that are not Mineral Reserves do not have demonstrated economic viability. The Mineral Resources have an effective date of 31 December, 2018.
4. For Fekola, Mineral Resources are reported on a 100% basis. B2Gold holds an 80% attributable interest, the remaining 20% is held by the State of Mali. For Anaconda, Mineral Resources are reported on a 100% basis. B2Gold holds an 85% attributable interest; under the Mali Mining Code (2012), the State of Mali has the right to a 10% free-carried interest and has an option to acquire an additional 10% participating interest, and 5% is held by a third party.
5. Mineral Resource estimates for Fekola and Anaconda assume an open pit mining method and a gold price of US$1,400/oz. For Fekola, a metallurgical recovery of 94.5%, and average operating cost estimates of US$2.00/t mined (mining), US$14.50/t processed (processing) and UsS$4.50/t processed (general and administrative) were used for pit shell generation. For Anaconda, a metallurgical recovery of 95%, and average operating cost estimates of US$1.75/t mined (mining), US$8.10/t processed (processing) and US$2.75/t processed (general and administrative) were used for pit shell generation.
6. Mineral Resources are reported at a cut-off of 0.6 g/t Au for Fekola and at a cut-off of 0.35 g/t Au for Anaconda. 7. Stockpiles: Mineral Resources in stockpiled material were prepared by Fekola mine site personnel. Ore stockpile
balances are derived from mining truck movements to individual stockpiles or detailed surveys, with grade estimated from routine grade control methods.
8. All tonnage, grade and contained metal content estimates have been rounded; rounding may result in apparent summation differences between tonnes, grade, and contained metal content.
Fekola Gold Mine Mali
NI 43-101 Technical Report
May 2019 Page 14-12
14.4 Factors That May Affect the Mineral Resource Estimate
Factors that may affect the Mineral Resource estimates include:
• Metal price and exchange rate assumptions;
• Changes to the assumptions used to generate the gold grade cut-off grade;
• Changes in local interpretations of mineralization geometry and continuity of mineralized zones;
• Changes to geological and mineralization shape and geological and grade continuity assumptions;
• Density and domain assignments;
• Changes to geotechnical, mining and metallurgical recovery assumptions;
• Change to the input and design parameter assumptions that pertain to the conceptual pit constraining the estimates;
• Assumptions as to the continued ability to access the site, retain mineral and surface rights titles, maintain environment and other regulatory permits, and maintain the social license to operate.
There are no other known environmental, legal, title, taxation, socioeconomic, marketing, political or other relevant factors that would materially affect the estimation of Mineral Resources that are not discussed in this Report.
14.5 Comments on Mineral Resources
Mineral Resources are reported in accordance with the 2014 CIM Definition Standards.
There is upside potential for the estimates if mineralization that is currently classified as Inferred can be upgraded to higher-confidence Mineral Resource categories.
Fekola Gold Mine Mali
NI 43-101 Technical Report
May 2019 Page 15-1
15.0 MINERAL RESERVE ESTIMATES
15.1 Introduction
Mineral Reserves have been converted from Indicated Mineral Resources. Inferred Mineral Resources were set to waste. The mine plan assumes open pit mining using conventional mining methods and equipment.
15.2 Mineral Reserves Statement
The Mineral Reserve estimate for the Project reported within the ultimate pit design is presented in Table 15-1. The Qualified Person for the estimate is Mr. Peter Montano, P.E., Project Director, who is also an employee of B2Gold. The estimate has an effective date of 31 December, 2018.
15.3 Factors that May Affect the Mineral Reserves
Factors that may affect the Mineral Reserve estimates include:
• Changes to the gold price assumptions;
• Changes to pit slope and geotechnical assumptions;
• Unforeseen dilution;
• Changes to hydrogeological and pit dewatering assumptions;
• Changes to inputs to capital and operating cost estimates;
• Changes to operating cost assumptions used in the constraining pit shell;
• Changes to pit designs from those currently envisaged;
• Stockpiling assumptions as to the amount and grade of stockpile material required to maintain operations during the wet season;
• Assumptions used when evaluating the potential economics of Phase 7 of the Fekola pit;
• Changes to modifying factor assumptions, including environmental, permitting and social licence to operate.
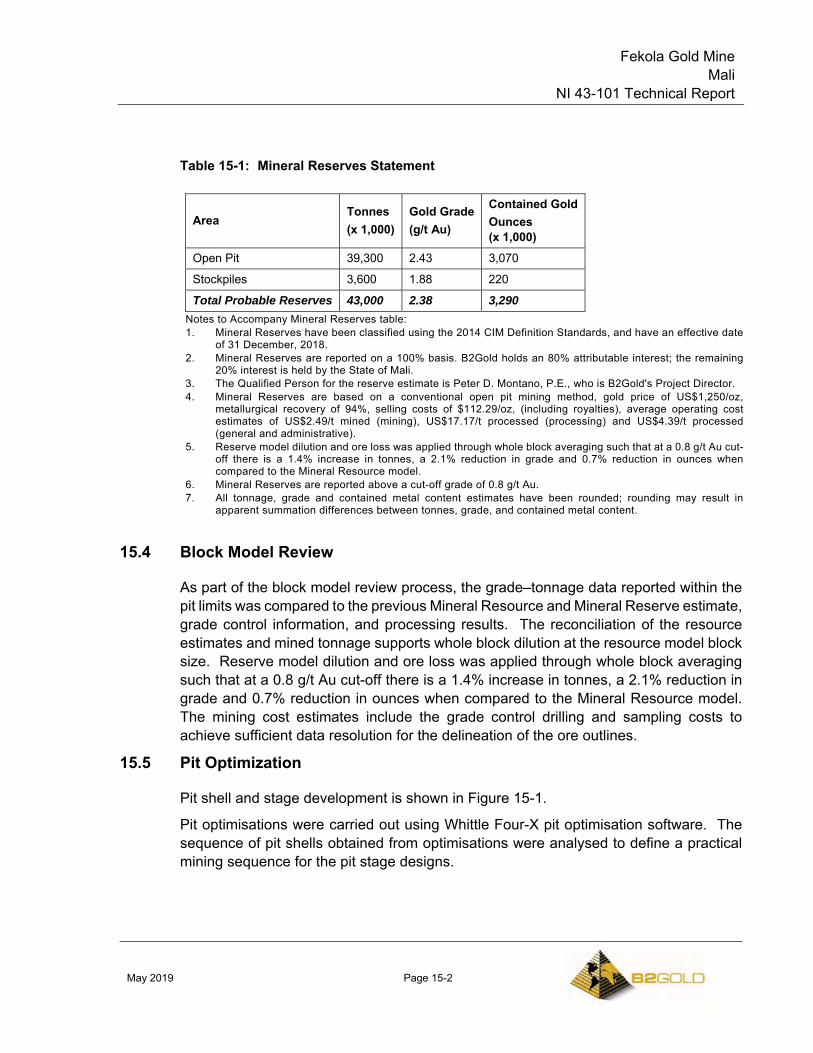
Fekola Gold Mine Mali
NI 43-101 Technical Report
May 2019 Page 15-2
Table 15-1: Mineral Reserves Statement
Area Tonnes (x 1,000)
Gold Grade (g/t Au)
Contained Gold Ounces (x 1,000)
Open Pit 39,300 2.43 3,070
Stockpiles 3,600 1.88 220
Total Probable Reserves 43,000 2.38 3,290 Notes to Accompany Mineral Reserves table: 1. Mineral Reserves have been classified using the 2014 CIM Definition Standards, and have an effective date
of 31 December, 2018. 2. Mineral Reserves are reported on a 100% basis. B2Gold holds an 80% attributable interest; the remaining
20% interest is held by the State of Mali. 3. The Qualified Person for the reserve estimate is Peter D. Montano, P.E., who is B2Gold's Project Director. 4. Mineral Reserves are based on a conventional open pit mining method, gold price of US$1,250/oz,
metallurgical recovery of 94%, selling costs of $112.29/oz, (including royalties), average operating cost estimates of US$2.49/t mined (mining), US$17.17/t processed (processing) and US$4.39/t processed (general and administrative).
5. Reserve model dilution and ore loss was applied through whole block averaging such that at a 0.8 g/t Au cut-off there is a 1.4% increase in tonnes, a 2.1% reduction in grade and 0.7% reduction in ounces when compared to the Mineral Resource model.
6. Mineral Reserves are reported above a cut-off grade of 0.8 g/t Au. 7. All tonnage, grade and contained metal content estimates have been rounded; rounding may result in
apparent summation differences between tonnes, grade, and contained metal content.
15.4 Block Model Review
As part of the block model review process, the grade–tonnage data reported within the pit limits was compared to the previous Mineral Resource and Mineral Reserve estimate, grade control information, and processing results. The reconciliation of the resource estimates and mined tonnage supports whole block dilution at the resource model block size. Reserve model dilution and ore loss was applied through whole block averaging such that at a 0.8 g/t Au cut-off there is a 1.4% increase in tonnes, a 2.1% reduction in grade and 0.7% reduction in ounces when compared to the Mineral Resource model. The mining cost estimates include the grade control drilling and sampling costs to achieve sufficient data resolution for the delineation of the ore outlines.
15.5 Pit Optimization
Pit shell and stage development is shown in Figure 15-1.
Pit optimisations were carried out using Whittle Four-X pit optimisation software. The sequence of pit shells obtained from optimisations were analysed to define a practical mining sequence for the pit stage designs.
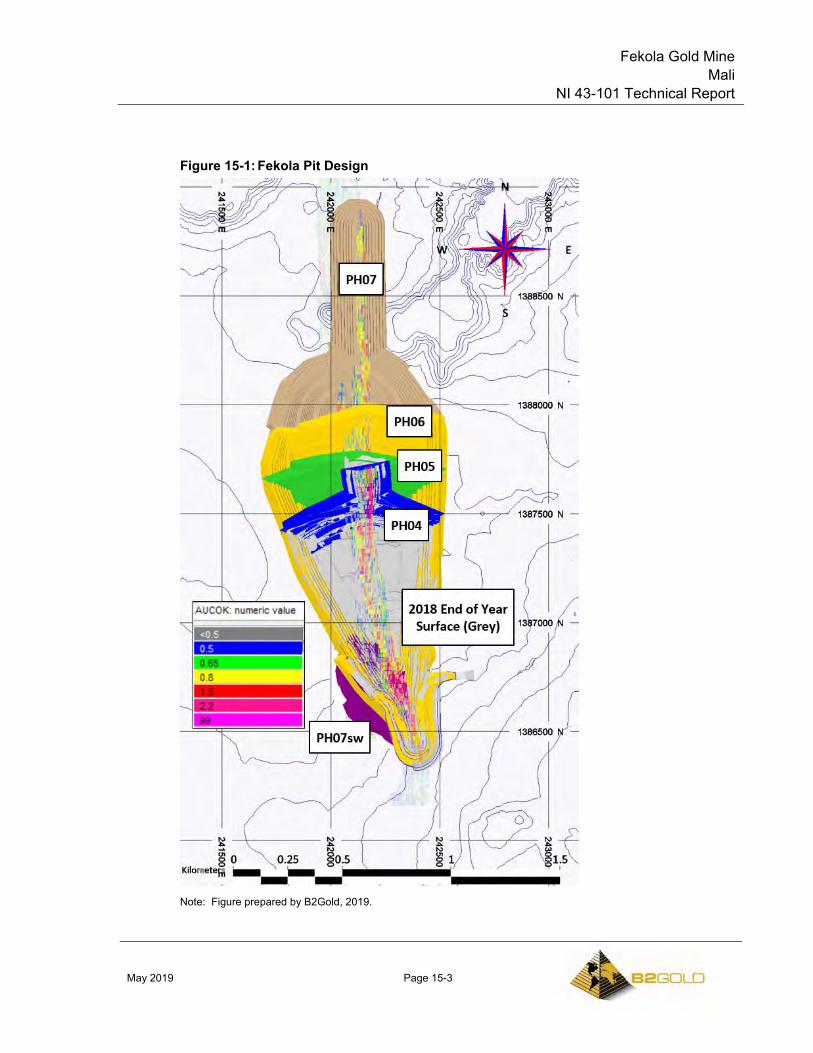
Fekola Gold Mine Mali
NI 43-101 Technical Report
May 2019 Page 15-3
Figure 15-1: Fekola Pit Design
Note: Figure prepared by B2Gold, 2019.
Fekola Gold Mine Mali
NI 43-101 Technical Report
May 2019 Page 15-4
For the given block model, cost, recovery and slope data, Whittle Four-X software determines a series of incremental pit shells, in which each shell is an optimum for a slightly higher price factor.
In the analysis of the incremental pit shells, indicative net present values (NPV) are calculated by discounting the preliminary cash flows over time. The reported NPVs in pit optimisation results are indicative operating values for relative comparison purposes only.
As well as the indicative NPVs, the incremental operating cost per ounce for the pit shells is also reported to guide the pit shell selection and design process.
In addition to the base case pit optimisation to determine the ultimate pit limits, further optimisations were carried out to determine the sensitivities around the base case results.
Parameters used in optimization are summarized in Table 15-2.
15.5.1 Base Mining Cost Estimate
The mining cost estimates were derived from the 2019 budget, 2018 life-of-mine (LOM) plan (LOMP), and feasibility mining equipment productivity and cost estimates. The estimates were compared to cost data for similar projects. The equipment ownership costs were included in the estimates for pit optimisation purposes, considering the relatively long mine life compared to the life cycle of the equipment.
The average cost of mining is estimated at $2.49/t mined which includes $ 1.82/t in operating costs, $0.25/t of site general costs and $0.42/t of sustaining capital which includes equipment replacement and rebuild costs. An incremental haulage cost of US$ 0.03/t per 10 m bench was applied to account for additional haulage costs as the pits deepen and lower haulage costs during the initial benches of each phase.
15.5.2 Processing Costs
The 2018 LOMP was based on a 5.5 Mt/a processing rate, which was revised to 6.0 Mt/a for the 2019 budget. Processing costs were conservatively estimated by using the average of the life of mine and budget costs.
15.5.3 Gold Price, Royalty and Discounting
A gold price of US$1,250/oz Au was used in the pit optimisations and the calculation of the break-even cut-off grade for Mineral Reserves reporting.
Taxes and royalties include a 3% net revenue tax, 3% gross gold revenue special tax, 0.6% product value stamp duty, and 1.65% net revenue royalty totaling $112.29/oz Au. The operating cash flows were discounted at 5% per annum to calculate the indicative NPV values for the comparison of optimal pit shells and production schedule options.
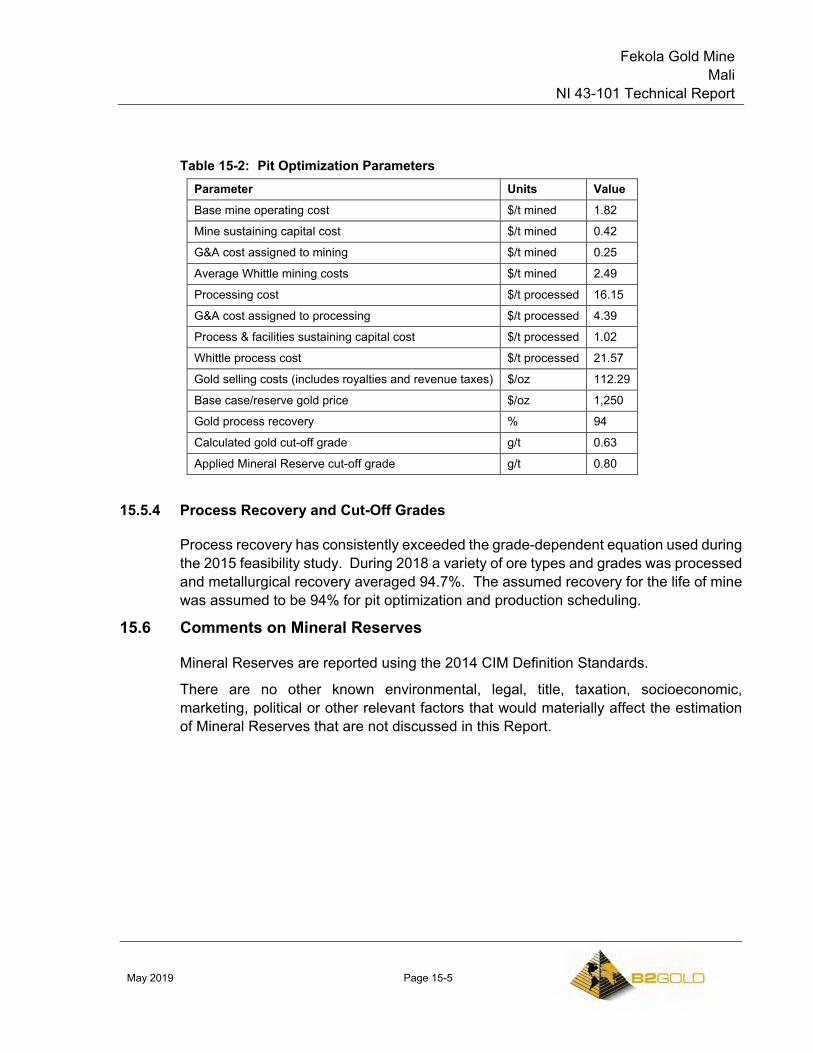
Fekola Gold Mine Mali
NI 43-101 Technical Report
May 2019 Page 15-5
Table 15-2: Pit Optimization Parameters Parameter Units Value Base mine operating cost $/t mined 1.82
Mine sustaining capital cost $/t mined 0.42
G&A cost assigned to mining $/t mined 0.25
Average Whittle mining costs $/t mined 2.49
Processing cost $/t processed 16.15
G&A cost assigned to processing $/t processed 4.39
Process & facilities sustaining capital cost $/t processed 1.02
Whittle process cost $/t processed 21.57
Gold selling costs (includes royalties and revenue taxes) $/oz 112.29
Base case/reserve gold price $/oz 1,250
Gold process recovery % 94
Calculated gold cut-off grade g/t 0.63
Applied Mineral Reserve cut-off grade g/t 0.80
15.5.4 Process Recovery and Cut-Off Grades
Process recovery has consistently exceeded the grade-dependent equation used during the 2015 feasibility study. During 2018 a variety of ore types and grades was processed and metallurgical recovery averaged 94.7%. The assumed recovery for the life of mine was assumed to be 94% for pit optimization and production scheduling.
15.6 Comments on Mineral Reserves
Mineral Reserves are reported using the 2014 CIM Definition Standards.
There are no other known environmental, legal, title, taxation, socioeconomic, marketing, political or other relevant factors that would materially affect the estimation of Mineral Reserves that are not discussed in this Report.
Fekola Gold Mine Mali
NI 43-101 Technical Report
May 2019 Page 16-1
16.0 MINING METHODS
16.1 Overview
The mining method for the Fekola deposit is via conventional open pit mining with the operations strategy based on Owner-operator mining equipment and labour.
The base case mine production schedule involves the movement of a total 35 Mt/a of ore and waste to sustain processing of 5.5 Mt/a of high-grade ore while stockpiling as much as 7 Mt of low-grade mineralization (below the 0.8 g/t Au Mineral Reserve cut-off but above the 0.6 g/t Au Mineral Resource cut-off) and 8.4 Mt of currently sub-economic mineralization.
The mine design is based on cutback widths of 200–250 m, minimum mining width of 25 m, nominal road and ramp widths of 27 m and a ramp gradient of up to 10%.
Waste storage facility design is based on 10 m vertical lifts with 18º faces and 5 m berms, with facility location considerations based on minimising haulage, surface water drainage and area availability.
The total mine life is eight years for the development of a 320 m deep ultimate pit in seven stages to support 10 years of processing (including 2019).
16.2 Geotechnical Considerations
The geotechnical appraisal and pit slope recommendations for the study were provided by George, Orr and Associates (GOA). More detailed geotechnical studies are in progress, with results expected by the end of 2019.
Ground conditions in the Fekola staged pits were interpreted from evaluations made on geotechnical drill hole cores (including use of an optical and acoustic imaging televiewer device), unconfined compressive strength (UCS) tests carried out on representative core samples, and local structural geological conditions.
Future wall stability is expected to be governed principally by the presence, attitude, and shear strength parameters of the geological structures occurring within the walls. Limited analyses have been performed to assess the stability against large scale wall collapses (rotational wall failures).
Zones of highly fractured rock (termed "broken core zones") occur in the hanging wall and footwall of the Fekola Fault. Northeasterly striking faults are also inferred to occur at the deposit. Bedrock is covered by an approximately 10–15 m thick layer of transported (pebbly) alluvium.
2D stability analysis results imply that the future wall stability against potential rotational collapses affecting the integrity of the whole slope will remain adequate for mining
Fekola Gold Mine Mali
NI 43-101 Technical Report
May 2019 Page 16-2
purposes. This is provided that slopes are not mined at steeper overall angles than recommended and the effective wall depressurisation (i.e. dewatering, particularly in the east wall of the Stage 5 Pit) is carried out.
The pit wall slope design domains around the pit perimeter and the associated overall slope angles are shown in Figure 16-1.
The overall slope angles vary from 40–45° around the pit rim, depending on mainly the extent and location of the broken core zones. The effect of access ramps on the pit walls were allowed in the definition of the overall slope angles.
The definition of the pit slope domains and the recommended slope design parameters used in the pit optimisations and designs are detailed in Table 16-1. The slope design may vary slightly at the lower levels of the pit design to maximise the ore recovery where the access ramps can act as berms.
16.3 Hydrogeological Considerations
Hydrogeological investigation results including ground water modelling and pit dewatering estimates were provided by Knight Piésold Consulting (Knight Piésold) in September 2014.
Results of hydrogeological investigations indicated that the pre-mining groundwater table was located at depths of between 2–5 m around the pit perimeter.
The current operations have encountered minor to moderate seasonal inflows from pit walls at the base of the colluvial and lateritized zone and significant inflows at the base of pit starting at roughly the zero elevation.
The pit floor responds well to dewatering using 600 kW pumps in pit floor sumps, with mining in moist conditions. Further geotechnical and hydrogeological investigation is planned in 2019–2020.
16.4 Open Pit Design
A staged pit development strategy was the key in the production schedules to defer the waste mining requirements and bring forward the mining of high-grade ore. The 320 m deep ultimate pit is planned for development in a sequence of seven phases. The ultimate pit is shown in Figure 16-2. Phases 1 to 3 are mined-out, and phase 4 was partially mined out as of 31 December 2018.
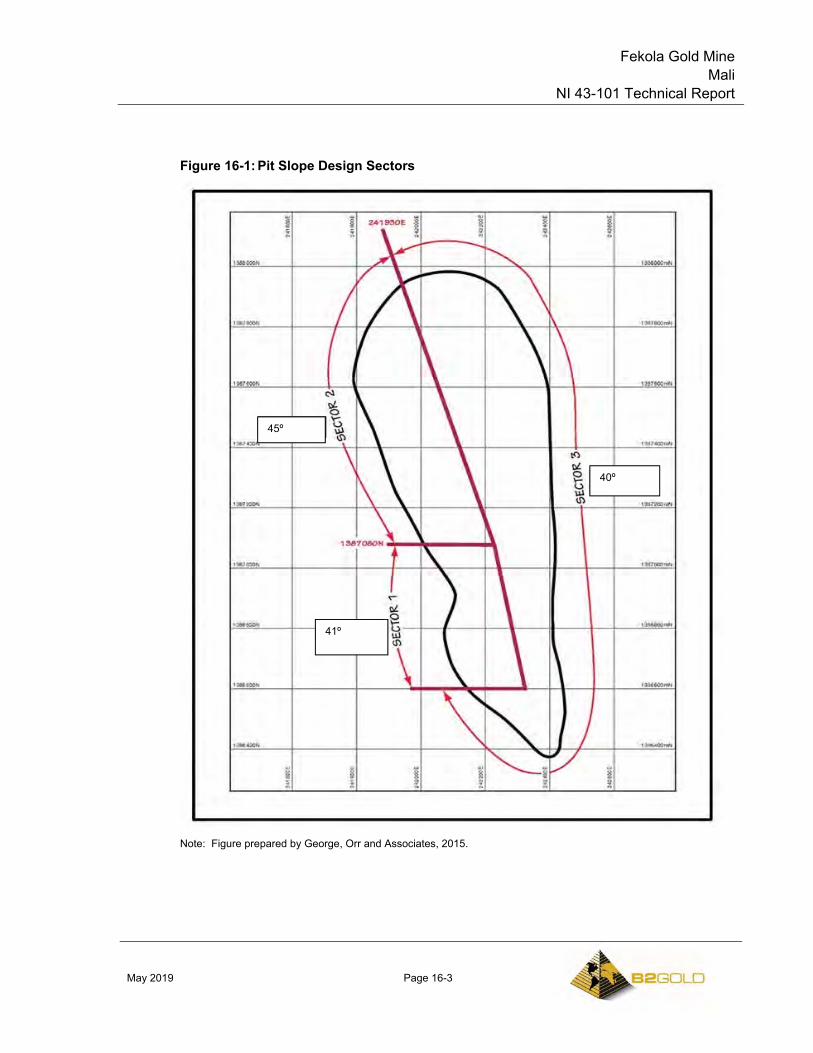
Fekola Gold Mine Mali
NI 43-101 Technical Report
May 2019 Page 16-3
Figure 16-1: Pit Slope Design Sectors
Note: Figure prepared by George, Orr and Associates, 2015.
45º
40º
41º
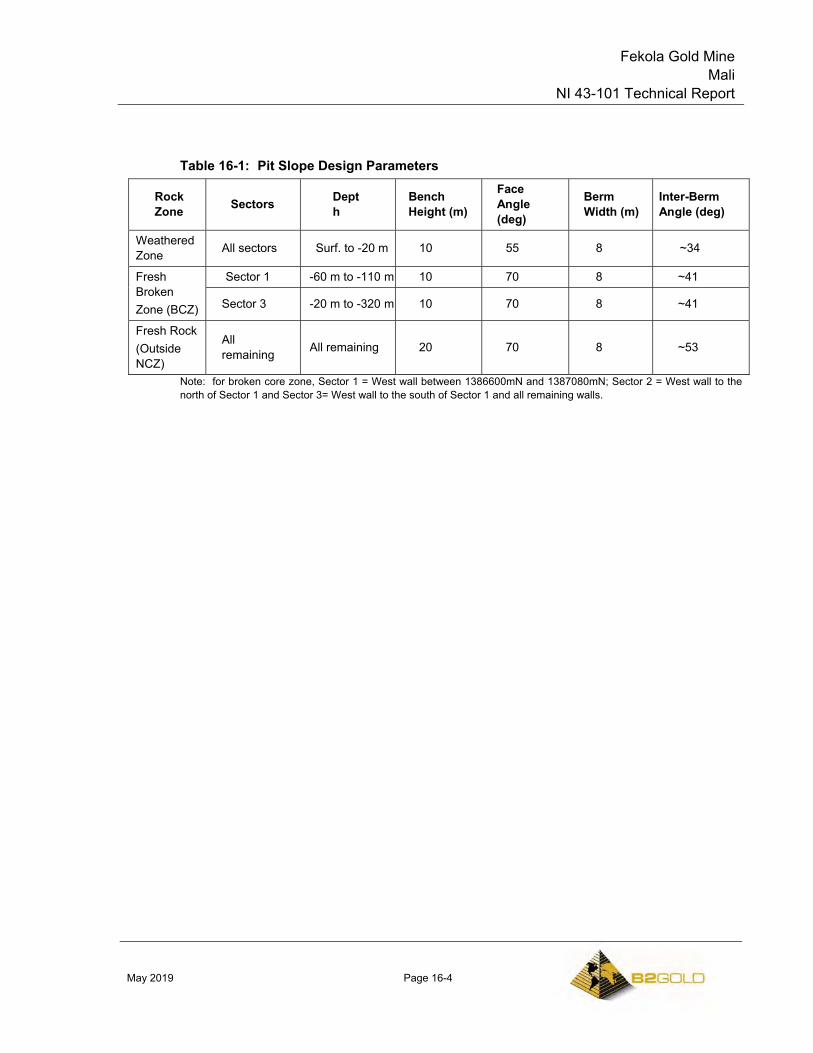
Fekola Gold Mine Mali
NI 43-101 Technical Report
May 2019 Page 16-4
Table 16-1: Pit Slope Design Parameters
Rock Zone Sectors Dept
h Bench Height (m)
Face Angle (deg)
Berm Width (m)
Inter-Berm Angle (deg)
Weathered Zone All sectors Surf. to -20 m 10 55 8 ~34
Fresh Broken Zone (BCZ)
Sector 1 -60 m to -110 m 10 70 8 ~41
Sector 3 -20 m to -320 m 10 70 8 ~41
Fresh Rock (Outside NCZ)
All remaining All remaining 20 70 8 ~53
Note: for broken core zone, Sector 1 = West wall between 1386600mN and 1387080mN; Sector 2 = West wall to the north of Sector 1 and Sector 3= West wall to the south of Sector 1 and all remaining walls.
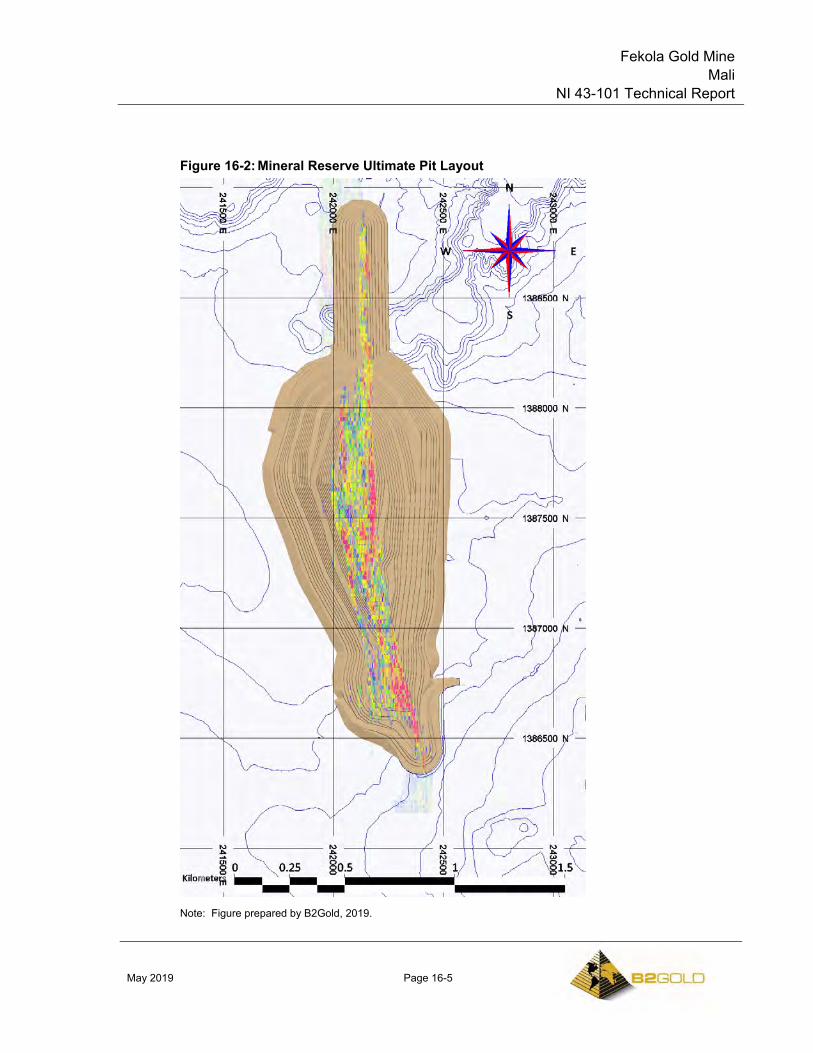
Fekola Gold Mine Mali
NI 43-101 Technical Report
May 2019 Page 16-5
Figure 16-2: Mineral Reserve Ultimate Pit Layout
Note: Figure prepared by B2Gold, 2019.
Fekola Gold Mine Mali
NI 43-101 Technical Report
May 2019 Page 16-6
The staged pit development will also mitigate the geological, geotechnical and economic risks for the operation, considering the 2.6 km length of the proposed Fekola open pit. The design of the future pit stages during the operations, especially the last two stages, can be adjusted progressively depending on the operational experience, exposed ground conditions and changes in economic conditions. The projected LOM average strip ratio is 4.2.
The cutbacks need to be accessed through temporary ramps in the initial stage of development from the surface. These temporary ramps may be mined after acting as catch (safety) berms between the successive cutbacks mined at different levels. The remaining ramps on the final pit walls will act as geotechnical berms (i.e. wider berms to limit the inter-ramp slope angle) to form a “stacked” slope design.
A minimum mining width of 25 m (dual lane ramp width) was adopted for the floor of the ultimate pit design. The temporary floors of the pit stages were designed wider (~40 m) not to constrain the mining equipment unnecessarily as these floors would be mined in the subsequent pit stage.
16.5 Road and Ramp Design Criteria
A nominal ramp and road width of 27 m, including drainage and safety windrow, was used for dual lane truck operation in the mine design. Ramp widths were reduced to 15 m in mining the lower levels of the Stage 6 and 7 cutbacks developing the final pit walls. A ramp gradient of up to 10% was used in the mine design for both single and dual lane ramps.
16.6 Waste Storage Facility Design Criteria
An overall slope angle of 18° was used in the design of the waste storage facility faces with the 5 m berms located at 10 m vertical intervals.
The temporary ramp exits from the pit stages were designed to distribute the waste across the waste storage facility areas and the TSF embankment. The size and height of the two waste storage facilities at the southwest and northeast were adjusted to minimise the haulage costs and leave the mineralization corridor open to the south for potential development of shallow pits (or sterilization) in the future.
16.7 Operational Cut-off Grades
The 0.8 g/t Au mill feed and Mineral Reserve cut-off grade was determined as optimal based mining production capacity and processing throughput. The cut-off grades used to classify the ore types in the open pit mining and production schedules are as follows:
• The break-even cut-off grade is 0.8 g/t Au as used to classify the Mineral Reserves;
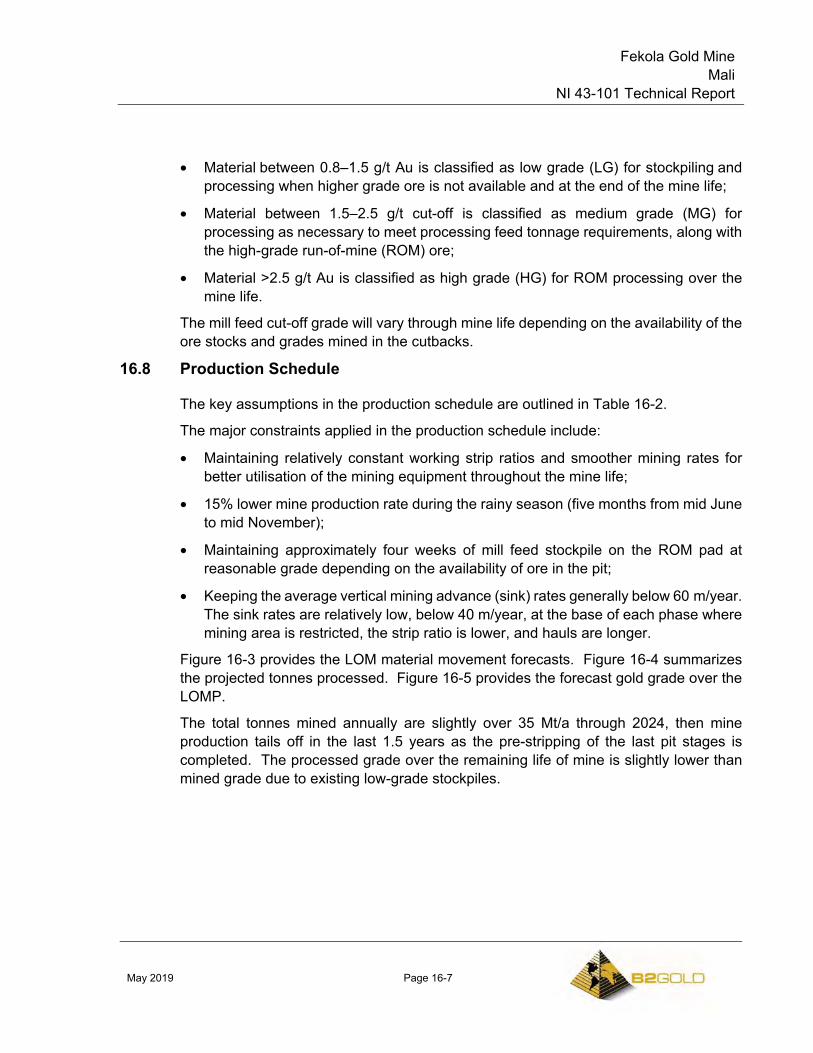
Fekola Gold Mine Mali
NI 43-101 Technical Report
May 2019 Page 16-7
• Material between 0.8–1.5 g/t Au is classified as low grade (LG) for stockpiling and processing when higher grade ore is not available and at the end of the mine life;
• Material between 1.5–2.5 g/t cut-off is classified as medium grade (MG) for processing as necessary to meet processing feed tonnage requirements, along with the high-grade run-of-mine (ROM) ore;
• Material >2.5 g/t Au is classified as high grade (HG) for ROM processing over the mine life.
The mill feed cut-off grade will vary through mine life depending on the availability of the ore stocks and grades mined in the cutbacks.
16.8 Production Schedule
The key assumptions in the production schedule are outlined in Table 16-2.
The major constraints applied in the production schedule include:
• Maintaining relatively constant working strip ratios and smoother mining rates for better utilisation of the mining equipment throughout the mine life;
• 15% lower mine production rate during the rainy season (five months from mid June to mid November);
• Maintaining approximately four weeks of mill feed stockpile on the ROM pad at reasonable grade depending on the availability of ore in the pit;
• Keeping the average vertical mining advance (sink) rates generally below 60 m/year. The sink rates are relatively low, below 40 m/year, at the base of each phase where mining area is restricted, the strip ratio is lower, and hauls are longer.
Figure 16-3 provides the LOM material movement forecasts. Figure 16-4 summarizes the projected tonnes processed. Figure 16-5 provides the forecast gold grade over the LOMP.
The total tonnes mined annually are slightly over 35 Mt/a through 2024, then mine production tails off in the last 1.5 years as the pre-stripping of the last pit stages is completed. The processed grade over the remaining life of mine is slightly lower than mined grade due to existing low-grade stockpiles.
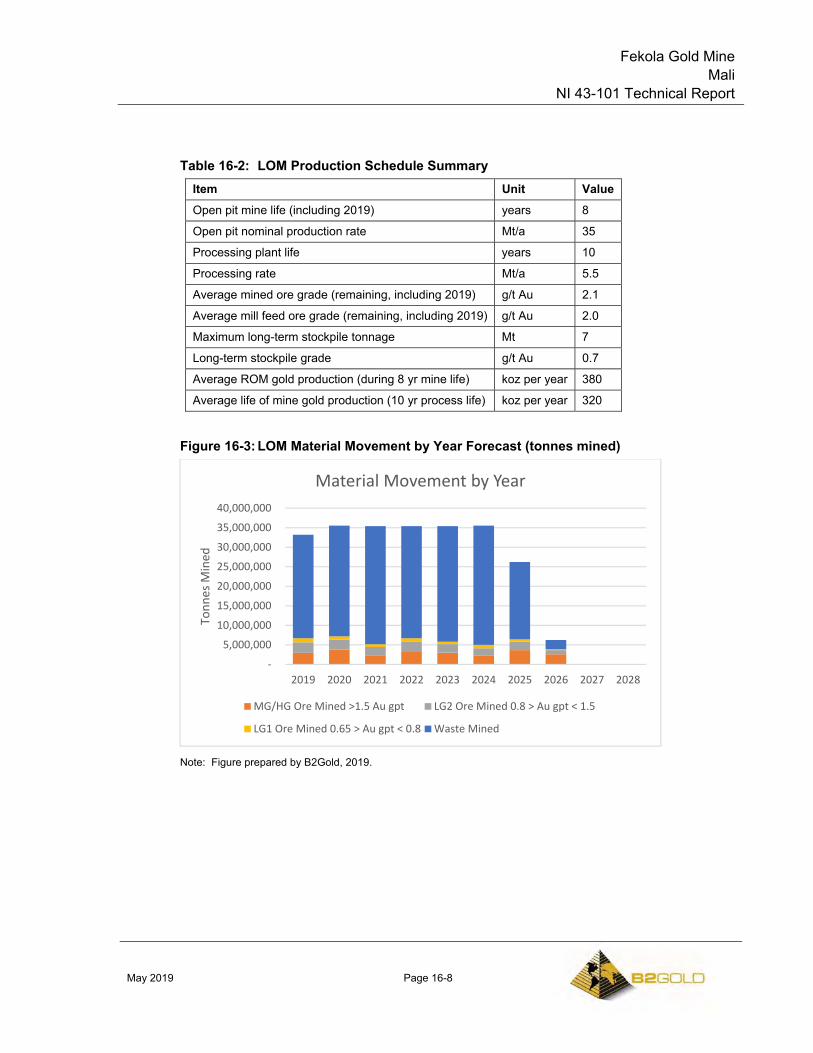
Fekola Gold Mine Mali
NI 43-101 Technical Report
May 2019 Page 16-8
Table 16-2: LOM Production Schedule Summary Item Unit Value Open pit mine life (including 2019) years 8
Open pit nominal production rate Mt/a 35
Processing plant life years 10
Processing rate Mt/a 5.5
Average mined ore grade (remaining, including 2019) g/t Au 2.1
Average mill feed ore grade (remaining, including 2019) g/t Au 2.0
Maximum long-term stockpile tonnage Mt 7
Long-term stockpile grade g/t Au 0.7
Average ROM gold production (during 8 yr mine life) koz per year 380
Average life of mine gold production (10 yr process life) koz per year 320
Figure 16-3: LOM Material Movement by Year Forecast (tonnes mined)
Note: Figure prepared by B2Gold, 2019.
-5,000,000
10,000,00015,000,00020,000,00025,000,00030,000,00035,000,00040,000,000
2019 2020 2021 2022 2023 2024 2025 2026 2027 2028
Tonn
es M
ined
Material Movement by Year
MG/HG Ore Mined >1.5 Au gpt LG2 Ore Mined 0.8 > Au gpt < 1.5
LG1 Ore Mined 0.65 > Au gpt < 0.8 Waste Mined
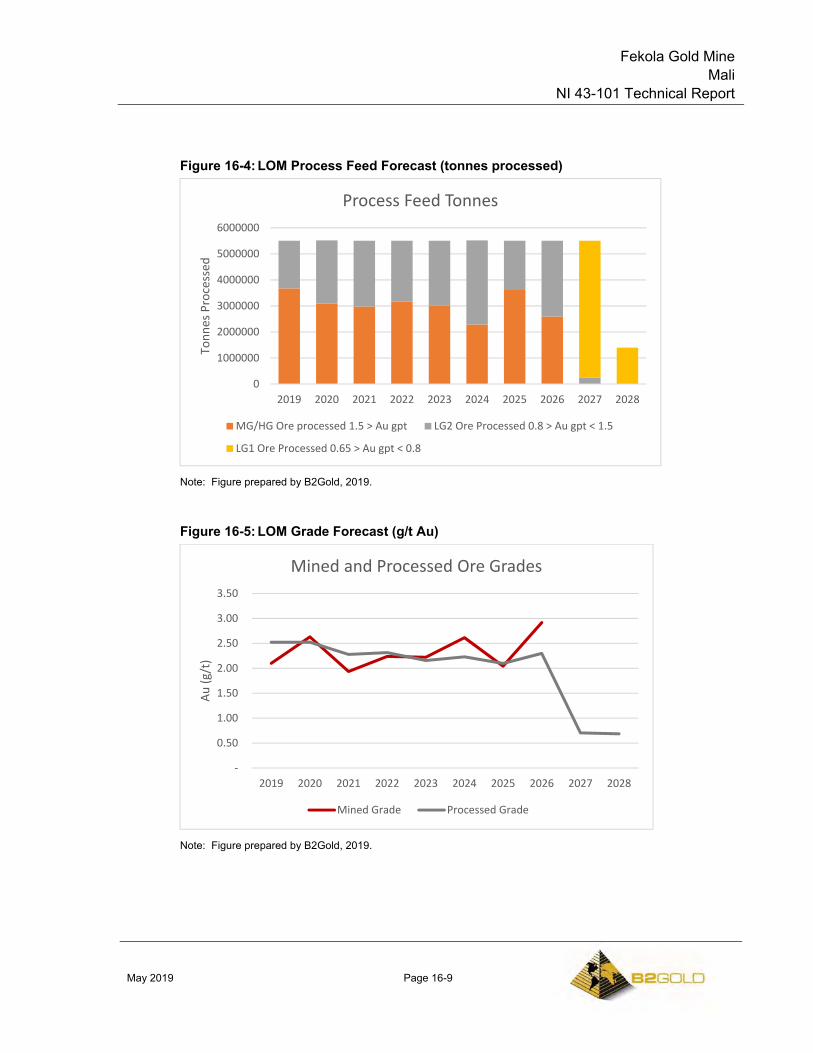
Fekola Gold Mine Mali
NI 43-101 Technical Report
May 2019 Page 16-9
Figure 16-4: LOM Process Feed Forecast (tonnes processed)
Note: Figure prepared by B2Gold, 2019.
Figure 16-5: LOM Grade Forecast (g/t Au)
Note: Figure prepared by B2Gold, 2019.
0
1000000
2000000
3000000
4000000
5000000
6000000
2019 2020 2021 2022 2023 2024 2025 2026 2027 2028
Tonn
es P
roce
ssed
Process Feed Tonnes
MG/HG Ore processed 1.5 > Au gpt LG2 Ore Processed 0.8 > Au gpt < 1.5
LG1 Ore Processed 0.65 > Au gpt < 0.8
-
0.50
1.00
1.50
2.00
2.50
3.00
3.50
2019 2020 2021 2022 2023 2024 2025 2026 2027 2028
Au (g
/t)
Mined and Processed Ore Grades
Mined Grade Processed Grade
Fekola Gold Mine Mali
NI 43-101 Technical Report
May 2019 Page 16-10
In general, two to three cutbacks will be mined simultaneously to expose sufficient ore stocks to sustain the plant feed through mine life. The deepest phase will generally produce most of the high-grade ore and have the lowest strip ratio. The second cutback will be catching up to expose more ore at depth as the waste pre- stripping is completed and will generate significant low and medium grade ore. Mostly waste will be mined in the third cutback at the upper levels to expose future ore on time. This pattern will repeat as the mining in the deepest cutback is completed and replaced with the ore mining in the second cutback and a new cutback is started at the top of the open pit.
The mining operations are scheduled to work 365 days in a year, with decreased production targets during the rainy season. The processing plant is scheduled to operate 24 hours continuously except for planned maintenance periods. The mill feed will be supplied from the ROM ore stockpiles while the mine is not producing ore feed.
The mill feed ore is transported from open pits to the ROM pad for direct tipping or stockpiling. Although the crusher design allows for direct truck tipping, mining cost estimates assume 80% of the ROM ore will be rehandled due to variations in mine production.
The stockpiled ore is loaded to the crusher with a front-end loader (Cat 990, 992, or similar). About approximately three to four week’s ore supply is maintained on the ROM pad to control the gold grades and ore types.
16.9 Blasting and Explosives
The production drilling, blasting, and waste mining operations is carried out in general at 10 m benches.
The current average powder factor is 0.26 kg/t (ANFO equivalent). Blast optimization is in progress and will continue as development in to harder rock continues.
Production drilling is performed by four Caterpillar MD6240 and MD6250 drills, and presplit drilling is performed by two Caterpillar drills and one Sandvik top-hammer drill. Bulk emulsion is used throughout the operations under both dry and wet conditions.
For blasting at 10 m benches, the 165 mm diameter blast hole patterns are expected to be varying from 4 m x 5 m in fresh rock to 4.8 m x 6 m in transitional rock, depending on the variability and strength of the formations.
For blasting at 5 m benches, the 115 m diameter blast hole patterns are expected to be varying from 2.7 m x 3.4 m in fresh rock to 3.2 m x 4 m in transition rock, depending on the variability and strength of the formations.
Free digging, ripping, and blasting operations in the weathered zone will vary according to the extent of the lateritized and colluvial zones and presence of boulders.
Fekola Gold Mine Mali
NI 43-101 Technical Report
May 2019 Page 16-11
16.10 Grade Control
In grade control of the mining benches, sampling commences with the RC drilling ahead of the mining front to assist the short and medium term mine planning processes. The holes are generally angled at 60º from the hanging wall side of the ore zones to provide a good intersection with the mineralised structures.
The grade control is based on drilling RC holes and sampling practice at regular intervals along the holes. The samples are tested in the onsite laboratory. Grade control drilling is generally spaced at 15 m along strike and 6.5 m across strike and drilled one to three benches in depth depending on mine scheduling and data requirements. Drill hole spacing and sample density is being optimized as the mine develops.
16.11 Mining Equipment
Current and peak equipment requirements are detailed in Table 16-3.
Truck numbers total 24. The haul distances increase with development of deeper cutbacks.
The excavator numbers will increase by one during the mine life, so that production is not reduced during mid-life rebuilds and as availability decreases over time. The four Caterpillar 6020B excavators will mine bulk waste, selective waste, and ore in 10 m benches. The benches are generally divided into three flitches, with the upper flitch consisting of blast heave plus 2 m and the middle and lower flitches mined at 4 m each.
The ancillary equipment numbers will peak in 2021 when three phases are in production, mining reaches the lower levels of the pit, and waste dumping faces advance horizontally and vertically.
16.12 Personnel
Mining operations estimates are based on a 2 x 12 hr shifts. The mining workforce is estimated to be up to 492 people, including senior and expatriate staff.
16.13 Comments on Mining Methods
The mining operations use conventional open pit mining methods and equipment. Seven pit phases are planned.
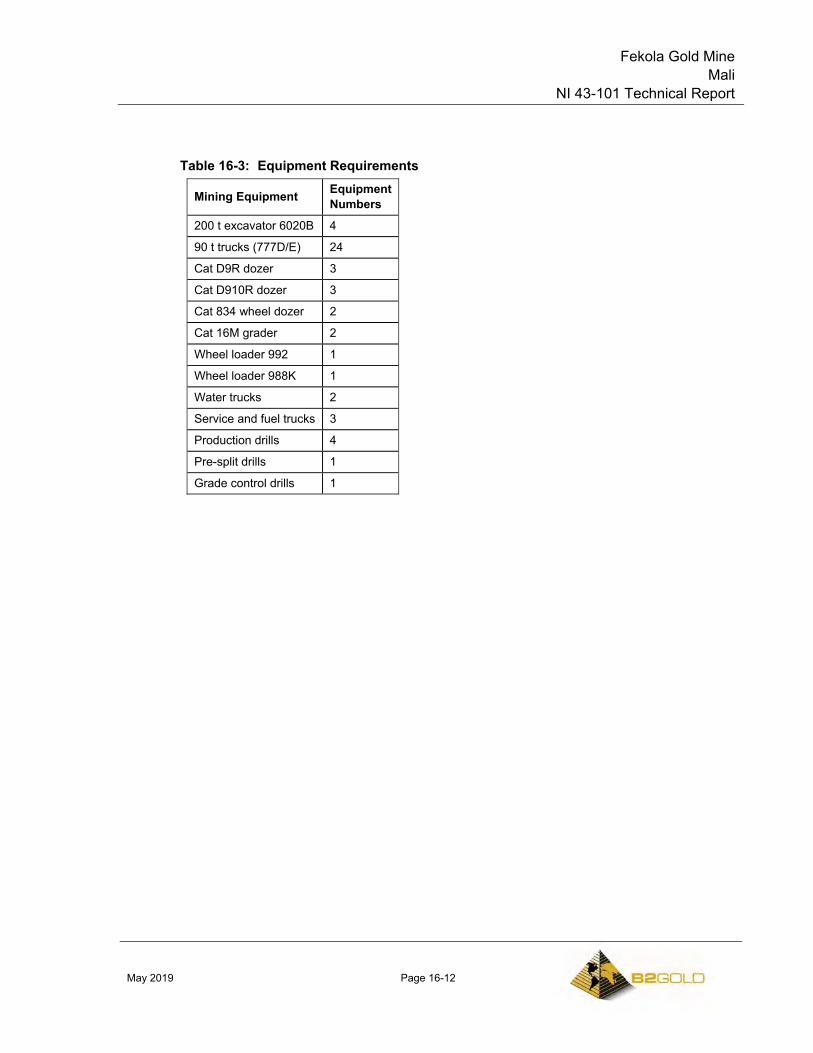
Fekola Gold Mine Mali
NI 43-101 Technical Report
May 2019 Page 16-12
Table 16-3: Equipment Requirements
Mining Equipment Equipment Numbers
200 t excavator 6020B 4
90 t trucks (777D/E) 24
Cat D9R dozer 3
Cat D910R dozer 3
Cat 834 wheel dozer 2
Cat 16M grader 2
Wheel loader 992 1
Wheel loader 988K 1
Water trucks 2
Service and fuel trucks 3
Production drills 4
Pre-split drills 1
Grade control drills 1
Fekola Gold Mine Mali
NI 43-101 Technical Report
May 2019 Page 17-1
17.0 RECOVERY METHODS
17.1 Introduction
The process plant at Fekola is based on a robust metallurgical flowsheet designed for optimum recovery with minimum operating costs. The flowsheet is based upon unit operations that are well proven in industry.
The key project and ore specific criteria considered in the 2015 feasibility study plant design included:
• Nameplate throughput capacity of 5 Mt/a of ore;
• Process plant availability of 94% supported by crushed ore storage, standby equipment in critical areas and on-site heavy fuel oil (HFO) and diesel generator power supply;
• Sufficient automated plant control to minimise the need for continuous operator interface and allow manual override and control if and when required.
Based on a grinding circuit survey and updated comminution model completed in 2018 and actual 2018 production, B2Gold evaluated plant throughput capacity increases using the existing plant and equipment. This indicated that a throughput rate of 5.5 Mt/a should be the basis of the 2018 LOMP that supports the Mineral Reserves in Section 15.
With further evaluation, it became apparent that the plant could operate with even higher throughput rates, and that the Fekola mill has the capacity to operate at a 6 Mt/a throughput rate on the mill feed materials envisaged in the LOMP.
17.2 Process Flowsheet
The process flowsheet is provided in Figure 17-1. The treatment plant incorporates the following unit process operations:
• Single stage primary crushing with a gyratory crusher to produce a crushed product size of 80% passing (P80) of 150 mm;
• Crushed ore stockpile with a nominal 10,000 t live capacity to provide 16 hours of operation at design plant throughput. During extended periods of up to three days for primary crusher equipment maintenance, ore from the dead part of the stockpile is reclaimed by an excavator or dozer to feed the grinding circuit;
• Crushed ore from the stockpile is reclaimed by apron feeders positioned under the stockpile to feed the grinding circuit;
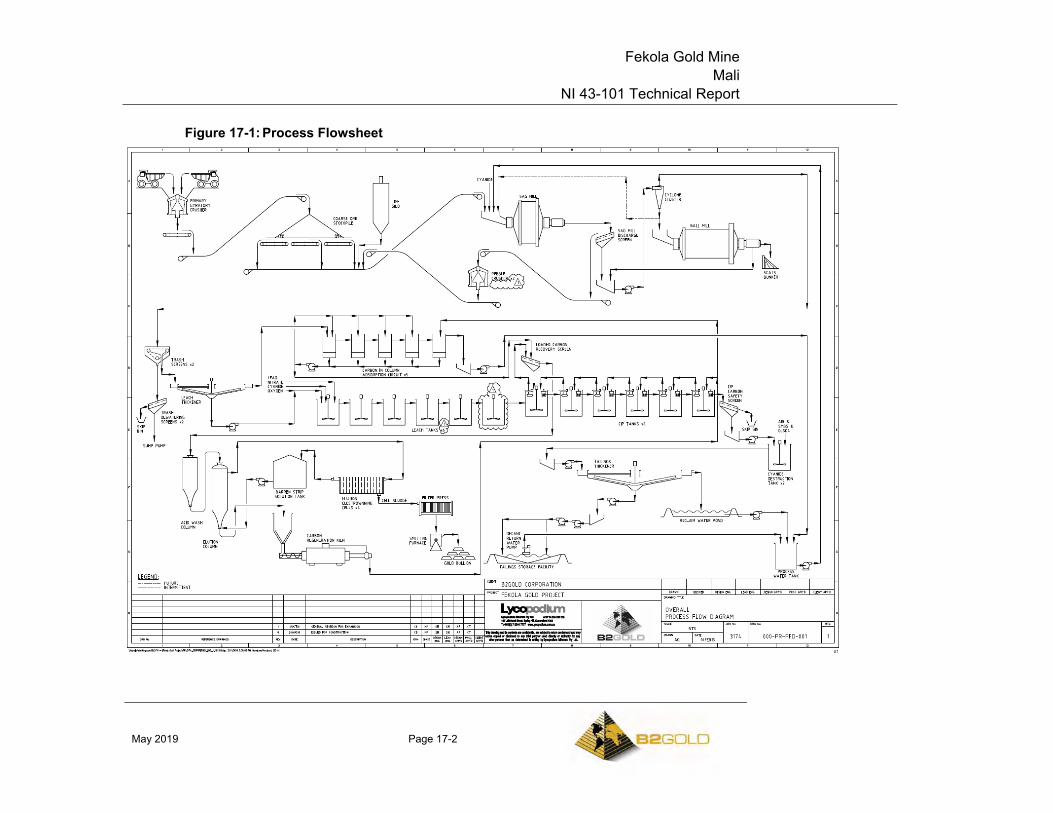
Fekola Gold Mine Mali
NI 43-101 Technical Report
May 2019 Page 17-2
Figure 17-1: Process Flowsheet
Fekola Gold Mine Mali
NI 43-101 Technical Report
May 2019 Page 17-3
• The grinding circuit is a semi-autogenous grind (SAG)–ball mill/pebble crusher circuit (SABC) type, which consists of an open circuit SAG mill, pebble crusher for SAG mill discharge oversize and a closed-circuit ball mill to produce a P80 grind size of 75 µm;
• Quicklime from a silo is added onto the SAG mill feed conveyor along with the crushed pebbles. Sodium cyanide solution is added to the SAG mill feed chute to start the gold leaching process;
• Hydrocyclones are operated to achieve a cyclone overflow slurry density of 25% solids to promote better particle size separation efficiency. Following this, a leach thickener is used to increase slurry density to the leach circuit, minimise leach tank volume requirements, reduce overall reagent consumption, and separate gold dissolved by cyanide addition to the grinding circuit;
• Carbon columns (CIC) recover gold already dissolved in the grinding circuit. The leach thickener overflow stream is pumped to this carbon adsorption circuit;
• Leach circuit with six tanks to achieve the required 24 hours of residence time at design plant throughput. Carbon-in-pulp (CIP) circuit consisting of six stages is a carbon adsorption circuit for recovery of remaining gold dissolved in the leaching circuit;
• Zadra elution circuit with gold recovery to doré. The circuit includes an acid wash column to remove inorganic foulants from the carbon with hydrochloric acid. The single elution circuit is common for both carbon adsorption circuits;
• Carbon regeneration kiln to remove organic foulants from the carbon with heat. This piece of equipment is common for both carbon adsorption circuits;
• Cyanide destruction circuit using SO2 and air to reduce the weakly acid-dissociable (WAD) cyanide (CNWAD) level in the tailings discharge stream to an environmentally acceptable level;
• Tailings thickener to increase slurry density for water recovery prior to tailings discharge to the TSF.
17.3 Plant Design
The key project design parameters are provided in Table 17-1, based on the LOMP throughput rate assumption of 5.5 Mt/a.
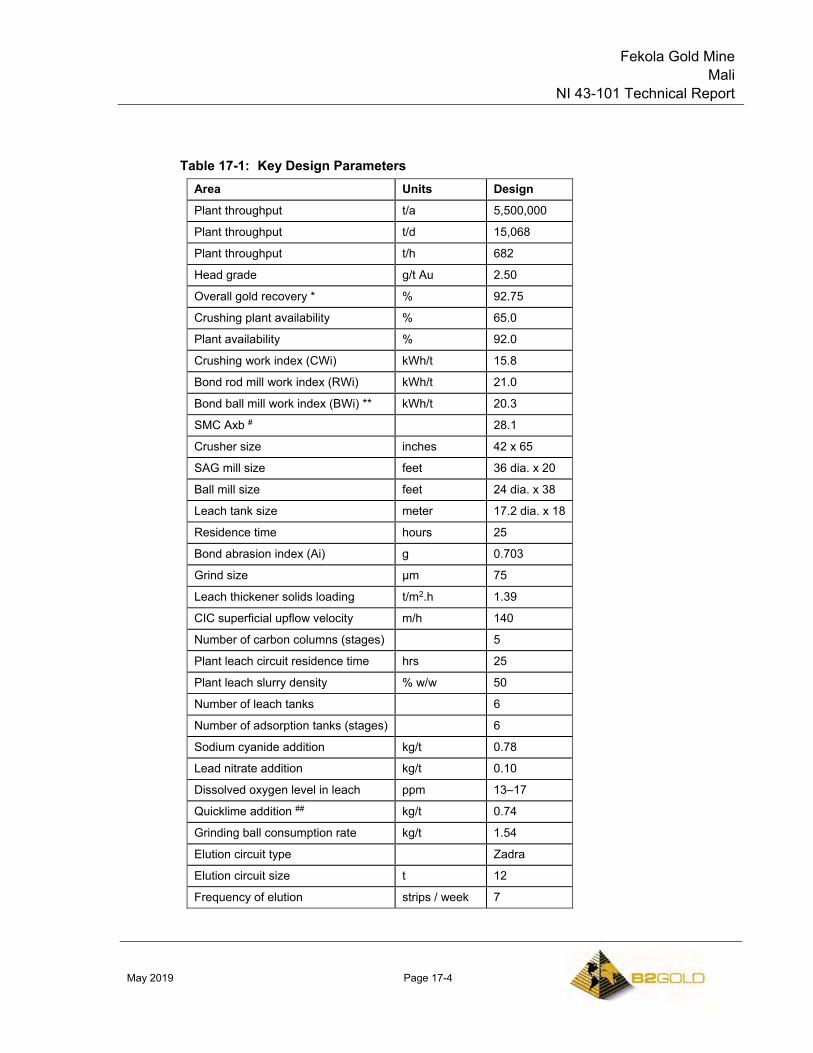
Fekola Gold Mine Mali
NI 43-101 Technical Report
May 2019 Page 17-4
Table 17-1: Key Design Parameters Area Units Design
Plant throughput t/a 5,500,000
Plant throughput t/d 15,068
Plant throughput t/h 682
Head grade g/t Au 2.50
Overall gold recovery * % 92.75
Crushing plant availability % 65.0
Plant availability % 92.0
Crushing work index (CWi) kWh/t 15.8
Bond rod mill work index (RWi) kWh/t 21.0
Bond ball mill work index (BWi) ** kWh/t 20.3
SMC Axb # 28.1
Crusher size inches 42 x 65
SAG mill size feet 36 dia. x 20
Ball mill size feet 24 dia. x 38
Leach tank size meter 17.2 dia. x 18
Residence time hours 25
Bond abrasion index (Ai) g 0.703
Grind size µm 75
Leach thickener solids loading t/m2.h 1.39
CIC superficial upflow velocity m/h 140
Number of carbon columns (stages) 5
Plant leach circuit residence time hrs 25
Plant leach slurry density % w/w 50
Number of leach tanks 6
Number of adsorption tanks (stages) 6
Sodium cyanide addition kg/t 0.78
Lead nitrate addition kg/t 0.10
Dissolved oxygen level in leach ppm 13–17
Quicklime addition ## kg/t 0.74
Grinding ball consumption rate kg/t 1.54
Elution circuit type Zadra
Elution circuit size t 12
Frequency of elution strips / week 7
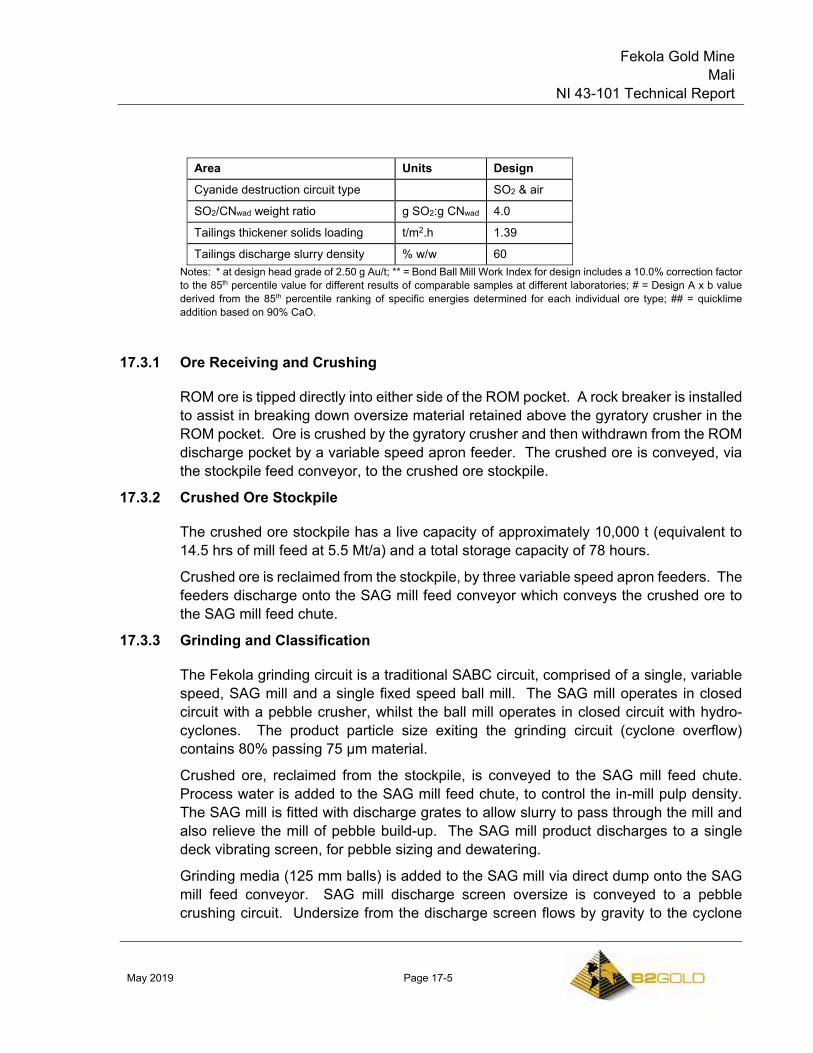
Fekola Gold Mine Mali
NI 43-101 Technical Report
May 2019 Page 17-5
Area Units Design
Cyanide destruction circuit type SO2 & air
SO2/CNwad weight ratio g SO2:g CNwad 4.0
Tailings thickener solids loading t/m2.h 1.39
Tailings discharge slurry density % w/w 60 Notes: * at design head grade of 2.50 g Au/t; ** = Bond Ball Mill Work Index for design includes a 10.0% correction factor to the 85th percentile value for different results of comparable samples at different laboratories; # = Design A x b value derived from the 85th percentile ranking of specific energies determined for each individual ore type; ## = quicklime addition based on 90% CaO.
17.3.1 Ore Receiving and Crushing
ROM ore is tipped directly into either side of the ROM pocket. A rock breaker is installed to assist in breaking down oversize material retained above the gyratory crusher in the ROM pocket. Ore is crushed by the gyratory crusher and then withdrawn from the ROM discharge pocket by a variable speed apron feeder. The crushed ore is conveyed, via the stockpile feed conveyor, to the crushed ore stockpile.
17.3.2 Crushed Ore Stockpile
The crushed ore stockpile has a live capacity of approximately 10,000 t (equivalent to 14.5 hrs of mill feed at 5.5 Mt/a) and a total storage capacity of 78 hours.
Crushed ore is reclaimed from the stockpile, by three variable speed apron feeders. The feeders discharge onto the SAG mill feed conveyor which conveys the crushed ore to the SAG mill feed chute.
17.3.3 Grinding and Classification
The Fekola grinding circuit is a traditional SABC circuit, comprised of a single, variable speed, SAG mill and a single fixed speed ball mill. The SAG mill operates in closed circuit with a pebble crusher, whilst the ball mill operates in closed circuit with hydro-cyclones. The product particle size exiting the grinding circuit (cyclone overflow) contains 80% passing 75 µm material.
Crushed ore, reclaimed from the stockpile, is conveyed to the SAG mill feed chute. Process water is added to the SAG mill feed chute, to control the in-mill pulp density. The SAG mill is fitted with discharge grates to allow slurry to pass through the mill and also relieve the mill of pebble build-up. The SAG mill product discharges to a single deck vibrating screen, for pebble sizing and dewatering.
Grinding media (125 mm balls) is added to the SAG mill via direct dump onto the SAG mill feed conveyor. SAG mill discharge screen oversize is conveyed to a pebble crushing circuit. Undersize from the discharge screen flows by gravity to the cyclone
Fekola Gold Mine Mali
NI 43-101 Technical Report
May 2019 Page 17-6
feed pump box, where it combines with the discharge slurry from the ball mill. The slurry is then pumped to the cyclone cluster by one of two (duty/standby) variable-speed cyclone feed pumps. Process water is added to the cyclone feed pump box for cyclone feed density control.
The cyclone cluster overflow flows by gravity through a metallurgical sampler then onto two linear trash screens in a parallel configuration. Trash screen undersize is directed to the leach thickener feed whilst trash screen oversize is discharged to trash dewatering screens for trash collection and disposal. Slurry from the cyclone underflow launder, is returned to the ball mill feed chute with optional underflow slurry recycle to the SAG mill. Ball mill discharge passes through the ball mill trommel prior to discharging to the cyclone feed pump box. Reject oversize material, from the ball mill trommel screen, is collected within the ball mill scats bunker.
17.3.4 Pebble Crushing
Oversize from the SAG mill discharge screen is conveyed to the pebble crusher feed bin, via a series of belt conveyors. Two self-cleaning belt magnets are positioned in the conveying circuit to remove any scrap metal and steel media which can potentially damage the pebble crusher.
Pebbles pass under a metal detector, then discharge into the pebble crusher feed bin. The feed bin provides surge capacity ahead of the pebble crushers and allows a controlled feed to be presented to the crushers which provides a choke-feed condition and consistent power draw. Should the pebble crushers not be operational, or the metal detector detect tramp metal, a diverter gate ahead of the feed bin allows pebbles to bypass the bin and crushers and feed directly to the pebble crusher discharge conveyor.
Pebbles are withdrawn from the pebble crusher feed bin, by variable speed vibrating feeders. Two pebble crushers are installed, and operate in a duty / standby arrangement. The pebble crusher discharges crushed pebbles directly onto the pebble crusher discharge conveyor which in turn returns the crushed pebbles to the SAG mill feed conveyor.
17.3.5 Leach Thickening
Trash screen undersize flows by gravity directly to the leach thickener feed box, where flocculant is added to aid with particle settling. Overflow solution from the leach thickener flows by gravity to the leach thickener overflow tank and is then pumped to the carbon in columns circuit. Underflow from the leach thickener is pumped to the leach feed distribution box. A thickener recycle pump is included to improve thickener operational flexibility when running, and ensure compaction of the thickener bed does not occur if the thickener is off-line for a plant shutdown.
Fekola Gold Mine Mali
NI 43-101 Technical Report
May 2019 Page 17-7
17.3.6 Carbon in Columns Circuit
Leach thickener overflow is pumped to the CIC circuit. The CIC circuit recovers gold in solution from the grinding circuit, then pumps the discharge solution, which is cyanide bearing solution, to the process water tank for reuse in the grinding circuit.
A common carbon transfers pump transfers carbon forward throughout the columns counter-current to the flow of solution. A second carbon transfer pump recovers carbon to the loaded carbon recovery screen for gold carbon desorption. Approximately twice per week, loaded carbon from the first carbon column is pumped, by the second carbon transfer pump, to the loaded carbon recovery screen. The screen solution underflow flows by gravity to the carbon column of origin whilst the loaded carbon flows by gravity to the acid wash column.
Regenerated carbon (or fresh carbon) is added to the CIC circuit, from the carbon regeneration circuit. The regenerated carbon (or fresh carbon) is pumped, to the CIC circuit, via the CIC carbon sizing screen. The sizing screen removes excess water and carbon fines. The dewatered carbon discharges into the last, online, CIC tank with excess water and carbon fines directed to the carbon fines collection hopper for further removal from the circuit.
17.3.7 Leach Circuit
Leach thickener underflow is pumped to the leach feed distribution box. The slurry from the leach feed distribution box flows by gravity to the first leach tank.
The leach circuit consists of six mechanically agitated, leach tanks operating in series. This equates to a residence time of approximately 25 hrs at a design feed rate of 5.5 Mt/a. Each leach tank has a live volume of 3,900 m³.
17.3.8 Carbon in Pulp Circuit
The CIP circuit consists of six, mechanically agitated, CIP tanks operating in series. This provides a residence time of about 6 hrs for a plant throughput of 5.5 Mt/a. Each CIP tank has a live volume of 1,100 m³.
The leaching circuit dissolves the remaining gold in solid and the CIP circuit recovers this dissolved gold in solution by carbon adsorption. Activated carbon is retained in each of the CIP tanks by an inter-tank screen.
As the slurry flows by gravity through the CIP tanks, the carbon is advanced counter-current to the slurry flow. Carbon advancement is achieved by the CIP carbon transfer pumps, of which there is one transfer pump per CIP tank.
Approximately five times per week, loaded carbon from the first CIP tank is pumped to the loaded carbon recovery screen, where it is washed with spray water to remove
Fekola Gold Mine Mali
NI 43-101 Technical Report
May 2019 Page 17-8
excess slurry. The excess slurry (screen underflow) flows by gravity to the CIP tank of origin whilst the loaded carbon flows by gravity to the acid wash column.
Regenerated carbon (or fresh carbon) is added to the CIP circuit, from the carbon regeneration circuit. The regenerated carbon (or fresh carbon) is pumped, to the CIP circuit, via the CIP carbon sizing screen. The sizing screen removes excess water and carbon fines. The dewatered carbon discharges into the last, online, CIP tank with excess water and carbon fines directed to the carbon fines collection hopper for further removal from the circuit.
Slurry discharging the last CIP tank flows by gravity to the CIP carbon safety screen. The carbon safety screen captures and recovers any carbon exiting the CIP circuit. The safety screen oversize reports to a fine carbon skip bin while the undersize is pumped to the cyanide destruction feed box.
17.3.9 Acid Wash, Elution, Electrowinning and Gold Room
The Fekola desorption circuit consists of separate acid wash and elution columns. A cold acid wash is used for removal of inorganic foulants. Following acid wash, gold is eluted from the carbon, using a Pressure Zadra elution process. An average daily carbon movement of 12 t satisfies the required carbon movements for both the CIC and CIP circuits.
17.3.10 Carbon Regeneration
After elution, the carbon is hydraulically transferred from the elution column to the carbon regeneration circuit.
17.3.11 Cyanide Destruction
CIP tailings are pumped to the cyanide destruction tank where cyanide destruction is achieved using the SO2/air process.
17.3.12 Tailings Thickening and Disposal
Slurry from the cyanide destruction circuit is pumped to the tailings thickener feed box. Flocculant is added to the tailings thickener to enhance the settling properties of the solids. Overflow from the tailings thickener flows by gravity to the reclaim water pond.
Tailings thickener underflow is pumped to the tailings pump box. Two tailings pumps, in series configuration, pump to the TSF and discharge the slurry via spigots around the circumference of the dam. Water from the surface of the TSF is recovered from the decant system and pumped back to the reclaim water pond. Underdrainage and seepage from around the TSF drainage system is pumped into the TSF for recovery by the decant return water pump.
Fekola Gold Mine Mali
NI 43-101 Technical Report
May 2019 Page 17-9
17.4 Plant Control System
The plant control system includes a moderate level of automation and monitoring. The process plant is provided with one main control room, and operator interface terminals are provided in the distributed control system hardware office, main plant control room, crusher control room, and elution circuit area.
17.5 Energy, Water, and Process Materials Requirements
17.5.1 Power
The power demand for the processing plant, along with the rest of the site and camp, is provided by on-site power generation using HFO and diesel fuel. The average annual LOM projected power requirement for the process plant at 250,000 MW.
17.5.2 Water
The process plant uses process water, reclaim water, fresh water, treated water, gland water and potable water. Any shortfall of process water is made up, preferentially, from water contained within the reclaim water pond. If insufficient water is available within the reclaim water pond, fresh water is used for make up to the reclaim water pond. An event pond, which holds any overflow from the process plant and stormwater collected from around the process plant, is pumped to the reclaim pond when necessary.
Process water predominantly consists of leach thickener overflow and reclaim water make-up. Reclaim water predominantly consists of tailings thickener overflow, decant return water from the TSF and fresh water make-up. Fresh water for potable water use is sourced from dedicated potable water bores.
Fresh water for the process plant and mining operation is sourced from active pit dewatering bores. The location of the pit dewatering bores changes as the mining progresses through the stages of the mine life. The bores pump predominantly to the fresh water storage pond, and if required, the bores can pump to the fresh water tank.
17.5.3 Process Materials
The major process materials required include:
• Quicklime (CaO) for pH control;
• Sodium cyanide (NaCN) for gold dissolution and desorption;
• Lead nitrate (Pb(NO3)2) for enhancing gold dissolution;
• Sodium hydroxide (caustic soda; NaOH) for carbon acid washing neutralisation and desorption.
Fekola Gold Mine Mali
NI 43-101 Technical Report
May 2019 Page 17-10
• Hydrochloric acid (HCl) for carbon acid washing;
• Sodium metabisulphite (SMBS) for cyanide destruction;
• Copper sulphate pentahydrate (CuSO4.5H2O) for cyanide destruction;
• Flocculant for thickening;
• Antiscalant to minimise scaling in the process water distribution, reclaim water distribution, fresh water distribution, gland water distribution, and elution circuit;
• Fluxes for smelting;
• Low- and high-pressure air services;
• Oxygen;
• Steel balls for SAG and ball mill grinding media.
17.6 Comments on Recovery Methods
The process recovery uses conventional designs and equipment.
Fekola Gold Mine Mali
NI 43-101 Technical Report
May 2019 Page 18-1
18.0 PROJECT INFRASTRUCTURE
18.1 Introduction
Surface infrastructure to support operations is in place, and includes:
• One open pit;
• Processing facilities: grinding and leaching facilities, along with management and engineering offices, change house, workshop, warehouse, and assay laboratory facilities;
• Mine facilities: management and engineering offices, change house, EMV and light vehicle workshops, wash bay, warehouse, explosives magazine, crusher, mine access gate house, return water pump house;
• Administration buildings: facilities for overall site management, safety inductions, and general and administrative functions;
• Accommodation camp;
• Waste rock storage facilities;
• Tailings storage facility;
• Water management facilities: stormwater and water storage dams, diversions, culverts;
• Landfill facility;
• Power generation facility;
• Fuel storage facilities: HFO and diesel.
A layout plan showing the facilities constructed to support mining operations is provided in Figure 18-1.
18.2 Road and Logistics
The Fekola Mine is accessible by road via a 20 km gravel road which intersects the existing Millennium Highway 25 km east of the town of Kéniéba. The Millennium Highway is a surfaced road in good condition, with access to the capital city of Bamako approximately 450 km to the east and to the port of Dakar approximately 1,100 km to the west.
Plant internal roads provide access between the administration area, process plant facilities, fuel storage, power plant, mine services area, and accommodation camp. A number of access tracks exist to access infrastructure such as the tailings storage facility, sediment control structures and water bore pumps remote from the plant site.
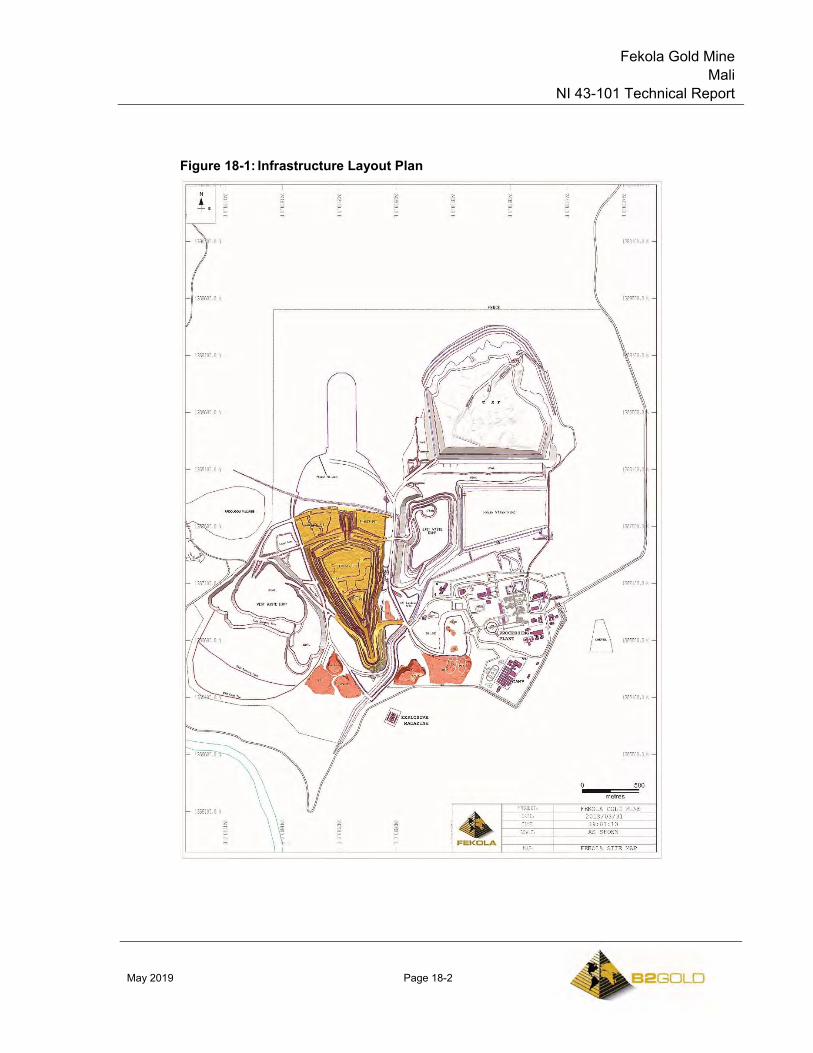
Fekola Gold Mine Mali
NI 43-101 Technical Report
May 2019 Page 18-2
Figure 18-1: Infrastructure Layout Plan
Fekola Gold Mine Mali
NI 43-101 Technical Report
May 2019 Page 18-3
An 1,800 m long (1,600 m active length) x 30 m wide all-weather gravel airstrip provides for secure transport of bullion, transportation of mine personnel, and emergency medivac purposes. The airstrip is designed to suit a Beech Craft 1900 type aircraft or similar.
18.3 Stockpiles
Stockpiles include low-grade, medium-grade, and active ROM stockpiles. The stockpiles are located to the east of the Fekola open pit or adjacent to the ROM pad (refer to Figure 18-1). The stockpiles have sufficient LOMP storage capacity; however, they could be expanded vertically and horizontally as needed.
Active stockpiles (medium and high grade) are located on the ROM pad.
18.4 Waste Storage Facilities
Waste rock storage facility design is discussed in Section 16.6.
Waste rock storage facilities are located to the west of the ultimate pit (refer to Figure 18-1). An overall slope angle of 18° was used in the design of the WRSFs with 5 m wide berms developed at 10 m vertical intervals.
The remaining WRSF capacity is about 200 Mt, and there is sufficient footprint area available to add capacity if needed.
18.5 Tailings Storage Facilities
18.5.1 Overview
The TSF was constructed using downstream construction techniques, based on a design by Knight Piésold.
A decant tower system was constructed to pump return water to the return water pond. The TSF, site water storage ponds, and surface water control structures were designed to control 100-year storm events (varying duration; 24-hr, 72-hr dry annual rainfall and wet annual rainfall).
The TSF was designed to contain 62 Mt of tailings at a deposition rate of 5.0 Mt/a. Review of the as-built and operating parameters of the TSF is on-going, to evaluate the storage capacity at the currently higher throughput rate.
18.5.2 Design Considerations
The TSF is located in the valley to the north of the plant site and open pit, adjacent to the eastern waste rock storage facility. The TSF is designed to store a total of 62 Mt of tailings. The TSF comprises a valley storage formed by a single downstream multi-zoned, earth fill embankment, lined with high density polyethylene (HDPE), comprising
Fekola Gold Mine Mali
NI 43-101 Technical Report
May 2019 Page 18-4
a total footprint area (including the basin area) of approximately 200 ha at the ultimate TSF height. The TSF was originally modelled with deposition rates up to 5.0 Mt/a. Higher deposition rates are being evaluated.
The TSF embankment is designed for annual raises to suit storage requirements. Downstream raise construction methods are proposed throughout operations. The embankment comprises an upstream low permeability zone (Zone A) and downstream structural fill zone (Zone C). The embankment upstream face is lined with HDPE liner. The embankment has an operating upstream and downstream slope of 3H:1V and a minimum crest width of 8 m.
The TSF design incorporates a basin underdrainage system to reduce pressure head acting on the geomembrane liner, reduce seepage, increase tailings densities, and improve the geotechnical stability of the embankments. The underdrainage system comprises a network of branch drains reporting to collector drains situated in natural drainage courses. Underdrains comprise perforated plastic pipes, covered in sand/gravel drainage material and wrapped in geotextile. The underdrainage system drains by gravity to a collection sump located at the lowest point in the TSF basin. Solution recovered from the underdrainage system is released to the top of the tailings mass via submersible pump, reporting to the supernatant pond.
Supernatant water is removed from the TSF via submersible pumps located within decant towers. The supernatant pond is maintained on the northern edge of the TSF basin. Solution recovered from the decant system is pumped back to the plant for re-use in the process circuit.
The TSF has sufficient capacity to completely contain all design criteria storm events and rainfall sequences (24- hr, 72-hr, dry annual rainfall and wet annual rainfall; average recurrence interval of one-in-100 years). Under normal operating conditions, with the TSF managed in accordance with standard operating procedures, the available stormwater storage capacity is in excess of the design storm event volumes and no discharge from the TSF is expected. In the event that a storm event greater than the TSF design criteria occurs that exceeds the available storage capacity during operation, rainfall and supernatant which cannot be attenuated and stored with the supernatant pond will discharge from the TSF in a controlled manner via an engineered spillway (spillway storm event design criteria one-in-100 year recurrence interval (critical duration), occurring when supernatant pond is at spillway inlet level).
The closure spillway will be excavated from the final supernatant pond location, running north through the ridge and off site. The closure spillway will allow conveyance of probable maximum precipitation, 24-hr duration storm event (critical duration, occurring when supernatant pond is at spillway inlet level) without significant attenuation in the TSF.
Fekola Gold Mine Mali
NI 43-101 Technical Report
May 2019 Page 18-5
Tailings are discharged into the TSF by sub-aerial deposition, using a combination of spigots at regularly spaced intervals from the embankments and the eastern and western perimeter of the TSF.
A pipeline containment trench has been constructed to contain both the tailings delivery pipeline and decant return pipeline between the TSF and plant site, as the flow in both pipelines is contaminated and cannot be discharged to the environment if the pipeline bursts. The pipeline trench is situated adjacent to the main access road and will drain to a designated catchment pond.
A monitoring program for the TSF has been developed to monitor for potential problems which may arise during operations.
The final layout of the TSF is provided in Figure 18-2.
18.6 Water Management
The Fekola Mine is located in an existing natural drainage course, with an upstream catchment of 9 km2. The site surface water management system is designed to prevent runoff from events up to and inclusive of a one-in-100-year recurrence interval storm event from entering the pit. Water management structures include a settling pond, diversion channels, a freshwater storage pond, and sediment control structures.
All water falling directly on the industrial areas (contacted water) or otherwise contacted (fissure water from the open pit, return and storm water from the TSF) is captured in storm-water settling ponds, where it is either used in the mining and processing facilities or during the prolonged rainy season released to the site diversion channels and the Falémé River.
An assessment of the flooding extent of the Falémé River was carried out to determine inundation risk to project infrastructure, particularly the Fekola open pit. Flood modelling was completed by Knight Piésold. The predicted flood inundation level for the section of the Falémé River adjacent to the Fekola Mine (in particular at the open pit), does not encroach on the current pit outline. A peak flood level of approximately 130.5 m would be required to result in pit flooding. Based on the frequency analysis of the flood levels, a flood resulting in a peak flood level of 130.5 m is estimated to be greater than a one-in-1,000-year recurrence interval.
18.7 Camps and Accommodation
B2Gold employees live in the surrounding communities and in the on-site camp. The on-site camp is fully secured and has facilities to house and support over 400 people, including VIP, Executive, Senior, and Standard dormitories. The camp includes entertainment, fitness, and medical facilities.
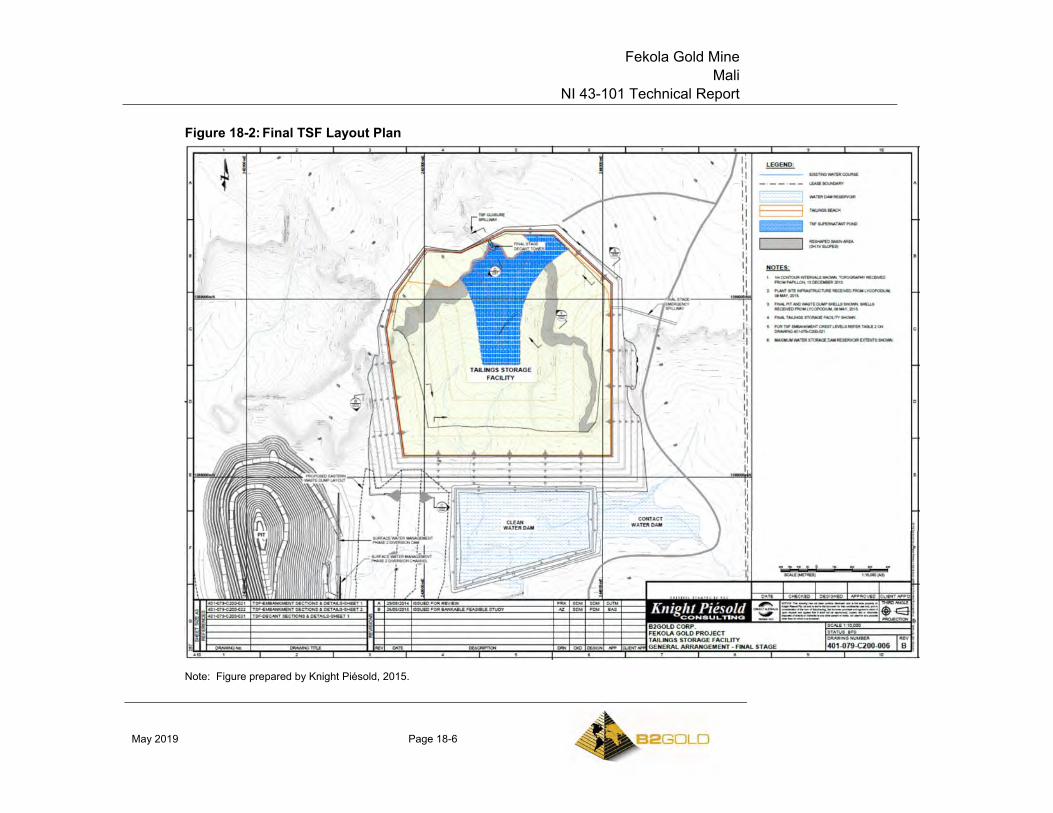
Fekola Gold Mine Mali
NI 43-101 Technical Report
May 2019 Page 18-6
Figure 18-2: Final TSF Layout Plan
Note: Figure prepared by Knight Piésold, 2015.
Fekola Gold Mine Mali
NI 43-101 Technical Report
May 2019 Page 18-7
18.8 Power and Electrical
Power for the Fekola Mine is generated by a dedicated power station that is a combination of HFO and diesel-fuelled generators located adjacent to the process plant. The power plant has been sized to accommodate a maximum demand power draw of 29.4 MW.
Studies are in progress to evaluate the potential for adding a solar power facility. Diesel and HFO are transported to the mine site from Dakar by road.
18.9 Fuel
A storage facility with minimum 30 days fuel supply supports the generators and mobile equipment (mining fleet).
18.10 Water Supply
Potable water is supplied from bore holes.
Process water is sourced from the clean water dam, which is fed from the dewatering wells and, if needed, from the Falémé River.
Water for dust suppression and other mining-related requirements is sourced from various sources including pit dewatering sumps, settling ponds, and the contact water pond.
18.11 Comments on Infrastructure
Infrastructure required to support the LOMP is in place.
Fekola Gold Mine Mali
NI 43-101 Technical Report
May 2019 Page 19-1
19.0 MARKET STUDIES AND CONTRACTS
19.1 Market Studies
No market studies are currently relevant as Fekola is an operating mine producing a readily-saleable commodity in the form of doré. Doré produced by B2Gold typically contains approximately 92% Au and 3% Ag. The doré is exported to the Metalor refinery in Switzerland.
19.2 Commodity Price Projections
Commodity prices used in Mineral Resource and Mineral Reserve estimates are set by B2Gold corporately. The current gold price provided for Mineral Reserve estimation is $1,250/oz, and $1,400/oz for Mineral Resource estimation.
19.3 Contracts
Major contracts include fuel supply, blasting explosives and accessories, and grade control drilling. Contracts are negotiated and renewed as needed. Contract terms are within industry norms, and typical of similar contracts in Mali that B2Gold is familiar with.
19.4 Comments on Market Studies and Contracts
The doré produced by the mine is readily marketable. Metal prices are set corporately for Mineral Resource and Mineral Reserve estimation, and the gold price used for Mineral Resources and Mineral Reserves in this Report was $1,400/oz and $1,250/oz respectively.
The QP has reviewed commodity pricing assumptions, marketing assumptions and the current major contract areas, and considers the information acceptable for use in estimating Mineral Reserves and in the economic analysis that supports the Mineral Reserves.
Fekola Gold Mine Mali
NI 43-101 Technical Report
May 2019 Page 20-2
20.0 ENVIRONMENTAL STUDIES, PERMITTING, AND SOCIAL OR COMMUNITY IMPACT
20.1 Introduction
An Environmental and Social Impact Assessment (ESIA) was originally completed for the Project in 2013 (2013 Environmental and Social Impact Statement (2013 ESIS)). This 2013 ESIS was approved by the Ministry of Environment and Sanitation on 29 April 2013.
In 2015, B2Gold completed an update of the ESIA (2015 ESIA Update) that filled gaps identified in the 2013 ESIS, reflected optimization improvement and modifications to the Fekola Mine design, assessed these improvements and modifications for their potential impacts against baseline conditions in the Project area, and aligned the assessment with international standards including the International Finance Corporation (IFC) environmental and social performance standards.
The 2015 ESIA Update contained the policy, legal and administrative framework under which the study was carried out and the Project was regulated and managed. It included a description of the Fekola Mine in its geographic, ecological, social and temporal context. The 2015 ESIA Update included baseline data describing relevant physical, biological and social conditions associated with the Project area and identified the likely types of environmental and social impacts associated with the construction, operation and closure of the Project. The 2015 ESIA Update assessed the magnitude and likelihood of these impacts based on Project information available at that time and presented the mitigation measures necessary to minimize potential impacts to acceptable levels. Stand-alone management plans to address residual impacts from the Fekola Mine were also provided as part of the ESIA documentation.
20.2 Environmental Impact Assessment Process
The 2013 ESIS process was conducted to comply with Malian legislation while also taking into consideration international guidelines such as the Equator Principles and the International Finance Corporation (IFC) performance standards. The 2015 ESIA Update was completed to fill gaps identified in the 2013 ESIS, reflect optimization improvement and modifications to the Fekola Mine design, assess these improvements and modifications for their potential impacts against baseline conditions in the Fekola Mine area, and align the assessment with international standards including the IFC environmental and social performance standards.
The 2013 ESIS and the 2015 ESIA Update were developed by B2Gold (2013 ESIS was completed by Papillon, since merged with B2Gold) with the support of environmental and social specialists that were selected on the basis of their expertise in the
Fekola Gold Mine Mali
NI 43-101 Technical Report
May 2019 Page 20-3
development of environmental and social impact assessments of mining projects and of the Fekola Mine area.
To ensure that all parties are provided with an opportunity to obtain information on the Fekola Mine as well as comment and raise issues relating to the proposed development, a participatory and inclusive public consultation process was developed and undertaken for the Project as part of the development of the 2013 ESIS. The emphasis of the consultation was on the effective involvement of the natural or legal persons likely to be affected by the proposed development. The consultation process focused on the communities and settlements in the license area and along the road from the town of Kéniéba to the site.
The initial baseline specialist studies were conducted in approximately 2011 and 2012. These studies were incorporated into the 2013 ESIS submitted to the Government of Mali and approved on 29 April 2013. Specialist studies conducted for the 2013 ESIS are listed in Table 20-1.
Additional specialist studies listed in Table 20-2 were commissioned as part of the 2015 ESIA Update process to assess optimization or modifications to the Fekola Mine or where gaps in data were identified.
Additional specialist studies have been conducted since the completion of the 2015 ESIA Update in 2015. These studies have continued to fill gaps in environmental data and to monitor various environmental aspects since the construction and commissioning of the Fekola Mine. These studies have focused on priority biodiversity aspects of the Fekola Mine surrounding area. Findings from these studies are assessed and incorporated into existing operational practices and management strategies as appropriate. These additional studies are listed in Table 20-3.
20.3 Summary of Environmental and Social Setting
20.3.1 Physical Setting
The Fekola Mine is located adjacent to the Falémé River, a major tributary to the Senegal River. The river width is variable from 10–45 m in the vicinity of the Project. There is significant variation in seasonal flows of the Falémé River with approximately 90% of annual flow occurring during the wet season months. Flows at Fadougou gradually decrease over the dry season from November (median flow 35.5 m³/s) to very little flow at the end of the dry season in the months of March (median flow of 5.6 m³/s) and April (median flow 3.9 m³/s). Annual flow is also highly variable year to year.
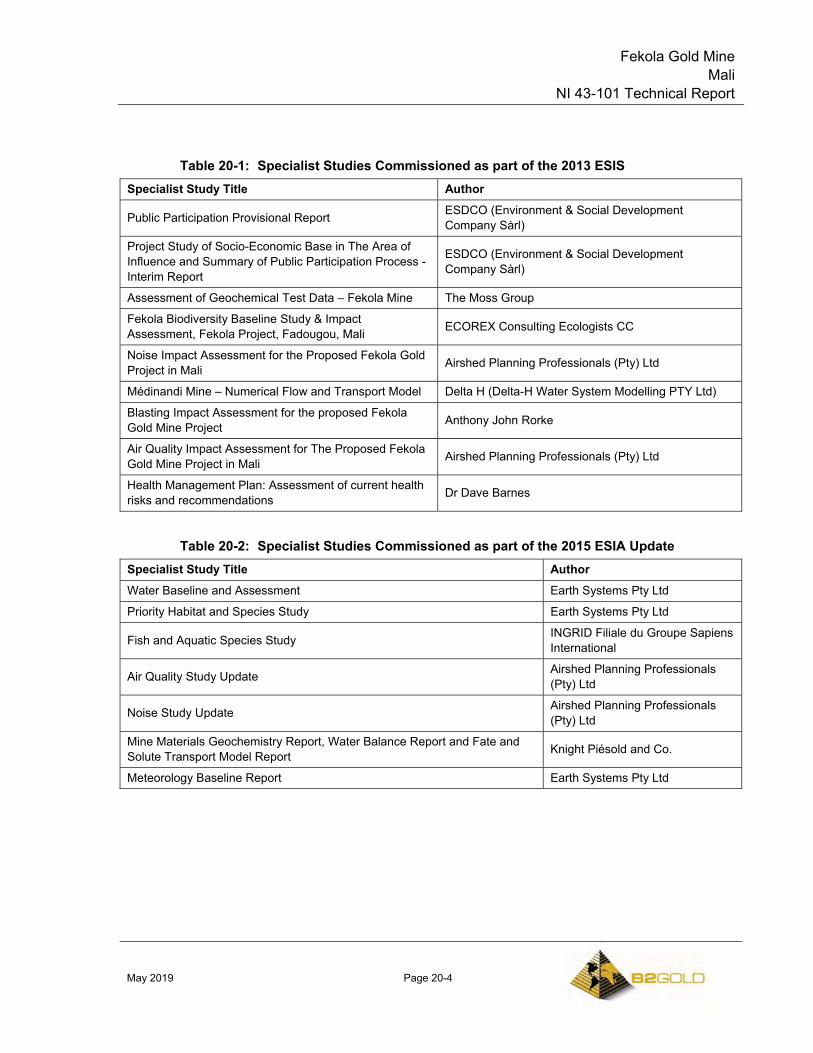
Fekola Gold Mine Mali
NI 43-101 Technical Report
May 2019 Page 20-4
Table 20-1: Specialist Studies Commissioned as part of the 2013 ESIS
Specialist Study Title Author
Public Participation Provisional Report ESDCO (Environment & Social Development Company Sàrl)
Project Study of Socio-Economic Base in The Area of Influence and Summary of Public Participation Process - Interim Report
ESDCO (Environment & Social Development Company Sàrl)
Assessment of Geochemical Test Data – Fekola Mine The Moss Group
Fekola Biodiversity Baseline Study & Impact Assessment, Fekola Project, Fadougou, Mali ECOREX Consulting Ecologists CC
Noise Impact Assessment for the Proposed Fekola Gold Project in Mali Airshed Planning Professionals (Pty) Ltd
Médinandi Mine – Numerical Flow and Transport Model Delta H (Delta-H Water System Modelling PTY Ltd)
Blasting Impact Assessment for the proposed Fekola Gold Mine Project Anthony John Rorke
Air Quality Impact Assessment for The Proposed Fekola Gold Mine Project in Mali Airshed Planning Professionals (Pty) Ltd
Health Management Plan: Assessment of current health risks and recommendations Dr Dave Barnes
Table 20-2: Specialist Studies Commissioned as part of the 2015 ESIA Update
Specialist Study Title Author Water Baseline and Assessment Earth Systems Pty Ltd
Priority Habitat and Species Study Earth Systems Pty Ltd
Fish and Aquatic Species Study INGRID Filiale du Groupe Sapiens International
Air Quality Study Update Airshed Planning Professionals (Pty) Ltd
Noise Study Update Airshed Planning Professionals (Pty) Ltd
Mine Materials Geochemistry Report, Water Balance Report and Fate and Solute Transport Model Report Knight Piésold and Co.
Meteorology Baseline Report Earth Systems Pty Ltd
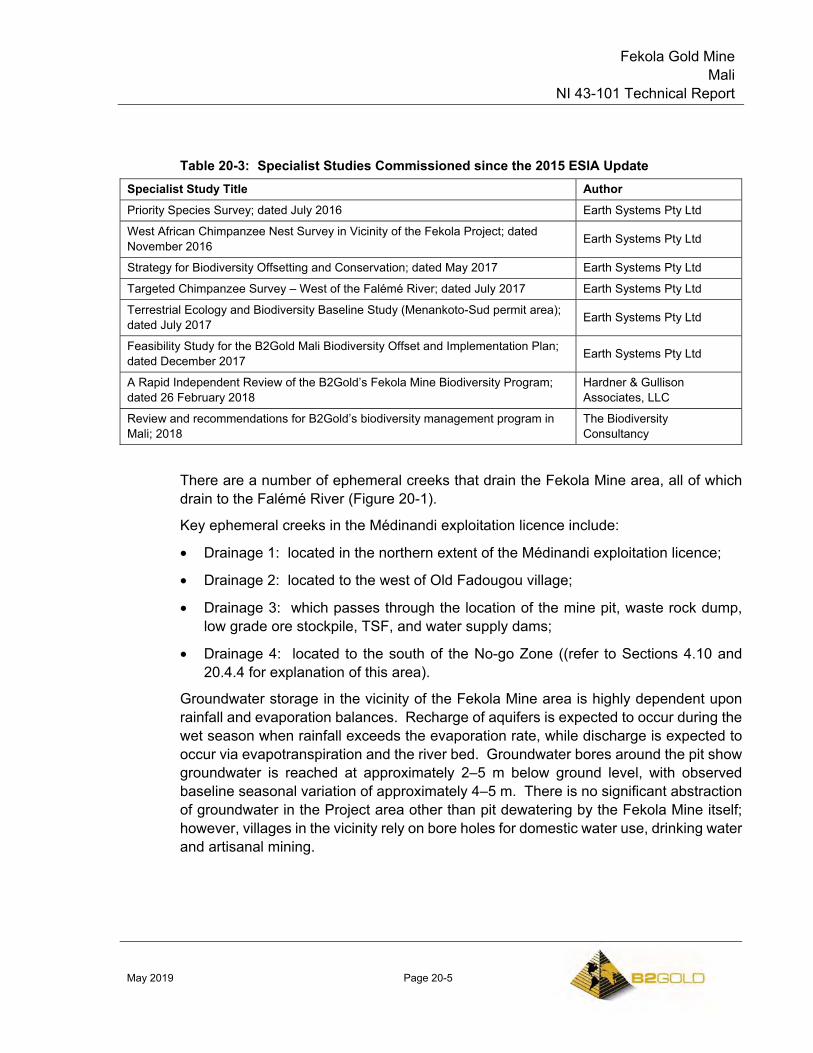
Fekola Gold Mine Mali
NI 43-101 Technical Report
May 2019 Page 20-5
Table 20-3: Specialist Studies Commissioned since the 2015 ESIA Update
Specialist Study Title Author Priority Species Survey; dated July 2016 Earth Systems Pty Ltd
West African Chimpanzee Nest Survey in Vicinity of the Fekola Project; dated November 2016 Earth Systems Pty Ltd
Strategy for Biodiversity Offsetting and Conservation; dated May 2017 Earth Systems Pty Ltd
Targeted Chimpanzee Survey – West of the Falémé River; dated July 2017 Earth Systems Pty Ltd
Terrestrial Ecology and Biodiversity Baseline Study (Menankoto-Sud permit area); dated July 2017 Earth Systems Pty Ltd
Feasibility Study for the B2Gold Mali Biodiversity Offset and Implementation Plan; dated December 2017 Earth Systems Pty Ltd
A Rapid Independent Review of the B2Gold’s Fekola Mine Biodiversity Program; dated 26 February 2018
Hardner & Gullison Associates, LLC
Review and recommendations for B2Gold’s biodiversity management program in Mali; 2018
The Biodiversity Consultancy
There are a number of ephemeral creeks that drain the Fekola Mine area, all of which drain to the Falémé River (Figure 20-1).
Key ephemeral creeks in the Médinandi exploitation licence include:
• Drainage 1: located in the northern extent of the Médinandi exploitation licence;
• Drainage 2: located to the west of Old Fadougou village;
• Drainage 3: which passes through the location of the mine pit, waste rock dump, low grade ore stockpile, TSF, and water supply dams;
• Drainage 4: located to the south of the No-go Zone ((refer to Sections 4.10 and 20.4.4 for explanation of this area).
Groundwater storage in the vicinity of the Fekola Mine area is highly dependent upon rainfall and evaporation balances. Recharge of aquifers is expected to occur during the wet season when rainfall exceeds the evaporation rate, while discharge is expected to occur via evapotranspiration and the river bed. Groundwater bores around the pit show groundwater is reached at approximately 2–5 m below ground level, with observed baseline seasonal variation of approximately 4–5 m. There is no significant abstraction of groundwater in the Project area other than pit dewatering by the Fekola Mine itself; however, villages in the vicinity rely on bore holes for domestic water use, drinking water and artisanal mining.
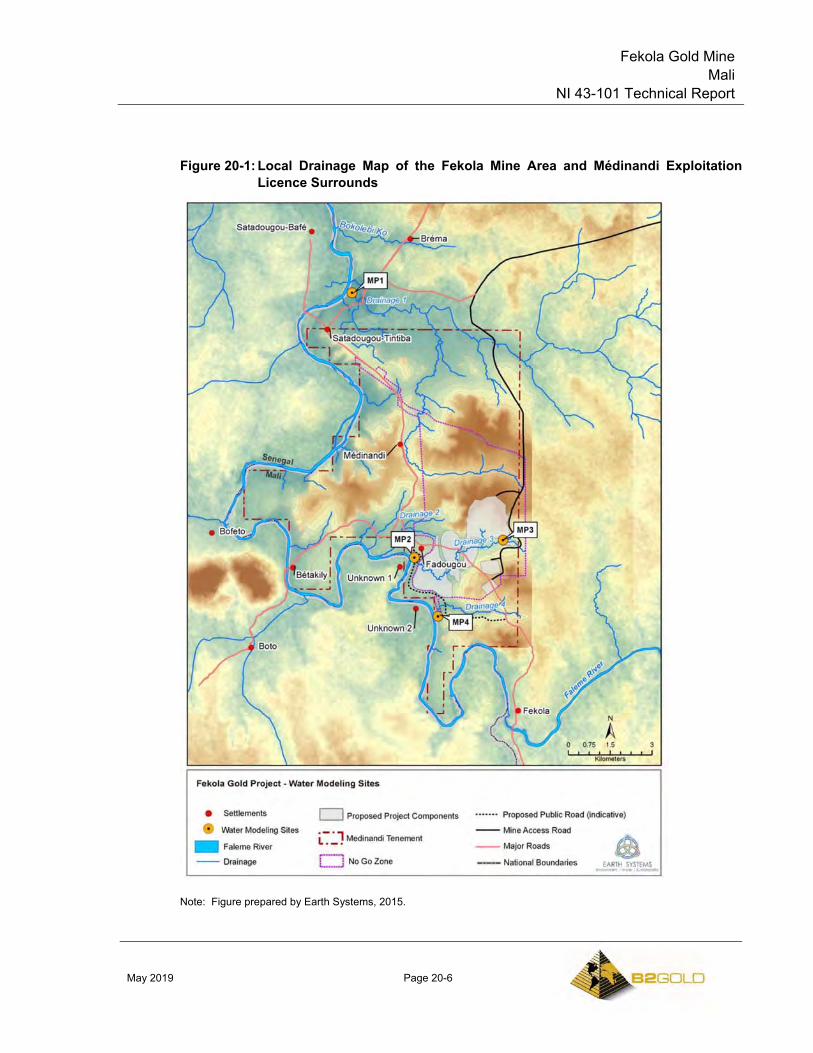
Fekola Gold Mine Mali
NI 43-101 Technical Report
May 2019 Page 20-6
Figure 20-1: Local Drainage Map of the Fekola Mine Area and Médinandi Exploitation Licence Surrounds
Note: Figure prepared by Earth Systems, 2015.
Fekola Gold Mine Mali
NI 43-101 Technical Report
May 2019 Page 20-7
Water quality of the Falémé River is generally good, with near neutral pH, low conductivity and low total metals concentrations. Exceptions to this include high total suspended solids (TSS) found locally in baseline studies at the monitoring site adjacent to Old Fadougou village. Groundwater is also generally of good quality. Groundwater is also generally of good quality. Exceptions include nitrate, metals (and metalloids) including iron and arsenic, and coliform concentrations exceeding applicable drinking water quality standards in community water drill holes (e.g., Tintiba, Médinandi, Old Fadougou, and New Fadougou). Such elevated concentrations in community water drill hole groundwater samples are likely to be associated with aquifer contamination from disposal of village and sewage wastes close to the village water drill hole.
Geochemical characterisation testwork indicated that the mine materials (waste rock, tailings, low-grade ore and construction materials) are likely to be non-acid forming and not likely to leach significant quantities of metals/metalloids to the receiving environment (Knight Piésold, 2015). Initial internal operational geochemical monitoring of mine materials confirms the previous characterization testwork.
Baseline air quality and noise in the vicinity of the Fekola Mine area are typical of rural areas in the region, and no major industrial sites are located nearby. Air quality is affected by sources such as dust from unpaved roads and Harmattan winds, burning, open cooking, livestock farming, and mining. Noise emissions in the vicinity of the Fekola Mine largely originate from human activity, primarily vehicle and motorcycle use on roads and pathways and artisanal mining, both domestic and wild animals, and insect activity. Baseline noise monitoring was undertaken during the wet season and has continued during operations. Baseline ambient (LAeq) daytime noise levels in Old Fadougou village were recorded to slightly exceed the IFC ambient daytime noise criterion of 55 dB(A), while night-time ambient noise levels were slightly below IFC criteria. Operational monitoring has indicated slight exceedances of IFC ambient daytime and night-time noise criteria.
20.3.2 Biological Setting
A Biodiversity Baseline Study and Impact Assessment was conducted by Epoch Resources in January 2013 for the Project’s 2013 ESIS. To supplement this information, aquatic ecology surveys in the vicinity of the Project were undertaken by INGRID S/C Groupe Sapiens International as part of the 2015 EISA Update, and several additional studies of priority habitats and species have been conducted by Earth Systems, as part of the 2015 ESIA Update and continuing into operations.
Additional priority habitats and species studies carried out within the Project region were included in Table 20-3. These additional studies provide supplementary ecological information to assist the Fekola Mine to better understand potential impacts to these environmental aspects and to adapt its mitigation and management measures if necessary.
Fekola Gold Mine Mali
NI 43-101 Technical Report
May 2019 Page 20-8
There are no protected areas within or near to the Fekola Mine area. The Fekola Mine is located in the western part of the West Sudanian Savannah ecoregion (1,638,426 km2). This broad ecoregion is covered by Sahelo-Sudanian/Sudanian vegetation consisting of savannah types, gallery forests, woodland and an understorey of shrubs, grasses and herbs. Vegetation is highly influenced by the two distinct seasons of the ecoregion; the hot/dry season and the wet season. The habitats in this ecoregion have been greatly reduced and fragmented by agricultural activities, fire, and timber harvesting, while populations of most of the larger mammal species have been decimated by overhunting.
The aquatic environments of the Fekola Mine are within the ‘Senegal-Gambia freshwater ecoregion’. This freshwater ecoregion consists of tropical and subtropical floodplains, rivers and wetland complexes. The Senegal–Gambia freshwater habitats are considered nationally important and are also considered ‘vulnerable’ due to existing threats.
One of the most important and influential ecological features in the vicinity of the Project is the Falémé River and its associated tributaries. The reach of the Falémé River directly downstream of the Fekola Mine is not within any protected areas and it is not protected itself. Seasonally-inundated wetlands are located in the Fekola Mine development area and surrounding areas, as well as along the Falémé River.
The main terrestrial habitat types within the Fekola Mine development area are tree savannah, shrub savannah, woody savannah, gallery forest, and bowal. All habitat types have moderate levels of disturbance. Signs of disturbance include land use changes (e.g. cultivation and grazing), timber harvesting, uncontrolled burning and artisanal mining. Some areas of gallery forest in the north of the Fekola Mine development area have been highly disturbed or cleared, while patches of gallery forest along the Falémé River are relatively intact.
Baseline and subsequent field studies have confirmed the presence of several priority species in the vicinity of the Fekola Mine. These species include the West African chimpanzee (IUCN listed as Critically Endangered), the hooded vulture (Critically Endangered) and the African lion (Endangered), and the hippopotamus (Vulnerable).
Three globally-vulnerable plants were also identified in the Project development area during field surveys: Afzelia africana, Khaya senegalensis, and Vitellaria paradoxa.
No globally-threatened aquatic flora or fauna was identified within the Falémé River in the initial dry season surveys conducted; however, there was high fish diversity recorded indicating that the river is in relatively good ecological condition. Along with many phytoplankton, zooplankton and macro invertebrates, the Nile crocodile (Crocodylus niloticus), and two endemic fish occur in the Falémé River near the Project development area: the freshwater rat-tail (Gymnarchus niloticus) and the African electric catfish (Malapterurus electricus).
Fekola Gold Mine Mali
NI 43-101 Technical Report
May 2019 Page 20-9
20.3.3 Social Setting
The following description of the Fekola Mine area social setting includes information collected during baseline study to the current date; however, at this time the village of Old Fadougou is in the process of being relocated, which will significantly alter this social setting. This relocation will greatly reduce potential negative impacts to the community members living in the village of Old Fadougou. Until the relocation is complete, the setting of and impacts to the village of Old Fadougou are still relevant as discussed here. Detailed information regarding the relocation of the village of Old Fadougou is presented in Section 20.4.4.
The rural landscape surrounding the Fekola Mine area is sparsely populated and mostly undeveloped. Kéniéba, the nearest sizeable town and the administrative headquarters of the prefecture, is located approximately 40 km north of the Project. The Project is situated within the Kéniéba gold belt, which contains a dense concentration of mineral exploration licences and several operational gold mines including Randgold’s Gounkoto and Loulo Projects and Endeavour Mining’s Tabakoto and Segala Projects.
There are 22 settlements identified within an approximately 10 km of the Fekola Mine area, including along the mine access road (Figure 20-2). Notably one large village (Old Fadougou) with a total of 1,355 people, and 255 households (per 2012 census), is located within 1 km of the Fekola Mine infrastructure. It has been observed that recent in-migration to this village is currently resulting in population increases.
Consistent with other parts of the region, the Malinke are the dominant ethnic group in Old Fadougou village, comprising more than 85% of the population. The Malinke language is the most common language in Old Fadougou, spoken by 47% of households, followed by Bambara (28% of households).
The major economic/livelihood activities in the communities surrounding the Fekola Mine are subsistence agriculture (farming and livestock) and artisanal mining (including some semi-industrial scale operations). Currently 13 artisanal mining sites have been identified in the permit area, 10 of which are active.
Internal migration is common in Mali, particularly in the gold mining areas of southwestern Mali.
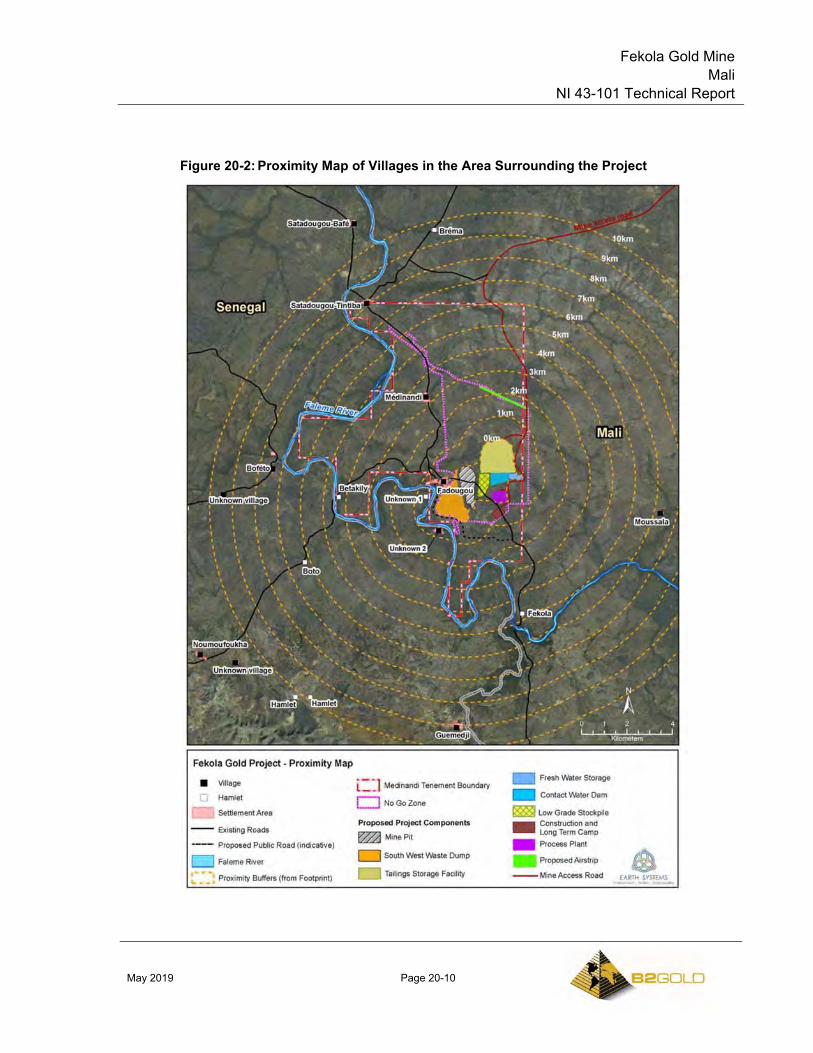
Fekola Gold Mine Mali
NI 43-101 Technical Report
May 2019 Page 20-10
Figure 20-2: Proximity Map of Villages in the Area Surrounding the Project
Fekola Gold Mine Mali
NI 43-101 Technical Report
May 2019 Page 20-11
Approximately 44% of the population in Old Fadougou village are below the age of 20 years old and 49% of the population were between 21 to 46 years old, representing 93.3% of the population (2012). The primary schooling rate for Kéniéba is 61%, whereby the schooling rate of the Old Fadougou village and surrounding villages is reported at 75% for the 2012 to 2013 year. There are primary schools in Old Fadougou and Médinandi; however, there are no secondary schools close to the Fekola Mine.
Health infrastructure in the vicinity of the Fekola Mine is limited. The nearest hospital to the Fekola Mine is located in Kéniéba. Old Fadougou has one Community Health Centre, one private clinic/infirmary and one pharmacy, while among the closest villages and hamlets, only Médinandi also has a private clinic. Malaria is common in the Kéniéba district. There are also other water and sanitation related illnesses due to poor sanitation and waste management standards. Nutritional issues contribute to health problems due to a shortage in some food supplies in the local area.
Authorities have stated in the past that the water supplies to the local villages surrounding the Fekola Mine were insufficient for the population, with three manual pump bores in Old Fadougou, and one in each of the other three closest villages. In 2018, B2Gold invested in 14 additional water drill holes with handpumps and one water tower to improve access to potable water significantly (i.e., potable water access now meets international standards) within all the villages of the Médinandi exploitation licence.
No electricity-related generation or distribution infrastructure is located in the local villages apart from privately-owned diesel generators used only for mining operations. Under the New Fadougou resettlement project (see Section 20.4.4), all the new houses built by B2Gold are equipped with solar panels.
Firewood is the most common form of energy used in the area for cooking and lighting. Accessibility in the area is generally poor, particularly in the wet season. Unformed dirt tracks connect villages and hamlets in the local area and provide access to Kéniéba. These are important transport routes for residents for employment, education and livelihood purposes; including the closest markets in Kéniéba or Kolomba. Two mobile telephone networks are available in most surrounding villages however internet is not accessible in the local villages.
There are no known sites of international or national archaeological or cultural heritage significance within the Fekola Mine area or surrounds. However, surveys identified 34 archaeological and cultural sites within the broad Médinandi exploitation licence area, including ancient habitats, scree mounds, iron reduction sites, worship sites, memorial sites, and a place of refuge. Several of these are located in the direct vicinity of the Fekola Mine footprint.
Fekola Gold Mine Mali
NI 43-101 Technical Report
May 2019 Page 20-12
20.4 Summary of Key Environmental and Social Potential Impacts
An initial assessment of potential environmental and social impacts from the development of the Fekola Mine was conducted as part of the 2013 ESIS. The 2015 ESIA Update improved and expanded this assessment applying a systematic and repeatable methodology of identifying the potential impacts arising from the development of the Fekola Mine and rating their significance. The potential impacts from the development of the Fekola Mine were evaluated for the construction, operations, and decommissioning/post-closure phases (the mine is currently in the operations phase and mitigation measures of potential impacts have evolved as the mine phases have advanced). The methodology for assessing the impact significance for each aspect includes the assessment of the receiving resource/receptor sensitivity and/or value, as well as evaluation of the impact magnitude associated with the proposed mine development under normal operating conditions, in order to determine an overall impact significance rating.
Potential risks associated with the proposed mine development were also assessed and discussed, as part of the impact assessment process. The assessment and discussion of potential risks associated with the Fekola Mine development was broadly aligned with internationally accepted risk assessment methodologies, such as ISO31000 Risk Management – Principles and Guidelines (2009) and ISO31010 Risk Management – Risk Assessment Techniques (2009).
The approach in the 2015 ESIA Update was to build on the existing assessment work conducted for the 2013 ESIS and to update the impact assessment to reflect modifications to the updated mine design and to align the assessment with relevant international standards. With the Fekola Mine currently in the operations phase, ongoing monitoring of both potential environmental and social impacts is utilized to continuously improve the Fekola Mine’s performance and further reduce residual impacts.
Wherever possible, environmental and social impacts were iteratively avoided or reduced throughout the 2015 ESIA Update process by making changes to the Fekola Mine design (e.g. movement of a road to avoid a key environmental feature). A key principle for the implementation of mitigation measures to reduce potential impacts is the mitigation hierarchy. As per IFC Performance Standard 1, adopting the mitigation hierarchy is to “to anticipate and avoid, or where avoidance is not possible, minimize, and, where residual impacts remain, compensate / offset for risks and impacts to workers, affected communities, and the environment.”
The application of the mitigation hierarchy is to implement a set of prioritised steps to avoid and minimise the potential impacts of the Fekola Mine to the extent practical, and compensate for residual impacts. The highest priority action is avoidance, while the lowest priority is providing offsets.
Fekola Gold Mine Mali
NI 43-101 Technical Report
May 2019 Page 20-13
Potential impacts were assessed for the various aspects characterized in the environmental and social baseline investigations discussed in Sections 20.4 and 20.5. Following the implementation of proposed mitigation measures and under normal operating conditions, identified potential impacts are not estimated to cause significant long-term, adverse impacts on receptors/the receiving environment. Key findings from the impact assessment included the following areas:
• Air quality;
• Water;
• Biodiversity;
• Access to land resources;
• Livelihood and employment;
• Social services/infrastructure.
Key findings related to these aspects are summarized briefly in the following sub-sections.
20.4.1 Air Quality
The Fekola Mine operations will result in fugitive particulate (i.e., dust) emissions (total suspended particulates (TSP), PM10 and PM2.5) and gaseous emissions from generators and vehicle exhaust pipes (diesel particulate matter, NO2 and SO2), with the key potential impact to receptors being fugitive particulate emissions.
The main source of particulate emissions at the Fekola Mine is fugitive dust from vehicle and mobile equipment operation, with crushing, drilling and blasting, and generator exhaust emissions contributing to a lesser extent. Impacts are expected to varying degrees to the surrounding flora and fauna and in the five communities in the immediate Project area; however, the greatest impacts would occur at the village of Old Fadougou due to its proximity to the mine.
Mitigation Measures and Residual Impacts
B2Gold has implemented a number of mitigation measures to reduce fugitive particulate concentrations at sensitive receptors (e.g., village of Old Fadougou). These measures include:
• Location of facilities/equipment that produce emissions away from sensitive receptors;
• Installation of filters, baghouses, screens, etc. where practical (e.g., metallurgical laboratory);
Fekola Gold Mine Mali
NI 43-101 Technical Report
May 2019 Page 20-14
• Water sprays on haul roads;
• Chemical suppression on haul roads;
• Water sprays at crushers;
• Water sprays at materials handling points;
• Water sprays on drill rigs;
• Relocating the village of Old Fadougou (B2Gold has decided to, and is currently in the process of, resettling the village of Old Fadougou (see Section 20.4.4 for additional details).
In addition, air quality monitoring of fugitive particulate and gaseous emissions is routinely conducted, and additional mitigation will be implemented if necessary, to ensure compliance with relevant guidelines. Post-closure, following the cessation of the majority of fugitive dust source activities and rehabilitation and revegetation of the Fekola Mine site, the residual long-term impacts from fugitive particulate emissions are expected to not be significant.
20.4.2 Hydrology, Hydrogeology and Water Quality
Potential hydrology, hydrogeology and water quality impacts of the Fekola Mine were initially considered in the 2013 ESIS. Design modifications such as locating the majority of the Fekola Mine infrastructure in a single catchment and significantly reducing abstraction (i.e., in most operating years abstraction will be zero) of water from the Falémé River were incorporated into the 2015 ESIA Update and resulted in a significant reduction in the potential hydrology, hydrogeology, and water quality impacts of the Fekola Mine.
Hydrology
During operations, impacts to the local surface water hydrology are considered minor to moderate. Three ephemeral creeks in the vicinity of the Fekola Mine (drainages 2, 3, and 4) are impacted during the rainy season. A significant decrease in flows for drainage 3 occurs downstream of the Fekola Mine footprint with the diversion of water around the lower reaches of this catchment (to drainage 2 currently in early operations and the lower reaches of drainage 4 for the remainder of the operations phase), and capture of surface water run-off within the TSF, contact water storage pond, and fresh water storage pond. Water is released from the various ponds throughout the year, resulting in varying flows in the mine diversion channel, the lower reaches of drainage 4 and the release of water to the Falémé River during the current operations phase.
Impacts to regional hydrology (e.g. the Falémé River) were expected to be negligible during both construction and operations as water abstraction from the Falémé River has
Fekola Gold Mine Mali
NI 43-101 Technical Report
May 2019 Page 20-15
been and will continue to be minimal (i.e., abstraction occurred prior to commissioning the Fekola Mine but has since reduced to zero) and drainage 3 represents less than 0.1% of the total catchment for the Falémé River at its point of intersection (i.e. at Old Fadougou). Additional flows, released to the Falémé River from either of the storage water ponds, are negligible compared with the median seasonal flow of the Falémé River (i.e. mostly less than 1% of the Falémé River flow). In the event that future water abstraction from the Falémé River is required to supplement Fekola Mine water supply, a minimum environmental flow will need to be established, below which the Fekola Mine will not abstract water, in order to protect downstream water use, and base aquatic ecology.
Post-closure impacts to local surface water hydrology in the Fekola Mine area are considered minor, with primarily only the lower reaches of one creek (Drainage 3) affected.
Water Quality
The primary impact to surface water quality during operations is from suspended sediments generated from land clearing/earthworks, unsealed road surfaces, and similar. The majority of sediment loading results from water erosion of disturbed areas during the wet season. Water courses most affected by suspended sediments are drainage 3 and, to lesser extent, drainages 2, 4 and the Falémé River. Overall, water quality impacts during construction were moderate and have improved now that the Fekola Mine has moved to operations.
Progressive rehabilitation has commenced (in very early stages) on the site and erosion and sediment control measures have been established, reducing suspended sediment water quality impacts from the construction phase. Static geochemical testwork indicates that the geochemical risk associated with the waste rock, tailings and pit wall rock is low, with no net generation of acidic drainage expected and leachate expected to contain only low dissolved metals concentrations. Additional geochemical testwork is being conducted to further characterise potential geochemical impacts.
Process water is not discharged from site during operations and is recycled from the TSF supernatant pond to the process plant. Cyanide concentrations in the TSF supernatant pond are maintained below 50 mg/L weak acid dissociable (WAD) cyanide via cyanide destruction (INCO process) in the tailings liquor, levels protective of wildlife (per ICMI guidelines, e.g. birdlife attracted to a water body) and livestock that may access the TSF. Surface water run-off from the pit, WRSFs (if water quality requires), low-grade ore stockpile and process plant will be managed through the contact water storage pond. The fresh water storage pond captures upstream surface water run-off and pit dewatering from the dewatering bores. The contact and fresh water storage ponds discharge water to the receiving environment during the wet season. Water
Fekola Gold Mine Mali
NI 43-101 Technical Report
May 2019 Page 20-16
quality is routinely monitored and water is only to be discharged once the applicable discharge standards are met.
Rehabilitation and established erosion and sediment control measures are expected to reduce suspended sediment water quality impacts post-closure. However, there may be increased suspended sediment concentrations in downstream water quality at decommissioning associated with rehabilitation earthworks.
One-off treatment of water bodies (e.g. TSF supernatant pond, contact water storage pond and fresh water storage pond), if required, prior to discharge to the environment at decommissioning/mine closure is expected to minimise potential water quality impacts associated with the release of these waters.
Groundwater
A groundwater cone of depression, surrounding the open pit, has begun to develop during operations associated with the dewatering of the pit to allow for mining operations below the groundwater table. The ultimate extent of the groundwater cone of depression is expected to be greater than 2.5 km from the edge of the pit, in a north–south direction. The village wells for Old Fadougou and Médinandi are within the zone of groundwater level drawdown, and groundwater levels in the vicinity of these two villages are expected to decrease by greater than 10 m. Groundwater level drawdown is being monitored and alternative water supplies will be identified and provided for Old Fadougou and Médinandi villages in the event that water supply from the village wells is interrupted. In addition, the Old Fadougou village is currently being relocated to New Fadougou village, removing this community from these potential impacts to groundwater.
Rehabilitation of the TSF at decommissioning, including treatment of the TSF supernatant pond at decommissioning, is expected to minimise the potential for residual impacts. The pit is expected to act as a sink for any seepage from the TSF. Estimates of post-closure pit lake water quality indicate that water will meet relevant water quality standards. Monitoring of surface and groundwater post-closure will be implemented to determine whether additional measures are required to avoid post-closure impacts to water quality.
Post-closure, groundwater levels are expected to rebound after the cessation of pit dewatering. Groundwater levels are expected to take approximately 55 years after closure to reach equilibrium as the pit lake reaches its capacity. Groundwater level impacts post-closure are expected to be far lower than during operations. However, residual groundwater level impacts post-closure need to be quantified during operations.
With the implementation of the detailed water management and monitoring program for Fekola Mine, the potential water quality and hydrology impacts and risks from the mine and subsequent impacts on water use will be greatly reduced. B2Gold has implemented or will still implement a number of significant measures to ensure any unavoidable
Fekola Gold Mine Mali
NI 43-101 Technical Report
May 2019 Page 20-17
impacts of the Fekola Mine on water use are compensated for. These could include a household latrine building programme, developing an institutional support programme to establish or strengthen community hygiene committees in Fekola Mine-affected villages, and construction of potable water infrastructure in key villages.
20.4.3 Biodiversity
A number of priority biodiversity features (including threatened and protected species) that have been or will be impacted by mine development have been identified in the Fekola Mine area. There are no identified Protected Areas in the vicinity of the Fekola Mine. Key potential adverse impacts to biodiversity are presented in the following sub-sections.
Terrestrial Flora
The most significant adverse potential impacts on terrestrial habitat and flora as a result of the Fekola Mine are or are expected to be:
• Habitat loss and associated degradation;
• Potential loss of individual stems of priority flora;
• Over exploitation of natural resources and poaching due to in-migration.
Terrestrial Fauna
The principal potential impacts on terrestrial fauna as a result of the Fekola Mine are or are expected to be:
• Habitat loss and associated degradation – natural habitats will be removed for Project components and roads;
• Barriers to movement from the clearance of habitat and construction of the Project components;
• Noise and vibration;
• Vehicle collisions;
• Drinking contaminated water (e.g. from the TSF);
• Light spills.
Aquatic Habitats and Fauna
The principal potential impact to aquatic biodiversity for the Fekola Mine relate to potential physical impacts on hydrology and water quality. Other potentially significant impacts include direct habitat loss and degradation associated with the location of the

Fekola Gold Mine Mali
NI 43-101 Technical Report
May 2019 Page 20-18
Fekola Mine footprint, and increased pressure on aquatic resources from Fekola Mine-related population increases.
Mitigation Measures and Residual Impacts
Throughout the Fekola Mine operations, B2Gold will implement numerous mitigation measures including commitments identified in the 2013 ESIS, requirements of the existing Environmental and Biodiversity Performance Standards (2014) relevant to all B2Gold operational mines, and others. A summary of key mitigation measures is presented as follows:
• Several additional, targeted ecological studies of terrestrial flora and fauna and aquatic habitats and fauna have been conducted to increase knowledge about species presence in the area. Additional study will continue to be carried out in the future;
• A Biodiversity Strategy Framework, Biodiversity Action Plan (BAP) and Biodiversity Monitoring Plan have been developed to (refer to Section 20.5.6). The BAP is currently in the process of being updated to incorporate the latest biodiversity findings and changes to the Fekola Mine;
− A key component of this BAP is environmental awareness and training programs that have begun within the communities aimed at minimising the impacts on flora and fauna;
• Eradication programs will be considered with regards to pest flora and fauna species if they become necessary;
• Where the operation of mobile machinery can impact wildlife, control measures are developed, implemented and monitored to reduce injury or mortality. Control measures include fencing of impacted areas or lease boundaries, reducing speed limits, installation of wildlife corridors and training and awareness of employees and contractors;
• Site procedures:
− Prohibit unauthorised hunting, trapping or fishing or the unauthorized harvesting of forest products;
− Minimise and/or restrict access to designated areas;
• Prior to vegetation clearance, ‘animal scaring’ activities will be conducted to reduce and minimize loss of fauna individuals during the removal of vegetation. This will include rescue of vulnerable individuals, such as females with cubs or nests with chicks, and their transfer to suitable sites for further release;
Fekola Gold Mine Mali
NI 43-101 Technical Report
May 2019 Page 20-19
• Biodiversity monitoring programs have been developed and implemented. These monitoring programs include the monitoring of potential or actual adverse biodiversity impacts (e.g. sensitive or protected areas) and the effectiveness of implemented control measures;
• The measures included in the Rehabilitation and Preliminary Mine Closure Plan, included concurrent rehabilitation, have been implemented in their initial phases. The site will be rehabilitated and revegetated concurrently during operations to the extent practical and fully at closure to restore impacted flora and habitats and provide self-sustaining natural ecosystems within the Project development area (refer to Section 20.7).
In addition to the measures described above, given the potential impacts of the Fekola Mine on a number of priority biodiversity features, B2Gold has considered and continues to evaluate providing biodiversity offsets for the Project. The decision to implement biodiversity offsets is dependent to a large degree on the potential outcomes and the feasibility of such measures within Mali.
Potential impacts to biodiversity during construction and operations are expected to be moderate, however, with the implementation of proposed mitigation measures including the rehabilitation and revegetation of the Fekola Mine site following mine closure the expected residual long-term impacts are expected to not be significant.
20.4.4 Access to Land Resources
The communities in the Fekola Mine area rely on land resources to make a subsistence living, primarily via small scale farming and/or artisanal mining activities. The community most significantly impacted is the village of Old Fadougou. The Fekola Mine’s No-go Zone has isolated the village and reduced livelihood options for the community.
As a result, the village of Old Fadougou, at its present location, could face significant impacts relating to land resource access that could worsen due to continued influx of people to the area.
To reduce these potential impacts, B2Gold has engaged with the community members and government and commenced with the resettlement of the village of Old Fadougou (described in the following sub-section).
Resettlement of the Village of Old Fadougou
Although the relocation of the village was not a requirement of the Mine Construction Permit, Mining Permit or Mine Environmental Permit, extensive engagement with government and community stakeholders led to a decision to proceed with the resettlement of the village of Old Fadougou. This decision was made due to the proximity of the village to the mine site, the potential for social, safety and environmental
Fekola Gold Mine Mali
NI 43-101 Technical Report
May 2019 Page 20-20
risks (e.g. eliminate potential safety risks such as fly rock and air blast, greatly reduce the risk of vehicle and equipment interactions, and minimize potential environmental impacts such as fugitive dust and noise) and the opportunity to improve the well-being of the community. A Resettlement Action Plan (RAP) and a resettlement-specific ESIA were developed according to international best practice and were approved by national authorities.
Impacts identified through the ESIA and the RAP include potential impacts on land use and inter-community conflict: these are being managed through the implementation of the Local Convention on Natural Resource Management, which establishes bylaws for land use and natural resource management. Village and area committees have been created and formalized to address any conflicts that arise. The Local Convention on Natural Resource Management has been approved by the Mayor of Kéniéba via Deliberation No 18-01/CR-KBA.
The resettlement process started in 2015 with the initial baseline collection (socio-economic and asset surveys), and has been implemented in compliance with Malian law and in line with international best practices, i.e. IFC Performance Standard 5: Land Acquisition and Involuntary Resettlement.
From 2015 to date, baseline data collection, assessment, planning, engagement and consultation activities have occurred including, among others, definition of the location and house design as well as the validation of the compensation framework. Key activities and decisions have been discussed and agreed in the Community Resettlement Committee (CCR in its French acronym), a multi-stakeholder committee created to inform the planning process with representation from a range of stakeholder groups including original village members, youth, women, and in-migrants, along with the support and participation of local authorities. The CCR has been created and approved by the Prefecture of Kéniéba via Decision No. 34, May 02, 2016.
Signing of agreements and compensations began in January 2019 and are currently ongoing. The construction of the New Fadougou village has been completed and the physical relocation of the families started in April 2019.
Livelihood and Employment
The development of the Fekola Mine contributed to a significant impact on the opportunity for paid employment and other forms of livelihood in the Fekola Mine area, via both direct employment by the Fekola Mine and jobs created in the communities due to the overall increased economic activity in the area. In general, these impacts are positive, however, the local residents in the communities surrounding the mine have little formal work experience, a general low level of relevant skills, and there are not sufficient available jobs to employ all the locals in search of work. If not managed properly, it is possible that the potential positive impacts of employment will not be fully appreciated
Fekola Gold Mine Mali
NI 43-101 Technical Report
May 2019 Page 20-21
in the Fekola Mine area. To this extent B2Gold has implemented a number of measures to ensure potential positive impacts are maximized throughout the life of the mine, including:
• Recruitment of employees based on the following criteria:
− Malian nationals, who possess the required skills and abilities; − Candidates over 18 years old, and − Current local residents and returning local residents, in preference over job
seekers who have recently arrived in the area;
• B2Gold has jointly-funded with the Government of Canada (Global Affairs Canada) the Adéquation Formation-Emploi dans le Cèrcle de Kéniéba (AFECK) project with the objective of improving technical and professional skills of Kéniéba region residents to meet the needs of the labour market;
• B2Gold has provided training to the workers involved in the construction and now operation of the mine in order to increase their skills and to prepare them for potential employment with the mine during the operations.
In addition to measures aimed at maximizing direct employment positive impacts in the Fekola Mine area, B2Gold has also developed pilot projects to promote local associations and cooperatives of farmers to increase to provide goods and services to the extractive and other sectors. The AFECK project also has an entrepreneurial component the reinforce the capacity of small business in the area.
Following closure of the Fekola Mine, economic activity and direct employment will most likely fall compared to operations. There is the potential that this reduction in activity leads to negative impacts associated with unemployment and loss of business; however, with successful implementation of sustainable community development initiatives throughout the life of the Fekola Mine and additional community development initiatives specifically targeted at the post-closure period it is expected that potential negative long-term impacts can be minimized and that the overall impact of the Fekola Mine will be positive.
20.4.5 Social Services/Infrastructure
The population of the five communities in the Fekola Mine area was estimated in 2012 to be 2,458 people. With the development of the Fekola Mine and construction of the mine the population is estimated to be 8,007 in 2018. In general, the communities in the Fekola Mine area have limited education, health care, and sanitation services, as well as poor infrastructure (roads, access to electricity, etc.) and not a high level of available goods and services. The in-migration due to the development of the Fekola Mine and its subsequent impacts on the communities in the Fekola Mine area can have potentially positive and/or negative impacts such as:
Fekola Gold Mine Mali
NI 43-101 Technical Report
May 2019 Page 20-22
• Stimulating the local economy and community organization. Wages and salaries will be injected into the local economy creating additional jobs and economic opportunities;
• Developing informal settlements which increase demand/need for basic infrastructure; e.g. land, housing, clean water supplies, sanitation, and electricity and waste management systems;
• Increasing pressure on government services such as health and education facilities, their staffing, and capital and operating cost requirements;
• Increasing incidence of social ills including alcoholism, drug abuse, prostitution, and criminality;
• Increasing incidence of disease such as sexually transmitted diseases including HIV/AIDS and tuberculosis.
If realized, the above potential impacts can have severe negative consequences that can last beyond the life of the Fekola Mine. To mitigate these potential negative impacts and ensure that the communities in the Fekola Mine area have an enhanced, sustainable economy following mine closure, B2Gold has been and will keep investing in improving infrastructure, education, health care, and other economic programs to promote sustainability. The 2018 Community Development Plan (2018 CDP; refer to Section 20.5.8) will enhance the promotion of sustainable community development opportunities in the Fekola Mine area. To be successful these efforts must be carefully co-ordinated with those of local government and the community through planned engagement and public-private partnerships. B2Gold has been engaging with local communities and other stakeholders through different informal activities and formal forums, such as the Community Resettlement Committee (CCR), Community Relations Committee (CRC) and the Local Committees for Natural Resources Management. Annual town-hall style meetings are held in local communities to ensure we are proactively sharing our understanding of our impacts and how they are being managed with stakeholders. B2Gold has also implemented an effective grievance mechanism that receive, investigate and respond to complaints from community stakeholders. B2Gold will keep ensuring the implementation of further engagement measures outlined in the Stakeholder Engagement Plan (SEP; refer to Section 20.5.7), including identifying Fekola Mine stakeholders, ensuring timely and effective communication between the Project site and affected stakeholders throughout the life of the Fekola Mine, documenting meaningful Fekola Mine consultation and disclosure and monitoring and reporting upon the performance of stakeholder engagement processes.
With the successful implementation of the measures outlined in the 2018 CDP and SEP, is expected that potential negative long-term impacts on social services and
Fekola Gold Mine Mali
NI 43-101 Technical Report
May 2019 Page 20-23
infrastructure can be minimized and that the overall impact of the Fekola Mine will be positive.
20.5 Environmental and Social Management and Monitoring Plans
An Environmental and Social Management Plan was developed as part of the 2013 ESIS that documented the proposed mitigation and control measures designed to meet Fekola Mine regulatory requirements and reduce potential impacts from the proposed Project to acceptable levels. This Environmental and Social Management Plan has been updated to account for optimization and modification of the Project and a corresponding Environmental and Social Management and Monitoring Plan (ESMMP) has been developed as part of the 2015 ESIA Update. This ESMMP is supported by a number of individual Management Plans (MPs) that describe how the site meets relevant regulations, standards and guidelines and manages and minimizes key environmental and social risks of the Fekola Mine. The ESMMP and its supporting individual MPs are “living documents” which are amended periodically throughout the life of the Fekola Mine to reflect changes in procedures, practices, Fekola Mine phase, and etc.
The following Management Plans are in place at the Fekola Mine:
• Environmental Monitoring Plan;
• Water Management Plan;
• Waste Management Plan;
• Rehabilitation and Preliminary Mine Closure Plan;
• Emergency Preparedness and Response Plan;
• Biodiversity Action Plan;
• Biodiversity Monitoring Plan;
• Stakeholder Engagement Plan;
• Community Development Plan.
20.5.1 Environmental Monitoring Plan
The Environmental Monitoring Plan (EMP) continues to build upon the environmental database that was generated to characterize baseline conditions for the 2013 ESIS and the 2015 ESIA Update. Ongoing environmental monitoring programs continue to document site conditions, allowing for the evaluation of the environmental performance of specific project components. The EMP covers data collection of the following environmental aspects:
• Meteorology;
Fekola Gold Mine Mali
NI 43-101 Technical Report
May 2019 Page 20-24
• Air quality;
• Noise and vibration;
• Water;
• Geochemistry of mine materials;
• Biodiversity.
20.5.2 Water Management Plan
The Water Management Plan (Water MP) outlines the strategies, operational controls and management practices to effectively manage water at the Project site. The Water MP includes water quality objectives, describes site water balances, and defines process water, stormwater, discharges and dewatering activities to ensure that human health and the environment are protected.
20.5.3 Waste Management Plan
The Waste Management Plan (Waste MP) details the handling, storing, and disposing of non-process wastes (i.e., excluding waste rock, ore and tailings) that are generated by Fekola Mine activities, including the mining operations, process plant, workshop, offices, TSF and other facilities.
Non-process waste streams generated at the Fekola Mine include the following:
• Hazardous wastes (waste oils, solvents, laboratory wastes, and medical wastes);
• Domestic wastes (inert wastes such as plastic, glass, and construction materials);
• Organic wastes (food and plant material).
The Waste MP details the handling, storing, and disposing of non-process wastes (i.e., excluding waste rock, ore and tailings) that are generated by Fekola Mine activities, including the mining operations, process plant, workshop, offices, TSF and other facilities. The Waste MP also addresses the management of wastes designated for special handling including hazardous, medical, and emergency response wastes and sewage as well as the minimization of waste through composting and recycling programs.
20.5.4 Rehabilitation and Preliminary Mine Closure Plan
A Rehabilitation and Preliminary Mine Closure Plan (RMCP) has been developed (in 2015 as part of the 2015 ESIA Update, see Sections 20.1 and 20.2) as the first step in providing a clear methodology for progressive rehabilitation and planning for decommissioning and closure of the Fekola Mine. The aim of the RMCP is to provide a conceptual rehabilitation and closure framework that will be refined throughout the life
Fekola Gold Mine Mali
NI 43-101 Technical Report
May 2019 Page 20-25
of the Fekola Mine to ultimately achieve mine closure. B2Gold’s overall objective for mine closure is to prevent or minimise adverse long-term environmental, physical, social and economic impacts for the greater Fekola Mine area and to create stable landforms that provide self-sustaining natural ecosystems within the Fekola Mine development area.
20.5.5 Emergency Preparedness and Response Plan
The Emergency Preparedness and Response Plan (EPRP) outlines the processes implemented at the Project for responding to on-site emergencies, including accidental spills and releases, fires, explosions, medical and other emergencies. It is designed to minimize employee exposure to risk and injury and limit potential impacts to the environment in emergency situations.
The EPRP identifies training programs for emergency recognition and prevention, methods and procedures for alerting on-site employees, resources for medical and emergency treatments, and procedures for containment and clean-up of accidental spills.
20.5.6 Biodiversity Action Plan
A number of priority species have been identified in the vicinity of the Project that may potentially be impacted by the Fekola Mine. A B2Gold Mali Biodiversity Strategy Framework has been developed that details the biodiversity management strategy, systems and actions for B2Gold’s operations within Mali to ensure compliance with Corporate and statutory biodiversity requirements. A Biodiversity Action Plan (BAP) and supporting Biodiversity Monitoring Plan was implemented in 2018 incorporating the findings from the various specialist biodiversity studies conducted in the past several years (refer to Sections 20.3 and 20.4).
The objective of the BAP is to avoid and minimise potential residual impacts on Fekola Mine area biodiversity wherever feasible. The BAP outlines specific mitigation measures to be implemented at the site and outlines further studies required to reduce current ecological uncertainties associated with threatened flora and fauna at the Fekola Mine site. The BAP is currently in the process of being updated to incorporate additional information (e.g., from external and internal study/monitoring) and to reflect the current status of the Fekola Mine).
20.5.7 Stakeholder Engagement Plan
Experience has demonstrated that projects that establish early and ongoing stakeholder engagement processes that continue throughout the life of the project have a greater rate of success, as well as reduced business risk. B2Gold has prepared a SEP with the description about the collection and dissemination of information to people who are affected by and/or interested in the Fekola Mine would happen. The SEP is being
Fekola Gold Mine Mali
NI 43-101 Technical Report
May 2019 Page 20-26
updated in 2019 to better reflect the engagement needs to establish the basis for how B2Gold should conduct its business with the community to ensure transparency in Project activities as they may affect stakeholders. The updated SEP will describe specific measures to identify Fekola Mine stakeholders, ensure timely and effective communication between the Fekola Mine site and affected stakeholders throughout the life of the project, document meaningful Fekola Mine consultation and disclosure, document the grievance process, and monitor and report upon the performance of stakeholder engagement processes.
20.5.8 Community Development Plan
B2Gold recognizes that a community development program is essential in ensuring that local communities do not become dependent on the mining economy, but rather have an enhanced, sustainable economy following mine closure. B2Gold has been investing to improve infrastructure, education, health care, and other economic programs to promote sustainability in the mine area. The 2018 CDP has been developed in a participative approach with communities and authorities and presents the framework to promote sustainable community development opportunities in the Fekola Mine area.
20.6 Closure Plan
B2Gold’s overall objective for mine closure is to prevent or minimise adverse long-term environmental, physical, social and economic impacts for the greater Fekola Mine area and to create stable landforms that provide self-sustaining natural ecosystems within the Fekola Mine development area. A Rehabilitation and Preliminary Mine Closure Plan (RMCP) has been developed as the first step in providing a clear methodology for progressive rehabilitation and planning for decommissioning and closure for the Fekola Mine. The aim of the RMCP is to provide a rehabilitation and closure framework that will be refined throughout the life of the Project to ultimately achieve mine closure.
Ongoing refinement of the RMCP will require community consultation regarding intended end postmining land use for the Fekola Mine development area and development of the methodology for clearly defining success or failure of rehabilitation (completion criteria). In subsequent versions of the RMCP, B2Gold will develop a consistent approach to performance monitoring and identify maintenance and/or remedial measures required for rehabilitation that promote the achievement of completion criteria to avoid or minimise residual impacts to the satisfaction of Fekola Mine stakeholders.
Concurrent rehabilitation will be conducted during the life of the mine to the extent practical to minimize impacts and lower the environmental liability at closure. These rehabilitation measures are currently in their initial stages, focused on test plot and pilot programs to establish successful rehabilitation techniques and refine specific
Fekola Gold Mine Mali
NI 43-101 Technical Report
May 2019 Page 20-27
rehabilitation objectives and success criteria. In 2018, trial testing of approximately 8 ha of disturbed land were rehabilitated, including final slope contouring and revegetation.
B2Gold prepares and updates annually the Asset Retirement Obligation cost estimate of the Fekola Mine. Costs are provided by B2Gold and its consultants and contractors, or where costs are not available supplemental costs are used from other sources including similar mining projects. Closure costs are estimated annually as of the end of the calendar year. Closure costs at the end of the mine life will differ. Concurrent rehabilitation is in the preliminary stages at the Fekola Mine and will be conducted during the life of the mine to the extent practical to minimize impacts and lower the environmental liability at closure; however, the bulk of the rehabilitation and closure costs are not expected to be incurred until the cease of operations. If the mine were to close prior to the expected end of mine life, the bulk of the closure costs would be incurred at this time.
The estimated Asset Retirement Obligation cost estimate for the Fekola Mine as of 31 December 2018 is approximately $32.1 M. This estimate was generated subsequent to the development of the total reclamation and closure capital cost estimate of $28.7 M that was used in the 2018 LOMP.
The 2012 Mining Code requires mining companies to post financial security for costs associated with the mine reclamation and long-term protection of the environment relating to potential impacts from the Fekola Mine. B2Gold has reached an agreement with the Malian government to fund an escrow account based on a production basis (i.e. per tonne of material processed), and there will be an accompanying escrow agreement on how and when the funds can be used or released based on the site’s evolving reclamation status and environmental liability.
20.7 Permitting
Various permits and authorizations are required for the Fekola Mine. The following sub-sections provide a brief summary of the status of key permits.
20.7.1 Environmental Permit
The environmental permit for the Fekola Mine was granted to Songhoi by the Ministry of Environment and Sanitation via Decision No. 2013-0033MEA-SG on 29 April 2013. The permit required that Songhoi began construction of the Fekola Mine within three years of the issue of the permit. Songhoi began construction of the Fekola Mine in 2015. The permit also allows the government to perform an environmental audit of the Project every five years. In August 2018, the government performed the first of these environmental audits and renewal of the environmental permit was received on 14 March 2019. A recommendation from the audit was that B2Gold submit the 2015 ESIA Update for regulatory approval. The 2015 ESIA Update was submitted in early 2019 and approval
Fekola Gold Mine Mali
NI 43-101 Technical Report
May 2019 Page 20-28
of the 2015 ESIA Update is expected in May or June 2019. The 2015 ESIA Update will then serve as the documentation of record for the Fekola Mine. The environmental permit should remain unchanged.
The permit also includes six clauses with conditions/requirements relating to the following:
• Air quality;
• Soil conservation;
• Surface water and groundwater quality;
• Noise and safety;
• Cultural heritage;
• Land appropriation.
20.7.2 Environmental Permit for Access Road
A second environmental permit, for the access road from the Millennial Highway near Sekondo village to the mine site, was granted to Songhoi by the Ministry of Environment and Sanitation via Decision No. 2015-0002MEADD-SG on 16 March 2015. Similar to the environmental permit approval for the Fekola Mine, the access road approval required that the road be constructed within three years of the issue of the permit and allows the government to perform an environmental audit of the access road every five years. Construction of the access road commenced in 2015.
The access road permit requires that the requirements of the Fekola Mine main environmental permit be met, as well as five clauses specific to this authorization relating to:
• Air quality;
• Soil conservation;
• Surface water and groundwater;
• Health, safety, employment and quality of life;
• Cultural heritage.
B2Gold has engaged in a process of restitution to return control of the access road to authorities. Once this process is complete, the permit renewal process and/or permit clauses may change; however, B2Gold does not anticipate any changes to have a material impact on the Fekola Mine.
Fekola Gold Mine Mali
NI 43-101 Technical Report
May 2019 Page 20-29
20.7.3 Mining Permit
The mining permit for the Fekola Mine was granted to Songhoi by the Secretary General via Decree No. 2014-0070/PM-RM, dated 13 February 2014, and signed by the Minister of Mines and the Prime Minister of Mali. The permit is valid for 30 years and can be renewed for successive 10-year periods until the Mineral Reserves are depleted.
20.7.4 Approval of Community Development Plan
As part of the ESIA process, the Fekola Mine was required to submit a CDP for approval. A CDP, dated 24 June 2013, was submitted to the Ministry of Land Administration, Decentralization and Regional Planning and approved by the Kéniéba Prefect authorities via Decision No. 13-041/PCK, dated 04 July 2013.
The National Mining Code requires mining companies to produce a multi-year CDP upon commencement of production, including the establishment of a Local Development Committee. B2Gold developed an updated CDP in 2018 in collaboration with local communities and authorities. The 2018 CDP was approved by the Prefecture of Kéniéba via Decision No. 2018-146/PCK.
20.7.5 Approval of Mine Closure Plan
As part of the process for the granting of an exploitation licence under the 2012 Mining Code, the Fekola Mine is required to submit a mine closure plan. A mine Conceptual Closure Plan, dated April 2013, was submitted to the Ministry of Mines as part of the exploitation licence application. By granting the Médinandi exploitation licence to Songhoi, the Ministry of Mines and the government of Mali approved all documents submitted in support of the exploitation licence application including the submitted Conceptual Closure Plan.
The 2015 ESIA Update documentation contains an updated Rehabilitation and Preliminary Mine Closure Plan (RMCP), dated September 2015. Once the 2015 ESIA Update is accepted by regulatory authorities, the updated RMCP will serve as the approved document of record.
20.7.6 Additional Permits and Authorizations
Several additional permits and authorizations are required for the Fekola Mine. A brief summary of these permits is presented in Table 20-4.
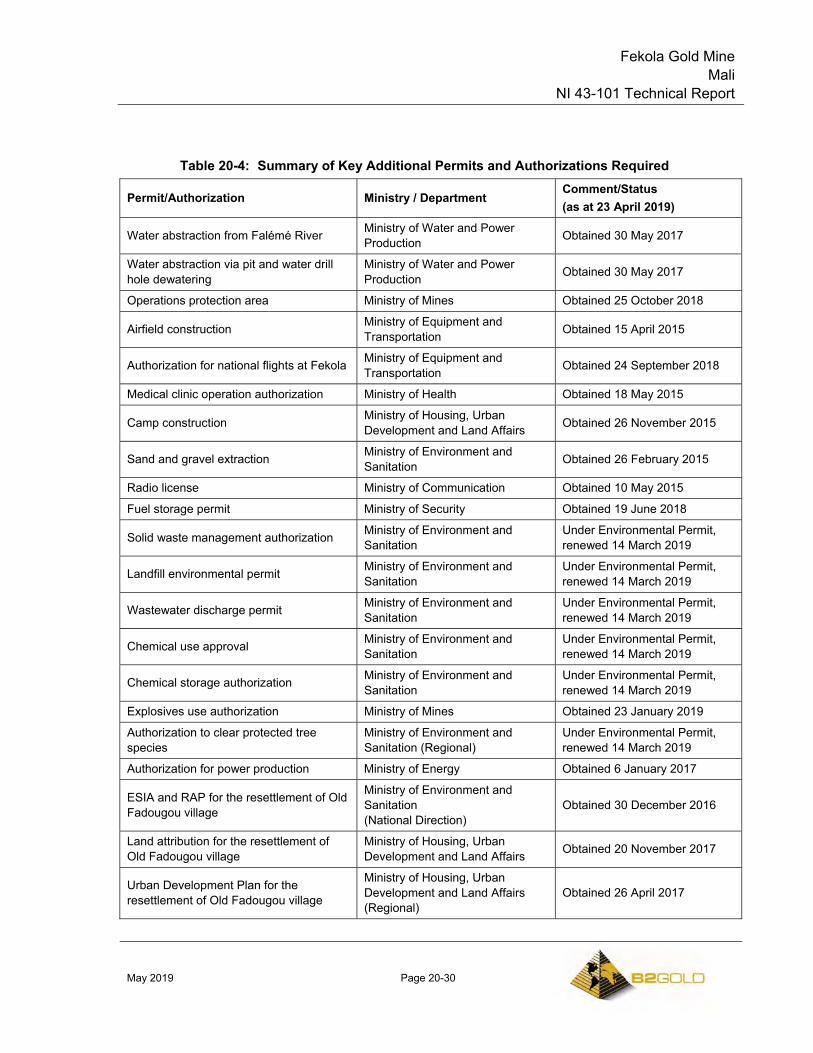
Fekola Gold Mine Mali
NI 43-101 Technical Report
May 2019 Page 20-30
Table 20-4: Summary of Key Additional Permits and Authorizations Required
Permit/Authorization Ministry / Department Comment/Status (as at 23 April 2019)
Water abstraction from Falémé River Ministry of Water and Power Production Obtained 30 May 2017
Water abstraction via pit and water drill hole dewatering
Ministry of Water and Power Production Obtained 30 May 2017
Operations protection area Ministry of Mines Obtained 25 October 2018
Airfield construction Ministry of Equipment and Transportation Obtained 15 April 2015
Authorization for national flights at Fekola Ministry of Equipment and Transportation Obtained 24 September 2018
Medical clinic operation authorization Ministry of Health Obtained 18 May 2015
Camp construction Ministry of Housing, Urban Development and Land Affairs Obtained 26 November 2015
Sand and gravel extraction Ministry of Environment and Sanitation Obtained 26 February 2015
Radio license Ministry of Communication Obtained 10 May 2015
Fuel storage permit Ministry of Security Obtained 19 June 2018
Solid waste management authorization Ministry of Environment and Sanitation
Under Environmental Permit, renewed 14 March 2019
Landfill environmental permit Ministry of Environment and Sanitation
Under Environmental Permit, renewed 14 March 2019
Wastewater discharge permit Ministry of Environment and Sanitation
Under Environmental Permit, renewed 14 March 2019
Chemical use approval Ministry of Environment and Sanitation
Under Environmental Permit, renewed 14 March 2019
Chemical storage authorization Ministry of Environment and Sanitation
Under Environmental Permit, renewed 14 March 2019
Explosives use authorization Ministry of Mines Obtained 23 January 2019
Authorization to clear protected tree species
Ministry of Environment and Sanitation (Regional)
Under Environmental Permit, renewed 14 March 2019
Authorization for power production Ministry of Energy Obtained 6 January 2017
ESIA and RAP for the resettlement of Old Fadougou village
Ministry of Environment and Sanitation (National Direction)
Obtained 30 December 2016
Land attribution for the resettlement of Old Fadougou village
Ministry of Housing, Urban Development and Land Affairs Obtained 20 November 2017
Urban Development Plan for the resettlement of Old Fadougou village
Ministry of Housing, Urban Development and Land Affairs (Regional)
Obtained 26 April 2017
Fekola Gold Mine Mali
NI 43-101 Technical Report
May 2019 Page 20-31
Other than as outlined in Table 20-4, B2Gold is not aware of significant permits or environmental factors that may affect the right or ability to conduct all activities involved in the continued operation and eventual closure of the Fekola Mine. Furthermore, B2Gold is not aware of reasons why additional operational permits will not be granted.
Fekola Gold Mine Mali
NI 43-101 Technical Report
May 2019 Page 21-1
21.0 CAPITAL AND OPERATING COSTS
21.1 Introduction
Capital and operating cost estimates are based on the Fekola LOMP as of January 1, 2019 which is based on mining and processing existing Mineral Reserves both in stockpiles and from the Fekola open pit. The LOMP assumes Owner-operated mining with mining operations until 2026, and processing operations until 2028.
Fekola is an operating mine; operating and capital costs are primarily based on actual operating and capital costs.
21.2 Capital Cost Estimates
21.2.1 Basis of Estimate
Fekola is a steady-state operation. Capital costs consist largely of mining and processing equipment and rebuilds, TSF raises, small projects, and other costs for mining, processing, and site general. Capital costs are split into
• Sustaining capital: Costs support the existing LOMP;
• Non-sustaining capital: Costs are for a long-term structure or external project which does not necessarily depend on the mine plan. Non-sustaining capital allocations include TSF raises and closure costs.
21.2.2 Labour Assumptions
Owner labour to support rebuilds or projects included in capital costs are included in operating costs. Where the labour is to be provided by some party other than the Owner, labour costs are included in capital costs.
21.2.3 Contingency
Capital costs are based on recent prices or operating data. No allowance for contingency is included.
21.2.4 Mine Capital Costs
Mine capital costs are estimated based on continued Owner operation. Recent actual costs are available, and maintenance practices are established now that the Fekola Mine is in operation. Rebuilds and equipment replacement costs are estimated based on this actual data. A major mine fleet replacement is planned in 2021 and 2022, with half the mining fleet scheduled to be replaced in each year, for $25 M in each period. Pre-stripping costs are not included in capital costs as they are included in mine operating costs.
Fekola Gold Mine Mali
NI 43-101 Technical Report
May 2019 Page 21-2
A total mining capital cost of $115.8 M is estimated for the LOM.
21.2.5 Process Capital Costs
Process capital costs included estimates of $0.5 M per year for both equipment replacements and equipment additions. The TSF also has $47.0 M estimated capital spend remaining over the project life.
In total, process capital costs total $57.0 M over the LOM.
21.2.6 General and Administrative Capital Costs
General and administrative capital costs average $1.0 M per year, for a total of $10.0 M over the LOM.
21.2.7 Closure Costs
The total reclamation and closure capital cost is estimated at $28.7 M, with costs beginning during the last year of mine operations in 2026 and ending in 2030.
These closure costs were developed for Mineral Reserve support prior to the development of the Asset Retirement Obligation cost estimate provided in Section 20.7, and is slightly lower than the $32.1 M estimated in that section.
21.2.8 Capital Cost Summary
Capital costs are summarized by category in Table 21-1.
21.3 Operating Cost Estimates
21.3.1 Basis of Estimate
Operating costs for Fekola are based on actual costs seen during operations at site and are projected through the LOMP.
21.3.2 Mine Operating Costs
Table 21-2 contains a summary of mine operating costs by area based on mining up to 35.5 Mt/a. Stockpile and rehandle costs are included in process operating costs.
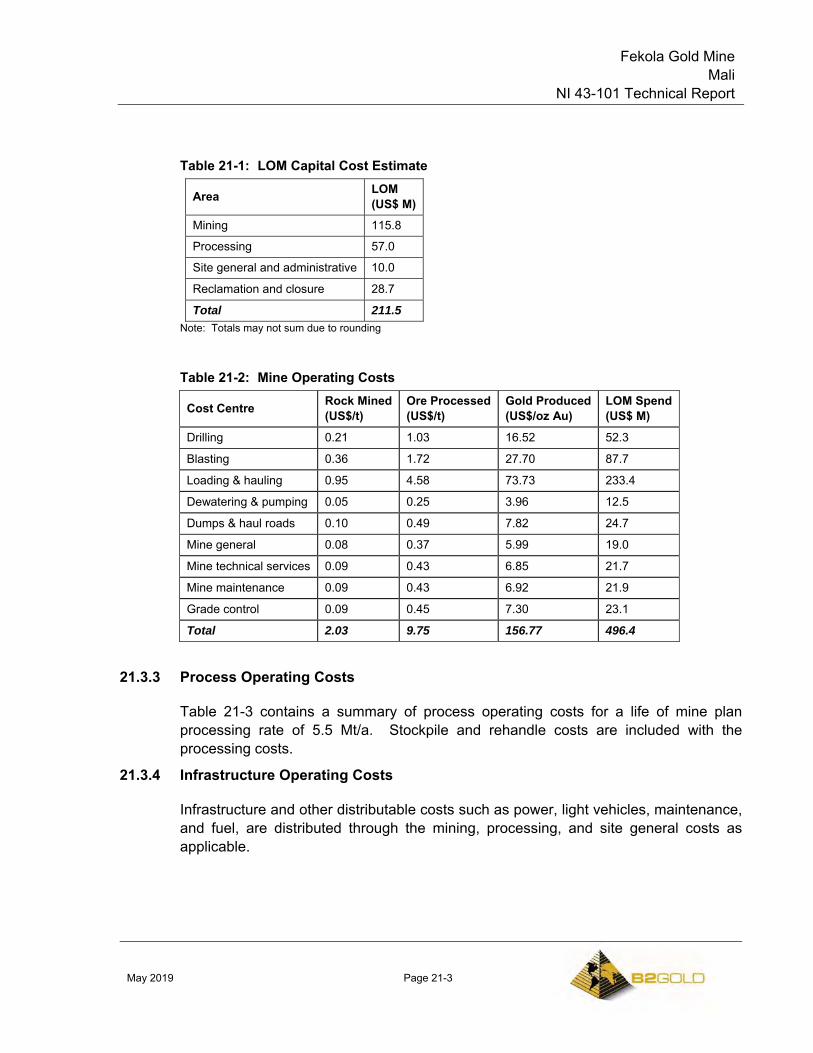
Fekola Gold Mine Mali
NI 43-101 Technical Report
May 2019 Page 21-3
Table 21-1: LOM Capital Cost Estimate
Area LOM (US$ M)
Mining 115.8
Processing 57.0
Site general and administrative 10.0
Reclamation and closure 28.7
Total 211.5 Note: Totals may not sum due to rounding
Table 21-2: Mine Operating Costs
Cost Centre Rock Mined (US$/t)
Ore Processed (US$/t)
Gold Produced (US$/oz Au)
LOM Spend (US$ M)
Drilling 0.21 1.03 16.52 52.3
Blasting 0.36 1.72 27.70 87.7
Loading & hauling 0.95 4.58 73.73 233.4
Dewatering & pumping 0.05 0.25 3.96 12.5
Dumps & haul roads 0.10 0.49 7.82 24.7
Mine general 0.08 0.37 5.99 19.0
Mine technical services 0.09 0.43 6.85 21.7
Mine maintenance 0.09 0.43 6.92 21.9
Grade control 0.09 0.45 7.30 23.1
Total 2.03 9.75 156.77 496.4
21.3.3 Process Operating Costs
Table 21-3 contains a summary of process operating costs for a life of mine plan processing rate of 5.5 Mt/a. Stockpile and rehandle costs are included with the processing costs.
21.3.4 Infrastructure Operating Costs
Infrastructure and other distributable costs such as power, light vehicles, maintenance, and fuel, are distributed through the mining, processing, and site general costs as applicable.
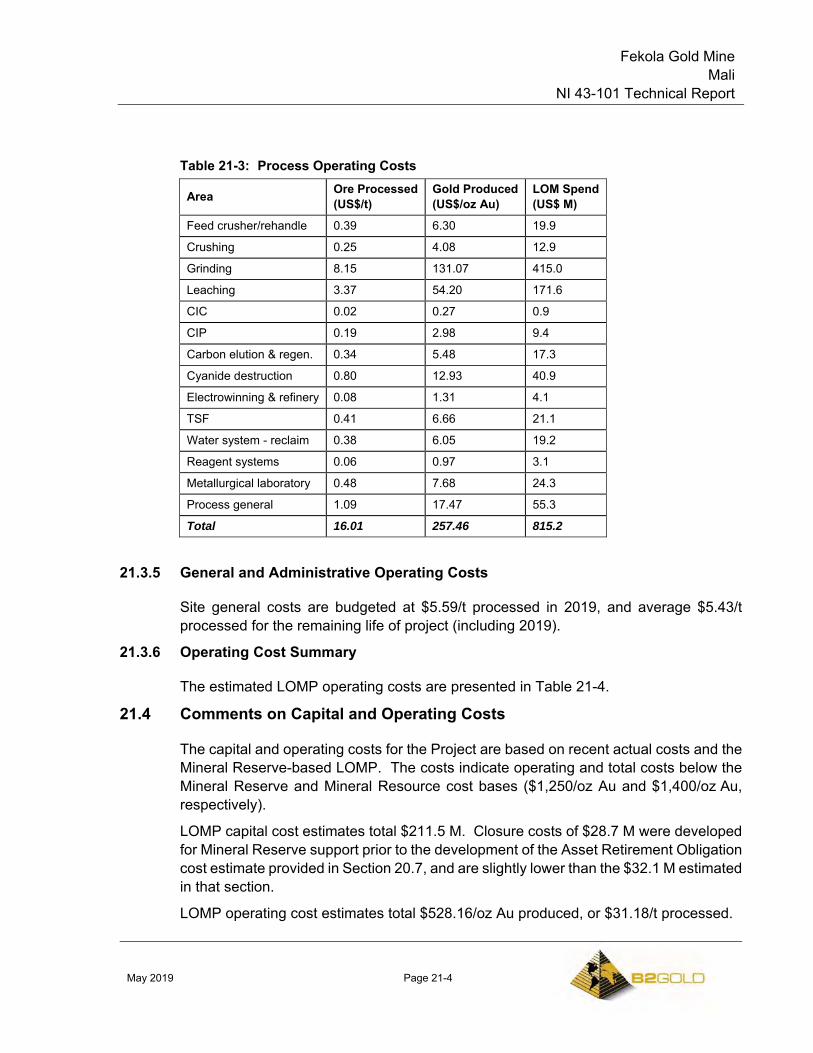
Fekola Gold Mine Mali
NI 43-101 Technical Report
May 2019 Page 21-4
Table 21-3: Process Operating Costs
Area Ore Processed (US$/t)
Gold Produced (US$/oz Au)
LOM Spend (US$ M)
Feed crusher/rehandle 0.39 6.30 19.9
Crushing 0.25 4.08 12.9
Grinding 8.15 131.07 415.0
Leaching 3.37 54.20 171.6
CIC 0.02 0.27 0.9
CIP 0.19 2.98 9.4
Carbon elution & regen. 0.34 5.48 17.3
Cyanide destruction 0.80 12.93 40.9
Electrowinning & refinery 0.08 1.31 4.1
TSF 0.41 6.66 21.1
Water system - reclaim 0.38 6.05 19.2
Reagent systems 0.06 0.97 3.1
Metallurgical laboratory 0.48 7.68 24.3
Process general 1.09 17.47 55.3
Total 16.01 257.46 815.2
21.3.5 General and Administrative Operating Costs
Site general costs are budgeted at $5.59/t processed in 2019, and average $5.43/t processed for the remaining life of project (including 2019).
21.3.6 Operating Cost Summary
The estimated LOMP operating costs are presented in Table 21-4.
21.4 Comments on Capital and Operating Costs
The capital and operating costs for the Project are based on recent actual costs and the Mineral Reserve-based LOMP. The costs indicate operating and total costs below the Mineral Reserve and Mineral Resource cost bases ($1,250/oz Au and $1,400/oz Au, respectively).
LOMP capital cost estimates total $211.5 M. Closure costs of $28.7 M were developed for Mineral Reserve support prior to the development of the Asset Retirement Obligation cost estimate provided in Section 20.7, and are slightly lower than the $32.1 M estimated in that section.
LOMP operating cost estimates total $528.16/oz Au produced, or $31.18/t processed.
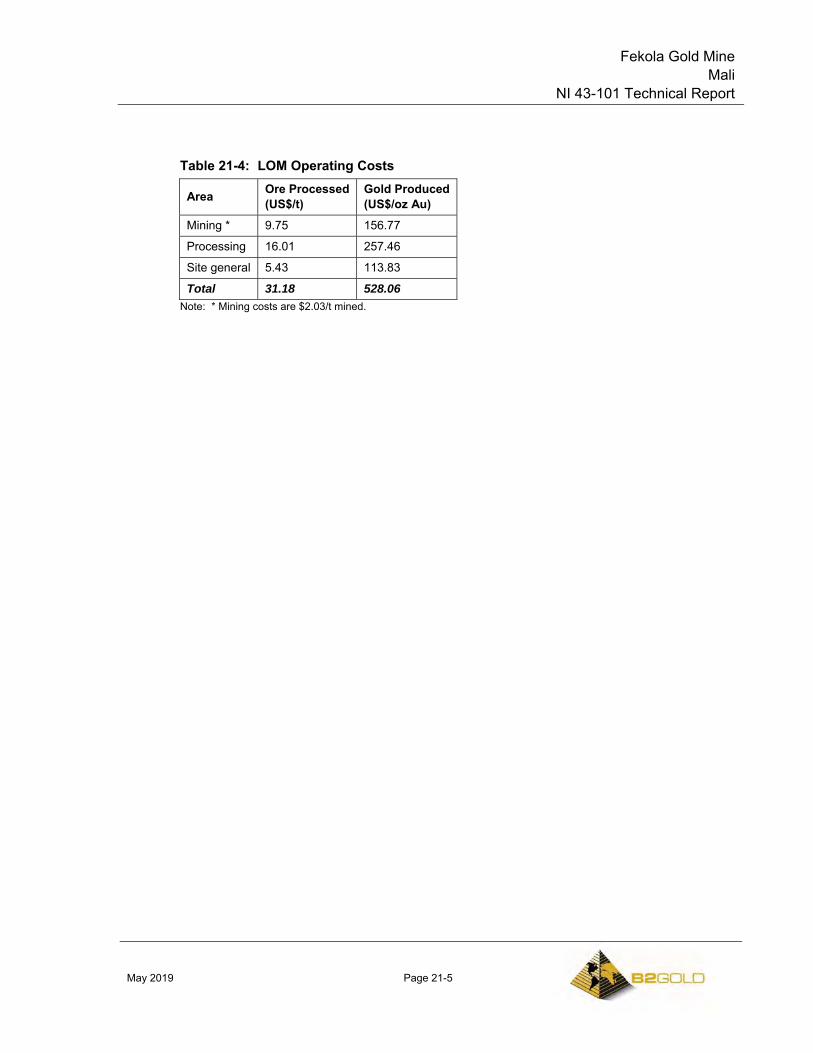
Fekola Gold Mine Mali
NI 43-101 Technical Report
May 2019 Page 21-5
Table 21-4: LOM Operating Costs
Area Ore Processed (US$/t)
Gold Produced (US$/oz Au)
Mining * 9.75 156.77
Processing 16.01 257.46
Site general 5.43 113.83
Total 31.18 528.06 Note: * Mining costs are $2.03/t mined.
Fekola Gold Mine Mali
NI 43-101 Technical Report
May 2019 Page 22-1
22.0 ECONOMIC ANALYSIS
B2Gold is using the provision for producing issuers, whereby producing issuers may exclude the information required under Item 22 for technical reports on properties currently in production and where no material production expansion is planned.
Mineral Reserve declaration is supported by a positive cash flow.
Fekola Gold Mine Mali
NI 43-101 Technical Report
May 2019 Page 23-1
23.0 ADJACENT PROPERTIES
This section is not relevant to this Report.
Fekola Gold Mine Mali
NI 43-101 Technical Report
May 2019 Page 24-1
24.0 OTHER RELEVANT DATA AND INFORMATION
24.1 2019 PEA Introduction
The 2019 PEA presents an expansion case scenario for the Fekola Mine. The 2019 PEA has no impact on the Mineral Reserves and the key assumptions and parameters supporting the Mineral Reserves. The Mineral Reserves are considered to remain current and valid in light of the key assumptions and parameters used in the 2019 PEA.
The 2019 PEA is partly based on Inferred Mineral Resources that are considered too speculative geologically to have the economic considerations applied to them that would enable them to be categorized as Mineral Reserves, and there is no certainty that the 2019 PEA based on these Mineral Resources will be realized.
The information presented in Sections 1 to 14 of the Report also pertain to the 2019 PEA, as do Section 23, and Sections 25 to 27, and therefore are not repeated here. Information relating to Sections 15 to 22 content for the 2019 PEA is provided in the following sub-sections. Years presented in the 2019 PEA are for illustrative purposes only.
24.2 Mineral Reserve Estimates
This section is not relevant to the 2019 PEA, as the 2019 PEA mine plan is based on Mineral Resources only.
24.3 2019 PEA Mining Methods
24.3.1 Overview
The mining method for the 2019 PEA on the Fekola deposit is via conventional open pit mining with the operations strategy based on Owner-operator mining equipment and labour.
The proposed mine production schedule involves the movement of a total 74.4 Mt/a of mineralized material and waste to sustain processing of 7.5 Mt/a of high-grade mineralized material while stockpiling as much as 9.3 Mt of low-grade mineralization and 9.6 Mt of currently sub-economic mineralization.
The mine design is based on cutback widths of 200–250 m, minimum mining width of 40m on all benches except floor of ultimate pit with 25m, nominal road and ramp widths of 27 m and a ramp gradient of up to 10%. Waste storage facility design is based on 10 m vertical lifts with 18º faces and 5 m berms, with facility location considerations based on minimising haulage, surface water drainage and area availability.
Fekola Gold Mine Mali
NI 43-101 Technical Report
May 2019 Page 24-2
The estimated total mine life is 11 years for the development of a 440 m deep ultimate pit in 10 stages to support 12 years of processing.
24.3.2 Geotechnical Considerations
The geotechnical appraisal and pit slope recommendations for the study were provided by George, Orr and Associates (GOA). More detailed geotechnical studies are in progress, with results expected by the end of 2019.
Ground conditions in the Fekola staged pits were interpreted from evaluations made on geotechnical drill hole cores (including use of an optical and acoustic imaging televiewer device), unconfined compressive strength (UCS) tests carried out on representative core samples, and local structural geological conditions.
Future wall stability is expected to be governed principally by the presence, attitude, and shear strength parameters of the geological structures occurring within the walls. Limited analyses have been performed to assess the stability against large scale wall collapses (rotational wall failures).
Zones of highly fractured rock (termed "broken core zones") occur in the hanging wall and footwall of the Fekola Fault. Northeasterly striking faults are also inferred to occur at the deposit. Bedrock is covered by an approximately 10–15 m thick layer of transported (pebbly) alluvium.
2D stability analysis results imply that the future wall stability against potential rotational collapses affecting the integrity of the whole slope will remain adequate for mining purposes. This is provided that slopes are not mined at steeper overall angles than recommended and the effective wall depressurisation (i.e. dewatering, particularly in the east wall of the Stage 5 Pit) is carried out.
The pit wall slope design domains around the pit perimeter and the associated overall slope angles are shown in Figure 24-2.
The overall slope angles vary from 40–45° around the pit rim, depending on mainly the extent and location of the broken core zones. The effect of access ramps on the pit walls were allowed in the definition of the overall slope angles.
The definition of the pit slope domains and the recommended slope design parameters used in the pit optimisations and designs are detailed in Table 24-1. The slope design may vary slightly at the lower levels of the pit design to maximise the ore recovery where the access ramps can act as berms.

Fekola Gold Mine Mali
NI 43-101 Technical Report
May 2019 Page 24-3
Figure 24-1: Pit Slope Design Sectors
Note: Figure prepared by George, Orr and Associates, 2015.
45º
40º
41º
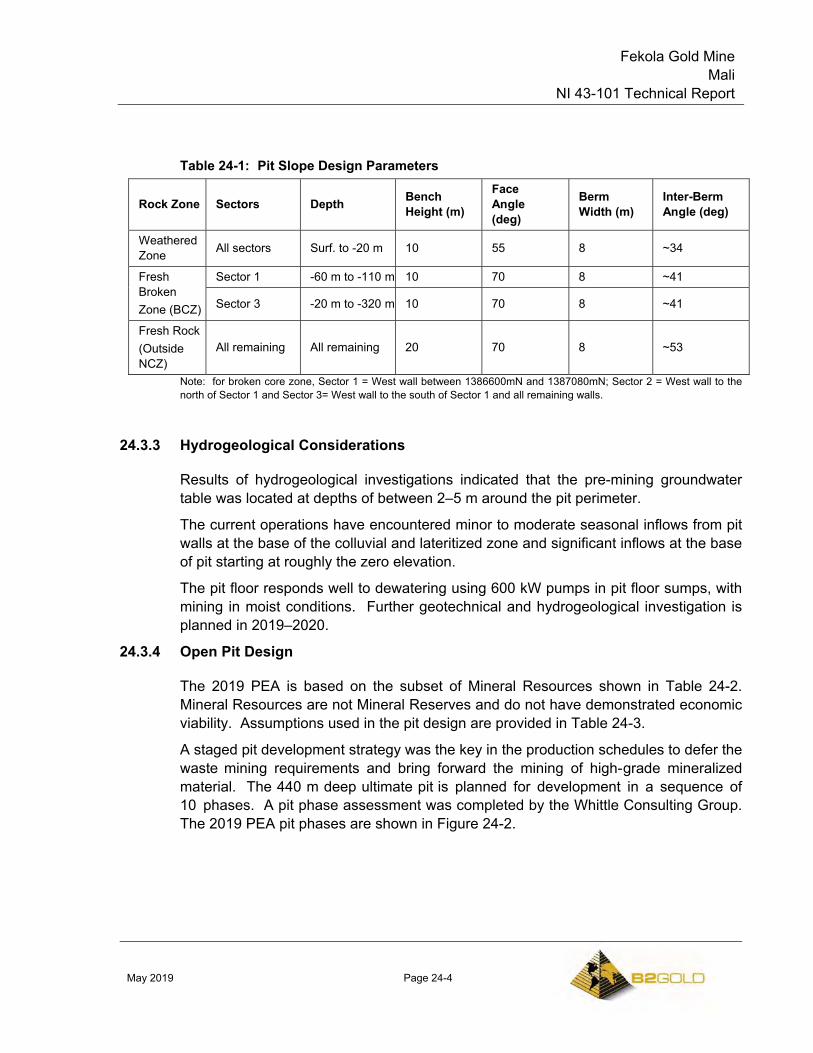
Fekola Gold Mine Mali
NI 43-101 Technical Report
May 2019 Page 24-4
Table 24-1: Pit Slope Design Parameters
Rock Zone Sectors Depth Bench Height (m)
Face Angle (deg)
Berm Width (m)
Inter-Berm Angle (deg)
Weathered Zone All sectors Surf. to -20 m 10 55 8 ~34
Fresh Broken Zone (BCZ)
Sector 1 -60 m to -110 m 10 70 8 ~41
Sector 3 -20 m to -320 m 10 70 8 ~41
Fresh Rock (Outside NCZ)
All remaining All remaining 20 70 8 ~53
Note: for broken core zone, Sector 1 = West wall between 1386600mN and 1387080mN; Sector 2 = West wall to the north of Sector 1 and Sector 3= West wall to the south of Sector 1 and all remaining walls.
24.3.3 Hydrogeological Considerations
Results of hydrogeological investigations indicated that the pre-mining groundwater table was located at depths of between 2–5 m around the pit perimeter.
The current operations have encountered minor to moderate seasonal inflows from pit walls at the base of the colluvial and lateritized zone and significant inflows at the base of pit starting at roughly the zero elevation.
The pit floor responds well to dewatering using 600 kW pumps in pit floor sumps, with mining in moist conditions. Further geotechnical and hydrogeological investigation is planned in 2019–2020.
24.3.4 Open Pit Design
The 2019 PEA is based on the subset of Mineral Resources shown in Table 24-2. Mineral Resources are not Mineral Reserves and do not have demonstrated economic viability. Assumptions used in the pit design are provided in Table 24-3.
A staged pit development strategy was the key in the production schedules to defer the waste mining requirements and bring forward the mining of high-grade mineralized material. The 440 m deep ultimate pit is planned for development in a sequence of 10 phases. A pit phase assessment was completed by the Whittle Consulting Group. The 2019 PEA pit phases are shown in Figure 24-2.
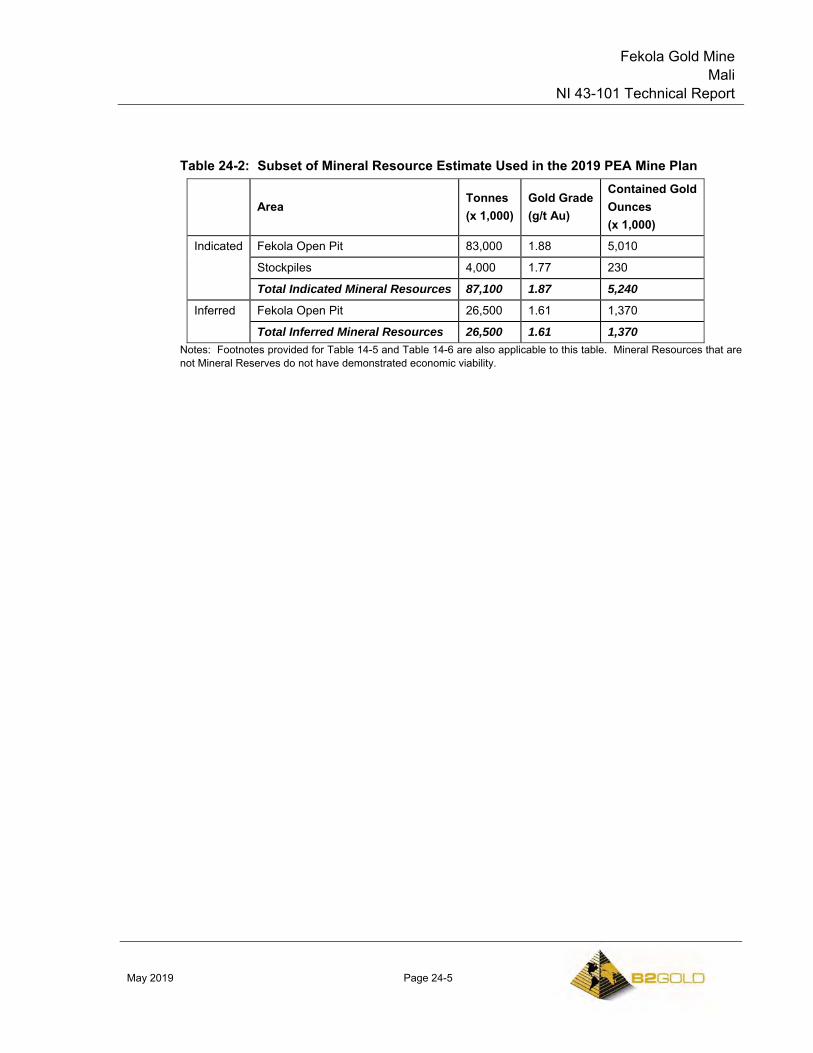
Fekola Gold Mine Mali
NI 43-101 Technical Report
May 2019 Page 24-5
Table 24-2: Subset of Mineral Resource Estimate Used in the 2019 PEA Mine Plan
Area Tonnes (x 1,000)
Gold Grade (g/t Au)
Contained Gold Ounces (x 1,000)
Indicated Fekola Open Pit 83,000 1.88 5,010
Stockpiles 4,000 1.77 230
Total Indicated Mineral Resources 87,100 1.87 5,240
Inferred Fekola Open Pit 26,500 1.61 1,370
Total Inferred Mineral Resources 26,500 1.61 1,370 Notes: Footnotes provided for Table 14-5 and Table 14-6 are also applicable to this table. Mineral Resources that are not Mineral Reserves do not have demonstrated economic viability.
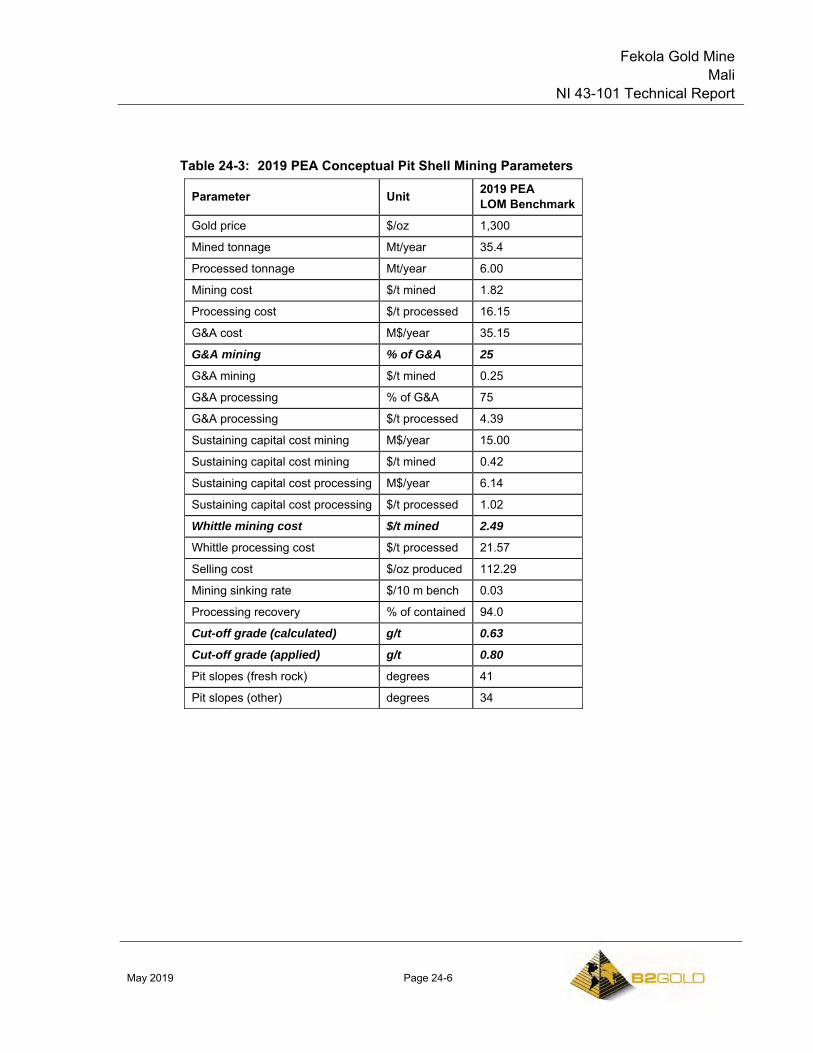
Fekola Gold Mine Mali
NI 43-101 Technical Report
May 2019 Page 24-6
Table 24-3: 2019 PEA Conceptual Pit Shell Mining Parameters
Parameter Unit 2019 PEA LOM Benchmark
Gold price $/oz 1,300
Mined tonnage Mt/year 35.4
Processed tonnage Mt/year 6.00
Mining cost $/t mined 1.82
Processing cost $/t processed 16.15
G&A cost M$/year 35.15
G&A mining % of G&A 25
G&A mining $/t mined 0.25
G&A processing % of G&A 75
G&A processing $/t processed 4.39
Sustaining capital cost mining M$/year 15.00
Sustaining capital cost mining $/t mined 0.42
Sustaining capital cost processing M$/year 6.14
Sustaining capital cost processing $/t processed 1.02
Whittle mining cost $/t mined 2.49
Whittle processing cost $/t processed 21.57
Selling cost $/oz produced 112.29
Mining sinking rate $/10 m bench 0.03
Processing recovery % of contained 94.0
Cut-off grade (calculated) g/t 0.63
Cut-off grade (applied) g/t 0.80
Pit slopes (fresh rock) degrees 41
Pit slopes (other) degrees 34
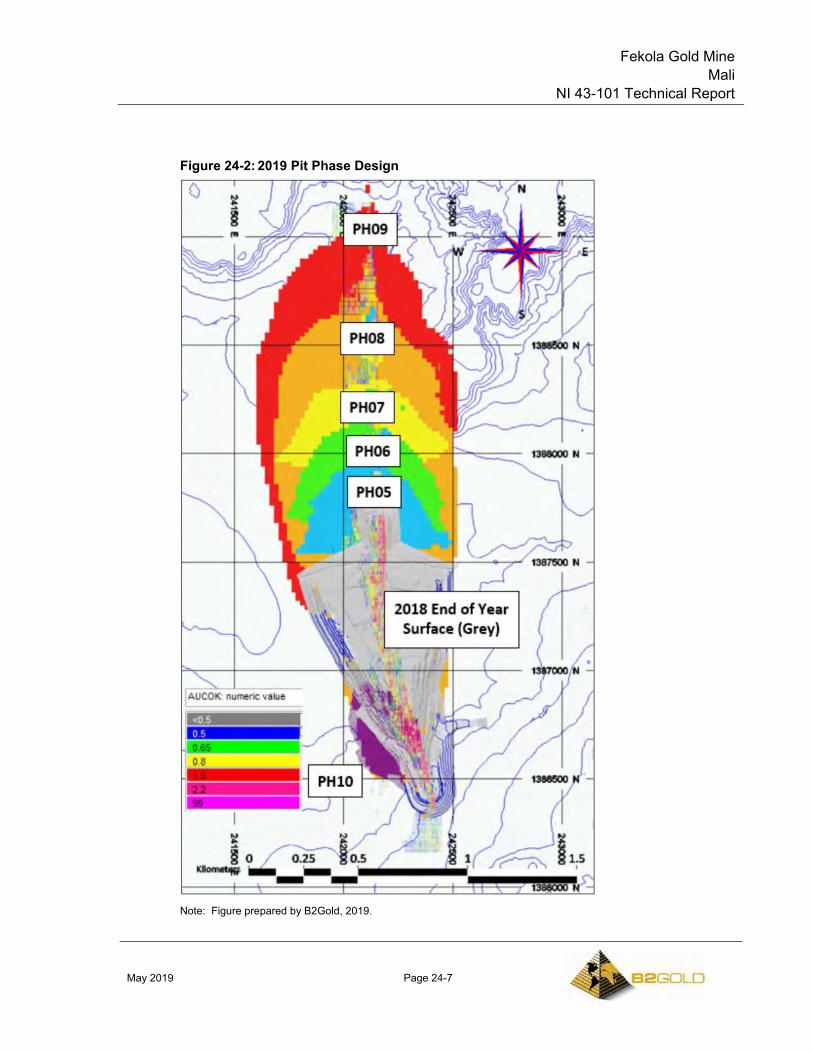
Fekola Gold Mine Mali
NI 43-101 Technical Report
May 2019 Page 24-7
Figure 24-2: 2019 Pit Phase Design
Note: Figure prepared by B2Gold, 2019.
Fekola Gold Mine Mali
NI 43-101 Technical Report
May 2019 Page 24-8
The staged pit development will also mitigate the geological, geotechnical and economic risks for the operation, considering the 2.6 km length of the proposed Fekola open pit. The design of the future pit stages during the operations, especially the last two stages, can be adjusted progressively depending on the operational experience, exposed ground conditions and changes in economic conditions.
The cutbacks need to be accessed through temporary ramps in the initial stage of development from the surface. These temporary ramps may be mined after acting as catch (safety) berms between the successive cutbacks mined at different levels. The remaining ramps on the final pit walls will act as geotechnical berms (i.e. wider berms to limit the inter-ramp slope angle) to form a “stacked” slope design.
A minimum mining width of 25 m (dual lane ramp width) was adopted for the floor of the ultimate pit design. The temporary floors of the pit stages were designed wider (~40 m) not to constrain the mining equipment unnecessarily as these floors would be mined in the subsequent pit stage.
The block model used for the 2019 PEA has dilution and ore loss applied through whole block averaging such that at a 0.8 g/t Au cut-off there is a 1.4% increase in tonnes, a 2.1% reduction in grade and 0.7% reduction in ounces when compared to the Mineral Resource model. For pit optimization runs, mineralized material tonnage was increased by 5% with zero grade, and a mineralized material loss factor of 2% was applied.
24.3.5 Road and Ramp Design Criteria
A nominal ramp and road width of 27 m, including drainage and safety windrow, was used for dual lane truck operation in the mine design. A ramp gradient of up to 10% was used in the mine design for both single and dual lane ramps.
24.3.6 Waste Rock Storage Facility Design Criteria
An overall slope angle of 18° was used in the design of the waste storage facility faces with the 5 m berms located at 10 m vertical intervals.
The temporary ramp exits from the pit stages were designed to distribute the waste across the waste storage facility areas and the TSF embankment. The size and height of the two WRSFs at the southwest and northeast were adjusted to minimise the haulage costs and leave the mineralization corridor open to the south for potential development of shallow pits (or sterilization) in the future.
The 2019 PEA mine plan assumes about 546 Mt of waste will be mined. This exceeds the current WRSF capacities, and new facilities will be required. Two WRSFs will likely be constructed with one potentially constructed to the north of the existing west WRSF, and one potentially sited to the north of the existing TSF. The facility designs are included in the 2019 PEA operating costs.
Fekola Gold Mine Mali
NI 43-101 Technical Report
May 2019 Page 24-9
24.3.7 Operational Cut-off Grades
The 0.8 g/t Au mill feed cut-off grade was determined as optimal based on the forecast mining production capacity and processing throughput assumptions.
The cut-off grades used to classify the mineralized material types in the open pit mining and production schedules are as follows:
• The break-even cut-off grade is 0.8 g/t Au;
• Material between 0.8–1.5 g/t Au is classified as low grade (LG) for stockpiling and processing when higher grade mill feed material is not available and at the end of the mine life;
• Material between 1.5–2.5 g/t cut-off is classified as medium grade (MG) for processing as necessary to meet processing feed tonnage requirements, along with the high-grade run-of-mine (ROM) mill feed material;
• Material >2.5 g/t Au is classified as high grade (HG) for ROM processing over the mine life.
The mill feed cut-off grade will vary through mine life depending on the availability of the mill feed material stocks and grades mined in the cutbacks.
24.3.8 Production Schedule
The major constraints applied in the production schedule include:
• Maintaining relatively constant working strip ratios and smoother mining rates for better utilisation of the mining equipment throughout the mine life;
• 15% lower mine production rate during the rainy season (five months from mid June to mid November);
• Maintaining approximately four weeks of mill feed stockpile on the ROM pad at reasonable grade depending on the availability of mineralized material in the pit;
• Keeping the average vertical mining advance (sink) rates generally below 60 m/year. The sink rates are relatively low, below 40 m/year, at the base of each phase where mining area is restricted, the strip ratio is lower, and hauls are longer.
Figure 24-3 provides the LOM material movement forecasts. Figure 24-4 summarizes the projected tonnes processed. Figure 24-5 provides the forecast gold grade over the LOMP.
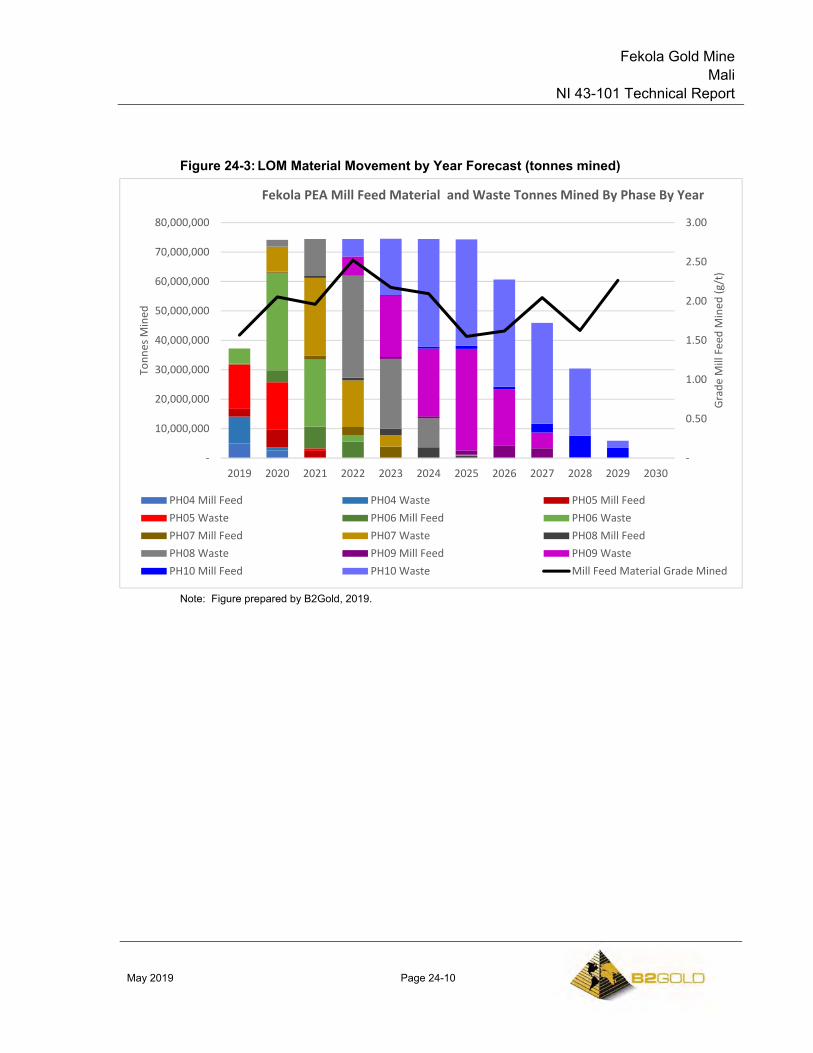
Fekola Gold Mine Mali
NI 43-101 Technical Report
May 2019 Page 24-10
Figure 24-3: LOM Material Movement by Year Forecast (tonnes mined)
Note: Figure prepared by B2Gold, 2019.
-
0.50
1.00
1.50
2.00
2.50
3.00
-
10,000,000
20,000,000
30,000,000
40,000,000
50,000,000
60,000,000
70,000,000
80,000,000
2019 2020 2021 2022 2023 2024 2025 2026 2027 2028 2029 2030
Grad
e M
ill F
eed
Min
ed (g
/t)
Tonn
es M
ined
Fekola PEA Mill Feed Material and Waste Tonnes Mined By Phase By Year
PH04 Mill Feed PH04 Waste PH05 Mill FeedPH05 Waste PH06 Mill Feed PH06 WastePH07 Mill Feed PH07 Waste PH08 Mill FeedPH08 Waste PH09 Mill Feed PH09 WastePH10 Mill Feed PH10 Waste Mill Feed Material Grade Mined
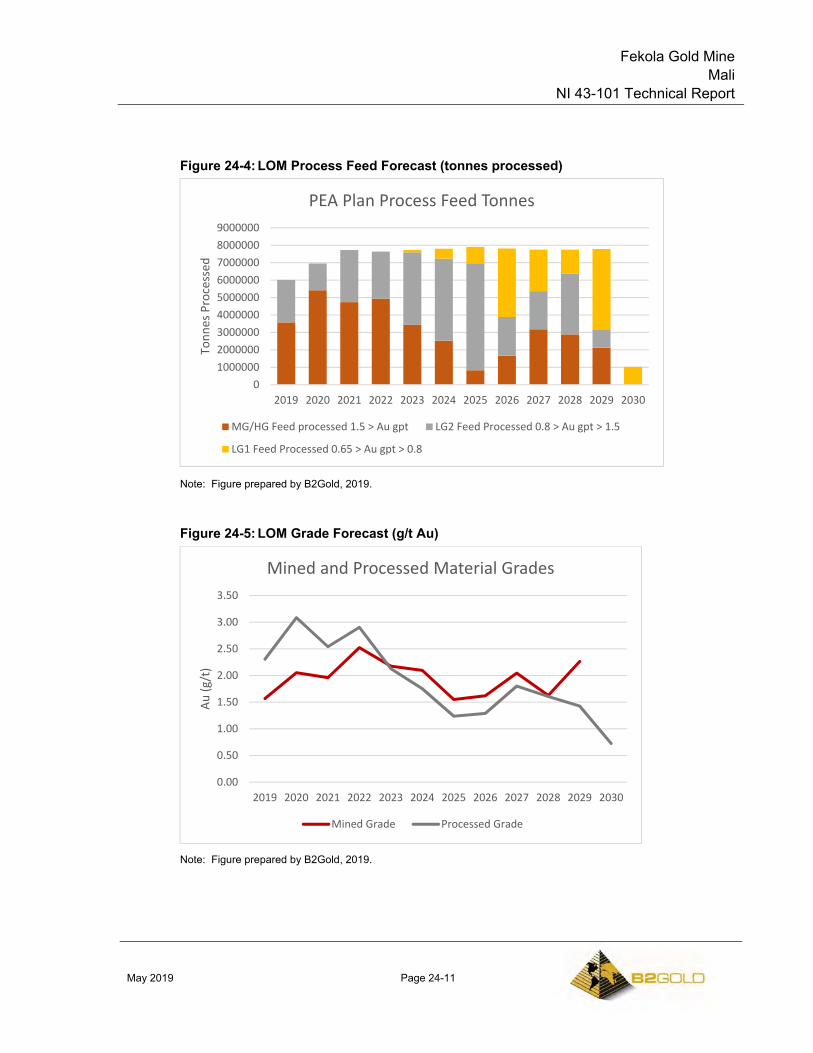
Fekola Gold Mine Mali
NI 43-101 Technical Report
May 2019 Page 24-11
Figure 24-4: LOM Process Feed Forecast (tonnes processed)
Note: Figure prepared by B2Gold, 2019.
Figure 24-5: LOM Grade Forecast (g/t Au)
Note: Figure prepared by B2Gold, 2019.
0100000020000003000000400000050000006000000700000080000009000000
2019 2020 2021 2022 2023 2024 2025 2026 2027 2028 2029 2030
Tonn
es P
roce
ssed
PEA Plan Process Feed Tonnes
MG/HG Feed processed 1.5 > Au gpt LG2 Feed Processed 0.8 > Au gpt > 1.5
LG1 Feed Processed 0.65 > Au gpt > 0.8
0.00
0.50
1.00
1.50
2.00
2.50
3.00
3.50
2019 2020 2021 2022 2023 2024 2025 2026 2027 2028 2029 2030
Au (g
/t)
Mined and Processed Material Grades
Mined Grade Processed Grade
Fekola Gold Mine Mali
NI 43-101 Technical Report
May 2019 Page 24-12
The total tonnes mined annually are slightly over 74 Mt/a through 2025, then mine production tails off in the last four years as the pre-stripping of the last pit stages is completed. The processed grade over the remaining life of mine is slightly lower than mined grade due to existing low-grade stockpiles.
In general, two to three cutbacks will be mined simultaneously to expose sufficient mineralized material stocks to sustain the plant feed through mine life. The deepest phase will generally produce most of the high-grade mineralized material and have the lowest strip ratio. The second cutback will be catching up to expose more mineralized material at depth as the waste pre- stripping is completed and will generate significant low and medium grade mineralized material. Mostly waste will be mined in the third cutback at the upper levels to expose future mineralized material on time. This pattern will repeat as the mining in the deepest cutback is completed and replaced with the mineralized material mining in the second cutback and a new cutback is started at the top of the open pit.
The mining operations are scheduled to work 365 days in a year, with decreased production targets during the rainy season. The processing plant is scheduled to operate 24 hours continuously except for planned maintenance periods. The mill feed will be supplied from the ROM stockpiles while the mine is not producing mill feed material.
The mill feed material will be transported from open pits to the ROM pad for direct tipping or stockpiling. Although the crusher design allows for direct truck tipping, mining cost estimates assume 80% of the ROM material will be rehandled due to variations in mine production.
The stockpiled mill feed material will be loaded to the crusher with a front-end loader (Cat 990, 992, or similar). About approximately three to four week’s mill feed supply will be maintained on the ROM pad to control the gold grades and mill feed material types.
24.3.9 Blasting and Explosives
The production drilling, blasting, and waste mining operations will be carried out in general at 10 m benches.
The projected average powder factor is forecast to be 0.26 kg/t (ANFO equivalent). Production drilling will be performed by four Caterpillar MD6240 and MD6250 drills, and presplit drilling will be performed by two Caterpillar drills and one Sandvik top-hammer drill. Bulk emulsion will be used throughout the operations under both dry and wet conditions.
For blasting at 10 m benches, the 165 mm diameter blast hole patterns are expected to be varying from 4 m x 5 m in fresh rock to 4.8 m x 6 m in transitional rock, depending on the variability and strength of the formations.
Fekola Gold Mine Mali
NI 43-101 Technical Report
May 2019 Page 24-13
For blasting at 5 m benches, the 115 m diameter blast hole patterns are expected to be varying from 2.7 m x 3.4 m in fresh rock to 3.2 m x 4 m in transition rock, depending on the variability and strength of the formations.
Free digging, ripping, and blasting operations in the weathered zone will vary according to the extent of the lateritized and colluvial zones and presence of boulders.
24.3.10 Grade Control
In grade control of the mining benches, sampling will commence with the RC drilling ahead of the mining front to assist the short and medium term mine planning processes. The holes will generally be angled at 60º from the hanging wall side of the mineralized zones to provide a good intersection with the mineralised structures.
The grade control will be based on drilling RC holes and sampling practice at regular intervals along the holes. The samples will be tested in the onsite laboratory. Grade control drilling will generally be spaced at 15 m along strike and 6.5 m across strike and drilled one to three benches in depth depending on mine scheduling and data requirements. Drill hole spacing and sample density will be optimized as the mine develops.
24.3.11 Mining Equipment
The 2019 PEA production plan mine schedule anticipates a mine fleet expansion to a material movement capacity of 74.4 Mt/a beginning in 2020. Equipment requirements are detailed in Table 24-4.
24.4 2019 PEA Recovery Methods
24.4.1 Introduction
The process plant at Fekola is based on a robust metallurgical flowsheet designed for optimum recovery with minimum operating costs. The flowsheet is based upon unit operations that are well proven in industry.
Following grinding and optimization tests completed in 2018, the plant is currently able to operate at a 6 Mt/a throughput rate with no changes to the plant or equipment. The 2019 PEA envisages a plant throughput expansion to 7.5 Mt/a. A 10 Mt/a expansion was internally reviewed, but is not the currently-preferred option.
24.4.2 Testwork Supporting Planned Expansion in 2019 PEA
A grinding circuit survey of the current Fekola comminution circuit was conducted in mid-2018. The survey was conducted on a campaign of competent fresh rock with the intent of quantifying the extent of grinding circuit throughput increase that could be achieved.
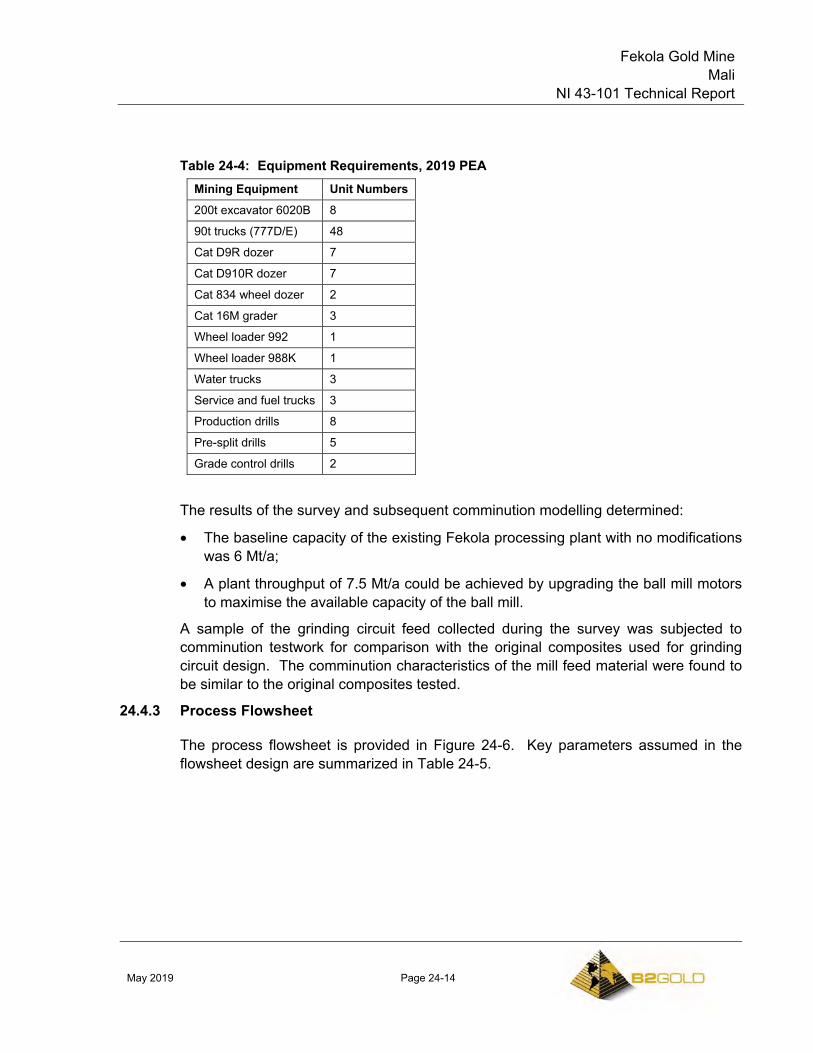
Fekola Gold Mine Mali
NI 43-101 Technical Report
May 2019 Page 24-14
Table 24-4: Equipment Requirements, 2019 PEA Mining Equipment Unit Numbers 200t excavator 6020B 8
90t trucks (777D/E) 48
Cat D9R dozer 7
Cat D910R dozer 7
Cat 834 wheel dozer 2
Cat 16M grader 3
Wheel loader 992 1
Wheel loader 988K 1
Water trucks 3
Service and fuel trucks 3
Production drills 8
Pre-split drills 5
Grade control drills 2
The results of the survey and subsequent comminution modelling determined:
• The baseline capacity of the existing Fekola processing plant with no modifications was 6 Mt/a;
• A plant throughput of 7.5 Mt/a could be achieved by upgrading the ball mill motors to maximise the available capacity of the ball mill.
A sample of the grinding circuit feed collected during the survey was subjected to comminution testwork for comparison with the original composites used for grinding circuit design. The comminution characteristics of the mill feed material were found to be similar to the original composites tested.
24.4.3 Process Flowsheet
The process flowsheet is provided in Figure 24-6. Key parameters assumed in the flowsheet design are summarized in Table 24-5.
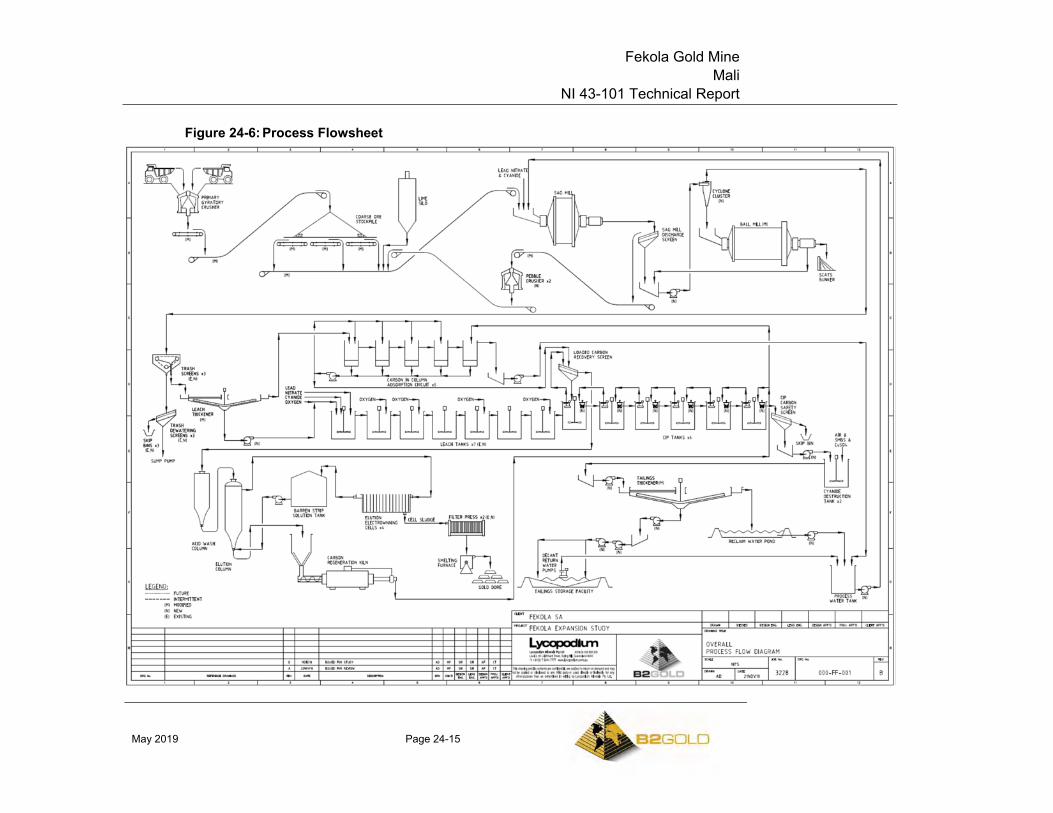
Fekola Gold Mine Mali
NI 43-101 Technical Report
May 2019 Page 24-15
Figure 24-6: Process Flowsheet
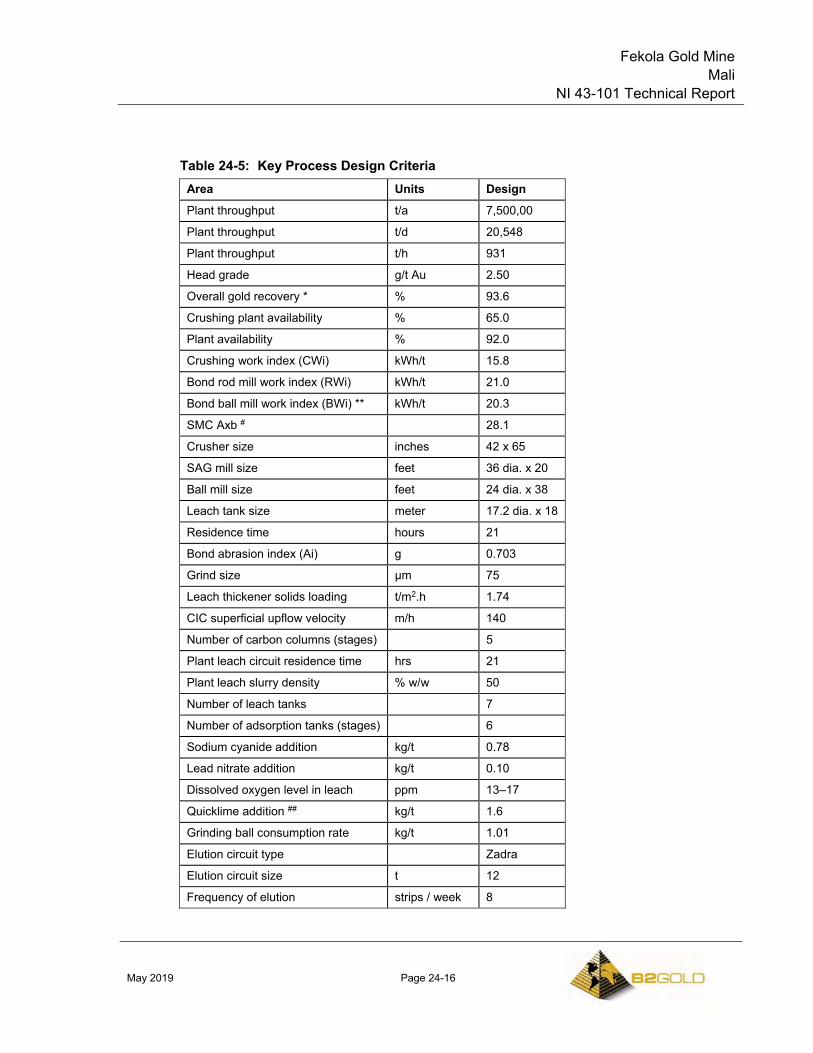
Fekola Gold Mine Mali
NI 43-101 Technical Report
May 2019 Page 24-16
Table 24-5: Key Process Design Criteria Area Units Design
Plant throughput t/a 7,500,00
Plant throughput t/d 20,548
Plant throughput t/h 931
Head grade g/t Au 2.50
Overall gold recovery * % 93.6
Crushing plant availability % 65.0
Plant availability % 92.0
Crushing work index (CWi) kWh/t 15.8
Bond rod mill work index (RWi) kWh/t 21.0
Bond ball mill work index (BWi) ** kWh/t 20.3
SMC Axb # 28.1
Crusher size inches 42 x 65
SAG mill size feet 36 dia. x 20
Ball mill size feet 24 dia. x 38
Leach tank size meter 17.2 dia. x 18
Residence time hours 21
Bond abrasion index (Ai) g 0.703
Grind size µm 75
Leach thickener solids loading t/m2.h 1.74
CIC superficial upflow velocity m/h 140
Number of carbon columns (stages) 5
Plant leach circuit residence time hrs 21
Plant leach slurry density % w/w 50
Number of leach tanks 7
Number of adsorption tanks (stages) 6
Sodium cyanide addition kg/t 0.78
Lead nitrate addition kg/t 0.10
Dissolved oxygen level in leach ppm 13–17
Quicklime addition ## kg/t 1.6
Grinding ball consumption rate kg/t 1.01
Elution circuit type Zadra
Elution circuit size t 12
Frequency of elution strips / week 8
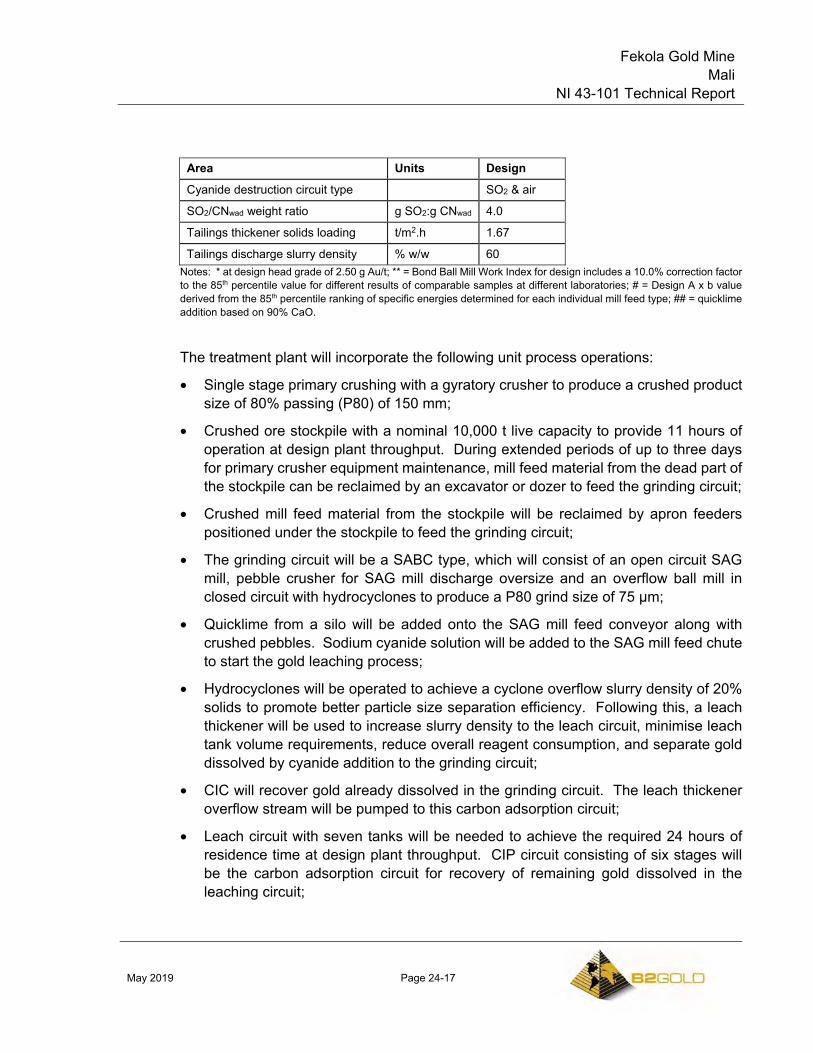
Fekola Gold Mine Mali
NI 43-101 Technical Report
May 2019 Page 24-17
Area Units Design
Cyanide destruction circuit type SO2 & air
SO2/CNwad weight ratio g SO2:g CNwad 4.0
Tailings thickener solids loading t/m2.h 1.67
Tailings discharge slurry density % w/w 60 Notes: * at design head grade of 2.50 g Au/t; ** = Bond Ball Mill Work Index for design includes a 10.0% correction factor to the 85th percentile value for different results of comparable samples at different laboratories; # = Design A x b value derived from the 85th percentile ranking of specific energies determined for each individual mill feed type; ## = quicklime addition based on 90% CaO.
The treatment plant will incorporate the following unit process operations:
• Single stage primary crushing with a gyratory crusher to produce a crushed product size of 80% passing (P80) of 150 mm;
• Crushed ore stockpile with a nominal 10,000 t live capacity to provide 11 hours of operation at design plant throughput. During extended periods of up to three days for primary crusher equipment maintenance, mill feed material from the dead part of the stockpile can be reclaimed by an excavator or dozer to feed the grinding circuit;
• Crushed mill feed material from the stockpile will be reclaimed by apron feeders positioned under the stockpile to feed the grinding circuit;
• The grinding circuit will be a SABC type, which will consist of an open circuit SAG mill, pebble crusher for SAG mill discharge oversize and an overflow ball mill in closed circuit with hydrocyclones to produce a P80 grind size of 75 µm;
• Quicklime from a silo will be added onto the SAG mill feed conveyor along with crushed pebbles. Sodium cyanide solution will be added to the SAG mill feed chute to start the gold leaching process;
• Hydrocyclones will be operated to achieve a cyclone overflow slurry density of 20% solids to promote better particle size separation efficiency. Following this, a leach thickener will be used to increase slurry density to the leach circuit, minimise leach tank volume requirements, reduce overall reagent consumption, and separate gold dissolved by cyanide addition to the grinding circuit;
• CIC will recover gold already dissolved in the grinding circuit. The leach thickener overflow stream will be pumped to this carbon adsorption circuit;
• Leach circuit with seven tanks will be needed to achieve the required 24 hours of residence time at design plant throughput. CIP circuit consisting of six stages will be the carbon adsorption circuit for recovery of remaining gold dissolved in the leaching circuit;
Fekola Gold Mine Mali
NI 43-101 Technical Report
May 2019 Page 24-18
• Zadra elution circuit with gold recovery to doré. The circuit will include an acid wash column to remove inorganic foulants from the carbon with hydrochloric acid. The single elution circuit will be common for both carbon adsorption circuits;
• Carbon regeneration kiln to remove organic foulants from the carbon with heat. This piece of equipment will be common for both carbon adsorption circuits;
• Cyanide destruction circuit using SO2 and air to reduce the CNWAD level in the tailings discharge stream to an environmentally acceptable level;
• Tailings thickener to increase slurry density for water recovery prior to tailings discharge to the TSF.
24.4.4 Plant Design
Changes in design to accommodate the proposed plant expansion in the 2019 PEA are provided in Table 24-6.
Mill Feed Material Receiving and Crushing
ROM mill feed will be tipped directly into either side of the ROM pocket. A dedicated mobile rock breaker will be used to break down oversize material. A fixed rock breaker to be dedicated to clearance of dump pocket blockages. Mill feed will be crushed by a gyratory crusher and then withdrawn from the ROM discharge pocket by a variable speed apron feeder. The crushed mill feed material will be conveyed, via the stockpile feed conveyor, to the crushed mill feed material stockpile.
Crushed Mill Feed Material Stockpile
The crushed mill feed material stockpile will have a live capacity of approximately 10,000 t (equivalent to 11 hrs of mill feed at 7.5 Mt/a) and a total storage capacity of 57 hours.
Crushed mill feed material will be reclaimed from the stockpile, by three variable speed apron feeders. The feeders will discharge onto the SAG mill feed conveyor which will convey the crushed material to the SAG mill feed chute.
Grinding and Classification
The Fekola grinding circuit will be a traditional SABC circuit, comprised of a single, variable speed, SAG mill and a single variable-speed ball mill. The SAG mill will operate in closed circuit with a pebble crusher, whilst the ball mill will operate in closed circuit with hydrocyclones. The product particle size exiting the grinding circuit (cyclone overflow) will contain 80% passing 75 µm material.
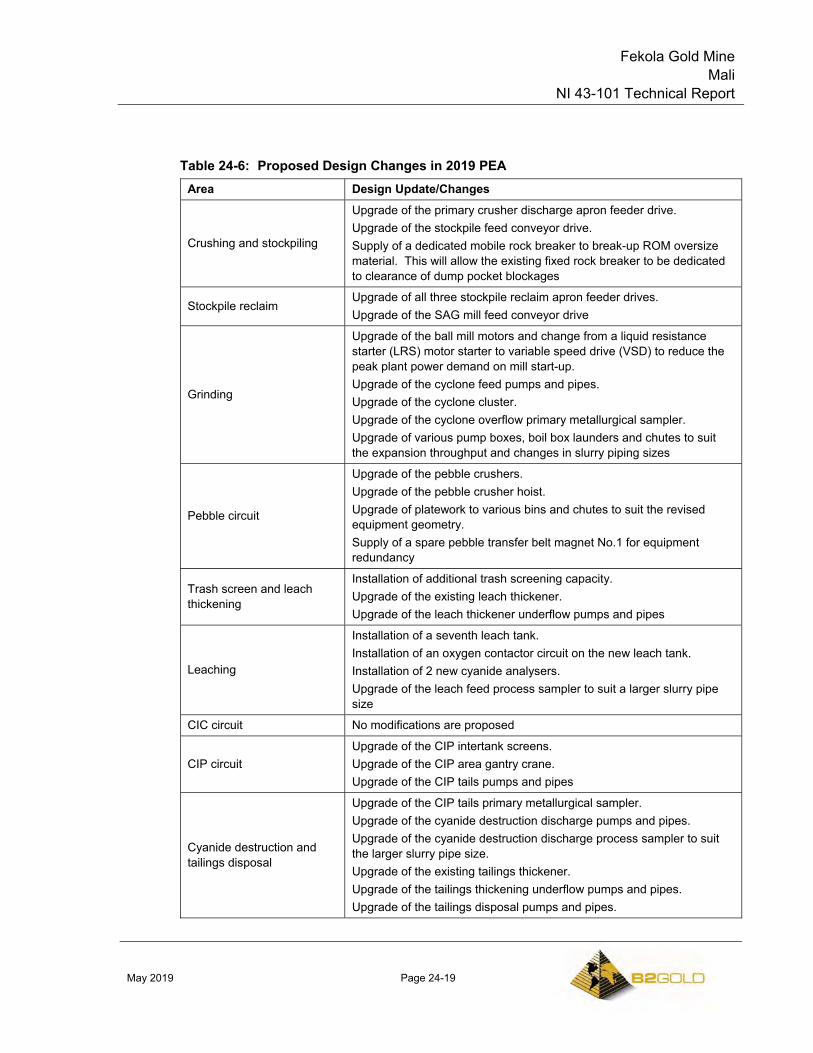
Fekola Gold Mine Mali
NI 43-101 Technical Report
May 2019 Page 24-19
Table 24-6: Proposed Design Changes in 2019 PEA Area Design Update/Changes
Crushing and stockpiling
Upgrade of the primary crusher discharge apron feeder drive. Upgrade of the stockpile feed conveyor drive. Supply of a dedicated mobile rock breaker to break-up ROM oversize material. This will allow the existing fixed rock breaker to be dedicated to clearance of dump pocket blockages
Stockpile reclaim Upgrade of all three stockpile reclaim apron feeder drives. Upgrade of the SAG mill feed conveyor drive
Grinding
Upgrade of the ball mill motors and change from a liquid resistance starter (LRS) motor starter to variable speed drive (VSD) to reduce the peak plant power demand on mill start-up. Upgrade of the cyclone feed pumps and pipes. Upgrade of the cyclone cluster. Upgrade of the cyclone overflow primary metallurgical sampler. Upgrade of various pump boxes, boil box launders and chutes to suit the expansion throughput and changes in slurry piping sizes
Pebble circuit
Upgrade of the pebble crushers. Upgrade of the pebble crusher hoist. Upgrade of platework to various bins and chutes to suit the revised equipment geometry. Supply of a spare pebble transfer belt magnet No.1 for equipment redundancy
Trash screen and leach thickening
Installation of additional trash screening capacity. Upgrade of the existing leach thickener. Upgrade of the leach thickener underflow pumps and pipes
Leaching
Installation of a seventh leach tank. Installation of an oxygen contactor circuit on the new leach tank. Installation of 2 new cyanide analysers. Upgrade of the leach feed process sampler to suit a larger slurry pipe size
CIC circuit No modifications are proposed
CIP circuit Upgrade of the CIP intertank screens. Upgrade of the CIP area gantry crane. Upgrade of the CIP tails pumps and pipes
Cyanide destruction and tailings disposal
Upgrade of the CIP tails primary metallurgical sampler. Upgrade of the cyanide destruction discharge pumps and pipes. Upgrade of the cyanide destruction discharge process sampler to suit the larger slurry pipe size. Upgrade of the existing tailings thickener. Upgrade of the tailings thickening underflow pumps and pipes. Upgrade of the tailings disposal pumps and pipes.
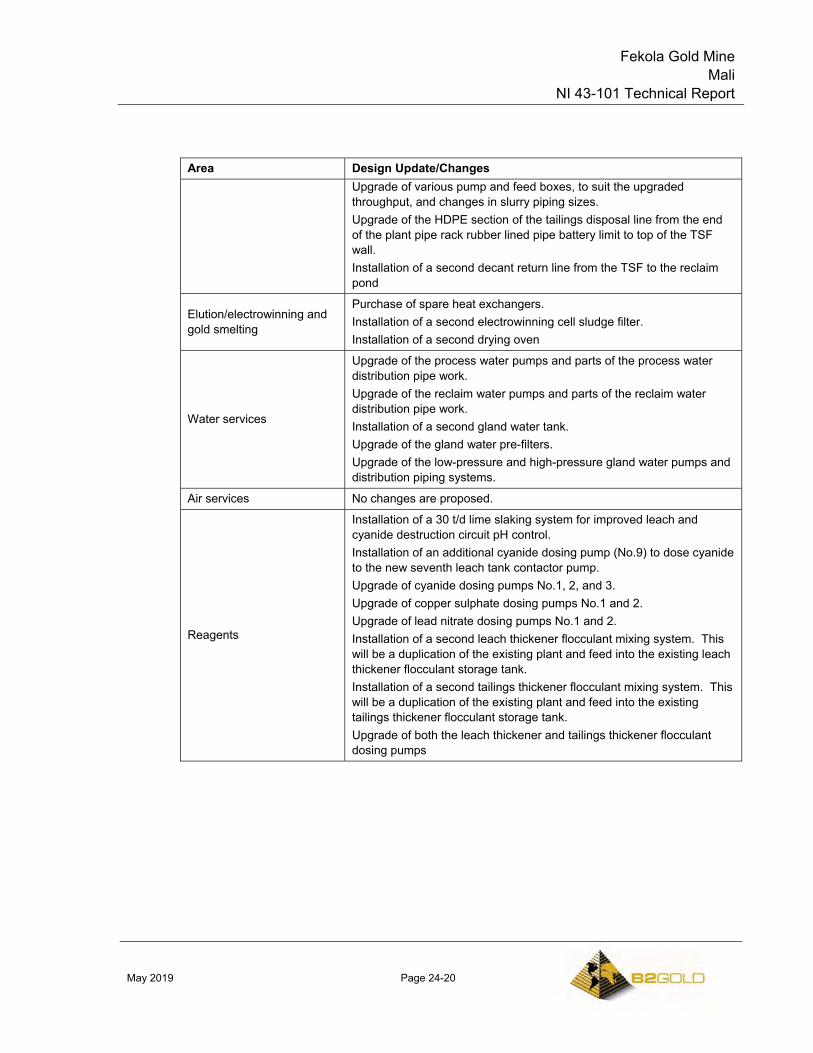
Fekola Gold Mine Mali
NI 43-101 Technical Report
May 2019 Page 24-20
Area Design Update/Changes Upgrade of various pump and feed boxes, to suit the upgraded throughput, and changes in slurry piping sizes. Upgrade of the HDPE section of the tailings disposal line from the end of the plant pipe rack rubber lined pipe battery limit to top of the TSF wall. Installation of a second decant return line from the TSF to the reclaim pond
Elution/electrowinning and gold smelting
Purchase of spare heat exchangers. Installation of a second electrowinning cell sludge filter. Installation of a second drying oven
Water services
Upgrade of the process water pumps and parts of the process water distribution pipe work. Upgrade of the reclaim water pumps and parts of the reclaim water distribution pipe work. Installation of a second gland water tank. Upgrade of the gland water pre-filters. Upgrade of the low-pressure and high-pressure gland water pumps and distribution piping systems.
Air services No changes are proposed.
Reagents
Installation of a 30 t/d lime slaking system for improved leach and cyanide destruction circuit pH control. Installation of an additional cyanide dosing pump (No.9) to dose cyanide to the new seventh leach tank contactor pump. Upgrade of cyanide dosing pumps No.1, 2, and 3. Upgrade of copper sulphate dosing pumps No.1 and 2. Upgrade of lead nitrate dosing pumps No.1 and 2. Installation of a second leach thickener flocculant mixing system. This will be a duplication of the existing plant and feed into the existing leach thickener flocculant storage tank. Installation of a second tailings thickener flocculant mixing system. This will be a duplication of the existing plant and feed into the existing tailings thickener flocculant storage tank. Upgrade of both the leach thickener and tailings thickener flocculant dosing pumps
Fekola Gold Mine Mali
NI 43-101 Technical Report
May 2019 Page 24-21
Crushed mill feed material reclaimed from the stockpile, will be conveyed to the SAG mill feed chute. Process water will be added to the SAG mill feed chute, to control the in-mill pulp density. The SAG mill will be fitted with discharge grates to allow slurry to pass through the mill and also relieve the mill of pebble build-up. The SAG mill product will discharge to a single deck vibrating screen, for pebble sizing and dewatering.
Grinding media (125 mm balls) will be added to the SAG mill via direct dump onto the SAG mill feed conveyor. SAG mill discharge screen oversize will be conveyed to a pebble crushing circuit. Undersize from the discharge screen will flow by gravity to the cyclone feed pump box, where it will combine with the discharge slurry from the ball mill. The slurry will then be pumped to the cyclone cluster by one of two (duty/standby) variable-speed cyclone feed pumps. Process water will be added to the cyclone feed pump box for cyclone feed density control.
The cyclone cluster overflow will flow by gravity through a metallurgical sampler then onto three linear trash screens in a parallel configuration. Trash screen undersize will be directed to the leach thickener feed whilst trash screen oversize will be discharged to trash dewatering screens for trash collection and disposal. Slurry from the cyclone underflow launder will be returned to the ball mill feed chute with optional underflow slurry recycle to the SAG mill. Ball mill discharge will pass through the ball mill trommel prior to discharging to the cyclone feed pump box. Reject oversize material, from the ball mill trommel screen will be collected within the ball mill scats bunker.
Pebble Crushing
Oversize from the SAG mill discharge screen will be conveyed to the pebble crusher feed bin, via two belt conveyors. Two self-cleaning belt magnets will be positioned in the conveying circuit to remove any scrap metal and steel media which can potentially damage the pebble crusher.
Pebbles will pass under a metal detector, then discharge into the pebble crusher feed bin. The feed bin will provide surge capacity ahead of the pebble crushers and will allow a controlled feed to be presented to the crushers which provides a choke-feed condition and consistent power draw. Should the pebble crushers not be operational, or the metal detector detect tramp metal, a diverter gate ahead of the feed bin will allow pebbles to bypass the bin and crushers and feed directly to the pebble crusher discharge conveyor.
Pebbles will be withdrawn from the pebble crusher feed bin, by variable speed vibrating feeders. Two pebble crushers will be installed, and operate in a duty/standby arrangement. The pebble crusher will discharge crushed pebbles directly onto the pebble crusher discharge conveyor which in turn will return the crushed pebbles to the SAG mill feed conveyor.
Fekola Gold Mine Mali
NI 43-101 Technical Report
May 2019 Page 24-22
Leach Thickening
Trash screen undersize will flow by gravity directly to the leach thickener feed box, where flocculant will be added to aid with particle settling. Overflow solution from the leach thickener will flow by gravity to the leach thickener overflow tank and will then be pumped to the carbon in columns circuit. Underflow from the leach thickener will be pumped to the leach feed distribution box. A thickener recycle pump will be included to improve thickener operational flexibility when running, and ensure compaction of the thickener bed does not occur if the thickener is off-line for a plant shutdown.
Carbon in Columns Circuit
Leach thickener overflow will be pumped to the CIC circuit. The CIC circuit will recover gold in solution from the grinding circuit, then pump the discharge solution, which is cyanide-bearing solution, to the process water tank for reuse in the grinding circuit.
A common carbon transfers pump will transfer carbon forward throughout the columns counter-current to the flow of solution. A second carbon transfer pump will recover carbon to the loaded carbon recovery screen for gold carbon desorption. Approximately twice per week, loaded carbon from the first carbon column will be pumped, by the second carbon transfer pump, to the loaded carbon recovery screen. The screen solution underflow will flow by gravity to the carbon column of origin whilst the loaded carbon will flow by gravity to the acid wash column.
Regenerated carbon (or fresh carbon) will be added to the CIC circuit, from the carbon regeneration circuit. The regenerated carbon (or fresh carbon) will be pumped to the CIC circuit via the CIC carbon sizing screen. The sizing screen will remove excess water and carbon fines. The dewatered carbon will discharge into the last, online, CIC tank with excess water and carbon fines will be directed to the carbon fines collection hopper for further removal from the circuit.
Leach Circuit
Leach thickener underflow will be pumped to the leach feed distribution box. The slurry from the leach feed distribution box will flow by gravity to the first leach tank.
The leach circuit will consist of seven mechanically agitated, leach tanks operating in series. This equates to a residence time of over 21 hrs at a design feed rate of 7.5 Mt/a. Each leach tank will have a live volume of 3,900 m³.
Carbon in Pulp Circuit
The CIP circuit will consist of six, mechanically agitated, CIP tanks operating in series. This provides a residence time of 5 hrs for a plant throughput of 7.5 Mt/a. Each CIP tank will have a live volume of 1,100 m³.
Fekola Gold Mine Mali
NI 43-101 Technical Report
May 2019 Page 24-23
The leaching circuit will dissolve the remaining gold in solid and the CIP circuit will recover this dissolved gold in solution by carbon adsorption. Activated carbon will be retained in each of the CIP tanks by an inter-tank screen.
As the slurry flows by gravity through the CIP tanks, the carbon will be advanced counter-current to the slurry flow. Carbon advancement will be achieved by the CIP carbon transfer pumps, of which there is one transfer pump per CIP tank.
Approximately six times per week, loaded carbon from the first CIP tank will be pumped to the loaded carbon recovery screen, where it will be washed with spray water to remove excess slurry. The excess slurry (screen underflow) will flow by gravity to the CIP tank of origin whilst the loaded carbon will flow by gravity to the acid wash column.
Regenerated carbon (or fresh carbon) will be added to the CIP circuit, from the carbon regeneration circuit. The regenerated carbon (or fresh carbon) will be pumped to the CIP circuit via the CIP carbon sizing screen. The sizing screen will remove excess water and carbon fines. The dewatered carbon will discharge into the last, online, CIP tank with excess water and carbon fines will be directed to the carbon fines collection hopper for further removal from the circuit.
Slurry discharging the last CIP tank will flow by gravity to the CIP carbon safety screen. The carbon safety screen will capture and recover any carbon exiting the CIP circuit. The safety screen oversize will report to a fine carbon skip bin while the undersize will be pumped to the cyanide destruction feed box.
Acid Wash, Elution, Electrowinning and Gold Room
The Fekola desorption circuit will consist of separate acid wash and elution columns. A cold acid wash will be used for removal of inorganic foulants. Following acid wash, gold will be eluted from the carbon, using a Pressure Zadra elution process. An average daily carbon movement of 14 t will satisfy the required carbon movements for both the CIC and CIP circuits.
Carbon Regeneration
After elution, the carbon will be hydraulically transferred from the elution column to the carbon regeneration circuit.
Cyanide Destruction
CIP tailings will be pumped to the cyanide destruction tank where cyanide destruction will be achieved using the SO2/air process.
Fekola Gold Mine Mali
NI 43-101 Technical Report
May 2019 Page 24-24
24.4.5 Tailings Thickening and Disposal
Slurry from the cyanide destruction circuit will be pumped to the tailings thickener feed box. Flocculant will be added to the tailings thickener to enhance the settling properties of the solids. Overflow from the tailings thickener will flow by gravity to the reclaim water pond.
Tailings thickener underflow will be pumped to the tailings pump box. Two tailings pumps, in series configuration, will pump to the TSF and discharge the slurry via spigots around the circumference of the dam. Water from the surface of the TSF will be recovered from the decant system and pumped back to the reclaim water pond. Underdrainage and seepage from around the TSF drainage system will be pumped into the TSF for recovery by the decant return water pump.
24.4.6 Plant Control System
The plant control system will include a moderate level of automation and monitoring. The process plant will be provided with one main control room, and operator interface terminals will be provided in the distributed control system hardware office, main plant control room, crusher control room, and elution circuit area.
24.4.7 Energy, Water, and Process Materials Requirements
Power
The power demand for the processing plant, along with the rest of the site and camp, will be provided by on-site power generation using HFO and diesel fuel. The average annual LOM projected power requirement for the process plant is a 7.5 Mt/a throughput is estimated at 306,000 MW.
Water
The process plant will use process water, reclaim water, fresh water, treated water, gland water and potable water. Any shortfall of process water will be made up, preferentially, from water contained within the reclaim water pond. If insufficient water is available within the reclaim water pond, fresh water will be used for make up to the reclaim water pond. An event pond, which will hold any overflow from the process plant and stormwater collected from around the process plant, will be pumped to the reclaim pond when necessary.
Process water will predominantly consist of leach thickener overflow and reclaim water make-up. Reclaim water will primarily consist of tailings thickener overflow, decant return water from the TSF and fresh water make-up. Fresh water for potable water use will be sourced from dedicated potable water bores.
Fekola Gold Mine Mali
NI 43-101 Technical Report
May 2019 Page 24-25
Fresh water for the process plant and mining operation will be sourced from active pit dewatering bores. The location of the pit dewatering bores will change as the mining progresses through the stages of the mine life. The bores will pump predominantly to the fresh water storage pond, and if required, the bores can pump to the fresh water tank.
Process Materials
The major process materials required include:
• Quicklime (CaO) for pH control;
• Sodium cyanide (NaCN) for gold dissolution and desorption;
• Lead nitrate (Pb(NO3)2) for enhancing gold dissolution;
• Sodium hydroxide (caustic soda; NaOH) for carbon acid washing neutralisation and desorption.
• Hydrochloric acid (HCl) for carbon acid washing;
• Sodium metabisulphite (SMBS) for cyanide destruction;
• Copper sulphate pentahydrate (CuSO4.5H2O) for cyanide destruction;
• Flocculant for thickening;
• Antiscalant to minimise scaling in the process water distribution, reclaim water distribution, fresh water distribution, gland water distribution, and elution circuit;
• Fluxes for smelting;
• Low- and high-pressure air services;
• Oxygen;
• Steel balls for SAG and ball mill grinding media.
Reagent usage will increase at the expanded plant throughput and with it the requirement to maintain adequate reagent storage will also increase. Provision has been made to increase the reagent storage building capacity.
Additional storage for plant maintenance spares is also required. Provision has been made for installation of a new plant maintenance warehouse, approximately 50 m x 30 m as part of the expansion upgrade
24.5 2019 PEA Project Infrastructure
24.5.1 Introduction
Surface infrastructure to support the current operations is in place, and includes:
Fekola Gold Mine Mali
NI 43-101 Technical Report
May 2019 Page 24-26
• One open pit;
• Processing facilities: grinding and leaching facilities, along with management and engineering offices, change house, workshop, warehouse, and expanded assay laboratory facilities;
• Mine facilities: management and engineering offices, change house, expanded EMV and light vehicle workshops, wash bay, warehouse, explosives magazine, crusher, mine access gate house, return water pump house;
• Administration buildings: facilities for overall site management, safety inductions, and general and administrative functions;
• Accommodation camp;
• Waste rock storage facilities;
• Tailings storage facilities;
• Water management facilities: stormwater and water storage dams, diversions, culverts;
• Landfill facility;
• Power generation facility;
• Fuel storage facilities: HFO and diesel.
A layout plan showing the facilities constructed to support mining operations, and potential sites for additional infrastructure that will be needed for the 2019 PEA is provided in Figure 24-7.
24.5.2 Road and Logistics
No change is forecast to the existing road network or airport in the 2019 PEA.
The Fekola Mine is accessible by road via a 20 km gravel road which intersects the existing Millennium Highway 25 km east of the town of Kéniéba. The Millennium Highway is a surfaced road in good condition, with access to the capital city of Bamako approximately 450 km to the east and to the port of Dakar approximately 1,100 km to the west.
Plant internal roads provide access between the administration area, process plant facilities, fuel storage, power plant, mine services area, and accommodation camp. A number of access tracks exist to access infrastructure such as the tailings storage facility, sediment control structures and water bore pumps remote from the plant site.
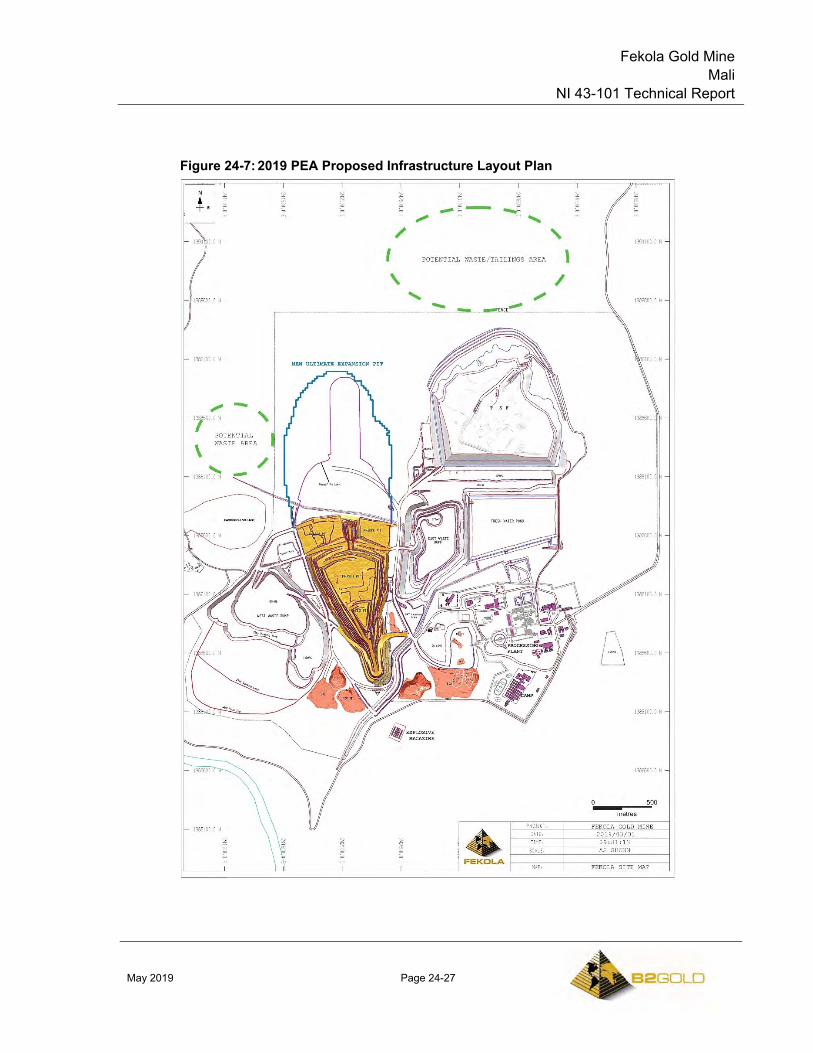
Fekola Gold Mine Mali
NI 43-101 Technical Report
May 2019 Page 24-27
Figure 24-7: 2019 PEA Proposed Infrastructure Layout Plan
Fekola Gold Mine Mali
NI 43-101 Technical Report
May 2019 Page 24-28
An 1,800 m long (1,600 m active length) x 30 m wide all-weather gravel airstrip provides for secure transport of bullion, transportation of mine personnel, and emergency medivac purposes. The airstrip is designed to suit a Beech Craft 1900 type aircraft or similar.
24.5.3 Stockpiles
Stockpiles include low-grade, medium-grade, and active ROM stockpiles. The stockpiles are located to the east of the Fekola open pit or adjacent to the ROM pad (refer to Figure 24-7). The stockpiles have sufficient LOMP storage capacity; however, they could be expanded vertically and horizontally as needed.
Active stockpiles (medium and high grade) are located on the ROM pad.
24.5.4 Waste Storage Facilities
Waste rock storage facility design is discussed in Section 24.1.3.
Waste rock storage facilities are located to the west of the ultimate pit (refer to Figure 24-7). An overall slope angle of 18° was used in the design of the WRSFs with 5 m wide berms developed at 10 m vertical intervals. The remaining WRSF capacity is about 200 Mt, and there is sufficient footprint area available to add capacity if needed.
24.5.5 Tailings Storage Facilities
Current TSF
The current TSF is located in the valley to the north of the plant site and open pit, adjacent to the eastern waste rock storage facility. The TSF is designed to store a total of 62 Mt of tailings. The TSF consists of a valley storage formed by a single downstream multi-zoned earthfill embankment, lined with HDPE, comprising a total footprint area (including the basin area) of approximately 200 ha at the ultimate TSF height.
The TSF embankment will be designed for annual raises to suit storage requirements. Downstream raise construction methods are proposed throughout operations. The embankment will consist of an upstream low permeability zone (Zone A) and downstream structural fill zone (Zone C). The embankment upstream face will be lined with HDPE liner. The embankment will have an operating upstream and downstream slope of 3H:1V and a minimum crest width of 8 m.
The TSF design will incorporate a basin underdrainage system to reduce pressure head acting on the geomembrane liner, reduce seepage, increase tailings densities, and improve the geotechnical stability of the embankments. The underdrainage system will consist of a network of branch drains reporting to collector drains situated in natural drainage courses. Underdrains will include perforated plastic pipes, covered in sand/gravel drainage material and wrapped in geotextile. The underdrainage system
Fekola Gold Mine Mali
NI 43-101 Technical Report
May 2019 Page 24-29
will drain by gravity to a collection sump located at the lowest point in the TSF basin. Solution recovered from the underdrainage system will be released to the top of the tailings mass via submersible pump, reporting to the supernatant pond.
Supernatant water will be removed from the TSF via submersible pumps located within decant towers. The supernatant pond will be maintained on the northern edge of the TSF basin. Solution recovered from the decant system will be pumped back to the plant for re-use in the process circuit.
The TSF will have sufficient capacity to completely contain all design criteria storm events and rainfall sequences (24- hr, 72-hr, dry annual rainfall and wet annual rainfall; average recurrence interval of one-in-100 years). Under normal operating conditions, with the TSF managed in accordance with standard operating procedures, the available stormwater storage capacity will be in excess of the design storm event volumes and no discharge from the TSF will be expected. In the event that a storm event greater than the TSF design criteria occurs that exceeds the available storage capacity during operation, rainfall and supernatant which cannot be attenuated and stored with the supernatant pond will discharge from the TSF in a controlled manner via an engineered spillway (spillway storm event design criteria one-in-100 year recurrence interval (critical duration), occurring when supernatant pond is at spillway inlet level).
The closure spillway will be excavated from the final supernatant pond location, running north through the ridge and off site. The closure spillway will allow conveyance of probable maximum precipitation, 24-hr duration storm event (critical duration, occurring when supernatant pond is at spillway inlet level) without significant attenuation in the TSF.
Tailings will be discharged into the TSF by sub-aerial deposition, using a combination of spigots at regularly spaced intervals from the embankments and the eastern and western perimeter of the TSF.
A pipeline containment trench will be constructed to contain both the tailings delivery pipeline and decant return pipeline between the TSF and plant site, as the flow in both pipelines will be contaminated and cannot be discharged to the environment if the pipeline bursts. The pipeline trench will be situated adjacent to the main access road and will drain to a designated catchment pond.
A monitoring program for the TSF will be developed to monitor for any potential problems which may arise during operations.
The final layout of the current TSF is provided in Figure 24-8.
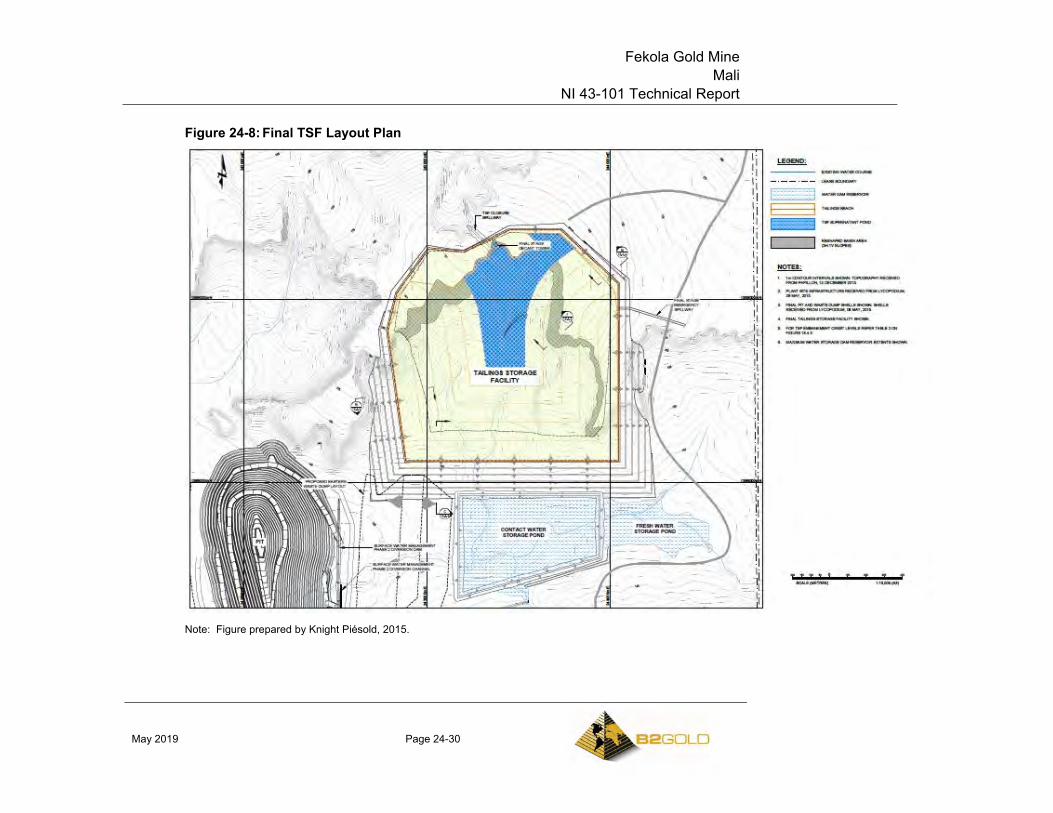
Fekola Gold Mine Mali
NI 43-101 Technical Report
May 2019 Page 24-30
Figure 24-8: Final TSF Layout Plan
Note: Figure prepared by Knight Piésold, 2015.
Fekola Gold Mine Mali
NI 43-101 Technical Report
May 2019 Page 24-31
Additional TSF
Additional tailings storage capacity will be required for the proposed processed tonnage. The 2019 PEA mine plan will process a total of 83.9 Mt. This exceeds the design capacity of 62 Mt of the existing TSF.
A valley to the north of the existing TSF has been identified as a potential TSF location (refer to Figure 24-7) for operations starting in 2026 through 2030, and B2Gold is studying alternative tailings storage options including tailings and waste rock co-disposal.
24.5.6 Water Management
No change to the existing Project water management methods is envisaged in the 2019 PEA.
The Fekola Mine is located in an existing natural drainage course, with an upstream catchment of 9 km2. The site surface water management system is designed to prevent runoff from events up to and inclusive of a one-in-100-year recurrence interval (varying duration; 24-hr, 72-hr dry annual rainfall and wet annual rainfall) storm event from entering the pit. Water management structures include a settling pond, diversion channels, a freshwater storage pond, and sediment control structures.
All water falling directly on the industrial areas (contacted water) or otherwise contacted (fissure water from the open pit, return and storm water from the TSF) is captured in storm-water settling ponds, where it is either used in the mining and processing facilities or during the prolonged rainy season released to the site diversion channels and the Falémé River.
An assessment of the flooding extent of the Falémé River was carried out to determine inundation risk to project infrastructure, particularly the Fekola open pit. Flood modelling was completed by Knight Piésold. The predicted flood inundation level for the section of the Falémé River adjacent to the Fekola Mine (in particular at the open pit), does not encroach on the current pit outline. A peak flood level of approximately 130.5 m would be required to result in pit flooding. Based on the frequency analysis of the flood levels, a flood resulting in a peak flood level of 130.5 m is estimated to be greater than a one-in-1,000-year recurrence interval (critical duration).
24.5.7 Camps and Accommodation
No change to the existing Project accommodation camp is envisaged in the 2019 PEA.
B2Gold employees live in the surrounding communities and in the on-site camp. The on-site camp is fully secured and has facilities to house and support over 400 people, including VIP, Executive, Senior, and Standard dormitories. The camp includes entertainment, fitness, and medical facilities.
Fekola Gold Mine Mali
NI 43-101 Technical Report
May 2019 Page 24-32
24.5.8 Power and Electrical
No change to the existing Project power station or power supply is envisaged in the 2019 PEA.
Power will be generated by a dedicated power station that will be a combination of HFO and diesel-fuelled generators located adjacent to the process plant. The power plant has been sized to accommodate a maximum demand power draw of 29.4 MW.
A solar power facility may be a future power option. Diesel and HFO will continue to be transported to the mine site from Dakar by road.
24.5.9 Fuel
No change to the existing Project fuel supply is envisaged in the 2019 PEA.
A storage facility with minimum 30 days fuel supply will continue to support the generators and mobile equipment (mining fleet).
24.5.10 Water Supply
No change to the existing Project water supply is envisaged in the 2019 PEA.
Potable water will be supplied from bore holes.
Process water will be sourced from the clean water dam, which will be fed from the dewatering wells and, if needed, from the Falémé River.
Water for dust suppression and other mining-related requirements will be sourced from various sources including pit dewatering sumps, settling ponds, and the contact water pond.
24.6 2019 PEA Market Studies and Contracts
No change is forecast to the existing marketing or contracts approach in the 2019 PEA.
24.6.1 Market Studies
No market studies are currently relevant as the Fekola Mine is operating, producing a readily-saleable commodity in the form of doré. It is expected that doré produced under the 2019 PEA assumptions will also be sent to the Metalor refinery in Switzerland.
24.6.2 Commodity Price Projections
Commodity prices used in Mineral Resource estimates are set by B2Gold corporately. The current gold price provided for Mineral Resource estimation is $1,400/oz. The 2019 PEA assumed a gold price of $1,300/oz Au for pit optimization, cash flow and NPV calculations.
Fekola Gold Mine Mali
NI 43-101 Technical Report
May 2019 Page 24-33
24.6.3 Contracts
Major contracts are likely to include fuel supply, blasting explosives and accessories, and grade control drilling. Contracts will be negotiated and renewed as needed. Contract terms are expected to be within industry norms, and typical of similar contracts in Mali that B2Gold is familiar with.
24.6.4 Comments on Market Studies and Contracts
The doré produced in the 2019 PEA scenario is expected to be readily marketable. Metal prices are set corporately for Mineral Resource estimation, and the gold price used for Mineral Resources was $1,400/oz.
The QP has reviewed commodity pricing assumptions, marketing assumptions and the current major contract areas, and considers the information acceptable for use in the 2019 PEA mine plan and in the 2019 PEA economic analysis.
24.7 Environmental Studies, Permitting, and Social or Community Impact
24.7.1 Introduction
The current regulatory and permitting structure and status, the environmental and social setting and the environmental and social management of potential impacts identified in the 2018 LOMP are also applicable to the proposed Fekola Mine expansion in the 2019 PEA. Information relating to environmental studies, permitting, and social or community impact remain substantially the same for the 2019 PEA as were discussed in Section 20. Those data are reproduced here for completeness, and include notations as to any differences as a result of the mine expansion contemplated in the 2019 PEA.
24.7.2 Environmental Impact Assessment and Permitting Process
The proposed changes to the Fekola Mine as a result of the proposed Fekola Mine expansion in the 2019 PEA would require the completion and submittal of an Environmental Notice to regulatory authorities (i.e., DNACPN) to assess the potential impacts from the expansion. If approved, a separate environmental permit would be issued for the Fekola Mine expansion; this permit would likely include various environmental and/or social permit conditions.
There may be other required permits or authorizations or required modifications to existing permits or authorizations. B2Gold assumes that all requisite approvals and permits for the expansion will be obtained. While it is believed that such approvals and permits can be obtained on a timely basis and on acceptable terms, there is no certainty that this will be the case.
Fekola Gold Mine Mali
NI 43-101 Technical Report
May 2019 Page 24-34
B2Gold’s self-screening assessment did not identify environmental or social fatal flaws due to the Fekola Mine expansion as outlined in the 2019 PEA; however, additional study (e.g., surface hydrology, hydrogeology, mine materials geochemical characterization) is required to fully understand the potential environmental and social impacts. Any identified potential negative impacts will need to be managed to ensure that they are reduced to acceptable levels. Necessary mitigation and management measures will be incorporated into the Fekola Mine environmental and social management plans.
The closure cost assumptions used for the 2019 PEA are the same costs as used in the 2018 LOMP. Closure planning would be required to incorporate the changes from the proposed Fekola Mine expansion, including increased footprints for the open pit, WRSFs and TSF. While additional closure study and planning is required, and additional closure costs would be incurred if the expansion were carried out, it is currently not anticipated that the Fekola Mine expansion would significantly alter the closure concepts for the Fekola Mine or its major facilities. Closure costs will likely increase from those used in the 2019 PEA when final mine planning and designs are complete.
Additional details regarding the Fekola Mine expansion environmental and social setting, the self-screening fatal flaw assessment of potential key impacts, permitting and closure are presented in the following sections.
24.7.3 Environmental and Social Setting
The Fekola mine expansion anticipated in the 2019 PEA would occur within the delineated study areas for environmental and socio-economic baseline and other studies for the existing Fekola Mine. As such, the environmental and social setting for the proposed Fekola mine expansion is the same as for the existing Fekola Mine.
Physical Setting
The Fekola Mine is located adjacent to the Falémé River, a major tributary to the Senegal River. The river width is variable from 10–45 m in the vicinity of the Project. There is significant variation in seasonal flows of the Falémé River with approximately 90% of annual flow occurring during the wet season months. Flows at Fadougou gradually decrease over the dry season from November (median flow 35.5 m³/s) to very little flow at the end of the dry season in the months of March (median flow of 5.6 m³/s) and April (median flow 3.9 m³/s). Annual flow is also highly variable year to year.
There are a number of ephemeral creeks that drain the Fekola Mine area, all of which drain to the Falémé River (Figure 24-9).

Fekola Gold Mine Mali
NI 43-101 Technical Report
May 2019 Page 24-35
Figure 24-9: Local Drainage Map of the Fekola Mine Area and Médinandi Exploitation Licence Surrounds
Note: Figure prepared by Earth Systems, 2015.
Fekola Gold Mine Mali
NI 43-101 Technical Report
May 2019 Page 24-36
Key ephemeral creeks in the Médinandi exploitation licence include:
• Drainage 1: located in the northern extent of the Médinandi exploitation licence;
• Drainage 2: located to the west of Old Fadougou village;
• Drainage 3: which passes through the proposed location of the mine pit, waste rock dump, low grade ore stockpile, TSF, and water supply dams;
• Drainage 4: located to the south of the No-go Zone (refer to Section 20.4.4 for explanation of this area).
Groundwater storage in the vicinity of the Fekola Mine area is highly dependent upon rainfall and evaporation balances. Recharge of aquifers is expected to occur during the wet season when rainfall exceeds the evaporation rate, while discharge is expected to occur via evapotranspiration and the river bed. Groundwater bores in the Fekola Mine area show groundwater is reached at approximately 2–5 m below ground level, with observed baseline seasonal variation of approximately 4–5 m. There is no significant abstraction of groundwater in the Fekola Mine area other than pit dewatering by the Fekola Mine itself; however, villages in the vicinity rely on bore holes for domestic water use, drinking water and artisanal mining.
Water quality of the Falémé River is generally good, with near neutral pH, low conductivity and low total metals concentrations. Exceptions to this include high total suspended solids (TSS) found locally in baseline studies at the monitoring site adjacent to Old Fadougou village. Operational monitoring has also indicated elevated levels of iron and aluminum, likely from natural background and/or artisanal mining in the area. Groundwater is also generally of good quality. Exceptions include nitrate, metals (and metalloids) including iron and arsenic, and coliform concentrations exceeding applicable drinking water quality standards in community water drill holes (e.g., Tintiba, Médinandi, Old Fadougou, and New Fadougou). Such elevated concentrations in community water drill hole groundwater samples are likely to be associated with aquifer contamination from disposal of village and sewage wastes close to the village water drill hole.
Geochemical characterisation testwork indicated that the mine materials (waste rock, tailings, low-grade ore and construction materials) are likely to be non-acid forming and not likely to leach significant quantities of metals/metalloids to the receiving environment (Knight Piésold, 2015). Initial internal operational geochemical monitoring of mine materials confirms the previous characterization testwork.
Baseline air quality and noise in the vicinity of the Fekola Mine area are typical of rural areas in the region, and no major industrial sites are located nearby. Air quality is affected by sources such as dust from unpaved roads and Harmattan winds, burning, open cooking, livestock farming, and mining. Noise emissions in the vicinity of the Fekola Mine largely originate from human activity, primarily vehicle and motorcycle use on roads and pathways and artisanal mining, both domestic and wild animals, and insect
Fekola Gold Mine Mali
NI 43-101 Technical Report
May 2019 Page 24-37
activity. Baseline noise monitoring was undertaken during the wet season and has continued during operations. Baseline ambient (LAeq) daytime noise levels in Old Fadougou village were recorded to slightly exceed the IFC ambient daytime noise criterion of 55 dB(A), while night-time ambient noise levels were slightly below IFC criteria. Operational monitoring has indicated slight exceedances of IFC ambient daytime and nighttime noise criteria.
Biological Setting
A Biodiversity Baseline Study and Impact Assessment was conducted by Epoch Resources in January 2013 for the Project’s 2013 ESIS. To supplement this information, aquatic ecology surveys in the vicinity of the Project were undertaken by INGRID S/C Groupe Sapiens International as part of the 2015 EISA Update, and several additional studies of priority habitats and species have been conducted by Earth Systems, as part of the 2015 ESIA Update and continuing into operations.
Additional priority habitats and species studies carried out within the Project region. These additional studies provide supplementary ecological information to assist the Fekola Mine to better understand potential impacts to these environmental aspects and to adapt its mitigation and management measures if necessary.
There are no protected areas within or near to the Fekola Mine area. The Fekola Mine is located in the western part of the West Sudanian Savannah ecoregion (1,638,426 km2). This broad ecoregion is covered by Sahelo-Sudanian/Sudanian vegetation consisting of savannah types, gallery forests, woodland and an understorey of shrubs, grasses and herbs. Vegetation is highly influenced by the two distinct seasons of the ecoregion; the hot/dry season and the wet season. The habitats in this ecoregion have been greatly reduced and fragmented by agricultural activities, fire, and timber harvesting, while populations of most of the larger mammal species have been decimated by overhunting.
The aquatic environments of the Fekola Mine are within the ‘Senegal-Gambia freshwater ecoregion’. This freshwater ecoregion consists of tropical and subtropical floodplains, rivers and wetland complexes. The Senegal–Gambia freshwater habitats are considered nationally important and are also considered ‘vulnerable’ due to existing threats.
One of the most important and influential ecological features in the vicinity of the Project is the Falémé River and its associated tributaries. The reach of the Falémé River directly downstream of the Fekola Mine is not within any protected areas and it is not protected itself. Seasonally-inundated wetlands are located in the Fekola Mine development area and surrounding areas, as well as along the Falémé River.
The main terrestrial habitat types within the Fekola Mine development area are tree savannah, shrub savannah, woody savannah, gallery forest, and bowal. All habitat
Fekola Gold Mine Mali
NI 43-101 Technical Report
May 2019 Page 24-38
types have moderate levels of disturbance. Signs of disturbance include land use changes (e.g. cultivation and grazing), timber harvesting, uncontrolled burning and artisanal mining. Some areas of gallery forest in the north of the Fekola Mine development area have been highly disturbed or cleared, while patches of gallery forest along the Falémé River are relatively intact.
Baseline and subsequent field studies have confirmed the presence of several priority species in the vicinity of the Fekola Mine. These species include the West African chimpanzee (IUCN listed as Critically Endangered), the hooded vulture (Critically Endangered) and the African lion (Endangered), and the hippopotamus (Vulnerable).
Three globally-vulnerable plants were also identified in the Project development area during field surveys: Afzelia africana, Khaya senegalensis, and Vitellaria paradoxa.
No globally-threatened aquatic flora or fauna was identified within the Falémé River in the initial dry season surveys conducted; however, there was high fish diversity recorded indicating that the river is in relatively good ecological condition. Along with many phytoplankton, zooplankton and macro invertebrates, the Nile crocodile (Crocodylus niloticus), and two endemic fish occur in the Falémé River near the Project development area: the freshwater rat-tail (Gymnarchus niloticus) and the African electric catfish (Malapterurus electricus).
Social Setting
The following description of the Fekola Mine area social setting includes information collected during baseline study to the current date; however, at this time the village of Old Fadougou is in the process of being relocated, which will significantly alter this social setting. This relocation will greatly reduce potential negative impacts to the community members living in the village of Old Fadougou, however, until the relocation is complete the setting of and impacts to the village of Old Fadougou are still relevant and Old Fadougou is discussed here.
The rural landscape surrounding the Fekola Mine area is sparsely populated and mostly undeveloped. Kéniéba, the nearest sizeable town and the administrative headquarters of the prefecture, is located approximately 40 km north of the Project. The Project is situated within the Kéniéba gold belt, which contains a dense concentration of mineral exploration licences and several operational gold mines including Randgold’s Gounkoto and Loulo Projects and Endeavour Mining’s Tabakoto and Segala Projects.
There are 22 settlements identified within an approximately 10 km of the Fekola Mine area, including along the mine access road (Figure 24-10). Notably one large village (Old Fadougou) with a total of 1,355 people, and 255 households (per 2012 census), is located within 1 km of the Fekola Mine infrastructure. It has been observed that recent in-migration to this village is currently resulting in population increases.

Fekola Gold Mine Mali
NI 43-101 Technical Report
May 2019 Page 24-39
Figure 24-10: Proximity Map of Villages in the Area Surrounding the Project
Fekola Gold Mine Mali
NI 43-101 Technical Report
May 2019 Page 24-40
Consistent with other parts of the region, the Malinke are the dominant ethnic group in Old Fadougou village, comprising more than 85% of the population. The Malinke language is the most common language in Old Fadougou, spoken by 47% of households, followed by Bambara (28% of households).
The major economic/livelihood activities in the communities surrounding the Project are subsistence agriculture (farming and livestock) and artisanal mining (including some semi-industrial scale operations). Currently, 13 artisanal mining sites have been identified in the permit area, 10 of which are active. Internal migration is common in Mali, particularly in the gold mining areas of southwestern Mali.
Approximately 44% of the population in Old Fadougou village are below the age of 20 years old and 49% of the population were between 21 to 46 years old, representing 93.3% of the population (2012). The primary schooling rate for Kéniéba is 61%, whereby the schooling rate of the Old Fadougou village and surrounding villages is reported at 75% for the 2012 to 2013 year. There are primary schools in Old Fadougou and Médinandi; however, there are no secondary schools close to the Fekola Mine.
Health infrastructure in the vicinity of the Fekola Mine is limited. The nearest hospital to the Fekola Mine is located in Kéniéba. Old Fadougou has one Community Health Centre, one private clinic/infirmary and one pharmacy, while among the closest villages and hamlets, only Médinandi also has a private clinic. Malaria is common in the Kéniéba district. There are also other water and sanitation related illnesses due to poor sanitation and waste management standards. Nutritional issues contribute to health problems due to a shortage in some food supplies in the local area.
Authorities have stated in the past that the water supplies to the local villages surrounding the Fekola Mine were insufficient for the population, with three manual pump bores in Old Fadougou, and one in each of the other three closest villages. In 2018, B2Gold invested in 14 additional water drill holes with handpumps and one water tower to improve access to potable water significantly (i.e., potable water access now meets international standards) within all the villages of the Médinandi exploitation licence.
No electricity-related generation or distribution infrastructure is located in the local villages apart from privately-owned diesel generators used only for mining operations. Under the New Fadougou resettlement project (see Section 20.4.4), all the new houses built by B2Gold are equipped with solar panels.
Firewood is the most common form of energy used in the area for cooking and lighting. Accessibility in the area is generally poor, particularly in the wet season. Unformed dirt tracks connect villages and hamlets in the local area and provide access to Kéniéba. These are important transport routes for residents for employment, education and livelihood purposes; including the closest markets in Kéniéba or Kolomba. Two mobile
Fekola Gold Mine Mali
NI 43-101 Technical Report
May 2019 Page 24-41
telephone networks are available in most surrounding villages however internet is not accessible in the local villages.
There are no known sites of international or national archaeological or cultural heritage significance within the Fekola Mine area or surrounds. However, surveys identified 34 archaeological and cultural sites within the broad Médinandi exploitation licence area, including ancient habitats, scree mounds, iron reduction sites, worship sites, memorial sites, and a place of refuge. Several of these are located in the direct vicinity of the Fekola Mine footprint.
24.7.4 Key Environmental and Social Potential Impacts
No formal specialist studies of environmental or social potential impacts have been conducted at this time. A “fatal flaw” self-screening of potential impacts from the Fekola Mine expansion as envisaged in the 2019 PEA was conducted; key findings are presented as follows:
• Biodiversity: the Fekola Mine expansion as contemplated in the 2019 PEA would require an ultimate additional disturbed area footprint of about 165 ha, an additional 38 ha compared to the 2018 LOM Fekola Mine disturbed area footprint. This additional disturbed area could lead to additional loss of habitat for priority species;
• Surface hydrology and surface water quality: Surface water hydrology in the Fekola Mine area would be impacted by the expansion of current facilities or the construction of additional facilities (i.e., the open pit, TSF and Waste Storage Facilities, mostly in drainage 3 (e.g., potential additional decrease in flows in drainage 3 downstream of the Fekola Mine footprint). In the event that future water abstraction from the Falémé River is required to supplement the Fekola Mine expansion, a minimum environmental flow will need to be established, below which the Mine will not abstract water, in order to protect downstream water use, and base aquatic ecology. The primary impact to surface water quality from the expansion is from an increase in generated suspended sediments, primarily during the construction phase and then reducing during the operations and closure phases;
• Groundwater and groundwater quality: The groundwater cone of depression surrounding the open pit would become larger with the expansion of the open pit (associated with additional dewatering). The village wells for Fadougou and Médinandi are within the current zone of groundwater level drawdown, and any additional impacts to groundwater levels would have to be monitored. In the event that water supply from the village wells is interrupted, alternative water supplies would have to be identified and provided to the impacted communities;
Fekola Gold Mine Mali
NI 43-101 Technical Report
May 2019 Page 24-42
• Access to land resources: The communities in the Project area rely on land resources to make a subsistence living, primarily via small scale farming and/or artisanal mining activities. The Fekola Mine expansion, however, is not expected to have a significant additional impact on land resource access as the impacted lands are contained within the current No-Go Zone;
• The village of Old Fadougou: The village of Old Fadougou, being in immediate proximity to the Fekola Mine, is the most significantly impacted community by the Fekola Mine (e.g., noise and vibration, fugitive dust, safety risks such as vehicle traffic and blast fly rock, and land access). The extension of the open pit to the north would potentially increase some of these negative impacts; however, the decision to resettle the village of Old Fadougou to the village of New Fadougou significantly reduces these potential impacts.
B2Gold’s self-screening assessment did not identify environmental or social fatal flaws due to the Fekola Mine expansion, however, additional study (e.g., surface hydrology, hydrogeology, mine materials geochemical characterization) is required to fully understand the potential environmental and social impacts. Any identified potential negative impacts will need to be managed to ensure that they are reduced to acceptable levels. Necessary mitigation and management measures will be incorporated into the Fekola Mine environmental and social management plans.
24.7.5 Closure
B2Gold’s overall objective for mine closure is to prevent or minimise adverse long-term environmental, physical, social and economic impacts for the greater Fekola Mine area and to create stable landforms that provide self-sustaining natural ecosystems within the Fekola Mine development area. An RMCP has been developed as the first step in providing a clear methodology for progressive rehabilitation and planning for decommissioning and closure for the Fekola Mine. The aim of the RMCP is to provide a rehabilitation and closure framework that will be refined throughout the life of the Project to ultimately achieve mine closure.
Ongoing refinement of the RMCP will require community consultation regarding intended end postmining land use for the Fekola Mine development area and development of the methodology for clearly defining success or failure of rehabilitation (completion criteria). In subsequent versions of the RMCP, B2Gold will develop a consistent approach to performance monitoring and identify maintenance and/or remedial measures required for rehabilitation that promote the achievement of completion criteria to avoid or minimise residual impacts to the satisfaction of Fekola Mine stakeholders.
Concurrent rehabilitation will be conducted during the life of the mine to the extent practical to minimize impacts and lower the environmental liability at closure. These
Fekola Gold Mine Mali
NI 43-101 Technical Report
May 2019 Page 24-43
rehabilitation measures are currently in their initial stages, focused on test plot and pilot programs to establish successful rehabilitation techniques and refine specific rehabilitation objectives and success criteria. In 2018, trial testing of approximately 8 ha of disturbed land were rehabilitated, including final slope contouring and revegetation.
B2Gold prepares and updates annually the Asset Retirement Obligation cost estimate of the Fekola Mine. Costs are provided by B2Gold and its consultants and contractors, or where costs are not available supplemental costs are used from other sources including similar mining projects. Closure costs are estimated annually as of the end of the calendar year. Closure costs at the end of the mine life will differ. Concurrent rehabilitation is in the preliminary stages at the Fekola Mine and will be conducted during the life of the mine to the extent practical to minimize impacts and lower the environmental liability at closure; however, the bulk of the rehabilitation and closure costs are not expected to be incurred until the cease of operations. If the mine were to close prior to the expected end of mine life, the bulk of the closure costs would be incurred at this time.
The estimated Asset Retirement Obligation cost estimate for the Fekola Mine as of 31 December 2018 is approximately US$32.1 M.
Closure planning would be required to incorporate the changes in the 2019 PEA, including increased footprints for the open pit, WRSFs and TSFs. While additional closure study and planning is required and additional closure costs would be incurred if the expansion were carried out; it is currently not anticipated that the Fekola Mine expansion would significantly alter the closure concepts for the Fekola Mine or its major facilities. Closure costs will likely increase from $28.7 M that have been allocated in the financial analysis that supports the 2019 PEA.
The 2012 Mining Code requires mining companies to post financial security for costs associated with the mine reclamation and long-term protection of the environment relating to potential impacts from the Fekola Mine. B2Gold has reached an agreement with the Malian government to fund an escrow account based on a production basis (i.e. per tonne of material processed), and there will be an accompanying escrow agreement on how and when the funds can be used or released based on the site’s evolving reclamation status and environmental liability.
24.7.6 Permitting
Various permits and authorizations are required for the Fekola Mine, and are applicable to the mine expansion contemplated in the 2019 PEA. The following sub-sections provide a brief summary of the status of key permits.
Fekola Gold Mine Mali
NI 43-101 Technical Report
May 2019 Page 24-44
Environmental Permit
The environmental permit for the Fekola Mine was granted to Songhoi by the Ministry of Environment and Sanitation via Decision No. 2013-0033MEA-SG on 29 April 2013. The permit required that Songhoi began construction of the Fekola Mine within three years of the issue of the permit. Songhoi began construction of the Fekola Mine in 2015. The permit also allows the government to perform an environmental audit of the Project every five years. In August 2018, the government performed the first of these environmental audits and renewal of the environmental permit was received on 14 March 2019. A recommendation from the audit was that B2Gold submit the 2015 ESIA Update for regulatory approval. The 2015 ESIA Update was submitted in early 2019 and approval of the 2015 ESIA Update is expected in May or June 2019. The 2015 ESIA Update will then serve as the documentation of record for the Fekola Mine. The environmental permit should remain unchanged.
The permit also includes six clauses with conditions/requirements relating to the following:
• Air quality;
• Soil conservation;
• Surface water and groundwater quality;
• Noise and safety;
• Cultural heritage;
• Land appropriation.
Environmental Permit for Access Road
A second environmental permit, for the access road from the Millennial Highway near Sekondo village to the mine site, was granted to Songhoi by the Ministry of Environment and Sanitation via Decision No. 2015-0002MEADD-SG on 16 March 2015. Similar to the environmental permit approval for the Fekola Mine, the access road approval required that the road be constructed within three years of the issue of the permit and allows the government to perform an environmental audit of the access road every five years. Construction of the access road commenced in 2015.
The access road permit requires that the requirements of the Fekola Mine main environmental permit be met, as well as five clauses specific to this authorization relating to:
• Air quality;
• Soil conservation;
Fekola Gold Mine Mali
NI 43-101 Technical Report
May 2019 Page 24-45
• Surface water and groundwater;
• Health, safety, employment and quality of life;
• Cultural heritage.
B2Gold has engaged in a process of restitution to return control of the access road to authorities. Once this process is complete, the permit renewal process and/or permit clauses may change; however, B2Gold does not anticipate any changes to have a material impact on the Fekola Mine.
Mining Permit
The mining permit for the Fekola Mine was granted to Songhoi by the Secretary General via Decree No. 2014-0070/PM-RM, dated 13 February 2014, and signed by the Minister of Mines and the Prime Minister of Mali. The permit is valid for up to 30 years, renewable for 10-year periods until the Mineral Reserves are depleted.
Approval of Community Development Plan
As part of the ESIA process, the Fekola Mine was required to submit a CDP for approval. A CDP, dated 24 June 2013, was submitted to the Ministry of Land Administration, Decentralization and Regional Planning and approved by the Kéniéba Prefect authorities via Decision No. 13-041/PCK, dated 04 July 2013.
The National Mining Code requires mining companies to produce a multi-year CDP upon commencement of production, including the establishment of a Local Development Committee. B2Gold developed an updated CDP in 2018 in collaboration with local communities and authorities. The 2018 CDP was approved by the Prefecture of Kéniéba via Decision No. 2018-146/PCK.
Approval of Mine Closure Plan
As part of the process for the granting of an exploitation licence under the 2012 Mining Code, the Fekola Mine is required to submit a mine closure plan. A mine Conceptual Closure Plan, dated April 2013, was submitted to the Ministry of Mines as part of the exploitation licence application. By granting the Médinandi exploitation licence to Songhoi, the Ministry of Mines and the government of Mali approved all documents submitted in support of the exploitation licence application including the submitted Conceptual Closure Plan.
The 2015 ESIA Update documentation contains an updated RMCP, dated September 2015. Once the 2015 ESIA Update is accepted by regulatory authorities, the updated RMCP will serve as the approved document of record.
Fekola Gold Mine Mali
NI 43-101 Technical Report
May 2019 Page 24-46
Additional Permits and Authorizations
Several additional permits and authorizations are required for the Fekola Mine and related proposed expansion. A brief summary of these permits is presented in Table 24-7.
Other than as outlined above, B2Gold is not aware of significant permits or environmental factors that may affect the right or ability to conduct all activities involved in the continued operation and eventual closure of the Fekola Mine. Additionally, B2Gold is not aware of reasons why additional operational permits will not be granted.
24.8 2019 PEA Capital and Operating Costs
Capital and operating cost estimates for the 2019 PEA have been factored from the 2018 LOMP and have an estimated accuracy of ±35%.
24.8.1 Capital Costs
The capital cost estimate for the 2019 PEA is factored from the 2018 LOMP. Capital costs included in the 2019 PEA are based largely on the existing operating plan for the Fekola Mine. Costs consider historical analysis, equipment purchase price quotes, and estimates from design and construction contractors.
The main capital costs associated with the 2019 PEA are a mine fleet expansion, and a process plant expansion. The mining fleet expansion is estimated at $56.0 M and is expected to begin operation in early 2020. The process plant expansion cost is estimated to be $48.5 M, with $24.2 M planned to be spent in 2019, and the remaining $24.3 M spent in 2020.
A model for tailings costs per cumulative volume was created by the Whittle Consulting Group to estimate expected capital cost of the tailings dam construction through the life of mine. Figure 24-11 shows the estimated cost per million cubic metres of tailings for the 2019 PEA scenario, versus the known cost for the current life-of-mine plan.
The final five years of the 2019 PEA TSF dam raise capital cost allowance, estimated to be $32.4 M for that period, will be used to construct an alternate TSF for operations starting in 2026 through 2030.
Capital allowances are also made in the 2019 PEA for other categories of capital associated with the proposed expansion versus the existing operating plan for the Fekola Mine. These categories include equipment replacement, equipment addition, site general, and other non-operating costs.
The costs for construction of the additional WRSFs required for the 2019 PEA mine plan are included in the mining operating costs.
The capital cost estimate for the 2019 PEA is summarized in Table 24-8.

Fekola Gold Mine Mali
NI 43-101 Technical Report
May 2019 Page 24-47
Table 24-7: Summary of Key Additional Permits and Authorizations Required
Permit/Authorization Ministry / Department Comment/Status (as at 23 April 2019)
Water abstraction from Falémé River Ministry of Water and Power Production Obtained 30 May 2017
Water abstraction via pit and water drill hole dewatering
Ministry of Water and Power Production Obtained 30 May 2017
Operations protection area Ministry of Mines Obtained 25 October 2018
Airfield construction Ministry of Equipment and Transportation Obtained 15 April 2015
Authorization for national flights at Fekola Ministry of Equipment and Transportation Obtained 24 September 2018
Medical clinic operation authorization Ministry of Health Obtained 18 May 2015
Camp construction Ministry of Housing, Urban Development and Land Affairs Obtained 26 November 2015
Sand and gravel extraction Ministry of Environment and Sanitation Obtained 26 February 2015
Radio license Ministry of Communication Obtained 10 May 2015
Fuel storage permit Ministry of Security Obtained 19 June 2018
Solid waste management authorization Ministry of Environment and Sanitation
Under Environmental Permit, renewed 14 March 2019
Landfill environmental permit Ministry of Environment and Sanitation
Under Environmental Permit, renewed 14 March 2019
Wastewater discharge permit Ministry of Environment and Sanitation
Under Environmental Permit, renewed 14 March 2019
Chemical use approval Ministry of Environment and Sanitation
Under Environmental Permit, renewed 14 March 2019
Chemical storage authorization Ministry of Environment and Sanitation
Under Environmental Permit, renewed 14 March 2019
Explosives use authorization Ministry of Mines Obtained 23 January 2019
Authorization to clear protected tree species
Ministry of Environment and Sanitation (Regional)
Under Environmental Permit, renewed 14 March 2019
Authorization for power production Ministry of Energy Obtained 6 January 2017
ESIA and RAP for the resettlement of Old Fadougou village
Ministry of Environment and Sanitation (National Direction)
Obtained 30 December 2016
Land attribution for the resettlement of Old Fadougou village
Ministry of Housing, Urban Development and Land Affairs Obtained 20 November 2017
Urban Development Plan for the resettlement of Old Fadougou village
Ministry of Housing, Urban Development and Land Affairs (Regional)
Obtained 26 April 2017
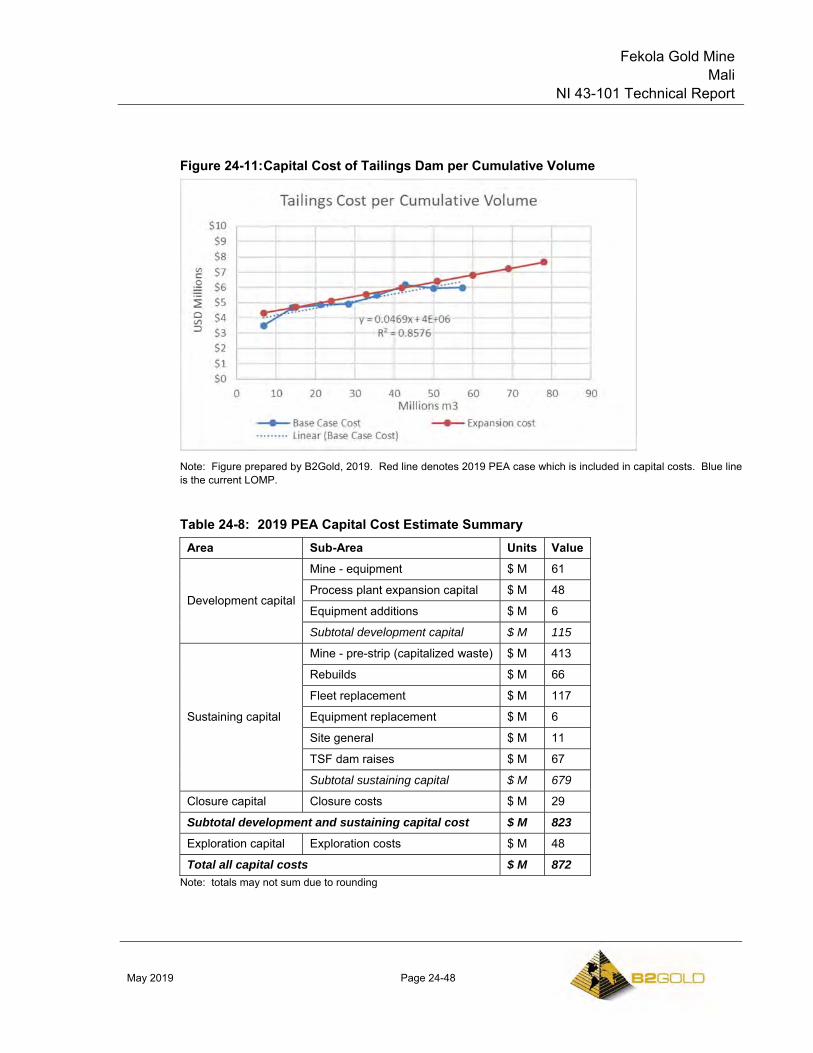
Fekola Gold Mine Mali
NI 43-101 Technical Report
May 2019 Page 24-48
Figure 24-11: Capital Cost of Tailings Dam per Cumulative Volume
Note: Figure prepared by B2Gold, 2019. Red line denotes 2019 PEA case which is included in capital costs. Blue line is the current LOMP.
Table 24-8: 2019 PEA Capital Cost Estimate Summary Area Sub-Area Units Value
Development capital
Mine - equipment $ M 61
Process plant expansion capital $ M 48
Equipment additions $ M 6
Subtotal development capital $ M 115
Sustaining capital
Mine - pre-strip (capitalized waste) $ M 413
Rebuilds $ M 66
Fleet replacement $ M 117
Equipment replacement $ M 6
Site general $ M 11
TSF dam raises $ M 67
Subtotal sustaining capital $ M 679
Closure capital Closure costs $ M 29
Subtotal development and sustaining capital cost $ M 823
Exploration capital Exploration costs $ M 48
Total all capital costs $ M 872 Note: totals may not sum due to rounding
Fekola Gold Mine Mali
NI 43-101 Technical Report
May 2019 Page 24-49
24.8.2 Operating Costs
Where appropriate, adjustments are made to costs to best reflect the proposed operations.
Mining costs cover activities related to drill and blast, load and haul, dewatering and pumping, dumps, haul roads, grade control and technical services, and are modelled as variable and period costs. Variable costs are costs which change with mine production, and include costs for fuel, consumables/supplies, maintenance, and other costs which are directly tied to the 2019 PEA mine plan. Period costs are time-related costs which are incurred regardless of production; these costs include labour, contractors, power and fuel, maintenance, and other supplies not directly tied to the mine plan. Mining costs include provision for additional WRSFs. Total mining costs vary year over year depending on the operational plan. Over the 2019 PEA mine life, the anticipated mining cost is $1.66/t mined.
Processing costs include all activities related to crushing, grinding, gravity circuit, Leaching, carbon in column, carbon in pulp, carbon elution & regeneration, cyanide destruction, electrowinning and refining, tailings storage facility, water reclaim, reagent systems, and the metallurgical laboratory. Processing costs are modelled as variable and period costs. Variable costs are costs which change with plant production, consisting largely of consumables/supplies and power costs, as well as maintenance and other allocations. Period costs are time related costs which are incurred regardless of production, including labour, contractors, and a portion of maintenance and other distributed costs. Total process costs vary year over year depending on the operational plan. Over the 2019 PEA process life, the process cost is estimated to be $15.56/t milled.
General and administrative costs are modelled as period costs. These include period costs for power plant operation, administrative labour and supplies costs, camp costs, information technology services, health and safety, environmental, security, supply chain, and accounting costs. Total G&A costs vary year over year depending on the operational plan. Over the 2019 PEA process life, the G&A cost is projected to be $3.69/t milled. A shipping and refining cost of $4.13/oz is applied to ounces processed. This is benchmarked to operational data from the Fekola Mine.
The anticipated LOM operating costs for the 2019 PEA are summarized in Table 24-9.
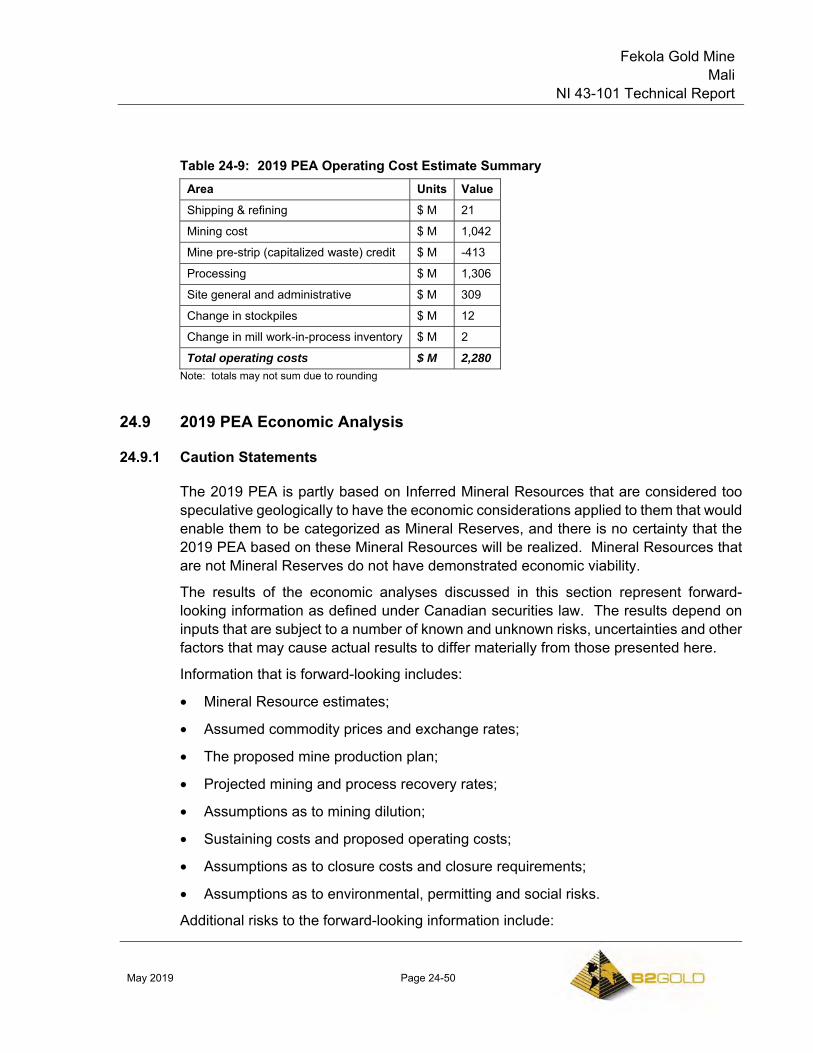
Fekola Gold Mine Mali
NI 43-101 Technical Report
May 2019 Page 24-50
Table 24-9: 2019 PEA Operating Cost Estimate Summary Area Units Value Shipping & refining $ M 21
Mining cost $ M 1,042
Mine pre-strip (capitalized waste) credit $ M -413
Processing $ M 1,306
Site general and administrative $ M 309
Change in stockpiles $ M 12
Change in mill work-in-process inventory $ M 2
Total operating costs $ M 2,280 Note: totals may not sum due to rounding
24.9 2019 PEA Economic Analysis
24.9.1 Caution Statements
The 2019 PEA is partly based on Inferred Mineral Resources that are considered too speculative geologically to have the economic considerations applied to them that would enable them to be categorized as Mineral Reserves, and there is no certainty that the 2019 PEA based on these Mineral Resources will be realized. Mineral Resources that are not Mineral Reserves do not have demonstrated economic viability.
The results of the economic analyses discussed in this section represent forward- looking information as defined under Canadian securities law. The results depend on inputs that are subject to a number of known and unknown risks, uncertainties and other factors that may cause actual results to differ materially from those presented here.
Information that is forward-looking includes:
• Mineral Resource estimates;
• Assumed commodity prices and exchange rates;
• The proposed mine production plan;
• Projected mining and process recovery rates;
• Assumptions as to mining dilution;
• Sustaining costs and proposed operating costs;
• Assumptions as to closure costs and closure requirements;
• Assumptions as to environmental, permitting and social risks.
Additional risks to the forward-looking information include:
Fekola Gold Mine Mali
NI 43-101 Technical Report
May 2019 Page 24-51
• Changes to costs of production from what is assumed;
• Unrecognized environmental risks;
• Unanticipated reclamation expenses;
• Unexpected variations in quantity of mineralized material, grade or recovery rates;
• Geotechnical or hydrogeological considerations during mining being different from what was assumed;
• Failure of mining methods to operate as anticipated;
• Failure of plant, equipment or processes to operate as anticipated;
• Changes to assumptions as to the availability of electrical power, and the power rates used in the operating cost estimates and financial analysis;
• Ability to maintain the social licence to operate;
• Accidents, labour disputes and other risks of the mining industry;
• Changes to interest rates;
• Changes to tax rates.
The production schedules and financial analysis annualized cash flow table are presented with conceptual years shown. Years shown in these tables are for illustrative purposes only. Additional mining, technical, and engineering studies are planned to support potential conversion of some or all of the Mineral Resources to Mineral Reserves, which may alter the assumptions as discussed in the 2019 PEA and this Report, and may result in changes to the calendar timelines presented.
24.9.2 Methodology Used
The Project has been valued using a discounted cash flow (DCF) approach. Estimates have been prepared for all the individual elements of cash revenue and cash expenditures for ongoing operations.
Capital cost estimates have been prepared for initial development and construction of the Project, in addition to ongoing operations (sustaining capital). 2019 was defined as the first year of initial capital expenditure, and cash flows are assumed to occur at the beginning of each period.
The resulting net annual cash flows are discounted back to the date of valuation of start-of-year 2019, because the actual starting calendar year has not been determined. The currency used to document the cash flow is US$Q1 2019, considering that the estimation was developed during the first quarter of 2019. A discount rate of 5% was assumed.
Fekola Gold Mine Mali
NI 43-101 Technical Report
May 2019 Page 24-52
24.9.3 Financial Model Parameters
Mineral Resource and Mine Life
The subset of Mineral Resources included in the 2019 PEA was provided in Table 24-2.
The assumed mine life is 11 years, with a process life of 12 years, from Jan. 1, 2019.
Metallurgical Recoveries
The financial model assumes a LOM metallurgical recovery of 94%.
Smelting and Refining Terms
Smelting and refining costs are assumed to be $4.13/oz Au.
Metal Prices
The 2019 PEA assumes a gold price of $1,300/oz Au.
Capital and Operating Costs
The capital cost estimate was included as Table 24-8 and the operating cost estimate in Table 24-9.
Royalties and Stamp Duties
Royalties and stamp duties included in the economic model are:
• 3% ISCP rate;
• 3% ad valorem tax on gold and other precious metals;
• 1.65% royalty to ZTS;
• 0.6% stamp duty.
The overall projected royalty and stamp duty payment is 8.25%, or a total $533 M payable over the 2019 PEA life of mine.
Working Capital
A working capital allocation of $11 M was included in 2020 to account for increased spares associated with the expanded mine fleet and process plant. The assumption was made that all of the working capital can be recovered at Project termination. The Fekola Mine has an opening supplies balance of $43 M which was also assumed to be recovered at project termination.
Fekola Gold Mine Mali
NI 43-101 Technical Report
May 2019 Page 24-53
Taxes
Corporate income tax in Mali is 30% under the 2012 Mining Code. For exploitation license holders, there is a 15-year period from the start of production where the corporate income tax is reduced to 25%.
In addition, a new tax has been introduced applying to holders of an exploitation license that produce, in one year, more than 10% of the expected quantity fixed in the annual production program approved by its shareholders' general assembly. This new tax consists of standard taxes and rights applying to operations and results relating to overproduction.
B2Gold has applied a corporate tax rate of 25% to the 2019 PEA economic model and has assumed that the overproduction tax will not be incurred during the mine life.
Value-added tax (VAT) is payable in Mali; however, the 2012 Mining Code has a provision that exploitation license holders have a three-year VAT and other customs and duties exemption period commencing from the start of commercial production (December 2017). Beyond the exemption period, VAT and duties have been included in the capital and operating costs as appropriate.
Closure Costs and Salvage Value
No salvage value was allocated. Closure costs are estimated at $28.7 M.
Financing
The base case economic analysis assumes 100% equity financing and is reported on a 100% project ownership basis. B2Gold holds an 80% interest in the Médinandi Exploitation License and the State of Mali holds a 20% interest.
Inflation
The base case economic analysis assumes constant prices with no inflationary adjustments. Capital and operating costs are based on first quarter 2019 United States dollars.
24.9.4 Financial Results
The pre-tax cumulative cash flow is estimated at $2,808 M. The post-tax cumulative cash flow is $2,150 M. The post-tax cash flow at a 5% discount rate is $1,674 M.
IRR and payback for the 2019 PEA are not presented because with 100% financing, neither is applicable; and because the cash flow is positive in all years of the 2019 PEA process plan.
Fekola Gold Mine Mali
NI 43-101 Technical Report
May 2019 Page 24-54
Table 24-10 is a summary of the key financial metrics. Table 24-11 provides the cash flow forecast on an annualized basis.
24.9.5 Sensitivity Analysis
A sensitivity analysis was performed taking into account variations in metal prices, metal grades processed, operating costs and capital costs (Figure 24-12 and Table 24-12).
The 2019 PEA shows the project envisaged is most sensitive to, from most to least, to variations in gold price, grade processed, operating costs, and then capital costs.
24.10 Comments on 2019 PEA
Using the assumptions set out for the 2019 PEA in this Report, the project envisaged shows a positive cash flow in all years of planned operation.
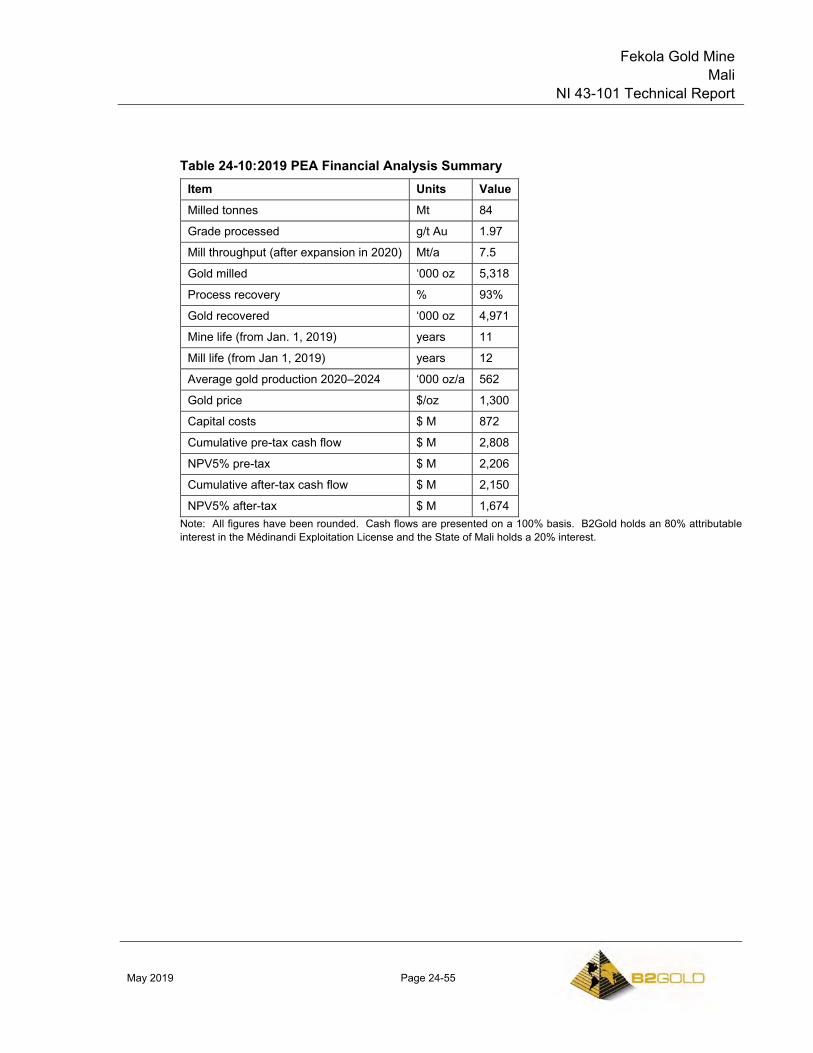
Fekola Gold Mine Mali
NI 43-101 Technical Report
May 2019 Page 24-55
Table 24-10: 2019 PEA Financial Analysis Summary Item Units Value Milled tonnes Mt 84
Grade processed g/t Au 1.97
Mill throughput (after expansion in 2020) Mt/a 7.5
Gold milled ‘000 oz 5,318
Process recovery % 93%
Gold recovered ‘000 oz 4,971
Mine life (from Jan. 1, 2019) years 11
Mill life (from Jan 1, 2019) years 12
Average gold production 2020–2024 ‘000 oz/a 562
Gold price $/oz 1,300
Capital costs $ M 872
Cumulative pre-tax cash flow $ M 2,808
NPV5% pre-tax $ M 2,206
Cumulative after-tax cash flow $ M 2,150
NPV5% after-tax $ M 1,674 Note: All figures have been rounded. Cash flows are presented on a 100% basis. B2Gold holds an 80% attributable interest in the Médinandi Exploitation License and the State of Mali holds a 20% interest.
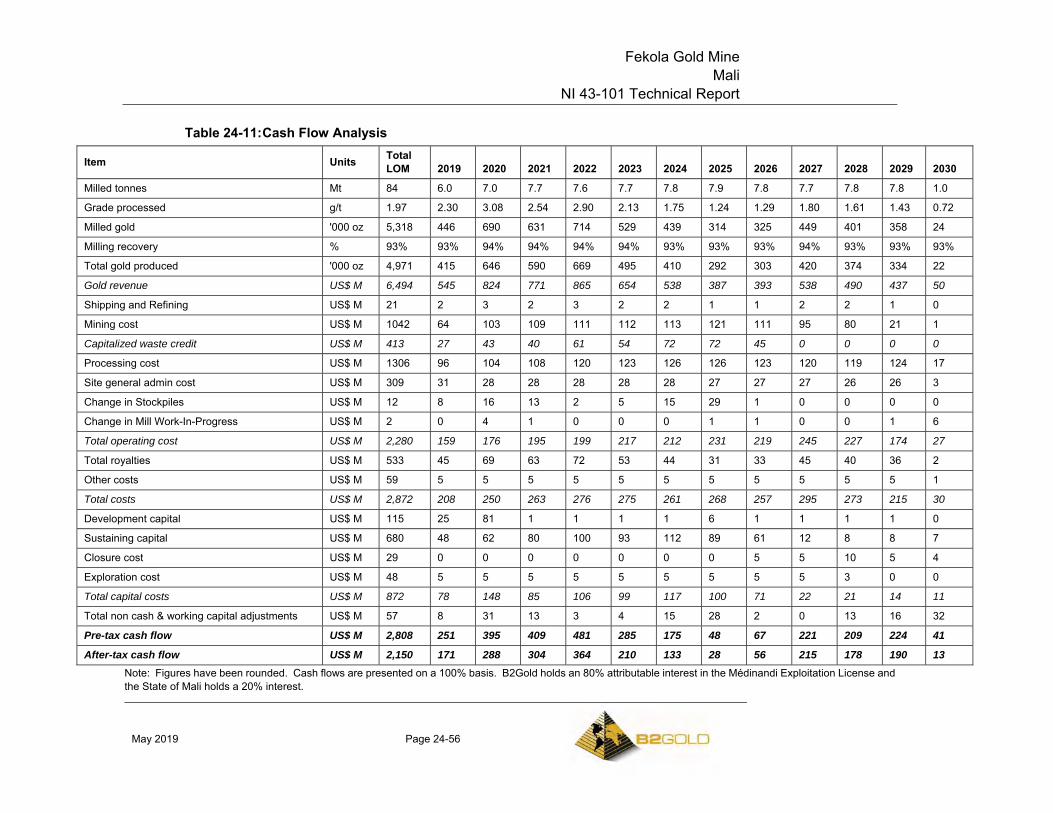
Fekola Gold Mine Mali
NI 43-101 Technical Report
May 2019 Page 24-56
Table 24-11: Cash Flow Analysis
Item Units Total LOM 2019 2020 2021 2022 2023 2024 2025 2026 2027 2028 2029 2030
Milled tonnes Mt 84 6.0 7.0 7.7 7.6 7.7 7.8 7.9 7.8 7.7 7.8 7.8 1.0
Grade processed g/t 1.97 2.30 3.08 2.54 2.90 2.13 1.75 1.24 1.29 1.80 1.61 1.43 0.72
Milled gold '000 oz 5,318 446 690 631 714 529 439 314 325 449 401 358 24
Milling recovery % 93% 93% 94% 94% 94% 94% 93% 93% 93% 94% 93% 93% 93%
Total gold produced '000 oz 4,971 415 646 590 669 495 410 292 303 420 374 334 22
Gold revenue US$ M 6,494 545 824 771 865 654 538 387 393 538 490 437 50
Shipping and Refining US$ M 21 2 3 2 3 2 2 1 1 2 2 1 0
Mining cost US$ M 1042 64 103 109 111 112 113 121 111 95 80 21 1
Capitalized waste credit US$ M 413 27 43 40 61 54 72 72 45 0 0 0 0
Processing cost US$ M 1306 96 104 108 120 123 126 126 123 120 119 124 17
Site general admin cost US$ M 309 31 28 28 28 28 28 27 27 27 26 26 3
Change in Stockpiles US$ M 12 8 16 13 2 5 15 29 1 0 0 0 0
Change in Mill Work-In-Progress US$ M 2 0 4 1 0 0 0 1 1 0 0 1 6
Total operating cost US$ M 2,280 159 176 195 199 217 212 231 219 245 227 174 27
Total royalties US$ M 533 45 69 63 72 53 44 31 33 45 40 36 2
Other costs US$ M 59 5 5 5 5 5 5 5 5 5 5 5 1
Total costs US$ M 2,872 208 250 263 276 275 261 268 257 295 273 215 30
Development capital US$ M 115 25 81 1 1 1 1 6 1 1 1 1 0
Sustaining capital US$ M 680 48 62 80 100 93 112 89 61 12 8 8 7
Closure cost US$ M 29 0 0 0 0 0 0 0 5 5 10 5 4
Exploration cost US$ M 48 5 5 5 5 5 5 5 5 5 3 0 0
Total capital costs US$ M 872 78 148 85 106 99 117 100 71 22 21 14 11
Total non cash & working capital adjustments US$ M 57 8 31 13 3 4 15 28 2 0 13 16 32
Pre-tax cash flow US$ M 2,808 251 395 409 481 285 175 48 67 221 209 224 41
After-tax cash flow US$ M 2,150 171 288 304 364 210 133 28 56 215 178 190 13 Note: Figures have been rounded. Cash flows are presented on a 100% basis. B2Gold holds an 80% attributable interest in the Médinandi Exploitation License and the State of Mali holds a 20% interest.
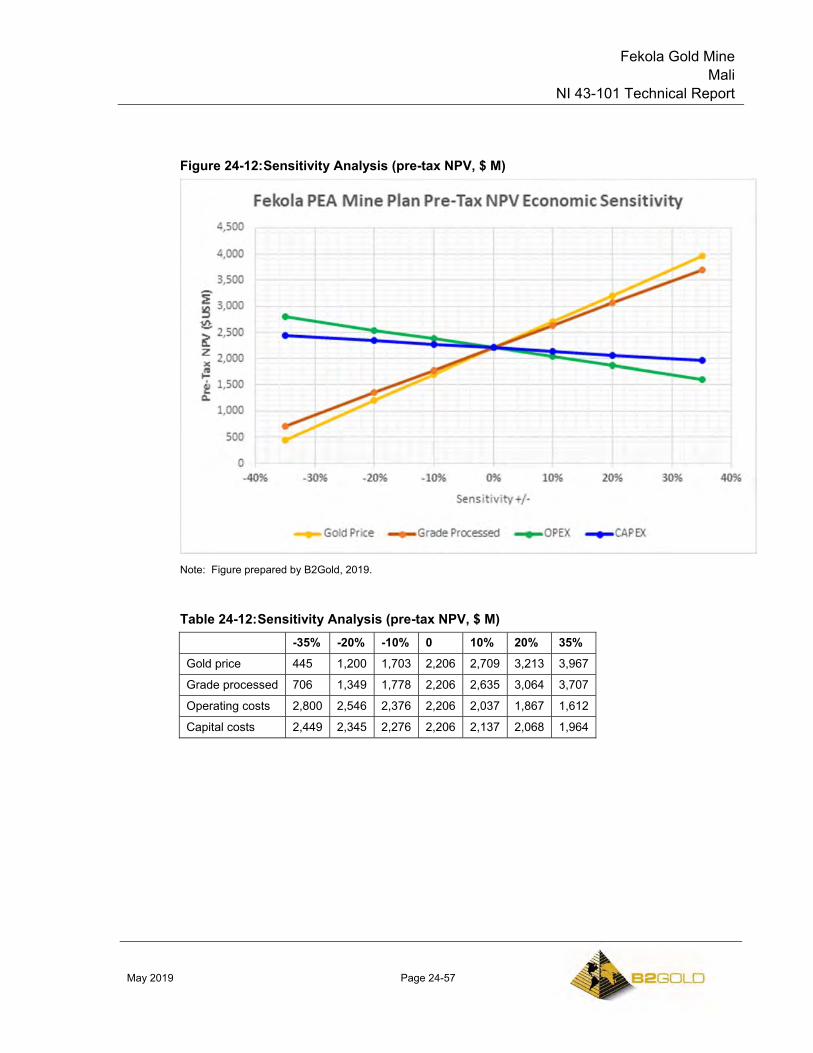
Fekola Gold Mine Mali
NI 43-101 Technical Report
May 2019 Page 24-57
Figure 24-12: Sensitivity Analysis (pre-tax NPV, $ M)
Note: Figure prepared by B2Gold, 2019.
Table 24-12: Sensitivity Analysis (pre-tax NPV, $ M) -35% -20% -10% 0 10% 20% 35%
Gold price 445 1,200 1,703 2,206 2,709 3,213 3,967
Grade processed 706 1,349 1,778 2,206 2,635 3,064 3,707
Operating costs 2,800 2,546 2,376 2,206 2,037 1,867 1,612
Capital costs 2,449 2,345 2,276 2,206 2,137 2,068 1,964
Fekola Gold Mine Mali
NI 43-101 Technical Report
May 2019 Page 25-1
25.0 INTERPRETATION AND CONCLUSIONS
25.1 Introduction
The QPs note the following interpretations and conclusions in their respective areas of expertise, based on the review of data available for this Report.
25.2 Mineral Tenure, Surface Rights, Water Rights, Royalties/Agreements
Information obtained from B2Gold experts supports that the support that the mineral tenure held is valid, and the granted exploitation licence is sufficient to support a declaration of Mineral Resources and Mineral Reserves at Fekola, and the granted exploration permit is sufficient to support a declaration of Mineral Resources at Anaconda.
Malian law provides for private individuals and companies to own surface rights under a formal titling and registration system, but in the Project area there are no private surface owners. However, the State of Mali owns all surface rights in the Fekola Mine area, and no surface rights have been registered to a private entity.
Water rights are granted, and sufficient to support mining operations.
Gold and other precious metals are levied under the 2012 Mining Code at a 3% royalty rate. There is also an additional 3% tax on gold production. The settlement for the purchase on a 10% minority interest held by ZTS Traore in the Fekola project included an additional 1.65% royalty, which is due to ZTS.
The Fekola Project is not subject to any other back-in rights payments, agreements or encumbrances.
To the extent known to the QP, there are no other significant factors and risks that may affect access, title, or the right or ability to perform work on the Project that have not been discussed in this Report.
25.3 Geology and Mineralization
The Fekola deposit is considered to be an example of a disseminated orogenic gold deposit.
The geological understanding of the settings, lithologies, and structural and alteration controls on mineralization in the different zones is sufficient to support estimation of Mineral Resources and Mineral Reserves. The geological knowledge of the area is also considered sufficiently acceptable to reliably inform mine planning.
The mineralization style and setting are well understood and can support declaration of Mineral Resources and Mineral Reserves.
Fekola Gold Mine Mali
NI 43-101 Technical Report
May 2019 Page 25-2
The Fekola deposit remains open down dip. Work conducted in 2017–2019 identified narrow zones of hanging wall mineralization. Exploration potential includes new plunging high-grade zones along strike to the north of the Fekola deposit where narrower intersections have been encountered at shallow depths, and north-plunging mineralization south of the current pit limits, occurring as stacked lodes. At Anaconda, limited deeper drilling has identified zones of bedrock mineralization requiring follow up drilling. In addition, a number of geophysical anomalies, in particular untested IP chargeability features, require drill testing.
25.4 Exploration, Drilling and Analytical Data Collection in Support of Mineral Resource Estimation
The exploration programs completed to date are appropriate for the style of the deposits on the Project.
Sampling methods are acceptable for Mineral Resource and Mineral Reserve estimation.
Sample preparation, analysis and security are generally performed in accordance with exploration best practices and industry standards.
The quantity and quality of the lithological, geotechnical, collar and down-hole survey data collected during the exploration and delineation drilling programs are sufficient to support Mineral Resource and Mineral Reserve estimation. The collected sample data adequately reflect deposit dimensions, true widths of mineralization, and the style of the deposits. Sampling is representative of the gold grades in the deposits, reflecting areas of higher and lower grades.
The QA/QC programs adequately address issues of precision, accuracy and contamination. Drilling programs typically included blanks, duplicates and CRM samples. QA/QC submission rates meet industry-accepted standards.
The data verification programs concluded that the data collected from the Project adequately support the geological interpretations and constitute a database of sufficient quality to support the use of the data in Mineral Resource and Mineral Reserve estimation.
25.5 Metallurgical Testwork
Metallurgical testwork and associated analytical procedures were appropriate to the mineralization type, appropriate to establish the optimal processing routes, and were performed using samples that are typical of the mineralization styles found within the Fekola deposit.
Similar metallurgical testwork and associated analytical procedures are underway on Anaconda mineralization.
Fekola Gold Mine Mali
NI 43-101 Technical Report
May 2019 Page 25-3
Samples selected for testing were representative of the various types and styles of mineralization. Samples were selected from a range of depths within the deposits. Sufficient samples were taken so that tests were performed on sufficient sample mass.
Recovery factors estimated are based on appropriate metallurgical testwork, supported by production data, and are appropriate to the mineralization types and the selected process route. The projected LOM average gold recovery is 93.6%.
There are no deleterious elements known that would affect process activities or metallurgical recoveries.
25.6 Mineral Resource Estimates
Mineral Resources are reported using the 2014 CIM Definition Standards, and assume open pit mining methods.
Factors that may affect the Mineral Resource estimates include: metal price and exchange rate assumptions; changes to the assumptions used to generate the gold grade cut-off grade; changes in local interpretations of mineralization geometry and continuity of mineralized zones; changes to geological and mineralization shape and geological and grade continuity assumptions; density and domain assignments; changes to geotechnical, mining and metallurgical recovery assumptions; change to the input and design parameter assumptions that pertain to the conceptual pit constraining the estimates; and assumptions as to the continued ability to access the site, retain mineral and surface rights titles, maintain environment and other regulatory permits, and maintain the social license to operate.
There is upside potential for the estimates if mineralization that is currently classified as Inferred can be upgraded to higher-confidence Mineral Resource categories.
25.7 Mineral Reserve Estimates
Mineral Reserves are reported using the 2014 CIM Definition Standards and are based on open pit mining methods.
Factors that may affect the Mineral Reserve estimates include: changes to the gold price assumptions; changes to pit slope and geotechnical assumptions; unforeseen dilution; changes to hydrogeological and pit dewatering assumptions; changes to inputs to capital and operating cost estimates; changes to operating cost assumptions used in the constraining pit shell; changes to pit designs from those currently envisaged; stockpiling assumptions as to the amount and grade of stockpile material required to maintain operations during the wet season; assumptions used when evaluating the potential economics of Phase 7 of the Fekola pit; changes to modifying factor assumptions, including environmental, permitting and social licence to operate.
Fekola Gold Mine Mali
NI 43-101 Technical Report
May 2019 Page 25-4
There is upside potential for the estimates if mineralization that is currently classified as Mineral Resources potentially amenable to underground mining methods can be converted to Mineral Reserves following appropriate technical studies.
25.8 Mine Plan
The mining operations use conventional open pit mining methods and equipment.
Mining is based on a phased approach with stockpiling to bring high-grade forward and provide operational flexibility.
The total mine life is eight years for the development of a 320 m deep ultimate pit in seven stages to support 10 years of processing (including 2019).
25.9 Recovery Plan
The process methods are conventional to the industry. The comminution and recovery processes are widely used in the industry with no significant elements of technological innovation.
The process plant flowsheet design was based on testwork results, previous study designs and industry standard practices.
The process facilities in use are appropriate to the mineralization styles.
The plant will produce variations in recovery due to the day-to-day changes in ore type or combinations of ore type being processed. These variations are expected to trend to the forecast recovery value for monthly or longer reporting periods.
25.10 Infrastructure
All key infrastructure is built for the Fekola operations. B2Gold employees live in the surrounding communities and in the on-site camp.
The TSF was constructed using downstream construction techniques, based on a design by Knight Piésold. The design is conventional for the industry. There is sufficient storage capacity for the planned LOM.
Water management structures include a settling pond, diversion channels, a freshwater storage pond, and sediment control structures.
Power for the Fekola Mine is generated by a dedicated power station that is a combination of HFO and diesel-fuelled generators located adjacent to the process plant. Studies are in progress to evaluate the potential for adding a solar power facility.
Fekola Gold Mine Mali
NI 43-101 Technical Report
May 2019 Page 25-5
25.11 Environmental, Permitting and Social Considerations
The 2013 ESIS was approved by the Ministry of Environment and Sanitation on 29 April 2013. The 2015 ESIA Update filled gaps identified in the 2013 ESIS, reflected optimization improvement and modifications to the Project design, assessed these improvements and modifications for their potential impacts against baseline conditions in the Project area, and aligned the assessment with international standards including IFC environmental and social performance standards.
The ESMMP is supported by a number of IM plans.
B2Gold prepares and annually updates the Asset Retirement Obligation cost estimate for the Fekola Mine. The estimated Asset Retirement Obligation cost estimate as of 31 December 2018 is approximately US$32.1 M. The 2018 LOMP that supports the Mineral Reserves estimate includes a provision of $28.7 M for closure.
Various permits and authorizations were required for the Project. Key permits include the site environmental permit, environmental permit for the access road, mining permit, approval of a Community Development Plan, and approval of a Mine Closure Plan. There are about another 21 major permits that have been obtained in support of operations.
Although the relocation of the village of Old Fadougou was not a requirement of the Mine Construction Permit or the approved EIA, extensive engagement with government and community stakeholders led to a decision to proceed with a resettlement project. The resettlement process started in 2015 with the initial baseline collection (socio-economic and asset surveys), and has been implemented in compliance with the Malian law and in line with international best practices. Signing of agreements and compensations have started in January 2019 and are currently ongoing. New Fadougou village construction has been completed and the physical move of the families and businesses started in April 2019.
25.12 Markets and Contracts
Doré from the mine is readily marketable, and contracts are in place for doré sales.
Commodity prices used in Mineral Resource and Mineral Reserve estimates are set by B2Gold corporately. The current gold price provided for Mineral Reserve estimation is $1,250/oz, and $1,400/oz for Mineral Resource estimation.
Major contracts include fuel supply, blasting explosives and accessories, and grade control drilling. Contracts are negotiated and renewed as needed. Contract terms are within industry norms and typical of similar contracts in Mali that B2Gold is familiar with.
Fekola Gold Mine Mali
NI 43-101 Technical Report
May 2019 Page 25-6
25.13 Capital Cost Estimates
Fekola is a steady-state operation. Capital costs are largely comprised of mining and processing equipment and rebuilds, TSF construction, small projects, and other costs for mining, processing, and site general. Capital costs are split into sustaining capital where the costs are supporting the existing LOMP, and non-sustaining capital where the cost is for a long-term structure or external project which does not necessarily depend on the mine plan.
LOMP capital cost estimates total $211.5 M.
25.14 Operating Cost Estimates
Operating costs for Fekola are based on actual costs seen during operations at site and are projected through the LOMP.
LOMP operating cost estimates total $528.16/oz Au produced, or $31.18/t processed.
25.15 Economic Analysis in Support of Mineral Reserve Estimation
B2Gold is using the provision for producing issuers, whereby producing issuers may exclude the information required under Item 22 for technical reports on properties currently in production and where no material expansion of current production is planned.
An economic analysis to support presentation of Mineral Reserves was conducted. Under the assumptions presented in this Report, the operations show a positive cash flow, and can support Mineral Reserve estimation.
25.16 2019 PEA
The 2019 PEA presents an expansion case scenario for the Fekola Mine. The 2019 PEA is partly based on Inferred Mineral Resources that are considered too speculative geologically to have the economic considerations applied to them that would enable them to be categorized as Mineral Reserves, and there is no certainty that the 2019 PEA based on these Mineral Resources will be realized.
The 2019 PEA has no impact on the Mineral Reserves and the key assumptions and parameters supporting the Mineral Reserves. The Mineral Reserves are considered to remain current and valid in light of the key assumptions and parameters used in the 2019 PEA.
Fekola Gold Mine Mali
NI 43-101 Technical Report
May 2019 Page 25-7
25.16.1 2019 PEA Mine Plan
The 2019 PEA mine plan is based on a subset of the Mineral Resource estimate. Mineral Resources are not Mineral Reserves and do not have demonstrated economic viability.
The mining method for the 2019 PEA on the Fekola deposit is via conventional open pit mining with the operations strategy based on Owner-operator mining equipment and labour. The proposed mine production schedule involves the movement of a total 74.4 Mt/a of mineralized material and waste to sustain processing of 7.5 Mt/a of high-grade mineralized material while stockpiling as much as 9.3 Mt of low-grade mineralization and 9.6 Mt of currently sub-economic mineralization.
The total tonnes mined annually are slightly over 74 Mt/a through 2025, then mine production tails off in the last four years as the pre-stripping of the last pit stages is completed. The processed grade over the remaining life of mine is slightly lower than mined grade due to existing low-grade stockpiles.
The anticipated total mine life is 11 years for the development of a 440 m deep ultimate pit in 10 stages to support 12 years of processing.
25.16.2 2019 PEA Recovery Plan
The 2019 PEA envisages a plant throughput expansion to 7.5 Mt/a, and will use much of the existing conventional plant and equipment. However, the expansion will require upgrades or modifications to certain areas of the existing plant to address the throughput rate increase, including: crushing and stockpiling, stockpile reclaim, grinding, pebble circuit, trash screen and leach thickening, leaching, CIP circuit, cyanide destruction and tailings disposal, dilution/electrowinning and gold smelting, water services and reagents.
The plant will produce variations in recovery due to the day-to-day changes in mill feed type or combinations of mill feed material type being processed. These variations are expected to trend to the forecast recovery value for monthly or longer reporting periods.
25.16.3 2019 PEA Infrastructure
Surface infrastructure to support the current operations is in place. The 2019 PEA will require expansion of the EMV and light vehicle workshops, and the mine laboratory. An additional WRSF will be needed, as will a second TSF. Water management structures will be extended to cover the additional infrastructure contemplated in the 2019 PEA, including the additional WRSF and TSF.
The existing power plant is sufficient to provide the power requirements envisaged in the 2019 PEA. A solar power facility may be a future power option.
Fekola Gold Mine Mali
NI 43-101 Technical Report
May 2019 Page 25-8
25.16.4 2019 PEA Environmental, Permitting and Social Considerations
The details of the regulatory and permitting structure and status, the environmental and social setting and the environmental and social management of potential impacts described for the Fekola Mine are applicable to the proposed Fekola Mine expansion as envisaged in the 2019 PEA.
The proposed changes to the Fekola Mine from the proposed Fekola Mine expansion would require the completion and submittal of an Environmental Notice to regulatory authorities (i.e., DNACPN) to assess the potential impacts from the expansion. If approved, a separate environmental permit would be issued for the Fekola Mine expansion; this permit would likely include various environmental and/or social permit conditions.
There may be other required permits or authorizations or required modifications to existing permits or authorizations. B2Gold assumes that all requisite approvals and permits for the expansion will be obtained. While it is believed that such approvals and permits can be obtained on a timely basis and on acceptable terms, there is no certainty that this will be the case.
B2Gold’s self-screening assessment did not identify environmental or social fatal flaws due to the Fekola Mine expansion, however, additional study (e.g., surface hydrology, hydrogeology, mine materials geochemical characterization) is required to fully understand the potential environmental and social impacts. Any identified potential negative impacts will need to be managed to ensure that they are reduced to acceptable levels. Necessary mitigation and management measures will be incorporated into the Fekola Mine environmental and social management plans.
Closure planning would be required to incorporate the changes in the 2019 PEA, including increased footprints for the open pit, WRSFs and TSFs. While additional closure study and planning is required, it is currently not anticipated that the Fekola Mine expansion would significantly alter the closure concepts for the Fekola Mine or its major facilities. Closure costs of $28.7 M have been allocated in the financial analysis that supports the 2019 PEA. Closure estimates may increase from that used in the 2019 PEA when final mine plans and infrastructure designs have been completed.
25.16.5 2019 PEA Markets and Contracts
The doré produced in the 2019 PEA scenario is expected to be readily marketable.
Commodity prices used in Mineral Resource estimates are set by B2Gold corporately. The current gold price provided for Mineral Resource estimation is $1,400/oz. The 2019 PEA assumed a gold price $1,300/oz.
Major contracts are likely to include fuel supply, blasting explosives and accessories, and grade control drilling. Contracts will be negotiated and renewed as needed.
Fekola Gold Mine Mali
NI 43-101 Technical Report
May 2019 Page 25-9
Contract terms are expected to be within industry norms and typical of similar contracts in Mali that B2Gold is familiar with.
The QP has reviewed commodity pricing assumptions, marketing assumptions and the current major contract areas, and considers the information acceptable for use in the 2019 PEA mine plan and in the 2019 PEA economic analysis.
25.16.6 2019 PEA Capital Cost Estimates
Capital cost estimates have been factored from the 2018 LOMP and have an estimated accuracy of ±35%. The main capital costs associated with the 2019 PEA are a mine fleet expansion, and a process plant expansion.
The overall capital costs for the 2019 PEA are estimated at $872 M.
25.16.7 2019 PEA Operating Cost Estimates
Operating cost estimates have been factored from the 2018 LOMP and have an estimated accuracy of ±35%.
Over the 2019 PEA mine life, the mining cost is projected to be $1.66/t mined, the process cost is estimated at $15.56/t milled, and G&A costs are anticipated to be $3.69/t milled. A shipping and refining cost of $4.13/oz is applied to ounces processed.
Total 2019 PEA LOM operating costs are estimated at $2,280 M.
25.16.8 2019 PEA Economic Analysis
The 2019 PEA is partly based on Inferred Mineral Resources that are considered too speculative geologically to have the economic considerations applied to them that would enable them to be categorized as Mineral Reserves, and there is no certainty that the 2019 PEA based on these Mineral Resources will be realized. Mineral Resources that are not Mineral Reserves do not have demonstrated economic viability.
The results of the 2019 PEA cash flow evaluation are:
• Cumulative pre-tax cash flow: $2,808 M;
• NPV5% pre-tax: $2,206 M;
• Cumulative after-tax cash flow: $2,150 M;
• NPV5% after-tax: $1,674 M.
IRR and payback for the 2019 PEA are not presented because with 100% financing, neither is applicable; and because the cash flow is positive in all years of the 2019 PEA process plan.
Fekola Gold Mine Mali
NI 43-101 Technical Report
May 2019 Page 25-10
The 2019 PEA shows the project envisaged is most sensitive to, from most to least, to variations in gold price, grade processed, operating costs, and then capital costs
25.17 Conclusions
An economic analysis was performed in support of estimation of the Mineral Reserves; this indicated a positive cash flow using the assumptions detailed in this Report.
Using the key parameters and assumptions set out for the 2019 PEA in Section 24 of this Report, the project envisaged shows a positive cash flow in all years of planned operation.
Fekola Gold Mine Mali
NI 43-101 Technical Report
May 2019 Page 26-1
26.0 RECOMMENDATIONS
26.1 Introduction
Two work programs are proposed. One work program consists of drill programs, and engineering optimization studies (about $18.8 M). The second work program will use information from the completed drill programs to update Mineral Resource estimates (about $0.05 M to complete).
26.2 Drill Programs and Optimization Studies
26.2.1 Fekola
Stage 1 should consist of infill drilling at Fekola and Fekola North to potentially upgrade Inferred Mineral Resources to the Indicated category. Approximately 23,000 m of core drilling is recommended to complete the infill program.
Additional RC drilling is also recommended to test several targets with the potential to support Mineral Resource estimates. These targets include:
• The Fekola North area, beyond the current resource boundary, which remains open along strike and down plunge;
• The Cardinal structures west of the operating mine;
• The Fekola South area, where previous wide spaced drilling has shown potential for additional mineralization below the main Fekola orebody.
The estimated cost for Stage 1 exploration work at Fekola is approximately $12.5 M.
26.2.2 Anaconda
Approximately 22,000 m of RC drilling, supplemented by additional core and auger drilling, is recommended for Phase 1 regional work at Anaconda. Drilling should focus on potentially expanding the known saprolite resource, as well as continuing to test for hard rock mineralization below the saprolite. The total estimated cost for Stage 1 exploration at Anaconda is about $3.9 M.
26.2.3 Geotechnical Drilling
The ultimate pit as currently proposed in the 2019 PEA should be supported by geotechnical drilling campaign designed to ensure geotechnical parameters are sufficient to support Mineral Reserve estimates, safe mining practices, and support the pit designs as the pit grows deeper and expands to the north.
The program is estimated to consist of 16 drill holes, for an all-in program cost of $2 M.
Fekola Gold Mine Mali
NI 43-101 Technical Report
May 2019 Page 26-2
26.2.4 Optimization Studies
During the preparation of the 2019 PEA mine plan, several opportunities for further business optimization were identified by B2Gold and the Whittle Consulting Group.
Additional optimization scenarios/studies to be evaluated include:
• Consideration of in-pit crushing and conveying. As the open pit advances in essentially a straight line to the north, there may be opportunity to use a conveyor system from semi-mobile locations within the pit, to reduce mining equipment requirements and operating costs;
• Evaluation of including the Anaconda deposit in the production plan;
• Completion of mine fleet equipment sizing analysis to determine the optimal equipment class to be operating at the production rate envisaged in the 2019 PEA. It is possible that this will impact capital cost estimates should it be determined more appropriate to operate with a larger class of equipment;
• Analysis of cut-off grade, grind-throughput-recovery, price sensitivity, and pit and phase optimization in conjunction with the Whittle Consulting Group. This may include setting a milling power limit, or a TSF capacity limit, which could impact project economics;
• Evaluation of alternate or supplemental tailings disposal strategies;
• Assessment of existing camp and workshop infrastructure. Capital costs for expansion of these facilities are not included in the 2019 PEA but estimates may be required upon further review of expected fleet size and personnel count;
• Investigation of the potential for underground mining.
These studies are collectively estimated at about $0.4 M to complete.
26.3 Mineral Resource Estimation
Drill results from the drill programs completed in the Fekola and Anaconda areas should be used to update resource models and Mineral Resource estimates.
This program is estimated at approximately $0.05 M.
Company Logo
Name of Project Location of Project (Province/State/Department, Country)
NI 43-101 Technical Report
May 2019 Page 27-1
27.0 REFERENCES
Bassot, J.P., 1987: Le Complexe Volcano-Plutonique Calcoalcalin de la Rivère Dalema (Est Sénegal): Discussion de sa Signification Géodynamique dans le Cadre de I’orogénie Eburnéene (Protérozoic Inférieur): Journal of African Earth Science, v. 6, pp. 505–519.
Bohlke, J.K.,1982: Orogenic Metamorphic-Hosted Gold-Quartz Veins: U.S. Geological Survey Open-File Rep. 795, pp. 70–76.
Canadian Institute of Mining, Metallurgy and Petroleum (CIM), 2003: Estimation of Mineral Resources and Mineral Reserves – Best Practice Guidelines, May 30, 2003: adopted by CIM Council on November 23, 2003.
Canadian Institute of Mining, Metallurgy and Petroleum (CIM), 2014: CIM Definition Standards – for Mineral Resources and Mineral Reserves, prepared by the CIM Standing Committee on Reserve Definitions: adopted by the CIM Council, May, 2014.
Canadian Securities Administrators (CSA), 2011: National Instrument 43-101, Standards of Disclosure for Mineral Projects, Canadian Securities Administrators.
Diene, M., Fullgraf, T., Diatta, F., Gloaguen, E., Gueye, M. and Ndiaye, P.M., 2015: Review of the Senegalo-Malian Shear Zone System – Timing, Kinematics and Implications for Possible Au Mineralization Styles: Journal of African Earth Sciences. 112, pp. 485–504.
Fraser Institute Survey, 2019: Fraser Institute Annual Survey of Mining Companies 2018: published February 28, 2019, 86 p. https://www.fraserinstitute.org/studies/annual-survey-of-mining-companies-2018.
Garagan, T., Montano, P., Lytle, W., Jones, K., Hunter, S. and Morgan, D., 2015: NI 43-101 Technical Report Feasibility Study on the Fekola Gold Project in Mali: technical report prepared by B2Gold and Lycopodium Minerals Pty Ltd for B2Gold, effective date 30 June, 2015.
Garagan, T., Lytle, W., Johnson, N., Kaye, C., Tschabrun, D., Wiid, G., and Coetzee, S., 2014: Fekola Gold Project, Mali, NI 43-101 Technical Report on Preliminary Economic Assessment: technical report prepared by B2Gold, MPR Geological Consultants Pty Ltd, Mine and Quarry Engineering Services Inc, and Epoch Resources Pty Ltd for B2Gold, effective date 3 June, 2014.
Groves, D.I., Goldfarb, R.J., Gebre-Mariam, H., Hagemann, S.G., Robert, F., 1998: Orogenic Gold Deposits—Proposed Classification in the Context of Their Crustal
Company Logo
Name of Project Location of Project (Province/State/Department, Country)
NI 43-101 Technical Report
May 2019 Page 27-2
Distribution and Relationship to Other Gold Deposit Types: Ore Geol. Rev. 13, pp. 7–27.
Gueye, M., Ngon, P.M., Diéne, M., hiam, Y., Siegesmund, S., Wemmer, K. and Pawlig, S., 2008: Intrusive Rocks and Tectono-Metamorphic Evolution of the Mako Paleoproterozoic Belt Eastern Sengal, West Africa: Journal of African Earth Sciences, v. 50, pp. 88–110.
Harbidge, P., 2013: The Kibali Gold Deposit in Northeast Democratic Republic of Congo: Evidence to Support Central Africa as the New Location for the Next Generation of Multi-Million Ounce Gold Deposits: Conference Proceedings, NewGenGold Conference 2013, Perth, Australia.
Hirdes, W., and Davis, D.W., 2002: U-Pb Geochronology of Paleoproterozoic Rocks in the Southern Part of the Kédougou-Kéniéba inlier, Senegal, West Africa: Evidence for Diachronous Accretionary Development of the Eburnean Province: Precambrian Research, v. 118, pp. 83–99.
Knight Piésold, 2015a: Report PE401-00079/04 Rev 0, Fekola Gold Project, Definitive Feasibility Study Report: compiled by Knight Piésold for B2Gold Corporation June 2015.
Knight Piésold, 2015b: Report PE401-00079_02 Rev 0, Feasibility Study Geotechnical Investigation Report: May 2015.
Knight Piésold, 2015c: Memorandum PE15-00487, Fekola Gold Project – Water Balance Modelling: May 2015.
Lawrence, D.M., Treloar, P.J., Rankin, A.H., Harbridge, P. and Holliday, J., 2013: The Geology and Mineralogy of the Loulo Mining District, Mali, West Africa: Evidence for Two Distinct Styles of Orogenic Gold Mineralization: Economic Geology. v. 108, pp. 199–227.
Mason, D., 2017: Petrographic Descriptions for Ten Rock Samples, Fekola Gold Project, Mali: Mason Geoscience report to B2Gold.
Mason, D., 2018: Petrographic Descriptions for Twenty Rock Samples, Fekola Gold Project, Mali: Mason Geoscience report to B2Gold.
Masurel, Q. Thébaud, N., Miller, J., Ulrich, S., Hein, K.A.A., Cameron, G., Béziat, D. Bruguier, O. and Davis, J.A., 2017: Sadiola Hill: A World-Class Carbonate-Hosted Gold Deposit in Mali, West Africa: Economic Geology. v. 112, pp. 23–47.
Ross, K., 2017: Petrographic Report on the Menankoto Prospect, Mali, West Africa: Panterra Geoservices Inc report to B2Gold.
Company Logo
Name of Project Location of Project (Province/State/Department, Country)
NI 43-101 Technical Report
May 2019 Page 27-3
Rhys, D., 2015: Fekola Gold Deposit, Mali: Geological Observations and Interpretations from a Site Visit: report prepared by Panterra Geoservices for B2Gold, 86 p.
Villeneuve, M., and Cornée, J.J. 1994: Structure, Evolution and Paleoceanography of the West African Craton and Bordering Belts During the Neoproterozoic: Precambrian Research, v. 69, pp. 307–326.