Embed Size (px)
Citation preview

NI 43-101 Technical Report
for the Asanko Gold Mine, Ashanti Region,
Ghana
Effective Date:
February 28, 2022
Prepared by:
Galiano Gold Inc
1640-1066 West Hastings Street
Vancouver, BC V6E 3X1
Qualified Persons Company
Richard Miller, P.Eng. Galiano Gold Inc.
Greg Collins, MAusIMM(CP) Galiano Gold Inc. (Former)
Eric Chen, P.Geo. Galiano Gold Inc. (Former)
Alan Eslake, FAusIMM Asanko Gold Ghana Ltd.
Mario E. Rossi, FAusIMM GeoSystems International Inc.
Malcolm Titley, MAIG CSA Global Ltd.
Benoni Owusu Ansah, P.E. Knight Piésold Ltd.

Richard Miller, P.Eng.
CERTIFICATE OF QUALIFIED PERSON
This Certificate of Qualified Person has been prepared to meet the requirements of National Instrument 43-101 Standards
of Disclosure for Minerals Projects Part 8.
a. Name, Address, OccupationRichard Miller, P.Eng.,Suite 1640 – 1066 West Hastings St., Vancouver, British Columbia, CanadaVice President, Technical Services, Galiano Gold Inc.
b. Title and Effective Date of Technical ReportNI 43-101 Technical Report for the Asanko Gold Mine, Ashanti Region, Ghana.Effective Date: February 28, 2022 (the Technical Report).
c. QualificationsBASc Mining and Mineral Process Engineering, University of British Columbia, Canada, 1987P.Eng., Engineers and Geoscientists British Columbia (EGBC)
I have practiced my profession continuously since 1987 and have worked at copper, diamond and gold mines in Canada, South Africa, Namibia, Guinea and Turkey in the progressive capacities of Mining Engineer, Project Manager, Mine Manager and General Manager. I have also held corporate positions as Manager Mining, Director Mine Engineering (Open Pit) and VP Technical Services, in which I have had overseeing involvement in mine engineering and technical services matters at various operating mines and development projects.
As a result of my experience and qualifications, I am a Qualified Person as defined in National Instrument 43-101 for the sections of the technical report that I take responsibility.
d. Site InspectionOctober 14 2021 to October 21 2021.
e. ResponsibilitiesI am responsible for Sections 1.1, 1.2, 1.7, 1.9 to 1.12, 2, 3, 4, 5, 15, 16, 18, 19, 20.1 to 20.8, 21, 22, 24, 25.1,25.2, 25.6, 25.9, 25.10, 26.4, and 27 of this Technical Report.
f. IndependenceI am not independent of Galiano Gold Inc. in accordance with the application of Section 1.5 of NationalInstrument 43-101.
g. Prior InvolvementI started employment with Galiano Gold Inc in October 2021 in the capacity of Manager, Mining and inDecember 2021 was appointed to Vice President, Technical Services for Galiano Gold Inc. In both of thesecapacities I have had oversight of planning and execution of technical programs supporting the Asanko Goldproperty, reviewed short and long term mining plans, had communications with and attended meetings withdiscipline leads at site and at the corporate level.
h. Compliance with NI 43-101I have read National Instrument 43-101 and Form 43-101F1 and the Technical Report has been prepared incompliance with same.
i. DisclosureAs of the effective date of the Technical Report, to the best of my knowledge, information and belief, the partsof the Technical Report that I am responsible for, contains all scientific and technical information that is requiredto be disclosed to make the Technical Report not misleading.
“Signed and sealed by Richard Miller”
Richard Miller, P.Eng.
March 29, 2022
Date

Gregory Collins, MAusIMM(CP)
CERTIFICATE OF QUALIFIED PERSON
This Certificate of Qualified Person has been prepared to meet the requirements of National Instrument 43-101 Standards
of Disclosure for Minerals Projects Part 8.
a. Name, Address, Occupation Gregory Collins, P.Geo., #1640-1066 W. Hastings Street, Vancouver, British Columbia (former) Vice President, Exploration, Galiano Gold Inc.
b. Title and Effective Date of Technical Report
NI 43-101 Technical Report for the Asanko Gold Mine, Ashanti Region, Ghana. Effective Date: February 28, 2022 (the Technical Report).
c. Qualifications B.AppSc Geology (Hons), Queensland University of Technology, Brisbane, Australia, 1992 MAusIMM CP (Geo) and SEG Fellow. I have practiced my profession continuously since 1993 and have worked on exploration projects for gold, copper, zinc-lead-silver, and uranium in Australia, Mongolia, China, Russia, and Indonesia in the progressive capacities of Geologist, Chief Geologist, and Exploration Manager. I have also held the corporate position of VP Exploration, in which I have had overseeing involvement in exploration/mine geology matters at various exploration projects and operating mines. As a result of my experience and qualifications, I am a Qualified Person as defined in National Instrument 43-101 for the sections of the technical report that I take responsibility.
d. Site Inspection February 10, 2021 to May 5, 2021, with regular visits thereafter every quarter for approximately 3 weeks each visit. Most recent visit from October 12 to November 4, 2021.
e. Responsibilities I am responsible for Sections 1.3, 1.4, 6, 7, 8, 9, 10, 11, 12, 23, 25.3, 25.4, and 26.3 of this Technical Report.
f. Independence I am not independent of Galiano Gold Inc. in accordance with the application of Section 1.5 of National Instrument 43-101.
g. Prior Involvement As Vice President of Exploration, I had oversight of planning and execution of exploration programs on the Asanko Gold property; developed, reviewed and presented exploration programs and budgets; regularly met and communicated with exploration teams onsite to ensure smooth program execution. I coordinated and collaborated with other departments on related programs involving exploration efforts, such as metallurgical and geotechnical drilling, and resource infill drilling.
h. Compliance with NI 43-101 I have read National Instrument 43-101 and Form 43-101F1 and the Technical Report has been prepared in compliance with same.
i. Disclosure As of the effective date of the Technical Report, to the best of my knowledge, information and belief, the parts of the Technical Report that I am responsible for, contains all scientific and technical information that is required to be disclosed to make the Technical Report not misleading.
“Signed by Gregory Collins”
Gregory Collins, MAusIMM(CP)
March 29, 2022
Date

Eric Chen, P.Geo.
CERTIFICATE OF QUALIFIED PERSON
This Certificate of Qualified Person has been prepared to meet the requirements of National Instrument 43-101 Standards
of Disclosure for Minerals Projects Part 8.
a. Name, Address, OccupationEric Chen, P.Geo.,#1640-1066 W. Hastings Street, Vancouver, British Columbia(former) Vice President, Technical Services, Galiano Gold Inc.
b. Title and Effective Date of Technical ReportNI 43-101 Technical Report for the Asanko Gold Mine, Ashanti Region, Ghana.Effective Date: February 28, 2022 (the Technical Report).
c. QualificationsBSc. Geology, Peking University, China, 1991P.Geo., Engineers and Geoscientists British Columbia (EGBC)
I have practiced my profession continuously since 1991 and have 30 years of experience working at gold, copper, base metal projects and mines, both open pit and underground, in Canada, Mexico, United States, Turkey, China and Ghana, in the capacity of exploration and resource geologist, with progressive responsibilities as Superintendent, Manager, VP Mineral Resources, and VP Technical Services.
As a result of my experience and qualifications, I am a Qualified Person as defined in National Instrument 43-101 for the sections of the technical report that I take responsibility.
d. Site InspectionRegular site visits since March 2021 (average 1 visit per quarter, 10-15 days per visit). Dates for most recentvisit to site: 16th to 30th September 2021.
e. ResponsibilitiesI am responsible for Sections 1.6, 12.1, 14.0, 14.4, 14.5, 14.6, 14.7, 14.8, 25.5, and 26.2 of this TechnicalReport.
f. IndependenceI am not independent of Galiano Gold Inc. in accordance with the application of Section 1.5 of NationalInstrument 43-101.
g. Prior InvolvementAs VP Mineral Resource (Aug 2020 to Aug 2021) and VP Technical Services (Aug to Dec 2021) of GalianoGold Inc., I had oversight of planning and execution of technical programs supporting resource and reservedevelopment, grade control and reconciliation, and other relevant mining studies on the Asanko Gold property.
h. Compliance with NI 43-101I have read National Instrument 43-101 and Form 43-101F1 and the Technical Report has been prepared incompliance with same.
i. DisclosureAs of the effective date of the Technical Report, to the best of my knowledge, information and belief, the partsof the Technical Report that I am responsible for, contains all scientific and technical information that is requiredto be disclosed to make the Technical Report not misleading.
“Signed and sealed by Eric Chen”
Eric Chen, P.Geo.
March 29, 2022
Date

Alan Eslake, B.App.Sc.
CERTIFICATE OF QUALIFIED PERSON
This Certificate of Qualified Person has been prepared to meet the requirements of National Instrument 43-101 Standards
of Disclosure for Minerals Projects Part 8.
a. Name, Address, Occupation Alan Eslake, B.App.Sc.. 100 Winbourne Road, Hazelbrook 2779, NSW Australia Chief Metallurgist, Asanko Gold Ghana Limited
b. Title and Effective Date of Technical Report
NI 43-101 Technical Report for the Asanko Gold Mine, Ashanti Region, Ghana. Effective Date: February 28, 2022 (the Technical Report).
c. Qualifications B.App.Sc. (Materials), University of Technology, Sydney, 1992 Fellow, Australasian Institute of Mining and Metallurgy (FAusIMM) I have practiced my profession continuously since 1992 and have worked in numerous commercial metallurgical laboratories and operating mine sites. Experienced with gold and base metals in global locations including New Zealand, PNG, China, Chile and Turkey. As a result of my experience and qualifications, I am a Qualified Person as defined in National Instrument 43-101 for the sections of the technical report that I take responsibility.
d. Site Inspection Site based since December 2020.
e. Responsibilities I am responsible for Sections 1.5, 1.8, 13, 17, 25.7, 25.8, and 26.1 of this Technical Report.
f. Independence I am not independent of Galiano Gold Inc. in accordance with the application of Section 1.5 of National Instrument 43-101.
g. Prior Involvement I have been employed by Galiano Gold Inc. / Asanko Gold Ghana Limited in the capacity of Chief Metallurgist since December 2020. Areas of focus have included production enhancement projects and supervision of both internal and external testwork programs.
h. Compliance with NI 43-101 I have read National Instrument 43-101 and Form 43-101F1 and the Technical Report has been prepared in compliance with same.
i. Disclosure As of the effective date of the Technical Report, to the best of my knowledge, information and belief, the parts of the Technical Report that I am responsible for, contains all scientific and technical information that is required to be disclosed to make the Technical Report not misleading.
“Signed by Alan Eslake”
Alan Eslake, B.App.Sc
March 29, 2022
Date
Mario E. Rossi, FAusIMM
CERTIFICATE OF QUALIFIED PERSON
This Certificate of Qualified Person has been prepared to meet the requirements of National Instrument 43-101 Standards
of Disclosure for Minerals Projects Part 8.
a. Name, Address, Occupation Mario E. Rossi, 2385 NW Executive Center Dr., Suite 100, Boca Raton, FL, 33431, USA Principal Geostatistician, GeoSystems International, Inc.
b. Title and Effective Date of Technical Report
NI 43-101 Technical Report for the Asanko Gold Mine, Ashanti Region, Ghana. Effective Date: February 28, 2022 (the Technical Report).
c. Qualifications Mining Engineer, Universidad Nacional de San Juan, Argentina, 1985 Master of Science, Geostatistics, Stanford University, 1988 Fellow, Australian Instutute of Mining and Metallurgy (AusIMM) Registered Member, Society for Mining, Metallurgy &Exploration (SME) I have practiced my profession continuously since 1985. I have worked in over 100 different mining projects at various stages of development and operations around the world, including precious and base metals, multi-element deposits (Au, Ag, Cu, Fe, Pb, Zn, etc.), laterite-type deposits, sedimentary deposits (uranium, coal), Iron hematite and magnetite deposits, and industrial minerals such as limestone, nitrate, iodine, lithium and graphite deposits. I have over 30 years experience in resource modeling for epithermal-type gold deposits, including Birimian-style Au deposits. These include Ashanti Gold (Ghana); Yaoure Au deposits (Ivory Coast); Salobo (Senegal); Chaarat Au deposit (Kyrgyzstan); and several others that are similar in style to the Esaase and Abore deposits. As a result of my experience and qualifications, I am a Qualified Person as defined in National Instrument 43-101 for the sections of the technical report that I take responsibility.
d. Site Inspection I have visited the site from March 18 through April 1, 2021
e. Responsibilities I am responsible for Sections 14.1, 14.2, and 25.5 of this Technical Report.
f. Independence I am independent of Galiano Gold Inc. in accordance with the application of Section 1.5 of National Instrument 43-101.
g. Prior Involvement I have had no prior involvement with Asanko Gold Mines or Galiano Gold Inc.
h. Compliance with NI 43-101 I have read National Instrument 43-101 and Form 43-101F1 and the Technical Report has been prepared in compliance with same.
i. Disclosure As of the effective date of the Technical Report, to the best of my knowledge, information and belief, the parts of the Technical Report that I am responsible for, contains all scientific and technical information that is required to be disclosed to make the Technical Report not misleading.
“Signed by Mario Rossi”
Mario Rossi, FAusIMM
March 29, 2022
Date

Malcolm Titley – BSc, MAusIMM, MAIG
CERTIFICATE OF QUALIFIED PERSON
This Certificate of Qualified Person has been prepared to meet the requirements of National Instrument 43-101 Standards
of Disclosure for Minerals Projects Part 8.
a. Name, Address, Occupation Malcolm Titley, MAIG Suite 2, First Floor, Springfield House, Horsham, West Sussex, United Kingdom, RH12 2RG Principal Consultant, CSA Global
b. Title and Effective Date of Technical Report
NI 43-101 Technical Report for the Asanko Gold Mine, Ashanti Region, Ghana. Effective Date: February 28, 2022 (the Technical Report).
c. Qualifications BSc Geology and Chemistry, University of Cape Town, 1979 Member, Australian Institute of Geoscientists Member, Australian Institute of Mining and Metallurgy I have practiced my profession continuously since 1981 and have over 20 years operating experience at gold, iron ore and copper mines in Australia, Papua New Guinea and Ghana, in the progressive capacities of Geologist, Chief Geologist, Pit Superintendent and Mine Manager. I have practiced as a consultant to the mining industry for over 20 years, primarily focused on mineral resource estimation and reporting, due diligence and feasibility studies and operations support and business improvement. My consulting experience includes time as a Managing Director. As a result of my experience and qualifications, I am a Qualified Person as defined in National Instrument 43-101 for the sections of the technical report that I take responsibility.
d. Site Inspection Regular site visits during the period November 2017 to January 2020 (on average 1 visit per quarter, minimum of 7 days per visit). Dates for most recent visit to site: 16th to 22nd January 2020.
e. Responsibilities I am responsible for Sections 14.3 and 25.5 of this Technical Report.
f. Independence I am independent of Galiano Gold Inc. in accordance with the application of Section 1.5 of National Instrument 43-101.
g. Prior Involvement I was QP for the December 2017 Nkran, Akwasiso and Dynamite Hill deposits Mineral Resource Estimate. I was also an independent consultant to Asanko Gold Ghana providing business improvement support services through my independent company Maja Mining Limited during the period 1st March 2018 until December 2020.
h. Compliance with NI 43-101 I have read National Instrument 43-101 and Form 43-101F1 and the Technical Report has been prepared in compliance with same.
i. Disclosure As of the effective date of the Technical Report, to the best of my knowledge, information and belief, the parts of the Technical Report that I am responsible for, contains all scientific and technical information that is required to be disclosed to make the Technical Report not misleading.
“Signed by Malcolm Titley”
Malcolm Titley, MAIG
March 29, 2022
Date

Benoni Owusu Ansah, P.E.
CERTIFICATE OF QUALIFIED PERSON
This Certificate of Qualified Person has been prepared to meet the requirements of National Instrument 43-101 Standards
of Disclosure for Minerals Projects Part 8.
a. Name, Address, Occupation Benoni M. Owusu Ansah, P.E., MGhIE, MASCE, MGGS, MGhIGS No. 20 Second Close, Airport Residential Area, Accra, Ghana Civil/Projects Manager, Knight Piésold, West Africa
b. Title and Effective Date of Technical Report
NI 43-101 Technical Report for the Asanko Gold Mine, Ashanti Region, Ghana. Effective Date: February 28, 2022 (the Technical Report).
c. Qualifications I have over 15 years of professional experience as a Civil Engineer with specialization in geotechnical, environmental, and structural engineering. My experience spans from prefeasibility, feasibility, detailed design to construction, and ‘forensic’ engineering of Tailings and Water Storage Dams, Harbours, Airports, and structural foundations. I have engineering design, construction and management experiences with various large-scale projects in Ghana, Cameroun, Congo DRC, Cote d’Ivoire, Burkina Faso, Mauritania, Sierra Leone, Congo, Togo, Mali and Guinea. I am currently a Civil/Projects Manager with Knight Piésold and undertake engineering designs as well as construction quality control and quality assurance for several mines. I am the Engineer of Record for the design and construction of the Tailings Storage Facility for the Asanko Gold Mine. As a result of my experience and qualifications, I am a Qualified Person as defined in National Instrument 43-101 for the sections of the technical report that I take responsibility.
d. Site Inspection Regular site visits from 2019 through 2022 for various engineering design, constructions, and dam safety audits. Date of most recent visit to site was January 3rd, 2022. A full day was spent on site providing technical guidance for the Stage 6 Expansion of the TSF and discussing future TSF developments with site management.
e. Responsibilities I am responsible for Section 20.9 of this Technical Report.
f. Independence I am independent of Galiano Gold Inc. in accordance with the application of Section 1.5 of National Instrument 43-101.
g. Prior Involvement I was part of the engineering team for mine start-up construction, including Stage 1 of the existing TSF and Process Plant development. I have supervised/managed the construction of Stage 2 expansion to the TSF. I have served as the Lead Design Engineer and Projects Manager for Stage 4 through Stage 6. I provide ongoing support for life of mine TSF development. I am the Engineer of Record for the design and construction of the Tailings Storage Facility for the Asanko Gold Mine.
h. Compliance with NI 43-101 I have read National Instrument 43-101 and Form 43-101F1 and the Technical Report has been prepared in compliance with same.
i. Disclosure As of the effective date of the Technical Report, to the best of my knowledge, information and belief, the parts of the Technical Report that I am responsible for, contains all scientific and technical information that is required to be disclosed to make the Technical Report not misleading.
“Signed by Benoni M. Owusu Ansah”
Benoni M. Owusu Ansah, P.E.
March 29, 2022
Date

NI 43-101 Technical Report for the Asanko Gold Mine, Ashanti Region, Ghana
Effective Date: February 28, 2022
Page i
Table of Contents
1 Summary .................................................................................................................................................. 1
1.1 Introduction........................................................................................................................................ 1
1.2 Property Description and Ownership ................................................................................................ 1
1.3 Geology and Mineralization .............................................................................................................. 3
1.4 Exploration and Drilling ..................................................................................................................... 5
1.5 Metallurgical Testwork and Recoveries ............................................................................................ 6
1.5.1 Esaase ....................................................................................................................................... 6
1.5.2 Nkran ......................................................................................................................................... 7
1.5.3 Abore ......................................................................................................................................... 7
1.5.4 Miradani North ........................................................................................................................... 7
1.5.5 Akwasiso.................................................................................................................................... 7
1.5.6 Dynamite Hill ............................................................................................................................. 7
1.5.7 Adubiaso .................................................................................................................................... 8
1.6 Mineral Resource Estimates ............................................................................................................. 8
1.7 Mineral Reserves .............................................................................................................................. 9
1.8 Mineral Processing ............................................................................................................................ 9
1.9 Infrastructure ................................................................................................................................... 10
1.10 Environmental ................................................................................................................................. 11
1.11 Risks and Opportunities .................................................................................................................. 11
1.12 Conclusions and Recommendations .............................................................................................. 12
2 Introduction ........................................................................................................................................... 13
2.1 Terms of Reference ........................................................................................................................ 13
2.2 Qualified Persons ............................................................................................................................ 14
2.3 References and Information Sources ............................................................................................. 15
2.4 Units, Currency and Abbreviations ................................................................................................. 15
3 Reliance on Other Experts ................................................................................................................... 22
3.1 Mineral Tenure, Surface Rights, Agreements, and Environmental Information ............................. 22
3.2 Political Information ......................................................................................................................... 22
4 Property Description and Location .................................................................................................... 23
4.1 Location and Area ........................................................................................................................... 23
4.2 Licences and Mineral Tenure .......................................................................................................... 26
4.2.1 Mining Legislation Overview.................................................................................................... 26
4.2.2 Issuer’s Title to the AGM Concessions ................................................................................... 27
4.3 Agreements, Royalties and Encumbrances ................................................................................... 28
4.4 Environmental Obligations .............................................................................................................. 28

NI 43-101 Technical Report for the Asanko Gold Mine, Ashanti Region, Ghana
Effective Date: February 28, 2022
Page ii
4.5 Permits ............................................................................................................................................ 28
4.6 Fraser Institute Survey .................................................................................................................... 29
5 Accesibility, Climate, Local Resources, Infrastructure and Physiography ................................... 30
5.1 Topography, Elevation and Vegetation ........................................................................................... 30
5.2 Access ............................................................................................................................................. 31
5.3 Proximity to Population Centre and Transport ................................................................................ 31
5.4 Climate and Length of Operating Season ...................................................................................... 31
5.5 Infrastructure ................................................................................................................................... 31
5.6 Surface Rights ................................................................................................................................. 32
6 History .................................................................................................................................................... 34
6.1 Prior Ownership and Ownership Changes ..................................................................................... 34
6.2 Historical Exploration and Development ......................................................................................... 35
6.3 Previous Mineral Resource Estimates ............................................................................................ 38
6.4 Historical Production ....................................................................................................................... 38
7 Geological Setting and Mineralization ............................................................................................... 39
7.1 Regional Geology ............................................................................................................................ 39
7.2 Local Geology ................................................................................................................................. 43
7.3 Regolith and Weathering Profile ..................................................................................................... 44
7.4 Property Geology and Mineralization .............................................................................................. 46
7.4.1 Nkran ....................................................................................................................................... 46
7.4.2 Esaase ..................................................................................................................................... 48
7.4.3 Akwasiso.................................................................................................................................. 65
7.4.4 Abore ....................................................................................................................................... 67
7.4.5 Asuadai .................................................................................................................................... 70
7.4.6 Adubiaso .................................................................................................................................. 72
7.4.7 Miradani North ......................................................................................................................... 74
7.4.8 Dynamite Hill ........................................................................................................................... 75
8 Deposit Types ....................................................................................................................................... 77
9 Exploration ............................................................................................................................................ 78
9.1 Introduction...................................................................................................................................... 78
9.2 Grids and Surveys ........................................................................................................................... 78
9.3 Geological Mapping ........................................................................................................................ 78
9.4 Geochemical Sampling ................................................................................................................... 80
9.4.1 Soil Geochemical Sampling .................................................................................................... 80
9.4.2 Trenching ................................................................................................................................. 83
9.5 Geophysical Surveys ...................................................................................................................... 84

NI 43-101 Technical Report for the Asanko Gold Mine, Ashanti Region, Ghana
Effective Date: February 28, 2022
Page iii
9.6 Exploration Potential ....................................................................................................................... 87
9.6.1 Nkran Deeps ............................................................................................................................ 87
9.6.2 Miradani Deeps ....................................................................................................................... 88
9.6.3 Kaniago West .......................................................................................................................... 88
9.6.4 Midras South ........................................................................................................................... 88
9.6.5 Amoaman ................................................................................................................................ 89
9.6.6 Other Prospects ....................................................................................................................... 90
10 Drilling ................................................................................................................................................ 91
10.1 Type and Extent of Drilling .............................................................................................................. 91
10.2 Drill Logging Procedures ............................................................................................................... 100
10.3 Collar Survey ................................................................................................................................. 101
10.4 Downhole Survey .......................................................................................................................... 101
10.5 Core Recovery .............................................................................................................................. 102
10.6 Core Handling ............................................................................................................................... 102
10.7 Core Photography ......................................................................................................................... 102
10.8 Core Cutting and Sampling ........................................................................................................... 102
10.9 QC Insertions ................................................................................................................................ 103
10.10 Geotechnical Logging ............................................................................................................... 104
10.11 Core Storage ............................................................................................................................. 104
10.12 Density Sampling ...................................................................................................................... 104
10.13 RC Sampling ............................................................................................................................. 105
10.14 Pre 2014 .................................................................................................................................... 106
11 Sample Preparation, Analyses, and Security .............................................................................. 107
11.1 Legacy Data (Pre-2014) ................................................................................................................ 107
11.1.1 Resolute ................................................................................................................................. 107
11.1.2 PMI ........................................................................................................................................ 107
11.2 Current Data (Post 2014) .............................................................................................................. 109
11.2.1 Sample Preparation Methods and Quality Control Measures Taken Before Submission to the
Laboratory ............................................................................................................................................. 109
11.2.2 Laboratory Certification ......................................................................................................... 111
11.2.3 Laboratory Sample Preparation and Analysis ....................................................................... 111
11.2.4 Check Assay Analysis ........................................................................................................... 112
11.2.5 Pre-2020 Quality Assurance and Quality Control Results .................................................... 112
11.2.6 Post 2020 Quality Assurance and Quality Control Results................................................... 113
11.3 Qualified Person’s Opinion on Adequacy of Sample Preparation, Security ................................. 148
12 Data Verification .............................................................................................................................. 149

NI 43-101 Technical Report for the Asanko Gold Mine, Ashanti Region, Ghana
Effective Date: February 28, 2022
Page iv
12.1 Data Validation and Site Visits ...................................................................................................... 149
12.2 Database Structure ....................................................................................................................... 150
12.3 Data Review .................................................................................................................................. 151
12.3.1 Exploration Database ............................................................................................................ 151
12.3.2 Grade Control Database ....................................................................................................... 151
12.4 Qualified Person’s Opinion on Adequacy of Data For Purposes Used in Technical Report ....... 151
13 Mineral Processing and Metallurgical Testing ............................................................................ 152
13.1 Previous Project Testwork ............................................................................................................ 152
13.1.1 Metallurgical Testwork 2008 to 2013 .................................................................................... 152
13.1.2 Metallurgical Testwork 2014 to 2016 .................................................................................... 152
13.1.3 Metallurgical Testwork 2018 to 2019 .................................................................................... 153
13.1.4 Addendum Testwork A20208 (2019) .................................................................................... 157
13.2 Current Testwork 2021 – Esaase Main Pit ................................................................................... 158
13.2.1 Sample Selection Criteria ...................................................................................................... 158
13.2.2 Bulk Composites Testing (ALS A22281) ............................................................................... 162
13.2.3 Variability Samples Testing (ALS A22281) ........................................................................... 171
13.3 Current Testwork 2021 – Nkran and Obotan Satellite Deposits .................................................. 177
13.3.1 Nkran 2021 Testwork (ALS A22441) .................................................................................... 177
13.3.2 Abore 2021 Testwork (ALS A22441) .................................................................................... 179
13.3.3 Miradani North 2021 Testwork (ALS A22441) ...................................................................... 181
13.3.4 Akwasiso................................................................................................................................ 185
13.3.5 Dynamite Hill Previous Recoveries ....................................................................................... 185
13.3.6 Adubiaso Previous Recoveries ............................................................................................. 186
13.4 Recent Plant Performance ............................................................................................................ 187
13.5 Life of Mine Recovery Estimates .................................................................................................. 187
13.5.1 Esaase ................................................................................................................................... 187
13.5.2 Nkran and Obotan Satellite Pits ............................................................................................ 188
14 Mineral Resource Estimates .......................................................................................................... 189
14.1 Esaase Mineral Resource Estimate .............................................................................................. 190
14.1.1 Database ............................................................................................................................... 190
14.1.1 Geological Models ................................................................................................................. 190
14.1.2 Exploratory Data Analysis ..................................................................................................... 191
14.1.3 Estimation/Interpolation Methods .......................................................................................... 200
14.1.4 Validation ............................................................................................................................... 201
14.1.5 Classification of Mineral Resources ...................................................................................... 204
14.1.6 Comparison with Production Results .................................................................................... 206

NI 43-101 Technical Report for the Asanko Gold Mine, Ashanti Region, Ghana
Effective Date: February 28, 2022
Page v
14.1.7 Reasonable Prospects of Eventual Economic Extraction ..................................................... 206
14.1.8 Mineral Resource Estimate ................................................................................................... 207
14.1.9 Factors That May Affect the Mineral Resource Estimate ..................................................... 208
14.2 Abore Mineral Resource Estimate ................................................................................................ 209
14.2.1 Database ............................................................................................................................... 209
14.2.2 Geological Models ................................................................................................................. 209
14.2.3 Exploration Data Analysis ..................................................................................................... 210
14.2.4 Estimation/Interpolation Methods .......................................................................................... 215
14.2.5 Validation ............................................................................................................................... 215
14.2.6 Classification of Mineral Resources ...................................................................................... 220
14.2.7 Reasonable Prospects of Eventual Economic Extraction ..................................................... 221
14.2.8 Mineral Resource Statement ................................................................................................. 222
14.2.9 Factors That May Affect the Mineral Resource Estimate ..................................................... 223
14.3 Nkran Mineral Resource Estimate ................................................................................................ 224
14.3.1 Database ............................................................................................................................... 224
14.3.2 Geological Models ................................................................................................................. 224
14.3.3 Exploration Data Analysis ..................................................................................................... 226
14.3.4 Estimation/Interpolation Methods .......................................................................................... 231
14.3.5 Validation ............................................................................................................................... 234
14.3.6 Classification of Mineral Resources ...................................................................................... 238
14.3.7 Reasonable Prospect of Eventual Economic Extraction ....................................................... 240
14.3.8 Mineral Resource Statement ................................................................................................. 241
14.3.9 Factors That May Affect the Mineral Resource Estimate ..................................................... 242
14.4 Akwasiso Mineral Resource Estimate .......................................................................................... 243
14.4.1 Database ............................................................................................................................... 243
14.4.2 Geological Models ................................................................................................................. 246
14.4.3 Exploration Data Analysis ..................................................................................................... 250
14.4.4 Estimation/Interpolation Methods .......................................................................................... 256
14.4.5 Validation ............................................................................................................................... 259
14.4.6 Classification of Mineral Resources ...................................................................................... 261
14.4.7 Reasonable Prospect of Eventual Economic Extraction ....................................................... 262
14.4.8 Mineral Resource Statement ................................................................................................. 263
14.4.9 Factors That May Affect the Mineral Resource Estimate ..................................................... 264
14.5 Dynamite Hill Mineral Resource Estimate .................................................................................... 265
14.5.1 Database ............................................................................................................................... 265
14.5.2 Geological Models ................................................................................................................. 266
NI 43-101 Technical Report for the Asanko Gold Mine, Ashanti Region, Ghana
Effective Date: February 28, 2022
Page vi
14.5.3 Exploration Data Analysis ..................................................................................................... 269
14.5.4 Estimation/Interpolation Methods .......................................................................................... 274
14.5.5 Validation ............................................................................................................................... 277
14.5.6 Classification of Mineral Resources ...................................................................................... 280
14.5.7 Reasonable Prospect of Eventual Economic Extraction ....................................................... 281
14.5.8 Mineral Resource Statement ................................................................................................. 281
14.5.9 Factors That May Affect the Mineral Resource Estimate ..................................................... 283
14.6 Miradani North Mineral Resource Estimate .................................................................................. 283
14.6.1 Database ............................................................................................................................... 283
14.6.2 Geological Models ................................................................................................................. 284
14.6.3 Exploration Data Analysis ..................................................................................................... 288
14.6.4 Estimation/Interpolation Methods .......................................................................................... 294
14.6.5 Validation ............................................................................................................................... 297
14.6.6 Classification of Mineral Resources ...................................................................................... 301
14.6.7 Reasonable Prospect of Eventual Economic Extraction ....................................................... 303
14.6.8 Mineral Resource Statement ................................................................................................. 303
14.6.9 Factors That May Affect the Mineral Resource Estimate ..................................................... 304
14.7 Asuadai Mineral Resource Estimate ............................................................................................. 305
14.7.1 Database ............................................................................................................................... 305
14.7.2 Geological Models ................................................................................................................. 305
14.7.3 Exploration Data Analysis ..................................................................................................... 310
14.7.4 Estimation/Interpolation Methods .......................................................................................... 314
14.7.5 Validation ............................................................................................................................... 316
14.7.6 Classification of Mineral Resources ...................................................................................... 319
14.7.7 Reasonable Prospect of Eventual Economic Extraction ....................................................... 319
14.7.8 Mineral Resource Statement ................................................................................................. 320
14.7.9 Factors That May Affect the Mineral Resource Estimate ..................................................... 321
14.8 Adubiaso Mineral Resource Estimate ........................................................................................... 322
14.8.1 Database ............................................................................................................................... 322
14.8.2 Geological Models ................................................................................................................. 322
14.8.3 Exploration Data Analysis ..................................................................................................... 325
14.8.4 Estimation/Interpolation Methods .......................................................................................... 331
14.8.5 Validation ............................................................................................................................... 332
14.8.6 Classification of Mineral Resources ...................................................................................... 335
14.8.7 Reasonable Prospect of Eventual Economic Extraction ....................................................... 336
14.8.8 Mineral Resource Statement ................................................................................................. 336

NI 43-101 Technical Report for the Asanko Gold Mine, Ashanti Region, Ghana
Effective Date: February 28, 2022
Page vii
14.8.9 Factors That May Affect the Mineral Resource Estimate ..................................................... 337
15 Mineral Reserve Estimates ............................................................................................................ 338
16 Mining Methods ............................................................................................................................... 339
17 Recovery Methods .......................................................................................................................... 340
17.1 Process Description ...................................................................................................................... 340
17.2 Crushing ........................................................................................................................................ 342
17.2.1 Esaase Source ...................................................................................................................... 342
17.2.2 Obotan Source ...................................................................................................................... 342
17.3 Milling ............................................................................................................................................ 342
17.4 Gravity Gold Recovery .................................................................................................................. 343
17.5 Pre-leach Thickening .................................................................................................................... 343
17.6 Carbon in Leach (CIL) ................................................................................................................... 343
17.7 Tailings and Detoxification ............................................................................................................ 343
17.8 Carbon Treatment ......................................................................................................................... 344
17.9 Electrowinning ............................................................................................................................... 344
17.10 Gold Room ................................................................................................................................ 345
17.11 Reagents ................................................................................................................................... 345
17.11.1 Flocculant .......................................................................................................................... 345
17.11.2 Copper sulphate ................................................................................................................ 345
17.11.3 Sodium Metabisulphite (SMBS) ........................................................................................ 345
17.11.4 Diesel ................................................................................................................................. 346
17.11.5 Caustic Soda ..................................................................................................................... 346
17.11.6 Sodium Cyanide ................................................................................................................ 346
17.11.7 Hydrated Lime ................................................................................................................... 346
17.11.8 Ferric Chloride ................................................................................................................... 346
17.11.9 Hydrochloric Acid ............................................................................................................... 346
17.11.10 Quicklime ........................................................................................................................... 346
17.11.11 Anti-scaling Agent .............................................................................................................. 346
17.11.12 Activated Carbon ............................................................................................................... 347
17.11.13 Grinding Media .................................................................................................................. 347
17.12 Plant Process Services ............................................................................................................. 347
17.12.1 Filtered Raw Water ............................................................................................................ 347
17.12.2 Fire Water .......................................................................................................................... 347
17.12.3 Potable Water .................................................................................................................... 347
17.12.4 Process Water and Plant Run-off ...................................................................................... 348
17.12.5 Discharge Water Treatment .............................................................................................. 348

NI 43-101 Technical Report for the Asanko Gold Mine, Ashanti Region, Ghana
Effective Date: February 28, 2022
Page viii
17.12.6 High Pressure (Compressed) Air Reticulation .................................................................. 348
17.12.7 Low Pressure (Blower) Air Reticulation ............................................................................. 348
17.12.8 Oxygen Reticulation .......................................................................................................... 348
17.12.9 Return Water and Return Water Treatment ...................................................................... 348
18 Project Infrastructure ..................................................................................................................... 349
18.1 Overview ....................................................................................................................................... 349
18.2 Existing Infrastructure ................................................................................................................... 349
18.2.1 Obotan – Existing Site Infrastructure .................................................................................... 349
18.2.2 Esaase – Existing Site Infrastructure .................................................................................... 349
18.2.3 Esaase-Obotan Haul Road ................................................................................................... 350
18.3 Site Layout .................................................................................................................................... 350
18.3.1 Obotan Layout ....................................................................................................................... 350
18.3.2 Esaase Layout ....................................................................................................................... 352
18.3.3 Haul Road Esaase to Obotan ............................................................................................... 353
18.4 Site Access.................................................................................................................................... 355
18.5 Waste Rock Dumps ...................................................................................................................... 355
18.6 Tailings Storage Facility ................................................................................................................ 355
18.7 Storm Water Management ............................................................................................................ 355
18.7.1 General .................................................................................................................................. 355
18.7.2 Sediment Control Structures ................................................................................................. 356
18.8 Potable Water Supply ................................................................................................................... 356
18.9 Sewage Handling .......................................................................................................................... 356
18.10 Power ........................................................................................................................................ 356
18.10.1 Power Supply – Obotan ..................................................................................................... 356
18.10.2 Power Supply – Esaase .................................................................................................... 356
18.11 Fuel ............................................................................................................................................ 356
19 Market Studies and Contracts ....................................................................................................... 357
19.1 Introduction.................................................................................................................................... 357
19.2 Marketing Strategy ........................................................................................................................ 357
19.3 Marketing Contracts ...................................................................................................................... 357
19.3.1 Refining Contract ................................................................................................................... 357
19.3.2 Off-take Agreement ............................................................................................................... 357
19.4 Pricing ........................................................................................................................................... 357
19.4.1 Payment Terms ..................................................................................................................... 357
19.5 Product Specification .................................................................................................................... 358
19.6 Shipping, Storage and Distribution ............................................................................................... 358

NI 43-101 Technical Report for the Asanko Gold Mine, Ashanti Region, Ghana
Effective Date: February 28, 2022
Page ix
20 Environmental Studies, Permitting & Social / Community Impact ............................................ 359
20.1 Ghanaian Legislation and Guidelines ........................................................................................... 359
20.1.1 Environmental and Social ...................................................................................................... 359
20.1.2 Minerals and Mining .............................................................................................................. 360
20.1.3 Compensation ....................................................................................................................... 361
20.1.4 Health, Safety and Labour ..................................................................................................... 361
20.2 Permitting Process ........................................................................................................................ 362
20.2.1 Obotan Permits ...................................................................................................................... 362
20.2.2 Esaase Permits ..................................................................................................................... 362
20.2.3 EPA Permitting Process for Esaase ...................................................................................... 362
20.3 Stakeholder Engagement ............................................................................................................. 366
20.3.1 Guiding Principles of Stakeholder Engagement ................................................................... 366
20.3.2 Engagement with Communities ............................................................................................ 366
20.3.3 Governmental Stakeholders .................................................................................................. 367
20.4 Environmental and Social Management ....................................................................................... 368
20.4.1 Environmental Management System .................................................................................... 368
20.5 Environmental and Social Mitigation ............................................................................................. 369
20.6 Environmental and Social Monitoring ........................................................................................... 369
20.6.1 Surface and Groundwater ..................................................................................................... 370
20.6.2 Dust and Noise ...................................................................................................................... 370
20.6.3 Aquatic Environment ............................................................................................................. 370
20.6.4 Ecological Environment ......................................................................................................... 371
20.6.5 Acid Rock Drainage Monitoring ............................................................................................. 371
20.6.6 Tailing Storage Facility .......................................................................................................... 371
20.7 Socio-Economic Aspects .............................................................................................................. 371
20.8 Closure and Reclamation .............................................................................................................. 371
20.9 Tailings Storage Facility Design and Construction ....................................................................... 373
20.9.1 Monitoring .............................................................................................................................. 375
20.9.2 Water Management Strategy ................................................................................................ 375
20.9.3 Closure and Rehabilitation .................................................................................................... 376
20.9.4 Geotechnical Investigation .................................................................................................... 376
20.9.5 Tailings Physical Characteristics ........................................................................................... 377
20.9.6 Tailings Geochemical Characteristics ................................................................................... 378
21 Capital and Operating Costs ......................................................................................................... 379
22 Economic Analysis ......................................................................................................................... 380
23 Adjacent Properties ........................................................................................................................ 381

NI 43-101 Technical Report for the Asanko Gold Mine, Ashanti Region, Ghana
Effective Date: February 28, 2022
Page x
24 Other Relevant Informtion ............................................................................................................. 383
25 Interpretation and Conclusions..................................................................................................... 384
25.1 Risks .............................................................................................................................................. 384
25.2 Opportunities ................................................................................................................................. 384
25.3 Geological Setting and Mineralization and Deposit Type ............................................................. 385
25.4 Exploration, Drilling, Sample Preparation and Analysis, and Security ......................................... 385
25.5 Mineral Resources ........................................................................................................................ 385
25.6 Mineral Reserves .......................................................................................................................... 385
25.7 Metallurgical Testing and Recoveries ........................................................................................... 386
25.8 Processing..................................................................................................................................... 386
25.9 Infrastructure ................................................................................................................................. 386
25.10 Market Studies and Contracts ................................................................................................... 386
26 Recommendations .......................................................................................................................... 387
26.1 Metallurgy ...................................................................................................................................... 387
26.2 Geology and Mineral Resources .................................................................................................. 387
26.3 Exploration .................................................................................................................................... 388
26.3.1 Geological Mapping ............................................................................................................... 388
26.3.2 Geophysics ............................................................................................................................ 389
26.3.3 Geochemistry ........................................................................................................................ 391
26.3.4 Spectral .................................................................................................................................. 391
26.3.5 Drilling .................................................................................................................................... 391
26.4 Operating Cost Optimization ......................................................................................................... 394
27 References ....................................................................................................................................... 395

NI 43-101 Technical Report for the Asanko Gold Mine, Ashanti Region, Ghana
Effective Date: February 28, 2022
Page xi
List of Tables
Table 1-1 Asanko Gold Mine Mining Lease and Prospecting Concession Areas ........................................... 3
Table 1-2 Head Grade Recovery Model Correlations ...................................................................................... 6
Table 1-3 Summary of the Mineral Resource at a 0.5 g/t Au cut-off and $1,600/oz Au, as of February 28,
2022 .................................................................................................................................................................. 8
Table 1-4 Process Plant Operating Criteria ..................................................................................................... 9
Table 2-1 Abbreviations and Unit of Measurement ....................................................................................... 16
Table 4-1 Asanko Gold Mine Mining Lease and Prospecting Concession Areas ......................................... 27
Table 6-1 Summary History of Ownership ..................................................................................................... 34
Table 6-2 Summary of Historical Exploration and Development per Deposit ............................................... 35
Table 7-1 Summary of Structural Controls on Mineralization per Deposit .................................................... 46
Table 7-2 Stratigraphic Unit with a General Description ................................................................................ 49
Table 9-1 Summary of Surface Samples Taken by AGM Since 2017 .......................................................... 80
Table 10-1 Drilling Summary by Deposit (to February 28, 2022) .................................................................. 91
Table 10-2 Grade Control Drilling Summary by Deposit (2014 to 2021) ..................................................... 100
Table 10-3 Grade Control Sample Summary by Deposit Since 2014 ......................................................... 100
Table 10-4 Drill Hole Sample Summary by Deposit for the Period of 2014 to 2021 ................................... 100
Table 11-1 Summary of Laboratory Location and Accreditation Status ...................................................... 108
Table 11-2 Laboratory Sample Preparation and Analysis Methods Before 2014 ....................................... 108
Table 11-3 Primary Laboratories Between 2014-2021 ................................................................................ 111
Table 11-4 Summary of Analytical Laboratories Sample Preparation and Gold Assay Techniques .......... 111
Table 11-5 Summary Findings From Previous QC Reviews ....................................................................... 112
Table 11-6 Nkran QAQC Samples For Period 01/06/2020 to 30/09/2020 .................................................. 113
Table 11-7 Standard Materials for Nkran Submitted to Lab - 2020 ............................................................. 114
Table 11-8 Esaase QC Samples for the Period 1/01/2021 to 23/08/2021 .................................................. 116
Table 11-9 Esaase Exploration CRM Results.............................................................................................. 118
Table 11-10 Esaase GC Sample Statistics for the Period of 20/11/2019 to 30/10/2021 ............................ 120
Table 11-11 Esaase Grade Control CRM Results (Method BR307) ........................................................... 124
Table 11-12 Miradani North QAQC Samples for Period 20/11/2019 to 10/30/2021 ................................... 126
Table 11-13 Miradani North CRM Results Showing Mean Bias .................................................................. 128
Table 11-14 Dynamite Hill QAQC Samples For Period 16/7/2021 to 7/9/2021 .......................................... 130
Table 11-15 Dynamite Hill CRM Results Showing Mean Bias .................................................................... 132
Table 11-16 Akwasiso QAQC Samples For Period 20/11/2019 to 30/10/2021 .......................................... 133
Table 11-17 Akwasiso Exploration CRM Results ........................................................................................ 136
Table 11-18 Akwasiso GC Samples for Period 20/11/2019 to 30/10/2021 ................................................. 138
Table 11-19 Akwasiso GC CRM Results (Method BR307) ......................................................................... 141

NI 43-101 Technical Report for the Asanko Gold Mine, Ashanti Region, Ghana
Effective Date: February 28, 2022
Page xii
Table 11-20 Abore QAQC Samples for Abore for the Period 1/1/2020 to 23/06/2021 ............................... 142
Table 11-21 Abore Exploration CRM Results .............................................................................................. 144
Table 11-22 Adubiaso QAQC Samples for the Period 01/05/2020 to 30/06/2020 ...................................... 145
Table 11-23 Adubiaso Exploration CRM Results ........................................................................................ 146
Table 13-1 Identification of Samples for Esaase Metallurgical Testwork .................................................... 154
Table 13-2 Head Grade Recovery Model Correlations................................................................................ 156
Table 13-3 Nkran Past Production Annualized Recovery ........................................................................... 157
Table 13-4 Hole and Interval Data With Expected Composite Gold Head Grades (Esaase) ..................... 161
Table 13-5 Esaase Bulk Composites – Main Elements of Interest (ALS A22281)...................................... 163
Table 13-6 Esaase Bulk Composites – Comparison of Gold Head Assays (g/t Au) ................................... 164
Table 13-7 Esaase Bulk Composites – Multi-element Analysis (ALS A22281) – Part 1 ............................. 164
Table 13-8 Esaase Bulk Composites – Multi-element Analysis (ALS A22281) – Part 2 ............................. 165
Table 13-9 Esaase Bulk Composites – Summary of Gravity/CIL Recovery Results .................................. 166
Table 13-10 Esaase Bulk Composites – Diagnostic Gold Assays on Final Residues ................................ 168
Table 13-11 Esaase Bulk Composites – Recoveries at Increasing Cut-off Grades (g/t) ............................ 169
Table 13-12 Esaase Variability Samples Head Assays ............................................................................... 172
Table 13-13 Esaase Variability Samples – Comparison of Gold Head Assays (g/t) ................................... 173
Table 13-14 Esaase Variability Samples Recovery Test Results................................................................ 174
Table 13-15 Comparison of Esaase Bulk Composites Recoveries to Corresponding Constituents ........... 175
Table 13-16 Esaase Recoveries Cropped According to Calculated Gold Head Assays ............................ 176
Table 13-17 Esaase Recovery by Domain .................................................................................................. 177
Table 13-18 Nkran Composites Details ....................................................................................................... 178
Table 13-19 Nkran Composites Head Assays ............................................................................................. 178
Table 13-20 Nkran Summary of Recoveries (600 ppm Initial NaCN) .......................................................... 179
Table 13-21 Abore Composites Details ....................................................................................................... 180
Table 13-22 Abore Composite Head Assays ............................................................................................... 181
Table 13-23 Abore Summary of Recoveries ................................................................................................ 181
Table 13-24 Miradani North Head Assays ................................................................................................... 183
Table 13-25 Miradani North Multi Element Analyses – Oxidation State Composites ................................. 183
Table 13-26 Miradani North Recovery Testing – Summarised Results ...................................................... 184
Table 13-27 Dynamite Hill Mill Feed Component and Plant Recoveries ..................................................... 185
Table 13-28 Adubiaso Past Production Summary ....................................................................................... 186
Table 13-29 Esaase Head Grade Recovery Model Correlations ................................................................ 188
Table 14-1 Summary of Mineral Resources at a 0.5 g/t Au cut-off and $1,600/oz Au, as of February 28,
2022 .............................................................................................................................................................. 189
Table 14-2 Esaase Statistics of In Situ Bulk Density Values ....................................................................... 193
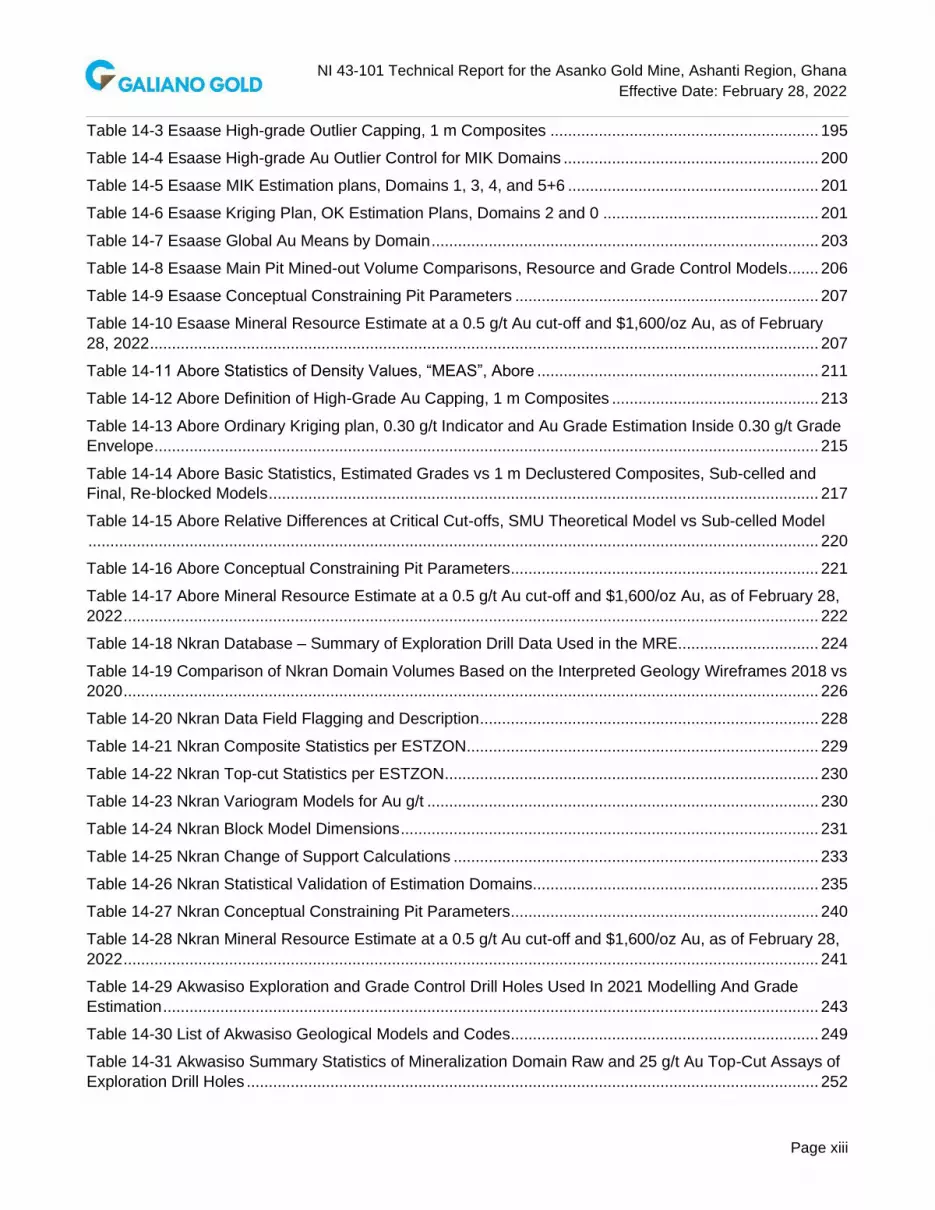
NI 43-101 Technical Report for the Asanko Gold Mine, Ashanti Region, Ghana
Effective Date: February 28, 2022
Page xiii
Table 14-3 Esaase High-grade Outlier Capping, 1 m Composites ............................................................. 195
Table 14-4 Esaase High-grade Au Outlier Control for MIK Domains .......................................................... 200
Table 14-5 Esaase MIK Estimation plans, Domains 1, 3, 4, and 5+6 ......................................................... 201
Table 14-6 Esaase Kriging Plan, OK Estimation Plans, Domains 2 and 0 ................................................. 201
Table 14-7 Esaase Global Au Means by Domain ........................................................................................ 203
Table 14-8 Esaase Main Pit Mined-out Volume Comparisons, Resource and Grade Control Models ....... 206
Table 14-9 Esaase Conceptual Constraining Pit Parameters ..................................................................... 207
Table 14-10 Esaase Mineral Resource Estimate at a 0.5 g/t Au cut-off and $1,600/oz Au, as of February
28, 2022 ........................................................................................................................................................ 207
Table 14-11 Abore Statistics of Density Values, “MEAS”, Abore ................................................................ 211
Table 14-12 Abore Definition of High-Grade Au Capping, 1 m Composites ............................................... 213
Table 14-13 Abore Ordinary Kriging plan, 0.30 g/t Indicator and Au Grade Estimation Inside 0.30 g/t Grade
Envelope ....................................................................................................................................................... 215
Table 14-14 Abore Basic Statistics, Estimated Grades vs 1 m Declustered Composites, Sub-celled and
Final, Re-blocked Models ............................................................................................................................. 217
Table 14-15 Abore Relative Differences at Critical Cut-offs, SMU Theoretical Model vs Sub-celled Model
...................................................................................................................................................................... 220
Table 14-16 Abore Conceptual Constraining Pit Parameters ...................................................................... 221
Table 14-17 Abore Mineral Resource Estimate at a 0.5 g/t Au cut-off and $1,600/oz Au, as of February 28,
2022 .............................................................................................................................................................. 222
Table 14-18 Nkran Database – Summary of Exploration Drill Data Used in the MRE................................ 224
Table 14-19 Comparison of Nkran Domain Volumes Based on the Interpreted Geology Wireframes 2018 vs
2020 .............................................................................................................................................................. 226
Table 14-20 Nkran Data Field Flagging and Description ............................................................................. 228
Table 14-21 Nkran Composite Statistics per ESTZON ................................................................................ 229
Table 14-22 Nkran Top-cut Statistics per ESTZON ..................................................................................... 230
Table 14-23 Nkran Variogram Models for Au g/t ......................................................................................... 230
Table 14-24 Nkran Block Model Dimensions ............................................................................................... 231
Table 14-25 Nkran Change of Support Calculations ................................................................................... 233
Table 14-26 Nkran Statistical Validation of Estimation Domains................................................................. 235
Table 14-27 Nkran Conceptual Constraining Pit Parameters ...................................................................... 240
Table 14-28 Nkran Mineral Resource Estimate at a 0.5 g/t Au cut-off and $1,600/oz Au, as of February 28,
2022 .............................................................................................................................................................. 241
Table 14-29 Akwasiso Exploration and Grade Control Drill Holes Used In 2021 Modelling And Grade
Estimation ..................................................................................................................................................... 243
Table 14-30 List of Akwasiso Geological Models and Codes ...................................................................... 249
Table 14-31 Akwasiso Summary Statistics of Mineralization Domain Raw and 25 g/t Au Top-Cut Assays of
Exploration Drill Holes .................................................................................................................................. 252

NI 43-101 Technical Report for the Asanko Gold Mine, Ashanti Region, Ghana
Effective Date: February 28, 2022
Page xiv
Table 14-32 Akwasiso Summary Statistics of Mineralization Domain Raw and 25 g/t Au Top-Cut Assays of
Grade Control Drill Holes ............................................................................................................................. 252
Table 14-33 Akwasiso Composite Au Statistics of Exploration and GC Drillholes ...................................... 254
Table 14-34 Akwasiso Domain 100, 210, 310 Composite Au Variogram (Correlogram) Parameters ........ 255
Table 14-35 Akwasiso 2021 Resource Model Setup ................................................................................... 256
Table 14-36 Akwasiso Grade Estimation Parameters ................................................................................. 258
Table 14-37 Akwasiso Bulk Density Values Assigned to Resource Block Model (by Material Type) ......... 259
Table 14-38 Comparison of Akwasiso Resource Model with Simulation Model (Between June 30 2021
Topography and $1600 Resource Pit Shell) ................................................................................................ 259
Table 14-39 Akwasiso 2021 Resource Classification Criteria ..................................................................... 261
Table 14-40 Akwasiso 2021 Resource Drillhole Coverage Summary ......................................................... 261
Table 14-41 Akwasiso Conceptual Constraining Pit Parameters ................................................................ 263
Table 14-42 Akwasiso Mineral Resource Estimate at a 0.5 g/t Au cut-off and $1,600/oz Au, as of February
28, 2022 ........................................................................................................................................................ 263
Table 14-43 Dynamite Hill Exploration Drill Holes ....................................................................................... 265
Table 14-44 List of Dynamite Hill Geological Models and Codes................................................................ 269
Table 14-45 Summary Statistics of Dynamite Hill Mineralization Domain Raw and Top-Cut Assays of
Exploration Drill Holes .................................................................................................................................. 270
Table 14-46 Summary Statistics of Dynamite Hill Mineralization Domain Raw and Top-Cut Assays of Grade
Control Drill Holes ........................................................................................................................................ 271
Table 14-47 Composite Au Statistics of Dynamite Hill Exploration Drillholes ............................................. 271
Table 14-48 De-clustered and Raw Dynamite Hill Exploration Drillhole Composite Au Statistics Comparison
(Main Zone) .................................................................................................................................................. 272
Table 14-49 Dynamite Hill Domain 10 Composite Au Normal Score Variogram (Correlogram) Parameters
...................................................................................................................................................................... 274
Table 14-50 Dynamite Hill 2021 Resource Model Setup ............................................................................. 274
Table 14-51 Dynamite Hill Domain 10 Simulation Model Setup .................................................................. 274
Table 14-52 Dynamite Hill Sequential Gaussian Simulation and Inverse Distance (ID3) Estimation
Parameters ................................................................................................................................................... 276
Table 14-53 Bulk Density Values Assigned to Dynamite Hill Block Model (by Material Type) ................... 276
Table 14-54 Global Stats (at 0 g/t Cut-off grade) Comparison Between Indicated Blocks and Exploration
Drill Hole Composites ................................................................................................................................... 278
Table 14-55 Dynamite Hill Resource Model Reconciliation Summary Within Mined-out Pit ...................... 280
Table 14-56 Dynamite Hill Resource Classification Criteria ........................................................................ 280
Table 14-57 Dynamite Hill Conceptual Constraining Pit Parameters .......................................................... 281
Table 14-58 Dynamite Hill Mineral Resource Estimate at a 0.5 g/t Au cut-off and $1,600/oz Au, as of
February 28, 2022 ........................................................................................................................................ 282
Table 14-59 Miradani North Exploration Drillholes ...................................................................................... 283
Table 14-60 List of Miradani North Geological Models and Codes ............................................................. 288

NI 43-101 Technical Report for the Asanko Gold Mine, Ashanti Region, Ghana
Effective Date: February 28, 2022
Page xv
Table 14-61 Raw and Top-Cut Assays Statistics of Miradani Exploration Drillholes .................................. 290
Table 14-62 Composite Au Statistics of Miradani Exploration Drillholes ..................................................... 291
Table 14-63 De-clustered and Raw Miradani Exploration Drillhole Composite Au Statistics Comparison . 292
Table 14-64 Miradani Domain 100 Composite Au Normal Score Variogram (Correlogram) Parameters .. 294
Table 14-65 Miradani North 2021 Resource Model Setup .......................................................................... 294
Table 14-66 Miradani North Mineralization Domain 100 Simulation Model Setup ...................................... 294
Table 14-67 Miradani Domain 100 SGS Search Parameters ...................................................................... 296
Table 14-68 Miradani Inverse Distance (ID3) Estimation Parameters ........................................................ 296
Table 14-69 Miradani Bulk Density Values Assigned to Resource Block Model (by Material Type) .......... 297
Table 14-70 Global Statistics Comparison of Miradani North Resource Model, Composites, and ID3
Estimate ........................................................................................................................................................ 300
Table 14-71 Miradani North 2021 Resource Classification Criteria ............................................................ 301
Table 14-72 Miradani North Conceptual Pit Parameters ............................................................................. 303
Table 14-73 Miradani North Mineral Resource Estimate at a 0.5 g/t Au cut-off and $1,600/oz Au, as of
February 28, 2022 ........................................................................................................................................ 303
Table 14-74 Asuadai Mineralized Domains ................................................................................................. 310
Table 14-75 Asuadai Estimation Domains ................................................................................................... 311
Table 14-76 Asuadai Domain Statistics and Top Caps ............................................................................... 313
Table 14-77 Asuadai Variogram Parameters............................................................................................... 313
Table 14-78 Asuadai Block Model Dimensions ........................................................................................... 314
Table 14-79 Asuadai Dry Bulk Density Values Assigned to the Block Model ............................................. 315
Table 14-80 Asuadai Classification Criteria ................................................................................................. 319
Table 14-81 Asuadai Conceptual Pit Parameters ........................................................................................ 320
Table 14-82 Asuadai Mineral Resource Estimate at a 0.5 g/t Au cut-off and $1,600/oz Au, as of February
28, 2022 ........................................................................................................................................................ 320
Table 14-83 Adubiaso Wireframe files ......................................................................................................... 326
Table 14-84 Adubiaso Domain Pre and Post Top Cut Statistics ................................................................. 329
Table 14-85 Adubiaso Applied Variogram Parameters ............................................................................... 330
Table 14-86 Adubiaso Block Model Dimensions ......................................................................................... 331
Table 14-87 Adubiaso Bulk Density Block Assignment ............................................................................... 332
Table 14-88 Adubiaso Classification Criteria ............................................................................................... 335
Table 14-89 Adubiaso Conceptual Constraining Pit Parameters ................................................................ 336
Table 14-90 Adubiaso Mineral Resource Estimate at a 0.5 g/t Au cut-off and $1,600/oz Au, as of February
28, 2022 ........................................................................................................................................................ 336
Table 17-1 Key Process Plant Operating Criteria ........................................................................................ 340
Table 17-2 AGM Process Plant Major Equipment ....................................................................................... 341
Table 18-1 Esaase to Obotan Haul Road Upgrade – Summary of Design Criteria .................................... 350

NI 43-101 Technical Report for the Asanko Gold Mine, Ashanti Region, Ghana
Effective Date: February 28, 2022
Page xvi
Table 20-1 Tailings Storage Facility Design Summary ................................................................................ 373
Table 23-1 Adjacent Property Listing ........................................................................................................... 381

NI 43-101 Technical Report for the Asanko Gold Mine, Ashanti Region, Ghana
Effective Date: February 28, 2022
Page xvii
List of Figures
Figure 1-1 Location of the Asanko Gold Mine Tenements .............................................................................. 2
Figure 1-2 Simplified Map of the West African Craton, with Associated Gold Deposits (Modified from
Goldfarb et al, 2017) ......................................................................................................................................... 4
Figure 1-3 Regional Geology of Southwest Ghana Around AGM Concessions ............................................. 5
Figure 1-4 Process Plant Block Flow Diagram .............................................................................................. 10
Figure 4-1 Location of the Asanko Gold Mine in the Ashanti Region of Ghana, West Africa ....................... 24
Figure 4-2 Location of the AGM Tenements .................................................................................................. 25
Figure 5-1 Example of Topography and Vegetation Around Esaase Pit Location ........................................ 30
Figure 7-1 Simplified Map of the West African Craton, with Associated Gold Deposits (Modified from
Goldfarb et al, 2017) ....................................................................................................................................... 39
Figure 7-2 Regional Geology of Southwest Ghana Around AGM Concessions ........................................... 41
Figure 7-3 Generalized Stratigraphy of Southwest Ghana ............................................................................ 42
Figure 7-4 Road-cut Exposure Showing Regolith Typical Regolith on a Hill on the Asankrangwa Belt ....... 44
Figure 7-5 Location of AGM Deposits Along the Asankrangwa Gold Belt .................................................... 45
Figure 7-6 Nkran Plan View Pit Showing Geology ........................................................................................ 47
Figure 7-7 Nkran Plan View and Cross-section Through Pit Showing Mineralized Domains Based on
Grade, Vein Density and Orientation Data ..................................................................................................... 48
Figure 7-8 Examples of Sedimentary Textures at Esaase ............................................................................ 50
Figure 7-9 Interpreted North Wall of Cut 3 at Esaase.................................................................................... 51
Figure 7-10 Complex Folding in the ‘Hawk Unit’ Adjacent to the Hawk Fault ............................................... 52
Figure 7-11 Illustrates the Gold-poor/Dead Zone Associated with the ‘Mobile Belt’ ..................................... 53
Figure 7-12 Examples of Steeply Plunging F1 Folds at Esaase ................................................................... 54
Figure 7-13 Examples of Deformation Fabrics at Esaase ............................................................................. 56
Figure 7-14 Examples of F2 Folds and S2 Crenulation Cleavage at Esaase ............................................... 57
Figure 7-15 Textures from the ‘Mobile Belt’ at Esaase .................................................................................. 58
Figure 7-16 Vein Textures at Esaase Part 1 .................................................................................................. 59
Figure 7-17 Vein Textures at Esaase Part 2 .................................................................................................. 60
Figure 7-18 Grade Control Drilling Patterns Highlighting the Distribution Around Folds .............................. 61
Figure 7-19 NE Corridor, Illustrating the en Echelon Tension Gash Vein Arrays ......................................... 62
Figure 7-20 Stereographic Plots for Veins and North Wall of Cut 3 Showing Vein Distribution in Various
Units ................................................................................................................................................................ 63
Figure 7-21 Schematic Geological Model for Fold Mineralization at Esaase ................................................ 64
Figure 7-22 Akwasiso Plan View Showing Geology ...................................................................................... 65
Figure 7-23 Akwasiso Cross-section Through the Pit Showing Geology ...................................................... 66
Figure 7-24 Plan View of Akwasiso Mineralization Envelopes at Akwasiso.................................................. 67
Figure 7-25 Abore Plan View Showing Drill Hole Distribution and Pit Shells ................................................ 69

NI 43-101 Technical Report for the Asanko Gold Mine, Ashanti Region, Ghana
Effective Date: February 28, 2022
Page xviii
Figure 7-26 Abore Cross-sectional View Through the Pit Showing Geology ................................................ 69
Figure 7-27 Abore Longitudinal-Section Through the Pit Showing Geology ................................................. 70
Figure 7-28 Asuadai Plan View and Cross-section Through Pit Showing Geology ...................................... 71
Figure 7-29 Adubiaso Plan View and Cross-section Through Pit Showing Geology .................................... 73
Figure 7-30 Miradani North Plan View Through Pit Showing Geology .......................................................... 74
Figure 7-31 Miradani North Plan View and Cross Section Through Pit Showing Geology ........................... 75
Figure 7-32 Dynamite Hill Plan View Through the Pit Showing Geology ...................................................... 76
Figure 7-33 Dynamite Hill Cross-section Through the Pit Showing Geology ................................................ 76
Figure 9-1 Regional Geological Interpretation from VTEM Survey ............................................................... 79
Figure 9-2 Plan Showing Gold-in-Soil Anomalies .......................................................................................... 81
Figure 9-3 Surface Geochemistry Sampling Locations (2017 to 2021) ......................................................... 82
Figure 9-4 Trench Map from Trench JGTR21-001, Jeni River Prospect ....................................................... 84
Figure 9-5 Map of Time-Domain EM Over the AGM License Package ......................................................... 85
Figure 9-6 Gradient Array Survey Over the Esaase Deposit ......................................................................... 86
Figure 9-7 Longitudinal Section Through the Nkran Deposit Showing Multiple Shoot Trends That Hold
Potential for Additional Resources ................................................................................................................. 87
Figure 9-8 Longitudinal Section Through the Miradani North Deposit .......................................................... 88
Figure 9-9 Interpreted Geology and Mineralized Trends on the Amoaman Property ................................... 89
Figure 9-10 Mineralized Trends on the AGM License Package Recommended to Follow-up ..................... 90
Figure 10-1 Distribution of Drilling and Trenching Across the AGM License Package, on Interpreted
Geology .......................................................................................................................................................... 94
Figure 10-2 Plan Showing Distribution of Drill Hole Collars at Nkran Pit ...................................................... 95
Figure 10-3 Plan Showing Distribution of Drill Hole Collars at Esaase ......................................................... 95
Figure 10-4 Plan Showing Distribution of Drill Hole Collars at Akwasiso and Nkran Extension ................... 96
Figure 10-5 Plan Showing Distribution of Drill Hole Collars at Abore ............................................................ 96
Figure 10-6 Plan Showing Distribution of Drill Hole Collars at Asuadai ........................................................ 97
Figure 10-7 Plan Showing Distribution of Drill Hole Collars at Dynamite Hill ................................................ 97
Figure 10-8 Plan Showing Distribution of Drill Hole Collars at Adubiaso and Adubiaso Extension .............. 98
Figure 10-9 Plan Showing Distribution of Drill Hole Collars at Miradani North ............................................. 98
Figure 10-10 Sample Labelling Example ..................................................................................................... 103
Figure 11-1 Plot of Nkran Blanks for the Period Noted................................................................................ 114
Figure 11-2 Scatter Plot of Nkran Exploration Field Duplicates .................................................................. 115
Figure 11-3 Half Absolute Relative Difference (HARD) Plot of Nkran Field Duplicates from Exploration .. 115
Figure 11-4 QQ Plot of Nkran Pulp Duplicates From Exploration ............................................................... 116
Figure 11-5 Plot of Blanks for Esaase Exploration/Infill Drilling for the Period Noted ................................. 117
Figure 11-6 Plots of the Performance of CRM’s G308-3 and G319-2 for Esaase Exploration Drilling ....... 117
Figure 11-7 Scatter Plot of Original vs Field Duplicates for Esaase Exploration/Infill Drilling ..................... 118

NI 43-101 Technical Report for the Asanko Gold Mine, Ashanti Region, Ghana
Effective Date: February 28, 2022
Page xix
Figure 11-8 HARD Plot of Original vs Field Duplicates for Esaase Exploration/Infill Drilling ...................... 119
Figure 11-9 QQ Plot of Original vs Pulp Duplicates for Esaase Exploration/Infill Drilling ........................... 120
Figure 11-10 Plot of Blanks for Esaase Grade Control Drilling for the Period Noted .................................. 121
Figure 11-11 Plot of Various CRM’s That Have Exceeded 3SD (Esaase) .................................................. 123
Figure 11-12 Scatter Plot of Original vs Field Duplicates for Esaase Grade Control Drilling ...................... 125
Figure 11-13 QQ Plot of Original vs Field Duplicates for Esaase GC RC Drilling ....................................... 125
Figure 11-14 Plot of Blanks for Miradani North Exploration Drilling for the Period Noted ........................... 126
Figure 11-15 Plot of CRM Standard Performance for G308-3 for Miradani North Exploration ................... 127
Figure 11-16 Plot of CRM Performance for G910-6 for Miradani North Exploration ................................... 127
Figure 11-17 Scatter Plot of Originals vs Field Duplicate Samples at Miradani North ................................ 128
Figure 11-18 HARD Plot for Miradani North ................................................................................................ 129
Figure 11-19 QQ Plot For Pulp Duplicates at Miradani North ..................................................................... 129
Figure 11-20 Plot of Blanks Performance at Dynamite Hill for the Period Stated ....................................... 130
Figure 11-21 Plot of CRM Performance for G308-3 for Dynamite Hill Exploration ..................................... 131
Figure 11-22 Plot of CRM Performance for G910-6 for Dynamite Hill Exploration ..................................... 131
Figure 11-23 Scatter Plot of Duplicate vs Original Performance at Dynamite Hill ...................................... 132
Figure 11-24 HARD Plot Analysis of Duplicate vs Original Performance at Dynamite Hill ......................... 133
Figure 11-25 Plot of Blanks for Akwasiso Exploration Drilling for the Period Stated .................................. 134
Figure 11-26 Plot of CRM Performance for G901-3 .................................................................................... 135
Figure 11-27 Plot of CRM Performance for G910-6 .................................................................................... 135
Figure 11-28 Akwasiso Exploration Field Duplicate Scatter Plot ................................................................. 136
Figure 11-29 Akwasiso Exploration Field Duplicate HARD Analysis Plot ................................................... 137
Figure 11-30 Akwasiso Exploration Pulp Duplicate QQ Plots ..................................................................... 138
Figure 11-31 Plot of Blanks for Akwasiso Grade Control RC Drilling for the Period Noted ........................ 139
Figure 11-32 Plot of CRM G318-2 Performance for Akwasiso GC ............................................................. 140
Figure 11-33 Plot of CRM G315-2 Performance for Akwasiso GC ............................................................. 140
Figure 11-34 Akwasiso Grade Control RC Field Duplicate Scatter Plot Showing Poor Repeatability ........ 141
Figure 11-35 Akwasiso Grade Control RC Field Duplicate HARD Analysis Plots ...................................... 142
Figure 11-36 Plot of Blanks for Abore Exploration Drilling for the Period Noted ......................................... 143
Figure 11-37 Plot of CRM G914-2 and G914-10 Performance for Abore Exploration ................................ 143
Figure 11-38 Scatter Plot of Field Duplicates from Abore Exploration Drilling for the Period Noted .......... 144
Figure 11-39 HARD Analysis of Field Duplicates from Abore Exploration Drilling ...................................... 145
Figure 11-40 Plot of Blanks for Adubiaso Infill Drilling for the Period Noted ............................................... 146
Figure 11-41 Scatter Plot of Field Duplicates from Adubiaso Infill Drilling .................................................. 147
Figure 11-42 HARD Analysis of Field Duplicates from Adubiaso Infill Drilling ............................................ 147
Figure 13-1 Esaase Mineralized Domains and Location of Metallurgical Samples (Plan View) ................. 159

NI 43-101 Technical Report for the Asanko Gold Mine, Ashanti Region, Ghana
Effective Date: February 28, 2022
Page xx
Figure 13-2 Esaase Mineralized Domains and Location of Metallurgical Samples (Long Section) ............ 160
Figure 13-3 Esaase Average CIL Residue Grade (g/t) by Size ................................................................... 167
Figure 13-4 Esaase Average CIL Stage Recovery (%) by Size .................................................................. 167
Figure 13-5 Head Grade vs Total Recovery – Esaase Bulk Composites.................................................... 169
Figure 13-6 Head Grade vs Total Recovery, with High Grade Outlier Omitted – Esaase Bulk Composites
...................................................................................................................................................................... 169
Figure 13-7 Gold Removed from Final Residue During Acetonitrile Strip vs. OC Content – Esaase Bulk
Composites ................................................................................................................................................... 170
Figure 13-8 Organic Carbon Grade vs. CIL Stage Recovery – Esaase Bulk Composites ......................... 170
Figure 13-9 Esaase Bulk Composite vs. Constituents’ Recoveries ............................................................ 176
Figure 13-10 Esaase Gold Recovery by Mineralized Domain ..................................................................... 177
Figure 13-11 Nkran Composite Long Section .............................................................................................. 178
Figure 13-12 Abore Composites Long Section ............................................................................................ 180
Figure 13-13 Miradani North Drill Holes Long Section ................................................................................ 182
Figure 13-14 Plant Recovery versus Dynamite Hill Feed Component ........................................................ 186
Figure 14-1 Esaase Cross Section Through Main Pit Showing Stratigraphic Units and Drill Hole Databases
...................................................................................................................................................................... 190
Figure 14-2 Esaase Mineralized Domains ................................................................................................... 191
Figure 14-3 Esaase Histogram and Basic Statistics of Gold (g/t) in Samples Within the Domain 1 (Main Pit,
Hanging Wall) ............................................................................................................................................... 192
Figure 14-4 Esaase Histogram and Basic Statistics of Gold (g/t) in Samples Within the Domain 3 (Main Pit,
Footwall) ....................................................................................................................................................... 192
Figure 14-5 Esaase Histogram and Basic Statistics, Au (g/t), All 1 m Composites within Domain 1 (Main Pit,
Hanging Wall) ............................................................................................................................................... 193
Figure 14-6 Esaase Histogram and Basic Statistics, Au (g/t), All 1 m Composites within Domain 3 (Main Pit,
Footwall) ....................................................................................................................................................... 194
Figure 14-7 Esaase Probability Plot, Au (g/t), All 1 m Composites Within Domain 1 (Main Pit, Hanging Wall)
...................................................................................................................................................................... 194
Figure 14-8 Esaase Probability Plot, Au (g/t), All 1 m Composites Within Domain 3 (Main Pit, Footwall) . 195
Figure 14-9 Esaase De-clustered Histogram and Basic Statistics, 50 m x 50 m x 10 m cell size, Au (g/t),
Domain 1 ...................................................................................................................................................... 196
Figure 14-10 Esaase Quantile-Quantile Plot, Au (g/t), Oxide vs Transition Zones, Composites Inside the
Mineralized Envelopes ................................................................................................................................. 196
Figure 14-11 Esaase Au Grade Profile, Domain 1 Contact with Outside Composites................................ 197
Figure 14-12 Esaase Histogram and Basic Statistics, RC Grade Control Data, All Domains .................... 197
Figure 14-13 Esaase Probability Plot, RC Grade Control Data, Domain 1 ................................................. 198
Figure 14-14 Esaase Quantile-Quantile Plot, Exploration vs Grade Control Au 3 m Composites, No More
Than 3 m Apart ............................................................................................................................................. 198
Figure 14-15 Esaase Summary Variogram Model, 0.80 g/t Indicator, 1 m Composites, Domain 3 ........... 199

NI 43-101 Technical Report for the Asanko Gold Mine, Ashanti Region, Ghana
Effective Date: February 28, 2022
Page xxi
Figure 14-16 Esaase Main Pit Au Grade Estimates Within Resource Pit, Level 194.5 .............................. 202
Figure 14-17 Esaase South Pit Au Grade Estimates Within Resource Pit, Level 194.5 ............................. 202
Figure 14-18 Esaase Main Pit Au Grade Estimates Within Resource Pit, Cross Section 724500N (Approx.),
Looking NE ................................................................................................................................................... 203
Figure 14-19 Esaase South Pit Au Grade Estimates Within Resource Pit, Longitudinal Section, Looking NE
to the Right of Image .................................................................................................................................... 203
Figure 14-20 Esaase Drift Plot, Domain 3 Au Grade Estimates (in Blue) vs Declustered Composites
(Nearest Neighbor Model, in Orange) .......................................................................................................... 204
Figure 14-21: Esaase Resource Classification, Longitudinal Section ......................................................... 205
Figure 14-22 Esaase Resource Classification, Level 194.5m. .................................................................... 205
Figure 14-23 Esaase Measured and indicated Grade-Tonnage Curves ..................................................... 208
Figure 14-24 Abore Three-dimensional View of the 0.3 g/t Au Grade Envelope in Red and Topography in
Brown............................................................................................................................................................ 210
Figure 14-25 Abore Histogram and Basic Statistics of Samples Within the Grade Envelope, Au ≥ 0.3 g/t 210
Figure 14-26 Abore Histogram and Basic Statistics of Samples Within the Grade Envelope, Au < 0.3 g/t 211
Figure 14-27 Abore Histogram and Basic Statistics, Au grades, All 1 m Composites Inside the 0.3 g/t Au
Envelope ....................................................................................................................................................... 212
Figure 14-28 Abore Probability Plot, Au, Inside the 0.3 g/t Au Mineralization Envelope ............................ 212
Figure 14-29 Abore Declustered Histogram and Basic Statistics, 50 m Cell Size, Au Grades, Inside the 0.30
g/t Au Envelope ............................................................................................................................................ 213
Figure 14-30 Abore Average Au Grade Profiles Near Contact of the 0.2 g/t Envelope .............................. 214
Figure 14-31 Abore Summary Variogram Model, 0.30 g/t Au Indicator, 1 m Composites Inside the 0.30 g/t
Envelope ....................................................................................................................................................... 214
Figure 14-32 Abore Au Grade Estimates, Level 157.5, Northern Area ....................................................... 216
Figure 14-33 Abore Au Grade Estimates, Level 157.5, Southern Area ...................................................... 216
Figure 14-34 Abore Au Grade Estimates, Cross Section 714170N ............................................................ 216
Figure 14-35 Abore Au Grade Estimates, Longitudinal Section .................................................................. 217
Figure 14-36 Abore Drift Plot, Au Grade Estimates (in Blue) vs Declustered Composites (Nearest Neighbor
Model, in Orange) ......................................................................................................................................... 218
Figure 14-37 Abore Summary Correlogram Model Parameters, Au Within the 0.3 g/t Au Grade Envelope
...................................................................................................................................................................... 219
Figure 14-38 Abore Resource Classification, Longitudinal Section ............................................................ 221
Figure 14-39 Abore Resource Classification, Level 187.5m ....................................................................... 221
Figure 14-40 Abore Measured and Indicated Grade-Tonnage Curves ....................................................... 223
Figure 14-41 3D View of the Nkran Geological Domains Within the June 2020 Mining Surface ............... 225
Figure 14-42 Cross-section View of the Nkran Weathering Profiles and Geological Domains................... 225
Figure 14-43 Nkran Log Probability Plots Comparing Top-cut Au Grades in DDH, RC and RCD Drill Holes
...................................................................................................................................................................... 227

NI 43-101 Technical Report for the Asanko Gold Mine, Ashanti Region, Ghana
Effective Date: February 28, 2022
Page xxii
Figure 14-44 Nkran QQ Plots Comparing Au Grades in the Exploration Dataset (X axis) to the Dynamic RC
GC Dataset (Y axis) for Western Sandstone (LHS) and Central Sandstone (RHS) ................................... 227
Figure 14-45 Nkran Log Probability Overlay plots of Uncut Au g/t within the Estimation Domains (ESTZON)
...................................................................................................................................................................... 228
Figure 14-46 Nkran Gaussian Anamorphosis Models for ESTZON 210 (Left) and ESTZON 220 (Right) . 232
Figure 14-47 Nkran Histogram of Au (Left) and Gaussian Transformed Au (Right) for ESTZON 210 ....... 232
Figure 14-48 Nkran Histogram of Au (Left) and Gaussian Transformed Au (Right) for ESTZON 220 ....... 232
Figure 14-49 Nkran Cross-section View – OK Panel Model and Composites (ESTZON 210 on Left,
ESTZON 220 on Right) ................................................................................................................................ 234
Figure 14-50 Nkran Scatterplots Showing UC Panel Grade (x-axis) versus OK Panel Grade (y-axis) ...... 236
Figure 14-51 Nkran GLOBAL Swath Plots and Histogram .......................................................................... 236
Figure 14-52 Nkran ESTZON 210 (Western Sandstone) Swath Plots and Histogram ............................... 237
Figure 14-53 Nkran ESTZON 220 (Central Sandstone) Swath Plots and Histogram ................................. 237
Figure 14-54 Nkran Scatterplots Showing Mean LUC Grade of SMUs (x-axis) versus UC Grade (y-axis)
Both at a Zero Cut-off. ESTZON 210 (Left) and ESTZON 220 (Right). ...................................................... 238
Figure 14-55 Nkran Grade (Left) and Tonnage Curves (Right) for ESTZON 210 with UC Model in Red and
LUC in Green ................................................................................................................................................ 238
Figure 14-56 Nkran Cross-section View of Classified Grade Model, Constrained within Nominal
US$1,600/oz Au Pit Shell (Blue Outline) Bounded by the June 2020 Mining Surface (Black Outline) ....... 239
Figure 14-57 Nkran 3D View of Classified Grade Model, View Towards NW. Nominal US$1,600/oz Pit Shell
Shown in Blue ............................................................................................................................................... 240
Figure 14-58 Nkran Grade-Tonnage Curve - All Mineralization .................................................................. 242
Figure 14-59 View of Akwasiso Exploration Drillholes................................................................................. 244
Figure 14-60 Akwasiso QQ Plots of Resolute and Asanko Drillhole Assays at < 5 m Distance ................. 245
Figure 14-61 Akwasiso QQ Plots of GC and Asanko Exploration Drillhole 1.5 m Composites at < 5 m
Distance ........................................................................................................................................................ 245
Figure 14-62 Akwasiso QQ Plots of GC Field Duplicate Assays vs. Original Assays ................................. 246
Figure 14-63 Plan and Sectional View of Akwasiso Lithology, Shear and Oxidation Model ....................... 247
Figure 14-64 Sectional View of Akwasiso Oxidation Model ........................................................................ 247
Figure 14-65 Plan and Sectional View of Akwasiso Mineralization Model .................................................. 248
Figure 14-66 Sectional View of Akwasiso Mineralization Model ................................................................. 249
Figure 14-67 Log Probability Plot of Akwasiso Exploration Drill Hole Assays Au Grade by Mineralization,
Oxidation, and Lithology ............................................................................................................................... 250
Figure 14-68 Assays Log Probability Plots of Exploration Drill Holes by Domain ....................................... 251
Figure 14-69 Log Probability Plot of Akwasiso Exploration Drill Hole 1.5 m Composite Au Grade by
Mineralization Domain .................................................................................................................................. 253
Figure 14-70 Akwasiso Contact Graphs of Drillhole Assays Between Main Mineralization Domains ........ 254
Figure 14-71 Akwasiso Contact Graphs of Drillhole Assays Between Oxidation Domains ........................ 255
Figure 14-72 3D Visualization of Variogram Ellipses for Akwasiso Domain 100, 210, 310 ........................ 256

NI 43-101 Technical Report for the Asanko Gold Mine, Ashanti Region, Ghana
Effective Date: February 28, 2022
Page xxiii
Figure 14-73 Akwasiso Block Assignment of Domain Codes ...................................................................... 257
Figure 14-74 Illustration of Akwasiso Search Ellipsoid (Domain 100 example) .......................................... 258
Figure 14-75 Akwasiso Tonnage-Grade Comparison of EXP Model and GC Model in Mined-out Area .... 259
Figure 14-76 Akwasiso Swath Plot by Northing and Elevation for Block and Composite Au (g/t) of Main
Domains ....................................................................................................................................................... 260
Figure 14-77 Illustration of Akwasiso 2021 Resource Classification and Block 3-Hole Average Distances
...................................................................................................................................................................... 262
Figure 14-78 Akwasiso Tonnage - Grade Curve for Indicated Mineral Resources ..................................... 264
Figure 14-79 Dynamite Hill Exploration and GC Drill Holes ........................................................................ 265
Figure 14-80 Dynamite Hill Lithology and Oxidation Model (Inclined Long Sectional View of Granite Model)
...................................................................................................................................................................... 267
Figure 14-81 Sectional View of Dynamite Hill Mineralization Model ........................................................... 268
Figure 14-82 Long Sectional View of Dynamite Hill Main Mineralization Model ......................................... 268
Figure 14-83 Log Probability Plot of Dynamite Hill Exploration Drill Hole Assays Au Grade by
Mineralization, Oxidation, and Lithology Model ........................................................................................... 269
Figure 14-84 Dynamite Hill Top-cut Analysis of Exploration Drill Holes Au Assays .................................... 270
Figure 14-85 Cell De-clustered Dynamite Hill Exploration Drillhole Composites Au Mean vs. Cell Size (Main
Zone) ............................................................................................................................................................ 272
Figure 14-86 Dynamite Hill Domain 10 Composite Au Normal Score Variogram (Correlogram) Parameters
...................................................................................................................................................................... 273
Figure 14-87 Example of Domain 10 GC Sample and Exploration Composite Au Normal Score Variogram
(Correlogram) ............................................................................................................................................... 273
Figure 14-88 Vertical Sectional View of Dynamite Hill Resource Block Model of Mineralization Domain .. 275
Figure 14-89 Dynamite Hill Accuracy Plot of 50 SGS Realizations ............................................................. 277
Figure 14-90 Dynamite Hill Statistical Comparison of SGS Realizations and Input Composites ............... 277
Figure 14-91 Dynamite Hill Plan View of SGS Realization ausim01 Grade ................................................ 278
Figure 14-92: Dynamite Hill Swath Plot by Easting, Northing, and Elevation for Block and Composite Au g/t
of Domain 10 ................................................................................................................................................ 279
Figure 14-93 Dynamite Hill Block Model 3 - Hole Average Distances and Resource Classification .......... 281
Figure 14-94 Dynamite Hill Tonnage - Grade Curve for Indicated Mineral Resources ............................... 282
Figure 14-95 Plan View of Miradani North Exploration Drillholes ................................................................ 283
Figure 14-96 Sectional View of Miradani North Exploration Drillholes ........................................................ 284
Figure 14-97 Plan View of Miradani North Lithology Model ........................................................................ 285
Figure 14-98 Sectional View of Miradani North Lithology Model ................................................................. 286
Figure 14-99 Plan View of Miradani North Lithology Model ........................................................................ 287
Figure 14-100 Sectional View of Miradani North Lithology Model ............................................................... 287
Figure 14-101 Log Probability Plot of Miradani Exploration Drillhole Assays Au Grade by Mineralization 288
Figure 14-102 Log Probability Plot of Miradani Exploration Drillhole Assays Au Grade by Oxidation and
Lithology Model Inside Minzone ................................................................................................................... 289

NI 43-101 Technical Report for the Asanko Gold Mine, Ashanti Region, Ghana
Effective Date: February 28, 2022
Page xxiv
Figure 14-103 Top-cut Analysis of Miradani Exploration Drillholes Au Assays ........................................... 290
Figure 14-104 Contact Graphs of Drillhole Assays by Miradani Lithology and Mineralization Models ....... 291
Figure 14-105 Cell De-clustered Miradani Exploration Drillhole Composites Au Mean vs. Cell Size ......... 292
Figure 14-106 Miradani Domain 100 Composite Au Normal Score Variogram (Correlogram) Parameters293
Figure 14-107 Miradani Domain 100 Drillhole Composite Au Normal Score Variogram (Correlogram) ..... 293
Figure 14-108 Vertical Sectional View of Miradani North Resource Block Model of Mineralization Domain
...................................................................................................................................................................... 295
Figure 14-109 Illustration of Miradani ID3 Estimation Search Orientations................................................. 297
Figure 14-110 Miradani Accuracy Plot of 50 SGS Realizations .................................................................. 298
Figure 14-111 Miradani Statistical Comparison of SGS Realizations and Input Composites ..................... 298
Figure 14-112 Miradani SGS Realization ausim03 Au Grade Compared to Variogram Model .................. 299
Figure 14-113 Miradani Swath Plot by Easting, Northing, and Elevation for Block and Composite Au (g/t) for
Domain 100 Indicated Class ........................................................................................................................ 300
Figure 14-114 Miradani Tonnage-Grade Comparison of LSMU and ID3 Estimates in Domain 100 .......... 301
Figure 14-115 Illustration of Miradani North 2021 Resource Classification ................................................ 302
Figure 14-116 Miradani Plan View of Blocks Coloured by 3-Hole Average Distance to Block Centroids .. 302
Figure 14-117 Miradani North Tonnage - Grade Curve for Indicated Mineral Resources .......................... 304
Figure 14-118 Asuadai Lithological and Structural Models ......................................................................... 306
Figure 14-119 Asuadai Material Type Models ............................................................................................. 307
Figure 14-120 Asuadai Preliminary Grade Analysis .................................................................................... 308
Figure 14-121 Asuadai Mineralization Model............................................................................................... 308
Figure 14-122 Asuadai Secondary Grade Analysis ..................................................................................... 309
Figure 14-123 Asuadai Material Type Analysis ........................................................................................... 311
Figure 14-124 Top Cap Selection Example ................................................................................................. 312
Figure 14-125 Asuadai Relative Variogram Models .................................................................................... 314
Figure 14-126 Asuadai Block Model Coded Domains ................................................................................. 315
Figure 14-127 Asuadai Validation of Gaussian Values ............................................................................... 316
Figure 14-128 Asuadai Variogram Reproduction ........................................................................................ 317
Figure 14-129 Asuadai Data Distribution Reproduction .............................................................................. 317
Figure 14-130 Asuadai Grade Tonnage Validation ..................................................................................... 317
Figure 14-131 Asuadai LSMU Model and Simulation Realizations ............................................................. 318
Figure 14-132: Classification Comparison on Section 709200mN .............................................................. 319
Figure 14-133 Asuadai Tonnage - Grade Curve for Indicated Mineral Resources ..................................... 321
Figure 14-134 Plan View of Adubiaso Exploration Drillholes ...................................................................... 322
Figure 14-135 Adubiaso Lithological and Structural Models (Section View) ............................................... 323
Figure 14-136 Adubiaso Lithological and Structural Models (Plan View).................................................... 324
Figure 14-137 Adubiaso Mineralization Model (Cross-section View) .......................................................... 324

NI 43-101 Technical Report for the Asanko Gold Mine, Ashanti Region, Ghana
Effective Date: February 28, 2022
Page xxv
Figure 14-138 Adubiaso Mineralization Model (Long-section View) ........................................................... 325
Figure 14-139 Adubiaso Domain Numbering Convention ........................................................................... 326
Figure 14-140 Adubiaso Material Type Analysis ......................................................................................... 328
Figure 14-141 Adubiaso Cumulative Grade Frequency by Drill Hole Type................................................. 328
Figure 14-142 Adubiaso Topcap Selection Example ................................................................................... 329
Figure 14-143 Adubiaso Plan View Showing Coded Block Model by Lithology Wireframes ...................... 331
Figure 14-144 Adubiaso Validation of Gaussian Values ............................................................................. 333
Figure 14-145 Adubiaso Data Distribution Reproduction ............................................................................ 333
Figure 14-146 Adubiaso Grade Tonnage Validation ................................................................................... 334
Figure 14-147 Adubiaso Global Model Grade Tonnage Curve ................................................................... 334
Figure 14-148 Comparison of 2014 and Current Block Classification ......................................................... 335
Figure 14-149 Adubiaso Tonnage - Grade Curve for Indicated Mineral Resources ................................... 337
Figure 17-1 Process Plant Block Flow Diagram .......................................................................................... 341
Figure 18-1 Obotan Site Plan and Surrounding Infrastructure .................................................................... 351
Figure 18-2 Process Plant Layout ................................................................................................................ 352
Figure 18-3 Esaase Site Infrastructure Layout ............................................................................................ 353
Figure 18-4 Asanko Gold Haul Road – Overall Site Infrastructure Layout .................................................. 354
Figure 20-1 EIA Approach for the Esaase Project ....................................................................................... 363
Figure 20-2 Community Members at the EPA Public Hearing .................................................................... 365
Figure 20-3 A Cross Section of Chiefs and Members of the Community at the EPA Public Hearing ......... 365
Figure 20-4 Reclamation of Native Timber Species and Food Crops ......................................................... 372
Figure 20-5 Tailings Storage Facility Stage 12 Layout ................................................................................ 374
Figure 23-1 AGM Tenements and Adjacent Properties ............................................................................... 382
Figure 26-1 Location of Sky Gold Tenements West of the Esaase Deposit, with Geology Interpreted From
Regional Geophysics ................................................................................................................................... 389
Figure 26-2 Location of Recommended Areas for Gradient Array Survey .................................................. 390
Figure 26-3 Longitudinal Section Through the Nkran Deposit Showing Multiple Shoot Trends That Hold
Potential for Additional Resources ............................................................................................................... 392
Figure 26-4 Cross-section Through the Nkran Deposit With Possible Deep Drilling Hole Traces ............. 392
Figure 26-5 Longitudinal Section Through the Miradani North Deposit ...................................................... 393

NI 43-101 Technical Report for the Asanko Gold Mine, Ashanti Region, Ghana
Effective Date: February 28, 2022
Page 1
1 SUMMARY
1.1 Introduction
Galiano Gold Inc. (the “Company” or “Galiano Gold”) is a gold mining company listed on the TSX and NYSE, with headquarters at 1640-1066 West Hastings Street, Vancouver, British Columbia (https://www.galianogold.com/). The Company's flagship project is the jointly owned Asanko Gold Mine (“AGM”). Galiano Gold and Gold Fields Limited (JSE & NYSE: GFI) jointly each own a 45% interest in Asanko Gold Ghana Limited (“AGGL”), with the Government of Ghana retaining a 10% free-carried interest. The AGM concessions are owned 100% by Asanko Gold Ghana Limited.
The AGM is a large scale, multi-deposit gold asset, which is managed and operated by Galiano Gold. The mine was built in 2015, with first gold poured in January 2016, and commercial production commencing in April 2016. The AGM has produced an average of approximately 230,000 ounces (oz) of gold per year between 2017 to 2021 and had a record gold production of approximately 251,000 ounces in 2019. AGGL holds the largest land package on the highly prospective and underexplored Asankrangwa Gold Belt.
The AGM is a multi-deposit complex with two main deposits, Nkran and Esaase, six satellite deposits and a carbon-in-leach (CIL) processing plant with a current operating capacity of approximately 5.8 Mtpa.
This report is a National Instrument 43-101 (NI 43-101) Technical Report that summarizes the AGM and its updated Mineral Resources effective February 28, 2022. This NI 43-101 Technical Report for the Asanko Gold Mine, Ashanti Region, Ghana, with an effective date of February 28, 2022 (“Report”) updates all material information on the AGM, is addressed to Galiano Gold, supports the disclosure of updated Mineral Resource estimates and supports the scientific and technical content in Galiano Gold’s Annual Information Form filing.
As at the effective date of this Report, Galiano Gold is not in a position to declare Mineral Reserves on the AGM property as a result of current metallurgical uncertainty of the Esaase material. AGM is in the process of investigating options for mitigating the issues, which will subsequently lead to a revised optimized mine plan. At that time, Galiano Gold will prepare an updated technical report supporting the new life of mine plan, based on Mineral Reserves.
Any references to “ore” apply to production during time periods when Mineral Reserves were stated.
The Report supersedes all previous technical reports.
1.2 Property Description and Ownership
Ghana is located in West Africa, sharing boundaries with Togo to the east, Cote d’Ivoire to the west, Burkina Faso to the north and the Gulf of Guinea to the south.
The country is known to hold a significant portion of West Africa’s gold deposits and has long attracted investors looking to trade and invest in its mineral riches. According to recent global statistics on gold production, Ghana is the world’s eighth and Africa’s largest gold producer. In addition to gold, the country has other mineral resources such as manganese, bauxite, and diamonds. At the moment, gold is Ghana’s most important export commodity, followed by cocoa and timber products.
The AGM tenements are in the Amansie West and South Districts, of the Ashanti Region of Ghana, approximately 250 km NW of the capital Accra and some 50 km to 80 km southwest of the regional capital Kumasi. The concessions cover an area of approximately 476 km2 between latitudes 6º 19’40” N and 6º 28’ 40” N; and longitudes 2º 00’ 55” W and 1º 55’ 00” W.
The AGM concessions are owned 100% by Asanko Gold Ghana Limited. All mineral tenements are in good standing with the Government of Ghana.

NI 43-101 Technical Report for the Asanko Gold Mine, Ashanti Region, Ghana
Effective Date: February 28, 2022
Page 2
AGGL holds 7 mining leases, 9 prospecting licences and 1 reconnaissance licence which collectively make up the AGM property and span over a 40 km length of the Asankrangwa Belt. The AGM is made up of a series of contiguous concessions in the Obotan and Esaase area. These concessions cover a total area of 476 km2 and are summarized in Table 1-1.
Figure 1-1 Location of the Asanko Gold Mine Tenements
Source: Asanko Gold Mine, 2021

NI 43-101 Technical Report for the Asanko Gold Mine, Ashanti Region, Ghana
Effective Date: February 28, 2022
Page 3
Table 1-1 Asanko Gold Mine Mining Lease and Prospecting Concession Areas
Name Mincom Ref# Licence
area (km2) Type Status/ Expiry date Ownership
Abore PL 6/352 28.47 Mining Lease Valid-ML 4/2030 Asanko – 100
% Abirem PL 6/303 47.13 Mining Lease Valid-ML 3/2026
Adubea PL 6/310 13.38 Mining Lease Valid-ML 4/2030
Miradani PL 6/122 14.98 Mining Lease Valid-ML 5/2025
Asanko – 100 %
Esaase PL 6/8 Vol 8 27.03 Mining Lease Application, All relevant documents and payment made for renewal of ML. Awaiting Ministerial Approval.
Jeni River RL 6/21 27.37 Mining Lease Application, All relevant documents and payment made for renewal of ML. Awaiting Ministerial Approval.
Kaniago PL 6/307 25.5 Prospecting Application, All relevant documents and payment made for renewal of PL. Awaiting Ministerial Approval
Asanko – 100 %
New Obuase PL 3/84 33.67 Prospecting Application, All relevant documents and payment made for renewal of PL. Awaiting Ministerial Approval
Datano PL 6/32 53.78 Mining Lease Valid-ML 5/2030
Mepom Pl 6/245 2.37 Prospecting Note 1 Asanko – 100
% Dawohodo PL 6/43 10.00 Prospecting Valid-PL 12/2023
Asanko – 100 %
Sky Gold RL 6/86 91.50 Reconnaissance Application, All relevant documents and payment made for renewal of RL. Awaiting Ministerial Approval. Note 2
Kaniago PL 6/289 25.27 Prospecting Application, All relevant documents and payment made for renewal of PL. Awaiting Ministerial Approval
Asanko – 100 %
Besease PL.6/120 15.55 Prospecting Valid-PL 12/2023
Mmooho PL 6/352 5.70 Prospecting Valid-PL 12/2023
Gyagyatreso PL6/32 10.83 Prospecting Application, All relevant documents and payment made for renewal of PL. Awaiting Ministerial Approval
Amoaman PL6/380 43.47 Prospecting Valid-PL 11/2022
Note 1: Mepom License renewal pending since 2012. In process of being merged with Esaase ML Note 2: License conversion from RL to PL pending since 2012.
All concessions carry a 10% free carried interest in favour of the Ghanaian government and as a result, the Ghanaian government holds a 10% interest in AGGL. All mining leases are also subject to a 5% Net Smelter Return (NSR) royalty payable to the Government of Ghana. In addition, the Adubea mining concession is subject to an additional 0.5% NSR royalty to the original concession owner. The Esaase mining lease is also subject to an additional 0.5% NSR royalty to the Bonte Liquidation Committee (BLC). The Akwasiso deposit on the Abirem mining lease is also subject to an additional 2% NSR royalty payable to the original concession owner.
1.3 Geology and Mineralization
The geology of Ghana is largely underlain by the West African craton. The craton consists of the Man-Leo (or Kénéma-Man) shield in the south (extending from Ghana to Senegal) and the Archaean Reguibat Shield in Mauritania to the north. They are separated by overlying younger sedimentary rocks of the
Taoudeni Basin (see Figure 1-2).

NI 43-101 Technical Report for the Asanko Gold Mine, Ashanti Region, Ghana
Effective Date: February 28, 2022
Page 4
Figure 1-2 Simplified Map of the West African Craton, with Associated Gold Deposits (Modified from
Goldfarb et al, 2017)
Note: Numbers 1 to 9 outline the different Archean, Proterozoic, and Hercynian domains: 1 = Eglab, 2 = Yetti, 3 = Daomeyan, 4 = Baoulé-Mossi, 5 = Kenema-Man, 6 = Kédougou-Kénébia Inlier, 7 =Rokelides, 8 = Bassarides, 9 = Mauritanides
At the regional scale, the AGM deposits are in the Paleoproterozoic Birimian Supergroup within the Man-Leo Shield in the southeast West Africa Craton. The Birimian Supergroup rocks consist of five NNE-trending greenstone belts composed of calc-alkaline or tholeiitic volcanic rocks separated by wide intervening sedimentary basins formed during two major orogenic phases between 2.25 to 2.15 Ga and 2.12 to 2.06 Ga. Magmatic episodes affecting the Birimian Supergroup rocks include Tonalite-Trondhjemite-Granodiorite emplacement (2.17-2.21 Ga), Granodiorite and Granite intrusions (2.12 and 2.09 Ga), and Granite intrusions (2.11 to 2.07 Ga).
Orogenic gold mineralization in the Birimian Supergroup occurs as quartz-vein-hosted and disseminated sulphide most developed between 2.2 Ga and 1.8 Ga. Peak gold mineralization in the West African Craton occurred at approximately 2.15–2.10 Ga and produced very large (>10 Moz) gold deposits associated with regional northeast–southwest trending shear zones.

NI 43-101 Technical Report for the Asanko Gold Mine, Ashanti Region, Ghana
Effective Date: February 28, 2022
Page 5
Figure 1-3 Regional Geology of Southwest Ghana Around AGM Concessions
Source: Ghana Geological Survey; CJM, 2014
At the local scale, the AGM deposits are in the Asankrangwa Gold Belt, a complex of northeast-trending shear zones along the central axis of the Kumasi Basin, which is one of the intervening basins between the greenstone belts. The Kumasi Basin is heavily faulted and consists of an isoclinally folded sequence of metasedimentary rocks. The basin is bound to the southeast by the Ashanti Fault/Shear and the Bibiani shear to the northwest. The regional 35-40° trending Nkran Shear, a zone of about 15 km in width, traced on a northeast to southwest trend for some 150 km hosts the Nkran, Asuadai, Dynamite Hill, and Akwasiso deposits. The parallel Esaase Shear Corridor hosts the Esaase, Adubiaso, and Abore deposits. The Miradani Shear Corridor hosts the Miradani deposit.
At the property scale, the AGM deposits are hosted along a 7 km wide and 50 km long segment of the Asankrangwa structural corridor locally coincident with magnetic lows and jogs along the NE trending shears. Quartz veins and disseminated sulphides are hosted in rocks ranging from granite and tonalite to sandstone, siltstone, and shale. Structural controls on gold mineralization include linking, conjugate, and tensional quartz veins associated with D2 shears.
1.4 Exploration and Drilling
Systematic exploration at the Asanko Gold Mine concessions includes regional generative and near mine programs, targeting new gold deposits as well as further delineation of Mineral Resources.
Multiple soil geochemical surveys have been undertaken on the AGM licences by various explorers. Since 2017, a total of 1,246 surface geochemical samples (grab, soil, stream sediment) have been taken across the AGM concessions with the focus on generation of greenfield targets.

NI 43-101 Technical Report for the Asanko Gold Mine, Ashanti Region, Ghana
Effective Date: February 28, 2022
Page 6
Geophysical surveys over the property have included regional aeromagnetic imaging of the Ashanti Belt and adjacent Kumasi Basin by the Ghana Geological Survey, as well as induced potential (IP) ground geophysical surveying and airborne VTEM and magnetic survey centred over specific targets.
Surface drilling at the AGM includes reverse circulation (RC), diamond drill hole (DDH) and reverse circulation with diamond tail (RCD). Drilling for Mineral Resource delineation focused on Nkran, Esaase, Miradani North, Dynamite Hill and Abore, although extensive drilling has also been undertaken at Akwasiso and Adubiaso. To date, a combined total of 4,773 aircore, DDH, RC, and RCD drill holes totalling 652,425 m have been drilled at the AGM deposits.
1.5 Metallurgical Testwork and Recoveries
1.5.1 Esaase
The 2021 testing (ALS report A22281) returned recovery results for the bulk composites that align with those from the 2018/19 testwork programs. As such, no change has been made to the recovery estimates as per the Asanko Gold NI 43-101 Technical Report (2020) for the purpose of constraining the current Mineral Resource estimate.
These recovery estimates, based on lithological source/type, are calculated according to the equations in Table 1-2. The recovery estimates are of sufficient confidence to determine reasonable prospect for eventual economic extraction; however, in light of recent plant performance of the Esaase material, further understanding of the Esaase metallurgical variability is required to have sufficient confidence to declare Mineral Reserves.
Table 1-2 Head Grade Recovery Model Correlations
Material Source Head Grade Recovery
Correlation M (slope) C (coefficient)
Upper (Fresh/Trans) y = 9.600ln(x) + 82.260 9.60 82.26
Cobra (Fresh/Trans) y = 15.532ln(x) + 56.020 15.5 56.02
Central (Fresh/Trans) y = 6.202ln(x) + 85.792 6.20 85.79
Python (Fresh/Trans) =upper 9.60 82.26
Other (Fresh/Trans) =upper 9.60 82.26
Material Type Residue Value Au (g/t)
Esaase Oxides* 0.10
Recovery Discount Factor (due to Soluble Gold Losses & Carbon Losses) 0.5%
Note: * A fixed residue grade has been applied to the Esaase Oxide material
Although the variability composites testing completed in 2021 (A22281) indicated an upside to these recovery estimates, the results are not applied herein. The rationale behind deferring reliance on the higher recoveries obtained in the testing is twofold:
1. Current plant performance is yielding lower recoveries than previously modelled in equivalent spatial locations within the Esaase deposit. The deviation between actual plant performance and modelled recovery will need to be further examined to determine the cause and the extent to which this may persist within the deposit
2. The variability testing, although indicative of an upside to 90.1% average recovery, may require revised plant operating protocols
The Company is working to better understand the cause(s), magnitude and impact of the observed lower recovery, and to quantify the magnitude of benefits from a series of opportunities that have been identified. Previous metallurgical testwork demonstrated significant improvements in gold recovery from preg-robbing material through kerosene or diesel pre-conditioning, followed by addition of fresh or regenerated activated carbon.

NI 43-101 Technical Report for the Asanko Gold Mine, Ashanti Region, Ghana
Effective Date: February 28, 2022
Page 7
1.5.2 Nkran
Past gold recoveries from processing of the Nkran ore (2017 to 2019) averaged 94%. By way of confirmation testing, a suite of 7 diamond drill (DD) (half split of HQ diamond core) intervals were dispatched to ALS, Perth. Lithologies tested included granites (2), sandstones (4) and siltstone (1).
The simple average recovery from these tests was 95.3%. Allowing a 0.3% discount for operational losses, the resultant 95% recovery confirms the past processing results (94%) may be applied for further Nkran material processing.
1.5.3 Abore
A suite of metallurgical testwork was undertaken in 2021 on 7 DD core composites at ALS, Perth. The objective was to confirm that recoveries would align with those of past performance. Resolute mining and processing activities in 2002 returned overall recovery of 95%.
A total of 124 m of core was dispatched, with each interval composite averaging 18 m in length. Six of the composites were classified as granite while the seventh as a blend of granites (27%) and sandstones (73%). Granites constitute an estimated 85% of the Abore fresh ore zone tonnage.
The average recovery from these tests stands at 93.3% which includes a deduction for losses in processing. Taking into account past production recoveries realized by Resolute in the oxide and transitional zones yield overall recoveries of 95%. 94% recovery value is considered reasonable for the overall Abore recovery.
1.5.4 Miradani North
A total of 259 x 1 m core samples from 11 drill holes were delivered to ALS, Perth in June of 2021. Samples were selected based on available HQ drill core and considered mineralized lithologies which are predominantly in the intrusives (granites/tonalites) and the sediments along its peripheries (sandstones, siltstones, and intercalations of the two).
Results averaged 97.2% for oxide, 94.0% for transition, and 93.4% for fresh material. An overall value of 94% recovery value is concluded for the Miradani North material.
1.5.5 Akwasiso
Akwasiso represents a smaller scale version of Nkran, with mineralization hosted in shears on siltstone/sandstone contacts, and around and within the granitic intrusive. Strong alteration zones are associated with higher grades around the sandstone-granite contact. Mineralization is hosted in the sandstone unit with gold occurring within quartz-carbonate veins, similar to the other deposits in the belt.
Akwasiso is currently being fed to the process plant as a minor tonnage contributor along with the predominant Esaase mill feed. A 94% gold recovery value is attributed to this small satellite deposit.
No new testwork was conducted for the Akwasiso deposit.
1.5.6 Dynamite Hill
Dynamite Hill ore had been processed between November 2017 and August 2019. This was complementary to the main mill feed sourced from the Nkran pit and was at no stage processed in isolation.
Overall plant recoveries averaged 94% during this period, regardless of the Dynamite Hill component. The attributable recovery from future mill feed is therefore assumed to be in line with past production at 94%.
No new testwork was conducted for the Dynamite Hill deposit.

NI 43-101 Technical Report for the Asanko Gold Mine, Ashanti Region, Ghana
Effective Date: February 28, 2022
Page 8
1.5.7 Adubiaso
Adubiaso ore had been mined and processed through the Resolute plant from November 1999 to December 2000. The ore was complimentary mill feed to that of Nkran ore. Over the period Adubiaso ore accounted for an average of 34% of the mill feed tonnage.
During this period, gold recoveries were slightly greater than 96%. A slightly conservative gold recovery of 94% has been applied for future performance from this pit.
No new testwork was conducted for the Adubiaso deposit.
1.6 Mineral Resource Estimates
The effective date of the Mineral Resource is February 28, 2022, and comprises eight deposits, which have been combined into a global Mineral Resource table (Table 1-3).
Table 1-3 Summary of the Mineral Resource at a 0.5 g/t Au cut-off and $1,600/oz Au, as of February 28, 2022
Measured Indicated Measured + Indicated Inferred
Tonnes Grade Au
Contained
Tonnes Grade Au
Contained
Tonnes Grade Au
Contained
Tonnes Grade Au
Contained
Deposit (Mt) (g/t) (koz) (Mt) (g/t) (koz) (Mt) (g/t) (koz) (Mt) (g/t) (koz)
Nkran 12.1 2.09 814 12.1 2.09 814 1.3 2.23 96
Esaase 10.9 1.25 437 11.7 1.27 475 22.6 1.26 912 0.6 1.22 25
Akwasiso 1.7 1.31 69 1.7 1.31 69 0.2 1.46 7
Abore 3.2 1.46 150 5.1 1.23 203 8.3 1.32 353 1.1 1.55 55
Adubiaso 1.6 1.80 90 1.6 1.80 90 0.2 1.38 9
Asuadai 1.6 1.29 67 1.6 1.29 67 0.0 1.17 1
Miradani 7.1 1.28 293 7.1 1.28 293 2.6 1.21 102
Dynamite 1.9 1.39 85 1.9 1.39 85 0.3 1.26 14
Stockpiles 9.5 0.72 221 9.5 0.72 221
Total 23.6 1.06 808 42.7 1.53 2,096 66.4 1.36 2,904 6.4 1.49 309
Notes: 1. The Mineral Resource estimates are reported in accordance with the CIM Definition Standards for
Mineral Resources & Mineral Reserves, adopted by CIM Council May 10, 2014. 2. The effective date for the Mineral Resource estimates is February 28, 2022 3. Mineral Resource estimates account for mining depletion up to and including February 28, 2022 4. Reasonable Prospects for eventual economic extraction assume open pit mining with conventional gold
processing and was tested using NPV Scheduler™ pit optimization software at gold price of $1,600/oz. Mining, G&A, processing costs, and process recovery are dependent on deposit and detailed in the respective deposit sections.
5. Applicable rounding has been applied to the stated tonnages, grades, and metal content to reflect the level of accuracy and precision of the estimate
The Mineral Resource estimates for the Esaase and Abore deposits have been prepared by Mario E. Rossi, FAusIMM, SME, IAMG, and Principal Geostatistician of Geosystems International Inc. Mr. Rossi is independent of Galiano Gold in accordance with the application of Section 1.5 of National Instrument 43-101.
The Mineral Resource estimate for Nkran has been prepared by Malcolm Titley, MAIG, MAusIMM who is a Principal Consultant of CSA Global. Mr. Titley is independent of Galiano Gold in accordance with the application of Section 1.5 of National Instrument 43-101.

NI 43-101 Technical Report for the Asanko Gold Mine, Ashanti Region, Ghana
Effective Date: February 28, 2022
Page 9
The Mineral Resource estimates for Akwasiso, Miradani North, and Dynamite Hill have been prepared by Eric Chen, P.Geo. who is Galiano Gold’s former Vice President of Technical Services. The Mineral Resource estimates for Adubiaso, Asuadai and Stockpiles have been prepared by others and reviewed and accepted by Mr. Chen. Mr. Chen is not independent of Galiano Gold in accordance with the application of Section 1.5 of National Instrument 43-101.
1.7 Mineral Reserves
At the time of the effective date of this Report, there remains an uncertainty in the variability of metallurgical recovery of gold from the Esaase deposit. Although all metallurgical testwork to date indicate predictable trends in the recovery of gold from the Esaase deposit, recent mill feed consisting of primarily Esaase material has demonstrated lower recovery. As a result, the Company has concluded that there is insufficient confidence in the understanding of the Esaase metallurgical variability to estimate Mineral Reserves.
Given the uncertainty of metallurgical performance on the Esaase material, Galiano Gold has decided not to state Mineral Reserves for all deposits. Any plant feed in the short term will have significant Esaase material present and overall recovery would therefore be difficult to predict.
Only the Esaase material is believed to be performing adverse to expectations. Recovery of gold from Nkran and all other satellite deposits remain of sufficient confidence, but will be subject to additional metallurgical testwork. Upon conclusion of the planned metallurgical testwork, Galiano Gold will prepare an updated technical report supporting an optimized life of mine plan, based on Mineral Reserves.
1.8 Mineral Processing
The existing AGM process plant located at Obotan is capable of processing approximately 5.8 Mtpa of total mill feed. Esaase material is being processed at present with supplementary feed from Akwasiso.
The key process operating criteria are shown in Table 1-4 and the process block flow diagram in Figure 1-4.
Table 1-4 Process Plant Operating Criteria
Parameter Units Value
Crushing plant running time Hours/annum (hpa) 5,957
Crushing plant feed rate Tonnes per hour (tph) 975
Milling and carbon in leach (CIL) plant running time hpa 7998
Milling and CIL plant feed rate tph 725
Life of Mine (LOM) Au head grade g/t 1.38
LOM gravity gold recovery % 50
Run of Mine (ROM) feed size (F100) mm 800
Semi-autogenous (SAG) mill feed size (F100) mm 270
SAG mill feed size (P80) mm 90
Leach feed size (F80) µm 106
CIL retention time (8 stages) hr 17.4
CIL slurry feed density % w/w 50.2
CIL feed gold grade Au g/t 0.69
LOM average CIL cyanide (NaCN) consumption kg/t 0.45
LOM average lime (CaO) consumption kg/t 0.98
Elution circuit type Split AARL
Elution circuit size t 5
Frequency of elution batches/day 2
Note: AARL – Anglo American Research Laboratories

NI 43-101 Technical Report for the Asanko Gold Mine, Ashanti Region, Ghana
Effective Date: February 28, 2022
Page 10
Figure 1-4 Process Plant Block Flow Diagram
1.9 Infrastructure
The process plant commenced production in early 2016 and was erected close to the Nkran deposit and several satellite orebodies. The plant is currently processing approximately 5.8 Mtpa of material.
Current site infrastructure at Obotan includes:
• An established mining operation with various structures, including offices, stores, workshops and fuel storage facilities
• A process plant with various structures, including offices, stores, workshops and reagent storage / mixing facilities
• An administration block, training facilities, exploration offices, core storage area, clinic and analytical laboratory
• Senior and junior accommodation facilities located to the west of the Nkran pit
• Tailings Storage Facility
• Waste rock dumps at Nkran, Akwasiso, and Dynamite Hill
• Multiple operating boreholes for water supply
• Water treatment plant (construction in progress)
• A 161 kV incoming power line from the Asawinso substation
• Mobile communications facilities. A Vodafone tower is located at the Obotan camp and MTN connectivity is also available.
Current infrastructure at Esaase includes:
• An exploration camp and office
• A geological core shed
• Basic camp requirements such as a clinic, offices, kitchen, accommodation, potable water services, power supply, IT connectivity, radio communications and sewage system

NI 43-101 Technical Report for the Asanko Gold Mine, Ashanti Region, Ghana
Effective Date: February 28, 2022
Page 11
• Mine service facilities, including mobile equipment workshops, wash bays, fuelling stations, and administrative buildings
• Water treatment plant
• Waste rock dumps
• Community services including hospital and community boreholes
• 33 kV overhead power line supplied by the Electricity Company of Ghana (ECG).
1.10 Environmental
Two key regulatory permits were required for the AGM as follows:
• The Mine Operating Permits (MOP) issued by the Minerals Commission in respect of mining leases
• The Environmental Certificate issued by the EPA in respect of mining operations.
Following the required engagements, regulatory site visits, and submission of the relevant documentation, the AGM has successfully obtained and renewed its Mine Operating Permits since commencement of operation in 2016 and is currently operating under the 2021 MOPs issued on January 12th, 2021 in respect of the following leases, all of which form part of the operational complex of the Asanko Gold Mine:
• LVD 7299/2013 located at Abirem
• LVD 21721/2012 located at Adubea
• LVD 21722/20 located at Abore
• LVD 3969A/90 located at Esaase
• LVD 8979A/95 located at Miradani
• LVD 5174/2012 located at Datano
The latest Environmental Certificate for the AGM (gold mining and mineral processing) was issued on July 30th, 2021 and is valid for three years following which it will be due for renewal.
The AGM is currently implementing a preventative approach to environmental management with the primary objective of avoiding negative environmental impacts from the operational activities, whilst maximising positive benefits. Where inevitable, the AGM seeks to minimize such negative impacts through appropriate mitigation measures. This approach fulfils the aspirations of the corporate policy on the environment, environmental performance management systems, and various impact-specific environmental action plans.
The AGM’s reclamation objective is to ensure that the site is left in a condition that is safe and stable where long-term environmental impacts are minimized and any future liability to the community and future land use restrictions are minimized.
The final post-mining land use will be determined in consultation with the EPA, other Ghanaian government institutions, stakeholders, and local communities. Natural soil covers and vegetation will as far as possible be re-established over the disturbed areas.
1.11 Risks and Opportunities
The following risks have been identified:
• Recent plant performance from predominantly Esaase fresh and transitional material has shown lower gold recoveries compared with the 2021 and prior metallurgical testwork as described in Section 13
• Variable nature of stockpiles: ability to accurately predict grades and recoveries in large continuous volumes of material

NI 43-101 Technical Report for the Asanko Gold Mine, Ashanti Region, Ghana
Effective Date: February 28, 2022
Page 12
• Escalation of labour and material costs
• Gold price volatility
The following opportunities have been identified:
• Recovery upside - 2021 metallurgical testwork (A22281) for Esaase material demonstrated that an average recovery of above 90% is achievable. This program yielded slightly higher recoveries compared to previous metallurgical testwork at Esaase. It is indicative of upside potential to the current Esaase recovery estimates
• Metallurgical testwork has demonstrated that pre-treatment of Esaase carbonaceous material yields significant improvement in recovery in bench scale CIL tests. Additional work is required to investigate the applicability of kerosene pre-treatment in the plant environment
• Mass pull of the gravity concentrate can be increased with minor operational adjustments, which could yield better overall plant recovery
• Optimization of carbon management practices to introduce fresh or regenerated carbon to early stages of CIL is expected to partially mitigate effects of preg-robbing as demonstrated in previous metallurgical testwork
• Nkran Deeps (Underground potential) – Mineralization at Nkran remains open down plunge and extensions of the deposit would likely be amenable to underground mining methods. Additional deep drilling has commenced to explore the underground potential at Nkran.
• Miradani Deeps (Underground potential) – A well-defined steeply northeast plunging shoot is evident in longitudinal section through the deposit. This high grade +80 gold gram meters (gm.m) shoot remains open at depth. Further drilling has commenced to explore for extensions and repetitions to this high grade zone.
• Other exploration prospects as described in Section 9 provide additional opportunities to add to the Mineral Resources.
1.12 Conclusions and Recommendations
The AGM is a large scale, multi-deposit gold asset that is managed and operated by Galiano Gold. Since declaring commercial production, the AGM has produced on average 230,000 oz of gold per year, with record production of approximately 251,000 oz in 2019. AGGL holds the largest land package of the highly prospective and underexplored Asankrangwa Gold Belt.
As at the effective date or the report, the AGM comprises of eight deposits which contain 2.9 Moz Au of measured and indicated Mineral Resources, and 0.3 Moz Au of inferred Mineral Resources.
As at the effective date of this Report, Galiano Gold is not in a position to declare Mineral Reserves on the AGM property as a result of current metallurgical uncertainty of the Esaase material. AGM is in the process of investigating options for mitigating the issues, which will subsequently lead to a revised optimized mine plan. At that time, Galiano Gold will prepare an updated technical report supporting the new life of mine plan, based on Mineral Reserves.
This will be facilitated by the fact that the AGM is an established operation with a processing plant, site infrastructure, permits, and organizational capability already in place to readily support a future LOM.
Additional work programs are taking place concurrently to optimize capital and operating costs, ensure best practices in relation to the size and scope of the operations, infill drilling to improve the confidence in the Mineral Resource estimates, and drill mid- and long-term exploration prospects to accelerate addition of new Mineral Resources and provide more flexibility in mine planning.

NI 43-101 Technical Report for the Asanko Gold Mine, Ashanti Region, Ghana
Effective Date: February 28, 2022
Page 13
2 INTRODUCTION
2.1 Terms of Reference
The Company is a gold mining company listed on the TSX and NYSE, with headquarters at 1640-1066 West Hastings Street, Vancouver, British Columbia (https://www.galianogold.com/). The Company's flagship project is the jointly owned Asanko Gold Mine. Galiano Gold and Gold Fields Limited (JSE & NYSE: GFI) jointly each own a 45% interest in Asanko Gold Ghana Limited, with the Government of Ghana retaining a 10% free-carried interest. The AGM concessions are owned 100% by Asanko Gold Ghana Limited.
The AGM is a large scale, multi-deposit gold asset, which is managed and operated by Galiano Gold. The mine was built in 2015, with first gold poured in January 2016, and commercial production commencing in April 2016. The AGM has produced an average of approximately 230,000 ounces of gold per year between 2017 to 2021 and had a record gold production of approximately 251,000 ounces in 2019. AGGL holds the largest land package on the highly prospective and underexplored Asankrangwa Gold Belt.
The AGM is a multi-deposit complex with two main deposits, Nkran and Esaase, six satellite deposits and a carbon-in-leach processing plant with a current operating capacity of approximately 5.8 Mtpa.
This Report is a National Instrument 43-101 Technical Report that summarizes the AGM and its updated Mineral Resources effective February 28, 2022. This Report updates all material information on the AGM, is addressed to Galiano Gold, supports the disclosure of updated Mineral Resource estimates and supports the scientific and technical content in Galiano Gold’s Annual Information Form filing.
As at the effective date of this Report, Galiano Gold is not in a position to declare Mineral Reserves on the AGM property as a result of current metallurgical uncertainty of the Esaase material. AGM is in the process of investigating options for mitigating the issues, which will subsequently lead to a revised optimized mine plan. At that time, Galiano Gold will prepare an updated technical report supporting the new life of mine plan, based on Mineral Reserves.
Any references to “ore” apply to production during time periods when Mineral Reserves were stated.
The Report supersedes the following historical reports:
• NI 43-101 Technical Report for the Asanko Gold Mine, Ghana (Amended and Restated) in June 2020
• Definitive Feasibility Study (DFS 2017) prepared by DRA Projects (Pty) Limited on behalf of Asanko Gold Inc (Asanko Gold)
• Amended NI 43-101 Technical Report in December 2017. Amendments involved changing the Mineral Resource gold price from US$2,000 per ounce (/oz) to US$1,500/oz, and to remove the Inferred Resource from the economic analysis.
• NI 43-101 Technical Report prepared by DRA Projects (Pty) Limited on behalf of Asanko Gold Inc in June 2017

NI 43-101 Technical Report for the Asanko Gold Mine, Ashanti Region, Ghana
Effective Date: February 28, 2022
Page 14
2.2 Qualified Persons
The list of Qualified Persons involved in the compilation of this Report are shown below:
Name: Richard Miller, P.Eng.
Company: Galiano Gold Inc.
Date of Last Site Visit: October 14 to 21, 2021
Sections: 1.1, 1.2, 1.7, 1.9 to 1.12, 2, 3, 4, 5, 15, 16, 18, 19, 20.1 to 20.8, 21, 22, 24, 25.1, 25.2, 25.6, 25.9, 25.10, 26.4, 27
Details of Visit: Mr. Miller visited the property from October 14 to 21, 2021. During this personal inspection of the property, he participated in sustainability, operational and technical services meetings, 2022 budget presentations, and attended technical trips to see existing infrastructure and each of the mining areas.
Name: Greg Collins, MAusIMM(CP)
Company: Galiano Gold Inc. (Former)
Date of Last Site Visit: October 12 to November 4, 2021
Sections: 1.3, 1.4, 6, 7, 8, 9, 10, 11, 12, 23, 25.3, 25.4, 26.3
Details of Visit: Mr. Collins’ initial site visit was from February 10 to May 5, 2021. During this personal inspection of the property, he visited all main exploration sites, drill rigs, logging and sample preparation facilities. He also participated in budget presentations and site based operational meetings. Most recent visit to site was October 12 to November 4, 2021 to conduct similar work.
Name: Eric Chen, P.Geo
Company: Galiano Gold Inc. (Former)
Date of Last Site Visit: September 14 to 30, 2021
Sections: 1.6, 12.1, 14.0, 14.4, 14.5, 14.6, 14.7, 14.8, 25.5, 26.2
Details of Visit: Mr. Chen most recently visited the property on September 14 to 30, 2021.
During this personal inspection of the property, he participated in LOM and
budget reviews, and conducted reviews of the grade control process,
reconciliation, short-term planning, pit mapping, grade control modelling,
sampling procedures, and mine geology data management. He also reviewed
Esaase drill core re-logging, geology and geometallurgical modelling,
metallurgical sampling and recovery modelling for the AGM deposits.
Name: Alan Eslake, FAusIMM
Company: Asanko Gold Ghana Limited
Date of Last Site Visit: Resides on Site
Sections: 1.5, 1.8, 13, 17, 25.7, 25.8, 26.1
Details of Visit: Mr. Eslake has been site based since December 2020. His areas of focus include production enhancement projects and supervision of both internal and external metallurgical testwork programs.

NI 43-101 Technical Report for the Asanko Gold Mine, Ashanti Region, Ghana
Effective Date: February 28, 2022
Page 15
Name: Mario E. Rossi, FAusIMM
Company: GeoSystems International Inc.
Date of Last Site Visit: March 18 to April 1, 2021
Sections: 14.1, 14.2, 25.5
Details of Visit: Mr. Rossi visited the property from March 18 to April 1, 2021. During this personal inspection of the property, he participated in operational and technical services meetings related to the Esaase deposit; visited the Esaase mine operation; viewed mineral exposures in the pit; visited the core storage facility; and had discussions regarding data used in the geologic and resource models, as well as the reconciliation (production) data from the mine. He also visited other Asanko Gold deposits in the area, specifically Abore and Nkran.
Name: Malcolm Titley, MAusIMM, MAIG
Company: CSA Global Ltd.
Date of Last Site Visit: January 16 to 22, 2020
Sections: 14.3, 25.5
Details of Visit: Mr. Titley most recently visited the property from January 16 to 22, 2020. During this personal inspection of the property, he participated in operational and technical services meetings and focused on analysis and site personnel training for end-of-month reconciliation processes and results. Mr. Titley completed technical trips to review sampling and geology mapping process at each of the mining areas.
Name: Benoni Owusu Ansah, P.E., MGhIE, MASCE, MGGS, MGhIGS
Company: Knight Piésold (West Africa)
Date of Last Site Visit: December 16, 2021
Sections: 20.9
Details of Visit: Mr. Ansah conducts regular visits since 2019 for various design, construction, and safety audits, with most recent visit on December 16, 2021. During this personal inspection of the property, he provided engineering and construction QAQC to support the ongoing TSF Stage 6 Expansion. He also observed performance of the active TSF (Stage 5 Basin) relative to design/operation intent.
2.3 References and Information Sources
All references and information sources are listed in Sections 3 and 27.
Mineral tenure, legal and environmental information on the Asanko Gold Mine was prepared by subject matter experts under the supervision of Frederick Attakumah, Executive Vice President and Managing Director for Asanko Gold Ghana Limited. This information provided the basis of the expert report referenced in Section 3.1.
2.4 Units, Currency and Abbreviations
Unless otherwise stated, all currencies are expressed in US dollars (US$), with metric units applied throughout this Report.
‘Section’ and ‘Item’ have been used interchangeably in this Report.
Abbreviations and units are shown in Table 2-1.
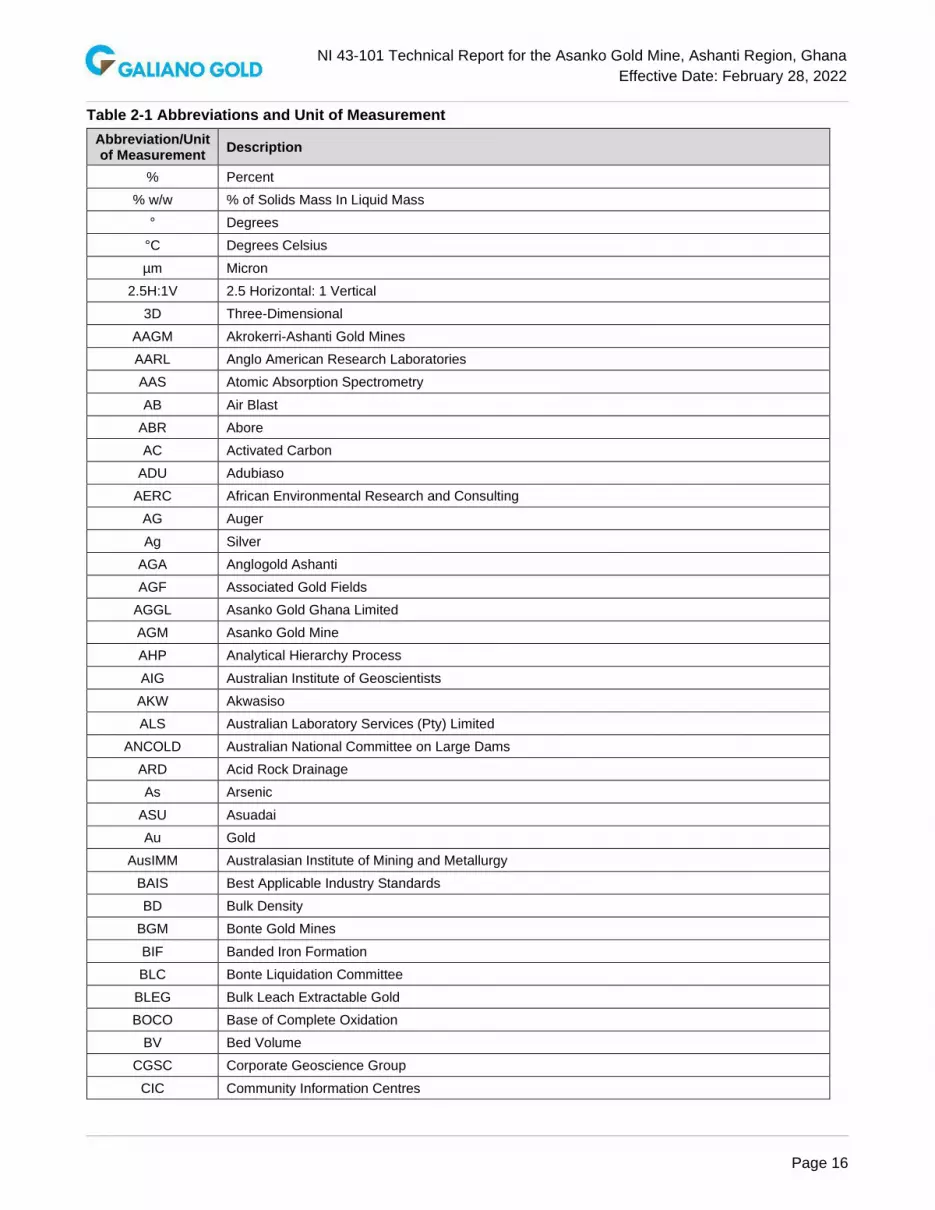
NI 43-101 Technical Report for the Asanko Gold Mine, Ashanti Region, Ghana
Effective Date: February 28, 2022
Page 16
Table 2-1 Abbreviations and Unit of Measurement
Abbreviation/Unit of Measurement
Description
% Percent
% w/w % of Solids Mass In Liquid Mass
° Degrees
°C Degrees Celsius
µm Micron
2.5H:1V 2.5 Horizontal: 1 Vertical
3D Three-Dimensional
AAGM Akrokerri-Ashanti Gold Mines
AARL Anglo American Research Laboratories
AAS Atomic Absorption Spectrometry
AB Air Blast
ABR Abore
AC Activated Carbon
ADU Adubiaso
AERC African Environmental Research and Consulting
AG Auger
Ag Silver
AGA Anglogold Ashanti
AGF Associated Gold Fields
AGGL Asanko Gold Ghana Limited
AGM Asanko Gold Mine
AHP Analytical Hierarchy Process
AIG Australian Institute of Geoscientists
AKW Akwasiso
ALS Australian Laboratory Services (Pty) Limited
ANCOLD Australian National Committee on Large Dams
ARD Acid Rock Drainage
As Arsenic
ASU Asuadai
Au Gold
AusIMM Australasian Institute of Mining and Metallurgy
BAIS Best Applicable Industry Standards
BD Bulk Density
BGM Bonte Gold Mines
BIF Banded Iron Formation
BLC Bonte Liquidation Committee
BLEG Bulk Leach Extractable Gold
BOCO Base of Complete Oxidation
BV Bed Volume
CGSC Corporate Geoscience Group
CIC Community Information Centres

NI 43-101 Technical Report for the Asanko Gold Mine, Ashanti Region, Ghana
Effective Date: February 28, 2022
Page 17
Abbreviation/Unit of Measurement
Description
CIL Carbon In Leach
CIM Canadian Institute of Mining, Metallurgy and Petroleum
cm Centimetre(s)
CMP Composite
CN Cyanide
CNWAD Weak Acid Dissociable Cyanide
COEF Coefficient
COG Cut-off Grade
Corg Organic Carbon
COS Coarse Ore Stockpile
CP Competent Person
CRM Certified Reference Material
CSL Compacted Clay Liner
CSV Comma Separated Value
CTS Central Technical Services
Cu Copper
CV Coefficient of Variation
DC Diamond Core
DD Diamond Drill
DDH Diamond Drill Hole
DFS Definitive Feasibility Report
DH Drill Hole
DI Diorite
DMP Dust Management Plan
EBSZ Eastern Bounding Shear Zone
ECG Electric Company of Ghana
EGL Equivalent Grinding Length
EIA Environmental Impact Assessment
EIS Environmental Impact Study
EM Electromagnetic
EMP Environmental Management Plan
EMS Environmental Management Systems
EOH End of Hole
EOM End of Month
EPA Environmental Protection Agency
EPMA Electron Probe Microanalysis
ESE East-South-East
ESIA Environmental and Social Impact Assessment
ESM Esaase Main
ESS Esaase South
EV Eastern Vein
EXP Exploration

NI 43-101 Technical Report for the Asanko Gold Mine, Ashanti Region, Ghana
Effective Date: February 28, 2022
Page 18
Abbreviation/Unit of Measurement
Description
FEL Front End Loader
FS Feasibility Study
g Gram(s)
gm.m Gold Gram Meters
G&A General and Administration
g/cm3 Grams Per Cubic Centimetre
g/t Grams Per Tonne
Ga Giga-Annum
GC Grade Control
GDP Gross Domestic Product
GFI Gold Fields Limited
GIS Geographic Information System
GIT Goods In Transit
GPS Global Positioning System
GTG Gold Technology Group (At Curtain University)
GV Galamsey Vein
h Hour(s)
ha Hectare(s)
HDPE High Density Polyethylene
HOD Head of Department
HSE Health, Safety, and Environment
ICMC International Cyanide Management Code
IEC International Electrotechnical Commission
IFC International Finance Corporation
IFRS International Financial Reporting Standards
IK Indicator Kriging
ILR Intensive Leach Reactor
IMOK Indicator-Modified Ordinary Kriging
IP Induced Potential
ISO International Standards Organization
IT Information Technology
ITRP Independent Tailings Review Panel
JORC Joint Ore Reserves Committee
JORC Code, 2012 Current Australasian Code for The Reporting of Mineral Resources and Ore Reserves (The JORC Code, 2012 Edition)
JSE Johannesburg Stock Exchange
JV Joint Venture
Keegan Keegan Resources Inc (name changed to Asanko Gold In February 2013)
kg Kilogram
kg Kilogram(s)
kg/hr Kilograms Per Hour
KIR Kiwi International Resources
kL Kilolitre

NI 43-101 Technical Report for the Asanko Gold Mine, Ashanti Region, Ghana
Effective Date: February 28, 2022
Page 19
Abbreviation/Unit of Measurement
Description
Km Kilometre(s)
KNA Kriging Neighbourhood Analysis
Knight Piésold Knight Piésold (Pty) Limited
koz Kilo Ounce/Thousand Ounce (Troy)
KRGL Keegan Resources Ghana Limited
kt Thousand Tonnes
kW Kilowatt
L Litre
LHS Left Hand Side
LOM Life of Mine
LUC Localized Uniform Conditioning
m Metre(s)
m2 Square Metre(s)
m3 Cubic Metre(s)
Ma Million Years
MAMSL Metres Above Mean Sea Level
masl Metres Above Sea Level
MDS Maxwell DatashedTM
MIK Multiple Indicator Kriging
mm Millimetre(s)
MOP Mine Operating Permit
MRE Mineral Resource Estimate
MRev Mineral Reserve Estimate
mRL Reduced Level/Depth or Height of A Place (in m) Above a Reference Datum or Mean Sea Level
Mt Million Tonnes
Mtpa Million Tonnes Per Annum
NGL Natural Ground Level
NI 43-101 Canadian Securities Administrators National Instrument 43-101 Standards of Disclosure for Mineral Projects
NPV Net Present Value
NSR Net Smelter Revenue
NYSE New York Stock Exchange
OC Organic Carbon
OK Ordinary Kriging
OPEX Operating Expenditure
oz Ounce (Troy)
oz Au Ounce of Gold
PAG Potentially Acid Generating
Pb Lead
PCD Pollution Control Dam
PDC Process Design Criteria
PFC Power Correction Factor
PFS Prefeasibility Study

NI 43-101 Technical Report for the Asanko Gold Mine, Ashanti Region, Ghana
Effective Date: February 28, 2022
Page 20
Abbreviation/Unit of Measurement
Description
pH Activity of Hydrogen Ions
PLS Pregnant Leach Solution
PMI PMI Gold Corporation
ppm Parts Per Million
PRI Preg-Robbing Index
Project Mineral Resources, Exploration Activities, and the Existing Mine Facilities at the Asanko Gold Mine
PRV Preg-Robbing Value
PSA Pressure Swing Absorption
PVC Polyvinyl Chloride
Q1, Q2, Q3, Q4 Quarter One, Quarter Two, Quarter Three, Quarter Four
QA Quality Assurance
QA/QC Quality Assurance/Quality Control
QC Quality Control
QEMSCAN Quantitative Evaluation of Materials by Scanning Electron Microscopy
QP(s) Qualified Person(s)
QQ Quantile-Quantile
QSP Quartz Sericite Pyrite
Qtz Quartz
QV Quartz Veins
RAP Resettlement Action Plan
RC Reverse Circulation
RCD Reverse Circulation with Diamond Tail
Resolute Resolute Mining Limited
RF Revenue Factor
RHS Right Hand Side
RO Reverse Osmosis
ROM Run of Mine
RQD Rock Quality Designations
RSA Reclamation Security Agreement
SABC Semi-Autogenous and Ball Milling Circuit
SAG Semi-Autogenous Grinding
Sametro Sametro Company Limited
Sb Antimony
SBM Sub-Celled Block Model
SD Standard Deviation(s)
SE South-East
SEC U.S. Securities and Exchange Commission
SER Slip Energy Recovery
SGS SGS Laboratories
SIB Stay-In-Business Capital
SiO2 Silicon Dioxide (Silica)
SMBS Sodium Meta-Bisulphite

NI 43-101 Technical Report for the Asanko Gold Mine, Ashanti Region, Ghana
Effective Date: February 28, 2022
Page 21
Abbreviation/Unit of Measurement
Description
SMU Selective Mining Unit
SOX Strongly-Oxidized
SQL Structured Query Language
SRF Social Responsibility Forum
SRK SRK (South Africa) (Pty) Ltd
SS Stainless Steel
SSW South-South-West
SW South-West
t Tonne(s)
t/m3 Tonnes Per Cubic Metre
TOFR Top of Fresh Rock
Tpa Tonnes Per Annum
TSF Tailings Storage Facility
TSX Toronto Stock Exchange
TWL Transworld Laboratories
u/f Underflow
UCS Unconfined Compressive Strength
US$ United States Dollars
VRA Volta River Authority
VTEM Versatile Time-Domain Electromagnetic Surveying
WBSZ Western Bounding Shear Zone
WNW West-North-West
WOX Weakly-Oxidized
WRD Waste Rock Dump
WRDF Waste Rock Dump Facility
XRD X-Ray Diffraction
XRF X-Ray Fluorescence
Zn Zinc

NI 43-101 Technical Report for the Asanko Gold Mine, Ashanti Region, Ghana
Effective Date: February 28, 2022
Page 22
3 RELIANCE ON OTHER EXPERTS
For the purpose of this Report, the QPs have relied on other experts for information regarding mineral rights, surface rights, agreements, political, environmental, permits, and tax content as noted below.
3.1 Mineral Tenure, Surface Rights, Agreements, and Environmental Information
The QPs have not reviewed the mineral tenure, nor verified the legal status, ownership of the property or underlying property agreements, and environmental information, including permits. As such, the QPs have fully relied upon, and disclaim responsibility for information derived from Company experts through the following document:
• Galiano Gold Inc. March 10, 2022, Letter report from Todd Romaine, Executive Vice President of Sustainability with attachment of the content for inclusion as Sections 4 and 20 in the NI 43-101 Technical Report for the Asanko Gold Mine, Ghana with an effective date of February 28th, 2021.
This document includes information concerning property licenses and mineral tenure, legal status, permits, royalties, and environmental. This information is used in Sections 4 and 20 of the Report.
This information was prepared by the appropriate subject matter experts employed by Asanko Gold Ghana Limited under the supervision of the Frederick Attakumah, Executive Vice President and Managing Director of Asanko Gold Ghana Limited.
3.2 Political Information
The QPs have not reviewed the political matters relevant to the Technical Report. As such, the QPs have fully relied upon, and disclaim responsibility for information derived from the following document:
• Policy Perception Index from the 2020 Fraser Institute Annual Survey of Mining Companies report
This document is considered a credible source for international mining industry consensus on the overall political risk facing an exploration or mining project in Ghana. This information is used in Section 4.6 of the Report.

NI 43-101 Technical Report for the Asanko Gold Mine, Ashanti Region, Ghana
Effective Date: February 28, 2022
Page 23
4 PROPERTY DESCRIPTION AND LOCATION
Ghana is located in West Africa, sharing boundaries with Togo to the east, Cote d’Ivoire to the west, Burkina Faso to the north and the Gulf of Guinea to the south.
The country is known to hold a significant portion of West Africa’s gold deposits and has long attracted investors looking to trade and invest in its mineral riches. According to recent global statistics on gold production, Ghana is the world’s eighth and Africa’s largest gold producer. In addition to gold, the country has other mineral resources such as manganese, bauxite, and diamonds. At the moment, gold is Ghana’s most important export commodity, followed by cocoa and timber products.
Ghana has an estimated population of 31.9 million (2021 estimate) and covers an area of approximately 238,530 km².
Ghana's population is ethnically diverse. The Akans are the largest, accounting for 44% of the population. Other significant ethnic groups include the Mole-Dagdani (16%), Ewe (13%), Ga-Adamgbe (18%), Gruma (4%), and Grussi (2%). The remainder is made up of a number of smaller ethnic groups. Despite the popularity of these languages, English, a legacy of British colonial rule, has become the official language.
In 1957 Ghana, (formerly known as the Gold Coast), became the first country in sub-Saharan Africa to gain independence. Ghana has been a stable democracy since 1992, which marked the drafting of a new constitution. Ghana is governed under a multi-party democratic system, with elected presidents allowed to hold power for a maximum of two terms of four years each.
Ghana predominantly has a tropical climate and consists mostly of low savannah regions with a central, hilled forest belt. Ghana’s one dominant geographic feature is the Volta River, upon which the Akosombo Hydro-Electric Dam was built in 1964. The damming of the Volta created the enormous Lake Volta, which occupies a sizeable portion of Ghana’s south-eastern territory.
Ghana has a market-based economy with relatively few policy barriers to trade and investment in comparison with other countries in the region. Ghana has substantial natural resources and a much higher per capita output than many other countries in West Africa.
Major international airlines fly into and from the international airport in Ghana’s capital city, Accra.
4.1 Location and Area
The AGM tenements are in the Amansie West and South Districts, of the Ashanti Region of Ghana, approximately 250 km NW of the capital Accra and some 50 km to 80 km south west of the regional capital Kumasi (Figure 4-1 and Figure 4-2).
The AGM areas are accessed from the town of Obuasi, northward towards Kumasi on the Kumasi-Dunkwa highway to the Anwiankwanta junction.
The AGM is accessed by travelling 35 km south to Anwiankwanta Junction, and then west into the AGM property on surfaced and un-surfaced all weather roads.
The concessions cover an area of approximately 476 km2 between latitudes 6º 19’40” N and 6º 28’ 40” N; and longitudes 2º 00’ 55” W and 1º 55’ 00” W.

NI 43-101 Technical Report for the Asanko Gold Mine, Ashanti Region, Ghana
Effective Date: February 28, 2022
Page 24
Figure 4-1 Location of the Asanko Gold Mine in the Ashanti Region of Ghana, West Africa
Source: CJM, 2014

NI 43-101 Technical Report for the Asanko Gold Mine, Ashanti Region, Ghana
Effective Date: February 28, 2022
Page 25
Figure 4-2 Location of the AGM Tenements
Source: Asanko Gold Mine, 2021
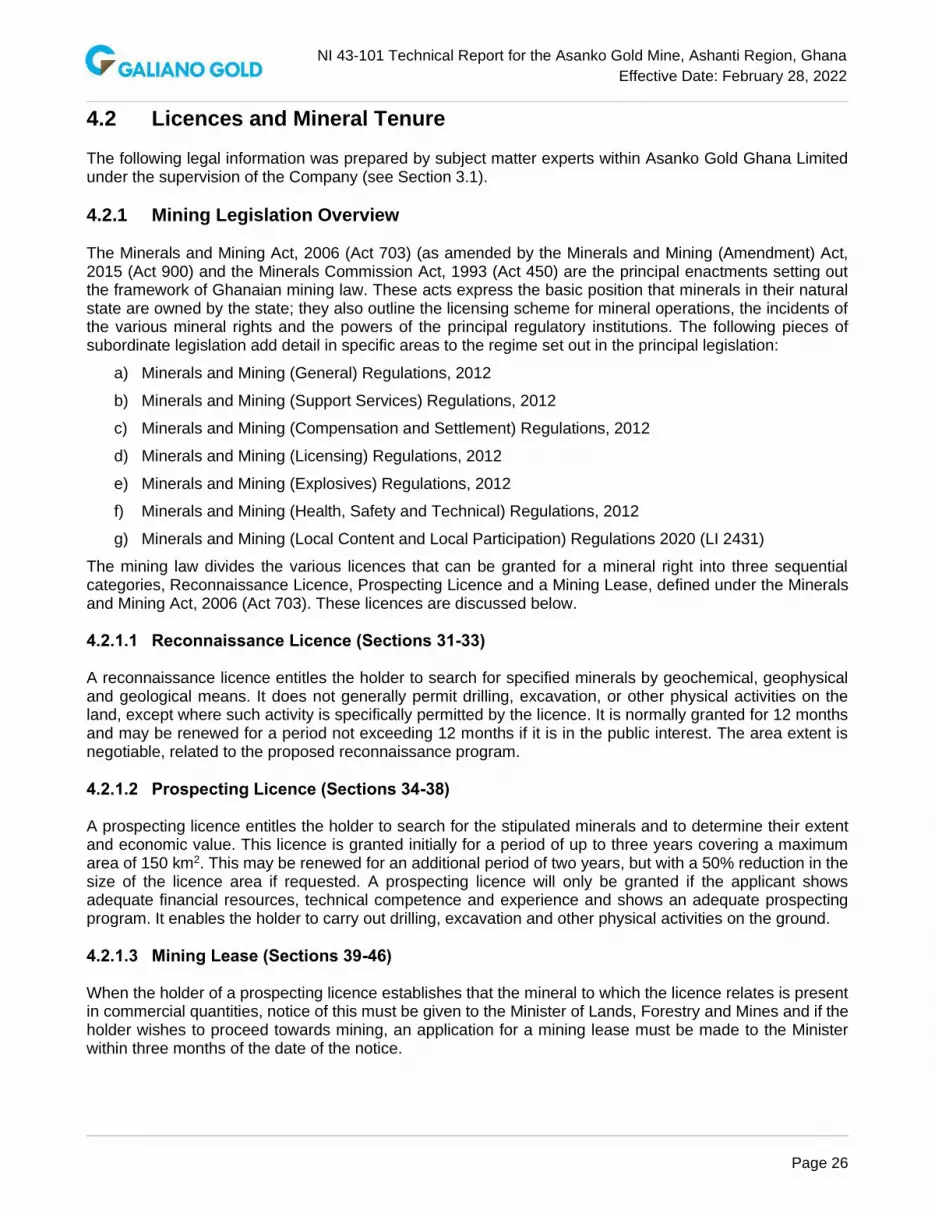
NI 43-101 Technical Report for the Asanko Gold Mine, Ashanti Region, Ghana
Effective Date: February 28, 2022
Page 26
4.2 Licences and Mineral Tenure
The following legal information was prepared by subject matter experts within Asanko Gold Ghana Limited under the supervision of the Company (see Section 3.1).
4.2.1 Mining Legislation Overview
The Minerals and Mining Act, 2006 (Act 703) (as amended by the Minerals and Mining (Amendment) Act, 2015 (Act 900) and the Minerals Commission Act, 1993 (Act 450) are the principal enactments setting out the framework of Ghanaian mining law. These acts express the basic position that minerals in their natural state are owned by the state; they also outline the licensing scheme for mineral operations, the incidents of the various mineral rights and the powers of the principal regulatory institutions. The following pieces of subordinate legislation add detail in specific areas to the regime set out in the principal legislation:
a) Minerals and Mining (General) Regulations, 2012
b) Minerals and Mining (Support Services) Regulations, 2012
c) Minerals and Mining (Compensation and Settlement) Regulations, 2012
d) Minerals and Mining (Licensing) Regulations, 2012
e) Minerals and Mining (Explosives) Regulations, 2012
f) Minerals and Mining (Health, Safety and Technical) Regulations, 2012
g) Minerals and Mining (Local Content and Local Participation) Regulations 2020 (LI 2431)
The mining law divides the various licences that can be granted for a mineral right into three sequential categories, Reconnaissance Licence, Prospecting Licence and a Mining Lease, defined under the Minerals and Mining Act, 2006 (Act 703). These licences are discussed below.
4.2.1.1 Reconnaissance Licence (Sections 31-33)
A reconnaissance licence entitles the holder to search for specified minerals by geochemical, geophysical and geological means. It does not generally permit drilling, excavation, or other physical activities on the land, except where such activity is specifically permitted by the licence. It is normally granted for 12 months and may be renewed for a period not exceeding 12 months if it is in the public interest. The area extent is negotiable, related to the proposed reconnaissance program.
4.2.1.2 Prospecting Licence (Sections 34-38)
A prospecting licence entitles the holder to search for the stipulated minerals and to determine their extent and economic value. This licence is granted initially for a period of up to three years covering a maximum area of 150 km2. This may be renewed for an additional period of two years, but with a 50% reduction in the size of the licence area if requested. A prospecting licence will only be granted if the applicant shows adequate financial resources, technical competence and experience and shows an adequate prospecting program. It enables the holder to carry out drilling, excavation and other physical activities on the ground.
4.2.1.3 Mining Lease (Sections 39-46)
When the holder of a prospecting licence establishes that the mineral to which the licence relates is present in commercial quantities, notice of this must be given to the Minister of Lands, Forestry and Mines and if the holder wishes to proceed towards mining, an application for a mining lease must be made to the Minister within three months of the date of the notice.

NI 43-101 Technical Report for the Asanko Gold Mine, Ashanti Region, Ghana
Effective Date: February 28, 2022
Page 27
4.2.2 Issuer’s Title to the AGM Concessions
The AGM concessions are owned 100% by Asanko Gold Ghana Limited. The legal status of the mineral properties in Ghana in which Asanko Gold has an interest have been verified by Asanko Gold and by an independent legal entity, Kimathi Partners Corporate Attorneys based in Accra. As at December 31, 2021, all mineral tenements were in good standing with the Government of Ghana. Furthermore, it has been confirmed that the properties are lawfully accessible for evaluation and also mineral production.
AGGL holds 7 mining leases, 9 prospecting licences and 1 reconnaissance licence which collectively make up the AGM property and span over 40 km length of the Asankrangwa Belt. The AGM is made up of a series of contiguous concessions in the Obotan and Esaase area (Figure 4-2). These concessions cover a total area of 476 km2.
The areas of the respective mining leases and prospecting licences with respective company owners are tabulated in (Table 4-1).
Table 4-1 Asanko Gold Mine Mining Lease and Prospecting Concession Areas
Name Mincom Ref# Licence
area (km2) Type Status/ Expiry date Ownership
Abore PL 6/352 28.47 Mining Lease Valid-ML 4/2030 Asanko – 100
% Abirem PL 6/303 47.13 Mining Lease Valid-ML 3/2026
Adubea PL 6/310 13.38 Mining Lease Valid-ML 4/2030
Miradani PL 6/122 14.98 Mining Lease Valid-ML 5/2025
Asanko – 100 %
Esaase PL 6/8 Vol 8 27.03 Mining Lease Application, All relevant documents and payment made for renewal of ML. Awaiting Ministerial Approval.
Jeni River RL 6/21 27.37 Mining Lease Application, All relevant documents and payment made for renewal of ML. Awaiting Ministerial Approval.
Kaniago PL 6/307 25.5 Prospecting Application, All relevant documents and payment made for renewal of PL. Awaiting Ministerial Approval
Asanko – 100 %
New Obuase PL 3/84 33.67 Prospecting Application, All relevant documents and payment made for renewal of PL. Awaiting Ministerial Approval
Datano PL 6/32 53.78 Mining Lease Valid-ML 5/2030
Mepom Pl 6/245 2.37 Prospecting Note 1 Asanko – 100
% Dawohodo PL 6/43 10.00 Prospecting Valid-PL 12/2023
Asanko – 100 %
Sky Gold RL 6/86 91.50 Reconnaissance Application, All relevant documents and payment made for renewal of RL. Awaiting Ministerial Approval. Note 2
Kaniago PL 6/289 25.27 Prospecting Application, All relevant documents and payment made for renewal of PL. Awaiting Ministerial Approval
Asanko – 100 %
Besease PL.6/120 15.55 Prospecting Valid-PL 12/2023
Mmooho PL 6/352 5.70 Prospecting Valid-PL 12/2023
Gyagyatreso PL6/32 10.83 Prospecting Application, All relevant documents and payment made for renewal of PL. Awaiting Ministerial Approval
Amoaman PL6/380 43.47 Prospecting Valid-PL 11/2022
Note 1: Mepom License renewal pending since 2012. In process of being merged with Esaase ML Note 2: License conversion from RL to PL pending since 2012.
NI 43-101 Technical Report for the Asanko Gold Mine, Ashanti Region, Ghana
Effective Date: February 28, 2022
Page 28
In the case where an application is awaiting ministerial approval, the renewed application has been submitted and recognized by the Ghana Minerals Commission (Mincom) and is awaiting final Ministerial signature. Mining Leases are renewed for an extended period based on available reported resources whereas Prospecting Licenses are renewed for an additional three (3) years from date of Ministerial Grant. The final step which may reverse this accepted status is the lease ratification by Parliament thereby preventing the Ministerial approval. This is, however, typically a formality.
A prospecting renewal application (3 years) and a renewal for a Mining Lease is submitted to Mincom and is always accompanied by an updated technical report, relevant processing fees, consideration fees, annual mineral right fees and Stool Land fees. The renewal application is subsequently submitted by Mincom to the Ministry of Lands and Natural Resources for secondary approvals and is completed by Ministerial Approval thereafter.
The lease/concession boundaries have been surveyed by global positioning system (GPS) and are correlated with the latitude and longitude via degree co-ordinates as per the Ghanaian Mining Cadastre (July 2016).
AGGL is the merged entity of Keegan Resources Ghana Limited (KRGL) and Adansi Gold. When AGGL acquired the Esaase concessions, there was a mining lease in place from the historical alluvial mining operations. The Minister of Lands and Natural Resources granted the other Mining Leases for the Obotan Project to PMI Gold Inc (PMI) in November 2012, prior to the acquisition of PMI by AGGL in early 2014.
In November 2012, AGGL formally received mining leases on the Abore-Abirem and Adubea prospecting licences.
The formal grant of these three Mining Leases, renewable under the terms of the Minerals and Mining Act, 2006 (Act 703), followed the favourable recommendation by the Minerals Commission of Ghana in September 2012. The Mining Leases cover a total area of 167 km2, encompassing the two main deposits, Nkran and Esaase and the smaller satellite deposits, Abore, Adubiaso, Dynamite Hill, Akwasiso, Asuadai, Adubiaso Extension and Nkran Extension.
In 2017, AGGL acquired the Miradani Mining Lease area situated in the southern camp adjacent to the Datano concession area.
4.3 Agreements, Royalties and Encumbrances
All concessions carry a 10% free carried interest in favour of the Ghanaian government and as a result, the Ghanaian government holds a 10% interest in Asanko Gold Ghana. The mining leases are also subject to a 5% Net Smelter Return royalty payable to the Government of Ghana. In addition, the Adubea mining concession is subject to an additional 0.5% NSR royalty to the original concession owner. The Esaase mining lease is also subject to an additional 0.5% NSR royalty to the Bonte Liquidation Committee. The Akwasiso pit on the Abirem mining lease is also subject to an additional 2% NSR royalty payable to the original concession owner.
4.4 Environmental Obligations
Environmental liabilities are discussed in Section 20.
4.5 Permits
Permits are discussed in Section 20.

NI 43-101 Technical Report for the Asanko Gold Mine, Ashanti Region, Ghana
Effective Date: February 28, 2022
Page 29
4.6 Fraser Institute Survey
The QPs have used the Policy Perception Index from the 2020 Fraser Institute Annual Survey of Mining Companies report (the Fraser Institute Survey) as a credible source for the international mining industry consensus on the overall political risk facing an exploration or mining project in Ghana. The QP has relied on the Fraser Institute survey because it is globally regarded as an independent report-card style assessment to governments on how attractive their policies are from the point of view of an exploration manager of a mining company. The survey forms a proxy for the assessment by senior management in the mining industry of political risk in Ghana. Overall, Ghana ranked as Africa’s fourth most attractive country to the mining industry in 2020 and was 46th globally (out of the 77 jurisdictions in the 2020 Policy Perception survey).
The AGM is a developed mine in an established mining camp with the Ghanaian government as a free carried joint venture partner. The QPs are not aware of any significant factors and risks that may affect access, title, or the right or ability to perform the work on the property, other than what is described in this Report.

NI 43-101 Technical Report for the Asanko Gold Mine, Ashanti Region, Ghana
Effective Date: February 28, 2022
Page 30
5 ACCESIBILITY, CLIMATE, LOCAL RESOURCES, INFRASTRUCTURE AND PHYSIOGRAPHY
5.1 Topography, Elevation and Vegetation
The AGM lies in the Amansie West District of the western region of Ghana. The AGM is located in hilly terrain dissected by broad, flat drainages that typically form swamps in the wet season between May and late October (Figure 5-1). Hill tops are generally at very similar elevations, reflecting the elevation of a previous erosional peneplane that is now extensively eroded. Maximum elevations are approximately 80 m above sea level (masl), but the areas impacted by the Project generally lie at less than 50 m elevation. Despite the subdued topography, hill slopes are typically steep. The concession areas are covered by a series of low, gently undulating hills, which rarely exceed 680 masl in elevation. Ecologically the AGM is situated in the wet evergreen forest zone.
In general, the concession areas have been largely transformed, having experienced extensive degradation in recent years. The main land uses include secondary forest, subsistence and cash crop farming, and artisanal gold mining.
Figure 5-1 Example of Topography and Vegetation Around Esaase Pit Location
The soils of the area fall within the Bekwai and Nzema Oda classification. The soils of the Bekwai series are found on the summits and some upper slope sites of the hills of the area. They are generally deep to very deep (over 20 cm), humus, well drained, red in colour, loam to clay loam, gravelly and concretionary, with well-developed sub angular blocky structure and clay cutans within sub-soils. The soils are acidic throughout the profile.
The soils of the Nzema Oda series are heavy textured soils developed on alluvial deposits along streams of the area. The soils are poorly drained and are subjected to flooding during the wet seasons and are greyish in colour with prominent yellowish orange mottles. The soils are deep, acidic with clay loam to clay textures, but are structureless in the sub-soils.

NI 43-101 Technical Report for the Asanko Gold Mine, Ashanti Region, Ghana
Effective Date: February 28, 2022
Page 31
5.2 Access
The Asanko Gold Mine is accessed by road from the city of Kumasi, south towards Obuasi on the Kumasi–Dunkwa highway to the Anwiankwanta junction then approximately 20 km west from this junction through Poano and Antoakurom on a tarred road onto a laterite road for approximately 30 km through Manso Akropon, Manso Atwere, Manso Nkwanta, Suntreso, Gyadukurom to Abore. At Abore, the road branches northwest to Akuntam, then northeast to Nkasu. At Gyadukurum, the road branches off south to Asuadai, Dynamite Hill, and Adubea. At Adubea, the road continues south to Kumpese and westward to Abirem, to Besease, then north to Mmooho. At Kumpese, the road branches south to Akwasiso, southwest to Koninase and to Nkran and Adubiaso. Areas of interest within the concession are reached via a combination of secondary roads, four-wheel drive tracks, logging roads, and farming/ hunting footpaths.
The Esaase property is accessed by road from the city of Kumasi by taking the tarred Sunyani–Kumasi road west for 10 km to the Bibiani Junction at Abuakwa and then southwest for 10 km along the tarred Bibiani–Kumasi highway to the village of Wiaso. A secondary tarred road is taken 8 km south from Wiaso to the village of Amankyea. Secondary gravel roads can be taken for a further 11 km via the villages of Ahewerwa and Tetrem.
The Esaase deposit itself is accessed by a 28 km haul road constructed by Asanko Gold.
5.3 Proximity to Population Centre and Transport
There are several local villages near the AGM site. The closest to the plant site is the Manso Nkran village, while the villages of Tetrem and Esaase are in close proximity to the Esaase deposit. Current site infrastructure and transport means are discussed in Section 5.5.
5.4 Climate and Length of Operating Season
The following is noted:
• Rainfall. The annual rainfall is in the range of 1,500 mm to 2,000 mm. The major rainy season takes place from April to July followed by a minor rainy season from September to October. The AGM has operated without cessation or delay throughout both rainy seasons
• Temperature. Maximum temperatures occur between January and April ranging between 26°C and 28°C and minimum temperatures between May and December when values range between 24°C to 25°C
• Wind speed and direction. The mean monthly wind speed is 0.59 knots with a mean monthly range from 0.4 to 1.3 knots. Mean monthly wind speeds rarely exceed 1.3 knots (0.67 m/s). August is generally the windiest month and wind direction is predominantly SE during the year.
5.5 Infrastructure
Current site infrastructure with respect to the Obotan concessions consists of an office complex, metallurgical facility, tailings storage facility, senior and junior accommodation and mess facilities, workshops, power distribution facility, a core storage facility, potable and operational water supplies, a waste rock dump facility, an upgraded dry weather air strip and a haul road from Esaase pit to Nkran pit. In addition, the following is noted for the Obotan concessions:
• Local facilities of importance to exploration and mining include towns, villages, roads, trails, power lines, rivers and rail roads
• The principal towns within the area are Abore and Adubea
• Akwasiso and Nkran are the principal towns within the mining area
• Surrounding villages are connected to the national electrical grid

NI 43-101 Technical Report for the Asanko Gold Mine, Ashanti Region, Ghana
Effective Date: February 28, 2022
Page 32
• There is grid power to the Nkran area, the processing plant and town site
• Most areas are adequately serviced by several cellular telephone suppliers
• The principal towns have potable water and health posts which cover local needs
• Ghana has a good base of skilled mining and exploration personnel.
The following resources are available for the Esaase concession area:
• The Esaase camp and surrounding villages are connected to the national electrical grid
• Esaase is in an area well serviced by the Ghana national power grid with at least two alternate points of supply within a 50 km radius of the open pit mining site
• Mobile phone communication is accessible in most parts of the concession
• Hospitals and most government offices are available in Kumasi
• Food and general supplies are also purchased in Kumasi.
Ghana has a mature mining industry that has resulted in the local availability of both skilled and
unskilled personnel.
5.6 Surface Rights
The laws regarding surface rights is captured in the Mineral and Mining Act 206, Act 703 sub-section 72. This section gives rights to the owners of the land (i.e. Chiefs, family, individuals, etc.) to be compensated by Mineral Rights holders (i.e. mining companies).
Sub-section: 72
(1) The holder of a mineral right shall exercise the rights under this Act subject to limitations that relate to surface rights that apply under an enactment and further limitations reasonably determined by the Minister.
(2) In the case of a dispute between a holder of a mining lease and the Minister concerning the limitations determined by the Minister under this subsection, the dispute shall be referred for resolution under section 27.
(3) The lawful occupier of land within an area subject to a mineral right shall retain the right to graze livestock upon or to cultivate the surface of the land if the grazing or cultivation does not interfere with the mineral operations in the area.
(4) In the case of a mining area, the owner or lawful occupier of the land within the mining area shall not erect a building or a structure without the consent of the holder of the mining lease, or if the consent is unreasonably withheld, without the consent of the Minister.
(5) The owner of a mining lease shall, in the presence of the owner or lawful occupier or accredited representative of the owner or lawful occupier of land, the subject of a mining lease and in the presence of an officer of the Government agency responsible for land valuation carry out a survey of the crops and produce a crop identification map for the compensation in the event that mining activities are extended to the areas.
(6) An owner or lawful occupier of land shall not upgrade to a higher value crop without the written consent of the holder of the mining lease, or if the consent is unreasonably withheld, without the consent of the Minister.
In the case of AGM, all concessions belong to the Ashanti Kingdom who has in turn given same right to the relevant Divisional Chiefs and in some cases specific individuals to exercise that right in terms of compensation. Compensation with regards to surface right comes in the form of:
• Crop compensation

NI 43-101 Technical Report for the Asanko Gold Mine, Ashanti Region, Ghana
Effective Date: February 28, 2022
Page 33
• Deprivation for land use compensation
• Compensation of immovable properties (shrines, ponds, etc.)
• Royalty payment through the Stool lands.
There are sufficient surface rights available now, or that can be obtained, if necessary, for any future mining operations. There are adequate sources of power, water, mining personnel, tailings storage areas, waste rock disposal areas, and sites for processing facilities.

NI 43-101 Technical Report for the Asanko Gold Mine, Ashanti Region, Ghana
Effective Date: February 28, 2022
Page 34
6 HISTORY
6.1 Prior Ownership and Ownership Changes
The deposits within the current AGM property have largely undergone a number of ownership changes since their discovery.
In 2007 Keegan Resources Inc acquired 100% of the Esaase Mining Lease from Sametro Company Limited, a private Ghana company. This lease includes the Esaase mineral deposit. In 2013 Keegan Resources Inc change the name of the company to Asanko Gold Inc. In 2014, Asanko Gold Inc acquired the Abirem, Adubea, and Abore Mining Leases from PMI Gold Inc. These leases include the Nkran, Akwasiso, Asuadai, Adubiaso, Abore and Dynamite Hill mineral deposits. In 2017 Asanko Gold Inc. acquired the Miradani Mining Lease which includes the Miradani mineral deposit. In 2020 Asanko Gold Inc changed the name of the company to Galiano Gold Inc. All these properties, collectively known as the Asanko Gold Mine, form the basis of a joint venture established between Galiano Gold and Gold Fields Limited in 2018. Galiano Gold Inc is the JV operator.
A summary of this is provided in Table 6-1.
Table 6-1 Summary History of Ownership
Year Ownership
Nkran (Historically Nkran Hill, or Obotan Mine)
Late 1980s Obotan Minerals awarded prospecting concession over 106 km² (current Abirem Mining Lease, Adubea Mining Lease and Abore Mining Lease).
1990 Kiwi Resources Limited (KIR) took over Obotan Minerals interest. Concession explored by Australian juniors Associated Gold Fields NL (AGF) and KIR.
1996 Resolute Mining Limited (Resolute) bought combined interests of AGF and KIR (Nkran, Akwasiso, Asuadai, Adubiaso and Abore).
1999 Resolute changed name to Resolute Amansie Limited.
2001 Obotan Mine closed.
2006 Resolute relinquished ground to Government of Ghana who granted several small-scale mining leases on the deposits. PMI Gold Inc (PMI) acquired the Abirem, Abore and Adubea prospecting licenses.
2014 Asanko Gold acquired mining leases Abirem, Adubea and Abore from PMI through purchase agreement. Obotan Mine renamed to Nkran Mine.
Esaase
1900-1939 Artisanal mining.
1990 Adjacent Jeni River mining lease granted to Jeni River Development Company Limited.
1990 Esaase (previously Bonte) mining lease granted to Akrokerri-Ashanti Gold Mines (AAGM) and later transferred to local subsidiary Bonte Gold Mines Limited (BGM).
2002 Ghanaian incorporated private company Dawohodo Manufacturing and Marketing Limited granted adjacent prospecting license to the south (Dawohodo-Esaase prospecting license).
2003 Jeni River Development Company Limited and BGM declared bankrupt. Esaase mining lease acquired from the Bonte Liquidation Committee by private Ghanaian company Sametro Company Limited (Sametro).
2006 Keegan Resources Inc (Keegan) entered into an option agreement with Sametro to earn 100% of the Esaase mining lease.
2007 Esaase mining lease transferred to Keegan.
2013 Keegan changed name to Asanko Gold.
Akwasiso see Nkran – Abirem lease area
Abore
Pre-1990 Small scale mining license held by Oda River Gold.
1990 Mutual Resources acquired Oda River Gold and formed JV with Leo Shield Exploration.
1990 Leo Shield Exploration (which became Shield Resources) bought out Mutual Resources.
2001 Agreement entered with Resolute; and Resolute took ownership of project.
2006 Resolute relinquished lease to Government of Ghana. PMI acquired Abore license.

NI 43-101 Technical Report for the Asanko Gold Mine, Ashanti Region, Ghana
Effective Date: February 28, 2022
Page 35
In March 2020, Asanko Gold Inc. changed its name to Galiano Gold Inc.
6.2 Historical Exploration and Development
Gold rushes in the area occurred in 1898 to 1901 and again in the 1930s. Most of the Asanko Gold concessions, however, have no record of the work undertaken on the properties for this period. Interest in the area was renewed in the early 1990s mainly because of the successful exploration work carried out on the adjacent concession where the Nkran deposit is located.
Table 6-2 below summarizes the extent of the exploration activities and developments per area relevant to the current Mineral Resource.
Table 6-2 Summary of Historical Exploration and Development per Deposit
Year Ownership
2015 Asanko Gold acquired ground from PMI.
Asuadai – Adubea lease area
1996 Resolute purchased combined interests of AGF and KIR. Released to six small scale operators at the time of mine closure.
2006 Resolute relinquished ground to Government of Ghana. Adubea license granted to Chief Joseph Biney family, and later acquired by PMI.
2015 Asanko Gold acquired ground from PMI.
Adubiaso see Nkran – Abirem lease area
Miradani North – Miradani lease area
1994 Miradani Mining Lease granted to Ashanti Goldfields, now Anglogold Ashanti (AGA)
2017 Asanko acquired the Miradani Lease from AGA
Dynamite Hill – Adubea lease area
2013 Discovered by PMI beneath laterite cap
2017 Commencement of mining delayed until Q4 2017 due to regulatory approvals
2019 Production ceased in Q4 2019
Period Workings Operator
Nkran
Historical Alluvial and eluvial gold artisanal gold mining which extend for ±610 m in a northeast-southwest direction. European settlers worked the deposits – adits and drives extend 80 m into the hill on site of old native workings.
1980s Limited exploration work undertaken with minor attention paid to the alluvial gold potential.
Previous Owner
1990-1995 Exploration focused on known prospects at Nkran deposit (formerly known as Jabokassie).
Regional soil geochemical survey carried out that identified numerous anomalies around Nkran.
Early reverse circulation drilling phase (details not available) yielded encouraging results over wide zone of bedrock mineralization, extending along strike for 600 m. The broad, low-lying Nkran had relief of only about 40 m with oxidation extending to depths of 40 m.
Previous Owner
1995 Additional DDH, RC, RC and RCD drilling was completed. Mineral Resources (Measured, Indicated and Inferred classes) were estimated and reported. A feasibility
study was completed, and mining lease was granted.
Previous Owner
1996 Combined interests of KIR and AGF bought out by Resolute who immediately reviewed and expanded project scope. Further RC and DDH drilling conducted to increase Mineral Resources to a depth of 150 m at Nkran and to further assess the
known mineralization at nearby Adubiaso.
Previous Owner
July 1996 Revised mine development plan completed with decision to proceed into production at a rate of 1.4 Mtpa.
Previous Owner
Early 1997 Initial mining commenced, and further exploration drilling continued. Previous Owner

NI 43-101 Technical Report for the Asanko Gold Mine, Ashanti Region, Ghana
Effective Date: February 28, 2022
Page 36
Period Workings Operator
May 1997 First gold poured. Previous Owner
1998-2000 Additional DDH, RC, RCD holes drilled. Previous Owner
2001 Nkran Mine closed due to low gold price having produced 590,743 oz Au at an average grade of 2.35 g/t Au.
Previous Owner
2002 Intensive exploration undertaken. Previous Owner
2011 PMI carried out a 5 km² Induced Potential (IP) ground geophysical survey. PMI also completed a VTEM electromagnetic (EM) and magnetic survey centred over the
Nkran pit.
Previous Owner
2015-2016 Nkran Mine dewatered and re-opened by Asanko Gold as a deeper opencast operation.
Galiano
2016-2020 Open pit production. Plant refurbishment and expansion to circa 5 Mtpa Galiano
2020 Additional drilling (DDH, RC and RCD) completed to infill and expand on resource at depth. Refer to Table 10-1 for total quantities.
Galiano
Esaase
Historical Artisanal mining in Bonte Area associated with the Ashanti Kingdom.
1900-1939 Workings by European settlers evidenced by old adits - no documented records remain.
Previous Owner
1966-1967 Drilling conducted on the Bonte River valley alluvial sediments to determine alluvial gold potential – no information available.
Previous Owner
1990 Bonte mining lease granted to Akrokerri-Ashanti Gold Mines (AAGM) and later transferred to BGM.
Previous Owner
1990-2002 Recovered approximately 200,000 oz of alluvial gold on Esaase concession +300,000 oz downstream on Jeni River concession.
Previous Owner
2006-2013 Keegan consolidates further concessions. Intensive exploration – geophysics (airborne VTEM - 2,266 line-km), soil geochemistry (>4,000 samples) and exploration drilling. Drilling included DDH, DTH, RC, and RCD. Refer to Table 10-1 for total
quantities.
Galiano
2013-2018 Asanko Gold continued extensive exploration drilling in order to update the Mineral Resources. Refer to Table 10-1 for total quantities.
Galiano
Dec 2018-current
Open pit production. Galiano
2020-2021 Infill drilling conducted. Refer to Table 10-1 for total quantities. Galiano
Nkran Extension Project Area
Historical No known historical exploration or mining activity.
1997-current Exploration on north-eastern extension of Nkran structure delineated a number of mineralized zones - Akwasiso and Nkran Extension that have all been drilled (2016) to Indicated Mineral Resource classification.
Previous Owner/Galiano
Akwasiso
1996-2000 Exploration programs including RC and DDH holes. Refer to Table 10-1 for total quantities.
Previous Owner
2001 Artisanal miners mined oxides. DDH holes drilled. Refer to Table 10-1 for total quantities.
Previous Owner
2014-2018 Exploration continues with purpose of refining the Mineral Resource. Drilling undertaken including RC, DDH, and RCD holes. Refer to Table 10-1 for total quantities.
Galiano
2017 Open pit operations commence. Galiano
Dec 2018 Open pit operations suspended in Q1 2019. Galiano
2019 Exploration drilling including RC, DD and RCD holes. Refer to Table 10-1 for total quantities.
Galiano
Jan 2020 Mining resumed Galiano
Abore
Historical Alluvial and eluvial artisanal gold mining.
1990-1998 Mutual Resources and Leo Shield Exploration initiated regional exploration program (73 km²) including soil geochemistry and trenching. Soil geochemistry revealed a strong north-north-east trending gold anomaly over the area of artisanal mining
Previous Owner

NI 43-101 Technical Report for the Asanko Gold Mine, Ashanti Region, Ghana
Effective Date: February 28, 2022
Page 37
Period Workings Operator
(bedrock areas); the anomaly is several hundred metres wide and traceable along strike for about 3 km, well beyond the area of old workings. Extensive trenching confirmed continuous bedrock mineralization over 1,000 m with widths in the range 50 m to 100 m. The mineralization consists of a broad quartz stock work system hosted mainly by a north-north-east trending intermediate granitoid intrusion. Early artisanal pitting was focused mainly on narrow quartz veins associated with the stock work
system
Extensive drilling in the area (mainly RC, some DDH) outlined sizeable resources (now known as the Abore, Adubiaso, Asuadai and Akwasiso prospects). Full details of this work are not available. Prospecting in area north of Abore revealed artisanal mining in alluvial areas, as well as many old pits in the saprolite along a low hill immediately adjacent to the alluvial workings.
2007-2012 Exploration programs which included RC and DDH drilling completed. Resulted in a Mineral resource estimate. Open pit mining, and an agreement was reached whereby ore was trucked from Abore north to Nkran plant for treatment. Refer to Table 10-1 for total drilling quantities.
Previous Owner
2012-current No further exploration undertaken. Mineral Resource estimate restated. Galiano
2019 - 2021 RC and RCD drilling, to extend the known resource at depth and along strike to the north. Refer to Table 10-1 for total quantities.
Galiano
Asuadai
Historical No known formal historical mining or exploration on this area. Minor pitting in the region by artisanal miners down to 5 m to 10 m through the oxide material to expose stock work vein sets.
1996 Mining undertaken by artisanal workers (to present day). Previous Owner
2000-2012 Exploration programs which included RC and DDH drilling completed. Refer to Table 10-1 for total quantities.
Previous Owner
2014 - current
No further exploration undertaken. Mineral Resource estimate restated. Galiano
Adubiaso
Historical No known formal historical mining or exploration on this area.
1996-2000 DD, RCD, and RC drilling completed. Refer to Table 10-1 for total quantities. Previous Owner
1999-2000 Open pit mining. Oxide ore processed at Nkran plant. Previous Owner
2007-2013 Exploration programs including RC and DDH drilling completed. Refer to Table 10-1 for total quantities.
Previous Owner
2016 Exploration continues with RC drilling to refine ore body definition. Refer to Table 10-1 for total quantities.
Galiano
2017 - current
No further exploration undertaken. Mineral Resource estimate restated. Galiano
2020 RC and RCD drilling complete. Refer to Table 10-1 for total quantities. Galiano
Miradani North
1900-1914 Ashanti Rivers and Concession Ltd conducted ‘extensive exploration’ including adits Previous Owner
1995 Miradani Mining License acquired by Ashanti Goldfields, now Anglogold Ashanti (AGA)
Previous Owner
1995-1996 Airborne geophysics, soil sampling and trenching completed by AGA Previous Owner
2017 License acquired from AGA Galiano
2017 - 2021 RC, DD, and RCD drilling complete. Refer to Table 10-1 for total quantities. Galiano
Dynamite Hill
2013 Discovered through trenching and drilling in 2013 Galiano
2013-2016 DD, RC, and RCD drilling complete. Refer to Table 10-1 for total quantities. Galiano
2021 Additional drilling to extend resource at depth, including RC and RCD drilling. Refer to Table 10-1 for total quantities.
Galiano

NI 43-101 Technical Report for the Asanko Gold Mine, Ashanti Region, Ghana
Effective Date: February 28, 2022
Page 38
6.3 Previous Mineral Resource Estimates
A number of Mineral Resource and Mineral Reserve estimations and declarations have been conducted over the various project areas that are the subject of this Report since 1995. The current Mineral Resources are not based on the previous estimates and have been re-estimated from first principles.
6.4 Historical Production
Artisanal mining has occurred at a number of the Asanko Gold target areas, focusing mainly on placer gold production. Prior to the Asanko Gold consolidation of the Keegan and PMI mineral assets in 2014, a number of satellite pit mining and evaluation projects were in operation.
The main producing mine in the area was the Obotan Mine (now Nkran Mine). Open pit mining commenced in February 1997. A total of 16.11 Mm3 of material was excavated from the open pit at a production rate of 1.4 Mtpa. Following several re-designs, the pit was mined in two stages. A total of 7.82 Mt of material was milled at an average recovery of 89% at a reported reserve grade of 2.35 g/t (Brinkley 2001). The mine was closed in July 2001 after having produced 590,743 oz Au. Operations ceased due to a low gold price environment coupled with the requirement to push back the Nkran pit to access deeper reserves. Asanko Gold dewatered the Nkran pit and re-commenced mining operations in February 2015, with the first gold produced in February 2016. Production was reported at Nkran through to Q2 2020, producing a total of 797,949 oz of gold.
At Esaase, under the Bonte mining lease BGM recovered approximately 200,000 oz of alluvial gold during the period 1990-2002. No mining or production details are available. Asanko Gold commenced operations at Esaase in 2018 extracting from non-alluvial sources. Production to date totals 452,477 oz of gold.
At Abore, Resolute Mining Limited (Resolute) conducted mining in the late 1990s to early 2000s. Mining targeted mainly oxides and transition material by open cast blast, load and haul to be processed at the old Nkran plant. Production details are unknown.
At Adubiaso, Resolute mined mostly oxides and transition material from the deposit by open cast free dig, load and haul to the Nkran plant. Mining was from October 1999 to December 2000. As reported by Brinkley (2001), a total of 3.79 Mm3 of material was excavated from Adubiaso open pit. A total of 0.70 Mt at 2.43 g/t Au was delivered to the ROM pad, containing a total of 54,654 oz of gold. Total production of 52,677 oz (recovered) was achieved with a pre-production cost of US$90/oz (February 1999 to October 1999); and an operating cost of US$262/oz (October 1999 to December 2000).
The Asuadai deposit has seen no legal mining conducted since the mineralization was identified. Artisanal miners had and still are undertaking pitting within the mineralized zones of the prospect.
The Dynamite Hill deposit was discovered in 2013 and put into production in Q4 2017. Production ceased in late 2019 having yielded 91,149 oz of gold.
No large-scale mining was conducted at Akwasiso prior to Asanko Gold. Akwasiso has been in operation since 2018. Production to date totals 152,328 oz of gold.
At Miradani North, some open pit mining was conducted to a vertical depth of 30-40m by GPS Ghana Ltd. The current pit is approximately 120 m long and 75 m. Production details from this operation are unknown at this time.
There is no record of formal commercial historical mining activity for the other target areas.

NI 43-101 Technical Report for the Asanko Gold Mine, Ashanti Region, Ghana
Effective Date: February 28, 2022
Page 39
7 GEOLOGICAL SETTING AND MINERALIZATION
Unless specified otherwise, all diagrams in this section are sourced from Asanko Gold Mine, 2019.
7.1 Regional Geology
The geology of Ghana is largely underlain by the West African craton. The craton consists of the Man-Leo (or Kénéma-Man) shield in the south (extending from Ghana to Senegal) and the Archaean Reguibat Shield in Mauritania to the north. They are separated by overlying younger sedimentary rocks of the
Taoudeni Basin (see Figure 7-1).
Figure 7-1 Simplified Map of the West African Craton, with Associated Gold Deposits (Modified from
Goldfarb et al, 2017)
Note: Numbers 1 to 9 outline the different Archean, Proterozoic, and Hercynian domains: 1 = Eglab, 2 = Yetti, 3 = Daomeyan, 4 = Baoulé-Mossi, 5 = Kenema-Man, 6 = Kédougou-Kénébia Inlier, 7 =Rokelides, 8 = Bassarides, 9 = Mauritanides

NI 43-101 Technical Report for the Asanko Gold Mine, Ashanti Region, Ghana
Effective Date: February 28, 2022
Page 40
The Man-Leo Shield covers the southernmost third of the craton. It is divided into two portions, with the Archaean age Kenema-Man Domain in the west and a Paleoproterozoic dominated Birimian aged terrain in the east, sometimes referred to as the Baoulé-Mossi domain. The Birimian rocks consist of five evenly spaced commonly NNE-trending, narrow, linear greenstone belts composed of calc-alkaline or tholeiitic volcanic rocks (Figure 7-2 and Figure 7-3). These belts are separated by wide intervening basins (such as the Kumasi Basin) filled with thick turbiditic sequences of argillites, phyllites, graywackes, and chemical sediments. The Birimian rocks are believed to have formed during two major orogenic phases, namely the Eoeburnian (ca. 2.25 to 2.15 Ga) and the Eburnian (ca. 2.12 to 2.06 Ga).
Birimian sedimentation was followed by deposition of clastic sediments of the Tarkwa Group from ca. 2135 to 2120 Ma, in places interbedded with the Birimian units and containing clasts derived from the Birimian rocks. Generally, though, the contact is considered unconformable. Tarkwaian conglomerates, sandstones, and phyllites appear to have accumulated in restricted basins within the volcanic belts of the Birimian towards the end of the volcanic cycle.
Three magmatic episodes intrude the Birimian rocks, divided based on petrography, geochemistry, and isotopic ages (Baratoux et al., 2011), as well as magnetic and radiometric signatures (Metelka et al., 2011).
• The oldest magmatic episode was characterized by emplacement of calc-alkaline biotite- and amphibole-bearing Tonalite-Trondhjemite-Granodiorite (TTG) suites dated from ca. 2.17 to 2.12 Ga (Yao et al., 2001). These equate to the often-used ‘Cape Coast’ or ‘Basin-type granitoids’ due to their spatial association with the sedimentary basins;
• The second episode is represented by calc-alkaline K-feldspar- and biotite-bearing granodiorite and granite intrusions dated between ca. 2.12 and 2.09 Ga. These are often referred to as ‘Belt-type’ or ‘Dixcove’ granitoids, due to their spatial association with the volcanic belts;
• The third episode, exemplified by the Bongo, Tongo, and Banso potassic granitoids granites emplaced during late orogenic stages between ca. 2.11 and 2.07 Ga. (post-Tarkwaian).
Later deformation resulted in widespread lower to upper greenschist facies metamorphism of most of the volcanic and sedimentary rocks in the greenstone belts (Feybesse et al., 2006), although amphibolite facies peak conditions were locally reached during regional metamorphism.
Clastic shallow water sediments of the Neoproterozoic Volta Basin cover the northeast of the country. Minor Paleozoic and Cretaceous to Tertiary sediments occur along the coast and in the extreme southeast of the country.
Much of this deformation is what is termed the Eburnean orogeny, which Allibone et al. (2004) defined as represented by two major deformational cycles. Feybesse et al. (2006) synthesized these West African events as 2130 to 2105 Ma (D1) thrusting followed by 2095 to 1980 Ma (D2-D3) transcurrent tectonics.
The margins of the belts commonly exhibit faulting on local and regional scales. These structures are fundamentally important in the development of gold deposits for which the region is well known.
Multiple tectonic events have affected virtually all Birimian rocks with the most substantive being the Eburnean Orogeny fold-thrust compressional event, that affected both volcanic and sedimentary belts throughout the region and to a lesser extent, Tarkwaian rocks. For this reason, relative age relations suggest that the final deposition of Tarkwaian rocks took place as the underlying and adjacent volcanic and sedimentary rocks were undergoing the initial stages of compressional deformation.

NI 43-101 Technical Report for the Asanko Gold Mine, Ashanti Region, Ghana
Effective Date: February 28, 2022
Page 41
Figure 7-2 Regional Geology of Southwest Ghana Around AGM Concessions
Source: Ghana Geological Survey; CJM, 2014

NI 43-101 Technical Report for the Asanko Gold Mine, Ashanti Region, Ghana
Effective Date: February 28, 2022
Page 42
Figure 7-3 Generalized Stratigraphy of Southwest Ghana
Source: CJM, 2014
Mesothermal gold mineralization in the Birimian Supergroup occurs as two main types, namely quartz vein hosted and disseminated sulphide type (Leube et al., 1990; Béziat et al., 2008), and most developed between 2.2 and 1.8 Ga. Of these, orogenic gold deposits formed between 2.2 and 2.0 Ga, intrusion-related (and skarn) between 2.2 and 2.1 Ga, and paleoplacer types between 2.06 and 1.8 Ga.
There are also examples of atypical major supergene gold deposits such as Yatela, which has been correlated with the glacial formation on the West African craton during the Miocene–Eocene epochs (Matsheka and Hein., 2011). Furthermore, gold mineralization is also known from the Archean of Sierra Leone and Liberia dating to 2.9 Ga (Foster and Piper, 1993). The youngest in situ recognized gold phase occurs in the Pan-African Dahomeyan belt of Togo (Markwitz et al., 2015).
Orogenic gold in West Africa is hosted in a range of rock types including mafic-hosted (both intrusive and extrusive units), granitoid-hosted, sediment-hosted, carbonate-hosted, and Banded Iron Formation (BIF) hosted. Orogenic gold in shear zones, commonly in quartz veins, is the dominant style of mineralization in West Africa (Markwitz et al 2015).

NI 43-101 Technical Report for the Asanko Gold Mine, Ashanti Region, Ghana
Effective Date: February 28, 2022
Page 43
Intrusion-related deposits and skarn deposits are rarer and, with some exceptions, are also controversial concerning an agreed genetic model. Generally, gold mineralization is associated with greenschist metamorphosed terrains, and less commonly in lower amphibolite facies rocks. Most deposits are found in the Baoulé Mossi domain and the Kédougou-Kéniéba Inlier and are spatial associated with shear zones. The shear zones commonly occur at the contact between Birimian metasedimentary and metavolcanic rocks (Kesse, 1985), with gold deposits expressing a significant degree of structural control (Béziat et al., 2008). Some gold mineralization is related to the pre-Eburnean metallogenesis (Tangaean event) at approximately 2.19–2.15 Ga (Allibone et al., 2002; Tshibubudze et al., 2009; Hein, 2010; de Kock et al., 2012) which is observed in Ghana (e.g.,Wassa), Burkina Faso (e.g., Kiaka, Essakane) and Mali (e.g., Morila).
In the West African Craton, the peak of mineralization was during the Eburnean Orogeny at approximately 2.15–2.10 Ga and produced very large (>10 Moz) gold deposits associated with regional northeast–southwest trending shear zones. Gold occurs as free grains associated with quartz and/or is hosted in sulphides (mainly pyrite and arsenopyrite) (Milési et al.,1989).
Extensive hydrothermal alteration is observed throughout gold-rich areas, with carbonate–pyrite–chlorite–sericite alteration in meta-sedimentary rocks, actinolite–chlorite–quartz ± chalcopyrite ± albite ± leucoxene in mafic volcanic rocks, and quartz–chlorite–sericite–epidote in felsic intrusive rocks (Markwitz et al., 2015).
7.2 Local Geology
The AGM deposits are located within the Kumasi Basin, one of the intervening basins between the greenstone belts. Within this basin lies the Asankrangwa Gold Belt which was recognized after decades of artisanal mining in gold-bearing, shear zone hosted quartz reefs. The basin is bound to the southeast by the Ashanti Fault/Shear and the Bibiani shear to the northwest. The Asankrangwa Belt expresses itself as a complex of northeast-trending shear zones situated along the central axis of the Kumasi Basin. Several major northeast-trending shears/structures bisect the Kumasi Basin/Asankrangwa Belt. The Nkran deposit is located on a jog along the regional 35-40° trending Nkran Shear, which is a zone of about 15 km in width and may be traced on a northeast to southwest trend for a distance of some 150 km. The Nkran Shear Corridor also hosts the Asuadai, Dynamite Hill, and Akwasiso deposits. The parallel Esaase Shear Corridor hosts the Esaase, Adubiaso, and Abore deposits. The Miradani Shear Corridor hosts the Tontokrom, Miradani, and Fromenda deposits.
The Kumasi Basin is heavily faulted and consists of an isoclinally folded sequence of metasediments, dominated by turbiditic sequences of greywackes and shales, intercalated with rare andesitic and volcaniclastic rocks, previously described as greywackes, phyllites, argillites, and shales.
The Asankrangwa Belt straddles two broad domains of distinct magnetic character. The western portion is characterized by the low magnetic relief that is typical of the Kumasi Basin as a whole. In the east, moderately magnetic mafic volcanic rocks result in a high magnetic zone corresponding to the Lower Birimian Supergroup, and the infolded, strongly magnetic rocks of the Ashanti Belt volcano-sedimentary and Tarkwaian sedimentary packages. This domain is in sharp contact with the weakly, to non-magnetic rocks of the upper Birimian metasediments, which dominate the Kumasi Basin in the west. This zone of contrast coincides with the prominent, shear zone which bounds the northwest margin of the Ashanti volcanic belt that plays host to most of the large gold deposits in the area.
A sharp NE trending break separates these two distinct magnetic domains and also truncates the dominant ENE to WSW trends typical of the eastern domain. Evident, dramatic changes in the structural grain in the area indicate the presence of a major shear zone separating the two domains. This interpretation results in the Upper Birimian metasediments of the western domain occurring in the hanging wall of the shear zone, and above Lower Birimian metavolcanics of the eastern domain which occur in the shear zone footwall. This arrangement of ‘younger-over-older’ supports a long and intense thrusting history on the shear zone.
One of the structural setting interpretations of the Asankrangwa Belt that explains these relationships is an inverted half-graben, in which growth faulting-controlled accumulation of the upper Birimian metasediments, above the Lower Birimian metavolcanics in the footwall.

NI 43-101 Technical Report for the Asanko Gold Mine, Ashanti Region, Ghana
Effective Date: February 28, 2022
Page 44
7.3 Regolith and Weathering Profile
The regolith system of the Asankrangwa belt is a typical tropical weathering environment. The topography comprises rolling hills and valleys with a dendritic drainage pattern that features a network of rivers and streams that generally drain southwards.
In this vast area, different regolith regimes are observed namely relic, erosional and depositional. The relict regime contains mainly lateritic residuum, the erosional regime comprises ferruginous saprolite, saprolite, lag, and soil on saprolite bedrock saprolite and soils on bedrock saprolite. The depositional regimes are mainly colluvium, alluvium, paleochannel, and lacustrine sediments, and ferricrete.
On hilltops, ridges, and elevated topographies and slopes, there is vegetation cover sitting on topsoil rich in organic matter which is between 0-30 cm thick. Underneath this is the lateritic residuum comprising lateritic gravel and duricrust beneath which is the mottled zone followed by plasmic zones. Beneath the plasmic zone lies the saprolite and the sap rock sitting on the bedrock.
In valleys and plains, the vegetation cover is underlain by mud, thick sandy soils, and pebbly gravels, 0.5 to 5 m thick, which overlie the saprolite, and the caprock. Both are underlain by bedrock.
Generally, the base of oxidation is about 50 m but varies between 20 to 80 m deep depending on local conditions such as rock type, topography degree of silicification, and other factors. The transition from completely weathered to fresh rock is 3 to 10 m thick but more gradual in the metasedimentary rocks compared to the intrusive rocks.
Figure 7-4 is a photo showing a typical regolith profile exposed in a road cut. Figure 7-5 shows the Asankrangwa belt regional geology.
Figure 7-4 Road-cut Exposure Showing Regolith Typical Regolith on a Hill on the Asankrangwa Belt

NI 43-101 Technical Report for the Asanko Gold Mine, Ashanti Region, Ghana
Effective Date: February 28, 2022
Page 45
Figure 7-5 Location of AGM Deposits Along the Asankrangwa Gold Belt
Source: Asanko Gold Mine, 2021

NI 43-101 Technical Report for the Asanko Gold Mine, Ashanti Region, Ghana
Effective Date: February 28, 2022
Page 46
7.4 Property Geology and Mineralization
The AGM deposits are hosted along the NE-SW Asankrangwa structural shear corridor, which is defined by
NE-SW trending lineaments and magnetic lows and is about 7 km wide and over 50 km long. A summary of
the structural controls on mineralization and dominant host rocks at each deposit is presented in Table 7-1.
Table 7-1 Summary of Structural Controls on Mineralization per Deposit
Deposit Mineralization Control Main Host Rock
Nkran D2 shear + granitoid + linking QVs Quartz (Qtz) sandstone + granitoid + quartz
veins (QVs)
Nkran Extension D2 shear + Late conjugate QVs Qtz sandstone
Esaase D2 shear + tensional QVs Highly deformed sandstone-siltstone-shale +
QVs
Akwasiso D2 shear + granite + Late conjugate QVs Qtz sandstone + granite + QVs
Abore D2 shear + granite dyke + Late conjugate QVs Granite + QVs
Asuadai D2 + Granite + late conjugate QVs Granite + QVs
Adubiaso D2 shear + granite dyke + Late conjugate QVs Qtz sandstone + granite
Adubiaso Ext D2 shear + late conjugate QVs Qtz sandstone
Miradani North D2 shear + sub-horizontal linking QVs Qtz sandstone + tonalite + QVs
7.4.1 Nkran
Nkran occurs on a 20° trending jog on the Nkran Shear Corridor. The Nkran Shear is characterized by sheared siltstones (phyllites) dominant on the western side of the shear and sandstone dominant on the east. The central part of the Nkran deposit consists of a series of wacke and sandstone-dominated stratigraphy that has been intruded by several felsic porphyry intrusions (see Davis, 2016). Consistent mappable lithologies are the western sandstone, the central sandstone, the eastern sandstone, the felsic granitic porphyry intrusive unit, and the skinny breccia unit which is located within the eastern sandstones and runs along the strike of the deposit.
In plan, the Nkran pit extends for approximately 850 m in a NE-SW direction along the strike length of the ore body, and at its widest point measures 450 m across strike. The main rock types at Nkran pit consist of thinly bedded greywacke and thickly bedded to massive sandstone, phyllite, and carbonaceous shale. The metasediments have been isoclinally folded and sheared, and generally dip steeply to the north-west at between 70º to 80º, with a steep 70º north-easterly plunge.
Intruding the metasediments are two lensoid tonalitic intrusions. The intrusion is largely restricted to the NE portion of the pit, with isolated pods of granitoid in the southern portion. Granitoid (as tonalite; Nude, 2011) is present at depth in the south end of the pit. The re-opening of the Nkran deposit has provided extensive in-pit exposure. The granitoids intrude structures marked by a stratigraphic discordance and are variably sericite altered. Of note is that the granitoids post-date the D1-D2 deformational events and host a brittle vein style of gold mineralization.
The regional stratigraphy trends in a NE direction, while in the middle of the Nkran pit the stratigraphy trends north. The stratigraphic discordance in the centre of the pit correlates with both the southern extent of the granite intrusion (GR01) at upper levels and the presence of sandstone-dominant stratigraphy. Phyllites locally are observed to splay and merge along strike, and mark zones of higher strain (shear zones) within a more competent sandstone dominant package and tonalite. Duplex structures present through the centre of the pit, cut the GR01 granite, and repeat the sandstone-dominant stratigraphy along sheared phyllites and tonalite contacts.
Three predominant deformation/geotectonic phases are identified at the Nkran area:
1. Closure of the Kumasi Basin through NW-SE compression

NI 43-101 Technical Report for the Asanko Gold Mine, Ashanti Region, Ghana
Effective Date: February 28, 2022
Page 47
o D1 NW-SE shortening, creating NE-trending, steep NW-dipping isoclinal folded stratigraphic package of greywacke, phyllite, and carbonaceous shale
o D2 WNW-ESE shortening, dextral movement along the Nkran shear, duplication of stratigraphy along phyllite/shale rich horizons. Formation of four main controlling structures – Freelander, Defender, Discovery, and County. The early phase of Au-mineralization (Galamsey Vein [GV], Central Vein [CV], Eastern Vein [EV]) is associated with ductile fabric associated with D2 deformation.
2. Change/rotation in stress field resulting in SW-NE compression
o D3 SW-NE shortening, resulting in crenulation cleavage.
3. Change/rotation in stress field resulting in NE-SW compression
o D4a NE–SW shortening, resulting in shallow stacked veins that cross-cut D2 fabric. Vein arrays predominantly hosted within the thick sand (broad sandstone) package, the synformal keel of prior D1/D2 deformation, and several granitoid stocks. High-grade gold associated with these vein arrays
o D4b NW-SE extension, resulting in steep, narrow extension veins striking NW. Often contain high-grade gold.
o D5 NW-SE shortening, sinistral reactivation of major structures, resulting in barren quartz breccia and laminated veins, contain xenoliths of early D2 and D4 related mineralization.
Figure 7-6 shows a plan view of the geology at Nkran.
Figure 7-6 Nkran Plan View Pit Showing Geology
Source: Asanko Gold Mine, 2021

NI 43-101 Technical Report for the Asanko Gold Mine, Ashanti Region, Ghana
Effective Date: February 28, 2022
Page 48
Mineralization at Nkran is controlled by an isoclinally sheared fold verging to the north. There is a very strong control on the gold mineralization distribution by structures associated with the Western Sandstone and the Eastern Breccia. The mineralization is concentrated around the limbs of this fold must have occurred in two major phases:
1. Ductile, shear-hosted mineralization, within the NNE-striking, steeply W-dipping GV, CV, and EV systems. These zones typically measure approximately 2 m in wide in the central area, with higher grades associated with the intersection of the lodes and the controlling structures (Freelander, Defender, etc.) resulting in high-grade steeply plunging shoots. These lodes are overprinted by a barren quartz event that significantly disrupts the continuous nature of the mineralization in the central zone of the pit.
2. Cross-cutting, NW to NNW-striking, shallow to moderately NE-dipping brittle quartz-carbonate vein hosted mineralization, and associated sericite-albite-arsenopyrite-magnetite alteration. Steep, narrow (2-5 cm thick) high-grade veins overprint the shallow dipping mineralization. The first set of shallow dipping veins (Figure 7-7) are linked to NE-SW shortening. The second phase of veins were linked to the NNE-SSW extension. This mineralization is predominantly hosted in the folded thickened broad sandstone and granitoid stocks.
Figure 7-7 Nkran Plan View and Cross-section Through Pit Showing Mineralized Domains Based on Grade, Vein Density and Orientation Data
Source: Asanko Gold Mine, 2021
7.4.2 Esaase
Broadly speaking, the Esaase deposit area can be referred to as a ‘system of gold-bearing quartz veins hosted by tightly folded Birimian-age sedimentary rocks arranged along an NNE-SSW trending strike’. Since the maiden resource release in October 2007, various simplified geological models have been used to constrain the resource estimation.

NI 43-101 Technical Report for the Asanko Gold Mine, Ashanti Region, Ghana
Effective Date: February 28, 2022
Page 49
The 2007 maiden Mineral Resource for Esaase used a simple ‘two mineral domain’ model to geologically constrain the resource, consisting of Hanging Wall and Footwall zones. The Hanging Wall zone consisted of shale and siltstone and the Footwall zone, predominantly greywacke (Coffey, 2007).
The 2019 model used four ‘litho-stratigraphic’ units (Upper Siltstone, Cobra Unit, Central Sandstone, Python Shear (or Footwall) Sandstone) to constrain modelling (see Table 7-2), all of which were believed to be bounded by NE-SW trending sheared contacts.
Table 7-2 Stratigraphic Unit with a General Description
Stratigraphic Unit General Description
Upper Siltstone Interbedded succession of sandstone (Upper Sandstone unit) and siltstone layers. The Mamba shear zone marks the top contact of the unit.
Cobra Siltstone Distinctive, sheared, and folded pelitic and carbonaceous succession which caps the Central Sandstone. The Cobra unit contains shear–bounded
discontinuous shale bands.
Central Sandstone The Dominant gold-bearing unit is exposed in the Esaase starter pit and represents the principal economic unit.
Python Shear Sandstone High-strain bounding Python shear with relatively undeformed Sandstone in the footwall which extends to the Viper Shear Zone.
These units are considered valid litho-stratigraphic units for Esaase, although recent work by Pratt (2021) highlights a tectono-stratigraphic unit between the Central Sandstone and the Cobra Unit that he refers to as ‘The Mobile Zone’.
The mineralized domain model used currently as a basis for resource modelling is based on recognising the distribution of vein arrays using quartz vein percentages, assisted by orientation data and pit mapping. In addition, the wealth of grade control data to date highlights the distribution of these vein arrays along fold hinges. These grade control patterns are best seen in level plans rather than cross sections due to the steeply northeast plunge to both mineralization and lithology.
The lithostratigraphy and structure is best described in the modified excerpts and figures from Pratt (2021) italicised below:
The rocks are entirely metasedimentary, varying from black, organic-rich mudstones to coarse grained, almost pebbly sandstones (though probable thin, late dikes were also seen in core photos). Examples of sedimentary textures are shown in Figure 7-8. The style of deposition was turbiditic, shown by some normally graded sandstone beds with finer, planar laminated to ripple cross bedded tops. (There are some examples of reverse grading in poorly sorted greywackes.) The pyritous black mudstones are hemipelagites, deposited under oxygen-poor (anoxic) conditions. The pyrite is almost certainly diagenetic. The pyrite was probably remobilized during metamorphism and hydrothermal alteration. The grade of metamorphism is probably low greenschist (indicated by lack of true mica schists/phyllites and the presence of cordierite (or andalusite). The main minerals are very fine-grained white mica, quartz, and feldspar. Feldspar seems to be preserved in the least altered, footwall sandstones suggesting that the white mica (sericite) in other rocks, particularly the Cobra Unit, is ultimately of hydrothermal origin.

NI 43-101 Technical Report for the Asanko Gold Mine, Ashanti Region, Ghana
Effective Date: February 28, 2022
Page 50
Figure 7-8 Examples of Sedimentary Textures at Esaase
Source: Pratt, 2021

NI 43-101 Technical Report for the Asanko Gold Mine, Ashanti Region, Ghana
Effective Date: February 28, 2022
Page 51
7.4.2.1 Lithostratigraphic Scheme
In the North of Cut 3, the lithostratigraphy comprises five main components, one of which is best described as ‘tectonostratigraphic’ (see Figure 7-9).
Figure 7-9 Interpreted North Wall of Cut 3 at Esaase
Source: Pratt, 2021
Figure 7-9 shows some of these components, along with en echelon quartz vein swarms (in magenta). Figure 7-9 shows a cross section across the North Wall area of Cut 3, approximating to the photo above. Broadly, the beds in Cut 3 seem to young from East to West (oldest to youngest). They comprise:
1. The footwall grey sandstones and siltstones (the ‘Grey Sandstones’ or ‘Footwall Sandstone’ of previous Esaase reports). These thickly bedded sandstones are generally fine grained and well sorted. The main characteristic is the colour: they are grey and there are no intervening black mudstones. There are also common interbeds of sandstone with planar lamination and ripple cross stratification (useful for younging directions – not common in the Central Sandstone). The rocks are tough and relatively fresh, even close to the original ground surface. Some individual sandstone beds are very thick. They can contain large euhedral grains of pyrite. The contact with the overlying Central Sandstone is a fault in the North Wall of Cut 3 (Figure 7-9). It is also important to emphasize that the footwall sandstone contains significant folds.
2. The ‘Central Sandstone’. This comprises medium- to coarse grained, moderate- to poorly sorted litharenites (quartz, feldspar, rock fragments). Mudstone rip-up clasts are common (Figure 7-8). Some individual sandstone beds are probably more than 3 m thick (true thickness). Towards the top of the unit, the litharenites are better described as greywackes. There are common thin interbeds of black pyritous mudstones, identical to the ‘Cobra Unit’. The sandstones generally have a weak cleavage and are commonly strongly sericitic or clay (smectite) altered.

NI 43-101 Technical Report for the Asanko Gold Mine, Ashanti Region, Ghana
Effective Date: February 28, 2022
Page 52
3. The ‘Mobile Belt’ (or ‘Dead Zone’, because of mostly low gold grades) (Figure 7-9). This belt is of strongly deformed, folded, and sheared black mudstones and sandstones. It is obvious in the North Wall of Cut 3 (Figure 7-9). This zone partly coincides with the previously modelled ‘Cobra Shear’, but that modelled shear is much narrower and cuts across the Mobile Belt.
4. The ‘Cobra Unit’. Pratt (2021) defines this as all the rocks between the Mobile Belt and the Hawk Fault. This complex unit comprises alternating sequences of black, pyritous mudstone- and sandstone-dominated rocks. There are a few packets of thickly bedded sandstone, commonly greywacke (sericitic, with a strong cleavage). One of these is probably the ‘Upper Sandstone’ mentioned in the past. Overall, the high pyrite content causes a distinct purplish hematite staining. The mudstones commonly have a strong S2 crenulation cleavage and common spherical porphyroblasts of cordierite or andalusite (now altered to fine grained mica). These porphyroblasts are locally overprinted by a halo of Fe carbonate. Fe carbonate also occurs as discrete porphyroblasts (Figure 7-8). There are almost certainly significant tight or isoclinal folds within the Cobra Unit, which repeat the sandstone units, however locating the hinges can be difficult.
5. The Hawk Unit (approximately equivalent of the previously modelled ‘Upper Siltstone’). This lies above (west of) the Hawk Fault. It comprises medium- to thickly bedded litharenites, locally coarse grained, with interbedded dark grey mudstones. It weathers in yellow, red, and purple colours, quite different from the Cobra Unit. Oxidation penetrates more deeply in this unit. Younging data indicate that this unit is the right way up (younging Northwest). It shows complex folds, with some gently dipping beds (Figure 7-10).
Figure 7-10 Complex Folding in the ‘Hawk Unit’ Adjacent to the Hawk Fault
Structure
D1 Deformation
The structural ‘grain’, mostly defined by bedding and schistosity, is the product of a single major deformation (D1). The bedding at Esaase is mostly sub vertical and Northeast-striking. The blue rectangles in Figure 7-11 are downhole bedding measurements. The Dead Zone (Mobile Belt) is clearly visible as a gap in gold grade.

NI 43-101 Technical Report for the Asanko Gold Mine, Ashanti Region, Ghana
Effective Date: February 28, 2022
Page 53
It is tempting to say that the entire sequence youngs towards the Northwest, like above the Hawk Fault. However, probable tight- to isoclinal folding is present. The hinges are under-represented in the mapping because they are trickier to spot in benches. They are also poorly represented in the downhole oriented bedding measurements. But there is clear evidence of folding; there are reversals in younging direction in drillholes. For example, a large part of KEDD6031, from 340-450 m depth, shows younging downhole (towards the Southeast).
Figure 7-11 Illustrates the Gold-poor/Dead Zone Associated with the ‘Mobile Belt’
The North Wall transect in Cut 3 (Figure 7-9) shows five main structural domains:
1. Open to tight folds occur in the hanging wall of the Hawk Fault, a major structure with a probable large post-mineral offset. These folds are very visible in the pit wall, emphasized by variegated colours. The rocks are mainly sandstones. The younging appears to be upward/northwest.
2. Between the Hawk Fault and the Mobile Belt, the Cobra Unit comprises interbedded black mudstones and sandstones, with at least one packet of thickly bedded sandstones (probably the ‘Upper Sandstone’). Minor folds plunge sub vertically or steeply towards the northeast.
3. The Mobile Belt has been described already; a belt of strongly folded rocks sandwiched between major faults (it is cross cut by Galiano’s Leapfrog-modelled ‘Cobra Shear’). It has low gold grade. Fold hinges plunge sub-vertically or steeply northeast.

NI 43-101 Technical Report for the Asanko Gold Mine, Ashanti Region, Ghana
Effective Date: February 28, 2022
Page 54
4. The Central Sandstone to the Southeast of the ‘Mobile Belt’ seems to comprise uniformly bedded rocks in the North Wall of Cut 3 (Figure 7-9). Major folds are likely to be present within it. This is supported by younging direction reversals in KEDD956.
5. The footwall grey sandstones also have fold hinges that plunge subvertically or steeply northeast. The main difference is the intensity of deformation and alteration. Sericite is present in the Central Sandstone but absent in the grey sandstones. Veins also tend to be carbonate-dominated. Bedding is less disturbed and sheared. This is confirmed by mapping in Cuts 2 and 3, where fold hinges (Figure 7-12) can be directly measured. Many plunge almost vertically.
The main cleavage (S1) is approximately axial planar to small scale F1 folds. Examples are shown in Figure 7-12.
Figure 7-12 Examples of Steeply Plunging F1 Folds at Esaase
Source: Pratt, 2021

NI 43-101 Technical Report for the Asanko Gold Mine, Ashanti Region, Ghana
Effective Date: February 28, 2022
Page 55
D2 Deformation
There is localized D2 deformation. This is manifested as kink bands and F2 folds (Figure 7-13 & Figure 7-14). Major folds are not recognized. An S2 crenulation cleavage is widespread within the muddier rocks (see Figure 7-8). Some significant quartz veins occur along F2 fold hinges, suggesting that the D2 event is related to gold mineralization. Of note, the S2 crenulation cleavage orientation is quite variable, suggesting that it may reflect local forces, due to movement on nearby faults/shear zones.
Faults and Shear Zones
Mapping and logging at the north end of Cut 3 show numerous significant northeast-striking, subvertical faults (Figure 7-9). They comprise narrow zones (mostly < 1 m) of gouge and sheared/broken rock and are commonly hosted by ductile black mudstones. Apparent ‘drag’ folds are common in the foot- and hanging walls. The ‘Mobile Belt’ comprises of two subparallel faults (including the ‘Cobra Fault’) with a zone of intense folding, transposed bedding, shearing and S2 crenulation between. Figure 7-15 shows some textures from the ‘Mobile Belt’.
To best understand the structure of Esaase, drill data should be viewed perpendicular to the average fold axis. Doing this, for example with the exploration and grade control assay data, seems to show evidence of folds. The key to understanding the distribution of the lithostratigraphic units, arrays of en echelon quartz veins, and, ultimately, gold grade, lies with these folds.
There are also multiple shear zones/faults within the Cobra Unit and within the Central Sandstone. It is strongly suspect that these multiple shear zones/faults have been mis-correlated between holes. The simplest parameter to model is the first appearance of thick sandstones (top of Central Sandstone). This contact is faulted and sheared in Cut 3, but, in some places, it seems like a normal lithostratigraphic contact. The contact is also commonly marked by the appearance of major, en echelon quartz tension gash veins (because the sandstone is more competent).
Veins
There is a clear correlation between the major quartz veins and gold grade. In drill core, the veins commonly present as en echelon tension gash veins at low angle to the core axis (Figure 7-16 and Figure 7-17). This is borne out by mapping, which shows swarms of veins that consistently strike anticlockwise of the structural grain, approximately north-south and sub vertical to northeast dipping. This implies a component of sinistral movement on the controlling structures (faults).
Some pertinent observations regarding veins at Esaase:
1. Veins within the competent sandstones can appear relatively planar and undeformed (though some are gently folded and boudinaged) (Figure 7-16 and Figure 7-17). However, these same veins can be traced laterally into more ductile units where they become sheared, parallel to the S1 cleavage and folded.
2. The larger, tension gash veins have stylolites of organic material (Figure 7-17).
3. Some quartz veins are folded in a ductile fashion and show an axial planar cleavage which seems to be S1 (Figure 7-16).
4. Even lithologies that may be considered as ductile, locally contain en echelon to sigmoidal tension gash veins that carry gold grades. See KEDD956 @ 218.8 m. In other words, the veins are not restricted to certain rock types.
5. Veins seem to be thicker within more competent rocks (thickly bedded sandstones). This is obvious in the North Wall of Cut 3 (Figure 7-20).
6. The quartz veins are dominated by quartz, but can contain orange weathered Fe carbonate, light grey carbonate, minor pyrite, rare arsenopyrite, and light green mica (probably sericite) (Figure 7-16 and Figure 7-17).
7. Veins within the grey footwall sandstones seem to be more carbonate-dominated.

NI 43-101 Technical Report for the Asanko Gold Mine, Ashanti Region, Ghana
Effective Date: February 28, 2022
Page 56
Figure 7-13 Examples of Deformation Fabrics at Esaase
Source: Pratt, 2021

NI 43-101 Technical Report for the Asanko Gold Mine, Ashanti Region, Ghana
Effective Date: February 28, 2022
Page 57
Figure 7-14 Examples of F2 Folds and S2 Crenulation Cleavage at Esaase
Source: Pratt, 2021

NI 43-101 Technical Report for the Asanko Gold Mine, Ashanti Region, Ghana
Effective Date: February 28, 2022
Page 58
Figure 7-15 Textures from the ‘Mobile Belt’ at Esaase
Source: Pratt, 2021

NI 43-101 Technical Report for the Asanko Gold Mine, Ashanti Region, Ghana
Effective Date: February 28, 2022
Page 59
Figure 7-16 Vein Textures at Esaase Part 1
Source: Pratt, 2021

NI 43-101 Technical Report for the Asanko Gold Mine, Ashanti Region, Ghana
Effective Date: February 28, 2022
Page 60
Figure 7-17 Vein Textures at Esaase Part 2
Source: Pratt, 2021

NI 43-101 Technical Report for the Asanko Gold Mine, Ashanti Region, Ghana
Effective Date: February 28, 2022
Page 61
Controls on Gold Mineralization
Gold at Esaase occurs in Northeast-striking, sub vertical corridors, parallel to the structural grain. But it is not clear whether these corridors are controlled principally by through-going faults/shear zones or by rock type, or a combination of both. The best understanding on the controls on gold comes from the exposures north of Cut 3. Here gold grade can be compared directly with mapped structures.
The strong ductility contrast between the Central Sandstone and the ductile ‘Mobile Belt’ (mostly black mudstones of the Cobra Unit), is a clear example of ‘contact-related’ orogenic gold mineralization. The Central Sandstone is clearly a good competent host for quartz veining and has quite a wide area of mineralization (visible in the tension gash veins of Figure 7-16 and Figure 7-19. The tension gash veins strike anticlockwise of bedding, suggesting a component of contemporaneous sinistral shear along the principal faults. The abrupt decline in gold grade to the Southeast seems to coincide well with the fault shown in Figure 7-20, which also marks a change in alteration (less sericite and pyrite). This strongly suggests a post-mineral offset on this fault. (The closest modelled fault in the Galiano Leapfrog model is the ‘Python Shear’).
Figure 7-18 shows the grade shapes (in blue) with, and without, the gold grades.
Figure 7-18 Grade Control Drilling Patterns Highlighting the Distribution Around Folds
Source: Pratt, 2021
The most striking feature is the lack of gold in the ‘Mobile Belt’ (or ‘Dead Zone’ – shown in orange above). This is perhaps because the (dominantly) black mudstones were not a good host for veining. However, the major faults on either side of the ‘Mobile Belt’ were clearly a major control on gold. Their immediate foot- and/or hanging walls are zones of grade, likely explained by swarms of en echelon quartz veins.
There are also bends in the mineralization shapes, suggesting that folds are present and that favourable lithologies (massive sandstones) are mineralized. The most pronounced ‘bends’ occur in the South, in Cut 2. Mapping along the west wall of the pit indicate that the Central Sandstone is folded in a steeply plunging anticline/syncline pair. In fact, there may be multiple folds; the fold pair may be a simplification.

NI 43-101 Technical Report for the Asanko Gold Mine, Ashanti Region, Ghana
Effective Date: February 28, 2022
Page 62
The fold hinges and limbs are mineralized with gold, suggesting this was a favourable area. The resolution in the grade control drilling is not quite sharp enough to decide if the sandstones within the Cut 2 folds host ‘disseminated’ gold (veins everywhere) or are cut by numerous corridors (mineralized faults or kink bands) of vein swarms. An example on the west side of Cut 2 is shown in Figure 7-19. It clearly shows a northeast corridor of veins, apparently without a major controlling fault. This belt of veins cuts across the lithostratigraphy but the veins are thicker in the sandstones. It may be comparable to the ‘kink band’ at the north end of Cut 3, or it may be developed along an incipient fault that never developed fully. Figure 7-19. shows an example of how, within this belt of veins, the veins swell in the more competent sandstone.
Figure 7-19 NE Corridor, Illustrating the en Echelon Tension Gash Vein Arrays
Source: Pratt, 2021

NI 43-101 Technical Report for the Asanko Gold Mine, Ashanti Region, Ghana
Effective Date: February 28, 2022
Page 63
Figure 7-20 Stereographic Plots for Veins and North Wall of Cut 3 Showing Vein Distribution in Various Units
Source: Pratt, 2021

NI 43-101 Technical Report for the Asanko Gold Mine, Ashanti Region, Ghana
Effective Date: February 28, 2022
Page 64
Figure 7-21 shows a simple model to explain the styles of mineralization at Esaase. Two styles are recognized:
1. The dominant control is sub vertical northeast-striking faults and shear zones. The faults are mostly not mineralized themselves, though there is some evidence of informal miners chasing some very narrow, late brittle faults. They probably also have a strong post-mineral component of movement. But the faults are flanked by belts of en echelon veins with gold, particularly where the adjacent host rock is competent sandstone (‘contact orogenic’). This explains why the best grades are in the Central Sandstone. It is much more competent than the adjacent Cobra black mudstones. The veins lie anticlockwise of the fold hinges, suggesting a component of sinistral movement. There is also evidence that sandstones within the Cobra Unit were more favourable for vein development.
2. The second style comprises swarms of en echelon veins, kink bands and zones of incipient faulting that traverse various rock types. Within these belts, the veins are thicker, and grades higher, where they traverse competent sandstone.
Figure 7-21 Schematic Geological Model for Fold Mineralization at Esaase
Source: Pratt, 2021

NI 43-101 Technical Report for the Asanko Gold Mine, Ashanti Region, Ghana
Effective Date: February 28, 2022
Page 65
7.4.3 Akwasiso
The Akwasiso deposit lies some 4 km NE of the main Nkran deposit and geologically bears many similarities to Nkran. A granite intrusion surrounds a 080° dipping cross structure and mineralization hosted in bounding 035°N sub-vertical shear structures transgressing a sandstone/siltstone sequence.
The deposit is predominantly underlain by Lower Birimian metasedimentary rocks with dominant lithologies being sandstone, siltstone, shales, and a granitic intrusion. The contact between these sedimentary units is intruded by granitoids mainly of felsic composition (belt granitoids), which form elongated bodies parallel to the regional shears. In many areas, the contact between the metasedimentary rocks and the granitoids is associated with higher grades of mineralization. The metasedimentary rocks occasionally host disseminated sulphides and carbonates. Pyrite, the most prevalent sulphide, is most often oxidized to limonite or leached out leaving cubic casts. Carbonates, phyllites, graphitic schists, and volcaniclastics constitute the major components of these supra crustal rocks. They have well-developed schistosity that is parallel to bedding, striking NE usually between 40° and 50° and often dip steeply to either NW or SE away from the granitic body. The rocks are generally foliated with the shales displaying better development of foliation planes than the sandstones. Foliation dips steeply and slightly oblique to bedding.
Figure 7-22 Akwasiso Plan View Showing Geology

NI 43-101 Technical Report for the Asanko Gold Mine, Ashanti Region, Ghana
Effective Date: February 28, 2022
Page 66
Figure 7-23 Akwasiso Cross-section Through the Pit Showing Geology
The sandstone unit appears to be the favourable host rock for mineralization where more brittle quartz-carbonate veins are localized. A plan view and cross-section at Akwasiso showing the deposit geology is provided in Figure 7-22 and Figure 7-23.
Akwasiso represents a smaller scale version of Nkran. Two shear zones are controlling the mineralization. The eastern mineralized envelope is associated with felsic porphyry emplaced along a sandstone siltstone contact. The intrusive seems to have occurred in a dilation jog with a potato shape plunging steeply to the north and terminated abruptly to the south. It is about 150-170 m along, and about 40-50 m across strike.
Mineralization is associated with increased carbonate quartz veining, quartz flooding in the felsic porphyry, arsenopyrite, sericite, and chlorite alteration. The alteration is pervasive with the granite and the walls of the country-rock. Higher grade intersections occur at the margins of the sandstone with the granite.
The other mineralized envelope is a stockwork of extension veins along a shear zone to the west occurring in a sandstone formation. The mineralization is 7-10 m wide and about 300 m along strike, crossing from one end of the pit to the other. The alteration assemblage consists of quartz carbonates, arsenopyrite, sericite, and chlorite, and pyrite. Figure 7-24 below shows the plan view of the mineralization envelopes at Akwasiso.

NI 43-101 Technical Report for the Asanko Gold Mine, Ashanti Region, Ghana
Effective Date: February 28, 2022
Page 67
Figure 7-24 Plan View of Akwasiso Mineralization Envelopes at Akwasiso
7.4.4 Abore
The Abore deposit is located on the Abore-Esaase shear corridor which also hosts the Esaase deposit. The main rock types observed within the Abore pit consist of carbonaceous shale, siltstone (phyllite), thinly bedded wacke, and thickly bedded sandstone. The sedimentary sequence has been intruded by a granitic (tonalitic) intrusion. For the development of the geological model, the various lithologies have been grouped into the following:
• Interbedded siltstone dominant: The thinly bedded siltstone and shale (with a minor interbedded wacke component) is the principal geology domain on the western portion of the deposit. This forms the hanging wall host sequence to the granite intrusion
• Interbedded sandstone dominant: The footwall sandstone and greywacke interbedded sedimentary sequence is the principal lithology on the eastern portion of the deposit. This forms the footwall host sequence to the granite intrusion. The sedimentary rocks dip steeply to the NW between 70° to 85°
• Granite intrusion: An elongate granite (tonalitic) intrusion has intruded parallel to the main lithological domain boundary. The foliated granite dips steeply to the NW. The granite has been boudinaged and displaced by E-W (060) trending faults
• Dyke. A late cross-cutting west-east striking dyke features in the northern section of the deposit.

NI 43-101 Technical Report for the Asanko Gold Mine, Ashanti Region, Ghana
Effective Date: February 28, 2022
Page 68
Several foliation and bedding relationships are observed at the Abore deposit. The most common feature is a pervasive foliation that is well developed in the fine-grained siltstones and shales and to a lesser extent in the coarser interbedded sandstone and wacke sequences. A strong foliation (040° strike and steep dip west) is also present on both the hanging wall and footwall margins of the granite, indicating emplacement before deformation. The hanging wall sequence of interbedded siltstone, shale, and wacke is significantly more deformed and foliated than the footwall sequence of sandstone with minor wacke, with several shears, trending on a bearing of 020°. These shears developed preferentially within the carbonaceous shale-rich units.
The presence of large-scale folding within the Abore pit is supported by the observation of opposing foliation/bedding relationships within the drill core. The second notable folding event is an NNE trending, steep north-westerly dipping foliation which cuts the earlier 040° trending fabric. Several of these structures are recognizable within the pit. These structures appear to be spatially associated with high-grade gold trends. A plan view and cross-section at Abore showing the deposit geology is provided in Figure 7-25 and Figure 7-26.
At least two (potentially three) phases of mineralization are recognized at Abore. Mineralization is constrained within the granite, with the overall trend of mineralization being parallel to that of the stratigraphy.
The dominant phase of mineralization is hosted in shallow west-dipping 1 cm to 10 cm thick quartz vein arrays which have developed primarily along the eastern margin of the granite contact and the sandstone-wacke dominated stratigraphy. Minor disseminated alteration is observed, despite the significant hydrothermal (sericite and arsenopyrite) alteration associated with the mineralized zones. Vein density, rather than vein thickness, seems to be indicative of higher-grade zones. Analysis of vein orientations showed that two vein types of shallow west-dipping and steep west-dipping occur.
Analysis of the grade control data shows discrete NNE zones of high-grade mineralization that have developed in the boudin necks of the granite bodies relating to early NNE trending structures. It is probable that these pre-dates the quartz vein-hosted mineralization, and is similar to that of Nkran, where shallow west-dipping vein arrays overprint steep, high-grade mineralization.
These same NNE bearing structures dextrally offset mineralization in at least three places along the deposit, which in part helps constrain proposed pit shapes (Figure 7-25 and Figure 7-27).

NI 43-101 Technical Report for the Asanko Gold Mine, Ashanti Region, Ghana
Effective Date: February 28, 2022
Page 69
Figure 7-25 Abore Plan View Showing Drill Hole Distribution and Pit Shells
Figure 7-26 Abore Cross-sectional View Through the Pit Showing Geology

NI 43-101 Technical Report for the Asanko Gold Mine, Ashanti Region, Ghana
Effective Date: February 28, 2022
Page 70
Figure 7-27 Abore Longitudinal-Section Through the Pit Showing Geology
7.4.5 Asuadai
The Asuadai deposit is located on the regional NE trending Nkran shear zone, approximately 10 km a long strike from Nkran. The prospect features a massive intermediate (tonalite) granitoid hosting a quartz stockwork system.
The main rock types observed within the Asuadai pits consist of thinly bedded carbonaceous shale, siltstone (phyllite), and more thickly bedded wacke and sandstone. Two narrow granitic intrusions (diorite dykes) intrude the metasedimentary sequence on the boundary between the two main sedimentary domains. Extensive shearing in places associated with silica flooding (and associated alteration), makes it difficult to determine the volcanic component of these rocks.
The general geology of the deposit may be broadly subdivided into two main sedimentary domains:
• NW sedimentary sequence comprising interbedded wacke and siltstone (with a minor shale component)
• SE sedimentary sequence consisting of interbedded sandstones and wacke lithologies, with a minor shale component. The sequence is separated by a granitic dyke intruding parallel to this main lithological boundary.
Bedding trends on a bearing of 40°, with local variations, along major structures of up to 00°.The stratigraphy at Asuadai has, like Nkran, been isoclinally folded and dips steeply (approximately 70°) to the west. The stratigraphy is locally imbricated and transposed along major structures which trend on a bearing of 00°.
As with Nkran, Asuadai is located on a 20° trending jog on a regional 35-40° trending structure and is characterized by phyllites dominant on the western margin and sandstone dominant on the eastern portion of the deposit. The granite forms the core of the deposit and is bounded by the two main sedimentary sequences.
Figure 7-28 illustrates the geology at Asuadai in plan view and cross-section.
The Asuadai deposit is characterized by preferential alteration of the sandstone and wacke (to a lesser extent) lithologies to a sericite-magnetite (±albite) assemblage. This alteration style appears to be distinctive to mineralization associated with the Nkran regional structural trend. Various stages of arsenopyrite and pyrite are observed, either disseminated throughout the core or as selvages to gold-bearing quartz veins. Arsenopyrite appears to be dominantly associated with the shallow SW dipping vein arrays, with significant disseminated alteration occurring within the granitic intrusion. Siltstone (and carbonaceous shale) lithologies are generally unaltered.

NI 43-101 Technical Report for the Asanko Gold Mine, Ashanti Region, Ghana
Effective Date: February 28, 2022
Page 71
Early ductile mineralization appears to be associated with silicification and minor pyrite. The extensive overprinting and later reactivation of these structures makes it difficult to establish a distinct alteration package.
The deposit is relatively complex with several controls of mineralization that influences the geometry of the mineralization. Two distinct styles of mineralization are recognized:
1. Steep ductile type mineralization associated with the metasedimentary lithologies: this style was selectively overprinted by a later brittle brecciation event. This mineralization parallels bedding, or foliation. Stereographic projections of vein arrays show a 020° to 040° orientation dipping steeply towards the west. The steep ductile mineralization is seen to bind the granitic intrusion. This mineralization is also associated with structures parallel to the main granitic intrusion.
2. Shallow dipping quartz veins: This is the dominant phase of gold mineralization at Asuadai and consists of veins that vary in thickness from 1 cm to 60 cm. The flat-lying vein arrays are best developed in the granite. The veins have associated sericite-albite-arsenopyrite-magnetite alteration.
Figure 7-28 Asuadai Plan View and Cross-section Through Pit Showing Geology

NI 43-101 Technical Report for the Asanko Gold Mine, Ashanti Region, Ghana
Effective Date: February 28, 2022
Page 72
7.4.6 Adubiaso
The Adubiaso geology comprises a sub-vertical stratigraphy of interbedded greywacke and phyllite, with three sub-vertical granite (porphyry) dykes obliquely cross-cutting the stratigraphy. A steep dipping (65° E) quartz vein system cuts across Birimian metasedimentary rocks, which dip steeply at 75° to the west. The vein system appears to be related to a NE fracture system (distinct from the Nkran structure) along the contact zone between dominantly phyllitic units on the east and coarser greywackes on the west, which host most of the gold-bearing veins. The central part of the vein system is 15 m to 20 m wide, but it tapers to about 10 m at both ends; the vein system has a strike length of about 700 m although the main area of economic significance is the central 300 m of the zone.
As at Nkran, narrow granitoids run generally parallel to the Adubiaso ore body in the pit area, but these are unmineralized. It is also noteworthy that the gold mineralization is restricted to the quartz veins and the metasedimentary host rocks are essentially barren, whereas at Nkran the gold values extend well into the host rocks.
The geology at the main Adubiaso deposit is illustrated in plan view and cross-section in Figure 7-29.
The Adubiaso Extension (or North) deposit is located to the NE of the main Adubiaso deposit, separated by the broad River Adubia drainage line. The deposit lies on the structure which hosts the Abore deposit known as the Abore shear.
The gold mineralization at Adubiaso occurs along the main NE to SW striking shear vein system in sub-vertically interbedded greywackes and phyllites intruded by later felsic intrusive units. Subtle jogs in the felsic intrusive units give rise to higher grade ore shoots. The ore body plunges shallowly to the NE at 20° parallel to the intersection of ENE dipping veins with the main strike direction.
Mineralization at Adubiaso is split into two phases:
1. Ductile, shear-hosted mineralization, within the NNE striking, steeply west-dipping Nkran Shear Corridor. This zone measures approximately 25 m in width in the central area, thinning to approximately 6 m at the northern and southern ends of the pit
2. Cross-cutting, NW to NNW striking, moderately east-dipping brittle quartz-carbonate vein hosted mineralization. This mineralization cross-cuts the shear zone and porphyry zones, and postdates the early phase of mineralization, are located in the hanging wall and footwall to the central mineralized zone. These structures appear to be spaced 35 m to 60 m vertically.
The deposit extends for some 1,000 m along strike and 180 m depth. The mineralized zones are typically 1 m to 4 m wide, but may occasionally reach up to 20 m. The gold mineralization occurs as free gold and is associated with the NE plunging quartz veins, along the intersection of the metasedimentary units and sheared porphyries.
The mineralized vein set strikes NNW to NNE and dips towards the east, cross-cuts the regional NE striking foliation, and is variably deformed near the shear zone.
A subtle jog in the strike of the porphyries and carbonaceous schist correlates with ore zone terminations. The ore shoots plunge shallowly to the north, parallel to the intersection of the ENE dipping veins with the sub-vertical north to south striking shear zone, and sub-parallel stretching lineation. The ore body occurs parallel to the strike inflection, which would be parallel to the north plunging stretching lineation.
The mineralization shows an overall north-south trend and a broadly anastomosing character. The undulations in the grade outlines are considered to correlate with interpreted NE to SW striking shears that appear to dextrally offset the lithology and mineralization to differing degrees. The overall movement is on a metre to tens of metre scale, with small offsets noted in the geological modelling.

NI 43-101 Technical Report for the Asanko Gold Mine, Ashanti Region, Ghana
Effective Date: February 28, 2022
Page 73
Figure 7-29 Adubiaso Plan View and Cross-section Through Pit Showing Geology

NI 43-101 Technical Report for the Asanko Gold Mine, Ashanti Region, Ghana
Effective Date: February 28, 2022
Page 74
7.4.7 Miradani North
The Miradani North deposit was mined between 1996 and 2016 by previous operators. The pit is 250 m long by about 120 m wide with a depth of about 60 m. Most of the oxide ore is depleted but the fresh rock remains untouched.
The deposit is located on the Datano Shear zone which is the first from the east of five major fertile shear zones across the Asankrangwa belt. This shear zone is known to traverse the Fromenda area to the south and Datano to the north where there are several active prospects for gold. The deposit is 8 km away from the Nkran processing plant and 3 km south of the Midras South prospect.
The geology of Miradani North deposit is akin to the Nkran deposit in several ways. It is located in a dilational jog at the triple junction of NNE-SSW trending regional structures and East-west (080) structures which are underlain by cryptic basement structures.
The stratigraphy is comprised of wackes and intermittent alternating units of sandstones, siltstones, and graphitic shales which are intruded by felsic porphyry. The intrusive unit is about 200 m long, plunges to the south and up to 100m wide at the middle where it was faulted and rotated by a sinistral movement causing shortening and thickening (see Figure 7-30).
The gold mineralization at Miradani North occurs as free gold in association with hydrothermal alteration of carbonate-sericite-arsenopyrite-chlorite-pyrite. The mineralization occurs in veins that at the sandstone /granitic porphyry contact or in the granite where the veins occur either as stockwork or spiderwebs of 1-3 cm long veinlets.
The overall mineralization is controlled by a westward dipping shoot that plunges to the north. The mineralization is controlled by the shape of the intrusive unit and has about 100 m thickness, 250 m strike length, and is continuous at depth with improved grade (see Figure 7-31).
Figure 7-30 Miradani North Plan View Through Pit Showing Geology

NI 43-101 Technical Report for the Asanko Gold Mine, Ashanti Region, Ghana
Effective Date: February 28, 2022
Page 75
Figure 7-31 Miradani North Plan View and Cross Section Through Pit Showing Geology
7.4.8 Dynamite Hill
The Dynamite Hill deposit is located on the Nkran shear trend about 7 km north of the Nkran pit and 4 km north of the Akwasiso pit where it offsets a regional north-south mafic dyke and a localized east-west cross-cutting structure. The area is underlain by fine to medium-grained greywackes (intermittent strong alterations) intercalated with argillites (phyllites), and intrusions of altered felsic rock (feldspar quartz porphyry/granitoid), quartz veins, and stockworks. The initial depth of oxidation was between 20 to 50 m below the surface on rugged terrain but a portion of the oxidized rock has been mined out. The deposit was mined in 2018 from an RL of about 330 m to 180 m.
Foliations are mostly parallel to beddings following NE-SW trends and sub-vertically dipping, biased towards the north-west. Local signatures indicate folding of the units with the mineralization localized along the axis of a recumbent fold which is intruded by the feldspar-quartz porphyry plunging steeply to the north. Figure 7-32 and Figure 7-33 are plans and sectional views respectively of the Dynamite Hill deposit showing the US$1300/oz Au and US$1600/oz Au pit shells as well as the mineralized zones and the felsic porphyry intrusion.
Gold mineralization at Dynamite Hill is mostly associated with quartz stockwork hosted within the northwest trending, steeply dipping orebody of strongly altered (chloritic, sericitic, and silicified) wackes, and at the contact between felsic units and foliated meta-sedimentary rocks. Sulphide mineralization, mostly pyrites grading from fine to coarse crystals are present. The defined gold mineralized zone is about 40-50 m in true width and strikes NNE-SSW traced to a depth of about 250 m and still open. The mineralization plunges steeply to the north. Recent drilling does not support continuity to the north, but the mineralization is open to the south but trending progressively weaker. The mined-out area covers a strike length of 250-300 m but mineralization can be traced for 600 m along strike.
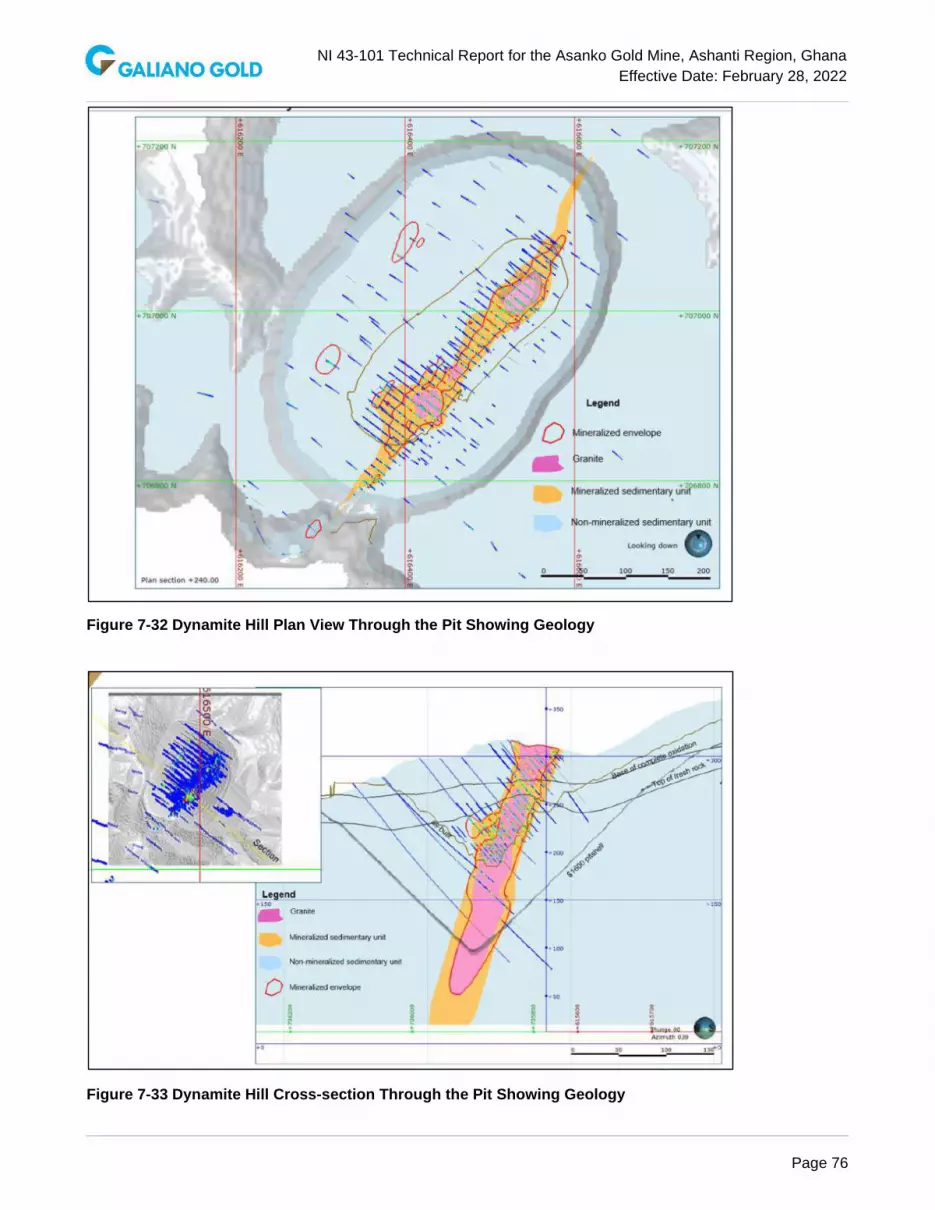
NI 43-101 Technical Report for the Asanko Gold Mine, Ashanti Region, Ghana
Effective Date: February 28, 2022
Page 76
Figure 7-32 Dynamite Hill Plan View Through the Pit Showing Geology
Figure 7-33 Dynamite Hill Cross-section Through the Pit Showing Geology

NI 43-101 Technical Report for the Asanko Gold Mine, Ashanti Region, Ghana
Effective Date: February 28, 2022
Page 77
8 DEPOSIT TYPES
Two broad styles of gold deposits are present in southwest Ghana:
• Structurally controlled lode or orogenic gold deposits
• Paleoplacer disseminated gold deposits in Tarkwaian conglomerates.
The primary controls on mineralization in the Asankrangwa Belt are structural in origin. Certain sandstone units within the Birimian metasedimentary package provided favourable rheological conditions that optimized gold deposition often close to major lithological contacts with either Birimian metavolcanic rocks, or Tarkwaian metasedimentary rocks (Griffis et al, 2002). The deposit type targeted by the AGM is this structurally controlled mesothermal quartz vein style mineralization (orogenic gold type deposits). This is the most important type of gold occurrence in West Africa and is commonly referred to as the Ashanti-type. Milesi et al. (1992) recognized that mesothermal quartz vein style deposits are largely confined to tectonic corridors that are often over 50 km long and up to several kilometres wide and usually display complex, multi-phase structural features, which control the mineralization.
There are at least two separate gold mineralising events that are linked to the structural evolution of the area. Mineralization is linked to:
• Early isoclinal folding, shearing and/or duplexing of stratigraphy controlling the location of deformation zones and fluid flow
• A late approximate east-west compressional event that generated shallow dipping to flat orientated conjugate vein sets that crosscut the earlier rock fabric and gold mineralization.
This brittle style deformation postdates the emplacement of granitic intrusive units into the core of the existing deformed and sheared sedimentary rocks. Orogenic gold deposits formed between 2.2 and 2.0 Ga, intrusion-related (and skarn) between 2.2 and 2.1 Ga, and paleoplacer types between 2.06 and 1.8 Ga.
Gold mineralization is associated with major NE striking, 5 m to 40 m wide graphite-chlorite-sericite bearing fault zones. In particular, gold mineralization is developed where the NE fault zones intersect major ENE striking fault zones, and especially where they are recognized to have influenced granite emplacement, alteration and gold geochemical trends.
Left stepping flexures (10 km to 30 km scale) in the NE striking fault zones (which produce more northerly striking fault sections), are important for the localization of gold mineralization. Other local complexities in stratigraphy and fault geometry, associated with major NE striking faults, are also important for example, folds in stratigraphy that may produce saddle reef style mineralization, or fault duplexes.
The most common host rock is usually fine-grained metasedimentary units, often in close proximity to graphitic, siliceous, or manganiferous chemical sediments. However, in some areas, mafic volcanic rocks and belt intrusions are also known to host significant gold occurrences. Refractory type deposits feature early-stage disseminated sulphides in which pyrite and arsenopyrite host important amounts of gold overprinted by extensive late stage quartz veining in which visible gold is fairly common and accessory polymetallic sulphides are frequently observed. This type includes important lode/vein deposits in Ghana such as at the Obotan and Esaase area. A second non-refractory style of gold mineralization occurs in which gold is not hosted within sulphide minerals either in early, or late stage mineralization. These deposit types have lower sulphide content in general and often lack the needle-like arsenopyrite that is common in the refractory type deposits.
The Asanko Gold deposits demonstrate a late (second) phase of gold mineralization hosted in granitoids (Nkran basin type granite), emplaced in regional shear corridors. The deposits are situated within the Birimian metasedimentary units, but the granitoid intrusions and mineralization both occur at contacts between greywacke and carbonaceous phyllite units. The deposits are dominated by D2 regional reverse faulting gold, and only contain quartz vein-hosted free-milling gold lodes.
The deposit types in the AGM area are sufficiently well understood to support the exploration programs and geological models forming the basis of the Mineral Resource estimates.

NI 43-101 Technical Report for the Asanko Gold Mine, Ashanti Region, Ghana
Effective Date: February 28, 2022
Page 78
9 EXPLORATION
9.1 Introduction
Systematic exploration at the Asanko Gold Mine concessions include regional generative and near mine programs, targeting new gold deposits as well as further delineation of Mineral Resources. Regional prospecting work was initiated in 2014 in collaboration with Corporate Geoscience Group (CGSG), and advanced drilling programs undertaken thereafter from early 2015. Follow-up to this work since 2017 includes:
• Reconnaissance mapping and sampling in of areas of exposure
• 3,000-line kilometre heli-borne versatile time-domain electromagnetic surveying (VTEM) survey infilling previous gaps in coverage
• Updated regional geological interpretation based on the interpretation of the VTEM survey
• Gradient array electrical geophysics survey over Esaase
• Discovery and drilling of the Miradani North deposit
• RC, RCD and DDH drilling to Indicated Mineral Resource classification on the Miradani North and Abore targets
• Resource expansion of the Dynamite Hill and Abore deposits through exploration drilling
Work completed under Galiano ownership (refers to post 2007 for Esaase concession, and post 2014 for all other concessions) is described in the following sections.
9.2 Grids and Surveys
All survey grid location information is in WGS 84, Zone 30N Universal Transverse Mercator (UTM) coordinates.
9.3 Geological Mapping
The broad framework of geological understanding on the AGM licences comes from geophysical interpretations completed in 2016 (Figure 9-1). This work has been built on through geological mapping as well as drilling and exposures at the various open pits. Geological mapping on the Asankrangwa Belt is hampered by a paucity of exposed basement rock, with deep weathering and laterite/alluvial cover making it more challenging. Often it is exposures created by artisanal mining workings that provides the most informative outcrop.
Field mapping has been undertaken at the target properties by AGGL geologists. Outcrop and visible features have been mapped and locations identified using handheld GPS. A targeted license-wide program of mapping and sampling was conducted in 2021, focusing on mineralized areas exposed by artisanal miners. This work was beneficial in understanding structural controls on mineralization and targeting of several prospective areas for follow-up reconnaissance-style RC drilling.
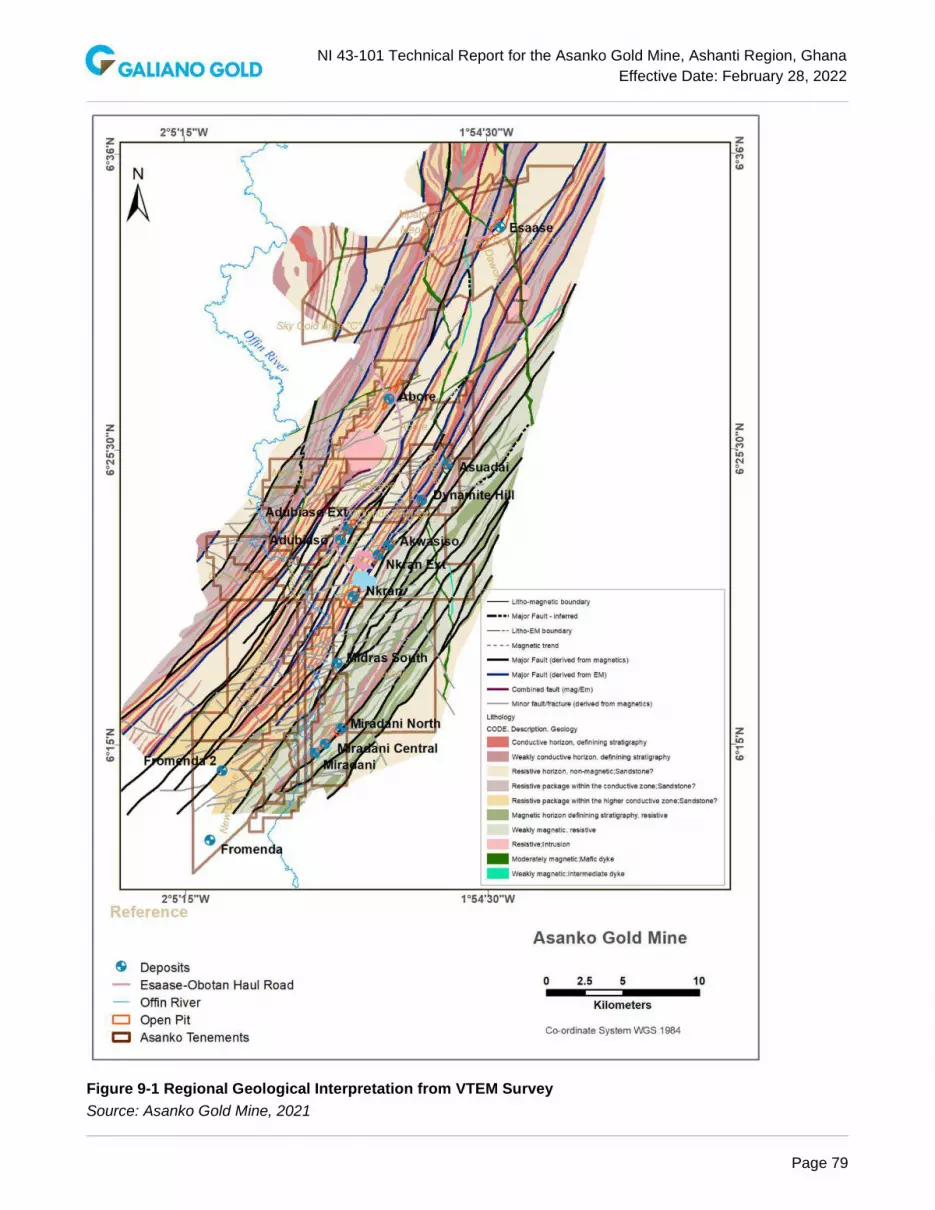
NI 43-101 Technical Report for the Asanko Gold Mine, Ashanti Region, Ghana
Effective Date: February 28, 2022
Page 79
Figure 9-1 Regional Geological Interpretation from VTEM Survey
Source: Asanko Gold Mine, 2021

NI 43-101 Technical Report for the Asanko Gold Mine, Ashanti Region, Ghana
Effective Date: February 28, 2022
Page 80
9.4 Geochemical Sampling
9.4.1 Soil Geochemical Sampling
Multiple soil geochemical surveys have been undertaken on the AGM licences by various explorers. Since 2017, a total of 1,246 surface geochemical samples (grab, soil, stream sediment) have been taken by AGGL geologists across the greater AGM licences with the focus on generation of greenfield targets. Sample media and year of sampling is detailed in Table 9-1 below.
Table 9-1 Summary of Surface Samples Taken by AGM Since 2017
Year Channel Grab Soil Total
2017 86 740 826
2018 2 11 13
2019 37 37
2021 31 331 8 370
Total 33 465 748 1,246
Sampling points are generated using MicromineTM or ArcGISTM software and downloaded into a handheld GPS. The sampling points are pegged out in the field. Soil geochemical sampling is not conducted in formal settlements, roads, cemeteries and other culturally sensitive areas.
The sampling grid or sampling spacing may vary from one place to another and is determined by factors that control mineralization and the level of information required. Sampling programs are typically undertaken on 400 m x 50 m spacing, and the sampling line’s azimuth is determined by the orientation of the structure suspected to be associated with mineralization. In some cases, the sample spacing is reduced to 200 m x 25 m or 100 m x 25 m if broad spaced sampling suggests the need for tighter data density. The depth at which geochemical samples are collected is between 20-50 cm or more precisely on the B-horizon.
Sample sites are located with GPS receiver and entered into database/GIS platform. During sampling, organic material is avoided. The soil fraction is sampled and analysed (generally either bulk soil or a particular size fraction). The regolith landform setting is recorded and range in clast size is estimated. The proportion of transported and in situ lag (based on degree of clast rounding, size of clasts, composition of clasts) is estimated. Lag is swept up with plastic dustpan and brush over about a 5 m diameter area. A sample of approximately 2.5 kg is sufficient. Coarse pebbles and organic material (greater than 1 or 2 cm) are sieved and picked out on a plastic sheet. Figure 9-2 and Figure 9-3 illustrate on a regional level the location of the sampling points.

NI 43-101 Technical Report for the Asanko Gold Mine, Ashanti Region, Ghana
Effective Date: February 28, 2022
Page 81
Figure 9-2 Plan Showing Gold-in-Soil Anomalies
Source: Asanko Gold Mine, 2021

NI 43-101 Technical Report for the Asanko Gold Mine, Ashanti Region, Ghana
Effective Date: February 28, 2022
Page 82
Figure 9-3 Surface Geochemistry Sampling Locations (2017 to 2021)
Source: Asanko Gold Mine, 2021

NI 43-101 Technical Report for the Asanko Gold Mine, Ashanti Region, Ghana
Effective Date: February 28, 2022
Page 83
9.4.2 Trenching
Given the terrane’s deep weathering and generally poor exposure, trenching is often the first tool used to assist with mapping areas of mineralization to collect quality geological information or reliable geochemical samples at surface. This information is not used in Mineral Resource estimation, but rather as a guide to drill targeting.
Trenching is undertaken when deemed appropriate to get preliminary information as to the width and structural features of possible exploration targets. In general topsoil horizons are too thick to use this method extensively.
Planned and approved programs are sited with a GPS by a geologist or technician, and after end points of proposed trenches have been clearly marked, must be ground-truthed by a geologist. The trenches are surveyed by the mine surveyor after or during the course of geological mapping and sampling of the trench. The trenches are excavated by excavator or manual labour. All open trenches are barricaded with caution or flagging tapes.
The saprolite exposure and regolith profile in the trench are mapped and the thicknesses measured with reference to the profile line. Rock type, lithological boundaries, structural measurements, visible mineralization, sample intervals and assay are recorded directly to DataShedTM using in a field computer or on a field data collection sample sheet and later entered into DataShedTM.
Trench sampling is carried out by even chipping of the sample using a geological hammer or chisel along the sidewalls of the trench with a collecting cut PVC pipe. The sample is homogenized by rolling it once or twice in a canvas tarpaulin before collecting a split for assay. 2.5 kg of the homogenized sample is collected. The samples are placed in a clean labelled sample bag with the sample number and sample ticket number folded and stapled into a fold at the top of the bag. At the core yard, the labelled samples are sorted and re-checked.
QAQC samples are inserted as per the QAQC protocol (1-3% of total samples for blanks and field duplicates, and 1-7% for standards, or 2 to 2.5 per 20 samples). The samples are then placed in a big white bag and labelled with the project name, sample interval for each big white bag and the number of samples in it. The sample sequence numbers must be written on the big sample bags. Once samples have been bagged, they are ready for dispatch and are not reopened until they reach the laboratory. The analytical request sheet (sample submission sheet) is completed, signed and dated by the project geologist prior to dispatch. The project geologist keeps copies of the analytical request form. An Asanko Gold item removal form is completed by the project geologist and approved by the head of department (HOD) and the security manager before samples are allowed to be sent out of site.
Sampled intervals in the trench are photographed. The hole ID, sample interval and sample ID are written clearly on a white board and displayed within the sample interval before photographing. An example of a graphical trench map from the recent Jeni River trench program is shown in Figure 9-4 below. After data collection, all trenches are backfilled to allow vegetation regeneration.

NI 43-101 Technical Report for the Asanko Gold Mine, Ashanti Region, Ghana
Effective Date: February 28, 2022
Page 84
Figure 9-4 Trench Map from Trench JGTR21-001, Jeni River Prospect
9.5 Geophysical Surveys
Geophysical surveys over the property have included regional aeromagnetic imaging of the Ashanti Belt and adjacent Kumasi Basin by the Ghana Geological Survey, as well as IP ground geophysical surveying and airborne VTEM and magnetic survey centred over specific targets.
Airborne geophysical surveys were commissioned by AGGL during 2015/2016 to advance the understanding of the geological and structural settings of the Asankrangwa Belt. A map of regional VTEM over the AGM license package is shown in Figure 9-5. The regional magnetic and VTEM data for the Ashanti Belt and adjacent Kumasi Basin provide a good indication of the distribution of the principal geological units occurring in the region as well as on the property.

NI 43-101 Technical Report for the Asanko Gold Mine, Ashanti Region, Ghana
Effective Date: February 28, 2022
Page 85
Figure 9-5 Map of Time-Domain EM Over the AGM License Package
Source: Asanko Gold Mine, 2021

NI 43-101 Technical Report for the Asanko Gold Mine, Ashanti Region, Ghana
Effective Date: February 28, 2022
Page 86
A ground geophysics orientation study was initiated over the Esaase deposit in 2019 by Planetary Geophysics based in Australia. The orientation survey focused on four surveys that are known to produce useful results for the direct detection of orogenic gold deposits. Surveys completed over the Esaase deposit are as follows:
• Gradient array IP
• Pole-dipole resistivity
• HaiTEM MLEM (electromagnetic)
• Gravity.
Eleven Gradient Array blocks and six 2D Pole-dipole lines were read over the Esaase project for a total of 6,700-line metres. The Gradient Array IP survey data was particularly successful and appears to map what is interpreted to be sulphide content at depth (Figure 9-6).
Figure 9-6 Gradient Array Survey Over the Esaase Deposit
Source: Planetary Geophysics, 2020 (units of measure, milli-seconds or ‘ms’)

NI 43-101 Technical Report for the Asanko Gold Mine, Ashanti Region, Ghana
Effective Date: February 28, 2022
Page 87
This work was planned as a ‘proof of concept’ orientation survey, with the intention of completing a series of much larger gradient array and IP surveys within the Asanko license package. However, the global pandemic in 2020-2021 delayed commencement of this activity. Given the success of this Esaase survey, geophysical coverage of this type has a high likelihood of identifying other zones of high chargeability that may be a proxy for gold mineralization.
9.6 Exploration Potential
Considerable potential exists for the discovery of additional gold resources on the AGM licenses, near existing operations as well as regionally.
9.6.1 Nkran Deeps
Underground mining scenarios have long been considered at Nkran. Resolute Mining included a modest underground resource (Spiers, 2010), and AGM have reviewed the idea of underground mining at Nkran, at a conceptual level. Following completion of Cut 2 however, it was believed that insufficient resources remained at Nkran to support an underground operation. Additional deep drilling is recommended to explore for significant down dip and down plunge mineralization at Nkran.
A number of possible high grade shoot controls have been interpreted at Nkran, all plunging shallow to steeply northeast (Figure 9-7). These high-grade structures, if repeated at depth, could represent a significant step change for the AGM resource potential. Deep drilling to explore for these structures is recommended.
Figure 9-7 Longitudinal Section Through the Nkran Deposit Showing Multiple Shoot Trends That Hold Potential for Additional Resources
Source: Asanko Gold Mine, 2021

NI 43-101 Technical Report for the Asanko Gold Mine, Ashanti Region, Ghana
Effective Date: February 28, 2022
Page 88
9.6.2 Miradani Deeps
The Miradani North deposit shows many similarities to Nkran, including a tonalite intrusive association and the existence of high-grade shoots. A well-defined steeply northeast plunging shoot is evident in longitudinal section through the deposit, as seen in Figure 9-8 below. This high grade +80 gm.m shoot remains open at depth and further drilling should be considered to explore for extensions and repetitions to this high grade.
Figure 9-8 Longitudinal Section Through the Miradani North Deposit
Source: Asanko Gold Mine, 2021
9.6.3 Kaniago West
The Kaniago West prospect is located on exploration lease PL6/289 and is 5 km NW of the AGM processing plant. It was acquired as part of the Midlands Mineral Corporation property transaction in 2015. Midlands conducted an aggressive drilling campaign between 2011 to 2012, delineating gold mineralization over a 500 m strike length and a depth of 150 m, open in all directions. AGM followed up this work in 2021, intersecting broad zones of quartz breccia and veining with associated visible gold mineralization. Follow-up drilling is recommended for this prospect.
9.6.4 Midras South
Midras South is located on the Datano Mining Lease, 5 km south of the AGM's processing plant. The drill program at Midras South was designed to expand on the known mineralized systems in the area, and although only partially completed due to access issues, did provide some of the better high grade intercepts this year to date.

NI 43-101 Technical Report for the Asanko Gold Mine, Ashanti Region, Ghana
Effective Date: February 28, 2022
Page 89
The Midras South prospect lies along the Takorase - Afraso shear zone, a laterally extensive structure recognized from airborne VTEM and magnetic surveys and extensively mapped on the ground. Midras South consists of 3 distinct zones of indicated mineralization, inferred to be fault offsets of the one mineralized zone.
Similar in character to Esaase and Kaniago West, indicated mineralization at Midras South is developed within a package of deformed sandstone, siltstone and phyllite. Stratigraphy and structure are both steeply dipping to the northwest as they do for most of the Asankrangwa Belt gold deposits. Indicated gold mineralization at Midras South occurs in association with quartz veining, arsenopyrite and pyrite, within a broader envelope of quartz-sericite-pyrite and carbonate alteration.
9.6.5 Amoaman
AGM acquired the Aburi lease in early 2020, known at that time as the Hawannah Mining Concession. The name was recently changed from Aburi to Amoaman to reflect the nearest community.
Figure 9-9 Interpreted Geology and Mineralized Trends on the Amoaman Property
Source: Asanko Gold Mine, 2021

NI 43-101 Technical Report for the Asanko Gold Mine, Ashanti Region, Ghana
Effective Date: February 28, 2022
Page 90
Previous explorers Romex conducted exploration including a VTEM survey which included acquisition of a DTM, radiometrics, aeromagnetics and electromagnetic (resistivity). Romex also completed geochemical surveys including stream sediment sampling, rock chip sampling, and soil sampling. This work assisted in defining three mineralized trends, referred to as Mpeasem, Aburi and Asamang (SEMS, 2013). A phase of trenching to test various soil anomalies, and follow-up preliminary drilling was conducted with a focus on these three prospective trends. 43 diamond holes were drilled for 6,930 m, and 61 RC holes for 3,840 m. Continued exploration is recommended for this prospect.
9.6.6 Other Prospects
A number of poorly tested prospective trends recognized during earlier prospectivity analysis were followed up by AGM with mapping and sampling, and in some cases trenching in 2021. These include the Gyagatreso-Kaniago-Abore trend, the Greater Midras-Nkran-Takorase trend, the Datano-Fawotrikye trend and the Abore-Jeni River-Esaase trend. These areas were highlighted due a combination of coincident structural and soil geochemical anomalies, and in some cases topographic highs and may relate to zones of veining and silicification associated with mineralized systems. Follow-up exploration is recommended for these prospects.
Figure 9-10 Mineralized Trends on the AGM License Package Recommended to Follow-up
Source: Asanko Gold Mine, 2021

NI 43-101 Technical Report for the Asanko Gold Mine, Ashanti Region, Ghana
Effective Date: February 28, 2022
Page 91
10 DRILLING
Asanko Gold have integrated historical databases with more recent and ongoing drilling programs. Drilling completed under AGGL ownership is described in this section. Unless specified otherwise, all diagrams in this section are sourced from Asanko Gold Mine 2021.
10.1 Type and Extent of Drilling
Surface drilling at AGM included RC, DDH and RCD drilling. Drilling for Mineral Resource delineation focused on Nkran, Esaase, Miradani North, Dynamite Hill and Abore, although extensive drilling has also been undertaken at Akwasiso and Adubiaso. An overview of the historical drilling per deposit is provided in Section 6. Representative plans and sections of each deposit can be found in Chapter 7 and Chapter 14 of this Report.
To date, a combined total of 4,773 evaluation aircore (AC), DD, RC and RCD drill holes totalling 652,425 m have been drilled at the AGM deposits that are the subject of this Report, as well as additional grade control and other drill holes. Mineral Resource definition drilling at AGM mainly includes RC and DDH drilling. A summary of the drilling completed at each deposit that is the subject of this Report, on a yearly basis, is provided in Table 10-1. The table only reflects AC, DDH, RC and RCD drilling. Additional drilling work such as auger and airblast has been completed but is not used in the Mineral Resource estimation.
Table 10-1 Drilling Summary by Deposit (to February 28, 2022)
Prospect Year No. of Holes
Number Of Metres Drilled
AC DDH RC RCD Total
Aboabo 2010 58 5,522 3,354 8,876
2011 19 490 242 3,918 4,650
Abore
2010 30 4,887 4,887
2011 24 4,550 4,550
2020 33 1,069 4,785 5,854
2021 42 429 4,376 1,082 5,887
Abore North
2000 420 1,225 31,594 32,819
2010 2 408 408
2011 2 353 353
Adubiaso
1996 49 5,958 5,958
1997 8 876 876
1998 11 1,745 1,745
2000 173 636 13,114 590 14,339
2009 4 614 614
2010 9 1,441 1,441
2011 35 7,636 7,636
2013 14 1,359 1,359
2016 35 3,460 3,460
2020 5 162 1,150 1,312
Akwasiso
1996 1 250 250
1997 18 1,278 1,098 2,376
1998 56 825 2,372 3,197
2000 102 2,736 6,019 8,755
2016 51 5,829 1,742 1,558 9,129

NI 43-101 Technical Report for the Asanko Gold Mine, Ashanti Region, Ghana
Effective Date: February 28, 2022
Page 92
Prospect Year No. of Holes
Number Of Metres Drilled
AC DDH RC RCD Total
2017 91 315 4,604 4,326 9,245
2020 36 643 2,516 3,698 6,857
2021 4 330 330
Akwasiso South 2018 65 4,946 225 5,171
Asuadai
2000 88 329 5,551 5,880
2010 15 1,740 1,740
2011 45 6,064 6,064
2012 3 653 653
Esaase B Zone
2007 16 301 3,023 3,324
2008 17 1,728 1,630 3,358
2011 73 608 7,265 3,660 11,533
Esaase B1 Zone
2007 8 1,010 265 1,275
2009 2 581 581
2010 1 156 156
Esaase C Zone
2007 5 651 651
2010 6 897 897
2011 2 177 177
Esaase D Zone
2007 1 232 232
2008 35 3,035 1,845 4,880
2010 3 150 636 786
2011 17 360 3,878 4,238
Dawahodo 2011 91 11,465 11,465
2012 13 1,488 1,223 2,711
Dynamite
2013 90 408 10,446 249 11,103
2014 42 2,094 4,611 6,705
2016 56 5,176 5,176
2021 30 1,470 4,640 6,110
Esaase E Zone
2008 2 251 251
2009 3 351 351
2011 12 1,303 802 2,105
Esaase
2020 32 1,370 3,370 1,373 6,113
2021 18 1,184 3,027 4,211
2022 2 299 299
Esaase Main Zone NE
2007 2 507 507
2008 28 3,161 642 3,803
2009 87 11,041 2,082 13,123
2010 61 7,787 177 7,964
2011 35 440 2,152 2,592
Esaase Main Zone North
2006 14 4,084 4,084
2007 165 1,464 20,813 14,095 36,373
2008 175 833 23,517 13,625 37,975
2009 24 1,627 891 4,413 6,931

NI 43-101 Technical Report for the Asanko Gold Mine, Ashanti Region, Ghana
Effective Date: February 28, 2022
Page 93
Prospect Year No. of Holes
Number Of Metres Drilled
AC DDH RC RCD Total
2010 89 6,652 1,494 17,490 25,637
2011 78 3,358 5,285 14,169 22,813
2013 6 1,323 1,323
2018 82 4,872 4,872
Esaase Main Zone South
2007 60 382 9,831 1,270 11,483
2008 41 225 3,795 6,199 10,218
2009 2 412 412
2010 25 1,111 764 3,230 5,105
2011 31 32 2,513 2,250 4,795
2013 1 100 100
2018 27 2,378 2,378
Miradani North
2019 12 3,380 3,380
2020 46 6,273 198 3,709 10,180
2021 42 5,209 2,794 1,057 9,060
2022 2 351 351
Nkran
1995 57 4,306 985 1,286 6,577
1997 59 100 3,435 1,325 4,860
1998 2 190 190
1999 1 100 100
2000 611 32,377 20,500 3,001 55,878
2010 22 9,550 9,550
2011 79 34,147 944 35,091
2012 443 20,677 546 800 1,976 24,000
2017 11 1,700 2,237 3,937
2020 72 2,693 7,205 1,143 11,041
2022 19 8,313 8,313
Nkran Extension
1998 4 370 370
2000 19 1,591 1,591
2013 10 1,002 1,002
2014 18 1,786 1,786
2016 38 3,032 3,032
2017 24 257 930 702 1,890
Nkran NE 2015 4 368 368
2016 4 352 352
Sky Gold 2011 16 1,687 1,687
Total 4,773 20,677 178,671 304,289 148,788 652,425
Note: AC – Aircore; DDH – Diamond drill hole; RC – Reverse circulation; RCD – Reverse circulation with diamond tail. The following drilling is excluded from the above – Auger (AG), Rotary Air Blast (AB). Esaase B, B1, C, D & E zones do not form part of the declared Esaase Mineral Resources.
A property wide drill plan is shown in Figure 10-1.

NI 43-101 Technical Report for the Asanko Gold Mine, Ashanti Region, Ghana
Effective Date: February 28, 2022
Page 94
Figure 10-1 Distribution of Drilling and Trenching Across the AGM License Package, on Interpreted Geology

NI 43-101 Technical Report for the Asanko Gold Mine, Ashanti Region, Ghana
Effective Date: February 28, 2022
Page 95
Plans showing the location of drill collars and drilling type per AGM deposits are provided in Figure 10-2 to Figure 10-9.
Figure 10-2 Plan Showing Distribution of Drill Hole Collars at Nkran Pit
Note: Areas in grey denote galamsey/artisanal mining disturbance areas
Figure 10-3 Plan Showing Distribution of Drill Hole Collars at Esaase
Note: Areas in grey denote galamsey/artisanal mining disturbance areas

NI 43-101 Technical Report for the Asanko Gold Mine, Ashanti Region, Ghana
Effective Date: February 28, 2022
Page 96
Figure 10-4 Plan Showing Distribution of Drill Hole Collars at Akwasiso and Nkran Extension
Note: Areas in grey denote galamsey/artisanal mining disturbance areas
Figure 10-5 Plan Showing Distribution of Drill Hole Collars at Abore
Note: Areas in grey denote galamsey/artisanal mining disturbance areas

NI 43-101 Technical Report for the Asanko Gold Mine, Ashanti Region, Ghana
Effective Date: February 28, 2022
Page 97
Figure 10-6 Plan Showing Distribution of Drill Hole Collars at Asuadai
Note: Areas in grey denote galamsey/artisanal mining disturbance areas
Figure 10-7 Plan Showing Distribution of Drill Hole Collars at Dynamite Hill
Note: Areas in grey denote galamsey/artisanal mining disturbance areas

NI 43-101 Technical Report for the Asanko Gold Mine, Ashanti Region, Ghana
Effective Date: February 28, 2022
Page 98
Figure 10-8 Plan Showing Distribution of Drill Hole Collars at Adubiaso and Adubiaso Extension
Note: Areas in grey denote galamsey/artisanal mining disturbance areas
Figure 10-9 Plan Showing Distribution of Drill Hole Collars at Miradani North

NI 43-101 Technical Report for the Asanko Gold Mine, Ashanti Region, Ghana
Effective Date: February 28, 2022
Page 99
Nkran has been drilled formally from the early 1990s prior to mine establishment and has since undergone numerous RC and DDH drilling and infill drilling programs to define and refine the resource model, as well as relogging of available core materials. Of note, a large proportion of (if not all) Nkran drilled by previous explorers has been mined out.
Drilling at Esaase by Keegan (precursor to Asanko/Galiano) from 2006 to 2012 focused mainly on the NE-striking, main gold bearing structures. An oxide RC infill drilling program was completed in May to June 2018 targeting the two-year oxide pit and drilled a staggered 40 m x 40 m infill pattern to increase the confidence in the mineralization within the upper portion of the deposit. Overall, the drill holes averaged approximately 60 m in depth and were spread along the length of the proposed two-year oxide pit. In addition to this program, 21,000 m of historical diamond drill core was re-logged from a selection of 83 holes covering the full strike of the Esaase Main deposit. A further 6,950 m was re-logged from 38 diamond drill holes covering the Esaase South deposit. In total, approximately 10% of core has been relogged for the purposes of refining the geological model at Esaase. An additional 11,809 m of infill drilling was completed during 2020-2021 to increase confidence and assist with the geological model development.
Resolute originally tested the Akwasiso oxide material in 2001 by RC and DD drilling. After acquiring Akwasiso, Asanko Gold completed further RC and DD drilling, including a second phase of RC and RCD drilling to upgrade the confidence of the Inferred Mineral Resources. Akwasiso was suspended as an operating pit in December 2018, and additional infill RC drilling was undertaken to define the continuation of mineralization below the current pit. Operations recommenced at Akwasiso in 2020. In 2020 to 2021 a program of 7,187 m combined RC and DD drilling was completed to upgrade the resource category and better define granitoid limits.
The Abore and Asuadai project database comprises historical drill hole data from Resolute and PMI. Between 2019 and 2021, AGM drilled an additional 11,311 m from 72 holes at Abore to extend the known resource at depth and along strike to the north. This data is used to upgrade the Abore Mineral Resource.
AGM continued testing the Adubiaso target during 2016 with a RC drilling program successfully identifying over 500 m of strike of additional multiple thin mineralized zones, which have subsequently been infill drilled. During 2016 AGM also conducted RC exploration and RC infill drilling on the NE extension of the Adubiaso pit mineralization. Minor infill drilling was completed at Adubiaso in 2020, for 1,312 m drilled.
Drill traverses for all deposits are generally aligned perpendicular to the local NE-SW mineralized trends. The drill hole spacing varies between the deposits, ranging from 10 m to 20 m across strike to 20 m to 50 m along strike (to define near surface projections of mineralization).
RC, DDH and RCD are the common drilling methods. Shallow drill holes targeting oxidized material and shallow fresh material generally use RC drilling.
The drilling density is considered appropriate to define the geometry and extent of the mineralization for the purpose of estimating Mineral Resources, given the understanding of the local geology, structure and confining formations. AGM’s strategy is to conduct drilling sufficient to assume geology and grade continuity to a level to support at least Indicated Mineral Resources and thus support the application of modifying factors in sufficient detail to support mine planning and evaluation of economic viability. Section 14 of this Report summarizes the drill hole data used in the estimation of Mineral Resources. Where concerns over legacy drilling (pre 2014) have been raised and the concerns verified, ensuing drill data has been excluded from use in Mineral Resource estimates. Legacy logging practices (PMI) have been well covered in Spiers (2010) and SRK (2011) and geological information related to these were verified by comparison with nearby AGM drilling where possible. This data has been further validated during generation of drill sections and geological interpretations, where any inconsistencies in geological logs, collar locations and downhole surveys were identified.
RC grade control (GC) drilling is conducted at the Nkran, Esaase, Akwasiso and Adubiaso pits. A summary of the drilling completed by Asanko Gold from 2014 to December 2021 is shown in Table 10-2.

NI 43-101 Technical Report for the Asanko Gold Mine, Ashanti Region, Ghana
Effective Date: February 28, 2022
Page 100
Table 10-2 Grade Control Drilling Summary by Deposit (2014 to 2021)
Pit No. of Holes RC Metres Drilled
Adubiaso 323 11,877
Akwasiso 4320 98,400
Dynamite Hill 854 28,242
Esaase Main 25,686 629,056
Nkran Extension 470 11,028
Nkran 11,550 358,438
Total 43,203 1,137,041
In addition to this, grade control sampling has occurred as summarized in Table 10-3.
Table 10-3 Grade Control Sample Summary by Deposit Since 2014
Pit COMP_RC FC Grab RC RPL Total
Akwasiso 63,282 766 64,048
Dynamite Hill 19,028 33 19,061
Esaase Main 487,234 487,234
Nkran Extension 6,809 6,809
Nkran 50,186 23 54 170,117 136 220,516
Total 50,186 23 54 727,442 902 797,668
Note: RPL – Ripline; FC – Face channel; RC – Reverse circulation
Since 2014, Asanko Gold has taken a total of 38,469 channel, pulp, DDH and RC samples across the Adubiaso, Akwasiso, Esaase and Nkran deposits, as shown in Table 10-4. These samples are not used in Mineral Resource estimation.
Table 10-4 Drill Hole Sample Summary by Deposit for the Period of 2014 to 2021
Prospect CHANNEL CHIPS DDH PULP RC TOTAL
Abore 2,859 7,902 10,761
Adubiaso 571 3,826 4,397
Akwasiso 10,818 11,864 22,682
Dynamite 2,217 9,290 11,507
Esaase 119 2,057 9,072 11,248
Esaase Main Zone North 960 3,871 4,831
Esaase Main Zone South 2,325 2,325
Miradani North 12,983 5,611 18,594
Nkran 9 3,724 7,330 11,063
Total 9 119 35,229 960 61,091 97,408
Note: DDH – Diamond drill hole; RC – Reverse circulation.
10.2 Drill Logging Procedures
Geological information gained through the efforts of legacy operators (such as PMI and Resolute) was first validated by check logging and comparison with nearby AGM logged holes before integration into the current database. Logging procedures by PMI are well covered by Spiers (2010) and SRK (2011). The QP has also reviewed this information and considers it of an appropriate industry standard.
Since 2014, logging records include the prospect name, hole ID, person logging, date of logging, depth from/to:
• Lithology
NI 43-101 Technical Report for the Asanko Gold Mine, Ashanti Region, Ghana
Effective Date: February 28, 2022
Page 101
o Lithological unit
o Regolith domain
o Stratigraphic domain.
• Alteration
o Alteration intensity
o Alteration mineral
o Sulphide intensity and type.
• Structure
o Structure type
o Younging (if visible for beds)
o Alpha (dip of structure)
o Beta (strike of structure)
o Structure style
o Lode name (if known).
• Structure zones
• Veining
• Veining density.
All logging data is captured digitally and then transferred to Maxwell DataShedTM software. Once imported into DataShedTM, all data is validated and undergoes QA/QC. Validated data is stored in a SQL database and is exported into appropriate file formats for resource estimation in Isatis™ and Datamine™ RM.
10.3 Collar Survey
The proposed drill hole coordinates are prepared by the geologist and approved by the project manager. The geologist provides the field technician with the proposed drill hole coordinates and corresponding location map; and the proposed coordinates are saved in the drill hole database.
The drill hole collar location is marked and surveyed in the field using a handheld GPS to an accuracy of 1 m. If any deviations in the proposed drill hole location are encountered due to topography or other reasons, alternative locations are determined by the field technician and communicated to the geologist for approval before pad construction begins.
Once the drill hole has been completed, the surveyor returns to pick up the “final coordinate” with a total station GPS.
10.4 Downhole Survey
AGM uses the Reflex EZ Shot single shot survey tool in all RC and DD holes. The first survey is collected within the first run (3 rods or 9 m) and subsequently at 30 m intervals. The last run to end of hole (EOH) is surveyed. The down hole survey is monitored by the rig geologist while drilling so that any excessive deviation (0.2 degrees per metre) can be identified and resurveyed. The Reflex EZ Shot tool is a completely manual single shot tool and only gives a read out of the basic azimuth (AZ), dip (Incl), temperature (Temp) and magnetic susceptibility (Mag Field) data which is manually recorded and reported via a Reflex data (template) which is signed by the drilling supervisor.

NI 43-101 Technical Report for the Asanko Gold Mine, Ashanti Region, Ghana
Effective Date: February 28, 2022
Page 102
10.5 Core Recovery
Core recoveries are typically calculated at the drilling site by qualified technicians or once the trays are delivered back to the core facility/yard and recorded in the geological logs. The recording of recoveries is the responsibility of the geologist. Core recoveries are typically in excess of 95%.
10.6 Core Handling
Prior to loading with core, core boxes are labelled with the drill hole number, box sequence and depth recorded in permanent marker. To ensure that pieces of core are not lost, rotated end for end, or misplaced in the tray the operator reconstructs the core after it has been placed in the tray. Wooden block markers are inserted by the driller to record depth.
A Reflex ACT IID electronic core orientation tool and barrel is used for orienting and marking core. The barrel is oriented using the electronic orientation unit prior to the drill run. The full, oriented barrel is then retrieved, the core aligned and marked using a bottom hole convention. The down hole direction is marked on the core at the base. If two sections of broken core cannot be matched, then no structural mark-up is made for the lower (down hole) part of the core run until the next barrel is retrieved and oriented.
10.7 Core Photography
Prior to cutting, all core is routinely photographed by the geologists both dry and wet. The colour and texture of the rock are best seen when the core is wet but the fracture patterns which are important to the geotechnical study are best viewed when the core is dry.
The project location, drill hole ID, tray number, depths start/end of tray and indication whether the core was dry or wet is written on white board and placed at the top of the box.
10.8 Core Cutting and Sampling
Sampling is undertaken after geological, structural and geotechnical logging. Sampling intervals are selected by the geologist, and for both HQ and NQ core conform to a minimum sample length of 30 cm and maximum of 200 cm. Sample intervals do not cross lithological boundaries as defined by the logging and are defined within similar alteration zones and structural features. The following procedures are followed:
A coloured orientation line is marked along the length of the core to indicate where the core should be cut in two equal halves. The line is traced perpendicular to the stratification; where there is mineralization, the optimum distribution is used so that 50% of mineralization is represented in each half of the core. The same side of the cut core is removed consistently throughout the drill hole (i.e. the right-hand side from the top to the bottom of the hole). The core is cut completely in two halves using an electric diamond blade saw. In the upper oxide zone, where the core is too friable for diamond saw cutting, the core is dry cut or cleaved.
A sampling form is completed with the intervals indicated for the samples. Ticket forms are completed with the drill hole ID number and FROM-TO interval for the sample. The samples numbers must be in consecutive order and are derived from the sample ticket book. Only the sample numbers are written on the plastic sample bags.
Metallic marker blocks are inserted at the start and end of each sample and the number of the corresponding sample is written with felt-tip pen on the core box to the side of the marker. Samples of approximately 2 to 3 kg are collected carefully and placed in plastic bags. The sample number is written on the plastic sample bag with a permanent marker pen. The sample ticket is stapled on the upper part of the bag, and the bag sample number is checked against ticket sample number. The bag is sealed with plastic ties.

NI 43-101 Technical Report for the Asanko Gold Mine, Ashanti Region, Ghana
Effective Date: February 28, 2022
Page 103
10.9 QC Insertions
Field technicians are responsible for the bulk of QC insertions, overseen by the site logging geologist. Ultimate compliance with procedures is with the Exploration Manager and Unit Manager – Spatial Data. QC insertions are inserted onsite (at the Esaase coreyard for Esaase drilling, and at the Obotan coreyard facility for all other projects).
Figure 10-10 Sample Labelling Example
Each assay/sampling job follows the below steps:
• Barcode sample ID tickets should be printed out. Sample IDs for QAQC materials follow the same sequence as regular samples IDs. Samples must be laid out and QAQC materials inserted at their correct positions before putting everything together in a batch.
• Asanko Certified Reference Materials (CRM) are sourced from Geostats Pty, Australia.
• Standards (CRM’s) should be inserted into routine sample batches at a rate between 2.5 per 20 samples and 5 per 40 samples. At the very minimum, quality control samples should never be less than two percent of a batch. When a standard is to be inserted, select a standard within the grade-range of the expected values in the routine samples.
• Blanks are similarly inserted onsite, alternating with standards at a rate between 2.5 per 20 samples and 5 per 40 samples.
• Duplicates are inserted into routine analytical batches at a rate of 1% to 3%, depending on the confidence level with the laboratory and the size of the batch. In the case of drill core, duplicates should be quarter (¼) of the drill core.
• DataShedTM software is used to import laboratory files, check for standards, blanks & duplicates and issue a report on standards performance for the batch. Data processing personnel communicate the outcome of the assay results and corresponding standard names for any inserted standards.

NI 43-101 Technical Report for the Asanko Gold Mine, Ashanti Region, Ghana
Effective Date: February 28, 2022
Page 104
10.10 Geotechnical Logging
Geotechnical characteristics of the rock mass are described to provide all necessary data for rock mass classification schemes. Logging records include:
• Depth from/to
• Core diameter
• Recovery
• Rock quality designation
• Lithology
• Alteration
• Defects
• Origin
• Alpha, beta
• Planarity, roughness
• Infill type and thickness
• Hardness
• Broken zone
• Orientation.
Four geotechnical rock tests may be undertaken, including point load testing and tilt testing (conducted on-site), and uniaxial compressive strength (UCS) testing and direct shear testing (conducted at off-site laboratory).
10.11 Core Storage
A core shed facility is located at Nkran. This facility has spacious core logging facilities, a dedicated XRF/spectrometer office, a dedicated core saw/splitter facility, covered core storage on pallets and pallet racking with a forklift, and containerized storage for pulps. With the exception of Esaase, all core from the other deposits is transported to the Nkran core shed for logging and storage.
The storage facility at Esaase consists of sheds with elevated racks on concrete floors that are sheltered from wind and rain. The core is stored following geological logging, photography, core cutting and sampling.
10.12 Density Sampling
The logging geologist selects a 10 to 20 cm length of half core for the density measurement. One representative sample is taken in each 10 m interval of unmineralized core, or in each 5 m interval of mineralized core. The geologist marks with a permanent marker pen the interval of the half core which is to be sampled. A technician labels the density sample with a black permanent marker indicating the hole number and the “FROM” and “TO” measurements. Details of each sample are recorded on a density sample registration form.

NI 43-101 Technical Report for the Asanko Gold Mine, Ashanti Region, Ghana
Effective Date: February 28, 2022
Page 105
The technician in charge of the density measurement takes a photograph of the sample outside the core box with the sample registration details. The photographs are downloaded to a computer. Photographs are named using the HOLE NUMBER_FROM_TO information, and download on the exploration database computer, with a backup in the server. A wooden block is placed in the core box where the sample was taken. The sample interval (“FROM” and “TO”) is written on the wedge, together with the word ‘Density’. Density is measured at the Asanko lab onsite following the Archimedes method, outlined in Section 11.
Duplicate measurements were taken by the laboratory for every tenth sample. Selected samples (1 in 30), located adjacent to the primary samples, were sent to a second laboratory (Intertek – Tarkwa) for check density measurements.
10.13 RC Sampling
Prior to commencing drilling, a series of sample bags for each hole are labelled with “FROM” and “TO” depths. For the original samples 40 cm x 50 cm bags are used, and for the reject samples 50 cm x 100 cm bags are used. Chip trays are labelled with Hole ID, sample number and From-To depths, as well as any quality control samples with FB (field blank) or FD (field duplicate).
The hole is drilled dry to maximize sample recovery and avoid losing fines, and a rig mounted rotary splitter is used wherever possible. In exploration drilling, a triple-tiered riffle splitter is used whenever a rotary splitter is not available. In GC drilling, a stationary cone splitter is used whenever a rotary splitter is not available. The auxiliary booster and compressor must be operational and used if water is encountered.
The cyclone is continuously monitored to avoid contamination from clogging and to ensure it is cleaned as required, and at a minimum, after completing each hole. The drill rods, down-hole hammer bit and the sampling equipment are cleaned regularly using compressed air, at each rod addition and after each hole. Sample buckets/bags are removed when the hole is flushed by the driller at the change of rods. The triple-tiered riffle splitter is frequently inspected and cleaned with compressed air or by hammering the side of the splitter between each sample, to avoid contamination and ensure representative samples.
Samples are taken at precise 1 m intervals for exploration drilling and 1.5 m intervals for GC drilling with no lag in the sampling. For every sample, the complete sample interval is collected from the cyclone.
Samples of approximately 2-3 kg are collected in the pre-labelled (FROM_TO) plastic bags and sealed with plastic tags. Samples are collected from the drill site every shift and transported to the Obotan (Nkran) and Esaase camp.
In exploration drilling, rejects are placed in plastic bags correctly labelled with FROM-TO depths and the samples bag securely closed. Reject bags are placed on the ground in organized piles. After each sample is placed in a sample bag, the technician takes a sub-sample of the field reject, sieves and washes the sample where fresh, and spoons the sample into the sequential trays. This provides a permanent record of the geology of each sample.
The sampling method (riffle splitter, rotating cone splitter, rotating wet splitter), estimation of recovery (%) and sample condition (dry, damp, wet) are recorded in a log.
A sample weighing program is undertaken on the RC rig, across each shift over a 24-hour period, to ensure that the optimal sample size is being taken, and to determine the recovery. All material reporting through the splitter is weighed for every interval drilled. The A and B samples are weighed to ensure a representative split, and the field reject is weighed to allow calculation of total sample recovery per interval drilled. The A and B samples must be consistently within 10% of the weight of each other. If this is not achieved it must be communicated to the driller, drilling manager and Project Manager so that the rotary/cone splitter can be calibrated.
As the samples are drilled, they are lined-up in order according to the FROM-TO intervals. The ordered samples are checked against the log sheet from the drill rig. The technician then writes the sample bag number on the plastic sample bag according to the number in the log sheet. Sample tickets are stapled to the plastic bags (bag sample number against ticket number is checked).

NI 43-101 Technical Report for the Asanko Gold Mine, Ashanti Region, Ghana
Effective Date: February 28, 2022
Page 106
As with diamond core sampling summarized above, field technicians are responsible for the bulk of QC insertions, overseen by the site logging geologist. Ultimate compliance with procedures is with the Exploration Manager and Unit Manager – Spatial Data. QC insertions are inserted onsite (at the Esaase coreyard for Esaase drilling, and at the Obotan coreyard facility for all others). QC insertions are made as follows:
• Standards (CRM’s) should be inserted into routine sample batches at a rate between 2.5 per 20 samples and 5 per 40 samples. At the very minimum, quality control samples should never be less than two percent of a batch. When a standard is to be inserted, select a standard within the grade-range of the expected values in the routine samples.
• Blanks are similarly inserted onsite, alternating with standards at a rate between 2.5 per 20 samples and 5 per 40 samples.
• Duplicates are inserted into routine analytical batches at a rate of 1% to 3%, depending on the confidence level with the laboratory and the size of the batch.
Detailed logging is undertaken by the exploration or grade control RC geologist using the MaxGeo LogChief™ data collection system.
10.14 Pre 2014
Drilling procedures for PMI prior to 2014 are covered in Spiers (2010) and SRK (2011). Procedures followed by Resolute are not well documented. In summary:
• Once core is thoroughly washed, individual core trays are photographed when wet.
• Core boxes are laid onto logging racks in numerical order and the recoveries measured, reconciled by drillers core blocks.
• Metre marks are directly on the core.
• Logging includes detailing all relevant lithologies, fractures, foliations, laminae, crenulations, cleavages and angles of formational contacts.
• Rock Quality Designation (RQD), indicating the strength of the rock units, are also noted and recorded.
Relogging and inspection of sample results from this period indicates drilling, logging, and sampling procedures were similar to the current methods. Recovery and density measurements are less frequent or not recorded. QC insertion types and rates are less than current and in some cases no QC insertion is evident, however this data contributes to an insignificant portion of the Mineral Resource estimate.
NI 43-101 Technical Report for the Asanko Gold Mine, Ashanti Region, Ghana
Effective Date: February 28, 2022
Page 107
11 SAMPLE PREPARATION, ANALYSES, AND SECURITY
11.1 Legacy Data (Pre-2014)
This subsection refers to sample preparation and analyses methods employed by PMI and Resolute (pre-2014) on samples from the Nkran, Abore, Akwasiso, Asuadai and Adubiaso deposits.
11.1.1 Resolute
No detailed breakdown on Resolute sampling and quality control measures was available for review.
11.1.2 PMI
These procedures have been reviewed and discussed by Spiers (2010) and SRK (2011).
In summary, the PMI core sampling procedures are as follows (from Spiers, 2010):
• Once the geological logging is complete, intervals to be sampled are pre-determined by referring to the drill logs and the drill core. Intervals are kept at one meter separations, within the normal mineralized zones, but at shorter intervals where isolated narrow mineralized features occur. Within “waste” zones, four-meter composite sample intervals are taken. Intervals to be assayed are marked directly on the core, using a permanent marker.
• The core is then ready to be sawn, using a diamond core cutting machine. One half of each sawn core section is carefully returned to its respective position in the core box for permanent storage. On occasion for data analysis purposes, where coarse gold was noted in the section, the entire section was submitted for assay.
• Sample numbers are allocated to each sawn portion of core, from each drill hole. Sample numbers are pre-written on plastic bags, into which the samples are carefully and individually placed and sealed with a stapler.
PMI RC sampling procedures as follows (from Spiers, 2010, via pers comm with PMI geologists):
• Sampling of reverse circulation drill cuttings is initiated at the drill site, where each representative sample is collected from the RC cyclone cuttings, corresponding to each meter of hole “depth”.
• The entire length of each RC hole is sampled. Samples, which usually weigh approximately 25 kg, are reduced in size to about 2-3 kg, by riffle splitting.
• Typically two duplicate splits are taken – one for assaying and a second for “pan” gold counts.
• As recovered from the drill cyclone, each sample is bagged, identified, permanently marked, recorded and secured by PMI’s Drill Geologist. The bagged ‘assay’ samples are transported to PMI’s sorting site (in the Geologist’s pickup) where they are laid out in appropriate rows according to their respective drill holes and “footages”.
• At the end of each shift these RC samples are transferred to PMI’s field office where they are secured in a clean, dry and locked storage room and recorded in the Company’s data base.
• Typically, results from the panning of duplicate samples are available within one day of the drilling. This is also recorded in the Company’s database and used to cross-check the assay results. Where significant visible gold is noted in the panning – the duplicate ‘assay’ sample is submitted as a 1 meter sample; where low gold colours are noted – the ‘assay’ samples are typically combined to form 2 to 4 metre composites for assay.
Laboratory location, accreditation status for assay results before 2015 are shown in Table 11-1. Although accreditation is unknown before 2014, these laboratories are operated by reputable independent companies which typically exercise expected industry standards.
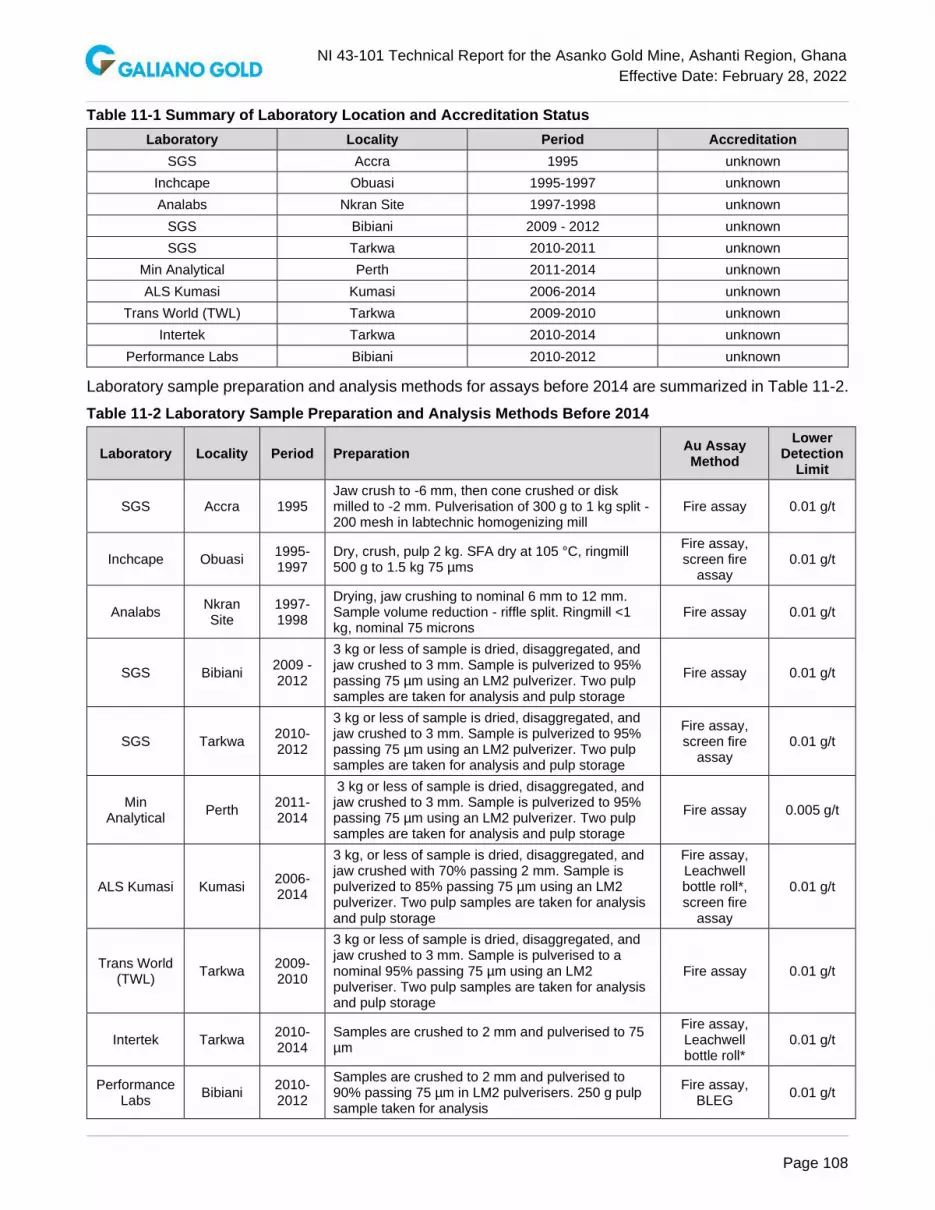
NI 43-101 Technical Report for the Asanko Gold Mine, Ashanti Region, Ghana
Effective Date: February 28, 2022
Page 108
Table 11-1 Summary of Laboratory Location and Accreditation Status
Laboratory Locality Period Accreditation
SGS Accra 1995 unknown
Inchcape Obuasi 1995-1997 unknown
Analabs Nkran Site 1997-1998 unknown
SGS Bibiani 2009 - 2012 unknown
SGS Tarkwa 2010-2011 unknown
Min Analytical Perth 2011-2014 unknown
ALS Kumasi Kumasi 2006-2014 unknown
Trans World (TWL) Tarkwa 2009-2010 unknown
Intertek Tarkwa 2010-2014 unknown
Performance Labs Bibiani 2010-2012 unknown
Laboratory sample preparation and analysis methods for assays before 2014 are summarized in Table 11-2.
Table 11-2 Laboratory Sample Preparation and Analysis Methods Before 2014
Laboratory Locality Period Preparation Au Assay Method
Lower Detection
Limit
SGS Accra 1995 Jaw crush to -6 mm, then cone crushed or disk milled to -2 mm. Pulverisation of 300 g to 1 kg split -200 mesh in labtechnic homogenizing mill
Fire assay 0.01 g/t
Inchcape Obuasi 1995-1997
Dry, crush, pulp 2 kg. SFA dry at 105 °C, ringmill 500 g to 1.5 kg 75 µms
Fire assay, screen fire
assay 0.01 g/t
Analabs Nkran Site
1997-1998
Drying, jaw crushing to nominal 6 mm to 12 mm. Sample volume reduction - riffle split. Ringmill <1 kg, nominal 75 microns
Fire assay 0.01 g/t
SGS Bibiani 2009 - 2012
3 kg or less of sample is dried, disaggregated, and jaw crushed to 3 mm. Sample is pulverized to 95% passing 75 µm using an LM2 pulverizer. Two pulp samples are taken for analysis and pulp storage
Fire assay 0.01 g/t
SGS Tarkwa 2010-2012
3 kg or less of sample is dried, disaggregated, and jaw crushed to 3 mm. Sample is pulverized to 95% passing 75 µm using an LM2 pulverizer. Two pulp samples are taken for analysis and pulp storage
Fire assay, screen fire
assay 0.01 g/t
Min Analytical
Perth 2011-2014
3 kg or less of sample is dried, disaggregated, and jaw crushed to 3 mm. Sample is pulverized to 95% passing 75 µm using an LM2 pulverizer. Two pulp samples are taken for analysis and pulp storage
Fire assay 0.005 g/t
ALS Kumasi Kumasi 2006-2014
3 kg, or less of sample is dried, disaggregated, and jaw crushed with 70% passing 2 mm. Sample is pulverized to 85% passing 75 µm using an LM2 pulverizer. Two pulp samples are taken for analysis and pulp storage
Fire assay, Leachwell bottle roll*, screen fire
assay
0.01 g/t
Trans World (TWL)
Tarkwa 2009-2010
3 kg or less of sample is dried, disaggregated, and jaw crushed to 3 mm. Sample is pulverised to a nominal 95% passing 75 µm using an LM2 pulveriser. Two pulp samples are taken for analysis and pulp storage
Fire assay 0.01 g/t
Intertek Tarkwa 2010-2014
Samples are crushed to 2 mm and pulverised to 75 µm
Fire assay, Leachwell bottle roll*
0.01 g/t
Performance Labs
Bibiani 2010-2012
Samples are crushed to 2 mm and pulverised to 90% passing 75 µm in LM2 pulverisers. 250 g pulp sample taken for analysis
Fire assay, BLEG
0.01 g/t
NI 43-101 Technical Report for the Asanko Gold Mine, Ashanti Region, Ghana
Effective Date: February 28, 2022
Page 109
11.2 Current Data (Post 2014)
This section refers to methods employed post-2014 on samples from the Esaase, Nkran, Abore, Akwasiso, Asuadai and Adubiaso, Dynamite Hill, and Miradani North deposits, as well as regional exploration samples. Unless specified otherwise, all diagrams in this section are sourced from Asanko Gold 2021.
11.2.1 Sample Preparation Methods and Quality Control Measures Taken Before Submission to the Laboratory
Diamond drill core samples are determined by the logging geologist and should be between 30 cm and 150 cm in length. Samples must not cross lithological boundaries and must be defined within similar alteration zones and structural features. Samples should weigh between 2 and 3 kg. QC samples are inserted by the logging geologist at the core shed.
RC samples of approximately 2 to 3 kg are collected from the cyclone at 1 m intervals and split in a riffle splitter. If the resultant sample is greater than 3 kg, then the entire sample is re-split. The cyclone is continuously monitored to avoid contamination from clogging and at a minimum cleaned after every hole. The drill rods, down-hole hammer bit and the sampling equipment are cleaned regularly using compressed air. To determine recovery and ensure that the optimal sample size was taken, recovery is monitored by weighing samples at the RC rig.
The geologist ensures that the quality control samples are inserted at the core yard and monitors the dispatch of the samples to the laboratory. A 2 to 3 kg duplicate sample is taken in an identical manner as the original and stored in a pre-labelled sample bag.
To avoid contamination, no metal jewellery is permitted to be worn by the Asanko Gold samplers.
Samples with visible gold were routinely submitted for either screen fire assay or a bulk cyanide leach assay. All sample preparation, apart from discussed above, is undertaken by the preparation and analytical laboratories. The quality of analysis at the laboratories was monitored using blanks, standards, duplicates and check assays.
With the exception of Esaase, all exploration samples are processed and stored at the AGM exploration facilities at Obotan. Esaase RC chips, half-core and core photographs, duplicate pulps and residues of all submitted samples are retained and stored at the Asanko Gold exploration camp at Tetrem.
Grade control samples were collected by reverse circulation drilling with an optimal drilling depth of 30 meters. Samples were taken at regular 1.5 m intervals and 2.5 kg to 3.0 kg of samples were collected using automatic cone splitter mounted on the GC drill rig. All samples were collected into plastic bags, labelled and sealed on site before transported to the Asanko mine laboratory for preparation and analysis. The QP has reviewed the procedures of the RC drilling, sample collection, preparation, transportation, QAQC measures and is of the opinion that the procedures established at AGM met the industry standards of similar mining operations.
Diamond core cutting procedures vary slightly between the earlier work and the current AGM sampling. In both cases an orientation line was drawn on the core and an electric diamond core saw used to cut the core, retaining the left-hand side for reference (when looking down hole). Historical samples were cut 1 cm to the right of the line and AGM samples are cut along the line. Asanko Gold procedures state that the line should be traced perpendicular to the stratification, or where there is mineralization one should try to get the optimum distribution so that 50% of mineralization is represented in each half of the core.
Where core was too friable to cut with a diamond saw, the core was dry cut or cleaved.
Nkran exploration RC samples were taken from the drilling rig using a rotary splitter which produced equal aliquots to mitigate any bias. A 3 kg sample was collected for laboratory submission and coarse rejects of all samples were kept as a backup for at least three months (GC) and six months (exploration).
Esaase and other RC samples are split using a three-tier riffle splitter (1 in 8 split) to obtain a sub-sample of 3 kg or less and collected in pre-labelled plastic bags. Rejects are stored in plastic bags.

NI 43-101 Technical Report for the Asanko Gold Mine, Ashanti Region, Ghana
Effective Date: February 28, 2022
Page 110
11.2.1.1 Bulk Density Measurements
Esaase bulk density measurements were collected over a range of lithological and weathered profiles. The Archimedes principal was used and is summarized as follows:
• 10 cm billet of clean, dry core (core dried in oven for 4 hours at 60°C) was weighed
• Core was immersed in paraffin wax and then reweighed (to determine wax weight)
• Billet was suspended and weighed in water
• Bulk density (BD) calculated as: BD = [Mass Core] / [(Mass Air - Mass Water) – (Mass Wax / 0.9)].
Asanko Gold samples are sent for laboratory bulk density analysis using the Archimedes method, methodology as follows:
• 10 to 20 cm length of half core from each 10 m interval of unmineralized core, or 5 m interval of mineralized core (dried in an oven at 105oC) was weighed (W1)
• Samples were coated with paraffin wax and reweighed (W2)
• The volume of the sample was measured (V1)
• Density was calculated from the following equation:
o Density= W1 /(V1- ((W2-W1)/DP) where DP = wax density (0.8 g/cm3).
Duplicate measurements were taken by the laboratory for every tenth sample. Selected samples (1 in 30), located adjacent to the primary samples, were sent to a second laboratory for check density measurements.
11.2.1.2 Quality Control Sample Insertions
QC insertion procedures are adequately covered in Section 10.9 and Section 10.13.
11.2.1.3 Security Measures
At Nkran, individually bagged core and RC drilling samples were packed in polyweave, or heavy plastic sacks, tied with binding wire and prepared for transport to the laboratory. The geologist was responsible for sample security and prior to dispatch, the samples were firmly secured and locked in a designated sample room at PMI’s field office.
Esaase (and Akwasiso) sampling procedures required samples to be collected in staple-closed bags once taken from the rig or core-cutting facility. The samples were then transported to the project camp to be picked up by the laboratory truck and taken directly to the laboratory.
The AGM procedure for sample submission is as follows:
• RC samples are collected from the drill site every shift and transported to the Obotan and Esaase camp
• Samples are packed in 50 kg bags and stored in the logging shed until shipped to the laboratory
• The QA/QC geologist supervises loading of samples on to the truck
• A sample dispatch form accompanies the samples, and another signed by the exploration manager is provided to the security guards to authorise the shipment to leave the camp
• At the laboratory, the laboratory representative signs the sample dispatch form confirming receipt and change of custody for the samples.

NI 43-101 Technical Report for the Asanko Gold Mine, Ashanti Region, Ghana
Effective Date: February 28, 2022
Page 111
11.2.2 Laboratory Certification
Since 2014, exploration samples are sent to either ALS laboratory in Kumasi, Intertek laboratory in Tarkwa, or the AGM Mine laboratory at Obotan. ALS and Intertek are independent from Galiano Gold Inc. The AGM Mine laboratory is not independent from Galiano Gold Inc.
ALS Ghana in Kumasi received accreditation of ISO/IEC 17025:2005 in 2018 and received ISO/IEC 17025:2017 accreditation in 2020. The scope of accreditation includes analysis for gold by fire assay followed by acid digestion and AAS finish. Before 2018 the laboratory was operating as per the ISO standards but was not certified or accredited.
The Intertek laboratory in Tarkwa received ISO/IEC 17025:2005 accreditation in 2017 and received ISO/IEC 17025:2017 accreditation in 2019. The scope of accreditation included analysis for gold by fire assays followed by acid digestion and AAS finish. Before 2017 the laboratory was operating as per the ISO standards but was not certified or accredited.
The AGM Mine laboratory holds no certification or accreditation. The mine laboratory QAQC procedure and data was independently reviewed by independent consultant, Richard Minnitt (Minnitt, 2020) in November 2020. No significant issues were identified. The QP visited the AGM mine laboratory multiple times in 2021, reviewed the process and interviewed the laboratory personnel, and is of the opinion that AGM laboratory is operated at industry standard. Table 11-3 summarizes primary laboratory location and accreditation.
Table 11-3 Primary Laboratories Between 2014-2021
Laboratory Locality Period Accreditation Scope of Accreditation
ALS Kumasi 2014-2021 2014-2020 none
2020 - ISO/IEC 17025:2017 analysis for gold by fire assays followed
by acid digestion and AAS finish
Intertek Tarkwa 2014-2021 2014-2017 - none
2017-2019 - ISO/IEC 17025:2005 2019-2021 - ISO/IEC 17025:2017
analysis for gold by fire assays followed by acid digestion and AAS finish
Asanko Gold Obotan 2017- 2021 none none
11.2.3 Laboratory Sample Preparation and Analysis
Table 11-4 summarizes sample preparation methods at each of the primary laboratories.
Table 11-4 Summary of Analytical Laboratories Sample Preparation and Gold Assay Techniques
Laboratory Locality Period Preparation Au Assay Method Lower
Detection Limit
ALS Kumasi 2014-2021
PREP-31 - 3 kg, or less of sample is dried, disaggregated, and jaw crushed
with 70% passing 2 mm. Sample is pulverised to 85% passing 75 µm using
an LM2 pulveriser. Two pulp samples are taken for analysis and pulp storage
30 g fire assay and AAS
30 g screen fire assay
0.01 g/t 0.05 g/t
Intertek Tarkwa 2014-2021 Samples are crushed to 2 mm and
pulverised to 75 µm Fire assay
Leachwell bottle roll* 0.01 g/t
0.001 g/t
Asanko Gold Nkran site 2017-2021
Samples are crushed to 2 mm and pulverised to 90% passing 75 µm in LM2 pulverisers. 250 g pulp sample taken for
analysis
Fire assay Leachwell bottle roll*
0.01 g/t 0.001 g/t
*Leachwell bottle roll assays used for grade control

NI 43-101 Technical Report for the Asanko Gold Mine, Ashanti Region, Ghana
Effective Date: February 28, 2022
Page 112
11.2.4 Check Assay Analysis
There were no check assays for exploration samples done in 2014.
Exploration samples were initially analyzed at Asanko Lab from 2015-2016, and were check assayed at the ALS lab in Kumasi.
Exploration samples analyzed at the Intertek Laboratory during 2017-2021 were sent to ALS.
No check samples have been submitted for grade control samples.
11.2.5 Pre-2020 Quality Assurance and Quality Control Results
SRK, CJM, and CSA Global have reported results of their reviews of the Quality Control results in the 2012, 2014, 2015, 2017, and 2020 technical reports. In 2015 CJM concluded the QA/QC undertaken by Resolute, PMI and Asanko is adequate and that the current QA/QC systems in place to monitor the precision and accuracy of the sampling and assaying are adequate. In 2017 CSA Global concluded there was little to no quality control results available to support historical (Resolute and PMI) assay results and that QC results for Akwasiso and Esaase were insufficient to adequately monitor the sampling and assay contamination, accuracy and precision.
In the 2020 technical report, CSA Global concluded sample preparation, security, and analytical procedures for the Asanko Gold deposits under investigation are acceptable for use in Mineral Resource estimation. CSA Global also identified several QAQC issues and recommended further action to improve the quality of data. Summary comments by CSA Global from their 2020 review are shown in Table 11-5.
No exploration drilling was undertaken at Dynamite Hill between 2017 and 2020, and CSA Global concluded in the 2017 report that sample preparation, security, and analytical procedures for Dynamite Hill were acceptable for use in Mineral Resource estimation. No specific recommendations were made regarding QAQC at Dynamite Hill at that time. The drilling at Miradani was limited to four holes and was not discussed in detail.
The QP has reviewed the CSA Global, CJM and SRK reports and agrees the QAQC procedures and quality control results for sampling before 2020 have provided assay results suitable to support Mineral Resource estimation.
Table 11-5 Summary Findings From Previous QC Reviews
Primary Laboratory Results Comments
Nkran No material concerns with cross contamination or assay accuracy and insufficient samples to assess precision for sample from 2017 onwards. Historical data had indications of cross contamination as well as multiple CRM failures, and no precision controls.
Esaase No material concerns with cross contamination or assay accuracy for the range up to approximately 3 ppm Au. Over 3 ppm Au, there are no controls on assay accuracy
Akwasiso No material concerns with cross contamination or assay accuracy for the range up to approximately 3 ppm Au. Over 3 ppm Au, there are no controls on assay accuracy; (DD) have acceptable; RC results from the Asanko Gold mine lab have poor repeatability precision
Abore No material concerns with cross contamination or assay accuracy, insufficient duplicates to assess precision; the proportion of blank and CRM samples included with the primary samples was lower than industry norms.
Asuadai No material concerns with cross contamination or assay accuracy; insufficient duplicates to assess precision
Adubiaso No material concerns with cross contamination or assay accuracy; RC sample assay precision is poor; no DD duplicate data available
Check Laboratory Results
Nkran Poor repeatability. Only ten external check samples were available for review

NI 43-101 Technical Report for the Asanko Gold Mine, Ashanti Region, Ghana
Effective Date: February 28, 2022
Page 113
Primary Laboratory Results Comments
Esaase Poor repeatability
Akwasiso Significant bias but original samples were analyzed at the AGM laboratory using a bottle roll cyanide leach and the umpires at Intertek Tarkwa by fire assay
Abore Only five samples available for review, therefore no definitive conclusions could be made
Asuadai Only five samples available for review, therefore no definitive conclusions could be made
Adubiaso Only eight samples available for review, therefore no definitive conclusions could be made
The QP considers that Table 11-5 above represents an adequate summary of findings from previous QAQC reviews.
11.2.6 Post 2020 Quality Assurance and Quality Control Results
11.2.6.1 Nkran
Seventy-one holes were drilled in between June 1st to September 30th, 2020 at Nkran. No drilling was completed in 2021. Mining ceased early Q2 2020, so no GC were samples submitted. QC insertion rates are summarized in Table 11-6.
Table 11-6 Nkran QAQC Samples For Period 01/06/2020 to 30/09/2020
Reference Material Number Inserted Total No of Samples Sent Percentage of Reference Material (%)
Blanks 240 - 2.99
CRM 266 - 3.31
Duplicates 260 - 3.24
Total 766 8,022 9.54
Cross Contamination
Blanks were used 240 times during sampling of Nkran drilling program. All blanks passed at ±2 standard deviation.
An example of a Blank control chart is shown in Figure 11-1.

NI 43-101 Technical Report for the Asanko Gold Mine, Ashanti Region, Ghana
Effective Date: February 28, 2022
Page 114
Figure 11-1 Plot of Nkran Blanks for the Period Noted
Assay Accuracy (Bias)
• All standards are within mean ±3 times the standard deviation with nearly 98% of those are within the mean ±2 times the standard deviation.
• No significant bias relative to the expected mean is evident.
• Table 11-7 summarizes the results of the Standards.
Table 11-7 Standard Materials for Nkran Submitted to Lab - 2020
Au Standard(s) No. of Samples
Calculated Values
Std Code Method Exp Method
Exp Value
Exp SD Mean Au SD CV Mean Bias
G300-9 FA50_AAS FA50_AAS 1.5300 0.0600 91 1.5427 0.0678 0.0440 0.83%
G311-8 FA50_AAS FA50_AAS 1.5700 0.0800 91 1.5711 0.0678 0.0432 0.07%
G910-6 FA50_AAS FA50_AAS 3.0900 0.1300 84 3.1307 0.1090 0.0348 1.32%
Assay Precision
• 260 Field Duplicates were collected.
• Figure 11-2 below shows Repeat Scatter Plot of original samples and field duplicate samples for exploration drilling at Nkran, with warning set to 15% variation limit.
• Figure 11-3 shows that nearly 55% of the paired duplicates had an absolute relative difference of less than 30%, typical for field duplicate gold analysis.

NI 43-101 Technical Report for the Asanko Gold Mine, Ashanti Region, Ghana
Effective Date: February 28, 2022
Page 115
Figure 11-2 Scatter Plot of Nkran Exploration Field Duplicates
Figure 11-3 Half Absolute Relative Difference (HARD) Plot of Nkran Field Duplicates from Exploration
Primary Laboratory Quality Control Insertions
• Intertek lab typically includes 4% pulp duplicate/re-split “checks” in each batch. Original results and pulp duplicate results generally compare very well for grades below 7 g/t.

NI 43-101 Technical Report for the Asanko Gold Mine, Ashanti Region, Ghana
Effective Date: February 28, 2022
Page 116
Figure 11-4 QQ Plot of Nkran Pulp Duplicates From Exploration
Between Laboratory Bias
• Ninety umpire samples originally assayed by Intertek Kumasi, were sent to ALS to check lab performance. No bias was noted.
Samples from the 2020 Nkran program show no significant cross contamination, systematic assay bias or precision issues.
11.2.6.2 Esaase
Twenty exploration holes were drilled in between January 1st and August 23rd, 2021 at Esaase. QC insertion rates for exploration samples are summarized in Table 11-8.
Table 11-8 Esaase QC Samples for the Period 1/01/2021 to 23/08/2021
Cross Contamination
• 523 blank samples were submitted to the lab to check contamination during sample preparation. Less than 0.2% of returned values less than ±2 times the standard deviation.
• Figure 11-5 is an example of a Blank control chart.
Reference Material Number Inserted Total No of Samples Sent Percentage of Reference Material (%)
Blanks 523 3.27
CRM 522 3.26
Duplicates 524 3.28
Total 1,569 15,991 9.81

NI 43-101 Technical Report for the Asanko Gold Mine, Ashanti Region, Ghana
Effective Date: February 28, 2022
Page 117
Figure 11-5 Plot of Blanks for Esaase Exploration/Infill Drilling for the Period Noted
Assay Accuracy (Bias)
• CRM’s performed well with no significant breaches of the mean ± 3xSD limit in exploration data. Minor samples that did breach were either within waste zones or performed well on rerun. Figure 11-6 illustrates these breaches, circled in red.
• Except for CRM’s GLG911-4 and G911-4 no significant bias is evident (Table 11-9). GLG911-4 is a low grade to almost blank level sample (4.65 ppb). G911-4 is likely mislabelled. The low number of analyses for these two prevents meaningful assessment of these results.
Figure 11-6 Plots of the Performance of CRM’s G308-3 and G319-2 for Esaase Exploration Drilling
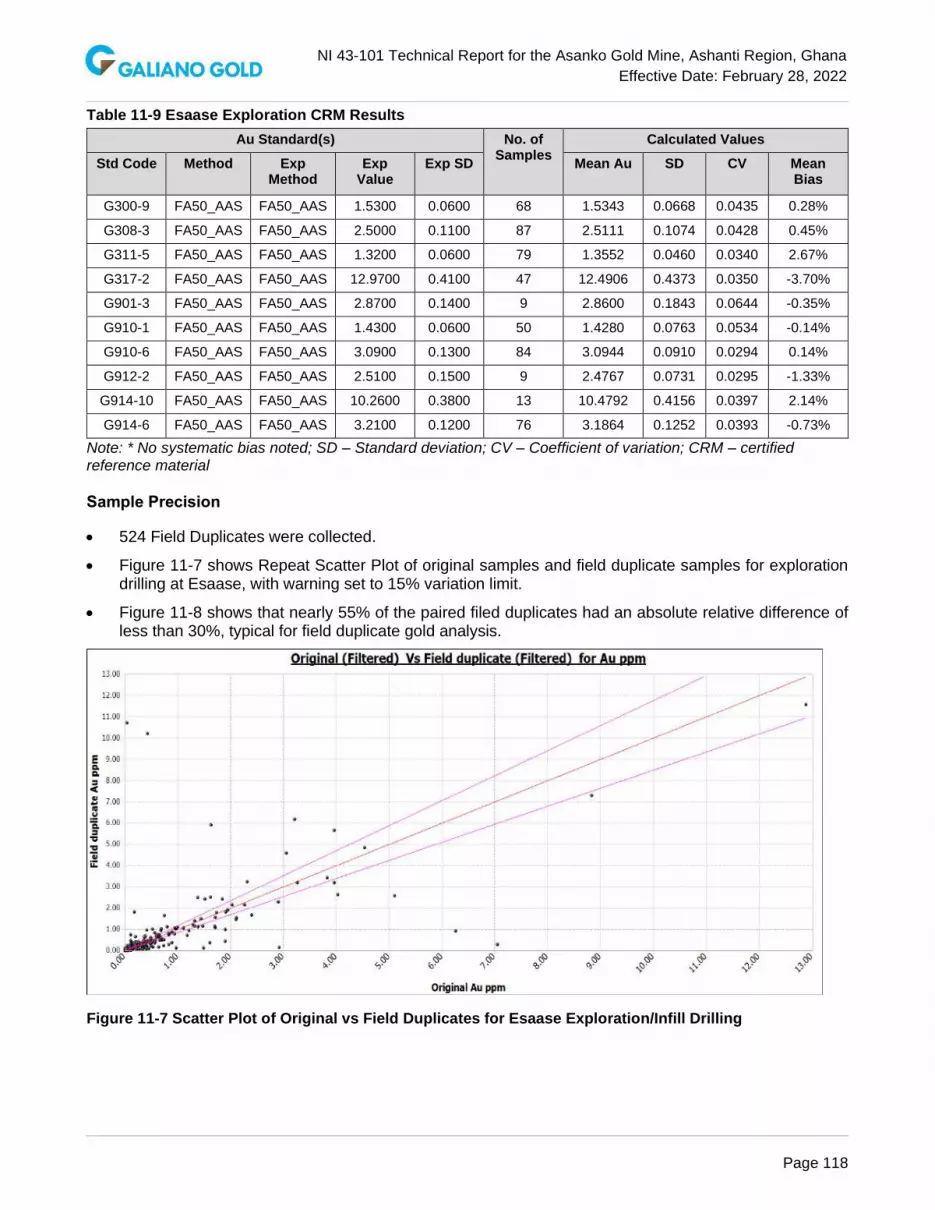
NI 43-101 Technical Report for the Asanko Gold Mine, Ashanti Region, Ghana
Effective Date: February 28, 2022
Page 118
Table 11-9 Esaase Exploration CRM Results
Au Standard(s) No. of Samples
Calculated Values
Std Code Method Exp Method
Exp Value
Exp SD Mean Au SD CV Mean Bias
G300-9 FA50_AAS FA50_AAS 1.5300 0.0600 68 1.5343 0.0668 0.0435 0.28%
G308-3 FA50_AAS FA50_AAS 2.5000 0.1100 87 2.5111 0.1074 0.0428 0.45%
G311-5 FA50_AAS FA50_AAS 1.3200 0.0600 79 1.3552 0.0460 0.0340 2.67%
G317-2 FA50_AAS FA50_AAS 12.9700 0.4100 47 12.4906 0.4373 0.0350 -3.70%
G901-3 FA50_AAS FA50_AAS 2.8700 0.1400 9 2.8600 0.1843 0.0644 -0.35%
G910-1 FA50_AAS FA50_AAS 1.4300 0.0600 50 1.4280 0.0763 0.0534 -0.14%
G910-6 FA50_AAS FA50_AAS 3.0900 0.1300 84 3.0944 0.0910 0.0294 0.14%
G912-2 FA50_AAS FA50_AAS 2.5100 0.1500 9 2.4767 0.0731 0.0295 -1.33%
G914-10 FA50_AAS FA50_AAS 10.2600 0.3800 13 10.4792 0.4156 0.0397 2.14%
G914-6 FA50_AAS FA50_AAS 3.2100 0.1200 76 3.1864 0.1252 0.0393 -0.73%
Note: * No systematic bias noted; SD – Standard deviation; CV – Coefficient of variation; CRM – certified reference material
Sample Precision
• 524 Field Duplicates were collected.
• Figure 11-7 shows Repeat Scatter Plot of original samples and field duplicate samples for exploration drilling at Esaase, with warning set to 15% variation limit.
• Figure 11-8 shows that nearly 55% of the paired filed duplicates had an absolute relative difference of less than 30%, typical for field duplicate gold analysis.
Figure 11-7 Scatter Plot of Original vs Field Duplicates for Esaase Exploration/Infill Drilling

NI 43-101 Technical Report for the Asanko Gold Mine, Ashanti Region, Ghana
Effective Date: February 28, 2022
Page 119
Figure 11-8 HARD Plot of Original vs Field Duplicates for Esaase Exploration/Infill Drilling
Between Laboratory Bias
• No umpire samples were submitted for the Esaase infill program.
Primary Laboratory Quality Control Insertions
• Intertek lab typically includes 4% pulp duplicate/re-split “checks” in each batch. Original results and pulp duplicate results generally compare very well for grades below 7 g/t.

NI 43-101 Technical Report for the Asanko Gold Mine, Ashanti Region, Ghana
Effective Date: February 28, 2022
Page 120
Figure 11-9 QQ Plot of Original vs Pulp Duplicates for Esaase Exploration/Infill Drilling
Samples from the 2020 Esaase program show no significant cross contamination, systematic assay bias or precision issues.
Esaase Grade Control QC
Grade control samples were used in 2021 Esaase resource estimation to a limited extent. The QP responsible for Esaase resource model did a thorough review of statistical and spatial distribution of the GC data in comparison with exploration data, and concluded that the GC data was suitable for global resource estimation and short-term mine planning may benefit from the use of GC data in the grade estimation. GC data was used only in the first pass of grade estimation with a maximum of 40 meters range of influence. More details and relevant GC data assessment are presented in Esaase section of Chapter 14.
Table 11-10 Esaase GC Sample Statistics for the Period of 20/11/2019 to 30/10/2021
Laboratories ASANKO LAB
No. of Batches 2,895
No. of DH Samples 460,048
No. of QC Samples 31,082 (6.8%)
No. of Standard Samples 52,239 (11.4%)
GC samples were assayed at the AGM laboratory by leachwell bottle roll for oxide material and fire assay for fresh material.

NI 43-101 Technical Report for the Asanko Gold Mine, Ashanti Region, Ghana
Effective Date: February 28, 2022
Page 121
GC Cross Contamination
A significant portion of the results returned greater than 2 times the lower detection limit suggesting the blank being used may not be satisfactorily devoid in gold mineralization or a sample preparation issue in the laboratory.
Figure 11-10 is an example of a Blank control chart
Figure 11-10 Plot of Blanks for Esaase Grade Control Drilling for the Period Noted
GC Assay Accuracy (Bias)
• A significant number of breaches of mean ± 3SD for grade control samples noted across a range of CRM materials, throughout the time period. These are illustrated in Figure 11-11 below and circled in bold red.
• No significant bias relative to the expected mean grade is evident for most CRMs (Table 11-11). Two CRMs indicate a significant high bias relative to the expected mean grade for very high grades. Two CRMs indicate a significant low and high biases relative to the expected mean grade near 0.8 and 0.9 g/t.

NI 43-101 Technical Report for the Asanko Gold Mine, Ashanti Region, Ghana
Effective Date: February 28, 2022
Page 122

NI 43-101 Technical Report for the Asanko Gold Mine, Ashanti Region, Ghana
Effective Date: February 28, 2022
Page 123
Figure 11-11 Plot of Various CRM’s That Have Exceeded 3SD (Esaase)
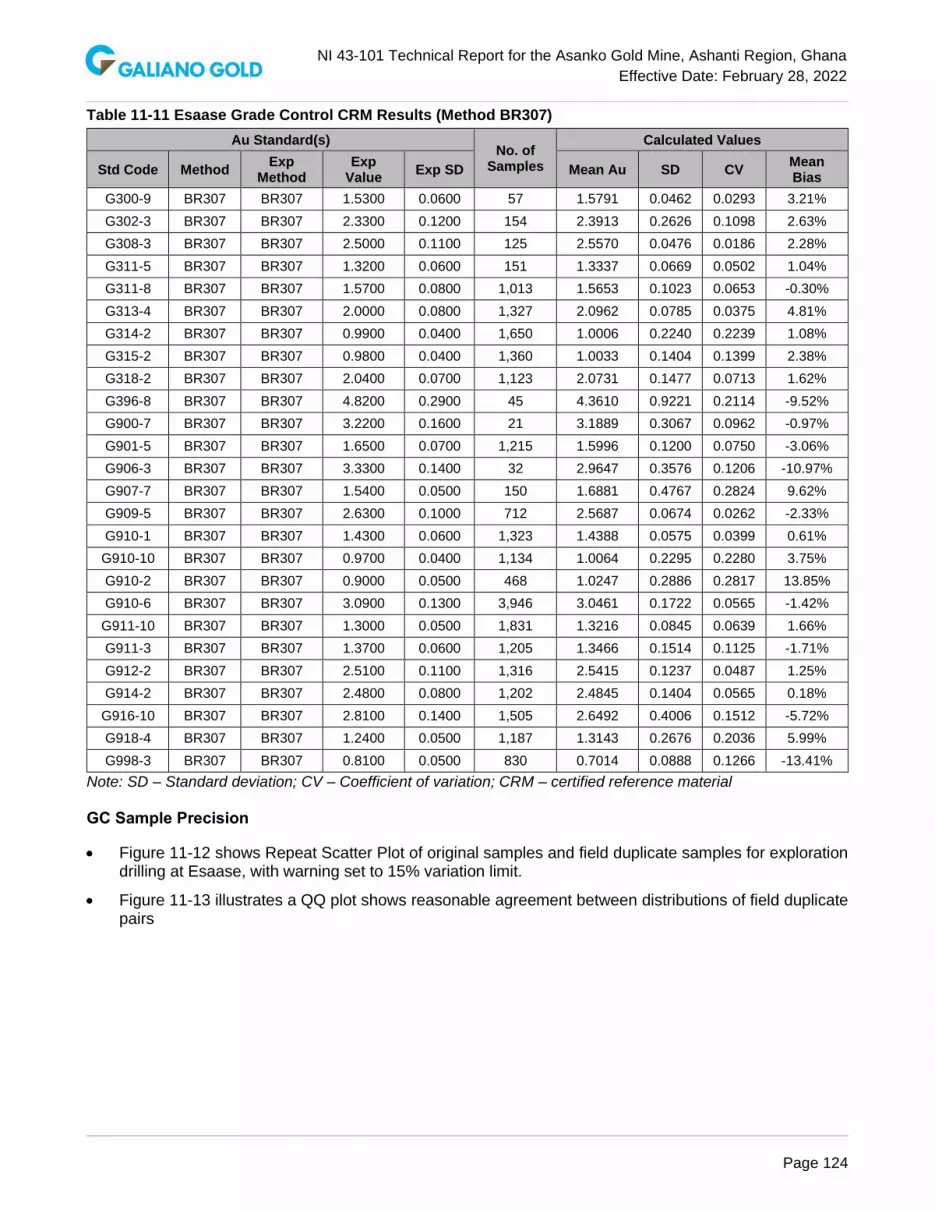
NI 43-101 Technical Report for the Asanko Gold Mine, Ashanti Region, Ghana
Effective Date: February 28, 2022
Page 124
Table 11-11 Esaase Grade Control CRM Results (Method BR307)
Au Standard(s) No. of
Samples
Calculated Values
Std Code Method Exp
Method Exp
Value Exp SD Mean Au SD CV
Mean Bias
G300-9 BR307 BR307 1.5300 0.0600 57 1.5791 0.0462 0.0293 3.21%
G302-3 BR307 BR307 2.3300 0.1200 154 2.3913 0.2626 0.1098 2.63%
G308-3 BR307 BR307 2.5000 0.1100 125 2.5570 0.0476 0.0186 2.28%
G311-5 BR307 BR307 1.3200 0.0600 151 1.3337 0.0669 0.0502 1.04%
G311-8 BR307 BR307 1.5700 0.0800 1,013 1.5653 0.1023 0.0653 -0.30%
G313-4 BR307 BR307 2.0000 0.0800 1,327 2.0962 0.0785 0.0375 4.81%
G314-2 BR307 BR307 0.9900 0.0400 1,650 1.0006 0.2240 0.2239 1.08%
G315-2 BR307 BR307 0.9800 0.0400 1,360 1.0033 0.1404 0.1399 2.38%
G318-2 BR307 BR307 2.0400 0.0700 1,123 2.0731 0.1477 0.0713 1.62%
G396-8 BR307 BR307 4.8200 0.2900 45 4.3610 0.9221 0.2114 -9.52%
G900-7 BR307 BR307 3.2200 0.1600 21 3.1889 0.3067 0.0962 -0.97%
G901-5 BR307 BR307 1.6500 0.0700 1,215 1.5996 0.1200 0.0750 -3.06%
G906-3 BR307 BR307 3.3300 0.1400 32 2.9647 0.3576 0.1206 -10.97%
G907-7 BR307 BR307 1.5400 0.0500 150 1.6881 0.4767 0.2824 9.62%
G909-5 BR307 BR307 2.6300 0.1000 712 2.5687 0.0674 0.0262 -2.33%
G910-1 BR307 BR307 1.4300 0.0600 1,323 1.4388 0.0575 0.0399 0.61%
G910-10 BR307 BR307 0.9700 0.0400 1,134 1.0064 0.2295 0.2280 3.75%
G910-2 BR307 BR307 0.9000 0.0500 468 1.0247 0.2886 0.2817 13.85%
G910-6 BR307 BR307 3.0900 0.1300 3,946 3.0461 0.1722 0.0565 -1.42%
G911-10 BR307 BR307 1.3000 0.0500 1,831 1.3216 0.0845 0.0639 1.66%
G911-3 BR307 BR307 1.3700 0.0600 1,205 1.3466 0.1514 0.1125 -1.71%
G912-2 BR307 BR307 2.5100 0.1100 1,316 2.5415 0.1237 0.0487 1.25%
G914-2 BR307 BR307 2.4800 0.0800 1,202 2.4845 0.1404 0.0565 0.18%
G916-10 BR307 BR307 2.8100 0.1400 1,505 2.6492 0.4006 0.1512 -5.72%
G918-4 BR307 BR307 1.2400 0.0500 1,187 1.3143 0.2676 0.2036 5.99%
G998-3 BR307 BR307 0.8100 0.0500 830 0.7014 0.0888 0.1266 -13.41%
Note: SD – Standard deviation; CV – Coefficient of variation; CRM – certified reference material
GC Sample Precision
• Figure 11-12 shows Repeat Scatter Plot of original samples and field duplicate samples for exploration drilling at Esaase, with warning set to 15% variation limit.
• Figure 11-13 illustrates a QQ plot shows reasonable agreement between distributions of field duplicate pairs

NI 43-101 Technical Report for the Asanko Gold Mine, Ashanti Region, Ghana
Effective Date: February 28, 2022
Page 125
Figure 11-12 Scatter Plot of Original vs Field Duplicates for Esaase Grade Control Drilling
Figure 11-13 QQ Plot of Original vs Field Duplicates for Esaase GC RC Drilling
Low ratio of blanks to samples in GC RC data is of concern, as is the number of CRM breaches above and below 3xSD. Based on a thorough review of statistical and spatial distribution of the GC data in comparison with exploration data, the wide scatter of values in GC RC duplicate data is not considered a material issue in the context of the deposits resource estimation.

NI 43-101 Technical Report for the Asanko Gold Mine, Ashanti Region, Ghana
Effective Date: February 28, 2022
Page 126
11.2.6.3 Miradani North
Forty-six holes were drilled between November 20th, 2019 to October 30th, 2021 at Miradani North. QC samples insertion rates are summarized in Table 11-12. This dataset represents the entire dataset used to support grade estimation at Miradani North.
Table 11-12 Miradani North QAQC Samples for Period 20/11/2019 to 10/30/2021
Cross Contamination
• A total of 569 BLANK samples were submitted to the lab.
• All blanks passed at -1 & +3 standard deviations.
• Figure 11-14 is an example of a Blank control chart.
Figure 11-14 Plot of Blanks for Miradani North Exploration Drilling for the Period Noted
Assay Accuracy (Bias)
• 567 CRM were inserted
• CRM’s performed well with no significant breaches of the mean ± 3SD limit in exploration data. Minor samples that did breach were either within waste zones or performed well on rerun. A small number of failures noted, all within waste zones (see Figure 11-15 and Figure 11-16 with breaches circled in red)
• Table 11-13 shows no significant bias is evident.
Reference Material Number Inserted Total No of Samples Sent Percentage of Reference Material (%)
Blanks 569 3.25
CRM 567 3.24
Duplicates 731 4.17
Total 1,867 17,508 10.66

NI 43-101 Technical Report for the Asanko Gold Mine, Ashanti Region, Ghana
Effective Date: February 28, 2022
Page 127
Figure 11-15 Plot of CRM Standard Performance for G308-3 for Miradani North Exploration
Figure 11-16 Plot of CRM Performance for G910-6 for Miradani North Exploration

NI 43-101 Technical Report for the Asanko Gold Mine, Ashanti Region, Ghana
Effective Date: February 28, 2022
Page 128
Table 11-13 Miradani North CRM Results Showing Mean Bias
Au Standard(s) No. of Samples
Calculated Values
Std Code Method Exp Method
Exp Value
Exp SD Mean Au SD CV Mean Bias G300-9 FA50_AAS FA50_AAS 1.5300 0.0600 121 1.5389 0.0595 0.0387 0.58%
G308-3 FA50_AAS FA50_AAS 2.5000 0.1100 134 2.5222 0.0893 0.0354 0.89%
G311-8 FA50_AAS FA50_AAS 1.5700 0.0800 47 1.5800 0.0600 0.0380 0.64%
G317-2 FA50_AAS FA50_AAS 12.9700 0.4100 19 13.0188 0.5783 0.0444 0.38%
G910-6 FA50_AAS FA50_AAS 3.0900 0.1300 157 3.0776 0.1260 0.0409 -0.40%
G914-10 FA50_AAS FA50_AAS 10.2600 0.3800 71 10.3185 1.0208 0.0989 0.57%
G914-2 FA50_AAS FA50_AAS 2.4800 0.0800 18 2.5356 0.0713 0.0281 2.24%
Assay Precision
• 731 field duplicate samples were collected to check the sample variability.
• Figure 11-17 below shows Repeat Scatter Plot of original samples and field duplicate samples for exploration drilling at Miradani, with warning set to 15% variation limit.
• Figure 11-18 shows that approximately 65% of the paired filed duplicates had an absolute relative difference of less than 30%, good for field duplicate gold analysis.
Figure 11-17 Scatter Plot of Originals vs Field Duplicate Samples at Miradani North

NI 43-101 Technical Report for the Asanko Gold Mine, Ashanti Region, Ghana
Effective Date: February 28, 2022
Page 129
Figure 11-18 HARD Plot for Miradani North
Between Laboratory Bias
• One hundred and twenty-two umpire samples originally assayed by Intertek Kumasi, were sent to ALS to check lab performance. No bias was noted.
Primary Laboratory Quality Control Insertions
• Intertek lab typically includes 4% pulp duplicate/re-split “checks” in each batch. Original results and pulp duplicate results generally compare very well for grades below 7 g/t.
Figure 11-19 QQ Plot For Pulp Duplicates at Miradani North

NI 43-101 Technical Report for the Asanko Gold Mine, Ashanti Region, Ghana
Effective Date: February 28, 2022
Page 130
11.2.6.4 Dynamite Hill
Thirty holes were drilled between July 16th, 2021 to September 7th, 2021 at Dynamite Hill. QC sample insertion rates are summarized in Table 11-14.
Table 11-14 Dynamite Hill QAQC Samples For Period 16/7/2021 to 7/9/2021
Reference Material Number Inserted Total No of Samples Sent Percentage of Reference Material (%)
Blanks 188 - 3.38
CRM 188 - 3.38
Duplicates 188 - 3.38
Total 564 5,554 10.14
Cross Contamination
• There were 188 BLANKS samples submitted to the lab together with original samples
• All blanks passed at -2 and +3 standard deviation
• Figure 11-20 shows an example of a Blank control chart
Figure 11-20 Plot of Blanks Performance at Dynamite Hill for the Period Stated
Assay Accuracy (Bias)
• 188 CRM were inserted
• CRM’s performed well with no significant breaches of the mean ± 3SD limit in exploration data. Minor samples that did breach were either within waste zones or performed well on rerun. A small number of failures noted, within waste zones as with CRM G308-3 in Figure 11-21 below, with breaches circled in red. The breach in G910-6 (Figure 11-22) was investigated and was suspected to be a case of wrong labelling. This sample falls within a wide waste zone and so was not re-assayed
• Table 11-15 shows no significant bias is evident
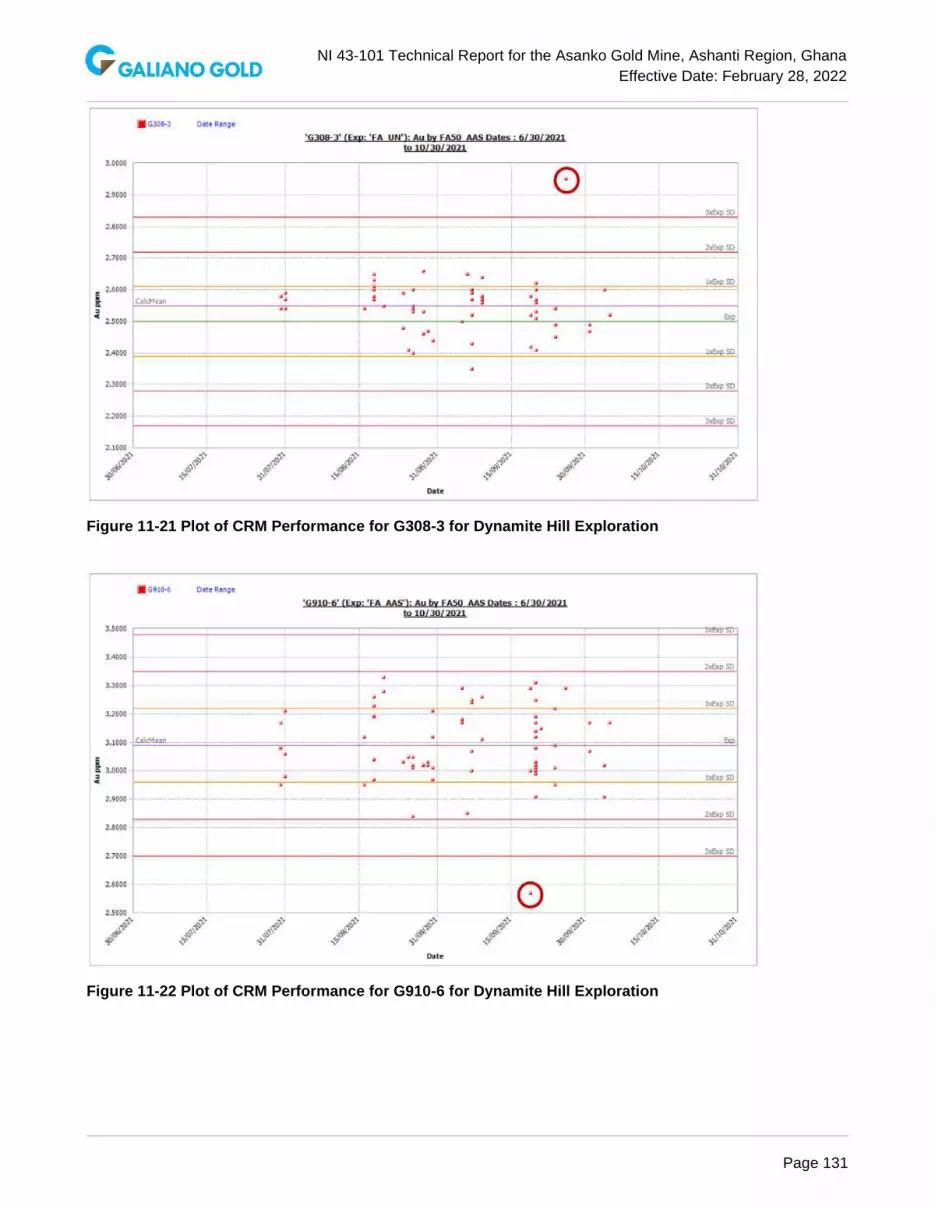
NI 43-101 Technical Report for the Asanko Gold Mine, Ashanti Region, Ghana
Effective Date: February 28, 2022
Page 131
Figure 11-21 Plot of CRM Performance for G308-3 for Dynamite Hill Exploration
Figure 11-22 Plot of CRM Performance for G910-6 for Dynamite Hill Exploration

NI 43-101 Technical Report for the Asanko Gold Mine, Ashanti Region, Ghana
Effective Date: February 28, 2022
Page 132
Table 11-15 Dynamite Hill CRM Results Showing Mean Bias
Au Standard(s) No. of
Samples
Calculated Values
Std Code Method Exp Method
Exp Value
Exp SD Mean Au SD CV Mean Bias
G300-9 FA50_AAS FA50_AAS 1.5300 0.0600 11 1.5445 0.0548 0.0355 0.95%
G308-3 FA50_AAS FA50_AAS 2.5000 0.1100 62 2.5485 0.0861 0.0338 1.94%
G311-8 FA50_AAS FA50_AAS 1.5700 0.0800 48 1.5648 0.0784 0.0501 -0.33%
G910-6 FA50_AAS FA50_AAS 3.0900 0.1300 67 3.0899 0.1346 0.0436 0.00%
Assay Precision
• 188 field duplicate samples were collected to check the sample variability.
• Figure 11-23 below shows Repeat Scatter Plot of original samples and field duplicate samples for exploration drilling at Dynamite Hill, with warning set to 15% variation limit.
• Figure 11-24 shows that approximately 60% of the paired filed duplicates had an absolute relative difference of less than 30%, good for field duplicate gold analysis.
Figure 11-23 Scatter Plot of Duplicate vs Original Performance at Dynamite Hill

NI 43-101 Technical Report for the Asanko Gold Mine, Ashanti Region, Ghana
Effective Date: February 28, 2022
Page 133
Figure 11-24 HARD Plot Analysis of Duplicate vs Original Performance at Dynamite Hill
Between Laboratory Bias
• No check samples were submitted for this period.
Primary Laboratory Quality Control Insertions
• Not assessed
No material failings were observed with cross contamination or assay accuracy.
11.2.6.5 Akwasiso
A total of 40 exploration holes were drilled at Akwasiso between November 20th, 2019 to October 30th, 2021. QC sample insertion rate are summarized in Table 11-16.
Table 11-16 Akwasiso QAQC Samples For Period 20/11/2019 to 30/10/2021
Reference Material Number Inserted Total No of Samples Sent Percentage of Reference Material (%)
Blanks 214 - 3.19
CRM 220 - 3.28
Duplicates 219 - 3.26
Total 653 6,711 9.73
Cross Contamination
• There were 214 BLANKS samples submitted to the lab together with original samples.
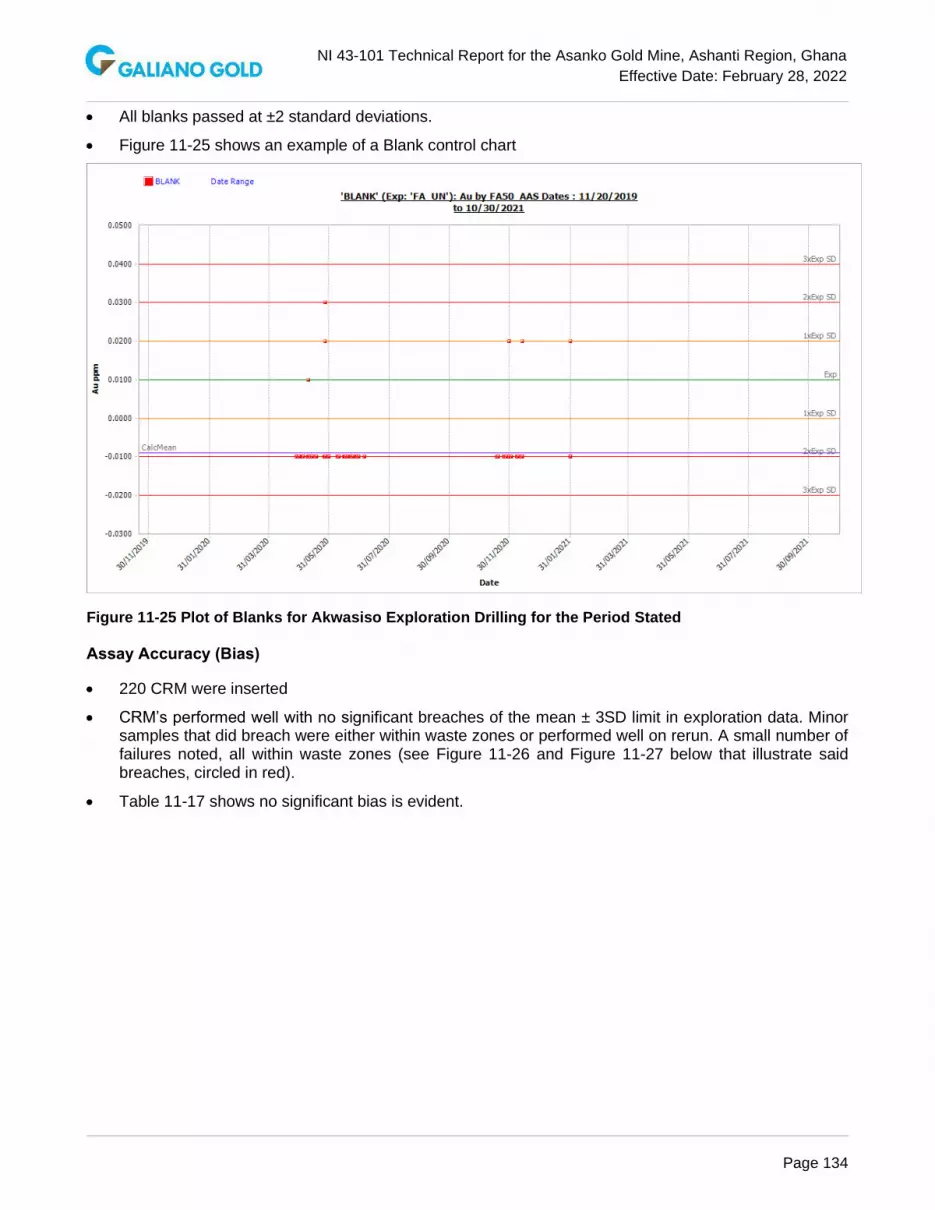
NI 43-101 Technical Report for the Asanko Gold Mine, Ashanti Region, Ghana
Effective Date: February 28, 2022
Page 134
• All blanks passed at ±2 standard deviations.
• Figure 11-25 shows an example of a Blank control chart
Figure 11-25 Plot of Blanks for Akwasiso Exploration Drilling for the Period Stated
Assay Accuracy (Bias)
• 220 CRM were inserted
• CRM’s performed well with no significant breaches of the mean ± 3SD limit in exploration data. Minor samples that did breach were either within waste zones or performed well on rerun. A small number of failures noted, all within waste zones (see Figure 11-26 and Figure 11-27 below that illustrate said breaches, circled in red).
• Table 11-17 shows no significant bias is evident.

NI 43-101 Technical Report for the Asanko Gold Mine, Ashanti Region, Ghana
Effective Date: February 28, 2022
Page 135
Figure 11-26 Plot of CRM Performance for G901-3
Figure 11-27 Plot of CRM Performance for G910-6

NI 43-101 Technical Report for the Asanko Gold Mine, Ashanti Region, Ghana
Effective Date: February 28, 2022
Page 136
Table 11-17 Akwasiso Exploration CRM Results
Au Standard(s) No. of Samples
Calculated Values
Std Code Method Exp Method
Exp Value
Exp SD Mean Au SD CV Mean Bias
G300-9 FA50_AAS FA50_AAS 1.5300 0.0600 74 1.5047 0.0704 0.0468 -1.65%
G308-3 FA50_AAS FA50_AAS 2.5000 0.1100 13 2.5462 0.0671 0.0264 1.85%
G311-8 FA50_AAS FA50_AAS 1.5700 0.0800 20 1.5765 0.0472 0.0299 0.41%
G901-3 FA50_AAS FA50_AAS 2.8700 0.1400 39 2.9156 0.1731 0.0594 1.59%
G910-1 FA50_AAS FA50_AAS 1.4300 0.0600 4 1.4200 0.0383 0.0270 -0.70%
G910-6 FA50_AAS FA50_AAS 3.0900 0.1300 70 3.0851 0.1246 0.0404 -0.16%
Note: SD – Standard deviation; CV –Coefficient of variation
Assay Precision
• 219 field duplicate samples were collected to check the sample variability.
• Figure 11-28 below shows Repeat Scatter Plot of original samples and field duplicate samples for exploration drilling at Akwasiso, with warning set to 15% variation limit.
• Figure 11-29 shows that approximately 55% of the paired filed duplicates had an absolute relative difference of less than 30%, reasonable for field duplicate gold analysis.
Figure 11-28 Akwasiso Exploration Field Duplicate Scatter Plot

NI 43-101 Technical Report for the Asanko Gold Mine, Ashanti Region, Ghana
Effective Date: February 28, 2022
Page 137
Figure 11-29 Akwasiso Exploration Field Duplicate HARD Analysis Plot
Between Laboratory Bias
• There were 59 umpire samples from 2020 exploration drilling originally assayed at Intertek Kumasi, sent to ALS for check assays. No bias was detected.
Primary Laboratory Quality Control Insertions
• Intertek lab typically includes 4% pulp duplicate/re-split “checks” in each batch. Original results and pulp duplicate results generally compare very well for grades below 7 g/t.

NI 43-101 Technical Report for the Asanko Gold Mine, Ashanti Region, Ghana
Effective Date: February 28, 2022
Page 138
Figure 11-30 Akwasiso Exploration Pulp Duplicate QQ Plots
Akwasiso Grade Control Assays
Grade control samples were also used in 2021 Akwasiso resource estimation. The QP responsible for Akwasiso resource model conducted thorough review of statistical and spatial distribution of the GC data in comparison with exploration data and concluded that the GC data was suitable for global resource estimation and short-term mine planning may benefit from the use of GC data in the grade estimation. More details and relevant GC data assessment are presented in Section 14 of this Report. QC sample insertion rates are summarized in Table 11-18.
Table 11-18 Akwasiso GC Samples for Period 20/11/2019 to 30/10/2021
Reference Material Number Inserted Total No of Samples Sent Percentage of Reference Material (%)
Blanks 1,566 - 4.82
CRM 1,554 - 4.78
Duplicates 1,564 - 4.81
Total 4,684 32,511 14.41
Cross Contamination
• There were 1,556 BLANKS samples submitted to the lab together with original samples.
• All blanks passed at ±2 standard deviations.
• Figure 11-31 is an example of a Blank control chart

NI 43-101 Technical Report for the Asanko Gold Mine, Ashanti Region, Ghana
Effective Date: February 28, 2022
Page 139
Figure 11-31 Plot of Blanks for Akwasiso Grade Control RC Drilling for the Period Noted
Assay Accuracy (Bias)
• 1,554 CRM were inserted
• CRM’s performed well with no significant breaches of the mean ± 3SD limit in exploration data. Minor samples that did breach were either within waste zones or performed well on rerun. A small number of failures noted, all within waste zones. These are shown in Figure 11-32 and Figure 11-33 below, with breaches circled in red.
Table 11-19 shows no significant bias is evident except for CRM BR307 which is a low-grade control sample typically used as a blank.

NI 43-101 Technical Report for the Asanko Gold Mine, Ashanti Region, Ghana
Effective Date: February 28, 2022
Page 140
Figure 11-32 Plot of CRM G318-2 Performance for Akwasiso GC
Figure 11-33 Plot of CRM G315-2 Performance for Akwasiso GC
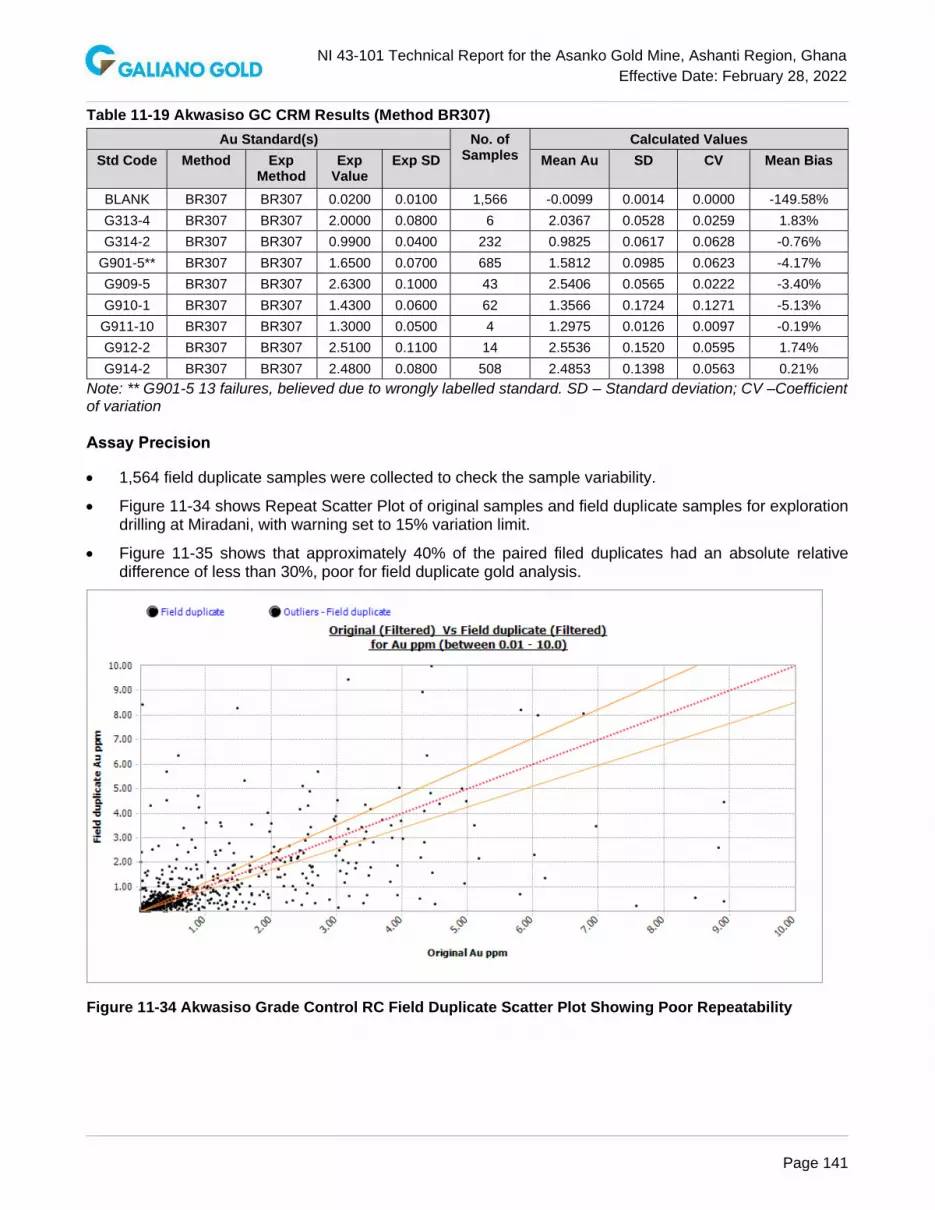
NI 43-101 Technical Report for the Asanko Gold Mine, Ashanti Region, Ghana
Effective Date: February 28, 2022
Page 141
Table 11-19 Akwasiso GC CRM Results (Method BR307)
Au Standard(s) No. of Samples
Calculated Values
Std Code Method Exp Method
Exp Value
Exp SD Mean Au SD CV Mean Bias
BLANK BR307 BR307 0.0200 0.0100 1,566 -0.0099 0.0014 0.0000 -149.58%
G313-4 BR307 BR307 2.0000 0.0800 6 2.0367 0.0528 0.0259 1.83%
G314-2 BR307 BR307 0.9900 0.0400 232 0.9825 0.0617 0.0628 -0.76%
G901-5** BR307 BR307 1.6500 0.0700 685 1.5812 0.0985 0.0623 -4.17%
G909-5 BR307 BR307 2.6300 0.1000 43 2.5406 0.0565 0.0222 -3.40%
G910-1 BR307 BR307 1.4300 0.0600 62 1.3566 0.1724 0.1271 -5.13%
G911-10 BR307 BR307 1.3000 0.0500 4 1.2975 0.0126 0.0097 -0.19%
G912-2 BR307 BR307 2.5100 0.1100 14 2.5536 0.1520 0.0595 1.74%
G914-2 BR307 BR307 2.4800 0.0800 508 2.4853 0.1398 0.0563 0.21%
Note: ** G901-5 13 failures, believed due to wrongly labelled standard. SD – Standard deviation; CV –Coefficient of variation
Assay Precision
• 1,564 field duplicate samples were collected to check the sample variability.
• Figure 11-34 shows Repeat Scatter Plot of original samples and field duplicate samples for exploration drilling at Miradani, with warning set to 15% variation limit.
• Figure 11-35 shows that approximately 40% of the paired filed duplicates had an absolute relative difference of less than 30%, poor for field duplicate gold analysis.
Figure 11-34 Akwasiso Grade Control RC Field Duplicate Scatter Plot Showing Poor Repeatability
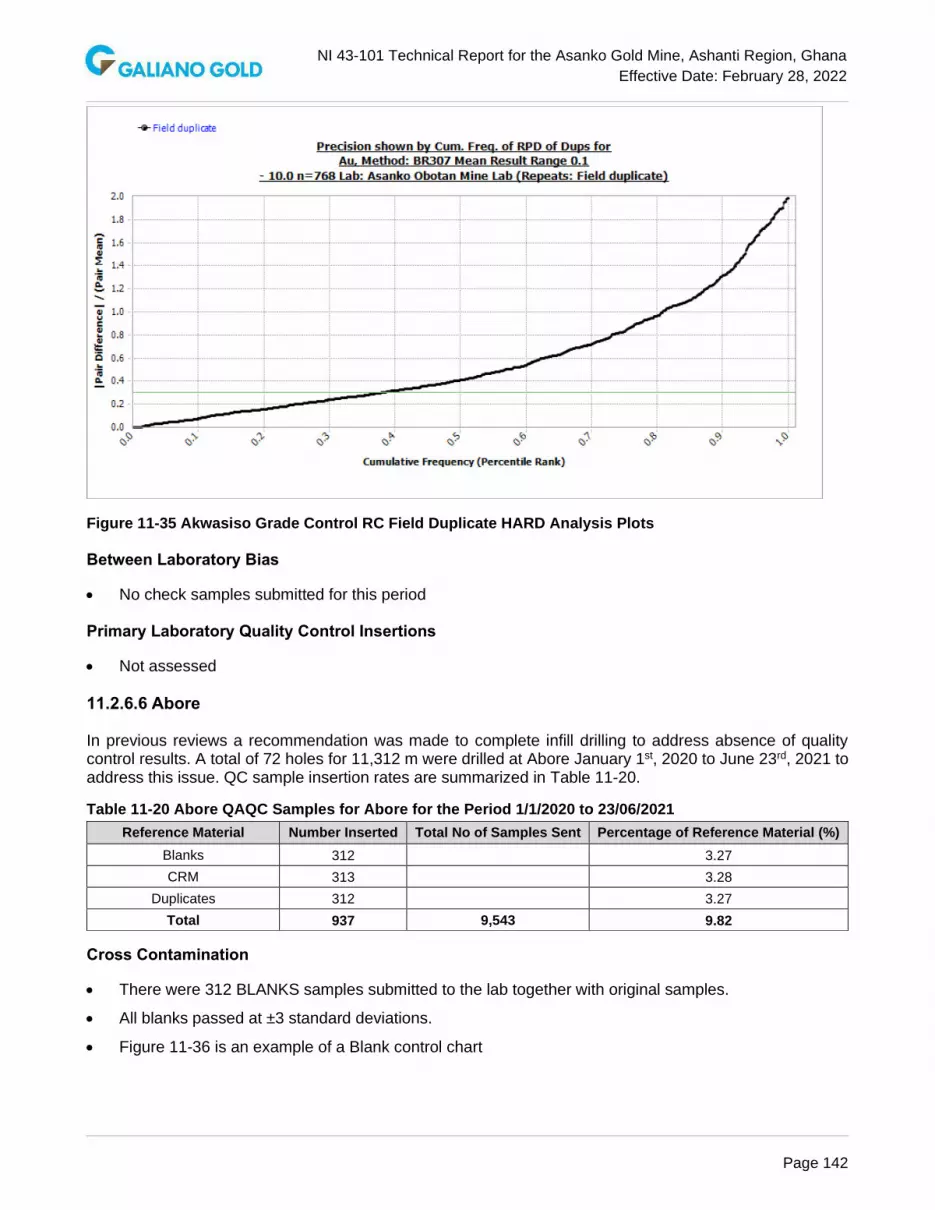
NI 43-101 Technical Report for the Asanko Gold Mine, Ashanti Region, Ghana
Effective Date: February 28, 2022
Page 142
Figure 11-35 Akwasiso Grade Control RC Field Duplicate HARD Analysis Plots
Between Laboratory Bias
• No check samples submitted for this period
Primary Laboratory Quality Control Insertions
• Not assessed
11.2.6.6 Abore
In previous reviews a recommendation was made to complete infill drilling to address absence of quality control results. A total of 72 holes for 11,312 m were drilled at Abore January 1st, 2020 to June 23rd, 2021 to address this issue. QC sample insertion rates are summarized in Table 11-20.
Table 11-20 Abore QAQC Samples for Abore for the Period 1/1/2020 to 23/06/2021
Cross Contamination
• There were 312 BLANKS samples submitted to the lab together with original samples.
• All blanks passed at ±3 standard deviations.
• Figure 11-36 is an example of a Blank control chart
Reference Material Number Inserted Total No of Samples Sent Percentage of Reference Material (%)
Blanks 312 3.27
CRM 313 3.28
Duplicates 312 3.27
Total 937 9,543 9.82

NI 43-101 Technical Report for the Asanko Gold Mine, Ashanti Region, Ghana
Effective Date: February 28, 2022
Page 143
Figure 11-36 Plot of Blanks for Abore Exploration Drilling for the Period Noted
Assay Accuracy (Bias)
• 312 CRM were inserted
• CRM’s performed well with no significant breaches of the mean ± 3xSD limit in exploration data. Minor samples that did breach were either within waste zones or performed well on rerun. A small number of failures noted, all within waste zones, illustrated in Figure 11-37 below, with breaches circled in red.
• Table 11-21 shows no significant bias is evident
Figure 11-37 Plot of CRM G914-2 and G914-10 Performance for Abore Exploration

NI 43-101 Technical Report for the Asanko Gold Mine, Ashanti Region, Ghana
Effective Date: February 28, 2022
Page 144
Table 11-21 Abore Exploration CRM Results
STD_ID Method Expected
Value Expected
SD Number of Samples Mean Au
Calculated SD Mean Bias
G300-9 FA50_AAS 1.53 0.06 72 1.5113 0.0661 -1.22%
G308-3 FA50_AAS 2.5 0.11 40 2.5011 0.154 0.04%
G311-8 FA50_AAS 1.57 0.08 44 1.5611 0.0663 -0.56%
G317-2 FA50_AAS 12.97 0.41 5 13.118 0.9508 1.14%
G901-3 FA50_AAS 2.87 0.14 26 2.9563 0.2027 3.01%
G910-1 FA50_AAS 1.43 0.06 1 1.4 0 -2.10%
G910-6 FA50_AAS 3.09 0.13 82 3.1044 0.1184 0.47%
G914-10 FA50_AAS 10.26 0.38 40 10.2811 0.6663 0.21%
G914-2 FA50_AAS 2.48 0.08 3 2.6267 0.2875 5.91%
Assay Precision
• 312 field duplicate samples were collected to check the sample variability.
• Figure 11-38 shows Repeat Scatter Plot of original samples and field duplicate samples for exploration drilling at Abore, with warning set to 15% variation limit.
• Figure 11-39 shows that approximately 60% of the paired filed duplicates had an absolute relative difference of less than 30%, good for field duplicate gold analysis.
Figure 11-38 Scatter Plot of Field Duplicates from Abore Exploration Drilling for the Period Noted

NI 43-101 Technical Report for the Asanko Gold Mine, Ashanti Region, Ghana
Effective Date: February 28, 2022
Page 145
Figure 11-39 HARD Analysis of Field Duplicates from Abore Exploration Drilling
Between Laboratory Bias
• No check samples submitted for this period
Primary Laboratory Quality Control Insertions
• Not assessed
• Generally good quality data from Abore, with acceptable CRM failures, a good repeatability fit for duplicate data and no contamination issues.
11.2.6.7 Asuadai
• No drilling in 2020-2021
11.2.6.8 Adubiaso
• A total of 5 holes for 1,312 m were drilled at Adubiaso May 1st to June 30th, 2020 to provide infill. QC sample insertion rates are summarized in Table 11-22.
Table 11-22 Adubiaso QAQC Samples for the Period 01/05/2020 to 30/06/2020
Reference Material Number Inserted Total No of Samples Sent Percentage of Reference Material (%) Blanks 42 3.818
CRM 41 3.727
Duplicates 41 3.727
Total 124 1,100 11.272

NI 43-101 Technical Report for the Asanko Gold Mine, Ashanti Region, Ghana
Effective Date: February 28, 2022
Page 146
Cross Contamination
• There were 42 BLANKS samples submitted to the lab together with original samples.
• All blanks passed at ± 1 & 2 standard deviations
• Figure 11-40 is an example of a Blank control chart
Figure 11-40 Plot of Blanks for Adubiaso Infill Drilling for the Period Noted
Assay Accuracy (Bias)
• 41 CRM were inserted
• CRM’s performed well with no significant breaches of the mean ± 3SD limit in exploration data.
• Table 11-23 shows no significant bias is evident
Table 11-23 Adubiaso Exploration CRM Results
STD_ID Method Expected
Value Expected
SD Number of Samples Mean Au
Calculated SD Mean Bias
G300-9 FA50_AAS 1.5300 0.0600 14 1.4943 0.0921 -2.33%
G901-3 FA50_AAS 2.8700 0.1400 11 2.9727 0.1181 3.58%
G910-6 FA50_AAS 3.0900 0.1300 14 3.1029 0.0981 0.42%
G910-1 FA50_AAS 1.4300 0.0600 1 1.4200 0.0000 -0.70%
G907-2 FA50_AAS 0.8900 0.0600 1 0.9500 0.0000 6.74%
Assay Precision
• 41 field duplicate samples were collected to check the sample variability.
• Figure 11-41 shows Repeat Scatter Plot of original samples and field duplicate samples for exploration drilling at Adubiaso, with warning set to 15% variation limit.

NI 43-101 Technical Report for the Asanko Gold Mine, Ashanti Region, Ghana
Effective Date: February 28, 2022
Page 147
Figure 11-41 Scatter Plot of Field Duplicates from Adubiaso Infill Drilling
Figure 11-42 HARD Analysis of Field Duplicates from Adubiaso Infill Drilling

NI 43-101 Technical Report for the Asanko Gold Mine, Ashanti Region, Ghana
Effective Date: February 28, 2022
Page 148
Between Laboratory Bias
• No check samples submitted for this period
Primary Laboratory Quality Control Insertions
• Not assessed
Generally good quality data from Adubiaso, with no CRM failures, a good repeatability fit for duplicate data and no contamination issues.
11.3 Qualified Person’s Opinion on Adequacy of Sample Preparation, Security
It is the opinion of Qualified Person that the QA/QC data provides reasonable support for the reliability of the sample database for the Asanko Gold deposits under investigation such that it supports Mineral Resource estimation without limitation on confidence classification. After reviewing this data, even though there has been a lot of work done, it is recommended to improve QAQC reporting from the Asanko lab, particularly as it relates to CRM and blank failures. Documentation and reporting of lab check results could also be improved. The QP has reviewed the quality of data and does not believe there is a risk of the data to be used for the resource estimate.

NI 43-101 Technical Report for the Asanko Gold Mine, Ashanti Region, Ghana
Effective Date: February 28, 2022
Page 149
12 DATA VERIFICATION
Previous extensive data verification has been undertaken by several independent consultants over the periods when Keegan and PMI owned the Esaase and Nkran properties respectively, prior to the Asanko Gold takeover of PMI and the merger of the two entities as Asanko Gold and the commencement of mining from the Nkran pit in 2015. These independent consultants included SRK (2011, 2012), CJM (2014, 2016), CSA Global (2016, 2019). The QP (Greg Collins, former VP Exploration for Galiano Gold) has read the data verification procedures and results in those reports and agrees with their conclusions regarding reliability of the data.
The verification steps undertaken by the earlier mine operators are shown below. The Qualified Person’s data verification activities support the conclusions by previous operators.
The current data for the various Obotan and Esaase tenements is based on the available exploration drill hole data. Geological models and litho-domains provided were developed internally using paper sectional interpretations and Leapfrog Geo 3D modelling by Asanko/Galiano Gold staff. Paper sectional interpretations in themselves are a method of cross checking how legacy data compares with adjacent AGM generated data in terms of consistent collar RL’s, geology and in some cases, assay continuity. Having reviewed all necessary procedures in place to collect and check data quality, as well as checking the quality of the data itself, the QP is satisfied with the accuracy of the data for the purposes of estimating Mineral Resources. Industry standard QAQC procedures are in place at AGM to ensure quality geological, assay and density data collection.
12.1 Data Validation and Site Visits
The Qualified Person (Greg Collins, former VP Exploration for Galiano Gold) has visited the AGM on numerous occasions during 2021, up to three months at a time. The most recent visit was in November 2021. During these visits, the QP has reviewed the items listed below for current 2021 drilling at Esaase, Miradani North, Dynamite Hill, and Abore:
• Drilling techniques with emphasis on appropriateness of the drilling method
• Sampling procedures
• Logging procedures
• Structural logging procedures
• Density estimation procedures
• Data entry procedures
• Review of geology interpretation and inputs for Mineral Resource Estimation
• Geological review of core and comparable relationships with open pit mapping, with particular emphasis on Esaase
The Qualified Person, in conjunction with fellow QP Eric Chen, (former VP Mineral Resources for Galiano Gold) also reviewed the following:
• QA/QC results of pit grade control and related infill drilling programs for the Esaase and Akwasiso deposits.
• Geological discussions related to continuous improvement of the geological understanding with the site geologist
• Mining and grade control procedures with emphasis on reconciliation between production and the MRE models for calibration of the Esaase and Akwasiso MRE models
• Mining and metallurgical plant recovery and metal accounting

NI 43-101 Technical Report for the Asanko Gold Mine, Ashanti Region, Ghana
Effective Date: February 28, 2022
Page 150
• Validation of Nkran, Esaase, Miradani North, Abore, Dynamite Hill geology and drill hole sample data, in preparation for MRE update. In addition to reviewing current (post 2020) QAQC results as part of assay validation, the QPs have reviewed legacy assay data and reports on legacy drilling and sampling procedures (Spiers, 2010) and SRK (2011). The QPs have, as much as possible, validated legacy data when spatially near post-2014 AGM drill data during the course of 2D paper sectional interpretations. In doing so, the QPs were able to assess legacy vs AGM hole collar RL’s, view downhole survey drill traces and assess how ‘geologically reasonable’ they are. The QPs have reviewed RC and diamond drilling, sampling, core preparation, photography and logging procedures. The QPs have reviewed several hundred metres of mineralized core from the Esaase, Miradani, Abore and Dynamite Hill drilling, and visually assessed several hundred metres of mineralized Nkran drill core and compared all with database records.
• Site visits of Miradani North, Dynamite Hill, Akwasiso, Abore and Asuadai, with reference to drilling programs (i.e. – verified collar locations in the field, drill core to core logs, review sample splits, etc.) and galamsey workings.
12.2 Database Structure
The database schema used is the Maxwell DataShed™ (MDS version 4.6.4) which has standard constraints, keys and triggers to ensure that only validated data can be loaded. If these constraints, keys or triggers have been edited or removed, invalidated data can be merged into the database, (e.g. overlapping intervals, data that exceeds the maximum depth of the drill hole, etc.).
Standard validation rules in the MDS include the following:
• Data is captured in the correct format:
o Real number: This is a number such as a drill hole depth, co-ordinate, etc. In some cases, there can be a constraint on a number (e.g. a number which is a percent should be ≤ 100)
o Date: Set format such as dd/mm/yyyy
o Text: Usually a comment
o Library field: A library field (lookup) has a predetermined list of values allowing only those values to be entered in the field (e.g. lithotype codes, or responsible person). This ensures that there is consistency in the database (e.g. a quartz vein is always captured as “Qv” not as Q-V, Qtz V, etc.)
o Collar table: Incorrect co-ordinates (not within known range), unique hole IDs per dataset. Data can only be merged into the database if the drill hole has been entered into the collar table.
• Survey table: Duplicate entries, survey intervals past the specified maximum depth in the collar table and anomalous dips and azimuths are not merged until corrected
• Geotechnical tables: Core recoveries and rock quality designations (RQDs) less than 0%, or greater than 120% (Recovery), or 100% (RQD), overlapping intervals, negative widths and geotechnical results past the specified maximum depth in the collar table are not merged until corrected
• Geology table: Duplicate entries, lithological intervals past the specified maximum depth in the collar table, overlapping intervals and negative widths are not merged until corrected. Standardized logging codes are required
• Sampling table: Duplicate entries, sampling intervals past the specified maximum depth in the collar table, negative widths, overlapping intervals, sampling widths exceeding tolerance levels, missing intervals and duplicated sample IDs are not merged until corrected
• Assay table: Missing samples (assay results received, but no samples in database) are imported into an incoming assay table, assay metadata such as detection limits, methods, etc. are captured where possible.

NI 43-101 Technical Report for the Asanko Gold Mine, Ashanti Region, Ghana
Effective Date: February 28, 2022
Page 151
12.3 Data Review
12.3.1 Exploration Database
Data was extracted from the exploration database for the various projects using bounding values for easting and northings. These data extractions were validated and exported for downstream work.
Extracted drillhole data are in comma-delimited csv format and transferred to the resource QP for each deposit. The resource QP worked closely with the site database and exploration team to conduct further data verification to ensure that data entries in all the drillhole tables are reasonably free of error and consistent before the data is accepted for resource estimation. The verification process is completed with assistance of various built-in tools in 3D geological modelling software programs or generic data processing program (such as Excel), and has included, but not limited to, checking and correcting duplicate records, drillhole interval overlap, drillhole depth mis-match, abnormal collar location, downhole surveys, erroneous assay values, etc.
12.3.2 Grade Control Database
Grade control data was used to a limited extent for the Esaase and Akwasiso Mineral Resources. The data verification for the GC data utilized in these estimates are described in Section 14.
12.4 Qualified Person’s Opinion on Adequacy of Data For Purposes Used in Technical Report
The Qualified Person (Greg Collins) has personally reviewed the accuracy of drill hole collars and sample locations, down-hole deviation, the accuracy and internal consistency of lithological and alteration data, and the accuracy and precision of analytical information. The verification activities included a search for factual errors, completeness of the lithological and assay data, and suitability of the primary data. As part of the database verification activities, the QP has also examined assay information and certificates obtained directly from the analytical laboratory.
Personal inspections included reviews of the geological and sample information used in the preparation of the Mineral Resource estimates. The QP is confident that the available information and sample density allow preparation of reasonable estimates of the geometries, tonnage, and grade continuity of the mineralization in accordance with the level of confidence established by the Mineral Resource categories in the CIM Definition Standards. The database fairly represents the primary information and the data therein contained are suitable to support estimation of Mineral Resources.
NI 43-101 Technical Report for the Asanko Gold Mine, Ashanti Region, Ghana
Effective Date: February 28, 2022
Page 152
13 MINERAL PROCESSING AND METALLURGICAL TESTING
13.1 Previous Project Testwork
13.1.1 Metallurgical Testwork 2008 to 2013
Esaase was evaluated in metallurgical test programs between 2008 and 2013. Four rounds of metallurgical testwork were carried out. The findings of each of these testwork programs are comprehensively discussed in the Lycopodium report, completed as part of the feasibility study submission in 2012.
A fifth testwork program was scoped to quantify the metallurgical recovery that could be achieved through the combination of gravity concentration within the milling circuit and flotation on gravity tailings, with a leach on the flotation concentrates. The fifth testwork program took place between 2012 and 2013 at Amdel Laboratories in Perth under the management of DRA. As per NI 43-101 Technical Report “Asanko Gold Project in Ghana – Pre-Feasibility Study” issued June 27th, 2013 (DRA, 2013).
13.1.2 Metallurgical Testwork 2014 to 2016
The AGM Expansion Project testwork was conducted in two testwork programs. Both testwork programs were undertaken by the Perth based, Australian Laboratory Services Pty Ltd (ALS) under the management of DRA. These testwork programs evaluated blends of Esaase and Nkran material for processing at a central facility.
13.1.2.1 AGM Expansion Project – Phase 1 Testwork
As per the Asanko Gold NI 43-101 Technical Report (2015), the following is noted:
This phase of testwork was designed to evaluate the metallurgical response of a gravity-CIL circuit versus a gravity-flotation-CIL circuit for treating blends of Esaase and Obotan feedstock. It was further investigated if it would prove feasible to dedicate specific material types to either one of the two processing routes to optimize overall recoveries and operating costs.
13.1.2.2 AGM Expansion Project – Phase 2 Testwork
As per the Asanko Gold NI 43-101 Technical Report (2017), the following is noted:
The testwork scope of this phase of the project was designed to evaluate the opportunity to process tailings from the gravity-CIL circuit together with the reground flotation concentrate product from a gravity-flotation circuit in a combined CIL circuit, when treating blends of Esaase and Obotan (Nkran) feed types. Additional testwork was undertaken which identified carbon poisoning by flotation reagents to be an added risk to CIL recoveries. Additional DFS testwork on composites of Esaase Fresh and Nkran, was conducted in Q4 2016 to confirm gravity/CIL as the preferred processing route.
As a result of the above investigations, the flotation processing route was abandoned in favour of the gravity-CIL option.

NI 43-101 Technical Report for the Asanko Gold Mine, Ashanti Region, Ghana
Effective Date: February 28, 2022
Page 153
13.1.3 Metallurgical Testwork 2018 to 2019
Information in this section is sourced from Asanko Gold NI 43-101 Technical Report (2020).
The initial NaCN concentration in all tests was 300 ppm.
The purpose of these test programs was to address two key technical aspects with respect to the Esaase Fresh component:
• To create a better understanding of the geological model with respect to the trending shear zones, namely Upper Sandstones, Central Sandstones and the Cobra unit
• To formulate a metallurgical test program that would focus on the geological model interpretation which would then lead into the future creation of a geometallurgical model and a more defined recovery profile.
The key component of the geometallurgy of the fresh, unoxidized gold mineralization at Esaase, and potentially within the Weakly – Oxidized (WOX) transition zone, is the distribution and abundance of organic carbon (OC) which shows enrichment in the following areas:
• Within and immediately adjacent to the NE-SW trending shear zones and sheared lithological contacts within the stratigraphic units
• Within the deformed shales and siltstones of the Cobra unit.
One of the planned outputs of the metallurgical testwork program was the development of an unbiased recovery model which considers the distribution and abundance of OC and is therefore applicable to all sections of the deposit.
The OC content variances were determined by drill core sampling and assaying, with the Cobra unit identified as a distinctly elevated OC geometallurgical domain (narrow 2-5 m intervals of greater than 0.5% OC). The OC content levels in the central sandstone zone are significantly lower.
Metallurgical sampling and testing completed in 2018/2019 is better aligned with the growing understanding of the geological model but are biased towards the thinking at that time that high-level OC is equally widespread across all lithologies.
The OC is present in all geological and metallurgical samples tested to date demonstrating various degrees of metallurgical recovery performance. The metallurgical testwork described below does not have the benefit of geological interpretation that has been developed in this phase of study and because of that, certain discounts relating to recovery may have been overstated (preliminary geological review indicates over-sampling of high OC material).
13.1.3.1 ALS Metallurgical Testwork on Esaase Composites
In support of the AGM LOM Study 2020, four defined testwork programs were undertaken at the ALS Metallurgy Services Laboratory in Perth (Western Australia) and one Raman ratio investigation program at Curtin University in Western Australia. The objective of the testwork was as follows:
• To determine the metallurgical performance of the samples through a program of gravity concentration with CIL treatment of the gravity tails
• To determine whether samples were likely to be preg-robbing during cyanide leaching (programs 1, 2, 3 and 4)
• To determine the gold extraction of samples under various process conditions (programs 1, 3 and 4)
• Preparation of samples for analysis at Curtin University (program 2 only) to determine the Raman preg-robbing ratio.

NI 43-101 Technical Report for the Asanko Gold Mine, Ashanti Region, Ghana
Effective Date: February 28, 2022
Page 154
13.1.3.2 Samples’ Origins
Samples were derived from a number of geological diamond drill cores and tested at Analytical Laboratory Services – ALS Perth as Testwork programs A19208, A19437, A19681 and A18754 using material from drill core intervals and RC drilling chips. The identification of samples obtained per testwork phase is shown in Table 13-1.
Table 13-1 Identification of Samples for Esaase Metallurgical Testwork
Testwork Program
Sample Type Geological Samples ID Geological Section(s)
A18754 Reverse
circulation KERC 039, 114, 155, 156, 157, 158, 164, 220, 227, 233
18, earlier testwork
A19208 Selected diamond
core KEDD 162, 550, 813, 989, 6032, KE 6013C 1, 2, 3
A19437 Diamond core KE6013C, KEDD 6032, 959, 550, 813, 949 16, 23, 24
A19681 Diamond core KEDD 162, 6032, 582, 509, 863, 862, 860, 302, 537, 821, 334,
822, 864, 832, 784, 785, 480, 488, 754, 913 13, 16, 17, 18,
22, 23, 24
13.1.3.3 ALS Testwork: Program 1 (ALS Report A18754, March 2018)
Program 1 involved ten RC Esaase samples, comprising five Fresh, two Transitional and three Oxide samples).
The following key findings were noted:
• Gravity gold is generally high with recoveries from 50% to 83.3%
• Potential preg-robbing is exhibited in samples KERC 155, 156 and 158. However, CIL cyanidation produced higher recoveries when compared to direct leach or CIP cyanidation. The preg-robbing is effectively countered by the presence of activated carbon.
• Overall gold recoveries from gravity/CIL processing (at grind size 80% passing 106 µm, 0.50 g/L NaCN, 15 g/L activated carbon and 24 hours residence time) ranged from 88.7% to 96.6%.
Sub-samples of all 10 KERC composites were submitted for preg-robbing characterisation. The results showed poor correlation of OC to the preg-robbing index (PRI) percent.
13.1.3.4 ALS Testwork: Program 2 (ALS Report A19208, October 2018)
Program 2 comprised 39 hand selected specimen samples, that were specifically selected for visible OC content from drill core samples EXES0618 5443-548. Selection of these samples was not based on current knowledge of the mining schedule.
Gold and OC assays were completed with sub-samples prepared for Raman spectroscopy testwork (Program 5) at Curtin University.
The following was noted with respect to the head assays:
• Gold content of samples ranged from less than 0.02 g/t to 7.79 g/t
• The OC content ranged from less than 0.03% to 3.99%.
Sub-samples of all 39 composites were submitted for preg-robbing characterisation testwork. The results indicate a linear relationship with percentage OC levels and PRI%.
13.1.3.5 ALS Testwork: Program 3 (ALS Report A19437, November 2018)
Program 3 comprised 25 cut core samples (EXES101800001–EXES101800025).

NI 43-101 Technical Report for the Asanko Gold Mine, Ashanti Region, Ghana
Effective Date: February 28, 2022
Page 155
The samples were subjected to fire assay for gold (and screen fire assay on selected samples) and a multi-element ICP scan for base metals and other elements. Significant variation in the gold values was observed and is indicative of the presence of coarse gold. The preg robbing characterisation tests results indicate a direct linear relationship between the OC value and the PRI.
A total of 19 these Esaase samples were ground to a P80 of 106 µm, and then submitted for gravity/CIL testwork.
Following the above tests, a bulk composite was prepared by combining sub-samples of gravity tailings for the following composites: EXES1018000-06, 16, 23, 24, and 25. Head assays of this composite returned 0.54 g/t Au and 0.60% organic carbon. Its preg robbing index (PRI) was 31%.
Sub-samples of the composite gravity tailings sample were submitted for cyanide leach testwork, to determine the impact of various parameters on leach performance to mitigate the effect of preg-robbing. The results indicate:
• CIL gold recovery increased significantly after pre-conditioning for 4 hours with 2 kg/t of kerosene (0.3 g/L NaCN, 24 hours)
o Base test (no kerosene, no activated carbon) – little dissolved gold was detected in solution, the leach residue contained 0.62 g/t gold
o CIL test (no kerosene, 10 g/L activated carbon) – leach residue grade was reduced to 0.38 g/t.
o CIL test (kerosene, 10 g/L activated carbon) – leach residue grade reduced to 0.11g/t
• Increased activated carbon concentration did not increase recovery
• Increased cyanide concentration did not increase gold recovery
13.1.3.6 ALS Testwork: Program 4 (ALS Report A19681, February 2019)
Program 4 comprised 20 core samples (EXES101900001-EXES 101900020), selected on the basis of high visible organic carbon content. The core samples were subjected to gravity concentration with both direct and CIL cyanidation carried out on the gravity tails.
The samples were subjected to fire assay for gold and a multi element ICP scan for base metals and other elements. The following observations were noted:
• Large variations in Au head grade assays are indicative of coarse gold
• Levels of OC range from 0.30% to 0.75%.
Total average extraction for direct cyanide leach tests was 57.3%; for fresh carbon CIL tests 80.4%; for site barren carbon CIL tests 74.6%.
All 20 samples were submitted for preg-robbing characterization testwork. The results of this testwork suggest a relationship between the OC value and the PRI.
Representative gravity tails samples of KEDD582 (EXES101900003), KEDD785 (EXES101900016) and KEDD821 (101900010) were blended to generate a gravity tails composite sample (1.02 g/t), sub-samples of which were subjected to CIL leach testwork at a P80 of 106 µm. The test procedure followed the standard but included varying concentrations of diesel added at the start of a 1-hour pre-conditioning phase. These tests were designed to determine if the OC content of the sample could be successfully blinded in order to reduce the preg-robbing characteristic of the material.
In addition, sub samples of the Fresh feed of KEDD582, KEDD 785 and KEDD821 were combined to create a “Combined Fresh Composite”. This composite was then submitted for gravity/CIL leach testwork at grind sizes of P80 75 µm and P80 45 µm. The results indicated:
• For the combined Fresh composite, no benefit was obtained when grinding finer; possibly due to the finer grinding resulting in enhanced activity of the preg-robbing carbon

NI 43-101 Technical Report for the Asanko Gold Mine, Ashanti Region, Ghana
Effective Date: February 28, 2022
Page 156
• The application of a pre-conditioning stage with diesel showed a positive correlation between dosage rate and leach performance.
13.1.3.7 Characterisation of Esaase Samples Using Raman Spectroscopy: Program 5 (Curtin University Report: April 2019)
The 39 pulverized samples, originating from ALS Test Program 2 (A19208), were received at The Gold Technology Group (GTG) at Curtin University.
The carbonaceous material within each sample was characterized using Raman spectroscopy with the following observations made:
• The Raman ratio results ranged from 0.43 to 0.77 with an average of 0.56
• Based on the Raman ratio results, the submitted Esaase samples would be classified as low to moderately preg-robbing
• It should be noted that Raman spectroscopy gives an indication of the preg-robbing behaviour of the carbon in the sample but not the concentration of the carbon (which will affect the overall preg-robbing capacity of the sample).
13.1.3.8 Summary of Metallurgical Testwork 2018 to 2019
The testwork results for the relevant ALS reports, A18754, A19208, A19437 and A19681 allude to a correlation between the OC content and the preg robbing index, and that this is biased towards the OC values greater than 0.5%. It is acknowledged however that there may have been over-sampling of high OC material.
Table 13-2 Head Grade Recovery Model Correlations
Material Source Head Grade Recovery
Correlation M (slope) C (coefficient)
Upper (Fresh/Trans) y = 9.600ln(x) + 82.260 9.60 82.26
Cobra (Fresh/Trans) y = 15.532ln(x) + 56.020 15.5 56.02
Central (Fresh/Trans) y = 6.202ln(x) + 85.792 6.20 85.79
Python (Fresh/Trans) =upper 9.60 82.26
Other (Fresh/Trans) =upper 9.60 82.26
Material Type Residue Value Au (g/t)
Esaase Oxides* 0.10
Recovery Discount Factor (due to Soluble Gold Losses & Carbon Losses) 0.5%
Note: * A fixed residue grade has been applied to the Esaase Oxide material
It is also acknowledged that, for this suite of tests, the base case cyanide concentrations were lower than plant operating levels at the time. The process plant, which was processing Nkran ore in 2018, added an average of 450 ppm NaCN. ALS testing was carried out with initial NaCN concentrations of 300 ppm. The test results may have been compromised due low cyanide levels.

NI 43-101 Technical Report for the Asanko Gold Mine, Ashanti Region, Ghana
Effective Date: February 28, 2022
Page 157
13.1.4 Addendum Testwork A20208 (2019)
13.1.4.1 Nkran Testwork and Past Mine Performance
Over the past mine performance of Nkran (3.5 years) the plant had achieved consistent recoveries exceeding 91.6%, notwithstanding the treatment of a blended ore comprising Oxides, Transition and Fresh and that preg-robbing zones are also encountered in the Nkran pit geology. The plant annualized recoveries are shown in Table 13-3.
Table 13-3 Nkran Past Production Annualized Recovery
Annualized Recovery 2016 2017 2018 2019
Nkran gold recovery (%) 91.6 94.3 93.8 93.8
In October 2019, a testwork program A20208 was undertaken at ALS Metallurgy in Perth (Western Australia). The objective of this testwork was as follows:
• Provide a direct comparison of the preg-robbing, gravity/direct leach and gravity/CIL performance of the Nkran core samples with the recent Esaase testwork using identical methods
• Compare the AGM laboratory testwork with typical plant performance results, though information on the Asanko Gold plant performance was limited at the time
• Compare Raman spectroscopy PRI of Nkran and Esaase
• Check that the current laboratory test methods produce results that are reasonably comparable with what is expected at plant scale
• Previous Nkran testwork was also considered.
The following conclusions were made:
• On average, the activity of Esaase organic carbon is double that of Nkran
• The organic carbon activity of the previous Esaase samples is relatively consistent and has relatively low variability
• The organic carbon activity of the Nkran samples is relatively more variable than Esaase.
13.1.4.2 Raman Spectroscopy
Preliminary reporting of the results by Curtin University on November 7, 2019.
“Essentially, by comparing the spectra from the Esaase and Nkran spectra with each other and with other spectra from our database, indications are that the carbonaceous material in the Nkran samples is slightly more preg-robbing than that in the Esaase samples, although both would be considered to have low to moderate preg-robbing capacity when compared with the wider dataset. However, the lower normalized PRI values for the Nkran samples relative to the Esaase samples are a little anomalous and I suspect that some of the Nkran samples contain graphitic (non preg-robbing) carbon which may be skewing the results.”

NI 43-101 Technical Report for the Asanko Gold Mine, Ashanti Region, Ghana
Effective Date: February 28, 2022
Page 158
13.2 Current Testwork 2021 – Esaase Main Pit
Previous testwork undertaken in 2018 to 2019 largely formed the basis for recovery estimates stated in the 2020 NI 43-101.
Subsequent concerns were raised about the test samples’ selection with respect to organic carbon. Section 13.1.3 acknowledges that there may have been oversampling of high OC material.
The lithology of primary focus in the previous work was a black mudstone/siltstone referred to as the Cobra unit. This material is elevated in organic carbon content with respect to the surrounding sandstones. Initial estimates were that the Cobra material comprised approximately 15 percent of the Esaase Main deposit. This is subject to ongoing investigation.
An additional concern was related to the cyanide addition used in previous testwork program. Cyanide concentrations were significantly lower than typical process plant concentrations. It is believed to arise from a misinterpretation of cyanide concentration values quoted, i.e.:
• The process plant quotes cyanide concentrations in CN- ppm. Average plant value in 2018 was 240 ppm, which equates to 450 ppm as NaCN
• Metallurgical laboratories in Australia understand cyanide concentration to refer to NaCN ppm. Therefore, the baseline 300 ppm NaCN used in almost all of the 2018 to 2019 testwork. This equates to only 165 ppm CN- in plant terminology (CN-).
As a result of the above concerns, it was decided to revisit the Esaase recovery modelling. This involved a comprehensive test program that included samples that more broadly, and representatively, portray the Esaase Main pit mineralized domains. Testing also involved higher cyanide additions.
13.2.1 Sample Selection Criteria
Sample selection for 2021 metallurgical test work at Esaase was completed in March of that year by Asanko Exploration team with support from Eric Chen, former VP Technical Services of Galiano Gold, in close consultation with Alan Eslake, Chief Metallurgist on site. The selection process followed the key technical considerations and criteria set by the Asanko technical and operation team:
1. Select from the existing exploration drillholes (as of March 2021)
2. Select core samples only (in order to avoid potential ambiguity in interpretation of test results from RC samples)
3. Select samples primarily from in the Fresh zone, with small portion from Transition zone. No sample from Oxide zone
4. Entire sample set to represent a range of the ore grade materials and have fair coverage of different mineralized zones and litho-stratigraphic domains within the prospect Esaase main resource pit. The 2019 PFS Esaase resource pit shell is used as reference
5. Each interval sample was composed of a series of consecutive drillhole core increments that represent multi-bench mining volumes. Each sample, when grouped with adjacent samples, represents bulk tonnage of material that approximates the amount processed in a roughly 2-3 month period (~1 Mt) at the process plant
6. Each sample was targeted to provide a minimum 15 kg in mass.
Leapfrog Geo 3D software was used to assist the visual and volumetric evaluation of drillhole samples and spatial coverage. Drillholes were displayed and reviewed in 2D and 3D with logged geology, assays, mineralized domain, litho-stratigraphic domain, oxidation, structure and other available geological models as of March 2021, with drillhole intervals selected following the criteria as described above.
Each selected sample was made of a series of individual increments (~1-2 m) of a drillhole, with accumulated average interval length of 20 m.

NI 43-101 Technical Report for the Asanko Gold Mine, Ashanti Region, Ghana
Effective Date: February 28, 2022
Page 159
The preliminary list of selected samples was generated in .csv format with all the individual sample intervals coded with original assays, logged and modelled lithology, alteration, oxidation and mineralized domain. The preliminary list was thoroughly checked and verified with the physical drill cores by the field team, and final selection of samples made with agreement of the site and corporate team. The selected cores were subsequently cut into quarters and each individual interval bagged separately to allow flexibility in managing sample re-compositing if deemed necessary.
The location of final selected samples for metallurgical test work in March 2021 is illustrated in Figure 13-1 (plan view) and Figure 13-2 (long section).
Figure 13-1 Esaase Mineralized Domains and Location of Metallurgical Samples (Plan View)

NI 43-101 Technical Report for the Asanko Gold Mine, Ashanti Region, Ghana
Effective Date: February 28, 2022
Page 160
Figure 13-2 Esaase Mineralized Domains and Location of Metallurgical Samples (Long Section)
ALS Metallurgy in Perth, Australia undertook all metallurgical testwork.
The significant number of core increments totalling 838 in number, represented 964 m of total length from 36 holes. Portions of each individual core increment were retained to enable additional testing if required.
Two main tranches of tests were completed. The initial bulk composites’ results returned some low recoveries (under conditions of 80% passing 106 µm, 15 g/L activated carbon, 600 ppm NaCN initial concentration and 250 ppm NaCN maintained thereafter, 24-hour retention time), and the decision was then made to test the composites constituents individually for higher definition (i.e. variability).
• Initially, tests were completed on 14 bulk composites representing the main mineralized zones. With the exception of two composites, each was comprised of intervals from multiple holes. Combined interval lengths averaged 69 m. These may be termed as ‘global’ composites as they contained full-length intervals without application of a cut-off grade to the increments. These tests were carried out at 600 ppm NaCN initial concentration.
• Subsequently, 42 variability composites were created from the individual hole intervals. In some instances, the intervals were further divided along their length. Increments below 0.5 g/t Au were omitted with 1 m samples below this grade included as skin dilution either side of the selection. Average interval length of these samples was 20 m. These tests were carried out at 1,000 ppm NaCN initial concentration in order to assess any benefit of higher concentration on recovery.
All composites were created on an equal weight per metre basis. Increments were generally 1 m length. Some intervals were created from 2 m lengths. Core sizes available included PQ, HQ and NQ.
Table 13-4 provides the bulk and variability composites’ hole details. This includes the expected gold grades as calculated from the core increments on a weighted (length) basis. Exploration assays had been carried out at Intertek, Tarkwa by 50 g charge fire assay method.

NI 43-101 Technical Report for the Asanko Gold Mine, Ashanti Region, Ghana
Effective Date: February 28, 2022
Page 161
Table 13-4 Hole and Interval Data With Expected Composite Gold Head Grades (Esaase)
DD Data Bulk Composites Variability Samples
Hole ID From To Bulk
Composite ID
Expected Au Grades (from Core Assays) Variability
Composite ID Expected Au
Grades g/t Hole g/t Comp g/t
KEDD546 192 222 11D1 2.89 1.99 11D1-1 6.49
KEDD727 158 180 0.76 11D1-2 1.13
KE6001C 119 159 11D2 2.52 2.52
11D2-1 0.86
159 190.5 11D2-2 1.67
KEDD096 214 230 12ND1 0.94 2.75 12ND1-1 0.94
KEDD761 129 143 2.39 12ND1-2 2.39
KEDD530 257.8 288 5.09 12ND1-3 5.09
KEDD536 284 301 1.26 12ND1-4 1.26
KEDD531 224 247 12ND2 1.04 1.51 12ND2-1 1.04
KEDD536 207 235 1.52 12ND2-2 1.52
KEDD872 215 219 1.42 12ND2-3 1.42
KEDD820 278 301 2.02 12ND2-4 1.54
KE6008C 99 119 12SD1 0.94 0.78 12SD1-1 1.02
KE6014C 63 79 0.55 12SD1-2 0.48
97 113 12SD1-3 0.62
KEDD334 193.9 210 1.05 12SD1-5* 1.05
KE6004C 77 97 13D1 0.96 1.25 13D1-1 0.96
KEDD332 106.2 126 2.20 13D1-2 2.20
KEDD763 118 148 0.82 13D1-3 0.98
KEDD335 273 301 13D2 0.82 1.19 13D2-2 0.92
KEDD326 253 276 1.57 13D2-3 1.76
KE6007C 129 165 13D3 2.08 1.71 13D3-1 2.33
KE6013C 179 205 1.61 13D3-2 1.61
KEDD709 99.2 122 1.13 13D3-3 1.37
KEDD532 251 278 13D4 1.32 2.59 13D4-1 1.80
KEDD303 238 272 4.38 13D4-2 4.38
KEDD336 324 345 0.53 13D4-3** 0.82
KEDD949 95 107 14D1 0.83 0.83 14D1-2-1 1.18
107 135 14D1-2-2 1.00
KEDD520 219.85 248 15D1 0.64 1.04 15D1-2 0.90
KEDD151 216 241 0.90 15D1-3 0.97
KEDD829 273 303 1.53 15D1-4 2.09
KE6006C 235 275 15D2 0.85 0.87 15D2-1 0.85
KEDD6031 213 240 0.73 15D2-2-1 0.75
240 265 15D2-2-2 1.00
KEDD099 284 294 1.64 15D2-3 1.81
KE6005C 152 166 15D3 1.76 1.67 15D3-1 1.76
KEDD750 100 117 1.60 15D3-2 1.60
KEDD722 114 147 1.53 15D3-3 1.63
KEDD723 186 201 1.97 15D3-4 2.11
KE6006C 139 155 15D4 0.91 1.23 15D4-1 1.11
KEDD723 138 168 1.15 15D4-2 1.29
KEDD721 118 138 1.74 15D4-3 1.74
Note: *12SD1-5 variability not tested due to anomalous head grade after composition **13D4-3 not included in variability testing due to lack of representivity

NI 43-101 Technical Report for the Asanko Gold Mine, Ashanti Region, Ghana
Effective Date: February 28, 2022
Page 162
13.2.2 Bulk Composites Testing (ALS A22281)
Testing methodology of the bulk composites included the following main steps:
• Coarse crushing and sub-sampling of each individual increment, creation of composites for testing
• Head assays Au, Ag, Cu, As, total and organic carbon, total and sulphide sulphur, ICP 26 element scan
• Gravity/CIL recovery simulations under current process plant operating conditions
o Grind size 80% passing 106 µm
o The ground sample was passed through a laboratory Knelson KC-MD3 centrifugal concentrator.
o The free gold in the gravity concentrate was recovered by mercury amalgamation. The amalgamation tail and gravity tail were combined and then subjected to a pre-leach conditioning step before CIL cyanide leach
• Size by size analyses on CIL feed and residue
• Diagnostic analyses on final CIL tails to estimate deportment of unrecovered gold i.e.
o Additional cyanide recoverable
o Organic carbon associated
o Sulphides associated
o Silicates associated
Note: 2 samples had the gravity tail CIL tests completed in duplicate for quality control purposes.
The same methodology was subsequently applied to the variability composites with some exclusions including elimination of intermittent leach sampling and reduction of assays to focus on gold. Size deportment and diagnostic analyses on residues were also omitted.
Grind size optimisation tests were not undertaken as part of this project, with the standard mill P80 of 106 µm used for all tests.
Head assays were carried out using the following methods:
• Gold – 50 g fire assay with AAS finish
• Total sulphur – CS 2000 (LECO furnace equivalent)
• Sulphide sulphur – sodium carbonate digest to remove sulphates, followed by CS 2000
• Total carbon – CS 2000 (LECO furnace equivalent)
• Organic carbon – hydrochloric acid digest to remove carbonates, followed by CS 2000
• Multi element scans are a mix of 4 acid digest (including HF) and sodium peroxide fusion. All are inductively coupled plasma optical emission spectroscopy (ICPOES) finish

NI 43-101 Technical Report for the Asanko Gold Mine, Ashanti Region, Ghana
Effective Date: February 28, 2022
Page 163
Table 13-5 Esaase Bulk Composites – Main Elements of Interest (ALS A22281)
ANALYTE Ag
(ppm)
As
(ppm)
Au I
g/t
Au II
g/t
Ctotal
(%)
Corganic
(%)
Cu
(ppm)
Stotal
(%)
Ssulphide
(%)
COMP 11D1 0.3 595 0.79 0.69 0.57 0.45 37 0.18 0.16
COMP 11D2 <0.3 495 0.53 0.57 0.48 0.24 35 0.20 0.16
COMP 12SD1 0.3 690 3.65 6.25 0.63 0.36 34 0.20 0.16
COMP 12ND1 0.3 460 1.26 1.16 0.63 0.42 178 0.32 0.26
COMP 12ND2 0.3 800 1.23 1.13 0.93 0.42 65 0.40 0.36
COMP 13D1 <0.3 395 0.91 0.77 0.66 0.42 32 0.30 0.26
COMP 13D2 0.3 520 0.83 0.84 0.87 0.33 53 0.32 0.28
COMP 13D3 0.3 490 0.97 2.89 0.72 0.27 42 0.18 0.16
COMP 13D4 <0.3 430 2.03 2.04 1.32 0.24 30 0.24 0.24
COMP 14D1 0.3 945 0.46 0.47 1.92 0.54 27 0.30 0.28
COMP 15D1 <0.3 1075 1.26 0.58 1.44 0.30 34 0.32 0.20
COMP 15D2 0.3 355 0.62 0.51 1.41 0.42 33 0.22 0.20
COMP 15D3 0.3 1275 1.95 1.48 1.17 0.30 32 0.38 0.28
COMP 15D4 <0.3 660 1.26 1.27 1.02 0.24 29 0.30 0.30
13.2.2.1 Comparison of Gold Head Assays (Bulk Composites)
Expected composite gold grades were calculated from the fire assay grades of the individual core increments on a length weighted basis. They are compared with the head grades calculated from the gravity/CIL recovery tests (8 kg scale). See Table 13-6.
• Variation between duplicate fire assay results indicates the presence of coarse free gold and a ‘nugget effect’. This phenomenon is a significant trait of Esaase material
• This ‘nugget effect’ is considered to be reduced in the case of the calculated head value due to the larger (8 kg) feed mass, as opposed to the 50 g fire assay feed charge
• In some instances, there is significant variation between the expected gold grade (weighted average of fire assay on all core increments) and that as calculated from the recovery testwork. This is symptomatic of the free gold ‘nugget effect’.

NI 43-101 Technical Report for the Asanko Gold Mine, Ashanti Region, Ghana
Effective Date: February 28, 2022
Page 164
Table 13-6 Esaase Bulk Composites – Comparison of Gold Head Assays (g/t Au)
Composite ID Expected
(Core Grades)
ALS Duplicate Fire Assay
Fire Assay Average
ALS Calculated Head from 8 kg Recovery Test
% Difference (Expected vs Calculated)
11D1 1.99 0.79, 0.69 0.74 1.07 -86
11D2 2.52 0.53, 0.57 0.55 1.17 -116
12ND1 2.75 1.26, 1.16 1.21 1.63 -68
12ND2 1.51 1.23, 1.13 1.18 1.07 -41
12SD1 0.78 3.65, 6.25 4.95 1.47 47
13D1 1.25 0.91, 0.77 0.84 1.22 -3
13D2 1.19 0.83, 0.84 0.84 1.11 -8
13D3 1.71 0.97, 2.89 1.93 1.49 -15
13D4 2.59 2.03, 2.04 2.04 4.71 45
14D1 0.83 0.46, 0.47 0.47 0.85 2
15D1 1.04 1.26, 0.58 1.84 0.83 -26
15D2 0.87 0.62, 0.51 0.57 0.53 -65
15D3 1.67 1.95, 1.48 1.72 2.14 22
15D4 1.23 1.26, 1.27 1.27 1.06 -17
average 1.57 1.44 1.45
Multi element ICP scans indicate arsenic grades in the range of 355 to 1275 ppm for a simple average of 656 ppm.
Table 13-7 Esaase Bulk Composites – Multi-element Analysis (ALS A22281) – Part 1
ANALYTE 11D1 11D2 12SD1 12ND1 12ND2 13D1 13D2
Ag(ppm) 0.3 <0.3 0.3 0.3 0.3 <0.3 0.3
As(ppm) 595 495 690 460 800 395 520
Al(%) 8.48 8.32 9.04 7.00 8.16 8.16 7.52
Ba(ppm) 500 500 500 400 400 500 500
Be(ppm) <5 <5 <5 <5 <5 <5 <5
Bi(ppm) <10 <10 <10 <10 <10 <10 <10
Ca(%) 0.6 0.4 0.3 0.4 0.4 0.2 1.0
Cd(ppm) <5 <5 <5 <5 <5 <5 <5
Co(ppm) 65 50 70 140 90 65 85
Cr(ppm) 120 140 160 90 100 140 100
Cu(ppm) 37 35 34 178 65 32 53
Fe(%) 4.64 4.44 3.44 3.12 4.78 4.72 4.64
K(%) 1.69 1.70 1.72 1.33 1.73 1.62 1.44
Li(ppm) 65 60 65 65 75 70 65
Mg(%) 1.04 0.96 0.60 0.76 0.84 0.72 1.16
Mn(ppm) 400 200 100 300 700 300 500
Mo(ppm) <5 <5 <5 <5 <5 <5 <5
Na(%) 1.30 1.22 1.65 1.12 1.02 0.99 1.55
Ni(ppm) 60 55 65 50 60 60 55
P(ppm) 600 600 300 300 400 500 600
Pb(ppm) <5 <5 <5 <5 <5 <5 5

NI 43-101 Technical Report for the Asanko Gold Mine, Ashanti Region, Ghana
Effective Date: February 28, 2022
Page 165
ANALYTE 11D1 11D2 12SD1 12ND1 12ND2 13D1 13D2
SiO2(%) 62.4 61.2 65.2 69.2 62.8 65.6 65.6
Sr(ppm) 200 200 240 200 200 160 200
Ti(ppm) 4400 4400 4400 3400 5600 4200 3800
V(ppm) 112 110 110 86 102 110 98
Y(ppm) <100 <100 <100 <100 <100 <100 <100
Zn(ppm) 134 120 88 84 120 124 76
Table 13-8 Esaase Bulk Composites – Multi-element Analysis (ALS A22281) – Part 2
ANALYTE 13D3 13D4 14D1 15D1 15D2 15D3 15D4
Ag(ppm) 0.3 <0.3 0.3 <0.3 0.3 0.3 <0.3
As(ppm) 490 430 945 1075 355 1275 660
Al(%) 8.60 6.96 7.80 6.92 7.96 7.08 7.84
Ba(ppm) 600 400 400 500 500 400 500
Be(ppm) <5 <5 <5 <5 <5 <5 <5
Bi(ppm) <10 <10 <10 <10 <10 <10 <10
Ca(%) 0.1 1.1 1.3 1.0 1.0 0.8 0.4
Cd(ppm) <5 <5 <5 <5 <5 <5 <5
Co(ppm) 45 75 80 90 50 110 75
Cr(ppm) 120 90 100 100 140 120 100
Cu(ppm) 42 30 27 34 33 32 29
Fe(%) 3.26 4.38 4.36 4.34 4.20 4.60 4.46
K(%) 1.80 1.30 1.50 1.47 1.65 1.35 1.56
Li(ppm) 60 50 60 50 55 55 60
Mg(%) 0.48 1.12 1.04 1.12 1.00 1.00 0.92
Mn(ppm) 300 500 900 600 500 500 500
Mo(ppm) <5 <5 <5 <5 <5 <5 <5
Na(%) 1.06 1.58 1.45 1.55 1.61 1.58 1.29
Ni(ppm) 50 50 55 55 50 55 60
P(ppm) 300 600 500 600 600 600 600
Pb(ppm) <5 <5 <5 <5 5 5 5
SiO2(%) 64.4 66.0 56.2 63.6 62.0 66.0 64.0
Sr(ppm) 200 200 200 200 240 200 200
Ti(ppm) 4600 3600 3800 3400 4000 3600 4200
V(ppm) 116 86 88 88 104 90 102
Y(ppm) <100 <100 <100 <100 <100 <100 <100
Zn(ppm) 102 80 82 82 100 88 130
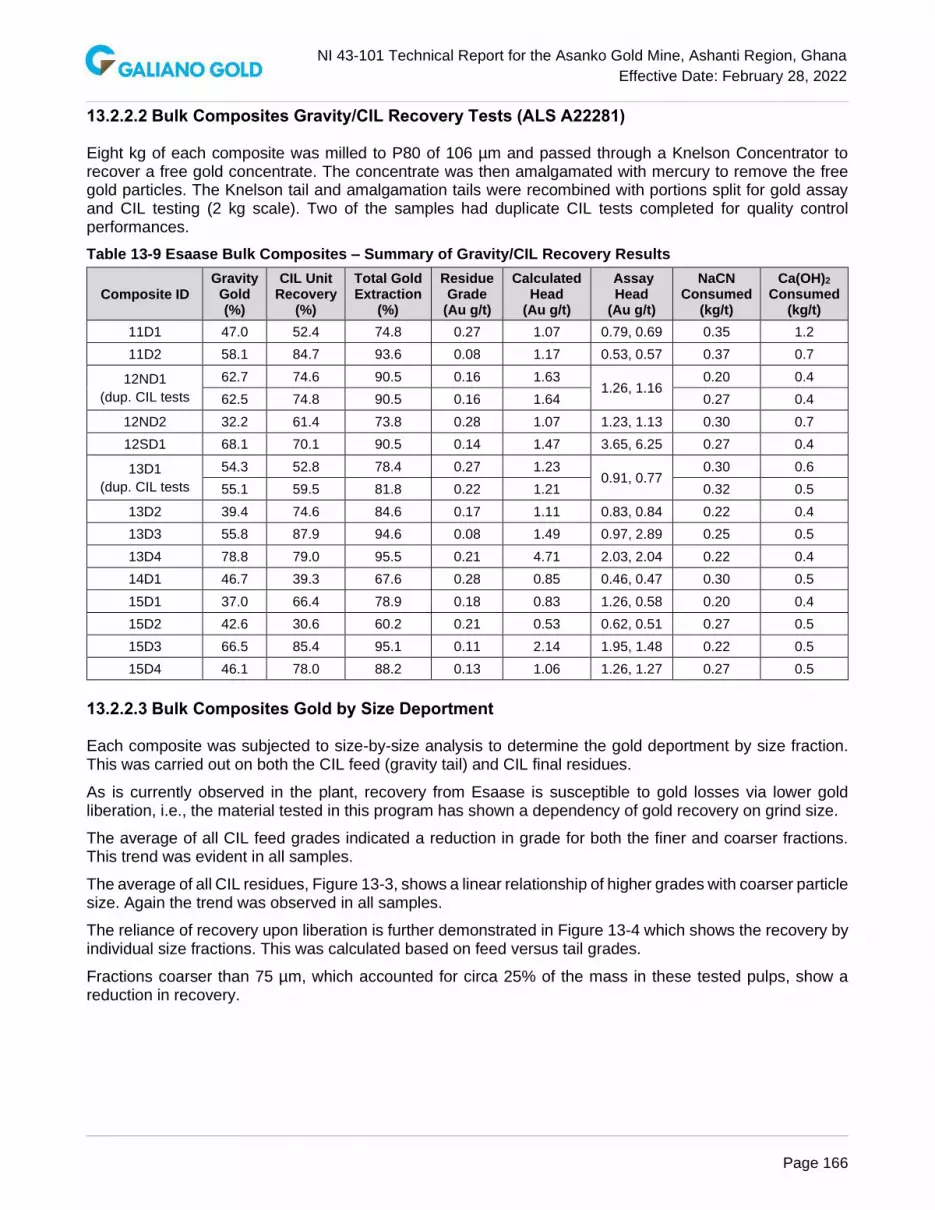
NI 43-101 Technical Report for the Asanko Gold Mine, Ashanti Region, Ghana
Effective Date: February 28, 2022
Page 166
13.2.2.2 Bulk Composites Gravity/CIL Recovery Tests (ALS A22281)
Eight kg of each composite was milled to P80 of 106 µm and passed through a Knelson Concentrator to recover a free gold concentrate. The concentrate was then amalgamated with mercury to remove the free gold particles. The Knelson tail and amalgamation tails were recombined with portions split for gold assay and CIL testing (2 kg scale). Two of the samples had duplicate CIL tests completed for quality control performances.
Table 13-9 Esaase Bulk Composites – Summary of Gravity/CIL Recovery Results
Composite ID Gravity
Gold (%)
CIL Unit Recovery
(%)
Total Gold Extraction
(%)
Residue Grade
(Au g/t)
Calculated Head
(Au g/t)
Assay Head
(Au g/t)
NaCN Consumed
(kg/t)
Ca(OH)2 Consumed
(kg/t)
11D1 47.0 52.4 74.8 0.27 1.07 0.79, 0.69 0.35 1.2
11D2 58.1 84.7 93.6 0.08 1.17 0.53, 0.57 0.37 0.7
12ND1
(dup. CIL tests
62.7 74.6 90.5 0.16 1.63 1.26, 1.16
0.20 0.4
62.5 74.8 90.5 0.16 1.64 0.27 0.4
12ND2 32.2 61.4 73.8 0.28 1.07 1.23, 1.13 0.30 0.7
12SD1 68.1 70.1 90.5 0.14 1.47 3.65, 6.25 0.27 0.4
13D1
(dup. CIL tests
54.3 52.8 78.4 0.27 1.23 0.91, 0.77
0.30 0.6
55.1 59.5 81.8 0.22 1.21 0.32 0.5
13D2 39.4 74.6 84.6 0.17 1.11 0.83, 0.84 0.22 0.4
13D3 55.8 87.9 94.6 0.08 1.49 0.97, 2.89 0.25 0.5
13D4 78.8 79.0 95.5 0.21 4.71 2.03, 2.04 0.22 0.4
14D1 46.7 39.3 67.6 0.28 0.85 0.46, 0.47 0.30 0.5
15D1 37.0 66.4 78.9 0.18 0.83 1.26, 0.58 0.20 0.4
15D2 42.6 30.6 60.2 0.21 0.53 0.62, 0.51 0.27 0.5
15D3 66.5 85.4 95.1 0.11 2.14 1.95, 1.48 0.22 0.5
15D4 46.1 78.0 88.2 0.13 1.06 1.26, 1.27 0.27 0.5
13.2.2.3 Bulk Composites Gold by Size Deportment
Each composite was subjected to size-by-size analysis to determine the gold deportment by size fraction. This was carried out on both the CIL feed (gravity tail) and CIL final residues.
As is currently observed in the plant, recovery from Esaase is susceptible to gold losses via lower gold liberation, i.e., the material tested in this program has shown a dependency of gold recovery on grind size.
The average of all CIL feed grades indicated a reduction in grade for both the finer and coarser fractions. This trend was evident in all samples.
The average of all CIL residues, Figure 13-3, shows a linear relationship of higher grades with coarser particle size. Again the trend was observed in all samples.
The reliance of recovery upon liberation is further demonstrated in Figure 13-4 which shows the recovery by individual size fractions. This was calculated based on feed versus tail grades.
Fractions coarser than 75 µm, which accounted for circa 25% of the mass in these tested pulps, show a reduction in recovery.
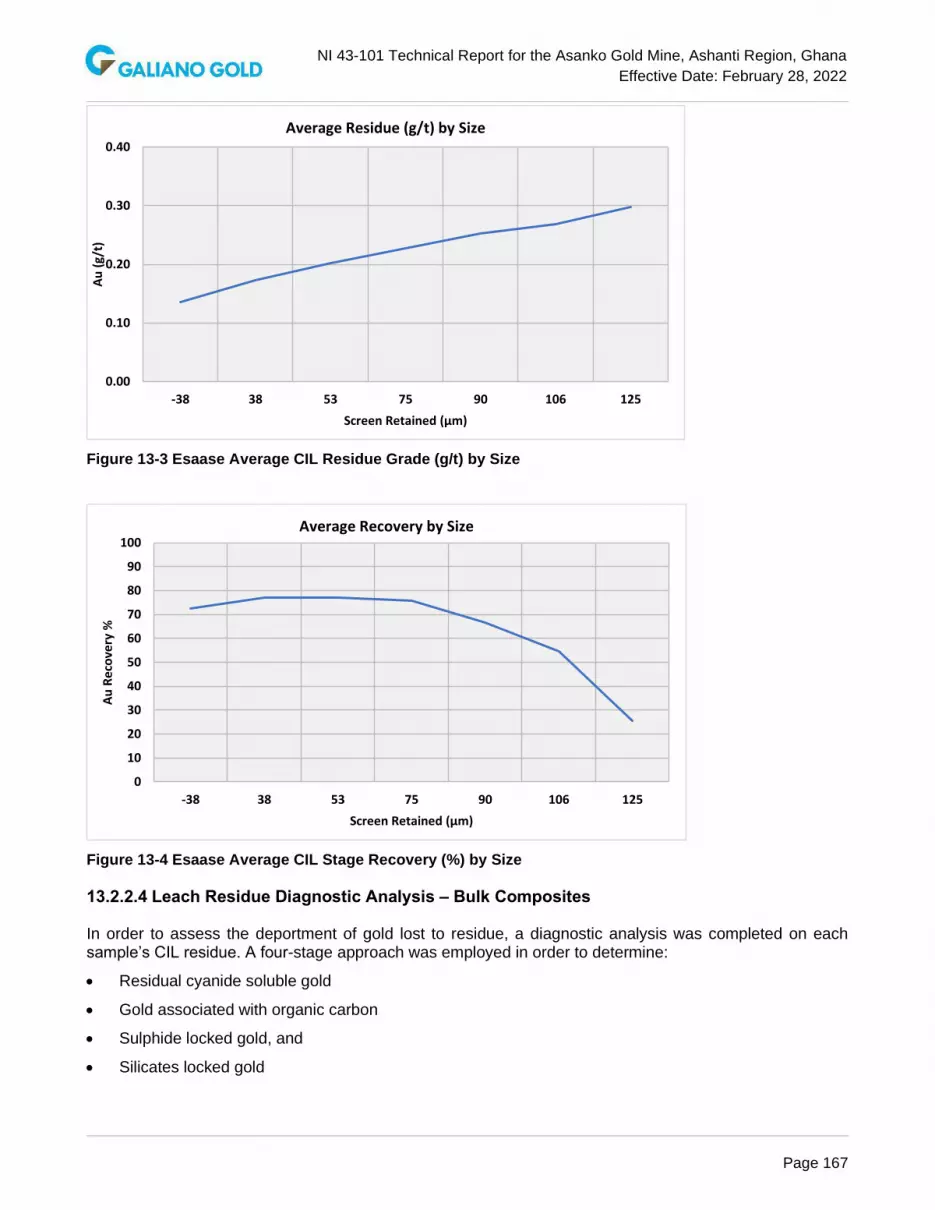
NI 43-101 Technical Report for the Asanko Gold Mine, Ashanti Region, Ghana
Effective Date: February 28, 2022
Page 167
Figure 13-3 Esaase Average CIL Residue Grade (g/t) by Size
Figure 13-4 Esaase Average CIL Stage Recovery (%) by Size
13.2.2.4 Leach Residue Diagnostic Analysis – Bulk Composites
In order to assess the deportment of gold lost to residue, a diagnostic analysis was completed on each sample’s CIL residue. A four-stage approach was employed in order to determine:
• Residual cyanide soluble gold
• Gold associated with organic carbon
• Sulphide locked gold, and
• Silicates locked gold
0.00
0.10
0.20
0.30
0.40
-38 38 53 75 90 106 125
Au
(g/
t)
Screen Retained (µm)
Average Residue (g/t) by Size
0
10
20
30
40
50
60
70
80
90
100
-38 38 53 75 90 106 125
Au
Re
cove
ry %
Screen Retained (µm)
Average Recovery by Size

NI 43-101 Technical Report for the Asanko Gold Mine, Ashanti Region, Ghana
Effective Date: February 28, 2022
Page 168
Note, the carbon association stage is by acetonitrile (CH3CN) solvent strip under aggressive conditions. Additional gold that is not carbon associated can also be removed from the solids. The values are somewhat presumptive as a result.
Results as summarized in Table 13-10 indicate that for the seven samples with lowest overall recoveries (<85%), the majority of the unrecovered gold is extracted in the acetonitrile strip i.e. inferred organic carbon association.
Table 13-10 Esaase Bulk Composites – Diagnostic Gold Assays on Final Residues
Diagnostic Extracted Au Grades (g/t) Recovery Loss % Points
SAMPLE ID Total Gold Extract-ion
%
Residue Au Grade
(g/t)
Calc. Au Head (g/t)
OC Head %
Extended CIL*
Ace-tonitrile (Carbon Assoc.)**
Aqua Regia Soluble
(Sulphide Assoc.)
Fire Assay (SiO2)
Calc. Total
Residue Au (g/t)
OC AR
Soluble SiO2
11D1 74.8 0.27 1.07 0.45 0.04 0.17 0.04 0.06 0.27 16.0 3.7 5.6
11D2 93.6 0.08 1.17 0.24 0.06 0.00 0.01 0.01 0.02 1.1 2.7 2.7
12ND1 90.5 0.16 1.63 0.36 0.00 0.11 0.02 0.04 0.17 6.1 1.1 2.3
12ND2 73.8 0.28 1.07 0.42 0.04 0.13 0.06 0.03 0.22 15.7 7.0 3.5
12SD1 90.5 0.14 1.47 0.42 0.00 0.08 0.04 0.02 0.14 5.5 2.7 1.3
13D1 80.1 0.24 1.22 0.42 0.02 0.19 0.04 0.02 0.23 16.6 0.0 1.7
13D2 84.6 0.17 1.11 0.33 0.04 0.09 0.02 0.02 0.13 10.8 2.3 2.3
13D3 94.6 0.08 1.49 0.27 0.00 0.08 0.02 0.01 0.11 3.9 1.0 0.5
13D4 95.5 0.21 4.71 0.24 0.00 0.13 0.02 0.02 0.17 3.4 0.5 0.5
14D1 67.6 0.28 0.85 0.54 0.00 0.25 0.04 0.03 0.32 25.2 4.1 3.1
15D1 78.9 0.18 0.83 0.30 0.00 0.16 0.02 0.03 0.21 16.1 2.0 3.0
15D2 60.2 0.21 0.53 0.42 0.00 0.13 0.04 0.03 0.20 25.6 8.1 6.1
15D3 95.1 0.11 2.14 0.30 0.00 0.06 0.04 0.02 0.12 2.5 1.6 0.8
15D4 88.2 0.13 1.06 0.24 0.00 0.08 0.03 0.02 0.13 7.1 2.8 1.9
Note: * stand-alone test to gauge initial CIL efficiency ** less extended CIL g/t
13.2.2.5 Discussion – Bulk Composites Recoveries
Plotting of total recoveries has seemingly indicated two trend relationships:
1. Recovery increase with increasing head grade
o Figure 13-5 and Figure 13-6 show the head grades, as calculated from the gravity/CIL recovery tests, against the respective total recoveries. The relationship is not strongly definitive. For example, a sample of head grade 1.07 g/t gave 74% recovery whereas one of 1.17 g/t returned 94%.
o Table 13-11 shows the data to indicate increasing recoveries (simple averages) with higher minimum feed grades.

NI 43-101 Technical Report for the Asanko Gold Mine, Ashanti Region, Ghana
Effective Date: February 28, 2022
Page 169
Figure 13-5 Head Grade vs Total Recovery – Esaase Bulk Composites
Figure 13-6 Head Grade vs Total Recovery, with High Grade Outlier Omitted – Esaase Bulk Composites
Table 13-11 Esaase Bulk Composites – Recoveries at Increasing Cut-off Grades (g/t)
Head Grade (g/t) Base 0.53 0.8 1.0 1.3
No. of composites 14 13 11 5
Average recovery % 83.4 85.2 87.4 93.3
2. The relationship between organic carbon (OC) and CIL gold recovery from gravity tails
o Figure 13-7 and Figure 13-8 respectively depict the relationship between OC, and:
▪ Gold removed from the final residue during acetonitrile strip, expressed in g/t
▪ Gold recovery (unit) from CIL tests
Both figures show a strong relationship between OC grade and gold recovery. This relationship can also be highly variable. For example, Figure 13-8 contains four points that highlight the challenges in using OC grades to assess gold recovery performance. Equal OC contents of 0.42% have given a range CIL recoveries from 30 to 70%.
0
10
20
30
40
50
60
70
80
90
100
0.0 1.0 2.0 3.0 4.0 5.0
Rec
ove
ry %
Au head g/t
50
55
60
65
70
75
80
85
90
95
100
0.0 0.5 1.0 1.5 2.0 2.5
Rec
ove
ry %
Au head g/t

NI 43-101 Technical Report for the Asanko Gold Mine, Ashanti Region, Ghana
Effective Date: February 28, 2022
Page 170
Figure 13-7 Gold Removed from Final Residue During Acetonitrile Strip vs. OC Content – Esaase Bulk Composites
Figure 13-8 Organic Carbon Grade vs. CIL Stage Recovery – Esaase Bulk Composites
13.2.2.6 Conclusions from Bulk Composites Testing
Comments on the bulk composites’ gravity/CIL testwork results are as follows:
• Gravity recoverable gold content ranged from 32 to 79% for an average 53%
• Total gold recovery ranged from 60.2% to 95.5% for an average 83.7%
• Leach residue (final tails) grades ranged from 0.08 to 0.28 g/t for an average 0.18 g/t
• Leach kinetics were generally rapid with the bulk of leaching completed in 8 hours
• Reagent consumptions were low for both cyanide and hydrated lime
The results indicated low recoveries for some composites, attributable to the presence of organic carbon. These findings align with the 2018/19 testwork.
Mapping of the bulk composites’ recovery results proved inconclusive as a contributor to recovery modelling. It was decided that greater spatial definition was required in order to create any links between zones/lithologies and recovery expectations, i.e. variability testing.
0.00
0.05
0.10
0.15
0.20
0.25
0.30
0 0.1 0.2 0.3 0.4 0.5 0.6
Au
g/t
ext
ract
ed
OC Grade (%)
30
40
50
60
70
80
90
100
0 0.1 0.2 0.3 0.4 0.5 0.6
Rec
ove
ry %
OC Grade %

NI 43-101 Technical Report for the Asanko Gold Mine, Ashanti Region, Ghana
Effective Date: February 28, 2022
Page 171
13.2.3 Variability Samples Testing (ALS A22281)
The bulk composites constituents were tested as individual intervals. In some cases, where a lithological boundary was thought to exist, these intervals were further divided. Hole data for these intervals is provided in Table 13-4.
Further refinement of the samples was carried out by removing material that would not be mined as ore, i.e. a 0.5 g/t gold grade cut off was applied and a 1 m ‘skin dilution’ applied before and after the grade segments. In instances where, for example, an isolated metre increment was of grade yet surrounded by low grade material, it was omitted from the composite. This approach resulted in the removal of 15% of the drill core increments in total.
Head assays were carried out on the main elements of interest and are provided in Table 13-12. No multi element assays were undertaken.
Table 13-13 compares the gold head assays – expected as from the exploration core assays, prepared test samples head assays and those as calculated from the subsequent gravity/CIL recovery tests. Significant scatter of gold grades is again evident.

NI 43-101 Technical Report for the Asanko Gold Mine, Ashanti Region, Ghana
Effective Date: February 28, 2022
Page 172
Table 13-12 Esaase Variability Samples Head Assays
Sample ID As
(ppm)
Au
(ppm)
Au_rpt1
(ppm)
Au avg (ppm)
Ctotal
(%)
Corganic
(%)
Stotal
(%)
Ssulphide
(%)
11D1-1 1645 3.18 3.51 3.35 1.11 0.45 0.50 0.42
11D1-2 505 0.38 0.42 0.40 0.48 0.45 0.16 0.12
11D2-1 395 0.37 0.46 0.42 0.48 0.27 0.26 0.12
11D2-2 945 0.38 0.29 0.34 1.05 0.33 0.56 0.42
12D1-1 225 0.97 0.97 0.97 0.51 0.51 0.46 0.40
12ND1-2 160 2.41 0.95 1.68 0.42 0.39 <0.02 <0.02
12ND1-3 400 0.92 0.61 0.77 0.66 0.42 0.38 0.36
12ND1-4 1095 0.80 0.62 0.71 0.75 0.30 0.32 0.28
12ND2-1 1180 0.79 0.71 0.75 0.72 0.66 0.54 0.46
12ND2-2 1010 1.66 1.72 1.69 0.96 0.51 0.50 0.44
12ND2-3 405 13.0 0.25 6.63 0.66 0.33 0.24 0.20
12ND2-4 1285 1.12 1.06 1.09 1.17 0.48 0.44 0.38
12SD1-1 735 13.3 14.7 14.00 0.63 0.63 0.24 0.20
12SD1-2 895 0.76 0.47 0.62 0.45 0.42 0.32 0.28
12SD1-3 1440 0.35 0.37 0.36 0.48 0.45 0.22 0.20
12SD1-5 30 <0.02 <0.02 <0.02 0.90 0.15 0.04 0.04
12SD1-5 Repeat <0.02 <0.02 Anomalous – sample not progressed to recovery testing
13D1-1 490 0.80 0.76 0.78 0.48 0.48 0.30 0.28
13D1-2 400 1.08 0.82 0.95 0.57 0.30 0.24 0.22
13D1-3 410 0.42 0.39 0.41 0.78 0.57 0.24 0.22
13D2-2 1125 0.96 0.75 0.86 0.90 0.33 0.42 0.40
13D2-3 345 0.94 0.81 0.88 0.93 0.27 0.30 0.28
13D3-1 795 1.04 1.87 1.46 0.24 0.24 0.14 0.12
13D3-2 325 1.29 1.41 1.35 1.53 0.39 0.26 0.24
13D3-3 530 0.58 0.62 0.60 0.96 0.21 0.22 0.20
13D4-1 515 0.74 1.88 1.31 1.32 0.33 0.36 0.32
13D4-2 545 1.26 1.94 1.60 1.44 0.24 0.28 0.26
14D1-2-1 1085 0.53 0.77 0.65 2.13 0.51 0.40 0.38
14D1-2-2 140 0.73 0.77 0.75 1.71 0.33 0.32 0.28
15D1-2 715 0.70 0.86 0.78 1.53 0.27 0.30 0.20
15D1-3 1015 1.37 1.35 1.36 1.62 0.36 0.44 0.32
15D1-4 1100 3.58 16.9 10.24 1.05 0.21 0.26 0.18
15D2-1 525 0.59 0.66 0.63 1.41 0.54 0.24 0.22
15D2-2-1 160 0.52 0.61 0.57 1.44 0.21 0.20 0.18
15D2-2-2 630 2.72 3.47 3.10 1.29 0.21 0.28 0.26
15D2-3 260 0.23 0.27 0.25 1.32 0.36 0.12 0.10
15D3-1 490 0.76 0.73 0.75 1.35 0.21 0.26 0.24
15D3-2 2810 3.36 2.50 2.93 1.35 0.33 0.42 0.40
15D3-3 715 0.81 0.81 0.81 0.93 0.39 0.40 0.32
15D3-4 215 0.83 1.89 1.36 1.29 0.30 0.20 0.20
15D4-1 575 1.93 1.75 1.84 0.84 0.12 0.28 0.26
15D4-2 585 0.84 0.91 0.88 1.02 0.33 0.30 0.28
15D4-3 1125 0.79 0.90 0.85 0.96 0.30 0.30 0.28

NI 43-101 Technical Report for the Asanko Gold Mine, Ashanti Region, Ghana
Effective Date: February 28, 2022
Page 173
Table 13-13 Esaase Variability Samples – Comparison of Gold Head Assays (g/t)
Sample ID Expected
(Core Grades)
ALS Duplicate Fire Assay
Fire Assay Average
ALS Calc. Head from 8 kg
Recovery Test
% Difference (Expected vs
Calc.)
11D1-1 6.49 3.18, 3.51 3.35 3.50 46
11D1-2 1.13 0.38, 0.42 0.40 0.78 31
11D2-1 0.86 0.37, 0.46 0.42 1.47 -71
11D2-2 1.67 0.38, 0.29 0.34 0.41 75
12ND1-1 0.94 0.97, 0.97 0.97 1.29 -36
12ND1-2 2.39 2.41, 0.95 1.68 1.29 46
12ND1-3 5.09 0.92, 0.61 0.77 1.15 77
12ND1-4 1.26 0.80, 0.62 0.71 1.90 -51
12ND2-1 1.04 0.79, 0.71 0.75 0.80 23
12ND2-2 1.52 1.66, 1.72 1.69 1.61 -6
12ND2-3 1.42 13.0, 0.25 6.63 0.56 61
12ND2-4 1.54 1.12, 1.06 1.09 1.18 23
12SD1-1 1.02 13.3, 14.7 14.0 (excl.) 1.30 -27
12SD1-2 0.48 0.76, 0.47 0.62 0.69 -43
12SD1-3 0.62 0.35, 0.37 0.36 0.45 28
13D1-1 0.96 0.76, 0.78 0.78 0.97 -1
13D1-2 2.20 1.08, 0.82 0.95 12.0 (excl.) -443
13D1-3 0.98 0.42, 0.39 0.41 1.12 -15
13D2-2 0.92 0.96, 0.75 0.86 0.87 5
13D2-3 1.76 0.94, 0.81 0.88 1.03 41
13D3-1 2.33 1.04, 1.87 1.46 1.99 15
13D3-2 1.61 1.29, 1.41 1.35 1.07 34
13D3-3 1.37 0.58, 0.62 0.60 1.28 7
13D4-1 1.80 0.74, 1.88 1.31 1.04 42
13D4-2 4.38 1.26, 1.94 1.60 3.36 23
14D1-2-1 1.18 0.53, 0.77 0.65 0.66 44
14D1-2-2 1.00 0.73, 0.77 0.75 1.05 -5
15D1-2 0.90 0.70, 0.86 0.78 1.22 -36
15D1-3 0.97 1.37, 1.35 1.36 1.70 -75
15D1-4 2.09 3.58, 16.9 10.2 3.78 -81
15D2-1 0.85 0.59, 0.66 0.63 0.72 15
15D2-2-1 0.75 0.52, 0.61 0.57 1.23 -62
15D2-2-2 1.00 2.72, 3.47 3.10 3.38 -237
15D2-3 1.81 0.23, 0.27 0.25 (excl.) 0.20 (excl.) 89
15D3-1 1.76 0.76, 0.73 0.75 1.21 32
15D3-2 1.60 3.36, 2.50 2.93 6.56 -310
15D3-3 1.63 0.81, 0.81 0.81 1.63 0
15D3-4 2.11 0.83, 1.89 1.36 1.01 52
15D4-1 1.11 1.93, 1.75 1.84 1.10 1
15D4-2 1.29 0.84, 0.91 0.88 1.48 -15
15D4-3 1.74 0.79, 0.90 0.85 0.73 58
average 1.65 1.47 1.50 -7

NI 43-101 Technical Report for the Asanko Gold Mine, Ashanti Region, Ghana
Effective Date: February 28, 2022
Page 174
13.2.3.1 Variability Samples – Recovery Testing
Samples were subjected to gravity/CIL testing as per the bulk composites, with the exception of the kinetics sampling. Only final 24-hour products were assayed. For this suite of tests, it was decided to assess the effect of increased NaCN levels, an initial concentration of 1,000 ppm was employed. Activated carbon concentration was 15 g/L.
Table 13-14 Esaase Variability Samples Recovery Test Results
Sample ID Gravity Gold
(%) CIL Unit
Recovery% Total Gold
Extraction % Residue
Grade (Au g/t) Calculated
Head (Au g/t)
NaCN
Cons. (kg/t)
Ca(OH)2 Cons. (kg/t)
11D1 – 1 53.0 87.2 94.0 0.21 3.50 0.39 0.4
11D1 – 2 56.7 55.8 80.9 0.15 0.78 0.50 1.2
11D2 – 1 66.7 89.8 96.6 0.05 1.47 0.42 0.4
11D2 – 2 31.8 89.4 92.7 0.03 0.41 0.45 1.0
12ND1-1 66.8 88.3 96.1 0.05 1.29 0.31 0.4
12ND1-2 63.9 80.7 93.0 0.09 1.29 0.36 0.4
12ND1-3 49.7 86.2 93.1 0.08 1.15 0.31 0.4
12ND1-4 51.5 81.5 91.0 0.17 1.90 0.26 0.3
12ND2-1 27.7 86.2 90.0 0.08 0.80 0.47 0.7
12ND2-2 16.7 81.4 84.5 0.25 1.61 0.42 0.9
12ND2-3 55.4 75.9 89.3 0.06 0.56 0.31 0.5
12ND2-4 35.3 81.7 88.2 0.14 1.18 0.42 0.5
12SD1-1 47.3 82.4 90.8 0.12 1.30 0.44 0.4
12SD1-2 36.5 86.2 91.3 0.06 0.69 0.50 0.5
12SD1-3 37.2 89.4 93.3 0.03 0.45 0.39 0.4
13D1-1 37.5 74.4 84.0 0.16 0.97 0.42 0.5
13D1-2 92.4 89.0 99.2 0.10 12.0 0.45 0.4
13D1-3 44.2 80.0 88.9 0.13 1.12 0.47 0.5
13D2-2 19.8 80.7 84.5 0.14 0.87 0.34 0.3
13D2-3 33.5 81.8 87.9 0.13 1.03 0.31 0.3
13D3-1 65.6 91.9 97.2 0.06 1.99 0.31 0.4
13D3-2 26.7 87.9 91.1 0.10 1.07 0.31 0.3
13D3-3 55.2 87.0 94.2 0.08 1.28 0.34 0.5
13D4-1 25.9 86.4 89.9 0.11 1.04 0.31 0.3
13D4-2 47.9 92.8 96.3 0.13 3.36 0.40 0.3
14D1-2-1 21.6 72.9 78.8 0.14 0.66 0.45 0.5
14D1-2- 2 44.0 74.5 85.7 0.15 1.05 0.34 0.5
15D1-2 36.1 80.7 87.7 0.15 1.22 0.29 0.3
15D1-3 23.7 91.5 93.5 0.11 1.70 0.31 0.3
15D1-4 90.4 87.6 98.8 0.05 3.78 0.31 0.3
15D2-1 28.1 60.5 71.6 0.21 0.72 0.40 0.6
15D2-2-1 41.4 87.5 92.7 0.09 1.23 0.36 0.3
15D2-2-2 77.3 65.5 92.2 0.27 3.38 0.36 0.3
15D2-3 31.1 49.0 64.9 0.07 0.20 0.36 0.3
15D3-1 55.9 83.1 92.5 0.09 1.21 0.36 0.4
15D3-2 76.9 86.5 96.9 0.21 6.56 0.40 0.3
15D3-3 61.2 89.7 96.0 0.07 1.63 0.45 0.4
15D3-4 49.1 85.5 92.6 0.08 1.01 0.36 0.3
15D4-1 42.7 79.5 88.2 0.13 1.10 0.34 0.3
15D4-2 46.7 87.3 93.3 0.10 1.48 0.40 0.4
15D4-3 28.2 84.6 89.0 0.08 0.73 0.52 0.4
Comments on the variability composites’ gravity/CIL testwork results are as follows:

NI 43-101 Technical Report for the Asanko Gold Mine, Ashanti Region, Ghana
Effective Date: February 28, 2022
Page 175
• Gravity recoverable gold content ranges from 17% to a very high 92% for an average of 46%
• Total recovery ranged from 64.9% to an extremely high 99.2% for an average of 90.1%
• Leach residue grades ranged from 0.03 to 0.27 for an average of 0.11 g/t
• Leach kinetics were generally rapid, with the bulk of the leaching completed in 8 hours
• Average reagent consumptions were generally low for both cyanide and hydrated lime
The two samples that returned the extremes of calculated head values have not been included in the further results assessment:
• High: 13D1-2 at 12.0 g/t
• Low: 15D2-3 at 0.20 g/t
13.2.3.2 Comparison with Bulk Composites Recoveries
Table 13-15 shows the bulk composites recoveries as quoted in Section 13.2.2 along with the corresponding recoveries as determined from the variability samples results.
Variability results show the average of the intervals that comprised the bulk composites, on a weighted basis.
Table 13-15 Comparison of Esaase Bulk Composites Recoveries to Corresponding Constituents
Bulk Composite ID Bulk Composite Total
Recovery % Corresponding Variability
Samples Recovery % Increase, Percentage
Points
11D1 74.8 87.2 12.4
11D2 93.6 94.4 0.9
12ND1 90.5 93.3 2.7
12ND2 73.8 87.6 13.8
12SD1 90.5 92.1 1.6
13D1 80.1 90.5 10.4
13D2 84.6 86.3 1.7
13D3 94.6 95.2 0.6
13D4 95.5 94.0 -1.5
14D1 67.6 81.3 13.7
15D1 78.9 93.6 14.8
15D2 60.2 83.7 23.5
15D3 95.1 95.0 -0.1
15D4 88.2 90.9 2.8
Average 83.4 90.4 6.9
Shown graphically in Figure 13-9, significant increases are seen for the composites that returned the lower results in the bulk composite round of testing. It should be noted that, although the bulk and variability rounds of testing are not directly comparable due to the removal of low grade drill core increments, the recovery increases are attributed to the higher initial NaCN concentrations in the laboratory tests.
It should be noted however that, although laboratory batch tests require higher initial cyanide concentrations, further investigation is required into continuous plant requirements. Significantly higher cyanide additions than current levels (circa 640 ppm) may have implications for detoxification and tailings management.

NI 43-101 Technical Report for the Asanko Gold Mine, Ashanti Region, Ghana
Effective Date: February 28, 2022
Page 176
Figure 13-9 Esaase Bulk Composite vs. Constituents’ Recoveries
The variability samples in some instances returned calculated gold head grades lower than 1.0 g/t. Table 13-16 shows the recoveries from two additional grade ranges.
It is evident however that the average head grade as calculated from all samples more closely aligns with that of the overall pit, the corresponding recovery value is deemed more appropriate on that basis.
Table 13-16 Esaase Recoveries Cropped According to Calculated Gold Head Assays
Esaase Variability Intervals (all)*
Intervals at Head Grade >0.8g/t Au
Intervals at Head Grade >1.0g/t Au
count 39 31 28
average head Au g/t 1.50 1.73 1.82
total recovery % 90.5 91.7 92.2
recovery discount %** 0.3 0.3 0.3
estimated recovery % 90.2 91.4 91.9
Notes: * Excludes highest and lowest outliers according to calculated head gold grades ** 0.3 % points as based on 6 months’ process plant operating data April to Sept. 2021: - 0.007 mg/L final tails’ solution tenor - 76 g/t barren carbon grade, 5 T/month carbon loss
13.2.3.3 Commentary on Recovery Results of the Variability Samples in Relation to Geology
Direct correlation between the metallurgical recovery of individual samples and current Esaase geological model cannot be established either spatially or statistically (Table 13-17, Figure 13-10).
It becomes clear since the receipt of the test results in early October 2021, that the geometallurgical understanding will need to be improved. At time of this report, Asanko Exploration team has started a new drillhole re-logging and geological mapping campaign to advance the interpretation and modelling of the geology at Esaase.
0
10
20
30
40
50
60
70
80
90
100
Tota
l A
u R
ecovery
%
Bulk Constituents

NI 43-101 Technical Report for the Asanko Gold Mine, Ashanti Region, Ghana
Effective Date: February 28, 2022
Page 177
Table 13-17 Esaase Recovery by Domain
Litho-Stratigraphic Unit Average Recovery (%) Sum of Sample Length (m)
Central SS S.Main 88.7 275
Central SS Main 92.4 458
Central SS North 92.2 23
Cobra S.Main 78.8 4
Cobra Main 89.7 157
Upper SS Main 91.3 16
Figure 13-10 Esaase Gold Recovery by Mineralized Domain
13.3 Current Testwork 2021 – Nkran and Obotan Satellite Deposits
13.3.1 Nkran 2021 Testwork (ALS A22441)
Past gold recoveries from processing of the Nkran ore (2017 to 2019) averaged 94%. By way of confirmation testing, a suite of 7 DD (half HQ) intervals were dispatched to ALS, Perth (Report A22441, January 2022). Lithologies tested included granites (2), sandstones (4) and siltstone (1).
Figure 13-11 provides the sample locations. The average interval length of each composite was 19 m.
Table 13-18 provides the composites’ hole details while Table 13-19 provides the head assays for the main elements of interest.
0
10
20
30
40
50
60
70
80
90
100
14D
1-2
15D
1-2
15D
2-1
15D
2-2
15D
2-3
15D
3-2
15D
3-3
15D
3-4
15D
4-1
15D
4-2
15D
4-3
11D
1-1
11D
1-2
11D
2-1
11D
2-2
12N
D1
-312N
D1
-412N
D2
-313D
1-1
13D
1-2
13D
1-3
13D
2-2
13D
2-3
13D
3-1
13D
3-2
13D
3-3
13D
4-1
13D
4-2
15D
1-2
15D
1-3
15D
1-4
15D
3-1
12N
D1
-112N
D2
-112N
D2
-411D
2-2
12N
D1
-112N
D1
-212N
D1
-312N
D2
-112N
D2
-212N
D2
-312N
D2
-412S
D1-1
12S
D1-3
13D
1-1
13D
1-3
14D
1-2
Central Sandstone S. Main Central Sandstone Main Central Sandstone North Cobra Main Cobra S.Main
Gold
Meta
llurg
ical R
ecovery
(%
)

NI 43-101 Technical Report for the Asanko Gold Mine, Ashanti Region, Ghana
Effective Date: February 28, 2022
Page 178
Figure 13-11 Nkran Composite Long Section
Table 13-18 Nkran Composites Details
Composite ID Hole ID Lithology From m To m
NKGR02 NKDD20-018 granite 13 57
NKGR05 NKDD20-031 granite 127 155
NKSD11 NKDD20-039 sandstone 92.25 117
NKSD12 NKDD20-024 sandstone 87.1 111
NKSD15 NKDD20-047 sandstone 107 121.5
NKSD16 NKDD20-024 sandstone 111 136
NKSI14 NKDD20-031 siltstone 75.2 88.14
Table 13-19 Nkran Composites Head Assays
COMP ID Ag
(ppm)
As
(%)
Au I (ppm)
Au II (ppm)
CTotal (%) OC (%) Cu
(ppm) STotal (%)
SSulphide (%)
NKGR02 0.3 0.22 0.25 0.24 0.39 <0.03 28 0.24 0.16
NKGR05 0.3 0.34 0.36 0.29 0.69 0.12 39 0.46 0.32
NKSD11 0.3 0.30 2.03 2.36 0.72 <0.03 57 1.00 0.76
NKSD12 <0.3 0.06 0.47 0.59 1.68 0.03 30 0.30 0.24
NKSD15 0.3 0.20 1.29 0.92 1.11 0.42 54 0.58 0.48
NKSD16 0.3 0.36 5.61 1.96 1.53 0.09 34 0.60 0.40
NKSI14 <0.3 0.12 1.22 1.46 1.47 0.30 40 0.64 0.54

NI 43-101 Technical Report for the Asanko Gold Mine, Ashanti Region, Ghana
Effective Date: February 28, 2022
Page 179
The first round of recovery tests was completed at an incorrect cyanide concentration of an initial 300 ppm NaCN. Results indicated poor response for both the granite samples. Subsequent testing at a more appropriate concentration of 600 ppm NaCN (equivalent to typical plant levels) resulted in high recoveries for all lithologies. These results are summarized in Table 13-20. Note, the two granites samples were composites for the second round of testing.
Table 13-20 Nkran Summary of Recoveries (600 ppm Initial NaCN)
COMP ID GRIND SIZE
(P80 um)
GRAVITY GOLD (%)
TOTAL GOLD EXTRACTION
24Hrs (%)
RESIDUE GRADE (Au
g/t)
CALC. HEAD
(Au g/t)
NaCN (kg/t)
HYD. LIME (kg/t)
NKGR02/05 106 50.1 96.2 0.03 0.66 0.21 0.27
NKSD11 106 24.3 95.5 0.13 2.86 0.27 0.51
NKSD12 106 10.4 95.9 0.03 0.73 0.25 0.48
NKSD15 106 8.8 94.2 0.11 1.80 0.27 0.48
NKSD16 106 10.5 96.0 0.13 3.11 0.25 0.42
NKSI14 106 9.7 93.1 0.11 1.60 0.25 0.52
The simple average recovery from these tests was 95.3%, assuming equal recovery for the granite samples. Allowing a 0.3% discount for operational losses, the resultant 95% recovery suggests the past processing results (94%) may be applied for Nkran material processing.
Note that Nkran is currently the subject of an infill drilling campaign, resultant mineralized core sections are to be subjected to further confirmatory testwork.
13.3.2 Abore 2021 Testwork (ALS A22441)
A suite of metallurgical testwork was undertaken on 7 DD core composites at ALS, Perth (Report A22441, January, 2022). The objective was to confirm that recoveries would align with those of past performance. Resolute mining and processing activities in 2002 returned overall recoveries of 95% (refer Resolute Amansie Limited: Abore Open Pit – Final Report, 2002).
A total of 124 m core was dispatched, with each interval composite averaging 18 m in length. Six of the composites were classified as granite while the seventh as a blend of granites (27%) and sandstones (73%). Granites constitute an estimated 85% of the Abore fresh zone tonnage. Figure 13-12 displays the composites’ locations in long section.

NI 43-101 Technical Report for the Asanko Gold Mine, Ashanti Region, Ghana
Effective Date: February 28, 2022
Page 180
Figure 13-12 Abore Composites Long Section
Table 13-21 supplies a summary of the interval composites hole details. Note, intervals’ meters were not necessarily continuous as some core increments were unavailable.
Table 13-22 provides the composites head assays.
Table 13-21 Abore Composites Details
Composite ID Hole ID Lithology From m To m
ABRGR01 ABPC20-003 granite 103 132
ABRGR02 ABPC20-007 granite 100 144
ABRGR03 ABPC20-009 granite 177 193
ABRGR04 ABPC20-030 granite 113 129
ABRGR05 ABPC20-020 granite 110 144
ABRGR07 ABPC20-006 granite 113 154
ABRSD08 ABPC20-013
sediments/granite 126.19 130.46
ABPC20-024 119 126

NI 43-101 Technical Report for the Asanko Gold Mine, Ashanti Region, Ghana
Effective Date: February 28, 2022
Page 181
Table 13-22 Abore Composite Head Assays
COMP ID Ag
(ppm)
As
(%)
Au I (ppm)
Au II (ppm)
CTotal
(%) OC (%)
Cu
(ppm)
STotal
(%) SSulphide (%)
ABRGR01 <0.3 0.26 0.31 0.46 0.42 <0.03 5 0.18 0.14
ABRGR02 <0.3 0.34 0.71 0.52 0.45 <0.03 4 0.22 0.14
ABRGR03 <0.3 0.48 1.56 0.80 0.57 <0.03 5 0.28 0.22
ABRGR04 0.3 0.48 0.52 1.01 0.39 <0.03 5 0.26 0.18
ABRGR05 <0.3 0.20 0.29 1.70 0.33 0.18 12 0.14 0.10
ABRGR07 <0.3 0.12 0.16 0.76 0.30 0.12 5 0.12 0.06
ABRGR08 0.3 0.16 1.51 1.53 0.75 0.27 39 0.44 0.42
Summarized recovery results in Table 13-23 indicate good response from the granite samples with an average of 95.7%. The sandstone/granite sample returned lower recovery at 84.5% and also indicated the lowest gravity stage recovery of only 18.3%. This sample contained the highest OC grade at 0.27%.
By calculation of proportion of sandstone to granite in composite ABRSD08, and the average granite recovery, the estimated recovery from the sandstone component is 80.3%.
Table 13-23 Abore Summary of Recoveries
COMP ID GRIND
SIZE (P80 um)
GRAVITY GOLD
(%)
TOTAL GOLD EXTRACTION
24Hrs (%)
RESIDUE GRADE (Au g/t)
CALC. HEAD (Au g/t)
NaCN (kg/t)
HYD. LIME (kg/t)
ABRGR01 106 49.0 93.2 0.05 0.66 0.26 0.3
ABRGR02 106 51.5 94.6 0.05 0.84 0.25 0.3
ABRGR03 106 69.5 96.9 0.05 1.63 0.25 0.3
ABRGR04 106 27.5 97.9 0.06 2.57 0.22 0.3
ABRGR05 106 41.1 94.7 0.03 0.48 0.20 0.3
ABRGR07 106 46.8 96.6 0.01 0.29 0.17 0.2
ABRSD08 106 18.3 84.5 0.23 1.50 0.25 0.5
The overall recovery from these tests stands at 93.3% which includes a discount for losses in processing. When using higher recoveries for the remaining oxide and transition materials, the work confirms no major variation from the past production 95% recovery value, however a 94% recovery value is currently concluded for the overall Abore recovery.
The relationship between OC and gold recovery in the sandstones warrants further investigation. Additional diamond drilling at Abore is currently envisaged, gold recovery relationship with OC will constitute part of the ensuing metallurgical test program.
13.3.3 Miradani North 2021 Testwork (ALS A22441)
A total of 259 x 1m core samples from 11 drill holes were delivered to ALS, Perth in June of 2021.
• Samples were selected based on the drill core available (all HQ) and considered the strike and dip distribution to cover the entire deposit
• Sample selection also considered the mineralized lithologies which in Miradani North are predominantly in the intrusives (granites/tonalites) and the sediments along its peripheries (sandstones, siltstones and intercalations of the two)
• For completeness 2 oxide and 2 transition composite were included
The drill hole locations are displayed in long section in Figure 13-13.

NI 43-101 Technical Report for the Asanko Gold Mine, Ashanti Region, Ghana
Effective Date: February 28, 2022
Page 182
Figure 13-13 Miradani North Drill Holes Long Section
Table 13-24 provides the head assays for the main elements of interest. The samples representing each oxidation state of fresh, transition and oxide were combined on an equal weight basis and subjected to multi element analysis as per Table 13-25.
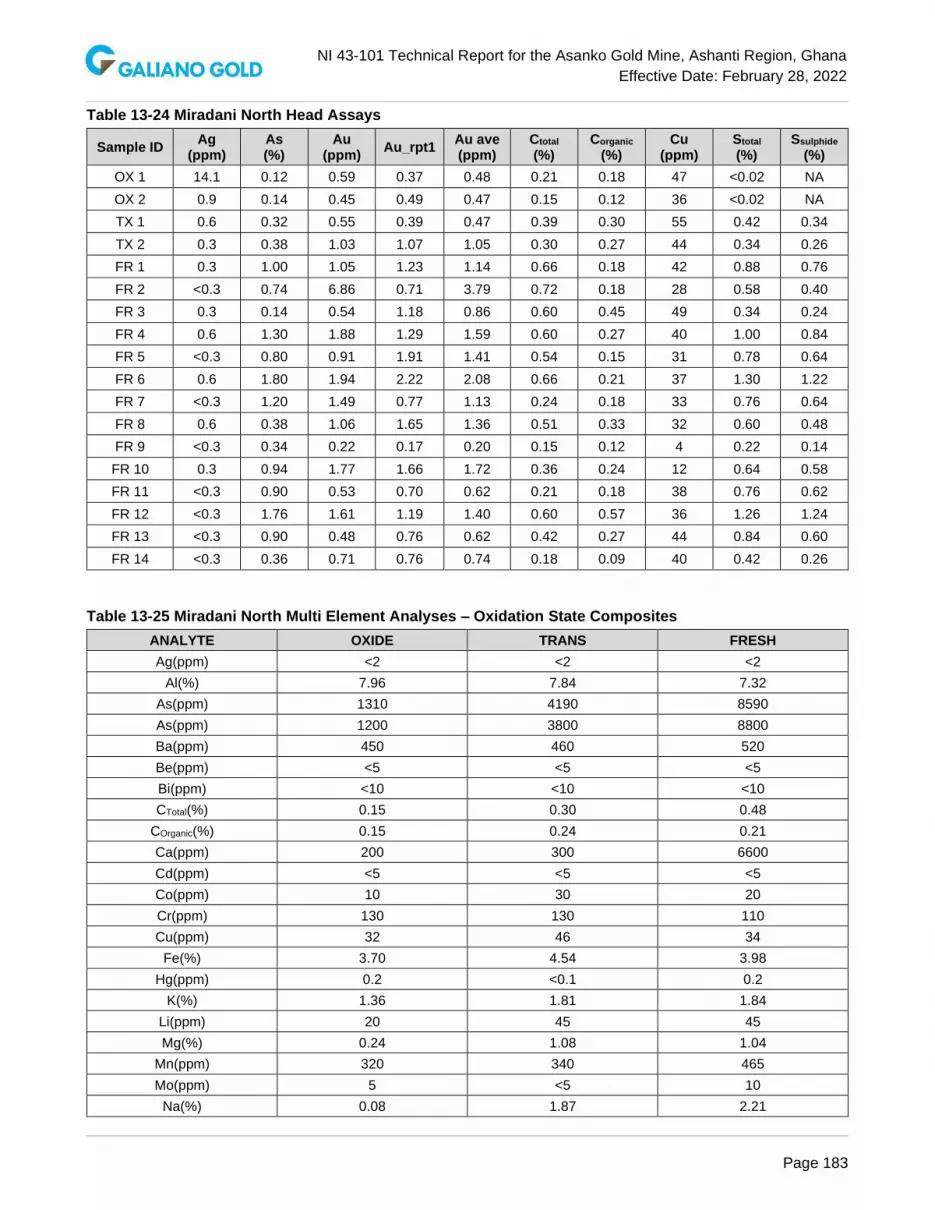
NI 43-101 Technical Report for the Asanko Gold Mine, Ashanti Region, Ghana
Effective Date: February 28, 2022
Page 183
Table 13-24 Miradani North Head Assays
Sample ID Ag
(ppm) As (%)
Au (ppm)
Au_rpt1 Au ave (ppm)
Ctotal (%)
Corganic
(%) Cu
(ppm) Stotal
(%) Ssulphide
(%)
OX 1 14.1 0.12 0.59 0.37 0.48 0.21 0.18 47 <0.02 NA
OX 2 0.9 0.14 0.45 0.49 0.47 0.15 0.12 36 <0.02 NA
TX 1 0.6 0.32 0.55 0.39 0.47 0.39 0.30 55 0.42 0.34
TX 2 0.3 0.38 1.03 1.07 1.05 0.30 0.27 44 0.34 0.26
FR 1 0.3 1.00 1.05 1.23 1.14 0.66 0.18 42 0.88 0.76
FR 2 <0.3 0.74 6.86 0.71 3.79 0.72 0.18 28 0.58 0.40
FR 3 0.3 0.14 0.54 1.18 0.86 0.60 0.45 49 0.34 0.24
FR 4 0.6 1.30 1.88 1.29 1.59 0.60 0.27 40 1.00 0.84
FR 5 <0.3 0.80 0.91 1.91 1.41 0.54 0.15 31 0.78 0.64
FR 6 0.6 1.80 1.94 2.22 2.08 0.66 0.21 37 1.30 1.22
FR 7 <0.3 1.20 1.49 0.77 1.13 0.24 0.18 33 0.76 0.64
FR 8 0.6 0.38 1.06 1.65 1.36 0.51 0.33 32 0.60 0.48
FR 9 <0.3 0.34 0.22 0.17 0.20 0.15 0.12 4 0.22 0.14
FR 10 0.3 0.94 1.77 1.66 1.72 0.36 0.24 12 0.64 0.58
FR 11 <0.3 0.90 0.53 0.70 0.62 0.21 0.18 38 0.76 0.62
FR 12 <0.3 1.76 1.61 1.19 1.40 0.60 0.57 36 1.26 1.24
FR 13 <0.3 0.90 0.48 0.76 0.62 0.42 0.27 44 0.84 0.60
FR 14 <0.3 0.36 0.71 0.76 0.74 0.18 0.09 40 0.42 0.26
Table 13-25 Miradani North Multi Element Analyses – Oxidation State Composites
ANALYTE OXIDE TRANS FRESH
Ag(ppm) <2 <2 <2
Al(%) 7.96 7.84 7.32
As(ppm) 1310 4190 8590
As(ppm) 1200 3800 8800
Ba(ppm) 450 460 520
Be(ppm) <5 <5 <5
Bi(ppm) <10 <10 <10
CTotal(%) 0.15 0.30 0.48
COrganic(%) 0.15 0.24 0.21
Ca(ppm) 200 300 6600
Cd(ppm) <5 <5 <5
Co(ppm) 10 30 20
Cr(ppm) 130 130 110
Cu(ppm) 32 46 34
Fe(%) 3.70 4.54 3.98
Hg(ppm) 0.2 <0.1 0.2
K(%) 1.36 1.81 1.84
Li(ppm) 20 45 45
Mg(%) 0.24 1.08 1.04
Mn(ppm) 320 340 465
Mo(ppm) 5 <5 10
Na(%) 0.08 1.87 2.21

NI 43-101 Technical Report for the Asanko Gold Mine, Ashanti Region, Ghana
Effective Date: February 28, 2022
Page 184
ANALYTE OXIDE TRANS FRESH
Ni(ppm) 20 50 45
P(ppm) 200 500 600
Pb(ppm) 195 55 60
STotal(%) <0.02 0.36 0.74
SSulphide(%) NA 0.30 0.62
SiO2(%) 71.2 68.4 66.0
Sr(ppm) 40 64 202
Ti(ppm) 4600 4000 3600
U(ppm) <2 <2 <2
V(ppm) 92 112 84
Y(ppm) <100 <100 <100
Zn(ppm) 36 82 70
Each of the 16 samples was subjected to recovery testing via gravity concentration and CIL of the gravity tails. These tests were carried out at a P80 of 106 µm grind size and 600 ppm initial NaCN in CIL.
Results as summarized in Table 13-26, indicate high gold recovery response with the following simple average recoveries by oxidation state:
• OXIDE 97.2% (average residue grade 0.02 g/t Au)
• TRANSITION 94.0% (average residue grade 0.05 g/t Au)
• FRESH 93.4% (average residue grade 0.10 g/t Au)
Table 13-26 Miradani North Recovery Testing – Summarised Results
SAMPLE ID GRAVITY GOLD (%)
TOTAL GOLD EXTRACTION
24 Hrs (%)
RESIDUE GRADE (Au g/t)
ASSAY HEAD
(Au g/t)
CALC. HEAD (Au
g/t)
NaCN (kg/t)
HYD. LIME (kg/t)
OX1 54.4 97.7 0.02 0.59, 0.37 0.88 0.38 1.8
OX2 54.1 96.7 0.03 0.45, 0.49 0.75 0.37 1.4
TX1 36.3 93.6 0.05 0.55, 0.39 0.79 0.66 2.2
TX2 32.9 94.3 0.05 1.03, 1.07 0.88 0.78 2.8
FR1 43.8 95.2 0.08 1.05, 1.23 1.58 0.27 0.5
FR2 69.4 97.1 0.07 6.86, 0.71 2.25 0.22 0.5
FR3 59.7 96.0 0.04 0.54, 1.18 0.94 0.32 0.5
FR4 62.8 97.6 0.09 1.88, 1.29 3.51 0.25 0.4
FR5 68.0 95.6 0.10 0.91, 1.91 2.25 0.25 0.4
FR6 48.1 93.5 0.22 1.94, 2.22 3.29 0.25 0.4
FR7 57.9 93.9 0.06 1.49, 0.77 0.98 0.27 0.5
FR8 48.5 93.8 0.13 1.06, 1.65 2.01 0.37 0.7
FR9 37.7 88.2 0.03 0.22, 0.17 0.25 0.27 0.3
FR10 40.3 92.4 0.21 1.77, 1.66 2.77 0.20 0.5
FR11 50.4 92.7 0.06 0.53, 0.7 0.82 0.84 6.0
FR12 53.9 94.4 0.15 1.61, 1.19 2.60 1.24 9.3
FR13 42.8 87.7 0.14 0.48, 0.76 1.14 0.84 5.5
FR14 43.1 90.1 0.07 0.71, 0.76 0.70 0.30 1.0
An overall value of 94% recovery value is concluded for the Miradani North material.

NI 43-101 Technical Report for the Asanko Gold Mine, Ashanti Region, Ghana
Effective Date: February 28, 2022
Page 185
13.3.4 Akwasiso
Akwasiso mineralization is hosted in shears on siltstone/sandstone contacts, and around and within the granitic intrusive. Strong alteration zones are associated with higher grades around the sandstone-granite contact. Mineralisation is hosted in the sandstone unit with gold occurring within quartz-carbonate veins, similar to the other deposits in the belt.
Akwasiso is currently being fed to the process plant as a minor tonnage contributor along with the predominant Esaase mill feed. Pit depletion is estimated to occur mid-2022.
A 94% gold recovery value is attributed to this small satellite deposit.
13.3.5 Dynamite Hill Previous Recoveries
Dynamite Hill ore had been processed through the process plant for 22 months between November 2017 and August 2019. This was complementary to the main mill feed sourced from the Nkran pit and was at no stage processed in isolation.
Table 13-27 provides details the contribution tonnage of Dynamite Hill (average 18%) along with overall plant recoveries (average 94%).
Table 13-27 Dynamite Hill Mill Feed Component and Plant Recoveries
Month Total Tonnes
Treated (t) Dynamite Hill Tonnes (%)
CIL Recovery (%) Overall Plant Recovery (%)
Nov-17 348,027 2.1 87.3 94.4
Dec-17 420,549 3.5 88.5 93.4
Jan-18 430,286 5.5 87.4 92.9
Feb-18 406,787 15.8 88.6 93.5
Mar-18 432,410 22.4 88.9 93.4
Apr-18 438,816 16.7 88.7 93.7
May-18 455,476 20.7 89.0 93.7
Jun-18 479,361 16.8 89.0 93.6
Jul-18 438,938 20.4 87.4 93.2
Aug-18 444,536 19.2 89.6 93.9
Sep-18 415,351 18.3 88.9 94.0
Oct-18 434,117 21.0 89.8 94.7
Nov-18 427,384 19.0 89.3 93.6
Dec-18 376,102 5.2 90.3 95.3
Jan-19 340,030 15.1 88.1 93.5
Feb-19 494,877 16.6 87.1 93.1
Mar-19 388,745 19.5 87.9 93.1
Apr-19 458,077 37.9 87.2 92.3
May-19 471,325 35.9 88.1 93.3
Jun-19 445,122 32.4 89.3 94.2
Jul-19 508,428 23.5 88.7 94.5
Aug-19 501,956 13.7 87.5 94.1
Given the Dynamite Hill ore was always fed in combination with Nkran ore, Figure 13-14 graphically displays variation in overall plant recoveries in comparison to the Dynamite Hill tonnage contribution.
Evident is an essentially steady rate of recovery over the period regardless of the Dynamite Hill component. The attributable recovery from future mill feed is therefore assumed to be in line with past production 94% recovery.

NI 43-101 Technical Report for the Asanko Gold Mine, Ashanti Region, Ghana
Effective Date: February 28, 2022
Page 186
Figure 13-14 Plant Recovery versus Dynamite Hill Feed Component
13.3.6 Adubiaso Previous Recoveries
Adubiaso ore had been mined and processed through the process plant for a period of 14 months from November 1999 to December 2000. The ore was complimentary mill feed to that of Nkran ore, over the period Adubiaso ore accounted for an average of 34% of the mill feed tonnage.
Table 13-28 provides a summary of the processing results, a total of 698 kt was fed to the mill with gold recoveries were slightly greater than 96% as based on monthly plant recovery figures (refer Resolute Amansie Limited: Adubiaso Open Pit – Final Report, 2001).
A slightly conservative gold recovery of 94% has been applied for future performance from this pit.
Table 13-28 Adubiaso Past Production Summary
Period Tonnes (dmt) Grade (g/t Au) Mined Au Oz Recovered Au Oz
Nov-99 64,267 1.42 2,940 2,782
Dec-99 46,481 1.59 2,387 2,256
Jan-00 47,810 1.82 2,810 2,681
Feb-00 82,888 1.95 5,218 4,989
Mar-00 91,460 3.11 9,178 8,921
Apr-00 65,130 3.09 6,490 6,334
May-00 104,422 2.54 8,561 8,296
Jun-00 88,750 3.14 8,990 8,775
Jul-00 34,812 2.35 2,641 2,564
Aug-00 15,591 2.55 1,283 1,249
Sep-00 12,706 2.45 1,003 970
Oct-00 21,285 2.54 1,742 1,620
Nov-00 6,100 2.12 417 381
Dec-00 16,946 1.82 994 862
Total 698,648 2.43 54,654 52,677
0
10
20
30
40
50
60
70
80
90
100
No
v-1
7
De
c-1
7
Jan
-18
Fe
b-1
8
Ma
r-1
8
Ap
r-18
Ma
y-1
8
Jun
-18
Jul-
18
Au
g-1
8
Se
p-1
8
Oct-
18
No
v-1
8
De
c-1
8
Jan
-19
Fe
b-1
9
Ma
r-1
9
Ap
r-19
Ma
y-1
9
Jun
-19
Jul-
19
Au
g-1
9
Perc
ent
(%)
Dynamite Hill Tons % Plant recovery %

NI 43-101 Technical Report for the Asanko Gold Mine, Ashanti Region, Ghana
Effective Date: February 28, 2022
Page 187
13.4 Recent Plant Performance
As per the press release issued by Galiano Gold on February 25th, 2022, the Asanko Gold Mine had recently detected an increase in gold grades in its tailings product leaving the processing facility. The assays indicated total gold grades of approximately 0.40 g/t in tailings product, which is higher than the historic and expected total gold grade in tailings of approximately 0.10 g/t. Previous testwork describes areas of the Esaase pit that were expected to yield lower recovery, and it is possible that material mined from these areas may be causing the lower recovery. However, given the volume and consistency of the material yielding lower recovery, the Company is working to better understand the cause(s), magnitude and impact of the observed lower recovery.
Testwork programs (2018-2021) have identified the key component of the geometallurgy of the Esaase unoxidized fresh mineralization, and potentially within the weakly oxidised transition, as the distribution and abundance of organic carbon.
Organic carbon in the plant feed material can compete with the activated carbon, added as part of the recovery process, for the adsorption of solubilised gold from solution.
An initial full plant circuit survey was recently completed. Samples obtained from various parts of the plant were subject to both BLEG (Bulk Leach Extractable Gold) and fire assays to assess how the characteristics of cyanide-soluble gold changes throughout the plant in comparison to total gold. Early results indicated that a portion of the increase in gold in tailings is attributable to preg-borrowing or preg-robbing materials, evident by an increase in difference between BLEG and fire assay after reaction with cyanide in the first leach tank,
Initial diagnostic leach testwork of head and tail composite samples indicate that the lower recoveries appear to be losses to organic carbon and some encapsulation in sulphides and silicates. The magnitude of recovery loss attributable to organic carbon versus sulphides/silicates is currently inconclusive and will continue to be investigated.
Investigative testing of recent leach feed material, undertaken at the Asanko site laboratory, has indicated the potential for increased recoveries via the use of kerosene as a pre-CIL conditioning agent. The kerosene serves to foul the activity of the organic carbon component of the feed material, thereby retarding any subsequent gold losses due to preg-borrowing or preg-robbing.
13.5 Life of Mine Recovery Estimates
13.5.1 Esaase
The 2021 testing (ALS report A22281) returned recovery results for the bulk composites that align with those from the 2018/19 testwork programs. As such, no change has been made to the recovery estimates as per the Asanko Gold NI 43-101 Technical Report (2020) for the purpose of constraining the current Mineral Resource estimate. These recoveries, based on material source/type, are calculated according to the equations in Table 13-29.
Although the variability composites testing completed in 2021 (A22281) indicated an upside to these recovery estimates, the results are not applied herein. The rationale behind deferring reliance on the higher recoveries obtained in the testing is twofold:
1. Current plant performance is yielding lower recoveries than previously modelled in equivalent spatial locations within the Esaase deposit. The deviation between actual plant performance and modelled recovery will need to be further examined to determine the cause and the extent to which this may persist within the deposit
2. The variability testing, although indicative of an upside to 90.1% average recovery, may require revised plant operating protocols

NI 43-101 Technical Report for the Asanko Gold Mine, Ashanti Region, Ghana
Effective Date: February 28, 2022
Page 188
Table 13-29 Esaase Head Grade Recovery Model Correlations
Material Source Head Grade Recovery
Correlation M (slope) C (coefficient)
Upper (Fresh/Trans) y = 9.600ln(x) + 82.260 9.60 82.26
Cobra (Fresh/Trans) y = 15.532ln(x) + 56.020 15.5 56.02
Central (Fresh/Trans) y = 6.202ln(x) + 85.792 6.20 85.79
Python (Fresh/Trans) =upper 9.60 82.26
Other (Fresh/Trans) =upper 9.60 82.26
Material Type Residue Value Au (g/t)
Esaase Oxides* 0.10
Recovery Discount Factor (due to Soluble Gold Losses & Carbon Losses) 0.5%
Note: * A fixed residue grade has been applied to the Esaase Oxide material
13.5.2 Nkran and Obotan Satellite Pits
Gold recoveries used for Nkran and the minor satellite pits is 94% based on previous operational performance and recoveries achieved in the mill from 2017 to 2019.
Additional metallurgical testing on Abore and Nkran confirmed the assumed recoveries as valid. Miradani North recovery is also estimated at 94%, as based on the 2021 recovery testwork.
Akwasiso material is currently being fed to the process plant as a minor tonnage contributor along with the predominant Esaase mill feed. Pit depletion is estimated to occur mid-2022.
Dynamite Hill and Adubiaso recoveries are assumed to be aligned with past production recoveries from the prior Resolute Amansie Limited operations.

NI 43-101 Technical Report for the Asanko Gold Mine, Ashanti Region, Ghana
Effective Date: February 28, 2022
Page 189
14 MINERAL RESOURCE ESTIMATES
The effective date of the Mineral Resource is February 28, 2022, and comprises eight deposits, which have been combined into a total Mineral Resource table (Table 14-1).
Table 14-1 Summary of Mineral Resources at a 0.5 g/t Au cut-off and $1,600/oz Au, as of February 28, 2022
Measured Indicated Measured + Indicated Inferred
Tonnes Grade Au
Contained
Tonnes Grade Au
Contained
Tonnes Grade Au
Contained
Tonnes Grade Au
Contained
Deposit (Mt) (g/t) (koz) (Mt) (g/t) (koz) (Mt) (g/t) (koz) (Mt) (g/t) (koz)
Nkran 12.1 2.09 814 12.1 2.09 814 1.3 2.23 96
Esaase 10.9 1.25 437 11.7 1.27 475 22.6 1.26 912 0.6 1.22 25
Akwasiso 1.7 1.31 69 1.7 1.31 69 0.2 1.46 7
Abore 3.2 1.46 150 5.1 1.23 203 8.3 1.32 353 1.1 1.55 55
Adubiaso 1.6 1.80 90 1.6 1.80 90 0.2 1.38 9
Asuadai 1.6 1.29 67 1.6 1.29 67 0.0 1.17 1
Miradani 7.1 1.28 293 7.1 1.28 293 2.6 1.21 102
Dynamite 1.9 1.39 85 1.9 1.39 85 0.3 1.26 14
Stockpiles 9.5 0.72 221 9.5 0.72 221
Total 23.6 1.06 808 42.7 1.53 2,096 66.4 1.36 2,904 6.4 1.49 309
Notes: 1. The Mineral Resource estimates are reported in accordance with the CIM Definition Standards for
Mineral Resources & Mineral Reserves, adopted by CIM Council May 10, 2014. 2. The effective date for the Mineral Resource estimates is February 28, 2022 3. Mineral Resource estimates account for mining depletion up to and including February 28, 2022 4. Reasonable Prospects for eventual economic extraction assume open pit mining with conventional gold
processing and was tested using NPV Scheduler™ pit optimization software at gold price of $1,600/oz. Mining, G&A, processing costs, and process recovery are dependent on deposit and detailed in the respective deposit sections.
5. Applicable rounding has been applied to the stated tonnages, grades, and metal content to reflect the level of accuracy and precision of the estimate
Cautionary Note about Mineral Resources
Mineral Resources are not Mineral Reserves and do not have demonstrated economic viability. Mineral Resources do not account for mining loss and dilution. It is reasonably expected that the majority of Inferred Mineral Resources could be upgraded to the Indicated category through further exploration.
All Mineral Resources reported are constrained by a US$1600/oz gold pit shell and as such, are considered to have a reasonable prospect for eventual economic extraction.

NI 43-101 Technical Report for the Asanko Gold Mine, Ashanti Region, Ghana
Effective Date: February 28, 2022
Page 190
14.1 Esaase Mineral Resource Estimate
All figures and tables prepared by Galliano unless otherwise indicated.
14.1.1 Database
The Esaase exploration database consists of 1,371 inclined surface diamond and reverse circulation drill holes for a total of 261,753.92 metres of drilling. The holes dip between about 90º to 37º orientated mostly towards the southeast, although with a significant number of holes orientated in other directions. Most drill holes are surveyed at 30 metre intervals down-the-hole using a Reflex single shot camera. The sampling interval is mostly 1 metre down the hole, with about 15% at different lengths. There are 250,394 Au values in the current exploration drill hole database. There are also over 24,000 reverse circulation grade control holes. There are 16,687 specific gravity measurements collected using a wax-coat water immersion method.
14.1.1 Geological Models
Wireframe envelopes and surfaces representing topographic surfaces, models for lithology, oxidation state, structures, and mineralization domains were developed using LeapfrogTM modelling software. An original-topography surface is used during grade estimation as an upper domain boundary and an as-mined topographic surface is used to deplete the estimated block grades before reporting resources. A series of 3D wireframes orientated approximately N30°E and steeply dipping represent the Upper sandstone; the Central sandstone; the Cobra unit; the Upper Shales; and the Footwall sandstone. Figure 14-1 shows a cross section through the Main zone looking approximately N30E, highlighting the sequence of these stratigraphic units. These wireframes are used to code lithology into the block model but are not used during grade estimation.
Figure 14-1 Esaase Cross Section Through Main Pit Showing Stratigraphic Units and Drill Hole Databases
Note: Window is ±10 m either side of the section
Three weathering surfaces representing the boundary between Saprolite, Oxides, Transition, and Fresh zones are used to code weathering type into the block model and are used for in situ density estimation and assignment.
Six mineralized envelopes developed for the Esaase resource model update are the most important grade estimation constraints. These mineralized domains were developed by Asanko geologists using a combination of lithology, alteration, structural, and mineralization information. They are not grade shells, rather interpreted section by sections by looking simultaneously at the geologic information described. These wireframes include:
• Domain 1: Main Pit, Hanging wall

NI 43-101 Technical Report for the Asanko Gold Mine, Ashanti Region, Ghana
Effective Date: February 28, 2022
Page 191
• Domain 2: Main Pit, Footwall, southern tail of the Main zone
• Domain 3: Main Pit, Footwall
• Domain 4: North Pit zone
• Domain 5 and 6 (combined): South Pit zone.
While the general thickness of the mineralization varies, Au grades can be traced from section to section (on 40 metre drill hole intersection spacings) with consistency in all three Esaase zones. Mineralization outside the envelopes generally cannot be traced from section to section but there are local small but consistent zones with Au grades of interest.
Figure 14-2 shows a three-dimensional view of the mineralized domains, looking from the Southeast. Drill holes traces and collars are also shown.
Figure 14-2 Esaase Mineralized Domains
Note: Pink: South Pit; Green and Red: Main Pit; Cyan: North Pit. Level 290 m; drill holes traces and collars are also shown. Oblique view from above, looking northwest.
14.1.2 Exploratory Data Analysis
There are 250,394 Au values in the current assay database with a maximum value of 266.84 g/t Au. The gold distribution has a global coefficient of variation of over 7 indicting very high variability as is expected from Birimian-style Au deposits. Figure 14-3 and Figure 14-4 show the raw histogram and basic statistics for Domains 1 and 3, respectively. Domaining reduced the coefficient of variation to approximately 4. The two grade distributions have similar variability and Au grade ranges.

NI 43-101 Technical Report for the Asanko Gold Mine, Ashanti Region, Ghana
Effective Date: February 28, 2022
Page 192
Figure 14-3 Esaase Histogram and Basic Statistics of Gold (g/t) in Samples Within the Domain 1 (Main Pit, Hanging Wall)
Figure 14-4 Esaase Histogram and Basic Statistics of Gold (g/t) in Samples Within the Domain 3 (Main Pit, Footwall)
14.1.2.1 Density Assignment
In situ density is estimated into the block model using the Inverse Distance Squared method. The arithmetic averages of each type of mineralization are used to assign in situ bulk density to un-estimated blocks. Summary statistics of in situ bulk density by oxidation zone are presented in Table 14-2.

NI 43-101 Technical Report for the Asanko Gold Mine, Ashanti Region, Ghana
Effective Date: February 28, 2022
Page 193
Table 14-2 Esaase Statistics of In Situ Bulk Density Values
Unit Mean (t/m3) SD 3*SD Accept. Min Value (t/m3) Accept. Max Value (t/m3)
SAP 2.26 0.22589 0.67767 1.58 2.94
OX 2.32 0.19758 0.59274 1.73 2.91
TR 2.45 0.23973 0.71919 1.73 3.17
FR 2.74 0.16644 0.49932 2.24 3.24
14.1.2.2 Composites
One-metre-long composites were prepared from the original assay data, truncated at the contacts of the mineralized envelopes. No significant correlation between assayed Au grades and assay length is observed so all resulting composites greater or equal to 0.40 metre are used to estimate grades.
Figure 14-5 and Figure 14-6 show the statistics and histogram of all 1 metre composites for Domain 1 and for Domain 3. The coefficients of variation are 4.55 and 4.00, respectively. Figure 14-7 and Figure 14-8 show the corresponding cumulative probability function graphs for the same Domains. These probability graphs are used to understand the behaviour of the high-grade population and the definition of the indicator thresholds, as discussed below.
Figure 14-5 Esaase Histogram and Basic Statistics, Au (g/t), All 1 m Composites within Domain 1 (Main Pit, Hanging Wall)

NI 43-101 Technical Report for the Asanko Gold Mine, Ashanti Region, Ghana
Effective Date: February 28, 2022
Page 194
Figure 14-6 Esaase Histogram and Basic Statistics, Au (g/t), All 1 m Composites within Domain 3 (Main Pit, Footwall)
Figure 14-7 Esaase Probability Plot, Au (g/t), All 1 m Composites Within Domain 1 (Main Pit, Hanging Wall)
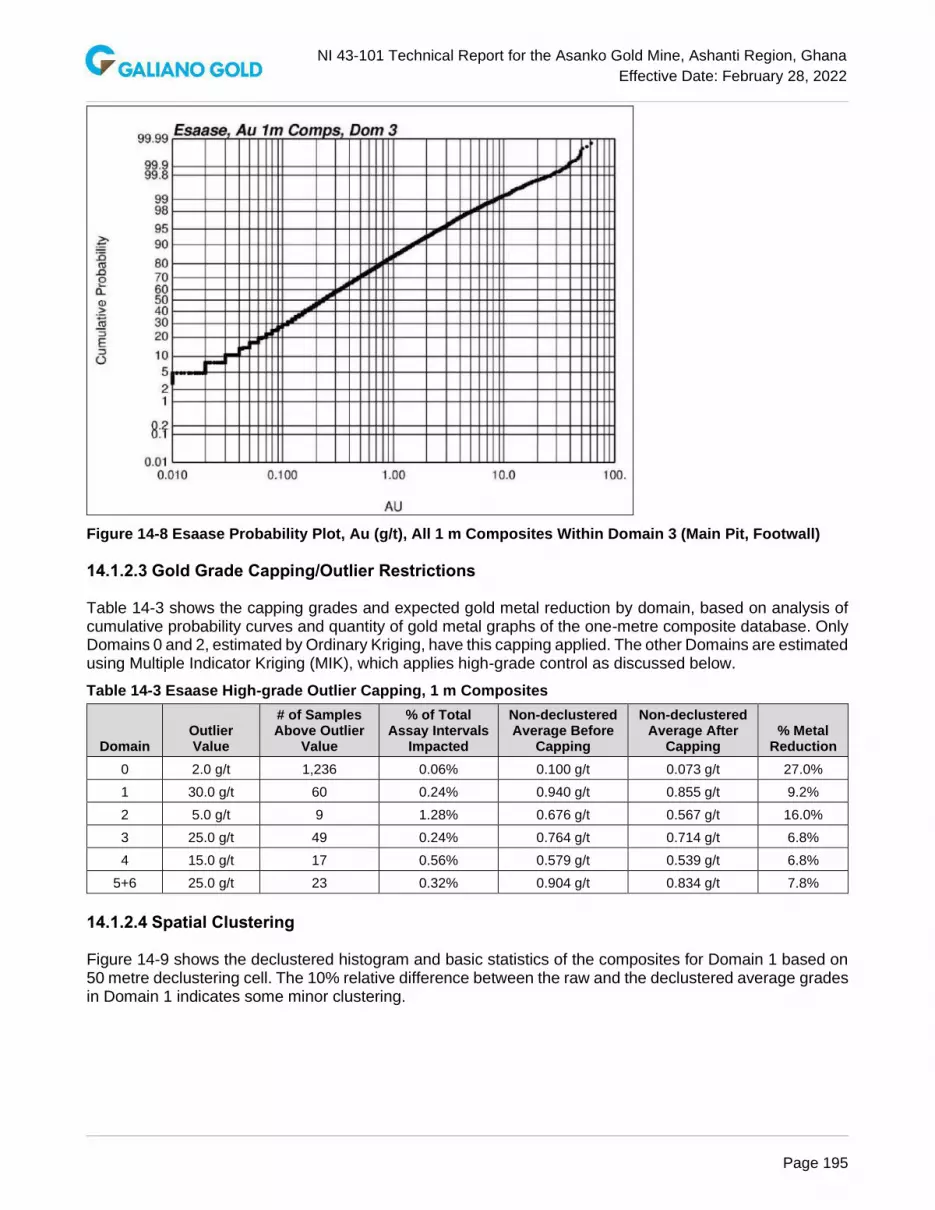
NI 43-101 Technical Report for the Asanko Gold Mine, Ashanti Region, Ghana
Effective Date: February 28, 2022
Page 195
Figure 14-8 Esaase Probability Plot, Au (g/t), All 1 m Composites Within Domain 3 (Main Pit, Footwall)
14.1.2.3 Gold Grade Capping/Outlier Restrictions
Table 14-3 shows the capping grades and expected gold metal reduction by domain, based on analysis of cumulative probability curves and quantity of gold metal graphs of the one-metre composite database. Only Domains 0 and 2, estimated by Ordinary Kriging, have this capping applied. The other Domains are estimated using Multiple Indicator Kriging (MIK), which applies high-grade control as discussed below.
Table 14-3 Esaase High-grade Outlier Capping, 1 m Composites
Domain Outlier Value
# of Samples Above Outlier
Value
% of Total Assay Intervals
Impacted
Non-declustered Average Before
Capping
Non-declustered Average After
Capping % Metal
Reduction
0 2.0 g/t 1,236 0.06% 0.100 g/t 0.073 g/t 27.0%
1 30.0 g/t 60 0.24% 0.940 g/t 0.855 g/t 9.2%
2 5.0 g/t 9 1.28% 0.676 g/t 0.567 g/t 16.0%
3 25.0 g/t 49 0.24% 0.764 g/t 0.714 g/t 6.8%
4 15.0 g/t 17 0.56% 0.579 g/t 0.539 g/t 6.8%
5+6 25.0 g/t 23 0.32% 0.904 g/t 0.834 g/t 7.8%
14.1.2.4 Spatial Clustering
Figure 14-9 shows the declustered histogram and basic statistics of the composites for Domain 1 based on 50 metre declustering cell. The 10% relative difference between the raw and the declustered average grades in Domain 1 indicates some minor clustering.

NI 43-101 Technical Report for the Asanko Gold Mine, Ashanti Region, Ghana
Effective Date: February 28, 2022
Page 196
Figure 14-9 Esaase De-clustered Histogram and Basic Statistics, 50 m x 50 m x 10 m cell size, Au (g/t), Domain 1
14.1.2.5 Contact Analysis
Quantile-Quantile plots used to compare Saprolite, Oxide, Transition and Fresh composite grades show reasonably similar distributions in all domains except locally at higher grades, supporting a decision to ignore these domain boundaries during grade estimation. Figure 14-10 shows the Quantile-Quantile plots for Oxide versus Transition.
Figure 14-10 Esaase Quantile-Quantile Plot, Au (g/t), Oxide vs Transition Zones, Composites Inside the Mineralized Envelopes

NI 43-101 Technical Report for the Asanko Gold Mine, Ashanti Region, Ghana
Effective Date: February 28, 2022
Page 197
Figure 14-11 shows the Au grade profile inside and outside the Domain 1 envelope. As expected, there is a sharp transition in average grades comparing those composites outside with those inside the envelope. Similar sharp transitions are present inside and outside of all other domains, supporting the decision to use only composites within a domain during grade estimation.
Figure 14-11 Esaase Au Grade Profile, Domain 1 Contact with Outside Composites
14.1.2.6 Grade Control Database
The grade control database has 383,584 samples from over 24,000 reverse circulation drill holes. Figure 14-12 and Figure 14-13 show the histogram and basic statistics for all grade control data and the probability plot for Domain 1, respectively. Both reveal a tail in the distribution different from than that observed in the exploration data possibility due to a sampling or downhole contamination issue that is still under investigation. This is not considered to represent a risk to the resource model.
Figure 14-12 Esaase Histogram and Basic Statistics, RC Grade Control Data, All Domains
0.00
0.20
0.40
0.60
0.80
1.00
1.20
-100 -80 -60 -40 -20 0 20 40 60 80 100
Au
gra
des
(g
/t)
Distance from contact (m)
Contact Analysis, Au grades, Esaase
Au mean outside Domain 1: 0.110 g/t
Au mean inside Domain 1: 0.652 g/t

NI 43-101 Technical Report for the Asanko Gold Mine, Ashanti Region, Ghana
Effective Date: February 28, 2022
Page 198
Figure 14-13 Esaase Probability Plot, RC Grade Control Data, Domain 1
This grade control database was compared with the exploration database by homogenizing both to sample lengths of 3 metre and then pairing individual grade control Au samples with Au grades from exploration reverse circulation holes with a 3-metre maximum separation distance. The Quantile-Quantile plot in Figure 14-14 show these two databases have similar Au grade distributions, supporting the decision to use the grade control model to calibrate and adjust estimation parameters during grade estimation.
Figure 14-14 Esaase Quantile-Quantile Plot, Exploration vs Grade Control Au 3 m Composites, No More Than 3 m Apart

NI 43-101 Technical Report for the Asanko Gold Mine, Ashanti Region, Ghana
Effective Date: February 28, 2022
Page 199
14.1.2.7 Variography
Indicator variogram models were prepared for each indicator, for each Domain estimated using MIK. In all cases, 37 directions were run, using a basic lag of 20 metre and directions every 30° in the horizontal, -30°, and -60° planes, for a total of 36 directions. In addition, a vertical variogram (-90°) was also run. SAGE2001© was used to obtain the experimental indicator variograms and resulting model.
The indicator variograms were run using 1 metre composites from the exploration database. The anisotropies and ellipses of continuity for each variogram were checked against known geology and its expected behavior. As expected, along-strike (approximately N30º E) and down dip continuities are the most significant within Esaase. Figure 14-15 shows the summary variogram model of the 0.80 g/t indicator variogram for Domain 3.
Domains 2 and 0 were modeled using Ordinary Kriging. For these domains experimental Au grade pairwise variograms and correlograms, as well as their respective models, were prepared. The pairwise models were chosen as the option providing the more robust models.
Figure 14-15 Esaase Summary Variogram Model, 0.80 g/t Indicator, 1 m Composites, Domain 3

NI 43-101 Technical Report for the Asanko Gold Mine, Ashanti Region, Ghana
Effective Date: February 28, 2022
Page 200
14.1.3 Estimation/Interpolation Methods
The block model is defined in DatamineTM using a 5 x 5 x 3 metre parent block size with a minimum 1 metre sub-cell size and with the following limits which refer to the southwest, lower corner of the block:
• Minimum Easting: 619,200E
• Maximum Easting: 623,000E
• Minimum Northing: 723,000N
• Maximum Northing: 728,000N
• Minimum Elevation: -200 metres
• Maximum Elevation: 553 metres
Blocks are flagged with a code describing whether they are inside or outside each mineralization, and topographic and oxidation domain.
Multiple Indicator Kriging (MIK) E-type estimation and Ordinary Kriging (OK) is used to estimate Au grades and includes edge dilution at contacts assuming a 0.0 g/t Au grade when no estimates are available on the unmineralized side of the wireframe.
MIK was used for Domains 1 and 3 in the Main Pit; North Pit; and South Pit mineralized envelopes. A very restrictive OK was used outside all mineralized zones and for a small volume to the South of the Main Pit, adjacent to the Footwall mineralized Domain.
Gold grades were estimated into blocks using mostly 1 metre composites within the corresponding Domain, although for the first and final estimation pass grade control data was added. Domain 4 does not have grade control data, so the indicator class means were derived from the declustered composite data.
Search orientations were guided by the variogram models, and the search distances in every case were guided by variography but optimized to reflect a correct balance of estimated blocks in each estimation pass.
Not all blocks are estimated due to the limitation imposed by the search ellipsoids. All non-estimated blocks are assigned a 0.0 g/t Au grade, although the total proportion of non-estimated blocks is very small in mineralized domains.
The indicator variable last class mean is used to control the impact of high-grade outliers. The last class means are presented in Table 14-4. The corresponding capping grades for Domain 0 and Domain 2, estimated with Ordinary Kriging, are as shown previously in Table 14-3.
Table 14-4 Esaase High-grade Au Outlier Control for MIK Domains
Domain Last Class Mean Used Metal Removed
1 (Last Indicator 40 g/t) 42 g/t 2.0%
3 (Last Indicator 40 g/t) 42 g/t 1.0%
4 (Last Indicator 24 g/t) 28 g/t 3.2%
5+6 (Last Indicator 40 g/t) 53.63 g/t 0%
Three estimation passes were used to estimate grades based on geologic and geostatistical considerations, including grade continuity from section to section and variogram models. Knowing which block was estimated with what level of information (on which pass) provides the information used for resource classification. Data selection uses anisotropic octant searches. The main parameters used to estimate the Domains with MIK are shown in Table 14-5. The corresponding main parameters of the OK kriging plans used for Domain 0 and Domain 2 are presented in Table 14-6.
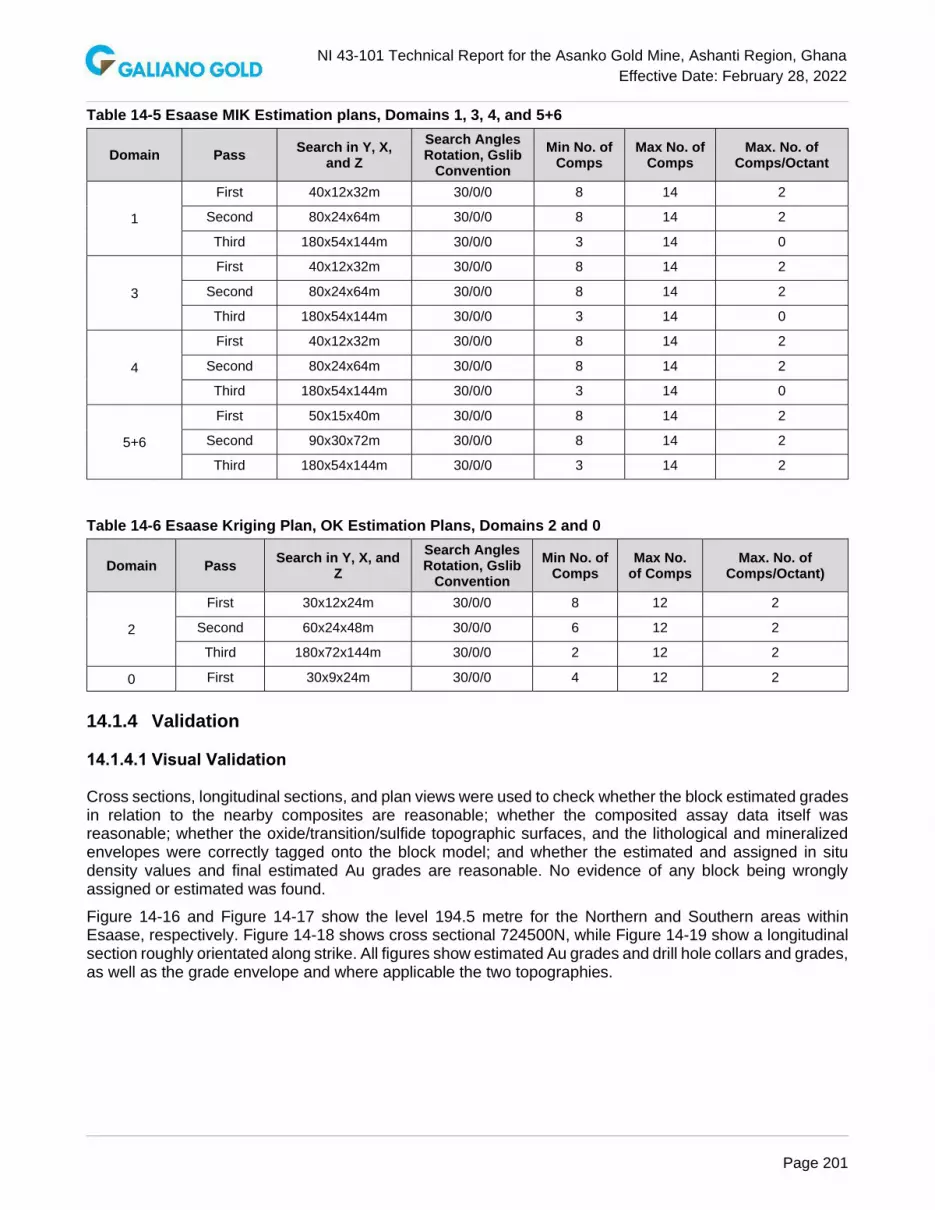
NI 43-101 Technical Report for the Asanko Gold Mine, Ashanti Region, Ghana
Effective Date: February 28, 2022
Page 201
Table 14-5 Esaase MIK Estimation plans, Domains 1, 3, 4, and 5+6
Domain Pass Search in Y, X,
and Z
Search Angles Rotation, Gslib
Convention
Min No. of Comps
Max No. of Comps
Max. No. of Comps/Octant
1
First 40x12x32m 30/0/0 8 14 2
Second 80x24x64m 30/0/0 8 14 2
Third 180x54x144m 30/0/0 3 14 0
3
First 40x12x32m 30/0/0 8 14 2
Second 80x24x64m 30/0/0 8 14 2
Third 180x54x144m 30/0/0 3 14 0
4
First 40x12x32m 30/0/0 8 14 2
Second 80x24x64m 30/0/0 8 14 2
Third 180x54x144m 30/0/0 3 14 0
5+6
First 50x15x40m 30/0/0 8 14 2
Second 90x30x72m 30/0/0 8 14 2
Third 180x54x144m 30/0/0 3 14 2
Table 14-6 Esaase Kriging Plan, OK Estimation Plans, Domains 2 and 0
Domain Pass Search in Y, X, and
Z
Search Angles Rotation, Gslib
Convention
Min No. of Comps
Max No. of Comps
Max. No. of Comps/Octant)
2
First 30x12x24m 30/0/0 8 12 2
Second 60x24x48m 30/0/0 6 12 2
Third 180x72x144m 30/0/0 2 12 2
0 First 30x9x24m 30/0/0 4 12 2
14.1.4 Validation
14.1.4.1 Visual Validation
Cross sections, longitudinal sections, and plan views were used to check whether the block estimated grades in relation to the nearby composites are reasonable; whether the composited assay data itself was reasonable; whether the oxide/transition/sulfide topographic surfaces, and the lithological and mineralized envelopes were correctly tagged onto the block model; and whether the estimated and assigned in situ density values and final estimated Au grades are reasonable. No evidence of any block being wrongly assigned or estimated was found.
Figure 14-16 and Figure 14-17 show the level 194.5 metre for the Northern and Southern areas within Esaase, respectively. Figure 14-18 shows cross sectional 724500N, while Figure 14-19 show a longitudinal section roughly orientated along strike. All figures show estimated Au grades and drill hole collars and grades, as well as the grade envelope and where applicable the two topographies.

NI 43-101 Technical Report for the Asanko Gold Mine, Ashanti Region, Ghana
Effective Date: February 28, 2022
Page 202
Figure 14-16 Esaase Main Pit Au Grade Estimates Within Resource Pit, Level 194.5
Note: Colour-coded according to legend shown. Grade envelope outline shown in red. Resource Pit in green.
Figure 14-17 Esaase South Pit Au Grade Estimates Within Resource Pit, Level 194.5
Note: Colour-coded according to legend shown. Grade envelope outline shown in red. Resource Pit in green.

NI 43-101 Technical Report for the Asanko Gold Mine, Ashanti Region, Ghana
Effective Date: February 28, 2022
Page 203
Figure 14-18 Esaase Main Pit Au Grade Estimates Within Resource Pit, Cross Section 724500N (Approx.), Looking NE
Note: Colour-coded according to legend shown. Grade envelope outline shown in red. Resource Pit in green.
Figure 14-19 Esaase South Pit Au Grade Estimates Within Resource Pit, Longitudinal Section, Looking NE to the Right of Image
Note: Colour-coded according to legend shown. Grade envelope outline shown in red. Resource Pit in green.
14.1.4.2 Statistical Validation
The comparison of the global averages and basic statistics between the block model at cut-off 0 g/t Au and the declustered composites are shown in Table 14-7 for each Domain. The relative differences between the average estimated grades and the NN-declustered composites are acceptable for all Domains.
Table 14-7 Esaase Global Au Means by Domain
Domain Avg. Declustered
Composite (NN Model), g/t Avg Estimated Grades, g/t Relative Difference
1 0.84 0.80 -4.8%
2 0.53 0.53 0.0%
3 0.69 0.72 -4.2%
4 0.66 0.67 1.5%
5+6 0.88 0.88 0.0%
Figure 14-20 shows drift plots with Au estimated block grades and Nearest Neighbour declustered composites in the Easting, Northing, and Vertical directions. These plots show the estimated block grades closely reproduce the grade trends observed in the original composites.

NI 43-101 Technical Report for the Asanko Gold Mine, Ashanti Region, Ghana
Effective Date: February 28, 2022
Page 204
Figure 14-20 Esaase Drift Plot, Domain 3 Au Grade Estimates (in Blue) vs Declustered Composites (Nearest Neighbor Model, in Orange)
Note: Histograms are number of data (second Y-axis); Easting, Northing, and Elevations, swaths every 12 m, all kriging passes
14.1.5 Classification of Mineral Resources
The Mineral Resource estimate is classified into Measured, Indicated, or Inferred categories after considering past production reconciliation, observed continuity of mineralization, knowledge of lithological and structural controls on mineralization, and reliability of sampled data and were classified using a multi-stage approach.
The criteria used in the first stage of the resource classification are:
1. Measured blocks – estimated within an ellipsoid that is 40 x 12 x 32 metre (along-strike, across-strike, and sub-vertical respectively), with a minimum of 8 composites from at least 2 drill holes, and 2 composites maximum per octant defined.
2. Indicated blocks – estimated within an ellipsoid that is 80 x 24 x 64 metre (along-strike, across-strike, and sub-vertical respectively), with a minimum of 8 composites from at least 2 drill holes, and 2 composites maximum per octant defined.
3. Inferred blocks – estimated within an ellipsoid that is 180 x 54 x 144 metre (along-strike, across-strike, and sub-vertical respectively), with a minimum of 3 composites from at least 2 drill holes, and 2 composites maximum per octant defined.
0
0.5
1
1.5
2
2.5
3
0
0.5
1
1.5
2
2.5
3
Nu
mb
er
of
Sam
ple
s
Gra
de
s
Slice
Swath Plot:xesa16csv.csvZone: 3
M_TONNES
M_AU
M_AUNN
0
0.5
1
1.5
2
2.5
3
3.5
4
0
0.5
1
1.5
2
2.5
3
Nu
mb
er
of
Sam
ple
s
Gra
de
s
Slice
Swath Plot:yesa16csv.csvZone: 3
M_TONNES
M_AU
M_AUNN
0
0.2
0.4
0.6
0.8
1
1.2
1.4
1.6
1.8
2
0
0.2
0.4
0.6
0.8
1
1.2
1.4
1.6
1.8
Nu
mb
er
of
Sam
ple
s
Gra
de
s
Slice
Swath Plot:Zesa16csv.csvZone: 3
M_TONNES
M_AU
M_AUNN
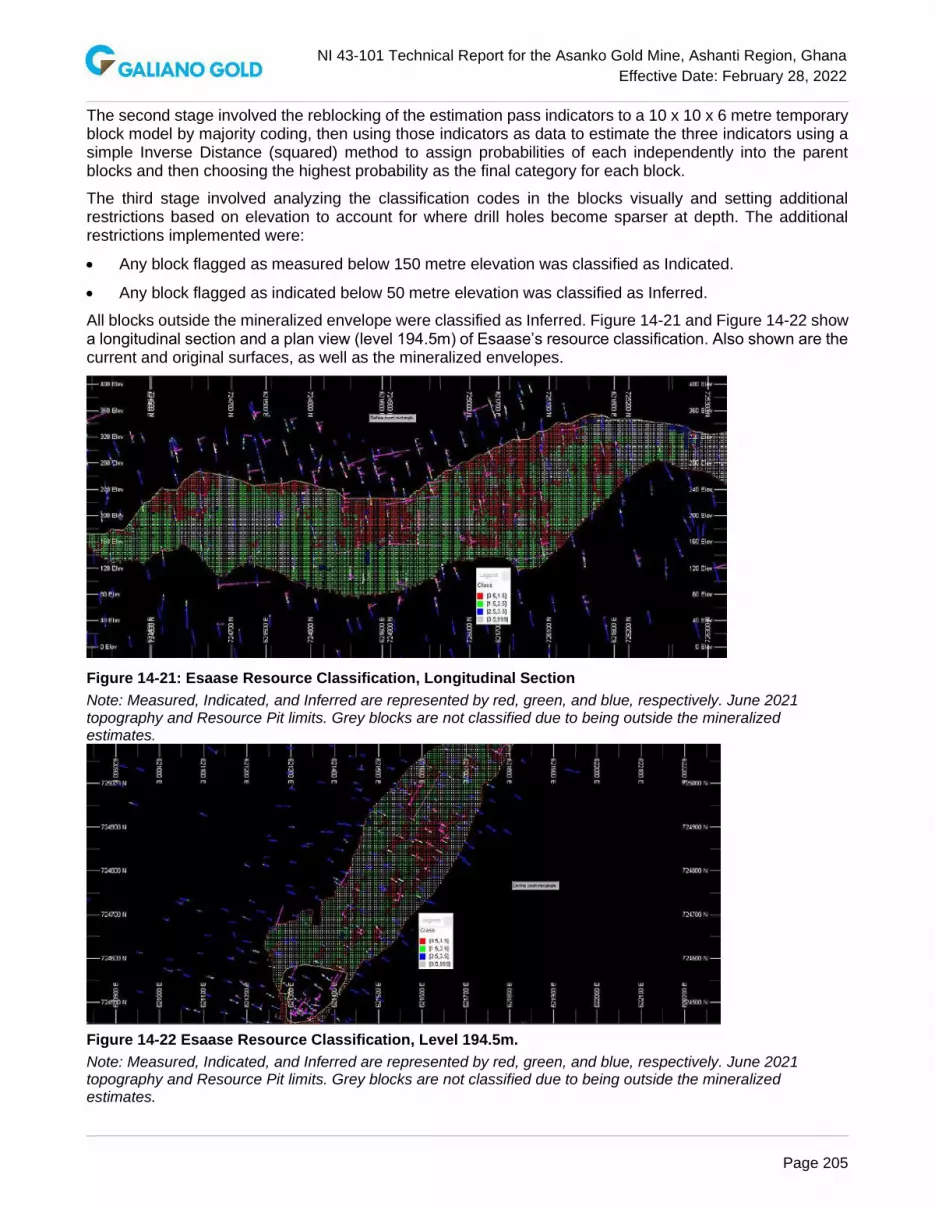
NI 43-101 Technical Report for the Asanko Gold Mine, Ashanti Region, Ghana
Effective Date: February 28, 2022
Page 205
The second stage involved the reblocking of the estimation pass indicators to a 10 x 10 x 6 metre temporary block model by majority coding, then using those indicators as data to estimate the three indicators using a simple Inverse Distance (squared) method to assign probabilities of each independently into the parent blocks and then choosing the highest probability as the final category for each block.
The third stage involved analyzing the classification codes in the blocks visually and setting additional restrictions based on elevation to account for where drill holes become sparser at depth. The additional restrictions implemented were:
• Any block flagged as measured below 150 metre elevation was classified as Indicated.
• Any block flagged as indicated below 50 metre elevation was classified as Inferred.
All blocks outside the mineralized envelope were classified as Inferred. Figure 14-21 and Figure 14-22 show a longitudinal section and a plan view (level 194.5m) of Esaase’s resource classification. Also shown are the current and original surfaces, as well as the mineralized envelopes.
Figure 14-21: Esaase Resource Classification, Longitudinal Section
Note: Measured, Indicated, and Inferred are represented by red, green, and blue, respectively. June 2021 topography and Resource Pit limits. Grey blocks are not classified due to being outside the mineralized estimates.
Figure 14-22 Esaase Resource Classification, Level 194.5m.
Note: Measured, Indicated, and Inferred are represented by red, green, and blue, respectively. June 2021 topography and Resource Pit limits. Grey blocks are not classified due to being outside the mineralized estimates.

NI 43-101 Technical Report for the Asanko Gold Mine, Ashanti Region, Ghana
Effective Date: February 28, 2022
Page 206
14.1.6 Comparison with Production Results
The 2021 Measured and Indicated Resource Model was compared with the in situ the grade control model (Asanko_CG), with the undiluted mine plan model (Asanko_MP), and with the “Final Mined out” reconciled Mill production tonnages and grades. The comparison is limited to Main and South pit production results from January 1, 2020, through June 30, 2021, at a gold cut-off grade of 0.5 g/t, 0.8 g/t, and 1.3 g/t.
The 2021 Resource Model predicts tonnes, grade and contained metal in the Main pit within 10% relative to the grade control, mine plan, and reconciled mill production at 0.5 g/t Au and 0.8 g/t Au cut-offs, and within 17% at a 1.3 g/t cut off (Table 14-8). These comparisons should not be construed as resources, they are only validation tools.
Table 14-8 Esaase Main Pit Mined-out Volume Comparisons, Resource and Grade Control Models
Esaase Main Mined-out Volume: December 31, 2019 to June 30, 2021 (All Domains)
COG = 0.5 Measured + Indicated
Tonnes Au (g/t) Gold (Oz)
2021_RES_MODEL 6,183,071 1.14 226,510
ASANKO_GC 6,104,586 1.19 232,815
ASANKO_MP (UNDIL) 5,815,394 1.16 216,630
2021_RES_MODEL/ASANKO_GC 101.29% 96.06% 97.23%
2021_RES_MODEL/ASANKO_MP (UNDIL) 106.32% 98.34% 104.56%
COG = 0.8 Measured + Indicated
Tonnes Au (g/t) Gold (Oz)
2021_RES_MODEL 3,666,313 1.49 175,157
ASANKO_GC 3,793,708 1.52 185,566
ASANKO_MP (UNDIL) 3,890,920 1.38 173,063
FINAL MINED (OFFICIAL) 4,018,357 1.34 173,507
2021_RES_MODEL/ASANKO_GC 96.64% 97.67% 94.39%
2021_RES_MODEL/ASANKO_MP (UNDIL) 94.23% 107.41% 101.21%
2021_RES_MODEL/FINAL MINED (OFFICIAL) 91.24% 110.64% 100.95%
COG = 1.3 Measured + Indicated
Tonnes Au (g/t) Gold (Oz)
2021_RES_MODEL 1,679,401 2.05 110,509
ASANKO_GC 1,798,699 2.08 120,480
ASANKO_MP (UNDIL) 1,613,656 1.81 93,827
2021_RES_MODEL/ASANKO_GC 93.37% 98.24% 91.72%
2021_RES_MODEL/ASANKO_MP (UNDIL) 104.07% 113.17% 117.78%
14.1.7 Reasonable Prospects of Eventual Economic Extraction
The Esaase mineralization is assumed amenable to open pit mining, and milling and recovery through CIL gold processing, and was evaluated for reasonable prospects for eventual economic extraction by constraining the Mineral Resources within a conceptual pit shell optimized in NPV Scheduler™. The assumptions used in preparing the conceptual pit, include mining and processing costs, metallurgical recovery, metal price and general and administrative costs and other technical parameters. The primary assumptions are shown in Table 14-9 and approximately correspond to the 0.50 g/t Au resource cut-off. A significant additional cost in the case of Esaase is the ore transport overland from the pit to the plant for a total of 30 km approximately. See “Cautionary Note about Mineral Resources”.

NI 43-101 Technical Report for the Asanko Gold Mine, Ashanti Region, Ghana
Effective Date: February 28, 2022
Page 207
Table 14-9 Esaase Conceptual Constraining Pit Parameters
Parameter Value
Gold Price (US$/ounce) 1,600
Mining Cost (US$/tonne) 1.03 – 2.24
Mining Cost Incremental (US$/Vertical 6m) 0.0059 – 0.0193
Mill Feed Transport (US$/tonne) 6.89
Process Cost (US$/tonne) 8.79 – 11.32
Gold Recovery (%) Refer to Table 13-29
General and Administration (US$/tonne) 6.55
14.1.8 Mineral Resource Estimate
The Esaase Mineral Resource estimate is reported in accordance with the CIM Definition Standards for Mineral Resources & Mineral Reserves, adopted by CIM Council May 10, 2014. The Qualified Person is Mr. Mario E. Rossi, FAusIMM, SME, IAMG, and Principal Geostatistician of Geosystems International Inc. The effective date of the Mineral Resource estimate is February 28, 2022. The Mineral Resource estimate is reported assuming open pit mining and milling and CIL gold processing methods using a cut-off grade of 0.5 g/t Au, is constrained within a conceptual open pit prepared using NPV Scheduler™ software. The Esaase Mineral Resource estimates are summarized in Table 14-10.
Table 14-10 Esaase Mineral Resource Estimate at a 0.5 g/t Au cut-off and $1,600/oz Au, as of February 28, 2022
Category
Cutoff Grade
(g/t Au) Tonnes (kt) Au (g/t)
Au Metal Contained
(koz)
Measured 0.5 10,915 1.25 437
Indicated 0.5 11,655 1.27 475
Measured & Indicated 0.5 22,569 1.26 912
Inferred 0.5 647 1.22 25
Notes: 1. The Mineral Resource estimates are reported in accordance with the CIM Definition Standards for
Mineral Resources & Mineral Reserves, adopted by CIM Council May 10, 2014. 2. The effective date for the Mineral Resource estimates is February 28, 2022 3. Mineral Resource estimates account for mining depletion as of February 28, 2022 4. Reasonable Prospects for eventual economic extraction assume open pit mining with conventional gold
processing and was tested using NPV Scheduler™ pit optimization software using several technical parameters including:
a. $1,600/oz Au price b. $1.03/t to $2.24/t mining costs c. $6.89/t mill feed transport costs d. $8.79/t, to $11.32/t processing costs e. Au recoveries per Table 13-29 f. $6.55/t G&A
5. Applicable rounding has been applied to the stated tonnages, grades, and metal content to reflect the level of accuracy and precision of the estimate
The estimated grades and tonnages of the remaining Measured and Indicated Au mineralization for Esaase and for multiple cut-offs are shown in Figure 14-23.

NI 43-101 Technical Report for the Asanko Gold Mine, Ashanti Region, Ghana
Effective Date: February 28, 2022
Page 208
Figure 14-23 Esaase Measured and indicated Grade-Tonnage Curves
14.1.9 Factors That May Affect the Mineral Resource Estimate
Other than as discussed in other sections of this report there are no known environmental, permitting, legal, title, taxation, socio-economic, marketing, and political or other relevant issues that may materially affect the Mineral Resource estimates. Other relevant factors that may materially affect the Mineral Resources, including mining, metallurgical recovery, and infrastructure are reasonably well understood according to the assumptions presented in this Report.
There is some risk associated to the Mineral Resource estimate presented in this Report stemming from two different sources. Firstly, the mineralized envelopes are interpretations based on exploration drilling, short-scale production data and pit mapping. The interpretations carry what is considered a moderate level of risk, which affects mostly the predicted mineralized tonnages.
Secondly, the grade estimates are calibrated to grade control model that carries its own level of uncertainty, in addition to the implicit assumption that the calibration holds at depth. While this is a reasonable assumption in the opinion of the QP, it does also imply a moderate level of risk.
0.00
0.50
1.00
1.50
2.00
2.50
3.00
3.50
0
5,000
10,000
15,000
20,000
25,000
30,000
35,000
40,000
45,000
50,000
0.00 0.10 0.20 0.30 0.40 0.50 0.60 0.70 0.80 0.90 1.00 1.10 1.20 1.30 1.40 1.50
Au
Gra
de
ab
ove
Cu
toff
(g/t
)
To
ns
ab
ove
Cu
toff
(x1
00
0)
Au Cutoff Grade (g/t)
Grade-Tonnage Curve2021 Esaase Measured and Indicated Mineralization
Tonnes (m)*1000 Au (g/t)
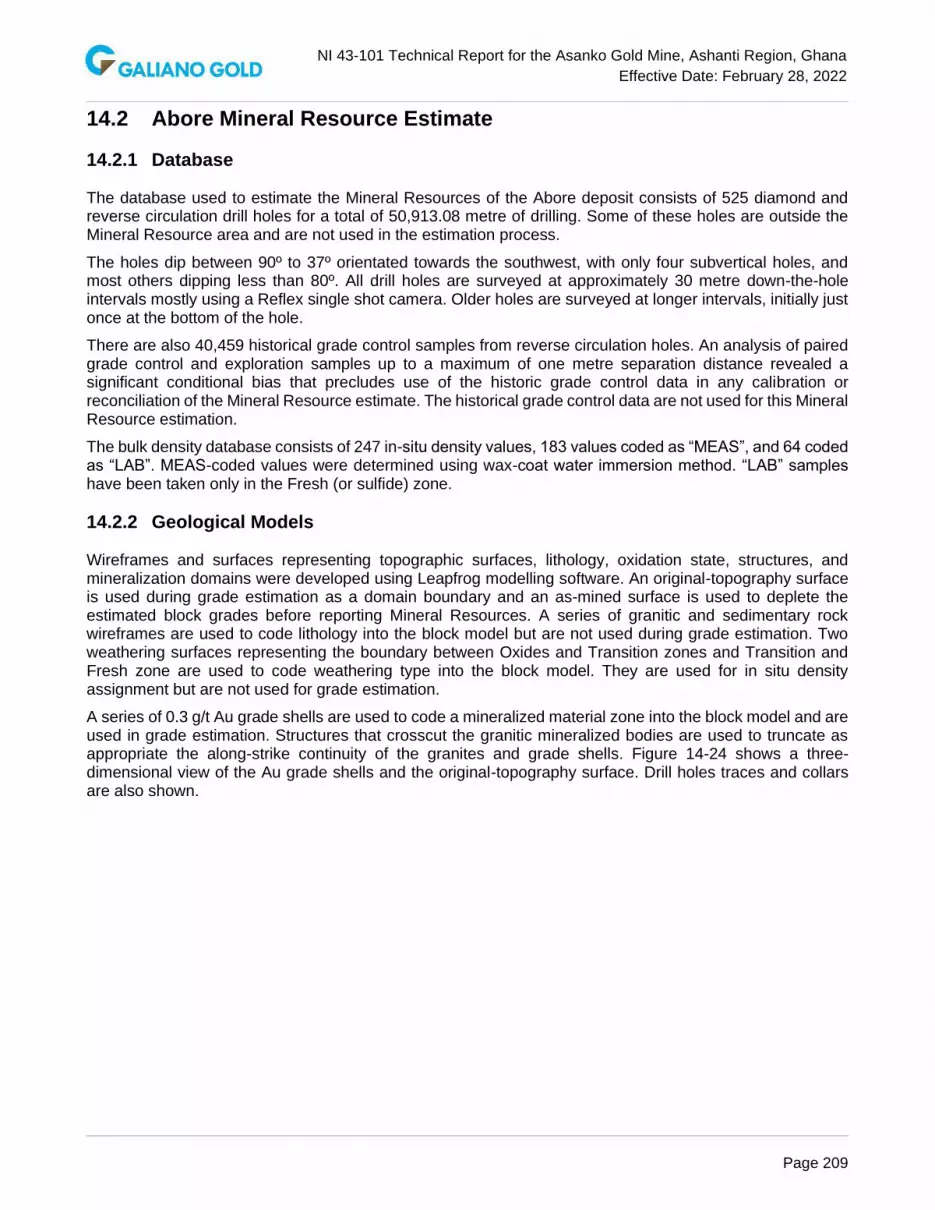
NI 43-101 Technical Report for the Asanko Gold Mine, Ashanti Region, Ghana
Effective Date: February 28, 2022
Page 209
14.2 Abore Mineral Resource Estimate
14.2.1 Database
The database used to estimate the Mineral Resources of the Abore deposit consists of 525 diamond and reverse circulation drill holes for a total of 50,913.08 metre of drilling. Some of these holes are outside the Mineral Resource area and are not used in the estimation process.
The holes dip between 90º to 37º orientated towards the southwest, with only four subvertical holes, and most others dipping less than 80º. All drill holes are surveyed at approximately 30 metre down-the-hole intervals mostly using a Reflex single shot camera. Older holes are surveyed at longer intervals, initially just once at the bottom of the hole.
There are also 40,459 historical grade control samples from reverse circulation holes. An analysis of paired grade control and exploration samples up to a maximum of one metre separation distance revealed a significant conditional bias that precludes use of the historic grade control data in any calibration or reconciliation of the Mineral Resource estimate. The historical grade control data are not used for this Mineral Resource estimation.
The bulk density database consists of 247 in-situ density values, 183 values coded as “MEAS”, and 64 coded as “LAB”. MEAS-coded values were determined using wax-coat water immersion method. “LAB” samples have been taken only in the Fresh (or sulfide) zone.
14.2.2 Geological Models
Wireframes and surfaces representing topographic surfaces, lithology, oxidation state, structures, and mineralization domains were developed using Leapfrog modelling software. An original-topography surface is used during grade estimation as a domain boundary and an as-mined surface is used to deplete the estimated block grades before reporting Mineral Resources. A series of granitic and sedimentary rock wireframes are used to code lithology into the block model but are not used during grade estimation. Two weathering surfaces representing the boundary between Oxides and Transition zones and Transition and Fresh zone are used to code weathering type into the block model. They are used for in situ density assignment but are not used for grade estimation.
A series of 0.3 g/t Au grade shells are used to code a mineralized material zone into the block model and are used in grade estimation. Structures that crosscut the granitic mineralized bodies are used to truncate as appropriate the along-strike continuity of the granites and grade shells. Figure 14-24 shows a three-dimensional view of the Au grade shells and the original-topography surface. Drill holes traces and collars are also shown.

NI 43-101 Technical Report for the Asanko Gold Mine, Ashanti Region, Ghana
Effective Date: February 28, 2022
Page 210
Figure 14-24 Abore Three-dimensional View of the 0.3 g/t Au Grade Envelope in Red and Topography in Brown
Note: Looking from underneath to the northwest; drill holes traces and collars are also shown.
14.2.3 Exploration Data Analysis
The drill hole sampling is mostly at one-metre intervals, although approximately 30% are at two-metre intervals. There are 33,342 assays in the overall database with a maximum value of 140 g/t Au. The gold distribution has a global coefficient of variation of almost five, indicating high variability, as would be expected in Birimian-style Au deposits
Figure 14-25 and Figure 14-26, show about 26% of the total assay intervals captured by the grade envelope are below 0.3 g/t Au, which is an adequate amount of dilution to limit occurrence of some of the artifacts that the use of grade envelopes can cause during grade estimation.
Figure 14-25 Abore Histogram and Basic Statistics of Samples Within the Grade Envelope, Au ≥ 0.3 g/t

NI 43-101 Technical Report for the Asanko Gold Mine, Ashanti Region, Ghana
Effective Date: February 28, 2022
Page 211
Figure 14-26 Abore Histogram and Basic Statistics of Samples Within the Grade Envelope, Au < 0.3 g/t
14.2.3.1 Density Assignment
The average measured density of “LAB”-coded samples combined, or by separate oxidation domain is 3% to 10% greater than comparable “MEAS”-coded samples. Only the arithmetic averages “MEAS”-coded samples by oxidation domain are used to assign densities to the block model because the waxed coat method used to determine the “MEAS”-coded sample densities is generally a reliable procedure and because and the use of the apparent high-bias “Lab” coded samples might result in an over estimation of tonnage. The summary statistics of the in-situ density used in the Mineral Resource estimate are presented in Table 14-11.
Table 14-11 Abore Statistics of Density Values, “MEAS”, Abore
Mineralization Type Number of Samples Mean Standard Deviation Interval [Mean±3*σ]
Oxide 29 1.67 0.0399 {1.55 ≤ 1.67 ≤ 1.79}
Transition 8 2.04 0.0629 {1.85 ≤ 2.04 ≤ 2.23}
Fresh/Sulphide 146 2.62 0.0093 {2.59 ≤ 2.62 ≤ 2.65}
14.2.3.2 Composites
One-metre-long composites were prepared from the original assay data, truncated at the contact of the 0.30 g/t Au envelope. No significant correlation between assayed Au grades and assay length is evident so all resulting composites greater or equal to 0.40 metre were used to estimate grades. Figure 14-27 shows the basic statistics of all composites inside the 0.3 g/t Au envelope. The coefficient of variation is 3.279. Figure 14-28 shows the cumulative probability function for the composites inside the 0.3 g/t Au grade envelope. This probability graph was used as a guide to define the capping thresholds as discussed below.
Quantile-Quantile plots of Au grade distributions of weathered and non-weathered domain one-metre composites within the 0.3 g/t Au envelope are virtually identical up to the 1.50 g/t Au and very similar up to the 3.0 g/t Au thresholds supporting the decision to ignore the oxidation boundaries when estimating grade.

NI 43-101 Technical Report for the Asanko Gold Mine, Ashanti Region, Ghana
Effective Date: February 28, 2022
Page 212
Figure 14-27 Abore Histogram and Basic Statistics, Au grades, All 1 m Composites Inside the 0.3 g/t Au Envelope
Figure 14-28 Abore Probability Plot, Au, Inside the 0.3 g/t Au Mineralization Envelope

NI 43-101 Technical Report for the Asanko Gold Mine, Ashanti Region, Ghana
Effective Date: February 28, 2022
Page 213
14.2.3.3 Gold Grade Capping/Outlier Restrictions
A 30.0 g/t Au grade capping value was applied to the one-metre composite database based on a review of a cumulative probability plot and a quantity-of-metal graph for the composite data inside the 0.30 g/t Au grade envelope. The probability plot in Figure 14-28 shows the Au grade inside the 0.30 g/t Au envelope plots as a homogeneous distribution. Table 14-12 shows 0.36% of the composites were capped at 30.0 g/t Au resulting in an 8.25% metal reduction.
Table 14-12 Abore Definition of High-Grade Au Capping, 1 m Composites
Zone Outlier Value
Number of Samples Above
Outlier Value
% of Total Assay Intervals
Impacted
Non-declustered Average Before
Capping
Non-declustered Average After
Capping % Metal
Reduction
Inside 0.3 g/t Envelope 30.0 g/t 55 0.36% 1.381 g/t 1.267 g/t 8.25%
14.2.3.4 Spatial Clustering
Figure 14-29 shows a histogram and basic statistics of the declustered composites inside the 0.30 g/t Au envelope based on a 50-metre declustering cell size. The 20% relative difference between the raw and the declustered average grades inside the 0.30 g/t Au mineralized envelope indicate significant clustering inside the grade shell.
Figure 14-29 Abore Declustered Histogram and Basic Statistics, 50 m Cell Size, Au Grades, Inside the 0.30 g/t Au Envelope
14.2.3.5 Contact Analysis
The only relevant contact is the 0.30 g/t Au envelope since the oxide/transition/sulfide surfaces will be ignored at the time of estimation. Figure 14-30 shows the Au grade profiles near the 0.30 g/t Au envelope contact. As expected, there is a sharp transition in average grades comparing those composites outside with those inside the envelope supporting the decision to use only composites within a domain during grade estimation.

NI 43-101 Technical Report for the Asanko Gold Mine, Ashanti Region, Ghana
Effective Date: February 28, 2022
Page 214
Figure 14-30 Abore Average Au Grade Profiles Near Contact of the 0.2 g/t Envelope
14.2.3.6 Variography
A correlogram model as well as a pairwise (PW) model for the overall Au distribution within the 0.30 g/t Au envelope was also obtained as a tool to aid in the later classification of the resources and to provide models for the internal dilution study as described below.
Figure 14-31 Abore Summary Variogram Model, 0.30 g/t Au Indicator, 1 m Composites Inside the 0.30 g/t Envelope
0.00
0.10
0.20
0.30
0.40
0.50
0.60
0.70
0.80
0.90
1.00
-100 -80 -60 -40 -20 0 20 40 60 80 100
Au
gra
des
(g
/t)
Distance from contact (m)
Contact Analysis, Au grades, Abore
Au mean outside 0.30 g/t Envelope: 0.057 g/t
Au mean inside 0.30 g/t Envelope: 0.548 g/t

NI 43-101 Technical Report for the Asanko Gold Mine, Ashanti Region, Ghana
Effective Date: February 28, 2022
Page 215
14.2.4 Estimation/Interpolation Methods
The block model is defined in Datamine using a 5 x 5 x 3 metre parent block size with a minimum 1 metre sub-cells size with the following limits which refer to the southwest, lower corner of the block:
• Minimum Easting: 613,500E
• Maximum Easting: 615,300E
• Minimum Northing: 712,500N
• Maximum Northing: 715,100N
• Minimum Elevation: 0 metre
• Maximum Elevation: 231 metres
An Indicator-modified Ordinary Kriging (IMOK) method is used to estimate Au grades within the 0.30 g/t Au envelope, only using composites within the 0.30 g/t Au envelope and includes edge dilution at the contact of the 0.30 g/t Au envelope, assuming a 0.0 g/t Au grade on the outside of the grade envelope. Not all blocks inside the 0.30 g/t Au envelope are estimated due to the limitation imposed by the search ellipsoids, which generally do not fill completely the volume defined by the envelopes. The total proportion of non-estimated blocks is very small, and they are assumed to have a 0.0 g/t Au grade.
Ordinary Kriging (OK) is used to estimate an indicator variable of the proportion of each block above 0.30 g/t Au and for the grades of the proportion above the 0.30 g/t Au threshold. The same process is used to obtain a grade estimate of the proportion of the block below 0.30 g/t. In all cases a discretization of 2 x 2 x 2 points per block in X, Y, and Z directions is used.
Search orientations are guided by the variogram models, and the search distances in every case are guided as well by variography but optimized to reflect a correct balance of estimated blocks in each estimation pass. Three anisotropic octant search passes were used. A maximum of 2 composites per octant was used for all three passes. The main parameters used to estimate the indicator variable and Au grade are shown in Table 14-13.
Table 14-13 Abore Ordinary Kriging plan, 0.30 g/t Indicator and Au Grade Estimation Inside 0.30 g/t Grade Envelope
Pass Search in Y, X,
and Z
Search Angles, Rotation, GSLib
Convention Min. No. of
Comps Max No. of
Comps Max No. of
Comps/Octant
First 25x12.5x16.75m 30/-5/10 8 8 2
Second 60x30x40m 30/-5/10 8 8 2
Third 120x60x80m 30/-5/10 3 12 2
14.2.5 Validation
14.2.5.1 Visual Validation
Cross sections, longitudinal sections, and plan views were used to check whether the block estimated grades in relation to the nearby composites are reasonable; whether the composited assay data itself was reasonable; whether the oxide/transition/sulfide, topographic surfaces and the 0.30 g/t Au envelope produced were correctly tagged onto the block model. No evidence of any block being wrongly estimated or tagged was found.
Figure 14-32 and Figure 14-33 show level 157.5 metre for the Northern and Southern areas within Abore, respectively. Figure 14-34 shows a cross sectional view of 714179N, while Figure 14-35 shows a longitudinal section roughly orientated along strike. All figures show estimated Au grades and drill hole collars and grades, as well as the grade envelope and where applicable the two topographies.

NI 43-101 Technical Report for the Asanko Gold Mine, Ashanti Region, Ghana
Effective Date: February 28, 2022
Page 216
Figure 14-32 Abore Au Grade Estimates, Level 157.5, Northern Area
Note: Colour-coded according to legend shown. Grade envelope outline shown in red.
Figure 14-33 Abore Au Grade Estimates, Level 157.5, Southern Area
Note: Colour-coded according to legend shown. Grade envelope outline shown in red.
Figure 14-34 Abore Au Grade Estimates, Cross Section 714170N
Note: Colour-coded according to legend shown. Grade envelope outline shown in red.

NI 43-101 Technical Report for the Asanko Gold Mine, Ashanti Region, Ghana
Effective Date: February 28, 2022
Page 217
Figure 14-35 Abore Au Grade Estimates, Longitudinal Section
Note: Colour-coded according to legend shown. Only blocks within grade envelope are shown.
14.2.5.2 Statistical Validation
Table 14-14 shows the comparisons for the sub-celled and the final re-blocked 5 x 5 x 3 metre models, highlighting the average grade. The 1 metre composites were declustered using a Nearest-Neighbor (NN) model. In the final model the estimated grades average (AUIMOK column) is about 3% lower than the declustered composites (AUNN column), which is considered acceptable.
Table 14-14 Abore Basic Statistics, Estimated Grades vs 1 m Declustered Composites, Sub-celled and Final, Re-blocked Models
SUBCELL REBLOCKED (5x5x3m)
AUIMOK AUNN AUIMOK AUNN
NUMBER 2395473 2395473 172292 172292
MINIMUM 0.036 0.010 0.001 0.000
MAXIMUM 95.282 34.500 89.895 34.500
MEAN 1.0290 1.1390 0.8400 0.8670
VARIANCE 2.3869 4.0552 2.0856 2.8515
STANDDEV 1.5450 2.0138 1.4442 1.6886
COEF_OF_VAR 1.5008 1.7674 1.7183 1.9470
Figure 14-36 shows drift plots with estimated Au block grades and averages of Nearest Neighbour declustered composites Au grades in the Easting, Northing, and the Vertical directions, and show that the estimated block grades closely reproduce the grade trends observed in the original composites.

NI 43-101 Technical Report for the Asanko Gold Mine, Ashanti Region, Ghana
Effective Date: February 28, 2022
Page 218
Figure 14-36 Abore Drift Plot, Au Grade Estimates (in Blue) vs Declustered Composites (Nearest Neighbor Model, in Orange)
Note: Histograms are number of data (second Y-axis); swaths every 50 m, all kriging passes.
14.2.5.3 Discrete Gaussian Model Check
A change of support check was made for the entire volume within the 0.3 g/t Au grade envelope. The Discrete Gaussian model was applied after deriving the corresponding variogram model and obtaining the dispersion variance for the 5 x 5 x 3 metre selective mining unit (SMU) size.
The model parameters corresponding to the correlogram obtained for the entire domain is shown in Figure 14-37. The corresponding SMU-sized block dispersion variance is 0.8175, indicating that on average there is a very significant mixing of grades within an SMU block, which results from highly variable Au mineralization.
0
0.5
1
1.5
2
2.5
3
0
0.2
0.4
0.6
0.8
1
1.2
1.4
1.6
61
36
37
.5
61
36
87
.5
61
37
37
.5
61
37
87
.5
61
38
37
.5
61
38
87
.5
61
39
37
.5
61
39
87
.5
61
40
37
.5
61
40
87
.5
61
41
37
.5
61
41
87
.5
61
42
37
.5
61
42
87
.5
61
43
37
.5
61
43
87
.5
61
44
37
.5
61
44
87
.5
61
45
37
.5
61
45
87
.5
61
46
37
.5
61
46
87
.5
61
47
37
.5
61
47
87
.5
61
48
37
.5
61
48
87
.5
61
49
37
.5
61
49
87
.5
61
50
37
.5
61
50
87
.5
Nu
mb
er
of
Sam
ple
s
Gra
de
s
Slice
Swath Plot:swathX.csv
M_TONNES
M_AUIMOK
M_AUNN
0
0.5
1
1.5
2
2.5
3
0
0.5
1
1.5
2
2.5
71
25
12
.5
71
26
12
.5
71
26
87
.5
71
27
62
.5
71
28
37
.5
71
29
12
.5
71
29
87
.5
71
30
62
.5
71
31
37
.5
71
32
12
.5
71
32
87
.5
71
33
62
.5
71
34
37
.5
71
35
12
.5
71
35
87
.5
71
36
62
.5
71
37
37
.5
71
38
12
.5
71
38
87
.5
71
39
62
.5
71
40
37
.5
71
41
12
.5
71
41
87
.5
71
42
62
.5
71
43
37
.5
71
44
12
.5
71
44
87
.5
71
45
62
.5
71
46
37
.5
71
47
12
.5
71
47
87
.5
71
48
62
.5
71
49
37
.5
Nu
mb
er
of
Sam
ple
s
Gra
de
s
Slice
Swath Plot:SWATHY.csv
M_TONNES
M_AUIMOK
M_AUNN
0
0.2
0.4
0.6
0.8
1
1.2
1.4
1.6
1.8
0
0.2
0.4
0.6
0.8
1
1.2
1.4
4.5
13
.5
22
.5
31
.5
40
.5
49
.5
58
.5
67
.5
76
.5
85
.5
94
.5
10
3.5
11
2.5
12
1.5
13
0.5
13
9.5
14
8.5
15
7.5
16
6.5
17
5.5
18
4.5
19
3.5
20
2.5
21
1.5
22
0.5
Nu
mb
er
of
Sam
ple
s
Gra
de
s
Slice
Swath Plot:SWATHZ.csv
M_TONNES
M_AUIMOK
M_AUNN

NI 43-101 Technical Report for the Asanko Gold Mine, Ashanti Region, Ghana
Effective Date: February 28, 2022
Page 219
Figure 14-37 Abore Summary Correlogram Model Parameters, Au Within the 0.3 g/t Au Grade Envelope
Table 14-15 shows the comparison between the SMU theoretical grade-tonnage curve and the sub-celled Abore Resource Model for some specific cut-offs. The key cut-off to consider in the case of the Resources is the reporting cut-off of 0.5 g/t Au, for which the tonnages and grades are within 5% relative difference of each other, and the metal content is less than 2% relative difference. Higher cut-offs are an issue for the Reserves model, as the predicted higher grades, according to the Discrete Gaussian model, are not realistic. Therefore, it is necessary to dilute further the grades at the time of converting the Resource model to the Reserve model which is discussed in more detail in the Section 15.
In summary, these checks show that the Abore Resource model at the 0.5 g/t Au cut-off is well validated, and that there is the need for selectively diluting the higher grades to obtain a reasonable Reserves model.
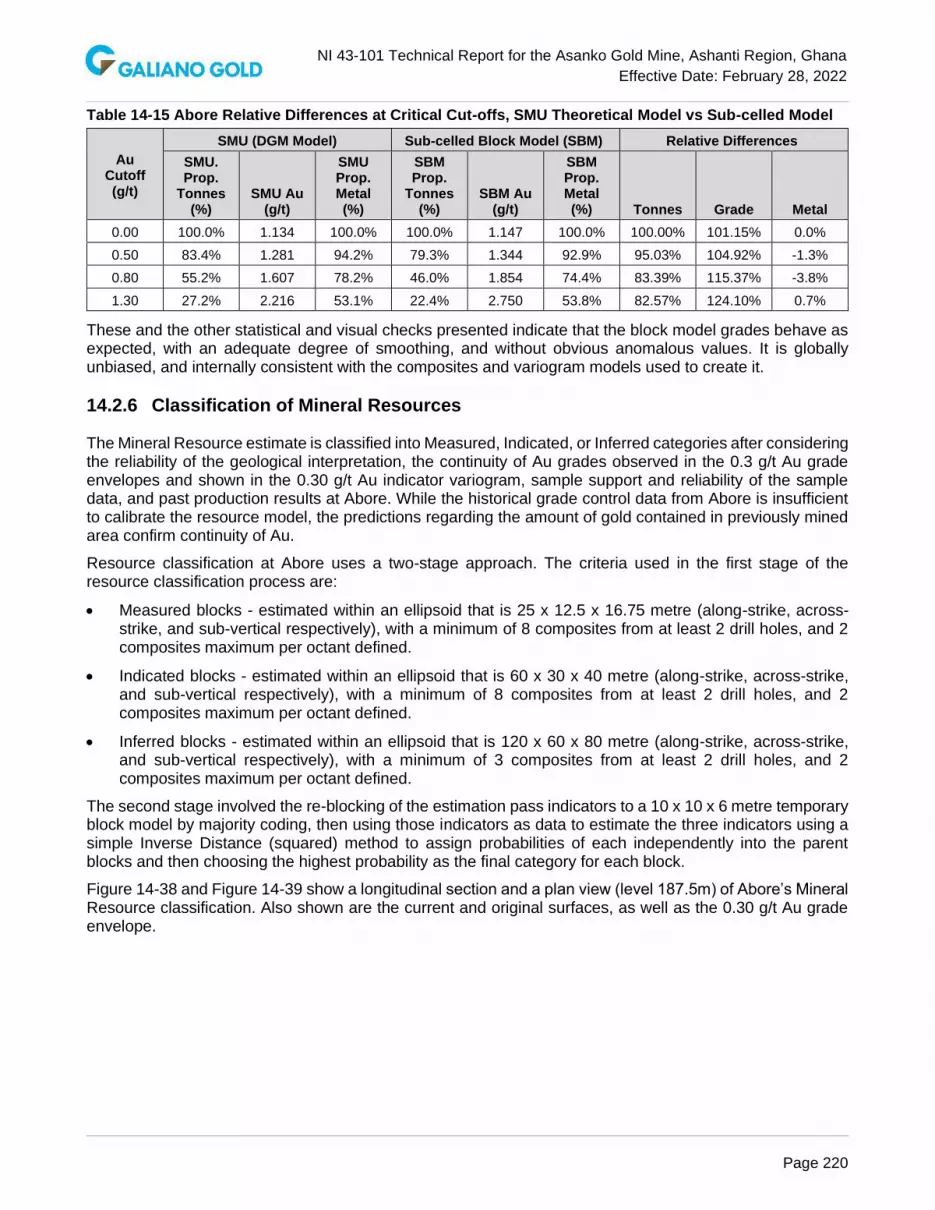
NI 43-101 Technical Report for the Asanko Gold Mine, Ashanti Region, Ghana
Effective Date: February 28, 2022
Page 220
Table 14-15 Abore Relative Differences at Critical Cut-offs, SMU Theoretical Model vs Sub-celled Model
Au Cutoff (g/t)
SMU (DGM Model) Sub-celled Block Model (SBM) Relative Differences
SMU. Prop.
Tonnes (%)
SMU Au (g/t)
SMU Prop. Metal (%)
SBM Prop.
Tonnes (%)
SBM Au (g/t)
SBM Prop. Metal (%) Tonnes Grade Metal
0.00 100.0% 1.134 100.0% 100.0% 1.147 100.0% 100.00% 101.15% 0.0%
0.50 83.4% 1.281 94.2% 79.3% 1.344 92.9% 95.03% 104.92% -1.3%
0.80 55.2% 1.607 78.2% 46.0% 1.854 74.4% 83.39% 115.37% -3.8%
1.30 27.2% 2.216 53.1% 22.4% 2.750 53.8% 82.57% 124.10% 0.7%
These and the other statistical and visual checks presented indicate that the block model grades behave as expected, with an adequate degree of smoothing, and without obvious anomalous values. It is globally unbiased, and internally consistent with the composites and variogram models used to create it.
14.2.6 Classification of Mineral Resources
The Mineral Resource estimate is classified into Measured, Indicated, or Inferred categories after considering the reliability of the geological interpretation, the continuity of Au grades observed in the 0.3 g/t Au grade envelopes and shown in the 0.30 g/t Au indicator variogram, sample support and reliability of the sample data, and past production results at Abore. While the historical grade control data from Abore is insufficient to calibrate the resource model, the predictions regarding the amount of gold contained in previously mined area confirm continuity of Au.
Resource classification at Abore uses a two-stage approach. The criteria used in the first stage of the resource classification process are:
• Measured blocks - estimated within an ellipsoid that is 25 x 12.5 x 16.75 metre (along-strike, across-strike, and sub-vertical respectively), with a minimum of 8 composites from at least 2 drill holes, and 2 composites maximum per octant defined.
• Indicated blocks - estimated within an ellipsoid that is 60 x 30 x 40 metre (along-strike, across-strike, and sub-vertical respectively), with a minimum of 8 composites from at least 2 drill holes, and 2 composites maximum per octant defined.
• Inferred blocks - estimated within an ellipsoid that is 120 x 60 x 80 metre (along-strike, across-strike, and sub-vertical respectively), with a minimum of 3 composites from at least 2 drill holes, and 2 composites maximum per octant defined.
The second stage involved the re-blocking of the estimation pass indicators to a 10 x 10 x 6 metre temporary block model by majority coding, then using those indicators as data to estimate the three indicators using a simple Inverse Distance (squared) method to assign probabilities of each independently into the parent blocks and then choosing the highest probability as the final category for each block.
Figure 14-38 and Figure 14-39 show a longitudinal section and a plan view (level 187.5m) of Abore’s Mineral Resource classification. Also shown are the current and original surfaces, as well as the 0.30 g/t Au grade envelope.

NI 43-101 Technical Report for the Asanko Gold Mine, Ashanti Region, Ghana
Effective Date: February 28, 2022
Page 221
Figure 14-38 Abore Resource Classification, Longitudinal Section
Note: Measured, Indicated, and Inferred are represented by red, green, and blue, respectively. Original topography; pit limit topography, and 0.30 g/t grade envelope in red.
Figure 14-39 Abore Resource Classification, Level 187.5m
Note: Measured, Indicated, and Inferred are represented by red, green, and blue, respectively. Original topography; pit limit topography, and 0.30 g/t grade envelope in red.
14.2.7 Reasonable Prospects of Eventual Economic Extraction
The Abore mineralization is assumed amenable to open pit mining, and milling and recovery through CIL gold processing, and was evaluated for reasonable prospects for eventual economic extraction by constraining the Mineral Resources within a conceptual pit shell optimized in NPV Scheduler™. The assumptions used in preparing the conceptual pit, include mining and processing costs, metallurgical recovery, metal price and general and administrative costs and other technical parameters. The primary assumptions are shown in Table 14-16 and approximately correspond to the 0.50 g/t Au Mineral Resource cut-off. See “Cautionary Note about Mineral Resources”.
Table 14-16 Abore Conceptual Constraining Pit Parameters
Parameter Value
Gold Price (US$/ounce) 1,600
Mining Cost (US$/tonne) 1.025 - 1.647
Mining Cost Incremental (US$/Vertical 6m) 0.0087 – 0.0353
Mill Feed Transport (US$/tonne) 3.86
Process Cost (US$/tonne) 8.79 – 11.32
Gold Recovery (%) 94%
General and Administration (US$/tonne) 6.55

NI 43-101 Technical Report for the Asanko Gold Mine, Ashanti Region, Ghana
Effective Date: February 28, 2022
Page 222
14.2.8 Mineral Resource Statement
The Abore Mineral Resource estimate is reported in accordance with the CIM Definition Standards for Mineral Resources & Mineral Reserves, adopted by CIM Council May 10, 2014. The Qualified Person is Mr. Mario E. Rossi, MAusIMM, SME, IAMG, and Principal Geostatistician of Geosystems International Inc. The effective date is February 28, 2022. The Mineral Resource estimate is reported assuming open pit mining and milling and CIL gold processing methods using a cut-off grade of 0.5 g/t Au, is constrained within a conceptual open pit prepared using NPV Scheduler™ software. The Mineral Resource estimates are summarized in Table 14-17.
Table 14-17 Abore Mineral Resource Estimate at a 0.5 g/t Au cut-off and $1,600/oz Au, as of February 28, 2022
Category
Cutoff Grade
(g/t Au) Tonnes (kt) Au (g/t)
Au Metal Contained
(koz)
Measured 0.5 3,193 1.46 150
Indicated 0.5 5,123 1.23 203
Measured & Indicated 0.5 8,316 1.32 353
Inferred 0.5 1,109 1.55 55
Notes: 1. The Mineral Resource estimates are reported in accordance with the CIM Definition Standards for
Mineral Resources & Mineral Reserves, adopted by CIM Council May 10, 2014. 2. The effective date for the Mineral Resource estimates is February 28, 2022 3. Mineral Resource estimates account for mining depletion as of February 28, 2022 4. Reasonable Prospects for eventual economic extraction assume open pit mining with conventional gold
processing and was tested using NPV Scheduler™ pit optimization software using several technical parameters including:
a. $1,600/oz Au price b. $1.025/t to1.647/t mining costs c. $3.86/t mill feed transport costs d. $8.79/t to $11.32/t processing costs e. 94% Au recovery for all material f. $6.55/t G&A
5. Applicable rounding has been applied to the stated tonnages, grades, and metal content to reflect the level of accuracy and precision of the estimate
Grade and tonnage curves are shown in Figure 14-40.

NI 43-101 Technical Report for the Asanko Gold Mine, Ashanti Region, Ghana
Effective Date: February 28, 2022
Page 223
Figure 14-40 Abore Measured and Indicated Grade-Tonnage Curves
14.2.9 Factors That May Affect the Mineral Resource Estimate
Other than as discussed in other sections of this report there are no known environmental, permitting, legal, title, taxation, socio-economic, marketing, and political or other relevant issues that may materially affect the Mineral Resource estimates. Other relevant factors that may materially affect the Mineral Resources, including mining, metallurgical recovery, and infrastructure are reasonably well understood according to the assumptions presented in this Report.
There is some risk associated to the Mineral Resource estimate presented in this Report because of the interpreted grade envelope. The interpretation is based on more widely-spaced exploration drilling, and carry what is considered a moderate level of risk. This risk affects the predicted mineralized tonnages.
While the change of support check results in a good validation of the estimated grades, the change of support model used is based on certain assumptions and parameters that carry a degree of uncertainty, which is also carried to the grade estimates. The uncertainty and risk implied in the grade estimates is considered low on a global basis, corresponding to no less than yearly production volumes. Less uncertainty for quarterly production periods would require additional infill drilling.
0.00
0.50
1.00
1.50
2.00
2.50
3.00
3.50
4.00
0
2,000
4,000
6,000
8,000
10,000
12,000
14,000
16,000
0.00 0.10 0.20 0.30 0.40 0.50 0.60 0.70 0.80 0.90 1.00 1.10 1.20 1.30 1.40 1.50
Au
Gra
de
ab
ove
Cu
toff
(g/
t)
Ton
s ab
ove
Cu
toff
(x1
00
0)
Au Cutoff Grade (g/t)
Grade-Tonnage Curve2021 Abore Measured and Indicated Mineralization
Tonnes (m)*1000 Au (g/t)

NI 43-101 Technical Report for the Asanko Gold Mine, Ashanti Region, Ghana
Effective Date: February 28, 2022
Page 224
14.3 Nkran Mineral Resource Estimate
14.3.1 Database
The Nkran exploration data used in the MRE is 928 diamond, reverse circulation, and reverse circulation with diamond tail drill holes totalling 82,460 metres of drilling with 81,464 Au assays. There are also 11,994 reverse circulation grade control drill holes totalling 338,583 metres of drilling with 225,722 Au assays. The dataset includes 36 new exploration diamond drill holes and 30 GC RC holes drilled since 2018. The exploration data was restricted to data selected up to 10 metre above the 31 May 2017 as-mined surface. A summary of the exploration drilling data, as used in the MRE, is shown in Table 14-18. All subsequent data analysis, statistics, and estimation for the MRE are limited to the validated dataset. Note that all figures and tables for the Nkran MRE section of this report were prepared by CSA Global unless otherwise stated.
Table 14-18 Nkran Database – Summary of Exploration Drill Data Used in the MRE
Description DDH RC RCD Total
Number of Holes 291 600 38 928
Metres Drilled 50,697 24,321 7,442 82,460
Number of Assays 49,787 24,236 7,441 81,464
Number of BD Measurements 273 - - 273
Validation checks were completed after the drill data were imported into SQL and Datamine StudioRM™ software. The QP confirms that no issues that would have a material impact on the MRE were identified.
Core recovery data was not recorded for the 30 new diamond holes. Core recoveries are not expected to change in the new drilling as it infills existing drillholes. In 2018, core recovery data were reviewed for DDH and RCD core, selected below the 31 May 2017 mined surface. The results show that recoveries are reasonable within oxide (74%) and good within transitional (85%) and fresh material (98%). Oxide material in core accounts for 5% of the recovery data, whereas transitional and fresh material in core accounts for 2% and 93% of the recovery data, respectively. Core recovery for the fresh material shows good recovery for both DD (98%) and RCD (98%). Further review of the core recovery data indicates that there is no relationship between grade and recovery.
14.3.2 Geological Models
The 31 May 2017 as-mined surface is used as an upper domain boundary during grade estimation. The reported Mineral Resource estimate is limited to material below the June 2020 as-mined surface.
The 3D lithological and structural models were prepared by Asanko geologists using Leapfrog software. The host lithologies constitute three sandstone units (western, central, and eastern), two granite units (main and skinny), and two breccia units (north and south). The modelled geological wireframes provide the basis of the mineralization domains and were used to flag assay, composites, and blocks. The lithology domains are shown in Figure 14-41.
In addition to adjustments made for new drilling, the Skinny and Main Granites were re-interpreted from pit-mapping which resulted in volume changes for domains not influenced by the new drilling. The dominant sandstone domain, the Western Sandstone, has gained volume mainly from material that was interpreted as barren siltstone in 2018. A smaller proportion of the volume increase can be attributed to material previously assigned to other non-siltstone domains. The South Breccia and Central Sandstone domains were extended to the southwest to include mineralization in surface holes that had not been included previously.

NI 43-101 Technical Report for the Asanko Gold Mine, Ashanti Region, Ghana
Effective Date: February 28, 2022
Page 225
Figure 14-41 3D View of the Nkran Geological Domains Within the June 2020 Mining Surface
Asanko geologists created weathering profiles for the bottom of oxidation and the top of fresh material in Leapfrog (Figure 14-42). These surfaces were used to flag weathering into the updated model and code density values into the blocks. Note that 99% of the rock within the extents of the current MRE volume is unweathered.
Figure 14-42 Cross-section View of the Nkran Weathering Profiles and Geological Domains
Note: Bottom of Complete Oxidation (dotted red line); Top of Fresh (dotted blue line); December 2018 Pit Shell (solid brown line)

NI 43-101 Technical Report for the Asanko Gold Mine, Ashanti Region, Ghana
Effective Date: February 28, 2022
Page 226
The main lithological units, within specific fault blocks, form the basis for delineating geological domains (GEOL). Within the domains the mineralized and waste volumes have been defined using an Indicator Kriging (IK) method.
A grade compositing process in Datamine Studio RM called CompSE was used to generate ‘mineable’ intercepts – that is, a set of intercepts that meets set minimum length, grade and dilution criteria. The minimum grade used to delineate mineralization from waste was 0.3 g/t Au. The minimum true width used was 3 m, in line with the SMU size of 5 x 5 x 3 m (X Y x Z) modelled. Intercepts that met the CompSE criteria were assigned a value of 1 and intercepts that did not, were assigned a value of 0. The 1 and 0 values are then estimated into a block model (2.5 x 2.5 x 3 m for better resolution) using dynamic anisotropy based on structural wireframes.
The indicator estimates produce a value between 0 and 1 which is then used as a probability for establishing if a cell is mineralized, or not. Specific probabilities are selected for each domain that represent expected mineralization volumes. The probability thresholds chosen were derived in 2018 from the results of testwork done in a trial area (documented in 2019 NI 43-101) with good exploration and grade control data coverage. The threshold values are retained and used in this update.
The mineralization volumes selected within the lithology wireframes were visually validated and compared with those of the previous MRE. The overall volume increase of the mineralized model is 1% compared with the previous MRE. There is a 3% increase in the mineralized model for the most materially significant Western Sandstone domain. The volume difference between the 2018 and 2020 for each domain is presented in Table 14-19).
Table 14-19 Comparison of Nkran Domain Volumes Based on the Interpreted Geology Wireframes 2018 vs 2020
Domain Description 2018 2020 Difference Variance
210 Western Sandstone 14,754,525 18,670,463 3,915,938 27%
220 Central Sandstone 15,766,181 14,769,825 -996,356 -6%
230 Eastern Sandstone 22,612,406 22,697,850 85,444 0%
310 Main Granite 6,365,006 6,501,694 136,688 2%
320 Skinny Granite 1,485,769 1,195,106 -290,663 -20%
510 South Breccia 2,241,825 2,751,488 509,663 23%
520 North Breccia 3,529,594 3,379,556 -150,038 -4%
Total 66,755,306 69,393,281 2,637,975 4%
14.3.3 Exploration Data Analysis
Statistical analysis was carried out using Datamine Studio, Snowden Supervisor and GeoAccess Professional software packages.
The exploration dataset was assessed for bias in Au grade between the sample types (DDH, RC and RCD). Summary statistics and probability plots (Figure 14-43) indicate the datasets are similar and appropriate to be used together as part of the estimation.
The exploration data was also compared to the grade control to the grade control reverse circulation data. QQ plots comparing the Au grades of exploration data with the grade control reverse circulation data within a common volume for each of the mineralized domains illustrates plots selected for the Western and Central Sandstone are reasonably compatible (Figure 14-44). Summaries of the domain codes used to distinguish the data during geostatistical analysis and estimation are shown in Table 14-20.

NI 43-101 Technical Report for the Asanko Gold Mine, Ashanti Region, Ghana
Effective Date: February 28, 2022
Page 227
Figure 14-43 Nkran Log Probability Plots Comparing Top-cut Au Grades in DDH, RC and RCD Drill Holes
Note: DDH (green); RC (blue); RCD (red) Samples used for IK, restricted to ORE=1, based on CompSE criteria. Source: CSA Global, 2021
Figure 14-44 Nkran QQ Plots Comparing Au Grades in the Exploration Dataset (X axis) to the Dynamic RC GC Dataset (Y axis) for Western Sandstone (LHS) and Central Sandstone (RHS)
Source: CSA Global, 2021

NI 43-101 Technical Report for the Asanko Gold Mine, Ashanti Region, Ghana
Effective Date: February 28, 2022
Page 228
Table 14-20 Nkran Data Field Flagging and Description
Field Code Description
OXIDE
1
2
3
Oxide
Transitional
Fresh/Sulphide
GEOL
210
220
230
310
320
510
520
900
Western Sandstone
Central Sandstone
Eastern Sandstone
Main Granite
Skinny Granite
South Breccia
North Breccia
Siltstone/Waste
ESTZON
210
220
230
310
320
510
Western Sandstone and IK_USE=1
Central Sandstone and IK_USE=1
Eastern Sandstone and IK_USE=1
Main Granite and IK_USE=1
Skinny Granite and IK_USE=1
South Breccia/North Breccia and IK_USE=1
IK_USE 0
1
Waste
Mineralization
Note: ESTZON defines the mineralization domains and is based on GEOL, and where IK_USE=1.
The naïve statistics per ESTZON domains are shown in Figure 14-45.
Figure 14-45 Nkran Log Probability Overlay plots of Uncut Au g/t within the Estimation Domains (ESTZON)

NI 43-101 Technical Report for the Asanko Gold Mine, Ashanti Region, Ghana
Effective Date: February 28, 2022
Page 229
14.3.3.1 Density Assignment
The in-situ dry bulk density (BD) dataset consists of in-pit grab samples and drill core with specific gravity measurements determined using a water immersion method with the following formula:
𝐵𝑢𝑙𝑘 𝐷𝑒𝑛𝑠𝑖𝑡𝑦 =𝑊𝑒𝑖𝑔ℎ𝑡 𝑖𝑛 𝑎𝑖𝑟
𝑊𝑒𝑖𝑔ℎ𝑡 𝑖𝑛 𝑎𝑖𝑟 − 𝑊𝑒𝑖𝑔ℎ𝑡 𝑖𝑛 𝑤𝑎𝑡𝑒𝑟
The mean densities for fresh sandstone, the dominant mineralization host rock, is in the region of 2.67 to 2.71, with low variance. An in-situ dry bulk density of 2.68 t/m3 was selected for all fresh material and the Western sandstone. There are insufficient samples in the oxide and transitional domains to estimate a value with any confidence. Densities for transitional material were set at ~75% of the fresh material, 2.00 t/m3, and oxide material set at ~65% of the fresh material, 1.72 t/m3. Less than 1% of the remaining resource is transitional, so the accuracy of these in-situ dry bulk densities is not materially significant.
14.3.3.2 Composites
A 1 metre composite length is used in the 2020 estimate. Prior to compositing, data flagged as oxide and transitional were removed, since the area for the current Mineral Resource estimate update is all within fresh material.
One-metre composites were prepared respecting ESTZON domain boundaries with a minimum composite length of 0.5 m. All composites are used for the geostatistical analysis and the grade estimate. The potential bias impact of retaining the 108 short composites is considered minimal. The descriptive analysis for the ESTZON domains is shown in Table 14-21.
Table 14-21 Nkran Composite Statistics per ESTZON
ESTZON No. of
Samples Minimum (g/t
Au) Maximum (g/t
Au) Mean (g/t Au) Variance
Coefficient of Variation
210 6,187 0.01 40 2.15 20.10 2.09
220 3,299 0.01 40 1.57 12.58 2.25
230 713 0.01 18 1.25 6.50 2.04
310 1,812 0.01 40 1.12 9.76 2.79
320 1,053 0.01 30 1.60 13.40 2.29
510 741 0.01 25 1.61 7.70 1.72
14.3.3.3 Gold Grade Capping/Outlier Restrictions
Cutting strategy was applied based on the following:
• Skewness of the data
• Probability plots
• Spatial position of extreme grades
Histograms and probability plots were reviewed for Au g/t within each individual estimation domain to determine the top-cut. Composites greater than the top-cut values were reset to the respective top-cut values. The number of values cut was minimal compared to the total domain population, and cutting these values generally had little impact on the mean grade of the domains. The uncut and top-cut statistics, including the impact on metal cut and number of samples cut, per estimation domain, are shown in Table 14-22.

NI 43-101 Technical Report for the Asanko Gold Mine, Ashanti Region, Ghana
Effective Date: February 28, 2022
Page 230
Table 14-22 Nkran Top-cut Statistics per ESTZON
ESTZON Total Top Cut #Cut Uncut Mean Cut Mean % Metal
Cut Uncut CV Cut CV
210 6,187 40 24 2.37 2.15 -9% 3.56 2.09
220 3,299 40 9 1.74 1.57 -9% 3.88 2.25
230 713 18 5 1.44 1.25 -13% 3.86 2.04
310 1,812 40 5 1.17 1.12 -4% 3.41 2.79
320 1,053 30 6 1.84 1.68 -9% 3.49 2.29
510 741 25 1 1.63 1.61 -1% 1.82 1.72
Note: CV – coefficient of variation
14.3.3.4 Variography
Experimental variograms prepared using the 2020 exploration and grade control dataset were compared with variogram models prepared to support the 2018 Mineral Resource. The variogram models calculated in 2018 are retained for the 2020 estimation update.
In 2018, Au grade control variograms were modelled on 1.5 metre top-cut grade control composites, restricted to trial area used for the IK test work. Nuggets were obtained from the downhole variograms, where the lag was set equal to the composite length of 1.5 m. Directional experimental semi variograms were calculated in Gaussian space and modelled and then back transformed to raw space prior to using them in estimation or change of support calculations. Although nuggets and sills were normalized to one, they were scaled to the exploration sample variance prior to change of support calculations and estimation. Table 14-23 presents the variogram model parameters used in change of support calculations and estimation.
Table 14-23 Nkran Variogram Models for Au g/t
ESTZON Rotation
(ISATIS ZYX) Nugget
Structure 1 Structure 2
Partial sill Range Partial sill Range
210
50
8.03 8.39
15
1.43
100
0 10 90
-70 5 40
220
50
4.63 5.70
10
0.43
55
0 10 50
-80 8 35
230
60
3.14 3.00
10
1.17
85
0 10 30
-80 4.5 12
310
70
5.09 6.18
45
0.85
110
0 40 80
-80 10 30
320
50
5.28 6.75
10
0.25
50
0 10 50
-80 10 20
510
60
3.96 3.96
15
1.29
100
0 15 80
-80 10 20

NI 43-101 Technical Report for the Asanko Gold Mine, Ashanti Region, Ghana
Effective Date: February 28, 2022
Page 231
14.3.4 Estimation/Interpolation Methods
14.3.4.1 Block Model
The block model is defined in Datamine using a 10 x 20 x 6 metre parent block size with a minimum 2.5 metre sub-cell size. The model is limited to below the 31 May 2017 as-mined surface. The model parameters, including cell dimensions and model extents, are shown in Table 14-24. The model was not rotated.
Blocks are flagged with GEOL, OXIDE, TOPO, MINED, IK_USE, and ESTZON domain codes. Density is assigned to each block based on oxidation domain.
Table 14-24 Nkran Block Model Dimensions
Axis Origin (m) Model Extent (m) # Blocks Maximum Cell
Size (m) Minimum Cell
Size (m)
Easting (X) 610,500 2,500 250 10 2.5
Northing (Y) 699,600 2,400 120 20 2.5
Elevation (Z) 494 1,212 202 6 3
14.3.4.2 Grade Estimation
The Nkran Mineral Resource is estimated using post-processing of Ordinary Kriged (OK) large panel estimates to produce a recoverable Mineral Resource. This method provides Selective Mining Unit (SMU) scale block estimates that honour the theoretical grade-tonnage relationship determined from discrete Gaussian change of support. Uniform Conditioning (UC) results for the large OK panels are transferred to SMU blocks using Localized Uniform Conditioning (LUC). The quality of the results is dependent on the availability of drill hole data and the nature of the spatial variance. The most material domains in terms of metal are 210 and 220; these domains are used and presented here to document the workflow.
14.3.4.3 Declustering
Declustering at Nkran was undertaken in two stages. For preliminary statistics and first pass estimation, a (20 x 40 x 12 metre) cell weighting strategy was used, which considers all samples when determining the average. Following first pass ordinary kriging, the Kriging weights were written out and the process was re-run. The process using Kriging declustering weights is what was used to generate the estimate.
14.3.4.4 Gaussian Anamorphosis Modelling
UC uses the Gaussian anamorphosis and Hermitian polynomial formalism to define the joint distributions of point, SMU, and panel scale estimates. Eighty Hermite polynomials were used on grade top-cut, declustered data (declustering weights derived through Ordinary Kriging).
The models for ESTZONs 210 and 220 are presented in Figure 14-46. The histograms for raw Au grades for these domains are presented in Figure 14-47 and Figure 14-48 alongside the Gaussian transformed values. The Gaussian transform has resulted in a mean of zero and a variance of one, as expected.

NI 43-101 Technical Report for the Asanko Gold Mine, Ashanti Region, Ghana
Effective Date: February 28, 2022
Page 232
Figure 14-46 Nkran Gaussian Anamorphosis Models for ESTZON 210 (Left) and ESTZON 220 (Right)
Figure 14-47 Nkran Histogram of Au (Left) and Gaussian Transformed Au (Right) for ESTZON 210
Figure 14-48 Nkran Histogram of Au (Left) and Gaussian Transformed Au (Right) for ESTZON 220

NI 43-101 Technical Report for the Asanko Gold Mine, Ashanti Region, Ghana
Effective Date: February 28, 2022
Page 233
14.3.4.5 Ordinary Kriging
Estimation was by Ordinary Kriging into 10 x 20 x 6 metre panels and 5 x 5 x 3 metre SMUs using ISATIS. Search ellipsoid orientations were defined by dynamic anisotropy, derived from the interpreted structures and geological controls. The dip and dip direction of the major axis of anisotropy were calculated from each triangle of the defined fault wireframes (Freelander, County and Discovery). Sample search neighbourhoods were designed to be extremely large to ensure a smoothed panel estimate for use in conditioning the panel. For the ranking of SMUs, the minimum and maximum number of samples were decreased substantially.
14.3.4.6 Support Correction
Block and point anamorphosis modelling of the estimated values and sampled data were undertaken as the primary input of the Uniform Conditioning. The support definition for the block anamorphosis is based on the SMU size. Information effect was computed. Block support correction values for each of the ESTZON domains range from 0.67 to 0.84 and following application of 10 x 10 x 1 metre information effect 0.62 to 0.80, (Table 14-25).
Table 14-25 Nkran Change of Support Calculations
ESTZON Real Block Support Correction (r) Kriged Block Support Correction (s)
210 0.68 0.64
220 0.70 0.66
230 0.68 0.63
310 0.83 0.80
320 0.72 0.67
510 0.73 0.68
14.3.4.7 Uniform Conditioning
Estimation of recoverable resources was completed using Uniform Conditioning. The input for UC was the OK model at the panel scale and the output was an Au grade-tonnage curve for each panel at the SMU scale. For a discretized grade tonnage curve, 90 cut-offs were used and five iso-frequency classes. The dispersion variance estimated through Ordinary Kriging was used alongside the Kriged panel grade per domain.
14.3.4.8 Localized Uniform Conditioning (LUC)
The UC grade tonnage factors of the panel were proportioned based on the domain SMU in the panel to accurately represent Q (metal), T (tonnes) and M (grade) in the domain.
To provide a block model for use in mine planning, SMU sized blocks were Kriged, and the resultant SMUs were ranked from 1 to 64, with the actual grades being discarded and only the ranking remaining. Grades were then read off the panel grade-tonnage curve for each SMU and assigned based on the estimated ranking. The result is the assignment of single grades to SMU sized blocks so that the 64 SMUs in each panel achieve a grade-tonnage tabulation matching that of the panel estimated through UC.
To assess the performance of the LUC process, grade tonnage curves from LUC were compared to those derived from UC for the main domains. These were found to be very comparable.

NI 43-101 Technical Report for the Asanko Gold Mine, Ashanti Region, Ghana
Effective Date: February 28, 2022
Page 234
14.3.5 Validation
14.3.5.1 Visual Validation
OK Panel Validation
The block model was visually reviewed section by section and in 3D to ensure that the grade tenor of the input data was reflected in the OK model panels. Generally, the estimate compares well with the input data. Example cross-sections for the two largest domains, ESTZON domains 210 and 220, are shown in Figure 14-49. The grades in the composites align with the corresponding grades in the block model.
Figure 14-49 Nkran Cross-section View – OK Panel Model and Composites (ESTZON 210 on Left, ESTZON 220 on Right)
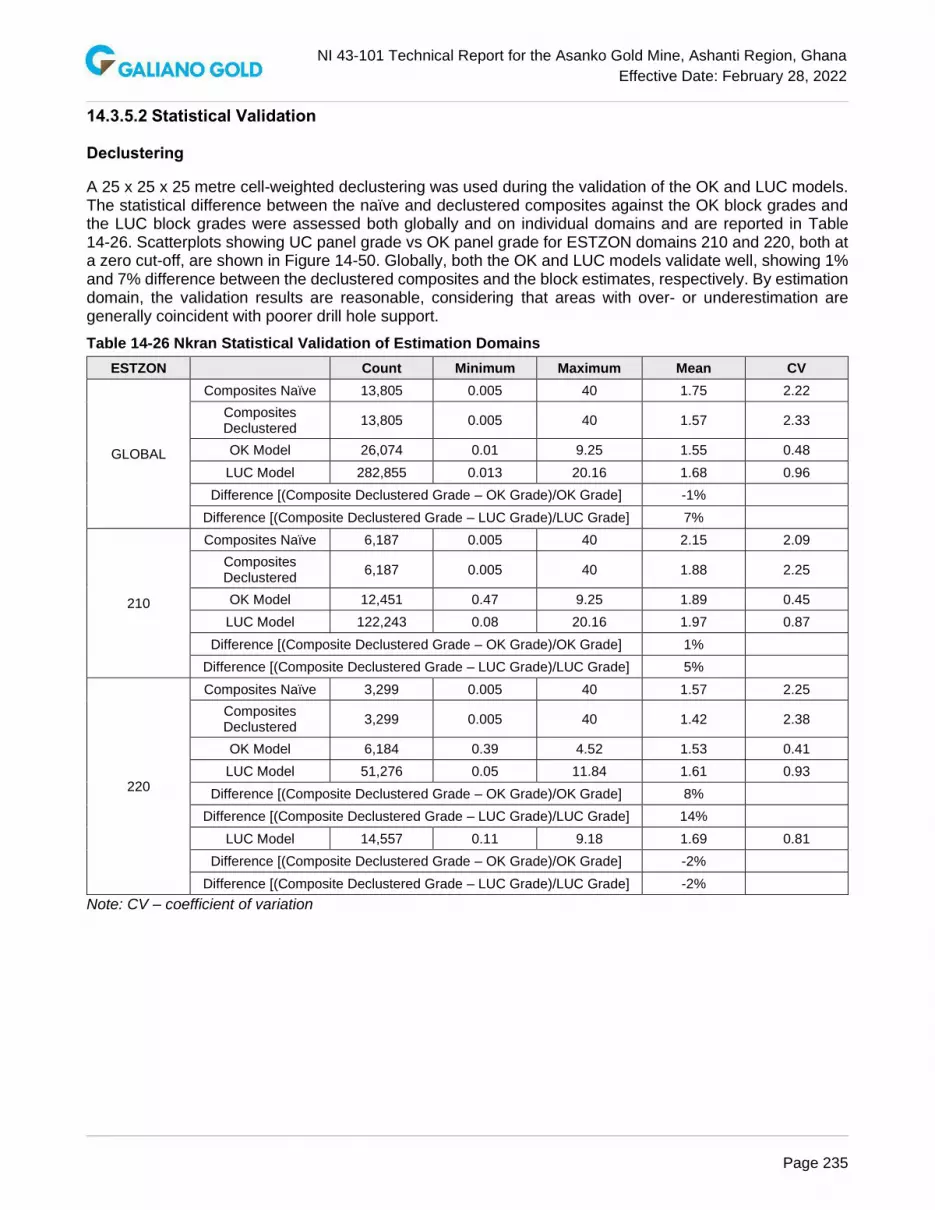
NI 43-101 Technical Report for the Asanko Gold Mine, Ashanti Region, Ghana
Effective Date: February 28, 2022
Page 235
14.3.5.2 Statistical Validation
Declustering
A 25 x 25 x 25 metre cell-weighted declustering was used during the validation of the OK and LUC models. The statistical difference between the naïve and declustered composites against the OK block grades and the LUC block grades were assessed both globally and on individual domains and are reported in Table 14-26. Scatterplots showing UC panel grade vs OK panel grade for ESTZON domains 210 and 220, both at a zero cut-off, are shown in Figure 14-50. Globally, both the OK and LUC models validate well, showing 1% and 7% difference between the declustered composites and the block estimates, respectively. By estimation domain, the validation results are reasonable, considering that areas with over- or underestimation are generally coincident with poorer drill hole support.
Table 14-26 Nkran Statistical Validation of Estimation Domains
ESTZON Count Minimum Maximum Mean CV
GLOBAL
Composites Naïve 13,805 0.005 40 1.75 2.22
Composites Declustered
13,805 0.005 40 1.57 2.33
OK Model 26,074 0.01 9.25 1.55 0.48
LUC Model 282,855 0.013 20.16 1.68 0.96
Difference [(Composite Declustered Grade – OK Grade)/OK Grade] -1%
Difference [(Composite Declustered Grade – LUC Grade)/LUC Grade] 7%
210
Composites Naïve 6,187 0.005 40 2.15 2.09
Composites Declustered
6,187 0.005 40 1.88 2.25
OK Model 12,451 0.47 9.25 1.89 0.45
LUC Model 122,243 0.08 20.16 1.97 0.87
Difference [(Composite Declustered Grade – OK Grade)/OK Grade] 1%
Difference [(Composite Declustered Grade – LUC Grade)/LUC Grade] 5%
220
Composites Naïve 3,299 0.005 40 1.57 2.25
Composites Declustered
3,299 0.005 40 1.42 2.38
OK Model 6,184 0.39 4.52 1.53 0.41
LUC Model 51,276 0.05 11.84 1.61 0.93
Difference [(Composite Declustered Grade – OK Grade)/OK Grade] 8%
Difference [(Composite Declustered Grade – LUC Grade)/LUC Grade] 14%
LUC Model 14,557 0.11 9.18 1.69 0.81
Difference [(Composite Declustered Grade – OK Grade)/OK Grade] -2%
Difference [(Composite Declustered Grade – LUC Grade)/LUC Grade] -2%
Note: CV – coefficient of variation

NI 43-101 Technical Report for the Asanko Gold Mine, Ashanti Region, Ghana
Effective Date: February 28, 2022
Page 236
Figure 14-50 Nkran Scatterplots Showing UC Panel Grade (x-axis) versus OK Panel Grade (y-axis)
Swath Plots
Swath plots comparing the model block grades and input composites (declustered and top cut) in spatial increments of northing, easting, and elevation slices. Swath plots globally, as well as for ESTZON domains 210 and 220 are shown in Figure 14-51, Figure 14-52, and Figure 14-53. The plots show that the distribution of block grades honours the distribution of input composite grades. The degree of smoothing is appropriate and accounts for volume variance effects, where block grades should be smoother than point grades. The general trend of the composite grades is reflected in the block models.
Figure 14-51 Nkran GLOBAL Swath Plots and Histogram
Note: OK Panel Model (Black); LUC Model (Orange); Declustered Composites (Blue) Source: CSA Global, 2021

NI 43-101 Technical Report for the Asanko Gold Mine, Ashanti Region, Ghana
Effective Date: February 28, 2022
Page 237
Figure 14-52 Nkran ESTZON 210 (Western Sandstone) Swath Plots and Histogram
Note: OK Panel Model (black); LUC Model (orange); Declustered Composites (blue) Source: CSA Global, 2021
Figure 14-53 Nkran ESTZON 220 (Central Sandstone) Swath Plots and Histogram
Note: OK Panel model (black); LUC model (orange); Declustered composites (blue) Source: CSA Global, 2021

NI 43-101 Technical Report for the Asanko Gold Mine, Ashanti Region, Ghana
Effective Date: February 28, 2022
Page 238
LUC Validation
In addition to the statistical and visual validation steps outlined above, the LUC estimate was subject to some additional checks. These included:
• Comparing the mean grade of LUC grades within the panel with the mean grade of the panel
• Comparing the grade-tonnage curve of UC and LUC estimates (shown in Figure 14-54 and Figure 14-55 for ESTZONs 210 and 220, respectively).
Figure 14-54 Nkran Scatterplots Showing Mean LUC Grade of SMUs (x-axis) versus UC Grade (y-axis) Both at a Zero Cut-off. ESTZON 210 (Left) and ESTZON 220 (Right).
Source: CSA Global, 2021
Figure 14-55 Nkran Grade (Left) and Tonnage Curves (Right) for ESTZON 210 with UC Model in Red and LUC in Green
Source: CSA Global, 2021
14.3.6 Classification of Mineral Resources
The Mineral Resource is classified as Indicated and Inferred based upon an assessment of geological understanding of the deposit, geological and mineralization continuity, drill hole spacing, quality control results, search and estimation parameters, and an analysis of available density information.

NI 43-101 Technical Report for the Asanko Gold Mine, Ashanti Region, Ghana
Effective Date: February 28, 2022
Page 239
The Nkran deposit shows good continuity of mineralization within well-defined geological constraints, particularly within the Western Sandstone domain which is has the highest grade and dominant gold metal deportment. Drill holes are located at a nominal spacing of 25 x 25 metre sections extending out to 50 metres on the peripheries of the deposit. The drill spacing is sufficient to allow the geology (and associated mineralization) to be modelled into coherent wireframes for each domain. Reasonable consistency is evident in the orientations, thickness, and grades of the mineralized zone, as defined by Indicator Kriging.
Indicated Mineral Resources were informed by Slope statistics and average distance of samples and generally is defined where drilling is approximately 40 x 40 metre. The remaining material above a wireframe surface of the conceptual Whittle pit shell was classified as Inferred Mineral Resources. Figure 14-56 and Figure 14-57 show the final classified block model in plan view and 3D view.
Figure 14-56 Nkran Cross-section View of Classified Grade Model, Constrained within Nominal US$1,600/oz Au Pit Shell (Blue Outline) Bounded by the June 2020 Mining Surface (Black Outline)
Source: CSA Global, 2021

NI 43-101 Technical Report for the Asanko Gold Mine, Ashanti Region, Ghana
Effective Date: February 28, 2022
Page 240
Figure 14-57 Nkran 3D View of Classified Grade Model, View Towards NW. Nominal US$1,600/oz Pit Shell Shown in Blue
14.3.7 Reasonable Prospect of Eventual Economic Extraction
The Nkran mineralization is assumed amenable to open pit mining, and milling and recovery through CIL gold processing, and was evaluated for reasonable prospects for eventual economic extraction by constraining the Mineral Resources within a conceptual pit shell optimized in NPV Scheduler™. The assumptions used in preparing the conceptual pit, include mining and processing costs, metallurgical recovery, metal price and general and administrative costs, and are shown in Table 14-27 and approximately correspond to the 0.50 g/t Au Mineral Resource cut-off. See “Cautionary Note about Mineral Resources”.
Table 14-27 Nkran Conceptual Constraining Pit Parameters
Parameter Value
Gold Price (US$/ounce) 1,600
Mining Cost (US$/tonne) 1.54 – 2.39
Mining Cost Incremental (US$/Vertical 6m) 0.0114 – 0.0197
Mill Feed Transport (US$/tonne) 0.84
Process Cost (US$/tonne) 8.79 – 11.32
Gold Recovery (%) 94%
General and Administration (US$/tonne) 6.55

NI 43-101 Technical Report for the Asanko Gold Mine, Ashanti Region, Ghana
Effective Date: February 28, 2022
Page 241
14.3.8 Mineral Resource Statement
The Nkran Mineral Resource estimate is reported in accordance with the CIM Definition Standards for Mineral Resources & Mineral Reserves, adopted by CIM Council May 10, 2014. The Qualified Person is, Malcolm Titley, MAIG, MAusIMM who is a Principal Consultant of CSA Global. The effective date of the Mineral Resource estimate is February 28, 2022. The Mineral Resource estimate is reported assuming open pit mining and milling and CIL gold processing methods using a cut-off grade of 0.5 g/t Au, is constrained within a conceptual open pit prepared using NPV Scheduler™ software. The Mineral Resource estimates are summarized in Table 14-28.
Table 14-28 Nkran Mineral Resource Estimate at a 0.5 g/t Au cut-off and $1,600/oz Au, as of February 28, 2022
Category
Cutoff Grade
(g/t Au) Tonnes (kt) Au (g/t)
Au Metal Contained
(koz)
Measured na na na na
Indicated 0.5 12,119 2.09 814
Measured & Indicated 0.5 12,119 2.09 814
Inferred 0.5 1,335 2.23 96
Notes:
1. The Mineral Resource estimates are reported in accordance with the CIM Definition Standards for Mineral Resources & Mineral Reserves, adopted by CIM Council May 10, 2014.
2. The effective date for the Mineral Resource estimates is February 28, 2022 3. Mineral Resource estimates account for mining depletion as of February 28, 2022 4. Reasonable Prospects for eventual economic extraction assume open pit mining with conventional gold
processing and was tested using NPV Scheduler™ pit optimization software using several technical parameters including:
a. $1,600/oz Au price b. $1.54/t to $2.39/t mining costs c. $0.84/t mill feed transport costs d. $8.79/t to $11.32/t processing costs e. 94% Au recovery for all material f. $6.55/t G&A
5. Applicable rounding has been applied to the stated tonnages, grades, and metal content to reflect the level of accuracy and precision of the estimate
The grade tonnage curve for all mineralization for the Nkran deposit is presented in Figure 14-58.

NI 43-101 Technical Report for the Asanko Gold Mine, Ashanti Region, Ghana
Effective Date: February 28, 2022
Page 242
Figure 14-58 Nkran Grade-Tonnage Curve - All Mineralization
Source: CSA Global, 2021
14.3.9 Factors That May Affect the Mineral Resource Estimate
Other that what is discussed in other sections of this Report there are no known environmental, permitting, legal, title, taxation, socio-economic, marketing, and political or other relevant issues that may materially affect the Mineral Resource estimates. Other relevant factors that may materially affect the Mineral Resources, include mining, metallurgical, and infrastructure are well understood according to the assumptions presented in this Report.
The current Mineral Resource estimate carries moderate uncertainty and risk. The risk is principally related to the indicator mineralization interpretation. The geological wireframes, which act as bounding volumes within which mineralization is defined by Indicator Kriging, have been modelled to have a high degree of continuity along strike. If the continuity along strike is not as great as has been modelled, there is a risk of overstatement of metal.
The choice of Indicator Kriging to generate the mineralization volumes models is dependent on the relationship/comparability between the grade control and exploration data. In some areas there are very significant differences, which if persistent with depth, will result in significant variance between predicted and actual in the ground volumes. This has the largest impact of any of the risk factors on tonnage.
It was noted during the threshold selection in 2018 that the accuracy of the exploration data in prediction of grade and mineralization volume was low in some areas when compared to the GC dataset. Additional drilling in advance of mining will be required to reduce the risk.
It is important to note that the full depth and extent of the Nkran PFS Open Pit shell is significantly influenced by a zone of high grade gold mineralization (centred on 611,815E, 700,615N and 765 Elevation) which is considered high risk Indicated. The QP for the Nkran MRE believes it is critical to conduct an infill drilling program to de-risk this high grade zone, as any changes to the gold tenor and geometry of this high grade will have a significant impact on the economics of the proposed PFS Open Pit. A sensitivity study was completed by Galiano which demonstrated the extent of this risk by delivering different pit depths and extents.

NI 43-101 Technical Report for the Asanko Gold Mine, Ashanti Region, Ghana
Effective Date: February 28, 2022
Page 243
14.4 Akwasiso Mineral Resource Estimate
The Akwasiso Mineral Resource was previously estimated and reported in 2019 by CSA Global as part of the 2020 Asanko Gold Mine NI 43-101 technical report. The Mineral Reserve, as defined by Akwasiso Cut 2 pit design based on 2019 Mineral Resource, was depleted in March 2021.
Mining at Akwasiso to 2021 demonstrated that the mineralization is still open in all directions and extends beyond the final depleted pit surface. Infill and step-out drilling program was subsequently designed and executed by Asanko Exploration team with the goal to update the geology and Mineral Resource model below the depleted pit surface. The 2021 drilling defined the boundary of the mineralization with adequate data density to define a Mineral Resource.
14.4.1 Database
The current drillhole database used to support the resource estimate now consists of 439 exploration drillholes totalling 46,232 meters and 3,320 grade control drillholes totalling 48,431 metres (Table 14-29). The cut-off date of drilling data is February 2, 2021, for exploration drillholes and December 5, 2020, for GC drillholes.
Table 14-29 Akwasiso Exploration and Grade Control Drill Holes Used In 2021 Modelling And Grade Estimation
Exploration Holes DDH RC RCD Total
Number of Holes 60 332 47 439
Metres Drilled 1,293 24,397 10,542 46,232
Grade Control Holes RC
Number of Holes 3,320
Metres Drilled 48,431
Since the resource model in 2019, an additional 30 exploration and infill holes were drilled by Asanko to upgrade the remaining Mineral Resources below Cut 2 pit design for evaluation of the economic viability of additional pushback. In addition, 178 exploration holes drilled by Resolute between 1996 and 2000 but not used in the 2019 Mineral Resource estimate were included in the current Mineral Resource drill hole database.
The exploration holes were drilled at approximate 20 to 40 metre spacing, with an average hole depth of 105 meters. GC holes were drilled at regular 10 x 5 metre spacing with an average hole depth of 15 meters. Figure 14-59 illustrates the overall coverage of the Exploration drilling.

NI 43-101 Technical Report for the Asanko Gold Mine, Ashanti Region, Ghana
Effective Date: February 28, 2022
Page 244
Figure 14-59 View of Akwasiso Exploration Drillholes
Note: 2020 November EOM Pit Topography; $1500 Pit Shell (Preliminary)
14.4.1.1 Verification of Exploration Data
Eric Chen, P.Geo., is the QP for the Akwasiso Mineral Resource estimate and has conducted data verification to assure the accuracy, completeness, and suitability of the exploration and grade control data for Mineral Resource estimation.
Extracted drillhole data were received from Asanko site in comma-delimited csv format. The QP worked closely with the site database and exploration team to conduct further data verification to ensure that data entries in all the drillhole tables were free of error and consistent before the data was accepted for resource estimation. The verification process is completed with assistance of various built-in tools in 3D geological modelling software programs or generic data processing program (such as Excel), and has included, but not limited to, checking and correcting duplicate records, drillhole interval overlap, drillhole depth mis-match, abnormal collar location, downhole surveys, erroneous assay values, etc.
Resolute drillholes were not included in 2019 resource estimation because the drill hole collar coordinates were in a mine grid different from the Asanko grid. The Asanko Mine Survey team subsequently established grid transformation parameters for 178 Resolute drillholes. The transformed Resolute drillholes were verified to have good comparison with topography and Asanko Exploration and GC drillhole intercepts of geology and mineralization. Statistical comparison with Asanko and Resolute assays within 5 metres of each other (“Twin-hole” analysis) shows a negative bias for Resolute assays relative to Asanko assays (Figure 14-60).

NI 43-101 Technical Report for the Asanko Gold Mine, Ashanti Region, Ghana
Effective Date: February 28, 2022
Page 245
Figure 14-60 Akwasiso QQ Plots of Resolute and Asanko Drillhole Assays at < 5 m Distance
14.4.1.2 Verification of Grade Control Data
“Twin-hole” analysis was conducted by pairing Akwasiso GC and Exploration RC and DDH assays at <5 metres separation distance. Figure 14-61 shows grade distributions between GC and Exploration DDH assays are similar below 2.5 g/t Au. A global statistical discrepancy is indicated between GC and Exploration RC assays, but it was not conclusive which data is biased.
Figure 14-61 Akwasiso QQ Plots of GC and Asanko Exploration Drillhole 1.5 m Composites at < 5 m Distance

NI 43-101 Technical Report for the Asanko Gold Mine, Ashanti Region, Ghana
Effective Date: February 28, 2022
Page 246
Field duplicate samples of the GC drillholes were also reviewed to assess the suitability of GC samples for resource estimation. Considerable variation of grades of duplicate sample pairs is observed, which indicates a possible precision issue in individual samples but when duplicates are grouped and statistically compared to original samples grouped in large volume, the two data set show identical statistical properties (Figure 14-62).
Figure 14-62 Akwasiso QQ Plots of GC Field Duplicate Assays vs. Original Assays
Mine lab QA/QC and performance was independently reviewed and verified by Dr. Dick Minnitt in November 2020. Duplicates, CRMs, and Blanks data supplied by the mine lab were analyzed and Dr. Minnitt concluded that there was no bias in the duplicates and overall accuracy was acceptable, consistently high standard of laboratory cleaning practice between assays, and CRMs behaved well in general. The QP has reviewed and accepted Dr. Minnitt’s conclusion.
Some discrepancy was observed between Asanko and Resolute exploration assays and between Asanko GC and Exploration drillhole assays, with Resolute and GC assays on the slightly lower side. Although the cause of these discrepancies is not fully understood at time of this writing, the QP is of the opinion that using Resolute and GC data is of low risk to Akwasiso Mineral Resource and that incorporating them in the estimation and calibrating the resource model to grade control would result in slightly conservative estimate of the grade.
14.4.2 Geological Models
The geological model for Akwasiso was interpreted and modelled by Asanko exploration team based on the exploration drilling and was constructed using Leapfrog software and includes:
1. Lithology model
2. Oxidation model
3. Shear model
4. Mineralization model

NI 43-101 Technical Report for the Asanko Gold Mine, Ashanti Region, Ghana
Effective Date: February 28, 2022
Page 247
14.4.2.1 Lithology, Oxidation and Shear/Fault Model
The various lithologies were interpreted directly from drillhole logging. A series of shear surfaces and two bounding shears were modelled and used as guides or constraints in modelling of the mineralization. Simple weathering surfaces were constructed from the exploration drillhole logging for the bases of complete oxidation and the top of fresh rock. The two surfaces divided weathering into three oxidation volumes: Oxide (strongly to moderately oxidized), Transitional (weakly oxidized) and Fresh (fresh rock) material types. The oxidation model represents different levels of weathering for material type categorization and density modelling purpose Lithology, shears, and weathering models are shown in Figure 14-63 and Figure 14-64 and are summarized in Table 14-30.
Figure 14-63 Plan and Sectional View of Akwasiso Lithology, Shear and Oxidation Model
Figure 14-64 Sectional View of Akwasiso Oxidation Model
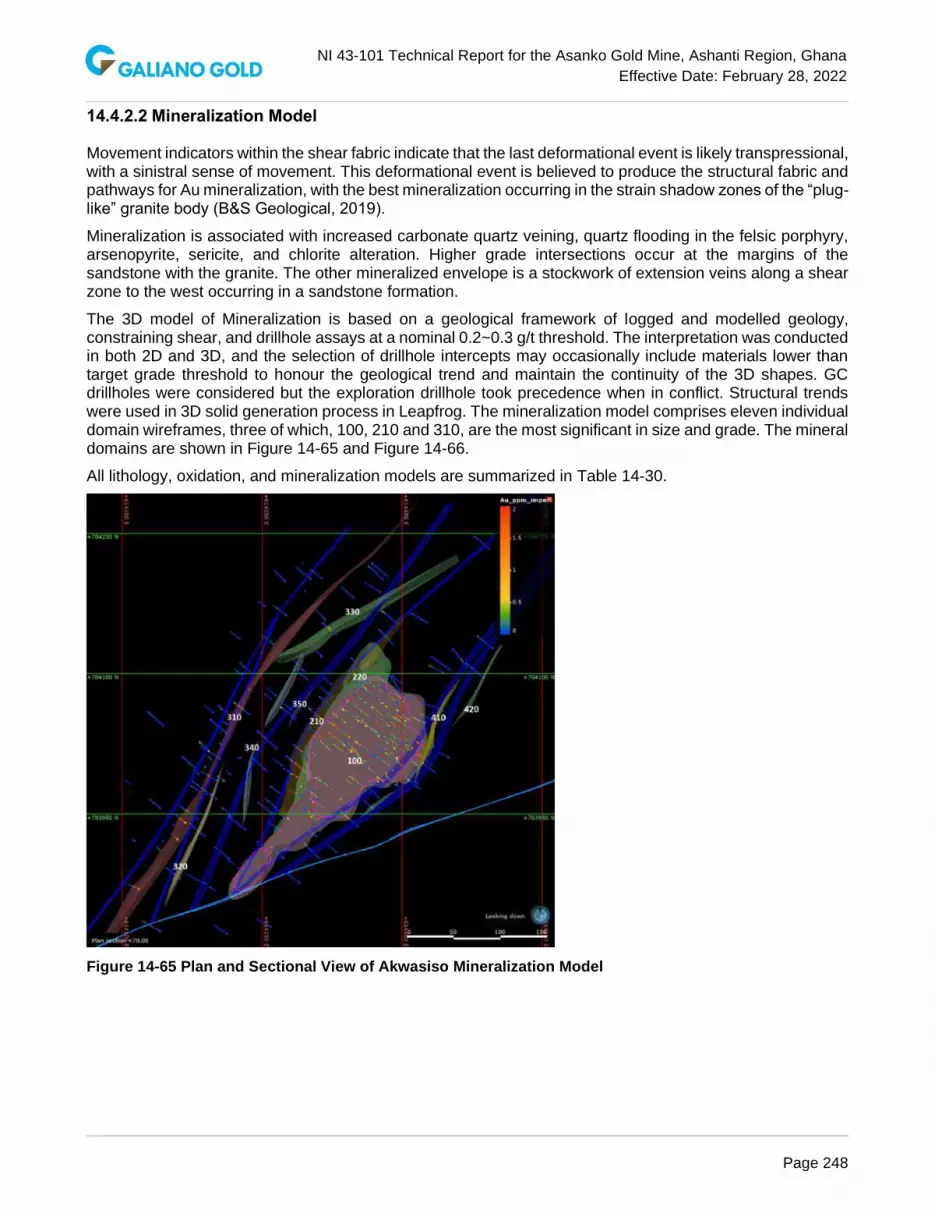
NI 43-101 Technical Report for the Asanko Gold Mine, Ashanti Region, Ghana
Effective Date: February 28, 2022
Page 248
14.4.2.2 Mineralization Model
Movement indicators within the shear fabric indicate that the last deformational event is likely transpressional, with a sinistral sense of movement. This deformational event is believed to produce the structural fabric and pathways for Au mineralization, with the best mineralization occurring in the strain shadow zones of the “plug-like” granite body (B&S Geological, 2019).
Mineralization is associated with increased carbonate quartz veining, quartz flooding in the felsic porphyry, arsenopyrite, sericite, and chlorite alteration. Higher grade intersections occur at the margins of the sandstone with the granite. The other mineralized envelope is a stockwork of extension veins along a shear zone to the west occurring in a sandstone formation.
The 3D model of Mineralization is based on a geological framework of logged and modelled geology, constraining shear, and drillhole assays at a nominal 0.2~0.3 g/t threshold. The interpretation was conducted in both 2D and 3D, and the selection of drillhole intercepts may occasionally include materials lower than target grade threshold to honour the geological trend and maintain the continuity of the 3D shapes. GC drillholes were considered but the exploration drillhole took precedence when in conflict. Structural trends were used in 3D solid generation process in Leapfrog. The mineralization model comprises eleven individual domain wireframes, three of which, 100, 210 and 310, are the most significant in size and grade. The mineral domains are shown in Figure 14-65 and Figure 14-66.
All lithology, oxidation, and mineralization models are summarized in Table 14-30.
Figure 14-65 Plan and Sectional View of Akwasiso Mineralization Model

NI 43-101 Technical Report for the Asanko Gold Mine, Ashanti Region, Ghana
Effective Date: February 28, 2022
Page 249
Figure 14-66 Sectional View of Akwasiso Mineralization Model
Table 14-30 List of Akwasiso Geological Models and Codes
Model Type Model Name Code Original File Name Effective Date
Lithology Central Sandstone 22 Litho_Model_2020 - Central_SS1.dxf 2020-09-25
Lithology Central Shale 3 31 Litho_Model_2020 - Central_Shale3.dxf 2020-09-25
Lithology Eastern Sandstone 1 23 Litho_Model_2020 - Eastern_SS1.dxf 2020-09-25
Lithology Eastern Sandstone 2 24 Litho_Model_2020 - East_SS2.dxf 2020-09-25
Lithology Granite 11 Litho_Model_2020 - Granite.dxf 2020-09-25
Lithology Skinny Granite 12 Litho_Model_2020 - Skinny_Granite.dxf 2020-09-25
Lithology Western Sandstone 21 Litho_Model_2020 - Western_SS1.dxf 2020-09-25
Lithology Background Sediments 90 materials outside litho model and under topo 2020-09-25
Oxidation Fresh 4 FRESHtr.dm 2020-02-24
Oxidation Transitional 3 TRANStr.dm 2020-02-24
Oxidation Oxide 2 OXtr.dm 2020-02-24
Mineralization West Domain 1 310 SIM_DOMs02_wss01.00t 2020-12-12
Mineralization West Domain 2 320 SIM_DOMs02_wss02.00t 2020-12-12
Mineralization West Domain 3 330 SIM_DOMs02_wss03a.00t 2020-12-12
Mineralization West Domain 4 340 SIM_DOMs02_wss03b.00t 2020-12-12
Mineralization West Domain 5 350 SIM_DOMs02_wss04.00t 2020-12-12
Mineralization Granite Domain 100 SIM_DOMs_Sim_GR.00t 2020-12-15
Mineralization Central Domain 1 210 SIM_DOMs_Sim_Sed01.00t 2020-12-15
Mineralization Central Domain 2 220 SIM_DOMs_Sim_Sed02.00t 2020-12-15
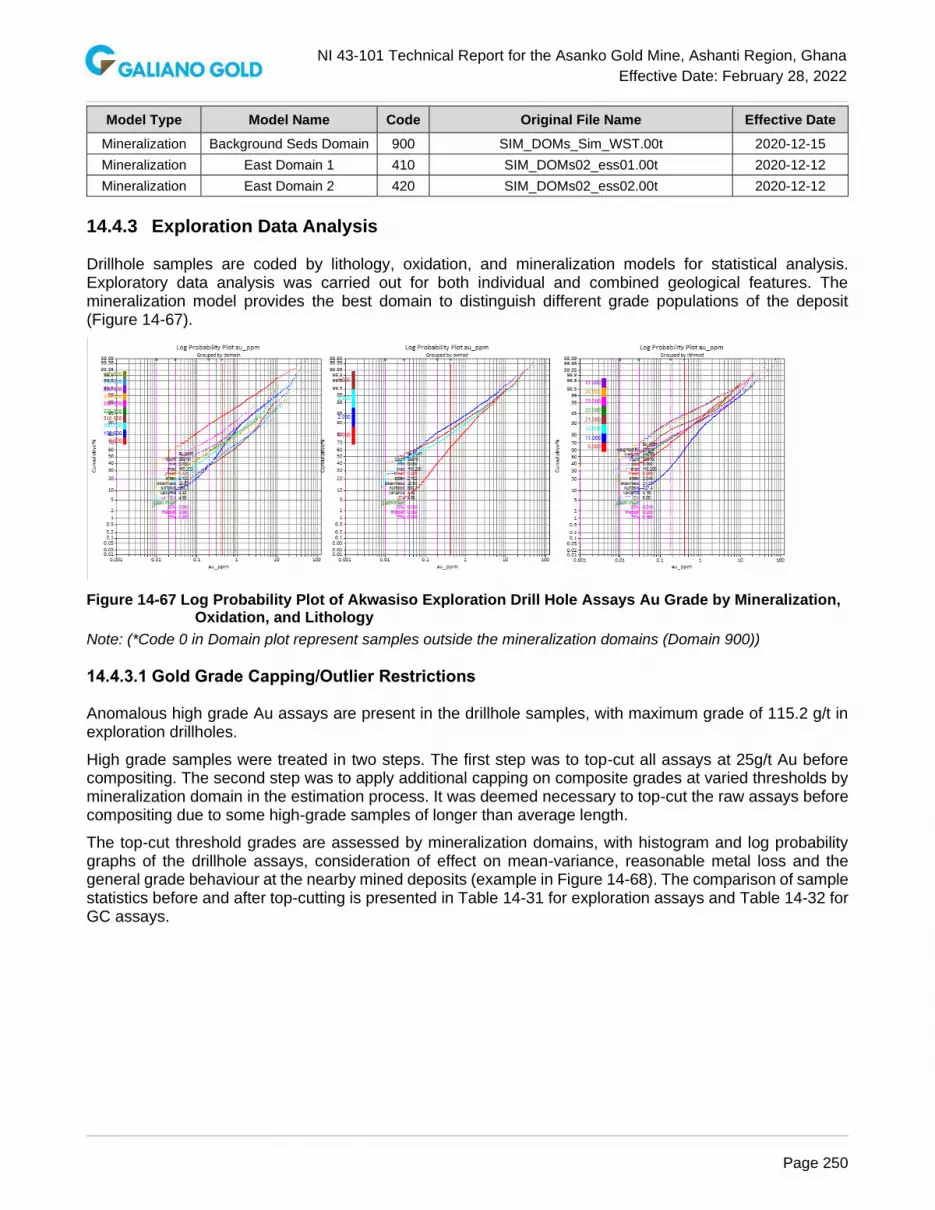
NI 43-101 Technical Report for the Asanko Gold Mine, Ashanti Region, Ghana
Effective Date: February 28, 2022
Page 250
Model Type Model Name Code Original File Name Effective Date
Mineralization Background Seds Domain 900 SIM_DOMs_Sim_WST.00t 2020-12-15
Mineralization East Domain 1 410 SIM_DOMs02_ess01.00t 2020-12-12
Mineralization East Domain 2 420 SIM_DOMs02_ess02.00t 2020-12-12
14.4.3 Exploration Data Analysis
Drillhole samples are coded by lithology, oxidation, and mineralization models for statistical analysis. Exploratory data analysis was carried out for both individual and combined geological features. The mineralization model provides the best domain to distinguish different grade populations of the deposit (Figure 14-67).
Figure 14-67 Log Probability Plot of Akwasiso Exploration Drill Hole Assays Au Grade by Mineralization, Oxidation, and Lithology
Note: (*Code 0 in Domain plot represent samples outside the mineralization domains (Domain 900))
14.4.3.1 Gold Grade Capping/Outlier Restrictions
Anomalous high grade Au assays are present in the drillhole samples, with maximum grade of 115.2 g/t in exploration drillholes.
High grade samples were treated in two steps. The first step was to top-cut all assays at 25g/t Au before compositing. The second step was to apply additional capping on composite grades at varied thresholds by mineralization domain in the estimation process. It was deemed necessary to top-cut the raw assays before compositing due to some high-grade samples of longer than average length.
The top-cut threshold grades are assessed by mineralization domains, with histogram and log probability graphs of the drillhole assays, consideration of effect on mean-variance, reasonable metal loss and the general grade behaviour at the nearby mined deposits (example in Figure 14-68). The comparison of sample statistics before and after top-cutting is presented in Table 14-31 for exploration assays and Table 14-32 for GC assays.

NI 43-101 Technical Report for the Asanko Gold Mine, Ashanti Region, Ghana
Effective Date: February 28, 2022
Page 251
Figure 14-68 Assays Log Probability Plots of Exploration Drill Holes by Domain

NI 43-101 Technical Report for the Asanko Gold Mine, Ashanti Region, Ghana
Effective Date: February 28, 2022
Page 252
Table 14-31 Akwasiso Summary Statistics of Mineralization Domain Raw and 25 g/t Au Top-Cut Assays of Exploration Drill Holes
AU_PPM AUCUT25 AUCUT25
Domain Count Mean CV Max Top-cut
(g/t) Au # Cut Mean CV Max
Metal loss
100 10,283 0.86 3.1 115.2 25 16 0.83 2.53 25 -3%
210 1,536 1.49 3.63 93.08 25 14 1.28 2.72 25 -14%
220 620 0.2 3.55 11.3 25 0 0.2 3.55 11.3 0%
310 1340 1.72 2.45 75.45 25 4 1.6 1.71 25 -7%
320 119 2.43 2.15 37.76 25 1 2.32 1.98 25 -4%
330 89 0.6 1.51 4.39 25 0 0.6 1.51 4.39 0%
340 169 0.48 3.63 17 25 0 0.48 3.63 17 0%
350 261 0.68 3.8 38.31 25 1 0.63 3.13 25 -6%
410 80 2.33 2.07 24.88 25 0 2.33 2.07 24.88 0%
420 191 0.83 2.24 14.64 25 0 0.83 2.24 14.64 0%
900 23152 0.09 11.45 82.2 25 5 0.08 7.87 25 -7%
Note: AU_PPM – raw assays; AUCUT25 – top-cut assays
Table 14-32 Akwasiso Summary Statistics of Mineralization Domain Raw and 25 g/t Au Top-Cut Assays of Grade Control Drill Holes
AU_PPM AUCUT25
Domain Count Mean CV Max Top-cut
(g/t) Au # Cut Mean CV Max
Metal loss
100 18,785 0.97 2.95 183.2 25 28 0.94 2.37 25 -2%
210 2,479 0.88 3.99 136 25 3 0.83 2.65 25 -6%
220 1225 0.39 3.02 18.48 25 0 0.39 3.02 18.48 0%
310 2521 1.45 1.97 68.4 25 4 1.42 1.7 25 -2%
320 609 1.67 2.61 37.76 25 3 1.63 2.51 25 -2%
330 0 0 - - 25 0 0 - - -
340 317 0.3 3.93 17.44 25 0 0.3 3.93 17.44 0%
350 294 0.41 3.09 15.96 25 0 0.41 3.09 15.96 0%
410 287 1.62 2.71 59.72 25 1 1.5 2.04 25 -7%
420 303 0.84 3.15 38.84 25 1 0.8 2.58 25 -5%
900 19995 0.19 11.36 204.8 25 8 0.17 6.14 25 -10%
Note: AU_PPM – raw assays; AUCUT25 – top-cut assays
14.4.3.2 Composites
The dominant sample length is 1.0 metre for exploration drillhole samples and 1.5 meters for GC hole samples. There is no obvious trend of grade distribution by the length of the samples.

NI 43-101 Technical Report for the Asanko Gold Mine, Ashanti Region, Ghana
Effective Date: February 28, 2022
Page 253
The exploration and GC drillhole samples are composited from collar to toe at 1.5 metre equal length intervals for uniform support. Residual of less than half of the composite length are added to the last full composite. Drillhole traces without sample or missing assays are ignored. The composites are coded by the mineralization domain wireframes (majority rule). Assays are top cut prior to compositing. Composite grade was calculated from top-cut assays (AUCUT25), and further capped by the varied thresholds by mineralization domain (Table 14-33). Composite capping thresholds were evaluated using the same method as used for assays capping (example in Figure 14-69).
Figure 14-69 Log Probability Plot of Akwasiso Exploration Drill Hole 1.5 m Composite Au Grade by Mineralization Domain

NI 43-101 Technical Report for the Asanko Gold Mine, Ashanti Region, Ghana
Effective Date: February 28, 2022
Page 254
Table 14-33 Akwasiso Composite Au Statistics of Exploration and GC Drillholes
AUCAP EXP 1.5m Composite AUCAP GC 1.5m Composite
Domain Count Mean CV Max Count Mean CV Max
100 7,024 0.81 2.03 25 18,785 0.94 2.37 25
210 1,054 1.25 2.24 25 2,479 0.83 2.65 25
220 434 0.23 2.86 6.42 1,225 0.38 2.71 10
310 909 1.56 1.4 16.82 2,495 1.55 1.61 25
320 82 2.16 1.64 16.71 542 2.18 2.11 25
330 60 0.58 1.34 3.34 0 0 - -
340 152 0.41 2.61 6.5 317 0.28 3.17 10
350 220 0.54 2.21 10 294 0.39 2.68 10
410 55 1.97 1.82 15 287 1.44 1.88 15
420 141 0.73 1.92 9.76 303 0.75 2.14 10
900 17,836 0.08 6.26 21.67 20,088 0.14 6.45 25
Note: (the “majority” rule of composite domain coding may result in the mean of small zones not consistent with raw assays)
14.4.3.3 Boundary Analysis
The boundary condition between the mineralization domains and between oxidation domains was assessed through visual inspections and contact graph analysis. The grades show sharp contact between the mineralization domain and the non-mineralized background. Between some mineralization domains that share common boundary, for example 100 – 210, the grade showed smoother transition within limited distance across the contact, while others showed abrupt change (Figure 14-70). The grades did not show distinct change across the oxidation boundaries (Figure 14-71).
Figure 14-70 Akwasiso Contact Graphs of Drillhole Assays Between Main Mineralization Domains

NI 43-101 Technical Report for the Asanko Gold Mine, Ashanti Region, Ghana
Effective Date: February 28, 2022
Page 255
Figure 14-71 Akwasiso Contact Graphs of Drillhole Assays Between Oxidation Domains
14.4.3.4 Variography
Variography was modelled for the main mineralization domains with sufficient samples, including Domain 100, 210, and 310. Correlograms were calculated and modelled with a two-structure exponential/spherical model in Vulcan software. The 1.5 composites of combined exploration and GC drillholes were used for variogram modelling. Robust variogram (correlogram) models were obtained for respective domains that matches well with the observed geology and trends of mineralization (Figure 14-72). The variogram parameters obtained from the three domains were used for other smaller domains with rotation angles adjusted to fit the respective domain (Table 14-34)
Table 14-34 Akwasiso Domain 100, 210, 310 Composite Au Variogram (Correlogram) Parameters
Domain
Type
Sill
Rotation Angles (Vulcan) Ranges (m)
Azimuth Plunge Dip Major Semi Minor
100
Nugget 0.4 - - - - - -
Exponential 0.576 169.107 48.59 41 12 15 8
Spherical 0.024 169.107 48.59 41 81 65 15
210*
Nugget 0.4 - - - - - -
Exponential 0.282 30 0 -60 10.277 21.473 5
Spherical 0.318 30 0 -60 25 10.658 5
310**
Nugget 0.3 - - - - - -
Exponential 0.491 30 0 -75 10 22 3
Spherical 0.209 30 0 -75 32 4 3
Note: * used for domain 220; ** used for 320, 330, 340, 350, 410, 420 (rotation angles adjusted to fit)

NI 43-101 Technical Report for the Asanko Gold Mine, Ashanti Region, Ghana
Effective Date: February 28, 2022
Page 256
Figure 14-72 3D Visualization of Variogram Ellipses for Akwasiso Domain 100, 210, 310
14.4.4 Estimation/Interpolation Methods
14.4.4.1 Block Model Setup
A block model was constructed in Vulcan software. The model covers the full extent of geology and mineralization models and provides adequate extent to allow pit optimization process. The block size of 5 x 5 x 6 metres was selected. The block size in Z direction was the mining bench height at Akwasiso. The block model setup dimensions are presented in Table 14-35.
Table 14-35 Akwasiso 2021 Resource Model Setup
Origin Minimum Maximum Extent (m) Block Size (m) # Blocks
Easting 613,820 613,820 614,660 840 5 168
Northing 703,700 703,700 704,420 720 5 144
Elevation -146 -146 202 348 6 58
The block model was coded with the geological model wireframes by majority rule as shown in Figure 14-73.

NI 43-101 Technical Report for the Asanko Gold Mine, Ashanti Region, Ghana
Effective Date: February 28, 2022
Page 257
Figure 14-73 Akwasiso Block Assignment of Domain Codes
14.4.4.2 Estimation
Ordinary Kriging (OK) was used for grade estimation. An independent GC model of the same block size was first created using GC data only as reference model in the mined-out area. To ensure that the resource model will reproduce the grade distribution of the reference model, multiple scenarios of estimation parameters were tested to run estimation with exploration data only (EXP Model). The parameters that produced the closest tonnage-grade curve to GC model were selected. The GC composites were then merged with the exploration composites for the final resource estimation (MRE Model) using the selected parameters. The estimation plan is presented in Table 14-36 and illustrated in Figure 14-74. The vein lode type domains used dynamic anisotropic search orientations generated from digitized vein trend surfaces.

NI 43-101 Technical Report for the Asanko Gold Mine, Ashanti Region, Ghana
Effective Date: February 28, 2022
Page 258
Table 14-36 Akwasiso Grade Estimation Parameters
Figure 14-74 Illustration of Akwasiso Search Ellipsoid (Domain 100 example)
14.4.4.3 Bulk Density
Bulk density was assigned to the block model based on a combination of lithology and oxidation. Density values were calculated from a small density data set of 48 measurements, only 12 of which are in oxide/transitional zones (Table 14-37).
Model Est. Pass Min Max Max/HoleMax per
OctMin Max Type Maj Semi Min
GC Model GC pass 6 30 5 - 2 8 gc only 15 15 7.5
1 (exp) 4 14 4 6 1 5 exp only 50 40 5
2 (exp) 4 10 4 5 1 4 exp only 75 75 10
1 4 20 4 6 2 8 exp + gc 12 12 5
2 4 14 4 6 1 5 exp + gc 50 40 5
3 4 10 4 5 1 4 exp + gc 75 75 10
EXP Model
(exploration comps only)
* GC Model used dynamic anisotropic search
MRE Model
(exploration + GC comps)
# Composites Drillholes Search Radius (m)
Domain BoundaryEstimation
MethodBearing (Z) Plunge (Y) Dip (X)
100 Firm (210) * OK 30 0 -78
210 Firm (100) * OK 30 0 -78
220 Hard OK 30 0 -78
310 Hard OK
320 Hard OK
330 Hard OK
340 Hard OK
350 Hard OK
410 Hard OK
420 Hard OK
900 Hard ID2 30 0 -78
* Firm boundary allows sharing comps to max of 15m distance
** GC model allows sharing 100, 210, 220 comps to max of 15m distance
Dynamic Anisotropy
Dynamic Anisotropy
Dynamic Anisotropy
Dynamic Anisotropy
Dynamic Anisotropy
Search Ellipsoid (Vulcan)
Dynamic Anisotropy
Dynamic Anisotropy

NI 43-101 Technical Report for the Asanko Gold Mine, Ashanti Region, Ghana
Effective Date: February 28, 2022
Page 259
Table 14-37 Akwasiso Bulk Density Values Assigned to Resource Block Model (by Material Type)
Material Type Bulk Density (t/m3)
Oxide 1.7
Transitional 2.3
Fresh - Granite 2.7
Fresh - Sediments 2.7
14.4.5 Validation
The Akwasiso resource model was calibrated to reference model (GC Model) in the mined-out area. The tonnage-grade comparison of the exploration model (EXP Model) and GC Model is presented in Figure 14-75. The resource model was also validated through cross-checking with an independent conditional simulation model produced by Gold Fields in September 2020. The two models compared well in the common volume between the as-mined topo surface and $1600 resource pit shell (Table 14-38).
Figure 14-75 Akwasiso Tonnage-Grade Comparison of EXP Model and GC Model in Mined-out Area
Table 14-38 Comparison of Akwasiso Resource Model with Simulation Model (Between June 30 2021 Topography and $1600 Resource Pit Shell)
Tonnes Au (g/t) Ounces Tonnes Au (g/t) Ounces
MRE Model 2,249,113 1.33 95,956 170,842 1.44 7,931
ConSim Model 1,997,748 1.50 96,472 297,061 1.56 14,928
Tonnes Au (g/t) Ounces Tonnes Au (g/t) Ounces
MRE Model 1,491,154 1.68 80,446 127,607 1.72 7,044
ConSim Model 1,504,739 1.78 86,210 239,719 1.78 13,726
(* ConSim Model: "ak_2008b_eng.dm" created by Gold Fields, September 2020)
COG = 0.5Indicated Inferred
COG = 0.8Indicated Inferred

NI 43-101 Technical Report for the Asanko Gold Mine, Ashanti Region, Ghana
Effective Date: February 28, 2022
Page 260
14.4.5.1 Swath Plots and Global Statistical Comparisons
Statistical comparison of the model and input data was also conducted to ensure global and local unbiasedness. Swath plots were created by comparing the model block grades and input in spatial increments in northing, easting, and elevation slices throughout the deposit Figure 14-76.
The plots show that block grades (Indicated) are smoother and follow the trend of input composite grades, which is the expected result of estimation, with block grades showing lower overall variance. The global mean of the model Au grade also compared well with composite Au grade.
Figure 14-76 Akwasiso Swath Plot by Northing and Elevation for Block and Composite Au (g/t) of Main Domains
14.4.5.2 Visual Inspection
The block model was visually reviewed in 2D in sections and level plans, and in 3D to ensure the block estimates are supported by the surrounding composites. In general, the estimates compare well with the input data.

NI 43-101 Technical Report for the Asanko Gold Mine, Ashanti Region, Ghana
Effective Date: February 28, 2022
Page 261
14.4.6 Classification of Mineral Resources
Akwasiso deposit shares the common geological features as other well studied deposits on the Nkran structural trend.
Drill spacing is the primary factor to define resource classification and only Indicated and Inferred resources are defined at Akwasiso. The spacing criteria at to separate the resource classes at Akwasiso are based on the variogram ranges and experiences of mining at adjacent Nkran deposit.
Nominal drill spacing is determined with a widely accepted mathematic approximation based on calculated average distance of the closest three drillholes to the block. The classification criteria are summarized in Table 14-39.
Table 14-39 Akwasiso 2021 Resource Classification Criteria
Classification Category
Drill Spacing (m) 3-Hole Average
Distance (m)
Measured (1) No Measured classification defined -
Indicated (2) 40 x 40 (m) drill spacing <= 28
Inferred (3) 80 x 80 (metre) drill spacing, or nearest DH < 40 metre distance <= 56
Drilling coverage at Akwasiso was relatively high. Although a block can be classified as Indicated if drillhole spacing was equal or closer than 40 metres, 50% of the Indicated materials were covered by 20 metre or closer drillhole spacing (Table 14-40). Block classification is shown in Figure 14-77.
Table 14-40 Akwasiso 2021 Resource Drillhole Coverage Summary
Class Spacing Tonnes Au Oz
Indicated
<20 metre spacing 48% 50%
20 - 30 metre spacing 38% 36%
30 - 40 metre spacing 14% 14%
Inferred
>60 metre spacing 6% 9%
30 - 40 metre spacing 4% 3%
40 - 60 metre spacing 90% 88%
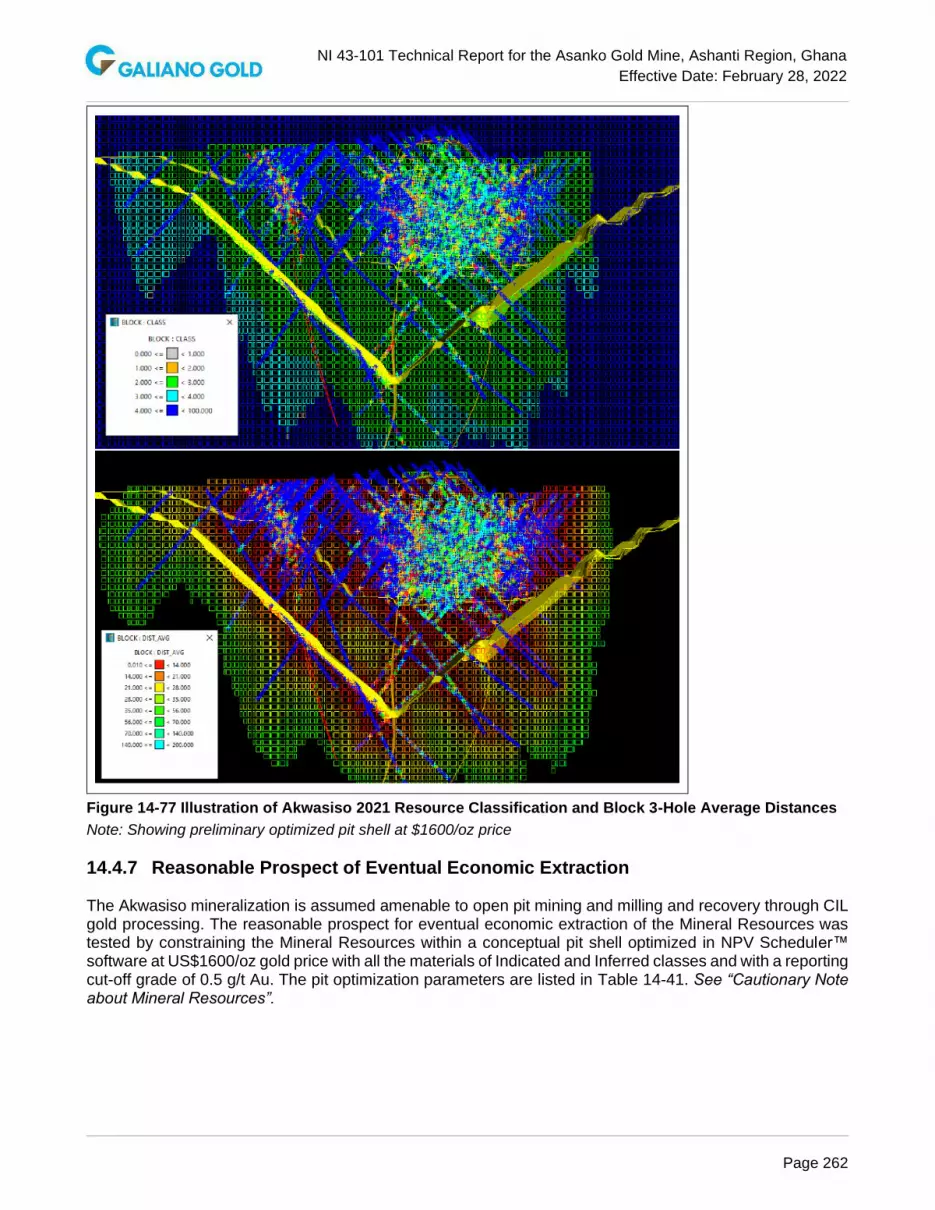
NI 43-101 Technical Report for the Asanko Gold Mine, Ashanti Region, Ghana
Effective Date: February 28, 2022
Page 262
Figure 14-77 Illustration of Akwasiso 2021 Resource Classification and Block 3-Hole Average Distances
Note: Showing preliminary optimized pit shell at $1600/oz price
14.4.7 Reasonable Prospect of Eventual Economic Extraction
The Akwasiso mineralization is assumed amenable to open pit mining and milling and recovery through CIL gold processing. The reasonable prospect for eventual economic extraction of the Mineral Resources was tested by constraining the Mineral Resources within a conceptual pit shell optimized in NPV Scheduler™ software at US$1600/oz gold price with all the materials of Indicated and Inferred classes and with a reporting cut-off grade of 0.5 g/t Au. The pit optimization parameters are listed in Table 14-41. See “Cautionary Note about Mineral Resources”.

NI 43-101 Technical Report for the Asanko Gold Mine, Ashanti Region, Ghana
Effective Date: February 28, 2022
Page 263
Table 14-41 Akwasiso Conceptual Constraining Pit Parameters
Parameter Value
Gold Price (US$/ounce) 1,600
Mining Cost (US$/tonne) 1.004 - 1.571
Mining Cost Incremental (US$/Vertical 6m) 0.0043 – 0.0146
Mill Feed Transport (US$/tonne) 2.14
Process Cost (US$/tonne) 8.79 – 11.32
Gold Recovery (%) 94%
General and Administration (US$/tonne) 6.55
14.4.8 Mineral Resource Statement
The Akwasiso Mineral Resource estimate is reported in accordance with the CIM Definition Standards for Mineral Resources & Mineral Reserves, adopted by CIM Council May 10, 2014.
The Qualified Person is Eric Chen, P.Geo. who is Galiano Gold’s former Vice President of Technical Services. The effective date is February 28, 2022. The Mineral Resource estimate is reported assuming open pit mining and milling and CIL gold processing methods using a cut-off grade of 0.5 g/t Au, is constrained within a conceptual open pit prepared using NPV Scheduler™ software. The Mineral Resource estimates are summarized in Table 14-42. The estimated grades and tonnages for multiple cut-offs are shown in Figure 14-78.
Table 14-42 Akwasiso Mineral Resource Estimate at a 0.5 g/t Au cut-off and $1,600/oz Au, as of February 28, 2022
Category
Cutoff Grade
(g/t Au) Tonnes (kt) Au (g/t)
Au Metal Contained
(koz)
Measured na na na
Indicated 0.5 1,655 1.31 69
Measured & Indicated 0.5 1,655 1.31 69
Inferred 0.5 158 1.46 7
Notes: 1. The Mineral Resource estimates are reported in accordance with the CIM Definition Standards for
Mineral Resources & Mineral Reserves, adopted by CIM Council May 10, 2014. 2. The effective date for the Mineral Resource estimates is February 28, 2022 3. Mineral Resource estimates account for mining depletion as of February 28, 2022 4. Reasonable Prospects for eventual economic extraction assume open pit mining with conventional gold
processing and was tested using NPV Scheduler™ pit optimization software using several technical parameters including:
a. $1,600/oz Au price b. $1.004/t to $1.571/t mining costs c. $2.14/t mill feed transport costs d. $8.79/t to $11.32/t processing costs e. 94% Au recovery for all material f. $6.55/t G&A
5. Applicable rounding has been applied to the stated tonnages, grades, and metal content to reflect the level of accuracy and precision of the estimate

NI 43-101 Technical Report for the Asanko Gold Mine, Ashanti Region, Ghana
Effective Date: February 28, 2022
Page 264
Figure 14-78 Akwasiso Tonnage - Grade Curve for Indicated Mineral Resources
14.4.9 Factors That May Affect the Mineral Resource Estimate
Other than as discussed in other sections of this report there are no known environmental, permitting, legal, title, taxation, socio-economic, marketing, and political or other relevant issues that may materially affect the Mineral Resource estimates. Other relevant factors that may materially affect the Mineral Resources, including mining, metallurgical recovery, and infrastructure are reasonably well understood according to the assumptions presented in this Report.
The current Mineral Resource estimate carries moderate uncertainty and risk. The risk is mainly related to the statistical gaps between the exploration and GC assays as discussed in the previous sections. Even though the resource model was calibrated with GC model, and the GC samples, which are on the lower side of the comparison, were used in estimation, the predicted tonnage and grade in areas beyond the influence of GC data may be different from what the future GC may define. Reconciliation shall be closely monitored and further studies on GC sampling, assaying, etc. in order to fully understand the discrepancy between exploration and GC assays shall continue.
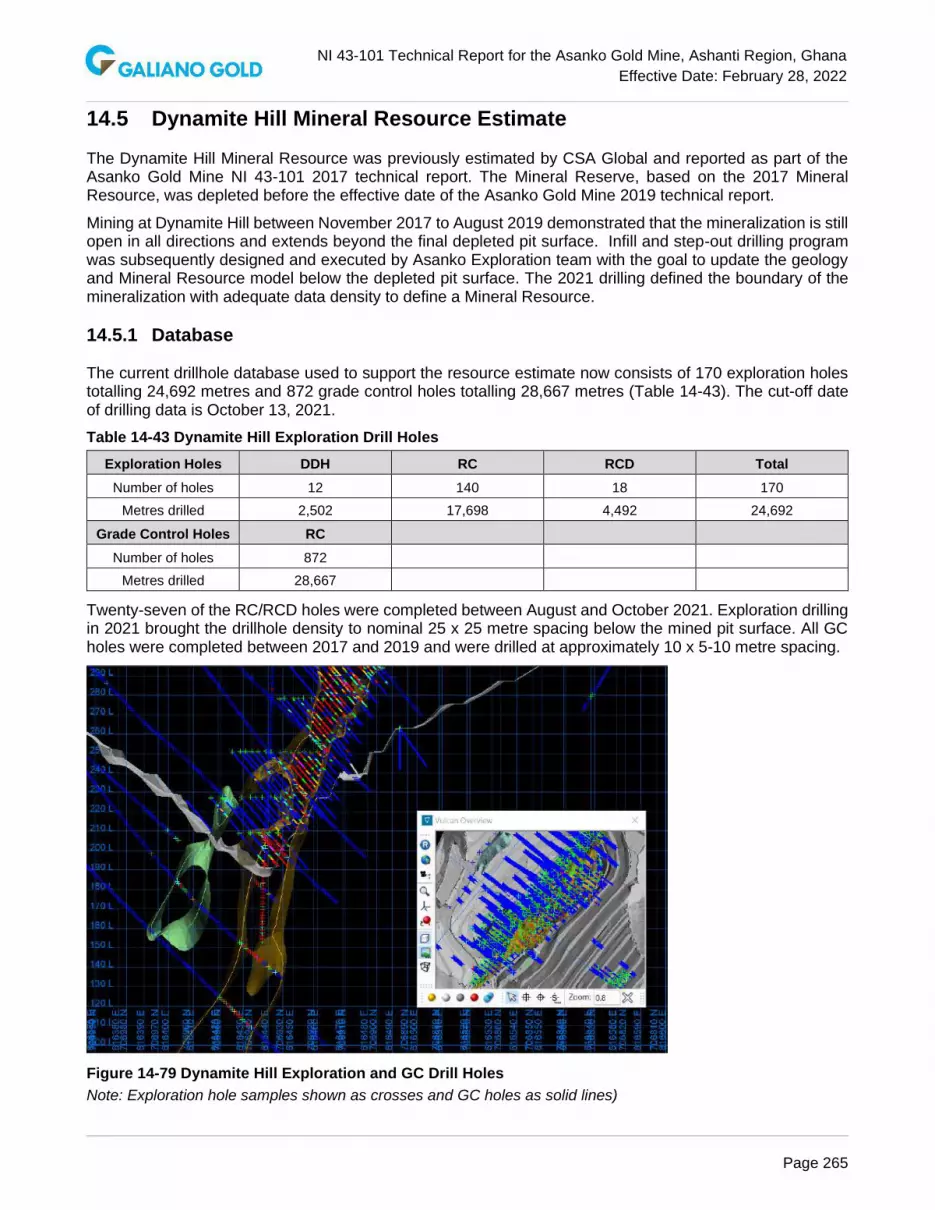
NI 43-101 Technical Report for the Asanko Gold Mine, Ashanti Region, Ghana
Effective Date: February 28, 2022
Page 265
14.5 Dynamite Hill Mineral Resource Estimate
The Dynamite Hill Mineral Resource was previously estimated by CSA Global and reported as part of the Asanko Gold Mine NI 43-101 2017 technical report. The Mineral Reserve, based on the 2017 Mineral Resource, was depleted before the effective date of the Asanko Gold Mine 2019 technical report.
Mining at Dynamite Hill between November 2017 to August 2019 demonstrated that the mineralization is still open in all directions and extends beyond the final depleted pit surface. Infill and step-out drilling program was subsequently designed and executed by Asanko Exploration team with the goal to update the geology and Mineral Resource model below the depleted pit surface. The 2021 drilling defined the boundary of the mineralization with adequate data density to define a Mineral Resource.
14.5.1 Database
The current drillhole database used to support the resource estimate now consists of 170 exploration holes totalling 24,692 metres and 872 grade control holes totalling 28,667 metres (Table 14-43). The cut-off date of drilling data is October 13, 2021.
Table 14-43 Dynamite Hill Exploration Drill Holes
Exploration Holes DDH RC RCD Total
Number of holes 12 140 18 170
Metres drilled 2,502 17,698 4,492 24,692
Grade Control Holes RC
Number of holes 872
Metres drilled 28,667
Twenty-seven of the RC/RCD holes were completed between August and October 2021. Exploration drilling in 2021 brought the drillhole density to nominal 25 x 25 metre spacing below the mined pit surface. All GC holes were completed between 2017 and 2019 and were drilled at approximately 10 x 5-10 metre spacing.
Figure 14-79 Dynamite Hill Exploration and GC Drill Holes
Note: Exploration hole samples shown as crosses and GC holes as solid lines)

NI 43-101 Technical Report for the Asanko Gold Mine, Ashanti Region, Ghana
Effective Date: February 28, 2022
Page 266
All drilling methods, sample collection methods and data quality processes and results are described in the relevant sections of this report.
14.5.1.1 Verification of Exploration Data
Eric Chen, P.Geo., is the QP for the Dynamite Hill Mineral Resource estimate and has conducted data verification to assure the accuracy, completeness, and suitability of the exploration and grade control data for Mineral Resource estimation.
Extracted drillhole data were received from Asanko site in comma-delimited csv format. The QP worked closely with the site database and exploration team to conduct further data verification to ensure that data entries in all the drillhole tables were free of error and consistent before the data was accepted for resource estimation. The verification process is completed with assistance of various built-in tools in 3D geological modelling software programs or generic data processing program (such as Excel), and has included, but not limited to, checking and correcting duplicate records, drillhole interval overlap, drillhole depth mis-match, abnormal collar location, downhole surveys, erroneous assay values, etc. Verification of Grade Control data was conducted in the same manner as exploration data.
14.5.2 Geological Models
The geological model was interpreted and modelled by Asanko exploration team with incorporation of 2017-2019 grade control drilling and new 2021 exploration drilling. The geological model was constructed using Leapfrog Geo software and includes:
1. Lithology model (LITHO)
2. Oxidation model (OX)
3. Mineralization model (DOMAIN)
14.5.2.1 Lithology and Oxidation Models
The Dynamite Hill area is underlain by fine to medium-grained greywackes (intermittent strong alterations) intercalated with argillites (phyllites), and intrusions of altered felsic rock (feldspar quartz porphyry/granitoid), quartz veins, and stockworks. Mineralization is hosted within veins and disseminations in and around a granitic intrusive located on the Nkran shear trend.
The lithology is generalized into a granite and a sedimentary rock model. The sedimentary rock model is treated as background rock mass.
The oxidation model represents different levels of weathering and is used for material-type categorization and density modelling purposes. Simple weathering surfaces are constructed for the base of complete oxidation (BOCO) and the top of fresh rock (TOFR). The two surfaces divided weathering into Oxide (strongly to moderately oxidized), Transitional (weakly oxidized) and Fresh (fresh rock) material types. Oxidation boundaries are based on drill core logging; Away from the drilling the thickness of weathering was maintained parallel to topography. The lithology and oxidation models are shown in Figure 14-80.

NI 43-101 Technical Report for the Asanko Gold Mine, Ashanti Region, Ghana
Effective Date: February 28, 2022
Page 267
Figure 14-80 Dynamite Hill Lithology and Oxidation Model (Inclined Long Sectional View of Granite Model)
14.5.2.2 Mineralization Model
Gold Mineralization is mostly associated with quartz stockwork hosted within the northwest steeply dipping orebody of strongly altered (chloritic, sericitic, and silicified) wackes, and at the contact between felsic intrusive (granite) and foliated meta-sedimentary rocks.
Modelled 3D granite, logged drillhole lithology, grade control and exploration assays are used to guide the interpretation of three gold mineralization zones at approximate 0.2~0.3 g/t.
The main zone is a single solid body hosted within and around the granite intrusive and contains most of the gold in the Dynamite Hill deposit. Two smaller zones are in the hanging wall above the main zone, and all of them are sub-parallel to the main regional northeast trending northwest steeply dipping structure. The gold mineralized zones are shown in Figure 14-81 and Figure 14-82.
All lithology, oxidation, and mineralization models are summarized in Table 14-44.

NI 43-101 Technical Report for the Asanko Gold Mine, Ashanti Region, Ghana
Effective Date: February 28, 2022
Page 268
Figure 14-81 Sectional View of Dynamite Hill Mineralization Model
Figure 14-82 Long Sectional View of Dynamite Hill Main Mineralization Model
Note: * Main Zone shown as solid in light red colour

NI 43-101 Technical Report for the Asanko Gold Mine, Ashanti Region, Ghana
Effective Date: February 28, 2022
Page 269
Table 14-44 List of Dynamite Hill Geological Models and Codes
Model Type Model Name Code Original File Name Effective Date
Mineralization Main Zone 10 Minzone_1_v041121.00t 2021-11-04
Mineralization Minzone01 11 Minzone_2_v041121.00t 2021-11-04
Mineralization Minzone02 12 Minzone_3_v041121.00t 2021-11-04
Mineralization Background Zone 9 BackgroundZone.00t 2021-11-04
Lithology Granite 1 gran1_v281021.00t 2021-10-28
Lithology Granite 1 gran2_v281021.00t 2021-10-28
Lithology Granite 1 gran3_v281021.00t 2021-10-28
Lithology Sediments 0 BackgroundZone.00t 2021-11-04
Oxidation Oxide 1 OX Contacts_v041121.00t (ox-tr contact) 2021-11-04
Oxidation Transitional 2 OX Contacts_v041121.00t (ox-tr contact) 2021-11-04
Oxidation Fresh 3 FR Contacts_v041121.00t (tr-fr contact) 2021-11-04
14.5.3 Exploration Data Analysis
Drillhole samples are coded by lithology, oxidation, and mineralization models for statistical analysis. Exploratory data analysis was carried out for both individual and combined geological features.
The probability plots shown in Figure 14-83 show the mineralization model provides the best domain to distinguish different grade populations of the deposit. Different lithologies or oxidation within the same mineralization domain do not show significant statistical differences.
Figure 14-83 Log Probability Plot of Dynamite Hill Exploration Drill Hole Assays Au Grade by Mineralization, Oxidation, and Lithology Model
Note: (*in lithmod figure, code 1 is granite and code 2 is sediments)
Mineralization
Oxidation
Lithology

NI 43-101 Technical Report for the Asanko Gold Mine, Ashanti Region, Ghana
Effective Date: February 28, 2022
Page 270
14.5.3.1 Gold Grade Capping/Outlier Restrictions
Anomalous high grade Au assays are present in the drillhole samples, with maximum grade of 107.28 g/t Au in exploration drillholes and 632 g/t Au in grade control drillholes.
Top-cutting threshold grades are assessed by mineralization domains with histogram and log probability (disintegration) graphs of the drillhole assays (Figure 14-84), with consideration of reasonable metal loss and the general grade behaviour at the nearby mined deposits. Assays higher than the threshold grades are capped to the respective threshold grades for each domain. The comparison of sample statistics before and after top-cutting is presented in Table 14-45 for exploration assays and Table 14-46 for GC assays.
Figure 14-84 Dynamite Hill Top-cut Analysis of Exploration Drill Holes Au Assays
Table 14-45 Summary Statistics of Dynamite Hill Mineralization Domain Raw and Top-Cut Assays of Exploration Drill Holes
Sample Assays AU Grade (g/t) Top-cut Assays AUCUT (g/t)
Domain Count Mean CV Maximum Top-cut (g/t) Au
# Samples
Cut Mean CV Maximum
Metal loss
9 19,821 0.04 6.13 21.04 3 18 0.04 3.71 3 7%
10 3,130 1.57 2.9 107.28 30 10 1.47 2.13 30 7%
11 185 0.74 2.04 12.37 4 7 0.62 1.54 4 16%
12 383 0.46 1.54 7.89 3 6 0.44 1.32 3 4%

NI 43-101 Technical Report for the Asanko Gold Mine, Ashanti Region, Ghana
Effective Date: February 28, 2022
Page 271
Table 14-46 Summary Statistics of Dynamite Hill Mineralization Domain Raw and Top-Cut Assays of Grade Control Drill Holes
Sample Assays AU Grade (g/t) Top-cut Assays AUCUT (g/t)
Domain Count Mean CV Maximum Top-cut (g/t) Au
# Samples
Cut Mean CV Maximum
Metal loss
9 10,293 0.07 3.98 11.08 3 14 0.07 3.16 3 4%
10 8,368 1.72 4.79 632 30 17 1.57 1.86 30 8%
11 94 0.67 1.69 9.4 4 2 0.61 1.24 4 9%
12 0 - - - - - - - - -
14.5.3.2 Composites
The dominant sample length is 1.0 metre for exploration drill hole samples and 1.5 meters for GC drill hole samples. There is no obvious trend of grade distribution by the length of the samples.
The exploration drillhole samples are composited from collar to toe at 1.5 metre equal length intervals, to maintain the uniform support as the grade control drillhole sample length (1.5m). Residual of less than half of the composite length are added to the last full composite. The residuals are mostly present at the end of drillholes. Drillhole traces without samples or missing assays are ignored. The composites are coded by the mineralized domain wireframes (majority rule) and the statistics. Assays are top cut prior to compositing. The comparison of composite statistics before (AU_PPM) and after top cutting (AUCUT) is presented in Table 14-47.
Table 14-47 Composite Au Statistics of Dynamite Hill Exploration Drillholes
Composite_1.5m AU_PPM Composite_1.5m AUCUT
Domain Count Mean CV Max Count Mean CV Max
9 14,399 0.04 4.62 10.97 14,399 0.04 3.39 8.05
10 2,105 1.57 2.27 62.06 2,105 1.46 1.74 28.5
11 123 0.73 1.57 6.29 123 0.6 1.22 3.34
12 258 0.46 1.27 5.56 258 0.44 1.08 2.3
Note: Composite AUCUT maximum grade may be different from assays AUCUT due to independent domain coding process
14.5.3.3 Boundary Analysis
The boundary condition between the mineralization, oxidation, and lithology was assessed through visual inspections. The grades show sharp contact between the mineralization domain and the non-mineralized background. Within the mineralized domain, the grades do not show distinct change across the lithology boundaries or oxidation boundaries.
14.5.3.4 Declustering
Conditional simulation (Sequential Gaussian Simulation, or SGS) is used to model the main mineralized domain. Normal Score transformation of the Au grade is required for SGS process, which requires the de-clustered distribution of the composite Au grade for the domain to map the normal score transformation. Cell de-clustered method is used. Several de-clustering cell sizes were tested on GC samples and exploration composites separately. The final cell size of 6 x 15 x 15 metre for GC samples, and 8 x 20 x 20 metre for exploration composites was selected and applied, primarily based on the respective data spacing and review of mean vs. cell size graph (Figure 14-85). The de-clustered statistics are compared to raw composites and presented in Table 14-48.

NI 43-101 Technical Report for the Asanko Gold Mine, Ashanti Region, Ghana
Effective Date: February 28, 2022
Page 272
Figure 14-85 Cell De-clustered Dynamite Hill Exploration Drillhole Composites Au Mean vs. Cell Size (Main Zone)
Table 14-48 De-clustered and Raw Dynamite Hill Exploration Drillhole Composite Au Statistics Comparison (Main Zone)
Comp AU_PPM Comp AUCUT (decl.)
Domain Count Min Max Mean CV Count Min Max Mean CV Metal loss
Comp AU_PPM
2,105 0.005 62.06 1.57 2.27 2,105 0.005 28.53 1.41 1.75 -10%
Comp AUCUT
2,105 0.005 28.53 1.46 1.74 2,105 0.005 28.53 1.41 1.75 -3%
14.5.3.5 Variography
Closely spaced GC drill holes depict well the characteristics of short-range continuity of gold grade therefore GC data is merged with exploration composites for variography analysis. As smaller domains (11, 12) do not contain sufficient samples for reliable variography, only the main mineralized domain (10) is modelled.
The variogram is modelled in Gaussian space with the normal scores transformed from the sample grades in real space. Correlograms are calculated and modelled with a two-structure exponential model using SAGE™ 2000 software. A robust variogram (correlogram) model is obtained for Domain 10 that matches well with the observed geology and trends of mineralization (Figure 14-86 and Figure 14-87, Table 14-49).

NI 43-101 Technical Report for the Asanko Gold Mine, Ashanti Region, Ghana
Effective Date: February 28, 2022
Page 273
Figure 14-86 Dynamite Hill Domain 10 Composite Au Normal Score Variogram (Correlogram) Parameters
Figure 14-87 Example of Domain 10 GC Sample and Exploration Composite Au Normal Score Variogram (Correlogram)

NI 43-101 Technical Report for the Asanko Gold Mine, Ashanti Region, Ghana
Effective Date: February 28, 2022
Page 274
Table 14-49 Dynamite Hill Domain 10 Composite Au Normal Score Variogram (Correlogram) Parameters
Domain
Type
Sill
Rotation Angles (Vulcan) Ranges (m)
Azimuth Plunge Dip Major Semi Minor
100
Nugget 0.222 - - - - - -
Exponential 0.598 18 -4 64 18.4 12.1 6.9
Spherical 0.18 27 -4 -21 81.8 17 40.2
14.5.4 Estimation/Interpolation Methods
14.5.4.1 Block Model Setup
A block model was developed within Vulcan software. The model covers the full extent of updated geology and mineralization models and provides adequate extent to allow potential pit expansion. The block size, at 5 x 5 x 3 metres, is considered the SMU, smallest unit that a mining decision is based on.
A large-scale panel (25 x 25 x 15 metre) is also set up for post-processing of the Domain 10 simulation to localize the simulated grades to the SMU blocks, each panel size being a multiple of the smaller SMU block size.
The block model setup dimensions are presented in Table 14-50 and Table 14-51.
Table 14-50 Dynamite Hill 2021 Resource Model Setup
Origin Minimum Maximum Extent (m) Block Size (m) # Blocks
Easting 616020 616020 616930 910 5 182
Northing 706520 706520 707430 910 5 182
Elevation 17 17 380 363 3 121
Table 14-51 Dynamite Hill Domain 10 Simulation Model Setup
Origin Minimum Maximum Extent (m) Block Size (m) # Blocks
Easting 616310 616310 616615 305 1 305
Northing 706760 706760 707110 350 1 350
Elevation 17 17 344 327 1.5 218
The block model was coded according to the geological model wireframes by majority rule as shown in Figure 14-88.
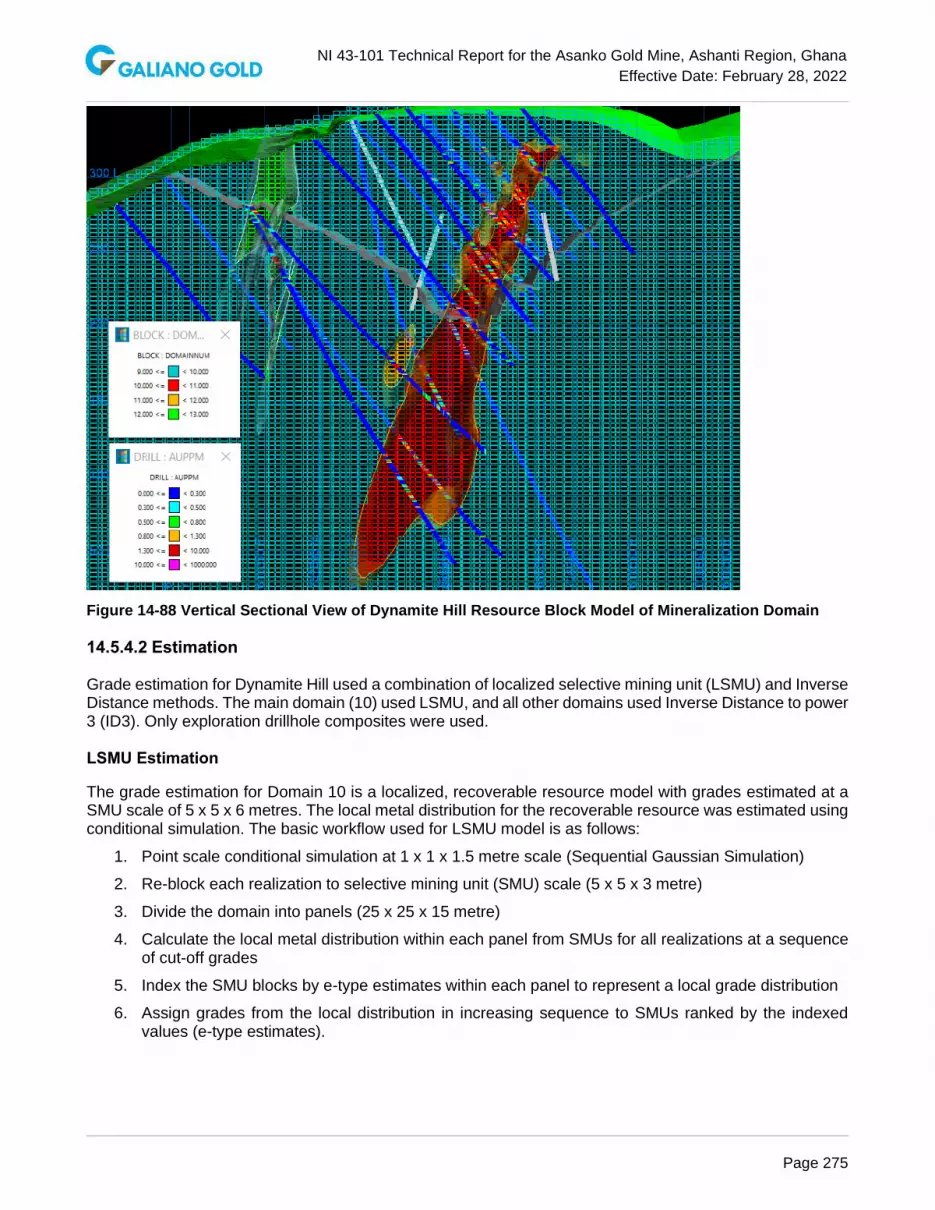
NI 43-101 Technical Report for the Asanko Gold Mine, Ashanti Region, Ghana
Effective Date: February 28, 2022
Page 275
Figure 14-88 Vertical Sectional View of Dynamite Hill Resource Block Model of Mineralization Domain
14.5.4.2 Estimation
Grade estimation for Dynamite Hill used a combination of localized selective mining unit (LSMU) and Inverse Distance methods. The main domain (10) used LSMU, and all other domains used Inverse Distance to power 3 (ID3). Only exploration drillhole composites were used.
LSMU Estimation
The grade estimation for Domain 10 is a localized, recoverable resource model with grades estimated at a SMU scale of 5 x 5 x 6 metres. The local metal distribution for the recoverable resource was estimated using conditional simulation. The basic workflow used for LSMU model is as follows:
1. Point scale conditional simulation at 1 x 1 x 1.5 metre scale (Sequential Gaussian Simulation)
2. Re-block each realization to selective mining unit (SMU) scale (5 x 5 x 3 metre)
3. Divide the domain into panels (25 x 25 x 15 metre)
4. Calculate the local metal distribution within each panel from SMUs for all realizations at a sequence of cut-off grades
5. Index the SMU blocks by e-type estimates within each panel to represent a local grade distribution
6. Assign grades from the local distribution in increasing sequence to SMUs ranked by the indexed values (e-type estimates).

NI 43-101 Technical Report for the Asanko Gold Mine, Ashanti Region, Ghana
Effective Date: February 28, 2022
Page 276
The localization is the same approach used for localized uniform conditioning (LUC) which estimates localized SMU grades conforming to the proper grade–tonnage curves as well as maintaining the relative spatial grade distribution pattern indicated by the e-type estimates. The applied estimation differs from LUC by obtaining the local distribution through conditional simulation rather than UC. This maintains the advantages of having a probabilistic conditional simulation model (multiple realization models) while providing a deterministic summary model (one grade per block) to be used for the reporting and optimisation processes.
A total of 50 simulation realizations and the e-type were produced at 1 x 1 x 1.5 metre point scale support, and then each realization and e-type are regularized to 5 x 5 x 3 metre SMU block size. The SGS search parameters are shown in Table 14-52. The SMU blocks are coded with the panel ID (each 25 x 25 x 15 metre panel was assigned a unique ID code) before being exported to csv block model file for post-processing.
The indexing and localization of block grades are completed in Microsoft™ Excel, PowerQuery and processed with DAX language. The localized block model file was then re-imported to Vulcan as the final grade model for Domain 10.
Inverse Distance Estimation
The ID3 was used for grade estimation for Domain 11, 12, and 9. SGS and Inverse Distance (ID3) estimation parameters are summarized in Table 14-52.
Table 14-52 Dynamite Hill Sequential Gaussian Simulation and Inverse Distance (ID3) Estimation Parameters
14.5.4.3 Bulk Density
Bulk density was assigned to the block model based on a combination of lithology and oxidation. The bulk density values are calculated from a total of 66 measurements of drill cores representing the various lithology and oxidation types. The calculated average bulk density values by material types are in line with the bulk densities of adjacent deposits. Densities assigned to the block model are shown in Table 14-53.
Table 14-53 Bulk Density Values Assigned to Dynamite Hill Block Model (by Material Type)
Material Type Bulk Density (t/m3)
Oxide 1.79
Transitional 1.98
Fresh - Granite 2.70
Fresh - Sediments 2.77
Modeling
MethodDomain Est. Pass min max max/hole min max max/oct major semi minor bearing plunge dip
SGS 10 one pass 4 15 4 - - 6 80 80 15 35 0 65
ID3 / P1 4 12 3 2 5 4 40 30 5 35 0 65
ID3 / P2 4 12 3 2 5 4 80 60 10 35 0 65
ID3 / P3 2 8 3 1 3 3 160 120 40 35 0 65
ID3 / P1 4 6 2 2 4 2 40 30 3 35 0 65
ID3 / P2 2 5 2 1 3 2 80 60 10 35 0 65
ID3 / P1 4 6 2 2 4 2 40 30 3 35 0 78
ID3 / P2 2 5 2 1 3 2 80 60 10 35 0 78
9 ID3 / P1 2 6 2 1 3 2 40 30 3 35 0 65
ID3
10
(for ranking)
11
12
Search Ellipsoid# of Composite # of Drillhole Octant
Radius (m) Orientation (Vulcan)

NI 43-101 Technical Report for the Asanko Gold Mine, Ashanti Region, Ghana
Effective Date: February 28, 2022
Page 277
14.5.5 Validation
Validation of the block model included the validation of the simulation model of the main mineralized domain, statistical comparison of the model and input data, visual inspection, and most importantly the reconciliation with the past production.
14.5.5.1 Validation of Simulation
The simulation was validated at point scale. The point scale realizations reasonably reproduced the statistics of input composites (Figure 14-89 and Figure 14-90). The visual inspection of select realizations in 2D and 3D also show reasonable reproduction of the orientation and ranges of input variogram (Figure 14-91).
Figure 14-89 Dynamite Hill Accuracy Plot of 50 SGS Realizations
Figure 14-90 Dynamite Hill Statistical Comparison of SGS Realizations and Input Composites

NI 43-101 Technical Report for the Asanko Gold Mine, Ashanti Region, Ghana
Effective Date: February 28, 2022
Page 278
Figure 14-91 Dynamite Hill Plan View of SGS Realization ausim01 Grade
14.5.5.2 Swath Plots
Swath plots were created by comparing the model block grades and input in spatial increments in northing, easting, and elevation slices throughout the deposit (Figure 14-92).
The plots show that block grades (Indicated + Inferred) are smoother and follow the trend of input composite grades, which is the expected result of estimation, with block grades showing lower overall variance.
The global mean comparison presented in Table 14-54.
Table 14-54 Global Stats (at 0 g/t Cut-off grade) Comparison Between Indicated Blocks and Exploration Drill Hole Composites
Block Model (Class 2) Composite_1.5m AUCUT
Domain Count Mean CV Min Max Count Mean CV Min Max
9 - - - - - 14,399 0.04 3.39 0.001 8.05
10 24,155 1.35 0.81 0.05 9.77 2,105 1.46 1.74 0.005 28.53
11 1,124 0.67 0.92 0.01 3.25 123 0.6 1.22 0.005 3.34
12 2,224 0.44 0.78 0.005 1.97 258 0.44 1.08 0.005 2.3
14.5.5.3 Visual Inspection
The block model was visually reviewed in 2D in sections and level plans, and in 3D to ensure the block estimates are supported by the surrounding composites. In general, the estimates compare well with the input data.

NI 43-101 Technical Report for the Asanko Gold Mine, Ashanti Region, Ghana
Effective Date: February 28, 2022
Page 279
Figure 14-92: Dynamite Hill Swath Plot by Easting, Northing, and Elevation for Block and Composite Au g/t of Domain 10
14.5.5.4 Reconciliation
To evaluate the model performance against the past production, the resource model is compared to the grade control model within the mined-out pit at key cut-off grades. A separate simulation model was also produced with GC samples following similar process as the LSMU model, as an additional check of the resource model within the mined-out pit. Reconciliation results are summarized in Table 14-55.

NI 43-101 Technical Report for the Asanko Gold Mine, Ashanti Region, Ghana
Effective Date: February 28, 2022
Page 280
Table 14-55 Dynamite Hill Resource Model Reconciliation Summary Within Mined-out Pit
COG = 0
Measured + Indicated Inferred Total
Tonnes Au
(g/t) Gold (Oz) Tonnes
Au (g/t)
Gold (Oz) Tonnes
Au (g/t) Gold (Oz)
2021 Resource Model 2,058,564 1.48 98,019 10,814,661 0.06 19,471 12,873,225 0.28 117,490
GC Model 1,951,983 1.58 99,436 0 0.00 0 1,951,983 1.58 99,436
GC Sim Model 2,051,851 1.56 102,911 10,755,382 0.05 16,944 12,807,233 0.29 119,855
COG = 0.5
Measured + Indicated Inferred Total
Tonnes Au
(g/t) Gold (Oz) Tonnes
Au (g/t)
Gold (Oz) Tonnes
Au (g/t) Gold (Oz)
2021 Resource Model 1,757,790 1.68 94,661 157,176 1.00 5,038 1,914,966 1.62 99,699
GC Model 1,800,110 1.69 97,982 0 0.00 0 1,800,110 1.69 97,982
GC Sim Model 1,683,437 1.84 99,317 123,340 1.04 4,124 1,806,777 1.78 103,441
COG = 0.8
Measured + Indicated Inferred Total
Tonnes Au
(g/t) Gold (Oz) Tonnes
Au (g/t)
Gold (Oz) Tonnes
Au (g/t) Gold (Oz)
2021 Resource Model 1,395,255 1.94 87,070 79,641 1.38 3,521 1,474,896 1.91 90,591
GC Model 1,533,186 1.87 92,326 0 0.00 0 1,533,186 1.87 92,326
GC Sim Model 1,340,241 2.14 92,169 62,682 1.44 2,900 1,402,923 2.11 95,069
14.5.6 Classification of Mineral Resources
Dynamite Hill deposit shares the common geological features as other well studied deposits on the Nkran structural trend. The control of mineralization is well understood from the previous modelling and mining.
Drill spacing is the primary factor to define resource classification and only Indicated and Inferred resources are defined at Dynamite Hill. The spacing criteria to separate the resource classes are based on the variogram ranges, experiences of mining at Dynamite Hill and other deposits in similar geological settings.
Nominal drill spacing is determined with a widely accepted mathematic approximation based on calculated average distance of the closest three drillholes to the block. The classification criteria are summarized in Table 14-56. See “Cautionary Note about Mineral Resources”.
Table 14-56 Dynamite Hill Resource Classification Criteria
Classification Category Drill Spacing (m) 3-Hole Average Distance (m)
Measured No Measured classification defined -
Indicated 40 x 40 drilling (Domain 10) <= 28.29
35 x 35 drilling (Domain 9, 11, 12) <= 24.75
Inferred 80 x 80 metre drilling, or nearest DH < 60 metre distance <= 56.58

NI 43-101 Technical Report for the Asanko Gold Mine, Ashanti Region, Ghana
Effective Date: February 28, 2022
Page 281
Figure 14-93 Dynamite Hill Block Model 3 - Hole Average Distances and Resource Classification
14.5.7 Reasonable Prospect of Eventual Economic Extraction
The Dynamite Hill mineralization is assumed amenable to open pit mining and milling and recovery through CIL gold processing. The reasonable prospect for eventual economic extraction of the Mineral Resources was tested by constraining the Mineral Resources within a conceptual pit shell optimized in NPV Scheduler™ software at US$1600/oz gold price with all the materials of Indicated and Inferred classes and with a reporting cut-off grade of 0.5 g/t Au. The conceptual pit parameters are listed in Table 14-57.
Table 14-57 Dynamite Hill Conceptual Constraining Pit Parameters
Parameter Value
Gold Price (US$/ounce) 1,600
Mining Cost (US$/tonne) 1.025 - 1.647
Mining Cost Incremental (US$/Vertical 6m) 0.0087 – 0.0353
Mill Feed Transport (US$/tonne) 2.35
Process Cost (US$/tonne) 8.79 – 11.32
Gold Recovery (%) 94%
General and Administration (US$/tonne) 6.55
14.5.8 Mineral Resource Statement
The Dynamite Hill Mineral Resource estimate is reported in accordance with the CIM Definition Standards for Mineral Resources & Mineral Reserves, adopted by CIM Council May 10, 2014.
The Qualified Person is Eric Chen, P.Geo. who is Galiano Gold’s former Vice President of Technical Services. The effective date is February 28, 2022. The Mineral Resource estimate is reported assuming open pit mining and milling and CIL gold processing methods using a cut-off grade of 0.5 g/t Au, is constrained within a conceptual open pit prepared using NPV Scheduler™ software. The Mineral Resource estimates are summarized in Table 14-58. The estimated grades and tonnages for multiple cut-offs are shown in Figure 14-94.

NI 43-101 Technical Report for the Asanko Gold Mine, Ashanti Region, Ghana
Effective Date: February 28, 2022
Page 282
Table 14-58 Dynamite Hill Mineral Resource Estimate at a 0.5 g/t Au cut-off and $1,600/oz Au, as of February 28, 2022
Category
Cutoff Grade
(g/t Au) Tonnes (kt) Au (g/t)
Au Metal Contained
(koz)
Measured na na na na
Indicated 0.5 1,900 1.39 85
Measured & Indicated 0.5 1,900 1.39 85
Inferred 0.5 340 1.26 14
Notes: 1. The Mineral Resource estimates are reported in accordance with the CIM Definition Standards for
Mineral Resources & Mineral Reserves, adopted by CIM Council May 10, 2014. 2. The effective date for the Mineral Resource estimates is February 28, 2022 3. Mineral Resource estimates account for mining depletion as of February 28, 2022 4. Reasonable Prospects for eventual economic extraction assume open pit mining with conventional gold
processing and was tested using NPV Scheduler™ pit optimization software using several technical parameters including:
a. $1,600/oz Au price b. $1.025/t to $1.647/t mining costs c. $2.35/t mill feed transport costs d. $8.79/t to $11.32/t processing costs e. 94% Au recovery for all material f. $6.55/t G&A
5. Applicable rounding has been applied to the stated tonnages, grades, and metal content to reflect the level of accuracy and precision of the estimate
Figure 14-94 Dynamite Hill Tonnage - Grade Curve for Indicated Mineral Resources

NI 43-101 Technical Report for the Asanko Gold Mine, Ashanti Region, Ghana
Effective Date: February 28, 2022
Page 283
14.5.9 Factors That May Affect the Mineral Resource Estimate
Other than as discussed in other sections of this report there are no known environmental, permitting, legal, title, taxation, socio-economic, marketing, and political or other relevant issues that may materially affect the Mineral Resource estimates. Other relevant factors that may materially affect the Mineral Resources, including mining, metallurgical recovery, and infrastructure are reasonably well understood according to the assumptions presented in this Report.
14.6 Miradani North Mineral Resource Estimate
The Miradani North deposit was mined between 1996 and 2016 by Ukrainians and Russians. The pit is 250 metres long by about 120 metres with a depth of about 60 metres. Most of the oxide mineralization is depleted but the fresh rock remains untouched. No historical data or production record is available from this period. Exploration drilling by Asanko started in 2019, followed by two drilling campaigns in 2020 and 2021. The 2021 drilling was successful in defining the geometry of the mineralization with adequate data density to define the Mineral Resource at Miradani North.
14.6.1 Database
The current drillhole database used to support the resource estimate now consists of 83 exploration holes totalling 19,609 metres (Table 14-59). The cut-off date of drilling data is May 13, 2021.
Table 14-59 Miradani North Exploration Drillholes
Exploration Holes DDH RC RCD Total
Number of holes 43 8 32 83
Metres drilled 10,453 1,010 8,146 19,609
The exploration holes were planned and drilled at nominal 40 x 40 metre grid. Due to drill rig access limitations, the near-surface portion of the deposit that is directly below the existing pit (water flooded) could not be drilled at the same grid. The current drill plan is show in Figure 14-95 and Figure 14-96.
Figure 14-95 Plan View of Miradani North Exploration Drillholes

NI 43-101 Technical Report for the Asanko Gold Mine, Ashanti Region, Ghana
Effective Date: February 28, 2022
Page 284
Figure 14-96 Sectional View of Miradani North Exploration Drillholes
All drilling methods, sample collection methods and data quality processes and results are described in the relevant sections of this report.
14.6.1.1 Verification of Exploration Data
Eric Chen, P.Geo., is the QP for the Miradani North Mineral Resource estimate and has conducted data verification to assure the accuracy, completeness, and suitability of the exploration data for Mineral Resource estimation.
Extracted drillhole data were received from Asanko site in comma-delimited csv format. The QP worked closely with the site database and exploration team to conduct further data verification to ensure that data entries in all the drillhole tables were free of error and consistent before the data was accepted for resource estimation. The verification process is completed with assistance of various built-in tools in 3D geological modelling software programs or generic data processing program (such as Excel), and has included, but not limited to, checking and correcting duplicate records, drillhole interval overlap, drillhole depth mis-match, abnormal collar location, downhole surveys, erroneous assay values, etc. Two drillholes, TTDD20-029 and TTDD20-050, were removed from resource database due to significant concern of the reliability of their downhole surveys.
14.6.2 Geological Models
The geological model for Miradani North was interpreted and modelled by Asanko exploration team based on the exploration drilling in 2019 - 2021. The geological model was constructed using Leapfrog Geo software and includes:
1. Lithology model
2. Oxidation model
3. Shear/Fault model
4. Mineralization model

NI 43-101 Technical Report for the Asanko Gold Mine, Ashanti Region, Ghana
Effective Date: February 28, 2022
Page 285
14.6.2.1 Lithology, Oxidation and Shear/Fault Model
The geology of Miradani North deposit is akin to the Nkran deposit in several ways. It is in a dilational jog at the triple junction of NNE-SSW trending regional structures and East-west (080) structures which are underlain by cryptic basement structures.
The stratigraphy is comprised of wackes and intermittent alternating units of sandstones, siltstones, and graphitic shales which are intruded by felsic porphyry. The intrusive unit is about 200 metres long, plunges to the south and up to 100 metre wide at the middle where it was faulted and rotated by a sinistral movement causing shortening and thickening.
The lithology is generalized into a granite and a sedimentary rock model. The sedimentary rock model is treated as background rock mass. Two shear surfaces, hanging wall and footwall, were modelled and are the most significant structures that constrain the overall mineralization.
The oxidation model represents different levels of weathering and is used for material type categorization and density modelling purpose. Simple weathering surfaces are constructed for the base of complete oxidation (BOCO) and the top of fresh rock (TOFR). The two surfaces divided weathering into Oxide (strongly to moderately oxidized), Transitional (weakly oxidized) and Fresh (fresh rock) material types. Away from the drilling the thickness of weathering was maintained parallel to topography (Figure 14-97 and Figure 14-98).
Figure 14-97 Plan View of Miradani North Lithology Model

NI 43-101 Technical Report for the Asanko Gold Mine, Ashanti Region, Ghana
Effective Date: February 28, 2022
Page 286
Figure 14-98 Sectional View of Miradani North Lithology Model
14.6.2.2 Mineralization Model
The gold mineralization at Miradani North occurs as free gold in veins that are at the sandstone/granitic porphyry contact or in the granite where the veins occur either as stockwork or spiderwebs of 1-3-centimetre-long veinlets. The overall mineralization is controlled by a westward dipping shoot that plunges to the north. The mineralization is controlled by the shape of the intrusive.
The 3D model of mineralization is based on a geological framework of logged and modelled granite intrusive, constraining shear/faults, and drillhole assays at nominal 0.2~0.3 g/t Au threshold. The interpretation was conducted in both 2D and 3D, and the selection of drillhole intercepts may occasionally include materials lower than target grade threshold to honour the geological trend and maintain the continuity of the 3D shapes. Structural trends were used in 3D solid generation process in Leapfrog. The model is a single solid orebody hosted within and around the main granite intrusions and is sub-parallel to the main regional northeast trending northwest steeply dipping structure (Figure 14-99 and Figure 14-100).
All lithology, oxidation, and mineralization models are summarized in Table 14-60.

NI 43-101 Technical Report for the Asanko Gold Mine, Ashanti Region, Ghana
Effective Date: February 28, 2022
Page 287
Figure 14-99 Plan View of Miradani North Lithology Model
Note: (* Minzone mineralization domain shown in yellow solid. Granite shown as magenta wireframe)
Figure 14-100 Sectional View of Miradani North Lithology Model
Note: (* Minzone mineralization domain shown in yellow solid. Granite shown as magenta wireframe)

NI 43-101 Technical Report for the Asanko Gold Mine, Ashanti Region, Ghana
Effective Date: February 28, 2022
Page 288
Table 14-60 lists all the geological models and codes.
Table 14-60 List of Miradani North Geological Models and Codes
Model Type Model Name Code Original File Name Effective Date
Mineralization Minzone 100 MinZone_v3_20210515final.dxf 2021-05-15
Mineralization OutMinzone 900 SEDS_box.dxf 2021-05-15
Lithology Granite 1 GR1.dxf 2021-05-04
Lithology Skinny Granite 1 2 GR2.dxf 2021-05-04
Lithology Skinny Granite 2 2 GR3.dxf 2021-05-04
Lithology Sediments 9 SEDS_box.dxf 2021-05-04
Oxidation Oxide 1 Boco_110521.dxf (ox-tr contact) 2021-05-11
Oxidation Transitional 2 Boco_110521.dxf (ox-tr contact) 2021-05-11
Oxidation Fresh 3 ToFr_110521.dxf (Tr-Fr contact) 2021-05-11
14.6.3 Exploration Data Analysis
Drillhole samples are coded by lithology, oxidation, and mineralization models for statistical analysis. Exploratory data analysis was carried out for both individual and combined geological features. The mineralization model provides the best domain to distinguish different grade populations of the deposit. Different lithologies or oxidation within the same mineralization domain do not show significant statistical differences (Figure 14-101 and Figure 14-102).
Figure 14-101 Log Probability Plot of Miradani Exploration Drillhole Assays Au Grade by Mineralization

NI 43-101 Technical Report for the Asanko Gold Mine, Ashanti Region, Ghana
Effective Date: February 28, 2022
Page 289
Figure 14-102 Log Probability Plot of Miradani Exploration Drillhole Assays Au Grade by Oxidation and Lithology Model Inside Minzone
14.6.3.1 Gold Grade Capping/Outlier Restrictions
Anomalous high grade Au assays are present in the drillhole samples, with maximum grade of 136.57 g/t in exploration drillholes.
The threshold grades are assessed by mineralization domains with histogram and log probability (disintegration) graphs of the drillhole assays (Figure 14-103), with consideration of reasonable metal loss and the general grade behaviour at the nearby mined deposits. Assays higher than the threshold grades are capped to the respective threshold grades for each domain. The comparison of sample statistics before and after top-cutting is presented in Table 14-61.

NI 43-101 Technical Report for the Asanko Gold Mine, Ashanti Region, Ghana
Effective Date: February 28, 2022
Page 290
Figure 14-103 Top-cut Analysis of Miradani Exploration Drillholes Au Assays
Table 14-61 Raw and Top-Cut Assays Statistics of Miradani Exploration Drillholes
Sample Assays Au Grade (g/t) Top-cut Assays AUCUT (g/t)
Domain Count Mean CV Maximum Top-cut Au (g/t)
# Samples
Cut Mean CV Maximum
Metal loss
100 3,766 1.21 3.01 136.57 25 12 1.14 2.2 25 6%
900 13,145 0.05 9.31 24.18 5 13 0.04 5.49 5 16%

NI 43-101 Technical Report for the Asanko Gold Mine, Ashanti Region, Ghana
Effective Date: February 28, 2022
Page 291
14.6.3.2 Composites
The dominant sample length is 1.0 metre for exploration drillhole samples. There is no obvious trend of grade distribution by the length of the samples.
The exploration drillhole samples are composited from collar to toe at 1.0 metre equal length intervals for uniform support. Residual of less than half of the composite length are added to the last full composite. The residuals are mostly present at the end of drillholes. Drillhole traces without sample or missing assays are ignored. The composites are coded by the mineralization domain wireframes (majority rule) and the statistics of drillhole composites are presented in Table 14-62 with comparison to the assay statistics. Assays are top cut prior to compositing and composite grade AUCUT was calculated from assays AUCUT.
Table 14-62 Composite Au Statistics of Miradani Exploration Drillholes
Sample Assays Au Grade (g/t) Composite 1.0m AUCUT (g/t)
Domain Count Mean CV Max Count Mean CV Max
100 3,766 1.21 3.01 136.57 3,695 1.14 1.99 25
900 13,145 0.05 9.31 24.18 13,275 0.04 5.25 5
14.6.3.3 Boundary Analysis
The boundary condition between the mineralization, oxidation, and lithology was assessed through visual inspections and contact graph analysis. The grades show sharp contact between the mineralization domain and the non-mineralized background. Within the mineralization domain, the grades do not show distinct change across the lithology boundaries or oxidation boundaries (Figure 14-104).
Figure 14-104 Contact Graphs of Drillhole Assays by Miradani Lithology and Mineralization Models

NI 43-101 Technical Report for the Asanko Gold Mine, Ashanti Region, Ghana
Effective Date: February 28, 2022
Page 292
14.6.3.4 Declustering
Conditional simulation (Sequential Gaussian Simulation, or SGS) was used to model the main mineralization domain (100). Normal Score transformation of the Au grade is required for SGS process, which requires the de-clustered distribution of the composite Au grade for the domain in normal score transformation. Cell de-clustering method was used. Several de-clustering cell sizes are tested and the final cell size of 20x40x20 (m) are selected and applied, primarily based on the data spacing and review of mean vs. cell size graph (Figure 14-105). The de-clustered statistics are compared to raw composites and presented in Table 14-63.
Figure 14-105 Cell De-clustered Miradani Exploration Drillhole Composites Au Mean vs. Cell Size
Table 14-63 De-clustered and Raw Miradani Exploration Drillhole Composite Au Statistics Comparison
Composite 1.0m AUCUT Composite 1.0m AUCUT (De-clustered)
Domain Count Min Max Mean CV Count Min Max Mean CV Metal loss
100 3,695 0.001 25 1.14 1.99 3,695 0.001 25 1.08 2 -5%
14.6.3.5 Variography
Variography was modelled for Mineralization Domain 100 only. The variogram was modelled in Gaussian space with the normal scores transformed from the de-clustered composite grades in real space. Correlograms are calculated and modelled with a two-structure exponential/spherical model using SAGE™ 2000 software. A robust variogram (correlogram) model was obtained for Domain 100 that matches well with the observed geology and trends of mineralization (Figure 14-106, Figure 14-107, and Table 14-64).

NI 43-101 Technical Report for the Asanko Gold Mine, Ashanti Region, Ghana
Effective Date: February 28, 2022
Page 293
Figure 14-106 Miradani Domain 100 Composite Au Normal Score Variogram (Correlogram) Parameters
Figure 14-107 Miradani Domain 100 Drillhole Composite Au Normal Score Variogram (Correlogram)
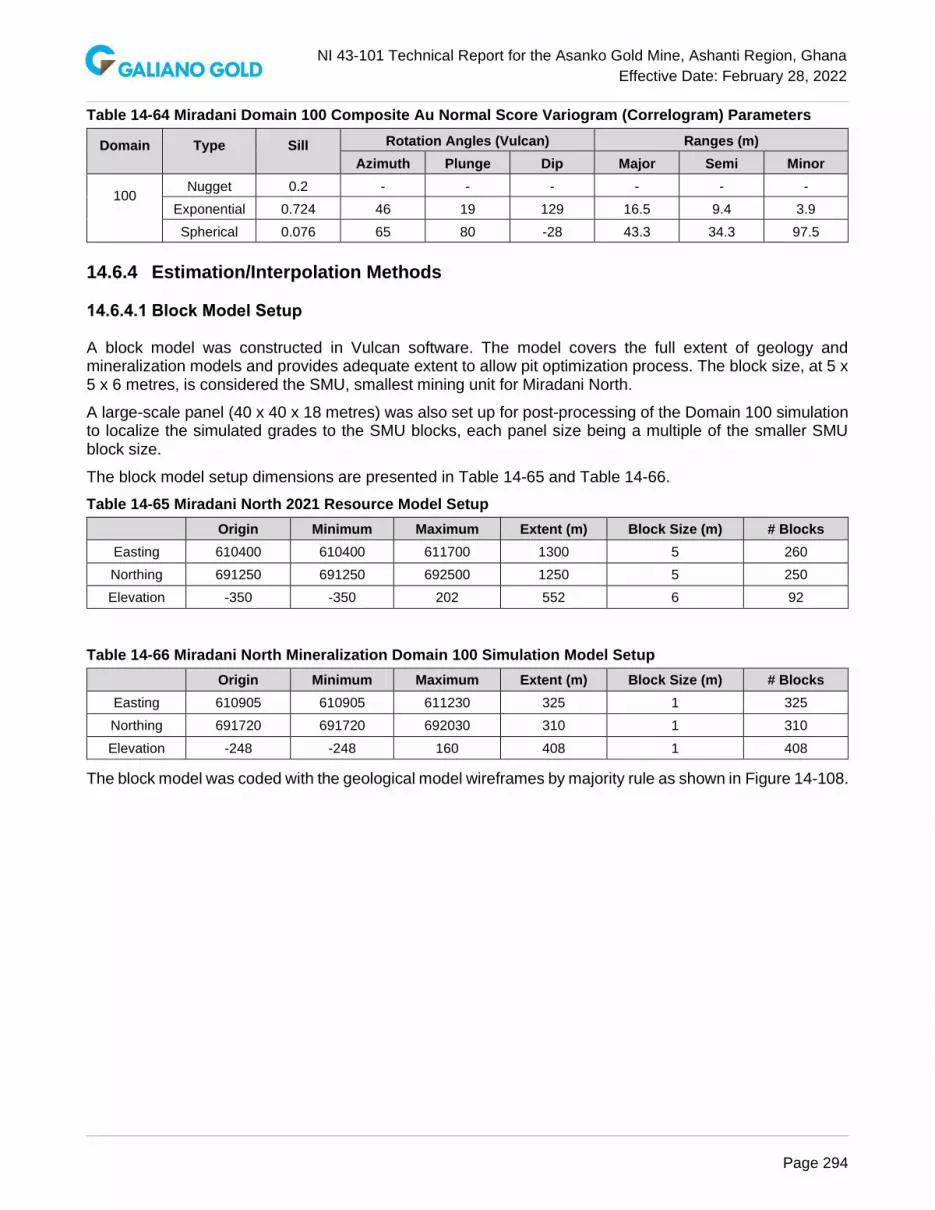
NI 43-101 Technical Report for the Asanko Gold Mine, Ashanti Region, Ghana
Effective Date: February 28, 2022
Page 294
Table 14-64 Miradani Domain 100 Composite Au Normal Score Variogram (Correlogram) Parameters
Domain
Type
Sill
Rotation Angles (Vulcan) Ranges (m)
Azimuth Plunge Dip Major Semi Minor
100
Nugget 0.2 - - - - - -
Exponential 0.724 46 19 129 16.5 9.4 3.9
Spherical 0.076 65 80 -28 43.3 34.3 97.5
14.6.4 Estimation/Interpolation Methods
14.6.4.1 Block Model Setup
A block model was constructed in Vulcan software. The model covers the full extent of geology and mineralization models and provides adequate extent to allow pit optimization process. The block size, at 5 x 5 x 6 metres, is considered the SMU, smallest mining unit for Miradani North.
A large-scale panel (40 x 40 x 18 metres) was also set up for post-processing of the Domain 100 simulation to localize the simulated grades to the SMU blocks, each panel size being a multiple of the smaller SMU block size.
The block model setup dimensions are presented in Table 14-65 and Table 14-66.
Table 14-65 Miradani North 2021 Resource Model Setup
Origin Minimum Maximum Extent (m) Block Size (m) # Blocks
Easting 610400 610400 611700 1300 5 260
Northing 691250 691250 692500 1250 5 250
Elevation -350 -350 202 552 6 92
Table 14-66 Miradani North Mineralization Domain 100 Simulation Model Setup
Origin Minimum Maximum Extent (m) Block Size (m) # Blocks
Easting 610905 610905 611230 325 1 325
Northing 691720 691720 692030 310 1 310
Elevation -248 -248 160 408 1 408
The block model was coded with the geological model wireframes by majority rule as shown in Figure 14-108.
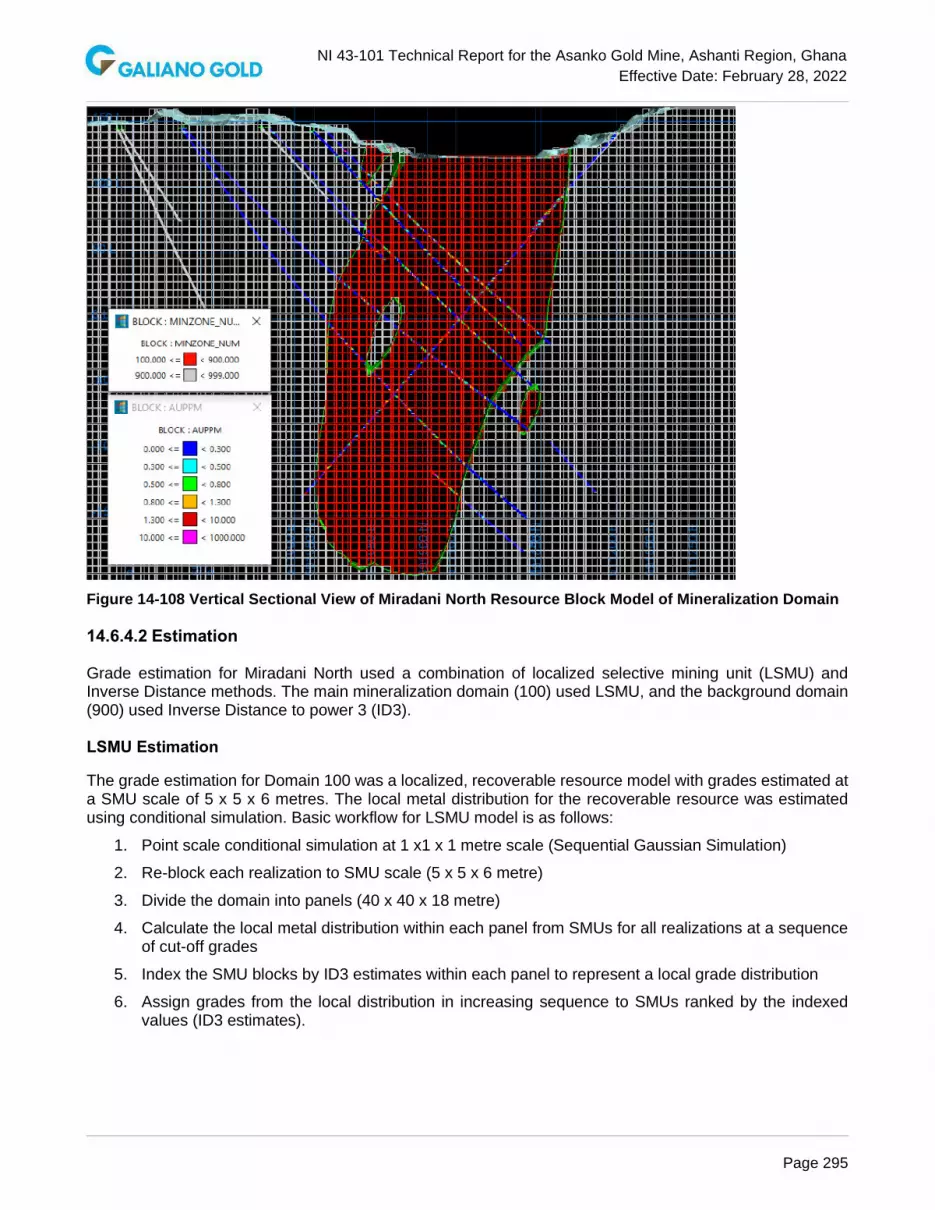
NI 43-101 Technical Report for the Asanko Gold Mine, Ashanti Region, Ghana
Effective Date: February 28, 2022
Page 295
Figure 14-108 Vertical Sectional View of Miradani North Resource Block Model of Mineralization Domain
14.6.4.2 Estimation
Grade estimation for Miradani North used a combination of localized selective mining unit (LSMU) and Inverse Distance methods. The main mineralization domain (100) used LSMU, and the background domain (900) used Inverse Distance to power 3 (ID3).
LSMU Estimation
The grade estimation for Domain 100 was a localized, recoverable resource model with grades estimated at a SMU scale of 5 x 5 x 6 metres. The local metal distribution for the recoverable resource was estimated using conditional simulation. Basic workflow for LSMU model is as follows:
1. Point scale conditional simulation at 1 x1 x 1 metre scale (Sequential Gaussian Simulation)
2. Re-block each realization to SMU scale (5 x 5 x 6 metre)
3. Divide the domain into panels (40 x 40 x 18 metre)
4. Calculate the local metal distribution within each panel from SMUs for all realizations at a sequence of cut-off grades
5. Index the SMU blocks by ID3 estimates within each panel to represent a local grade distribution
6. Assign grades from the local distribution in increasing sequence to SMUs ranked by the indexed values (ID3 estimates).
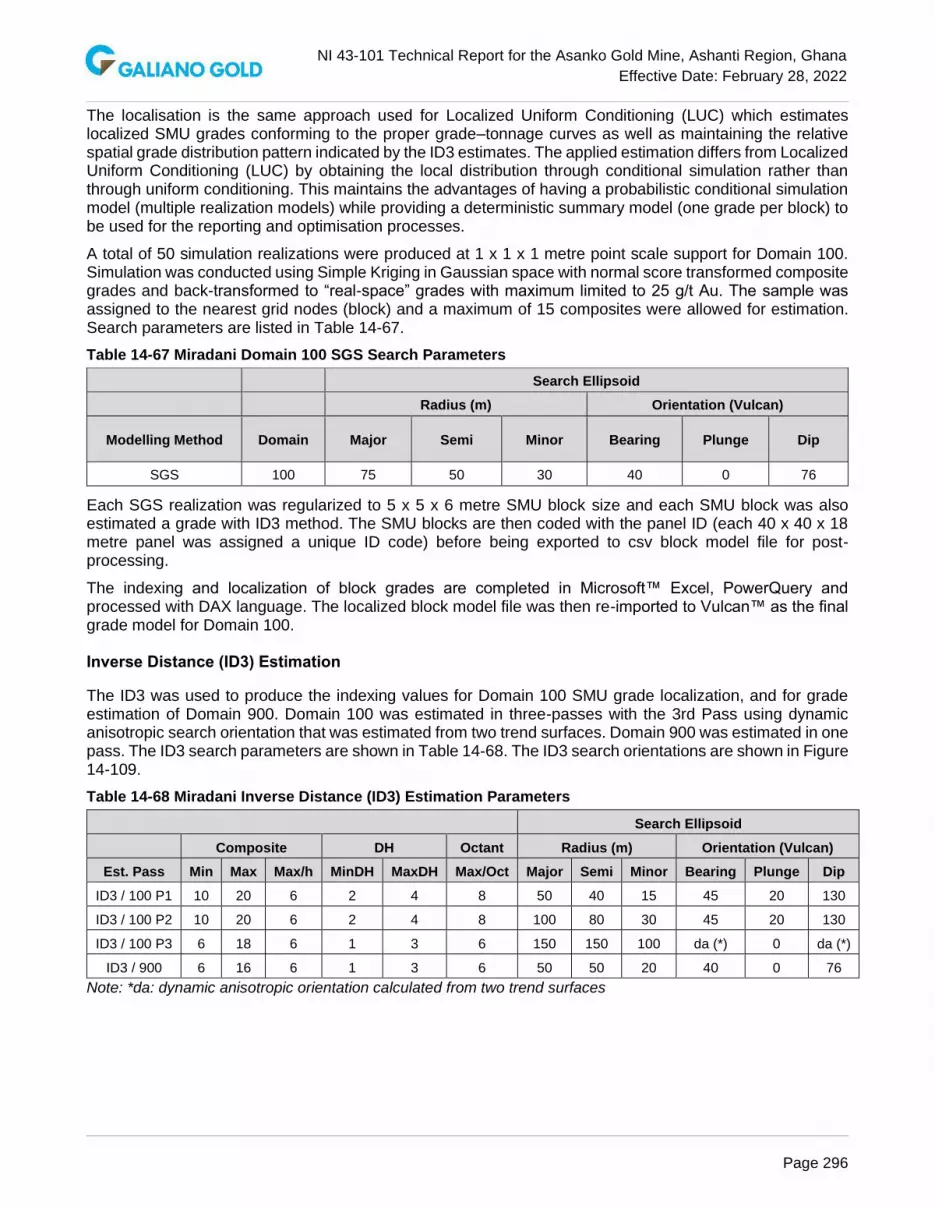
NI 43-101 Technical Report for the Asanko Gold Mine, Ashanti Region, Ghana
Effective Date: February 28, 2022
Page 296
The localisation is the same approach used for Localized Uniform Conditioning (LUC) which estimates localized SMU grades conforming to the proper grade–tonnage curves as well as maintaining the relative spatial grade distribution pattern indicated by the ID3 estimates. The applied estimation differs from Localized Uniform Conditioning (LUC) by obtaining the local distribution through conditional simulation rather than through uniform conditioning. This maintains the advantages of having a probabilistic conditional simulation model (multiple realization models) while providing a deterministic summary model (one grade per block) to be used for the reporting and optimisation processes.
A total of 50 simulation realizations were produced at 1 x 1 x 1 metre point scale support for Domain 100. Simulation was conducted using Simple Kriging in Gaussian space with normal score transformed composite grades and back-transformed to “real-space” grades with maximum limited to 25 g/t Au. The sample was assigned to the nearest grid nodes (block) and a maximum of 15 composites were allowed for estimation. Search parameters are listed in Table 14-67.
Table 14-67 Miradani Domain 100 SGS Search Parameters
Search Ellipsoid
Radius (m) Orientation (Vulcan)
Modelling Method Domain Major Semi Minor Bearing Plunge Dip
SGS 100 75 50 30 40 0 76
Each SGS realization was regularized to 5 x 5 x 6 metre SMU block size and each SMU block was also estimated a grade with ID3 method. The SMU blocks are then coded with the panel ID (each 40 x 40 x 18 metre panel was assigned a unique ID code) before being exported to csv block model file for post-processing.
The indexing and localization of block grades are completed in Microsoft™ Excel, PowerQuery and processed with DAX language. The localized block model file was then re-imported to Vulcan™ as the final grade model for Domain 100.
Inverse Distance (ID3) Estimation
The ID3 was used to produce the indexing values for Domain 100 SMU grade localization, and for grade estimation of Domain 900. Domain 100 was estimated in three-passes with the 3rd Pass using dynamic anisotropic search orientation that was estimated from two trend surfaces. Domain 900 was estimated in one pass. The ID3 search parameters are shown in Table 14-68. The ID3 search orientations are shown in Figure 14-109.
Table 14-68 Miradani Inverse Distance (ID3) Estimation Parameters
Search Ellipsoid
Composite DH Octant Radius (m) Orientation (Vulcan)
Est. Pass Min Max Max/h MinDH MaxDH Max/Oct Major Semi Minor Bearing Plunge Dip
ID3 / 100 P1 10 20 6 2 4 8 50 40 15 45 20 130
ID3 / 100 P2 10 20 6 2 4 8 100 80 30 45 20 130
ID3 / 100 P3 6 18 6 1 3 6 150 150 100 da (*) 0 da (*)
ID3 / 900 6 16 6 1 3 6 50 50 20 40 0 76
Note: *da: dynamic anisotropic orientation calculated from two trend surfaces

NI 43-101 Technical Report for the Asanko Gold Mine, Ashanti Region, Ghana
Effective Date: February 28, 2022
Page 297
Figure 14-109 Illustration of Miradani ID3 Estimation Search Orientations
14.6.4.3 Bulk Density
Bulk density was assigned to the block model based on a combination of lithology and oxidation. The Fresh zone granite and sedimentary rock bulk density values are calculated from a total of 187 measurements of drill core samples representing the various lithology types. The calculated average bulk density values for different lithology types in fresh zone are in line with the that of adjacent deposits and are used to assign densities to block model. There was no sample taken for density measurement from oxide or transitional zones at Miradani North. After consultation with the Asanko Exploration team and review of the bulk densities of similar material types at adjacent deposits, it was considered appropriate to use the oxide and transitional densities at Nkran for Miradani North. Densities assigned to the block model are shown in Table 14-69.
Table 14-69 Miradani Bulk Density Values Assigned to Resource Block Model (by Material Type)
Material Type Bulk Density (t/m3)
Oxide 1.69
Transitional 2.10
Fresh - Granite 2.64
Fresh - Sediments 2.68
14.6.5 Validation
Validation of the block model included the validation of simulation model of the main mineralization domain, statistical comparison of the model and input data, visual inspection.
14.6.5.1 Validation of Simulation
The simulation was validated at point scale. The point scale realizations reasonably reproduced the statistics of input composites (Figure 14-110 and Figure 14-111). The visual inspection of select realizations in 2D and 3D also show reasonable reproduction of the orientation and ranges of input variogram (Figure 14-112).

NI 43-101 Technical Report for the Asanko Gold Mine, Ashanti Region, Ghana
Effective Date: February 28, 2022
Page 298
Figure 14-110 Miradani Accuracy Plot of 50 SGS Realizations
Figure 14-111 Miradani Statistical Comparison of SGS Realizations and Input Composites

NI 43-101 Technical Report for the Asanko Gold Mine, Ashanti Region, Ghana
Effective Date: February 28, 2022
Page 299
Figure 14-112 Miradani SGS Realization ausim03 Au Grade Compared to Variogram Model
14.6.5.2 Swath Plots and Global Statistical Comparisons
Swath plots were created by comparing the model block grades and input in spatial increments in northing, easting, and elevation slices throughout the deposit (Figure 14-113). The plots show that block grades (Indicated) are smoother and follow the trend of input composite grades, which is the expected result of estimation, with block grades showing lower overall variance.
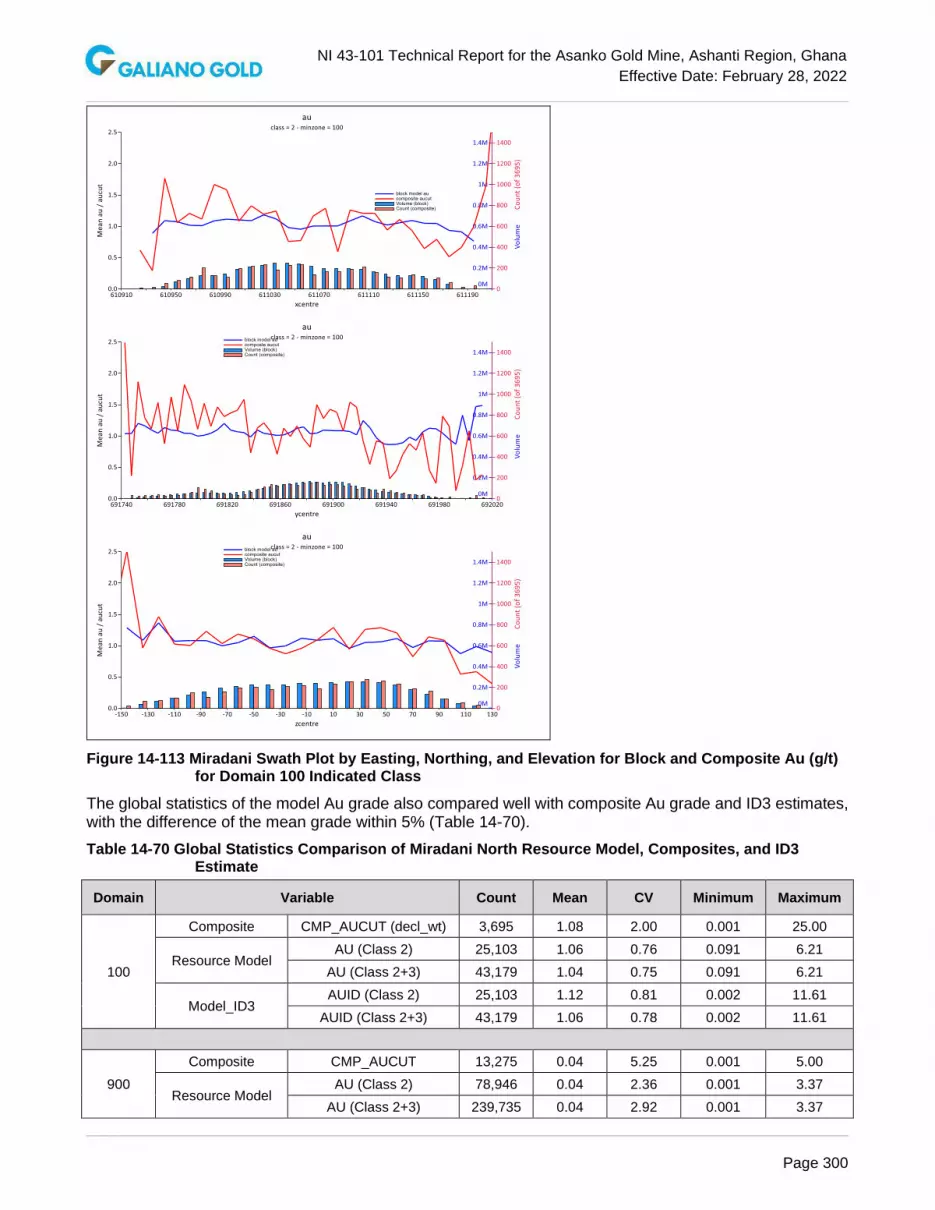
NI 43-101 Technical Report for the Asanko Gold Mine, Ashanti Region, Ghana
Effective Date: February 28, 2022
Page 300
Figure 14-113 Miradani Swath Plot by Easting, Northing, and Elevation for Block and Composite Au (g/t) for Domain 100 Indicated Class
The global statistics of the model Au grade also compared well with composite Au grade and ID3 estimates, with the difference of the mean grade within 5% (Table 14-70).
Table 14-70 Global Statistics Comparison of Miradani North Resource Model, Composites, and ID3 Estimate
Domain Variable Count Mean CV Minimum Maximum
100
Composite CMP_AUCUT (decl_wt) 3,695 1.08 2.00 0.001 25.00
Resource Model AU (Class 2) 25,103 1.06 0.76 0.091 6.21
AU (Class 2+3) 43,179 1.04 0.75 0.091 6.21
Model_ID3 AUID (Class 2) 25,103 1.12 0.81 0.002 11.61
AUID (Class 2+3) 43,179 1.06 0.78 0.002 11.61
900
Composite CMP_AUCUT 13,275 0.04 5.25 0.001 5.00
Resource Model AU (Class 2) 78,946 0.04 2.36 0.001 3.37
AU (Class 2+3) 239,735 0.04 2.92 0.001 3.37

NI 43-101 Technical Report for the Asanko Gold Mine, Ashanti Region, Ghana
Effective Date: February 28, 2022
Page 301
14.6.5.3 Visual Inspection
The block model was visually reviewed in 2D in sections and level plans, and in 3D to ensure the block estimates are supported by the surrounding composites. In general, the estimates compare well with the input data.
14.6.5.4 Comparison with ID3 Estimates
The LSMU estimates were compared with ID3 estimates in tonnage-grade graphs to ensure that the simulation-based LSMU estimates are supported by alternative conventional method (Figure 14-114).
Figure 14-114 Miradani Tonnage-Grade Comparison of LSMU and ID3 Estimates in Domain 100
14.6.6 Classification of Mineral Resources
Miradani North deposit shares the common geological features as other well studied deposits on the Nkran structural trend. The control of mineralization is well understood through the three campaigns of exploration drilling by Asanko.
Drill spacing is the primary factor to define resource classification and only Indicated and Inferred resources are defined at Miradani North. The spacing criteria to separate the resource classes are based on the variogram ranges, quantitative assessment of resource uncertainty, and experiences of mining at adjacent deposits in similar geological settings.
A quantitative uncertainty assessment was conducted with the simulation model of Mineralization Domain (100) and the derived criteria for classification was used for Domain 100 and 900. The results of the assessment supported the use of 45-metre drillhole spacing to define Indicated Resource Class. The Inferred class required 80-metre spacing, which was primarily based on the maximum variogram ranges.
Nominal drill spacing is determined with a widely accepted mathematic approximation based on calculated average distance of the closest three drillholes to the block (Table 14-71). The final classification of the block model and 3-hole average distance is illustrated in Figure 14-115 and Figure 14-116.
Table 14-71 Miradani North 2021 Resource Classification Criteria
Classification Category
Drill Spacing (m) 3-Hole Average
Distance (m)
Measured (1) No Measured classification defined -
Indicated (2) 45 x 45 (m) drill spacing (Domain 100) <= 31.82
Inferred (3) 80 x 80 (metre) drill spacing, or nearest DH < 60 metre distance <= 56.58

NI 43-101 Technical Report for the Asanko Gold Mine, Ashanti Region, Ghana
Effective Date: February 28, 2022
Page 302
Figure 14-115 Illustration of Miradani North 2021 Resource Classification
Figure 14-116 Miradani Plan View of Blocks Coloured by 3-Hole Average Distance to Block Centroids

NI 43-101 Technical Report for the Asanko Gold Mine, Ashanti Region, Ghana
Effective Date: February 28, 2022
Page 303
14.6.7 Reasonable Prospect of Eventual Economic Extraction
The Miradani mineralization is assumed amenable to open pit mining and milling and recovery through CIL gold processing. The reasonable prospect for eventual economic extraction of the Mineral Resources was tested by constraining the Mineral Resources within a conceptual pit shell optimized in NPV Scheduler™ software at US$1,600/oz gold price with all the materials of Indicated and Inferred classes and with a reporting cut-off grade of 0.5 g/t Au. The conceptual constraining parameters are listed in Table 14-72. See “Cautionary Note about Mineral Resources”.
Table 14-72 Miradani North Conceptual Pit Parameters
Parameter Value
Gold Price (US$/ounce) 1,600
Mining Cost (US$/tonne) 1.025 - 1.647
Mining Cost Incremental (US$/Vertical 6m) 0.0087 – 0.0353
Mill Feed Transport (US$/tonne) 2.86
Process Cost (US$/tonne) 8.79 – 11.32
Gold Recovery (%) 94%
General and Administration (US$/tonne) 6.55
14.6.8 Mineral Resource Statement
The Miradani Mineral Resource estimate is reported in accordance with the CIM Definition Standards for Mineral Resources & Mineral Reserves, adopted by CIM Council May 10, 2014.
The Qualified Person is Eric Chen, P.Geo. who is Galiano Gold’s former Vice President of Technical Services. The effective date is February 28, 2022. The Mineral Resource estimate is reported assuming open pit mining and milling and CIL gold processing methods using a cut-off grade of 0.5 g/t Au, is constrained within a conceptual open pit prepared using NPV Scheduler™ software. The Mineral Resource estimates are summarized in Table 14-73. The estimated grades and tonnages for multiple cut-offs are shown in Figure 14-117.
Table 14-73 Miradani North Mineral Resource Estimate at a 0.5 g/t Au cut-off and $1,600/oz Au, as of February 28, 2022
Category
Cutoff Grade
(g/t Au) Tonnes (kt) Au (g/t)
Au Metal Contained
(koz)
Measured na na na na
Indicated 0.5 7,116 1.28 293
Measured & Indicated 0.5 7,116 1.28 293
Inferred 0.5 2,615 1.21 102
Notes: 1. The Mineral Resource estimates are reported in accordance with the CIM Definition Standards for Mineral
Resources & Mineral Reserves, adopted by CIM Council May 10, 2014. 2. The effective date for the Mineral Resource estimates is February 28, 2022 3. Mineral Resource estimates account for mining depletion as of February 28, 2022 4. Reasonable Prospects for eventual economic extraction assume open pit mining with conventional gold
processing and was tested using NPV Scheduler™ pit optimization software using several technical parameters including:
a. $1,600/oz Au price b. $1.025/t to $1.647/t mining costs c. $2.86/t mill feed transport costs d. $8.79/t to $11.32/t processing costs e. 94% Au recovery for all material f. $6.55/t G&A
5. Applicable rounding has been applied to the stated tonnages, grades, and metal content to reflect the level of accuracy and precision of the estimate

NI 43-101 Technical Report for the Asanko Gold Mine, Ashanti Region, Ghana
Effective Date: February 28, 2022
Page 304
Figure 14-117 Miradani North Tonnage - Grade Curve for Indicated Mineral Resources
14.6.9 Factors That May Affect the Mineral Resource Estimate
Other than as discussed in other sections of this report there are no known environmental, permitting, legal, title, taxation, socio-economic, marketing, and political or other relevant issues that may materially affect the Mineral Resource estimates. Other relevant factors that may materially affect the Mineral Resources, including mining, metallurgical recovery, and infrastructure are reasonably well understood according to the assumptions presented in this Report.
The current Mineral Resource estimation carries small to moderate uncertainty and risk. The shallow dipping higher grade structures developed within the general mineralized envelope based on the current geological/structural interpretations were confirmed by the spatial continuity analysis of the drillhole sample grades. But some drill holes have been drilled in azimuth and dip angles not optimal to fully define those smaller structures. There is uncertainty in the actual number and extent of those structures which require some additional drilling to confirm before mining takes place.
The depth of the previous mining was based on the best estimate as it is now covered in water, which may result in small uncertainty of the amount of in-situ mineralized material still remaining near the surface.

NI 43-101 Technical Report for the Asanko Gold Mine, Ashanti Region, Ghana
Effective Date: February 28, 2022
Page 305
14.7 Asuadai Mineral Resource Estimate
The Asuadai Mineral Resource was last updated by Mr. Shaun Hackett of Gold Fields and reported in 2020 NI 43-101 Technical Report. The QP has reviewed this estimate and is satisfied that the work was conducted at an acceptable level for the reporting of Mineral Resources according to CIM (2014) and the NI 43-101. No mining or additional drilling has been carried out at Asuadai since 2014.
14.7.1 Database
There are 59 diamond drill holes used for the modelling project. Four drillholes are excluded as they did not contain sufficient information in the primary tables. There are 77 reverse circulation drillholes used for the modelling project. The supplied files also included information on diamond drillholes and rotary air blast percussion holes that are excluded as it was supplied in other files and the RAB drillhole data was excluded as it is a poor-quality drilling method. Additionally, RC holes outside of the modelling area also in the supplied data are excluded.
14.7.1.1 Validation of Exploration Data
Leapfrog data validation tools were used to identify errors and warnings in the drill hole database. All errors and warnings were addresses in the primary files. For the secondary files all errors were eliminated but some warnings remain. Warnings do not affect Leapfrogs use of these drill holes.
Collar elevations were compared to the topographic surface. The majority of the drillholes are within 1 metre of the topo. All drillhole collars were subsequently pressed to the current topographic surface for modelling.
The drillhole database was compared to the Datamine Studio drillhole filed used for the 2014 estimate. Holes were checked for availability. Three RC holes were found in the 2014 Datamine file that were not available in the current drillhole database. These holes were extracted and added to the current project drillhole file in Datamine for grade modelling. These holes could not be added for the geological modelling in Leapfrog as they were only available in a desurveyed format and did not have the component collar, survey and interval data required for loading into Leapfrog.
14.7.2 Geological Models
Mineralization is hosted within an east-northeast trending shear zone which cuts through sediment packages and is also found parallel to bedding within wacke/sandstones on the southeast footwall side and wacke/siltstones on the northeast hanging wall side. Diorite dykes have intruded along the central lithological contact of the shear. Sub-parallel to this central contact are hanging wall and footwall extents of the shear zone.
A series of repeating north-south trending structures cross the shear zone, offsetting the main lithological contact and the hanging wall shear contact. Each of the diorite bodies appears to be bracketed by a pair of these north-south structures. These structures are not evident on the magnetic images due to their orientation and the low magnetic contrast in the host lithologies (Figure 14-118).
The geological model builds on the observations and concepts modelled by HMM Consultancy in 2014. The geological model was constructed using Leapfrog Geo and was built in four parts:
1. Lithology model (GROCK)
2. Structural model (Interpreted structural planes)
3. Mineralization model (MDOM)
4. Material Type model (MROCK)

NI 43-101 Technical Report for the Asanko Gold Mine, Ashanti Region, Ghana
Effective Date: February 28, 2022
Page 306
14.7.2.1 Lithology, Structure, and Material Type Models
The lithology, structure, and material type models were initially interpreted from the diamond drill holes. These models, along with the mineralization model, were updated to account for the mineralization intersected in the RC drill holes. The lithology and structural models are shown fin Figure 14-118.
Figure 14-118 Asuadai Lithological and Structural Models
The material type represents different levels of weathering for material movement purposes. A simple weathering model was constructed from the diamond drill hole logged for the base of complete oxidation (BOCO) and the top of fresh rock (TOFR). The model divided weathering into Oxide (strongly to moderately oxidized), Transitional (weakly oxidized) and Fresh (fresh rock) material types. Away from the drilling the thickness of weathering was maintained parallel to topography. The weathering model was deemed to be suitable for assessing simple mineral process flow sheets but may not be sufficiently detailed for complicated processing assessments.

NI 43-101 Technical Report for the Asanko Gold Mine, Ashanti Region, Ghana
Effective Date: February 28, 2022
Page 307
Figure 14-119 Asuadai Material Type Models
14.7.2.2 Mineralization Model
HMM Consultancy observed two generations of mineralization in 2014 (Dusci & Davies, 2014), an earlier, steep, ductile-type mineralization, parallel to bedding and foliation and a later set of shallow dipping quartz veins. They considered that the shallow set of veins represented the dominant mineralization and were best developed within the diorite bodies. They also noted an increase in sheer intensity and mineralization in the sediments adjacent to the diorite contact. This observation is consistent with Asanko Gold’s Dynamite Hill deposit where increased intensity of shearing adjacent to the granite contacts is observed in the pit. They interpreted a moderate plunge to the mineralization towards the southwest at the intersection between the northeast–southwest main shear and the north-south crosscutting structures. This is different to other deposits in the area which dominantly show a northerly plunge to mineralization.
To guide the mineralization modelling a preliminary analysis was undertaken on the raw grades within the modelled lithologies and material types. This confirmed that the diorite (DI) hosts the higher-grade material and that there is only a small difference between the sediment units (FW_SED, HW_SED) within the main shear. The oxide appeared to be slightly higher-grade than the transitional and fresh material (Figure 14-120).

NI 43-101 Technical Report for the Asanko Gold Mine, Ashanti Region, Ghana
Effective Date: February 28, 2022
Page 308
Grade Analysis by Lithology Grade Analysis by Weathering
Figure 14-120 Asuadai Preliminary Grade Analysis
For the mineralization model, the main shear was split into fault blocks along strike between the north-south structures (FB1 to FB6) and a wireframe was constructed adjacent to the diorite contact capturing the higher shear intensity mineralization in the sediments close to the diorite contact (DI shear) (Figure 14-121).
Figure 14-121 Asuadai Mineralization Model

NI 43-101 Technical Report for the Asanko Gold Mine, Ashanti Region, Ghana
Effective Date: February 28, 2022
Page 309
A secondary grade analysis was undertaken to assess the impact of the mineralization domains. This showed a clear variation in grade between the different fault blocks within the main shear and confirmed the higher-grade mineralization in the sediments adjacent to the diorite contact (Figure 14-122).
Figure 14-122 Asuadai Secondary Grade Analysis
Many of the geological concepts observed and modelled by HMM Consultancy in 2014 were supported by the relogging exercise and were incorporated into the updated model. The geological models are therefore similar. In the current model the diorites were modelled as two discreet bodies as opposed to a continuous dyke as was modelled in 2014. The relogging programme did not support the 2014 modelled phyllite/shale units and these were updated as structural contacts rather than lithological units. The footwall contact to the main shear has been introduced. The new material type model is smoother and slightly deeper for the oxides compared to 2014.
All domains are summarized in Table 14-74.

NI 43-101 Technical Report for the Asanko Gold Mine, Ashanti Region, Ghana
Effective Date: February 28, 2022
Page 310
Table 14-74 Asuadai Mineralized Domains
Leapfrog Output file Datamine Wireframe File Datamine Mode
Topographic model
TOPO TOPO 1
Lithological model
GROCK - DI LITH 10
GROCK - HW_SED LITH 22
GROCK - FW_SED LITH 21
GROCK - HW_WASTE LITH 32
GROCK - FW_WASTE LITH 31
Structural model
NS12 STRUC 1
NS23 STRUC 2
NS34 STRUC 3
NS45 STRUC 4
NS56 STRUC 5
STRUCTURE_FW STRUC 6
STRUCTURE_HW STRUC 7
MAIN_SED_CONTACT STRUC 8
Material type model
MROCK - OXIDE MROCK 2
MROCK - TRANS MROCK 3
MROCK - FRESH MROCK 4
Mineralization model
MDOM - MDOM_DI DOMAIN 100
MDOM - MDOM_DI_SHEAR DOMAIN 200
MDOM - MAIN_SHEAR_FB1 DOMAIN 301
MDOM - MAIN_SHEAR_FB2 DOMAIN 302
MDOM - MAIN_SHEAR_FB3 DOMAIN 303
MDOM - MAIN_SHEAR_FB4 DOMAIN 304
MDOM - MAIN_SHEAR_FB5 DOMAIN 305
MDOM - MAIN_SHEAR_FB6 DOMAIN 306
MDOM - MDOM_FW_WASTE DOMAIN 901
MDOM - MDOM_HW_WASTE DOMAIN 902
Ancillary wireframes
Main_Shear_0.3g_Ind - Min SUBDOM 10
DH_ALL - DH_10m DHSPACE 10
DH_ALL - DH_20m DHSPACE 20
DH_ALL - DH_40m DHSPACE 40
14.7.3 Exploration Data Analysis
Statistical analysis was carried out using Snowden Supervisor version 8.8. The domains are a combination of lithology, material type and fault blocks.

NI 43-101 Technical Report for the Asanko Gold Mine, Ashanti Region, Ghana
Effective Date: February 28, 2022
Page 311
In the main shear sediments, transitional and fresh material was found to have a similar grade distribution while there is a bias towards the oxide material (Figure 14-123). Oxide material is therefore being domained separately in the main shear sediments except for fault block 1 which only contains a small number of drill holes. The diorite and the contact shear sediments do not show a bias to the oxide material and therefore all material types are grouped together for estimation. Summaries of the domain codes used to distinguish the data during geostatistical analysis and estimation are shown in Table 14-75.
Figure 14-123 Asuadai Material Type Analysis
Table 14-75 Asuadai Estimation Domains
ESTIMATION DOMAIN
GROCK MROCK MDOM
DOMAIN
FAULT BLOCK
DESCRIPTION
D1000 10 2-4 100 - Diorite intrusive
Oxide, transition and fresh
D2000 21-22 2-4 200 - Contact Shear sediments
Oxide, transition and fresh
D3220 21-22 2 302 2 Fault block 2 Main Shear sediments
Oxide
D3240 21-22 3-4 302 2 Fault block 2
Main Shear sediments
Transition and fresh
D3320 21-22 2 303 3 Fault block 3
Main Shear sediments Oxide
D3340 21-22 3-4 303 3 Fault block 3
Main Shear sediments
Transition and fresh
D3420 21-22 2 304 4 Fault block 4
Main Shear sediments
Oxide

NI 43-101 Technical Report for the Asanko Gold Mine, Ashanti Region, Ghana
Effective Date: February 28, 2022
Page 312
ESTIMATION DOMAIN
GROCK MROCK MDOM
DOMAIN
FAULT BLOCK
DESCRIPTION
D3440 21-22 3-4 304 4 Fault block 4
Main Shear sediments
Transition and fresh
D3520 21-22 2 305 5 Fault block 5
Main Shear sediments
Oxide
D3540 21-22 3-4 305 5 Fault block 5
Main Shear sediments
Transition and fresh
D3100 21-22 2-4 301 1 Fault block 1
Main Shear sediments
Oxide, transition and fresh
14.7.3.1 Gold Grade Capping/Outlier Restrictions
The data was assessed for high-grade outlier samples. A top cap or truncation approach has been used where grade values above the selected top cap threshold are reduced in value to the threshold. The threshold is selected by reviewing the anamorphosis model and selecting an upper limit that results in a good fit of the anamorphosis model through the whole grade range (Figure 14-124).
Raw Anamorphosis Fit Top-capped Anamorphosis Fit – Domain 3420
Figure 14-124 Top Cap Selection Example
The selected top cap thresholds and influence of the top cap on the calculation of the global mean for each domain can be seen in Table 14-76.
14.7.3.2 Composites
Most of the samples were originally collected at sample length of 1 metre or smaller. There are a small number of RC holes that were originally collected at 1.5 metre samples lengths. Coded drill hole sample intervals were composited to 1 metre composite lengths for each domain. Where the total drill hole intersection in a domain is not a multiple of the 1 metre.

NI 43-101 Technical Report for the Asanko Gold Mine, Ashanti Region, Ghana
Effective Date: February 28, 2022
Page 313
Table 14-76 Asuadai Domain Statistics and Top Caps
ESTIMATION DOMAIN RAW DATA TOPCAP DATA DE-CLUSTER
Count Minimum Maximum Mean Variance Topcap Number Mean Variance Mean Variance
D1000 658 0 53.82 1.05 10.83 20.00 3 0.95 4.52 0.93 3.85
D2000 763 0 28.15 1.00 4.94 20.00 3 0.98 4.3 1.00 5.17
D3220 275 0 4.13 0.18 0.17 2.00 3 0.17 0.12 0.14 0.11
D3240 1306 0 9.12 0.17 0.29 2.00 17 0.15 0.1 0.16 0.13
D3320 405 0 12.2 0.32 0.89 N/A 0 0.32 0.89 0.28 0.69
D3340 1200 0 15.33 0.35 1.42 N/A 0 0.35 1.42 0.32 1.3
D3420 792 0 95.00 0.87 17.19 20.00 3 0.73 3.37 0.55 3.22
D3440 2716 0 34.00 0.35 1.54 20.00 1 0.35 1.27 0.32 1.31
D3520 126 0 13.10 0.48 2.32 2.00 4 0.31 0.24 0.36 0.28
D3540 516 0 24.59 0.45 2.79 8.00 4 0.41 1.55 0.45 2.06
D3100 109 0 5.00 0.10 0.23 2.00 1 0.07 0.04 0.07 0.06
14.7.3.3 Declustering
The drilling shows a typical spatial bias, with additional drilling being carried out in higher grade areas and a higher density of drilling close to surface than at depth. To account for this in the global data analysis a moving window declustering algorithm was applied. The moving window size was selected at 70 x 70 x 20 metre which roughly equates to the broader, regular drill spacing in the project. The influence of the declustering algorithm on the calculation of the global mean for each domain can be seen in Table 14-76.
14.7.3.4 Variography
The domains were grouped for variography based on the geometry of the mineralization. The diorite and the contact shear mineralization have a steep southerly plunge and the variogram (V101) was orientated to reflect this. The mineralization in the main shear sediment domains is parallel to the shear and V301 is orientated to reflect this. The variograms are modelled on experimental gaussian variograms which are moderately to poorly structured. To reflect the uncertainty in the variogram structure, a second set of alternate variogram models were developed (V102 and V302) and in each of these models a short-range structure was introduced with a local rotation to align the variogram structure to the flat lying vein geometry reported from the drill core. Variogram parameters are summarized in Table 14-77 and modelled variograms are shown in Figure 14-125 Asuadai Relative Variogram Models
Table 14-77 Asuadai Variogram Parameters
Variogram Structure Sill Range U Range V Range W Rotation
V101
S1 Nugget 0.20
S2 0.35 14 6 2 -150,65,51
S3 0.45 80 10 10 -150,65,51
V102
S1 Nugget 0.20
S2 0.45 10 10 2 180,5,0
S3 0.1 14 12 8 -150,65,51
V301
S4 0.25 80 20 10 -150,65,51
S1 Nugget 0.20
S2 0.35 30 20 10 -115,0,70
V302
S3 0.45 150 40 30 -115,0,70
S1 Nugget 0.2
S2 0.35 10 10 20 180,5,0

NI 43-101 Technical Report for the Asanko Gold Mine, Ashanti Region, Ghana
Effective Date: February 28, 2022
Page 314
Figure 14-125 Asuadai Relative Variogram Models
14.7.4 Estimation/Interpolation Methods
14.7.4.1 Block Model Setup
The Asuadai block model was developed within Datamine StudioRM. Three block sizes were considered in the block model development, the SMU which is the smallest unit that a mining decision is based on (5 x 5 x 3 metre), a less selective waste block (10 x 10 x 6 metre) and a large-scale panel (50 x 50 x 24 metre), each block size being a multiple of the smaller block size. The primary block model setup dimensions are presented in Table 14-78.
Table 14-78 Asuadai Block Model Dimensions
Dimension Origin Extent SMU Size Number of SMUs
X 617800 mE 600 m 5 120
Y 708950 mN 850 m 5 170
Z -50 mRL 405 m 3 135
The block model was coded according to the geological model wireframes. For volume resolution, blocks were sub-celled to a sub-cell resolution of 1 x 1 x 1 metre (Figure 14-126).

NI 43-101 Technical Report for the Asanko Gold Mine, Ashanti Region, Ghana
Effective Date: February 28, 2022
Page 315
Figure 14-126 Asuadai Block Model Coded Domains
14.7.4.2 Density Assignment
The results of 109 density determination from drill core were supplied with the drilling data. Dry bulk density was assigned to the block model based on a combination of lithology and material type. Density values have changed slightly from those used in 2014 and were rounded to reflect an appropriate level of precision (Table 14-79).
Table 14-79 Asuadai Dry Bulk Density Values Assigned to the Block Model
Material Rock Type Density
Oxide All 1.9
Transitional All 2.3
Fresh Sediments 2.7
Diorite 2.6
14.7.4.3 Estimation
The grade model estimated for Asuadai is a localized, recoverable resource model with grades estimated at a SMU scale of 5 x 5 x 3 metre and is referred to as a localized SMU model (LSMU). The local metal distribution for the recoverable resource was estimated using conditional simulation.
Basic workflow for the LSMU model:
1. Point scale conditional simulation (sequential Gaussian simulation)
2. Re-block each realization to SMU scale (5 x 5 x 3 metre)
3. Divide the domain into panels (50 x 50 x 24 metre)
4. Calculate the local metal distribution within each panel from SMUs for all realizations at a sequence of cut-off grades
5. Index the SMU blocks within each panel to represent a local grade distribution
6. Assign grades from the local distribution in increasing sequence to SMUs ranked by the indexed values.

NI 43-101 Technical Report for the Asanko Gold Mine, Ashanti Region, Ghana
Effective Date: February 28, 2022
Page 316
The localisation is the same approach used for Localized Uniform Conditioning (LUC) which estimates localized SMU grades conforming to the proper grade–tonnage curves as well as maintaining the relative spatial grade distribution pattern indicated by the directly estimated small block grades. The applied estimation differs from LUC by obtaining the local distribution through conditional simulation rather than uniform conditioning. This maintains the advantages of having a probabilistic conditional simulation model (multiple realization models) while providing a deterministic summary model (one grade per block) to be used for the reporting and optimisation processes.
14.7.5 Validation
Validation of the block model included the validation of simulation model of the main mineralization domain, statistical comparison of the model and input data, visual inspection
14.7.5.1 Validation of Simulation
The point scale gaussian values are validated for reproduction of the global mean and variance (0 and 1). The validation of the Gaussian values for Doman 1000 is shown Figure 14-127. Reproduction of the mean is good across all realizations however the variance is systematically low. The QP has commonly found this with sequential gaussian simulation within Isatis, particularly when declustering has been applied to the data. The decluster weights are considered in the anamorphosis function but are not considered during simulation. Validation of the variogram reproduction also shows the reduced variance (Figure 14-128). The influence of the two variograms applied can also be seen in the variogram validation particularly in the short range.
Figure 14-127 Asuadai Validation of Gaussian Values
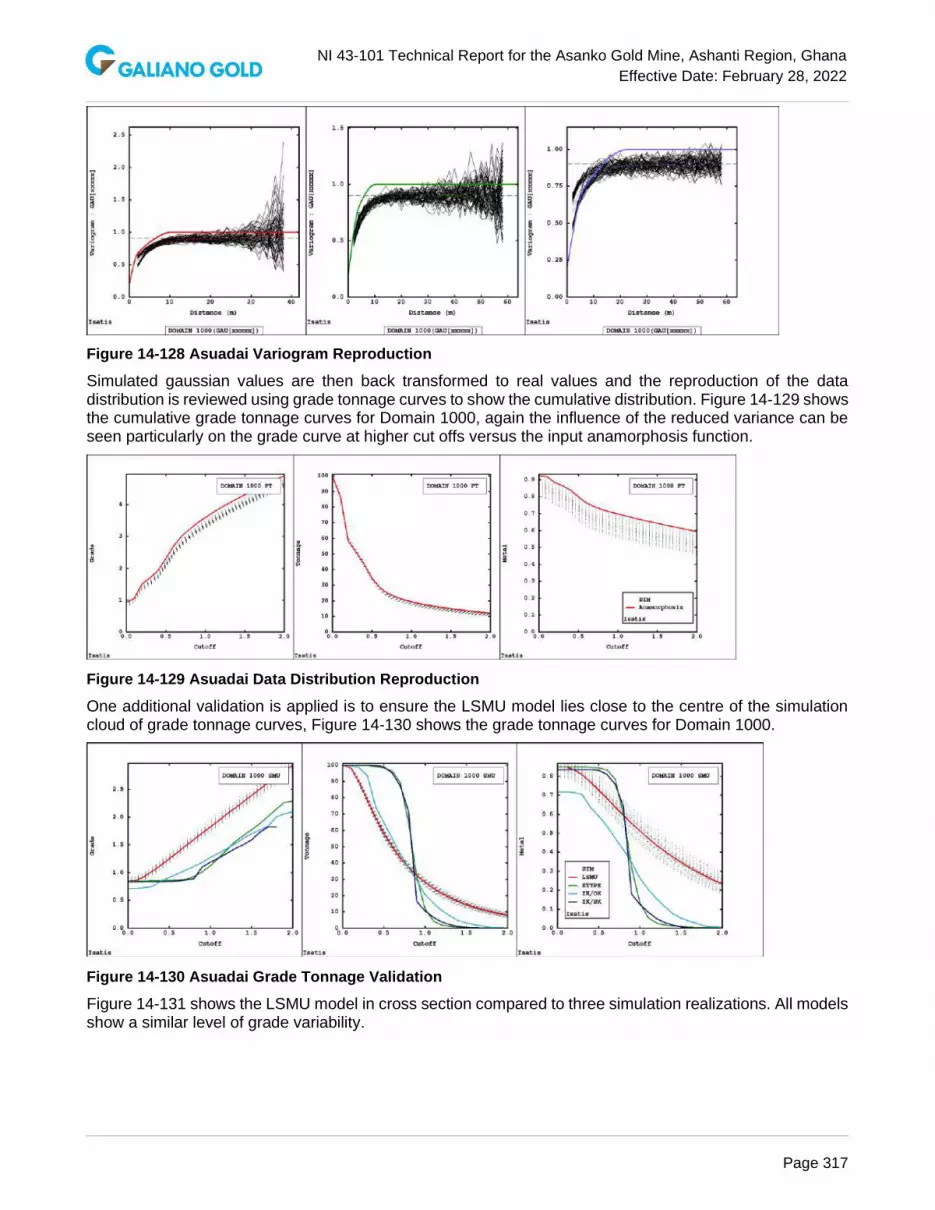
NI 43-101 Technical Report for the Asanko Gold Mine, Ashanti Region, Ghana
Effective Date: February 28, 2022
Page 317
Figure 14-128 Asuadai Variogram Reproduction
Simulated gaussian values are then back transformed to real values and the reproduction of the data distribution is reviewed using grade tonnage curves to show the cumulative distribution. Figure 14-129 shows the cumulative grade tonnage curves for Domain 1000, again the influence of the reduced variance can be seen particularly on the grade curve at higher cut offs versus the input anamorphosis function.
Figure 14-129 Asuadai Data Distribution Reproduction
One additional validation is applied is to ensure the LSMU model lies close to the centre of the simulation cloud of grade tonnage curves, Figure 14-130 shows the grade tonnage curves for Domain 1000.
Figure 14-130 Asuadai Grade Tonnage Validation
Figure 14-131 shows the LSMU model in cross section compared to three simulation realizations. All models show a similar level of grade variability.

NI 43-101 Technical Report for the Asanko Gold Mine, Ashanti Region, Ghana
Effective Date: February 28, 2022
Page 318
LSMU – Localized Model Mid-case Simulation Realization
Low-case Simulation Realization High-case Simulation Realization - Section 709200mN
Figure 14-131 Asuadai LSMU Model and Simulation Realizations
14.7.5.2 Information Effect
It is common in most recoverable resource techniques to apply an information effect. The purpose of the information effect is to make an allowance that “perfect” selectivity of SMUs will never be achieved as mining selection will be based on a short-term model from grade control spaced drilling and a degree of smoothing will be present due to this. Information effect is generally applied as a variance reduction when modelling the SMU distribution. In this case no information effect has been applied as there is already a reduced variance in the simulations.

NI 43-101 Technical Report for the Asanko Gold Mine, Ashanti Region, Ghana
Effective Date: February 28, 2022
Page 319
14.7.5.3 Reconciliation
No grade control or production has been undertaken at this project, so no reconciliations can be made.
14.7.6 Classification of Mineral Resources
Drill spacing is the primary factor to define resource classification and only Indicated and Inferred resources are defined at Asuadai. The 2014 Indicated classification used a nominal drill spacing of 20 x 20 metres, with the remainder being classified as Inferred. This spacing is inconsistent with other Asanko Gold deposits where a 40 x 40 metre drill spacing had been used to classify material as Indicated. A new classification scheme was proposed and applied as shown in Table 14-80 and a comparison of the 2014 and current block classification is shown in Figure 14-132.
Table 14-80 Asuadai Classification Criteria
Classification Category Drill Spacing (m) Use
Measured Measured classification not applied
Indicated 40 x 40 drilling Suitable for long-term mine planning
Inferred 80 x 80 drilling Suitable for conceptual studies
Based on the amount of unknown artisanal mining, consideration should be given to downgrading all material within 15 metres of surface to Inferred in future Mineral Resource updates.
Figure 14-132: Classification Comparison on Section 709200mN
14.7.7 Reasonable Prospect of Eventual Economic Extraction
The Asuadai mineralization is assumed amenable to open pit mining, and milling and recovery through CIL gold processing, and was evaluated for reasonable prospects for eventual economic extraction by constraining the Mineral Resources within a conceptual pit shell optimized in NPV Scheduler™. The assumptions used in preparing the conceptual pit, include mining and processing costs, metallurgical recovery, metal price and general and administrative costs, and are shown in Table 14-81 and approximately correspond to the 0.50 g/t Au Mineral Resource cut-off. See “Cautionary Note about Mineral Resources”.

NI 43-101 Technical Report for the Asanko Gold Mine, Ashanti Region, Ghana
Effective Date: February 28, 2022
Page 320
Table 14-81 Asuadai Conceptual Pit Parameters
Parameter Value
Gold Price (US$/ounce) 1,600
Mining Cost (US$/tonne) 1.025 – 1.647
Mining Cost Incremental (US$/Vertical 6m) 0.0087 – 0.0353
Mill Feed Transport (US$/tonne) 3.70
Process Cost (US$/tonne) 8.79 – 11.32
Gold Recovery (%) 94%
General and Administration (US$/tonne) 6.55
14.7.8 Mineral Resource Statement
The Asuadai Mineral Resource estimate is reported in accordance with the CIM Definition Standards for Mineral Resources & Mineral Reserves, adopted by CIM Council May 10, 2014.
The Qualified Person is Eric Chen, P.Geo. who is Galiano Gold’s former Vice President of Technical Services. The effective date is February 28, 2022. The Mineral Resource estimate is reported assuming open pit mining and milling and CIL gold processing methods using a cut-off grade of 0.5 g/t Au, is constrained within a conceptual open pit prepared using NPV Scheduler™ software. The Mineral Resource estimates are summarized in Table 14-82. The estimated grades and tonnages for multiple cut offs are shown in Figure 14-133.
Table 14-82 Asuadai Mineral Resource Estimate at a 0.5 g/t Au cut-off and $1,600/oz Au, as of February 28, 2022
Category
Cutoff Grade
(g/t Au) Tonnes (kt) Au (g/t)
Au Metal Contained
(koz)
Measured na na na na
Indicated 0.5 1,620 1.29 67
Measured & Indicated 0.5 1,620 1.29 67
Inferred 0.5 18 1.17 1
Note: 1. The Mineral Resource estimates are reported in accordance with the CIM Definition Standards for
Mineral Resources & Mineral Reserves, adopted by CIM Council May 10, 2014. 2. The effective date for the Mineral Resource estimates is February 28, 2022 3. Mineral Resource estimates account for mining depletion as of February 28, 2022 4. Reasonable Prospects for eventual economic extraction assume open pit mining with conventional gold
processing and was tested using NPV Scheduler™ pit optimization software using several technical parameters including:
a. $1,600/oz Au price b. $1.025/t to $1.647/t mining costs c. $3.70/t mill feed transport costs d. $8.79/t to $11.32/t processing costs e. 94% Au recovery for all material f. $6.55/t G&A
5. Applicable rounding has been applied to the stated tonnages, grades, and metal content to reflect the level of accuracy and precision of the estimate

NI 43-101 Technical Report for the Asanko Gold Mine, Ashanti Region, Ghana
Effective Date: February 28, 2022
Page 321
Figure 14-133 Asuadai Tonnage - Grade Curve for Indicated Mineral Resources
14.7.9 Factors That May Affect the Mineral Resource Estimate
Other than as discussed in other sections of this report there are no known environmental, permitting, legal, title, taxation, socio-economic, marketing, and political or other relevant issues that may materially affect the Mineral Resource estimates. Other relevant factors that may materially affect the Mineral Resources, including mining, metallurgical recovery, and infrastructure are reasonably well understood according to the assumptions presented in this Report.

NI 43-101 Technical Report for the Asanko Gold Mine, Ashanti Region, Ghana
Effective Date: February 28, 2022
Page 322
14.8 Adubiaso Mineral Resource Estimate
The estimate relating to this Mineral Resource was conducted by Mr. Shaun Hackett of Gold Fields. The QP has reviewed this estimate and is satisfied that the work was conducted at an acceptable level for the reporting of Mineral Resources according to CIM (2014) and the NI 43-101.
14.8.1 Database
Fifty-four diamond drill holes, including holes with RC pre-collars, 281 reverse circulation drillholes, and 4,985 grade control drillholes are used for the modelling project. Thirty-five RC holes drilled in 2016 are used in this Mineral Resource estimate. Five RCD holes drilled in 2020 totalling 1,312 metres are not used in this Mineral Resource estimate.
Figure 14-134 Plan View of Adubiaso Exploration Drillholes
14.8.1.1 Verification of Exploration Data
In addition to data verification discussed in Section 11 and 12 of this report, all drilling data was validated on import into Datamine. No major errors reported.
Assay intervals with no recorded gold grades were assumed to be low grade values.
14.8.2 Geological Models
This geological model was completely reinterpreted by M. Crawford (Crawford, 2019). The following descriptions are based on file notes collected during the modelling process.
The geology model has been built in four parts:
1. Lithology model (GROCK)
2. Structural model (Interpreted structural planes)
3. Mineralization model (MDOM)
4. Material type model (MROCK)

NI 43-101 Technical Report for the Asanko Gold Mine, Ashanti Region, Ghana
Effective Date: February 28, 2022
Page 323
14.8.2.1 Lithology, Structure, and Material Type Models
The Lithology model was developed from the diamond and RC drillholes only, as these have the most reliable logging information. The mineralization model uses the grade control drilling within the mined-out portion of the pit and then the same trends are imposed on the diamond and RC drilling at depth. Reference was made to available processed images from the airborne geophysics. The modelling in Leapfrog uses manually selected intervals and geological model algorithms to generate the resulting wireframe models. Lithology wireframe models are shown in Figure 14-135 and Figure 14-136.
The material type represents different levels of weathering and is suitable for assessing material movement and simple mineral processing flow sheets but may not be detailed enough for more complicated processing assessments.
Figure 14-135 Adubiaso Lithological and Structural Models (Section View)

NI 43-101 Technical Report for the Asanko Gold Mine, Ashanti Region, Ghana
Effective Date: February 28, 2022
Page 324
Figure 14-136 Adubiaso Lithological and Structural Models (Plan View)
14.8.2.2 Mineralization Model
The principal control on the mineralization is the Adubiaso shear. Within the shear the mineralization is then best developed along the hanging wall side of the felsic porphyry units. The mineralization appears to be a composite of moderately dipping structures hosting the higher gold grades (Figure 14-137 and Figure 14-138) within an overall steeper dipping envelope subparallel to the trend of the porphyries. Local thickening of the mineralization envelope also corresponds to higher intensity in the gold mineralization this appears to be controlled in part by the interpreted northwest/southeast crosscutting structure, resulting in a moderate northeast plunge to the mineralization.
Figure 14-137 Adubiaso Mineralization Model (Cross-section View)
Note: Blue stripes are conceptual illustrations of extension veins/structures and green stripes are modelled from drilling.

NI 43-101 Technical Report for the Asanko Gold Mine, Ashanti Region, Ghana
Effective Date: February 28, 2022
Page 325
Figure 14-138 Adubiaso Mineralization Model (Long-section View)
14.8.3 Exploration Data Analysis
Data analysis was undertaken to determine estimation domains and to derive parameters for estimation. Figure 14-139 shows the domain numbering convention based on progressive mineralization controls for the main domains. First order is the along strike variation within the shear numbered by fault block from SW to NE with values in the 1000 to 5000 range. Second order is variation across the shear with values in the 100-300. Third order is a sub domain based on the interpreted low angle structures or outside of the low angle structures using 10 for within the structures. Some minor domains were re-coded to incorporate them into larger adjacent domains where a domain numbering combination resulted in a small number of samples. The northern splay structure is assigned domain numbers in the 6000 series. Sub domain wireframes within the northern splay are individually number to subdomains (111-121). The felsic porphyries postdate mineralization and are coded to a domain series of their own (9000) except for the grade control samples. No lithological information is available for the grade control and the interpreted positions of the felsic porphyries are not sufficiently detailed enough at the grade control spacing.

NI 43-101 Technical Report for the Asanko Gold Mine, Ashanti Region, Ghana
Effective Date: February 28, 2022
Page 326
Figure 14-139 Adubiaso Domain Numbering Convention
Domain coding is summarized in Table 14-83.
Table 14-83 Adubiaso Wireframe files
Leapfrog Output File Datamine Wireframe File Datamine Code
Topographic model
TOPO_CURRENT TOPO 1
PREMINE_TOPO TOPO_PM 1
Lithological model
L - FP3 LITH 13
L - FP4 LITH 14
L - FP6 LITH 16
L - FP_2 LITH 12
L - FP_8 LITH 18
L - FP_Main_West LITH 11
L - GWK_FW LITH 31
L - GWK_HW LITH 33
L - PHYLLITE LITH 32

NI 43-101 Technical Report for the Asanko Gold Mine, Ashanti Region, Ghana
Effective Date: February 28, 2022
Page 327
Leapfrog Output File Datamine Wireframe File Datamine Code
Structural model
B_INT_LG_STH_BLOCK STRUC 1
B_INT_NTH_BLOCK_BOUNDARY STRUC 3
B_INT_NTH_BLOCK STRUC 4
B_INT_STH_INFLECTION_BLOCK STRUC 2
Material type model
MROCK - OXIDE MROCK 2
MROCK - TRANS MROCK 3
MROCK - FRESH MROCK 4
Mineralization model
MIN - MIN FAULT BLOCK (1-4) – HG MDOM_ENV 1100-4100
MIN - MIN FAULT BLOCK 5 - HG MDOM_ENV 5300
MIN - MIN FB 1 - CENTRAL MDOM_ENV 1300
MIN - MIN FB (2-4) - CENTRAL MDOM_ENV 2200-2400
MIN - MIN FB 5 - CENTRAL MDOM_ENV 5300
MIN - MIN FB 5 - CENTRAL_NTH MDOM_ENV 6200
MIN - MIN FAULT BLOCK (1-5) - LG MDOM_ENV 1300-5300
V_NTH_BLOCK_WEST MDOM_ENV 6300
Mineralized structures interpretations
GM_EXTENSIONVEINS – EV* MDOM_EV Nov-43
GM_EXTENSIONVEINS – AA* MDOM_EV 51-62
F* MDOM_EV 71-92
D_NTH_ZONE MDOM_EV 111
D_ZONE_NTH_WEST* MDOM_EV 112-121
Ancillary wireframes
ADUBIASO_PIT PIT 20
DH_SPACE - 10 DHSPACE 10
DH_SPACE - 20 DHSPACE 20
DH_SPACE - 30 DHSPACE 30
DH_SPACE - 40 DHSPACE 40
A check for influence of weathering on the grade distribution indicates weathering does not appear to alter the grade distribution to any significant degree (Figure 14-140).

NI 43-101 Technical Report for the Asanko Gold Mine, Ashanti Region, Ghana
Effective Date: February 28, 2022
Page 328
Figure 14-140 Adubiaso Material Type Analysis
A comparison of GC, RC and DDH assays indicates there is an apparent low bias in the GC and RC sampling compared to the diamond drilling for samples collected in the upper portion of the main domain (Figure 14-141). This bias is considered a function of the drill density, related to the short scale mineralization structures. As the project advances this bias should be further investigated to confirm the underlying cause. For this model no action has been take on the bias.
The drillhole data used for resource estimation were predominately RC, hence the estimates would more heavily weighted towards RC samples. The low bias in RC samples would likely produce a more conservative grade estimation on the global sense.
Figure 14-141 Adubiaso Cumulative Grade Frequency by Drill Hole Type

NI 43-101 Technical Report for the Asanko Gold Mine, Ashanti Region, Ghana
Effective Date: February 28, 2022
Page 329
14.8.3.1 Gold Grade Capping/Outlier Restrictions
The data has been assessed for high-grade outlier samples. A top-capping or truncation approach has been used where grade values above the selected top-cap threshold are reduced in value to the threshold. The threshold is selected by reviewing the anamorphosis model and selecting an upper limit that results in a good fit of the anamorphosis model through the whole grade range (Figure 14-142). Generally, top-cap thresholds in this methodology only affect a small number of samples and are typically higher than those that would be selected for kriging. The selected top-cap thresholds and influence of the top-cap on the calculation of the global mean for each domain can be seen Table 14-84.
Figure 14-142 Adubiaso Topcap Selection Example
14.8.3.2 Composites
Coded drillhole sample intervals were composited to 1 metre composite lengths for each domain. Where the total drillhole intersection in a domain is not a regular multiple of 1metre the composite length is adjusted slightly to reflect an even composite length close to 1 metre. Most of the samples were originally collected at sample length of 1 metre or smaller. Pre and post capping composite statistics are shown in Table 14-84.
Table 14-84 Adubiaso Domain Pre and Post Top Cut Statistics
DOMAIN Count Min (Au
g/t) Max (Au
g/t) Mean
(Au g/t) Var
Cap (Au g/t)
# of Comp. Capped
Mean (Au g/t)
Var
D2110 397 0.01 104.5 2.27 61.68 2.27 61.68
D3110 3748 0.01 108.55 1.94 24.15 100 1 1.94 23.68
D4110 316 0.01 35.2 1.23 9.51 10 4 1.07 3.6
D2210 299 0.01 25.33 0.87 7.88 20 2 0.84 6.83
D3210 2564 0.01 58.93 1.2 14.8 1.2 14.8
D4210 650 0.01 133.33 1.9 43.77 1.9 43.77
D2310 1110 0.01 105.27 0.76 24.92 0.76 24.92
D3310 3197 0.01 105 0.93 14.38 0.93 14.38
D4310 304 0.01 132.8 1.09 61.93 20 2 0.7
D5310 18 0.03 15.93 1.28 12.84 5 1 0.67 1.32

NI 43-101 Technical Report for the Asanko Gold Mine, Ashanti Region, Ghana
Effective Date: February 28, 2022
Page 330
DOMAIN Count Min (Au
g/t) Max (Au
g/t) Mean
(Au g/t) Var
Cap (Au g/t)
# of Comp. Capped
Mean (Au g/t)
Var
D6111 58 0.01 6.02 0.67 1.13 0.67 1.13
D6112 259 0.01 3.2 0.53 0.34 0.53 0.34
D6113 81 0.01 18.5 1.28 9.82 10 3 1.07 4.22
D6114 37 0.01 7.66 0.77 2.13 0.77 2.13
D6115 119 0.01 22.3 0.68 4.88 0.68 4.88
D6116 389 0.01 9.16 0.14 0.32 0.14 0.32
D6117 182 0.01 7.26 0.31 0.83 0.31 0.83
D6118 45 0.01 3.28 0.54 0.52 0.54 0.52
D6119 771 0.01 122 1.69 58.38 1.69 58.38
D6120 93 0.01 7.25 0.37 0.71 0.37 0.71
D6121 187 0.01 12.9 1.03 3.35 1.03 3.35
D2100 1081 0.01 305.67 1.14 101 20 5 0.76 4.43
D3100 14949 0.01 430.75 1.84 54.91 200 3 1.81 39.12
D4100 662 0.01 29.9 0.52 3.08 0.52 3.08
D2200 1151 0.01 30.2 0.22 1.27 0.22 1.27
D3200 11950 0.01 76.25 0.27 3.02 0.27 3.02
D4200 1755 0.01 56.47 0.51 5.84 0.51 5.84
D2300 4006 0.01 117.24 0.23 5.97 0.23 5.97
D3300 16842 0.01 114.53 0.2 2.86 0.2 2.86
D4300 2132 0.01 13.9 0.14 0.41 0.14 0.41
D5300 2002 0.01 74.21 0.13 3.62 5 6 0.07 0.11
D1100 50 0.01 0.06 0.02 0.01 0.02 0.01
D1300 172 0.01 1.51 0.07 0.03 0.07 0.03
D6200 1857 0.01 327.47 0.94 125.5 20 12 0.49 3.96
D6300 11816 0.01 358 0.15 14.45 20 5 0.1 0.41
D9000 2760 0.01 48.9 0.18 2.78 3 15 0.11 0.09
14.8.3.3 Variography
Two variogram orientations were applied to this model; the first aligned parallel to the low angle structures and the second aligned parallel to the shear (Table 14-85). Half of the simulation realizations were run with the first variogram and then the remaining simulation realizations were run with the second variogram.
Table 14-85 Adubiaso Applied Variogram Parameters
Variogram Structure Sill Range U Range V Range W Rotation
V3100
S1 Nugget 0.2
S2 0.5 5 5 2 210,130, -160
S3 0.2 20 15 5 210,130, -160
S4 0.1 110 75 15 210,130, -160
V3300
S1 Nugget 0.2
S2 0.3 8 3 3 210,75,180
S3 0.2 19 7 7 210,75,180
S4 0.4 100 30 30 210,75,180
Note: All rotations use Isatis geologist plane convention

NI 43-101 Technical Report for the Asanko Gold Mine, Ashanti Region, Ghana
Effective Date: February 28, 2022
Page 331
14.8.4 Estimation/Interpolation Methods
14.8.4.1 Block Model Setup
The Adubiaso block model was developed within Datamine Studio. Three block sizes were considered in the block model development, the selective mining unit (SMU) which is the smallest unit that a mining decision is based on (5 x 5 x 3 metre), a less selective waste block (10 x 10 x 6 metre) and a large-scale panel (50 x 50 x 24 metre) each block size being a multiple of the smaller block size. The primary block model setup dimensions are presented in Table 14-86.
Table 14-86 Adubiaso Block Model Dimensions
Dimension Origin Extent (m) SMU Size (m) Number of SMUs
X 610500 mE 1,500 5 310
Y 703600 mN 2,050 5 410
Z -50 mRL 336 3 112
The block model was coded according to the geological model wireframes. For volume resolution, blocks were sub-celled to a sub-cell resolution of 1 x 1 x 1 metre.
Figure 14-143 Adubiaso Plan View Showing Coded Block Model by Lithology Wireframes

NI 43-101 Technical Report for the Asanko Gold Mine, Ashanti Region, Ghana
Effective Date: February 28, 2022
Page 332
14.8.4.2 Density Assignment
Dry bulk density has been assigned to the block model based on a combination of lithology and material type. The same density values as used at Asuadai have been applied as similar rock types are present at both deposits. Density values have changed slightly from those used in 2014 and have been rounded to reflect an appropriate level of precision (Table 14-87).
Table 14-87 Adubiaso Bulk Density Block Assignment
Description GROCK MROCK Dry Bulk Density (t/m3) 2014 Density
Waste Dump N/A 5 1.3
All Oxide Material ALL 2 1.9 1.78
All Transitional Material ALL 3 2.3 2.23
Fresh Sediments 31-33 4 2.7 2.73
Fresh Porphyry 11-18 4 2.6 2.64
14.8.4.3 Estimation
The grade model estimated for Adubiaso is a localized, recoverable resource model with grades estimated at a SMU scale of 5 x 5 x 3 metre and is referred to as a localized SMU model (LSMU). The local metal distribution for the recoverable resource was estimated using conditional simulation.
Basic workflow for the LSMU model:
1. Point scale conditional simulation (sequential Gaussian simulation)
2. Re-block each realization to SMU scale (5 x 5 x 3 metre)
3. Divide the domain into panels (50 x 50 x 24 metre)
4. Calculate the local metal distribution within each panel from SMUs for all realizations at a sequence of cut-off grades
5. Index the SMU blocks within each panel to represent a local grade distribution
6. Assign grades from the local distribution in increasing sequence to SMUs ranked by the indexed values.
The localisation is the same approach used for Localized Uniform Conditioning (LUC) which estimates localized SMU grades conforming to the proper grade–tonnage curves as well as maintaining the relative spatial grade distribution pattern indicated by the directly estimated small block grades. The applied estimation differs from LUC by obtaining the local distribution through conditional simulation rather than uniform conditioning. This maintains the advantages of having a probabilistic conditional simulation model (multiple realization models) while providing a deterministic summary model (one grade per block) to be used for the reporting and optimisation processes.
14.8.5 Validation
Validation of the block model included the validation of simulation model of the main mineralization domain, statistical comparison of the model and input data, visual inspection
14.8.5.1 Validation of Simulation
The point scale gaussian values are validated for reproduction of the global mean and variance (0 and 1). The validation of the Gaussian values for Doman 3110 is shown in Figure 14-144. Reproduction of the mean is slightly low across all realizations and the variance is slightly low. The influence of the two variograms applied can also be seen in the validation with the change at realization 30.

NI 43-101 Technical Report for the Asanko Gold Mine, Ashanti Region, Ghana
Effective Date: February 28, 2022
Page 333
Figure 14-144 Adubiaso Validation of Gaussian Values
Simulated gaussian values are then back-transformed to real values and the reproduction of the data distribution is reviewed using grade tonnage curves to show the cumulative distribution. Figure 14-145 shows the cumulative grade tonnage curves for Domain 3110 versus the input anamorphosis function.
Figure 14-145 Adubiaso Data Distribution Reproduction
Once the LSMU model is produced, it was validated with similar processes to other models. One additional validation is applied is to ensure the LSMU model lies close to the centre of the simulation cloud of grade tonnage curves, Figure 14-146 shows the grade tonnage curves for Domain 3110.

NI 43-101 Technical Report for the Asanko Gold Mine, Ashanti Region, Ghana
Effective Date: February 28, 2022
Page 334
Figure 14-146 Adubiaso Grade Tonnage Validation
The global grade tonnage curve is shown in Figure 14-147 for the LSMU model and simulation average. The LSMU model reflects the selectivity shown in the simulation realizations (discussed above) and is higher than that for the simulation average, as expected. The simulation average typically performs in a similar manner to that of a linear kriged estimation and gives an indication of what a smoother kriged model would look like in terms of selectivity.
Figure 14-147 Adubiaso Global Model Grade Tonnage Curve
14.8.5.2 Information Effect
It is common in most recoverable resource techniques to apply an information effect. The purpose of the information effect is to make an allowance that “perfect” selectivity of SMUs will never be achieved as mining selection will be based on a short-term model from grade control spaced drilling and a degree of smoothing will be present due to this. Information effect is generally applied as a variance reduction
when modelling the SMU distribution. In this case no information effect has been applied as there is already a reduced variance in the simulations.

NI 43-101 Technical Report for the Asanko Gold Mine, Ashanti Region, Ghana
Effective Date: February 28, 2022
Page 335
14.8.5.3 Mining Selectivity
This model has not been adjusted to represent mining selectivity for optimisation. The LSMU model using a conditional simulation approach with minimal smoothing, results in a high selective SMU block scale model. The degree of selectivity represented is much higher than that which will me achieved at the mining stage. Designed dig blocks that consolidate multiple SMU sized blocks into a larger contiguous mining shape to incorporate SMU blocks with grades below the desired cutoff (internal dilution) is recommended for mine planning.
14.8.5.4 Reconciliation
No grade control or production has been undertaken at this project, so no reconciliations can be made.
14.8.6 Classification of Mineral Resources
Drill spacing is the primary factor to define resource classification and only Indicated and Inferred resources are defined at Adubiaso. The 2014 Indicated classification used a nominal drill spacing of 20 x 20 metres, with the remainder being classified as Inferred. This spacing is inconsistent with other Asanko Gold deposits where a 40 x 40 metre drill spacing had been used to classify material as Indicated. A new classification scheme was proposed and applied (Table 14-88) and a comparison between 2014 and the current block classification is shown in Figure 14-148.
Table 14-88 Adubiaso Classification Criteria
Classification Category Drill Spacing (m) Use
Measured Measured classification not applied
Indicated 40 x 40 drilling Suitable for long-term mine planning
Inferred 80 x 80 drilling Suitable for conceptual studies
Based on the amount of unknown artisanal mining, consideration should be given to downgrading all material within 15 metres of surface to Inferred in future Mineral Resource updates.
Figure 14-148 Comparison of 2014 and Current Block Classification
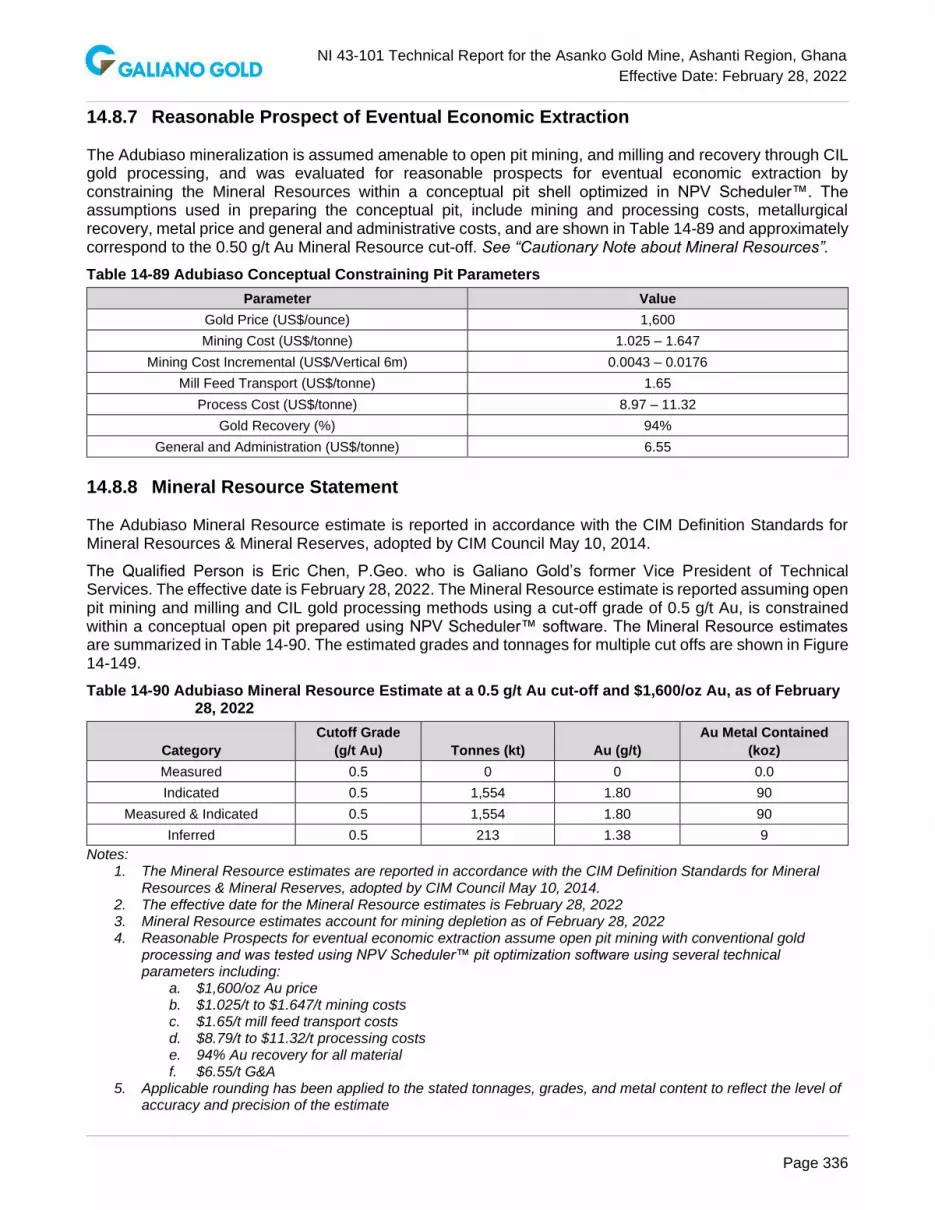
NI 43-101 Technical Report for the Asanko Gold Mine, Ashanti Region, Ghana
Effective Date: February 28, 2022
Page 336
14.8.7 Reasonable Prospect of Eventual Economic Extraction
The Adubiaso mineralization is assumed amenable to open pit mining, and milling and recovery through CIL gold processing, and was evaluated for reasonable prospects for eventual economic extraction by constraining the Mineral Resources within a conceptual pit shell optimized in NPV Scheduler™. The assumptions used in preparing the conceptual pit, include mining and processing costs, metallurgical recovery, metal price and general and administrative costs, and are shown in Table 14-89 and approximately correspond to the 0.50 g/t Au Mineral Resource cut-off. See “Cautionary Note about Mineral Resources”.
Table 14-89 Adubiaso Conceptual Constraining Pit Parameters
Parameter Value
Gold Price (US$/ounce) 1,600
Mining Cost (US$/tonne) 1.025 – 1.647
Mining Cost Incremental (US$/Vertical 6m) 0.0043 – 0.0176
Mill Feed Transport (US$/tonne) 1.65
Process Cost (US$/tonne) 8.97 – 11.32
Gold Recovery (%) 94%
General and Administration (US$/tonne) 6.55
14.8.8 Mineral Resource Statement
The Adubiaso Mineral Resource estimate is reported in accordance with the CIM Definition Standards for Mineral Resources & Mineral Reserves, adopted by CIM Council May 10, 2014.
The Qualified Person is Eric Chen, P.Geo. who is Galiano Gold’s former Vice President of Technical Services. The effective date is February 28, 2022. The Mineral Resource estimate is reported assuming open pit mining and milling and CIL gold processing methods using a cut-off grade of 0.5 g/t Au, is constrained within a conceptual open pit prepared using NPV Scheduler™ software. The Mineral Resource estimates are summarized in Table 14-90. The estimated grades and tonnages for multiple cut offs are shown in Figure 14-149.
Table 14-90 Adubiaso Mineral Resource Estimate at a 0.5 g/t Au cut-off and $1,600/oz Au, as of February 28, 2022
Category
Cutoff Grade
(g/t Au) Tonnes (kt) Au (g/t)
Au Metal Contained
(koz)
Measured 0.5 0 0 0.0
Indicated 0.5 1,554 1.80 90
Measured & Indicated 0.5 1,554 1.80 90
Inferred 0.5 213 1.38 9
Notes: 1. The Mineral Resource estimates are reported in accordance with the CIM Definition Standards for Mineral
Resources & Mineral Reserves, adopted by CIM Council May 10, 2014. 2. The effective date for the Mineral Resource estimates is February 28, 2022 3. Mineral Resource estimates account for mining depletion as of February 28, 2022 4. Reasonable Prospects for eventual economic extraction assume open pit mining with conventional gold
processing and was tested using NPV Scheduler™ pit optimization software using several technical parameters including:
a. $1,600/oz Au price b. $1.025/t to $1.647/t mining costs c. $1.65/t mill feed transport costs d. $8.79/t to $11.32/t processing costs e. 94% Au recovery for all material f. $6.55/t G&A
5. Applicable rounding has been applied to the stated tonnages, grades, and metal content to reflect the level of accuracy and precision of the estimate

NI 43-101 Technical Report for the Asanko Gold Mine, Ashanti Region, Ghana
Effective Date: February 28, 2022
Page 337
Figure 14-149 Adubiaso Tonnage - Grade Curve for Indicated Mineral Resources
14.8.9 Factors That May Affect the Mineral Resource Estimate
Other than as discussed in other sections of this report there are no known environmental, permitting, legal, title, taxation, socio-economic, marketing, and political or other relevant issues that may materially affect the Mineral Resource estimates. Other relevant factors that may materially affect the Mineral Resources, including mining, metallurgical recovery, and infrastructure are reasonably well understood according to the assumptions presented in this Report.

NI 43-101 Technical Report for the Asanko Gold Mine, Ashanti Region, Ghana
Effective Date: February 28, 2022
Page 338
15 MINERAL RESERVE ESTIMATES
Not applicable at the current stage of the Project.

NI 43-101 Technical Report for the Asanko Gold Mine, Ashanti Region, Ghana
Effective Date: February 28, 2022
Page 339
16 MINING METHODS
Not applicable at the current stage of the Project.

NI 43-101 Technical Report for the Asanko Gold Mine, Ashanti Region, Ghana
Effective Date: February 28, 2022
Page 340
17 RECOVERY METHODS
17.1 Process Description
The existing Asanko Gold Mine process plant located at Obotan is capable of processing approximately 5.8 Mtpa of total mill feed. Esaase material is being processed at present with supplementary feed from Akwasiso.
The key process operating criteria are shown in Table 17-1, the major equipment in Table 17-2 and the process block flow diagram in Figure 17-1.
Table 17-1 Key Process Plant Operating Criteria
Parameter Units Value
Crushing plant running time Hours/annum (hpa) 5,957
Crushing plant feed rate Tonnes per hour (tph) 975
Milling and carbon in leach (CIL) plant running time hpa 7998
Milling and CIL plant feed rate tph 725
Life of Mine (LOM) Au head grade g/t 1.38
LOM gravity gold recovery % 50
Run of Mine (ROM) feed size (F100) mm 800
Semi-autogenous (SAG) mill feed size (F100) mm 270
SAG mill feed size (P80) mm 90
Leach feed size (F80) µm 106
CIL retention time (8 stages) hr 17.4
CIL slurry feed density % w/w 50.2
CIL feed gold grade Au g/t 0.69
LOM average CIL cyanide (NaCN) consumption kg/t 0.45
LOM average lime (CaO) consumption kg/t 0.98
Elution circuit type Split AARL
Elution circuit size t 5
Frequency of elution batches/day 2
Note: AARL – Anglo American Research Laboratories

NI 43-101 Technical Report for the Asanko Gold Mine, Ashanti Region, Ghana
Effective Date: February 28, 2022
Page 341
Figure 17-1 Process Plant Block Flow Diagram
Table 17-2 AGM Process Plant Major Equipment
Equipment Description No. of Units
Specification Power (kW)
Nkran primary jaw crusher 1 CJ815 200
Nkran mobile jaw crusher unit 1 Model WJ1175 110
Nkran mobile jaw crusher unit 1 Model UJ440i Diesel
Primary SAG mill 1 Shell support; discharge pebble ports; 8.6 m diameter;
inside shell: 4 m equivalent grinding length (EGL)
6,500
LRS /SER
Secondary ball mill 1 Shell support: overflow; 5.8 m diameter; inside shell:
9.1 m EGL
5,600
LRS
Gravity gold recovery scalping screen
3 Horizontal vibratory, 2.44 m width x 4.88 m length;
aperture 3 mm x 19 mm 44 (4 x 11)
Gravity gold concentrator 3 KC-QS48 (G5 cone) 55
Gravity intensive leach reactor 2 2000 BA reactor; 3.2 m3 4
Gravity recovery electrowinning cells
2 12 cathode, 14 anode; 316 stainless steel (SS); 0.73 m
(width) x 1.35 m (height) x 1.01 m (length); 1,000 A 12
Pre-leach trash screen 1 Horizontal vibratory, 3.05 m (width) x 6.10 m (length);
aperture 0.8 mm x 8.8 mm 44 (4 x 11)
Pre-leach thickener 1 30 m diameter; high rate 11 (hydraulic)
CIL leach tank 8 14.0 m diameter x 14.3 m height; flat bottom; 2,100 m3
live volume
CIL tank agitator 8 XHH/90/15/90/M4PVSFK (MSRL) hydrofoil dual impeller 90
CIL inter-stage screens 8 MPS 1450(P); 14.5 m2; 304 L SS; aperture 800 µm 22
Elution column 1 5 t carbon capacity, 13 m3 total volume, SAF 2507
duplex SS
Regeneration kiln 1 Horizontal tube; tube 321SS, 750 kg Diesel
Elution electrowinning cells 6 12 cathode, 14 anode; 316 SS; 0.73 m (width) x 1.35 m
(height) x 1.01 m (length); 1,000 A 12
Note: LRS – Liquid resistance starter; SER – modern slip energy recovery drive; MSRL – mild steel rubber lined; SS – stainless steel

NI 43-101 Technical Report for the Asanko Gold Mine, Ashanti Region, Ghana
Effective Date: February 28, 2022
Page 342
17.2 Crushing
17.2.1 Esaase Source
ROM Esaase material P100 of 800 mm is loaded onto haul trucks which transports the material approximately 28 km to Obotan, where it is crushed in the crushing plant and thereafter joins the Obotan crushed material ahead of feeding to the milling circuit.
17.2.2 Obotan Source
The primary crushing circuit consists of a single tip with a dedicated ROM bin and a single jaw crusher in open circuit. Primary crusher product reports to the crushed ore stockpile (COS). The ROM (F100 800 mm, F80 500 mm) is loaded into a 100 t ROM bin by means of a front-end loader (FEL), or by direct tipping by haul trucks.
The ROM is drawn from the ROM bin at a controlled rate by a single, variable speed apron feeder, and fed directly to the jaw crusher. The speed of the apron feeder is controlled to maintain crusher throughput. Fine material spillage from the apron feeder reports to the primary crushing conveyor, where it is combined with the primary crusher product (P100 300 mm, P80 125 mm). The primary crushing conveyor is fitted with a belt magnet to remove any tramp iron material. The primary crushing conveyor discharges the crushed material onto the COS.
17.3 Milling
The milling circuit is configured as a SAG milling, ball milling, crushing circuit (SABC circuit) comprising a primary SAG mill, a secondary ball mill and a pebble crushing circuit. Mill feed is withdrawn from the 1,550 t COS by apron feeders feeding onto the SAG mill feed conveyor. A weightometer indicates the instantaneous and totalized crushed mill feed tonnage and is used to control the SAG mill feed rate via the apron feeders as well as the addition rate of supplementary Esaase oxide material. The SAG mill feed conveyor discharges directly into the SAG mill feed hopper. The SAG mill discharge is screened via a 15 mm x 50 mm aperture trommel screen before gravitating to the ball mill discharge sump. Screen oversize is conveyed to a single pebble crusher, where it is crushed to below 12 mm prior to recycling back to mill feed conveyor. The pebble crusher feed conveyor is fitted with a weightometer for control purposes. A SAG mill pebble bunker is installed, in which any pebble overflow is stored for further handling.
The SAG mill operates in open circuit, discharging directly into the ball mill discharge sump, and in closed circuit with the pebble crusher. The ball mill discharges into a sump from where the slurry is pumped to the cyclone classification circuit. A portion of the cyclone underflow (84% target) is diverted to the three gravity concentration units, each with its own scalping screen, which removes the oversize fraction and diverts this back to the ball mill discharge sump. The remaining cyclone underflow portion reports back to the ball mill discharge sump for further grinding. Gravity recovered gold concentrate reports to an intensive leaching reactor circuit (ILR) while the gravity tailings reports back to the ball mill discharge sump.
Cyclone overflow gravitates to the pre-leach thickening circuit, comprising a single high-rate thickener, where it is thickened to approximately 50% solids ahead of leaching and gold adsorption in the CIL circuit. Supernatant solution overflowing the thickener is recycled back to the process plant.
Quicklime is stored in a 100 t silo and is metered onto the SAG mill feed conveyor using a variable speed screw feeder. Quicklime is delivered to site by tanker and pneumatically transferred to the lime silo using an off-loading blower.
A ball loading system is used for loading of grinding media into the SAG mill (via the SAG mill feed conveyor).
Dust control is by way of a water dust suppression system at the stockpile area.
A mobile crushing array is used to assist with crushing of the ROM material, to optimize fragmentation and maintain throughput in the crushing circuit. Dust suppression, for dust control, is used at the crushing circuit.
NI 43-101 Technical Report for the Asanko Gold Mine, Ashanti Region, Ghana
Effective Date: February 28, 2022
Page 343
17.4 Gravity Gold Recovery
Gravity concentrate originating from the three milling gravity recovery concentrators is treated in two ILRs. These reactors contain elevated levels of cyanide, caustic soda, catalyst and oxygen to enable maximum leaching of the precious metals in the concentrate. Leach residence time is approximately 8 hours. At the end of the leach cycle the pregnant solution is treated for gold recovery in two dedicated electrowinning cells to facilitate separate metallurgical accounting. ILR residue is pumped to the ball mill discharge sump. Average gravity recovery is approximately 50%.
17.5 Pre-leach Thickening
The secondary ball mill classification cyclone overflow stream gravitates to a horizontal vibrating trash removal screen, to remove any coarse particles, wood fragments, organic material and plastics that would otherwise become locked up with the circuit carbon and block the CIL inter-stage screens. The trash screen oversize reports directly to a trash bin, whilst the underflow reports to the pre-leach thickener, via a two-stage sampling system.
The pre-leach thickener is a high-rate thickener producing an underflow product of between 50% to 60% solids (w/w). The thickened underflow slurry is pumped to the CIL circuit by means of an underflow pump.
The thickener overflow product gravitates to the process water circuit. Flocculant and lime are added to the thickener feed.
17.6 Carbon in Leach (CIL)
The CIL circuit comprises 8 agitated tanks, numbered 0 to 7. This follows the conversion, in October 2021, of the pre-oxidation tank to CIL operation. This is now designated as Tank 0. Slurry and carbon flows are counter current with loaded carbon pumped upwards in the circuit and exiting at either Tank 0 or Tank 1. The slurry gravitates from Tank 0 to 7 through inter-stage screening (vertical, mechanically swept wedge wire screen) in each tank (facilitating carbon retention), exiting from CIL Tank 7 over a carbon safety screen, to recover any stray carbon particles. Each of the tanks contains a bypass facility which allows the removal of any tank from service for maintenance while CIL operation is continued.
Oxygen (90% purity) from the three, pressure swing absorption (PSA) plants, is added to all tanks. The first tank has 3 intensive reactor injection units installed in the slurry feed line in addition to the oxygen sparging in the tank to elevate the dissolved oxygen level to approximately 20 ppm. The remaining tanks are sparged with oxygen to target 17 ppm dissolved oxygen. This process enhances the dissolution of oxygen into the leach slurry, minimizing cyanide consumption and improving gold leach kinetics by increasing the dissolved oxygen concentration
Total slurry residence time is approximately 17.4 hours. Carbon concentration per stage is 11 g/L with an anticipated loaded carbon value of 1,250 g/t in the first CIL tank. Daily loaded carbon throughput is approximately 10 t.
17.7 Tailings and Detoxification
As per International Cyanide Management Code (ICMC) guidelines, the CIL tailings needs to be discharged with a final cyanide concentration of less than 50 g CNWAD/m3 at the TSF spigot.
The current plant operating parameters result in no need for cyanide detoxification of the CIL tailings as the CNWAD values are generally below the 50 ppm compliance standard.
However, provision has been made to use the INCO air/SO2 process for cyanide detoxification. The current detoxification circuit comprises a cyanide destruction feed box, gravity feeding into a single agitated tank, with a blower air sparging facility.

NI 43-101 Technical Report for the Asanko Gold Mine, Ashanti Region, Ghana
Effective Date: February 28, 2022
Page 344
The detoxification process utilizes SO2 and air in the presence of a soluble copper catalyst to oxidize cyanide to the less toxic compound cyanate (OCN). Sodium meta-bisulphite (SMBS) is used as the SO2 source and is dosed into the cyanide destruction feed box as a 20% weight/volume (w/v) solution. The detoxification process requires the presence of soluble copper to act as a catalyst and to ensure that any free cyanide present is bound to copper as a CNWAD component. Provision is made for the preparation and dosing of a copper sulphate solution, for dosing to the cyanide destruction feed box as a 15% w/v solution when required. Oxygen required in the reaction will be supplied by sparging of blower air into the cyanide detoxification tank. The reaction is carried out at a pH of 8.5 which is maintained by controlled lime addition to the cyanide destruction feed box. The detoxified tailings are then pumped to the TSF. Supernatant TSF water is recovered via a barge pump and recycled to the plant as process water.
17.8 Carbon Treatment
Carbon is received from the loaded carbon recovery screen and loaded directly into the acid wash column. The carbon treatment circuit is designed to handle a batch size of 5 t of loaded carbon per elution. Based on the mass balance, an average of 60 elutions are required per month. The circuit comprises cold acid washing, using a solution of 3% HCl concentration, to remove inorganic foulants such as carbonates, a split AARL elution process operated at approximately 125°C, using an eluant solution comprising 3% NaCN and 3% NaOH, regeneration of the eluted carbon in a rotary kiln at 750°C to remove organic foulants such as grease and oils, and ultimately electrowinning of the pregnant solution in four dedicated electrowinning cells situated in the gold room.
The elution process may be described in more detail as follows. The caustic solution is pumped into the strip (elution) solution make-up tank from the caustic mixing tank and the cyanide solution is pumped from the cyanide dosing tank. The reagents are mixed with filtered raw water in the strip solution make-up tank at the correct concentrations. When the elution column is filled, the strip solution pump turns on and pumps the strip solution through the recovery heat exchangers followed by the primary heat exchangers before entering the bottom of the elution column at 125°C. The strip solution is recycled through the carbon column via the strip solution pump, at a flow rate of two bed volumes per hour (BV/h) equivalent to 20 m3/h, for a total of 50 minutes resulting in a carbon strip (removal of gold from the carbon). Eluate produced during the elution cycle is pumped to either one of the two eluate storage tanks located in the electrowinning area.
The fresh strip solution cycle is followed by a spent solution cycle. During this cycle, the rinse solution from the previous elution (stored in the intermediate solution tank) is circulated through the elution column at 125°C a rate of two BV/h (20 m3/h) for 150 minutes. Once the cycle is complete, the spent solution is pumped to either one of the two eluate storage tanks.
Following this, the rinse cycle involves pumping water for 150 minutes at a rate of two BV/h through the elution column and storing the resulting solution in the intermediate solution tank for the spent solution cycle in the subsequent elution cycle. On completion of the elution cycle, cooling water is pumped from the intermediate solution tank, through the elution column at a rate of two BV/h for 30 minutes and reports to the CIL circuit.
Eluted carbon is removed from the elution column and transferred to the carbon regeneration kiln, via the static sieve bend drainage screen, by means of pressurized water. Drained carbon gravitates to the carbon regeneration kiln feed bin from where it is fed to the carbon regeneration kiln. The regenerated carbon is collected in the barren carbon quench tank, from where it is pumped to the carbon dewatering screen for re-introduction to the CIL circuit via CIL Tank 6 or CIL Tank 7.
17.9 Electrowinning
Currently the pregnant leach solution (PLS) from the ILR is collected in the ILR pregnant solution storage tank. This pregnant solution is circulated through two dedicated electrowinning cells via a common steady head tank.

NI 43-101 Technical Report for the Asanko Gold Mine, Ashanti Region, Ghana
Effective Date: February 28, 2022
Page 345
Pregnant solution from the carbon elution circuit is collected in either one of the two eluate storage tanks. This solution is circulated through a dedicated electrowinning circuit consisting of four cells operating in parallel via a common steady head tank.
Gold is deposited on the electrowinning cell cathodes as a sludge while the solution is circulated until the desired barren gold concentration is achieved, or the cycle time has elapsed. After completion of an electrowinning cycle, barren solution is sampled before being pumped to the CIL feed. Loaded cathodes are removed periodically from the cells, the gold sludge is washed off using a high-pressure washer after which the washed solution is decanted.
Hydrogen cyanide, ammonia, and hydrogen gas detection equipment is installed in the electrowinning circuit, together with relevant extraction and ventilation systems.
17.10 Gold Room
Electrowon gold is recovered from the cathodes and the electrowinning cells using high pressure water jet sprays. The precious metal slurry is then filtered and dried in a drying oven at approximately 110°C to remove associated moisture. Once dried the precious metal powder is smelted in the melting furnace at approximately 1,700°C with fluxes, such as borax, sodium carbonate and silica to remove base metallic impurities such as copper, iron etc. The molten bullion mixture is then poured in moulds, allowed to solidify, cleaned, sampled and stamped with the mine name and sequential bar number. Gold content varies from 85% to 90%, with approximately 10% silver and approximately 2% to 5% base metal content. The bars are dispatched periodically to a refiner for production of 99.99% gold bars. Slag from the smelting may be re-smelted if the gold content warrants this or be returned to the SAG mill for recovery through the circuit. Additional equipment in the gold room includes safes, scales, and various security systems.
17.11 Reagents
17.11.1 Flocculant
Flocculant is delivered to site dry in 25 kg bags and is added manually to the flocculant hopper. The flocculant is then fed into a venturi tube by a screw feeder, where it is pneumatically transferred into a wetting head. The dry flocculant is mixed with filtered raw water up to a 33% (w/v) solution and discharged into the flocculant mixing tank where additional raw water is added. After a suitable hydration period under agitation, the flocculant solution is pumped to the flocculant storage and distribution tank, from where it is dosed to the respective areas by means of a ring main system fed via a duty/standby variable speed pumping arrangement.
17.11.2 Copper sulphate
The current installation allows for the delivery of copper sulphate in 1.25 t bulk bags, and manual addition to the mixing tank using a hoist and a bag breaker system. Provision is made for the addition of filtered raw water to the mixing tank to dilute the copper sulphate to a 15% (w/v) solution. The copper sulphate solution gravitates from the mixing tank to the dosing tank, from where it can be dosed directly to the plant CIL tailings cyanide detoxification circuit via a duty/standby variable speed pumping arrangement when required. Copper sulphate spillage is pumped to the CIL tailings cyanide detoxification circuit.
17.11.3 Sodium Metabisulphite (SMBS)
The existing installation allows for the delivery of SMBS in 1.2 t bulk bags and manual addition to the mixing tank using a hoist and a bag breaker system. Provision is made for filtered raw water addition to the mixing tank to dilute the SMBS to a 20% (w/v) solution. When required, the diluted SMBS solution will be pumped from the mixing tank to the dosing tank, from where it will be dosed directly to the cyanide detoxification circuit and reverse osmosis (RO) plant via a duty/standby variable speed pumping arrangement.

NI 43-101 Technical Report for the Asanko Gold Mine, Ashanti Region, Ghana
Effective Date: February 28, 2022
Page 346
17.11.4 Diesel
Diesel is delivered to the plant site by the fuel tanker and stored in a diesel storage tank for distribution to the generators associated with the fire water system, elution circuit, carbon regeneration kiln and the gold room.
17.11.5 Caustic Soda
Caustic is delivered to site in 1 t bags of ‘pearl’ pellets. The bags are hoisted by a crane into the mixing tank via a bag breaker system. The caustic soda is diluted with filtered raw water up to a final solution concentration of 20% (w/v). The diluted caustic solution is pumped from the mixing tank to the dosing tank, from where it is dosed to the respective areas (ILR, elution, and electrowinning) by means of a duty/standby variable speed pumping installation.
17.11.6 Sodium Cyanide
Sodium cyanide is delivered as dry briquettes in 1 t boxes and added manually via a hoist and bag breaking system into the mixing tank. Filtered raw water is used to prepare a 20% (w/v) solution in the mixing tank. The diluted solution is pumped from the mixing tank to the dosing tank, from where it is distributed by means of dedicated variable speed dosing pumps.
17.11.7 Hydrated Lime
Hydrated lime is delivered dry in 1 t bulk bags, and manually loaded to the lime make-up tank via a hoist and bag breaker system. The hydrated lime is fed into the lime make-up tank by means of a screw feeder. Filtered raw water is added to the make-up tank to produce a 20% (w/v) solution. The diluted milk of lime is distributed throughout the plant by means of a ring main system fed by a fixed speed duty/standby pumping installation.
17.11.8 Ferric Chloride
Ferric chloride is delivered in 25 kg bags which are manually loaded via a hoist and bag breaking system into the mixing tank. Filtered raw water is added to the mixing tank to prepare a 20% (w/v) solution. The diluted solution is dosed directly from the mixing tank to the return water treatment circuit, by means of a variable speed, duty/standby pumping installation.
17.11.9 Hydrochloric Acid
Hydrochloric acid is delivered in 1,000 L bulk containers at a solution strength of 33% w/v. This is used to acid wash the pregnant carbon prior to gold elution taking place.
17.11.10 Quicklime
Quicklime is delivered in 36 t bulk tankers and pneumatically off-loaded from the tanker into the lime silo. The lime is extracted from the silo using a variable speed screw feeder and dosed directly onto the SAG mill feed conveyor. A suitable dust extraction system is installed on the quicklime dosing system.
17.11.11 Anti-scaling Agent
The anti-scaling agent is delivered in 1 t intermediate bulk containers, from where it is pumped to the anti-scalant storage tank. The anti-scalant reagent is pumped from the storage tank, through the elution heat exchangers, back to the storage tank.

NI 43-101 Technical Report for the Asanko Gold Mine, Ashanti Region, Ghana
Effective Date: February 28, 2022
Page 347
17.11.12 Activated Carbon
Fresh activated carbon is delivered in 500 kg bulk bags. The fresh carbon is added to the carbon quench tank using a hoist, as required for carbon make-up to the CIL circuit. The addition point will allow attrition of any friable carbon particles with subsequent fines removal on the sizing screen prior to entering the CIL tanks.
17.11.13 Grinding Media
The forged steel (125 mm diameter) grinding media is used in the SAG mill, while 60 mm grinding media is used in the secondary ball mill.
Grinding media is delivered in 200 L drums. SAG mill balls are added to the mill using a hydraulic ball feeder which discharges directly onto the mill feed conveyor. Secondary ball mill media is added to the ball mill feed box by use of a specially designed kibble and hoist, which safely transports the media from the loading area to the feed box.
17.12 Plant Process Services
17.12.1 Filtered Raw Water
Raw water is currently supplied to the plant raw water storage tank from the pit dewatering boreholes and several borehole pumps. Additional raw water is sourced from the Sediment Control Structure 4 and pumped to the plant raw water tank, via the raw water treatment plant.
Provision has further been made on site to route tailings return water to the plant raw water storage tank via the discharge water treatment settling and RO plant.
The raw water is used for gland service, carbon transfer duties, elution, gravity concentrator circuit water, and reagent make-up.
The raw water storage tank has a reserve of water for fire-fighting purposes. This reserve is maintained by suitability positioned fire water and raw water pump suctions.
17.12.2 Fire Water
Firewater is drawn from the raw water tank. The firewater pumping system contains:
• An electric jockey pump to maintain fire water ring main pressure
• An electric fire water delivery pump
• A diesel driven fire water pump that automatically starts in the event that power is unavailable for the electric firewater pump.
Fire hydrants and hose reels are placed throughout the process plant, fuel storage and plant offices at intervals that ensure coverage in areas where flammable materials are present.
17.12.3 Potable Water
Potable water is taken from the borehole water line. It is pumped through a water treatment plant before being stored in the potable water tank. The potable water tank feeds the plant potable water tank, from where the plant and mining potable water is distributed.

NI 43-101 Technical Report for the Asanko Gold Mine, Ashanti Region, Ghana
Effective Date: February 28, 2022
Page 348
17.12.4 Process Water and Plant Run-off
Plant run-off is contained in the pollution control dam, from where it is pumped to the plant process water dam.
The plant process water dam collects the water from the pit-dewatering pumps, TSF return water, and any plant run-off from the pollution control dam. Provision is made for a raw water make-up stream, as required. Filtered water to the plant gravity concentration circuit is supplied by a dedicated pump system, while the remainder of the process water reticulation is undertaken by means of a duty/standby pumping arrangement. Provision is made in the design for the treatment of excess process water prior to discharge to the environment.
17.12.5 Discharge Water Treatment
The plant design allows for the treatment of the excess process water in a mechanically agitated arsenic precipitation tank, where ferric chloride would be dosed to precipitate out arsenic from solution (in the presence of oxygen), at a pH of 6. Provision was made for lime addition and hydrochloric acid addition to this tank, as required for pH control. The current design allows for the treated water to overflow to an intermediate transfer tank, from where it is pumped to a RO water treatment plant, complete with pre-filters, prior to discharge. Filter cake product from the RO plant filters will be re-pulped with RO brine in the arsenic waste disposal tank, from where it will be pumped to the final tailings disposal circuit.
17.12.6 High Pressure (Compressed) Air Reticulation
Plant instrument and plant air at 8.0 bar pressure are supplied by a dedicated, duty/standby compressor installation. The compressed air is stored in the instrument air receiver while a dedicated air receiver, located in the milling area, is provided for plant air storage, and is fed from the main instrument air receiver.
All compressed air is dried and filtered prior to storage in the instrument air receiver, from where it is reticulated throughout the plant for instrument air requirements.
17.12.7 Low Pressure (Blower) Air Reticulation
A total of three low pressure blowers supply air to the water treatment circuits.
17.12.8 Oxygen Reticulation
The plant currently utilizes a 15 tpd oxygen plant (comprising three modules of 5 tpd each) to generate oxygen at 90% purity and 300 kPa pressure, for use in the ILR, pre-oxidation, and CIL circuits. The oxygen is stored in the oxygen plant air receiver from where it is distributed.
17.12.9 Return Water and Return Water Treatment
The TSF return water is pumped from the TSF via a duty/standby pumping installation to the plant process water circuit. AGM has made provision for the routing of the TSF return water to the discharge water treatment and RO plant for treatment prior to discharge to the plant raw water tank, to supplement the raw water requirement.
NI 43-101 Technical Report for the Asanko Gold Mine, Ashanti Region, Ghana
Effective Date: February 28, 2022
Page 349
18 PROJECT INFRASTRUCTURE
18.1 Overview
18.2 Existing Infrastructure
The Obotan plant commenced production in early 2016. The plant was erected close to the Nkran deposit and several satellite orebodies. The plant is currently processing 5.8 Mtpa of material.
18.2.1 Obotan – Existing Site Infrastructure
Current site infrastructure at Obotan includes:
• An established mining operation with various structures, including offices, stores, workshops and fuel storage facilities
• A CIL process plant with various structures, including offices, stores, workshops and reagent storage / mixing facilities
• An administration block, training facilities, exploration offices, core storage area, clinic and analytical laboratory
• Senior and junior accommodation facilities located to the west of the Nkran pit
• Tailings Storage Facility
• Waste rock dumps at Nkran, Akwasiso, and Dynamite Hill
• Multiple boreholes for water supply
• Water treatment plant (construction in progress)
• A 161 kV incoming power line from the Asawinso substation
• Mobile communications facilities. A Vodafone tower is located at the Obotan camp and MTN connectivity is also available.
18.2.2 Esaase – Existing Site Infrastructure
Current infrastructure at Esaase includes:
• An exploration camp and office
• A geological core shed
• Basic camp requirements such as a clinic, offices, kitchen, accommodation, potable water services, power supply, IT connectivity, radio communications and sewage system
• Mine service facilities, including mobile equipment workshops, wash bays, fuelling stations, and administrative buildings
• Water treatment plant
• Waste rock dumps
• Community services including hospital and community boreholes
• 33 kV overhead power line supplied by the Electricity Company of Ghana (ECG).

NI 43-101 Technical Report for the Asanko Gold Mine, Ashanti Region, Ghana
Effective Date: February 28, 2022
Page 350
18.2.3 Esaase-Obotan Haul Road
The 28 km Esaase to Obotan haul road was upgraded in 2019 to support annual haulage rate of 3.0 - 3.6 Mtpa. Table 18-1 below summarizes the main design criteria for the road upgrade:
Table 18-1 Esaase to Obotan Haul Road Upgrade – Summary of Design Criteria
Description Specification
Lane width 3.5 m - 4.5 m
Shoulder width 1.0 m - 1.5 m
Road width 9.0 m -12.0 m
Maximum design speed 60 km/h (50 km/h with the current design)
Maximum gradient 10% (1:10)
Cross fall slope 3% (recommended – 1% to 4%)
Base and Sub-base Selected Graded Material
Surfacing Compacted Gravel wearing course (no seal)
Finished road level 700 mm above NGL (200 mm-700 mm above NGL)
18.3 Site Layout
18.3.1 Obotan Layout
The processing plant area is well established on two bulk earthworks terraces with all the major infrastructure already in place. Figure 18-1 shows the Obotan site plan and surrounding infrastructure.

NI 43-101 Technical Report for the Asanko Gold Mine, Ashanti Region, Ghana
Effective Date: February 28, 2022
Page 351
Figure 18-1 Obotan Site Plan and Surrounding Infrastructure
Source: Asanko Gold Mine, 2021
Figure 18-2 shows a closer view of the processing plant.

NI 43-101 Technical Report for the Asanko Gold Mine, Ashanti Region, Ghana
Effective Date: February 28, 2022
Page 352
Figure 18-2 Process Plant Layout
Source: Asanko Gold Mine, 2021
18.3.2 Esaase Layout
The Esaase site plan and the surrounding infrastructure is illustrated below in Figure 18-3.

NI 43-101 Technical Report for the Asanko Gold Mine, Ashanti Region, Ghana
Effective Date: February 28, 2022
Page 353
Figure 18-3 Esaase Site Infrastructure Layout
Source: Asanko Gold Mine, 2021
18.3.3 Haul Road Esaase to Obotan
The Esaase to Obotan haul road is a distance of approximately 28 km. The haul road route goes through thick vegetation, farmlands and galamsey area. It also crosses various local gravel roads, one paved district road and a few overhead power lines.
Figure 18-4 illustrates the haul road layout.
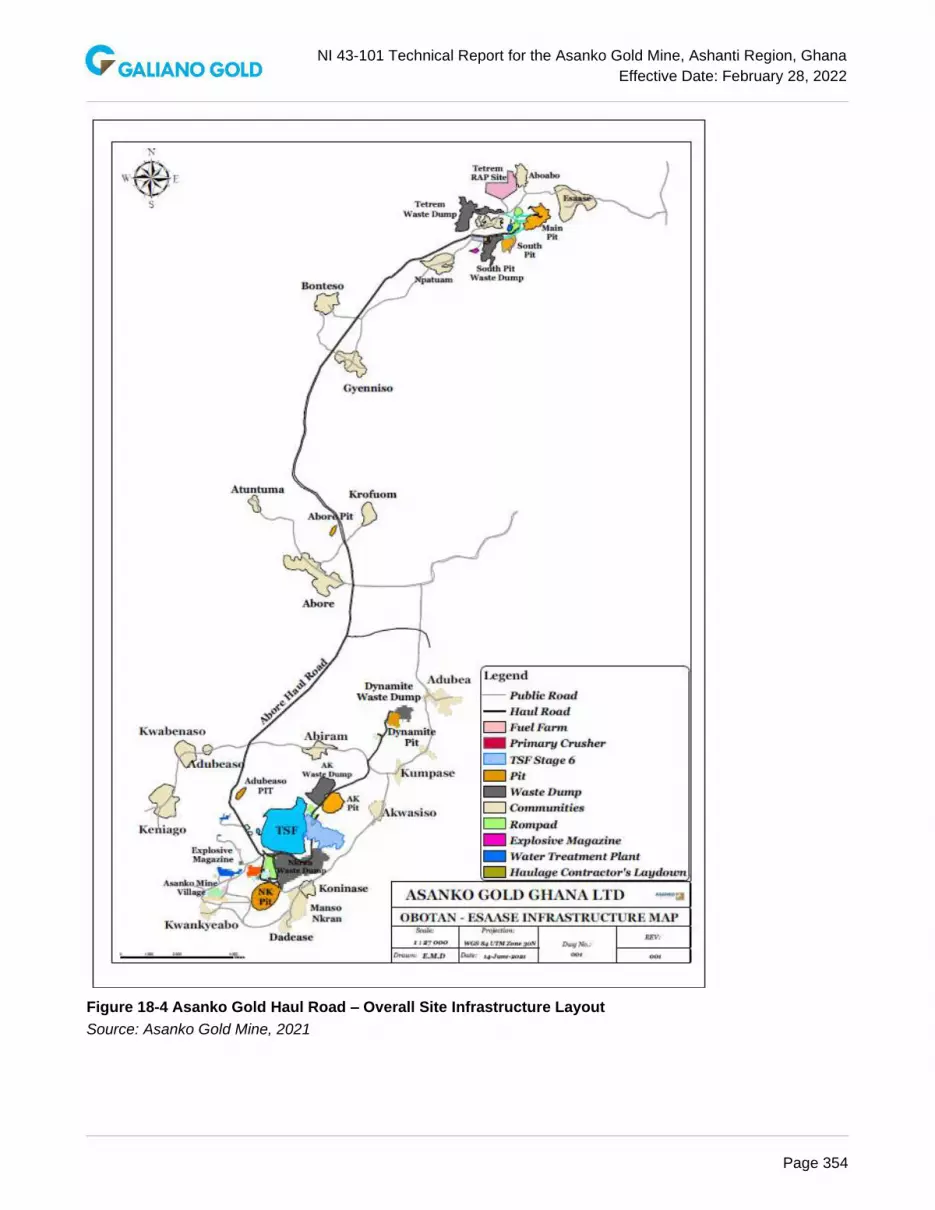
NI 43-101 Technical Report for the Asanko Gold Mine, Ashanti Region, Ghana
Effective Date: February 28, 2022
Page 354
Figure 18-4 Asanko Gold Haul Road – Overall Site Infrastructure Layout
Source: Asanko Gold Mine, 2021

NI 43-101 Technical Report for the Asanko Gold Mine, Ashanti Region, Ghana
Effective Date: February 28, 2022
Page 355
18.4 Site Access
The Esaase site is accessed by existing public roads from two directions through three routes:
• Kumasi/Sunyani road to the north-east (sealed road)
• Kumasi/Obuasi road to the south (sealed road)
• Kumasi/Manso Nkwanta road (sealed road), with the last 15 km being the mine’s private haul road.
Roads from both directions are gravel topped for the last 20 km to the Esaase site. Conditions of these roads can be described as fair to poor.
The process plant is also accessed by an existing public road, namely the Kumasi / Manso Nkwanta road (sealed road), with the last 12 km being AGM’s private haul road.
18.5 Waste Rock Dumps
Waste rock dumps (WRD) associated with mining operations are constructed to meet the requirements of the Ghanaian Mining Regulations and AKOBEN guidelines. The WRDs have been initially constructed with the natural rill angle of approximately 35° with 10 m lifts and 17 m berms. This is then contoured progressively to an overall slope angle of 18.5° (1:3) to allow for slope stability and re-vegetation.
The WRDs will be progressed by tipping from a higher level against a windrow and progressively pushing the waste out with a dozer. Geochemical testwork identified that the waste rock for Esaase and Nkran was non-acid generating. The WRDs locations for Nkran, Esaase and the Satellite Pits are shown on the site layout diagrams, in Figure 18-1 and Figure 18-3.
The waste dumps will be progressively rehabilitated with topsoil, where possible. Progressive rehabilitation has been undertaken where possible to date. Surfaces of dumps will be contoured to minimize batter scour and ripped at 1.5 m centres to a depth of 400 mm, where practicable. Seepage and shallow ground water flow along the perimeter of the mine residue deposits are controlled with suitable toe drains.
Select waste rock from Nkran will be used for future TSF stages where practical.
18.6 Tailings Storage Facility
The Tailings Storage Facility is located near the process plant and consists of multi-zoned downstream raised perimeter embankments.
Refer to Section 20 for details of the Tailings Storage Facility.
18.7 Storm Water Management
18.7.1 General
The surface water management system consists of two separate systems:
• A clean water diversion system to control the run-off from the higher lying natural environment
• A storm water system to capture the contaminated storm water from operational areas.
Water accumulated within the clean water system is diverted around areas of disturbance and directed towards the natural watercourses.
Water accumulated in the dirty water system is either harvested for use or routed through sediment control structures prior to discharge to the environment. Water will only be discharged to the environment if it meets EPA sector specific effluent guidelines for mining and is approved by the environmental manager.

NI 43-101 Technical Report for the Asanko Gold Mine, Ashanti Region, Ghana
Effective Date: February 28, 2022
Page 356
18.7.2 Sediment Control Structures
This infrastructure includes a network of water storage dams (ponds) and sediment control structures.
Four sediment control structures were constructed at Obotan. The sediment control structures were designed per the EIS to have embankment slopes of 1:3 for both the upstream and downstream ends of the Zone A Fill embankment with a 6m width. The embankment height is 2.0 m with 1.5 m height to the spillway.
Based on the site topography, the run-offs from the waste rock dumps heads toward the sediment control structure with majority heading towards the Sediment Control Structure No. 4. Water is pumped from the sediment control structure back to the process plant for processing.
All run-offs from the processing plant are captured in the downstream drains and directed towards the Pollution Control Dam (PCD). Water from the PCD is pumped back to the processing plant. In the event of a spill, the water is directed towards Sediment Control Structure No. 4 for controlled discharged into the environment when EPA standards are met.
A 1,920 m3/day N2 Water Treatment Plant has been constructed at Esaase to treat the water pumped from the Esaase pit and pit dewatering boreholes. The plant features three storage ponds (Feed Pond, Sediment Pond, and the Discharge Pond) with a combined holding capacity of 27,000 m3. The treated water is discharged into the Bonte river.
18.8 Potable Water Supply
Potable water demands for the Esaase mine services area and camp are supplied by ground water boreholes.
There is basic water treatment infrastructure at the Esaase camp already in place.
18.9 Sewage Handling
Sewage is currently collected in tanks, then pumped to a contractor’s truck and discharged at the Obotan sewage treatment plant.
18.10 Power
Power is supplied to Obotan and Esaase from two different generation sources and two different distribution systems.
18.10.1 Power Supply – Obotan
Power to the existing Obotan plant is generated by the Volta River Authority (VRA) and transmitted from the Asawinso sub-station via a 161 kV overhead line, owned and operated by Ghana Grid Company Limited (GRIDCo). The capacity of the overhead line feeding the plant is 150 MW, which far exceeds the estimated power requirements for LOM.
18.10.2 Power Supply – Esaase
Power to Esaase is supplied by ECG and transmitted from the ECG network via a 33 kV overhead line. The 33 kV distribution network is in place throughout the Esaase mine.
18.11 Fuel
Diesel is supplied by road from Takoradi and stored at existing fuel farms at both Nkran and Esaase. The fuel farms are operated by the fuel transport contractor, Zen Petroleum.

NI 43-101 Technical Report for the Asanko Gold Mine, Ashanti Region, Ghana
Effective Date: February 28, 2022
Page 357
19 MARKET STUDIES AND CONTRACTS
19.1 Introduction
The commodity produced at AGM is gold, which is widely and freely traded on the international market with known and instantly accessible pricing information.
19.2 Marketing Strategy
The marketing approach for any future gold production is the same as that used for AGM production since commercial production commenced in Q1 2016.
The three key elements of marketing strategy are as listed. Gold, as doré bar, is:
• Transported from the mine via Accra to Rand Refinery (Pty) Ltd (Rand Refinery) in Johannesburg, South Africa. The transportation of the gold bar is the responsibility of the refining contractor
• Refined at Rand Refinery under a refining contact
• Sold to the original project lenders under an off-take agreement.
19.3 Marketing Contracts
19.3.1 Refining Contract
The gold refining industry is competitive with several gold refineries in South Africa, India, Switzerland and several other countries that have the capacity to refine gold from AGM.
AGM refines all doré bars produced at Rand Refinery under a one-year contract that commenced on August 1, 2021. The contract was awarded to Rand Refinery after an open tender on competitive terms.
The contract specifies a standard refining charge. This charge is credited for payables (e.g. silver content of the doré) and debited for any deleterious content (e.g. arsenic) in accordance with specific terms in the contract.
19.3.2 Off-take Agreement
AGM has an off-take agreement to sell 100% of the future gold production up to a maximum of 2.2 Moz to the original project lender, Exp T2 Ltd (“Red Kite”). Arrangements for sale of production after this agreement is satisfied will be reviewed as required.
As of December 31, 2021, the AGM has delivered 1,299,256 ounces to Red Kite under the offtake agreement.
19.4 Pricing
The off-take agreement specifies that the buyer can nominate the purchase price, being either the London Gold Market AM fixing price as publish by the London Bullion Market Association or London Gold Market PM price or Comex (first position) settlement price during the nine-day quotation period following shipment from site. In practice, the buyer nominates the lowest of the spot prices during that period as the purchase price.
19.4.1 Payment Terms
Under the off-take agreement, the buyer pays for 100% of the value of the gold nine business days after shipment from the mine.
NI 43-101 Technical Report for the Asanko Gold Mine, Ashanti Region, Ghana
Effective Date: February 28, 2022
Page 358
A provisional payment of 90% of the estimated value is made within one business day after receipt of the gold credits by the buyer, which is typically 3 or 4 business days after shipment from the mine.
19.5 Product Specification
The product specification is defined in the refining contract.
19.6 Shipping, Storage and Distribution
Transport of doré bars from mines across Africa to refineries in South Africa and elsewhere is a relatively common occurrence. For the AGM mine, transport of doré bars from AGM is the responsibility of the refinery. The doré bar is transported from the mine site via helicopter.

NI 43-101 Technical Report for the Asanko Gold Mine, Ashanti Region, Ghana
Effective Date: February 28, 2022
Page 359
20 ENVIRONMENTAL STUDIES, PERMITTING & SOCIAL / COMMUNITY IMPACT
This section provides an overview of the environmental legislation and guidelines applicable to the AGM, as well as a summary of the permitting process and stakeholder engagements conducted in respect of the mine.
20.1 Ghanaian Legislation and Guidelines
20.1.1 Environmental and Social
The key environmental and social legislation in Ghana are the Environmental Protection Agency Act 1994 (Act 490) and the Environmental Assessment Regulations 1999 (LI 1652). The Environmental Protection Agency (EPA) is the regulatory body that administers these laws.
The Environmental Protection Agency Act 1994 (Act 490) establishes Ghana’s EPA and defines the various functions of the EPA two of which are as follows:
• To prescribe standards and guidelines relating to the pollution of air, water, land and any other forms of environmental pollution including the discharge of waste and the control of toxic substances;
• To ensure compliance with the laid down environmental impact assessment procedures in the planning and execution of development projects, including compliance in respect of existing projects;
The Environmental Assessment Regulations 1999 (LI 1652) support the Environmental Protection Agency Act 1994 (Act 490) and describe the process of environmental assessment in Ghana.
Proponents of undertakings that have a significant adverse impact on the environment (as defined in Schedule 2 of these Regulations) must submit an Environmental Impact Statement (EIS) to the Agency in accordance with the EPA LI1652 obligations. It is instructive to note that the scope of the EIS covers both the biophysical and the socio-economic impacts of the project.
Though not expressly stated in the law, the Agency has some discretionary powers in Clause 2 (LI1652) to establish some additional guidelines based on their technical judgment. In this context, the submission of an EIS is required for any mining project where the mining lease covers an area greater than 10 hectares. The regulations outline the environmental and social aspects that must be addressed in an EIS. This includes addressing the possible direct and indirect environmental impacts of the proposed undertaking during pre-construction, construction, operation, decommissioning (i.e., mine closure) and post-decommissioning phases.
As a first step, an Environmental Scoping Report must be prepared for, and approved by, the EPA prior to submitting an EIS. The purpose of the scoping document is to set out the scope of works for the EIS and must include its draft terms of reference.
In accordance with the traditional regulatory approach, a number of legally binding conditions for mitigating biophysical and social impacts of the project must be carried out once an Environmental Permit is obtained.
These typically include:
• Submit, and have approved, an environmental management plan (EMP) within 18 months of commencement of operations and thereafter every 3 years
• Submit an annual Environmental report 12 months after the commencement of operation and every 12 months thereafter
• Obtain an Environmental Certificate from the EPA within 24 months of commencement of operations
• Mining operations are required to submit closure plans to the EPA and obliged to post reclamation bonds. The Environmental Protection Agency Act, 1994 (Act 490) and the Environmental Assessment Regulations, 1999 (LI 1652) also contain provisions for community engagement

NI 43-101 Technical Report for the Asanko Gold Mine, Ashanti Region, Ghana
Effective Date: February 28, 2022
Page 360
• Obtain the Water Use License from the Ghana Water Resources Commission in accordance with the Water Resources Commission Act, 1996 (Act 522) as well as the Water Use Regulations, 2001 (LI 1692) that govern the abstraction, impoundment, and discharge of water.
20.1.2 Minerals and Mining
The Minerals Commission is the principal regulatory body of the mining industry in Ghana. It was established under the Minerals Commission Act, 1993 (Act 450) for the “regulation and management of the utilization of the mineral resources (of Ghana) and the co-ordination of policies in relation to them”.
The Minerals and Mining Act, 2006 (Act 703) aims to:
• Develop a national policy on mining and consolidate the disparate laws on mining in force prior to 2006
• Increase investment by foreign mining companies in Ghana.
• Remove the uncertainty concerning the availability and conditionality of mining rights as well as the bureaucratic gridlock
• This Act requires that an application for a mineral right (e.g., mining lease) be accompanied by a statement providing:
o Particulars of the financial and technical resources available to the applicant
o An estimate of the amount of money proposed to be spent on the operations
o The proposed program of mineral operations
o A detailed program with respect to the employment and training of Ghanaians.
Subject to Section 72 of the Minerals and Mining Act, 2006 (Act 703) the holder of a mineral right must have due regard to the effects of mineral operations on the environment and must take whatever steps necessary to prevent pollution of the environment as a result of mineral operations.
The Minister may, as part of a mining lease, enter into a Stability Agreement with the holder of the mining lease to ensure that the holder will not, for a period of up to 15 years, be adversely affected by a new enactment, changes to an enactment, or be adversely affected by subsequent changes to the level of, and payment of, royalties, taxes, customs or other related duties. The Stability Agreement becomes effective upon ratification by Ghana’s Parliament.
Where the proposed investment to be made by the mining company will exceed US$500 million, the Minister may, on the advice of the Minerals Commission, enter into a development agreement under the mining lease.
The development agreement may contain provisions relating to:
• The mineral right or operations to be conducted under the mining lease
• The circumstance or manner in which the Minister will exercise discretion conferred by, or under, the Minerals and Mining Act, 2006 (Act 703)
• Stability terms under a Stability Agreement
• Environmental management expectations and obligations of the holder to safeguard the environment in accordance with the Minerals and Mining Act 2006, or another enactment
• Settlement of disputes.
The development agreement is also subject to the country’s Parliamentary ratification in order to make it effective.
The Minerals and Mining (health, safety and technical) regulations provide mining, health, safety and environmental requirements that must be met by a mining lease holder.

NI 43-101 Technical Report for the Asanko Gold Mine, Ashanti Region, Ghana
Effective Date: February 28, 2022
Page 361
In addition to the Minerals and Mining Act, 2006 (Act 703), seven subsidiary legislations regulate the various aspects of mining operations in Ghana. These are:
1. Minerals and Mining (General) Regulations 2012
2. Minerals and Mining (Licensing) Regulations 2012
3. Minerals and Mining (Support Services) Regulations 2012
4. Minerals and Mining (Compensation and Resettlement) Regulations 2012
5. Minerals and Mining (Explosives) Regulations, 2012
6. Minerals and Mining (HSLP and Technical) Regulations 2012.
7. Minerals and Mining (Local Content and Local Participation) Regulations 2020 (LI 2431)
20.1.3 Compensation
Acquisition and access to land in Ghana for development activities, including mining, may be undertaken either through the State’s power of eminent domain, or by private treaty. The taking of land requires the payment of due compensation. The regulatory oversight of private sector land acquisition and resettlement related to mining activities and actions is governed by the Constitution of Ghana and two legislative acts:
• The 1992 Constitution of Ghana ensures protection of private property and establishes requirements for resettlement in the event of displacement from State acquisition (Article 20, Section 1,2 and 3)
• The State Lands Act 1962 (Act 125) and its subsequent amendment, State Lands (Amendment) Act 2000 (Act 586), mandates compensation payment for displaced persons and sets procedures for public land acquisitions.
The Minerals and Mining Act, 2006 (Act 703) vests all mineral rights in land to the State and entitles landowners or occupiers to the right for compensation. Section 74 (1) requires compensation for:
• Deprivation of the use or a particular use of the natural surface of the land, or part of the land
• Loss of, or damage to immovable property
• In the case of land under cultivation, loss of earnings, or sustenance suffered by the owner, or lawful occupier, having due regard to the nature of their interest in the land
• Loss of expected income, depending on the nature of crops on the land and their life expectancy.
20.1.4 Health, Safety and Labour
The principal health, safety and labour laws applicable in the mining industry include:
• The Minerals and Mining Act, 2006 (Act 703)
• Workmen’s Compensation Act, 1987 (PNDCL 187)
• Labour Act, 2003 (Act 651)
• Minerals and Mining (Health Safety and Technical) Regulations (LI 2182).
Provisions in the mining law state in part that a holder of a mineral right shall give preference in employment to citizens of Ghana “to the maximum extent possible and consistent with safety, efficiency and economy.”
As with other sectors, a foreign employee in the mining sector needs a work and residence permit in order to work.
However, under the mining laws of Ghana, there are immigration quotas in respect of the approved number of expatriate personnel mining companies may employ.

NI 43-101 Technical Report for the Asanko Gold Mine, Ashanti Region, Ghana
Effective Date: February 28, 2022
Page 362
20.2 Permitting Process
20.2.1 Obotan Permits
Two key regulatory permits were required for the Asanko Gold Mine as follows:
• The Mine Operating Permits (MOP) issued by the Minerals Commission in respect of mining leases
• The Environmental Certificate issued by the EPA in respect of mining operations.
Following the required engagements, regulatory site visits, and submission of the relevant documentation, the Asanko Gold Mine has successfully obtained and renewed its Mine Operating Permits since commencement of operation in 2016 and is currently operating under the 2021 MOPs issued on January 12th 2021 in respect of the following leases, all of which form part of the operational complex of the Asanko Gold Mine:
• LVD 7299/2013 located at Abirem
• LVD 21721/2012 located at Adubea
• LVD 21722/20 located at Abore
• LVD 3969A/90 located at Esaase
• LVD 8979A/95 located at Miradani
• LVD 5174/2012 located at Datano
The latest Environmental Certificate for the Asanko Gold Mine (gold mining and mineral processing) was issued on July 30th 2021, and is valid for three years following which it will be due for renewal.
20.2.2 Esaase Permits
Asanko Gold (formerly known as Keegan Resources) acquired the Esaase concession in 2006 and, under an exploration permit issued by the Minerals Commission, conducted extensive geological survey and drilling program to define its Mineral Reserves.
Following completion of this work stream, and preliminary establishment of a business case, a mining area application was submitted to the Minerals Commission in 2012 which defined the location of the proposed mine on the concession as well as locations of the pits, waste rock dumps and other related mining infrastructure and facilities.
The mining area application was approved by the Minerals Commission and a Temporary Mine Operating Permit issued that same year.
In 2014, further work was conducted to optimize the Project. The Minerals Commission was regularly updated on the Project and a formal application was submitted to the Minerals Commission in December 2016 which led to issuance of the permanent MOP for the Esaase concession in January 2017. The permanent Esaase MOP, as with all other Asanko mining leases, has since been successfully renewed annually in line with regulatory requirements.
20.2.3 EPA Permitting Process for Esaase
The Figure 20-1 depicts the sequence of activities that had to be completed in accordance with the EPA environmental permitting process.
This necessitated the hiring of a Ghanaian environmental management consulting firm, the African Environmental Research & Consulting Company (AERC), to carry out the required activities.
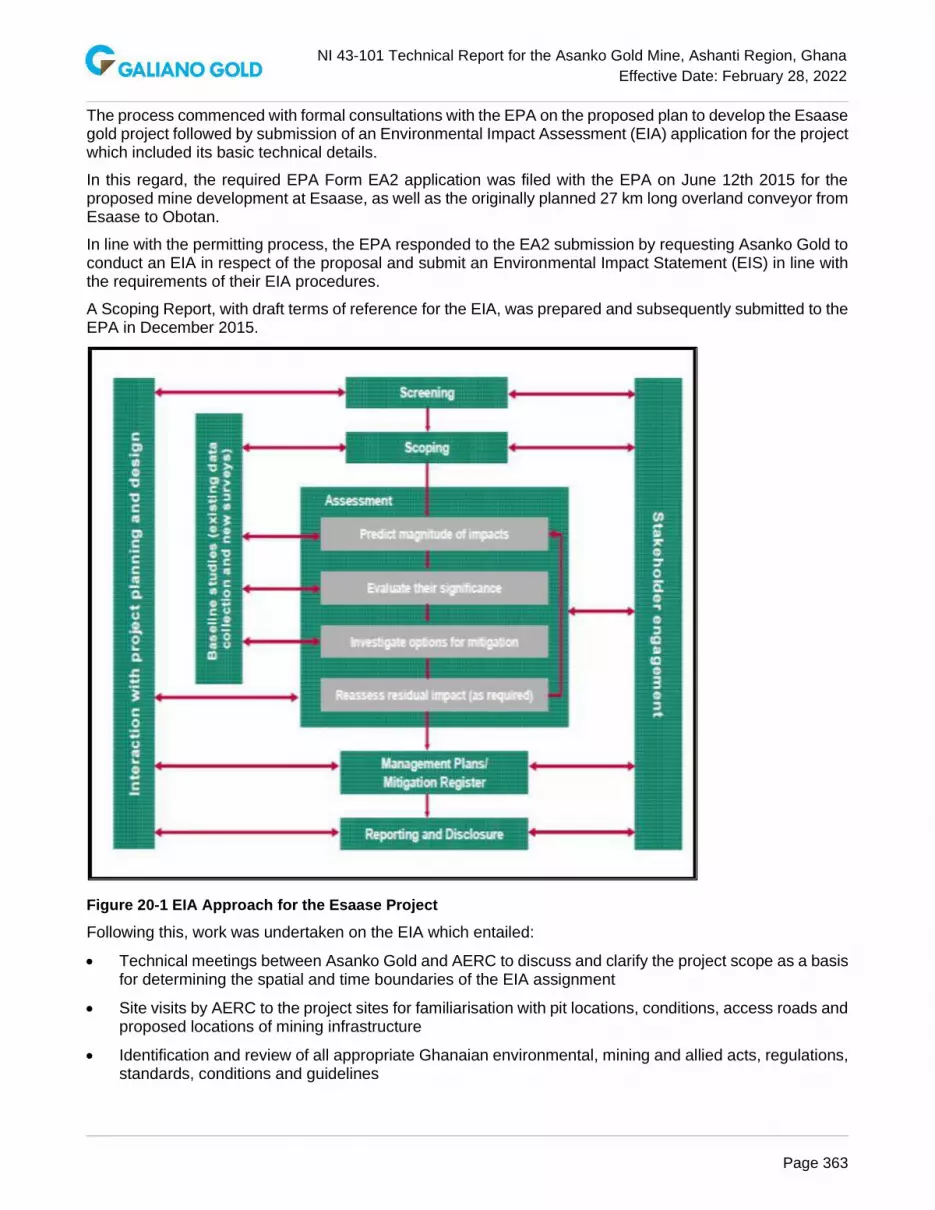
NI 43-101 Technical Report for the Asanko Gold Mine, Ashanti Region, Ghana
Effective Date: February 28, 2022
Page 363
The process commenced with formal consultations with the EPA on the proposed plan to develop the Esaase gold project followed by submission of an Environmental Impact Assessment (EIA) application for the project which included its basic technical details.
In this regard, the required EPA Form EA2 application was filed with the EPA on June 12th 2015 for the proposed mine development at Esaase, as well as the originally planned 27 km long overland conveyor from Esaase to Obotan.
In line with the permitting process, the EPA responded to the EA2 submission by requesting Asanko Gold to conduct an EIA in respect of the proposal and submit an Environmental Impact Statement (EIS) in line with the requirements of their EIA procedures.
A Scoping Report, with draft terms of reference for the EIA, was prepared and subsequently submitted to the EPA in December 2015.
Figure 20-1 EIA Approach for the Esaase Project
Following this, work was undertaken on the EIA which entailed:
• Technical meetings between Asanko Gold and AERC to discuss and clarify the project scope as a basis for determining the spatial and time boundaries of the EIA assignment
• Site visits by AERC to the project sites for familiarisation with pit locations, conditions, access roads and proposed locations of mining infrastructure
• Identification and review of all appropriate Ghanaian environmental, mining and allied acts, regulations, standards, conditions and guidelines

NI 43-101 Technical Report for the Asanko Gold Mine, Ashanti Region, Ghana
Effective Date: February 28, 2022
Page 364
• Field investigations comprising environmental, socio-economic and cultural surveys within the area of influence of the Project to determine existing baseline conditions
• Development of an inventory of all proposed mine infrastructure within the vicinity of the Project area
• Collection, sorting and review of company documentation relevant to the proposed undertaking, including concept descriptions, independent study reports, design drawings and maps, etc.
• Holding of consultations with all governmental (and non-governmental) institutions
• Holding of consultations with traditional authorities and all impacted communities.
In attendance at that were:
• Officials of the EPA
• Officials of Asanko Gold
• Officials of AERC, Asanko Gold’s environmental management consultants
• A representative of the Asantehene, the King of the Ashanti Kingdom
• The chiefs and members of all 12 communities within the catchment area of the proposed Esaase mining project as well as those along the then proposed overland conveyor corridor
• The Member of Parliament for the area
• The District Chief Executive and officials of the Amansie West District Assembly
• A representative of the District Chief Executive of the Atwima Nwabiagya District Assembly
• Religious leaders from the communities
• The media.
The ceremony was chaired by Dr. Richard Amankwah Kuffour, a lecturer at the University of Education (UEW), Winneba, Ghana.
The then General Manager of the Asanko Gold Mine, Mr. Charles Amoah, gave an overview of the project highlighting its impacts and the interventions to be implemented by the Company to mitigate these. He further enumerated the financial and socio-economic benefits of the Project to all stakeholders, including the Government of Ghana, and the local communities.
In an open forum, members of the community, as well as the chiefs of each of the 12 communities, publicly declared their support for the project and expressed their expectation that the expansion projects will create jobs for the youth in the community and also lead to socio-economic development of the catchment area.
The positive outcome of this key EIA activity (i.e. the public hearing) was pivotal to the permitting process and an account of the event formed an integral part of the Draft EIA developed in respect of the Project.
Select community members and chiefs at the EPA public hearing are shown in Figure 20-2 and Figure 20-3.

NI 43-101 Technical Report for the Asanko Gold Mine, Ashanti Region, Ghana
Effective Date: February 28, 2022
Page 365
Figure 20-2 Community Members at the EPA Public Hearing
Figure 20-3 A Cross Section of Chiefs and Members of the Community at the EPA Public Hearing
The various findings of the respective EIA activities were subsequently compiled into the Draft EIS which was submitted to the EPA as a sequel to the Scoping Report on September 30th 2016. The Draft EIS outlined the project description, its potential impacts and mitigations, proposed environmental monitoring action plans, provisional environmental management plans and reclamation, and closure alternatives of relevance to the mining undertaking.
The EPA reviewed the Draft EIS and reverted with their comments and queries as well as invoices for the permit processing fees. This effectively marked technical approval of the project by the EPA.

NI 43-101 Technical Report for the Asanko Gold Mine, Ashanti Region, Ghana
Effective Date: February 28, 2022
Page 366
The Draft EIS was revised and submitted to the Agency on November 30th 2016, after the EPA's comments were incorporated. This was followed by payment of the EPA's invoice for the issuance of the environmental permit.
An updated Environmental and Social Impact Assessment (ESIA) was prepared by the AGM and submitted to the EPA during 2017 to incorporate a 27-kilometre haul road, to facilitate truck ore haulage from Esaase to Obotan. This ESIA was approved by the EPA and an Environmental Permit issued for the expanded Obotan Gold Mining and Processing Project (permit received in August 2019). The 27-kilometre overland conveyor was removed from the May 2020 version of the EPA Permit at the request of the AGM.
20.3 Stakeholder Engagement
20.3.1 Guiding Principles of Stakeholder Engagement
Extensive interactions were held with various stakeholder groups including the government, regulatory authorities and, particularly, members of communities that would be impacted by the development of Esaase as well as expansion projects at Obotan.
These interactions were guided by Asanko Gold’s principles of conducting stakeholder engagement in a manner that is:
• Respectful and sensitive to local culture and societal norms
• Transparent and honest in deliberations over issues of concern
• Based on continuous engagement and keeping stakeholders updated, and their opinions sought, every step of the way
• Aimed at building mutually beneficial long-term partnerships
Further to these, there were extensive stakeholder engagements to ensure that, apart from legal and regulatory consent to the project, affected communities were fully informed about the project, its potential technical and socio-economic impacts on them, interventions to mitigate these impacts, among others, so the communities could make the decision on whether or not to allow the Project to be implemented on their land.
20.3.2 Engagement with Communities
The AGM has a catchment area which straddles parts of the Amansie South and Amansie West Districts of the Ashanti Region of Ghana. The mine’s catchment area has thirty five (35) villages and approximately 135,000 inhabitants, based on the 2010 Ghana population census. Of these thirty five communities, three (Nkran, Tetrem and Esaase) are directly impacted thereby necessitating either a partial or total resettlement. The partial resettlement of Nkran was successfully completed in 2015 whereas the total resettlement of Tetrem was completed in 2021. The relevant Resettlement Action Plan processes are currently in progress with respect to the planned partial resettlement of Esaase.
Formal consultations regarding various aspects of the then AGM Obotan Gold Project were conducted from as far back as 2011 through:
1. Engagements with various government entities including relevant ministries, departments and agencies as well as the local government i.e. district assemblies,
2. Engagements with Project-affected-Persons in the catchment Area, and
3. The formal Environmental and Social Impact Assessment Scoping Process which included holding of a Public Hearing involving all stakeholders of the project.
As a result, the AGM has consistently, and directly, engaged with the affected catchment communities since commencement of the Obotan project.

NI 43-101 Technical Report for the Asanko Gold Mine, Ashanti Region, Ghana
Effective Date: February 28, 2022
Page 367
Principal engagement methods and venues to date have included:
• Multi-stakeholder forums
• Village level community liaison committees
• Establishment of staffed community information centres (CIC) as an ongoing access point for village residents
• Individual and focus group meetings
• Open door policy at the project site offices.
A grievance management process was also instituted to ensure all community concerns were documented, reviewed, necessary actions taken, and timely feedback provided to affected community members. Grievances are resolved between 14 to 30 days from the date of complaints.
The AGM further engaged additional community liaison officers to enhance the frequency and quality of interactions, particularly with the immediate communities, and also to build trusting relationships with stakeholders even before commencement of the Project.
A stakeholder engagement and Action Plan was developed, with broad stakeholder groups and committees established in the communities, to keep members of the communities fully updated on the project and to deepen their relationship with Asanko Gold, thereby building a strong linkage with the local population. This approach ensured effective information flow between the Company and the catchment communities and provided the platform for building strong and collaborative working relationships with project stakeholders.
AGM has over time followed a well-defined communications plan with key discussion items as follows:
• New mine development activities
• Planned mining activities and any associated changes
• Rehabilitation works and post-closure land use requirements of stakeholders
• Development of partnerships with stakeholders for community development
• Proposals for company sponsored livelihood and agricultural land improvement programs
• Determination and review of crop compensation and deprivation of land use rates
• Sustainable development and community assistance projects
• Social Responsibility Forum (SRF) update
• Establishment of SRF Board of Trustees and training of the board, and standing committees, on their activities as they relate to sustainable community development
• Baseline engagement on Voluntary Principles on Security and Human Rights (VPSHR) issues
• Ore transport and haul road safety management plan
• Encroachment and illegal mining activities on Asanko tenements
20.3.3 Governmental Stakeholders
On the governmental and regulatory side, regular engagement sessions were held with the various regulators and government departments to provide the required updates on progress at the AGM.
To this end, the following governmental stakeholders have been kept fully informed, their opinions and inputs sought and are actively updated on the AGM with formal notifications, submissions and applications made as required. These were the:
• Ministry of Lands and Natural Resources

NI 43-101 Technical Report for the Asanko Gold Mine, Ashanti Region, Ghana
Effective Date: February 28, 2022
Page 368
• Minerals Commission
• Inspectorate division of the Minerals Commission
• Ministry of Environment, Science, Technology and Innovation
• Environmental Protection Agency
• Water Resources Commission
• Forestry Commission
• Ashanti Regional Coordinating Council
• Amansie West District Assembly
• Amansie South District Assembly
• Ministry of Food and Agriculture – Amansie West & South Districts
• Ghana Education Service – Amansie West & South Districts
• Ghana Health Service – Amansie West & South Districts
• Land Valuation Board – Ashanti region.
The relevant consents, regulatory permits and approvals continue to be successfully renewed and updated as required.
20.4 Environmental and Social Management
20.4.1 Environmental Management System
Though the AGM is yet to go through ISO14001 Certification, its environmental management system (EMS) is aligned to the standard which follows the “Plan, Do, Check, and Act‟ (PDCA) methodology.
The AGM’s EMP outlines anticipated mitigation measures to be developed to monitor environmental impacts associated with the Project. It addresses the following aspects:
• Corporate commitment and HSE policies
• Environmental management structure
• Financial allocations
• Project overview
• Existing natural environment
• Existing socio-economic environment
• Environmental impacts and mitigation measures
• Environmental Action Plans
• Monitoring programme
• Reclamation and decommissioning
• Emergency response plan
• Auditing and review
• Community relations and resettlement.
Environmental and social impacts associated with the establishment and operation of the Obotan Mine was assessed in the 2013 ESIA and subsequent addendums to the ESIA.

NI 43-101 Technical Report for the Asanko Gold Mine, Ashanti Region, Ghana
Effective Date: February 28, 2022
Page 369
20.5 Environmental and Social Mitigation
AGM is currently implementing the preventative approach to environmental management with the primary objective of limiting negative environmental impacts from the operational activities, whilst maximising positive benefits. Where possible, AGM seeks to minimize such negative impacts through appropriate mitigation measures. This approach fulfils the aspirations of the corporate policy on the environment, environmental performance management systems, and various impact-specific environmental action plans.
Waste rock from mining operations is placed in areas identified as suitable for the establishment of WRD facilities and are located in close proximity to the resource areas.
Tailings material from the plant is deposited on the expanded TSF. Cyanide in the CIL tailings is detoxified using a three-phase hybrid cyanide destruction process. Weak acid dissociable cyanide concentration is reduced in a single tank by means of sodium metabisulfite and air. The SO2/air process is used for cyanide destruction prior to tailings deposition in the TSF.
The management of potentially acid generating material is implemented to limit the effect on the receiving environment.
A surface water management regime consists of a clean water diversion system to control the uncontaminated run-off from the higher lying natural environment, and a dirty storm water system to capture the contaminated storm water from plant, operational and processing areas.
Water in the dirty water system is to be collected for reuse or routed through sediment control structures before being discharged into the environment. To this end, water is only discharged into the environment when it meets the EPA’s effluent guidelines for mining.
The TSF and associated expansion has the following design characteristics associated with storm water management:
• Storm water capacity: 1 in 100-year recurrence interval, 72-hour storm event
• Emergency spillway: 1 in 100-year recurrence interval storm event.
Given the expected geochemical characteristics of fresh rock from Esaase, a new water treatment plant is under construction at the process plant to the treat process water. A similar plant has already been built at Esaase to treat water from the pits following which the solution is allowed to settle and the treated water decanted and, finally, released to the environment.
Appropriate drainage control measures to minimize soil erosion will be put in place during preparation of each site.
20.6 Environmental and Social Monitoring
Monitoring information is assessed against the Ghana EPA guidelines (January 2001) and in alignment with international best practice guidelines for the mining industry, including:
• IFC Environmental, Health & Safety Guidelines – Mining (December 2007)
• IFC Performance Standards on Social and Environmental Sustainability (January 2012)
• "Equator Principles III" 2013
The Government of Ghana and EPA’s Environmental Performance Rating and Disclosure Methodology for Mining Companies (AKOBEN Programme).
In line with regulatory requirements, the AGM has been monitoring and reporting all environmental incidents that may occur on or offsite as a result of its operations.

NI 43-101 Technical Report for the Asanko Gold Mine, Ashanti Region, Ghana
Effective Date: February 28, 2022
Page 370
20.6.1 Surface and Groundwater
AGM maintains an extensive programme for the regular monitoring of surface and groundwater quality. Compliance sampling is conducted monthly, and results are analysed externally by an accredited laboratory to determine compliance with regulatory requirements. Control and reference sampling are typically conducted on a quarterly basis. As per International Cyanide Management Code (ICMC) requirements, weekly sampling is conducted at cyanide facility areas for free cyanide, WAD-cyanide, and total cyanide levels. Pit water quality is also monitored monthly with additional monitoring conducted prior to any necessary discharges.
Multiple locations within the TSF surrounds are monitored daily to enable detection of any potential discharges. Supernatant and seepage water from the TSF are monitored monthly. Several piezometers have been installed on the embankments of the TSF to monitor pore pressure levels within the embankments. The piezometers are typically monitored monthly to enable observation of both seasonal and operational changes in water levels.
Surface water monitoring points required during construction, operation, and closure for the Esaase Project include downstream of pit discharge points, waste rock dumps and stockpiles as well as locations around any other facility such as workshops and fuel bays.
Potable water sources in all the communities monitored during the baseline groundwater are monitored monthly.
20.6.2 Dust and Noise
A Dust Management Plan (DMP) has been developed, and is being implemented, to provide a coordinated approach to dust impact mitigation. An integral part of the dust management program is a monitoring program that has been instituted in the surrounding communities. Stations are monitored fortnightly, and the results submitted to the EPA. Additionally, the monitoring stations also assess levels of nitrogen oxides and sulphur oxides (NOx and SOx).
Noise monitoring is similarly undertaken across several affected communities and is compared to the day and night-time guidelines.
20.6.3 Aquatic Environment
Appropriate drainage control measures to minimize soil erosion are in place by the AGM. These measures include:
• Settling ponds at appropriate locations downstream of mine infrastructure such as the waste rock dumps, the process plant and the mine services area
• Vetiver grass which has been planted on the crests and slopes of waste rock dumps and on exposed surfaces to prevent sedimentation arising from erosion
• Construction of drains around the perimeter of the pits, haul roads and access roads to enhance effective surface runoff management
• Early revegetation of disturbed areas using topsoil and subsoil stockpiled during the preparation phase
The AGM has established Water and Sanitation Committees (WATSAN) in communities where it has provided boreholes and, in addition to regular monitoring, the company provides the needed oversight and support to ensure these are in good working condition and also regularly maintained.

NI 43-101 Technical Report for the Asanko Gold Mine, Ashanti Region, Ghana
Effective Date: February 28, 2022
Page 371
20.6.4 Ecological Environment
Although post-mining land uses are likely to be agriculturally oriented, a terrestrial fauna survey will be undertaken during the closure phase to assess habitat regeneration as well as compliance with AGM’s Reclamation and Closure Plans.
In the interim, specific actions being pursued by the AGM include:
• Sampling of the fresh water environment
• Progressive land clearing as necessitated by mine development requirements
• Concurrent land reclamation programme in line with the LOM Plan and operational opportunities
• Stockpiling of topsoil and overburden for reuse in reclamation efforts such as the ongoing re-spreading exercise on the slopes of the Nkran Waste Rock Dump which has led to successful revegetation of the area.
These actions have created favourable conditions for return of fauna to the reclaimed areas.
20.6.5 Acid Rock Drainage Monitoring
Sampling and assessment of rock types/lithologies from the operations is carried out routinely to understand acid base accounting, rock mineralogy and potential for ARD development. Routine ARD monitoring is conducted in-house with additional analyses conducted by external laboratories, as required.
20.6.6 Tailing Storage Facility
The monitoring program for the TSF is described in Section 20.9.
Additionally, an Independent Tailings Review Panel (ITRP) was established to provide advisory services to the ongoing monitoring, maintenance, and construction of the TSF. The ITRP comprises of 4 international experts with experience in geology, geotechnical, geochemistry and hydrology. The ITRP supports the AGM’s efforts to apply evolving international best practices and standards to ensure increased oversight, tracking, monitoring, capacity building and support for site level personnel.
The ITRP closely works with the Engineer-of-Record, AGM and Galiano senior management and the Board Committee on Sustainability as well as our JV partner. Semi-annual meetings are held to discuss a multitude of issues around water & geochemistry, capacity and containment, emergency preparedness, construction standards & scheduling, monitoring technology, closure practices and alignment to best practices.
20.7 Socio-Economic Aspects
AGM has formed Community Consultative Committees (CCC) which comprise of representatives of the mine, the District Assemblies (local government), traditional authorities and various identifiable groups. The CCC presents an important platform for communicating with stakeholder, providing updates on the mine’s activities and projects, receiving feedback from community stakeholders and addressing any stakeholder concerns that there may be.
The company has further established the Asanko Development Foundation into which a contribution of $2/oz is made for every ounce of gold sold. The accrued amount is to be used for community-driven development projects.
20.8 Closure and Reclamation
AGM’s reclamation objective is to ensure that the site is left in a condition that is safe and stable where long-term environmental impacts are minimized and any future liability to the community and future land use restrictions are minimized.

NI 43-101 Technical Report for the Asanko Gold Mine, Ashanti Region, Ghana
Effective Date: February 28, 2022
Page 372
The final post-mining land use will be determined in consultation with the EPA, other Ghanaian government institutions, stakeholders, and local communities. Natural soil covers and vegetation will as far as possible be re-established over the disturbed areas.
Financial provision for reclamation and closure are made in accordance with the requirements of the Reclamation Security Agreement (RSA) that has been entered into between the mine and the EPA. The RSA sets out criteria for Primary Completion, Land Use Completion and Final Completion. Final completion is achieved when an area continues to meet the completion criteria with no monitoring or maintenance for three seasonal cycles.
As various facilities reach the end of their useful life, AGGL will begin reclamation activities in tandem with ongoing mining operations. For instance, concurrent reclamation at the Nkran Waste Rock Dump which started in 2019 and has been extended to cover additional 6.84 ha bringing the total area under reclamation to 12.93 ha. Native timber species and food crops were planted to create a valuable revegetated land that resembles a natural forest (Figure 20-4).
Figure 20-4 Reclamation of Native Timber Species and Food Crops
The AGM re-assess the closure and reclamation liability on an annual basis as changes occur. Changes include examples such as increase in land disturbance, reclamation work complete in tandem with ongoing operations, or change in regulatory/remediation requirements.
As at December 31, 2021 the asset retirement provision recognized under IFRS on the financial statements of the AGM was $81.0M USD. There is no significant difference through to the effective date of this report.

NI 43-101 Technical Report for the Asanko Gold Mine, Ashanti Region, Ghana
Effective Date: February 28, 2022
Page 373
20.9 Tailings Storage Facility Design and Construction
The TSF consists of multi-zoned downstream raised embankments. At present, Stage 5 of the TSF is operational, and Stage 6 construction has recently been completed and is pending commissioning. Stage 6 will provide a total capacity of 29.2 Mt. The latest design completed in 2021 considers a limit of Stage 12, with a total footprint area of 375 ha (the basin area is approximately 318 ha). The TSF will generally be expanded vertically beyond the Stage 6 footprint into a ring dike configuration, and a single storage basin or cell formed such that reduced rate of rise plus construction efficiency are realized during future expansions to the facility. Tailing’s deposition shall be undertaken, using subaerial methods such that a near centralized pond develops farther from the impounding walls. Each development of the facility is capable of safely accommodating tailings from mill operations and envisaged rainstorm events, applicable to the facility.
Table 20-1 Tailings Storage Facility Design Summary
Parameter Unit Value
Total Capacity Mt 64.0
LOM Design Embankment Crest Limit M 203.0
Height of LOM Critical Embankment M 53.0
Total Volume of Embankments Mm3 11.1
Total Crest Length of Embankments m 7,487.0
Total Footprint of Embankments (Base Area) Ha 174.3
TSF Basin Plan Area Ha 317.7
The TSF embankments are designed with 2.5H:1V upstream slopes to support stability and HDPE geomembrane installation. Downstream slopes of embankments are to vary from 2H:1V to 3.0H:1V during the raise constructions of the TSF, with the slope becoming gentle or flatter as the development approaches the LOM crest. A minimum 25 m wide buttress is provided for the highest embankment (West Embankment) during each stage raise. Each stage embankment has a minimum 12 m crest width to accommodate envisioned construction machinery. The adopted crest width, downstream and upstream slopes as well as the buttresses, contributes to the overall stability of the storage facility by supporting mobilization of safety factors that satisfies project country regulatory requirements and adopted design guideline(s) recommendations.
During each expansion to the TSF, vegetation within the footprint will be cleared, grubbed and de-stumped as part of foundation and subgrade preparations for fill construction. Topsoil and unsuitable materials (saturated, weak and vegetation laden soils) within the TSF footprint shall be stripped or removed such that the expanded embankments are constructed on competent ground. Unsuitable materials and topsoil shall be stockpiled in designate locations within the TSF proximity to support facility closure and rehabilitation efforts.
The embankments are provided with cut-off walls, constructed from plastic clays/silts along the upstream toes into competent low permeability in-situ foundation materials, which mitigates seepage of in-store slurry water beneath the dam such that the environment external to the TSF is not adversely impacted. TSF areas forming part of the containment basin are constructed with a minimum 200 mm thick compacted soil (clay/silt) liner (CSL), from either reworked suitable in-situ or imported materials. Upstream fills of embankments comprise a minimum 6 m wide low permeable zone, constructed from plastic clays and/or silts (Zone A). 1.5 mm thick smooth HDPE geomembrane are installed within the basin to form a continuous composite hydraulic barrier with the CSL and embankment low permeable fills (Zone A) during each expansion of the facility. The cut-off walls, CSL, embankment upstream low permeable fills, and HDPE geomembrane provides hydraulic containment for in-store tailings water mitigating seepage releases and safeguarding the external environment.

NI 43-101 Technical Report for the Asanko Gold Mine, Ashanti Region, Ghana
Effective Date: February 28, 2022
Page 374
Supernatant water recovery from the TSF to process circuit shall be via two Decant Towers, to be supported by a floating barge on as needed basis. Two sufficiently sized submersible pumps would be utilized for Decant Tower operations - a pump shall be installed in each tower. Decant Towers shall be extended over the LOM to support water recovery to process operations such that a small pond is maintained in the TSF within operational limits or requirements, to the extent practical. The floating barge shall be maintained, during each expansion of the facility, for backup operations.
Gravity drained groundwater and under-drainage systems, comprising primarily of branch and collector drains, installed within the TSF basin shall be utilized throughout the facility operations to the LOM end. The groundwater system (also referred to as subterrain or sub-liner water collection system) act to mitigate uplift pressure risks to the basin hydraulic barrier; and provides a means for evaluating the performance of the hydraulic barrier system (CSL, embankment Zone A and HDPE geomembrane) against seepage of slurry water. The under-drainage system (also referred to as over-liner drainage system) shall: promote consolidation of in-store tailings solids; reduce seepage; aid improved in-store densities and stability. A seepage collection and confinement channel is to be maintained downstream of the West Embankment, to allow collection of seepage (where any) and rain precipitates into a sump for monitoring. Water reporting to the sump shall be returned to the TSF surface as part of measures to mitigate release of tailings water into the external environment.
The design incorporates an emergency spillway during each expansion to the TSF. This shall be available at all times during operations for each expansion, to end of mine life, to aid controlled safe evacuation of rainstorms in excess of the facility’s design storage capacity and mitigate overtopping breach risks (however unlikely).
Figure 20-5 Tailings Storage Facility Stage 12 Layout
Source: Knight Piésold, 2021

NI 43-101 Technical Report for the Asanko Gold Mine, Ashanti Region, Ghana
Effective Date: February 28, 2022
Page 375
20.9.1 Monitoring
A monitoring program for the TSF is currently in place to observe for potential challenges which may arise during operations. This program will continue to be reviewed, evaluated, and updated as information become available and the facility performance is understood.
Additional groundwater monitoring stations will be installed downstream of the TSF, as determined necessary, to support routine observation of water quality and early detection of changes in baseline parameters (both during operations and after decommissioning) such that potential risks are mitigated proactively.
Vibrating wire piezometers and open-end standpipe piezometers will be installed in the TSF embankments, as determined appropriate and in conformance with existing regulations (L.I 2182), to monitor pore water pressures within the embankments and confirm that facility performance is consistent with design intent with regards to impoundments stability. The piezometers will be monitored at regular intervals and the observations noted and communicated to the Design Engineer.
Survey pins and/or prisms will be installed at regular intervals along the embankment crests per local regulatory requirements and to international best practice guidelines to monitor potential deformations in the impounding walls, as part of overall dam performance and safety observations, that would aid any potential or identified distress remediation in a timely manner.
A number of instruments (shape accelerometer arrays and inclinometers), that aid continued observation of the impoundments’ performance relative to deformation, have been incorporated in recent expansion to the TSF. These automated instruments will support real-time data collection, transmission via wireless communication system and graphical reporting such that deformation related distresses to the TSF impounding walls are identified timely, and remedial measures implemented such that the dam is continuously operated under practically safe conditions.
The adopted monitoring instruments will be reviewed, as appropriate, during expansions to the TSF. Alternative technologies may be considered, adopted and incorporated into the TSF monitoring/surveillance system as may be determined applicable.
The TSF will undergo operational audits and dam safety inspection or review by a suitably qualified Geotechnical Engineer, as part of continuous monitoring efforts relative to safe facility performance. The audits will observe that the facility is operating within design intent and in an efficient manner or otherwise. Operational audits and dam safety inspection or review intervals shall be adopted and reviewed as may apply to the TSF.
20.9.2 Water Management Strategy
Water management is a fundamental consideration for the safe design and operation of the TSF in support of process plant operations. The design approach adopted for the expansions to the TSF, relative to water management and associated risk mitigation, considers that each stage raise or expansion has sufficient: capacity to accommodate anticipated rainstorm events and rainfall sequence commensurate with the dam classification per Ghanaian regulatory requirements (L.I 2182) and best practice guidelines provided by ANCOLD. The design objective is to either meet or exceed, to the extent practical, those requirements and/or recommendations; and freeboard above operating pond level and anticipated applicable design rainstorm event, such that risks of in-store materials release to the external environment are mitigated.
A key water management strategy is to recover the maximum possible slurry liquor and rainwater from the TSF for recycling to process operations. Shortfalls will be supplemented from raw water sources available on site, as may be determined essential.

NI 43-101 Technical Report for the Asanko Gold Mine, Ashanti Region, Ghana
Effective Date: February 28, 2022
Page 376
To efficiently manage TSF and process water supply/demands over the updated LOM, a water balance model has been developed to aid estimation of: net inflow and outflow of slurry water from the TSF, supernatant pond volumes under design average and dry rainfall sequence, supernatant pond volumes (following design rainfall events and sequences), and make-up water requirements during design average and dry rainfall sequences.
Key considerations for the water balance model developed include: process water demand; tailings percent solids or tailings solids content (current and projected); LOM mining schedule and mill feed blends; ore water content; settling and consolidation properties of tailings from ore bodies to be included in mill operations; TSF basin groundwater or subterrain water inflow/pump rates; run-off water from direct and surrounding catchments to the process and TSF circuit; current and alternative sources of process make-up water; Open Pit development schedules and post mining plans; and climatic data (including rainfall, evaporation etc).
Generally, the TSF maintains water sufficient to support process operations such that a minimal supernatant pond results under average climate conditions with sufficient freeboard. Under dry climatic conditions, additional water will be supplied from available sources external to the TSF to support process operations.
20.9.3 Closure and Rehabilitation
The rehabilitation and closure of the TSF will include activities that take place concurrently with its development and operation, as well as those associated with its final decommissioning and closure. At closure, the TSF will remain a permanent feature on the landscape immediately adjacent to the extensive Nkran waste rock dump.
Tailings will be drained of water during the operational phase of the facility via the under-drainage system, installed within the dam, to reduce the phreatic surface and improve stability of in-store solids to support closure cap or cover construction. The under-drainage system is expected to continue to operate for a number of years, after completion of capping and native vegetation used for the rehabilitation become established, until such time when interstitial water has been drained (to the extent practical from the tailings mass) such that a stable landform is realized.
The closure cover shall be constructed from suitable local mine waste rocks, oxides or saprolites stripped to various stockpiles during open pit developments, plastic clays/silts, drained alluvial soils (removed from the TSF basin and embankment footprints) and stockpiles of topsoil at the mine.
20.9.4 Geotechnical Investigation
Several geotechnical investigations have been completed in support of the TSF design. These investigations included: desktop review of site knowledge, obtained from mine exploratory activities and other constructions; regional geological/geotechnical information review; existing site-specific geotechnical investigation reports reviews; site reconnaissance; supplementary geotechnical explorations with in-situ testing and sampling; and geotechnical laboratory testing of recovered materials. The geotechnical investigations for the existing and planned TSF expansions were conducted to assess:
• Foundation and excavation conditions for embankments as well as appurtenant installations, and
• Construction materials availability as well as suitability.
Key observations of the geotechnical investigations conducted, with respect to the existing and planned TSF expansions, include:
• The TSF location remains suitable for the envisioned LOM expansions
• TSF embankments shall be founded on stiff to very stiff plastic soils and competent weathered to fresh bedrock following removal of topsoil as well as any saturated soft to firm vegetation laden soils (unsuitable materials)
NI 43-101 Technical Report for the Asanko Gold Mine, Ashanti Region, Ghana
Effective Date: February 28, 2022
Page 377
• Structural fill for the TSF embankments can be sourced from active open pit operations and/or from waste rock dumps within the proximity of the construction zones. Other structural fill materials, including natural gravels and saprolites (extremely to distinctly weathered rocks), can be sourced from near surface materials within the TSF area
• A large extent of the south boundary embankments may be developed to abut the existing extensive mine waste rock dump, as practical, during expansions for the stability advantage it presents
• Low permeability materials (residual laterites) can be obtained from local borrows within the TSF area for embankment fill construction
• In-situ soils in the TSF basin, following removal of topsoil and other unsuitable materials, are generally suitable for construction of low permeable CSL or support subgrade for HDPE geomembrane as part of hydraulic barrier construction
• Drainage and filter/transition materials required for inclusion in the TSF permanent works can be sourced from locals borrows. Suitable mine waste rocks may also be crushed to drainage, filter or transition materials’ specifications and stockpiled for use within economical hauls of the TSF construction
• Approximate average topsoil depth of 300 mm is anticipated over large areas of the expanded TSF. This shall be stripped and stockpiled in designated areas outside the LOM footprint of the TSF to support future facility closure and rehabilitation works
• Removal of unsuitable materials within the expanded embankment footprints and some basin areas would be required such that constructions are undertaken on competent foundation. Based on geotechnical investigation observations and previous construction experiences, the thickness of unsuitable materials to be removed is estimated to range from approximately 1.0 m to 3.0 m
• Vegetation clearing, grubbing and de-stumping will be required as part of foundation or subgrade preparations. Typical vegetation includes shrubs, palm trees, hardwood and softwood trees. Typical tree girths range from 0.3 m to 5.0 m
Geotechnical investigations conducted in the TSF vicinity, including observations of the most recent supplementary ground explorations completed in quarter 3 of 2021 (in support of the planned Stage 7 raise of the facility), provides information sufficient to support and guide the facility design/construction. Additional geotechnical investigations shall be conducted to support future expansions of the TSF as determined necessary and practical.
20.9.5 Tailings Physical Characteristics
Tailings physical testing of representative oxides and primary ore from the Nkran and Esaase orebodies was undertaken in 2012 and 2015.
Supernatant water release ranging from approximately 42% to 53% of slurry liquor is envisaged per the observations of the tests conducted. Tailings water release to the under-drainage system may range from approximately 5% to 20%, considering the: design/operations of existing drainage system; basin treatment; and deposited tailings thickness over the collection system. Tailings water release to the under-drainage system is envisaged to reduce during the later stages of the facility development due to consolidation and increased thickness of deposited tailings solids.
Where the TSF is efficiently operated, long term in-store densities of deposited slurry solids ranging from 1.40 t/m³ to 1.50 t/m³ may be realized. It is envisioned that minimum achievable in-store slurry solids density, considering ore blends and milling schedules for the LOM, shall be approximately 1.30 t/m³.
The physical properties of the tailings are such that they would support recovery of large volumes of slurry water for recycling to process operations, reducing in-store pond volumes and demand for supply external to the TSF over the LOM; such that dam safety as well as downstream environmental risks are mitigated.

NI 43-101 Technical Report for the Asanko Gold Mine, Ashanti Region, Ghana
Effective Date: February 28, 2022
Page 378
20.9.6 Tailings Geochemical Characteristics
Geochemistry testing of representative samples (of oxide and primary tailings) for the Nkran orebody was conducted by Genalysis in 2012. Both oxide and primary Nkran tailings samples were classified as non-acid forming or non-acid generating. The samples had a moderate number of elemental enrichments, although several metals of interest were found to be present. Arsenic and mercury classed as highly enriched in the samples tested. Boron was found to be highly enriched in the oxide samples.
Geochemical testing of three samples of tailings from the Esaase orebody was conducted by Environmental Geochemistry International (“EGi”). The tests conducted by EGi included both static testing and column leaching. The results of the static acid-base accounting testing indicate that the samples are all non-acid forming and do not present related environmental risks. The only element found to be significantly enriched was arsenic. The column leaching indicates that the leachate remained alkaline with a low salinity, and that the majority of highly soluble arsenic was removed in the processing stage at high pH. Arsenic leaching was therefore limited beyond the processing stage.
Due to observed elemental enrichment in the tailings evaluated, facility closure shall be developed to consider a cover or capping system to mitigate risks of tailings and constituent metals release into the external environment post LOM.
Based on the environmental control measures (i.e., CSL and/or HDPE geomembrane use, cut-off trenches or walls and under-drainage system) included in the facility design/construction, anticipated seepage should not adversely impact surface water and/or groundwater aquifers. However, as a precaution and further commitment to wildlife protection, the TSF may be fenced to mitigate access by as many terrestrial animals as practical.

NI 43-101 Technical Report for the Asanko Gold Mine, Ashanti Region, Ghana
Effective Date: February 28, 2022
Page 379
21 CAPITAL AND OPERATING COSTS
Not applicable at the current stage of the Project.

NI 43-101 Technical Report for the Asanko Gold Mine, Ashanti Region, Ghana
Effective Date: February 28, 2022
Page 380
22 ECONOMIC ANALYSIS
Not applicable at the current stage of the Project.

NI 43-101 Technical Report for the Asanko Gold Mine, Ashanti Region, Ghana
Effective Date: February 28, 2022
Page 381
23 ADJACENT PROPERTIES
Properties adjacent to the Asanko Gold AGM area and tenements are shown below in Figure 23-1. The AGM properties are shown in bright red and are named. The property listing is shown in Table 23-1. These properties are all located within the Kumasi basin and share similar underlying deformed siliciclastic metasediments as the primary rock type, with a range of syn- to late tectonic granite intrusives mainly to the east of the AGM tenements. None of these adjacent properties host mineral resources that are in alignment with a Reporting Code such as JORC, SAMREC or CIM.
Information on adjacent properties are based on information publicly disclosed. The Qualified Person has been unable to verify the information regarding adjacent properties. The information regarding adjacent properties is not necessarily indicative of the mineralization on the Asanko Gold Mine.
Table 23-1 Adjacent Property Listing
Tenement /PL Number Tenement Owner
137 Tropical Minerals Co. Ltd
91 Moseaso Co. Ltd
155 Joam Enterprise Ltd
169 Rock and Rivers
234 Triple Key Co. Ltd
150 Hawanah Natural Resources
138 U & N Ltd
145 Westminister
257 Star Gold Ltd

NI 43-101 Technical Report for the Asanko Gold Mine, Ashanti Region, Ghana
Effective Date: February 28, 2022
Page 382
Figure 23-1 AGM Tenements and Adjacent Properties
Source: Asanko Gold Mine, 2021

NI 43-101 Technical Report for the Asanko Gold Mine, Ashanti Region, Ghana
Effective Date: February 28, 2022
Page 383
24 OTHER RELEVANT INFORMTION
No other relevant information.

NI 43-101 Technical Report for the Asanko Gold Mine, Ashanti Region, Ghana
Effective Date: February 28, 2022
Page 384
25 INTERPRETATION AND CONCLUSIONS
25.1 Risks
The following risks have been identified:
• Recent plant performance from predominantly Esaase fresh and transitional material has shown lower gold recoveries compared with the 2021 and prior metallurgical testwork as described in Section 13
• Variable nature of stockpiles: ability to accurately predict grades and recoveries in large continuous volumes of material
• Escalation of labour and material costs
• Gold price volatility
25.2 Opportunities
The Asanko Gold Mine will prioritize further work to advance on the understanding of Esaase metallurgy and geometallurgy to support a new optimized life of mine plan and re-instate Mineral Reserves. This will be facilitated by the fact that the Asanko Gold Mine is an established operation with a processing plant, site infrastructure, permits, and organizational capability already in place to readily support a future LOM.
Additional work programs are taking place concurrently to optimize capital and operating costs, ensure best practices in relation to the size and scope of the operations, infill drilling to de-risk investments, and drill mid- and long-term exploration prospects to accelerate addition of new Mineral Resources and provide more flexibility in mine planning.
Other opportunities identified include:
• Recovery upside - 2021 metallurgical testwork (A22281) for Esaase material demonstrated that an average recovery of above 90% is achievable. This program yielded slightly higher recoveries compared to previous metallurgical testwork at Esaase. It is indicative of upside potential to the current Esaase recovery estimates
• Metallurgical testwork has demonstrated that pre-treatment of Esaase carbonaceous material yields significant improvement in recovery in bench scale CIL tests. Additional work is required to investigate the applicability of kerosene pre-treatment in the plant environment
• Mass pull of the gravity concentrate can be increased with minor operational adjustments, which could yield better overall plant recovery
• Optimization of carbon management practices to introduce fresh or regenerated carbon to early stages of CIL is expected to partially mitigate effects of preg-robbing as demonstrated in previous metallurgical testwork
• Nkran Deeps (Underground potential) – Mineralization at Nkran remains open down plunge and extensions of the deposit would likely be amenable to underground mining methods. Additional deep drilling has commenced to explore the underground potential at Nkran
• Miradani Deeps (Underground potential) – A well-defined steeply northeast plunging shoot is evident in longitudinal section through the deposit. This high grade +80 gm.m shoot remains open at depth. Further drilling has commenced to explore for extensions and repetitions to this high grade zone
• Other exploration prospects as described in Section 9 provide additional opportunities to add to the Mineral Resources.

NI 43-101 Technical Report for the Asanko Gold Mine, Ashanti Region, Ghana
Effective Date: February 28, 2022
Page 385
25.3 Geological Setting and Mineralization and Deposit Type
The understanding of the regional, local and property geology within the Asanko mineral concessions has been developed through many years of exploration and mining and is sufficient to support interpretation of the relevant geological controls, the length, width, depth and continuity of the mineralization, and type, character, and distribution of the mineralization hosted in these structurally controlled orogenic gold deposits.
However, structural controls and lithological controls on mineralization associated with orogenic gold deposits are particularly complex and often change with more detailed information, and exposure of the deposit during mining.
25.4 Exploration, Drilling, Sample Preparation and Analysis, and Security
The exploration programs completed to date are appropriate for the structurally controlled orogenic gold deposits found within the Asanko mineral concessions. Core and reverse circulation drilling, logging, sampling, sample preparation, and laboratory analysis methods used since 2014 have followed industry standards for structurally controlled orogenic gold exploration. Sample security since 2014 was in accordance with exploration practices and industry accepted standards. The limited availability of documentation supporting the drilling, logging, sampling, sample preparation, and laboratory analysis methods before 2014 is mitigated by the verification work completed and the quality and density of more recent data. No material factors were identified with the data collected from the drill programs that might affect the reliability or confidence in the exploration information. The drill hole spacing, the lithological, collar and down-hole survey, and density data collected during the exploration programs and the sample preparation and assay results allow for preparation of a reasonable estimate of the geometries, tonnage, and grade continuity of the mineralization.
25.5 Mineral Resources
The Mineral Resources are reported in accordance with the CIM Definition Standards for Mineral Resources & Mineral Reserves, adopted by CIM Council May 10, 2014 and assume open pit mining methods, milling and CIL gold processing methods. All reported resource estimates are constrained within conceptual open pits. Factors that may affect the Mineral Resource estimates include: changes to commodity price assumptions; changes to metallurgical recovery assumptions; changes to interpretations of geological continuity due to changes in geometallurgical, lithological, weathering or structural interpretations; changes to assigned density values in the estimation domains; changes to operating costs; changes to geotechnical characteristics; and changes to environmental, permitting and social license assumptions.
25.6 Mineral Reserves
At the time of the effective date of this Report, there remains an uncertainty in the variability of metallurgical recovery of gold from the Esaase deposit. Although all metallurgical testwork to date indicate predictable trends in the recovery of gold from the Esaase deposit, recent mill feed consisting of primarily Esaase material has demonstrated lower recovery. As a result, the Company has concluded that there is insufficient confidence in the understanding of the Esaase metallurgical variability to estimate Mineral Reserves.
Given the uncertainty of metallurgical performance on the Esaase material, Galiano Gold has decided not to state Mineral Reserves for all deposits. Any plant feed in the short term will have significant Esaase material present and overall recovery would therefore be difficult to predict.
Only the Esaase material is believed to be performing adverse to expectations. Recovery of gold from Nkran and all other satellite deposits remain of sufficient confidence, but will be subject to additional metallurgical testwork. Upon conclusion of the planned metallurgical testwork, Galiano Gold will prepare an updated technical report supporting an optimized life of mine plan, based on Mineral Reserves.

NI 43-101 Technical Report for the Asanko Gold Mine, Ashanti Region, Ghana
Effective Date: February 28, 2022
Page 386
25.7 Metallurgical Testing and Recoveries
The 2021 testing for Esaase material (ALS report A22281) returned recovery results for the bulk composites that align with those from the 2018/19 Esaase testwork programs. As such, no change has been made to recovery estimates as per the Asanko Gold NI 43-101 Technical Report (2020) for the purpose of constraining a Mineral Resource estimate.
The recovery estimates are of sufficient confidence to determine reasonable prospect for eventual economic extraction; however, in light of recent plant performance of the Esaase material, further understanding of the Esaase metallurgical variability is required to have sufficient confidence to declare Mineral Reserves.
Gold recovery for Nkran and the satellite deposits is estimated to be 94% based on previous operational performance. Additional metallurgical testwork undertaken in 2021 for Nkran, Abore, and Miradani North material support that the assumed recoveries are valid.
25.8 Processing
The existing Asanko Gold Mine process plant located at Obotan is capable of processing 5.8 Mtpa of mill feed. The plant comprises of primary jaw crushing, SAG and ball mill, gravity concentration and ILR, pre-leach thickening, CIL, elution and gold room, and cyanide detoxification.
25.9 Infrastructure
The Obotan plant commenced production in early 2016. The plant was erected close to the Nkran deposit and in proximity to several satellite deposits.
Major site infrastructure consists of an office complex, metallurgical facility, Tailings Storage Facility, senior and junior accommodation and mess facilities, workshops, power distribution facility, a core storage facility, potable and operational water supplies, waste rock dumps, an upgraded dry weather air strip and a haul road from Esaase pit to Nkran pit.
The Tailings Storage Facility is located near the process plant and consists of multi-zoned downstream raised perimeter embankments.
25.10 Market Studies and Contracts
AGM has an off-take agreement to sell 100% of the future gold production up to a maximum of 2.2 Moz to the original project lender, Exp T2 Ltd (“Red Kite”). Arrangements for sale of production after this agreement is satisfied will be reviewed as required.
As of December 31, 2021, the AGM has delivered 1,299,256 ounces to Red Kite under the offtake agreement.

NI 43-101 Technical Report for the Asanko Gold Mine, Ashanti Region, Ghana
Effective Date: February 28, 2022
Page 387
26 RECOMMENDATIONS
26.1 Metallurgy
To better understand the elevated tailings grade recently observed at the process plant, the following work is either in progress or is proposed:
• Diagnostic analysis on composite tail samples to determine the nature of unrecovered gold
• Laboratory and pilot-plant scale testwork to determine potential process modifications (finer grinding, improve gravity gold recovery, leach retention time, cyanide concentration, carbon densities, carbon activity and effective blinding of preg-robbing materials) to maximize gold recovery
• Core re-logging and geological mapping campaign to advance the interpretation and modelling of the geology at Esaase
• Additional drilling at Esaase to obtain fresh samples for metallurgical testwork.
The additional metallurgical drilling, sampling and testwork are estimated to cost between $3.0M to $5.0M USD.
26.2 Geology and Mineral Resources
• Esaase
o Continue to monitor and analyze the QAQC performance of grade control RC samples and take measures to improve confidence in the data by reducing sampling errors in the field and improve the field duplicate precision. Increasing the grade control RC sample size is recommended
o Improve the geological and geometallurgical model though continued drill core re-logging, detailed structural and lithological mapping and modelling. Continued geological work has indicated that folding may have played an important role in controlling the spatial distribution of gold-bearing veins at Esaase. Mapping and modelling of the folding structures are recommended to improve the geological and geometallurgical domaining
o Systematic in-situ dry bulk density sampling and analysis to verify and improve the MRE and grade control bulk density model and improve production reconciliation
o Based on the improved geological and geometallurgical model, add infill drilling where necessary to improve the short-term mine planning
• Nkran
o Continue to review RC sampling QAQC especially field duplicate precision of high grade nuggety samples. If significant high-grade bias >10% is detected, alternate sampling and assay methods should be investigated
o Review the IK controls used to estimate the mineralization volumes used for the gold grade estimation, especially in areas where the exploration drill spacing is variable
o Complete additional infill drilling to de-risk the high-grade mineralization at depth, which is defined by limited drilling and has a significant influence on open pit depth and reasonable prospects for eventual economic extraction.
• Abore
o Improve the geological model though the development of litho-chemical domains based on continued drill core re-logging to better understand the relation between gold grades and litho-chemical domains

NI 43-101 Technical Report for the Asanko Gold Mine, Ashanti Region, Ghana
Effective Date: February 28, 2022
Page 388
o Detailed structural mapping is recommended to improve the geological domaining for subsequent Mineral Resource models.
• Miradani North
o Continue definition drilling to improve modelling of the shallower southeast dipping high-grade structures within the mineralized envelope. Drilling in northwest azimuth is preferred, focusing on the mineralized zones within the resource pit, prioritized for the contemplated future “starter pit” area. Oriented core measurement is recommended for all diamond core drillholes
o Continue definition drilling to upgrade the near surface Inferred resources to Indicated
• Dynamite Hill
o Conduct step-out drilling to explore and define potential near-surface resources of the southwest extension of the mineralized zone(s) that are amenable to open pit extraction
The infill drilling, core relogging, and geological mapping programs are estimated to cost between $10M to $15M USD. Underground potential drilling for Nkran and Miradani North is not included in this range and is further described in Section 26.3.5.
26.3 Exploration
26.3.1 Geological Mapping
In addition to the known mineralized belt, AGM owns a significant land position west of Asanko known as the Sky Gold tenements. Little work has been completed on these concessions, yet AGM pays a fee for their maintenance. It is recommended that a small team of geologists conduct reconnaissance geological mapping (and rock chip sampling) on these areas in order to form a view on their prospectivity and value.
The geological mapping of the Sky Gold tenements is estimated to cost approximately $0.5M USD.

NI 43-101 Technical Report for the Asanko Gold Mine, Ashanti Region, Ghana
Effective Date: February 28, 2022
Page 389
Figure 26-1 Location of Sky Gold Tenements West of the Esaase Deposit, with Geology Interpreted From Regional Geophysics
26.3.2 Geophysics
Follow up on the 2020 gradient array geophysics at Esaase by conducting high resolution (100 m line spacing) gradient array surveys along prospective structural corridors. This was originally to be completed in 2020/2021 but logistical challenges related to the global pandemic prevented implementation. Areas of focus should include but should not be restricted to areas along strike from the Jeni River, along strike extensions to Esaase, Nkran, Kaniago, Miradani and Midras deposits and prospects (see Figure 26-2 below).
In addition, deep IP should be considered at deposits such as Abore to explore for chargeability features that may indicate extensions to mineralization at depth and assist in more efficient drill targeting.
The geophysics program is estimated to cost approximately $0.5M USD.
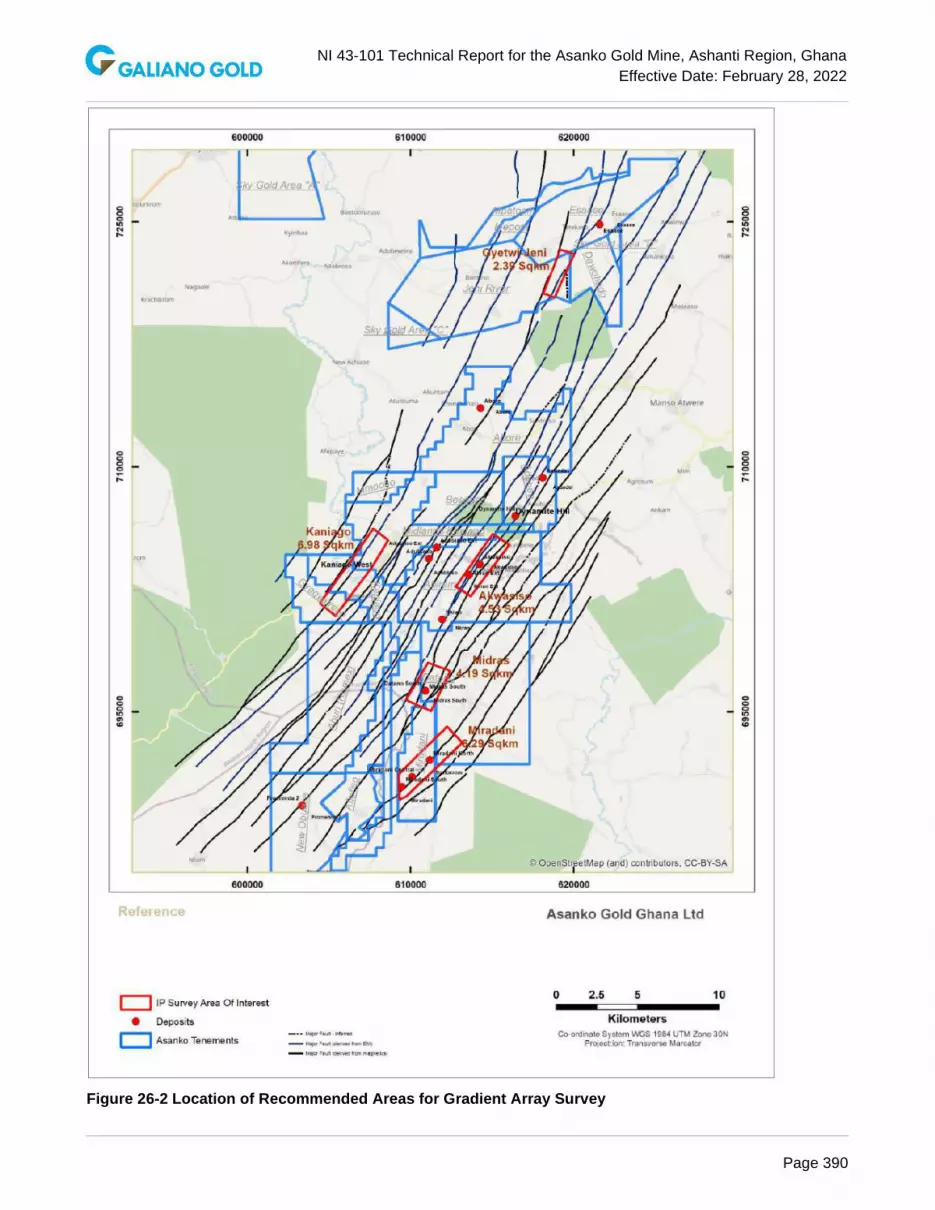
NI 43-101 Technical Report for the Asanko Gold Mine, Ashanti Region, Ghana
Effective Date: February 28, 2022
Page 390
Figure 26-2 Location of Recommended Areas for Gradient Array Survey

NI 43-101 Technical Report for the Asanko Gold Mine, Ashanti Region, Ghana
Effective Date: February 28, 2022
Page 391
26.3.3 Geochemistry
Ore mineragraphy completed on Esaase ore samples (Di Prisco, 2011) supports a spatial if not temporal relationship between gold and arsenopyrite (and to a far lesser extent chalcopyrite and galena). Visual observation of drill core taken together with assay data suggests this arsenopyrite – gold relationship is common in deposits explored by AGM in the Asankrangwa belt. Multi-element analysis of a statistically meaningful amount of historical core/pulp to build on AGM’s understanding of the spatial arsenic-gold relationship (and thus use arsenic as a footprint for gold) would be prohibitively expensive. A cost effective and reliable method of collecting arsenic (as a proxy for arsenopyrite) data is pXRF analysis. It is recommended that AGM purchase an additional Olympus pXRF instrument and undertake collection of pXRF data on all drill holes of selected sections on several of its deposits. Building 3D models of arsenic distribution may well provide useful vectors to additional mineralization.
In addition to the above, the collection of pXRF data from soil and trench sample could provide a quick and cost-effective filter for higher priority areas the explore.
The geochemistry program is estimated to cost approximately $0.5M USD.
26.3.4 Spectral
Gold mineralization at the AGM deposits has a recognizable sericite-carbonate signature, well noted in logging, paragenetic (Davis, 2016) and petrological studies (Nude, 2011, and Di Prisco, 2011). However, the current dataset cannot be used to construct a reliable alternation model for these deposits due to historical inconsistent logging. A solution to this would be to dedicate a geologist to the collection of spectral data using the companies currently inactive spectrometer. This data could be submitted to a consultancy for interpretation and use in better understanding hydrothermal alteration of the AGM deposits.
The spectral program is estimated to cost approximately $0.5M USD.
26.3.5 Drilling
26.3.5.1 Nkran Deeps
Underground mining scenarios have long been considered at Nkran. Resolute Mining included a modest underground resource (Spiers, 2010), and AGM have reviewed the idea of underground mining at Nkran at a conceptual level. Additional deep drilling is recommended to explore for significant down dip and down plunge mineralization at Nkran.
In the event of a successful conclusion of Phase 1 drilling, Phase 2 drilling campaign will be recommended to further quantify potential for Nkran Deeps.
The Phase 1 Nkran Deeps directional drilling program is estimated to cost between $2.0M to $3.0M USD.

NI 43-101 Technical Report for the Asanko Gold Mine, Ashanti Region, Ghana
Effective Date: February 28, 2022
Page 392
Figure 26-3 Longitudinal Section Through the Nkran Deposit Showing Multiple Shoot Trends That Hold Potential for Additional Resources
Figure 26-4 Cross-section Through the Nkran Deposit With Possible Deep Drilling Hole Traces

NI 43-101 Technical Report for the Asanko Gold Mine, Ashanti Region, Ghana
Effective Date: February 28, 2022
Page 393
26.3.5.2 Miradani Deeps
The Miradani North deposit shows many similarities to Nkran, including a tonalite intrusive association and the existence of high-grade shoots. A well-defined steeply northeast plunging shoot is evident in longitudinal section through the deposit, as seen in Figure 26-5 below. This high grade +80 gm.m shoot remains open at depth and further drilling should be considered to explore for extensions and repetitions to this high grade. In the event of a successful conclusion of Phase 1 drilling, Phase 2 drilling campaign will be recommended to further quantify potential for Miradani Deeps.
The Phase 1 Miradani Deeps directional drilling program is estimated to cost between $2.0M to $3.0 USD.
Figure 26-5 Longitudinal Section Through the Miradani North Deposit
26.3.5.3 Other Exploration
Considerable potential exists for the discovery of additional gold resources on the AGM licenses, near existing operations as well as regionally.
A number of poorly tested prospective trends recognized during earlier prospectivity analysis were followed up by AGM with drilling, mapping and sampling, and in some cases trenching in 2021. These include the Gyagatreso-Kaniago-Abore trend, the Greater Midras-Nkran-Takorase trend, the Datano-Fawotrikye trend and the Abore-Jeni River-Esaase trend. These areas were highlighted due a combination of coincident structural and soil geochemical anomalies, and in some cases topographic highs and may relate to zones of veining and silicification associated with mineralized systems. Follow-up exploration is recommended for these prospects.
A budget of approximately $5.0M USD is planned in 2022 for greenfield generative exploration, and will be re-evaluated on an annual basis.

NI 43-101 Technical Report for the Asanko Gold Mine, Ashanti Region, Ghana
Effective Date: February 28, 2022
Page 394
26.4 Operating Cost Optimization
The following operating cost optimization opportunities have been identified to be evaluated in further detail:
• Competitive tenders for mining and all major consumable contracts
• Material movement study to reduce rehandling costs
• Self-performance of drill & blast, grade control drilling, and ore rehandling
• Fleet management system
• Labour rationalization
This work program is estimated to cost approximately $0.5M USD and is expected to take place in 2022.

NI 43-101 Technical Report for the Asanko Gold Mine, Ashanti Region, Ghana
Effective Date: February 28, 2022
Page 395
27 REFERENCES
Primary documents associated with this Technical Report, by discipline, are referenced below.
Geology
Asanko Gold, 2020 Grade Control Procedures_2020
Agyei-Duodu, J., Loh, G. K., Boamah, K. O., Baba, M., Hirdes, W., Toloczyki, M., & Davis, D. W., 2009
Geological Survey Department of Ghana (GSD) Report. Geological Map of Ghana 1:1,000,000, Accra Ghana.
Allibone, A., McCuaig, C., Harris, D., Etheridge, M.A., Munroe, S., and Byrne, D., 2002
Structural controls on gold mineralization at the Ashanti gold deposit, Obuasi, Ghana: Society of Economic Geologists Special Publication 9, p. 65–93.
Allibone, A., Hayden, P., Cameron, G., and Duku, F., 2004
Paleoproterozoic gold deposits hosted by albite- and carbonate-altered tonalite in the Chirano district, Ghana, West Africa: Economic Geology, v. 99, p. 479–497.
Asiedu, D.K., Asamoah Sakayi, P., Banoeng Yakubo, B., Dampare, S.B., Osae, S., Manu, J., and Nyarko, B.J.B., 2004
Geochemistry of Paleoproterozoic metasedimentary rocks from the Birim diamondiferous field, southern Ghana: Implications for provenance and crustal evolution at the Archean-Proterozoic boundary. Geochemical Journal vol 38, pp. 215-228
Baratoux, L., Metelka, V., Naba, S., Jessell, M.W., Grégoire, M., and Ganne, J., 2011
Juvenile Paleoproterozoic crust evolution during the Eburnean orogeny (~2.2–2.0 Ga), western Burkina Faso: Precambrian Research, v. 191, p. 18–45.
Béziat, D., Dubois, M., Debat, P., Nikiéma, S., Salvi, S., and Tollon, F., 2008
Gold metallogeny in the Birimian craton of Burkina Faso (West Africa): Journal of African Earth Sciences, v. 50, p. 215–233.
CIM, 2010 CIM Definition Standards – For Mineral Resources and Mineral Reserves. Prepared by the CIM Standing Committee on Reserve Definitions. Adopted by CIM Council on 27 November 2010
CIM, 2014 CIM Definition Standards – For Mineral Resources and Mineral Reserves. Prepared by the CIM Standing Committee on Reserve Definitions. Adopted by CIM Council on 10 May 2014
CJM, 2014 Asanko Gold Mine, Ghana 43-101 Technical Report, 2014
CSA Global, 2019 CSA Global Report for the Asanko Gold NI 43-101 Technical Report (2019), prepared by various CSA Global employees, submitted February 2020.
Davis, D.W., Hirdes, W., Shaltegger, E., and Nunoo, 1994
U-Pb age constraints on deposition and provenance of Birimian and gold-bearing Tarkwaian sediments in Ghana, West Africa, Precambrian Research, v.67, pp.89-107
Davis, B., 2016 Nkran Geological History, internal Technical Report
de Kock, G.S., Théveniaut, H., Botha, P.M.W., and Gyapong, W., 2012
Timing the structural events in the Palaeoproterozoic Bolé–Nangodi belt terrane and adjacent Maluwe basin, West African craton, in central-west Ghana. Journal of African Earth Sciences, 65, 1–24
Di Prisco, G, 2011 Mineralogy Examination of the Esaase Gold Mineralization from Deep Zones, Part
IV, Ashanti Region, Ghana
Dusci, M., & Davies, J., 2014 Geological Model Handover Reports for Abore Deposit, Asuadai Deposit and Dynamite Hill Deposit, and Nkran 3D Geological Model and Constraints on Mineralisation, over the 2014 period, for Asanko Gold Inc, on behalf of HMM Consulting.
Eisenlohr, B.N., 1989 The structural geology of Birimian and Tarkwaian rocks of southwest Ghana. Rep. Arch. BGR, 66pp

NI 43-101 Technical Report for the Asanko Gold Mine, Ashanti Region, Ghana
Effective Date: February 28, 2022
Page 396
Feybesse, J.L., Billa, M., Guerrot, C., Duguey, E., Lescuyer, J.L., Milesi, J.-P., and Bouchot, V., 2006
The Paleoproterozoic Ghanaian province: Geodynamic model and ore controls, including regional stress modeling: Precambrian Research, v. 149, p. 149–196
Goldfarb, R.J., André-Mayer, A., Jowitt, S.M. and Mudd, G.M., 2017
West Africa: The World’s Premier Paleoproterozoic Gold Province, Economic Geology, v. 112, pp. 123–143
Gold Fields, 2020 Akwasiso_Model_ak_2008b_eng_Handover_Report_Sep20, September 2020
Gold Fields, 2020 Akwasiso_Model_ak_2008b_eng_Handover_Report_Sep20, September 2020
Adubiaso 2018 resource model handover note, 2018
Asuadai 2018 resource model handover note and report, 2018
Various communications
Gold Fields, 2018 Adubiaso 2018 resource model handover note, 2018
Gold Fields, 2018 Asuadai 2018 resource model handover note and report, 2018
Griffis, R. A., Baring, K., Agezo, F. L. and Akosah, F. K., 2002
Gold deposits of Ghana; pp 154–159 and 194 – 200
Hein, K.A.A., 2010 Succession of structural events in the Goren greenstone belt (Burkina Faso): Implications for West African tectonics: Journal of African Earth Sciences, v. 56, p. 83–94
Leube, A., Taylor, P., Moorbath, S., Hirdes, W., 1990
Early Proterozoic crustal evolution in the Birimian of Ghana: constraints from geochronology and isotope geochemistry; Precambrian Research, Volume 56, Issues 1–2, April 1992, Pages 97-111
Markwitz, V, Hein, K.A.A., and Miller, J., 2016
Compilation of West African mineral deposits: Spatial distribution and mineral endowment: Precambrian Research, v. 274, p. 61–81
Matsheka, I.R., and Hein, K.A.A., 2011
Character, morphology and origin of gold from the selected mines in the Yatela and Sadiola goldfield, Mali, West Africa. In: Poster Presentation to the WAXI Sponsors Meeting, Ouagadougou, Burkina Faso, 28 March to 1 April 2011.
McCuaig, C. and Williams, P., 2002 Review of structural controls on mineralisation and regional prospectivity of the Obotan project, Ghana, report compiled by SRK Consulting for Resolute–Amansie Limited, 53 pp
Metelka, V., Baratoux, L., Naba, S., and Jessel, M.W., 2011
A geophysically constrained litho-structural analysis of the Eburnean greenstone belts and associated granitoid domains, Burkina Faso, West Africa: Precambrian Research, v. 190, p. 48–69.
Milesi, J.P., Feybesse, J.L., Ledru, P., Dommanget, A., Ouedraogo, M.F., Marcoux, E., Prost, A., Vinchon, C., Sylvain, J.P., Johan, V., Teguey, M., Calvez, J.Y., and Lagny, P., 1989
Les minéralisations aurifères de l’Afrique de l’Ouest. Leurs relations avec l’évolution lithostructurale au Protérozoïque inférieur: Chronique de la recherche minière, v. 497, p. 3–98.
Milesi, J.P., Ledru, P., Feybesse, J.L., Dommanget, A. and Marcoux, E., 1992
Early Proterozoic Ore Deposits and Tectonics of the Birimian Orogenic Belt, West Africa. Precambrian Research, 58, 305-344, published 1992
Minxcon, 2012 Esaase NI 43-101 Technical Report, November 2012
Minnitt, R. 2020 An analysis of the Quality Assurance – Quality Control data from Obotan (2019-2020) and Esaase (2019-2020)
Nude, 2011 Petrographic report of Drill-core samples from the Nkran prospect, Obotan
Perrouty, S., Aillères, L., Jessell, M.W., Baratoux, L., Bourassa, Y., and Crawford, B., 2012
Revised Eburnean geodynamic evolution of the gold-rich southern Ashanti belt, Ghana, with new field and geophysical evidence of pre-Tarkwaian deformations: Precambrian Research, v. 204–205, p. 12–39.
Pratt, W., 2021 Geological Model and Metallurgy of the Esaase Gold Mine, Ghana. Technical Report.
Resolute-Adansi, 1995 Resolute Mining’s Nkran Project Resource –Reserve Report
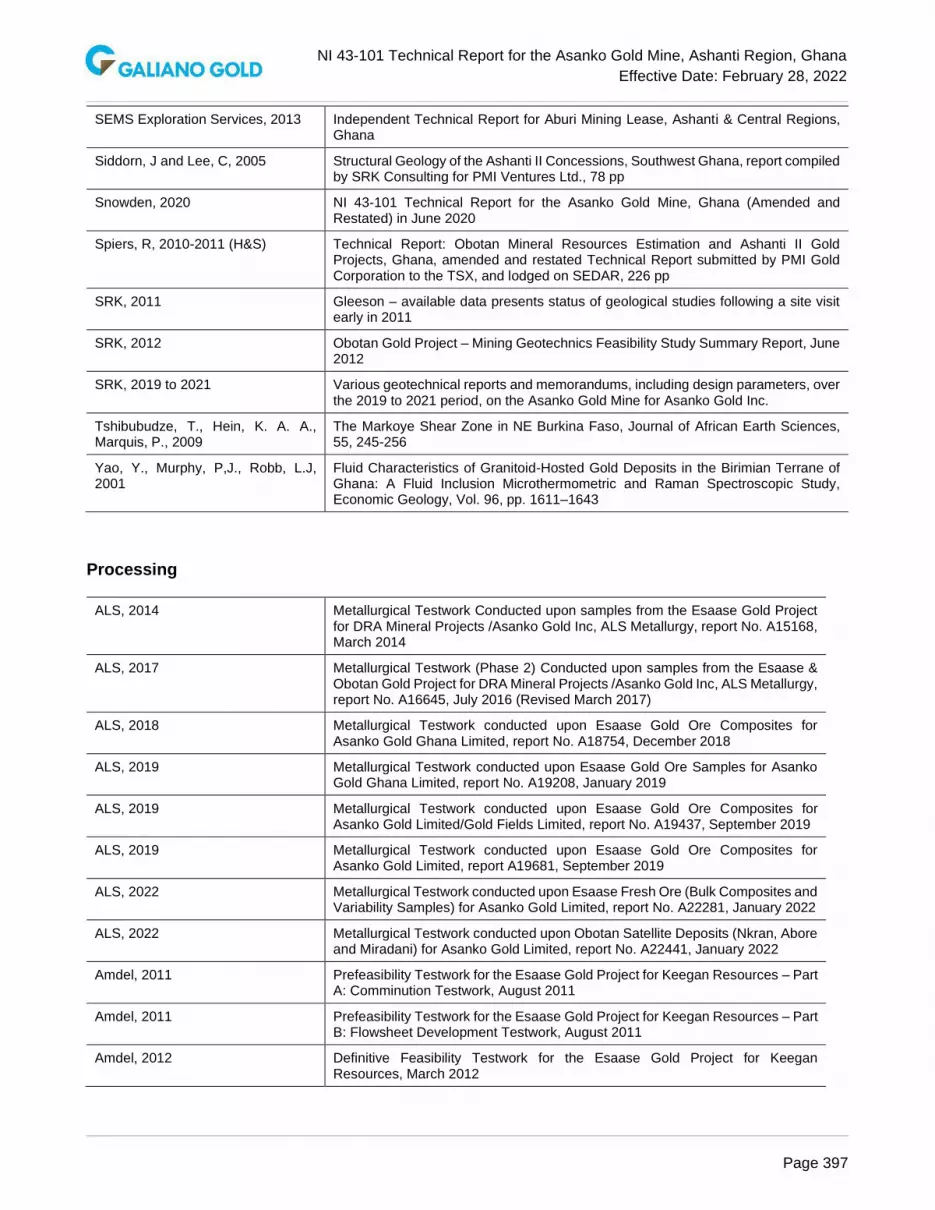
NI 43-101 Technical Report for the Asanko Gold Mine, Ashanti Region, Ghana
Effective Date: February 28, 2022
Page 397
SEMS Exploration Services, 2013 Independent Technical Report for Aburi Mining Lease, Ashanti & Central Regions, Ghana
Siddorn, J and Lee, C, 2005 Structural Geology of the Ashanti II Concessions, Southwest Ghana, report compiled by SRK Consulting for PMI Ventures Ltd., 78 pp
Snowden, 2020 NI 43-101 Technical Report for the Asanko Gold Mine, Ghana (Amended and Restated) in June 2020
Spiers, R, 2010-2011 (H&S) Technical Report: Obotan Mineral Resources Estimation and Ashanti II Gold Projects, Ghana, amended and restated Technical Report submitted by PMI Gold Corporation to the TSX, and lodged on SEDAR, 226 pp
SRK, 2011 Gleeson – available data presents status of geological studies following a site visit early in 2011
SRK, 2012 Obotan Gold Project – Mining Geotechnics Feasibility Study Summary Report, June 2012
SRK, 2019 to 2021 Various geotechnical reports and memorandums, including design parameters, over the 2019 to 2021 period, on the Asanko Gold Mine for Asanko Gold Inc.
Tshibubudze, T., Hein, K. A. A., Marquis, P., 2009
The Markoye Shear Zone in NE Burkina Faso, Journal of African Earth Sciences, 55, 245-256
Yao, Y., Murphy, P,J., Robb, L.J, 2001
Fluid Characteristics of Granitoid-Hosted Gold Deposits in the Birimian Terrane of Ghana: A Fluid Inclusion Microthermometric and Raman Spectroscopic Study, Economic Geology, Vol. 96, pp. 1611–1643
Processing
ALS, 2014 Metallurgical Testwork Conducted upon samples from the Esaase Gold Project for DRA Mineral Projects /Asanko Gold Inc, ALS Metallurgy, report No. A15168, March 2014
ALS, 2017 Metallurgical Testwork (Phase 2) Conducted upon samples from the Esaase & Obotan Gold Project for DRA Mineral Projects /Asanko Gold Inc, ALS Metallurgy, report No. A16645, July 2016 (Revised March 2017)
ALS, 2018 Metallurgical Testwork conducted upon Esaase Gold Ore Composites for Asanko Gold Ghana Limited, report No. A18754, December 2018
ALS, 2019 Metallurgical Testwork conducted upon Esaase Gold Ore Samples for Asanko Gold Ghana Limited, report No. A19208, January 2019
ALS, 2019 Metallurgical Testwork conducted upon Esaase Gold Ore Composites for Asanko Gold Limited/Gold Fields Limited, report No. A19437, September 2019
ALS, 2019 Metallurgical Testwork conducted upon Esaase Gold Ore Composites for Asanko Gold Limited, report A19681, September 2019
ALS, 2022 Metallurgical Testwork conducted upon Esaase Fresh Ore (Bulk Composites and Variability Samples) for Asanko Gold Limited, report No. A22281, January 2022
ALS, 2022 Metallurgical Testwork conducted upon Obotan Satellite Deposits (Nkran, Abore and Miradani) for Asanko Gold Limited, report No. A22441, January 2022
Amdel, 2011 Prefeasibility Testwork for the Esaase Gold Project for Keegan Resources – Part A: Comminution Testwork, August 2011
Amdel, 2011 Prefeasibility Testwork for the Esaase Gold Project for Keegan Resources – Part B: Flowsheet Development Testwork, August 2011
Amdel, 2012 Definitive Feasibility Testwork for the Esaase Gold Project for Keegan Resources, March 2012

NI 43-101 Technical Report for the Asanko Gold Mine, Ashanti Region, Ghana
Effective Date: February 28, 2022
Page 398
Amdel, 2013 Pre-Feasibility Testwork for the Esaase Gold Project for DRA Mineral Projects, Amdel Pty Ltd, Project No. 3486, including Addendum to Report, May 2013
DRA, 2013 Asanko Gold Project in Ghana – Pre-Feasibility Study
DRA, 2015 Asanko Gold Project Phase 2 Pre-feasibility Study, DRA 2015
DRA, 2017 AGM Expansion Project FS report JGHDP0221-RPT-007, DRA 2017
GRES, 2012 Obotan Gold Project Pre-feasibility Study, GRES, 11831 0184, February 2012
Lycopodium, 2009 Esaase Gold Project Report on Variability Testwork, March 2009
Resolute Amansie Limited, 2001 Adubiaso Open Pit – Final Report, February 2001
Resolute Amansie Limited, 2002 Abore Open Pit – Final Report, September 2002
Infrastructure
Knight Piésold Consulting, 2016 Tailings Storage Facility Feasibility Study Update December 2016
Knight Piésold Consulting, 2020 Tailings Storage Facility Pre-Feasibility Study (PFS) and NI43-101 Update March 2020
Knight Piésold Consulting, 2020 Asanko Gold TSF Dam Break Analyses to Stage 8 Raise / Asanko Gold Project TSF Stage 8 Dam Break and Consequence Assessment April 2020